assessment of respiratory system mechanics - DalSpace
218
ASSESSMENT OF RESPIRATORY SYSTEM MECHANICS IN ADULTS: EFFECT OF WEIGHT LOSS, POSTURE, BRONCHODILATION AND ARTEFACTS ON RESPIRATORY IMPEDANCE AND ITS REPEATABILITY by Ubong Akpan Peters Submitted in partial fulfilment of the requirements for the degree of Doctor of Philosophy at Dalhousie University Halifax, Nova Scotia September 2016 © Copyright by Ubong Akpan Peters, 2016
-
Upload
khangminh22 -
Category
Documents
-
view
1 -
download
0
Transcript of assessment of respiratory system mechanics - DalSpace

ASSESSMENT OF RESPIRATORY SYSTEM MECHANICS IN ADULTS: EFFECT OF WEIGHT LOSS, POSTURE,
BRONCHODILATION AND ARTEFACTS ON RESPIRATORY IMPEDANCE AND ITS REPEATABILITY
by
Ubong Akpan Peters
Submitted in partial fulfilment of the requirements
for the degree of Doctor of Philosophy
at
Dalhousie University Halifax, Nova Scotia
September 2016
© Copyright by Ubong Akpan Peters, 2016

To my family for their constant support
ii

TABLE OF CONTENTS List of Tables .................................................................................................................. vii
List of Figures .................................................................................................................. ix
Abstract ............................................................................................................................ xi
List of Abbreviations and Symbols Used ..................................................................... xii Acknowledgements ........................................................................................................ xv
Chapter 1: Introduction .................................................................................................. 1
1.1 Motivation for the Thesis ......................................................................................... 1
1.2 Thesis Organization ................................................................................................. 2
1.3 Manuscripts, Conference Abstracts and Proceedings arising from the Thesis. ....... 4
Chapter 2: Review of Relevant Literature .................................................................... 7
2.1 The Respiratory System and the Mechanics of Breathing ....................................... 7
2.2 Lung Diseases .......................................................................................................... 9
2.2.1 Asthma ............................................................................................................ 11
2.2.2 Chronic obstructive pulmonary disease (COPD) ............................................ 17
2.3 Pulmonary Function Tests ..................................................................................... 20
2.3.1 Spirometry....................................................................................................... 20
2.3.2 Plethysmography............................................................................................. 30
2.3.3 Oscillometry .................................................................................................... 34
2.4 Lung Mechanics and Function in Obesity ............................................................. 41
2.4.1 Asthma and the respiratory symptoms of obesity ........................................... 42
2.4.2 Pathogenesis of asthma in obesity: role of inflammation ............................... 43
2.4.3 Mechanical compression of the respiratory system in obesity ....................... 50
2.4.4 Summary ......................................................................................................... 56
2.5 Research Hypothesis and Aims ............................................................................. 57
2.5.1 Early changes in lung mechanics following weight loss surgery ................... 57
2.5.2 Improvement in upright and supine lung mechanics with bariatric surgery ... 58
2.5.3 Repeatability, variability and reliability of respiratory impedance ................ 59
Chapter 3: Early Detection of Changes in Lung Mechanics with Oscillometry Following Bariatric Surgery in Severe Obesity........................................................... 60
3.1 Abstract .................................................................................................................. 61
3.2 Background ............................................................................................................ 62
iii
3.3 Methods.................................................................................................................. 64
3.3.1 Selection of study participants and consent .................................................... 64
3.3.2 Inclusion and exclusion criteria ...................................................................... 64
3.3.3 Study design .................................................................................................... 64
3.3.4 Sleep quality questionnaire ............................................................................. 65
3.3.5 Weight, height and waist circumference measurements ................................. 66
3.3.6 Pulmonary function tests................................................................................. 66
3.3.7 Oscillometry .................................................................................................... 66
3.3.8 Bronchial reversibility test .............................................................................. 68
3.3.9 Bariatric surgery.............................................................................................. 68
3.3.10 Statistical analysis ......................................................................................... 68
3.4 Results .................................................................................................................... 69
3.4.1 Demographics and obesity parameters ........................................................... 69
3.4.2 Changes in lung mechanics with weight loss: posture and bronchodilation .. 70
3.4.3 Weight loss and bronchodilator responsiveness ............................................. 71
3.4.4 Weight loss and lung volumes ........................................................................ 74
3.4.5 Variability and repeatability of respiratory resistance .................................... 74
3.4.6 Sleep quality.................................................................................................... 75
3.5 Discussion .............................................................................................................. 78
Chapter 4: Improvement in upright and supine lung mechanics with bariatric surgery: sleep quality and bronchodilator responsiveness ........................................ 84
4.1 Abstract .................................................................................................................. 85
4.2 Background ............................................................................................................ 86
4.3 Methods.................................................................................................................. 87
4.3.1 Selection of study participants and consent .................................................... 87
4.3.2 Inclusion and exclusion criteria ...................................................................... 87
4.3.3 Study design .................................................................................................... 87
4.3.4 Sleep quality questionnaire ............................................................................. 88
4.3.5 Anthropometric measurements ....................................................................... 88
4.3.6 Pulmonary function tests................................................................................. 88
4.3.7 Oscillometry .................................................................................................... 89
4.3.8 Mathematical modeling of respiratory system impedance ............................. 89
4.3.9 Bronchial reversibility test .............................................................................. 91
iv

4.3.10 Bariatric surgery............................................................................................ 91
4.3.11 Statistical analyses ........................................................................................ 91
4.4 Results .................................................................................................................... 92
4.4.1 Demographics and obesity parameters ........................................................... 92
4.4.2 Lung function before and after bariatric surgery ............................................ 92
4.4.3 Lung volumes before and after bariatric surgery ............................................ 93
4.4.4 Effect of weight loss and bronchodilation on oscillometry outcomes ............ 93
4.4.5 Improvements in sleep quality with weight loss ............................................. 99
4.4.6 Mathematical model of changes in respiratory impedance ............................. 99
4.4.7 Changes in frequency dependence of Rrs with weight loss ............................ 99
4.6 Discussion ............................................................................................................ 100
Chapter 5: Repeatability and Variability of Respiratory Impedance and its Reliability: Effect of Cheek Support and Variations in Head and Neck Positioning........................................................................................................................................ 107
5.1 Abstract ................................................................................................................ 108
5.2 Introduction .......................................................................................................... 109
5.3 Methods................................................................................................................ 110
5.3.1 Selection of study participants and consent .................................................. 110
5.3.2 Inclusion and exclusion criteria .................................................................... 111
5.3.3 Study design .................................................................................................. 111
5.3.4 Weight and height measurements ................................................................. 112
5.3.5 Oscillometry .................................................................................................. 112
5.3.6 Statistical analyses ........................................................................................ 113
5.4 Results .................................................................................................................. 114
5.4.1 Anthropometric characteristics of study participants ................................... 114
5.4.2 Effects of flexion, extension and cheek support on mean Zrs ...................... 114
5.4.3 Effects of flexion, extension and cheek support on COV of Rrs .................. 116
5.4.4 Effects of flexion, extension and cheek support on SD of Xrs ..................... 117
5.4.5 Reliability and reproducibility of oscillometry outcomes ............................ 119
5.5 Discussion ............................................................................................................ 119
Chapter 6: Discussion .................................................................................................. 125
6.1 Overview of findings ........................................................................................... 125
6.2 Significance and Implications of Findings .......................................................... 127
v

6.4 Statement of Original Contributions .................................................................... 133
6.5 Suggestions for Future Research ......................................................................... 134
6.5.1 Upright and supine respiratory mechanics in obese subjects with asthma and changes following bariatric surgery ....................................................................... 134
6.5.2 The contribution of chest wall and airway-parenchymal tethering to overall mechanics of the respiratory system in obesity and the changes following weight loss ......................................................................................................................... 135
6.5.3 Changes in upper airway geometry with weight loss assessed with dual-energy X-ray absorptiometry ................................................................................. 136
6.6 Conclusion ........................................................................................................... 136
References ..................................................................................................................... 138
Appendix A: Pathophysiologic Mechanisms of Asthma........................................... 169
Appendix B: Permission letter for Figure 2.1 ........................................................... 172
Appendix C: Permission letter for Figure 2.2 ........................................................... 175
Appendix D: Permission letter for Figure 2.4 ........................................................... 181
Appendix E: Permission letter to use published article as Chapter 3 ..................... 187
Appendix F: Permission letter to use Pittsburgh Sleep Quality Index ................... 191
Appendix G: Pictorial and Schematic Representation of tremoFloTM ................... 198
Appendix H: Validation of Resistance and Reactance ............................................. 200
vi

List of Tables Table 2.1: Prevalence of some common respiratory diseases in Canada * ..................... 10
Table 2.2. Stages and Severity of Chronic Obstructive Pulmonary Disease ................... 19
Table 2.3. Common spirometric measures of pulmonary function ................................. 22
Table 2.4. Spirometric classification of severity of airflow obstruction.......................... 23
Table 2.5. Typical lung volume measurements obtained from plethysmography ........... 32
Table 2.6. Plethysmographic estimation of FRC using Boyle’s law ............................... 33
Table 3.1. Age distribution and anthropometric characteristics of study participants. .... 70
Table 3.2. Analysis of Variance for Oscillometry ........................................................... 71
Table 3.3. Pre- and Post-BD spirometric data obtained before and 5 weeks after bariatric
surgery.............................................................................................................................. 75
Table 3.4. Lung Volumes obtained before and five weeks after bariatric surgery. ......... 76
Table 3.5. Percent Coefficient of Variation (COV) for oscillometric Rrs obtained under
various test conditions...................................................................................................... 78
Table 3.6. Component scores of the PSQI collected before and 5 weeks after bariatric
surgery.............................................................................................................................. 78
Table 4.1. Demographics and anthropometric characteristics of study participants. ...... 93
Table 4.2. Component scores of the Pittsburgh sleep quality index collected before and 6
months after bariatric surgery. ....................................................................................... 100
Table 5.1. Anthropometric characteristics of study participants ................................... 114
Table 5.2. Percent COV for Rrs at selected frequencies obtained when healthy subjects
performed oscillometry without cheek support, and during maximum flexion and
extension of the neck. .................................................................................................... 116
Table 5.3. Percent COV for Rrs at selected frequencies obtained when COPD patients
performed oscillometry without cheek support, and during 20° flexion and 10° extension
of the neck. ..................................................................................................................... 117
Table 5.4. Standard deviation of Xrs (in cm·H2O/(L·s-1)) at selected frequencies
obtained when healthy subjects performed oscillometry with and without cheek support,
and during maximum flexion and extension of the neck. .............................................. 119
vii

Table 5.5. Standard deviation of Xrs (in cm·H2O/(L·s-1)) at selected frequencies
obtained when COPD patients performed oscillometry with and without cheek support,
and during 20° flexion and 10°extension of the neck. ................................................... 120
viii
List of Figures Figure 2.1. Diagnostic flowchart for asthma at initial presentation (GINA 2015 report).
.......................................................................................................................................... 14
Figure 2.2. Change in FEV1 from baseline versus increasing concentrations of
methacholine in mild, moderate and severe asthma compared to healthy subjects [122].
.......................................................................................................................................... 28
Figure 2.3. Methacholine-induced changes in pulmonary resistance in four types of
obese mice compared to lean controls. ............................................................................ 48
Figure 2.4. Campbell diagram for the chest wall (CCW), lung (CL) and respiratory system
(CRS) in normal weight and obese subjects. ..................................................................... 52
Figure 3.1. Testing sequence for assessment of the effect of weight loss on lung
mechanics. ........................................................................................................................ 65
Figure 3.2. Effect of weight loss on pre-BD resistance measured in the supine position.
.......................................................................................................................................... 72
Figure 3.3. Effect of moving from an upright to supine position on Pre- and Post-BD
Rrs,6 (A) and Ers (B) measured before and after bariatric surgery. ................................ 73
Figure 3.4. The effect of BD on Rrs and Xrs measured in the upright posture before (A
& B) and five weeks after bariatric surgery (C & D). ..................................................... 74
Figure 3.5. Percent drop in Rrs and Ers in the upright (A) and supine position (B)
measured in response to BD before and after surgery. .................................................... 77
Figure 4.1. Schematic illustration of the series two-compartment model of the lung. .... 90
Figure 4.2. Spirometric measures before and after weight loss presented as percent
predicted. .......................................................................................................................... 94
Figure 4.3. Plethysmography outcomes before and after weight loss presented as percent
predicted. .......................................................................................................................... 95
Figure 4.4. Changes in Rrs and Xrs measured in the upright (A & B) and supine
positions (C & D) before and after bariatric surgery. ...................................................... 96
Figure 4.5. Percent change in key oscillometry outcomes and FEV1 produced by weight
loss in the upright and supine positions. .......................................................................... 97
ix

Figure 4.6. Percent change in key oscillometry outcomes and FEV1 produced by
bronchodilator in the upright (A) and supine positions (B) before and 6 months after
weight loss surgery. ......................................................................................................... 98
Figure 4.7. Parameters of the two-compartment series model of the respiratory system
before and weight loss at 6 months (Panels A – D). ...................................................... 101
Figure 5.1. Effect of 20° flexion and 10° extension of neck on Rrs (A) and Xrs (B) in
COPD patients. .............................................................................................................. 115
Figure 5.2. Effect of maximal forward flexion and maximal extension on Rrs (A) and
Xrs (B) in healthy subjects. ............................................................................................ 117
Figure 5.3. Effect of upper airway shunt artefact on Rrs and Xrs measured in healthy
subjects (A & B) and COPD patients (C & D). ............................................................. 118
Figure 5.4. Rrs and Xrs measured during two separate study visits in healthy adults (A &
B) and COPD patients (C & D). .................................................................................... 121
Figure 5.5. Within-day COV for Rrs versus frequency from three consecutive measures
obtained during study visits 1 and 2 in healthy adults (A) and COPD patients (B). ..... 122
Figure 6.1. Summary of findings at baseline and after weight loss. .............................. 129
Figure 6.2. Schematic showing how stress distribution within the lung can alter airway
caliber. ............................................................................................................................ 130
x
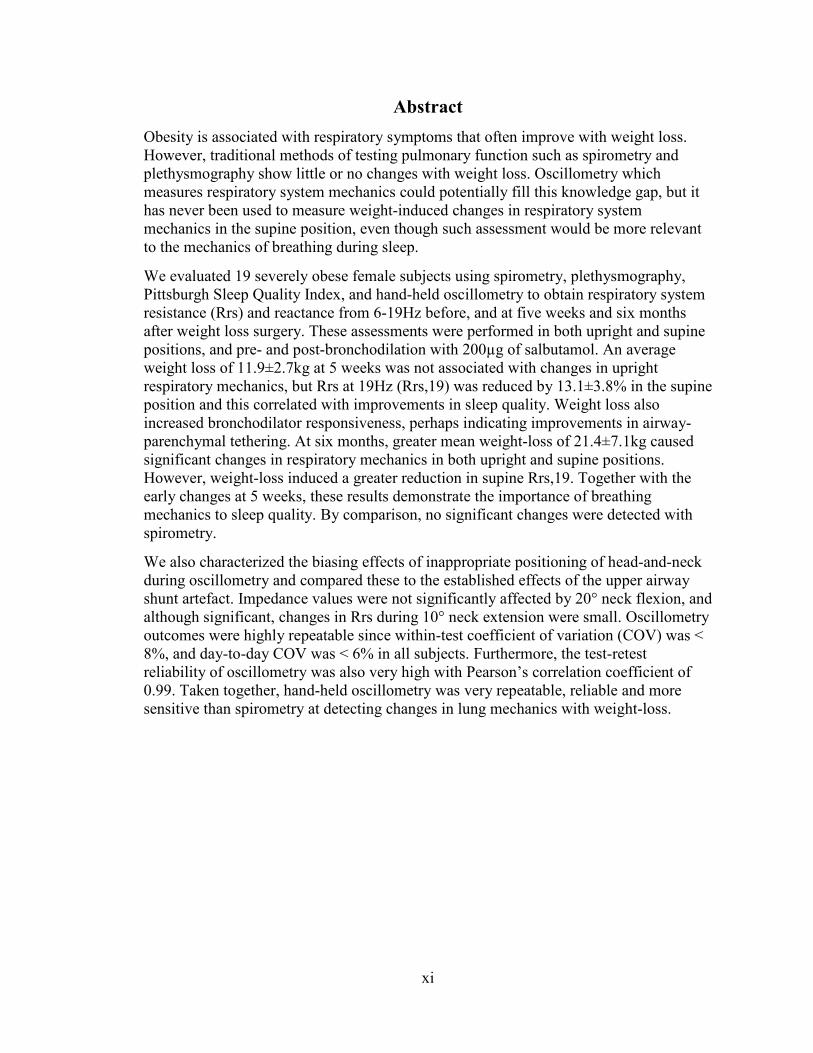
Abstract Obesity is associated with respiratory symptoms that often improve with weight loss. However, traditional methods of testing pulmonary function such as spirometry and plethysmography show little or no changes with weight loss. Oscillometry which measures respiratory system mechanics could potentially fill this knowledge gap, but it has never been used to measure weight-induced changes in respiratory system mechanics in the supine position, even though such assessment would be more relevant to the mechanics of breathing during sleep.
We evaluated 19 severely obese female subjects using spirometry, plethysmography, Pittsburgh Sleep Quality Index, and hand-held oscillometry to obtain respiratory system resistance (Rrs) and reactance from 6-19Hz before, and at five weeks and six months after weight loss surgery. These assessments were performed in both upright and supine positions, and pre- and post-bronchodilation with 200µg of salbutamol. An average weight loss of 11.9±2.7kg at 5 weeks was not associated with changes in upright respiratory mechanics, but Rrs at 19Hz (Rrs,19) was reduced by 13.1±3.8% in the supine position and this correlated with improvements in sleep quality. Weight loss also increased bronchodilator responsiveness, perhaps indicating improvements in airway-parenchymal tethering. At six months, greater mean weight-loss of 21.4±7.1kg caused significant changes in respiratory mechanics in both upright and supine positions. However, weight-loss induced a greater reduction in supine Rrs,19. Together with the early changes at 5 weeks, these results demonstrate the importance of breathing mechanics to sleep quality. By comparison, no significant changes were detected with spirometry.
We also characterized the biasing effects of inappropriate positioning of head-and-neck during oscillometry and compared these to the established effects of the upper airway shunt artefact. Impedance values were not significantly affected by 20° neck flexion, and although significant, changes in Rrs during 10° neck extension were small. Oscillometry outcomes were highly repeatable since within-test coefficient of variation (COV) was < 8%, and day-to-day COV was < 6% in all subjects. Furthermore, the test-retest reliability of oscillometry was also very high with Pearson’s correlation coefficient of 0.99. Taken together, hand-held oscillometry was very repeatable, reliable and more sensitive than spirometry at detecting changes in lung mechanics with weight-loss.
xi

List of Abbreviations and Symbols Used
AHR airway hyperresponsiveness
ANOVA analysis of variance
ASM airway smooth muscle
ATS American Thoracic Society
BAL bronchoalveolar lavage
BD bronchodilator
BMI body mass index
CCW chest wall compliance
CI confidence interval
CL lung compliance
cm H2O centimeter of water
COV coefficient of variation
COPD chronic obstructive pulmonary disease
Crs respiratory system compliance
CRS respiratory system compliance
DEXA dual-energy X-ray absorptiometry
E elastance
Ec central elastance
Ep peripheral elastance
Ers respiratory system elastance
ERS European Respiratory Society
ERV expiratory reserve volume
FEF25-75 forced expiratory flow between 25-75% of FVC
FEF75 forced expiratory flow at 75% of FVC
FEF50 forced expiratory flow at 50% of FVC
FEF25 forced expiratory flow at 25% of FVC
FEV1 forced expiratory volume in one second
FFT fast Fourier transform
FOT forced oscillation technique
xii

FRC functional residual capacity
FVC forced vital capacity
GINA Global Initiative for Asthma
GOLD Global Initiative for Chronic Obstructive Lung Disease
hs-CRP high-sensitivity C-reactive protein
Ic central inertance
IC inspiratory capacity
ICS inhaled corticosteroid
IFN-γ interferon-gamma
IgE immunoglobulin E
IL interleukin
IRV inspiratory reserve volume
ISAAC International Study of Asthma and Allergies in Childhood
IVC inspiratory vital capacity
kg kilogram
L liter
LABA long-acting beta-agonist
LTRA leukotriene receptor antagonist
MCh methacholine
MCP-1 monocyte chemoattractant protein-1
P pressure
PC20 provocative concentration of MCh that induces a 20% fall in FEV1
PD20 provocative dose of MCh that induces a 20% fall in FEV1
PEF peak expiratory flow
PFT pulmonary function test
PSQI Pittsburgh sleep quality index
R resistance
Raw airway resistance
Rc central resistance
RCT randomized controlled trial
Rrs respiratory system resistance
xiii
RV residual volume
s second or seconds
SABA short-acting β2-adreneric agonist
SD standard deviation
SDXrs standard deviation of respiratory system reactance
SE standard error of the mean
sRaw specific airway resistance
TH T-helper
TLC total lung capacity
TNF-α tumor necrosis factor – alpha
VC vital capacity
V volume
VT tidal volume
WC waist circumference
Xrs respiratory system reactance
Zrs respiratory system impedance
Z1 upper compartment impedance
Z2 lower compartment impedance
Z3 lower compartment impedance, representing the elastance of central
airways
V flow
xiv
Acknowledgements I would love to express my appreciation to the Government of Akwa Ibom State, Akwa Ibom
State University, Niger Delta Development Commission, Natural Sciences and Engineering
Research Council of Canada, Lung Association of Nova Scotia, and Dalhousie University for
giving me the privilege and opportunity to undertake this research work. These organizations
generously supported my studentship for nearly my entire course of study, and for that I say
“thank you.”
I am deeply indebted to my supervisor, Dr. Geoffrey Maksym for the stimulating support he
provided me during the course of this work. Indeed, the years we spent working together
reminds me of the proverb: better than a thousand days of thorough learning, is a single day with
a great teacher. His insights and problem solving skills were invaluable to the success of this
thesis. My sincere thanks also goes to members of my supervisory committee – Drs. Gail
Dechman, Paul Hernandez, Jason Gu, and Andrew Milne. Thank you very much for asking the
tough questions that provoke me to think outside the box. I am also grateful to Dr. James
Ellsmere and Dianne Russell for helping me recruit patients into my study. My heartfelt
gratitude is extended to Thorasys Thoracic Medical Systems Inc., in particular Dr. Thomas
Schuessler, Guy Drapeau, and Fahad Altimimi for all the valuable contributions they made
towards the development of the tremoFloTM Airwave Oscillometry System.
I have been blessed to work with very supportive colleagues at the Airway Mechanics Lab;
colleagues like Drs. Swati Bhatawadekar, Hamed Hanafi, Del Leary, Florentin Wilfart, and
Marwa Alamer, Jonathan Tjong, and Darren Cole. Thank you very much for fostering a friendly
and inspiring work environment that enabled us to accomplish the goals we set for ourselves. I
am comforted by the fact that we will remain good friends, even as we collaborate to confront
future challenges in the field of lung mechanics.
Lastly, I would like to dedicate this work to my family for their constant support. I am
particularly grateful to my Mom for the gift of education and the role she plays in shaping my
life; Mr. Anietie Peters for paving the way to graduate school for me and for the fatherly advice
he often offers me; Mr. Uduak Peters and Mr. Ukeme Peters for both taking me under their
wings; Engr. and Mrs. Aniefiok Idiok for their financial support, and Dr. Princewill Ekanim for
being my source of inspiration. I also acknowledge the support and encouragement of my friends
especially Sharifah Nansukusa – your support and kind words of encouragement provided me
strength to push through the challenges of this work and life in general. May God bless you all!
xv
Chapter 1: Introduction
In this chapter, I provide an overview of the thesis describing the motivation for the
studies I conducted. The organization of the thesis chapters is provided in Section 1.2 and
a list of original manuscripts and conference abstracts arising from this thesis is provided
in Section 1.3.
1.1 Motivation for the Thesis
Obesity is associated with asthma [1], obstructive sleep apnea [2], and obesity
hypoventilation syndrome [3]. It is also associated with respiratory symptoms such as
wheeze and dyspnea. These symptoms can be difficult to manage in individuals with
obesity, and bronchodilators are reported to exhibit limited effectiveness [4-8]. However,
symptoms often improve with weight loss but traditional methods of testing lung function
such as spirometry and plethysmography often show little or no changes with weight loss
[9-11]. This lack of information from traditional lung function tests has hampered our
ability to unravel the mechanisms that link obesity and weight loss to changes in
respiratory health. Furthermore, lung function is typically assessed in the upright position
but the respiratory symptoms associated with obesity are reported to be worse when
subjects lie down and this affects their sleep quality [12, 13]. Unfortunately, there are no
studies on the respiratory health consequences of weight loss in the supine position.
A novel technique for measuring lung mechanics and function known as oscillometry
could potentially fill this knowledge gap by providing clinically useful information on the
mechanisms that facilitate the relationship between obesity and respiratory symptoms.
This thesis investigates the utility of this technique in detecting weight-induced changes
in lung mechanics as compared to traditional methods of testing lung function.
We hypothesized that oscillometry outcomes would show larger changes in lung
mechanics than spirometry and plethysmography outcomes after weight-loss surgery, and
that these changes would be associated with improvements in sleep quality reported by
the patients. We measured lung mechanics with oscillometry in the upright and supine
1

position and recorded the changes that occurred with weight loss. We then compared the
changes in oscillometry outcomes to changes measured with spirometry and
plethysmography. Furthermore, we hypothesized that changes in lung mechanics
measured in the supine position following weight loss would be associated with changes
in sleep quality. Finally, to investigate the contribution of obesity to the reported
ineffectiveness of bronchodilators, we measured breathing mechanics with oscillometry
before and after inhalation of salbutamol, and compared baseline bronchodilator
responsiveness to the responsiveness measured after weight loss.
The clinical adoption of oscillometry is possibly hindered by the low repeatability of the
technique, relative to spirometry. Repeatability is defined as the variation in an outcome
measurement administered repeatedly by a specific individual or device on the same test
subject, under the same test condition and within a short period of time. Repeatability is
usually assessed from the standard deviation or percent coefficient of variation of the
repeated measures. The percent coefficient of variation for oscillometry outcomes has
been reported to be higher than 8 % in some oscillometry devices and this indicates low
repeatability [14, 15]. By comparison, the percent coefficient of variation for spirometry
is typically less than 3% and this indicates high repeatability [14]. In this thesis, we used
a portable, handheld oscillometry device which allowed us to collect measurements in
both upright and supine positions. However, the repeatability of this device has never
been characterized before. Furthermore, it has been speculated that incorrect positioning
of the head and neck during oscillometry could potentially affect the repeatability of
oscillometry outcomes [14]. Thus, we hypothesized that a portable, handheld
oscillometry device demonstrates high repeatability, and low and acceptable variability,
even in the presence of artefacts such as variations in positioning of the head and neck.
The following section describes the structure of this thesis.
1.2 Thesis Organization
This thesis is divided into five chapters. Chapter 2 provides a broad review of published
literature relevant to this thesis. It describes the state of the art in the field of lung
2

mechanics and function with a special focus on obesity and weight loss. Other topics
reviewed include the clinical application of the oscillometry technique in the assessment
of respiratory mechanics as well as a brief introduction into conventional methods of
assessing pulmonary function. This section ends with a description of the research
hypotheses, aims and approaches.
In Chapter 3, we investigated whether changes in lung mechanics relatively soon after
weight loss surgery are detectable with oscillometry. Results obtained were compared to
outcomes from spirometry and plethysmography. We also investigated whether the
changes in lung mechanics measured in the supine position following weight loss are
associated with changes in sleep quality. This work led to an original manuscript titled
“Early detection of changes in lung mechanics with oscillometry following bariatric
surgery in severe obesity” authored by Ubong Peters, and coauthored by Drs. Paul
Hernandez, Gail Dechman, James Ellsmere, and Geoffrey Maksym. The manuscript is
published in Applied Physiology, Nutrition and Metabolism and a modified version is
presented in Chapter 3.
In Chapter 4, we extended the follow-up period of our previous weight loss study from 5
weeks to 6 months and re-evaluated lung function and sleep quality in our study
participants using oscillometry, spirometry, plethysmography, and Pittsburgh Sleep
Quality Index (PSQI). Results obtained were compared to those recorded earlier at
baseline and 5 weeks after surgery. A manuscript for this study is being prepared for
submission.
Chapter 5 investigates the effect of incorrect positioning of head and neck during
oscillometry on the repeatability and variability of oscillometry outcomes. The effect of
the upper airway shunt artefact on the repeatability and variability of oscillometry
outcomes was also assessed, and the within-session repeatability and day-to-day
reproducibility of a portable, handheld oscillometry device was characterized. A
manuscript for this work is also currently under preparation.
A summary of the findings presented in this thesis is provided in Chapter 6. A discussion
of the significance and implications of these findings is also presented along with a
3

summary of the original contributions of this thesis. This chapter ends with suggestions
for future work.
1.3 Manuscripts, Conference Abstracts and Proceedings arising from the Thesis.
Journal Articles and Manuscripts
1. Ubong Peters, Paul Hernandez, Gail Dechman, James Ellsmere, and Geoffrey
Maksym. Early Detection of Changes in Lung Mechanics with Oscillometry
Following Bariatric Surgery in Severe Obesity. Applied Physiology, Nutrition and
Metabolism. 2016 May; 41(5) 538–47. doi: 10.1139/apnm-2015-0473.
2. Ubong Peters, Gail Dechman, Paul Hernandez, Thomas Schuessler, and Geoffrey
Maksym. Repeatability, Variability and Reliability of Respiratory Impedance:
Effect of Upper Airway Shunt Artefact, and Head and Neck Positioning (to be
submitted)
3. Ubong Peters, Swati Bhatawadekar, Paul Hernandez, Gail Dechman, James
Ellsmere, and Geoffrey Maksym. Improvements in Upright and Supine Lung
Mechanics with Weight Loss Surgery: Sleep Quality and Bronchodilator
Responsiveness (to be submitted)
Conference Abstracts and Proceedings
1. Ubong Peters, Paul Hernandez, Gail Dechman, James Ellsmere, and Geoffrey
Maksym. Improvements in Lung Mechanics with Weight Loss in Severely
Obese Subjects Following Bariatric Surgery: Sleep Quality and
Bronchodilator Responsiveness. Poster discussion, Canadian Respiratory
Conference, Halifax, Nova Scotia. April 2016.
2. Ubong Peters, Paul Hernandez, Gail Dechman, James Ellsmere, and Geoffrey
Maksym. The Bronchodilatory Effects of Beta-Agonist and Weight Loss are
Similar in Severely Obese Patients after Bariatric Surgery. Podium
4
presentation, Obesity and Metabolism Conference, University of Vermont,
Burlington, Vermont. October 2015.
3. Hamed Hanafi, Kamal El-Sankary, Ubong Peters, Marwa Al-Amer, Dietrich
Henzler, Andrew Milne, Jeremy Brown, and Geoffrey Maksym. Assessing the
accuracy of oscillometry in tracking the mean values and temporal changes in
impedance of children. Poster presentation, Annual Congress of the European
Respiratory Society, Amsterdam, Netherlands. September 2015.
4. Ubong Peters, Swati Bhatawadekar, Gail Dechman, James Ellsmere, Paul
Hernandez, and Geoffrey Maksym. Bariatric Surgery Improves Lung
Mechanics of Severely Obese Patients in the Supine Position. Poster
discussion, American Thoracic Society International Conference, Denver,
Colorado. Am J Respir Crit Care Med 191; 2015: A1222, May 2015.
5. Ubong Peters, Gail Dechman, James Ellsmere, Thomas Schuessler, Paul
Hernandez, and Geoffrey Maksym. Repeatability and Reliability of
Respiratory Impedance in Obese and Nonobese Adults. Poster presentation,
American Thoracic Society International Conference, Denver, Colorado. Am J
Respir Crit Care Med 191; 2015: A2101, May 2015.
6. Marwa Al-Amer, Ubong Peters, Swati Bhatawadekar, Wade Watson, and
Geoffrey Maksym. Repeatability of Respiratory Impedance and
Bronchodilatory Response in Asthmatic Children. Poster presentation,
American Thoracic Society International Conference, Denver, Colorado. Am J
Respir Crit Care Med 191; 2015: A2105, May 2015.
7. Ubong Peters, Paul Hernandez, Gail Dechman, James Ellsmere, and Geoffrey
Maksym. Lung Function Following Weight Loss. Podium presentation,
Atlantic Respirology and Critical Care Medicine Conference, Halifax, Nova
Scotia. November 2014.
8. Ubong Peters, James Ellsmere, Paul Hernandez, Thomas Schuessler, and
Geoffrey Maksym. The Effect of Artefacts on Variability and Repeatability of
Respiratory Impedance in Healthy Adults. Poster presentation, American
Thoracic Society International Conference, San Diego, California. Am J
Respir Crit Care Med 189; 2014: A3546, May 2014.
5
9. Ubong Peters, Gail Dechman, James Ellsmere, Paul Hernandez, and Geoffrey
Maksym. The Role of Parenchymal Tethering on Lung Mechanics in Obesity
before and after Bariatric Surgery. Poster presentation, American Thoracic
Society International Conference, San Diego, California. Am J Respir Crit
Care Med 189; 2014: A3517, May 2014.
10. Ubong Peters, Swati Bhatawadekar, Gail Dechman, James Ellsmere, Paul
Hernandez, Dietrich Henzler, and Geoffrey Maksym. Lung mechanics in
obesity and changes with bariatric surgery: role of airway smooth muscle tone
and airway unloading. Poster presentation, Atlantic Respirology and Critical
Care Conference, Halifax, Nova Scotia. November 2013.
11. Ubong Peters, Swati Bhatawadekar, Gail Dechman, James Ellsmere, Paul
Hernandez, Dietrich Henzler, and Geoffrey Maksym. Lung mechanics in
obesity and changes with bariatric surgery: role of airway smooth muscle tone
and airway unloading. Poster discussion, Annual Congress of the European
Respiratory Society, Barcelona, Spain. September 2013.
12. Yuanyuan Chen, Timothy Brown, Swati Bhatawadekar, Del Leary, Ubong
Peters, Linhong Deng, and Geoffrey Maksym. A method for assessing glottis
aperture variation on airway resistance by forced oscillation. Poster
presentation, Annual Scientific Meeting of the Biomedical Engineering
Society, Austin, Texas. October 2010.
13. Ubong Peters, Guy Drapeau, and Geoffrey Maksym. Testing and Validation
of a Handheld Oscillation Spirometer Prototype. Poster presentation, Annual
Scientific Meeting of the Biomedical Engineering Society, Pittsburgh,
Pennsylvania. October 2009.
6

Chapter 2: Review of Relevant Literature
This chapter provides a broad review of published literature relevant to this thesis. It
principally covers the role of obesity in altered lung function. Obesity often leads to
asthma-like symptoms and asthma is a common comorbidity in these subjects. Therefore,
this review also examines the state of the art in the field of lung mechanics with a specific
focus on pulmonary mechanics in asthma. A general review of asthma is first provided
followed by a detailed discussion of how asthma-like symptoms could possibly arise in
individuals with obesity. Other topics reviewed include the clinical application of the
oscillometry technique in the assessment of pulmonary mechanics. An introduction to
conventional methods of assessing pulmonary function is also provided. This chapter
ends with a description of the research hypotheses, aims and approaches.
2.1 The Respiratory System and the Mechanics of Breathing
The respiratory system can be described as a parallel combination of mechanical and
physiological subsystems acting together in a synchronous fashion to facilitate one of the
most vital processes of life – gas exchange. The physiological subsystem comprises of
two functional zones namely, the conducting zone (pharynx, larynx, trachea, bronchi) and
the respiratory zone (respiratory bronchioles, alveolar ducts, alveoli) while the
mechanical subsystem is made up of the rib cage, pleural sac and muscles that assist in
moving air into and out of the lungs during breathing. These muscles include the
diaphragm and the nondiaphragmatic (intercostal) muscles. Other accessory muscles that
also play a role in respiration include the abdominal muscles, the sternocleidomastoid,
alae nasi and scalenus muscle.
During inspiration, the diaphragm contracts and moves downwards, the external
intercostal muscles contract, the rib cage moves upwards and out, while the abdominal
muscles relaxes [16]. The increase in chest cavity volume and the increase in the negative
pressure within this region with respect to atmosphere results in the inflation of the lungs
[17, 18]. Following inspiration, a relaxed exhalation of air from the lungs occurs as a
7
result of the passive elastic recoil of the lung and chest wall returning to their equilibrium
state of balance, which is between inward recoil of the lung and outward recoil of the
chest wall. This balance occurs at a defined lung volume known as the functional residual
capacity (FRC). This is described in more detail in section 2.3. Unlike the act of
inspiration which is an active event involving the respiratory muscles, expiration is
usually passive, except during exercise or forced exhalation maneuvers when the
abdominal muscles and internal intercostal muscles are recruited to assist.
The Structure of the Lungs
The lung is a highly complex structure made up of thousands of tree-like branching
airways. Air comes into the lung through the trachea but the trachea divides into right and
left main bronchus, which then divides into lobar bronchi, and then segmental bronchi.
Penetrating further into the lungs, the airways become more numerous, they branch
repeatedly, and they also become narrower and smaller. These structural changes
continue up to the alveoli. The human airway tree is made up of about 23 generations of
dichotomously-branching airways [19]. This process of dichotomous bifurcation at each
airway generation continues even at the level of the terminal bronchioles, which make up
the last set of conducting airways. The trachea and bronchi make up the conducting
airways. These conducting airways are often referred to as the anatomic dead space
because they have no alveoli, and as such they do not take part in gas exchange. The
terminal bronchi then branch repeatedly to form the respiratory bronchioles, which are
the site where alveolization begins as some alveoli can be found occasionally budding off
the walls of the respiratory bronchioles. The bifurcation ends at the alveolar ducts, and
the alveoli. The alveoli make up most of the lung parenchyma.
The alveolus is the main site in the respiratory system where physiological gas exchange
actually occurs. In total there are about 300-500 million alveoli in a healthy adult lung
and this covers an area of approximately 70-80 m2 which is about the size of a tennis
court [19, 20]. It is made up of a squamous epithelial cell layer lining the inner surface,
supported by an extracellular matrix containing the blood capillaries. Deoxygenated
blood containing carbon dioxide from all body tissues is exchanged for fresh oxygen
8

through the blood capillaries of the alveoli. The alveolated regions of the lung described
here make up the respiratory zone.
The alveolar walls contain the proteins – collagen and elastin which are largely
responsible for the structure and architecture of the lung parenchyma and also contribute
to its compliance (i.e volume change per unit change in pressure). However, since the
alveoli are lined with fluid, the compliance (inverse of elastance or stiffness) of the
respiratory system arises from a combination of the elastic forces generated when the
collagen and elastin fibers stretch during breathing, and from the surface tension of the
alveolar lining fluid. The compliance of the respiratory system is also influenced by
components of the chest wall which include the rib cage and diaphragm.
The following sections describe some common respiratory disorders and some of the tests
that are used to understand them.
2.2 Lung Diseases
There are many types of respiratory diseases but the most common ones include asthma,
chronic obstructive pulmonary disease (COPD), lung cancer, tuberculosis, cystic fibrosis,
obstructive sleep apnea (OSA), respiratory distress syndrome (RDS), pneumonia and
influenza. The main focus of this section is on asthma because it is a common
comorbidity in obesity [21], and many individuals with obesity often present with
asthma-like symptoms [22, 23]. A brief review of COPD is also provided here since
patients with COPD were also studied in this thesis.
It is estimated that more than 3 million Canadians suffer every year from the five most
prevalent lung diseases presented in Table 2.1 [24]. In the United Kingdom, respiratory
diseases make up the second largest cause of death with more than 117,000 deaths
recorded in 2004 [25] and in the United States, respiratory disease is rated as the third
biggest killer with approximately 35 million Americans living with some form of chronic
lung disease such as asthma or COPD [26].
9

Most respiratory diseases fall into two main categories, viz; obstructive respiratory
diseases and restrictive respiratory diseases. Obstructive diseases are characterized by
airflow limitation due to excessive mucus production or narrowing of the lung airways.
Common examples of obstructive lung disease include: cystic fibrosis, asthma and
COPD.
Table 2.1: Prevalence of some common respiratory diseases in Canada *
Respiratory Disease Affected Canadians
Asthma – physician diagnosed (prevalence 2014) * 2,448,817
COPD – physician diagnosed (prevalence 2014) * 804,043
Lung cancer (new cases – 2014) * 26,100
Cystic fibrosis (prevalence from registry – 2013) † 4,077
Tuberculosis (new or reactivated cases – 2014) * 1,600
* Information sourced from [27].
† Information sourced from [28].
Restrictive respiratory diseases, on the other hand, are characterized by stiffer lungs,
reduced lung volumes accompanied by a significant decline in lung compliance.
Examples of restrictive lung diseases include: interstitial pulmonary fibrosis and
interstitial lung disease (including sarcoidosis), pneumonia, and extra-pulmonary
restrictive lung diseases (scoliosis). These pathologies manifest changes to the mechanics
of the respiratory system which can, if measured, be used diagnostically.
A brief description of the two most prevalent respiratory diseases is provided below,
followed by an introduction to various tests used in assessing changes in lung function
caused by these diseases.
10
2.2.1 Asthma
Definition of Asthma
Asthma is a complex and heterogeneous disease. Historically, the term “asthma” was
loosely applied to refer to any respiratory condition that resembled dyspnea. Despite
tremendous advances in our understanding of the disease, the definition of asthma is still
the subject of many scientific debates. According to the Global Initiative for Asthma
(GINA) [29], asthma is defined as “a chronic inflammatory disease of the airways in
which many cell types play a role, in particular mast cells, eosinophils and T
lymphocytes. In susceptible individuals, the inflammation causes recurrent episodes of
wheezing, breathlessness, chest tightness and cough particularly at night and/or early
morning. These symptoms are usually associated with widespread but variable airflow
obstruction that is at least partly reversible either spontaneously or with treatment. The
inflammation also causes an associated increase in airway responsiveness to a variety of
stimuli.”
This definition of asthma recognized the central role chronic inflammation plays in the
disease process. It also suggests that the best way to control the progression of the disease
is to treat the underlying inflammatory process that is responsible for the changes in
structure and function of the pulmonary airways. Indeed, structural remodeling of the
airways is a well-documented pathological feature of asthma that is believed to be present
in the airways of individuals with asthma [30, 31], including those newly diagnosed with
the disease [32]. Such remodelling is characterized by increased airway smooth muscle
(ASM) mass, angiogenesis, thickening of the reticular basement membrane and damage
to bronchial epithelium [31, 33, 34].
Epidemiology of Asthma and its Economic Cost
Asthma is one of the most chronic diseases in North America with almost 2.5 million
Canadians suffering from the disease (Table 2.1) [24, 35]. Epidemiological data have
revealed that asthma is more prevalent among children with prevalence rates reported to
11

be about 10-15% of children and about 5% of the adult population [36]. In the US, it is
estimated that 22.2 million Americans, representing 7.7% of the total population, have
asthma [37]. The prevalence rate of the disease is reported to decline with age with a
breakdown of the rate indicating that 8.9% of children and 7.2% of adults have the
disease. Surprisingly, approximately 32% of asthmatic adults in the US are also obese
[38], suggesting a relationship between obesity and asthma. This relationship is reviewed
in more detail in Section 2.4.1.
According to the European Respiratory Society (ERS), the cost of asthma care in Europe
alone is estimated to be over €17 billion and the loss of productivity due to the disease is
over €9 billion annually [39]. The annual direct cost of asthma care in Canada is
estimated to range from $504 to $684 million CAD [40] while the estimated direct and
indirect cost of asthma care per year in the US is about $12.6 billion USD [41].
Pathophysiologic Mechanisms of Asthma
The symptoms of asthma develop through numerous pathophysiological mechanisms that
are triggered by a wide variety of stimuli, ultimately resulting in bronchoconstriction and
airflow obstruction [42]. The pathophysiology of classical asthma is reviewed in detail in
Appendix A to enable us to draw parallels to the pathophysiology of asthma-like
symptoms in obesity. This review is important because it is not yet known whether the
mechanisms of classical asthma are distinct from the mechanisms of asthma or asthma-
like symptoms in obese individuals. The pathophysiologic mechanisms of asthma-like
symptoms in obesity will be reviewed in detail in Section 2.4.
Diagnosing Asthma
Since asthma is more frequently diagnosed in obese individuals than lean individuals, and
the changes in pulmonary function can be similar in obesity and asthma, it is important to
understand how asthma is diagnosed. The challenges in diagnosing asthma in obesity are
described in the next section.
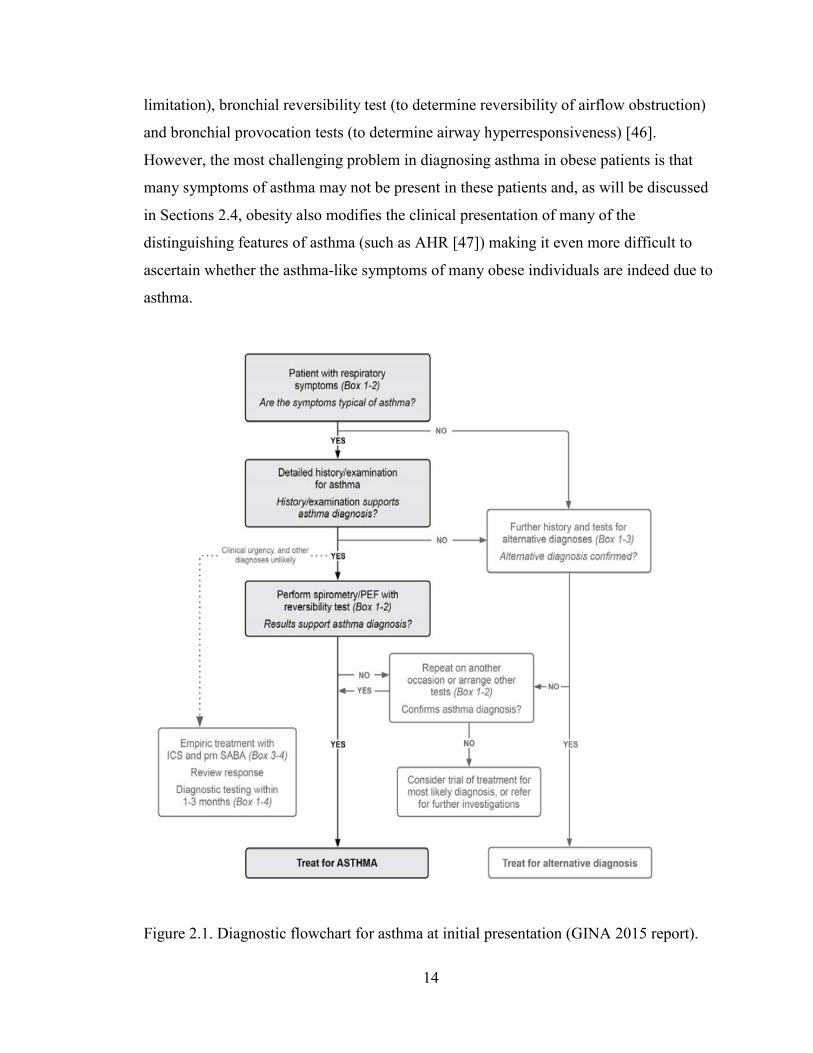
The criteria for diagnosing asthma in adults are presented in Figure 2.1. Asthma is
usually diagnosed using a combination of different tools beginning with physical
12
examination and detailed documentation of the patient’s medical history including history
of wheeze, dyspnea, chest tightness and cough and how these symptoms vary in intensity.
Other conditions such as COPD, upper airway obstruction, gastric esophageal reflux
disease, pulmonary embolism and heart failure can cause wheezing and other symptoms
that are similar to the symptoms of asthma; therefore, a differential diagnosis must be
performed if the patient does not fit the criteria described here (i.e history and symptoms
that vary in intensity) as shown in Figure 2.1. This is usually followed by lung function
tests (see Section 2.3 for a detailed description) to document the presence of excessive
variability in lung function, airflow limitation and reversible airflow obstruction, airway
hyperresponsiveness, and to document the progression of the disease over time (Global
Initiative for Asthma [43]).
Reversibility of airflow obstruction is usually assessed during a bronchial reversibility
test with a short-acting beta2-adrenergic agonist (SABA) such as salbutamol. When
available, bronchial provocation test with a bronchoactive agent such as methacholine is
also used to determine airway hyperresponsiveness (AHR). Tests for AHR and bronchial
reversibility are described in detail in Section 2.3. Briefly, the airways are considered
hyperresponsive if inhalation of 16 mg/mL of methacholine induces more than a 20 %
drop in forced expired volume in one second (FEV1) [44], while the clinical threshold for
positive bronchial reversibility required to diagnose asthma is a 12 % increase in FEV1
from baseline together with a minimum increase in volume of 200 ml [45]. According to
guidelines used in diagnosing asthma, airflow obstruction occurs when the ratio of FEV1
to forced vital capacity (FVC) is lower than 0.75 (Global Initiative for Asthma [43]).
FEV1 is defined as the volume of air that can be forcibly exhaled from the lung in the first
second of a forced exhalation maneuver while FVC is defined as the total volume of air
that is exhaled from the lungs during the forced exhalation maneuver. These tests are also
described in detail in Section 2.3.
The Challenges in Diagnosing Asthma in Obese Individuals
As mentioned above, asthma is usually diagnosed using a combination of different tools
that include: physical examination and past medical history (intermittent and variable
wheeze, dyspnea, chest tightness and cough), lung function tests (to determine airflow
13
limitation), bronchial reversibility test (to determine reversibility of airflow obstruction)
and bronchial provocation tests (to determine airway hyperresponsiveness) [46].
However, the most challenging problem in diagnosing asthma in obese patients is that
many symptoms of asthma may not be present in these patients and, as will be discussed
in Sections 2.4, obesity also modifies the clinical presentation of many of the
distinguishing features of asthma (such as AHR [47]) making it even more difficult to
ascertain whether the asthma-like symptoms of many obese individuals are indeed due to
asthma.
Figure 2.1. Diagnostic flowchart for asthma at initial presentation (GINA 2015 report).
14
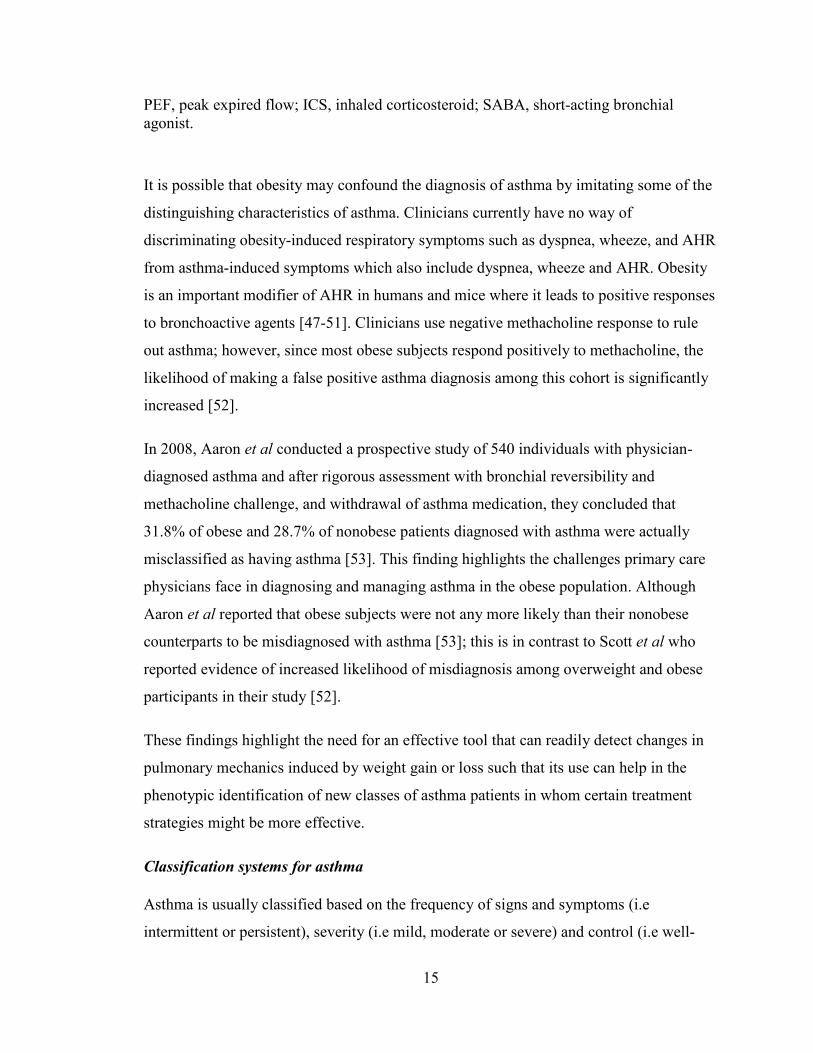
PEF, peak expired flow; ICS, inhaled corticosteroid; SABA, short-acting bronchial agonist.
It is possible that obesity may confound the diagnosis of asthma by imitating some of the
distinguishing characteristics of asthma. Clinicians currently have no way of
discriminating obesity-induced respiratory symptoms such as dyspnea, wheeze, and AHR
from asthma-induced symptoms which also include dyspnea, wheeze and AHR. Obesity
is an important modifier of AHR in humans and mice where it leads to positive responses
to bronchoactive agents [47-51]. Clinicians use negative methacholine response to rule
out asthma; however, since most obese subjects respond positively to methacholine, the
likelihood of making a false positive asthma diagnosis among this cohort is significantly
increased [52].
In 2008, Aaron et al conducted a prospective study of 540 individuals with physician-
diagnosed asthma and after rigorous assessment with bronchial reversibility and
methacholine challenge, and withdrawal of asthma medication, they concluded that
31.8% of obese and 28.7% of nonobese patients diagnosed with asthma were actually
misclassified as having asthma [53]. This finding highlights the challenges primary care
physicians face in diagnosing and managing asthma in the obese population. Although
Aaron et al reported that obese subjects were not any more likely than their nonobese
counterparts to be misdiagnosed with asthma [53]; this is in contrast to Scott et al who
reported evidence of increased likelihood of misdiagnosis among overweight and obese
participants in their study [52].
These findings highlight the need for an effective tool that can readily detect changes in
pulmonary mechanics induced by weight gain or loss such that its use can help in the
phenotypic identification of new classes of asthma patients in whom certain treatment
strategies might be more effective.
Classification systems for asthma
Asthma is usually classified based on the frequency of signs and symptoms (i.e
intermittent or persistent), severity (i.e mild, moderate or severe) and control (i.e well-
15
controlled, not well-controlled, very poorly controlled) (Global Initiative for Asthma
[43]); however, given the heterogeneous and complex nature of the disease, many experts
have suggested other methods for classifying the disease. In 2006, a comprehensive and
integrated method of classification for asthma was proposed [54]. This method classifies
asthma into three distinct phenotypic categories based on its clinical features (i.e
exacerbation-prone, chronic airflow obstruction, treatment resistant, age of onset), the
stimulants that trigger an attack (i.e allergic, occupational, exercise-induced, aspirin-
induced, menses-related, obesity-related) or based on its inflammatory phenotype (i.e
eosinophilic, neutrophilic, paucigranulocytic) [54].
In the same vein, cluster analysis of demographic, clinical and/or pathophysiological
characteristics of participants enrolled in the Severe Asthma Research Program have also
led to the identification of five new asthma phenotypes [55]. The phenotypic
characteristics of the five asthma clusters identified in this study were:
(i) early-onset atopic asthma with normal lung function treated with two or fewer
controller medications and minimal healthcare utilization,
(ii) early-onset atopic asthma and well preserved lung function but increased
medication requirements and healthcare utilization,
(iii) older obese women with late-onset non-atopic asthma and frequent use of oral
corticosteroids.
Subjects in the remaining two clusters all had severe airflow obstruction and
demonstrated bronchial reversibility but they differed in their age of asthma onset, atopic
status and use of oral corticosteroids.
These findings suggest that each phenotype of asthma may be caused by a specific
pathophysiologic mechanism implying that the treatment strategy must be designed to
meet that specific phenotype, following a detailed characterization of the phenotype.
Indeed, in the past 5 years, two new predominant phenotypes of asthma in obese subjects
have emerged [56, 57]. These two phenotypes are: (i) atopic, early-onset, TH2-high
asthma phenotype characterized by high serum immunoglobulin-E (IgE) and the presence
of eosinophilia, and (ii) non-atopic, late-onset, TH2-low asthma phenotype characterized
16
by low serum IgE and the absence of eosinophilia. These phenotypes are described in
more detail in section 2.4.
Given the complexity and phenotypic diversity of this disease, asthma should not be
considered a single respiratory ailment; rather, it should be defined as a complex
constellation of several respiratory conditions with many overlapping phenotypes.
Perhaps in the future, a much deeper understanding of the pathophysiology of asthma will
guide the development of novel treatment strategies that would target each asthma
phenotype described in these classification systems. Indeed, there is a great need to
carefully phenotype obese individuals with asthma to understand the mechanisms behind
the increased risk of respiratory impairment in this patient group and their blunted
response to asthma treatment.
2.2.2 Chronic obstructive pulmonary disease (COPD)
A brief review of chronic obstructive pulmonary disease (COPD) is provided here
because, as described below, these patients present with impaired lung mechanics that
lead to increased respiratory system impedance. COPD is a largely irreversible lung
disorder that is characterized by damaged airway tissues and airways that narrow easily
during exhalation, resulting in persistent and progressive airflow limitation and
expiratory flow limitation [58]. It is strongly associated with inhaled particles such as
cigarette smoke, occupational dust and/or chemicals, and polluted air. These particles
irritate the lungs causing inflammatory changes in the walls of the small airways and
alveoli, including the destruction of alveolar walls due to infiltration and accumulation of
neutrophils and macrophages within the lung airways [59]. As a result of the destruction
of alveolar walls, the parenchyma loses its elasticity, and the lung elastic recoil is
consequently reduced. These pathological changes in lung parenchyma contribute to
airflow limitation observed in patients with COPD. The destruction of the alveolar walls
also attenuates airway-parenchymal tethering forces [60, 61]. Thus, the airways narrow
easily because the elastic load that is typically applied around the airways through the
parenchymal attachments is reduced. This results in an increased resistance to airflow.
17
There are several definitions for COPD. According to European Respiratory Society
(ERS), COPD is defined as “reduced maximum expiratory flow and slow forced
emptying of the lungs, which is slowly progressive and mostly irreversible to present
medical treatment” [62]. The American Thoracic Society (ATS) defines COPD as “a
diseased state characterized by the presence of airflow limitation due to chronic
bronchitis or emphysema; the airflow obstruction is generally progressive, and may be
partially reversible” [63]. However, according to the Global Initiative for Chronic
Obstructive Lung Disease (GOLD), COPD is defined as “a disease state characterized by
airflow limitation that is not fully reversible. The airflow limitation is usually both
progressive and associated with an abnormal inflammatory response of the lungs to
noxious particles or gases” [64].
The differences in these definitions show that there is no consensus yet on the precise
definition and classification for COPD, therefore, its diagnostic criteria will also vary.
Currently, the criteria for diagnosing COPD are based on the demonstration of COPD
symptoms, particularly airflow obstruction which is defined as a post-bronchodilator
FEV1/FVC ratio less than 0.7. Spirometry is not only used to determine the presence of
airflow obstruction in COPD, it is also used to classify the stages and severity of the
disease as presented in Table 2.2. The clinical manifestations of COPD include: dyspnea,
wheeze, and chronic cough that is sometimes accompanied by sputum production, poor
exercise tolerance, and respiratory failure or cor pulmonale in very advanced stages of the
disease. COPD patients sometimes demonstrate partial bronchial reversibility and airway
hyperresponsiveness.
In 2001, COPD ranked as the 5th leading cause of death worldwide, and it is projected
that it will become the 3rd leading cause of death by 2020 [65]. However, in the US,
COPD is already the 3rd leading cause of death and the 12th leading cause of mortality
[66]. COPD is the leading cause of hospitalization among adults in the US, with about
662,000 hospitalizations (1.9% of total hospitalizations) reported in 1998 alone [41]. In
the same year, COPD was also identified as a comorbidity in an additional 2,530,000
hospitalizations (7% of hospitalizations). In 1996, the National Health Interview Survey
(NHIS) estimated that about 10.2 million American adults (5.9 % of the adult population)
18
aged ≥ 25 suffer from COPD [41]. In Canada, the National Population Health Survey
conducted by Statistics Canada between 2013-14 indicated that about 804,043 Canadians
have physician-diagnosed COPD with the national prevalence reported to be 4.0% (Table
2.1) [67].
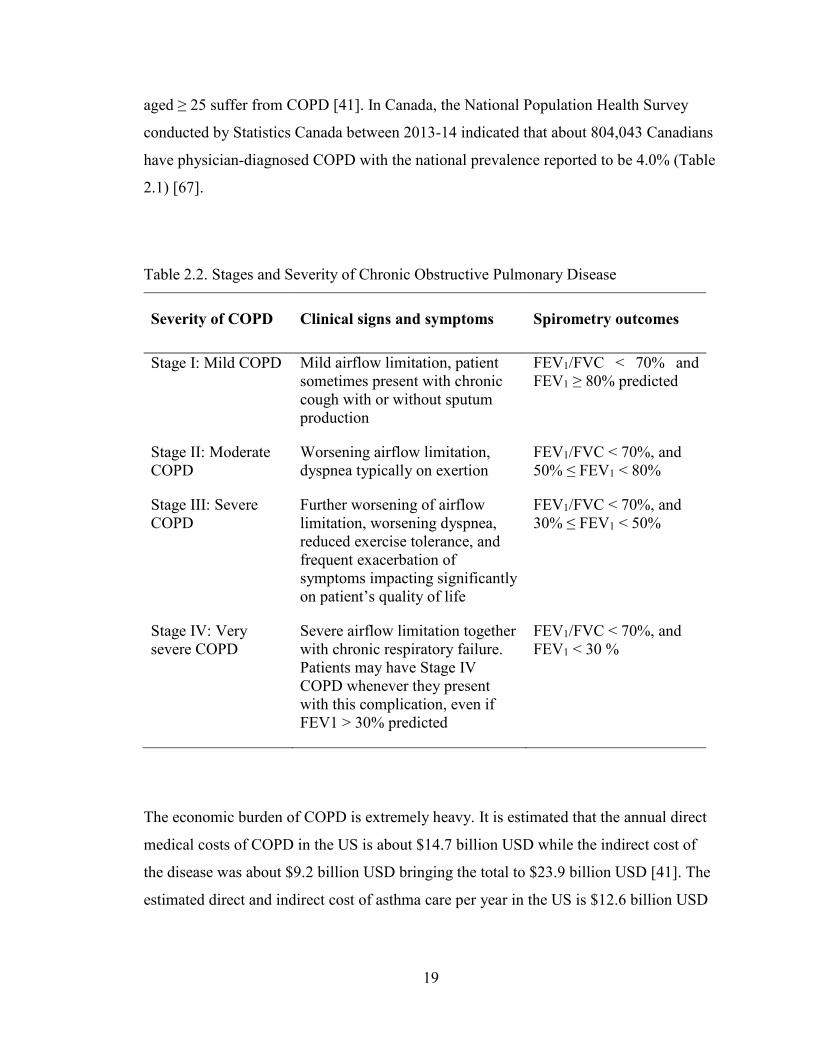
Table 2.2. Stages and Severity of Chronic Obstructive Pulmonary Disease
Severity of COPD Clinical signs and symptoms Spirometry outcomes
Stage I: Mild COPD Mild airflow limitation, patient sometimes present with chronic cough with or without sputum production
FEV1/FVC < 70% and FEV1 ≥ 80% predicted
Stage II: Moderate COPD
Worsening airflow limitation, dyspnea typically on exertion
FEV1/FVC < 70%, and 50% ≤ FEV1 < 80%
Stage III: Severe COPD
Further worsening of airflow limitation, worsening dyspnea, reduced exercise tolerance, and frequent exacerbation of symptoms impacting significantly on patient’s quality of life
FEV1/FVC < 70%, and 30% ≤ FEV1 < 50%
Stage IV: Very severe COPD
Severe airflow limitation together with chronic respiratory failure. Patients may have Stage IV COPD whenever they present with this complication, even if FEV1 > 30% predicted
FEV1/FVC < 70%, and FEV1 < 30 %
The economic burden of COPD is extremely heavy. It is estimated that the annual direct
medical costs of COPD in the US is about $14.7 billion USD while the indirect cost of
the disease was about $9.2 billion USD bringing the total to $23.9 billion USD [41]. The
estimated direct and indirect cost of asthma care per year in the US is $12.6 billion USD
19
and when added to that of COPD care, the total burden of obstructive lung disease in the
US alone rises to about $36.1 billion USD [41].
The following section describes the tests used in assessing changes in pulmonary function
caused by various respiratory diseases.
2.3 Pulmonary Function Tests
Pulmonary function tests (PFTs) provide an objective index of how well the respiratory
system is ventilating its lung by measuring the flows and volume that are associated with
normal tidal breathing, and forced inspiration and exhalation. Common ways of assessing
pulmonary function include body plethysmography, spirometry, and recently, the forced
oscillation technique (FOT), also known as oscillometry. The main focus of this thesis is
oscillometry, spirometry, and plethysmography thus these tests are described in the
following sections.
2.3.1 Spirometry
Spirometry is currently the most frequently performed and most widely accepted measure
of pulmonary function [68]. The technique was invented by John Hutchinson in 1846
after he recognized that the volume of air exhaled from total lung capacity is indicative of
lung function [69, 70]. Hutchinson’s invention has evolved over the decades to find
usefulness today as a diagnostic tool for restrictive and obstructive lung diseases, and also
as a tool for the physiological investigation of lung function.
During the spirometry test, the patient is trained to inhale to total lung capacity (TLC),
and then exhale forcibly into the spirometer while measures such as the forced vital
capacity (FVC) and the forced expired volume in 1 second (FEV1) are recorded. FEV1, or
frequently, FEV1 normalized to FVC is the “de facto” gold standard for measuring lung
function in healthy subjects and patients with asthma and COPD [71, 72] and loss of
FEV1 indicates airway obstruction. Table 2.3 provides a brief description of some of the
20

common clinical indices that can be derived from spirometry. These outcomes are usually
presented as percentiles of predicted values estimated from reference equations that take
into account the subject’s age, height, gender, and sometimes ethnicity [73-75].
Spirometry can be used to discriminate between obstructive respiratory diseases and
restrictive respiratory diseases. Obstructive lung diseases are those that lead to some
degree of obstruction to the passage of air into and out of the lung [76, 77]. Notable
examples of obstructive diseases include emphysema, chronic bronchitis, asthma and
cystic fibrosis, all of which lead to significant reductions in forced expiratory flows when
assessed with spirometry. The Global Initiative for Chronic Obstructive Lung Disease
(GOLD) criteria for classification of severity of airflow obstruction based on post-
bronchodilator FEV1 is shown in Table 2.4 [78]. According to the GOLD criteria, airflow
limitation is defined by an FEV1/FVC ratio of less than 70%, and in addition to this
criteria, FEV1 is used in classifying airflow obstruction as either mild (FEV1 ≥ 80%
predicted), moderate (50% ≤ FEV1 < 80% predicted), severe (30% ≤ FEV1 < 50%
predicted), or very severe (FEV1 < 30% predicted or FEV1 < 50% predicted plus chronic
respiratory failure), but there are other criteria that can be used which do not rely on a
fixed ratio . Restrictive respiratory disorders, on the other hand, are those that result in
significant reductions in lung volumes [76, 79]. In particular, restriction is indicated by a
low FVC in the presence of a normal FEV1/FVC ratio [45, 77, 80, 81].
Obstruction in the large and mid-sized airways, collectively known as central airways,
can be easily detected with spirometry since narrowed airways expel air more slowly [68,
82, 83]; however, this index is not sensitive to changes in the small or peripheral airways.
The distinction between central and peripheral airways that used here was first described
in 1967 by Peter Macklem and Jere Mead [84]. The upper airways includes the larynx,
pharynx, and glottis while the central airways extends from the trachea to the segmental
bronchi and includes all airways greater than 2 mm in diameter. The small peripheral
airways includes all airways less than 2 mm in diameters. Indeed, the small airways are
considered a silent zone to spirometry because changes in this region of the lungs are
typically not reflected in spirometry, unless the airway disease is at an advanced stage
[85-87]. Interestingly, mid-expiratory flow measurements including the forced expiratory
21

flow at 50% (FEF50), 75% (FEF75), and 25-75% (FEF25-75) of FVC are often cited in the
literature as sensitive indices of small airways obstruction [88, 89]; however, there is
general agreement that these measures lack specificity [80, 90, 91], with one recent study
reporting a poor correlation between mid-expiratory flow measurements and other well-
established indices of air trapping such as FVC and the ratio of residual volume to total
lung capacity [92]. The influence of obesity on spirometry outcomes is discussed below
in Section 2.4.
Table 2.3. Common spirometric measures of pulmonary function
Name Abbreviation Description
Forced vital capacity
FVC This is the volume of air that can be forcibly exhaled from the lungs after a deep inspiration.
Forced expiratory volume in 1 second
FEV1 This is the volume of air that can be forcibly exhaled from the lungs in the first second of exhalation, measured in litres.
FEV1/FVC FEV1/FVC This is the ratio of FEV1 to FVC. In healthy adults this should be approximately 0.75 – 0.80.
Peak expiratory flow
PEF This is the speed of the air moving out of your lungs at the beginning of the expiration, measured in litres per second.
Forced expiratory flow 25–75% or 25–50%
FEF25–75% or 25–
50%
This is the average flow (or speed) of air coming out of the lung during the middle half of expiration also sometimes referred to as the maximal mid-expiratory flow (MMEF).
Tidal volume VT This is the specific volume of air that is drawn into and then expired out of the lungs during the normal respiratory cycle.
22

Spirometry is considered the “de facto” gold standard for measuring the severity of
respiratory disease [71]. The technique is safe and noninvasive and spirometry devices
are cheap, portable and simple to use. Another important advantage of spirometry is that
it has been widely adopted and standardized [45, 68, 93], and normative values are
readily available [73].
Table 2.4. Spirometric classification of severity of airflow obstruction
Class Condition Description
Stage I Mild FEV1/FVC < 0.70
FEV1 ≥ 80% predicted
Stage II Moderate FEV1/FVC < 0.70
50% ≤ FEV1 < 80% predicted
Stage III Severe FEV1/FVC < 0.70
30% ≤ FEV1 < 50% predicted
Stage IV Very Severe FEV1/FVC < 0.70
FEV1 < 30% predicted or FEV1 < 50% predicted plus chronic respiratory failure
Assessment of Bronchial Reversibility with Spirometry
Bronchial reversibility or bronchodilator (BD) responsiveness is measured by assessing
pulmonary function before and after inhalation of a short acting β2-adrenergic agonist
such as salbutamol. In order to prevent the deposition of the BD in the upper airways and
to facilitate the deposition in the small airways, the BD is usually administered through
an inhaler device such as a pressurized or breath-actuated metered-dose inhaler, dry
powder inhaler, nebulizer, or soft mist inhaler [94]. The subject is instructed to exhale
completely and then asked to inhale the drug to TLC. A breath-hold of about 5-10
23
seconds is recommended upon reaching TLC to ensure widespread distribution of the
agonist within the central and small airways of the lung. According to ATS/ERS
guidelines, the clinical threshold for positive bronchial reversibility required to diagnose
asthma is at least a 12 % increase in FEV1 from baseline together with a minimum
increase in volume of 200 ml [45]. The 12 % increase in FEV1 represents the 95th
percentile for percent change from baseline after bronchodilator administration in a large
sample of the general population and patient population [45].
The bronchial reversibility test is highly specific; therefore, it is very useful in confirming
(ruling in) an asthma diagnosis, if the result is positive. This test is sometimes used in
clinical practice to distinguish subjects with asthma from those with COPD, if the
FEV1/FVC ratio normalizes following BD or if FEV1 increases by more than 10 % [45];
however, some investigators have argued that this test does not possess such
discriminatory powers [95, 96]. Moreover, because of its poor sensitivity, a negative
bronchodilator response does not conclusively rule out asthma [97], a position that has
also been adopted by the British Thoracic Society Scottish Intercollegiate Guidelines
Network [98].
The poor sensitivity and high specificity of bronchial reversibility tests could prevent
many asthma patients from taking part in randomized controlled trials (RCTs) and this
could limit the generalizability of RCTs especially considering the fact that the outcome
of these trials form the basis of many clinical guidelines and recommendations developed
for the management of asthma. This is because the inclusion criteria for most asthma
RCTs is the demonstration of BD responsiveness, defined as a 12 % increase in FEV1
from baseline [99, 100]. In fact, according to one estimate, up to 76 % of adult subjects
with asthma drawn from a random sample (n = 179) would not have met the entry criteria
for many RCTs because they did not demonstrate positive BD reversibility [101].
There is a paucity of data on the effect of obesity on BD responsiveness and this effect
has been investigated by only three studies to date. These studies which relied on
spirometry to investigate BD responsiveness in obesity showed conflicting results. The
first of these studies conducted by Castro-Rodriguez et al showed that girls who became
overweight or obese between the ages of 6 and 11 were more likely to demonstrate
24
bronchial reversibility than girls who did not become overweight or obese over the same
interval [102]. Children whose BMI are above the 85th percentile of their age- and
gender-matched counterparts are considered overweight while children whose BMI are
above the 95th percentile are considered obese [103]. However, Tantisira et al later
reported that BD responsiveness decreased with increasing body mass index (BMI) in
obese children [104]. A third study failed to establish a relationship between obesity and
reversible airway obstruction, but this was in adults. In that study, Dixon et al showed
that BD responsiveness was not associated with BMI in obese and non-obese patients
with asthma [105]. To date, there are no published studies that have investigated
bronchial reversibility in obesity using oscillometry. Furthermore, there are no published
data in the literature on the effect of weight reduction on BD responsiveness in obese
adults without asthma.
Assessment of Airway Hyperresponsiveness with Spirometry
Airway hyperresponsiveness (AHR) is a distinguishing characteristic of asthma. In
simple terms, AHR refers to a heightened response of the airway to a variety of
contractile stimuli in at risk individuals, as compared with healthy individuals who show
no clinically significant response. Bronchial provocation testing is used to measure AHR.
A heightened response to methacholine and histamine was first reported in healthy
subjects and subjects with asthma, as far back as the 1940s [106, 107]. The degree of
AHR was later discovered to correlate with asthma severity [108]. From then onwards,
this test has become standardized [44, 109] and employed in many studies to deepen our
understanding of the pathogenesis and pathophysiology of asthma and its use as a tool to
support the diagnosis and management of asthma is now recommended (Global Initiative
for Asthma [110]).
Bronchial challenge test involves the assessment of FEV1 every 30 to 90 seconds after
inhalation of increasing doses of methacholine administered through a nebulizer [44] or
dosimeter [111], until a cut off dose of 16 mg/ml is reached, or a 20% fall in FEV1 from
baseline is achieved. The test begins with the administration of saline as control, and then
doubling of methacholine dose starting from 0.03 mg/ml to 16 mg/ml. The result is
usually expressed as the provocative dose (PD) or concentration (PC) of methacholine
25
that induced a 20% fall in FEV1, i.e PD20 or PC20. The airways are considered
hyperresponsive if inhalation of 16 mg/ml of methacholine induces more than a 20 %
drop in FEV1 [44] but as a precautionary measure, challenge testing is not recommended
if the baseline FEV1 is below 60 % of the predicted FEV1. Another reason why challenge
testing is not recommended when baseline FEV1 is below 60 % of the predicted FEV1 is
because the volume changes would be so small that they may be undetectable by
spirometry. The response to the stimuli is estimated from the percent drop in FEV1 in
response to histamine or methacholine as follows:
1 1
1
100* baselineFEV lowestFEV postchallengebaselineFEV
−
Direct bronchial provocation test is a moderately sensitive test (GINA 2015 report),
therefore it is very useful in ruling out asthma (if the result is negative) but its weakness
is that it lacks specificity, implying that healthy subjects could sometimes be
misclassified as asthmatics, particularly at higher methacholine concentrations (if the
result is positive) [112]. However, there is a clinically significant difference in AHR
between healthy subjects and patients with asthma. In fact, as shown in Figure 2.2, most
healthy subjects do not present with significant AHR since their FEV1 does not drop by
up to 20%.
Healthy subjects exhibit a characteristic plateau in their dose-response curve whereas
subjects with asthma are unable to reach a similar plateau, even when FEV1 drops by
60% from baseline. As demonstrated in the seminal work of Woolcock et al, healthy
subjects can be distinguished from current asthmatics and those with mild asthma based
on the shape of their dose-response curve to histamine [113]. Subjects with severe asthma
demonstrate a steep fall in FEV1 at relatively small concentrations of methacholine while
subjects with mild asthma demonstrate a characteristic pattern whereby larger
concentration of methacholine is required to induce a clinically significant fall in FEV1
(Figure 2.2). As described earlier, the risk for AHR increases significantly with
increasing severity of obesity in both humans [47-50] and mice [51] but this will be
described in detail in Section 2.4.
26

In summary, bronchial provocation test is a very important pulmonary function test with
high diagnostic value. However, the main limitation of this test is that it has high
technical requirements and healthy individuals and patients suffering from respiratory
conditions other than asthma such as obesity could also present with positive AHR [47-
50]. Therefore, the test is more useful in ruling out asthma than in confirming asthma.
Limitations of Spirometry
Although spirometry is sensitive to changes in pulmonary function [114], its downside is
that it is highly effort dependent. In order to obtain reliable results, the test maneuver
must be learned, and active subject cooperation must be achieved. Results are considered
reliable if the patient produces at least two repeatable FEV1s, within 150 ml of each other
[68]. Reliable results also depend on the subject’s psychological state, and the pulmonary
technologist’s ability to properly coach the subject during the maneuver. However, the
cost of training the technician and the time needed to obtain satisfactory and reliable
results significantly increases the cost of health care. In fact, about 10 % of patients are
unable to perform spirometry to acceptable standards, even when coached by an
experienced respiratory technician [115]. This rate is presumably higher among preschool
children and seniors over 80 years of age. Due to these issues, spirometry is not
recommended in those with cognitive limitations and those with a limited psychological
reserve who lack the motivation to perform spirometric maneuvers. Spirometry is also
not recommended in children below the age of 6 [116], even though the International
Study of Asthma and Allergies in Childhood (ISAAC) reports that children in this age
bracket self-report symptoms such as wheezing and shortness of breath which is
consistent with asthma [35].
Furthermore, FEV1 is typically normal in those with obesity [22, 23], while FEV1/FVC
ratio is typically well preserved or slightly elevated [22, 23, 117-119], even though these
obese individuals exhibit respiratory symptoms like wheezing and shortness of breath
[22, 23]. Thus, more effective methods of measuring lung function are badly needed for
the elderly, obese populations, children and those unable to perform spirometry to
acceptable standards.
27
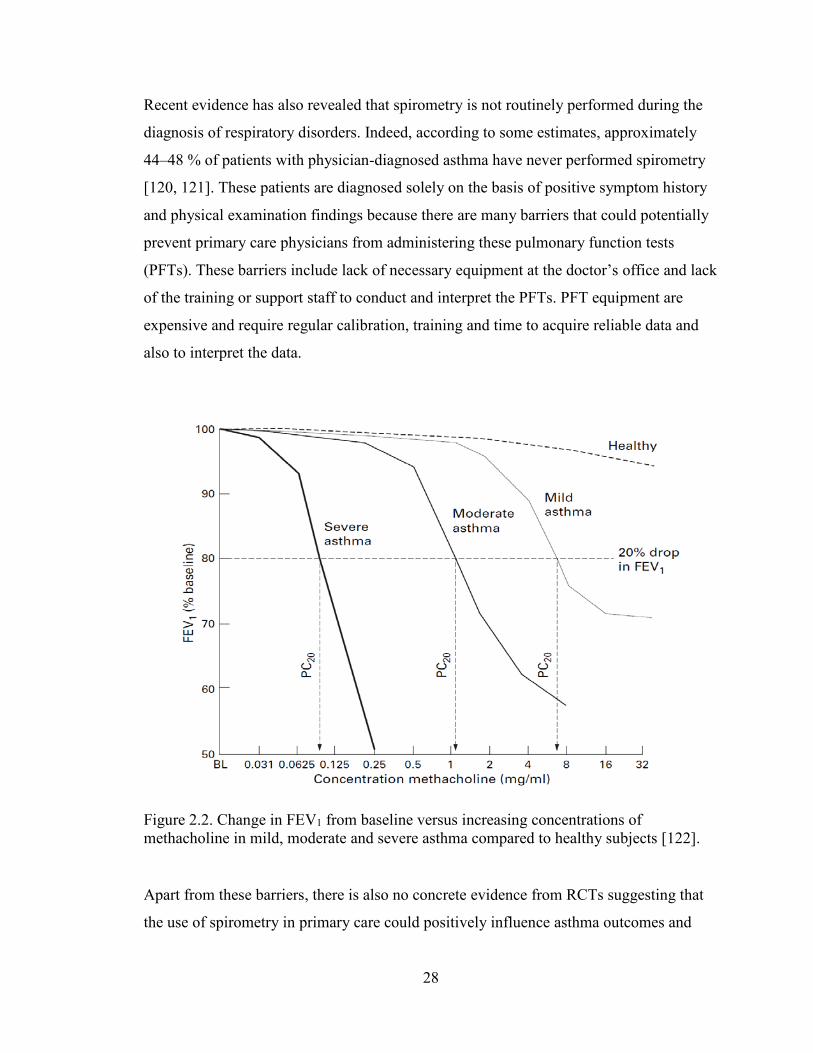
Recent evidence has also revealed that spirometry is not routinely performed during the
diagnosis of respiratory disorders. Indeed, according to some estimates, approximately
44–48 % of patients with physician-diagnosed asthma have never performed spirometry
[120, 121]. These patients are diagnosed solely on the basis of positive symptom history
and physical examination findings because there are many barriers that could potentially
prevent primary care physicians from administering these pulmonary function tests
(PFTs). These barriers include lack of necessary equipment at the doctor’s office and lack
of the training or support staff to conduct and interpret the PFTs. PFT equipment are
expensive and require regular calibration, training and time to acquire reliable data and
also to interpret the data.
Figure 2.2. Change in FEV1 from baseline versus increasing concentrations of methacholine in mild, moderate and severe asthma compared to healthy subjects [122].
Apart from these barriers, there is also no concrete evidence from RCTs suggesting that
the use of spirometry in primary care could positively influence asthma outcomes and
28

improve its diagnosis and management. In fact, one study reported that office spirometry
did not add any significant benefit to conventional evaluation with symptom history and
physical examination when confirming an asthma diagnosis [123], but another study
found the opposite to be true [124]. Available evidence also suggest that bronchial
reversibility testing with spirometry only confirmed asthma diagnosis in 16% of asthma
cases while methacholine challenge confirmed asthma in only 72% of patients studied
[53]. Many primary care physicians therefore rely on the patient’s response to trial of
therapy for asthma to confirm their diagnosis [125]. Although trial of therapy is only
recommended when spirometry is not readily available [98], this practice has likely
contributed to the high rate of overdiagnosis of asthma in the developed countries [53,
121].
Taken together, these studies suggest that the use of spirometry as the only tool in clinical
decision making could potentially mislead clinicians to withhold treatment from patients
with respiratory disorders who absolutely need it. This problem is also compounded by
the fact that many patients with respiratory disease have normal spirometry [123], and
according to one Canadian spirometry interpretation algorithm, reversibility testing is
only recommended in patients with demonstrable airflow obstruction, i.e patients who
present with FEV1/FVC ratio of less than 70% [126]. For example, in the study by
Lusuardi et al, only 21% of asthmatic patients met this criteria [123]; therefore, if the
Canadian spirometry interpretation algorithm was to be strictly adhered to, a very large
proportion of asthma patients would either be left untreated or these patients would have
to be diagnosed through alternate means such as methacholine challenge.
Given the limitations of spirometry outlined here, there are many reasons why other
methods of assessing pulmonary function should be included in the armamentarium of
respirologists, primary care physicians and physiologists. These methods include
oscillometry for measurement of respiratory mechanics, and plethysmography which
provide clinically useful indices of lung volumes. The plethysmography technique is
described below in Section 2.3.2 because obesity affects lung volumes and the
oscillometry technique is described in Section 2.3.3 because this is the primary
29

measurement technique used in this thesis to assess weight-induced changes in lung
mechanics.
2.3.2 Plethysmography
The constant-volume (or constant-pressure) whole body plethysmograph, also known as
the body box, is an air-tight, rigid-walled chamber used in measuring lung volumes.
During measurement, the subject performs a combination of inspirations and expirations
while seated within the chamber which is similar in size (about 700–1000 L) and shape to
a telephone booth, and a number of important lung volumes and capacities are measured
including TLC, functional residual capacity (FRC), residual volume (RV) as well as one
non-volume measure known as airway resistance (Raw) [127, 128].
The application of body plethysmography in modern clinical practice began more than 60
years ago following many technical contributions from Dubois and others [129]. Body
plethysmography reflects many structural, physiological and functional aspects of the
lung and the test is now frequently performed along with spirometry to detect the
presence of obstructive or restrictive respiratory diseases [45]. For example, an
abnormally high specific airway resistance (sRaw) from plethysmography can help
confirm the clinical diagnosis of airway obstruction indicated from an abnormally low
FEV1. Body box tests are also performed prior to surgery or to monitor the lung function
of individuals at risks of developing lung ailments, as well as to assess disease
progression or the effectiveness of therapy. The test is also highly valuable in the
differential diagnosis of chronic dyspnea when used along with spirometry and chest X-
ray.
Table 2.5 provides a brief description of a variety of plethysmography-derived indices.
Some of these measures can also be derived using the Helium dilution technique as well
as the Nitrogen washout technique, but these methods will not be reviewed here because
they fall outside the scope of this thesis. The interested reader is encouraged to consult
the following sources for comprehensive reviews of these techniques [127, 130-132].
30
Boyle’s law is the basic principle applied in the measurement of lung volumes during
plethysmography. Boyle’s law states that, under constant temperature, when a constant
mass of gas is compressed or decompressed, its volume (V) decreases or increases and its
pressure (P) changes such that the product of volume and pressure at any given moment
is constant [133, 134]. However, when it is not isothermal, the appropriate mathematical
expression is: P·Vγ = constant, where γ varies between 1.4 for adiabatic gas compression
and 1.0 for isothermal gas compression [135].
The body plethysmograph measures respiratory flow using either a pneumotachograph,
anemometer, or ultrasound transducer. The body box also has two pressure transducers;
one transducer measures the pressure within the box relative to atmospheric pressure
while the other is placed close to the mouth and is used in measuring alveolar pressure
when there is no flow and the subject is asked to pant against a closed shutter. During this
maneuver, a shutter mechanism allows the respiratory technologist administering the test
to transiently occlude air from flowing through the mouthpiece into the patient’s lung
while sensors record the pressure and volume changes within the body box and the lungs.
For example, during the measurement of FRC, Boyle’s law is simultaneously applied to
two separate but related situations: i.e, the gas in the body box, and the gas in the lungs.
As shown in Table 2.6, the initial pressure and volume within the body box is indicated
as P1 and V1, respectively, while the initial pressure and volume in the lungs is denoted
by P3 and FRC, respectively. During the panting maneuver, the test subject attempts to
inspire against a closed breathing circuit. The subject cannot get much gas to flow
through the mouthpiece into his/her lungs since the breathing circuit has been transiently
occluded. However, the panting maneuver rarefies the air column in the lungs, and this
results in a small increase in lung volume (i.e FRC + the change in volume, ΔV), and a
proportional decrease in the volume of the body box (i.e V1 – ΔV). The accompanying
changes in pressure within the body box (P2) and the lungs (P4) are also recorded. Once
ΔV is calculated from the body box equation shown in Table 2.6, the FRC can then be
estimated, since it is the only unknown term [136].
31
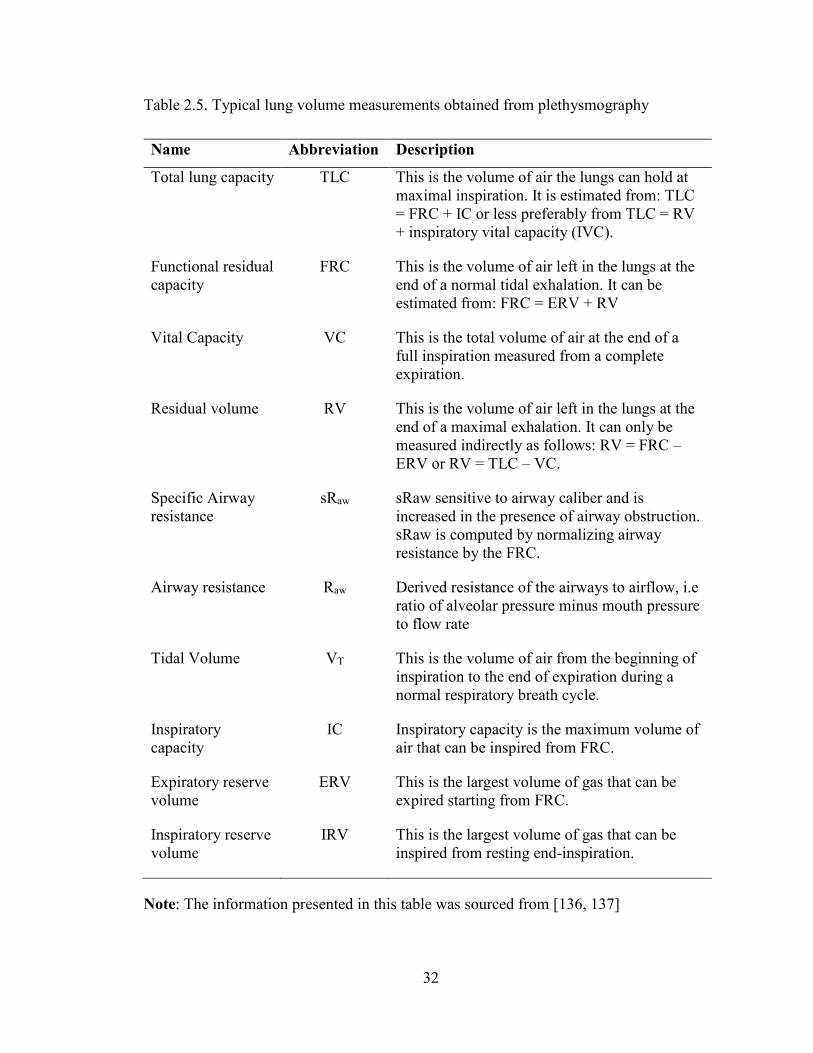
Table 2.5. Typical lung volume measurements obtained from plethysmography
Name Abbreviation Description
Total lung capacity TLC This is the volume of air the lungs can hold at maximal inspiration. It is estimated from: TLC = FRC + IC or less preferably from TLC = RV + inspiratory vital capacity (IVC).
Functional residual capacity
FRC This is the volume of air left in the lungs at the end of a normal tidal exhalation. It can be estimated from: FRC = ERV + RV
Vital Capacity VC This is the total volume of air at the end of a full inspiration measured from a complete expiration.
Residual volume RV This is the volume of air left in the lungs at the end of a maximal exhalation. It can only be measured indirectly as follows: RV = FRC – ERV or RV = TLC – VC.
Specific Airway resistance
sRaw sRaw sensitive to airway caliber and is increased in the presence of airway obstruction. sRaw is computed by normalizing airway resistance by the FRC.
Airway resistance Raw Derived resistance of the airways to airflow, i.e ratio of alveolar pressure minus mouth pressure to flow rate
Tidal Volume VT This is the volume of air from the beginning of inspiration to the end of expiration during a normal respiratory breath cycle.
Inspiratory capacity
IC Inspiratory capacity is the maximum volume of air that can be inspired from FRC.
Expiratory reserve volume
ERV This is the largest volume of gas that can be expired starting from FRC.
Inspiratory reserve volume
IRV This is the largest volume of gas that can be inspired from resting end-inspiration.
Note: The information presented in this table was sourced from [136, 137]
32

As with spirometry, results from plethysmography are typically presented as percentiles
of predicted values estimated from reference equations that take into account the
subject’s age, height, gender, and ethnicity [137, 138]. The FRC is the volume of air left
in the lungs at the end of a normal tidal exhalation and it is physiologically determined by
a counteracting balance of inward retractile forces of the lung and the outward recoil
forces of the chest wall. FRC is dramatically reduced as a result of restrictive respiratory
disorders such as idiopathic pulmonary fibrosis. FRC is also reduced in obesity [139-
144], due to obesity-induced reductions in the compliance of the chest wall and total
respiratory system [145, 146].
The residual volume (RV) is another important lung volume index that can be estimated
from whole body plethysmography. This parameter reflects the volume of air left in the
lungs at the end of a full exhalation but it is usually well preserved in obesity [117, 147-
149]. A reduced RV is sometimes the only physiological abnormality in patients with
chest wall problems (skeletal deformity, fibrothorax, scoliosis) or diseases of the lung
parenchyma such as sarcoidosis [150]. However, due to the nature of the complex
interaction between the lungs and chest wall [151], it is important that such diagnosis also
take into account results from other lung volume indices such as the total lung capacity
(TLC), and the expiratory reserve volume (ERV) (Table 2.3) [45].
Table 2.6. Plethysmographic estimation of FRC using Boyle’s law
Initial
Condition
Final
Condition
Body box: P1V1 = P2(V1 – ΔV)
Lung: P3FRC = P4(FRC + ΔV)
Note: P1, initial pressure within body box; V1, initial volume of body box; P2, new
pressure within the body box due to inspiration against closed breathing circuit; ΔV,
change in volume caused by the attempted inspiration against a closed breathing circuit;
33

P3, initial pressure within the lung; FRC, functional residual capacity; P4, new pressure
within the lung caused by the attempted inspiration against a closed breathing circuit.
TLC is absolutely essential in confirming the diagnosis of restrictive disorders [127]. The
threshold for confirming restrictive disorders is defined as TLC below the 5th percentile
of normal values [45]. However, only 50% of patients who demonstrate a restrictive
pattern on spirometry (i.e reduced FVC and normal or elevated FEV1/FVC ratio) also
demonstrate low TLC on plethysmography. The remaining 50% of patients are classified
as presenting a “mixed ventilatory” or “non-specific” pattern since they exhibit both
obstructive and restrictive ventilatory patterns on spirometry and plethysmography [81,
137]. Interestingly, patients presenting with such non-specific pattern suffer from a wide
variety of conditions, in particular obesity [81] but the clinical course of these conditions
are generally benign [152]. Marked reductions in ERV are also observed in obesity [139-
144]. The changes in lung mechanics and function induced by obesity are discussed in
greater detail in Section 2.4.
In conclusion, the determination of lung volumes using whole-body plethysmography is a
highly technical procedure that is actually very easy for subjects to perform. This unique
technique provides reliable information on the structural, physiological and functional
aspects of the lungs in health and disease and measurements can be obtained in a
relatively short amount of time. However, the main weaknesses of this technique include
its bulky size, its cost and the strong technical requirements of the method. Active subject
cooperation is also required for reliable results to be achieved.
2.3.3 Oscillometry
History, development, and principles of measurement
The forced oscillation technique (FOT) was introduced in the late 1950s as a tool for
assessment of respiratory mechanics [153]. Dubois and his colleagues developed the
technique to apply flow oscillations of varying frequencies at the airway opening during
34

voluntary apnea [153] but it was not widely accepted at the time because it required
specialized equipment, was too difficult to perform, and it was also time consuming.
However, the advent of microprocessor techniques in the 1970s that allow for complex
analysis of signals by the Fourier transform have made it possible to further develop the
FOT as a tool for routine assessment of pulmonary function [154, 155].
The principle behind the technique is that forced oscillatory pressure waves of about 1–2
cm H2O are generated by an excitation source (typically a loudspeaker), and
superimposed on a subject’s spontaneous breathing at predetermined frequencies, unlike
in the past when Dubois collected measurements during voluntary apnea [153]. The
mechanical properties of the respiratory system are then estimated from the impedance of
the respiratory system (Zrs) to the resulting flow oscillations [156]. Zrs is the spectral
ratio of the fast Fourier transform (FFT) of the pressure and flow measured at the
subject’s airway opening (Equation 2.1).
( )( )( )
P fZrs fV f
=
(2.1)
Where f is the oscillatory frequency. The details of the actual mathematical
implementation can include repeated calculation of Zrs (Equation 2.1) from multiple,
often overlapping windows or periods extracted from continuous recordings of ( )P f and
( )V f . This computation can also include filtering and other signal analysis methods to
improve quality of the computed Zrs.
In the mathematical sense, and by convention in the frequency domain, Zrs is represented
as a complex frequency dependent quantity and is made up of a real and an imaginary
part (Equation 2.2). The real part depicts the in-phase component of the pressure and
flow, which describes the resistance of the respiratory system (Rrs), while the imaginary
part describes the 90º out-of-phase component of the pressure and flow, which describes
the reactance of the respiratory system (Xrs). Rrs is largely governed by airway caliber
and lung tissue properties while Xrs is largely governed by both the balance between the
elasticity of the lung tissues and the inertia of the oscillating air, depending on the
35
oscillating frequency. Although with airway heterogeneity, the elastic element of the
respiratory system can affect Rrs and the resistive dissipative element of the respiratory
system can also affect Xrs [157].
( ) ( ) ( )Zrs Rrs jXrsω ω ω= + (2.2)
where, ω is the angular frequency and is mathematically expressed as: ω = 2πf.
The respiratory system is sometimes described using a mathematical model. A simple
model that is often developed to describe pulmonary mechanics is known as the single
compartment model. It consists of a single resistance (R) representing airflow resistance
(i.e Rrs = R), and Xrs modeled as an inertance (I) and elastance (E) as shown below in
Equation 2.3.
EXrs Iωω
= − (2.3)
If R is to be estimated from Rrs(ω), then often the average Rrs is employed and if I and E
are to be estimated from Xrs, then a least squares fit is often employed. A reciprocal
relationship exists between elastance and forced oscillation respiratory system
compliance (Crs); therefore, Crs can be computed from Equation 2.3 as follows:
1
( )Crs
Xrs Iω ω−
=−
(2.4)
At very low frequencies, inertance is negligible thus Equation 2.4 can be rewritten as
follows (Equation 2.5).
1CrsXrsω−
≈ (2.5)
Rrs is the most commonly measured FOT index and patients with airway obstruction
often exhibit a negative frequency-dependent Rrs [158-160] while healthy subjects are
characterized by a lower and largely frequency-independent Rrs [161], within the normal
FOT range from 5 to 40 Hz. Xrs has received less attention but it is thought to be
sensitive and specific to changes in peripheral lung mechanics [162, 163]. This index has
36
been used as a surrogate measure for lung tissue stiffness, and to estimate the amount of
recruited airspaces in the lung, since stiffness increases when there are fewer alveolar
airspaces available for the forced oscillations from the oscillometry device [162, 163].
Xrs can be used to differentiate patients with stiffer lungs from healthy subjects through a
characteristic rightward shift in the Xrs versus frequency curve resulting in a significantly
higher resonant frequency which normally occurs between 8-10 Hz in healthy adults
[154, 158, 164-166]. The resonant frequency is the frequency where the inertive and
elastic components of Xrs are equal in magnitude (Equation 2.3). Xrs is dominated by
elastic components of Xrs at low oscillation frequencies but inertive forces dominate at
high oscillation frequencies and the resonant frequency is the oscillation frequency where
that transition from elastic to inertive dominance occurs. Since the elastic and inertive
forces are equal in magnitude at the resonant frequency, the elastance and inertance terms
both cancel out (Equation 2.4), and Xrs becomes zero, implying that Zrs can be modelled
by a pure resistance at the resonance frequency (Equation 2.2).
Clinical Application of Oscillometry
As described above, oscillometry measures how much pressure the respiratory system
must generate in order to move air into and out of the lung. Thus, obstructed patients such
as individuals with asthma, present with increased Rrs and decreased Xrs at low
oscillation frequencies [167], and as a consequence, the pressure the respiratory system
must generate in order to move the same quantity of air to and from the lungs is also
increased. Oscillometry provides a direct assessment of Rrs and Xrs during quiet tidal
breathing.
Furthermore, the oscillometric evaluation of Xrs and the frequency dependence of Rrs are
known to be sensitive to small airway dysfunction [158, 168]. This means that
oscillometry is thought to be useful for early detection of changes in the small peripheral
airways which is where many respiratory diseases such as asthma and COPD, originate
[169]. It is also thought that transpulmonary resistance can be estimated from
measurements of inspiratory reactance [170] and this measure has been shown to
discriminate patients with asthma from those with COPD [171]. This is potentially
important especially given the overlap between both disorders [172].
37

Moreover, the assessment of Rrs at multiple oscillation frequencies can reveal ventilation
heterogeneity within the lung, indicated by an inverse dependence of Rrs on frequency
and this is thought to be a marker of heterogeneous disease [173]. Oscillometry is capable
of identifying subjects with asthma or COPD even when they present with normal FEV1
and mid-expiratory flows [174, 175]. In fact, in a case-controlled study of symptomatic
and asymptomatic subjects exposed to dust and fumes from the 2011 World Trade Center
disaster, oscillometric Rrs and frequency dependence of resistance detected small airway
dysfunction in symptomatic subjects while spirometry remained within the normal range
[176]. Also, assessment of Rrs and Xrs over a range of frequencies enables application of
the data to models of respiratory mechanics, providing greater insight than can be
obtained from spirometry [177, 178].
The oscillometry technique has been used in a large number of studies and in various
clinical settings to monitor the progression of respiratory disease and the efficacy of
treatment. Recent evidence from a randomized crossover study showed that
improvements in small airway function measured with oscillometry correlated with
improvements in asthma symptoms, airway inflammation and AHR [179]. As described
above in Section 2.3.1, an important limitation of spirometry which oscillometry
overcomes is the fact that spirometry is highly effort dependent and requires active
subject cooperation for reliable assessment of pulmonary function. This implies that
oscillometry can be used to assess lung mechanics in subjects who are unable to perform
spirometry and this cohort includes elderly and geriatric subjects [180, 181], children
below the age of 6 in whom asthma is first diagnosed [182], and sick and paralyzed
subjects [183] as well as subjects with obesity.
Oscillometry has also been shown to be suitable for assessing the severity of airway
obstruction in asthma [167]. It has been successfully used in studies involving infants
[184, 185], in anaesthetized subjects [186], and in patients on mechanical ventilation
[186, 187]. Studies investigating the response of asthmatic children to bronchial
provocation challenges [188] as well as studies investigating the effects of bronchodilator
(BD) on the respiratory system [189-192] have all relied on the oscillometry technique.
38

In almost all the studies, reproducible and repeatable estimates of Rrs and Xrs have been
reported.
Reference values for oscillometry outcomes as a function of sex, age, height and ethnicity
are now available for both children and adults [161, 182, 190, 191, 193, 194]. Moreover,
in 2003, the ATS and ERS taskforce on FOT published guidelines and recommendations
on the standardization and use of the FOT in clinical practice [177] indicating that the
technique is indeed gaining wider acceptance in the respiratory community.
Limitations of Oscillometry
There are many challenges that have hindered the clinical adoption of this novel
assessment tool. Unlike spirometry used with plethysmography, oscillometry cannot
discriminate between obstructive and restrictive lung diseases [177]. Also, despite the
fact that oscillometry directly measures the mechanical factors affecting breathing, the
assessment of respiratory system impedance with oscillometry is a fairly technical
concept. Conversely, while spirometry is simple in its technology, it does require
substantial training in its interpretation to relate to pathophysiology, but this training is
currently well in place for clinical practitioners. Currently, clinicians are unfamiliar with
the terminology for measurement of respiratory mechanics. For example, respiratory
reactance is usually negative at low frequencies and so clinicians find it unappealing and
difficult to make sense of, despite a more negative reactance being easily relatable to a
stiffer lung [162, 167]. Furthermore, respiratory impedance data is usually presented as
an average value computed over several respiratory cycles. However, it is now
established that in subjects with airflow obstruction such as COPD, expiratory Rrs is
greater than inspiratory Rrs and expiratory Xrs is significantly more negative than
inspiratory Xrs due to the presence of expiratory flow limitation [195].
The clinical adoption of oscillometry is also hindered by what is thought to be its low
repeatability and reproducibility compared to spirometry, and the fact that noise from
labored breathing can affect the results, implying it can have a low signal-to-noise ratio.
Until very recently, another significant drawback of oscillometry had been the lack of
universal age- and height-related predicted values for comparison of results. Unlike
39
spirometry, the range of normal predicted values appeared to have some specificity to the
device from which the measurements were obtained, although it is not clear whether this
was also due to the differences in subjects measured. Recently, data from Oostveen et al
have attempted to address this issue by measuring lung mechanics in a large population
using multiple oscillometry devices [196]. Data were also collected from different centers
and thus from different populations. The data obtained were used in developing age- and
height-related predicted equations for oscillometry which can be applied across different
oscillometry systems; however, since individual devices demonstrate differences in
frequency dependence, it is not yet known whether these differences will impact the
predicted values [197]. These differences are likely due to either inherent differences
within the electronics of each device, or differences in the perturbation waveforms of the
devices. One device uses impulses while the other oscillometry devices use combinations
of sinusoidally varying oscillations.
Lung mechanics are typically obtained in less than three minutes with oscillometry from
three repeated measures and the average of the three repeated measures is reported as the
outcome variable. Throughout the maneuver, the subject breathes ambient air through a
resistance mesh or high impedance bias tube. This feature, together with the widely used
speaker-based forced-excitation generator, is responsible for the bulky size and the
expensive cost of most conventional forced oscillatory devices. Commercially available
FOT devices such as the MasterScreen-IOS device (E. Jaeger, Wuerzburg, Germany),
and the Quark PFT from Cosmed (Chicago, IL, USA) can cost as much as $18,900 CAD
and $21,995 CAD, respectively.
Despite these limitations, oscillometry is a convenient technique for noninvasive
assessment of respiratory mechanics. Unlike spirometry, it does not require subject
cooperation and useful measurements can be acquired within a very short duration. Since
oscillometry provides a direct assessment of pulmonary mechanics and it is sensitive to
respiratory diseases, this tool has a significant role to play in the monitoring of
pulmonary function as well as in the diagnosis and management of asthma and other
respiratory conditions such as COPD where small airway dysfunction may be involved,
as the small airways is considered a silent zone to spirometry.
40
2.4 Lung Mechanics and Function in Obesity
Obesity is a medical condition characterized by an excessive accumulation of fat in the
body. The Body Mass Index (BMI) is the standard index for classification of obesity
[198]. It is calculated as the ratio of weight in kilograms to the square of height in meters
and is expressed in units of kg/m2. In adults, overweight is defined by a BMI greater than
25 kg/m2 and obese by a BMI greater than 30 kg/m2, but in children, the classification
system is based on age- and gender-matched normative data of BMI [199, 200]. As
described in Section 2.3.1, children with BMI above the 85th percentile of their age- and
gender-matched counterparts are considered overweight while those above the 95th
percentile are considered obese [103].
The BMI is a very simple and convenient method of classifying the severity of obesity.
Its main limitation is that it is highly nonspecific since it does not distinguish between fat
mass and lean (muscle) mass. More importantly, it does not account for the pattern of
regional fat distribution in the body. There are two typical regional fat distribution
patterns, namely central obesity and peripheral obesity. Central (abdominal or android)
obesity is characterized by increased deposition of fat in the thorax, abdomen and visceral
organs (apple-like body shape) while peripheral (gynoid) obesity is characterized by
deposition of fat in the hips, thighs, limbs or in subcutaneous tissue (pear like body
shape). This distinction is important because compared to gynoid obesity, android obesity
is likely to have a more direct effect on pulmonary mechanics but the inflammatory state
is likely to be similar in both types of obesity.
Obesity is a common comorbidity in asthma; it is associated with an increased risk for
developing asthma. According to the National Health and Nutrition Examination Survey,
approximately 32% of asthmatic adults are obese in the United States [38] whereas, as
described in Section 2.2.1, the overall prevalence of asthma in the US is 7.7 % of the
adult population [37]. In 2014, The Epidemiology and Natural History of Asthma:
Outcomes and Treatment Regimens (TENOR) demonstrated that 58% of patients with
severe uncontrolled asthma were obese [201]. Other studies have also shown that
41
severely obese subjects have worse asthma outcomes and require higher doses of
controller medication [4, 55, 202]. Interestingly, surgical and nutritional weight loss
interventions effectively improve clinical asthma outcomes and overall respiratory health
of obese patients [11, 203-205]. However, as will be described in the following sections,
there are still many critical gaps in our current understanding of the relationship between
asthma (including asthma-like symptoms such as dyspnea and wheeze) and obesity and
the mechanism underpinning this relationship is yet to be clearly elucidated.
2.4.1 Asthma and the respiratory symptoms of obesity
Over the last two decades, a large body of epidemiological evidence suggesting a
relationship between obesity and asthma has emerged. A meta-analysis of several
prospective studies involving over 300,000 adults revealed a dose-response gradient
between these two conditions whereby asthma risk increases with increasing BMI [206].
In that study, the odds ratio of incident asthma in the overweight group was 1.5 (95% CI;
1.2-1.6) compared to normal weight subjects, whereas the odds ratio for the obese group
was 1.9 (95% CI; 1.4-2.6). The odds ratio of 1.9 measured in the meta-analysis of the
obese group implies that the presence of obesity increases the odds of developing asthma
by a factor of 1.9.
The relationship between asthma and obesity has also been established in studies of
weight gain or loss. Castro-Rodriguez et al showed that girls who became overweight or
obese between the ages of 6 and 13 were 7 times more likely to demonstrate new asthma
symptoms than girls who did not become overweight or obese during the same time
interval [102]. These new asthma symptoms included wheezing, bronchial reversibility,
peak expired flow variability and airway hyperresponsiveness. They also showed that
54.2% of girls who became overweight or obese were atopic as indicated by a positive
skin-prick test at Year 6. Interestingly, only 35.9% of girls who did not become
overweight or obese during the same time interval were atopic at Year 6. However, in a
large cross section of obese children, Tantisira et al found that increased BMI does not
significantly contribute to other measures of asthma severity such as school absence and
42
emergency room visits [104]. The reasons for the differences are unclear. However, in
adults, Hakala et al demonstrated that weight loss was associated with a reduction in
airways obstruction (reduced airway resistance) and peak flow variability, and an
increase in FRC, mid-expiratory flows and ERV [207], clearly linking lung function
indices typically associated with asthma to obesity.
The conflicting results described above highlights the complexities in characterizing the
obesity-asthma association. Factors such as heterogeneous study design, diagnostic bias
and the effects of gender, race and age group are among some of the issues that could
possibly account for these conflicting results and differences in interpretation. Despite
these differences, there is a general agreement that weight gain and obesity significantly
impacts respiratory health of millions around the world regardless of whether or not they
have asthma [22, 23, 47, 208].
Two important biological mechanisms could potentially lead to asthma or asthma-like
symptoms in obesity. These mechanisms are: (i) chronic systemic inflammation due to
excess adiposity, and (ii) obesity-induced mechanical compression of the respiratory
system. In other words, the asthma or asthma-like respiratory symptoms of obesity may
be due to the mechanical effects of weight-induced loading, narrowing the airways and
resulting in symptoms, or the symptoms could be due to systemic asthma or asthma-like
effects that arise from a cascade of inflammatory mediators and hormones linked to
adipose tissue secretions in the obese. These mechanisms are explored in detail in
Sections 2.4.2 and 2.4.3 of this thesis.
2.4.2 Pathogenesis of asthma in obesity: role of inflammation
This section examines the role of obesity-induced inflammation in the pathogenesis of
asthma or asthma-like respiratory symptoms. In section 2.4.2.1, evidence of the
contribution of adipose tissue inflammation to the pathogenesis of obese asthma will be
reviewed followed by a review of the contribution of systemic inflammation to the
pathogenesis of obese asthma in section 2.4.2.2, and lastly, in section 2.4.2.3, a similar
review will be conducted for the airways.
43
2.4.2.1 Evidence of elevated adipose tissue inflammation
Adipose tissue was once considered a storage depot for excess lipids but today is
considered to be an important endocrine organ that secretes adipocyte-derived factors
known as adipokines in addition to various signaling molecules and inflammatory
mediators for regulation of numerous physiologic and immune functions. Adipokines are
energy-regulating proteins synthesized and secreted by the adipose tissue. They include
leptin, adiponectin, resistin, visfatin, and adipsin. Of these adipokines, leptin is the most
studied and best characterized as will be described in later sections of this thesis.
Obesity significantly affects the types of immune and inflammatory cells that infiltrate
the adipose tissue. On one hand, expression of adiponectin–the most abundant anti-
inflammatory adipokine in the adipose tissue is markedly reduced in obese patients with
asthma, while on the other hand, expression of leptin–a pro-inflammatory adipokine, is
increased, compared to obese patients without asthma [1]. In clinical studies, visceral fat
leptin expression was strongly correlated to AHR [1], a distinguishing feature of asthma.
Leptin is an anorexigenic hormone; it induces satiety, increases metabolism and also
plays an important role in the regulation of immune function. The fact that leptin level is
upregulated in the adipose tissue while adiponectin is downregulated suggests that the
adipose tissue of obese patients is an important source of chronic inflammation.
In addition to the changes in adipose-derived adipokines, the number of adipose tissue
macrophages is significantly increased in the adipose tissue of obese humans and obese
mice. Weisberg et al isolated subcutaneous adipose tissue of obese individuals and
determined that adipose tissue macrophages accounted for up to 50% of the cells in the
tissue when stained for the macrophage antigen–CD68 [209]. Sideleva et al also reported
increased infiltration of subcutaneous adipose tissue and visceral adipose tissue by
macrophages in obese individuals with asthma [1]. One might ask why the number of
adipose tissue macrophages is amplified in obesity. While the exact reason is not
completely understood, it is thought that enlargement of adipocytes in obesity affects the
ability of the capillaries to supply blood to these cells with the result being hypoxia,
44
apoptosis and buildup of necrotic tissues which the macrophages are recruited to
phagocytose [210].
In addition to macrophages that are recruited to the site of necrotic adipocytes, there are
also large numbers of CD8+ and CD4+ T lymphocytes in the adipose tissue of obese
humans [211] and obese mice [212, 213]. In obesity, the CD4+ T lymphocytes tend to
differentiate into T-helper 1 (TH1) cell lineage rather than T-helper 2 (TH2) cell lineage
since expression of TH2 cells is known to decline with increasing severity of obesity
[213]. Consistent with this notion, eosinophils that normally play a role in the
differentiation of CD4+ T lymphocytes towards a TH2 phenotype in lean individuals
[214], are reduced in mice with diet-induced obesity [215]. Thus, it has been suggested
that neutrophilic inflammation may be the predominant phenotypic characteristic of
asthma in obesity whereas asthma is usually characterized by an eosinophilic
inflammatory phenotype in lean individuals [216]. Unlike eosinophilic inflammation, the
pathways involved in the recruitment and activation of neutrophils in asthma and many
other aspects of neutrophilic inflammation have yet to be fully established [217].
Interestingly, increased adipose tissue mass is also synergistically associated with
increased mast cell propagation. Mast cells are key mediators of allergic reaction and
recent evidence from animal models of mast cell activation and dysfunction have
demonstrated that the adipose tissue is an important source of mast cell progenitor cells
[218]. Indeed, compared to lean individuals, the burden of mast cells is reportedly
increased in obese humans and mice [219] suggesting that obesity-induced mast cell
proliferation may be an important driver of asthma in these subjects.
In summary, although the development of inflammation in the adipose tissue of obese
individuals is likely multifactorial and involves complicated interactions between various
signaling proteins (leptin, adiponectin), inflammatory mediators and immune cells
(macrophages, T lymphocytes, and mast cells), there is evidence to suggests that the
adipose tissue is the site and source of chronic inflammation that could likely lead to the
development of respiratory symptoms of asthma in obese individuals.
45
2.4.2.2 Evidence of elevated systemic inflammation
Pro-inflammatory adipokines such as leptin secreted by the adipose tissue (described
above in section 2.4.2.1) continuously leak into the systemic circulation and this leads to
an increased concentration of leptin in the serum [220]. Leptin is not only produced by
adipose tissue; bronchial epithelial cells, type II alveolar cells and macrophages in
peripheral lung tissue also produce this protein [221], and this further amplifies the
circulating levels of this adipokine. As described in the preceding section, leptin is an
anorexigenic hormone and this means that its presence induces satiety and increases
metabolism. However, the increased levels of leptin measured in the serum of obese
humans [220] and obese mice [222] suggests that leptin resistance occurs in obesity in a
similar manner to insulin resistance in patients with type II diabetes [223].
Given its pro-inflammatory nature, the increased levels of leptin in the serum of obese
patients invariably lead to recruitment of pro-inflammatory cytokines, chemokines and
acute phase proteins in obesity. Specific inflammatory moieties that have been shown to
increase in obesity include: tumor necrosis factor alpha (TNF-α) [224, 225], interleukin
(IL-) 8 and IL-6 [226], high-sensitivity C-reactive protein (hs-CRP) and monocyte
chemoattractant protein-1 (MCP-1) [227]. In addition, the level of circulating leukocytes
in the blood of obese subjects is increased compared to lean individuals [228].
Leptin receptors have been observed on the surface of hematopoietic stem cells [229] and
binding of these receptors to leptin stimulate monocytes and macrophages to produce
cytokines through CD4+ T-lymphocytes [230]. TH1 response is enhanced by leptin
whereas TH2 response is suppressed by leptin [213]. Given that allergic inflammation
such as atopic asthma is usually mediated by TH2 cells, the involvement of leptin in
asthma is not through typical pathways of allergic inflammation, rather non-atopic
mechanisms appear to be involved. This notion is supported by the recent identification
of two predominant phenotypes of asthma in obese subjects [56, 57]. These two
phenotypes are: (i) atopic, early onset, TH2-high asthma characterized by high serum IgE
and the presence of eosinophilia and (ii) non-atopic, late onset, TH2-low asthma
characterized by low serum IgE, presence of neutrophilic inflammation and the absence
46

of eosinophilia [231, 232]. In other words, asthma most likely predates the development
of obesity in atopic subjects with TH2-high asthma while obesity may play a causative
role for asthma in non-atopic subjects with TH2-low asthma.
The role of leptin in the respiratory system has been extensively studied in animal models
of obesity, and to a lesser extent in clinical studies. The ob/ob mouse is a commonly used
animal model of systemic inflammation in obesity because these mice lack functional
leptin due to mutation of the leptin gene; therefore, they are extremely obese and
demonstrate hyperphagia and low metabolism. Compared to wild type, ob/ob mice have
significantly higher pulmonary resistance at baseline and elevated responsiveness to
intravenous methacholine and ozone–both of which are prominent features of asthma
(Figure 2.3) [233]. Similar results were observed in genetically diabetic (db/db) mice, the
carboxypeptidase E-deficient (Cpe fat) mice [234, 235] and mice with diet induced obesity
(Figure 2.3), suggesting that the increased responsiveness in obese mice has more to do
with increased adiposity than modality of obesity (db/db mice lack the receptor for leptin
due to a genetic mutation and Cpe fat mice lack the enzyme that regulates satiety
neuropeptides). These results suggest that agents other than leptin may contribute to the
development of airway hyperresponsiveness (AHR) and increased pulmonary resistance
since similar results were obtained in the different strains of obese mice regardless of the
levels of leptin in the circulatory system.
Evidence from clinical human studies on the role of leptin in obese asthma has been less
insightful. There is some evidence that leptin is associated with asthma in obesity. In
2006, Sood et al showed that high BMI and high serum leptin concentration are both
strongly associated with asthma in adults [236], Sood and coworkers also found that
adjusting for leptin did not affect the association between BMI and asthma suggesting
that the relationship between obesity and asthma is not mediated by the leptin pathway
alone. There is similar evidence from children. Overweight children with asthma are
reported to have twice the serum concentration of leptin compared to overweight
nonasthmatics children [237]. However, Dixon and coworkers found no significant
difference in the serum concentrations of leptin in obese asthmatics and obese
nonasthmatics adults [1], in contrast with the above findings [236, 237]. While there is
47

general consensus that serum leptin levels are strongly correlated with excess adiposity
[220], but the result from Dixon et al raises some doubt if this influences asthma [1].
Figure 2.3. Methacholine-induced changes in pulmonary resistance in four types of obese mice compared to lean controls. Notice that ob/ob and cpe fat mice have significantly higher pulmonary resistance compared to wildtype at baseline. Data expressed as mean ±SE. * p < 0.05. Compiled from previous studies conducted at Shore’s lab [233, 234, 238] and published in a review article by Shore [51].
48

In summary, the role of increased systemic inflammation on the development of asthma
in obesity was examined in this section. Although there is good evidence that leptin is
significantly increased in obesity, current evidence also appears to suggest that the
association between obesity and asthma is not mediated by the leptin pathway alone.
Rather, it appears that leptin is involved in the asthma of obesity through non-atopic
mechanisms since TH2 response is suppressed by leptin and typical pathways of allergic
inflammation is usually mediated by TH2 cells.
2.4.2.3 Evidence of elevated airway inflammation
As described earlier, obesity is commonly associated with two phenotypes of asthma [56,
57]. One phenotype is described as a non-atopic (non-allergic), late onset, TH2-low
asthma with low serum IgE and absence of eosinophilia while the second phenotype is
described as an atopic (allergic), early onset, TH2-high asthma that is marked by high
serum IgE and presence of eosinophilia [231]. In most obese patients, sputum eosinophils
are decreased with increasing BMI, consistent with the reduction in exhaled nitric oxide
associated with reduced airway eosinophilia and reduced underlying airway inflammation
[232]. Interestingly, sputum neutrophils were shown to increase with increasing BMI in a
study of obese women with asthma [231]. The drop in sputum eosinophils and the rise in
sputum neutrophils with increasing BMI suggests that neutrophilic inflammation, rather
than eosinophilic inflammation may play a more dominant role in the pathogenesis of
asthma in the non-atopic, late onset, TH2-low obese group.
The effect of obesity on airway inflammation has also been assessed from
bronchoalveolar lavage (BAL) fluid of obese humans and mice. Elevated levels of pro-
inflammatory mediators such as IL-6, MCP-1 and neutrophils were observed in the BAL
fluid of Cpefat mice compared to lean controls following ozone exposure but not air
exposure [235]. In fact, exogenous administration of the pro-inflammatory adipokine–
leptin to lean control mice prior to ozone exposure reportedly augments ozone-induced
increases in IL-6 in BAL fluid [233].
49

However, in human subjects, there is no concrete evidence of elevated airway
inflammation in BAL fluid of obese patients. Similar cell counts of macrophages,
neutrophils, lymphocytes and eosinophils were found in BAL fluid of obese asthmatics
and nonasthmatics [56]. Furthermore, alveolar macrophages in obese asthmatics and
nonasthmatics have been shown to produce similar amounts and types of cytokines [1].
Although increasing severity of obesity is associated with increased concentration of
leptin in BAL fluid, no association was found between obesity and markers of airway
inflammation such as exhaled nitric oxide [239]. As shown in the previous sections,
inflammatory cells are present in higher quantities in the adipose tissue and serum of
obese individuals but it is possible that these cells do not migrate into the airways, hence
the lack of such evidence.
Taken together, there is no concrete evidence to support the notion that asthma in obesity
is an inflammatory disease of the airways, besides the evidence of increased neutrophilic
inflammation in women. However, there is some evidence suggesting that the disease is
mediated by adipokines and other inflammatory mediators released from the adipose
tissue which lead to a state of low grade chronic systemic inflammation. These adipose-
derived adipokines appear to have indirect effects on airway hyperreactivity and lung
function, despite the lack of evidence of airway inflammation. Thus, while not
characteristic of the inflammation in asthma, this indirect route to airway reactivity may
contribute ultimately to asthma or asthma-like symptoms although the mechanisms are
unclear. However, as described in the next section (Section 2.4.3), the mechanical effects
of obesity may also play an important role in this process.
2.4.3 Mechanical compression of the respiratory system in obesity
Obesity alters the mechanical properties of the lungs and chest wall mainly through the
accumulation of fat in the mediastinum, and in the abdominal and thoracic cavities [240].
Increased fat deposition in obesity limits the downward excursion of the diaphragm and
lowers the operating volume of the lungs. Consequently, pleural pressure is increased
[241] and the functional residual capacity (FRC), which is physiologically determined by
50

a counteracting balance of inward retractile forces of the lung and the outward recoil
forces of the chest wall, is reduced [242, 243]. In fact, FRC is reduced by 10%, 22% and
33% in overweight, mildly obese and severely obese subjects without asthma,
respectively [243].
The pressure-volume curves of the chest wall (CCW), lung (CL) and entire respiratory
system (CRS) in lean and obese subjects is shown in Figure 2.4 (Dixon et al. [244]). As
demonstrated here, obesity is thought to have profound effects on the compliance of the
lungs [245-247], chest wall and entire respiratory system [145, 247]. For example,
compared to CL of a normal weight subject, the obese CL shows an inflection implying
that increased pressure must be generated to open airways that closed when lung volume
fell below FRC. Also, the obese CCW is shifted to the right towards higher
transpulmonary pressures, even though the overall shape of the curve is preserved.
Together, the reduced compliance of the lung and chest wall result in a reduced
respiratory system compliance where FRC is significantly reduced.
The reduction in respiratory system compliance (increased stiffness) alters the breathing
pattern. Obese individuals therefore breathe in a rapid shallow pattern with reduced tidal
volumes [148] perhaps minimizing the peak pressures required during breathing.
Furthermore, obese subjects breathe at very low FRC (Figure 2.4) and their expiratory
reserve volume (ERV) is drastically diminished. Therefore, their tidal flow-volume loop
approaches the region of maximal flow and this increases the risk of expiratory flow
limitation especially in the supine position [13].
The mechanical effects of obesity are associated with respiratory signs and symptoms of
asthma such as dyspnea [23], wheeze [22], increased respiratory system resistance [117],
airway narrowing and closure [248, 249], ventilation heterogeneity [250], and airway
hyperresponsiveness [47]. However, an important question that must be answered is:
How do the mechanical effects of obesity bring about these asthma-like symptoms? The
following sections attempt to answer this important question by examining the
mechanical consequences of obesity on some distinguishing characteristics of asthma
such as AHR, airway narrowing and closure.
51

Figure 2.4. Campbell diagram for the chest wall (CCW), lung (CL) and respiratory system (CRS) in normal weight and obese subjects. The mechanical effects of obesity results in a reduction in the functional residual capacity (FRC) and higher transpulmonary pressures in the obese individual [244].
Effect of Obesity on Airway Hyperresponsiveness
Many large studies report positive associations between BMI and AHR, but this is not a
uniform finding because smaller studies do not show this association [51]. The only
prospective longitudinal cohort study that investigated the relationship between obesity
and AHR in more than 7,000 adults found that the risk for AHR increases as BMI
increases [47]. They also found that weight gain was a risk factor for developing AHR.
These findings were established after controlling for the effects of age, smoking, serum
IgE and baseline FEV1.
Similar results were obtained in three other large cross-sectional epidemiologic studies in
China (7,109 participants [48]), Europe (11,277 participants [49]) and the United States
52

(1,725 participants [50]) where AHR or symptomatic AHR was more prevalent in obese
adults compared to lean subjects. In contrast, several smaller studies failed to find a
consistent relationship between AHR and obesity [22, 251]. This inconsistency may be
explained by several factors such as the small sample sizes, or possibly differences
between the outcome indicator used (Rrs, Xrs, FEV1, and maximum expiratory flow at
60% of TLC), atopic status, severity of obesity in the participants and other study
inclusion and exclusion criteria such as enrolling only nonasthmatic obese subjects. It
would be expected that these findings would be more consistent if the various studies
used the same outcome measure, and since the association is more consistent with larger
studies, this tends to favor the presence of a positive association between AHR and
obesity.
Effect of Weight Loss on Airway Hyperresponsiveness
If obesity-induced alterations in respiratory mechanics represent an important factor in
the development of AHR, then it is reasonable to assume that weight loss could reverse
these changes. This issue has been addressed in three important studies by Aaron et al
[252], Dixon et al [56], and Chapman et al [248]. The data from Aaron et al indicates a
trend towards reduced AHR with weight loss following an intense diet-induced weight
reduction program; however, this effect was not statistically significant (p = 0.23) [252].
In contrast to these findings, Dixon et al reported that a 27% weight loss in asthmatic
women who underwent bariatric surgery was associated with a significant reduction in
AHR (p = 0.03) [56]. Interestingly, they also found that the effect of weight loss on AHR
could be predicted from the atopic status of their subjects. In other words, subjects who
were classified as atopic based on their serum IgE concentration did not demonstrate any
changes in their AHR with weight loss, whereas weight loss resulted in significant
reductions in AHR in nonatopic subjects. Subjects in the atopic group reported that they
had asthma since childhood and their serum IgE concentrations were unchanged
following weight loss suggesting that they had the allergic form of the disease while
subjects in the nonatopic group had asthma with an onset that was later in life
(nonallergic asthma phenotype). The nonatopic group had a diagnosis of asthma, but
without allergy suggesting that another mechanism is responsible for their asthma
53
symptoms, and the leading mechanism at play here is thought to be the direct effect of
mechanical compression of the lung due to obesity [11].
As described earlier, these results gave rise to the notion that there are two distinct
clinical phenotypes of asthma in obesity – those with early onset asthma and high serum
IgE (TH2-high) and those with late onset asthma and low serum IgE (TH2-low). Chapman
et al further investigated these findings by assessing the effect of weight loss on
sensitivity to small airway closure during methacholine challenge in the two obese
asthmatic groups (allergic and nonallergic) compared to an obese control arm [248]. They
found significantly higher airway responsiveness to methacholine in the two obese
asthmatic groups compared to the control group. Furthermore, sensitivity to airway
closure and AHR was not significantly improved following weight loss in TH2-high
asthmatics whereas weight loss was associated with a reduction in small airway
responsiveness in TH2-low asthmatics.
Taken together, the results of these weight loss studies on AHR suggest that obesity
exerts a strong mechanical effect on the respiratory system and depending on the asthma
phenotype (atopic versus nonatopic), obesity could potentially increase the risk of AHR.
The mechanical effects of obesity on the respiratory system together with the
inflammatory effects of excess adiposity could indirectly contribute to AHR likely
through mechanisms such as airway narrowing and airway remodeling that is commonly
associated with asthma. The next section will examine these mechanisms.
Effect of Obesity on Airway Narrowing and Airway Closure
Compared to healthy weight controls, airway narrowing in obesity has been shown to
correlate with airway closure and AHR [249]. Airway narrowing and closure leads to gas
trapping and ventilation inhomogeneity [250]. While gas trapping and thus the effect of
airway closure can be assessed from elevated RV/TLC ratio by body plethysmography
[253], a recently developed method to assess airway closure is from the oscillometric
evaluation of Xrs. For example, in a comparative study of lung mechanics in obese versus
nonobese nonasthmatics, Salome et al used the oscillometry technique to demonstrate
that obesity does not alter airway responsiveness to methacholine; rather, it significantly
54

reduces Xrs and increases Rrs [254]. They reported that methacholine-induced reduction
in Xrs was greater among obese nonasthmatics compared to their nonobese counterparts
suggesting that excess adiposity could promote peripheral airway closure. Similar
findings have been observed in other studies [11, 248].
The mechanisms behind the increase in Rrs and reduction in Xrs observed in obesity
[117, 254] are not completely understood but it is thought that the reduction in FRC
attenuates the forces of interdependence between the airway and parenchyma and this
reduces airway caliber [245]. Indeed, airway caliber is sensitive to airway-parenchymal
tethering forces, and breathing at a lowered lung volume due to reduced FRC plays a
dominant role in increasing Rrs in obese subjects [117, 119]. In addition, breathing at low
lung volumes also increases AHR [255]. Van Noord et al, Torchio et al, and Navajas et
al conducted studies involving rib cage strapping [256, 257] and supine lying [258] to
reduce lung volume in a similar manner to obesity-induced mechanical compression of
the respiratory system. These experiments resulted in increased Rrs and in one of the
studies [257], AHR was also increased. These results show that the reduction in the
operating volume of the lung in obesity, measured as a reduction in FRC, could
potentially amplify the manifestation of symptoms related to airway narrowing or airway
closure with notable examples being the increased risk for AHR [47], dyspnea [23], and
wheeze [22].
Another hypothesis that has been postulated to explain the increased AHR in obesity is
that breathing at low FRC, with a rapid breathing pattern and a reduced tidal volume
could affect the contractility of airway smooth muscle (ASM). Smooth muscle
contractility is usually modulated by stretching during regular tidal breathing and deep
inspirations [259]. The outcome of breathing at reduced tidal volume in obesity is
potentially two-fold. The first outcome is that the load applied on the ASM is reduced
and this leads both to increased shortening velocity of the ASM, and the ASM
consequently operates at a shorter length possibly due to ASM length adaptation
(mechanical plasticity) i.e, the ASM adapts to a shorter length at reduced lung volume
and rearranges its contractile apparatus in the best possible way to maintain its force
generating capacity [257, 260-266]. Thus, it can now generate more force at a shorter
55

length than it would have without the length adaptation. A second mechanism potentially
leading to increased force and AHR with obesity is that the reduced tidal volume
breathing does not disrupt actin-myosin cross-bridges, thus the ASM becomes stiffer than
it would have been at larger amplitude stretches. This was demonstrated in tissue strip
experiments that showed that with large tidal oscillations and large stretches, ASM force
reduces, and ASM dramatically lengthened and the muscle became softened (fluidized)
[259, 267-269]. This mechanism could explain the maintenance of airway dilation in
healthy subjects despite inhaled agonists, and how smaller tidal stretching in obesity
might impair this effect. Currently, there is some debate arising from data using intact
airways which appear to indicate that this effect can only be produced by very large
stretches, and the effect is less substantial than that recorded in the tissue strip
experiments [270]. Nevertheless, it is possible that reduced length with reduced tidal
stretching in obesity could lead to reduced disruption of actin-myosin cross-bridges thus
leading to AHR.
2.4.4 Summary
Obesity is associated with asthma and asthma-like respiratory symptoms such as wheeze
and dyspnea. The diagnosis and management of asthma in obese individuals is
complicated as a result of excess adiposity, and bronchodilators are reported to exhibit
limited effectiveness [4-8]. However, symptoms often improve with weight loss but
traditional methods of testing lung function such as spirometry and plethysmography
often show little or no changes with weight loss [9-11]. Lung function is typically
assessed in the upright position but the respiratory symptoms of obesity worsens when
subjects lie down [12, 13] and this affects their sleep quality [271]. Unfortunately, there
is a paucity of data on the respiratory health consequences of weight loss, particularly in
the supine position. There is also no data on the effect of weight loss on responsiveness to
short-acting β2–adrenergic bronchial agonists, despite reports of limited effectiveness of
long-acting bronchodilators in this patient group. This information gap has hampered our
ability to unravel the mechanisms that link obesity and weight loss to changes in
respiratory health.
56

It seems likely that there is an additive or potentially synergistic relationship between
obesity-induced mechanical compression of the respiratory system and obesity-related
hormonal, metabolic and inflammatory effects. Evidence from several studies reviewed
here appear to suggest that these two factors could synergistically act to worsen lung
mechanics and function in obese individuals and also modify their response to asthma
controller therapies and bronchodilators. As reviewed in this chapter, there is ample
evidence that the pro-inflammatory environment in obesity could contribute to the
development of asthma and asthma-like respiratory symptoms in individuals with obesity
but evidence of the effect of obesity and weight loss on lung mechanics is rather scant. It
is quite possible that the inflammatory environment in obesity and the mechanical effects
of excess adiposity could act together to produce an overall effect that is greater than the
sum of the individual effects of these two factors.
2.5 Research Hypothesis and Aims The general hypotheses for this thesis is that improvements in lung function after weight
loss can be reliably measured with oscillometry and would be related to improvements in
sleep quality and these changes in lung mechanics would reflect lung-volume-induced
changes in airway-parenchymal tethering affecting airway diameters.
2.5.1 Early changes in lung mechanics following weight loss surgery
Specific Hypothesis 1: Oscillometry can be used effectively to show early changes in
pulmonary mechanics with weight loss in obese subjects, and is more sensitive than
spirometry and plethysmography.
Specific Hypothesis 2: Changes in lung mechanics measured in the supine position are
associated with improvements in sleep quality reported by the patients.
Specific Hypothesis 3: Obesity and weight loss alters bronchodilator responsiveness due
to changes in lung volumes.
57

Brief approach: I evaluated lung mechanics and function in 19 severely obese female
subjects using spirometry, oscillometry, whole-body plethysmography and the Pittsburgh
Sleep Quality Index (Appendix F) before and 5 weeks after bariatric surgery. Spirometry
and oscillometry were conducted in both the upright and the supine position, and pre- and
post-bronchodilation with 200 μg of the short-acting β2–adrenergic agonists, salbutamol.
The aims of this part of my thesis were to a) assess pulmonary mechanics in both the
upright and supine position in obese individuals, and assess the early changes in upright
and supine pulmonary mechanics that occur within the first 5 weeks of weight loss
surgery by measuring Rrs and Xrs with oscillometry and comparing these assessments
with results from spirometry and plethysmography, b) correlate the early changes in lung
mechanics induced by weight loss with changes in sleep quality assessed during the 5-
week study period, and c) study the effect of obesity and weight loss on bronchodilator
responsiveness.
2.5.2 Improvement in upright and supine lung mechanics with bariatric surgery
Specific Hypothesis 1: Compared to the modest weight loss recorded at 5 weeks after
bariatric surgery, further weight loss would induce greater improvements in upright
pulmonary mechanics, and changes in supine pulmonary mechanics will be greater, and
this would in turn lead to greater improvements in sleep quality.
Specific Hypothesis 2: Weight loss will lead to decreased airway heterogeneity via
recruitment of small airways due to improved tethering between the airway and
parenchyma, and this would be detectable by improvements in bronchodilator
responsiveness, and reduced frequency dependence of Rrs.
Brief approach: I extended the follow-up period of our weight-loss study (section 2.5.1)
to 6 months and re-evaluated our study participants using oscillometry, spirometry,
plethysmography, and Pittsburgh Sleep Quality Index (PSQI). Results obtained were
compared to those recorded earlier at baseline and 5 weeks after surgery.
58
The aims of the second part of this thesis were to a) evaluate the changes in lung
mechanics measured in the upright and supine positions at 6 months after weight loss
surgery, b) assess the changes in sleep quality with further weight loss achieved at 6
months after bariatric surgery, and c) investigate the changes in frequency dependence of
Rrs at 6 months and assess the changes in lung mechanics induced by the short-acting β2–
adrenergic agonists following weight loss.
2.5.3 Repeatability, variability and reliability of respiratory impedance
The third and final objective of this thesis was to a) assess the effect of incorrect
positioning of the head and neck during oscillometry, as well as the effect of cheek
support for comparison, b) assess within-day repeatability and variability on the
respiratory impedance values, and c) assess day-to-day repeatability and variability of
oscillometric indices.
Brief approach: I evaluated 6 healthy adults and 6 COPD patients with oscillometry on
two separate study visits to obtain Rrs and Xrs. At baseline, subjects were instructed to
follow recommended guidelines for use of oscillometry in clinical practice. Oscillometry
was then repeated without cheek-support, and artefacts were introduced through flexion
and extension of the head and neck. Three consecutive sets of measurements were
obtained under each condition, and standard deviation and percent coefficient of variation
were computed as indices of variability and repeatability. Also, Pearson’s product
moment correlation coefficient [Pearson’s (r)] was computed to determine the test-retest
reliability of oscillometry from day to day.
59
Chapter 3: Early Detection of Changes in Lung Mechanics with
Oscillometry Following Bariatric Surgery in Severe Obesity
Authors
Ubong Peters
Paul Hernandez
Gail Dechman
James Ellsmere
Geoffrey Maksym
Published, Applied Physiology, Nutrition and Metabolism
2016
This manuscript has been modified from its original format to conform to the
structure of this dissertation
60

3.1 Abstract
Obesity is associated with respiratory symptoms that are reported to improve with weight
loss; but this is poorly reflected in spirometry and few studies have measured respiratory
mechanics with oscillometry. We investigated whether early changes in lung mechanics
following weight loss is detectable with oscillometry. Furthermore, we investigated
whether the changes in lung mechanics measured in the supine position following weight
loss is associated with changes in sleep quality. Nineteen severely obese female subjects
(mean body mass index: 47.2±6.6kg/m2) were evaluated using spirometry, oscillometry,
plethysmography and the Pittsburgh Sleep Quality Index before and 5 weeks after
bariatric surgery. These tests were conducted in both upright and supine positions, and
pre- and post-bronchodilation with 200mcg of salbutamol. Five weeks after surgery,
mean weight loss of 11.5±2.5kg was not associated with changes in spirometry and
plethysmography, except for functional residual capacity. There was also no change in
upright respiratory system resistance (Rrs) or reactance following weight loss.
Importantly, however, in the supine position, weight loss substantially reduced Rrs. In
addition, sleep quality significantly improved and was highly correlated with the
reduction in supine Rrs. Prior to weight loss, subjects did not respond to bronchodilator
when assessed in the upright position with either spirometry or oscillometry, but with
modest weight loss, bronchodilator response was regained to the normal range.
Improvements in lung mechanics occur very early following weight loss but mostly in the
supine position, resulting in improved sleep quality. These improvements are detectable
with oscillometry but not with spirometry.
Keywords: Oscillometry (Forced oscillation technique); Obesity; Body mass index; Lung
function; Lung mechanics; Bronchial reversibility.
61
3.2 Background
The worldwide prevalence of obesity has nearly doubled over the past three decades, now
exceeding 10 % of the adult population [272]. Obesity is associated with impaired lung
function and respiratory conditions including asthma [21] and obstructive sleep apnea
[2], and increased risk of respiratory symptoms such as wheeze [22], dyspnea [23], and
orthopnea [13].
Increasingly, bariatric surgery is used successfully to achieve and maintain weight loss,
and this is accompanied by significant improvements in morbidity [273, 274], sleep
quality [271], and lung function [144, 275]. While several studies have examined the
effects of surgically induced weight loss on lung function in obese subjects with asthma,
there is a paucity of data on the effects of bariatric surgery on obese individuals without
asthma or other concomitant lung disease. The most significant lung function changes
with weight loss in individuals without asthma are improvements in expiratory reserve
volume (ERV) and functional residual capacity (FRC), with modest changes in total lung
capacity (TLC) and residual volume (RV), accompanied by minor improvements in
forced expiratory volume in one second (FEV1) [276]. Expiratory reserve volume and
FRC were shown to increase by as much as 54 % and 37 % respectively, following a 34.2
kg weight loss [144].
Dyspnea and wheeze in obesity are thought to arise largely from compression of the
lungs by visceral fat around the mediastinum and in the abdominal and thoracic cavities
which leads to decreased lung volumes [146, 240, 277]. While the reduced lung volumes
alter airway-parenchymal interdependence [278], there is little apparent effect on airway
obstruction, at least as reflected in FEV1, despite the reductions in airway diameters [117].
This has led to the notion that obesity predominantly affects small airways, and is
therefore not likely to be fully reflected in spirometry [276]. However, evaluation of lung
mechanics by oscillometry, also known as the forced oscillation technique, in obesity has
revealed an increase in respiratory system resistance (Rrs) [117, 254, 279] and a decrease
in respiratory system reactance (Xrs), primarily at low frequencies [254, 279]. Rrs is
sensitive to central airway caliber, while low frequency Xrs can be used to determine
respiratory system elastance (Ers), which is the inverse of respiratory system compliance
62

[280]. In obesity, Xrs is thought to be significantly decreased due to closure of small
airways in the lung periphery [254]. Indeed, low frequency Xrs is sensitive to peripheral
small airway closure [162, 281, 282] making it a suitable tool for assessment of small
airways [132], which is considered a silent zone to spirometry [283].
There have been very few studies of changes in lung mechanics with weight loss [9-11,
248]. Moreover, there are no studies of how weight loss affects lung mechanics in the
supine position, despite reports of increased severity of dyspnea and poor sleep quality in
obesity [13, 271]. While the reduced lung volumes in obesity alters airway-parenchymal
interdependence by decreasing tethering forces and shifting the pressure-volume
relationship of the respiratory system [117, 278], it is not well understood how the
reduced tethering forces in obesity might affect the responsiveness to bronchodilator
(BD). Indeed, responsiveness to long acting bronchodilators and inhaled corticosteroids is
impaired in obese subjects with asthma [5-8], but the effect of obesity and weight loss on
responsiveness to short-acting beta2-adrenergic agonists has not been studied.
We hypothesized that oscillometry is more sensitive than spirometry and
plethysmography to early changes in lung mechanics measured at 5 weeks following
weight loss surgery and this may be associated with improvements in sleep quality
reported by the patients. We assessed the mechanics of moving air into and out of the
lungs in both upright and supine positions and recorded the changes that occurred with
weight loss by measuring Rrs and Xrs with oscillometry and comparing these
assessments with results from spirometry and plethysmography. Furthermore, we
hypothesized that changes in lung mechanics measured in the supine position following
weight loss is associated with the changes in sleep quality. Finally, to probe the role of
obesity and weight loss on bronchodilator response, we measured lung mechanics before
and after salbutamol inhalation and compared the changes in lung mechanics to changes
in spirometry values.
63
3.3 Methods
3.3.1 Selection of study participants and consent
Nineteen severely obese individuals without a diagnosis of asthma or other lung diseases
were recruited from the Bariatric Surgery Clinic at the Queen Elizabeth II Health
Sciences Center. This study was approved by the Nova Scotia Health Authority Research
Ethics Board (reference number: CDHA-RS/2012-109). All participants provided written
informed consent to participate in the study and also consented to have their data
published.
3.3.2 Inclusion and exclusion criteria
All participants in the study had a body mass index (BMI) greater than 40 kg/m2 and
were scheduled for bariatric surgery within a few days of the baseline assessments
described here. Subjects were excluded from the study if their BMI was less than 40
kg/m2, or if they presented with a physician-diagnosis of chronic lung disease (including
asthma and chronic obstructive pulmonary disease). Other exclusion criteria included: a
greater than 10 pack year smoking history, cognitive impairments that prevented accurate
completion of study questionnaires or unacceptable performance of pulmonary function
tests. Subjects were also excluded if they were unable to lie on their back for up to 10
minutes.
3.3.3 Study design
We assessed lung mechanics pre- and post-bronchodilator (BD) in the upright and supine
postures, prior to and 5 weeks after bariatric surgery. We define all measurements before
surgery to be baseline. At each assessment, oscillometry, whole body plethysmography
and spirometry were performed as described below. The testing sequence is outlined in
Figure 3.1.
64
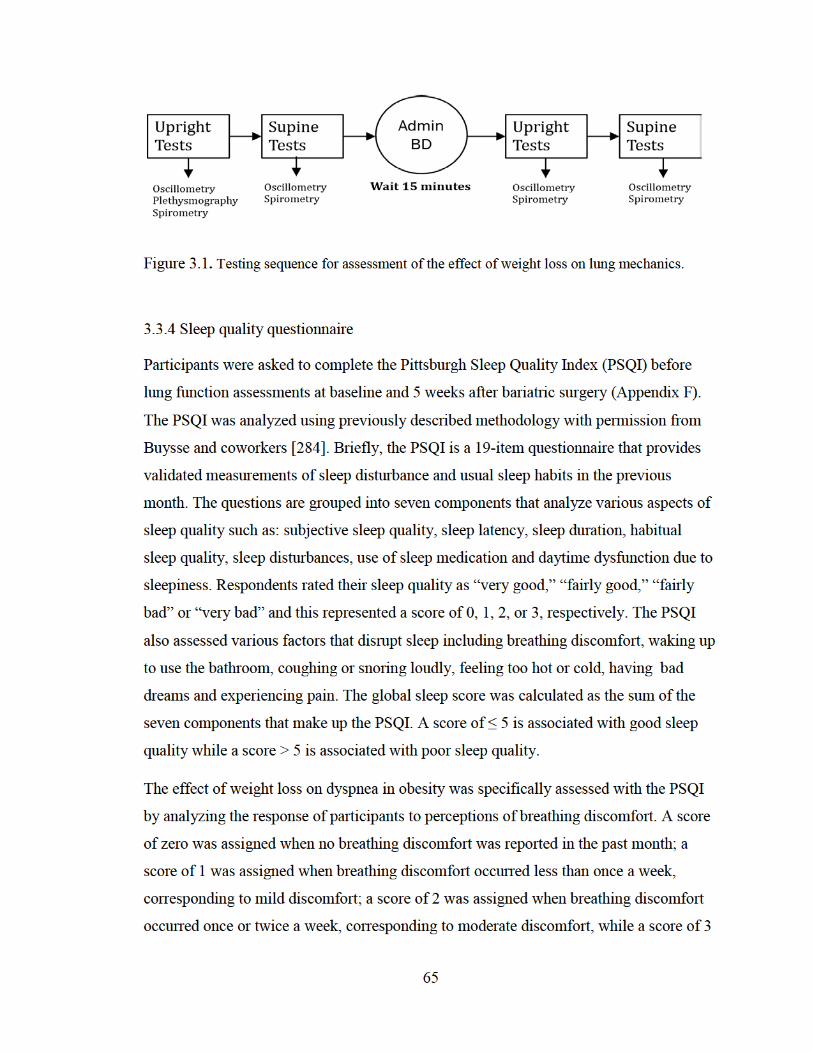
Figure 3.1. Testing sequence for assessment of the effect of weight loss on lung mechanics.
3.3.4 Sleep quality questionnaire
Participants were asked to complete the Pittsburgh Sleep Quality Index (PSQI) before
lung function assessments at baseline and 5 weeks after bariatric surgery (Appendix F).
The PSQI was analyzed using previously described methodology with permission from
Buysse and coworkers [284]. Briefly, the PSQI is a 19-item questionnaire that provides
validated measurements of sleep disturbance and usual sleep habits in the previous
month. The questions are grouped into seven components that analyze various aspects of
sleep quality such as: subjective sleep quality, sleep latency, sleep duration, habitual
sleep quality, sleep disturbances, use of sleep medication and daytime dysfunction due to
sleepiness. Respondents rated their sleep quality as “very good,” “fairly good,” “fairly
bad” or “very bad” and this represented a score of 0, 1, 2, or 3, respectively. The PSQI
also assessed various factors that disrupt sleep including breathing discomfort, waking up
to use the bathroom, coughing or snoring loudly, feeling too hot or cold, having bad
dreams and experiencing pain. The global sleep score was calculated as the sum of the
seven components that make up the PSQI. A score of ≤ 5 is associated with good sleep
quality while a score > 5 is associated with poor sleep quality.
The effect of weight loss on dyspnea in obesity was specifically assessed with the PSQI
by analyzing the response of participants to perceptions of breathing discomfort. A score
of zero was assigned when no breathing discomfort was reported in the past month; a
score of 1 was assigned when breathing discomfort occurred less than once a week,
corresponding to mild discomfort; a score of 2 was assigned when breathing discomfort
occurred once or twice a week, corresponding to moderate discomfort, while a score of 3
65
was assigned when breathing discomfort occurred three or more times a week,
corresponding to severe discomfort.
3.3.5 Weight, height and waist circumference measurements
Participant weight and height were measured without wearing shoes or heavy clothing;
these parameters were used to calculate BMI. Waist circumference (WC) was measured
as the circumferential distance around the midpoint between the lowest rib and the iliac
crest.
3.3.6 Pulmonary function tests
Spirometry and whole body plethysmography were performed according to
recommended international guidelines using a spirometer-equipped body box
(SensorMedics Corporation, Yorba Linda, CA, USA) [45, 127]. Forced expiratory flows,
including forced expiratory volume in one second (FEV1) and expiratory flow at 50 %
(FEF50), 75 % (FEF75), and 25 – 75 % (FEF25–75) of forced vital capacity (FVC) were
obtained. Lung volumes and capacities, including expiratory reserve volume (ERV),
inspiratory capacity (IC), functional residual capacity (FRC) and vital capacity (VC) were
also measured. The average ERV, FRC and IC; and the best VC and forced expiratory
flows were selected as the final result from three technically acceptable measurements
[285]. TLC was calculated as the sum of IC and FRC while RV was calculated as the
difference between TLC and VC. Results obtained from these lung function tests were
expressed as percentages of predicted values from Crapo et al [73].
3.3.7 Oscillometry
The mechanical properties of the respiratory system were measured according to
recommended guidelines [286] using the tremoFloTM Airwave Oscillometry System
(Appendix G, Thorasys Thoracic Medical Systems Inc., Montreal, QC, Canada). During
each measurement, subjects wore a nose-clip and firmly held their cheeks and mouth
66
floor so as to minimize the upper airway shunt artefact [286]. The Airwave Oscillometry
System delivered a multi-frequency composite oscillatory pressure waveform of about 1-
2 cm H2O superimposed on a subject’s spontaneous breathing at 6, 11 and 19 Hz for 16
seconds. Mechanical parameters of the respiratory system were then computed from the
impedance of the respiratory system (Zrs) to the resulting flow oscillations. The
frequency range allowed us to examine the frequency-dependent mechanics of the
respiratory system and how it changed with weight-loss. Respiratory impedance
measured at the 6 Hz oscillation frequency probed the respiratory mechanics of the entire
respiratory system while the impedance measured at the 19 Hz oscillation frequency
probed the respiratory mechanics of the upper and central airways of the lung.
Respiratory system impedance is the spectral ratio of the fast Fourier transform (FFT) of
the pressure and flow measured at the subject’s mouth, and was computed by averaging 1
second windows of the pressure and flow recordings multiplied by Hamming windows
with 50% overlap. Zrs is a complex quantity where the real part depicts the portion of the
pressure that is in phase with flow and thus describes Rrs, while the imaginary part
depicts the portion of the pressure that is in phase with volume and acceleration of
volume and thus describes Xrs. Rrs is largely governed by airway caliber and some lung
tissue properties, while Xrs is governed by the elasticity of the chest wall and lung
tissues, and the inertia of the oscillating column of gas in the central airways.
Furthermore, while the resistance of the two components of the chest wall – the rib cage
and diaphragm-abdomen accounts for a small part of the Rrs, the contribution of these
two components to the total Rrs may be increased in the supine position particularly in
obesity.
Within each 16 second recording, the effects of artefacts were minimized by automatic
rejection of any 1 second window containing negative Rrs or Rrs values greater than
three standard deviations and using the mean Rrs and Xrs to minimize the effect of any
outliers. Additionally, measurements were repeated four times with periodic breaks of
about 30 seconds between measurements. The average from these measurements was
computed as the final result.
67

At low frequencies Xrs is negative and is dominated by the elastance of the respiratory
system (Ers) while at high frequencies when Xrs is positive, it is dominated by the inertia
of the oscillating air column. For all subjects, Xrs at 6 Hz was less than -1 cmH2O/(L·s-1)
indicating that Xrs was dominated by elastance and an estimate of Ers was obtained
[287] as: 𝐸𝐸𝐸𝐸𝐸𝐸 = −𝜔𝜔𝜔𝜔𝐸𝐸𝐸𝐸6 where, 𝜔𝜔 is the angular frequency and is mathematically
expressed as: 𝜔𝜔 = 2𝜋𝜋f.
The coefficient of variation (COV) for Rrs was computed from the standard deviation of
the four consecutive Rrs measurements normalized to the mean to determine the
repeatability and variability of Rrs. Coherence ≥ 0.90 was used as an acceptance criteria
for each 16 second measurement of Zrs at each frequency.
3.3.8 Bronchial reversibility test
Lung mechanics and function was assessed before, and 15 minutes after inhaling 200 µg
of the BD – salbutamol, administered with a metered-dose inhaler and valved-holding
chamber spacer device (CareStream Medical Ltd., Pickering, ON, Canada). This
assessment was performed before and 5 weeks after bariatric surgery.
3.3.9 Bariatric surgery
All subjects underwent a laparoscopic sleeve gastrectomy – a minimally invasive
procedure that results in the complete removal of about 85% of the stomach. The surgery
was performed under general anesthesia and patients were discharged home 48-72 hours
post-surgery. The postoperative diet regimen consisted of 4-6 weeks of a high protein,
semi-liquid diet followed by a return to normal diet.
3.3.10 Statistical analysis
Results are expressed as means ± standard deviations (SD). Weight, BMI, waist
circumference, PSQI and plethysmography results obtained before and after bariatric
68
surgery were analyzed using a one-way repeated measures analysis of variance
(ANOVA) while the effects of position and bronchodilation on spirometry and
oscillometry results obtained before and after bariatric surgery were analyzed using two-
way repeated-measures ANOVA with surgery and condition (position plus
bronchodilation) as factors. Surgery was divided into two levels (i.e. before and after
surgery) while condition was divided into four levels (i.e. upright pre-BD, supine pre-BD,
upright post-BD and supine post-BD). Where significance was found, separate post hoc
pairwise testing was then performed with Student’s t-test to identify differences due to
surgery, position, or BD and the Benjamini-Hochberg procedure was applied to control
the effect of multiple comparisons [288]. Correlation analyses were performed using
linear regression methods in MATLAB R2013b (Natick, MA, USA) while all other
analyses were performed in IBM SPSS Statistics for Windows, Version 22.0 (Armonk,
NY, USA). P-values < 0.05 were considered statistically significant.
3.4 Results
3.4.1 Demographics and obesity parameters
Table 3.1 shows the age distribution and anthropometric characteristics of the subjects
before and 5 weeks after bariatric surgery. Following bariatric surgery, there was a
significant reduction in weight, BMI and WC (p < 0.001). Study participants lost about
9.4 ± 2.1 % of their initial weight (Table 3.1). The ANOVA summary table of within-
subjects effects for oscillometry is presented in Table 3.2. With the exception of Rrs,19,
weight loss surgery did not have a significant effect on any of the oscillometric (Table
3.2) or spirometric measures (not shown). Furthermore, position and bronchodilation
significantly changed all oscillometric measures (Table 3.2) while the only spirometric
indices that significantly changed were FEV1, FEV1/FVC, FEF25-75 and FEF75 (not
shown). Also, there was a significant cross interaction between surgery and conditions
(position plus bronchodilation) in Xrs,6 and Ers (Table 3.2).
69

3.4.2 Changes in lung mechanics with weight loss: posture and bronchodilation
Although weight loss had no effect on upright pre-BD Rrs measured at all the
frequencies, weight loss significantly reduced pre-BD Rrs,19 measured in the supine
position by 13.1 ± 3.8%, but not Rrs,6 and Rrs,11 (Table 3.2, Figures 3.2 and 3.3A). In
addition, moving from an upright to supine position elicited changes in lung mechanics
that were further influenced by weight loss and by bronchodilation. For instance, prior to
weight loss, moving to the supine position pre-BD resulted in a 23.7 ± 11 % increase in
pre-BD Rrs,6, but there was no change post-BD; however, after weight loss, the increase
in Rrs,6 was 24.4 ± 8 % post-BD (Figure 3.3A). Ers was consistently sensitive to changes
in posture increasing by similar amounts on moving from upright to supine position, both
pre- and post-BD, and before and after weight loss (Figure 3.3B).
Table 3.1. Age distribution and anthropometric characteristics of study participants.
Before Surgery After Surgery p-value
Number of participants 19 19
Sex (Females, Males) 19, 0
Age (years) 48.3 ± 7.6
Mean weight (kg) 123.4 ± 19.0 111.9 ± 18.1 < 0.001
Mean BMI (kg/m2) 47.2 ± 6.6 42.8 ± 6.6 < 0.001
Mean Waist Circumference 1.30 ± 0.04 m
(134 ± 4 cm)
1.20 ± 0.03 m
(121 ± 3 cm)
< 0.001
Average weight loss (kg) N/A 11.5 ± 2.5
Percent of initial weight lost (%) N/A 9.4 ± 2.1
Note: Weight, BMI and waist circumference significantly reduced after bariatric surgery. Data are expressed here as mean ± standard deviation.
70

3.4.3 Weight loss and bronchodilator responsiveness
Figure 3.4 shows the effects of BD at each frequency. Prior to weight loss, BD only had a
modest effect on Rrs,11 measured in the upright position (Figure 3.4A); however,
following weight loss, BD had a substantial effect by decreasing Rrs at all frequencies
(Figure 3.4C). In contrast to measurements in the upright position, in the supine position,
BD significantly decreased Rrs at all frequencies before weight loss but following weight
loss, BD response was only observed in Rrs,6 (Figure 3.3A) and not in Rrs,11 and Rrs,19
(not shown). There was also no BD response measured with Ers before surgery in both
the upright and supine positions; however, significant response to BD was measured
following weight loss in both the upright and supine positions (Figure 3.3B). Unlike Ers,
Xrs measured at 11 and 19 Hz was consistently increased in response to BD in the
upright (Figure 3.4B and 3.4D) and supine (not shown) positions both before and after
weight loss.
Table 3.2. Analysis of Variance for Oscillometry
Surgery Conditions (Position + Bronchodilation)
Interactions (Surgery*Conditions)
F-value p-value F-value p-value F-value p-value
Rrs6 .562 .463 7.873 < .001 2.355 .082
Rrs11 3.251 .088 8.783 .001 2.053 .117
Rrs19 5.627 .029 4.421 .017 2.353 .082
Xrs6 .214 .650 26.415 < .001 1.207 .029
Xrs11 1.331 .264 25.551 < .001 .717 .546
Xrs19 .011 .919 24.687 < .001 .266 .850
Ers .214 .650 26.415 < .001 1.207 .029
Examining the responses due to BD in Rrs again, and evaluating the percent changes in
Rrs to compare to the percent changes in Ers in Figure 3.5, we saw that at baseline, the
percent change in upright Rrs at all frequencies in response to BD was negligible;
71
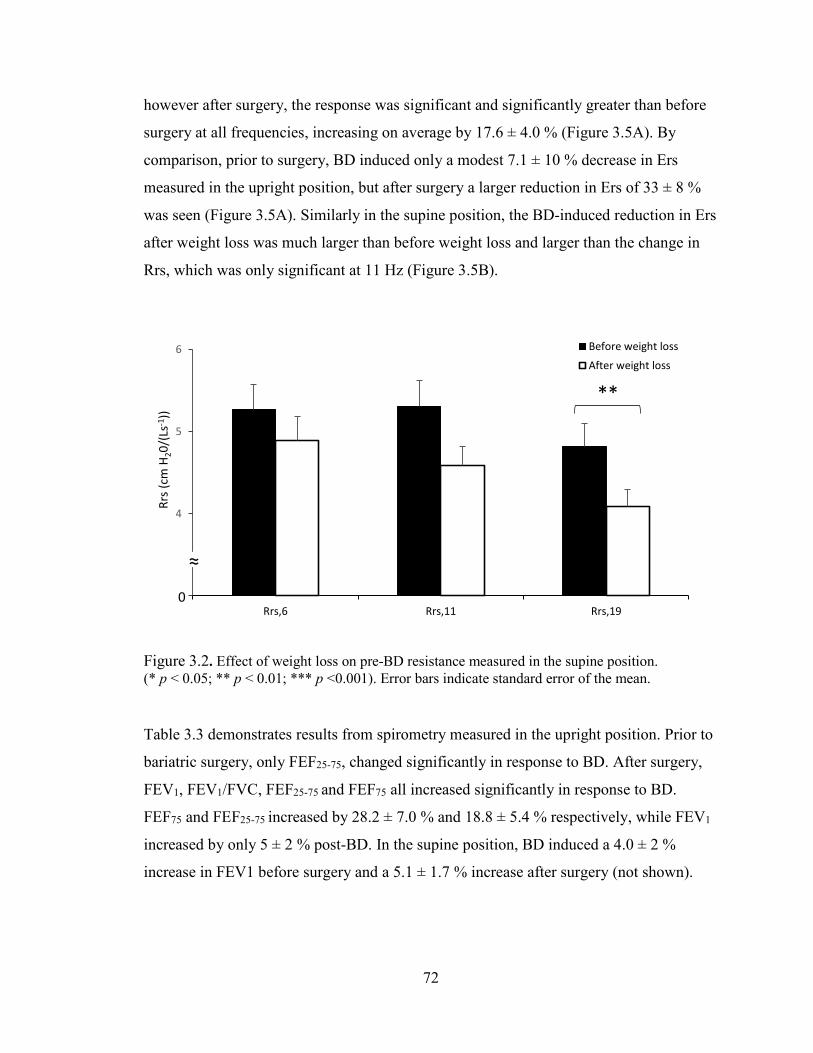
however after surgery, the response was significant and significantly greater than before
surgery at all frequencies, increasing on average by 17.6 ± 4.0 % (Figure 3.5A). By
comparison, prior to surgery, BD induced only a modest 7.1 ± 10 % decrease in Ers
measured in the upright position, but after surgery a larger reduction in Ers of 33 ± 8 %
was seen (Figure 3.5A). Similarly in the supine position, the BD-induced reduction in Ers
after weight loss was much larger than before weight loss and larger than the change in
Rrs, which was only significant at 11 Hz (Figure 3.5B).
Figure 3.2. Effect of weight loss on pre-BD resistance measured in the supine position. (* p < 0.05; ** p < 0.01; *** p <0.001). Error bars indicate standard error of the mean.
Table 3.3 demonstrates results from spirometry measured in the upright position. Prior to
bariatric surgery, only FEF25-75, changed significantly in response to BD. After surgery,
FEV1, FEV1/FVC, FEF25-75 and FEF75 all increased significantly in response to BD.
FEF75 and FEF25-75 increased by 28.2 ± 7.0 % and 18.8 ± 5.4 % respectively, while FEV1
increased by only 5 ± 2 % post-BD. In the supine position, BD induced a 4.0 ± 2 %
increase in FEV1 before surgery and a 5.1 ± 1.7 % increase after surgery (not shown).
**
3
4
5
6
Rrs,6 Rrs,11 Rrs,19
Rrs (
cm H
20/(
Ls-1
))
Before weight loss
After weight loss
0
≈
72
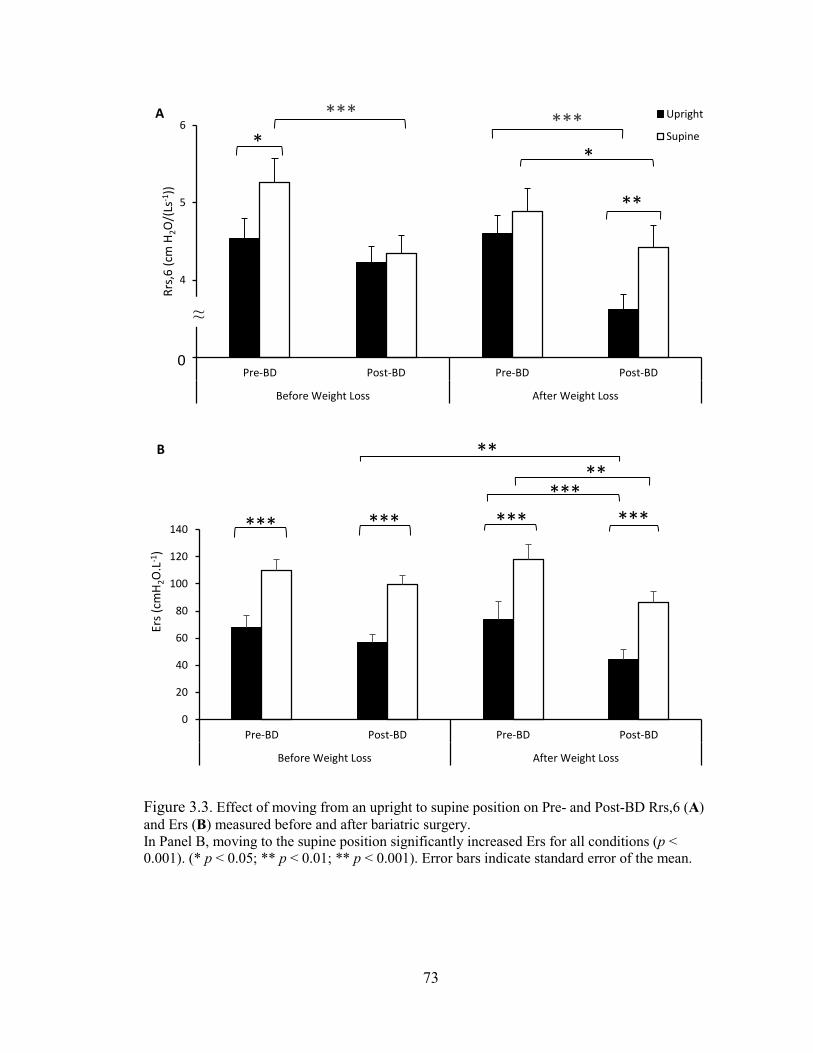
Figure 3.3. Effect of moving from an upright to supine position on Pre- and Post-BD Rrs,6 (A) and Ers (B) measured before and after bariatric surgery. In Panel B, moving to the supine position significantly increased Ers for all conditions (p < 0.001). (* p < 0.05; ** p < 0.01; ** p < 0.001). Error bars indicate standard error of the mean.
**
*** ***
3
4
5
6
Pre-BD Post-BD Pre-BD Post-BD
Before Weight Loss After Weight Loss
Rrs,
6 (c
m H
2O/(
Ls-1
))
Upright
Supine
A
**
***
0
20
40
60
80
100
120
140
Pre-BD Post-BD Pre-BD Post-BD
Before Weight Loss After Weight Loss
Ers (
cmH 2
O.L
-1)
B
*** *** *** ***
****
0
≈
73

3.4.4 Weight loss and lung volumes
There was a 9.5 ± 2.5 % increase in FRC with weight loss following bariatric surgery but
no change in other lung volume measurements (Table 3.4). There was a significant
correlation between the change in FRC, expressed as a percent of predicted, and the
percent weight loss following surgery (r = 0.56, p = 0.019).
Figure 3.4. The effect of BD on Rrs and Xrs measured in the upright posture before (A & B) and five weeks after bariatric surgery (C & D). (* p < 0.05; ** p < 0.01; *** p <0.001). Error bars indicate standard error of the mean.
3.4.5 Variability and repeatability of respiratory resistance
The variability and repeatability of respiratory system resistance was determined from the
percent COV (Table 3.5) obtained from multiple measurements at each time and in each
test condition (e.g. before and after bariatric surgery, in the upright and supine position,
74
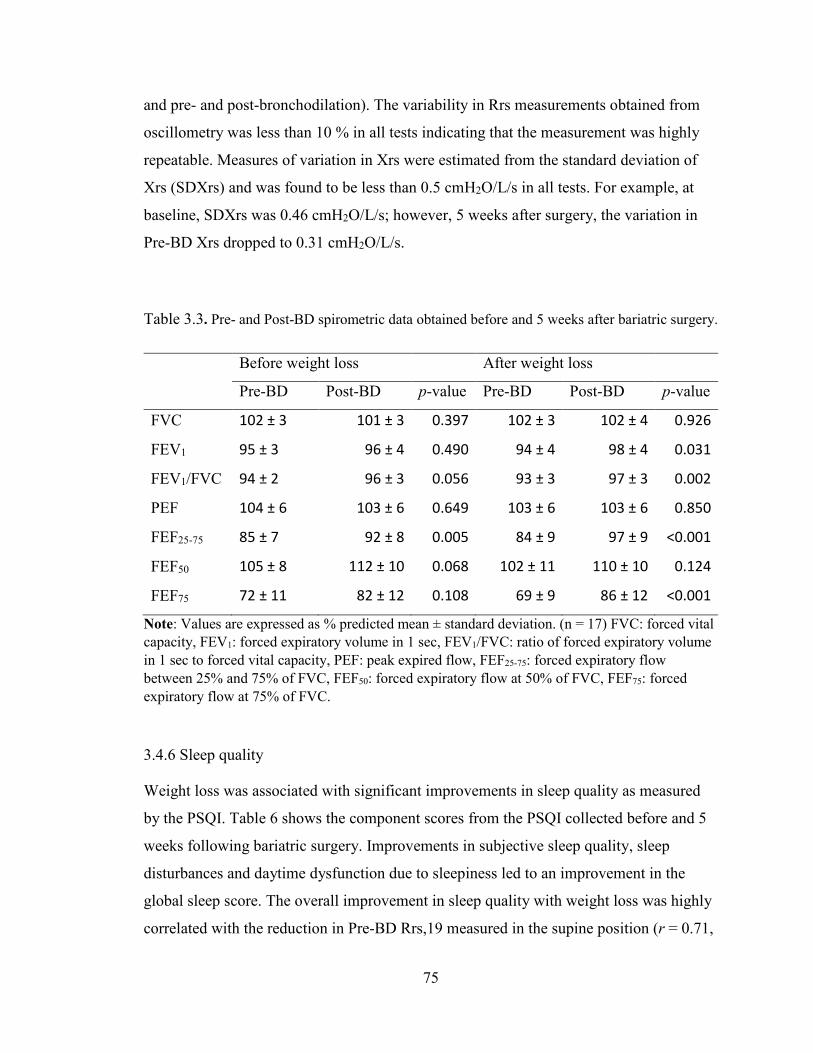
and pre- and post-bronchodilation). The variability in Rrs measurements obtained from
oscillometry was less than 10 % in all tests indicating that the measurement was highly
repeatable. Measures of variation in Xrs were estimated from the standard deviation of
Xrs (SDXrs) and was found to be less than 0.5 cmH2O/L/s in all tests. For example, at
baseline, SDXrs was 0.46 cmH2O/L/s; however, 5 weeks after surgery, the variation in
Pre-BD Xrs dropped to 0.31 cmH2O/L/s.
Table 3.3. Pre- and Post-BD spirometric data obtained before and 5 weeks after bariatric surgery.
Before weight loss After weight loss
Pre-BD Post-BD p-value Pre-BD Post-BD p-value
FVC 102 ± 3 101 ± 3 0.397 102 ± 3 102 ± 4 0.926
FEV1 95 ± 3 96 ± 4 0.490 94 ± 4 98 ± 4 0.031
FEV1/FVC 94 ± 2 96 ± 3 0.056 93 ± 3 97 ± 3 0.002
PEF 104 ± 6 103 ± 6 0.649 103 ± 6 103 ± 6 0.850
FEF25-75 85 ± 7 92 ± 8 0.005 84 ± 9 97 ± 9 <0.001
FEF50 105 ± 8 112 ± 10 0.068 102 ± 11 110 ± 10 0.124
FEF75 72 ± 11 82 ± 12 0.108 69 ± 9 86 ± 12 <0.001
Note: Values are expressed as % predicted mean ± standard deviation. (n = 17) FVC: forced vital capacity, FEV1: forced expiratory volume in 1 sec, FEV1/FVC: ratio of forced expiratory volume in 1 sec to forced vital capacity, PEF: peak expired flow, FEF25-75: forced expiratory flow between 25% and 75% of FVC, FEF50: forced expiratory flow at 50% of FVC, FEF75: forced expiratory flow at 75% of FVC.
3.4.6 Sleep quality
Weight loss was associated with significant improvements in sleep quality as measured
by the PSQI. Table 6 shows the component scores from the PSQI collected before and 5
weeks following bariatric surgery. Improvements in subjective sleep quality, sleep
disturbances and daytime dysfunction due to sleepiness led to an improvement in the
global sleep score. The overall improvement in sleep quality with weight loss was highly
correlated with the reduction in Pre-BD Rrs,19 measured in the supine position (r = 0.71,
75
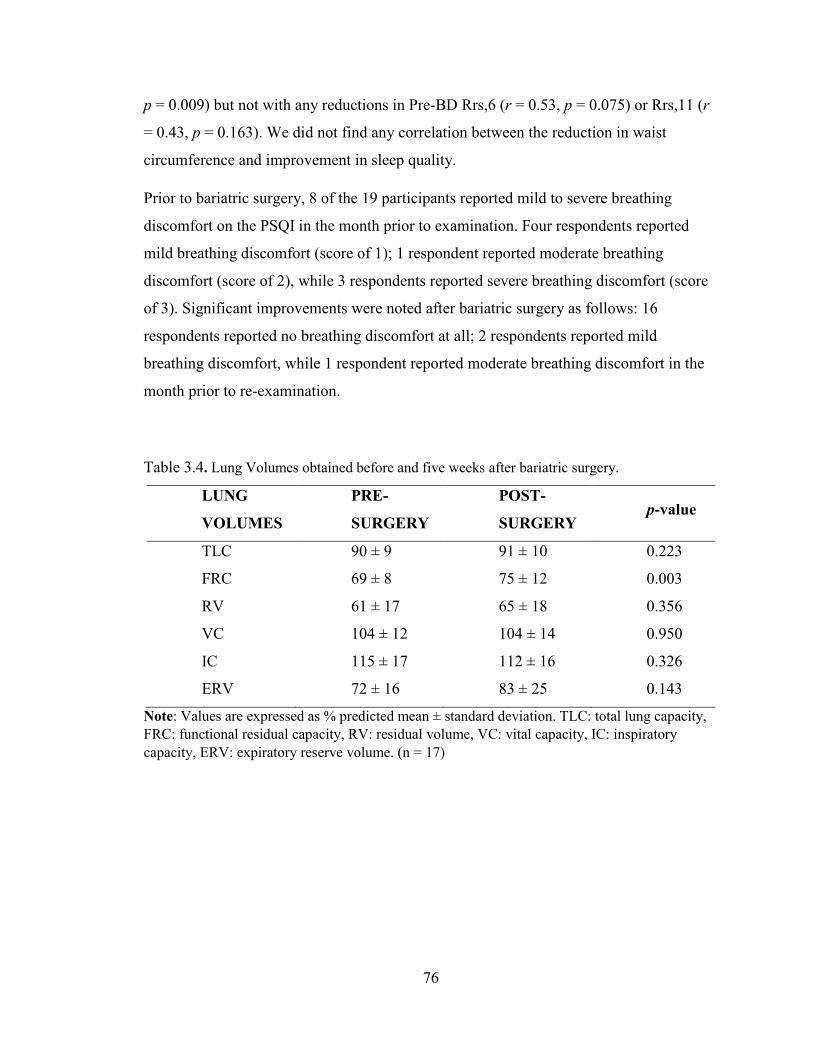
p = 0.009) but not with any reductions in Pre-BD Rrs,6 (r = 0.53, p = 0.075) or Rrs,11 (r
= 0.43, p = 0.163). We did not find any correlation between the reduction in waist
circumference and improvement in sleep quality.
Prior to bariatric surgery, 8 of the 19 participants reported mild to severe breathing
discomfort on the PSQI in the month prior to examination. Four respondents reported
mild breathing discomfort (score of 1); 1 respondent reported moderate breathing
discomfort (score of 2), while 3 respondents reported severe breathing discomfort (score
of 3). Significant improvements were noted after bariatric surgery as follows: 16
respondents reported no breathing discomfort at all; 2 respondents reported mild
breathing discomfort, while 1 respondent reported moderate breathing discomfort in the
month prior to re-examination.
Table 3.4. Lung Volumes obtained before and five weeks after bariatric surgery.
LUNG
VOLUMES
PRE-
SURGERY
POST-
SURGERY p-value
TLC 90 ± 9 91 ± 10 0.223
FRC 69 ± 8 75 ± 12 0.003
RV 61 ± 17 65 ± 18 0.356
VC 104 ± 12 104 ± 14 0.950
IC 115 ± 17 112 ± 16 0.326
ERV 72 ± 16 83 ± 25 0.143
Note: Values are expressed as % predicted mean ± standard deviation. TLC: total lung capacity, FRC: functional residual capacity, RV: residual volume, VC: vital capacity, IC: inspiratory capacity, ERV: expiratory reserve volume. (n = 17)
76
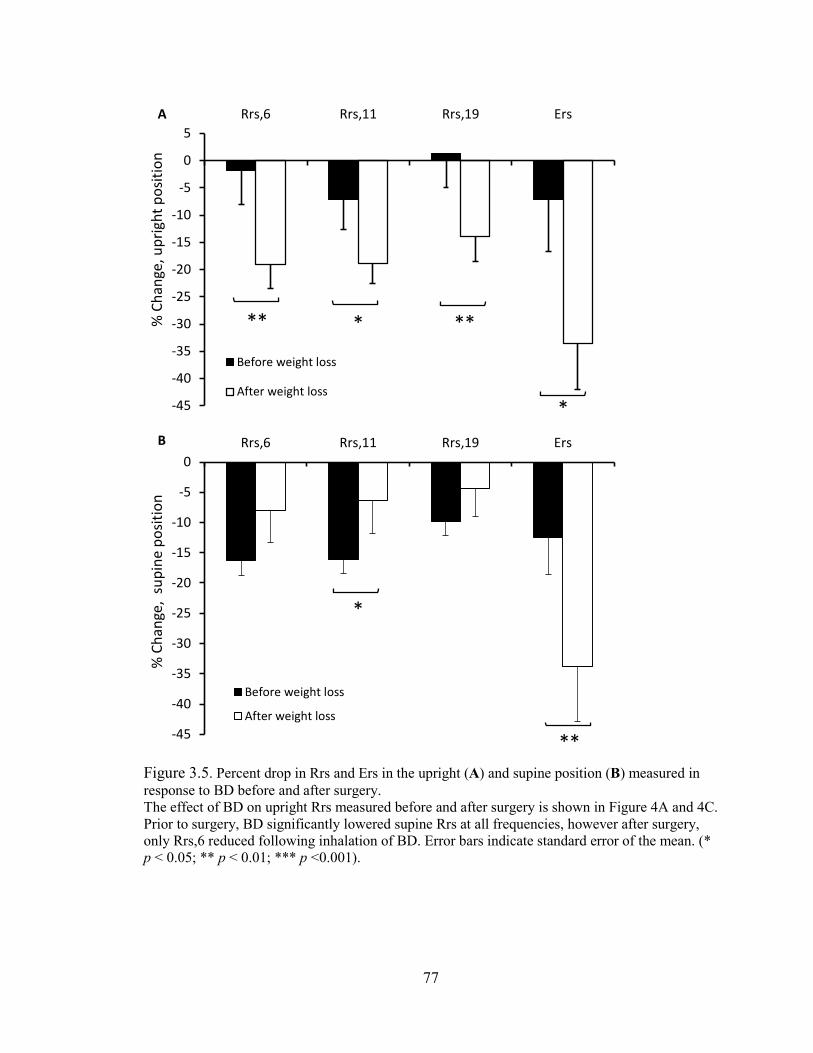
Figure 3.5. Percent drop in Rrs and Ers in the upright (A) and supine position (B) measured in response to BD before and after surgery. The effect of BD on upright Rrs measured before and after surgery is shown in Figure 4A and 4C. Prior to surgery, BD significantly lowered supine Rrs at all frequencies, however after surgery, only Rrs,6 reduced following inhalation of BD. Error bars indicate standard error of the mean. (* p < 0.05; ** p < 0.01; *** p <0.001).
*
** * **
-45
-40
-35
-30
-25
-20
-15
-10
-5
0
5Rrs,6 Rrs,11 Rrs,19 Ers
% C
hang
e, u
prig
ht p
ositi
on
Before weight loss
After weight loss
A
*
**-45
-40
-35
-30
-25
-20
-15
-10
-5
0Rrs,6 Rrs,11 Rrs,19 Ers
% C
hang
e, s
upin
e po
sitio
n
Before weight loss
After weight loss
B
77

Table 3.5. Percent Coefficient of Variation (COV) for oscillometric Rrs obtained under various test conditions.
Pre-Surgery Post-Surgery p-value
Upright Pre-BD 7.3 ± 2.9 5.2 ± 2.2 0.010
Supine Pre-BD 7.0 ± 1.8 6.5 ± 1.7 0.181
Upright Post-BD 5.5 ± 1.7 5.4 ± 2.2 0.362
Supine Post-BD 6.4 ± 2.3 7.0 ± 2.5 0.230
Note: Values are expressed as % mean ± standard deviation.
Table 3.6. Component scores of the PSQI collected before and 5 weeks after bariatric surgery.
Components of the PSQI Before surgery After surgery p-value
Subjective Sleep Quality 1.2 ± 0.8 0.7 ± 0.8 0.025
Sleep Latency 1.6 ± 1.1 1.4 ± 1.1 0.297
Sleep Duration 1.0 ± 1.2 0.7 ± 1.0 0.297
Habitual Sleep Efficiency 1.2 ± 1.0 1.2 ± 1.2 1.00
Sleep Disturbances 1.8 ± 0.5 1.4 ± 0.5 0.007
Use of Sleeping Medication 0.3 ± 0.8 0.2 ± 0.5 0.506
Daytime Dysfunction 1.2 ± 0.9 0.8 ± 0.6 0.042
Global score 8.4 ± 3.5 6.5 ± 3.7 0.049
Note: Values are expressed as mean ± standard deviation
3.5 Discussion
We investigated the early changes in lung mechanics and lung function associated with
weight loss in severely obese subjects at 5 weeks following bariatric surgery. Our
principle finding was that despite normal spirometry and no changes in lung mechanics in
the upright position, lung mechanics assessed by oscillometry significantly improved in
the supine position with weight loss. Secondly, these changes were accompanied by a
78

significant increase in BD responsiveness in the upright position; thirdly, these changes
were accompanied by improvements in sleep quality.
This is the first study to examine changes in lung mechanics induced by weight loss in
both the upright and supine positions. Although weight loss had no effect on Rrs
measured in the upright position, it significantly reduced Rrs measured supine (Figures
3.2 and 3.3A). Previous studies have consistently reported significant reductions in Rrs
measured in the upright position following weight-loss surgery, but those assessments
were conducted 12-24 months after surgery [9-11]. Thus, the amount of weight loss
achieved by the participants only a few weeks after bariatric surgery in our study was
likely insufficient to induce a decrease in Rrs measured in the upright position. However,
the modest weight loss was sufficient to reduce the Rrs measured in the supine position
likely because moving to the supine position augments lung compression associated with
obesity [258, 279] and that could amplify the changes in mechanics with weight loss.
Compression reduces lung volume and lung elastic recoil [250], resulting in weaker
airway-parenchymal tethering and the collapse of dependent airways [289]. Thus, the
modest weight loss present at 5 weeks after surgery, which was accompanied by a
decrease in waist circumference (Table 3.1), was sufficient to reduce lung compression in
the supine position. Indeed, prior to weight loss, moving from an upright to supine
position increased Rrs,6 by 23.7 ± 11 %, while after surgery, the increase in Rrs was not
significant (Figure 3.3A).
The reduction in supine Rrs with weight loss measured at 19 Hz (Figure 3.2) may be due
to a greater increase in the caliber of the central airways. This is because Rrs at higher
oscillometry frequencies (Rrs,19) is usually dominated by the upper and central airways
while the effect of small peripheral airways on Rrs is normally undetectable unless there
is sufficient heterogeneous peripheral airway obstruction present [173]. It is possible that
with further weight loss larger changes in peripheral airway caliber might be detectable,
leading to improvements in Rrs at lower frequencies as well. In some severely obese
patients improvements in Rrs with weight loss might occur with resolution of upper
airway obstruction associated with obstructive sleep apnea [290]. Since the prevalence of
obstructive sleep apnea in severely obese patients presenting for weight loss surgery is
79
about 74 % [291], it is quite likely that some of our study participants may have had
undiagnosed sleep apnea that could possibly have improved with weight loss resulting in
improved sleep quality (Table 3.6).
The fact that we did not find any changes in spirometry but did with oscillometry may be
because oscillometry measures lung mechanics near FRC, and particularly in the supine
position, the effects may be greater than might occur during the forced exhalation
manoeuvres performed during spirometry. Surprisingly, even at 18-24 months,
spirometry appeared to be insensitive to weight-loss-induced improvements in upright
lung function as reported previously [9, 10], although Al-alwan et al reported slight
improvements in FEV1 and FVC at 12 months [11].
Weight loss affected the response to BD in our study participants. Prior to bariatric
surgery, inhalation of salbutamol did not result in significant reduction in Rrs measured
in the upright position or in spirometry values. This is consistent with the results of other
studies in obese individuals with asthma who demonstrated little or no change in
spirometry values following BD [105, 292]. In a study of obese subjects without
respiratory disease, less than 15 % of subjects demonstrated a positive BD response and
examining mean values, post BD FEV1% was only 0.25 % higher than pre BD FEV1%
[293]. We are the first group to publish data on the effect of weight reduction on BD
responsiveness in obese adults without asthma. Our results demonstrate that weight loss
is associated with an increased BD response in both oscillometric and spirometric indices
(Figure 3.5A and Table 3.3). Although the BD response in Rrs was increased to 17 %, it
was still within the normal range which is reported as an 11 % drop in Rrs [196]. This
response was also below traditional thresholds for reporting acute reversibility in both
spirometry (<12%) [45] and oscillometry (<33%) [196].
The lack of BD responsiveness before weight loss could be due to decreased airway-
parenchymal tethering forces with obesity [278]. Reduced tethering uncouples the airway
smooth muscle from the parenchyma and as a consequence, the airways fail to dilate with
BD. This same mechanism has been suggested in nocturnal asthma where the airway is
uncoupled from the parenchyma during sleep resulting in increased resistance that
persisted throughout sleep [294, 295]. Weight loss reduces lung compression and
80
accounts for the increase in FRC that we measured 5 weeks following bariatric surgery
(Table 3.4). This effect could partially restore airway-parenchymal coupling, resulting in
greater airway wall tension that would be responsive to bronchodilation. This may
explain the increased BD response recorded in the upright position as an increased
percent drop in post-BD Rrs following weight loss (Figure 3.5A), suggesting an increase
in central airway caliber.
Another explanation for the reduced BD responsiveness measured in the upright position
prior to weight loss surgery is that some of the bronchodilator may have been deposited
within the oropharynx despite the use of a metered dose inhaler and valved-holding
chamber in the administration of the drug. With weight loss, it is possible that there was a
reduction in the amount of redundant supraglottic oropharyngeal tissue which increased
BD deposition within the lung. However, this effect was likely modest since we found
that BD reduced Rrs and FEV1 in the supine position indicating successful BD delivery
to the lung. Regardless of the cause, reduced BD responsiveness is an important problem
for severely obese subjects with asthma since they are usually prescribed short acting
bronchial agonists for sudden symptoms. It is also possible that changes in systemic
inflammation with weight loss may have led to physiological changes in the airways.
Inflammation is associated with obesity and, in particular, increased secretion of pro-
inflammatory adipokines by the visceral adipose tissue is suggested to lead to airway
remodeling and bronchial hyperreactivity [1]. However, changes in inflammatory status
with weight loss is particularly associated with obese subjects who also have asthma [1],
whereas our study focused on subjects without asthma. Furthermore, progesterone has
been shown to potentiate BD-stimulated ASM relaxation [296], and it is down-regulated
in obesity [297], suggesting a possible mechanism for the reduced BD responsiveness at
baseline, since our study was limited to only female participants. Thus perhaps, even with
modest weight-loss, these hormonal and inflammatory mediators could have a functional
effect on lung mechanics. Nevertheless, our subjects were severely obese before bariatric
surgery and remained severely obese after surgery, despite significant weight loss.
In contrast to the upright position, supine Rrs was significantly reduced post-BD at all
frequencies before weight loss; however, only Rrs,6 was reduced post-BD after weight
81

loss (Figures 3.5B and 3.3A). Before weight loss, Rrs was highest in the supine position,
indicating narrowed airways that may be attributed largely to the central airways, as we
did not observe any frequency dependence indicative of small airways heterogeneity
[281]. Due to the inverse power relationship between radius and resistance, Rrs is
exquisitely sensitive to airway diameter. Thus, small changes in airway caliber can cause
large effects on Rrs. It is possible that despite diminished airway-parenchymal tethering
in obesity, the BD was able to induce central airway dilation in the supine position before
weight loss because of the reduced airway caliber. However, following weight loss, the
beta-agonist had little effect in dilating the airways in the supine position (Figure 3.5B),
since weight loss had already induced significant airway dilation in this position as
shown in Rrs,19 (Figure 3.2). Moving from upright to supine position can cause
significant changes in upper, and central airway geometries as well as changes to the lung
periphery [258, 279, 298]. Xrs is thought to be an indicator of airway closure [162, 254,
282] and is decreased in the supine position [258, 279, 298] consistent with our findings.
Xrs may also reflect changes in chest wall elastance that may occur with changes in
posture [299]. Interestingly, we found that the BD was very effective at reducing upright
and supine Ers after weight loss likely due to recruitment of small airways (Figures 3.3B
and 3.5B). The larger relative change in Ers compared to Rrs following weight loss may
mean a greater improvement in lung function due to recruitment of small airways with
weight loss.
The biggest effect of weight loss at baseline was the improvement in supine lung
mechanics which may help explain the improvements observed in sleep quality (Table
3.6). Eight (42%) out of the 19 subjects interviewed in this study reported mild to severe
breathing discomfort at baseline. However, after weight loss, only three (16%) of the
respondents reported any breathing difficulty in the month prior to examination. This is in
agreement with the findings of Oppenheimer et al where they reported that the
prevalence of respiratory symptoms such as dyspnea, wheeze and cough was greatly
reduced after weight loss [9]. A PSQI of 8.4±3.5 was measured at baseline in our cohort
and this is quite similar to the findings of Toor et al who reported a PSQI of 8.8 in their
cohort [271]. A global sleep score of ≤ 5 is associated with good sleep quality while a
global sleep score > 5 is associated with poor sleep quality [284]. The PSQI reduced to
82

6.5±3.7 following weight loss surgery (Table 3.6), unlike the findings of Toor et al [271]
where global sleep score reduced to ≤ 5, although their follow-up assessment was
conducted after much greater weight loss was achieved at 3-6 months after bariatric
surgery. Nevertheless, even with modest weight loss at 5 weeks, there were significant
improvements in PSQI that was highly correlated with the reduction in Rrs,19 measured
in the supine position. In fact, about 51% of the variance in the improvement in sleep
quality was accounted for by the reduction in supine Rrs,19 suggesting that breathing
discomfort due to narrowing of upper and central airways in the supine position may
contribute more to poor sleep quality than previously thought.
We have shown that the assessment of lung mechanics with oscillometry in the supine
position or with BD was sensitive to early changes in lung function associated with
modest weight loss following bariatric surgery while spirometry and plethysmography,
except for FRC, was not. Weight loss likely improved lung mechanics by restoring the
airway-parenchymal tethering forces in the supine position and likely helps explain
improvements in sleep quality. In addition, the tethering forces were likely sufficiently
restored to allow the BD to dilate the airways even after weight loss. These findings
demonstrate the sensitivity of oscillometry and that improvements in lung mechanics
occur early after weight loss surgery improving sleep quality.
83
Chapter 4: Improvement in upright and supine lung mechanics with
bariatric surgery: sleep quality and bronchodilator responsiveness
84

4.1 Abstract
Introduction: Obesity is associated with respiratory symptoms such as wheezing and
dyspnea, but its effect and the effect of weight loss on lung function particularly in the
supine position is insufficiently documented.
Methods: We evaluated fifteen severely obese female participants (mean±SD BMI
48.2±6.0 kg/m2) using spirometry, plethysmography, Pittsburgh Sleep Quality Index
(PSQI), and oscillometry to obtain various indices of lung mechanics including
respiratory system resistance (Rrs,6, Rrs,11 and Rrs,19) and elastance (Ers). These tests
were conducted in the upright and supine position, and pre- and post-bronchodilation
with 200 µg of salbutamol before, and 5 weeks and 6 months after bariatric surgery.
Results: An average weight loss of 11.9±2.7kg was recorded at the 5 week-postoperative
assessment but this had no significant effect on respiratory mechanics. Six months after
surgery, a 21.4±7.1kg weight loss was associated with a 14.1±6.1% reduction in Rrs,6
and a 25.7±9.4% reduction in Ers measured in the upright position, with no significant
changes in spirometry. Similar changes in Rrs and Ers were recorded in the supine
position and the sleep quality of study participants improved from a PSQI of 8.4±3.5 to
4.1±2.9. The reduction in Rrs and Ers induced by weight loss was comparable to that
produced by salbutamol. Furthermore, the frequency dependence of Rrs was modestly
reduced with weight loss indicating reduced heterogeneity. Fits of respiratory impedance
spectra to a mathematical model suggests reduced resistance in the central and peripheral
airways as well as reduced stiffness in the peripheral airways.
Conclusion: Respiratory mechanics during tidal breathing were more greatly affected by
weight loss than the mechanics of forced expiration, likely due to both airway recruitment
and reduced chest wall stiffness. Our findings provide new evidence that severely obese
subjects may have poor sleep quality due to poor respiratory mechanics but weight loss
reverses these changes.
Keywords: Oscillometry (Forced oscillation technique); Obesity; Body mass index;
Lung function; Lung mechanics; Bronchial reversibility; Sleep quality.
85

4.2 Background
Obesity is associated with respiratory symptoms like wheeze [22], dyspnea [23],
orthopnea [13], and sleep disturbances [271]. These symptoms can be difficult to treat
with bronchodilators but improvements have been widely reported with weight loss [6,
300]. However, spirometry often shows little or no change in lung function with weight
loss [9-11, 300]. This lack of insight from spirometry has made it challenging to explore
the mechanisms that link obesity and weight loss to changes in lung function.
Furthermore, lung function is typically assessed in the upright position but the respiratory
symptoms of obesity worsen in the supine position [13], and this is thought to contribute
to sleep disturbances [271].
Mechanically, the lung is compressed in obesity and this causes a number of changes in
lung mechanics and function, including a reduction in lung volumes, particularly, the
functional residual capacity (FRC) [147, 242, 279]. The changes in lung mechanics
include: an increase in respiratory system stiffness and a reduction in the diameter of the
airways [245]. These changes can be indirectly assessed from respiratory system
resistance (Rrs) and reactance (Xrs) using oscillometry. We recently used oscillometry to
study the effects of modest weight loss induced by bariatric surgery [300]. We found
significant changes in supine Rrs as early as 5 weeks after bariatric surgery and these
changes correlated strongly with improvements in sleep quality. Interestingly, however,
we found no other significant changes in respiratory system mechanics measured in the
upright position, and similarly no changes in spirometric outcomes [300]. While the
effects of weight loss on supine respiratory mechanics have never been probed,
improvements in oscillometry outcomes (Rrs and Xrs) obtained in the upright position
have been consistently reported after 12-24 month of bariatric surgery-induced weight
loss [9-11].
Here, because of the likely importance of supine respiratory mechanics to sleep quality,
and because it had not been previously investigated, we were interested in tracking the
progress of the changes in respiratory system mechanics with weight loss in the supine
position, and to assess these changes in comparison to the changes in upright respiratory
mechanics. Lastly, we wanted to assess the changes in airway heterogeneity using the
86

frequency dependence of Rrs, and also the role of weight-loss-induced restoration of
airway-parenchymal tethering on bronchodilator responsiveness. Thus, we evaluated the
effect of weight loss on sleep quality and respiratory system mechanics at the 6 month-
postoperative assessment using the PSQI, oscillometry, spirometry, and
plethysmography, and we compared the results obtained to weight-changes recorded at
the 5 week-postoperative assessment.
4.3 Methods
4.3.1 Selection of study participants and consent
Twenty four severely obese individuals without a diagnosis of asthma or other lung
diseases were recruited into the study from the bariatric surgery clinic at the Queen
Elizabeth II Health Sciences Centre. Of this, 5 subjects were lost to follow-up at 5-weeks
while 4 were lost to follow-up at 6 months. This study was approved by the Nova Scotia
Health Authority Research Ethics Board (reference number: CDHA-RS/2012-109). All
participants provided written informed consent to participate in the study and consented
to have their data published.
4.3.2 Inclusion and exclusion criteria
Inclusion criteria were the presence of severe obesity defined as body mass index (BMI)
greater than 40 kg/m2 and scheduled bariatric surgery. Exclusion criteria were: BMI less
than 40 kg/m2, physician diagnosis of chronic lung disease (including asthma and chronic
obstructive pulmonary disease), smoking history of more than 10 pack years, inability to
lie on the back for up to 10 minutes, inability to perform PFTs acceptably, and cognitive
limitations that prevented completion of sleep questionnaire. Subjects who did not show
up for their follow-up appointments were also excluded from the study.
4.3.3 Study design
This prospective observational study includes assessments performed prior to bariatric
surgery and post-operative assessments at 5 weeks and 6 months. Some of the data
obtained at baseline and 5 weeks after bariatric surgery have been previously published
87
[300]. During follow-up, sleep quality was reassessed and plethysmography, spirometry
and oscillometry were repeated. Spirometry and oscillometry was performed in the
upright and supine position, and pre- and post-bronchodilation (BD). The testing
sequence for the measurements conducted has been described previously in Chapter 3
(Figure 3.1).
4.3.4 Sleep quality questionnaire
Sleep quality was reassessed using the Pittsburgh Sleep Quality Index (PSQI) with
permission from Buysse and coworkers [284]. Briefly, the PSQI is a 19-item
questionnaire that provides validated measurements of sleep disturbance and usual sleep
habits in the previous month. The questions are grouped into seven components that
analyze various aspects of sleep quality such as: subjective sleep quality, sleep latency,
sleep duration, habitual sleep quality, sleep disturbances, use of sleep medication and
daytime dysfunction due to sleepiness. Respondents rated their sleep quality as “very
good,” “fairly good,” “fairly bad” or “very bad” and this represented a score of 0, 1, 2, or
3, respectively. The PSQI also assessed various factors that disrupt sleep including
breathing discomfort, waking up to use the bathroom, coughing or snoring loudly, feeling
too hot or cold, having bad dreams and experiencing pain. The global sleep score is
calculated as the sum of the seven components that make up the PSQI. A score of ≤ 5
was associated with good sleep quality while a score > 5 was associated with poor sleep
quality. Responder analysis of the PSQI was also performed by estimating the number of
subjects that reported good sleep quality at baseline, 5 weeks after surgery, and at 6
months after surgery.
4.3.5 Anthropometric measurements
Weight and height were measured using a calibrated scale and stadiometer and used in
calculating BMI.
4.3.6 Pulmonary function tests
Spirometry and whole-body plethysmography were performed according to
recommended international guidelines [127, 285], using a calibrated spirometer-equipped
body plethysmograph (SensorMedics Corporation, Yorba Linda, CA, USA). Forced
88

expiratory flows, including forced expiratory volume in 1 s (FEV1) and expiratory flow at
50 % (FEF50), 75 % (FEF75), and 25% – 75 % (FEF25–75) of vital capacity (VC) were
obtained. Lung volumes and capacities, including residual volume (RV), expiratory
reserve volume (ERV), FRC (estimated as the sum of RV and ERV), inspiratory capacity
(IC) and TLC (estimated as the sum of FRC and IC) were also measured. The lowest
residual volume (RV); the average ERV, FRC and TLC; and the best VC and forced
expiratory flows were selected as the final result from three technically acceptable
measurements and expressed as percentages of predicted values from Crapo and
colleagues [73].
4.3.7 Oscillometry
Respiratory system impedance was measured according to recommended guidelines
[286] using the tremoFloTM airwave oscillometry system (Appendix G, Thorasys
Thoracic Medical Systems Inc., Montreal, QC, Canada). This technique has been
described in detail previously [300]. Briefly, a multi-frequency composite oscillatory
pressure waveform of about 1-2 cm H2O was generated by the oscillometry device and
superimposed on a subject’s spontaneous breathing at 6, 11 and 19 Hz for 16 s. The
impedance of the respiratory system (Zrs) to the resulting flow oscillations was then
estimated from the spectral ratio of the pressure and flow signals measured at the mouth.
Respiratory system resistance (Rrs) and reactance (Xrs) were computed at each frequency
by separating Zrs into its in-phase component of the pressure and flow and 90 degrees
out-of-phase component of the pressure and flow, respectively. The frequency
dependence of Rrs, which is an indicator of airway heterogeneity, was computed by
subtracting Rrs,19 from Rrs,6, that is: Rrs,6 minus Rrs,19. Predicted Rrs and Xrs was
also computed using each subject’s age, height, sex and ideal body weight using
reference equations published by Oostveen and colleagues [196]. Xrs measured at 6 Hz
was used in estimating respiratory system elastance (Ers) using the relationship: 𝐸𝐸𝐸𝐸𝐸𝐸 =
−𝜔𝜔𝜔𝜔𝐸𝐸𝐸𝐸, 6, where ω is the angular frequency (f), mathematically expressed as: 𝜔𝜔 = 2𝜋𝜋𝜋𝜋.
4.3.8 Mathematical modeling of respiratory system impedance
To investigate changes in central versus peripheral lung mechanics, we employed the
two-compartment series model originally developed by Mead et al [301], and recently
89

applied by Al-Alwan et al to study lung mechanics in obese subjects [11]. The model was
fit to respiratory system impedance spectra measured before and after weight loss surgery
in order to obtain the parameters of the respiratory system using MATLAB R2016a
(Mathworks Inc., Natick, Mass., USA). The model consists of a series arrangement of an
upper airway resistance, representing central resistance (Rc), and an upper airway
compliance, representing central compliance (1/Ec) connected through a single peripheral
airway, representing the peripheral resistance (Rp), to peripheral compliance (1/Ep) to
account for the alveolar compartments (Figure 4.1) [301]. The upper compartment
pathway impedance (Z1) included a central inertance (Ic) and is described by Equation
4.1, while the lower compartment impedance (Z2) is described by Equation 4.2 as shown
below.
Figure 4.1. Schematic illustration of the series two-compartment model of the lung.
1 2Z Rc i fIcπ= + (4.1)
22
EpZ Rp i
fπ= − (4.2)
Also included in the upper compartment was an impedance Z3, representing the elastance
of the central airways (Ec) as shown in Equation 4.3 below.
90

3 2EcZ i
fπ= − (4.3)
The total static elastance (Etotal) was computed as the parallel sum of Ec and Ep as
shown in Equation 4.4, assuming zero-flow conditions.
c p
c p
E EEtotal
E E=
+ (4.4)
Z1 was added to the parallel sum of Z2 and Z3 to obtain the total impedance (Ztotal) of the
model as shown in Equation 4.5.
2 31
2 3
Z ZZtotal ZZ Z
= ++
(4.5)
We also calculated the coefficient of determination (CD) in order to determine the
goodness of fit of the model impedance to the measured impedance spectra and CD
greater than 0.95 was used as an acceptance criterion.
4.3.9 Bronchial reversibility test
Lung mechanics were assessed before and 15 minutes after relaxation of airway wall
tension with inhalation of 200 µg of the short-acting β2-adrenergic agonist–salbutamol
delivered through a pressurized metered-dose inhaler and valved-holding chamber
(CareStream Medical Ltd, Pickering, ON, Canada).
4.3.10 Bariatric surgery
All subjects underwent a laparoscopic sleeve gastrectomy, a minimally invasive
procedure that results in the complete removal of about 85% of the stomach. The
postoperative diet regimen consisted of 4–6 weeks of a high-protein, semiliquid diet,
followed by a return to a normal diet.
4.3.11 Statistical analyses
Results are expressed as means ± standard deviation (SD) unless specified otherwise.
Normality of data was determined with Shapiro-Wilk test and normality plots. Weight,
height, BMI, PSQI, and plethysmography data obtained before and at 5 weeks and 6
91
months after bariatric surgery were analyzed using a 1-way repeated-measures analysis of
variance (ANOVA) with 3 levels (i.e before surgery, 5 weeks after surgery, and 6 months
after surgery). The effects of position and bronchodilation on spirometry results were
analyzed using 2-way repeated-measures ANOVA with time and intervention (position
plus bronchodilation) as factors. Time was divided into 3 levels (i.e before surgery, 5
weeks after surgery, and 6 months after surgery), and intervention was divided into 4
levels (i.e upright pre-BD, supine pre-BD, upright post-BD, and supine post-BD). The
same procedure was repeated for oscillometry results at each frequency. When
significance was found, separate post hoc pair-wise testing was performed with a
Student’s t test to identify differences caused by weight loss surgery, position, or BD and
the Benjamini-Hochberg procedure was applied to control the effect of multiple
comparisons [288]. Statistical analyses were performed in IBM Statistics for Windows,
version 22.0 (IBM Corporation, Armonk, NY, USA) and p-values < 0.05 were
considered statistically significant.
4.4 Results
4.4.1 Demographics and obesity parameters
Twenty four severely obese individuals were recruited into the study through the
informed consent process. Demographics and anthropometric data from 15 study
participants that completed the study protocol are presented in Table 4.1. Bariatric
surgery significantly reduced the weight and BMI of the participants with an average
weight loss of 11.9 ± 2.7 kg and 21.4 ± 7.1 kg recorded at the 5 week- and 6 month-
postoperative assessments, respectively.
4.4.2 Lung function before and after bariatric surgery
At baseline, FEV1, FVC, PEF and other spirometric parameters, expressed as percentages
of predicted, were within normal limits (Figure 4.2). Weight loss did not induce any
significant changes in any of the spirometric parameters at the 5 week- or 6 month-
postoperative assessment.
92

4.4.3 Lung volumes before and after bariatric surgery
Similar to the spirometry outcomes reported above, TLC, VC and IC, were also within
normal limits at baseline but RV, ERV and FRC were below the range of expected values
(Figure 4.3). With the exception of FRC, weight loss was not associated with any
significant changes in these lung volumes at the 5 week- or 6 month-postoperative
assessment (Figure 4.3). Weight loss was associated with an increase in FRC of 8.1 ± 3.8
% and 13.4 ± 3.9 % from baseline at 5 weeks and 6 months, respectively.
Table 4.1. Demographics and anthropometric characteristics of study participants.
Baseline 5 weeks After Surgery
6 months After Surgery
p-value
Sex (Females, Males) 15, 0
Age (years) 45.5 ± 7.0
Mean weight (kg) 125.7 ± 18.0 113.7 ± 17.3 104.3± 15.4 < 0.001
Mean BMI (kg/m2) 48.2 ± 6.0 43.7 ± 6.1 40.1 ± 5.7 < 0.001
Avg weight loss (kg) na 11.9 ± 2.7 21.4 ± 7.1
% of initial weight lost na 9.6 ± 2.3 16.9 ± 5.2
BMI, body mass index; Avg, average; na, not applicable. Data are expressed as means ± SD. p < 0.05 was considered statistically significant.
4.4.4 Effect of weight loss and bronchodilation on oscillometry outcomes
The effect of weight loss on Rrs measured in the upright position is shown in Figure
4.4A. Upright Rrs measured at 5 weeks after bariatric surgery was not significantly
different from baseline at any oscillation frequency. However, with further weight loss,
there was a significant drop across all oscillation frequencies at 6 months, approaching
the mean predicted Rrs estimated from the participants’ ideal body weights, particularly
at Rrs,19 (Figure 4.4A).
Similar results were observed in Xrs obtained in the upright position. At baseline, upright
Xrs was quite negative and well below the predicted Xrs (Figure 4.4B). Weight loss had
93

no significant effect on upright Xrs at the 5 week-postoperative assessment. However, at
6 months, a significant increase in Xrs,6 and Xrs,11 was observed and the Xrs versus
oscillation frequency curve moved towards the predicted Xrs.
Figure 4.2. Spirometric measures before and after weight loss presented as percent predicted. Error bars indicate SE. FVC, forced vital capacity; FEV1, forced expiratory volume in 1 s; FEV1/FVC; ratio of forced expiratory volume in 1 s to forced vital capacity; PEF, peak expired flow; FEF25-75, forced expiratory flow between 25% and 75% of FVC; FEF50, forced expiratory flow at 50% of FVC; FEF75, forced expiratory flow at 75% of FVC.
As previously reported, supine Rrs significantly reduced at the 5 week-postoperative
assessment but only at the 19 Hz oscillation frequency [300]. Here, we found that further
weight loss at 6 months led to greater reductions in supine Rrs across all oscillation
frequencies (Figure 4.4C). Also, moving to the supine position shifted the Rrs versus
oscillation frequency curve upwards (Figures 4.4A and 4.4C). Compared to Xrs measured
in the upright position, supine Xrs was much more negative at baseline and weight loss
20
60
100
FVC FEV1 FEV1/FVC PEF FEF25-75 FEF50 FEF75
Per c
ent P
redi
cted
Before Weight Loss5 weeks post-op6 months post-op
0
94

had no significant effect at the 5 week-postoperative assessment (Figure 4.4D).
Interestingly, weight loss induced significant increases in supine Xrs,6 and Xrs,11 at 6
months but similar to the upright position (Figure 4.4B), supine Xrs,19 was not
significantly affected. These improvements in supine Rrs and Xrs with weight loss were
found to be comparable to the improvements recorded in the upright position, with the
only exception being Rrs,19 which improved more in the supine position
Figure 4.3. Plethysmography outcomes before and after weight loss presented as percent predicted. Error bars indicate SE. TLC, total lung capacity; RV, residual volume; VC, vital capacity; IC, inspiratory capacity; ERV, expiratory reserve volume; FRC, functional residual capacity. *, p < 0.05.
Figure 4.5 shows the percent change in key oscillometry outcomes and FEV1 produced
by weight loss in the upright and supine positions. Weight loss induced a 14.1 ± 6.1 %
reduction in upright Rrs,6 and a 25.7 ± 9.4 % reduction in upright Ers at the 6 month-
postoperative assessment but FEV1 only demonstrated a 4.6 ± 2.8 % increase in the
upright position (Figure 4.5) and this increase was not statistically significant. Compared
to the upright position, weight loss was also associated with a greater reduction in supine
**
40
60
80
100
120
TLC RV VC IC ERV FRC
Percent Predicted
Baseline
5-Weeks Post-Surgery
6-Months Post-Surgery
0
95

Rrs,19 of 23.4 ± 6.7 % (p = 0.040) (Figure 4.5). Supine Rrs,6 and Ers also reduced by
17.8 ± 5.4 % and 20.2 ± 7.2 % but these reductions were not statistically different from
the percent reductions reported above for the upright position (Figure 4.5).
Figure 4.4. Changes in Rrs and Xrs measured in the upright (A & B) and supine positions (C & D) before and after bariatric surgery. Note that improvements in upright Rrs and Xrs only occur at the 6 month post-op assessment, while improvements in supine Rrs occurred as early as 5 weeks after bariatric surgery. Error bars indicate SE. Rrs, respiratory system resistance; Xrs, respiratory system reactance. ††, p < 0.01 at 5 week post-op assessment and **, p < 0.01 at 6 month post-op assessment compared to baseline.
**** **
0
2
4
6
0 5 10 15 20
Rrs (cm H20/(L·s-1 ))
Frequency (Hz)
Baseline5-wk Post-op6-month post-opPredicted Rrs
A
††
** ** **
0
2
4
6
0 5 10 15 20Rrs (cm H2O/(L·s-1 ))
Frequency (Hz)
Baseline5 week post-op6 months post-op
C
**
**
-4
-3
-2
-1
0
1
0 10 20
Xrs (cm H20/(L·s-1 ))
Frequency (Hz)
B
**
**
-4
-3
-2
-1
0
1
0 5 10 15 20
Xrs (cm H20/(L·s-1 ))
Frequency (Hz)
D
96
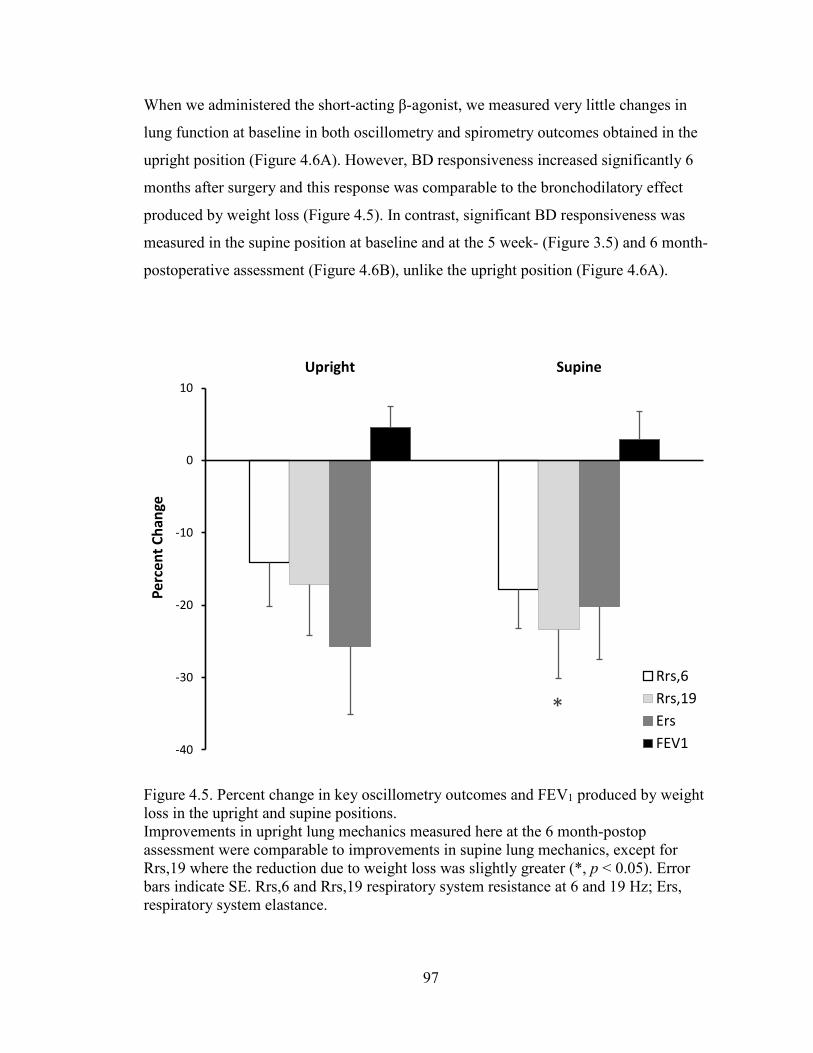
When we administered the short-acting β-agonist, we measured very little changes in
lung function at baseline in both oscillometry and spirometry outcomes obtained in the
upright position (Figure 4.6A). However, BD responsiveness increased significantly 6
months after surgery and this response was comparable to the bronchodilatory effect
produced by weight loss (Figure 4.5). In contrast, significant BD responsiveness was
measured in the supine position at baseline and at the 5 week- (Figure 3.5) and 6 month-
postoperative assessment (Figure 4.6B), unlike the upright position (Figure 4.6A).
Figure 4.5. Percent change in key oscillometry outcomes and FEV1 produced by weight loss in the upright and supine positions. Improvements in upright lung mechanics measured here at the 6 month-postop assessment were comparable to improvements in supine lung mechanics, except for Rrs,19 where the reduction due to weight loss was slightly greater (*, p < 0.05). Error bars indicate SE. Rrs,6 and Rrs,19 respiratory system resistance at 6 and 19 Hz; Ers, respiratory system elastance.
*
-40
-30
-20
-10
0
10Upright Supine
Perc
ent C
hang
e
Rrs,6Rrs,19ErsFEV1
97

Figure 4.6. Percent change in key oscillometry outcomes and FEV1 produced by bronchodilator in the upright (A) and supine positions (B) before and 6 months after weight loss surgery. Error bars indicate SE. Rrs,6 and Rrs,19 respiratory system resistance at 6 and 19 Hz; Ers, respiratory system elastance.
-30
-20
-10
0
10Baseline After weight loss
Perc
ent C
hang
e
A
Rrs,6Rrs,19ErsFEV1
-30
-20
-10
0
10Baseline After weight loss
Perc
ent C
hang
e
B
Rrs,6Rrs,19ErsFEV1
98
4.4.5 Improvements in sleep quality with weight loss
Previously, we reported that weight loss was associated with significant improvements in
sleep quality at the 5 week-postoperative assessment [300]. However, our participants’
sleep quality was still rated as poor because their global sleep score was above the
threshold for good sleep quality. According to the PSQI, a global sleep score > 5 is
associated with poor sleep quality, whereas a global sleep score ≤ 5 is associated with
good sleep quality [284]. At the 6 month-follow-up assessment, however, we measured
greater improvements in sleep quality and the global sleep score of our participants
exceeded the threshold for good sleep quality (Table 4.2). Subjects reported significant
improvements in their subjective sleep quality, sleep latency, sleep duration, habitual
sleep efficiency, sleep disturbances, and daytime dysfunction, but they reported no
significant changes in their use of sleeping medication.
Responder analysis of the PSQI revealed that only 10.5% of subjects reported good sleep
quality at baseline but this increased to 47.4% at the 5 week-postoperative assessment.
This proportion continued to increase with further weight loss reaching 80% at the 6
month-postoperative assessment.
4.4.6 Mathematical model of changes in respiratory impedance
Figure 4.7A-D shows weight-induced changes in the mechanical parameters of the
respiratory system obtained from fitting the series two-compartment model (Figure 4.1)
to respiratory impedance spectra measured before and after weight loss. Weight loss had
no significant effect on Ec but Ep reduced significantly and this led to a significant
reduction in Etotal (Figure 4.7A). Similarly, weight loss caused Rc and Rp to decrease
significantly (Figure 4.7C and 4.7D) but Ic was unaffected (Figure 4.7B).
4.4.7 Changes in frequency dependence of Rrs with weight loss
We were interested in knowing whether the frequency dependence of Rrs improved in
subjects who exhibited definitive frequency dependence at baseline. Thus, we also
quantified the changes in frequency dependence of Rrs induced by weight loss in subjects
whose Rrs,6 minus Rrs,19 reached a critical threshold of 0.2 cm H2O/(L·s-1), which
99
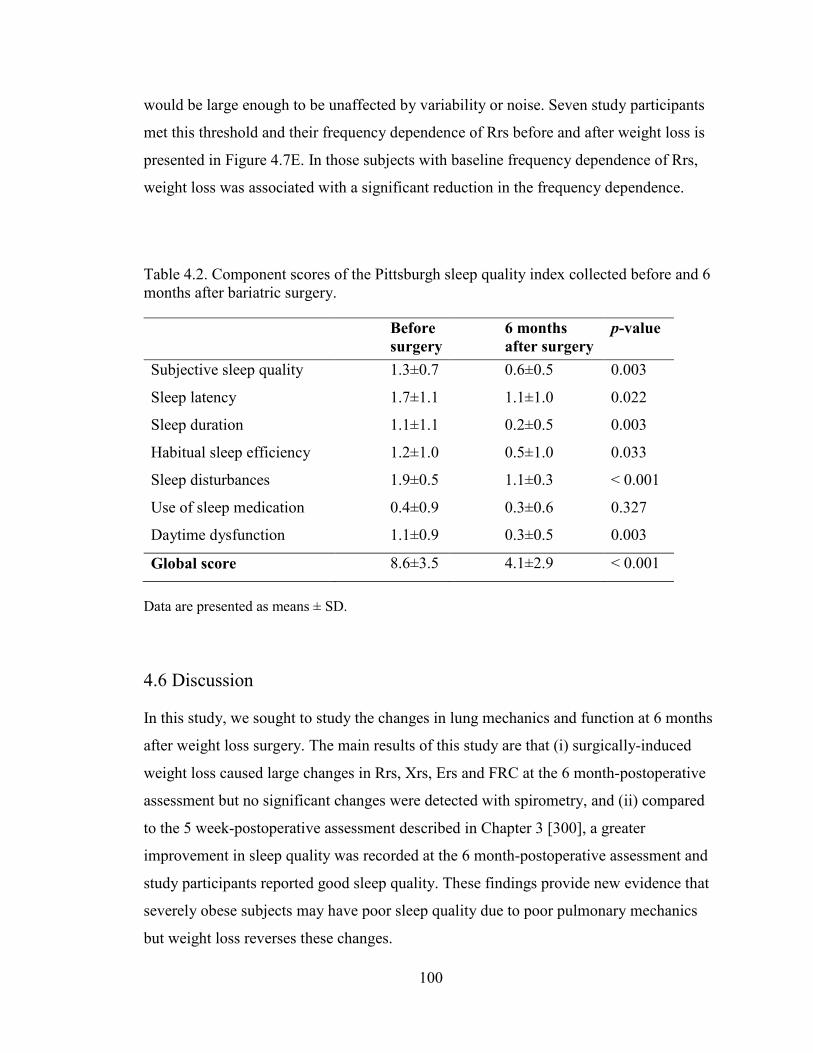
would be large enough to be unaffected by variability or noise. Seven study participants
met this threshold and their frequency dependence of Rrs before and after weight loss is
presented in Figure 4.7E. In those subjects with baseline frequency dependence of Rrs,
weight loss was associated with a significant reduction in the frequency dependence.
Table 4.2. Component scores of the Pittsburgh sleep quality index collected before and 6 months after bariatric surgery.
Before surgery
6 months after surgery
p-value
Subjective sleep quality 1.3±0.7 0.6±0.5 0.003
Sleep latency 1.7±1.1 1.1±1.0 0.022
Sleep duration 1.1±1.1 0.2±0.5 0.003
Habitual sleep efficiency 1.2±1.0 0.5±1.0 0.033
Sleep disturbances 1.9±0.5 1.1±0.3 < 0.001
Use of sleep medication 0.4±0.9 0.3±0.6 0.327
Daytime dysfunction 1.1±0.9 0.3±0.5 0.003
Global score 8.6±3.5 4.1±2.9 < 0.001
Data are presented as means ± SD.
4.6 Discussion
In this study, we sought to study the changes in lung mechanics and function at 6 months
after weight loss surgery. The main results of this study are that (i) surgically-induced
weight loss caused large changes in Rrs, Xrs, Ers and FRC at the 6 month-postoperative
assessment but no significant changes were detected with spirometry, and (ii) compared
to the 5 week-postoperative assessment described in Chapter 3 [300], a greater
improvement in sleep quality was recorded at the 6 month-postoperative assessment and
study participants reported good sleep quality. These findings provide new evidence that
severely obese subjects may have poor sleep quality due to poor pulmonary mechanics
but weight loss reverses these changes.
100

Figure 4.7. Parameters of the two-compartment series model of the respiratory system before and weight loss at 6 months (Panels A – D).
***
**
0
20
40
60
80
100
Ec Ep Etotal
cmH 2
O.L
-1Before Weight Loss
After Weight LossA
0
0.002
0.004
0.006
0.008
0.01
0.012
Ic
cm H
2O/(
L/s2 )
B **
0
1
2
3
4
5
6
Rc
cm H
2O/(
Ls-1
)
C
**
0
0.2
0.4
0.6
0.8
1
1.2
1.4
Rp
cm H
2O/(
Ls-1
)
D**
0
0.2
0.4
0.6
0.8
1
1.2
Rrs,6 – Rrs,19
cm H
2O/(
Ls-1
)
E
101
Panel E shows the frequency dependence of Rrs computed by subtracting Rrs,19 from Rrs,6 in seven subjects that demonstrated substantial frequency dependence at baseline. Ec, central elastance; Ep, peripheral elastance; Etotal, total elastance; Ic, central inertance of air column; Rc, central resistance; Rp, peripheral resistance; Rrs,6, respiratory system resistance at 6 Hz; Rrs,19, respiratory system resistance at 19 Hz. Error bars indicate SE. **, p < 0.01.
The association between weight loss and improvements in lung mechanics in the upright
position has been consistently reported in previous studies at 12-24 months after weight-
loss surgery [9-11]. To the best of our knowledge, we are the first group to study the
effect of weight loss on lung mechanics in both upright and supine positions and at earlier
time points [300]. We specifically investigated the effect of weight loss at earlier time
points because most of the surgically-induced weight loss typically occurs within the first
5 weeks to 6 months following bariatric surgery. Thus, although the weight loss achieved
by our study participants at the end of the study period was slightly smaller than those
reported in previous studies [9, 11], we can show that the weight loss led to dramatic
improvements in both upright and supine lung mechanics.
At baseline, respiratory system resistance was significantly higher than the predicted Rrs
in the upright position (Figure 4.4A) in agreement with earlier studies which concluded
that the increase was due to lung compression and narrower airways in obesity [11]. Six
months after bariatric surgery, the resultant 21.4 ± 7.1 kg weight loss was associated with
a significant reduction in both upright and supine Rrs measured at all the oscillation
frequencies (Figure 4.4A and 4.4C), suggesting reversal of airway narrowing and an
overall improvement in breathing mechanics. Further analysis revealed that the
bronchodilation induced by weight loss (Figure 4.5) was substantial, and was comparable
to the bronchodilatory response that was induced by salbutamol at the end of the study
period (Figure 4.6). Rrs,19 was particularly close to the predicted Rrs at the 6 month-
postoperative assessment suggesting normalization of upper and central airway caliber.
This implies greater improvement in upper and central airways because Rrs at high
oscillometry frequencies (Rrs,19) largely reflects these sources, whereas the effect of the
small peripheral airways on Rrs is normally undetectable unless significant
heterogeneous peripheral airway obstruction is present [173].
102

While Rrs,6 was significantly greater than Rrs,19 in our obese subjects, which could be
indicative of peripheral airway heterogeneity, this was not as large as that reported in
other studies [9, 11]. However, we did find a significant reduction in the frequency
dependence of Rrs with weight loss (Figure 4.7E) in individuals with observable
frequency dependence at baseline. Since frequency dependence is an index of peripheral
airway heterogeneity, this indicates the presence of heterogeneous obstruction of the
small airways, but this reduced after weight loss. Notably, using the series two
compartment model, Rp was significantly reduced after weight loss, potentially
indicating airway recruitment as described by Al-Alwan et al [11]. Frequency
dependence of Rrs is caused by heterogeneous obstruction of the small airways in the
lung periphery, and is a hallmark feature of asthma [158, 173, 302-304]. However, in this
study, the degree of heterogeneity was likely modest in all subjects. Furthermore, our
subjects did not have asthma and none reached the clinical threshold for positive
bronchial reversibility in response to BD. Similar studies on obese subjects without
asthma do show larger frequency dependence of Rrs [9, 11, 305] than our study. This
could be due to our small sample size, or differences in the sensitivity to frequency
dependence in oscillometry devices. Oostveen et al. (2013) noted that one of the more
common oscillometry devices demonstrated a larger frequency dependence than three
other devices used in their study. Although the differences between devices were small,
they might arise due to differences in the perturbation waveforms employed [196, 197]
and could have contributed to frequency dependence of Rrs in other studies [9, 11, 305].
Weight loss was also associated with a significant increase in upright and supine Xrs but
only at the 6 and 11 Hz frequencies (Figure 4.4B and 4.4D). Similar to the frequency
dependence of Rrs, Xrs is thought to be a sensitive indicator of peripheral airway closure
and respiratory system stiffness [162, 254, 282]. At baseline, Xrs was highly negative and
well below the predicted Xrs in both upright and supine positions (Figure 4.4B and 4.4D)
and this could be due to collapse and closure of small airways in the lung periphery. In
fact, Xrs measured in the supine position at low oscillation frequencies was comparable
to results obtained from individuals with moderately severe asthma [167]. With weight
loss, Xrs,6 and Xrs,11 in both upright and supine positions increased indicating a
reduction in the stiffness of the respiratory system.
103

While the highly negative Xrs (Figure 4.4B and 4.4D) and large Ep (Figure 4.7A) and
their significant improvement could be attributed to peripheral airway recruitment, this
change in elastic properties could also be due in part to changes in chest wall stiffness
which is thought to be increased in obesity [145, 247]. Indeed, for peripheral airway
heterogeneity and recruitment to play a large role in our obese subjects, we would expect
larger and comparable changes in the magnitude of Rrs,6–Rrs,19 to changes in the
magnitude of Xrs. However, the baseline frequency dependence was modest, as was its
decrease with weight loss and this may mean that changes in chest wall stiffness with
weight loss may have played a more substantial part. If true, then the role of the changes
in chest wall stiffness with weight loss may have been less appreciated previously [11].
Although the series model differentiates between central and peripheral lung
compartments, these compartments are individually homogeneous, and both must
account for the chest wall elastance which is part of the total respiratory system
impedance. Thus, changes in chest wall cannot be easily differentiated from changes in
Ep.
Nevertheless, the notion that there might be peripheral airway recruitment with weight
loss is further supported by evidence of a 13.4 ± 3.9 % increase in FRC with weight loss
(Figure 4.3), consistent with other findings in the literature [162, 282]. However, this
might also be due to changes in the mechanical balance of components of the respiratory
system as well as changes in the chest wall. Thus, since Rrs,6 minus Rrs,19 decreased
with weight loss in some subjects, it is likely that weight loss induced some airway
recruitment; however, as this was modest relative to the changes in Xrs, we believe the
contribution of chest wall mechanics to the improved pulmonary mechanics may be more
important.
Obesity affects the forces of mechanical interdependence between the airway and
parenchyma [245, 278]. Using oscillometry, we explored how weight loss changed the
balance of forces between the airway and parenchyma using two approaches, viz: (i)
increased lung compression caused by the supine position, and (ii) by reducing airway
smooth muscle tone to induce bronchodilation with inhaled salbutamol. Figures 4.4A and
4.4C show that moving to the supine position increased Rrs as a result of a significant
104
reduction in the caliber of the airways due to mechanical compression of the lungs. The
shift to more negative Xrs recorded when subjects moved to the supine position (Figures
4.4B and 4.4D) further supports the notion of mechanical compression of the lung in
obesity, since both involve shifts in abdominal mass in the thorax. With both obesity and
the supine position, the Xrs at baseline is at its most negative, and obesity likely amplifies
increases in chest wall stiffness, especially in the supine position [299] which results in a
worsening of breathing mechanics in these subjects. The reduction in lung volume leads
to attenuation of tethering forces between the parenchyma and the airways [245], and this
consequently leads to potential derecruitment of small airways in the parenchyma as
previously reported [258, 279, 298]. Interestingly, weight loss appears to restore airway-
parenchymal tethering forces, illustrated by the increased responsiveness to BD, at least
in the upright position (Figure 4.6) [300], as well as improvements in multiple measures
of lung mechanics including Rrs,6, and Ers (Figure 4.4 and Figure 4.5), echoed by
improvements in model parameters Rc, Rp and Ep (Figure 4.7E).
The worsening of lung mechanics in the supine position likely contributes to the severity
of sleep-disordered breathing and poor sleep quality in obesity. We previously found a
strong correlation between improvements in supine Rrs,19 and improvements in sleep
quality following a modest 11.5 ± 2.5 kg weight loss at the 5 week-postoperative
assessment [300]. However, despite the improvements in sleep quality, the global sleep
score of our subjects was 6.5 ± 3.7 at the end of the 5-week study period. According to
the PSQI, a global sleep score > 5 is associated with poor sleep quality, whereas a global
sleep score ≤ 5 is associated with good sleep quality [284]. Here, with greater weight
loss, the global sleep score of our subjects improved to 4.1 ± 2.9. Thus, our study
participants achieved good sleep quality at the 6 month-postoperative assessment only
after much greater weight loss. This result is consistent with the findings of Toor et al
who also found improvements in sleep quality after much greater weight loss was
achieved at 3-6 months following bariatric surgery [271] but they did not measure
respiratory mechanics or lung function.
One of the main limitations of this study is that our study protocol required participants to
perform both spirometry and oscillometry and it is known that the deep inspirations
105

associated with the forced breathing maneuvers of spirometry can transiently modify
bronchomotor tone and airway caliber [306, 307]. It is possible that oscillometry
performed in the supine position may have been affected by the deep inspirations of the
preceding upright spirometry. To control for this effect, we ensured that oscillometry was
performed at least 5 minutes after upright spirometry and participants were breathing
normally. We also maintained the same testing sequence at all 3 time points of the study
to help control for any effect this might have on the study outcomes.
In summary, lung compression occurs in obesity and in agreement with other studies
[11]; this reduces airway-parenchymal tethering forces, resulting in narrower airways and
stiffer lungs. Weight loss likely restored the airway-parenchymal tethering forces and this
resulted in improvements in oscillometric Rrs and Xrs, sleep quality and BD
responsiveness, but not spirometry. Impairments in respiratory mechanics were amplified
in the supine position, but substantial improvements were noted following weight loss.
The improvements in supine respiratory mechanics appeared to have greater impact on
the subject’s sleep quality and overall breathing mechanics.
106

Chapter 5: Repeatability and Variability of Respiratory Impedance and
its Reliability: Effect of Cheek Support and Variations in Head and
Neck Positioning
107
5.1 Abstract
Background: Oscillometry is increasingly used in clinical practice and in research as an
objective tool for assessment of respiratory system mechanics. Certain recommendations
have been outlined for avoiding the biasing effects from the upper airway such as those
caused by inappropriate head and neck angles, and oscillometry requires cheek-support to
minimize upper airway shunting. However, the effects of variations in positioning of the
head and neck during oscillometry have never been carefully characterized, so it is
difficult to assess the importance of these criteria. Here we examined the effects of small
and large neck angles on oscillometry outcomes, and compared these to the established
effects of the upper airway shunt artefact. We also compared within-session repeatability
and variability of oscillometric indices to day-to-day reproducibility and variability.
Methods: Six healthy adults and 6 COPD patients were evaluated using handheld
airwave oscillometry (tremoFlo) on two separate study visits to obtain respiratory system
resistance (Rrs) and reactance (Xrs). At baseline, subjects were instructed to follow
recommended guidelines for use of oscillometry in clinical practice. Oscillometry was
then repeated without cheek-support, and also during flexion and extension of the head
and neck. Three consecutive sets of measurements were obtained under each condition,
and standard deviation and percent coefficient of variation (COV) were computed as
indices of variability, repeatability and reproducibility. Also, Pearson’s product moment
correlation coefficient [Pearson’s (r)] was computed to determine the test-retest reliability
of oscillometry. Results: Oscillometry outcomes were not affected by flexion of the neck
but significant changes were recorded during extension. Despite the changes induced by
these artefacts, oscillometry demonstrated high within-day repeatability with a COV < 15
% for Rrs,5. The test-retest reliability and day-to-day reproducibility of oscillometry was
also very high. Furthermore, Rrs and Xrs were not significantly affected by cheek support
in healthy subjects, but significant effects from the upper airway shunt artefact were
observed in COPD patients. Conclusions: Handheld oscillometry demonstrated high
repeatability, and low and acceptable variability. It was also not susceptible to artefacts
caused by incorrect head and neck angles.
108
Keywords: Oscillometry; Repeatability; Reproducibility; Variability; COPD; Cheek
support; Respiratory system resistance; Respiratory system reactance; Upper airway
shunt
5.2 Introduction
Respiratory diseases such as asthma and chronic obstructive pulmonary disease (COPD)
affect millions of people around the world and are responsible for hundreds of thousands
of deaths every year [40, 41, 67]. These diseases represent a huge global health burden
impacting significantly on global economics [29, 72]. Currently, spirometry is the gold
standard applied in the diagnosis, staging, and monitoring of respiratory disease
progression. However, the main limitations of spirometry are that it is a highly effort
dependent test that is also insensitive to changes in the small airways – the predominant
locus for lung diseases. In the mid-1950s, Dubois et al. developed a new tool for
assessment of respiratory system mechanics known as the forced oscillation technique or
more recently as oscillometry [153].
Oscillometry is increasingly being used in clinical practice and in research to derive
many useful indices of respiratory system mechanics, such as respiratory system
resistance (Rrs) and reactance (Xrs). These indices have been reported in normal subjects
[196] and in patients with various conditions such as asthma [167], COPD [163], sleep
apnea/hypopnea [308, 309] and obesity [117, 247, 279], as well as to assess changes
induced by weight loss [9, 11, 300]. One key advantage oscillometry has over spirometry
is that it allows the assessment of pulmonary function during regular tidal breathing, and
it can be used when spirometry is difficult or unfeasible as is the case in preschool
children [182], and in patients with cognitive impairments and/or limited psychological
reserve [180, 181]. Oscillometry is also a valuable alternative in cases where
symptomatic patients present with normal or nearly normal spirometric values [174, 175].
In an effort to standardize the use of oscillometry in clinical practice, the American
Thoracic Society (ATS) and the European Respiratory Society (ERS) published a joint
guideline in 2003 with recommendations for its proper use [177]. According to the
109

ATS/ERS guideline, oscillometry should be performed while sitting upright with the neck
slightly extended forward or in the neutral position and with hands firmly supporting the
cheeks and the floor of the mouth. This procedure minimizes biasing effects from the
upper airway such as those caused by inappropriate head and neck angles, and upper
airway shunting. It has been speculated that incorrect positioning of the head and neck
during oscillometry could potentially affect the accuracy as well as the repeatability, and
contribute to the variability of test outcomes [14]; however, the effects of different head
and neck angles have never been carefully characterized, so it is difficult to assess the
importance of these criteria. Furthermore, there is need for more data on the acceptable
variability for an oscillometry test from repeated measures, referred to here as the within-
test variability. More data is also needed on the day-to-day reproducibility, variability and
reliability of oscillometric parameters in healthy subjects and patients with respiratory
disease, particularly patients with airflow obstruction such as COPD and asthma patients.
Therefore, the objectives of this study were to: (i) assess the magnitude of the effect of
incorrect angles in the positioning of head and neck during oscillometry, and compare
these with the effect of cheek support to reduce upper airway shunt artefact, and (ii)
assess within-test (also referred to as within-day) repeatability and day-to-day
reproducibility, variability and reliability of oscillometric indices in healthy subjects and
patients with airway obstruction.
5.3 Methods
5.3.1 Selection of study participants and consent
Six healthy adult subjects without a history of chronic respiratory disease were recruited
from the local community (Halifax Regional Municipality) and 6 patients with a
confirmed diagnosis of chronic obstructive pulmonary disease (COPD) were recruited
from the Pulmonary Rehabilitation Program at the Mumford Professional Centre in
Halifax. This study was approved by the Nova Scotia Health Authority Research Ethics
Board (reference number: CDHA-RS/2013-219). All participants provided written
informed consent to participate in the study and consented to have their data published.
110
5.3.2 Inclusion and exclusion criteria
Male or female subjects between the ages of 16 and 70 with no history of asthma or other
chronic respiratory condition and no recent respiratory tract infection (within 6 weeks),
and less than 10 pack-years were enrolled in this study as healthy subjects. Inclusion
criteria for COPD patients was a confirmed diagnosis of COPD (GOLD stage II
[moderate COPD] to stage IV [very severe COPD]) based on the Canadian Thoracic
Society COPD guidelines [310]. Male and female COPD patients between the ages of 16
and 70 with a baseline post-bronchodilator forced expiratory volume in 1 second (FEV1)
< 80% of predicted and FEV1/forced vital capacity ratio < 70% predicted were included
in the study. COPD patients who were current or ex-smokers with a smoking history of
more than 10 pack-years were also included in the study.
Exclusion criteria for COPD patients were: (i) known respiratory disease other than
COPD (e.g. lung cancer, sarcoidosis, tuberculosis, lung fibrosis, cystic fibrosis, upper
and/or lower respiratory tract infection, (ii) having undergone lung surgery (e.g. lung
reduction or lung transplant), and (iii) any other uncontrolled disease likely to interfere
with the study or impact on subject safety.
5.3.3 Study design
Respiratory system impedance was assessed in 6 healthy adult subjects and 6 patients
with COPD on two study visits. During the first study visit, oscillometry was recorded
according to the ATS/ERS criteria [177] which recommend that during oscillometry,
subjects seat upright in a straight-backed chair, with their head in the neutral position and
with hands supporting their cheeks and mouth floor to minimize the upper airway shunt
artefact. Data obtained was used as a baseline reference, and to determine within-day
repeatability of the device. Oscillometry was then performed without hand support of
cheeks to assess the effect of upper airway shunt, and also during flexion and extension
of the neck to assess the effect of incorrect head-and-neck angles on oscillometry
outcomes. Each test was repeated 3 times with periodic breaks of about 30 s between the
measurements and within-test repeatability was assessed from these 3 measurements.
111
In healthy subjects, we sought to assess the potential magnitude of large head-and-neck
angles on oscillometry outcomes, so oscillometry was conducted with the head and neck
comfortably near maximum forward flexion, and with the head and neck extended
backwards in comfortable maximum extension. The maximum flexion and maximum
extension described here established the effect of extreme deviations from the ATS/ERS
criteria, but these would not be expected to occur clinically.
We also investigated the potential magnitude of smaller deviations in head and neck
angles on oscillometry outcomes in a clinically relevant patient population. To achieve
this objective, COPD patients were asked to flex and extend their neck submaximally by
only 20° and 10°, respectively. These angles were chosen to approximate extreme
situations that would likely occur during assessment of respiratory system mechanics in
clinical practice and a goniometer was used in verifying the angle between the head and
neck.
Respiratory system mechanics was re-evaluated 2 days later with the head in the neutral
position according to the ATS/ERS criteria to determine day-to-day reproducibility, and
the test-retest reliability of oscillometry.
5.3.4 Weight and height measurements
The weight and height of each participant was measured and used in computing the BMI
of each subject.
5.3.5 Oscillometry
Respiratory system mechanics were assessed by using the tremoFlo C-100 Airwave
Oscillometry System (Appendix G, Thorasys Thoracic Medical Systems Inc, Montreal,
QC, Canada) to superimpose a multifrequency composite oscillatory pressure waveform
of about 1-2 cm H2O on a subject’s spontaneous breathing for 16 s. The handheld
oscillometry device delivered a multifrequency waveform at 5, 11, 13, 17, 19, 23, 29, 31,
and 37 Hz and mechanical parameters of the respiratory system (Rrs and Xrs) were then
estimated from the impedance of the respiratory system (Zrs) to the resulting flow
oscillations. Other experiments conducted as part of the calibration and validation of this
handheld oscillometry device are described in Appendix H.
112

Zrs was computed as the spectral ratio of the fast Fourier transform of the pressure and
flow signals by averaging 1 second windows of the pressure and flow signals. Each 1
second window from the 16 second recording was multiplied by a Hamming windows
with 50% overlap in order to reduce the error caused by spectral leakage, and the Rrs and
Xrs from each 1 second window was calculated at each frequency. In each 16 s
recording, the effects of artefacts were minimized by automatic rejection of any 1 second
window that contains negative Rrs or Rrs (and Xrs) values greater than 3 standard
deviations (SDs) prior to computing the mean Rrs and Xrs. Coherence ≥ 0.90 was used as
an acceptance criterion. Subjects wore a nose-clip during all measurements as
recommended in the ATS/ERS criteria [177].
5.3.6 Statistical analyses
Statistical analyses were performed in IBM SPSS Statistics for Windows, version 22
(IBM Corp., Armonk, N.Y., USA). Within-day repeatability of Rrs was estimated from
the coefficient of variation (COV) calculated by dividing the SD of the 3 consecutive
measurements obtained on the first study visit by the mean of those 3 consecutive
measurements. Since Xrs can have values that approach zero making COV less
representative of its variation, the variability in Xrs was estimated from the SD of Xrs.
Day-to-day reproducibility of Rrs was estimated from the COV computed by dividing the
SD of study visits 1 and 2 by the mean of study visits 1 and 2. Pearson’s correlation
coefficient (Pearson’s r) was computed from the Rrs measured on both study visits to
determine the test-retest reliability of oscillometry. All results were analyzed using a 1-
way analysis of variance (ANOVA) with repeated measures. When significance was
found, separate post hoc pairwise testing was performed with a Student’s t test to identify
differences due to the upper airway shunt artefact, incorrect head-and-neck angles, and
day-to-day variability. The Benjamini-Hochberg procedure was then applied to p-values
obtained to control the effect of multiple comparisons and to minimize the false
discovery rate [288]. The Benjamini-Hochberg procedure ranked the p-values from the
multiple comparisons and computed a critical value using the relationship: (i/m)q, where i
is the rank, m is the total number of comparisons performed, and q is the false discovery
113
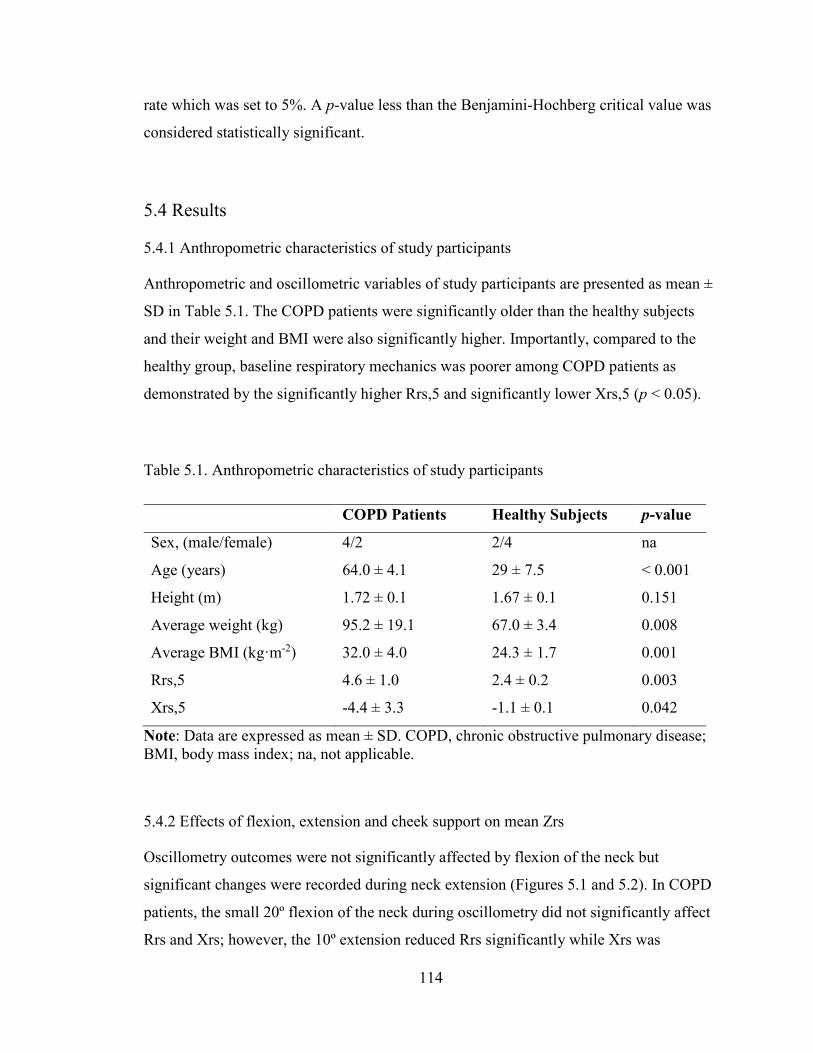
rate which was set to 5%. A p-value less than the Benjamini-Hochberg critical value was
considered statistically significant.
5.4 Results
5.4.1 Anthropometric characteristics of study participants
Anthropometric and oscillometric variables of study participants are presented as mean ±
SD in Table 5.1. The COPD patients were significantly older than the healthy subjects
and their weight and BMI were also significantly higher. Importantly, compared to the
healthy group, baseline respiratory mechanics was poorer among COPD patients as
demonstrated by the significantly higher Rrs,5 and significantly lower Xrs,5 (p < 0.05).
Table 5.1. Anthropometric characteristics of study participants
COPD Patients Healthy Subjects p-value
Sex, (male/female) 4/2 2/4 na
Age (years) 64.0 ± 4.1 29 ± 7.5 < 0.001
Height (m) 1.72 ± 0.1 1.67 ± 0.1 0.151
Average weight (kg) 95.2 ± 19.1 67.0 ± 3.4 0.008
Average BMI (kg·m-2) 32.0 ± 4.0 24.3 ± 1.7 0.001
Rrs,5 4.6 ± 1.0 2.4 ± 0.2 0.003
Xrs,5 -4.4 ± 3.3 -1.1 ± 0.1 0.042
Note: Data are expressed as mean ± SD. COPD, chronic obstructive pulmonary disease; BMI, body mass index; na, not applicable.
5.4.2 Effects of flexion, extension and cheek support on mean Zrs
Oscillometry outcomes were not significantly affected by flexion of the neck but
significant changes were recorded during neck extension (Figures 5.1 and 5.2). In COPD
patients, the small 20º flexion of the neck during oscillometry did not significantly affect
Rrs and Xrs; however, the 10º extension reduced Rrs significantly while Xrs was
114

unaffected (Figure 5.1). For example, an 8.4 ± 3.8 % reduction in Rrs was recorded at 5
Hz as a result of the 10º extension. In healthy subjects, maximum flexion and extension
of the neck during oscillometry did not also affect oscillometric Rrs and Xrs (Figure 5.2)
significantly, but there was a significant reduction in Xrs at 11 – 37 Hz during maximal
extension (Figure 5.2B).
In healthy subjects, cheek support had no effect on Rrs and Xrs (Figure 5.3). However, in
COPD patients, Rrs was significantly lower without cheek support, while Xrs was
significantly higher at all the oscillation frequencies compared to when the cheeks were
supported (Figure 5.3).
Figure 5.1. Effect of 20° flexion and 10° extension of neck on Rrs (A) and Xrs (B) in COPD patients. Error bars indicate SE. Rrs, respiratory system resistance; Xrs, respiratory system reactance. *, p < 0.05.
*
**** * **
0
2
4
6
0 10 20 30 40
Rrs (
cm H
2O/(
L·s-1
))
Frequency (Hz)
BaselineFlexionExtension
A
-6
-4
-2
0
2
0 10 20 30 40
Xrs (
cm H
2O/(
L·s-1
))
Frequency (Hz)
B
115
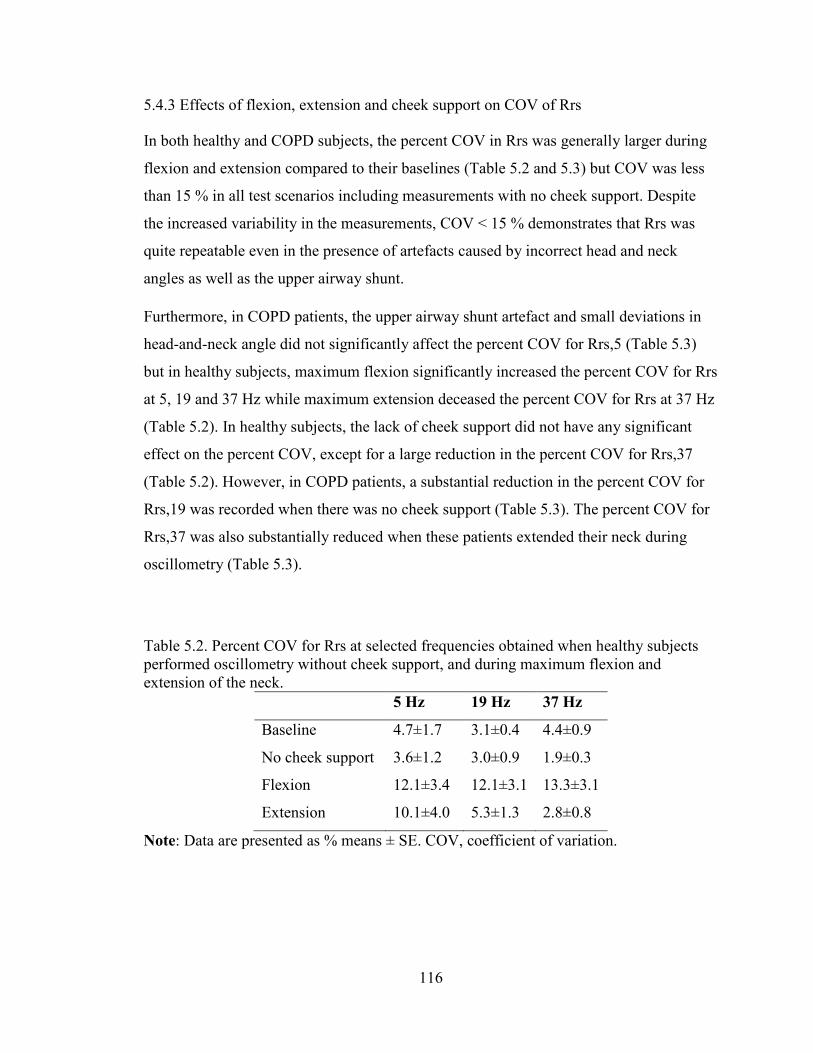
5.4.3 Effects of flexion, extension and cheek support on COV of Rrs
In both healthy and COPD subjects, the percent COV in Rrs was generally larger during
flexion and extension compared to their baselines (Table 5.2 and 5.3) but COV was less
than 15 % in all test scenarios including measurements with no cheek support. Despite
the increased variability in the measurements, COV < 15 % demonstrates that Rrs was
quite repeatable even in the presence of artefacts caused by incorrect head and neck
angles as well as the upper airway shunt.
Furthermore, in COPD patients, the upper airway shunt artefact and small deviations in
head-and-neck angle did not significantly affect the percent COV for Rrs,5 (Table 5.3)
but in healthy subjects, maximum flexion significantly increased the percent COV for Rrs
at 5, 19 and 37 Hz while maximum extension deceased the percent COV for Rrs at 37 Hz
(Table 5.2). In healthy subjects, the lack of cheek support did not have any significant
effect on the percent COV, except for a large reduction in the percent COV for Rrs,37
(Table 5.2). However, in COPD patients, a substantial reduction in the percent COV for
Rrs,19 was recorded when there was no cheek support (Table 5.3). The percent COV for
Rrs,37 was also substantially reduced when these patients extended their neck during
oscillometry (Table 5.3).
Table 5.2. Percent COV for Rrs at selected frequencies obtained when healthy subjects performed oscillometry without cheek support, and during maximum flexion and extension of the neck.
5 Hz 19 Hz 37 Hz
Baseline 4.7±1.7 3.1±0.4 4.4±0.9
No cheek support 3.6±1.2 3.0±0.9 1.9±0.3
Flexion 12.1±3.4 12.1±3.1 13.3±3.1
Extension 10.1±4.0 5.3±1.3 2.8±0.8
Note: Data are presented as % means ± SE. COV, coefficient of variation.
116

Figure 5.2. Effect of maximal forward flexion and maximal extension on Rrs (A) and Xrs (B) in healthy subjects. Error bars indicate SE. Rrs, respiratory system resistance; Xrs, respiratory system reactance. Xrs for all frequencies other than 6 Hz was significantly different from baseline during extension of the head and neck (p < 0.05).
Table 5.3. Percent COV for Rrs at selected frequencies obtained when COPD patients performed oscillometry without cheek support, and during 20° flexion and 10° extension of the neck.
5 Hz 19 Hz 37 Hz
Baseline 4.9±1.1 6.7±1.3 6.4±1.2
No cheek support 5.2±1.6 2.1±0.3 2.5±0.8
Flexion 5.7±0.5 4.4±1.1 3.1±0.6
Extension 8.1±2.3 2.7±0.6 2.3±0.5
Note: Data are presented as % means ± SE. COV, coefficient of variation; COPD, chronic obstructive pulmonary disease.
5.4.4 Effects of flexion, extension and cheek support on SD of Xrs
The mean variability in Xrs assessed through the standard deviation was less than 0.6
cm·H2O/(L·s-1) at all frequencies and in all test scenarios in both healthy subjects and
COPD patients (Table 5.4 and 5.5). At baseline, the variability in Xrs was less than 0.1
***** *
**
-6
-5
-4
-3
-2
-1
0
1
2
0 10 20 30 40
Xrs (cm H2O/(L·s-1 ))
Frequency (Hz)
B
0
2
4
6
0 10 20 30 40
Rrs (cm H2O/(L·s-1 ))
Frequency (Hz)
BaselineFlexionExtension
A
117

cm·H2O/(L·s-1) and 0.5 cm·H2O/(L·s-1) in healthy subjects and COPD patients,
respectively, and was not significantly different with other test conditions.
Figure 5.3. Effect of upper airway shunt artefact on Rrs and Xrs measured in healthy subjects (A & B) and COPD patients (C & D). Error bars indicate SE. Rrs, respiratory system resistance; Xrs, respiratory system reactance. *, p < 0.05.
0
2
4
6
0 10 20 30 40
Rrs (
cm H
2O/(
L·s-1
))
Frequency (Hz)
BaselineNo Cheek…
A
*** * * * * * *
0
2
4
6
0 10 20 30 40
Rrs (
cm H
2O/(
L·s-1
))
Frequency (Hz)
C
-6
-4
-2
0
2
0 10 20 30 40
Xrs (
cm H
2O/(
L·s-1
))
Frequency (Hz)
B
**
***
***
*
-6
-4
-2
0
2
0 10 20 30 40
Xrs (
cm H
2O/(
L·s-1
))
Frequency (Hz)
D
118
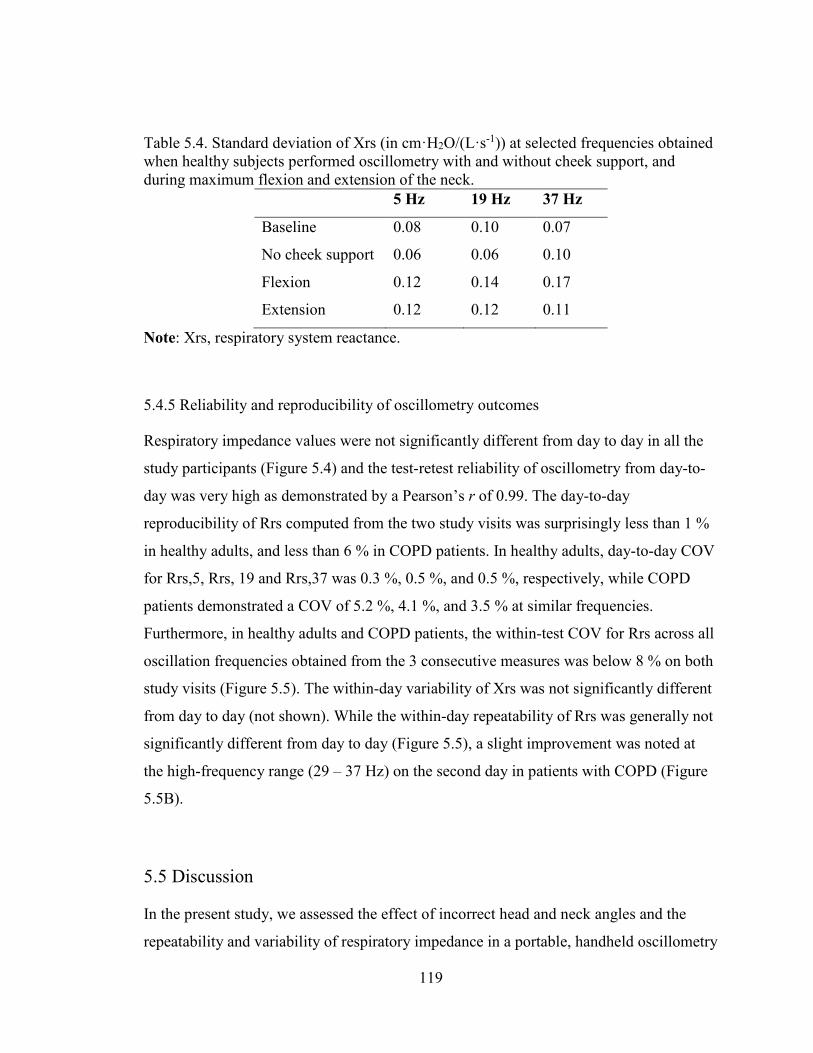
Table 5.4. Standard deviation of Xrs (in cm·H2O/(L·s-1)) at selected frequencies obtained when healthy subjects performed oscillometry with and without cheek support, and during maximum flexion and extension of the neck.
5 Hz 19 Hz 37 Hz
Baseline 0.08 0.10 0.07
No cheek support 0.06 0.06 0.10
Flexion 0.12 0.14 0.17
Extension 0.12 0.12 0.11
Note: Xrs, respiratory system reactance.
5.4.5 Reliability and reproducibility of oscillometry outcomes
Respiratory impedance values were not significantly different from day to day in all the
study participants (Figure 5.4) and the test-retest reliability of oscillometry from day-to-
day was very high as demonstrated by a Pearson’s r of 0.99. The day-to-day
reproducibility of Rrs computed from the two study visits was surprisingly less than 1 %
in healthy adults, and less than 6 % in COPD patients. In healthy adults, day-to-day COV
for Rrs,5, Rrs, 19 and Rrs,37 was 0.3 %, 0.5 %, and 0.5 %, respectively, while COPD
patients demonstrated a COV of 5.2 %, 4.1 %, and 3.5 % at similar frequencies.
Furthermore, in healthy adults and COPD patients, the within-test COV for Rrs across all
oscillation frequencies obtained from the 3 consecutive measures was below 8 % on both
study visits (Figure 5.5). The within-day variability of Xrs was not significantly different
from day to day (not shown). While the within-day repeatability of Rrs was generally not
significantly different from day to day (Figure 5.5), a slight improvement was noted at
the high-frequency range (29 – 37 Hz) on the second day in patients with COPD (Figure
5.5B).
5.5 Discussion
In the present study, we assessed the effect of incorrect head and neck angles and the
repeatability and variability of respiratory impedance in a portable, handheld oscillometry
119
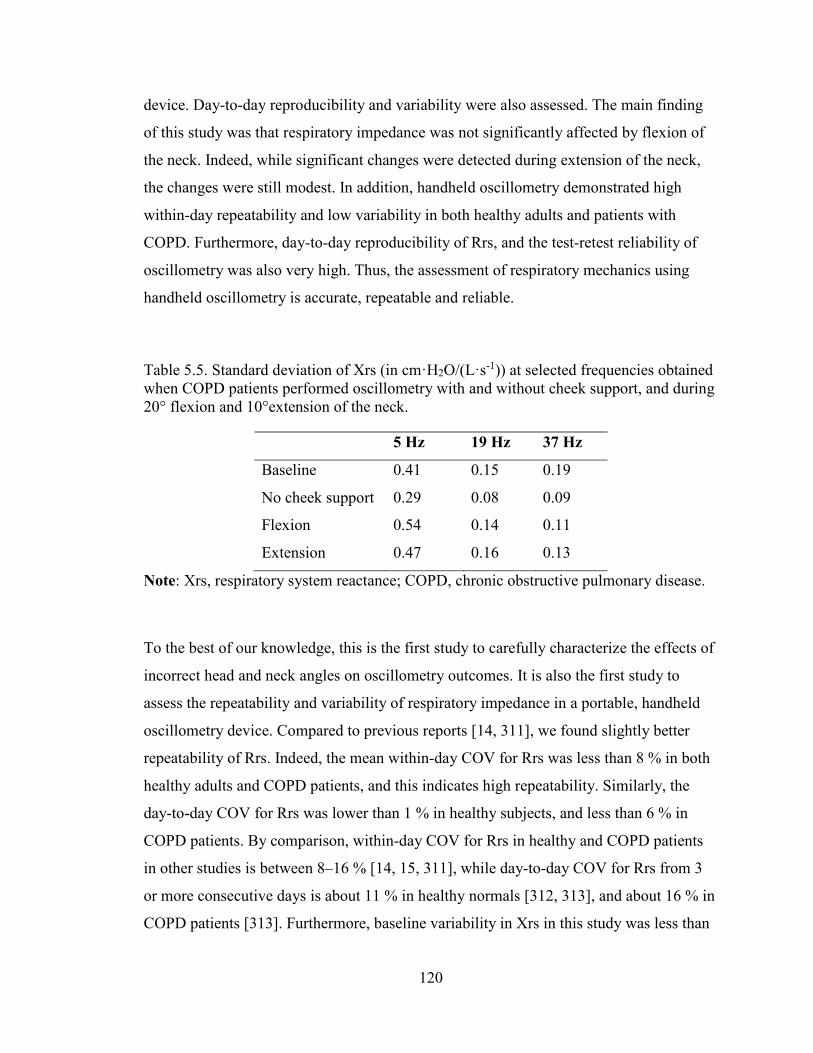
device. Day-to-day reproducibility and variability were also assessed. The main finding
of this study was that respiratory impedance was not significantly affected by flexion of
the neck. Indeed, while significant changes were detected during extension of the neck,
the changes were still modest. In addition, handheld oscillometry demonstrated high
within-day repeatability and low variability in both healthy adults and patients with
COPD. Furthermore, day-to-day reproducibility of Rrs, and the test-retest reliability of
oscillometry was also very high. Thus, the assessment of respiratory mechanics using
handheld oscillometry is accurate, repeatable and reliable.
Table 5.5. Standard deviation of Xrs (in cm·H2O/(L·s-1)) at selected frequencies obtained when COPD patients performed oscillometry with and without cheek support, and during 20° flexion and 10°extension of the neck.
5 Hz 19 Hz 37 Hz
Baseline 0.41 0.15 0.19
No cheek support 0.29 0.08 0.09
Flexion 0.54 0.14 0.11
Extension 0.47 0.16 0.13
Note: Xrs, respiratory system reactance; COPD, chronic obstructive pulmonary disease.
To the best of our knowledge, this is the first study to carefully characterize the effects of
incorrect head and neck angles on oscillometry outcomes. It is also the first study to
assess the repeatability and variability of respiratory impedance in a portable, handheld
oscillometry device. Compared to previous reports [14, 311], we found slightly better
repeatability of Rrs. Indeed, the mean within-day COV for Rrs was less than 8 % in both
healthy adults and COPD patients, and this indicates high repeatability. Similarly, the
day-to-day COV for Rrs was lower than 1 % in healthy subjects, and less than 6 % in
COPD patients. By comparison, within-day COV for Rrs in healthy and COPD patients
in other studies is between 8–16 % [14, 15, 311], while day-to-day COV for Rrs from 3
or more consecutive days is about 11 % in healthy normals [312, 313], and about 16 % in
COPD patients [313]. Furthermore, baseline variability in Xrs in this study was less than
120

0.1 cm·H2O/(L·s-1) and 0.5 cm·H2O/(L·s-1) in healthy subjects and COPD patients,
respectively and these results are comparable to those reported by Timmins et al [14].
Figure 5.4. Rrs and Xrs measured during two separate study visits in healthy adults (A & B) and COPD patients (C & D). Error bars indicate SE. Rrs, respiratory system resistance; Xrs, respiratory system reactance.
0
2
4
6
0 10 20 30 40
Rrs (
cm H
2O/(
L·s-1
)
A
0
2
4
6
0 10 20 30 40
Rrs (
cm H
2O/(
L·s-1
))
Visit 1
Visit 2
C
-6
-4
-2
0
2
0 10 20 30 40
Xrs (
cm H
2O/(
L·s-1
))
Frequency (Hz)
Visit 1Visit 2
B
-6
-4
-2
0
2
0 10 20 30 40
Xrs (
cm H
2O/(
L·s-1
))
Frequency (Hz)
D
121

Figure 5.5. Within-day COV for Rrs versus frequency from three consecutive measures obtained during study visits 1 and 2 in healthy adults (A) and COPD patients (B). Error bars indicate SE. COV, coefficient of variation; *, p < 0.05.
We specifically explored the effects of 20° flexion and 10°extension of the neck on
respiratory impedance in COPD patients because these angles are perhaps at the
borderline of head-and-neck position that would not be rejected during clinical
oscillometry. To compare, we also measured the effect of maximal flexion and extension
of the neck on respiratory impedance in healthy subjects to get an idea of the possible
magnitude of this effect at its extremes. We reasoned that the effect would be larger in
healthy subjects because the change in upper airway impedance would be a larger
fraction of the total respiratory impedance [314-317]. However, the overall magnitude of
this effect was modest since maximal extension only affected Xrs at mid- and high-
frequencies (Figure 5.2). We also recorded significant reductions in Rrs during
10°extension of the neck in COPD patients, but this reduction was also modest – with
only 8.4 ± 3.8 % reduction in Rrs recorded at 5 Hz. Although the ATS/ERS guidelines
recommend that flexion of the head should be avoided during oscillometry [177], our
results indicate that this artefact had no significant effect on respiratory impedance in
0
2
4
6
8
10
0 10 20 30 40
COV
%
Frequency (Hz)
Visit 1
Visit 2
A
* **
0
2
4
6
8
10
0 10 20 30 40
COV
%
Frequency (Hz)
Visit 1Visit 2
B
122

both healthy subjects and patients with COPD. However, maximal flexion in healthy
individuals increased the COV for Rrs to 13.3±3.1 % at high oscillation frequencies
(Table 5.2), thereby reducing measurement repeatability.
The upper airway shunt is an established artefact that is known to bias oscillometric
outcomes, especially in patients with high respiratory system impedance [315]. This
artefact occurs when a significant portion of the forced oscillatory energy directed at the
central and peripheral airways is diverted to compliant structures of the upper airways
with only a small portion reaching the lower respiratory system [314, 318]. This is
commonly observed in patients with high respiratory impedance, such as asthma and
COPD patients [171, 175], as well as young children who have low Crs and high Rrs
[189, 319]. To the best of our knowledge, this is the first study to investigate the biasing
effect of upper airway shunt artefact on the repeatability and variability of oscillometry
outcomes. Indeed, the upper airway shunt significantly affected respiratory impedance in
patients with COPD but no significant effect was observed among the healthy subjects.
This finding is not entirely consistent with previous reports in the literature which
established that cheek-support can significantly affect respiratory impedance in both
healthy subjects and patients with COPD [314, 318, 320]. The lack of significant
difference we found is likely due to the small number of subjects in our study. Also, the
mechanical properties of the chest wall are a significant contributor to total respiratory
system mechanics [155], and although it is likely smaller than the contribution arising
from the shunt provided by the soft tissues of the upper airway, it is possible that the
contribution from the chest wall might be significantly altered when study participants
raise their arms to support the cheeks, as suggested by Goldman et al [321].
We did not measure the effect of small angle variations on oscillometry outcomes in
healthy subjects; however, the magnitude of this effect would have been smaller than the
modest changes we reported at extreme angles. While we anticipate that small angle
flexion and extension of head and neck would have similar effects to that reported in
COPD (Figure 5.1), it is also possible that such deviations in recommended head-and-
neck position may produce larger changes than those measured in the patients with
COPD. This is because the changes in the upper airway in a healthy subject would
123

normally be a greater fraction of the total respiratory impedance, since lung impedance is
lower [314]. However, given that baseline Rrs at higher frequencies which largely
represent central airway [304] (Figure 5.3) was comparable between healthy subjects and
COPD patients, it is quite likely that changes in respiratory impedance caused by small
deviations in head-and-neck angles would be similar in both subject groups.
In summary, we have shown that oscillometry is not easily susceptible to upper airway
artefacts caused by flexion of the head and neck, but small angle extension of the neck
slightly reduced Rrs in COPD patients while maximal neck extension reduced Xrs in
healthy subjects. We also demonstrated that cheek support only affected oscillometry
outcomes in high impedance patients. Lastly, this study demonstrated that oscillometry is
highly repeatable with low variability and high test-retest reliability. These results
provide important information on the clinical validity of handheld oscillometry as a novel
tool for assessment of respiratory system mechanics.
124
Chapter 6: Discussion
This chapter provides a brief description of the novel findings and contributions from this
thesis. This is followed by a description of the significance and implications of the
findings presented in this thesis. A summary of original contributions from this thesis is
also provided and the chapter ends with suggestions for future work.
6.1 Overview of findings
As reviewed in Chapters 1 and 2, obesity is a condition associated with respiratory
diseases such as asthma, obstructive sleep apnea, and obesity hypoventilation syndrome.
The most common respiratory symptoms in obesity are wheeze and dyspnea. These
symptoms can be difficult to manage in individuals with obesity, and bronchodilators are
reported to exhibit limited effectiveness. However, symptoms often improve with weight
loss but traditional methods of testing lung function such as spirometry and
plethysmography often show little or no changes with weight loss. This lack of
information from traditional lung function tests has hampered our ability to unravel the
mechanisms that link obesity and weight loss to changes in respiratory health.
Furthermore, lung function is typically assessed in the upright position either with
spirometry or oscillometry but the respiratory symptoms of obesity are reported to be
worse when subjects lie down and this affects their sleep quality. Because this
information was important to asses, as was the role weight loss or weight gain could play
in altering lung function, we directly assessed the respiratory consequences of obesity
and weight loss in the supine position. We used a portable oscillometry system which
facilitated comparison of upright pulmonary mechanics to supine mechanics, and used
this to characterize weight-induced changes in upright and supine pulmonary mechanics.
Results were also compared to traditional methods of testing lung function. Finally, to
investigate the contribution of obesity to the reported ineffectiveness of bronchodilators,
we measured breathing mechanics with oscillometry before and after inhalation of
125
salbutamol, and compared baseline bronchodilator responsiveness to the responsiveness
measured after weight loss.
In Chapter 3, we reported that prior to weight loss, subjects did not respond to the
bronchodilator when assessed in the upright position with either spirometry or
oscillometry; however, a remarkable response to the bronchodilator was observed after
bariatric surgery at the 5-week postoperative assessment. We also found that oscillometry
was sensitive to early changes in pulmonary mechanics induced by weight loss at the 5-
week postoperative assessment, while spirometry was not. While oscillometry and
spirometry had been previously reported to change with obesity and weight loss [9-11,
117, 204, 305], the difference in sensitivity was not well characterized. The higher
sensitivity of oscillometry to the changes induced by weight loss indicate that
oscillometry is a more appropriate technique to probe and monitor changes in pulmonary
function in these subjects.
As described above, we found that modest weight loss at the 5 week time point induced a
substantial reduction in supine Rrs,19 and this change correlated strongly with
improvements in sleep quality (Chapter 3). Thus, in Chapter 4, we were interested to see
if greater magnitudes of weight loss would lead to larger changes in supine respiratory
mechanics so we extended the follow-up period of our study to 6 months. We
hypothesized that additional weight loss would induce greater improvements in
pulmonary mechanics, which would in turn lead to greater improvements in sleep quality.
We also hypothesized that the magnitude of the changes in pulmonary mechanics would
be larger in the supine position than in the upright position. To test these hypotheses, we
re-evaluated sleep quality and pulmonary mechanics and function in our study subjects
using the PSQI, oscillometry, spirometry, and plethysmography. The main findings of
this study were that (i) surgically-induced weight loss of 21.4 ± 7.1 kg induced large
changes in Rrs, Xrs, Ers and FRC at the postoperative assessment conducted at 6 months
but no significant changes were detected with spirometry, and (ii) compared to the
postoperative assessment conducted at 5 weeks (Chapter 3)[300], a greater improvement
in sleep quality was recorded at the postoperative assessment conducted at 6 months and,
for the first time, the global sleep score of our study participants exceeded the threshold
126

for good sleep quality. While there was a small but significant role for airway recruitment
with weight loss, it is likely that changes in chest wall stiffness played an important role
in reducing overall respiratory system stiffness.
Lastly, in Chapter 5, this thesis investigated the biasing effects of upper airway shunt
artefact and inappropriate positioning of head and neck during oscillometry on the
repeatability of oscillometry outcomes. The within-session, and day-to-day
reproducibility of a portable, handheld oscillometry device was also characterized.
Oscillometry outcomes were not significantly affected by flexion of the neck but
significant changes were recorded during extension. In general, outcomes from
oscillometry were highly repeatable, even in the presence of artefacts caused by the upper
airway shunt artefact and incorrect head and neck angles. Furthermore, the test-retest
reliability of the device was also found to be very high.
6.2 Significance and Implications of Findings
We demonstrated for the first time that improvements in respiratory mechanics and BD
responsiveness occur very early after weight loss, mostly in the supine position, and this
resulted in improved sleep quality. These findings are significant because it further
confirms the notion that obese individuals have poor lung mechanics and this leads to
respiratory symptoms in susceptible individuals. In particular, this may be the first study
to indicate the likely importance of the association between improvements in respiratory
mechanics and sleep quality. This study also demonstrates that oscillometry is an
effective tool to objectively and sensitively measure the improvements in breathing
mechanics that occur with weight loss or with changes induced by pharmacological
intervention.
The oscillometry technique objectively measures the mechanics of moving air into and
out of the lungs and it revealed that obese individuals have some difficulty moving air
into and out of their lungs, by quantifying respiratory impedance. Our study revealed that
obese individuals have worse respiratory mechanics and likely experience greater
127
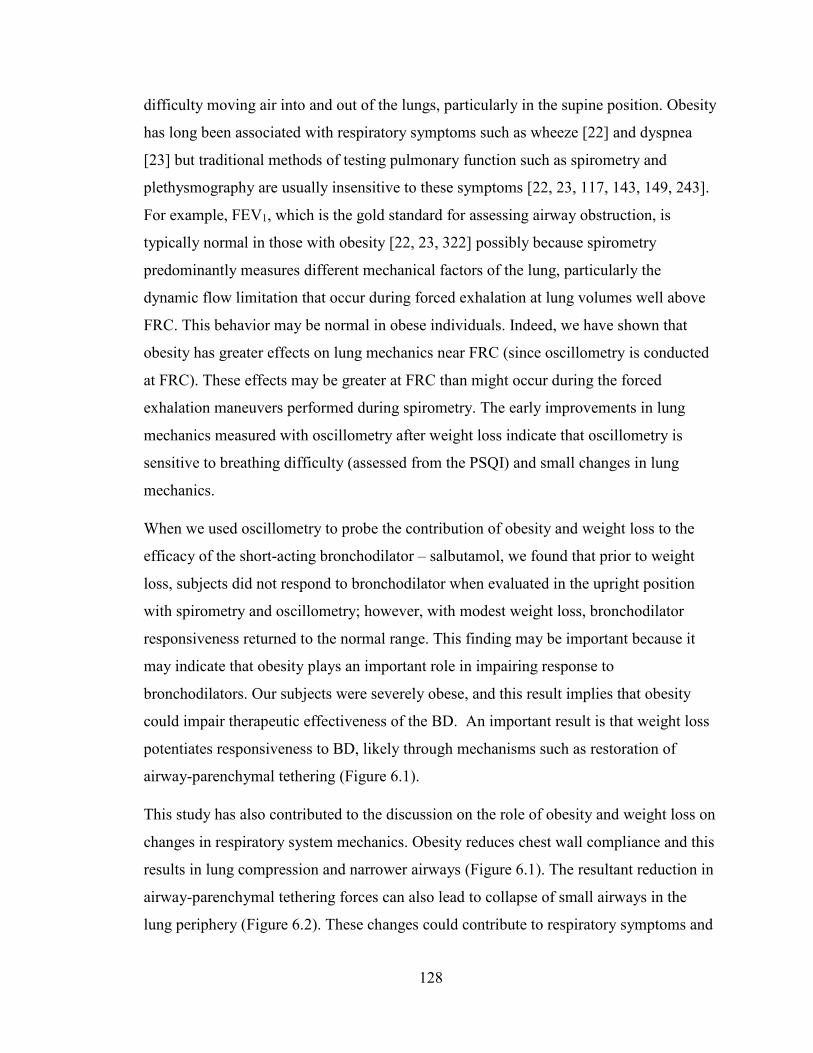
difficulty moving air into and out of the lungs, particularly in the supine position. Obesity
has long been associated with respiratory symptoms such as wheeze [22] and dyspnea
[23] but traditional methods of testing pulmonary function such as spirometry and
plethysmography are usually insensitive to these symptoms [22, 23, 117, 143, 149, 243].
For example, FEV1, which is the gold standard for assessing airway obstruction, is
typically normal in those with obesity [22, 23, 322] possibly because spirometry
predominantly measures different mechanical factors of the lung, particularly the
dynamic flow limitation that occur during forced exhalation at lung volumes well above
FRC. This behavior may be normal in obese individuals. Indeed, we have shown that
obesity has greater effects on lung mechanics near FRC (since oscillometry is conducted
at FRC). These effects may be greater at FRC than might occur during the forced
exhalation maneuvers performed during spirometry. The early improvements in lung
mechanics measured with oscillometry after weight loss indicate that oscillometry is
sensitive to breathing difficulty (assessed from the PSQI) and small changes in lung
mechanics.
When we used oscillometry to probe the contribution of obesity and weight loss to the
efficacy of the short-acting bronchodilator – salbutamol, we found that prior to weight
loss, subjects did not respond to bronchodilator when evaluated in the upright position
with spirometry and oscillometry; however, with modest weight loss, bronchodilator
responsiveness returned to the normal range. This finding may be important because it
may indicate that obesity plays an important role in impairing response to
bronchodilators. Our subjects were severely obese, and this result implies that obesity
could impair therapeutic effectiveness of the BD. An important result is that weight loss
potentiates responsiveness to BD, likely through mechanisms such as restoration of
airway-parenchymal tethering (Figure 6.1).
This study has also contributed to the discussion on the role of obesity and weight loss on
changes in respiratory system mechanics. Obesity reduces chest wall compliance and this
results in lung compression and narrower airways (Figure 6.1). The resultant reduction in
airway-parenchymal tethering forces can also lead to collapse of small airways in the
lung periphery (Figure 6.2). These changes could contribute to respiratory symptoms and
128

poor sleep quality which many obese individuals exhibit. Here, we have shown that
weight loss increases the compliance of the chest wall and this results in lung
decompression and increased airway caliber (Figures 6.1 and 6.2). These changes restore
the tethering forces that alveolar walls exert around the small airways likely leading to
increased recruitment of small airways and perhaps explaining the increased
responsiveness to BD. That is, at baseline, due to weak tethering forces, the changes in
airway caliber induced by BD might be relatively small, despite the attendant relaxation
of airway smooth muscle. This may explain the restoration of BD responsiveness to the
normal range with weight loss.
The improvements in multiple measures of respiratory system mechanics, sleep quality
and BD responsiveness reported here underscore the importance of weight loss in
improving pulmonary function, response to inhaled BD therapy, and overall quality of
life. To reiterate, these findings have provided new evidence that severely obese subjects
may have poor sleep quality due to poor pulmonary mechanics but weight loss can
reverse these changes.
Figure 6.1. Summary of findings at baseline and after weight loss. The likely mechanisms for these findings are also briefly provided.
129
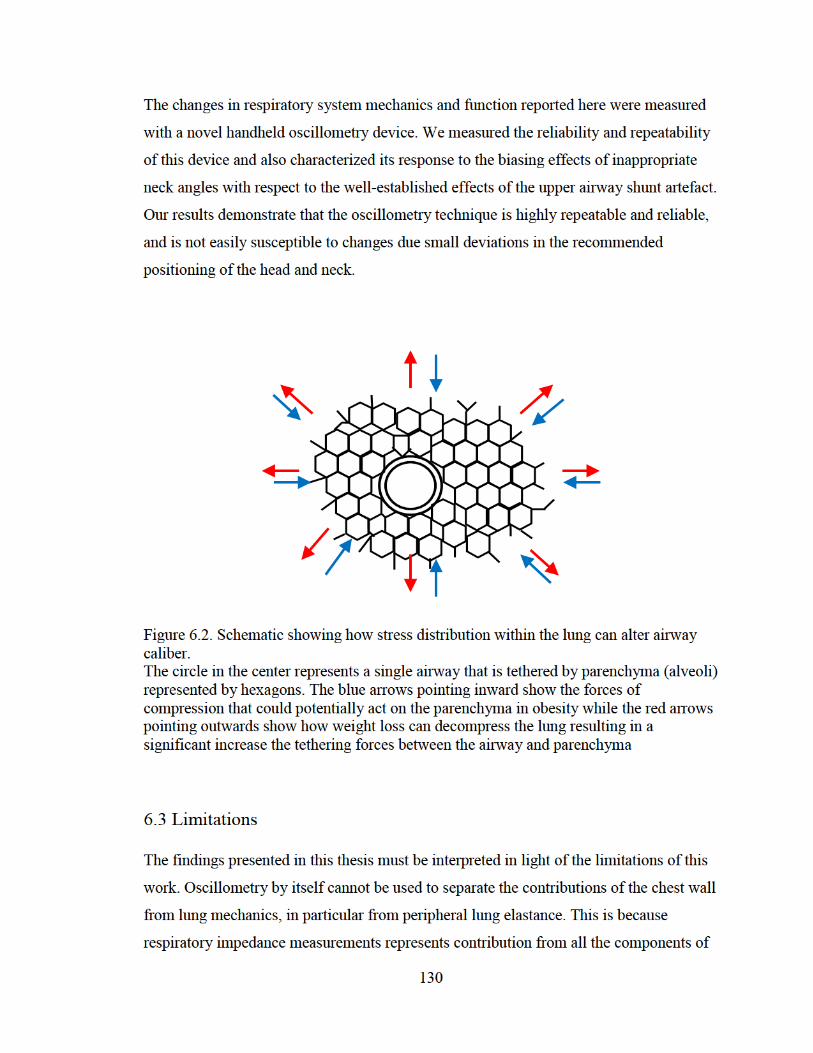
The changes in respiratory system mechanics and function reported here were measured
with a novel handheld oscillometry device. We measured the reliability and repeatability
of this device and also characterized its response to the biasing effects of inappropriate
neck angles with respect to the well-established effects of the upper airway shunt artefact.
Our results demonstrate that the oscillometry technique is highly repeatable and reliable,
and is not easily susceptible to changes due small deviations in the recommended
positioning of the head and neck.
Figure 6.2. Schematic showing how stress distribution within the lung can alter airway caliber. The circle in the center represents a single airway that is tethered by parenchyma (alveoli) represented by hexagons. The blue arrows pointing inward show the forces of compression that could potentially act on the parenchyma in obesity while the red arrows pointing outwards show how weight loss can decompress the lung resulting in a significant increase the tethering forces between the airway and parenchyma
6.3 Limitations
The findings presented in this thesis must be interpreted in light of the limitations of this
work. Oscillometry by itself cannot be used to separate the contributions of the chest wall
from lung mechanics, in particular from peripheral lung elastance. This is because
respiratory impedance measurements represents contribution from all the components of
130

the respiratory system, including the upper airway, lungs and chest wall. This means that
when we assessed the changes in pulmonary mechanics due to obesity and weight loss,
we cannot directly distinguish changes due to chest wall elastance from changes in lung
elastance that occur with recruitment following improved tethering of the peripheral
airways to the parenchyma. However, changes in peripheral airway recruitment can be
assessed from its association with changes in ventilation heterogeneity caused by
obstruction of the small airways in the lung periphery. This heterogeneity can be
indirectly assessed from the negative frequency dependence of Rrs, which is typically a
hallmark feature of asthma [173, 302-304].
Interestingly, we did not find substantial evidence of peripheral airway heterogeneity
from assessing frequency dependence of Rrs in our study participants. Indeed, we only
recorded slight negative frequency dependence of Rrs in our obese cohort, probably
because these subjects do not have asthma. Other studies of respiratory mechanics in
obesity have reported significant negative frequency dependence of Rrs which also
appears to have been larger than we report [9, 11, 305]. The exact reason for this
potential difference in frequency dependence of Rrs is not yet known, but it may be due
to differences in the devices used [9-11, 117, 305]. Depending on the manufacturer, some
oscillometry devices may exhibit inherently larger frequency dependence of Rrs [196]
likely be due to differences arising from the hardware of each device, and also
differences in the perturbation waveforms generated, since the device with the highest
frequency dependence of Rrs used impulses rather than a mixed sine wave oscillatory
signal [196, 197].
Another important factor indicating that ventilation heterogeneity was mild in our
subjects was that the coefficient of determination obtained from fitting our Zrs data to a
2-compartment model of the respiratory system was higher than 0.95, and this suggests
that the behavior of our Zrs data can be explained by the series 2-compartment model,
which is a homogenous model. Indeed, we found that the frequency dependence of Rrs
measured by subtracting Rrs,19 from Rrs,6 decreased significantly with weight loss,
indicating some reduction in ventilation heterogeneity. This means that while peripheral
airway recruitment likely played some role in the changes measured in Xrs,6 and model
131
elastance with weight loss, it is likely that the reduction in the stiffness of the chest wall
may have contributed more to these changes. It is well-established that obesity changes
the compliance of the chest wall [245] and it is possible that the weight loss reported by
our subjects contributed to changes in the stiffness of the chest wall; thus contributing to
the reduction in Ers.
Our study only focused on obese women, and this could limit the generalizability of our
findings to obese men and children. Indeed, the effects of weight gain on pulmonary
function is different in men and women. While weight gain is associated with small
reductions in both FEV1 and FVC, the effect has been found to be greater in men than
women [323, 324], presumably because men comparatively gain more abdominal fat than
women. This may imply that compared to women, larger changes in Rrs and Xrs would
occur with weight loss in men.
Another potential limitation of this study is that our study protocol required participants
to perform both spirometry and oscillometry. However, the deep inspirations associated
with the forced breathing maneuvers of spirometry are known to transiently modify
bronchomotor tone and airway caliber, particularly in studies comparing asthma to health
[306, 307]. This could potentially have some effect on our oscillometry results obtained
in the supine position since these measurements followed spirometry in the upright
position. However, our subjects did not have asthma, so we anticipated that they had low
bronchomotor tone; thus this effect was likely small. In any case, to help control for this
effect, we ensured that participants followed the same testing sequence at all 3 time
points of the study.
We cannot reliably infer from our data that respiratory impedance is not affected by
cheek support in healthy subjects because of our small sample size. Cheek support
significantly affected respiratory impedance in patients with COPD but no significant
effect was observed among the healthy subjects. This finding is not entirely consistent
with previous reports in the literature which established that cheek-support can
significantly affect respiratory impedance in both healthy subjects and patients with
COPD [314, 318, 320]. The lack of significant difference which we report here is likely
due to the small number of subjects in our study. Also, the mechanical properties of the
132

chest wall are a significant contributor to total respiratory system mechanics [155], and
although it is likely smaller than the contribution arising from the shunt provided by the
soft tissues of the upper airway, it is possible that the contribution from the chest wall
might be significantly altered when study participants raise their arms to support the
cheeks, as suggested by Goldman et al [321].
6.4 Statement of Original Contributions
The following is a brief summary of the original contributions from this thesis.
1) I measured changes in respiratory mechanics in both the upright and supine
positions. My study was the first to measure pulmonary mechanics in obese
subjects in the supine position with oscillometry. This allowed us to compare the
changes measured in the supine position with weight loss to those recorded in the
upright position.
2) I showed that improvements in respiratory mechanics occur very early after
weight loss in the supine position. This was the first study to report changes in
lung mechanics as early as 5 weeks after weight loss surgery, and also the first to
report changes in respiratory mechanics from baseline at both 5 weeks and 6
months.
3) I measured the effect of weight reduction on BD responsiveness in obese female
adults without asthma. This is the first study to examine the effect of weight loss
on responsiveness to short-acting β2-adrenergic agonist. My study showed that
BD responsiveness was impaired in severe obesity, but weight loss restored this
response to the normal range.
4) I demonstrated a significant correlation between reduction in supine Rrs with
weight loss and improvement in sleep quality. This is the first study to examine
how weight loss affects the relationship between supine respiratory mechanics
133
and sleep quality. Here, I demonstrated that the breathing discomfort caused by
narrowing of the upper and central airways in the supine position contributes
significantly to poor sleep quality in obesity.
5) I showed that oscillometry was more sensitive than spirometry to changes in
respiratory system mechanics and function induced by weight loss and short-
acting bronchial agonist. Indeed, spirometry was not sensitive enough to detect
changes in pulmonary function even after 6 months of substantial weight loss.
6) I showed that a portable handheld oscillometry device demonstrated high within-
day repeatability and low and acceptable variability in the assessment of
respiratory mechanics in health and in COPD. I also showed that handheld
oscillometry demonstrated high day-to-day reproducibility and high test-retest
reliability.
7) I showed that portable handheld oscillometry device was not easily susceptible to
artefacts caused by small deviations in the recommended positioning of the head
and neck during oscillometry.
6.5 Suggestions for Future Research
There are several possible research questions that may be pursued as a result of the
studies in my thesis.
6.5.1 Upright and supine respiratory mechanics in obese subjects with asthma and
changes following bariatric surgery
The weight loss study described in this thesis focused only on obese subjects without
asthma because we wanted to explore the respiratory symptoms of obesity by itself. A
future direction for research would be to replicate this study in obese subjects with
134
asthma and compare the results to those without asthma. Compared to healthy weight
individuals, asthma is more severe in obese individuals [55] and several studies have
shown that obese asthmatics are less likely to respond favorably to controller therapies
[4]. There are several types of controller therapies available for treating asthma. These
include: inhaled short-acting beta2 adrenergic agonist, inhaled corticosteroids (ICS),
inhaled long acting beta2 adrenergic agonist (LABA), leukotriene receptor antagonist
(LTRA) and monoclonal antibodies such as omalizumab. We have shown that response
to short-acting beta2 adrenergic agonist is attenuated in obese subjects without asthma but
the responsiveness to this bronchodilator is restored to the normal range following weight
loss. Given the clinical implications of this findings, it is important to conduct a similar
study in obese subjects with asthma since they are usually prescribed short-acting
bronchodilators for relief of sudden symptoms. This study would help determine whether
weight loss is effective in reversing asthma symptoms in obese individuals with asthma.
It would also help determine whether short acting bronchodilators become more effective
in these subjects after weight loss.
6.5.2 The contribution of chest wall and airway-parenchymal tethering to overall
mechanics of the respiratory system in obesity and the changes following weight loss
My thesis has shown that obesity significantly affected the impedance of the respiratory
system and significant changes in respiratory mechanics were measured with weight loss.
However, we were unable to quantitatively determine the relative contribution of the
chest wall and lungs to the overall changes in respiratory mechanics caused by obesity
and weight loss. A future study could quantify the contribution of the chest wall or lung
airways to the changes in pulmonary mechanics. Such a study would involve the use of
an esophageal balloon to differentiate lung from chest wall mechanics, and thus help
identify the degree of airway derecruitment occurring in obesity relative to changes in
chest wall.
135

6.5.3 Changes in upper airway geometry with weight loss assessed with dual-energy X-
ray absorptiometry
In Chapter 3, we speculated that two possible mechanisms could account for the lack of
BD responsiveness in our obese subjects prior to weight loss. One mechanism was that
prior to weight loss, most of the bronchodilator administered to the subjects was most
likely deposited within the oropharynx. However, with weight loss, there was a reduction
in the amount of redundant supraglottic oropharyngeal tissue and this resulted in the
exposure of these subjects to effectively higher doses of the drug. The increased
responsiveness to BD measured after weight loss in these subjects is therefore a direct
consequence of increased exposure to the drug. The second possible mechanism behind
the lack of BD responsiveness prior to weight loss has to do with the attenuation of
airway-parenchymal tethering forces with obesity. The increased responsiveness to BD is
therefore due to the restoration of the tethering forces with weight loss. A future study
could use imaging modalities such as dual-energy X-ray absorptiometry (DEXA) to
determine whether the reduction in the amount of redundant supraglottic oropharyngeal
tissue with weight loss correlates with the increase in BD responsiveness. The outcome of
the study on the contribution of chest wall mechanics and airway-parenchymal tethering
to changes in lung mechanics with weight loss suggested in 6.5.1 would also be pivotal
here because it would provide crucial information on whether effective airway-
parenchymal tethering is absolutely required for inhaled bronchodilators to take effect.
6.6 Conclusion
In conclusion, the work outlined in this thesis demonstrates that the oscillometry
technique is more sensitive than spirometry at measuring breathing difficulty. Changes in
respiratory mechanics induced by weight loss were detected with the oscillometry
technique as early as 5 weeks following bariatric surgery, but no significant changes in
spirometry outcomes were recorded even after 6 months of massive weight loss. This
thesis also demonstrates that portable handheld oscillometry is not easily susceptible to
upper airway artefacts caused by small deviations in recommended head-and-neck
136
positioning during oscillometry. Handheld oscillometry was shown to be highly
repeatable and highly reliable with low and acceptable variability. Taken together, these
findings provide important information on the clinical utility of handheld oscillometry as
a novel tool for assessment of respiratory mechanics.
137
References
[1] Sideleva O, Suratt B T, Black K E, Tharp W G, Pratley R E, Forgione P, Dienz O, Irvin C G and Dixon A E 2012 Obesity and asthma: an inflammatory disease of adipose tissue not the airway Am J Respir Crit Care Med 186 598-605
[2] Romero-Corral A, Caples S M, Lopez-Jimenez F and Somers V K 2010 Interactions between obesity and obstructive sleep apnea: implications for treatment Chest 137 711-9
[3] Piper A J and Grunstein R R 2011 Obesity hypoventilation syndrome: mechanisms and management Am J Respir Crit Care Med 183 292-8
[4] Sutherland E R, Goleva E, Strand M, Beuther D A and Leung D Y 2008 Body mass and glucocorticoid response in asthma Am J Respir Crit Care Med 178 682-7
[5] Camargo C A, Boulet L P, Sutherland E R, Busse W W, Yancey S W, Emmett A H, Ortega H G and Ferro T J 2010 Body mass index and response to asthma therapy: fluticasone propionate/salmeterol versus montelukast J Asthma 47 76-82
[6] Peters-Golden M, Swern A, Bird S S, Hustad C M, Grant E and Edelman J M 2006 Influence of body mass index on the response to asthma controller agents Eur Respir J 27 495-503
[7] Boulet L P and Franssen E 2007 Influence of obesity on response to fluticasone with or without salmeterol in moderate asthma Respir Med 101 2240-7
[8] Rodrigo G J and Plaza V 2007 Body mass index and response to emergency department treatment in adults with severe asthma exacerbations: a prospective cohort study Chest 132 1513-9
[9] Oppenheimer B W, Macht R, Goldring R M, Stabile A, Berger K I and Parikh M 2012 Distal airway dysfunction in obese subjects corrects after bariatric surgery Surg Obes Relat Dis 8 582-9
[10] Zerah-Lancner F, Boyer L, Rezaiguia-Delclaux S, D'Ortho M P, Drouot X, Guilloteau-Schoennagel I, Ribeil S, Delclaux C, Adnot S and Tayar C 2011 Airway responsiveness measured by forced oscillation technique in severely obese patients, before and after bariatric surgery J Asthma 48 818-23
138
[11] Al-Alwan A, Bates J H, Chapman D G, Kaminsky D A, DeSarno M J, Irvin C G and Dixon A E 2014 The nonallergic asthma of obesity. A matter of distal lung compliance Am J Respir Crit Care Med 189 1494-502
[12] Peppard P E, Ward N R and Morrell M J 2009 The impact of obesity on oxygen desaturation during sleep-disordered breathing Am J Respir Crit Care Med 180 788-93
[13] Ferretti A, Giampiccolo P, Cavalli A, Milic-Emili J and Tantucci C 2001 Expiratory flow limitation and orthopnea in massively obese subjects Chest 119 1401-8
[14] Timmins S C, Coatsworth N, Palnitkar G, Thamrin C, Farrow C E, Schoeffel R E, Berend N, Diba C, Salome C M and King G G 2012 Day-to-day variability of oscillatory impedance and spirometry in asthma and COPD Respir Physiol Neurobiol
[15] van den Elshout F J, van de Woestijne K P and Folgering H T 1990 Variations of respiratory impedance with lung volume in bronchial hyperreactivity Chest 98 358-64
[16] Macklem P T 1998 The mechanics of breathing Am J Respir Crit Care Med 157 S88-94
[17] Ward S A 2004 Physiology of breathing II Surgery (Oxford) 22 230-4
[18] Ward J 2005 Physiology of breathing I Surgery (Oxford) 23 419-24
[19] Weibel E 1963 Morphometry of the Human Lung (New York: Academic Press)
[20] Daniels C B and Orgeig S 2003 Pulmonary surfactant: the key to the evolution of air breathing News Physiol Sci 18 151-7
[21] Sideleva O and Dixon A E 2014 The many faces of asthma in obesity J Cell Biochem 115 421-6
[22] Schachter L M, Salome C M, Peat J K and Woolcock A J 2001 Obesity is a risk for asthma and wheeze but not airway hyperresponsiveness Thorax 56 4-8
[23] Sin D D, Jones R L and Man S F 2002 Obesity is a risk factor for dyspnea but not for airflow obstruction Arch Intern Med 162 1477-81
139
[24] Editorial Board Respiratory Diseases in Canada. Respiratory Diseases in Canada. Ottawa, ON: Canadian Lung Association, Health Canada, Statistics Canada, the Canadian Institute for Health Information; 2001. Available from: http://www.statcan.ca/
[25] BTS 2006 The Burden of Lung Disease. A Statistics Report from the British Thoracic Society - 2nd Edition.
[26] American Lung Association: Chronic Obstructive Pulmonary Disease (COPD) Fact Sheet. 2009. Available: http://www.lungusa.org [2009, 28 August]
[27] Canada S Table 105-0501 - Health indicator profile, annual estimates, by age group and sex, Canada, provinces, territories, health regions and peer groups.
[28] 2013 Annual Report. The Canadian Cystic Fibrosis Registry.
[29] Bateman E D, Hurd S S, Barnes P J, Bousquet J, Drazen J M, FitzGerald M, Gibson P, Ohta K, O'Byrne P, Pedersen S E, Pizzichini E, Sullivan S D, Wenzel S E and Zar H J 2008 Global strategy for asthma management and prevention: GINA executive summary Eur Respir J 31 143-78
[30] Hamid Q 2003 Gross pathology and histopathology of asthma J Allergy Clin Immunol 111 431-2
[31] Barbato A, Turato G, Baraldo S, Bazzan E, Calabrese F, Panizzolo C, Zanin M E, Zuin R, Maestrelli P, Fabbri L M and Saetta M 2006 Epithelial damage and angiogenesis in the airways of children with asthma Am J Respir Crit Care Med 174 975-81
[32] Laitinen L A, Laitinen A and Haahtela T 1993 Airway mucosal inflammation even in patients with newly diagnosed asthma Am Rev Respir Dis 147 697-704
[33] Bousquet J, Jeffery P K, Busse W W, Johnson M and Vignola A M 2000 Asthma. From bronchoconstriction to airways inflammation and remodeling Am J Respir Crit Care Med 161 1720-45
[34] Xiao C, Puddicombe S M, Field S, Haywood J, Broughton-Head V, Puxeddu I, Haitchi H M, Vernon-Wilson E, Sammut D, Bedke N, Cremin C, Sones J, Djukanović R, Howarth P H, Collins J E, Holgate S T, Monk P and Davies D E 2011 Defective epithelial barrier function in asthma J Allergy Clin Immunol 128 549-56.e1-12
140
[35] 1998 Worldwide variation in prevalence of symptoms of asthma, allergic rhinoconjunctivitis, and atopic eczema: ISAAC. The International Study of Asthma and Allergies in Childhood (ISAAC) Steering Committee Lancet 351 1225-32
[36] 2000 A Report from the National Asthma Control Task Force. The Prevention and Management of Asthma in Canada: A Major Challenge Now and in the Future.
[37] Akinbami, L. Asthma prevalence, Health Care Use and Mortality: United States, 2003-05. National Center for Health Statistics, Centers for Disease Control and Prevention, Available from: http://www.cdc.gov/nchs/data/hestat/asthma03-05/asthma03-05.htm. [2010, October 20th].
[38] Ford E S and Mannino D M 2005 Time trends in obesity among adults with asthma in the United States: findings from three national surveys J Asthma 42 91-5
[39] Asthma Burden in Europe.
[40] Krahn M D, Berka, C., Langlois, P., Detsky, A. S. 1996 Direct and indirect costs of asthma in Canada, 1990 CMAJ 154 821-31
[41] Mannino D M 2002 COPD* Chest 121 121S-6S
[42] James A L, Pare P D and Hogg J C 1989 The mechanics of airway narrowing in asthma Am Rev Respir Dis 139 242-6
[43] 2007 National Heart Lung and Blood Institute National Asthma Education and Prevention Program. Expert Panel Report 3: guidelines for the diagnosis and management of asthma. (Bethesda, MD
[44] Crapo R O, Casaburi R, Coates A L, Enright P L, Hankinson J L, Irvin C G, MacIntyre N R, McKay R T, Wanger J S, Anderson S D, Cockcroft D W, Fish J E and Sterk P J 2000 Guidelines for methacholine and exercise challenge testing-1999. This official statement of the American Thoracic Society was adopted by the ATS Board of Directors, July 1999 Am J Respir Crit Care Med 161 309-29
[45] Pellegrino R, Viegi G, Brusasco V, Crapo R O, Burgos F, Casaburi R, Coates A, van der Grinten C P, Gustafsson P, Hankinson J, Jensen R, Johnson D C, MacIntyre N, McKay R, Miller M R, Navajas D, Pedersen O F and Wanger J 2005 Interpretative strategies for lung function tests Eur Respir J 26 948-68
141
[46] Lougheed M D, Lemiere C, Ducharme F M, Licskai C, Dell S D, Rowe B H, Fitzgerald M, Leigh R, Watson W, Boulet L P and Assembly C T S A C 2012 Canadian Thoracic Society 2012 guideline update: diagnosis and management of asthma in preschoolers, children and adults Can Respir J 19 127-64
[47] Litonjua A A, Sparrow D, Celedon J C, DeMolles D and Weiss S T 2002 Association of body mass index with the development of methacholine airway hyperresponsiveness in men: the Normative Aging Study Thorax 57 581-5
[48] Celedón J C, Palmer L J, Litonjua A A, Weiss S T, Wang B, Fang Z and Xu X 2001 Body mass index and asthma in adults in families of subjects with asthma in Anqing, China Am J Respir Crit Care Med 164 1835-40
[49] Chinn S, Jarvis D, Burney P and Survey E C R H 2002 Relation of bronchial responsiveness to body mass index in the ECRHS. European Community Respiratory Health Survey Thorax 57 1028-33
[50] Sood A, Verhulst S J, Varma A, Eagleton L E, Henkle J Q and Hopkins-Price P 2006 Association of excess weight and degree of airway responsiveness in asthmatics and non-asthmatics J Asthma 43 447-52
[51] Shore S A 2010 Obesity, airway hyperresponsiveness, and inflammation J Appl Physiol (1985) 108 735-43
[52] Scott S, Currie J, Albert P, Calverley P and Wilding J P 2012 Risk of misdiagnosis, health-related quality of life, and BMI in patients who are overweight with doctor-diagnosed asthma Chest 141 616-24
[53] Aaron S D, Vandemheen K L, Boulet L P, McIvor R A, Fitzgerald J M, Hernandez P, Lemiere C, Sharma S, Field S K, Alvarez G G, Dales R E, Doucette S, Fergusson D and Consortium C R C R 2008 Overdiagnosis of asthma in obese and nonobese adults CMAJ 179 1121-31
[54] Wenzel S E 2006 Asthma: defining of the persistent adult phenotypes Lancet 368 804-13
[55] Moore W C, Meyers D A, Wenzel S E, Teague W G, Li H, Li X, D'Agostino R, Castro M, Curran-Everett D, Fitzpatrick A M, Gaston B, Jarjour N N, Sorkness R, Calhoun W J, Chung K F, Comhair S A, Dweik R A, Israel E, Peters S P, Busse W W, Erzurum S C, Bleecker E R and National Heart L n, and Blood Institute's Severe Asthma Research Program 2010 Identification of asthma phenotypes using cluster analysis in the Severe Asthma Research Program Am J Respir Crit Care Med 181 315-23
142
[56] Dixon A E, Pratley R E, Forgione P M, Kaminsky D A, Whittaker-Leclair L A, Griffes L A, Garudathri J, Raymond D, Poynter M E, Bunn J Y and Irvin C G 2011 Effects of obesity and bariatric surgery on airway hyperresponsiveness, asthma control, and inflammation J Allergy Clin Immunol 128 508-15.e1-2
[57] Holguin F, Bleecker E R, Busse W W, Calhoun W J, Castro M, Erzurum S C, Fitzpatrick A M, Gaston B, Israel E, Jarjour N N, Moore W C, Peters S P, Yonas M, Teague W G and Wenzel S E 2011 Obesity and asthma: an association modified by age of asthma onset J Allergy Clin Immunol 127 1486-93.e2
[58] Rabe K F, Hurd S, Anzueto A, Barnes P J, Buist S A, Calverley P, Fukuchi Y, Jenkins C, Rodriguez-Roisin R, van Weel C and Zielinski J 2007 Global strategy for the diagnosis, management, and prevention of chronic obstructive pulmonary disease: GOLD executive summary Am J Respir Crit Care Med 176 532-55
[59] Baraldo S, Turato G and Saetta M 2012 Pathophysiology of the small airways in chronic obstructive pulmonary disease Respiration 84 89-97
[60] Wiggs B R, Bosken C, Paré P D, James A and Hogg J C 1992 A model of airway narrowing in asthma and in chronic obstructive pulmonary disease Am Rev Respir Dis 145 1251-8
[61] Paré P D and Mitzner W 2012 Airway-parenchymal interdependence Compr Physiol 2 1921-35
[62] Siafakas N M, Vermeire P, Pride N B, Paoletti P, Gibson J, Howard P, Yernault J C, Decramer M, Higenbottam T and Postma D S 1995 Optimal assessment and management of chronic obstructive pulmonary disease (COPD). The European Respiratory Society Task Force Eur Respir J 8 1398-420
[63] 1995 Standards for the diagnosis and care of patients with chronic obstructive pulmonary disease. American Thoracic Society Am J Respir Crit Care Med 152 S77-121
[64] Global Initiative for Chronic Obstructive Lung Disease.
[65] Murray C J and Lopez A D 1997 Alternative projections of mortality and disability by cause 1990-2020: Global Burden of Disease Study Lancet 349 1498-504
[66] Miniño A M, Murphy S L, Xu J and Kochanek K D 2011 Deaths: final data for 2008 Natl Vital Stat Rep 59 1-126
143

[67] Lacasse Y, Brooks D and Goldstein R S 1999 Trends in the Epidemiology of COPD in Canada, 1980 to 1995* Chest 116 306-13
[68] Miller M R, Hankinson, J., Brusasco, V., Burgos, F., Casaburi, R., Coates, A., Crapo, R., Enright, P., van der Grinten C P, Gustafsson P, Jensen R, Johnson D C, MacIntyre N, McKay R, Navajas D, Pedersen O F, Pellegrino R, Viegi G and Wanger J 2005 Standardisation of spirometry Eur Respir J 26 319-38
[69] Hutchinson J 1846 On the capacity the lungs, and on the respiratory functions, with a view of establishing a precise and easy method of detecting disease by the spirometer. Medico-Chirurgical Transactions (London) 29 137-61
[70] Petty T L 2002 John Hutchinson's mysterious machine revisited Chest 121 219S-23S
[71] Enright P L, Lebowitz M D and Cockroft D W 1994 Physiologic measures: pulmonary function tests. Asthma outcome Am J Respir Crit Care Med 149 S9-18; discussion S9-20
[72] Vestbo J, Hurd S S, Agustí A G, Jones P W, Vogelmeier C, Anzueto A, Barnes P J, Fabbri L M, Martinez F J, Nishimura M, Stockley R A, Sin D D and Rodriguez-Roisin R 2013 Global strategy for the diagnosis, management, and prevention of chronic obstructive pulmonary disease: GOLD executive summary Am J Respir Crit Care Med 187 347-65
[73] Crapo R O, Morris A H and Gardner R M 1981 Reference spirometric values using techniques and equipment that meet ATS recommendations Am Rev Respir Dis 123 659-64
[74] Glindmeyer H W, Lefante J J, McColloster C, Jones R N and Weill H 1995 Blue-collar normative spirometric values for Caucasian and African-American men and women aged 18 to 65 Am J Respir Crit Care Med 151 412-22
[75] Langhammer A, Johnsen R, Gulsvik A, Holmen T L and Bjermer L 2001 Forced spirometry reference values for Norwegian adults: the Bronchial Obstruction in Nord-Trøndelag Study Eur Respir J 18 770-9
[76] Dykstra B J, Scanlon P D, Kester M M, Beck K C and Enright P L 1999 Lung volumes in 4,774 patients with obstructive lung disease Chest 115 68-74
[77] Vandevoorde J, Verbanck S, Schuermans D, Kartounian J and Vincken W 2005 FEV1/FEV6 and FEV6 as an alternative for FEV1/FVC and FVC in the spirometric detection of airway obstruction and restriction Chest 127 1560-4
144

[78] NHLBI/WHO workshop 1998. Global initiative for chronic obstructive lung disease. Global strategy for the diagnosis, management, and prevention of chronic obstructive pulmonary disease. Last updated: 2006. Available from: http://pharmacoclin.hug-ge.ch/formation/GOLD_WR_06.pdf [2009, August 28]
[79] Vandevoorde J, Verbanck S, Schuermans D, Broekaert L, Devroey D, Kartounian J and Vincken W 2008 Forced vital capacity and forced expiratory volume in six seconds as predictors of reduced total lung capacity Eur Respir J 31 391-5
[80] Boros P W, Franczuk M and Wesolowski S 2004 Value of spirometry in detecting volume restriction in interstitial lung disease patients. Spirometry in interstitial lung diseases Respiration 71 374-9
[81] Hyatt R E, Cowl C T, Bjoraker J A and Scanlon P D 2009 Conditions associated with an abnormal nonspecific pattern of pulmonary function tests Chest 135 419-24
[82] 1995 American Thoracic Society. Standardization of Spirometry, 1994 Update. Am J Respir Crit Care Med 152 1107-36
[83] Aggarwal A N and Agarwal R 2007 The new ATS/ERS guidelines for assessing the spirometric severity of restrictive lung disease differ from previous standards Respirology 12 759-62
[84] Macklem P T and Mead J 1967 Resistance of central and peripheral airways measured by a retrograde catheter J Appl Physiol 22 395-401
[85] Mead J 1970 The lung's "quiet zone" N Engl J Med 282 1318-9
[86] Levine G, Housley E, MacLeod P and Macklem P T 1970 Gas exchange abnormalities in mild bronchitis and asymptomatic asthma N Engl J Med 282 1277-82
[87] Hogg J C, Williams J, Richardson J B, Macklem P T and Thurlbeck W M 1970 Age as a factor in the distribution of lower-airway conductance and in the pathologic anatomy of obstructive lung disease N Engl J Med 282 1283-7
[88] Cosio M, Ghezzo H, Hogg J C, Corbin R, Loveland M, Dosman J and Macklem P T 1978 The relations between structural changes in small airways and pulmonary-function tests N Engl J Med 298 1277-81
145
[89] McFadden E R and Linden D A 1972 A reduction in maximum mid-expiratory flow rate. A spirographic manifestation of small airway disease Am J Med 52 725-37
[90] Gelb A F, Williams A J and Zamel N 1983 Spirometry. FEV1 vs FEF25-75 percent Chest 84 473-4
[91] Aaron S D, Dales R E and Cardinal P 1999 How accurate is spirometry at predicting restrictive pulmonary impairment? Chest 115 869-73
[92] Sorkness R L, Bleecker E R, Busse W W, Calhoun W J, Castro M, Chung K F, Curran-Everett D, Erzurum S C, Gaston B M, Israel E, Jarjour N N, Moore W C, Peters S P, Teague W G, Wenzel S E and National Heart L n, and Blood Institute Severe Asthma Research Program 2008 Lung function in adults with stable but severe asthma: air trapping and incomplete reversal of obstruction with bronchodilation J Appl Physiol (1985) 104 394-403
[93] Miller M R, Crapo R, Hankinson J, Brusasco V, Burgos F, Casaburi R, Coates A, Enright P, van der Grinten C P, Gustafsson P, Jensen R, Johnson D C, MacIntyre N, McKay R, Navajas D, Pedersen O F, Pellegrino R, Viegi G and Wanger J 2005 General considerations for lung function testing Eur Respir J 26 153-61
[94] Lavorini F 2013 The challenge of delivering therapeutic aerosols to asthma patients ISRN Allergy 2013 102418
[95] Kesten S and Rebuck A S 1994 Is the short-term response to inhaled beta-adrenergic agonist sensitive or specific for distinguishing between asthma and COPD? Chest 105 1042-5
[96] Richter D C, Joubert J R, Nell H, Schuurmans M M and Irusen E M 2008 Diagnostic value of post-bronchodilator pulmonary function testing to distinguish between stable, moderate to severe COPD and asthma Int J Chron Obstruct Pulmon Dis 3 693-9
[97] Dundas I, Chan E Y, Bridge P D and McKenzie S A 2005 Diagnostic accuracy of bronchodilator responsiveness in wheezy children Thorax 60 13-6
[98] Network B T S S I G 2008 British Guideline on the Management of Asthma Thorax 63 Suppl 4 iv1-121
[99] Herland K, Akselsen J P, Skjønsberg O H and Bjermer L 2005 How representative are clinical study patients with asthma or COPD for a larger "real life" population of patients with obstructive lung disease? Respir Med 99 11-9
146
[100] Boushey H A, Sorkness C A, King T S, Sullivan S D, Fahy J V, Lazarus S C, Chinchilli V M, Craig T J, Dimango E A, Deykin A, Fagan J K, Fish J E, Ford J G, Kraft M, Lemanske R F, Leone F T, Martin R J, Mauger E A, Pesola G R, Peters S P, Rollings N J, Szefler S J, Wechsler M E, Israel E and National Heart L n, and Blood Institute's Asthma Clinical Research Network 2005 Daily versus as-needed corticosteroids for mild persistent asthma N Engl J Med 352 1519-28
[101] Travers J, Marsh S, Williams M, Weatherall M, Caldwell B, Shirtcliffe P, Aldington S and Beasley R 2007 External validity of randomised controlled trials in asthma: to whom do the results of the trials apply? Thorax 62 219-23
[102] Castro-Rodríguez J A, Holberg C J, Morgan W J, Wright A L and Martinez F D 2001 Increased incidence of asthmalike symptoms in girls who become overweight or obese during the school years Am J Respir Crit Care Med 163 1344-9
[103] Barlow S E and Committee E 2007 Expert committee recommendations regarding the prevention, assessment, and treatment of child and adolescent overweight and obesity: summary report Pediatrics 120 Suppl 4 S164-92
[104] Tantisira K G, Litonjua A A, Weiss S T, Fuhlbrigge A L and Group C A M P R 2003 Association of body mass with pulmonary function in the Childhood Asthma Management Program (CAMP) Thorax 58 1036-41
[105] Dixon A E, Shade D M, Cohen R I, Skloot G S, Holbrook J T, Smith L J, Lima J J, Allayee H, Irvin C G, Wise R A and Centers A L A-A C R 2006 Effect of obesity on clinical presentation and response to treatment in asthma J Asthma 43 553-8
[106] Curry J J 1946 THE ACTION OF HISTAMINE ON THE RESPIRATORY TRACT IN NORMAL AND ASTHMATIC SUBJECTS J Clin Invest 25 785-91
[107] Curry J J 1947 COMPARATIVE ACTION OF ACETYL-BETA-METHYL CHOLINE AND HISTAMINE ON THE RESPIRATORY TRACT IN NORMALS, PATIENTS WITH HAY FEVER, AND SUBJECTS WITH BRONCHIAL ASTHMA J Clin Invest 26 430-8
[108] Murray A B, Ferguson A C and Morrison B 1981 Airway responsiveness to histamine as a test for overall severity of asthma in children J Allergy Clin Immunol 68 119-24
147

[109] Sterk P J, Fabbri L M, Quanjer P H, Cockcroft D W, O'Byrne P M, Anderson S D, Juniper E F and Malo J L 1993 Airway responsiveness. Standardized challenge testing with pharmacological, physical and sensitizing stimuli in adults. Report Working Party Standardization of Lung Function Tests, European Community for Steel and Coal. Official Statement of the European Respiratory Society Eur Respir J Suppl 16 53-83
[110] Program N A E a P 2007 Expert Panel Report 3 (EPR-3): Guidelines for the Diagnosis and Management of Asthma-Summary Report 2007 J Allergy Clin Immunol 120 S94-138
[111] Chai H, Farr R S, Froehlich L A, Mathison D A, McLean J A, Rosenthal R R, Sheffer A L, Spector S L and Townley R G 1975 Standardization of bronchial inhalation challenge procedures J Allergy Clin Immunol 56 323-7
[112] Cockcroft D W, Murdock K Y, Berscheid B A and Gore B P 1992 Sensitivity and specificity of histamine PC20 determination in a random selection of young college students J Allergy Clin Immunol 89 23-30
[113] Woolcock A J, Salome C M and Yan K 1984 The shape of the dose-response curve to histamine in asthmatic and normal subjects Am Rev Respir Dis 130 71-5
[114] Schneider A, Gindner L, Tilemann L, Schermer T, Dinant G J, Meyer F J and Szecsenyi J 2009 Diagnostic accuracy of spirometry in primary care BMC Pulm Med 9 31
[115] Enright P L 2015 COUNTERPOINT: Should Oscillometry Be Used to Screen for Airway Disease? No Chest 148 1135-7
[116] Kanengiser S and Dozor A J 1994 Forced expiratory maneuvers in children aged 3 to 5 years Pediatr Pulmonol 18 144-9
[117] Zerah F, Harf A, Perlemuter L, Lorino H, Lorino A M and Atlan G 1993 Effects of obesity on respiratory resistance Chest 103 1470-6
[118] Lazarus R, Sparrow D and Weiss S T 1997 Effects of obesity and fat distribution on ventilatory function: the normative aging study Chest 111 891-8
[119] Rubinstein I, Zamel N, DuBarry L and Hoffstein V 1990 Airflow limitation in morbidly obese, nonsmoking men Ann Intern Med 112 828-32
148
[120] Chapman K R, Boulet L P, Rea R M and Franssen E 2008 Suboptimal asthma control: prevalence, detection and consequences in general practice Eur Respir J 31 320-5
[121] LindenSmith J, Morrison D, Deveau C and Hernandez P 2004 Overdiagnosis of asthma in the community Can Respir J 11 111-6
[122] Lötvall J, Inman M and O'Byrne P 1998 Measurement of airway hyperresponsiveness: new considerations Thorax 53 419-24
[123] Lusuardi M, De Benedetto F, Paggiaro P, Sanguinetti C M, Brazzola G, Ferri P and Donner C F 2006 A randomized controlled trial on office spirometry in asthma and COPD in standard general practice: data from spirometry in Asthma and COPD: a comparative evaluation Italian study Chest 129 844-52
[124] Yawn B P, Enright P L, Lemanske R F, Israel E, Pace W, Wollan P and Boushey H 2007 Spirometry can be done in family physicians' offices and alters clinical decisions in management of asthma and COPD Chest 132 1162-8
[125] Stanbrook M B and Kaplan A 2008 The error of not measuring asthma CMAJ 179 1099-102
[126] He X O, D'Urzo A, Jugovic P, Jhirad R, Sehgal P and Lilly E 2015 Differences in spirometry interpretation algorithms: influence on decision making among primary-care physicians NPJ Prim Care Respir Med 25 15008
[127] Wanger J, Clausen J L, Coates A, Pedersen O F, Brusasco V, Burgos F, Casaburi R, Crapo R, Enright P, van der Grinten C P, Gustafsson P, Hankinson J, Jensen R, Johnson D, Macintyre N, McKay R, Miller M R, Navajas D, Pellegrino R and Viegi G 2005 Standardisation of the measurement of lung volumes Eur Respir J 26 511-22
[128] Stocks J, Godfrey S, Beardsmore C, Bar-Yishay E, Castile R and Society E A T F o S f I R F T E R S A T 2001 Plethysmographic measurements of lung volume and airway resistance. ERS/ATS Task Force on Standards for Infant Respiratory Function Testing. European Respiratory Society/ American Thoracic Society Eur Respir J 17 302-12
[129] Dubois A B, Botelho S Y and Comroe J H, Jr. 1956 A new method for measuring airway resistance in man using a body plethysmograph: values in normal subjects and in patients with respiratory disease J Clin Invest 35 327-35
149
[130] Brown R, Leith D E and Enright P L 1998 Multiple breath helium dilution measurement of lung volumes in adults Eur Respir J 11 246-55
[131] Sivan Y, Hammer J and Newth C J 1994 Measurement of high lung volumes by nitrogen washout method J Appl Physiol (1985) 77 1562-4
[132] McNulty W and Usmani O S 2014 Techniques of assessing small airways dysfunction 2014
[133] Dubois A B, Botelho S Y, Bedell G N, Marshall R and Comroe J H, Jr. 1956 A rapid plethysmographic method for measuring thoracic gas volume: a comparison with a nitrogen washout method for measuring functional residual capacity in normal subjects J Clin Invest 35 322-6
[134] Coates A L, Peslin R, Rodenstein D and Stocks J 1997 Measurement of lung volumes by plethysmography Eur Respir J 10 1415-27
[135] Bates J 1989 Correcting for the thermodynamic characteristics of a body plethysmograph Annals of Biomedical Engineering 17 647
[136] Criée C P, Sorichter S, Smith H J, Kardos P, Merget R, Heise D, Berdel D, Köhler D, Magnussen H, Marek W, Mitfessel H, Rasche K, Rolke M, Worth H, Jörres R A and Care W G f B P o t G S f P a R 2011 Body plethysmography--its principles and clinical use Respir Med 105 959-71
[137] Quanjer P H, Tammeling G J, Cotes J E, Pedersen O F, Peslin R and Yernault J C 1993 Lung volumes and forced ventilatory flows. Report Working Party Standardization of Lung Function Tests, European Community for Steel and Coal. Official Statement of the European Respiratory Society Eur Respir J Suppl 16 5-40
[138] Quanjer J S a P 1995 Reference values for residual volume, functional residual capacity and total lung capacity. ATS Workshop on Lung Volume Measurements. Official Statement of The European Respiratory Society Eur Respir J 8: 492-506
[139] BEDELL G N, WILSON W R and SEEBOHM P M 1958 Pulmonary function in obese persons J Clin Invest 37 1049-60
[140] Barrera F, Reidenberg M M and Winters W L 1967 Pulmonary function in the obese patient Am J Med Sci 254 785-96
[141] GILBERT R, SIPPLE J H and AUCHINCLOSS J H 1961 Respiratory control and work of breathing in obese subjects J Appl Physiol 16 21-6
150

[142] Emirgil C and Sobol B J 1973 The effects of weight reduction on pulmonary function and the sensitivity of the respiratory center in obesity Am Rev Respir Dis 108 831-42
[143] Ray C S, Sue D Y, Bray G, Hansen J E and Wasserman K 1983 Effects of obesity on respiratory function Am Rev Respir Dis 128 501-6
[144] Thomas P S, Cowen E R, Hulands G and Milledge J S 1989 Respiratory function in the morbidly obese before and after weight loss Thorax 44 382-6
[145] NAIMARK A and CHERNIACK R M 1960 Compliance of the respiratory system and its components in health and obesity J Appl Physiol 15 377-82
[146] Sharp J T, Henry J P, Sweany S K, Meadows W R and Pietras R J 1964 Effects of mass loading the respiratory system in man J Appl Physiol 19 959-66
[147] Watson R A and Pride N B 2005 Postural changes in lung volumes and respiratory resistance in subjects with obesity J Appl Physiol 98 512-7
[148] Sampson M G and Grassino A E 1983 Load compensation in obese patients during quiet tidal breathing J Appl Physiol Respir Environ Exerc Physiol 55 1269-76
[149] Collins L C, Hoberty P D, Walker J F, Fletcher E C and Peiris A N 1995 The effect of body fat distribution on pulmonary function tests Chest 107 1298-302
[150] Owens M W, Kinasewitz G T and Anderson W M 1987 Clinical significance of an isolated reduction in residual volume Am Rev Respir Dis 136 1377-80
[151] Yernault J C and Gibson G J 1982 Interactions between lung and chest wall in restrictive ventilatory defects Bull Eur Physiopathol Respir 18 395-401
[152] Iyer V N, Schroeder D R, Parker K O, Hyatt R E and Scanlon P D 2011 The nonspecific pulmonary function test: longitudinal follow-up and outcomes Chest 139 878-86
[153] Dubois A B, Brody A W, Lewis D H and Burgess B F, Jr. 1956 Oscillation mechanics of lungs and chest in man J Appl Physiol 8 587-94
[154] Landser F J, Nagles J, Demedts M, Billiet L and van de Woestijne K P 1976 A new method to determine frequency characteristics of the respiratory system J Appl Physiol 41 101-6
151
[155] Nagels J, Landser F J, van der Linden L, Clement J and Van de Woestijne K P 1980 Mechanical properties of lungs and chest wall during spontaneous breathing J Appl Physiol 49 408-16
[156] Smith H J, Reinhold, P., Goldman, M. D. 2005 Forced oscillation technique and impulse oscillometry European Respiratory Monograph 31 72 - 105
[157] OTIS A B, MCKERROW C B, BARTLETT R A, MEAD J, MCILROY M B, SELVER-STONE N J and RADFORD E P 1956 Mechanical factors in distribution of pulmonary ventilation. J Appl Physiol 8 427-43
[158] Grimby G, Takishima T, Graham W, Macklem P and Mead J 1968 Frequency dependence of flow resistance in patients with obstructive lung disease. J Clin Invest 47 1455-65
[159] OTIS A, MCKERROW C, BARTLETT R, MEAD J, MCILROY M, SELVER-STONE N and RADFORD E J 1956 Mechanical factors in distribution of pulmonary ventilation. J Appl Physiol 8 427-43
[160] Kaczka D W, Ingenito E P, Body S C, Duffy S E, Mentzer S J, DeCamp M M and Lutchen K R 2001 Inspiratory lung impedance in COPD: effects of PEEP and immediate impact of lung volume reduction surgery J Appl Physiol 90 1833-41
[161] Pasker H G, Mertens I, Clement J, Van de Woestijne KPP 1994 Normal values of total respiratory input resistance and reactance for adult men and women Eur Respir Rev 4 134-7
[162] Dellaca R L, Andersson Olerud M, Zannin E, Kostic P, Pompilio P P, Hedenstierna G, Pedotti A and Frykholm P 2009 Lung recruitment assessed by total respiratory system input reactance. Intensive Care Med 35 2164-72
[163] Dellaca R L, Santus P, Aliverti A, Stevenson N, Centanni S, Macklem P T, Pedotti A and Calverley P M 2004 Detection of expiratory flow limitation in COPD using the forced oscillation technique Eur Respir J 23 232-40
[164] Fisher A, DuBois A and Hyde R 1968 Evaluation of the forced oscillation technique for the determination of resistance to breathing. J Clin Invest 47 2045-57
[165] Peslin R, Papon J, Duviver C and Richalet J 1975 Frequency response of the chest: modeling and parameter estimation. J Appl Physiol 39 523-34
152

[166] Michaelson E D, Grassman E D and Peters W R 1975 Pulmonary mechanics by spectral analysis of forced random noise J Clin Invest 56 1210-30
[167] Cavalcanti J V, Lopes A J, Jansen J M and Melo P L 2006 Detection of changes in respiratory mechanics due to increasing degrees of airway obstruction in asthma by the forced oscillation technique Respir Med 100 2207-19
[168] Cavalcanti J V, Lopes A J, Jansen J M and de Melo P L 2006 Using the forced oscillation technique to evaluate bronchodilator response in healthy volunteers and in asthma patients presenting a verified positive response J Bras Pneumol 32 91-8
[169] Oppenheimer B W, Goldring R M, Herberg M E, Hofer I S, Reyfman P A, Liautaud S, Rom W N, Reibman J and Berger K I 2007 Distal airway function in symptomatic subjects with normal spirometry following World Trade Center dust exposure Chest 132 1275-82
[170] Johnson M K, Birch M, Carter R, Kinsella J and Stevenson R D 2005 Use of reactance to estimate transpulmonary resistance Eur Respir J 25 1061-9
[171] Paredi P, Goldman M, Alamen A, Ausin P, Usmani O S, Pride N B and Barnes P J 2010 Comparison of inspiratory and expiratory resistance and reactance in patients with asthma and chronic obstructive pulmonary disease Thorax 65 263-7
[172] Postma D S and Rabe K F 2015 The Asthma-COPD Overlap Syndrome N Engl J Med 373 1241-9
[173] Bates J H, Irvin C G, Farré R and Hantos Z 2011 Oscillation mechanics of the respiratory system Compr Physiol 1 1233-72
[174] Vink G R, Arets H G, van der Laag J and van der Ent C K 2003 Impulse oscillometry: a measure for airway obstruction Pediatr Pulmonol 35 214-9
[175] Di Mango A M, Lopes A J, Jansen J M and Melo P L 2006 Changes in respiratory mechanics with increasing degrees of airway obstruction in COPD: detection by forced oscillation technique Respir Med 100 399-410
[176] Friedman S M, Maslow C B, Reibman J, Pillai P S, Goldring R M, Farfel M R, Stellman S D and Berger K I 2011 Case-control study of lung function in World Trade Center Health Registry area residents and workers Am J Respir Crit Care Med 184 582-9
153
[177] Oostveen E, MacLeod D, Lorino H, Farre R, Hantos Z, Desager K and Marchal F 2003 The forced oscillation technique in clinical practice: methodology, recommendations and future developments Eur Respir J 22 1026-41
[178] Bates J H T 2009 Lung mechanics : an inverse modeling approach (Cambridge, UK ; New York: Cambridge University Press)
[179] Kirsten A M, Watz H, Brindicci C, Piccinno A and Magnussen H 2015 Effects of beclomethason/formoterol and budesonide/formoterol fixed combinations on lung function and airway inflammation in patients with mild to moderate asthma--an exploratory study Pulm Pharmacol Ther 31 79-84
[180] Ducharme F and Davis G 1998 Respiratory resistance in the emergency department: a reproducible and responsive measure of asthma severity. Chest 113 1566-72
[181] Carvalhaes-Neto N, Lorino H, Gallinari C, Escolano S, Mallet A, Zerah F, Harf A and Macquin-Mavier I 1995 Cognitive function and assessment of lung function in the elderly. Am J Respir Crit Care Med 152 1611-5
[182] Ducharme F M, Davis G M and Ducharme G R 1998 Pediatric reference values for respiratory resistance measured by forced oscillation Chest 113 1322-8
[183] Janssens J P, Nguyen M C, Herrmann F R and Michel J P 2001 Diagostic value of respiratory impedance measurements in elderly subjects Respiratory Medicine 95 415-22
[184] Desager K N, Buhr W, Willemen M, van Bever H P, de Backer W, Vermeire P A and Landser F J 1991 Measurement of total respiratory impedance in infants by the forced oscillation technique J Appl Physiol 71 770-6
[185] Srikasibhandha S 1983 [Measurement of respiratory resistance in newborn infants with the oscillation method] Anaesthesist 32 214-8
[186] Peslin R, Felicio da Silva J, Duvivier C and Chabot F 1993 Respiratory mechanics studied by forced oscillations during artificial ventilation Eur Respir J 6 772-84
[187] Van de Woestijne K P 1993 The forced oscillation technique in intubated, mechanically-ventilated patients Eur Respir J 6 767-9
154

[188] van Noord J A, Clement J, van de Woestijne K P and Demedts M 1989 Total respiratory resistance and reactance as a measurement of response to bronchial challenge with histamine Am Rev Respir Dis 139 921-6
[189] Delacourt C, Lorino H, Herve-Guillot M, Reinert P, Harf A and Housset B 2000 Use of the forced oscillation technique to assess airway obstruction and reversibility in children Am J Respir Crit Care Med 161 730-6
[190] HAYDEN MARK J, PETAK F, HANTOS Z, HALL G and SLY PETER D 1998 Using Low-frequency Oscillation to Detect Bronchodilator Responsiveness in Infants Am. J. Respir. Crit. Care Med. 157 574-9
[191] Hellinckx J, De Boeck K and Demedts M 1998 No paradoxical bronchodilator response with forced oscillation technique in children with cystic fibrosis Chest 113 55-9
[192] Klug B and Bisgaard H 1996 Measurement of lung function in awake 2-4-year-old asthmatic children during methacholine challenge and acute asthma: a comparison of the impulse oscillation technique, the interrupter technique, and transcutaneous measurement of oxygen versus whole-body plethysmography Pediatr Pulmonol 21 290-300
[193] Clement J, Landser F J and Van de Woestijne K P 1983 Total resistance and reactance in patients with respiratory complaints with and without airways obstruction Chest 83 215-20
[194] Gimeno F, van der Weele L T, Koeter G H and van Altena R 1992 Forced oscillation technique. Reference values for total respiratory resistance obtained with the Siemens Siregnost FD5 Ann Allergy 68 155-8
[195] Dellacà R L, Duffy N, Pompilio P P, Aliverti A, Koulouris N G, Pedotti A and Calverley P M 2007 Expiratory flow limitation detected by forced oscillation and negative expiratory pressure Eur Respir J 29 363-74
[196] Oostveen E, Boda K, van der Grinten C P, James A L, Young S, Nieland H and Hantos Z 2013 Respiratory impedance in healthy subjects: baseline values and bronchodilator response Eur Respir J 42 1513-23
[197] Calverley P M and Farre R 2013 Putting noninvasive lung mechanics into context Eur Respir J 42 1435-7
155

[198] 1998 Clinical Guidelines on the Identification, Evaluation, and Treatment of Overweight and Obesity in Adults--The Evidence Report. National Institutes of Health Obes Res 6 Suppl 2 51S-209S
[199] Krebs N F, Himes J H, Jacobson D, Nicklas T A, Guilday P and Styne D 2007 Assessment of child and adolescent overweight and obesity Pediatrics 120 Suppl 4 S193-228
[200] Cole T J, Bellizzi M C, Flegal K M and Dietz W H 2000 Establishing a standard definition for child overweight and obesity worldwide: international survey BMJ 320 1240-3
[201] Schatz M, Hsu J W, Zeiger R S, Chen W, Dorenbaum A, Chipps B E and Haselkorn T 2014 Phenotypes determined by cluster analysis in severe or difficult-to-treat asthma J Allergy Clin Immunol 133 1549-56
[202] Mosen D M, Schatz M, Magid D J and Camargo C A 2008 The relationship between obesity and asthma severity and control in adults J Allergy Clin Immunol 122 507-11.e6
[203] Simard B, Turcotte H, Marceau P, Biron S, Hould F S, Lebel S, Marceau S and Boulet L P 2004 Asthma and sleep apnea in patients with morbid obesity: outcome after bariatric surgery Obes Surg 14 1381-8
[204] Boulet L P, Turcotte H, Martin J and Poirier P 2012 Effect of bariatric surgery on airway response and lung function in obese subjects with asthma Respir Med 106 651-60
[205] Scott H A, Gibson P G, Garg M L, Pretto J J, Morgan P J, Callister R and Wood L G 2013 Dietary restriction and exercise improve airway inflammation and clinical outcomes in overweight and obese asthma: a randomized trial Clin Exp Allergy 43 36-49
[206] Beuther D A and Sutherland E R 2007 Overweight, obesity, and incident asthma: a meta-analysis of prospective epidemiologic studies Am J Respir Crit Care Med 175 661-6
[207] Hakala K, Stenius-Aarniala B and Sovijärvi A 2000 Effects of weight loss on peak flow variability, airways obstruction, and lung volumes in obese patients with asthma Chest 118 1315-21
156

[208] Sutherland T J, McLachlan C R, Sears M R, Poulton R and Hancox R J 2016 The relationship between body fat and respiratory function in young adults Eur Respir J
[209] Weisberg S P, McCann D, Desai M, Rosenbaum M, Leibel R L and Ferrante A W 2003 Obesity is associated with macrophage accumulation in adipose tissue J Clin Invest 112 1796-808
[210] Strissel K J, Stancheva Z, Miyoshi H, Perfield J W, DeFuria J, Jick Z, Greenberg A S and Obin M S 2007 Adipocyte death, adipose tissue remodeling, and obesity complications Diabetes 56 2910-8
[211] Travers R L, Motta A C, Betts J A, Bouloumié A and Thompson D 2015 The impact of adiposity on adipose tissue-resident lymphocyte activation in humans Int J Obes (Lond) 39 762-9
[212] Rausch M E, Weisberg S, Vardhana P and Tortoriello D V 2008 Obesity in C57BL/6J mice is characterized by adipose tissue hypoxia and cytotoxic T-cell infiltration Int J Obes (Lond) 32 451-63
[213] Winer S, Chan Y, Paltser G, Truong D, Tsui H, Bahrami J, Dorfman R, Wang Y, Zielenski J, Mastronardi F, Maezawa Y, Drucker D J, Engleman E, Winer D and Dosch H M 2009 Normalization of obesity-associated insulin resistance through immunotherapy Nat Med 15 921-9
[214] Spencer L A and Weller P F 2010 Eosinophils and Th2 immunity: contemporary insights Immunol Cell Biol 88 250-6
[215] Wu D, Molofsky A B, Liang H E, Ricardo-Gonzalez R R, Jouihan H A, Bando J K, Chawla A and Locksley R M 2011 Eosinophils sustain adipose alternatively activated macrophages associated with glucose homeostasis Science 332 243-7
[216] Nijhuis J, Rensen S S, Slaats Y, van Dielen F M, Buurman W A and Greve J W 2009 Neutrophil activation in morbid obesity, chronic activation of acute inflammation Obesity (Silver Spring) 17 2014-8
[217] Ciepiela O, Ostafin M and Demkow U 2015 Neutrophils in asthma--a review Respir Physiol Neurobiol 209 13-6
[218] Poglio S, De Toni-Costes F, Arnaud E, Laharrague P, Espinosa E, Casteilla L and Cousin B 2010 Adipose tissue as a dedicated reservoir of functional mast cell progenitors Stem Cells 28 2065-72
157

[219] Liu J, Divoux A, Sun J, Zhang J, Clément K, Glickman J N, Sukhova G K, Wolters P J, Du J, Gorgun C Z, Doria A, Libby P, Blumberg R S, Kahn B B, Hotamisligil G S and Shi G P 2009 Genetic deficiency and pharmacological stabilization of mast cells reduce diet-induced obesity and diabetes in mice Nat Med 15 940-5
[220] Considine R V, Sinha M K, Heiman M L, Kriauciunas A, Stephens T W, Nyce M R, Ohannesian J P, Marco C C, McKee L J and Bauer T L 1996 Serum immunoreactive-leptin concentrations in normal-weight and obese humans N Engl J Med 334 292-5
[221] Bruno A, Pace E, Chanez P, Gras D, Vachier I, Chiappara G, La Guardia M, Gerbino S, Profita M and Gjomarkaj M 2009 Leptin and leptin receptor expression in asthma J Allergy Clin Immunol 124 230-7, 7.e1-4
[222] Van Heek M, Compton D S, France C F, Tedesco R P, Fawzi A B, Graziano M P, Sybertz E J, Strader C D and Davis H R 1997 Diet-induced obese mice develop peripheral, but not central, resistance to leptin J Clin Invest 99 385-90
[223] Reaven G M 1995 Pathophysiology of insulin resistance in human disease Physiol Rev 75 473-86
[224] Bulló M, Garcia-Lorda P and Salas-Salvadó J 2002 Plasma soluble tumor necrosis factor alpha receptors and leptin levels in normal-weight and obese women: effect of adiposity and diabetes Eur J Endocrinol 146 325-31
[225] Bulló M, García-Lorda P, Megias I and Salas-Salvadó J 2003 Systemic inflammation, adipose tissue tumor necrosis factor, and leptin expression Obes Res 11 525-31
[226] Bastard J P, Jardel C, Bruckert E, Blondy P, Capeau J, Laville M, Vidal H and Hainque B 2000 Elevated levels of interleukin 6 are reduced in serum and subcutaneous adipose tissue of obese women after weight loss J Clin Endocrinol Metab 85 3338-42
[227] Roth C L, Kratz M, Ralston M M and Reinehr T 2011 Changes in adipose-derived inflammatory cytokines and chemokines after successful lifestyle intervention in obese children Metabolism 60 445-52
[228] Zaldivar F, McMurray R G, Nemet D, Galassetti P, Mills P J and Cooper D M 2006 Body fat and circulating leukocytes in children Int J Obes (Lond) 30 906-11
158
[229] Zhou B O, Yue R, Murphy M M, Peyer J G and Morrison S J 2014 Leptin-receptor-expressing mesenchymal stromal cells represent the main source of bone formed by adult bone marrow Cell Stem Cell 15 154-68
[230] Lord G M, Matarese G, Howard J K, Baker R J, Bloom S R and Lechler R I 1998 Leptin modulates the T-cell immune response and reverses starvation-induced immunosuppression Nature 394 897-901
[231] Scott H A, Gibson P G, Garg M L and Wood L G 2011 Airway inflammation is augmented by obesity and fatty acids in asthma Eur Respir J 38 594-602
[232] van Veen I H, Ten Brinke A, Sterk P J, Rabe K F and Bel E H 2008 Airway inflammation in obese and nonobese patients with difficult-to-treat asthma Allergy 63 570-4
[233] Shore S A, Rivera-Sanchez Y M, Schwartzman I N and Johnston R A 2003 Responses to ozone are increased in obese mice J Appl Physiol (1985) 95 938-45
[234] Lu F L, Johnston R A, Flynt L, Theman T A, Terry R D, Schwartzman I N, Lee A and Shore S A 2006 Increased pulmonary responses to acute ozone exposure in obese db/db mice Am J Physiol Lung Cell Mol Physiol 290 L856-65
[235] Johnston R A, Theman T A and Shore S A 2006 Augmented responses to ozone in obese carboxypeptidase E-deficient mice Am J Physiol Regul Integr Comp Physiol 290 R126-33
[236] Sood A, Ford E S and Camargo C A 2006 Association between leptin and asthma in adults Thorax 61 300-5
[237] Mai X M, Böttcher M F and Leijon I 2004 Leptin and asthma in overweight children at 12 years of age Pediatr Allergy Immunol 15 523-30
[238] Johnston R A, Theman T A, Lu F L, Terry R D, Williams E S and Shore S A 2008 Diet-induced obesity causes innate airway hyperresponsiveness to methacholine and enhances ozone-induced pulmonary inflammation J Appl Physiol (1985) 104 1727-35
[239] Holguin F, Rojas M, Brown L A and Fitzpatrick A M 2011 Airway and plasma leptin and adiponectin in lean and obese asthmatics and controls J Asthma 48 217-23
159

[240] Watson R A, Pride N B, Thomas E L, Fitzpatrick J, Durighel G, McCarthy J, Morin S X, Ind P W and Bell J D 2010 Reduction of total lung capacity in obese men: comparison of total intrathoracic and gas volumes J Appl Physiol (1985) 108 1605-12
[241] Behazin N, Jones S B, Cohen R I and Loring S H 2010 Respiratory restriction and elevated pleural and esophageal pressures in morbid obesity J Appl Physiol (1985) 108 212-8
[242] Li A M, Chan D, Wong E, Yin J, Nelson E A and Fok T F 2003 The effects of obesity on pulmonary function Arch Dis Child 88 361-3
[243] Jones R L and Nzekwu M M 2006 The effects of body mass index on lung volumes Chest 130 827-33
[244] 2013 Obesity and lung disease: A guide to management (New York: Springer)
[245] Pelosi P, Croci M, Ravagnan I, Tredici S, Pedoto A, Lissoni A and Gattinoni L 1998 The effects of body mass on lung volumes, respiratory mechanics, and gas exchange during general anesthesia Anesth Analg 87 654-60
[246] Hedenstierna G and Santesson J 1976 Breathing mechanics, dead space and gas exchange in the extremely obese, breathing spontaneously and during anaesthesia with intermittent positive pressure ventilation Acta Anaesthesiol Scand 20 248-54
[247] SHARP J T, HENRY J P, SWEANY S K, MEADOWS W R and PIETRAS R J 1964 THE TOTAL WORK OF BREATHING IN NORMAL AND OBESE MEN J Clin Invest 43 728-39
[248] Chapman D G, Irvin C G, Kaminsky D A, Forgione P M, Bates J H and Dixon A E 2014 Influence of distinct asthma phenotypes on lung function following weight loss in the obese Respirology 19 1170-7
[249] Chapman D G, Berend N, King G G and Salome C M 2008 Increased airway closure is a determinant of airway hyperresponsiveness Eur Respir J 32 1563-9
[250] Pellegrino R, Gobbi A, Antonelli A, Torchio R, Gulotta C, Pellegrino G M, Dellacà R, Hyatt R E and Brusasco V 2014 Ventilation heterogeneity in obesity J Appl Physiol (1985) 116 1175-81
[251] Bustos P, Amigo H, Oyarzún M and Rona R J 2005 Is there a causal relation between obesity and asthma? Evidence from Chile Int J Obes (Lond) 29 804-9
160
[252] Aaron S D, Fergusson D, Dent R, Chen Y, Vandemheen K L and Dales R E 2004 Effect of weight reduction on respiratory function and airway reactivity in obese women Chest 125 2046-52
[253] Naoum C, Kritharides L, Ing A, Falk G L and Yiannikas J 2015 Changes in lung volumes and gas trapping in patients with large hiatal hernia Clin Respir J
[254] Salome C M, Munoz P A, Berend N, Thorpe C W, Schachter L M and King G G 2008 Effect of obesity on breathlessness and airway responsiveness to methacholine in non-asthmatic subjects Int J Obes (Lond) 32 502-9
[255] Ding D J, Martin J G and Macklem P T 1987 Effects of lung volume on maximal methacholine-induced bronchoconstriction in normal humans J Appl Physiol 62 1324-30
[256] van Noord J A, Demedts M, Clément J, Cauberghs M and Van de Woestijne K P 1986 Effect of rib cage and abdominal restriction on total respiratory resistance and reactance J Appl Physiol 61 1736-40
[257] Torchio R, Gulotta C, Ciacco C, Perboni A, Guglielmo M, Crosa F, Zerbini M, Brusasco V, Hyatt R E and Pellegrino R 2006 Effects of chest wall strapping on mechanical response to methacholine in humans J Appl Physiol (1985) 101 430-8
[258] Navajas D, Farre R, Rotger M M, Milic-Emili J and Sanchis J 1988 Effect of body posture on respiratory impedance J Appl Physiol 64 194-9
[259] Fredberg J J, Inouye D S, Mijailovich S M and Butler J P 1999 Perturbed equilibrium of myosin binding in airway smooth muscle and its implications in bronchospasm Am J Respir Crit Care Med 159 959-67
[260] Shen X, Wu M F, Tepper R S and Gunst S J 1997 Mechanisms for the mechanical response of airway smooth muscle to length oscillation J Appl Physiol (1985) 83 731-8
[261] Wang L, Paré P D and Seow C Y 2001 Selected contribution: effect of chronic passive length change on airway smooth muscle length-tension relationship J Appl Physiol (1985) 90 734-40
[262] Gunst S J, Meiss R A, Wu M F and Rowe M 1995 Mechanisms for the mechanical plasticity of tracheal smooth muscle Am J Physiol 268 C1267-76
161
[263] Gunst S J and Wu M F 2001 Selected contribution: plasticity of airway smooth muscle stiffness and extensibility: role of length-adaptive mechanisms J Appl Physiol (1985) 90 741-9
[264] Gunst S J 1983 Contractile force of canine airway smooth muscle during cyclical length changes J Appl Physiol Respir Environ Exerc Physiol 55 759-69
[265] Seow C Y 2005 Myosin filament assembly in an ever-changing myofilament lattice of smooth muscle Am J Physiol Cell Physiol 289 C1363-8
[266] Pratusevich V R, Seow C Y and Ford L E 1995 Plasticity in canine airway smooth muscle J Gen Physiol 105 73-94
[267] Trepat X, Deng L, An S S, Navajas D, Tschumperlin D J, Gerthoffer W T, Butler J P and Fredberg J J 2007 Universal physical responses to stretch in the living cell Nature 447 592-5
[268] Krishnan R, Trepat X, Nguyen T T, Lenormand G, Oliver M and Fredberg J J 2008 Airway smooth muscle and bronchospasm: fluctuating, fluidizing, freezing. Respir Physiol Neurobiol 163 17-24
[269] Fredberg J J, Inouye D, Miller B, Nathan M, Jafari S, Raboudi S H, Butler J P and Shore S A 1997 Airway smooth muscle, tidal stretches, and dynamically determined contractile states Am J Respir Crit Care Med 156 1752-9
[270] Golnabi A H, Harris R S, Venegas J G and Winkler T 2014 Deep inspiration and the emergence of ventilation defects during bronchoconstriction: a computational study PLoS One 9 e112443
[271] Toor P, Kim K and Buffington C K 2012 Sleep quality and duration before and after bariatric surgery Obes Surg 22 890-5
[272] 2013 Obesity: Situation and Trends. In: WHO: World Health Organization)
[273] Shah S S, Todkar J S, Shah P S and Cummings D E 2010 Diabetes remission and reduced cardiovascular risk after gastric bypass in Asian Indians with body mass index <35 kg/m(2) Surg Obes Relat Dis 6 332-8
[274] Spivak H, Hewitt M F, Onn A and Half E E 2005 Weight loss and improvement of obesity-related illness in 500 U.S. patients following laparoscopic adjustable gastric banding procedure Am J Surg 189 27-32
162
[275] Hasegawa K, Tsugawa Y, Chang Y and Camargo C A 2015 Risk of an asthma exacerbation after bariatric surgery in adults J Allergy Clin Immunol
[276] Littleton S W 2012 Impact of obesity on respiratory function Respirology 17 43-9
[277] Babb T G, Wyrick B L, DeLorey D S, Chase P J and Feng M Y 2008 Fat distribution and end-expiratory lung volume in lean and obese men and women Chest 134 704-11
[278] Mead J, Takishima T and Leith D 1970 Stress distribution in lungs: a model of pulmonary elasticity J Appl Physiol 28 596-608
[279] Yap J C, Watson R A, Gilbey S and Pride N B 1995 Effects of posture on respiratory mechanics in obesity J Appl Physiol 79 1199-205
[280] MacLeod D and Birch M 2001 Respiratory input impedance measurement: forced oscillation methods Med Biol Eng Comput 39 505-16
[281] King G G, Downie S R, Verbanck S, Thorpe C W, Berend N, Salome C M and Thompson B 2005 Effects of methacholine on small airway function measured by forced oscillation technique and multiple breath nitrogen washout in normal subjects Respir Physiol Neurobiol 148 165-77
[282] Goldman M D, Saadeh C and Ross D 2005 Clinical applications of forced oscillation to assess peripheral airway function Respir Physiol Neurobiol 148 179-94
[283] Konstantinos Katsoulis K, Kostikas K and Kontakiotis T 2013 Techniques for assessing small airways function: Possible applications in asthma and COPD Respir Med
[284] Buysse D J, Reynolds C F, Monk T H, Berman S R and Kupfer D J 1989 The Pittsburgh Sleep Quality Index: a new instrument for psychiatric practice and research Psychiatry Res 28 193-213
[285] Miller M R, Hankinson J, Brusasco V, Burgos F, Casaburi R, Coates A, Crapo R, Enright P, van der Grinten C P, Gustafsson P, Jensen R, Johnson D C, MacIntyre N, McKay R, Navajas D, Pedersen O F, Pellegrino R, Viegi G, Wanger J and Force A E T 2005 Standardisation of spirometry Eur Respir J 26 319-38
163
[286] Oostveen E, MacLeod D, Lorino H, Farré R, Hantos Z, Desager K, Marchal F and Measurements o b o t E T F o R I 2003 The forced oscillation technique in clinical practice: methodology, recommendations and future developments European Respiratory Journal 22 1026-41
[287] Kaczka D W and Dellacá R L 2011 Oscillation mechanics of the respiratory system: applications to lung disease Crit Rev Biomed Eng 39 337-59
[288] Benjamini Y and Hochberg Y 1995 Controlling the False Discovery Rate: A Practical and Powerful Approach to Multiple Testing Journal of the Royal Statistical Society 57 289-300
[289] Salome C M, King G G and Berend N 2010 Physiology of obesity and effects on lung function J Appl Physiol (1985) 108 206-11
[290] Schwartz A R, Gold A R, Schubert N, Stryzak A, Wise R A, Permutt S and Smith P L 1991 Effect of weight loss on upper airway collapsibility in obstructive sleep apnea Am Rev Respir Dis 144 494-8
[291] Lopez P P, Stefan B, Schulman C I and Byers P M 2008 Prevalence of sleep apnea in morbidly obese patients who presented for weight loss surgery evaluation: more evidence for routine screening for obstructive sleep apnea before weight loss surgery Am Surg 74 834-8
[292] Sutherland E R, Lehman E B, Teodorescu M, Wechsler M E and National Heart L n, and Blood Institute's Asthma Clinical Research Network 2009 Body mass index and phenotype in subjects with mild-to-moderate persistent asthma J Allergy Clin Immunol 123 1328-34.e1
[293] Machado D, Tavares B, Loureiro G, Conde B, Cemlyn-Jones J, Calado G, Sousa N, Chieira C and Pereira C 2008 Body mass index and airway hyper-responsiveness in individuals without respiratory disease Eur Ann Allergy Clin Immunol 40 130-7
[294] Ballard R D, Irvin C G, Martin R J, Pak J, Pandey R and White D P 1990 Influence of sleep on lung volume in asthmatic patients and normal subjects J Appl Physiol (1985) 68 2034-41
[295] Irvin C G, Pak J and Martin R J 2000 Airway-parenchyma uncoupling in nocturnal asthma Am J Respir Crit Care Med 161 50-6
[296] Foster P S, Goldie R G and Paterson J W 1983 Effect of steroids on beta-adrenoceptor-mediated relaxation of pig bronchus Br J Pharmacol 78 441-5
164

[297] Hernández García I A, Gutiérrez Gutiérrez A M and Gallardo Lozano E 1999 [Effect of weight reduction on the clinical and hormonal condition of obese anovulatory women] Ginecol Obstet Mex 67 433-7
[298] Lorino A M, Atlan G, Lorino H, Zanditenas D and Harf A 1992 Influence of posture on mechanical parameters derived from respiratory impedance Eur Respir J 5 1118-22
[299] Hantos Z, Daróczy B, Suki B, Galgóczy G and Csendes T 1986 Forced oscillatory impedance of the respiratory system at low frequencies J Appl Physiol (1985) 60 123-32
[300] Peters U, Hernandez P, Dechman G, Ellsmere J and Maksym G 2016 Early detection of changes in lung mechanics with oscillometry following bariatric surgery in severe obesity Appl Physiol Nutr Metab 41 538-47
[301] Mead J 1969 Contribution of compliance of airways to frequency-dependent behavior of lungs J Appl Physiol 26 670-3
[302] Lutchen K R and Gillis H 1997 Relationship between heterogeneous changes in airway morphometry and lung resistance and elastance J Appl Physiol (1985) 83 1192-201
[303] Lutchen K R, Jensen A, Atileh H, Kaczka D W, Israel E, Suki B and Ingenito E P 2001 Airway constriction pattern is a central component of asthma severity: the role of deep inspirations Am J Respir Crit Care Med 164 207-15
[304] LaPrad A S and Lutchen K R 2008 Respiratory impedance measurements for assessment of lung mechanics: focus on asthma Respir Physiol Neurobiol 163 64-73
[305] Oppenheimer B W, Berger K I, Segal L N, Stabile A, Coles K D, Parikh M and Goldring R M 2014 Airway dysfunction in obesity: response to voluntary restoration of end expiratory lung volume PLoS One 9 e88015
[306] Nadel J A and Tierney D F 1961 Effect of a previous deep inspiration on airway resistance in man J Appl Physiol 16 717-9
[307] Gimeno F, Berg W C, Sluiter H J and Tammeling G J 1972 Spirometry-induced bronchial obstruction Am Rev Respir Dis 105 68-74
165

[308] Badia J R, Farre R, Rigau J, Uribe M E, Navajas D and Montserrat J M 2001 Forced oscillation measurements do not affect upper airway muscle tone or sleep in clinical studies Eur Respir J 18 335-9
[309] Reisch S, Daniuk J, Steltner H, Rühle K H, Timmer J and Guttmann J 2000 Detection of sleep apnea with the forced oscillation technique compared to three standard polysomnographic signals Respiration 67 518-25
[310] O'Donnell D E, Aaron S, Bourbeau J, Hernandez P, Marciniuk D D, Balter M, Ford G, Gervais A, Goldstein R, Hodder R, Kaplan A, Keenan S, Lacasse Y, Maltais F, Road J, Rocker G, Sin D, Sinuff T and Voduc N 2007 Canadian Thoracic Society recommendations for management of chronic obstructive pulmonary disease - 2007 update Can Respir J 14 Suppl B 5B-32B
[311] Borrill Z L, Houghton C M, Woodcock A A, Vestbo J and Singh D 2005 Measuring bronchodilation in COPD clinical trials Br J Clin Pharmacol 59 379-84
[312] Neild J E, Twort C H, Chinn S, McCormack S, Jones T D, Burney P G and Cameron I R 1989 The repeatability and validity of respiratory resistance measured by the forced oscillation technique Respir Med 83 111-8
[313] Gimeno F, van der Weele L T, Koeter G H, de Monchy J G and van Altena R 1993 Variability of forced oscillation (Siemens Siregnost FD 5) measurements of total respiratory resistance in patients and healthy subjects Ann Allergy 71 56-60
[314] Peslin R, Duvivier C, Didelon J and Gallina C 1985 Respiratory impedance measured with head generator to minimize upper airway shunt J Appl Physiol 59 1790-5
[315] Peslin R, Duvivier C, Gallina C and Cervantes P 1985 Upper airway artifact in respiratory impedance measurements Am Rev Respir Dis 132 712-4
[316] Habib R H and Jackson A C 1993 Total respiratory input impedance with the upper airway wall shunt minimized J Appl Physiol 74 1045-55
[317] Farre R, Peslin R, Oostveen E, Suki B, Duvivier C and Navajas D 1989 Human respiratory impedance from 8 to 256 Hz corrected for upper airway shunt J Appl Physiol 67 1973-81
[318] Cauberghs M and Van de Woestijne K P 1989 Effect of upper airway shunt and series properties on respiratory impedance measurements J Appl Physiol 66 2274-9
166

[319] Delacourt C, Lorino H, Fuhrman C, Herve-Guillot M, Reinert P, Harf A and Housset B 2001 Comparison of the forced oscillation technique and the interrupter technique for assessing airway obstruction and its reversibility in children Am J Respir Crit Care Med 164 965-72
[320] Uchida A, Ito S, Suki B, Matsubara H and Hasegawa Y 2013 Influence of cheek support on respiratory impedance measured by forced oscillation technique Springerplus 2 342
[321] Goldman M D, Carter R, Klein R, Fritz G, Carter B and Pachucki P 2002 Within- and between-day variability of respiratory impedance, using impulse oscillometry in adolescent asthmatics Pediatr Pulmonol 34 312-9
[322] Schachter L M, Peat J K and Salome C M 2003 Asthma and atopy in overweight children Thorax 58 1031-5
[323] Chen Y, Horne S L and Dosman J A 1993 Body weight and weight gain related to pulmonary function decline in adults: a six year follow up study Thorax 48 375-80
[324] Wise R A, Enright P L, Connett J E, Anthonisen N R, Kanner R E, Lindgren P, O'Hara P, Owens G R, Rand C S and Tashkin D P 1998 Effect of weight gain on pulmonary function after smoking cessation in the Lung Health Study Am J Respir Crit Care Med 157 866-72
[325] Corrigan C J and Kay A B 1990 CD4 T-lymphocyte activation in acute severe asthma. Relationship to disease severity and atopic status Am Rev Respir Dis 141 970-7
[326] Berger A 2000 Th1 and Th2 responses: what are they? BMJ 321 424
[327] Gaurav R and Agrawal D K 2013 Clinical view on the importance of dendritic cells in asthma Expert Rev Clin Immunol 9 899-919
[328] Ziegler S F and Liu Y J 2006 Thymic stromal lymphopoietin in normal and pathogenic T cell development and function Nat Immunol 7 709-14
[329] Zhou B, Comeau M R, De Smedt T, Liggitt H D, Dahl M E, Lewis D B, Gyarmati D, Aye T, Campbell D J and Ziegler S F 2005 Thymic stromal lymphopoietin as a key initiator of allergic airway inflammation in mice Nat Immunol 6 1047-53
167

[330] Wills-Karp M, Luyimbazi J, Xu X, Schofield B, Neben T Y, Karp C L and Donaldson D D 1998 Interleukin-13: central mediator of allergic asthma Science 282 2258-61
[331] Clutterbuck E J, Hirst E M and Sanderson C J 1989 Human interleukin-5 (IL-5) regulates the production of eosinophils in human bone marrow cultures: comparison and interaction with IL-1, IL-3, IL-6, and GMCSF Blood 73 1504-12
[332] Burrows B, Martinez F D, Halonen M, Barbee R A and Cline M G 1989 Association of asthma with serum IgE levels and skin-test reactivity to allergens N Engl J Med 320 271-7
[333] Bousquet J, Chanez P, Lacoste J Y, Barnéon G, Ghavanian N, Enander I, Venge P, Ahlstedt S, Simony-Lafontaine J and Godard P 1990 Eosinophilic inflammation in asthma N Engl J Med 323 1033-9
[334] Peslin R, Jardin P, Duvivier C and Begin P 1984 In-phase rejection requirements for measuring respiratory input impedance J Appl Physiol 56 804-9
[335] Làndsér F, Clément J and Van de Woestijne K 1982 Normal values of total respiratory resistance and reactance determined by forced oscillations: influence of smoking. Chest 81 586-91
168

Appendix A: Pathophysiologic Mechanisms of Asthma
169

The symptoms of asthma develops through numerous pathophysiological mechanisms
that are triggered by a wide variety of stimuli, ultimately resulting in bronchoconstriction
and airflow obstruction [42]. It is not yet known whether these mechanisms are quite
distinct in obese individuals, who may develop asthma as a consequence of obesity. The
pathophysiologic mechanisms of asthma-like symptoms in obesity is reviewed in detail in
Section 2.4. Here, the pathophysiology of classical asthma is reviewed to enable us draw
parallels to the pathophysiology of asthma-like symptoms in obesity. The stimuli that
could provoke an asthma attack include pollen, house dust mite, cigarette smoke, animal
fur, cold air, fog, certain drugs such as aspirin, exercise, anxiety and even stress. These
triggers set off a cascade of immunological reactions that involve the CD4 T-
lymphocytes known as T-helper (TH) cells [325]. There are two types of TH cells: TH1
and TH2 cells and the cytokines they produce are known as TH1-type cytokines (eg
interleukin (IL-) 2, interferon gamma (IFN-γ) and lyphotoxin) and TH2-type cytokines
(eg IL-4, -5, -6, -9, -10 and -13), respectively [326]. TH1 cells are normally found in the
lungs whereas TH2 are not commonly found in the lungs. It is well established that TH1
cells stimulate cell-mediated immunity (delayed-type hypersensitivity reaction or
autoimmune response) while TH2 cells mediate allergic inflammation by increasing
humoral-mediated immunity (B-cell antibody production particularly IgE).
When inhaled allergens, microorganisms and other environmental pollutants disrupt the
airway epithelial layer in an individual with asthma, dendritic cells in the submucosa
intercept the offending antigen and migrate to regional lymph nodes where the antigen is
presented to CD4 T-lymphocytes. Depending on the nature of the interaction between the
processed antigen and the microenvironment, dendritic cells polarize naïve CD4+ T-
lymphocytes to differentiate into TH1, TH2, or regulatory T lymphocytes which normally
inhibit TH2 cells [327]. At the same time, airway epithelial cells respond by releasing
various bronchoactive agents such as nitric oxide and thymic stromal lymphopoietin–an
important factor that conditions and activates the dendritic cells to upregulate production
of TH2 cell attracting chemokine – CCL17 [328, 329]. Activated TH2 cells perform
several functions. They stimulate plasma cells through IL-4 and IL-13 to increase
production of IgE antibody [330]. In addition, TH2 cells stimulate the production of mast
170

cells through IL-9 and also promotes eosinophil production in the bone marrow through
IL-5 [331].
Immunoglobulin E released from the peripheral blood then binds to IgE receptors present
on the surface of inflammatory cells such as mast cells, basophils, lymphocytes,
eosinophils and macrophages to form a complex. When this complex encounters the
offending antigen, it degranulates and this results in the release of pro-inflammatory
mediators including histamine, cysteinyl-leukotrienes, tryptase, and prostaglandin D2 as
well as further amplification of the inflammatory response. These inflammatory
mediators induce airway hyperresponsiveness (AHR), bronchoconstriction, mucus
hypersecretion, airway edema, tissue damage, hypertrophy and hyperplasia of airway
smooth muscle (ASM), as well as other typical symptoms of asthma. Some of these
respiratory symptoms have also been reported in individuals with obesity [22, 23, 249].
Atopic or allergic asthma is thought to be due to a preference towards increased TH2-
lymphocyte production along with a predisposition towards an IgE-mediated response
resulting in the eosinophilic inflammation that is known to characterize this asthma
phenotype and is responsible for its chronicity [332, 333]. The pathophysiology of
nonatopic or nonallergic asthma is very similar to that of atopic asthma. However,
compared to atopic asthma, many aspects of the pathophysiology of nonatopic asthma
have yet to be fully established, especially the role of IgE and neutrophils [217].
171

Appendix B: Permission letter for Figure 2.1
172

Ubong Peters
From: Rebecca Decker <[email protected]> Sent: Tuesday, August 9, 2016 12:27 PM To: Ubong Peters Subject: RE: GINA COPYRIGHT REQUEST
Hi Ubong, permission is granted for this request.
Rebecca Decker
Program Director, GOLD and GINA
Global Initiative for Chronic Obstructive Lung Disease Global Initiative for Asthma P.O. Box 558 Fontana, WI 53125 Mobile: 262‐812‐6741 email: [email protected]
www.goldcopd.org @gold_copd
www.ginasthma.org @ginasthma
‐‐‐‐‐Original Message‐‐‐‐‐
From: Ubong Peters [mailto:[email protected]]
Sent: Monday, August 8, 2016 2:11 PM
Subject: GINA COPYRIGHT REQUEST
1. Name: Ubong Peters
173
2. Address: 5981 University Avenue, Halifax, NS, Canada. B3H 4R2 3. Email Address: [email protected] 4. Organization Represented (if any): Dalhousie University 5. Is commercial support involved directly or indirectly in the proposed use: (yes/no)No 6. Indicate the GINA document and pages, table or figures that you wish to reproduce:
Box 1‐1. Diagnostic flowchart for clinical practice ‐ initial presentation. Page 4 of the GINA2015 Report
7. Indicate the proposed use of the materials: including the form(s) in which it will be
disseminated, the number of copies that will be distributed, and whether or not a commercial organization will be using the material. This Figure will be reproduced in my doctoral thesis submitted to Dalhousie University. No commercial organization will use this material.
8. Will a commercial organization (for example a Pharmaceutical or Publishing
Company or a Commercial Agency) provide funds for the dissemination, or if funds for the dissemination come from a professional group, will this professional group receive commercial funds for the activity? No
9. If used for commercial purposes, will you provide a copy to GINA prior to its release? 10. Will the GINA material be submitted for publication in a medical journal? If yes,
please indicate the name of the journal. No 11. Will there be any charge made for the disseminated document that includes the GINA
material? No ‐‐
This e‐mail was sent from a contact form on GINA (http://ginasthma.org)
174

Appendix C: Permission letter for Figure 2.2
175

BMJ PUBLISHING GROUP LTD. LICENSE TERMS AND CONDITIONS
Aug 08, 2016
This Agreement between Ubong Peters ("You") and BMJ Publishing Group Ltd. ("BMJ Publishing Group Ltd.") consists of your license details and the terms and conditions provided by BMJ Publishing Group Ltd. and Copyright Clearance Center. License Number 3924370588785 License date Aug 08, 2016
Licensed Content Publisher BMJ Publishing Group Ltd. Licensed Content Publication Thorax
Licensed Content Title Measurement of airway hyperresponsiveness: new considerations Licensed Content Author Jan Lötvall, Mark Inman, Paul O’Byrne
Licensed Content Date May 1, 1998
Licensed Content Volume Number
53
Licensed Content Issue Number
5
Volume number 53
Issue number 5
Type of Use Dissertation/Thesis
Requestor type Author of this article
Format Print and electronic
Portion Figure/table/extract
Number of figure/table/extracts
1
Descriptionof figure/table/extracts
Figure 2A
Will you be translating? No
Circulation/distribution 10000
Title of your thesis / dissertation
ASSESSMENT OF LUNG MECHANICS IN ADULTS: EFFECT OF WEIGHT LOSS, POSTURE, BRONCHODILATION AND ARTEFACTS ON LUNG MECHANICS AND ITS REPEATABILITY
Expected completion date Sep 2016
Estimated size(pages) 190
176
Requestor Location Ubong Peters 5981 University Avenue
Halifax, NS B3H 4R2 Canada Attn: Ubong Peters
Publisher Tax ID GB674738491
Billing Type Invoice
Billing Address Ubong Peters 5981 University Avenue
Halifax, NS B3H 4R2 Canada Attn: Ubong Peters
Total 0.00 CAD Terms and Conditions
BMJ Group Terms and Conditions for Permissions When you submit your order you are subject to the terms and conditions set out below. You will also have agreed to the Copyright Clearance Center's ("CCC") terms and conditions regarding billing and payment https://s100.copyright.com/App/PaymentTermsAndConditions.jsp. CCC are acting as the BMJ Publishing Group Limited's ("BMJ Group's") agent. Subject to the terms set out herein, the BMJ Group hereby grants to you (the Licensee) a nonexclusive, non-transferable licence to re-use material as detailed in your request for this/those purpose(s) only and in accordance with the following conditions: 1) Scope of Licence: Use of the Licensed Material(s) is restricted to the ways specified by you during the order process and any additional use(s) outside of those specified in that request, require a further grant of permission. 2) Acknowledgement: In all cases, due acknowledgement to the original publication with permission fromthe BMJ Group should be stated adjacent to the reproduced Licensed Material. The format of such acknowledgement should read as follows: "Reproduced from [publication title, author(s), volume number, page numbers, copyright notice year] with permission from BMJ Publishing Group Ltd." 3) Third Party Material: BMJ Group acknowledges to the best of its knowledge, it has the rights to licence your reuse of the Licensed Material, subject always to the caveat that images/diagrams, tables and other illustrative material included within, which have a separate copyright notice, are presumed as excluded from the licence. Therefore, you should ensure that the Licensed Material you are requesting is original to BMJ Group and does not carry the copyright of another entity (as credited in the published version). If the credit line on any part of the material you have requested in any way indicates that it was reprinted or adapted by BMJ Group with permission from another source, then you should seek permission from that source directly to re-use the Licensed Material, as this is outside of the licence granted herein. 4) Altering/Modifying Material: The text of any material for which a licence is granted may notbe altered in any way without the prior express permission of the BMJ Group. Subject to Clause
177
3 above however, single figure adaptations do not require BMJ Group's approval; however, the adaptation should be credited as follows: "Adapted by permission from BMJ Publishing Group Limited. [Publication title, author, volume number, page numbers, copyright notice year] 5) Reservation of Rights: The BMJ Group reserves all rights not specifically granted in the combination of (i) the licence details provided by you and accepted in the course of this licensing transaction, (ii) these terms and conditions and (iii) CCC's Billing and Payment Terms and Conditions. 6) Timing of Use: First use of the Licensed Material must take place within 12 months of the grant of permission. 7). Creation of Contract and Termination: Once you have submitted an order via Rightslink and this is received by CCC, and subject to you completing accurate details of your proposed use, this is when a binding contract is in effect and our acceptance occurs. As you are ordering rights from a periodical, to the fullest extent permitted by law, you will have no right to cancel the contract from this point other than for BMJ Group's material breach or fraudulent misrepresentation or as otherwise permitted under a statutory right. Payment must be made in accordance with CCC's Billing and Payment Terms and conditions. In the event that you breach any material condition of these terms and condition or any of CCC's Billing and Payment Terms and Conditions, the license is automatically terminated upon written notice from the BMJ Group or CCC or as otherwise provided for in CCC's Billing and Payment Terms and Conditions, where these apply.. Continued use of materials where a licence has been terminated, as well as any use of the Licensed Materials beyond the scope of an unrevoked licence, may constitute intellectual property rights infringement and BMJ Group reserves the right to take any and all action to protect its intellectual property rights in the Licensed Materials. 8. Warranties: BMJ Group makes no express or implied representations or warranties with
respect to the Licensed Material and to the fullest extent permitted by law this is provided on an "as is" basis. For the avoidance of doubt BMJ Group does not warrant that the Licensed Material is accurate or fit for any particular purpose.
9. Limitation of Liability: To the fullest extent permitted by law, the BMJ Group disclaims all liability for any indirect, consequential or incidental damages (including without limitation, damages for loss of profits, information or interruption)arising out of the use or inability to use the Licensed Material or the inability to obtain additional rights to use the Licensed Material. To the fullest extent permitted by law, the maximum aggregate liability of the BMJ Group for any claims, costs, proceedings and demands for direct losses caused by BMJ Group's breaches of its obligations herein shall be limited to twice the amount paid by you to CCC for the licence granted herein.
10. Indemnity: You hereby indemnify and hold harmless the BMJ Group and their respective officers, directors, employees and agents, from and against any and all claims, costs, proceeding or demands arising out of your unauthorised use of the Licensed Material.
11. No Transfer of License: This licence is personal to you, and may not be assigned or
transferred by you without prior written consent from the BMJ Group or its authorised agent(s). BMJ Group may assign or transfer any of its rights and obligations under this Agreement, upon written notice to you.
178

12. No Amendment Except in Writing: This licence may not be amended except in a writing signed by both parties (or, in the case of BMJ Group, by CCC on the BMJ Group's behalf).
13. Objection to Contrary terms: BMJ Group hereby objects to any terms contained in any purchase order, acknowledgment, check endorsement or other writing prepared by you, which terms are inconsistent with these terms and conditions or CCC's Billing and Payment Terms and Conditions. These terms and conditions, together with CCC's Billing and Payment Terms and Conditions (which to the extent they are consistent are incorporated herein), comprise the entire agreement between you and BMJ Group (and CCC) and the Licensee concerning this licensing transaction. In the event of any conflict between your obligations established by these terms and conditions and those established by CCC's Billing and Payment Terms and Conditions, these terms and conditions shall control.
14. Revocation: BMJ Group or CCC may, within 30 days of issuance of this licence, deny the permissions described in this licence at their sole discretion, for any reason or no reason, with a full refund payable to you should you have not been able to exercise your rights in full. Notice of such denial will be made using the contact information provided by you. Failure to receive such notice from BMJ Group or CCC will not, to the fullest extent permitted by law alter or invalidate the denial. For the fullest extent permitted by law in no event will BMJ Group or CCC be responsible or liable for any costs, expenses or damage incurred by you as a result of a denial of your permission request, other than a refund of the amount(s) paid by you to BMJ Group and/or CCC for denied permissions.
15. Restrictions to the license: 15.1 Promotion: BMJ Group will not give permission to reproduce in full or in part any Licensed Material for use in the promotion of the following: a) non-medical products that are harmful or potentially harmful to health: alcohol, baby milks and/or, sunbeds b) medical products that do not have a product license granted by the Medicines and Healthcare products Regulatory Agency (MHRA) or its international equivalents. Marketing of the product may start only after data sheets have been released to members of the medical profession and must conform to the marketing authorization contained in the product license. 16. Translation: This permission is granted for non-exclusive world English language rights only unless explicitly stated in your licence. If translation rights are granted, a professional translator should be employed and the content should be reproduced word for word preserving the integrity of the content. 17. General: Neither party shall be liable for failure, default or delay in performing its obligations under this Licence, caused by a Force Majeure event which shall include any act of God, war, or threatened war, act or threatened act of terrorism, riot, strike, lockout, individual action, fire, flood, drought, tempest or other event beyond the reasonable control of either party.
17.1 In the event that any provision of this Agreement is held to be invalid, the remainder of the provisions shall continue in full force and effect.
17.2 There shall be no right whatsoever for any third party to enforce the terms and conditions of this Agreement. The Parties hereby expressly wish to exclude the operation of the Contracts (Rights of Third Parties) Act 1999 and any other legislation which has this effect and is binding on this agreement.
179

17.3 To the fullest extent permitted by law, this Licence will be governed by the laws of England and shall be governed and construed in accordance with the laws of England. Any action arising out of or relating to this agreement shall be brought in courts situated in England save where it is necessary for BMJ Group for enforcement to bring proceedings to bring an action in an alternative jurisdiction.
Questions? [email protected] or +1-855-239-3415 (toll free in the US) or +1-978-646-2777.
180

Appendix D: Permission letter for Figure 2.4
181

SPRINGER LICENSE
TERMS AND CONDITIONS Aug 08, 2016
This Agreement between Ubong Peters ("You") and Springer ("Springer") consists of your license details and the terms and conditions provided by Springer and Copyright Clearance Center.
License Number 3924410693983 License date Aug 08, 2016 Licensed Content Publisher Springer Licensed Content Publication Springer eBook Licensed Content Title Effects of Obesity on Lung Function
Licensed Content Author Cheryl M. Salome B.Sc., Ph.D.
Licensed Content Date Jan 1, 2013 Type of Use Thesis/Dissertation Portion Figures/tables/illustrations Number of 1
figures/tables/illustrations
Author of this Springer
article No Order reference number
Original figure numbers Figure 1.2 Title of your thesis / dissertation
ASSESSMENT OF LUNG MECHANICS IN ADULTS: EFFECT OF WEIGHT LOSS, POSTURE, BRONCHODILATION AND ARTEFACTS ON LUNG MECHANICS AND ITS REPEATABILITY
Expected completion date Sep 2016
Estimated size(pages) 190
Requestor Location Ubong Peters 5981 University Avenue
Halifax, NS B3H 4R2 Canada Attn: Ubong Peters
Billing Type Invoice
182
Billing Address Ubong Peters 5981 University Avenue
Halifax, NS B3H 4R2 Canada Attn: Ubong Peters
Total 0.00 CAD Terms and Conditions
Introduction The publisher for this copyrighted material is Springer. By clicking "accept" in connection with completing this licensing transaction, you agree that the following terms and conditions apply to this transaction (along with the Billing and Payment terms and conditions established by Copyright Clearance Center, Inc. ("CCC"), at the time that you opened your Rightslink account and that are available at any time at http://myaccount.copyright.com).
Limited License With reference to your request to reuse material on which Springer controls the copyright, permission is granted for the use indicated in your enquiry under the following conditions: - Licenses are for one-time use only with a maximum distribution equal to the number stated in your request.
- Springer material represents original material which does not carry references to other sources. If the material in question appears with a credit to another source, this permission is not valid and authorization has to be obtained from the original copyright holder.
- This permission • is non-exclusive • is only valid if no personal rights, trademarks, or competitive products are infringed. • explicitly excludes the right for derivatives. - Springer does not supply original artwork or content. - According to the format which you have selected, the following conditions apply accordingly:
• Print and Electronic: This License include use in electronic form provided it is password protected, on intranet, or CD-Rom/DVD or E-book/E-journal. It may not be republished in electronic open access.
• Print: This License excludes use in electronic form. • Electronic: This License only pertains to use in electronic form provided it is password
protected, on intranet, or CD-Rom/DVD or E-book/E-journal. It may not be republished in electronic open access.
For any electronic use not mentioned, please contact Springer at [email protected].
183

- Although Springer controls the copyright to the material and is entitled to negotiate on rights, this license is only valid subject to courtesy information to the author (address is given in the article/chapter).
- If you are an STM Signatory or your work will be published by an STM Signatory and you are requesting to reuse figures/tables/illustrations or single text extracts, permission is granted according to STM Permissions Guidelines: http://www.stm-assoc.org/permissionsguidelines/
For any electronic use not mentioned in the Guidelines, please contact Springer at [email protected]. If you request to reuse more content than stipulated in the STM Permissions Guidelines, you will be charged a permission fee for the excess content.
Permission is valid upon payment of the fee as indicated in the licensing process. If permission is granted free of charge on this occasion, that does not prejudice any rights we might have to charge for reproduction of our copyrighted material in the future. -If your request is for reuse in a Thesis, permission is granted free of charge under the following conditions:
This license is valid for one-time use only for the purpose of defending your thesis and with a maximum of 100 extra copies in paper. If the thesis is going to be published, permission needs to be reobtained.
- includes use in an electronic form, provided it is an author-created version of the thesis on his/her own website and his/her university’s repository, including UMI (according to the definition on the Sherpa website: http://www.sherpa.ac.uk/romeo/); - is subject to courtesy information to the co-author or corresponding author.
Geographic Rights: Scope Licenses may be exercised anywhere in the world. Altering/Modifying Material: Not Permitted Figures, tables, and illustrations may be altered minimally to serve your work. You may not alter or modify text in any manner. Abbreviations, additions, deletions and/or any other alterations shall be made only with prior written authorization of the author(s).
Reservation of Rights Springer reserves all rights not specifically granted in the combination of (i) the license details provided by you and accepted in the course of this licensing transaction and (ii) these terms and conditions and (iii) CCC's Billing and Payment terms and conditions.
License Contingent on Payment While you may exercise the rights licensed immediately upon issuance of the license at the end of the licensing process for the transaction, provided that you have disclosed complete and accurate details of your proposed use, no license is finally effective unless and until full payment is received from you (either by Springer or by CCC) as provided
184

in CCC's Billing and Payment terms and conditions. If full payment is not received by the date due, then any license preliminarily granted shall be deemed automatically revoked and shall be void as if never granted. Further, in the event that you breach any of these terms and conditions or any of CCC's Billing and Payment terms and conditions, the license is automatically revoked and shall be void as if never granted. Use of materials as described in a revoked license, as well as any use of the materials beyond the scope of an unrevoked license, may constitute copyright infringement and Springer reserves the right to take any and all action to protect its copyright in the materials.
Copyright Notice: Disclaimer You must include the following copyright and permission notice in connection with any reproduction of the licensed material:
"Springer book/journal title, chapter/article title, volume, year of publication, page, name(s) of author(s), (original copyright notice as given in the publication in which the material was originally published) "With permission of Springer"
In case of use of a graph or illustration, the caption of the graph or illustration must be included, as it is indicated in the original publication.
Warranties: None Springer makes no representations or warranties with respect to the licensed material and adopts on its own behalf the limitations and disclaimers established by CCC on its behalf in its Billing and Payment terms and conditions for this licensing transaction.
Indemnity You hereby indemnify and agree to hold harmless Springer and CCC, and their respective officers, directors, employees and agents, from and against any and all claims arising out of your use of the licensed material other than as specifically authorized pursuant to this license.
No Transfer of License This license is personal to you and may not be sublicensed, assigned, or transferred by you without Springer's written permission.
No Amendment Except in Writing This license may not be amended except in a writing signed by both parties (or, in the case of Springer, by CCC on Springer's behalf).
Objection to Contrary Terms Springer hereby objects to any terms contained in any purchase order, acknowledgment, check endorsement or other writing prepared by you, which terms are inconsistent with these terms and conditions or CCC's Billing and Payment terms and conditions. These terms and conditions, together with CCC's Billing and Payment terms and conditions (which are incorporated herein), comprise the entire agreement between you and Springer (and CCC) concerning this licensing transaction. In the event of any conflict
185

between your obligations established by these terms and conditions and those established by CCC's Billing and Payment terms and conditions, these terms and conditions shall control.
Jurisdiction All disputes that may arise in connection with this present License, or the breach thereof, shall be settled exclusively by arbitration, to be held in the Federal Republic of Germany, in accordance with German law.
Other conditions: V 12AUG2015 Questions? [email protected] or +1-855-239-3415 (toll free in the US) or +1-978-646-2777.
186

Appendix E: Permission letter to use published article as Chapter 3
187

8/8/2016 RightsLink Printable License
NRC RESEARCH PRESS LICENSE TERMS AND CONDITIONS
Aug 08, 2016
This Agreement between Ubong Peters ("You") and NRC Research Press ("NRC Research Press") consists of your license details and the terms and conditions provided by NRC Research Press and Copyright Clearance Center. License Number 3924420317259
License date Aug 08, 2016
Licensed Content Publisher NRC Research Press
Licensed Content Publication Applied Physiology, Nutrition, and Metabolism Licensed Content Title Early detection of changes in lung mechanics with oscillometry
following bariatric surgery in severe obesity Licensed Content Author Ubong Peters, Paul Hernandez, Gail Dechman, et al
Licensed Content Date May 1, 2016
Licensed Content Volume Number
41
Licensed Content Issue Number
5
Type of Use Thesis/Dissertation
Requestor type Author (original work)
Format Print and electronic
Portion
Order reference number
Full article
Title of your thesis / dissertation
ASSESSMENT OF LUNG MECHANICS IN ADULTS: EFFECT OF WEIGHT LOSS, POSTURE, BRONCHODILATION AND ARTEFACTS ON LUNG MECHANICS AND ITS REPEATABILITY
Expected completion date Sep 2016
Estimated size(pages) 190
188
Requestor Location Ubong Peters 5981 University Avenue
Halifax, NS B3H 4R2 Canada Attn: Ubong Peters
Billing Type Invoice
Billing Address Ubong Peters 5981 University Avenue
Halifax, NS B3H 4R2 Canada Attn: Ubong Peters
Total 0.00 CAD Terms and Conditions
https://s100.copyright.com/CustomerAdmin/PLF.jsp?ref=55e65159-60b3-4a3a-9cfb-6f77420a1663 1/2 8/8/2016 RightsLink Printable License
General Terms & Conditions Permission is granted upon the requester's compliance with the following terms and conditions:
1. A credit line will be prominently placed in your product(s) and include: for books the author, book title, editor, copyright holder, year of publication; for journals the author, title of article, title of journal, volume number, issue number, and the inclusive pages. The credit line must include the following wording: "© 2008 Canadian Science Publishing or its licensors. Reproduced with permission," except when an author of an original article published in 2009 or later is reproducing his/her own work.
2. The requester warrants that the material shall not be used in any manner that may be derogatory to the title, content, or authors of the material or to Canadian Science Publishing, including but not limited to an association with conduct that is fraudulent or otherwise illegal.
3. Permission is granted for the term (for Books/CDs-Shelf Life; for Internet/Intranet-In perpetuity; for all other forms of print-the life of the title) and purpose specified in your request. Once term has expired, permission to renew must be made in writing.
189

4. Permission granted is nonexclusive, and is valid throughout the world in English and the languages specified in your original request. A new permission must be requested for revisions of the publication under current consideration.
5. Canadian Science Publishing cannot supply the requester with the original artwork or a "clean copy."
6. If the Canadian Science Publishing material is to be translated, the following lines must be included: The authors, editors, and Canadian Science Publishing are not responsible for errors or omissions in translations.
v1.4 Questions? [email protected] or +1-855-239-3415 (toll free in the US) or +1-978-646-2777.
https://s100.copyright.com/CustomerAdmin/PLF.jsp?ref=55e65159-60b3-4a3a-9cfb-6f77420a1663 2/2
190

Appendix F: Permission letter to use Pittsburgh Sleep Quality Index
191
192

193
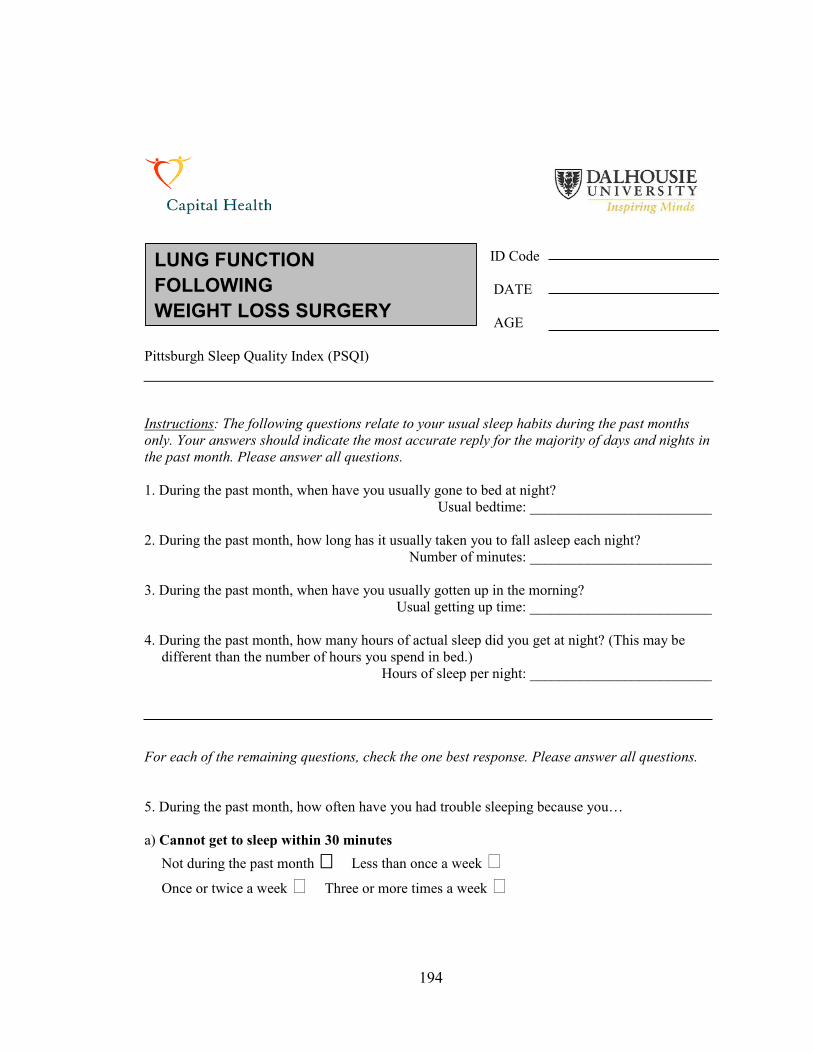
ID Code
DATE AGE
Pittsburgh Sleep Quality Index (PSQI) Instructions: The following questions relate to your usual sleep habits during the past months only. Your answers should indicate the most accurate reply for the majority of days and nights in the past month. Please answer all questions. 1. During the past month, when have you usually gone to bed at night?
Usual bedtime: _________________________
2. During the past month, how long has it usually taken you to fall asleep each night? Number of minutes: _________________________
3. During the past month, when have you usually gotten up in the morning?
Usual getting up time: _________________________
4. During the past month, how many hours of actual sleep did you get at night? (This may be different than the number of hours you spend in bed.)
Hours of sleep per night: _________________________
For each of the remaining questions, check the one best response. Please answer all questions. 5. During the past month, how often have you had trouble sleeping because you… a) Cannot get to sleep within 30 minutes
Not during the past month Less than once a week Once or twice a week Three or more times a week
LUNG FUNCTION FOLLOWING WEIGHT LOSS SURGERY
194

b) Wake up in the middle of the night or early morning Not during the past month Less than once a week Once or twice a week Three or more times a week
c) Have to get up to use the bathroom
Not during the past month Less than once a week Once or twice a week Three or more times a week
d) Cannot breathe comfortably Not during the past month Less than once a week Once or twice a week Three or more times a week
e) Cough or snore loudly Not during the past month Less than once a week Once or twice a week Three or more times a week
f) Feel too cold Not during the past month Less than once a week Once or twice a week Three or more times a week
g) Feel too hot Not during the past month Less than once a week Once or twice a week Three or more times a week
h) Had bad dreams Not during the past month Less than once a week Once or twice a week Three or more times a week
i) Have pain Not during the past month Less than once a week Once or twice a week Three or more times a week
195
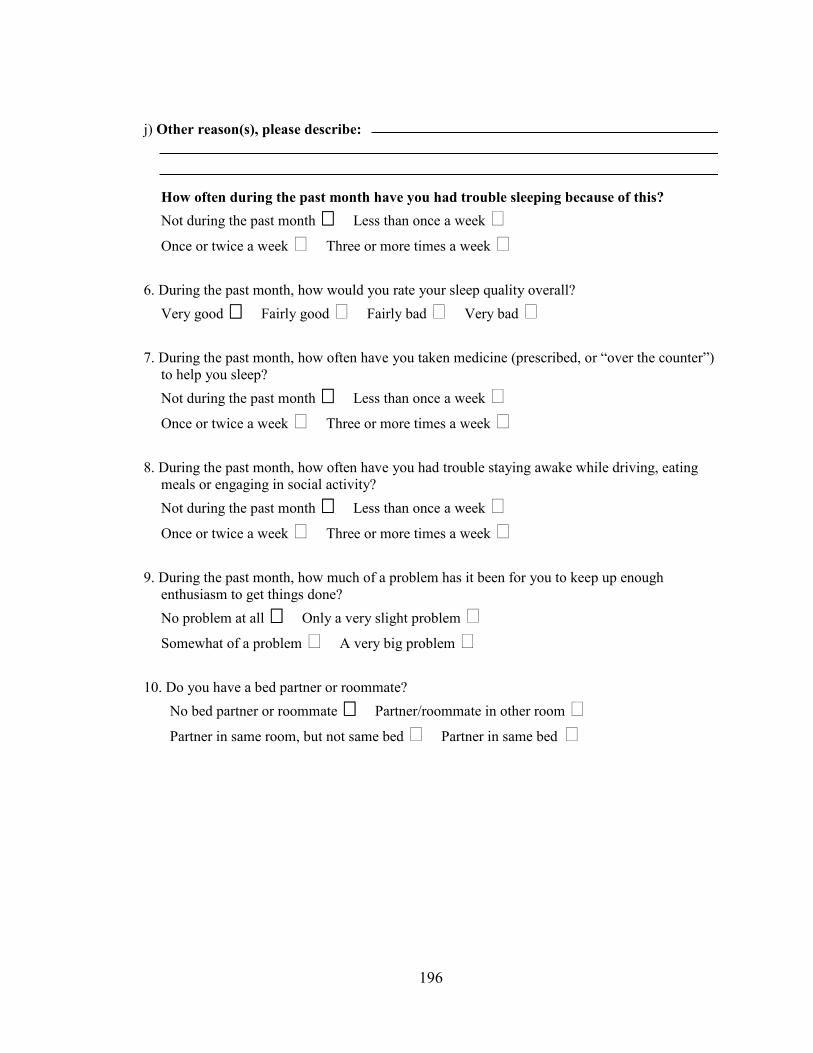
j) Other reason(s), please describe:
How often during the past month have you had trouble sleeping because of this? Not during the past month Less than once a week Once or twice a week Three or more times a week
6. During the past month, how would you rate your sleep quality overall? Very good Fairly good Fairly bad Very bad
7. During the past month, how often have you taken medicine (prescribed, or “over the counter”) to help you sleep? Not during the past month Less than once a week Once or twice a week Three or more times a week
8. During the past month, how often have you had trouble staying awake while driving, eating meals or engaging in social activity? Not during the past month Less than once a week Once or twice a week Three or more times a week
9. During the past month, how much of a problem has it been for you to keep up enough enthusiasm to get things done? No problem at all Only a very slight problem Somewhat of a problem A very big problem
10. Do you have a bed partner or roommate? No bed partner or roommate Partner/roommate in other room Partner in same room, but not same bed Partner in same bed
196

If you have a roommate or bed partner, ask him/her how often in the past month you have had...
a) Loud snoring Not during the past month Less than once a week Once or twice a week Three or more times a week
b) Long pauses between breaths while asleep Not during the past month Less than once a week Once or twice a week Three or more times a week
c) Legs twitching or jerking while you sleep Not during the past month Less than once a week Once or twice a week Three or more times a week
d) Episodes of disorientation or confusion during sleep Not during the past month Less than once a week Once or twice a week Three or more times a week
e) Other restlessness while you sleep, please describe: Not during the past month Less than once a week Once or twice a week Three or more times a week
197

Appendix G: Pictorial and Schematic Representation of tremoFloTM
198

Figure G1. The tremoFlo C-100 Airwave Oscillometry System used in collecting respiratory impedance measurements in this thesis.
Figure G2. A schematic illustration of the inner components of one of the early prototypes of the handheld oscillometry device. The inset is a 3D model of the handheld oscillometry prototype.
199

Appendix H: Validation of Resistance and Reactance
200

Resistive test loads with nominal values of 1, 2, 3, 5, 10, 20 and 40 cm·H2O/(L·s-1) from
Hans Rudolph Inc (Shawnee, KS, USA) were used as reference impedances to determine
the accuracy of measurements obtained from the handheld oscillometry device. These test
loads were measured using a 5-frequency composite signal that contained 4, 6, 10, 14 and
19 Hz oscillation frequencies. Resistance validation tests were also conducted with a 7-
frequency composite signal that contained 22 and 26 Hz oscillation frequencies, in
addition those frequencies outlined in the 5-frequency composite signal. The predicted
resistance closely matched the measured resistance, indicating that the device can
accurately measure resistance (Figure H1).
Reactance was validated using the 7-frequency composite signal with the aid of a
mechanical analogue of the lung developed in a similar manner to the study by Peslin et
al. [334]. The parameters of this mechanical analog of the lung were chosen to match the
E and I of an average man reported by Landser et al. [335] to be 30 cm H2O L-1 and 0.01
cm H2O L–1 s–2, respectively. This test-bed mainly consisted of a 0.23 m rigid pipe with
an inner diameter of 0.021 m and an inertance (I) of 0.0106 cm H2O L–1 s–2 connected in
series to a 26.4 L glass chamber with an elastance (E) of 38.297 cm H20 L–1 (Figure H2).
Basically, a defined volume of gas has a fixed E which can be predicted from the
equation: PEV
= and a rigid pipe with a defined dimension has a fixed inertance which
can also be predicted from the equation: 2
lIr
ηρπ
= , where ρ is density of air, l is length of
the pipe, r is the radius of the pipe and η is a constant that represents the velocity profile,
with 1η = when the velocity profile is blunt and 1.3η = when the velocity profile is
parabolic. The E and I were used in computing the predicted reactance of the mechanical
analog of the lung model according to the equation: EX Iωω
= − and the result was
compared to the actual reactance measured with the handheld oscillometry device.
201
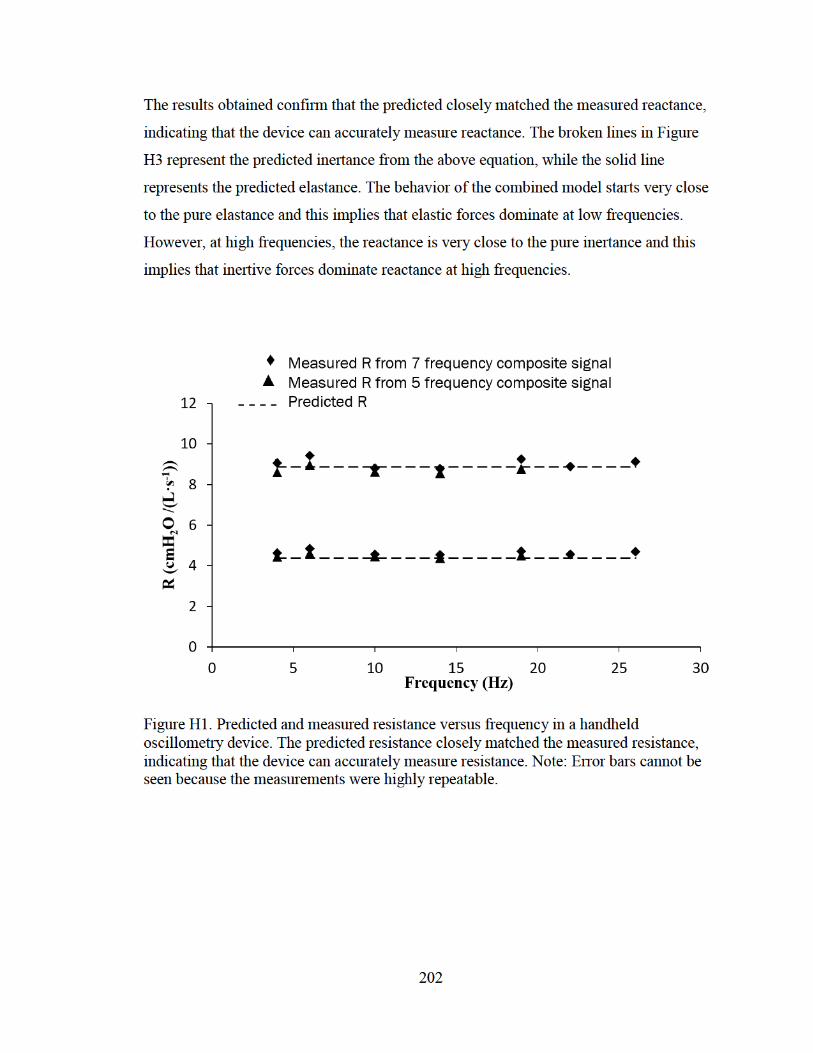
The results obtained confirm that the predicted closely matched the measured reactance,
indicating that the device can accurately measure reactance. The broken lines in Figure
H3 represent the predicted inertance from the above equation, while the solid line
represents the predicted elastance. The behavior of the combined model starts very close
to the pure elastance and this implies that elastic forces dominate at low frequencies.
However, at high frequencies, the reactance is very close to the pure inertance and this
implies that inertive forces dominate reactance at high frequencies.
Figure H1. Predicted and measured resistance versus frequency in a handheld oscillometry device. The predicted resistance closely matched the measured resistance, indicating that the device can accurately measure resistance. Note: Error bars cannot be seen because the measurements were highly repeatable.
202

Figure H2. Reactance validation testbed.
Figure H3. Predicted and measured reactance versus frequency in a handheld oscillometry device. The predicted reactance closely matched the measured reactance, indicating that the device can accurately measure reactance.
203