Assessment: Course/Service Four Column - De Anza College
318
Dept - (PSME) Mathematics Assessment: Course/Service Four Column MATH 10:Elementary Statistics and Probability Student Learning Outcomes (SLOs) Assessment Methods Assessment Data Summaries Enhancements MATH10_SLO_1 - Organize, analyze, and utilize appropriate methods to draw conclusions based on sample data by constructing and/or evaluating tables, graphs, and numerical measures of characteristics of data. Planned Assessment Quarters: 2012- 13 2-Fall SLO Status: Active Target for Success: At least 75% of students in 5 Math 10 sections correctly identifying the best estimate for the population proportion as the sample proportion and giving the appropriate symbol and calculating its correct value. Reflection (CLICK ON ? FOR INSTRUCTIONS): With an average of 9 correct responses of 10, students were extremely competent with recognizing proper symbols and performing correct calculations for sample statistics. Enhancement: Continue stressing the numerical relationship between parameters and statistics. (04/20/2013) Program Review Reporting Year: 2012-2013 Target : Target Met 89% of students provided the correct symbol for the sample proportion and 91% found its correct value. (11/16/2012) Exam - Course Test/Quiz - Quiz question on best point estimates, both symbols and values for a population parameter Target for Success: 80% of students successfully complete lab. Reflection (CLICK ON ? FOR INSTRUCTIONS): Pleased with results, but 3 students failed to turn in the project. For future, I will send out more reminders. Program Review Reporting Year: 2017-2018 Target : Target Met 20 out of 24 students received passing grade. (03/13/2018) Reflection (CLICK ON ? FOR INSTRUCTIONS): Overall students still struggle with proper notation and identifying the difference between parameters and statistics. Program Review Reporting Year: 2012-2013 Target : Target Met Out of 57 students 46 successfully completed the lab showing competence in descriptive statistics (04/11/2013) Enhancement: Continue to keep the data fresh and monitor the Program Review Reporting Year: 2012-2013 Target : Target Met Laboratory Project - Students create descriptive statistics, charts and graphs from several real world data sets. They must draw valid conclusions by interpreting the graphs and make "common sense" inferences that will be compared later to actual hypothesis test results. 09/19/2019 Page 1 of 318 Generated by Nuventive Improve
-
Upload
khangminh22 -
Category
Documents
-
view
0 -
download
0
Transcript of Assessment: Course/Service Four Column - De Anza College

Dept - (PSME) Mathematics
Assessment: Course/Service Four Column
MATH 10:Elementary Statistics and Probability
Student LearningOutcomes (SLOs) Assessment Methods Assessment Data Summaries Enhancements
MATH10_SLO_1 - Organize, analyze,and utilize appropriate methods todraw conclusions based on sampledata by constructing and/orevaluating tables, graphs, andnumerical measures of characteristicsof data.
Planned Assessment Quarters: 2012-13 2-Fall
SLO Status: Active
Target for Success: At least 75% ofstudents in 5 Math 10 sectionscorrectly identifying the bestestimate for the populationproportion as the sample proportionand giving the appropriate symboland calculating its correct value.
Reflection (CLICK ON ? FOR INSTRUCTIONS): With anaverage of 9 correct responses of 10, students wereextremely competent with recognizing proper symbols andperforming correct calculations for sample statistics.
Enhancement: Continue stressingthe numerical relationshipbetween parameters andstatistics. (04/20/2013)
Program Review Reporting Year: 2012-2013Target : Target Met89% of students provided the correct symbol for the sampleproportion and 91% found its correct value. (11/16/2012)
Exam - Course Test/Quiz - Quizquestion on best point estimates,both symbols and values for apopulation parameter
Target for Success: 80% of studentssuccessfully complete lab.
Reflection (CLICK ON ? FOR INSTRUCTIONS): Pleased withresults, but 3 students failed to turn in the project. Forfuture, I will send out more reminders.
Program Review Reporting Year: 2017-2018Target : Target Met20 out of 24 students received passing grade. (03/13/2018)
Reflection (CLICK ON ? FOR INSTRUCTIONS): Overallstudents still struggle with proper notation and identifyingthe difference between parameters and statistics.
Program Review Reporting Year: 2012-2013Target : Target MetOut of 57 students 46 successfully completed the labshowing competence in descriptive statistics (04/11/2013)
Enhancement: Continue to keepthe data fresh and monitor the
Program Review Reporting Year: 2012-2013Target : Target Met
Laboratory Project - Students createdescriptive statistics, charts andgraphs from several real world datasets. They must draw validconclusions by interpreting thegraphs and make "common sense"inferences that will be comparedlater to actual hypothesis testresults.
09/19/2019 Page 1 of 318Generated by Nuventive Improve

Student LearningOutcomes (SLOs) Assessment Methods Assessment Data Summaries Enhancements
Reflection (CLICK ON ? FOR INSTRUCTIONS): This result farexceeded the benchmark established for the lab. Studentsworked well in groups which helped the success of the lab.
results of this successful lab.(12/12/2012)
95% of students successfully completed the lab.(12/12/2012)
Target for Success: At least 75% ofstudents will achieve a score of 75%or better on the assessmentquestion
Reflection (CLICK ON ? FOR INSTRUCTIONS): Based onabove data, students successfully understood the SLO.
Program Review Reporting Year: 2012-2013Target : Target MetFinal exam questions
The table below shows the number of times a weekstudents play video games, on average, during the course ofa week.
What proportion of students play video games at most 3times a week:
What is the cumulative relative frequency for students whoplay video games 5 times a week?
Out of 76 questions, there were 67 correct answers or 88%correct. (03/26/2013)
Reflection (CLICK ON ? FOR INSTRUCTIONS): Overallstudents struggle the most with correct notation but havethe general concepts.
Enhancement: A greater focus onappropriate notation in lectureand homework will beimplemented. (01/15/2013)
Program Review Reporting Year: 2012-2013Target : Target Metout of 30 students tested, 24 achieved a 75% or better onthe assessment question (01/15/2013)
Exam - Course Test/Quiz - A finalexam question including creating arelative frequency table andcalculating sample statistics usingappropriate notation
Target for Success: 80% completionrate
Reflection (CLICK ON ? FOR INSTRUCTIONS): Will rewritethe "inference" question to more clearly emphasize what isbeing asked. Will discuss inferences from graphs more infuture classes.
Program Review Reporting Year: 2013-2014Target : Target Not Met18 out of 23 (78.2%) of the projects created the correctgraph. 14 out of 23 (60.9%) of the projects had the correctinferences drawn from the graph. (01/28/2014)
Project - Students create graphsfrom survey data and made intuitiveinferences
09/19/2019 Page 2 of 318Generated by Nuventive Improve

Student LearningOutcomes (SLOs) Assessment Methods Assessment Data Summaries Enhancements
Reflection (CLICK ON ? FOR INSTRUCTIONS): Discussedproject with colleague and shared assessment
Enhancement: Increase thechallenge of this part of theproject. (03/23/2013)
Program Review Reporting Year: 2012-2013Target : Target Met100% of students successfully completed this part of theproject. (03/23/2013)
Target for Success: 70% of studentsachieving a passing score.Comments/Notes: 74% of studentobtained a passing score, including41% of students who received A's.
Exam - Course Test/Quiz - Successfulpassing of first exam.
Target for Success: 65% of studentswith a passing exam score
Reflection (CLICK ON ? FOR INSTRUCTIONS): Students whodid not pass, by and large, were not putting in the time andeffort to understand the concepts.
Program Review Reporting Year: 2012-2013Target : Target Met68% of students successfully passed exam. (06/21/2013)
Exam - Course Test/Quiz - answer avariety of questions requiring properidentification of variables, analysis ofnumerical statistics, andinterpretation of graphical results
Target for Success: 90% completionrate.
Reflection (CLICK ON ? FOR INSTRUCTIONS): Lab wasconsidered successful, no major changes needed
Program Review Reporting Year: 2012-2013Target : Target Met95% of students successfully completed this lab.Explanations ranged from acceptable to outstanding.(06/24/2013)
Laboratory Project - Minitab lab -Students will successfully organizeraw data into descriptive statisticsand graphs. The students will thenexplain and interpret their statisticsand graphs.
Reflection (CLICK ON ? FOR INSTRUCTIONS): I was verypleased by the performance of the class on this project. Atthe time the project was assigned, students were given therubric for how the project would be graded. I think thatthis helped the students to include the required
Enhancement: In the future, I willcontinue to give students thegrading rubric for the projectahead of time, and I will alsocontinue to post a past example ofan A project. Both of theseseemed to really help students. Iam also pleased that theenhancement regarding outliercalculations was effective.To help students with going over
Program Review Reporting Year: 2016-2017Target : Target Met29 students (94% of the class) scored 39 or higher on theproject. All 29 students scored between 45 and 50 points onthe project (the equivalent of an A), with 4 studentsreceived 50 out of 50 on this group project (03/24/2017)
Project - Students complete a groupproject to collect and analyze datausing statistical methods, graphs andmeasures studied in class. Theywere given instructions forcompletion of the project and arubric for how they would begraded. Students were awardedpoints based on successfulcompletion of each criterion in therubric. The points were then totaled
09/19/2019 Page 3 of 318Generated by Nuventive Improve
Student LearningOutcomes (SLOs) Assessment Methods Assessment Data Summaries Enhancements
Target for Success: Success wasdefined as at least 70% of studentsscoring at least 39 out of 50 pointson the project.
components of the project. In addition, the week beforethe project was due, I posted copies of 2 past projects sostudents could see what an A project looked like. Inparticular, the section on finding outliers was very welldone. This had been a problem in the past and so Iemphasized the procedure for finding outliers this quarter.This seems to have helped.There were a few groups who lost points for one reason oranother. The groups that did not score at the targeted leveldid not use the rubric and were missing some requiredelements. Groups also lost points because theircalculations were not correct. I had invited students tohave me check over their projects during my office hours inorder to catch any errors, but only two groups tookadvantage of this.
their work, next time I will bemore careful to go from group togroup and see if they would likeme to check over the work theyhad done. (03/24/2017)
Reflection (CLICK ON ? FOR INSTRUCTIONS): I was verypleased by the performance of the class on this project. Atthe time the project was assigned, students were given therubric for how the project would be graded. I think thatthis helped the students to include the requiredcomponents of the project. In addition, the week beforethe project was due, I posted copies of 2 past projects sostudents could see what an A project looked like. Inparticular, the section on finding outliers was very welldone. This had been a problem in the past and so Iemphasized the procedure for finding outliers this quarter.This seems to have helped.There were a few groups who lost points for one reason oranother. The groups that did not score at the targeted leveldid not use the rubric and were missing some required
Enhancement: In the future, I willcontinue to give students thegrading rubric for the projectahead of time, and I will alsocontinue to post a past example ofan A project. Both of theseseemed to really help students. Iam also pleased that theenhancement regarding outliercalculations was effective.To help students with going overtheir work, next time I will bemore careful to go from group togroup and see if they would likeme to check over the work theyhad done. (06/13/2016)
Program Review Reporting Year: 2015-2016Target : Target Met30 students (91% of the class) scored 39 or higher on theproject. 20 of the students scored between 45 and 50points on the project (the equivalent of an A), with theremaining 10 students scoring 39 – 44 points (a B). 6students received 50 out of 50 on this group project(06/13/2016)
and a grade given for the project.
09/19/2019 Page 4 of 318Generated by Nuventive Improve

Student LearningOutcomes (SLOs) Assessment Methods Assessment Data Summaries Enhancements
elements. Groups also lost points because theircalculations were not correct. I had invited students tohave me check over their projects during my office hours inorder to catch any errors, but only two groups tookadvantage of this.
Reflection (CLICK ON ? FOR INSTRUCTIONS): I was verypleased by the performance of the class on this project. Atthe time the project was assigned, students were given therubric for how the project would be graded. I think thatthis helped the students to include all of the requiredcomponents of the project. In addition, the week beforethe project was due, I posted a copy of a past project sostudents could see what an A project looked like.There were a few groups who lost points for one reason oranother. Two groups failed to write the population,sample, parameter and statistic for their project. Inaddition, there were a few groups that made errors inidentifying outliers. There seemed, in those groups, to besome confusion between the calculation of the limits for anoutlier, and the identification of the outlier itself.
Enhancement: In the future, I willcontinue to give students thegrading rubric for the projectahead of time, and I will alsocontinue to post a past example ofan A project. Both of theseseemed to really help students –the projects for this class wereprobably the best I have evergotten for consistency of quality.To help students with the outlierportion of the project, I will makesure that I do additional examplesof calculating outliers using thetwo methods we discussed priorto assigning the project.(06/24/2015)
Program Review Reporting Year: 2013-2014Target : Target MetAll students in the class scored at least 39 out of 50 pointson the project. 21 students (62%) of the students scored 45– 50 points (the equivalent of an A) including 10 students(29%) who scored 50 out of 50. The remaining 38% of thestudents received scores of 41 to 44 points (the equivalentof a B) on the project. (06/24/2014)
Reflection (CLICK ON ? FOR INSTRUCTIONS): : I was verypleased by the performance of the class on this project. At
Program Review Reporting Year: 2012-2013Target : Target MetAll students in the class scored at least 39 out of 50 pointson the project. 21 students (62%) of the students scored 45– 50 points (the equivalent of an A) including 10 students(29%) who scored 50 out of 50. The remaining 38% of thestudents received scores of 41 to 44 points (the equivalentof a B) on the project. (07/01/2013)
09/19/2019 Page 5 of 318Generated by Nuventive Improve

Student LearningOutcomes (SLOs) Assessment Methods Assessment Data Summaries Enhancements
the time the project was assigned, students were given therubric for how the project would be graded. I think thatthis helped the students to include all of the requiredcomponents of the project. In addition, the week beforethe project was due, I posted a copy of a past project sostudents could see what an A project looked like.There were a few groups who lost points for one reason oranother. Two groups failed to write the population,sample, parameter and statistic for their project. Inaddition, there were a few groups that made errors inidentifying outliers. There seemed, in those groups, to besome confusion between the calculation of the limits for anoutlier, and the identification of the outlier itself.
Target for Success: Target forSuccess: 70% studentsunderstanding the numerical resultsand communication the practicalresults with a sentence.
Reflection (CLICK ON ? FOR INSTRUCTIONS): More writingrequirements in class will help raise students' ability toexplain numerical results.
Program Review Reporting Year: 2013-2014Target : Target Met74% of students responded with correct numericalcalculations and clear explanations of the result.(10/15/2013)
Exam - Course Test/Quiz - Quizzedstudents on ability to use z-scores tocompare three animal weightsrelative to species based on a chartof statistics.
Target for Success: Average classscore of 65%.
Reflection (CLICK ON ? FOR INSTRUCTIONS): This was oneof the first quizzes given to students. As such, theyperformed well.
Program Review Reporting Year: 2014-2015Target : Target MetClass average for quiz was 75%. (10/09/2014)
Exam - Course Test/Quiz -evaluating student ability to findprobabilities using two-waycontingency tables and selectedprobability statements, and findingrelative measures and explaininghow to use those measures to reachresults.
Reflection (CLICK ON ? FOR INSTRUCTIONS): All studentswere successful, which is a great start to the quarter!
Program Review Reporting Year: 2014-2015Target : Target MetAll students were successful! (01/20/2015)
Project - Students will gathersample data and a create relativefrequency table, boxplot andhistogram of the data, properlyinterpreting the data.
09/19/2019 Page 6 of 318Generated by Nuventive Improve

Student LearningOutcomes (SLOs) Assessment Methods Assessment Data Summaries Enhancements
Target for Success: 90% of groupswill be 90% or better on the project.
Having time in class to work on this project was helpful forstudent success.
Reflection (CLICK ON ? FOR INSTRUCTIONS): In futureclasses, I need to emphasize scaling and labelling graphs.
Program Review Reporting Year: 2014-2015Target : Target Not Met89% average score, 57% scored 90% or above. (10/07/2014)
Reflection (CLICK ON ? FOR INSTRUCTIONS): Some stillneed to work on the organizational skills when presenting apaper. Having more examples for them to look at on mywebsite should help in the future.
Program Review Reporting Year: 2013-2014Target : Target MetStudents did an excellent job on this project. I was quitepleased. (05/05/2014)
Target for Success: 70% of studentsachieving a passing score.
Reflection (CLICK ON ? FOR INSTRUCTIONS): I will surveystudents to see what I can do to better help them and whatthey can do to help learn the material.
Program Review Reporting Year: 2014-2015Target : Target Not MetOnly 23% of students passed. This was very disappointing.(05/05/2015)
Reflection (CLICK ON ? FOR INSTRUCTIONS): comparedresults with other instructors
Enhancement: I will be reviewingadditional examples using two-way contingency tables(02/05/2015)
Program Review Reporting Year: 2014-2015Target : Target Met 74% of students achieved a passing score. (01/29/2015)
Comments/Notes: 74% of studentobtained a passing score, including41% of students who received A's.
Exam - Course Test/Quiz - Successfulpassing of first exam.
Target for Success: At least 70% ofstudents get 70% or better
Reflection (CLICK ON ? FOR INSTRUCTIONS): Students havetrouble differentiating between the value of a percentileand the location of the percentile. More work can be doneon graphical representations of data.
Program Review Reporting Year: 2014-2015Target : Target Met14/19 students successfully completed this lab.(03/27/2015)
Laboratory Project - Studentscollected data in class and wereasked to analyze it then drawappropriate conclusions. Studentswere given a complete gradingrubric and assigned group gradesupon completion.
Enhancement: Add additional datasets to the lab. (04/24/2016)
Program Review Reporting Year: 2015-2016Target : Target Met
Laboratory Project - Studentschoose the appropriate graphs
09/19/2019 Page 7 of 318Generated by Nuventive Improve

Student LearningOutcomes (SLOs) Assessment Methods Assessment Data Summaries Enhancements
Target for Success: 85% successfullycomplete lab
Reflection (CLICK ON ? FOR INSTRUCTIONS): 100% ofstudents completed project successfully. A possibleenhancement would be to look at other data sets.
Students were given data from the website rate myprofessor and created dot plots of rating, cross-tabulated byvarious categorical variables. They then described visuallythe center, shpae and spread of the data. (04/24/2016)
Reflection (CLICK ON ? FOR INSTRUCTIONS): Discussed labproject with two other stat instructors who mayincorporate a similar project in their courses.
Program Review Reporting Year: 2014-2015Target : Target Met95% of students successfully completed Minitab lab projectdemonstrating an understanding of graphs. (06/12/2015)
based on whether data iscategorical, numerical or both.Students then create theappropriate graph and then describecenter, shape and spread and makecomparisons
Target for Success: Class averagequiz score of 70%.
Reflection (CLICK ON ? FOR INSTRUCTIONS): Students werecompetent overall with data organization. Additionalemphasis on variable definitions would be helpful.
Program Review Reporting Year: 2015-2016Target : Target MetClass average quiz score of 80% (11/10/2015)
Exam - Course Test/Quiz - Quizcovering organizing, displaying andanalyzing data.
Target for Success: mean score of80%
Laboratory Project - Minitab labwhere students construct dotplotsfrom a data set and interpret center,shape and spread of data.
Target for Success: mean score of90%
Reflection (CLICK ON ? FOR INSTRUCTIONS): Everyonethought this was an effective lab since the data came froman actual Harvard study which showed that AirBnb hostswere discriminating against people whose names didn'tsound "white". Airbnb has since changed their platform.
Program Review Reporting Year: 2018-2019Target : Target Met34 students worked in groups to complete the lab wheredata was taken from a study about discrimination forpeople using the AirBnB platform. All students successfullycompleted the lab. (03/18/2019)
Enhancement: change data fornext quarter (06/22/2016)
Program Review Reporting Year: 2015-2016Target : Target Met
Laboratory Project - Student willcreate descriptive statistics andgraphs from a large data set andthen successfully describe thecenter, shape, spread and unusualobservations
09/19/2019 Page 8 of 318Generated by Nuventive Improve
Student LearningOutcomes (SLOs) Assessment Methods Assessment Data Summaries Enhancements
Reflection (CLICK ON ? FOR INSTRUCTIONS): Studentscreated different graphs and were successfully able tocontrast and compare to the descriptive stats.
Mean score on lab was 95% - Students were successfullyable to grasp th concepts (06/22/2016)
Target for Success: 70% pass rateReflection (CLICK ON ? FOR INSTRUCTIONS): Most ofquestions students got wrong dealt with choosing incorrectdistribution to carry out hypothesis test, need to spendmore time emphasizing how to choose the correctdistribution for hypothesis test.
Program Review Reporting Year: 2015-2016Target : Target Not Met17 out of 30 students taking the exam passed (06/22/2016)
Exam - Course Test/Quiz - Exam 3deals with confidence intervals andhypothesis testing requires studentsuse SLO 1
Target for Success: At least 80% ofstudents correctly portraying sampledata using histograms.
Reflection (CLICK ON ? FOR INSTRUCTIONS): Studentsenjoyed this exercise and were able to accurately interpretthe center, shape spread and outliers.
Program Review Reporting Year: 2018-2019Target : Target MetThe students collected data on units taken by students.Working in groups, they created and interpreted the graphs.(12/19/2018)
Laboratory Project - Students collectsample data on campus usingrandomized methods thensummarize and interpret resultsusing histograms, frequency tables,box plots and measures of centerand dispersion.
MATH10_SLO_2 - Identify, evaluate,interpret and describe datadistributions through the study ofsampling distributions and probabilitytheory.SLO Status: Active
Target for Success: The combinedstudent scores in 5 Math 10 sections
Reflection (CLICK ON ? FOR INSTRUCTIONS): About 3 out ofevery 4 students, on average, were able to take thenumerical results and present a properly labeled and scaledgraph to represent the results.
Enhancement: Continue to stressgraphical interpretations ofconfidence intervals. (04/20/2013)
Program Review Reporting Year: 2012-2013Target : Target Met73% of total points were awarded for student answers.(11/16/2012)
Exam - Course Test/Quiz - Make avisual connection between theprobability distribution of a randomvariable, the proportion of onesample, and the populationproportion, a parameter. Sketch theshape of the distribution anddesignate the resulting confidencelevel corresponding to an area ofprobability under the distributioncurve of the random variable.Include a second axis forstandardized scores.
09/19/2019 Page 9 of 318Generated by Nuventive Improve

Student LearningOutcomes (SLOs) Assessment Methods Assessment Data Summaries Enhancements
should total at least 70% of allpossible points assigned for theproblem.
Target for Success: 80% of studentssuccessfully complete lab.
Reflection (CLICK ON ? FOR INSTRUCTIONS): Studentsinitially struggled on the lab, but after some help 90% wereable to successfully complete the lab.
Enhancement: Improveinstructions for lab and give aclearer example of the process.(04/15/2013)
Program Review Reporting Year: 2012-2013Target : Target Met90% of students successfully completed lab. (12/12/2012)
Laboratory Project - Students arerequired to identify and simulateseveral random variables byanalyzing the real life word problemand using an inverse pdf and arandom number generator to createrandom samples. The students thenverify the model by calculating thesample mean, median and standarddeviation to compare to thepopulation values, and then makehistograms and box plots of the dataan compare to the expected result.
Target for Success: At least 75% ofstudents will achieve a score of 75%or better on the assessmentquestion
Reflection (CLICK ON ? FOR INSTRUCTIONS): The studentsare unsure of which probability rules to use in differentsituation and continue to be uncomfortable with theuniform distribution. More work with the interaction ofthese two topics is needed.
Program Review Reporting Year: 2012-2013Target : Target Not MetOut of 50 students 26 correctly completed a question onprobability distributions on the final exam. (04/11/2013)
Reflection (CLICK ON ? FOR INSTRUCTIONS): Studentsstruggle with interpreting the correct inequalities for agiven situation. Without this starting point, students have ahard time completing the problem. Students also struggleto identify the correct distribution to use in a givensituation.
Enhancement: For Winter 2013,more practice on interpretingprobability notation will beincluded (01/15/2013)
Program Review Reporting Year: 2012-2013Target : Target Not MetOut of 30 students tested, 17 students achieved a score of75% or better. (01/15/2013)
Exam - Course Test/Quiz - A finalexam question where student areasked to calculate probabilities usingcorrect notation for differentdistributions.
Program Review Reporting Year: 2011-2012Target : Target Met
Exam - Course Test/Quiz - Examquestion on choosing correct
09/19/2019 Page 10 of 318Generated by Nuventive Improve
Student LearningOutcomes (SLOs) Assessment Methods Assessment Data Summaries Enhancements
Target for Success: 70% get answercorrect
Reflection (CLICK ON ? FOR INSTRUCTIONS): Based on datacollected, it looks like the students successfully understoodthis SLO.
final exam question:
The weight of Snickers candy bars are uniformly distributedbetween 1.8 and 2.2 ounces. We sample a box of snickerbars containing 48 snicker bars.The distributed for the average weight of 48 snicker bars is.
One the final, 30/34 students got the correct answer or 88% (04/25/2013)
Reflection (CLICK ON ? FOR INSTRUCTIONS): Discussedusing questions as assessments with colleague
Enhancement: Future evaluationof a different area of this SLO(03/23/2013)
Program Review Reporting Year: 2012-2013Target : Target Met76% of students correctly answered this question.(03/23/2013)
sampling distribution.
Target for Success: 75% of studentssuccessfully responding
Reflection (CLICK ON ? FOR INSTRUCTIONS): Students weregenerally comfortable with the concept. Some haddifficulty with understanding the definition of the variablewhen constructing the probability distribution function
Program Review Reporting Year: 2012-2013Target : Target Met80.1% of students correctly setting up and interpreting theexpected winnings (05/13/2013)
Exam - Course Test/Quiz - Studentsrequired to construct the probabilitydistribution function for thewinnings resulting from a "carnivalgame." In addition, they needed towrite a sentence interpreting theexpected average winnings from thegame.
Target for Success: 90% completionrate. Reflection (CLICK ON ? FOR INSTRUCTIONS): A difficult lab
for students, but analysis was accurate and complete inmost cases.
Enhancement: Add additionalrandom variables to simulate,including empirical data derivedpdfs (04/24/2016)
Program Review Reporting Year: 2015-2016Target : Target MetStudents were asked to simulate the Normal andExponential distributions and then compare the samplestatistics with the population parameters. 100% of studentssuccessfully completed the lab. (04/24/2016)
Program Review Reporting Year: 2012-2013Target : Target Met
Laboratory Project - Minitab projectsimulating continuous randomvariables. Students will comparesimulated data sample statistics withexpected population parameters.
09/19/2019 Page 11 of 318Generated by Nuventive Improve
Student LearningOutcomes (SLOs) Assessment Methods Assessment Data Summaries Enhancements
Reflection (CLICK ON ? FOR INSTRUCTIONS): Although thetarget was met, I felt that 30% of the students did notadequately compare the descriptive statistics to thepopulation parameters.
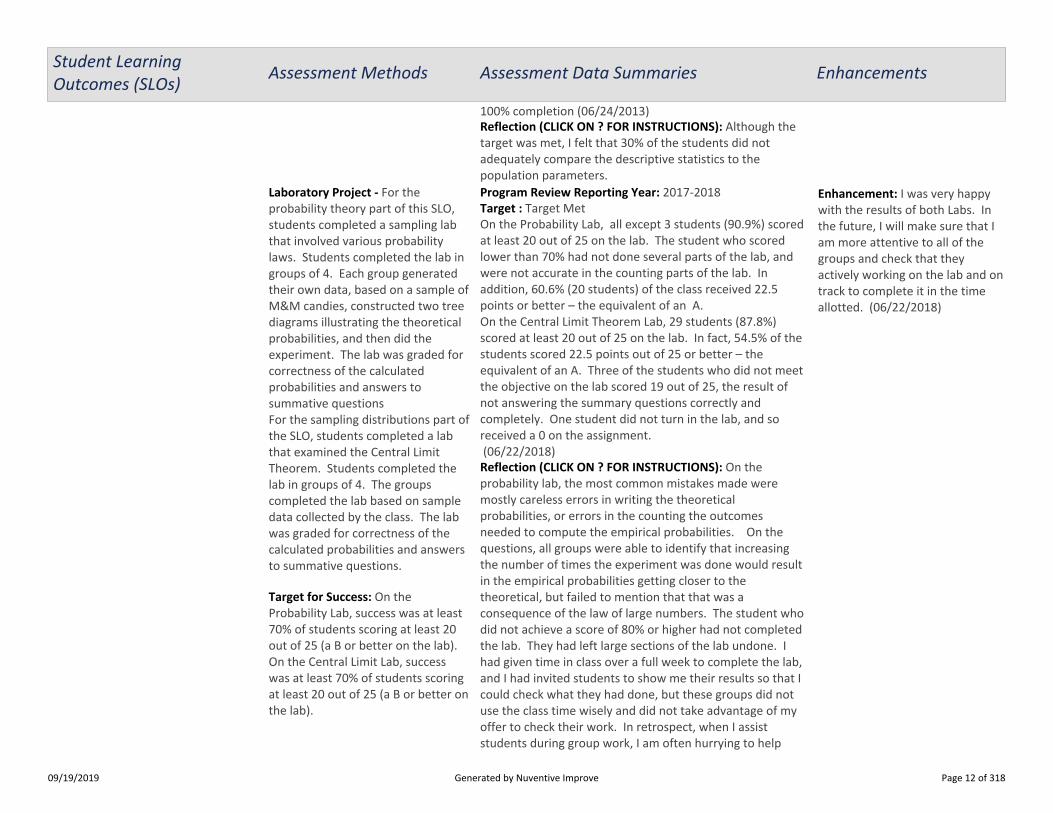
100% completion (06/24/2013)
Target for Success: On theProbability Lab, success was at least70% of students scoring at least 20out of 25 (a B or better on the lab).On the Central Limit Lab, successwas at least 70% of students scoringat least 20 out of 25 (a B or better onthe lab).
Reflection (CLICK ON ? FOR INSTRUCTIONS): On theprobability lab, the most common mistakes made weremostly careless errors in writing the theoreticalprobabilities, or errors in the counting the outcomesneeded to compute the empirical probabilities. On thequestions, all groups were able to identify that increasingthe number of times the experiment was done would resultin the empirical probabilities getting closer to thetheoretical, but failed to mention that that was aconsequence of the law of large numbers. The student whodid not achieve a score of 80% or higher had not completedthe lab. They had left large sections of the lab undone. Ihad given time in class over a full week to complete the lab,and I had invited students to show me their results so that Icould check what they had done, but these groups did notuse the class time wisely and did not take advantage of myoffer to check their work. In retrospect, when I assiststudents during group work, I am often hurrying to help
Enhancement: I was very happywith the results of both Labs. Inthe future, I will make sure that Iam more attentive to all of thegroups and check that theyactively working on the lab and ontrack to complete it in the timeallotted. (06/22/2018)
Program Review Reporting Year: 2017-2018Target : Target MetOn the Probability Lab, all except 3 students (90.9%) scoredat least 20 out of 25 on the lab. The student who scoredlower than 70% had not done several parts of the lab, andwere not accurate in the counting parts of the lab. Inaddition, 60.6% (20 students) of the class received 22.5points or better – the equivalent of an A.On the Central Limit Theorem Lab, 29 students (87.8%)scored at least 20 out of 25 on the lab. In fact, 54.5% of thestudents scored 22.5 points out of 25 or better – theequivalent of an A. Three of the students who did not meetthe objective on the lab scored 19 out of 25, the result ofnot answering the summary questions correctly andcompletely. One student did not turn in the lab, and soreceived a 0 on the assignment. (06/22/2018)
Laboratory Project - For theprobability theory part of this SLO,students completed a sampling labthat involved various probabilitylaws. Students completed the lab ingroups of 4. Each group generatedtheir own data, based on a sample ofM&M candies, constructed two treediagrams illustrating the theoreticalprobabilities, and then did theexperiment. The lab was graded forcorrectness of the calculatedprobabilities and answers tosummative questionsFor the sampling distributions part ofthe SLO, students completed a labthat examined the Central LimitTheorem. Students completed thelab in groups of 4. The groupscompleted the lab based on sampledata collected by the class. The labwas graded for correctness of thecalculated probabilities and answersto summative questions.
09/19/2019 Page 12 of 318Generated by Nuventive Improve

Student LearningOutcomes (SLOs) Assessment Methods Assessment Data Summaries Enhancements
groups who have their hands up for help. I think thatperhaps I should also make sure I visit those groups who areshy of asking for help and have them show me their workand actively help them with parts they are unsure of.On the Central Limit Theorem Lab, the most common errorsmade were in not following directions, especially indescribing the shapes of the graphs. Previous quarter’serrors made in correctly stating the theoretical distributionwere not present in this lab. Extra care was taken to makesure students understood the directions for this part.
Reflection (CLICK ON ? FOR INSTRUCTIONS): On theprobability lab, the most common mistakes made weremostly careless errors in writing the theoreticalprobabilities, or errors in the counting the outcomesneeded to compute the empirical probabilities. On thequestions, all groups were able to identify that increasingthe number of times the experiment was done would resultin the empirical probabilities getting closer to thetheoretical, but failed to mention that that was aconsequence of the law of large numbers. The student whodid not achieve a score of 80% or higher had not completedthe lab. They had left large sections of the lab undone. Ihad given time in class over a full week to complete the lab,
Enhancement: I was very happywith the results of both Labs. Inthe future, I will make sure that Iam more attentive to all of thegroups and check that theyactively working on the lab and ontrack to complete it in the timeallotted. (03/24/2017)
Program Review Reporting Year: 2016-2017Target : Target MetOn the Probability Lab, all except 1 student (96.8%) ofstudents scored at least 20 out of 25 on the lab. Thestudent who scored lower than 70% had not done severalparts of the lab, and were not accurate in the counting partsof the lab. In addition, 71% (22 students) of the classreceived 22.5 points or better – the equivalent of an A.On the Central Limit Theorem Lab, 29 students (93.5%)scored at least 20 out of 25 on the lab. In fact, 54.8% of thestudents scored 22.5 points out of 25 or better – theequivalent of an A. The students who did not meet theobjective on the lab scored 19 out of 26, the result of notanswering the summary questions correctly and completely. (03/24/2017)
09/19/2019 Page 13 of 318Generated by Nuventive Improve

Student LearningOutcomes (SLOs) Assessment Methods Assessment Data Summaries Enhancements
and I had invited students to show me their results so that Icould check what they had done, but these groups did notuse the class time wisely and did not take advantage of myoffer to check their work. In retrospect, when I assiststudents during group work, I am often hurrying to helpgroups who have their hands up for help. I think thatperhaps I should also make sure I visit those groups who areshy of asking for help and have them show me their workand actively help them with parts they are unsure of.On the Central Limit Theorem Lab, the most common errorsmade were in not following directions, especially indescribing the shapes of the graphs. Previous quarter’serrors made in correctly stating the theoretical distributionwere not present in this lab. Extra care was taken to makesure students understood the directions for this part.
Reflection (CLICK ON ? FOR INSTRUCTIONS): On theprobability lab, the most common mistakes made weremostly careless errors in writing the theoreticalprobabilities, or errors in the counting the outcomesneeded to compute the empirical probabilities. On thequestions, all groups were able to identify that increasing
Enhancement: Although I was veryhappy that the majority of theclass had done very well on thislab, I was very concerned that somany students ( 9 students) hadnot completed the lab and, thus,received low scores on the lab. Inthe future, I will make sure that Iam more attentive to all of thegroups and check that theyactively working on the lab and ontrack to complete it in the timeallotted. (06/13/2016)
Program Review Reporting Year: 2015-2016Target : Target MetOn the Probability Lab, 72.7% of students scored at least 20out of 25 on the lab. Of those who did not score at least70%, one group of 3 students scored 15 out of 25 (a D) and2 groups of students scored grades of F on the lab. Thestudents who scored lower than 70% had not done severalparts of the lab, and were not accurate in the counting partsof the lab. In addition, 42.4% of the class received 22.5points or better – the equivalent of an A.On the Central Limit Theorem Lab, 93.8% of students scoredat least 20 out of 25 on the lab. In fact, 87.5% of thestudents scored 22.5 points out of 25 or better – theequivalent of an A. The students who did not meet theobjective on the lab scored 16 out of 26, the result of notanswering the summary questions correctly and completely. (06/13/2016)
09/19/2019 Page 14 of 318Generated by Nuventive Improve
Student LearningOutcomes (SLOs) Assessment Methods Assessment Data Summaries Enhancements
the number of times the experiment was done would resultin the empirical probabilities getting closer to thetheoretical, but failed to mention that that was aconsequence of the law of large numbers. The studentswho did not achieve a score of 80% or higher had notcompleted the lab. They had left large sections of the labundone. I had given time in class over a full week tocomplete the lab, and I had invited students to show metheir results so that I could check what they had done, butthese groups did not use the class time wisely and did nottake advantage of my offer to check their work. Inretrospect, when I assist students during group work, I amoften hurrying to help groups who have their hands up forhelp. I think that perhaps I should also make sure I visitthose groups who are shy of asking for help and have themshow me their work and actively help them with parts theyare unsure of.On the Central Limit Theorem Lab, the most common errorsmade were in not following directions, especially indescribing the shapes of the graphs. Previous quarter’serrors made in correctly stating the theoretical distributionwere not present in this lab. Extra care was taken to makesure students understood the directions for this part.
Reflection (CLICK ON ? FOR INSTRUCTIONS): The studentsappeared to have fun with both of these hands-on labs.
Program Review Reporting Year: 2014-2015Target : Target Met78% scored B or higher on Probability Lab.72% scored B or higher on Central Limit Lab (10/14/2014)
Enhancement: : I was very happywith the results of the lab. Nexttime, I will emphasize the Law ofLarge Numbers more in mylectures.
(06/24/2015)
Program Review Reporting Year: 2013-2014Target : Target MetOn the Probability Lab, all except two students (95%) scoredat least 20 out of 25 on the lab. One of the two studentsstudents did not turn in the lab. The other student scored16.5 out of 25. In addition, 16 students (45.7% of the classreceived 22.5 points or better – the equivalent of an A.On the Central Limit Theorem Lab, all except two students(95%) scored at least 20 out of 25 on the lab. In fact, 82% ofthe students scored 22.5 points out of 25 or better – the
09/19/2019 Page 15 of 318Generated by Nuventive Improve

Student LearningOutcomes (SLOs) Assessment Methods Assessment Data Summaries Enhancements
Reflection (CLICK ON ? FOR INSTRUCTIONS): On theprobability lab, the most common mistakes made weremostly careless errors in writing the theoreticalprobabilities. On the questions, all groups were able toidentify that increasing the number of times the experimentwas done would result in the empirical probabilities gettingcloser to the theoretical, but failed to mention that thatwas a consequence of the law of large numbers.On the Central Limit Theorem Lab, the most common errorsmade were in not following directions, especially indescribing the shapes of the graphs. Previous quarter’serrors made in correctly stating the theoretical distributionwere not present in this lab. Extra care was taken to makesure students understood the directions for this part.
equivalent of an A. The two students who did not meet theobjective on the lab scored 16 out of 26, the result of notanswering the summary questions correctly and completely. (06/24/2014)
Reflection (CLICK ON ? FOR INSTRUCTIONS): On theprobability lab, the most common mistakes made weremostly careless errors in writing the theoreticalprobabilities. On the questions, all groups were able to
Enhancement: : I was very happywith the results of the lab. Nexttime, I will emphasize the Law ofLarge Numbers more in mylectures. In the Central LimitTheorem Lab, I will emphasizehow to write the distribution foraverages when we discuss theinstructions for the lab.
(04/01/2014)
Program Review Reporting Year: 2013-2014Target : Target MetOn the Probability Lab, all students scored at least 20 out of25 on the lab, except for 1 group of two students whoscored 19 out of 25. In fact, the results were very good.Out of the 11 lab projects submitted, 9 groups scored 22.5or higher (the equivalent of an A), with one group scoring25 out of 25.On the Central Limit Theorem Lab, all students scored atleast 20 out of 25 on the lab, except for 1 group of twostudents who scored 19 out of 25. In fact, with theexception of the group just mentioned, all students scored23 or higher (the equivalent of an A) on the lab, with 3groups scoring 25 out of 25. (07/01/2013)
09/19/2019 Page 16 of 318Generated by Nuventive Improve

Student LearningOutcomes (SLOs) Assessment Methods Assessment Data Summaries Enhancements
identify that increasing the number of times the experimentwas done would result in the empirical probabilities gettingcloser to the theoretical, but failed to mention that thatwas a consequence of the law of large numbers.On the Central Limit Theorem Lab, the most common errorsmade were in not following directions, especially indescribing the shapes of the graphs. Also, students did notfully understand how to write the theoretical distributionfor Xbar, using the standard deviation for the samples,rather than that of the population in writing thedistribution. This is a common error.
Target for Success: 70% student passrate
Reflection (CLICK ON ? FOR INSTRUCTIONS): While moststudents were successful, there are a handful of studentsthat need to recognize the need to set aside adequate timefor studying and reviewing material.
Program Review Reporting Year: 2015-2016Target : Target MetClass average exam score of 79%. (11/10/2015)
Reflection (CLICK ON ? FOR INSTRUCTIONS): Need to domore to encourage students to study for this exam, need toemphasize in class the level of difficulty that they need tomaster.
Program Review Reporting Year: 2014-2015Target : Target Not Met15 out of 31 students scored below the passing grade.(02/17/2015)
Reflection (CLICK ON ? FOR INSTRUCTIONS): comparisonand review of results
Program Review Reporting Year: 2014-2015Target : Target MetAverage score of 76% (11/06/2014)
Reflection (CLICK ON ? FOR INSTRUCTIONS): I was quitepleased with the results, especially with the 8 students who
Program Review Reporting Year: 2013-2014Target : Target Met83% of students passed the exam with a class exam averagescore of 85%. (11/12/2013)
exam on chapters 4, 5, 6, and 7covering discrete and continuoussampling distributions
09/19/2019 Page 17 of 318Generated by Nuventive Improve

Student LearningOutcomes (SLOs) Assessment Methods Assessment Data Summaries Enhancements
got 100%.
Reflection (CLICK ON ? FOR INSTRUCTIONS): I will revisethe instructions based on questions students asked.
Program Review Reporting Year: 2017-2018Target : Target Met17 of 24 students successfully completed the activity.(03/13/2018)
Reflection (CLICK ON ? FOR INSTRUCTIONS): Somestudents had a hard time following written instructions forthis activity.
Enhancement: Next time, I willcarefully go over the instructionsin class and point out areas wherestudents mis-understood what todo, In addition, I will re-write partsof the activity to rewrite andhighlight instructions studentshave had trouble understanding.(05/28/2015)
Program Review Reporting Year: 2014-2015Target : Target Met60% of students successfully completed a project wheresampling distributions were compared to theoreticaldistributions. (05/19/2015)
Reflection (CLICK ON ? FOR INSTRUCTIONS): For future useof this project, I will update the questions to be more clearof what is being asked.
Program Review Reporting Year: 2013-2014Target : Target Met72% of students were able to explain variation in sampling.61% were able to explain how repeated sampling drawsresults closer to the original distribution. (01/31/2014)
On a technology based activity,students will compare samplingdistributions to theoreticaldistributions.
Target for Success: 90% of thegroups will be 90% or better on theproject.
Reflection (CLICK ON ? FOR INSTRUCTIONS): I need tospend more time emphasizing the number of intervals onfreg tables and histograms. Having more than 5-6 with asample of 30 - 50 can lose the shape of the distribution.
Program Review Reporting Year: 2013-2014Target : Target MetStudents did quite well in describing their sampling method.There were some minor problems with the frequency tablessince some had too many intervals. (05/05/2014)
Project - Students will describe theirsampling method for a project andthen by completing a relativefrequency table determine theappropriate probabilities.
Target for Success: At least 70% of
Enhancement: Keep the datarelevant by using the most recentstudies. (03/18/2019)
Program Review Reporting Year: 2018-2019Target : Target MetStudents were given several probability problems usingtwo-way tables. Students needed to be able to distinguishmarginal, joint and conditional probabilities, be able todetermine if events were independent and interpret results
Laboratory Project - Studentsworked in groups on acomprehensive review of probabilitytopics. Students were asked to finishby themselves over 3 days.
09/19/2019 Page 18 of 318Generated by Nuventive Improve

Student LearningOutcomes (SLOs) Assessment Methods Assessment Data Summaries Enhancements
students get 70% or better.
Reflection (CLICK ON ? FOR INSTRUCTIONS): Most studentsunderstood this concept, but some needed some help.Independence is always a challenge in Stat
as if doing a more formal hypothesis test. 32 of 35 (91%)students successfully complete the task. (03/18/2019)
Reflection (CLICK ON ? FOR INSTRUCTIONS): Students havetrouble identifying when a probability question isconditional or not.
Program Review Reporting Year: 2014-2015Target : Target Met14 out of 19 students successfully completed theassignment (03/27/2015)
Target for Success: 85% of classsuccessfully complete assignment
Reflection (CLICK ON ? FOR INSTRUCTIONS): Students wereable to see that the pig die positions are not of equalprobability like a normal cube die. The students then seethe value of repeated trials to get an estimate of eachchoice's probability.
Program Review Reporting Year: 2018-2019Target : Target MetStudents, working in pairs, rolled and tracked the 6 differentpositions the pig die landed. They then built relativefrequency tables. (12/19/2018)
Reflection (CLICK ON ? FOR INSTRUCTIONS): This projectoriginally came from Statway and we agreed that thisproject is equally appropriate for this SLO of Math 10
Program Review Reporting Year: 2014-2015Target : Target Met100% of students successfully completed this fun project.Students were able to recognize that different groups haddifferent results. (06/12/2015)
Other - Students work in groups anddetermine through repeated trialsthe empirical probability of the sixdifferent landing positions of a smalltoy pig from the game Pass the Pigs.Students than compare results withother students and explore varianceof random variables.
Target for Success: 70% of studentsachieving a passing score.Comments/Notes: 74% of studentobtained a passing score, including41% of students who received A's.
Exam - Course Test/Quiz - Successfulpassing of first exam.
Enhancement: Try using anexponential distribution next time.
Program Review Reporting Year: 2015-2016Target : Target Met
Demonstration - Students willgenerate random data from a
09/19/2019 Page 19 of 318Generated by Nuventive Improve
Student LearningOutcomes (SLOs) Assessment Methods Assessment Data Summaries Enhancements
Target for Success: 90% completionrate
Reflection (CLICK ON ? FOR INSTRUCTIONS): Students werecorrectly able to determine that the pdf of X-bar wasnormal, with the same mean and lower spread than theoriginal uniform data.
(06/22/2016)100% of students successfully completed the project.(06/22/2016)
uniform distribution in blocks of 20.Students will then take samplemeans of each block and then graphthe means and recognize thecomponents of the central limittheorem for means.
Target for Success: 70% pass rate Reflection (CLICK ON ? FOR INSTRUCTIONS): Students didwell on this exam but struggled with expected value of aprobability distribution function for game of chance, needto focus more on defining random variable X andcomputing pdf table
Program Review Reporting Year: 2015-2016Target : Target Met24 out of 34 students passed the exam (>70%) or 70.5%pass rate (06/22/2016)
Exam - Course Test/Quiz - Exam 2:deals with computing probabilityand choosing correct probabilitydistribution
MATH10_SLO_3 - Collect data,interpret, compose and defendconjectures, and communicate theresults of random data usingstatistical analyses such as intervaland point estimates, hypothesis tests,and regression analysis.SLO Status: Active
Target for Success: The combinedstudent scores in 5 Math 10 sectionsshould total at least 70% of possiblepoints assigned for the problem.
Reflection (CLICK ON ? FOR INSTRUCTIONS): Pleased withso many getting this correct, I plan to emphasize more thewriting component of the CI in later quarters.
Enhancement: Add more practiceon writing sentences to explainconfidence intervals. (11/16/2017)
Program Review Reporting Year: 2017-2018Target : Target Met18 out of 21 students demonstrated correctly writing acomplete sentence for a population parameter in thecontext of a problem. (11/16/2017)
Reflection (CLICK ON ? FOR INSTRUCTIONS): Less than halfof possible points (43%) were awarded for interpreting theresults with a complete sentence. Students omittedrequired details, made incorrect links between the resultingconfidence interval and population proportion.In conclusion, students performed excellently withnumerical computations, adequately with graphicalrepresentations and poorly with verbal interpretations.
Enhancement: AI will provideadditional examples of writteninterpretations to students. Also, Iwill require students to write moresentences to interpret results bothin class and in homeworkassignments. (04/20/2013)
Program Review Reporting Year: 2012-2013Target : Target Not Met47% of total points were awarded for student answers inthe 5 Math 10 sections. (11/16/2012)
Exam - Course Test/Quiz - Interpreta confidence interval for apopulation parameter in context ofthe problem with a completesentence.
Project - Using data provided to
09/19/2019 Page 20 of 318Generated by Nuventive Improve

Student LearningOutcomes (SLOs) Assessment Methods Assessment Data Summaries Enhancements
Target for Success: 90% of studentssuccessfully complete project.
Reflection (CLICK ON ? FOR INSTRUCTIONS): Most studentssuccessfully completed the project, and were especiallyproficient in appropriate use of ANOVA, Regression and Chi-square Test of Independence Models - topics that werestressed in the course due to the critical necessity of thesemodels in research. Students were also able to createcomparative graphs and tables that were consistent withresults.
The most common error was failure to recognize thedifference between Dependent and Independent samplingon one of the eight hypothesis tests.
The students who did not succeed failed to turn in acomplete project so their performance cannot be assessed.
Enhancement: Developmentexamples and exercises that helpstudents understand thedifference between dependentand independent sampling.(04/15/2013)
Program Review Reporting Year: 2012-2013Target : Target Met90% of students turned in a satisfactory project, 10% ofprojects were deemed unsatisfactory (12/12/2012)
them by the instructor in addition todata collected by them during anearlier project, students will designand conduct 8 hypothesis tests.Students will need to successfullystate the hypotheses in context andin symbols, choose the correctmodel, run the test using computersoftware, make the correct decision,compare results to appropriategraphs, and write a two pageresearch report analyzing theconclusions in non-statisticallanguage.
Target for Success: At least 75% ofstudents will achieve a score of 75%or better on the assessmentquestion
Reflection (CLICK ON ? FOR INSTRUCTIONS): Studentscontinue to have trouble identifying when to use a t-testversus a z-test. They are confused about when they havethe parameter value versus the statistic value.
Program Review Reporting Year: 2012-2013Target : Target Not MetOut of 50 students 28 correctly completed a question onthe final exam. (04/11/2013)
Program Review Reporting Year: 2012-2013Target : Target MetFinal Exam QuestionA tire manufacturer claims that his tires last at least 60,000miles. To test this claim, we sample 125 tires and find thelasted, on average, 62,000 miles with a standard deviationof 800 miles.
there were four questions associated with this question:
What is the null hypothesis:
What is the appropriate test for this problem:
Exam - Course Test/Quiz - A finalexam question where students areto perform a hypothesis test ongiven data.
09/19/2019 Page 21 of 318Generated by Nuventive Improve
Student LearningOutcomes (SLOs) Assessment Methods Assessment Data Summaries Enhancements
Reflection (CLICK ON ? FOR INSTRUCTIONS): Based on theabove data, students successfully understood the SLO
What is the p-value for this sample:
At a 1% signficance level, which conclusion is mostappropriate
Out of 152 total questions there were 137 correct answersor 90% correct. (03/26/2013)
Reflection (CLICK ON ? FOR INSTRUCTIONS): Studentsstruggled with identifying the type of hypothesis test tocomplete in a given situation. Following that, studentslacked proper notation to complete the test.
Enhancement: More guidedpractice will be included to aid thestudents in being able to find theappropriate work to complete.(01/15/2013)
Program Review Reporting Year: 2012-2013Target : Target Not MetOut of 30 students, 18 achieved a score of 75% or better onthis question. (01/15/2013)
Target for Success: 80% completion
Reflection (CLICK ON ? FOR INSTRUCTIONS): Discussedwith a colleague ways to improve the lab and how to useMinitab.
Enhancement: More time spenton design and conclusions ofhypothesis testing (03/23/2013)
Program Review Reporting Year: 2012-2013Target : Target Met100% of students completed assignment, although somestudents had difficulty with design and conclusions(03/23/2013)
Laboratory Project - Students designand run using computer softwarehypothesis tests. Students must thenstate valid conclusions. Studentsmust choose the correct model andcheck the assumptions needed forthe chosen model.
Target for Success: At least 65% ofstudents with passing scores
Reflection (CLICK ON ? FOR INSTRUCTIONS): Students needto spend more time on homework assignments and hands-on worksheets.
Program Review Reporting Year: 2012-2013Target : Target Met68% of students with passing scores (06/21/2013)
Exam - Course Test/Quiz - Usingbivariate data, determine and graphthe best fit line, test if thecorrelation coefficient is significant,predict values of the dependentvariable, and find the percent ofvariation in the dependent variablethat is not explained by theindependent variable.
Enhancement: Incorporate theAirbnb study data since it was so
Program Review Reporting Year: 2018-2019Target : Target Met
Other - Group work - studentsshould discuss various research
09/19/2019 Page 22 of 318Generated by Nuventive Improve

Student LearningOutcomes (SLOs) Assessment Methods Assessment Data Summaries Enhancements
Target for Success: 90% successfullycomplete lab
Reflection (CLICK ON ? FOR INSTRUCTIONS): Their wasinitial some confusion about the difference betweendependent and independent sampling, but after practicemost students understood and were able to conduct theappropriate tests.
popular in the descriptive statisticssection (03/18/2019)
33 out of 35 (94%) of students were able to correctlychoose the correct models for the class. Students worked inpairs. (03/18/2019)
Reflection (CLICK ON ? FOR INSTRUCTIONS): Studentssuccessfully completed the group work and were able toeffectively communicate their results.
Program Review Reporting Year: 2015-2016Target : Target MetStudents were given a variety of research questions and hadto design the experiment. Models included one and twopopulation test of mean and proportions, dependentsampling models, categorical data tests, regression andANOVA. (04/24/2016)
Reflection (CLICK ON ? FOR INSTRUCTIONS): This was avery successful group activity in that students wererequired to be creative in their design of experiments.Although students often had difficulty in choosing thecorrect model, the collaborative effort and interaction withthe facilitating tutors made this activity an excellentlearning activity and improved the results of the laterprojects.
Enhancement: Add differentexamples using data from currentevents. (04/24/2016)
Program Review Reporting Year: 2012-2013Target : Target Met93% completed lab (06/24/2013)
questions and design hypothesestests, choosing appropriate modelsand sample sizes.
Enhancement: Next time I teachMath 10, I will encourage them toconsult with me about writingtheir summaries. I will also try tolook at their summaries before thedue date so that I can givefeedback. (06/22/2018)
Program Review Reporting Year: 2017-2018Target : Target Met31 students (93.9%) scored at least 39 points out of 50 onthe project. 13 students( 39.4%) scored at least 45 points –the equivalent of an A. The two students who did not meetthe objective scored 38 out of 50 points, just 1 point shy ofthe target. However, none of the groups received a perfectscore on the project. There were fewer A projects than Ihad in previous years. Many of the projects hadinconsistencies in their write-ups. Two groups had amismatch between their summary and the solution sheets
Project - : Students completed aHypothesis Testing Project. Thefound an article that made a claimabout a population mean orproportion, made a hypothesisabout whether they thought thattheir own study would show theactual mean or proportion to behigher or lower, collected data, andthen conducted a hypothesis test.The project was worth 50 points.
09/19/2019 Page 23 of 318Generated by Nuventive Improve

Student LearningOutcomes (SLOs) Assessment Methods Assessment Data Summaries Enhancements
Target for Success: Success wasdefined to be at least 70% ofstudents scoring 39 out of 50 orhigher on the project (equivalent toa B)
Reflection (CLICK ON ? FOR INSTRUCTIONS): The overallperformance of the class was good on this project and theclass met the target. But none of the groups did a perfectjob on their project, despite having a copy of the rubric Iwould use to grade the projects, a posted sample of an Aproject from the previous year, and my invitation to haveme look over their work so I could help them with theirwrite up.
they had submitted. I had, as usual, posted a sample Aproject from the previous year. This seemed to help, asmost projects did have the required components. But, I hadinvited students to show me their write-ups for help ingetting the maximum points. There was only one groupwho did this. (06/22/2018)
Reflection (CLICK ON ? FOR INSTRUCTIONS): Overall, I waspleased with the class performance on this project. Thegroups picked good topics for their project and I had somequite good submissions. This quarter, I brought two priorprojects to class so that students could see what an “A”project looked like. Many students took pictures of theprojects and I think it helped them to write their summary.I was disappointed in the two groups who had done theirsummaries incorrectly because their survey data summarywas the opposite of the hypothesis they were trying toprove. As in the past, I invited students to show me theirsummaries for review prior to the due date and two orthree groups did that. But, one of the groups with lowscores did not use class time efficiently when I gave time towork on their project and did not ask for advice on their
Enhancement: Next year, when Iteach Math 10, I will continue togive the students more examplesof possible topics and alsocontinue to show examples of pastprojects. I will also encouragethem to consult with me aboutwriting their summaries. I will alsotry to look at their summariesbefore the due date so that I cangive feedback.
(03/24/2017)
Program Review Reporting Year: 2016-2017Target : Target MetThe project results were very good. 25 students (80.6%)scored at least 39 points out of 50 on the exam. 21students( 67.7%) scored at least 45 points – the equivalentof an A. There were 2 project groups who had submitted afinal project that was not consistent with what they hadproposed to do. One students had failed to turn in herproject proposal on the due date. 2 groups had some partsof the final project write up missing. Overall, however, thequality of the projects were very good. (03/24/2017)
Students were assigned 5 points forsubmitting a project proposal, anadditional 5 points for submittingtheir data, and 40 points forsuccessful completion of the projectitself. The write up for the projectincluded a typed summary of theirproject theme and the results theyobtained, a graph of their data, andthe complete hypothesis testconducted.
09/19/2019 Page 24 of 318Generated by Nuventive Improve
Student LearningOutcomes (SLOs) Assessment Methods Assessment Data Summaries Enhancements
write-up, even after I asked if they needed help. However,most of the projects were of good quality.
Reflection (CLICK ON ? FOR INSTRUCTIONS): Great project.I will use it again.
Program Review Reporting Year: 2015-2016Target : Target MetAll students (100%) scored at least 40/50 on the project. Itwas a huge success! (07/12/2016)
Reflection (CLICK ON ? FOR INSTRUCTIONS): Overall, I waspleased with the class performance on this project. Thegroups picked good topics for their project and I had somequite good submissions. Some students did not know howto write their summary, despite the fact that I had postedtwo past projects that had done a good job of theirsummaries. I was disappointed in the groups that did notsubmit a project or whose projects was very incomplete. Ihad given a significant amount of class time on several daysfor the students to work on their projects. Unfortunately,these students were often absent. As in the past, I invitedstudents to show me their summaries for review prior tothe due date, but only one group did that. However, mostof the projects were of good quality.
Enhancement: Next year, when Iteach Math 10, I will continue togive the students more examplesof possible topics and also givethem examples of some meanstests they could do. I will alsoencourage them to consult withme about writing their summaries.I will also try to look at theirsummaries before the due date sothat I can give feedback.(06/13/2016)
Program Review Reporting Year: 2015-2016Target : Target MetThe project results were very good. 25 students (78.1%)scored at least 39 points out of 50 on the exam. 14students( 43.75%) scored at least 45 points – the equivalentof an A. There were two students who did not submit aproject and 3 students whose project was very incomplete.Another group received a C because some parts of theprojects write up were missing. (06/13/2016)
Enhancement: : Next year, when Iteach Math 10, I will continue togive the students more examplesof possible topics and also givethem examples of some meanstests they could do. I will alsoencourage them to consult withme about writing their summaries.
Program Review Reporting Year: 2013-2014Target : Target MetThe project results were very good. There was only onestudent who scored below 39 out of 50 points. Thisparticular student had lost points because her group failedto turn in the project proposal and she did not turn in thedata for the data check. The remainder of the groupsscored the equivalent of an A on their project.
09/19/2019 Page 25 of 318Generated by Nuventive Improve
Student LearningOutcomes (SLOs) Assessment Methods Assessment Data Summaries Enhancements
Reflection (CLICK ON ? FOR INSTRUCTIONS): Again, I waspleased with the class performance on this project. On mylast assessment, I had noted that there was not muchvariety in the topics chosen for this project. That was notan issue this year. I found that the students did a good jobin selecting their topics and I had a good variety of studies.I also had four different groups do Hypothesis Tests forMeans, instead of proportions. I was pleased, since it isharder to find an appropriate article for a test of means andthe data takes a little more work to gather.
I had posted two examples of past projects and so theproject write-ups were much better quality. I invitedstudents to show me their summaries for review prior tothe due date, but only one group did that. However, theprojects were of very good quality.
(06/24/2015)(06/24/2014)
Reflection (CLICK ON ? FOR INSTRUCTIONS): I was pleasedwith the class performance on this project. A few points,though, need some attention for next time. There were 4or 5 groups who used the same study as a basis for theirproject. In the past, I had gotten more variety. I also didnot have anyone do a means hypothesis test. Next year, Iwill give some examples of means tests and also givestudents more guidance about where to look for studies.
I also found that students were not really sure how to writetheir summary, although I had posted an example of a pastproject as a model. I think the students are not used towriting a “technical” paper and could use a little moreguidance about how to do it.
Enhancement: Next year, when Iteach Math 10, I will give thestudents more examples ofpossible topics and also give themexamples of some means teststhey could do. I will also givethem more guidance about writingtheir summaries. (07/01/2013)
Program Review Reporting Year: 2012-2013Target : Target MetThe project results were very good. There was only onegroup of four who scored below 39 points on the project,and they scored a 37.5. This particular group had lostpoints because they did not turn in a project proposal. Theremainder of the groups scored above 39 points, with threegroups scoring a perfect score. (07/01/2013)
09/19/2019 Page 26 of 318Generated by Nuventive Improve

Student LearningOutcomes (SLOs) Assessment Methods Assessment Data Summaries Enhancements
Target for Success: passing averageclass score of at least 65
Reflection (CLICK ON ? FOR INSTRUCTIONS): Studentsshould be encouraged to work through more homeworkquestions to prepare for this exam.
Enhancement: Add more pre-exam assessment opportunitiesfor students, so they can getfeedback in what they need towork on. (03/20/2018)
Program Review Reporting Year: 2017-2018Target : Target MetAverage class score was over 65% (03/20/2018)
Reflection (CLICK ON ? FOR INSTRUCTIONS): Good results
Program Review Reporting Year: 2014-2015Target : Target MetAverage class score of 77% (03/31/2015)
Reflection (CLICK ON ? FOR INSTRUCTIONS): Missed thetarget by 1 point
Program Review Reporting Year: 2013-2014Target : Target Not MetThe class average was 64 on Exam 3. (12/03/2013)
Exam - Course Test/Quiz - averageof class score on exam 3, coveringconfidence intervals and hypothesistesting
Target for Success: 70% drawcorrect conclusion, 80% find correctconfidence interval.
Reflection (CLICK ON ? FOR INSTRUCTIONS): Writingconclusions needs more examples in class.
Enhancement: Spend more time inclass demonstrating, emphasizingand explaining the writing ofconclusions./ (06/20/2017)
Program Review Reporting Year: 2016-2017Target : Target Met71% drew correct conclusion, 86% found correct CI(06/20/2017)
Reflection (CLICK ON ? FOR INSTRUCTIONS): For futureclasses, I should spend more time emphasizing what goesinto writing a correct conclusion and tying it back to theoriginal question posed. I ma happy the students werecomfortable with confidence intervals and theirinterpretation.
Enhancement: For future classes, Ishould spend more timeemphasizing what goes intowriting a correct conclusion andtying it back to the originalquestion posed. (06/16/2015)
Program Review Reporting Year: 2014-2015Target : Target Met95% found correct CI. 70% drew correct conclusion(06/16/2015)
Reflection (CLICK ON ? FOR INSTRUCTIONS): Need toemphasis how to write conclusions more.
Program Review Reporting Year: 2014-2015Target : Target Met73% drew correct conclusion, 100% found correctconfidence interval. (03/12/2015)
Program Review Reporting Year: 2014-2015Target : Target Met
Laboratory Project - Studentscompleted a Hypothesis Testingtechnology based activity, whichincluded 3 hypothesis tests - a z-test,a t-test and a proportions test. Foreach problem, students also had tofind and graph the confidenceinterval.
09/19/2019 Page 27 of 318Generated by Nuventive Improve

Student LearningOutcomes (SLOs) Assessment Methods Assessment Data Summaries Enhancements
Reflection (CLICK ON ? FOR INSTRUCTIONS): Spent moretime on hypothesis testing this quarter than before. Wellworth it.
80% were able to draw a correct conclusion92% found correct confidence interval (11/18/2014)
Reflection (CLICK ON ? FOR INSTRUCTIONS): Next time, Iplan to add an interpretation of the CI to the project.
Program Review Reporting Year: 2013-2014Target : Target Met10 out of 11 were able to write a correct conclusion to thehypothesis tests, 9 out of 11 found the correct confidenceinterval. (03/11/2014)
Target for Success: 85% of groupswill get 90% of better on the lab.
Reflection (CLICK ON ? FOR INSTRUCTIONS): Not sure howto be more clear but will do a better job of explaining eachof the parts of the lab next time so that students don't missthe matched pair hypothesis test.
Program Review Reporting Year: 2013-2014Target : Target MetStudents did well on the Lab. There were a couple that,despite being told in the explanation of the lab, incorrectlydid the matched pair hypothesis test as a test of twoindependent means. (06/16/2014)
Laboratory Project - Students willcomplete a lab on two pop meanand proportion and matched pairhypothesis testing.
Target for Success: Average of 75%Reflection (CLICK ON ? FOR INSTRUCTIONS): comparison ofother class results
Program Review Reporting Year: 2014-2015Target : Target MetExam average score of 81% (11/25/2014)
Exam - Course Test/Quiz - Studentswill score an average of at least 75%on exam 3 which covers confidenceintervals and hypothesis testing
Reflection (CLICK ON ? FOR INSTRUCTIONS): Students havetrouble identifying outliers. It seemed more of atechnology issue than an understanding issue, though,because they knew what formulas to apply but they wereunsure how to find "s".
Program Review Reporting Year: 2014-2015Target : Target Met16 out of 19 students successfully completed theassignment (03/27/2015)
Laboratory Project - Students wereprovided data by the instructor andwere asked to preform regressionsanalysis to arrive at the appropriateconclusions. Students were given acomplete rubric for grading andassigned group grades at the end.
Exam - Course Test/Quiz - Averageclass score on exam 3 on hypothesestesting and confidence intervals
09/19/2019 Page 28 of 318Generated by Nuventive Improve
Student LearningOutcomes (SLOs) Assessment Methods Assessment Data Summaries Enhancements
Target for Success: At least anaverage passing score of 70%
Target for Success: 90% successfullycomplete project.
Reflection (CLICK ON ? FOR INSTRUCTIONS): Althoughstudents demonstrated an ability to choose the appropriatemodel and design and conduct the experiment, severalstudents had difficulty in writing. It was suggested that areading/writing tutor would be valuable for Math 10.
Program Review Reporting Year: 2014-2015Target : Target Met92% of students successfully completed this project.(06/12/2015)
Laboratory Project - Students aregiven 6 different research questionsand need to determine theappropriate model, design andconduct the hypotheses tests.Students must then write a briefresearch paper describing the resultsin non-statistical language.
Target for Success: 70% of studentsachieving a passing score.Comments/Notes: 74% of studentobtained a passing score, including41% of students who received A's.
Exam - Course Test/Quiz - Successfulpassing of first exam.
Target for Success: class average ofat least 70%
Reflection (CLICK ON ? FOR INSTRUCTIONS): Studentswhose native language is not English had a more difficulttime with this exam.
Program Review Reporting Year: 2015-2016Target : Target MetClass average of 75% on exam (11/24/2015)
Exam - Course Test/Quiz - examcovering confidence intervals andhypothesis testing
Target for Success: mean of 80%
Reflection (CLICK ON ? FOR INSTRUCTIONS): We discussedthis assessment method at our MPS meeting since otherinstructors use similar assessments. Although theassignment required careful reading and critical thinking,the students were successful in completing this assignment.
Program Review Reporting Year: 2018-2019Target : Target Met5 examples requiring different models were chosen.Students must then be able to determine the correct modelbased on the parameter(s) being tested, the samplingmethod and the assumptions needed. (12/19/2018)
Enhancement: Add discoverylearning and productivepersistence to other activities.
Program Review Reporting Year: 2016-2017Target : Target MetMean score was 87% (06/22/2016)
Other - Group work - students willread several examples/descriptionsof an experiment needed to bedesigned. Students will then, indiscussion groups, determine theappropriate Hypotheses in word andparameters, and choose theappropriate model.
09/19/2019 Page 29 of 318Generated by Nuventive Improve

Student LearningOutcomes (SLOs) Assessment Methods Assessment Data Summaries Enhancements
Reflection (CLICK ON ? FOR INSTRUCTIONS): Discoverylearning and productive persistence really works. Studentstalked about each design and were able through teamworkto figure out the correct design of experiment.
(06/22/2016)
Target for Success: 70% pass rate (Cor better on final exam)
Reflection (CLICK ON ? FOR INSTRUCTIONS): Students didwell on final, now goal is to retain more students from firstday of class to final to improve aggregate pass rate.
Program Review Reporting Year: 2015-2016Target : Target Met24 out of 31 students taking the final passed with a grade ofC or better (06/22/2016)
Exam - Course Test/Quiz - Final -Final included questions onregression analysis, pointestimates/confidence intervals, andhypothesis
Target for Success: At least 80% ofthe students score at least 75% onthe quizComments/Notes: Target Met, Fall2017
Exam - Course Test/Quiz - Interpreta confidence interval for apopulation parameter in context ofthe problem with a completesentence.
Target for Success: 70% with grade80% or above.
Reflection (CLICK ON ? FOR INSTRUCTIONS): Using a rubricin Canvas was a huge help to the students.
Enhancement: Grading rubrics tobe updated for other assessments.instructions to be enhanced toavoid common wrong answers.(06/20/2019)
Program Review Reporting Year: 2018-2019Target : Target Met31 out of 34 students successfully completed the project.(06/20/2019)
Laboratory Project - LaboratoryProject: Students were provideddata by the instructor andperformed regression analysis toarrive at the appropriateconclusions. Students were given acomplete rubric for grading.
09/19/2019 Page 30 of 318Generated by Nuventive Improve

MATH 11:Finite Mathematics
Student LearningOutcomes (SLOs) Assessment Methods Assessment Data Summaries Enhancements
MATH11_SLO_2 - Compare, evaluate,judge, make informed decisions, andcommunicate results about variousfinancial opportunities by applyingthe mathematical concepts andprinciples of the time value of money.SLO Status: Active
Target for Success: 75% of studentspassing the exam Reflection (CLICK ON ? FOR INSTRUCTIONS): Results for
financial calculations were particularly poor this quarter.Students appear to have a hard time understanding what aparticular problem is asking and whether a present orfuture value is needed, as well as whether there areperiodic payments or a single lump sum payments.Students need more practice and guidance inunderstanding what the problems are asking. Studentsneed to be encouraged to understand the problem insteadof just finding a formula to apply without taking the time tounderstand the situation described in the words of theproblem.
Enhancement: 1) Students needtutorial help with financecalculations. The tutorial center isnot able to find sufficient numberof tutors to help with the financialtopics in Math 11.2) In future quarters I will stressuse of timelines more to helpstudents understand the nature ofthe payments in financialproblems and to understand thetiming of the payments andcalculations, in order to improvetheir ability to interpret what thequestions are asking. (09/26/2017)
Program Review Reporting Year: 2016-2017Target : Target Not MetJust under 25% of students passed this exam with a passinggrade of 68% of possible points earned. (09/26/2017)
Reflection (CLICK ON ? FOR INSTRUCTIONS): 84%-88% ofstudent passed the exam. Student difficulties with thismaterial include 1) understanding financial situations -some of the younger students with less life experience donot have personal experience with finance and havedifficulty understanding the financial situations described inthe problems; 2) attendance - in spring quarter studentattendance is lower than other quarters and students whodon't attend then don't learn the material adequately; 3)students lack appropriate tutoring in this course due to lackof availability of tutors for Math 11 due to hiringrestrictions for tutors.Result of former enhancement: Expanding the of use oftimelines to understand financial situations has helpedstudents understand the timing of financial calculationsbetter.
Enhancement: Additional tutors inthe Math Science Tutoring andResource Center who can tutorMath 11 Finite Math would beevery helpful. Because we canonly hire full time students to betutors, and because most Math 11students transfer shortly aftercompleting the class, and becausemost Math tutors are Math orScience majors who don'tnormally take Math 11 Finite Mathwhich is business oriented, thetutorial center rarely has Math 11tutors available. Hiringprocedures should be reviewed orchanged as possible to increasethe number of tutors for Math 11,to help students succeed in Math11 and to help them prepare forMath 12 to achieve their Business
Program Review Reporting Year: 2016-2017Target : Target Met84% of all enrolled students passed the exam. 88% of allstudents who remained enrolled to finish the class passedthe exam (06/08/2017)
Exam - Course Test/Quiz - Evaluatethe percentage of students passingthe exam
09/19/2019 Page 31 of 318Generated by Nuventive Improve

Student LearningOutcomes (SLOs) Assessment Methods Assessment Data Summaries Enhancements
Associate Transfer degrees thatinclude these courses.(06/08/2017)
Reflection (CLICK ON ? FOR INSTRUCTIONS): 30 of the 37students passed the exam. 76% of students were able todetermine whether problem involved an annuity or lump-sum situation. They were also able to recognize Present andFuture Values as well as Sinking Fund and InstallmentPayment categories. But only 69% could choose thesituation that was more profitable. They also had troubleapproximating effective interest rate without performingthe actual computation.
Enhancement: I will try to chooseproblems and examples thatbetter illustrate the ideas andconcepts involved, and have mystudents spend more timeunderstanding and explainingfinancial situations.I will put more emphasis in havingthem a) describe in their ownwords each situation, and b) aftercomputing the answers explaintheir results. (07/14/2013)
Program Review Reporting Year: 2012-2013Target : Target MetOver all 81%, 30 of the 37 students, passed the Exam, 76%identified the problems correctly, 86% computed theanswers correctly, 69% gave correct interpretation of theanswers. (07/14/2013)
Reflection (CLICK ON ? FOR INSTRUCTIONS): The majorityof students are capable of handling the math involved inthe formulas for the various types of financial problems.There are certain types of problems that do seem to causedifficulty for a fair number of students.I have not used interpretative types of questions on thisexam, where students have to write a sentence or two ofexplanation and interpretation of results. I will find a way toincorporate such questions in future exams.
Enhancement: I have not usedinterpretative types of questionson this exam, where students haveto write a sentence or two ofexplanation and interpretation ofresults. I will find a way toincorporate such questions infuture exams. (04/17/2013)
Program Review Reporting Year: 2012-2013Target : Target MetOn Exam 1, 15 out of 20 passed the exam, 75 % passed.The distribution of test scores ranged from 17 to 115 (extraproblems/points are available on exam). The average was73, and the median was 78. Four of the 5 who did not passscored well below 50. (04/17/2013)
Enhancement: I will provide moreexamples for interpretation ofresults and have them write in fullsentences description of results
Program Review Reporting Year: 2012-2013Target : Target MetOn Exam 2, 28 of the 36 student passed. That is, 78%passed. (01/07/2013)
09/19/2019 Page 32 of 318Generated by Nuventive Improve
Student LearningOutcomes (SLOs) Assessment Methods Assessment Data Summaries Enhancements
Reflection (CLICK ON ? FOR INSTRUCTIONS): 84% 0f thestudents were able to do perform calculations and comewith the correct answers, but only 68% were able tointerpret the answers they obtained. I need to make themwrite in full sentences the meaning of their results on allclasswork, homework, and test problems.
both in class and homework.(11/07/2012)Follow-Up: I started to put moreemphasis on both the statementof the problem, as well as theinterpretations of the results; as aresult, the students did better onthat description andinterpretation part of the tests.(01/11/2013)
Target for Success: 60% of thestudents will pass the quiz Reflection (CLICK ON ? FOR INSTRUCTIONS): I was happy
with the results. The quiz was a great evaluation of thestudents' knowledge
Program Review Reporting Year: 2018-2019Target : Target Met78% of the students passed the quiz and it was successful(12/13/2018)
Exam - Course Test/Quiz - I will usea quiz to evaluate the studentsunderstanding of the above SLO
MATH11_SLO_1 - Identify, evaluate,and utilize appropriate linear andprobability optimization models andcommunicate results.SLO Status: Active
Target for Success: 75% of studentspassing exam
Reflection (CLICK ON ? FOR INSTRUCTIONS): This quarter Imoved this topic to the end of the quarter. Linearprogramming was covered in the last two weeks of thequarter. At that point, some students who were strugglinghad already withdrawn from the class. Also, this quarterwe completed the linear programming lab before the quiz,whereas in previous quarters the students completed thelab after the quiz. Due to placement of material in thequarter and timing of holidays, etc, the timing of the lab (orexam) vs the quiz varies in different quarters. I think thatcompleting the lab before the quiz gave students betterfamiliarity with the topic and helped improve theirperformance on the quiz
Enhancement: The tutorial centeris not able to find enough tutorsfor Math 11. This particular topic,linear programming, is notcovered in any other course in ourDepartment, and therefore thestudents are not able to findsufficient tutoring help in thistopic. It would be helpful if theTutorial Center were to have someother way to hire tutors otherthan only full time De Anzastudents because it is historicallynot possible to find enoughstudents who meet tutor eligibilityrequirements (full time De Anzastudent) who are also qualified totutor Math 11. (09/26/2017)
Program Review Reporting Year: 2016-2017Target : Target Met83% of students passed the quiz evaluating using linearoptimization models (linear programming). (09/26/2017)
Enhancement: Students needmore practice understanding theduality relationship and simplex
Program Review Reporting Year: 2016-2017Target : Target Met76% of students passed the exam with a grade of 68% of
Exam - Course Test/Quiz - Percent ofstudents passing exam.
09/19/2019 Page 33 of 318Generated by Nuventive Improve

Student LearningOutcomes (SLOs) Assessment Methods Assessment Data Summaries Enhancements
Reflection (CLICK ON ? FOR INSTRUCTIONS): Students werereasonably adepts at interpreting linear programs fromword problems, writing them up in standard form, solvinggeometrically for both maximization and minimizationproblems, and using the simplex method to solve standardmaximum problems. Students tended to have difficultysetting up and solving standard minimum problems usingduality with the simplex method. Problems in this sectionof the course are long and involved and require many steps,and some students do not do the homework to practice thisin this section as they are frustrated by the (unavoidable)length of some of the problems. Due to the length andcomplexity of the algorithms it is also harder for students to"get it" if they do not do adequate practice, compared toother topics in this course with simpler shorter types ofproblems.
method process applied tominimization problems. In thefuture I will place additional stresson this topic to help make itclearer for students tounderstand.Students need more Math 11tutors in the Math TutoringCenter. The tutors who are ourfull-time students who are tutorsmostly do not take Math 11 andare not able to effectively tutorthis topic in Math 11. More Math11 tutors are needed. Perhapsanother method of hiring tutors isneeded other than only full-timestudents, since that method ofhiring tutors leaves tutorshortages in some classes that donot have as many studentsenrolled in it. Tutors hired who aremath students at graduate schoolfor example, could help fill in thegaps in tutoring that we havewhen hiring only full time De AnzaCollege students as tutors.(09/26/2017)
points possible on the exam (09/26/2017)
Reflection (CLICK ON ? FOR INSTRUCTIONS): Probability is adifficult subject and students have trouble not onlyunderstanding counting principles, but also complicatedprobabilistic models. One way to overcome this is topractice enough drill problems to develop manipulativeskills and to practice a large number of applications in order
Enhancement: We will practicemore drill as well as applicationproblems.I will not only have them doubletheir efforts in solving moreproblems, but have them explainin full sentences description oftheir results. (07/14/2013)
Program Review Reporting Year: 2012-2013Target : Target MetOver all 81% of the students passed Exam 1, but only 70%passed Exam 3. In Exam 1, 76% gave correct interpretationof the answers, but in Exam 3, fewer than 62% interpretedthe problems and solutions correctly. (07/14/2013)
09/19/2019 Page 34 of 318Generated by Nuventive Improve
Student LearningOutcomes (SLOs) Assessment Methods Assessment Data Summaries Enhancements
to learn how material is used both in business and the lifeand social sciences.
Reflection (CLICK ON ? FOR INSTRUCTIONS): Though therewere approximately the same number of "mechanical" and"application" problems on this exam (which dealt withmax/min and optimizations) as on the first exam (finances),students had more difficulty interpreting the informationpresented in the application problems.
Enhancement: I may have to firstprovide some written questionswhereby students have to readthrough the problem to discernthe various information given inthe problem, then have thestudents solve the problem. i.e., aset of questions requiring someshort-answer phrase or statementthat indicates the student isreading and interpreting thequestion correctly, before thestudent attempts the mathematicsto solve the problem.(04/17/2013)
Program Review Reporting Year: 2012-2013Target : Target Not Met13 of 21 students passed exam 3. 62 % (04/17/2013)
Reflection (CLICK ON ? FOR INSTRUCTIONS): There wereroughly the same number of "mechanical" and"application" problems as on the first exam (though adifferent topic), but students seemed to have moredifficulty interpreting several types of optimization andother application problems.
Enhancement: I may need to firstbreak down a problem into aseries of questions that askstudents to discern the variouspieces of information the problempresents, before they go directlyinto solving the problem.(04/17/2013)
Program Review Reporting Year: 2012-2013Target : Target Not MetOn exam 2, (max/min and optimization problems) 13 of 21students passed the exam: 62 % (04/17/2013)
Reflection (CLICK ON ? FOR INSTRUCTIONS): SLO 1: 27 ofthe 37 students passed the exam. 80% of students werequite competent in interpreting the problem and carry outthe computations, and 74% were able to explain the results.
Enhancement: I will provide moreexamples for interpretation ofresults and have them write in fullsentences description of resultsboth in class, in homework, and intests. (10/17/2012)Follow-Up: The students didimprove in interpreting theproblems and describing theresults because of my efforts inmaking them write in full
Program Review Reporting Year: 2012-2013Target : Target MetOver all 76% of the students passed the Exam81% gave correct numerical answers to the problems69% gave correct interpretation of the answers (10/15/2012)
09/19/2019 Page 35 of 318Generated by Nuventive Improve

Student LearningOutcomes (SLOs) Assessment Methods Assessment Data Summaries Enhancements
sentences what the problemstated and what was asked.(01/11/2013)
Target for Success: 60% of thestudents will pass this exam Reflection (CLICK ON ? FOR INSTRUCTIONS): I gave critical
points that had decimal solutions. I will change thisapproach next time and will make sure the values areintegers.
Program Review Reporting Year: 2018-2019Target : Target Met65% of the students passed this exam (12/13/2018)
Exam - Course Test/Quiz - I willevaluate this SLO on Exam 1
09/19/2019 Page 36 of 318Generated by Nuventive Improve

MATH 114:College Math Preparation Level 3: Intermediate Algebra
Student LearningOutcomes (SLOs) Assessment Methods Assessment Data Summaries Enhancements
MATH114_SLO_1 - Evaluate real-world situations and distinguishbetween and apply exponential,logarithmic, rational, and discretefunction models appropriately.
Planned Assessment Quarters: 2012-13 3-Winter
SLO Status: Active
Outcome Creation Date: 09/18/2012
Target for Success: Success wouldmean more than half the classperformed well on at least two ofthe three problems.
Reflection (CLICK ON ? FOR INSTRUCTIONS): Target wasmet . Students who met target were for the most part theones who ended up passing the course. Students thatstruggled with this SLO were mainly ones that didn't passclass, suggesting that they had other areas of deficienciesthat made it hard for them to meet this particular SLO.
Program Review Reporting Year: 2013-2014Target : Target Met30 out of 49 students performed well on at least two out of3 relevant final questions. (04/19/2013)
Reflection (CLICK ON ? FOR INSTRUCTIONS): In futurequarters I will spend more time making sure my studentscan apply the various function models to real-worldsituations. Exponential functions, in particular, were quitechallenging for my students this quarter.
Program Review Reporting Year: 2012-2013Target : Target Not MetOut of 39 students taking the final, 9 performed well on all3 problems, 9 performed well on 2 out of 3 problems, 10performed well on 1 out of 3 problems, and 11 did notperform well on any of the problems. (01/30/2013)
Exam - Course Test/Quiz - Look atstudent performance on threeapplicable problems on the final.
Target for Success: Two thirds of thestudents will get at least onequestion correct and half will getboth correct.
2 questions on the first test wherestudents must figure out which ofthe 4 models to apply.
Target for Success: 70% of class willset up both models correctly. Reflection (CLICK ON ? FOR INSTRUCTIONS): Target was
not met. Students could have benefited from doing a classproject or in class activity centered around modeling usingall the different functions that were covered during thequarter.
Program Review Reporting Year: 2013-2014Target : Target Not Met17 out of 49 students met target. (04/19/2013)
Exam - Course Test/Quiz - Tworelevant questions on final exam.
Program Review Reporting Year: 2012-2013Project - Project - Partner project
09/19/2019 Page 37 of 318Generated by Nuventive Improve

Student LearningOutcomes (SLOs) Assessment Methods Assessment Data Summaries Enhancements
Target for Success: 100% completionof project by all students. 85%average class score on project.
Reflection (CLICK ON ? FOR INSTRUCTIONS): Still someissues with following directions so will edit the project tomake things clearer. (I hope!!)
Target : Target MetAll students (i.e. pairs) completed the project. Class averagescore was well over 85%. (11/15/2013)
dealing with mortgage calculations.Use of rational equation to findmonthly payments, total paymentsand total interest paid of the loan.
Target for Success: 1) Group workdoes not need much mathematicalguidance2) All groups turn in a project with atleast 75% completion3) All groups earn a 'C' or better Reflection (CLICK ON ? FOR INSTRUCTIONS): 1. I would
encourage students to write down any assistance and typesought by their group. I would use this to improve theproject and/or focus more on teaching certain topics.2. Target met3. Instead of individual group performances a bettermeasure might be overall or average percent based on allprojects.
Program Review Reporting Year: 2013-2014Target : Target Not Met1. Out of 20 groups (2-3 students) 4 groups neededassistance. However, I only observed assistance duringclass meetings. More groups may have sought assistancefrom such resources as our tutorial center.2. All groups did turn in a project with at least 75%completion.3. All but 2 groups earned a 'C' or better. In these 2 lesssatisfactory projects the work was mostly complete butincorrect and very messy. (12/30/2013)
Project - 1) Do groups working onthe project need much mathematicalguidance2) Do all groups complete theproject3) Grade on the Project
Target for Success: 70% of the classdo these questions correctly
Reflection (CLICK ON ? FOR INSTRUCTIONS): students whopracticed homework did well on the questions
Program Review Reporting Year: 2014-2015Target : Target Met1 and 6 are related to exponential. 13 related to log, and 18related to sequencce (03/21/2015)
Exam - Course Test/Quiz - test 3number 1, 6, 13 and 18
Target for Success: complete withscore 90% or better
Program Review Reporting Year: 2014-2015Target : Target Not MetIn a class of 33 students with 12 groups, 2 groups did notturn in both projects 3 groups turned in only 1 of the twoprojects Of the projects that were turned the averagepercent for the first project on drugs was 83.6%. Theaverage percent on the second project (pH and dBs) was77.8%. (01/07/2015)
Project - Score on collaborativeprojects
09/19/2019 Page 38 of 318Generated by Nuventive Improve

Student LearningOutcomes (SLOs) Assessment Methods Assessment Data Summaries Enhancements
Reflection (CLICK ON ? FOR INSTRUCTIONS): Somestudents complained about others not doing the workwithin the group. Also, no one within groups necessarilyhad definite roles and responsibilities. Instead of lettingstudents form their own groups I will create groups andgive students different responsibilities within the groups. Imay also create a short open ended question to attach toeach project at the end that requires a short presentationby the group.
Target for Success: 70% of thestudents can answer relatedquestions correctly
Reflection (CLICK ON ? FOR INSTRUCTIONS): Students inmy MW class were more motivated than my M-F class. MWclass average is 78% and the other is 70%
Enhancement: Course assignmentencouraged students to take incharge in learning. Examsmeasured well what they learned.There were students registered forthe classes, but hardly bothered tocome to class and to dohomework, which lowered theclass average. (12/17/2015)
Program Review Reporting Year: 2015-2016Target : Target MetAverage of 74% of my two classes answered relatedquestions correctly (12/17/2015)
Exam - Course Test/Quiz - exam 1,exam 3 and final exam questions ofapplications these functions
Target for Success: At least 75% ofthe students will earn a 70% orhigher on this question.
Exam - Course Test/Quiz - Finalexam question: motion problemrequiring the use of rational model.
Target for Success: Mean score of70% correct for that specificproblem.
Reflection (CLICK ON ? FOR INSTRUCTIONS): Students weregiven several opportunities in class to engage with thematerial from analytical, graphical and computationalperspectives. Some of the wording in the problem mayhave been misleading. Not providing a graphic with therelative locations of the cities may have led to confusionand/or misunderstanding.
Enhancement: Change thewording of the problem to makethe meaning more explicit.Provide a graphic of the state ofCalifornia that includes therelative locations for all threecities referenced in the problem.(04/17/2016)
Program Review Reporting Year: 2015-2016Target : Target Not MetMean score was 56.4% correct for specific problem.(04/17/2016)
Exam - Course Test/Quiz - Studentswere presented with an absolutevalue problem that included adistance function (distance from SanFrancisco) and were asked to usethat function to analyze the distanceat different times on a trip from LosAngeles to Truckee, CA, anddetermine required travel times forspecific distances.
Enhancement: In the future, I willprobably have the students
Program Review Reporting Year: 2017-2018Target : Target Met
Exam - Course Test/Quiz - On thefinal exam, I asked the students the
09/19/2019 Page 39 of 318Generated by Nuventive Improve

Student LearningOutcomes (SLOs) Assessment Methods Assessment Data Summaries Enhancements
Target for Success: I wanted to seeat least 50% of the class answer thisquestion correctly.
Reflection (CLICK ON ? FOR INSTRUCTIONS): I was fairlyhappy with how the students answered this question.There were more students than I expected who did noteven attempt to compute A(4) which would have giventhem at least a few points on this question.
actually construct the average costfunction in the problem. I will alsotry to do more examples of solvingapplications of rational equationsin class. (08/30/2018)
Around 64% of the class answered this question correctly.(08/30/2018)
following: Your local coffee shop,Sconehenge Bakery, charges $1.50for a cup of coffee if you use theirreusable Sconehenge mug rewardsprogram. The mug costs $5.00. Thefunction A(x) = (1.5x + 5)/x gives theaverage cost in dollars for a cup ofcoffee using the rewards program.Compute A(4) and interpret youranswer. How many cups of coffeewould you need to purchase in orderto have an average cost of $2.00 percup?
Target for Success: 70% of studentswould earn at least 11/15 pointscombined between these threeproblems.
Reflection (CLICK ON ? FOR INSTRUCTIONS): My target of70% was not met. It seems that there may have been someconfusion about how to work with logarithmic expressionsin terms of an application problem. While most of thestudents were successful in working with logarithmicfunctions in other problems of the exam, there seems to besome trouble when it was applied to a real-world situation,such as earthquakes.
Enhancement: I should have spentmore time covering logarithmicexpressions in class. Because itwas covered closer to the end ofthe quarter, I did not have asmuch time. (06/18/2019)
Program Review Reporting Year: 2018-2019Target : Target Not MetOf the 24 students who took the exam, 16 were able to earnat least 11/15 points combined between the threeproblems. (06/18/2019)
Exam - Course Test/Quiz - The finalexam for Math 114 in Spring 2019consisted of problems (not limitedto) involving exponential,logarithmic, and rational functions.Students are asked to evaluatelogarithmic expressions with variousbases (other than e or 10) in anapplication (earthquake probleminvolving magnitude and intensity),simplify rational functions byfactoring, and sketch graphs ofexponential functions fromgrowth/decay while explaining anynonrigid transformations. Each ofthese three problems were scoredout of 5 points (based on accuracyand attempt).
MATH114_SLO_2 - Analyze, interpret, Program Review Reporting Year: 2012-2013Exam - Course Test/Quiz - Looking at
09/19/2019 Page 40 of 318Generated by Nuventive Improve

Student LearningOutcomes (SLOs) Assessment Methods Assessment Data Summaries Enhancements
and communicate results ofexponential, logarithmic, rational, anddiscrete models in a logical mannerfrom four points of view - visual,formula, numerical, and written.
SLO Status: Active
Target for Success: Two thirds of theclass. Reflection (CLICK ON ? FOR INSTRUCTIONS): Students had
a hard time with cumulative material and being able todiscern how problems are different, and when to applycertain rules.
Target : Target Not Met23 out of 39 students taking the final exam score at least a75%. (05/03/2013)
Reflection (CLICK ON ? FOR INSTRUCTIONS): Not enough ofthe class met this objective. I will introduce some differentteaching methods the next time I teach this course.
Program Review Reporting Year: 2012-2013Target : Target Not MetOut of a class of 34 students, 13 scored at least 75% on thefinal exam, and 21 did not. (02/04/2013)
the number of students who scoredat least 75% on the final exam.
Target for Success: At least 2/3rds ofthe projects correctly analyze andpresent the data using the correctmodel and with 4 points of view.Comments/Notes: A murdermystery!
Project - Give a project wherestudents in small groups have toanalyze the data and come up withthe answer by using one of the 4models. They then present the datafrom 4 points of view.
Target for Success: 75% of classanswer question correctly.
Exam - Course Test/Quiz - Look atperformance on relevant problemson final exam.
Target for Success: 100% completionof the project. 85% class average onthe project.
Reflection (CLICK ON ? FOR INSTRUCTIONS): Will edit theproject to be more clear to students as to what to do.
Program Review Reporting Year: 2012-2013Target : Target MetAll students completed the project. Some trouble gettingthe correct mortgages but class average well above 85%(11/15/2013)
Project - Partner project dealing withmortgage calculations. Use ofrational equation to find monthlypayments, total payments and totalinterest paid of the loan.
09/19/2019 Page 41 of 318Generated by Nuventive Improve

Student LearningOutcomes (SLOs) Assessment Methods Assessment Data Summaries Enhancements
Reflection (CLICK ON ? FOR INSTRUCTIONS): The resultswere below target mainly because of the number ofstudents who didn't even bother to do one whole section ofthe project (worth 10 points). I sensed a real lack ofdedication (or realization as to how much this project wasworth) and commitment to completing the assignment bymany students.
I should have spent more time with class on the idea ofbuying a house and what it means to make mortgagepayments. Should have spent more time talking aboutwhat a realistic payment would be based on interest andloan amount.
Program Review Reporting Year: 2012-2013Target : Target Not Met100% of the groups turned in the project on time.Unfortunately, many were poorly done with a class averageof 76%. Even removing the one project that was a totalmess only brought the class average up to 81%.(05/03/2013)
Target for Success: 1. Everyone turnsin at least one complete worksheet2. At least one worksheet is welldone (neat, correct, written well)3. The Average percent on eachworksheet is 70% or more.
Reflection (CLICK ON ? FOR INSTRUCTIONS): For #2 I wouldask students who felt challenged with written answers toseek help in the Language Arts tutorial center. I would alsoask students to check each others work since everyone'sworksheet required a unique product. Perhaps I would giveextra credit if students checked each others work and eachof them earned 90% or better.
Program Review Reporting Year: 2013-2014Target : Target Not Met1. Out of 69 enrolled in two classes 58 students turned in atleast one worksheet. Of the 11 who did not 7 stoppedattending after the 8th week.2. Of the 58 papers turned in for worksheet #1 54 of themwere well done. The remaining 4 had some incorrectanswers and written answers were unsatisfactory.3. Although the average percent on the first worksheet wasover 70% (87%) the average percent on the secondworksheet was 62%. The 2nd worksheet was longer andrequired students to find examples in their real lives.(12/30/2013)
Comments/Notes: Worksheetsincorporate numerical, writtenresults, graphing and functionevaluations.
Other - Grade on Two Worksheets(Modeling Using Exp and LogFunctions)
09/19/2019 Page 42 of 318Generated by Nuventive Improve

Student LearningOutcomes (SLOs) Assessment Methods Assessment Data Summaries Enhancements
For #3 I would ask students to work in pairs. I will also givea little more guidance on how to easily finish some of thework.
Target for Success: The average onthe 3 quizzes should be at least 80%.The average on the set of questionson each exam should be at least70%.Comments/Notes: It is and will bevery difficult to keep track of the setof questions even though they areon certain pages of the exams. I willneed to figure out another way.
Underlying Course - 3 out of 6 quizcompletely incorporated analysis,interp. and communication while oneach exam there were a set ofquestions that required at least oneof the following: analysis,interpretation or communicationpresented from one of the 4perspectives.
Target for Success: 70% of the classlearn the material
Reflection (CLICK ON ? FOR INSTRUCTIONS): Studentscome to class on the regular basis, they do much better.motivate students to come and participate.
Program Review Reporting Year: 2014-2015Target : Target MetBetween 60% - 80% students did correctly on relatedquestions (03/21/2015)
Exam - Course Test/Quiz - variesquestions on test 1,2 and 3
Reflection (CLICK ON ? FOR INSTRUCTIONS): Course workencouraged students to be responsible in their learning.Exams tested what they learned. It worked well for my 2classes.
Enhancement: Course assignmentencouraged students to take incharge in learning. Examsmeasured well what they learned.There were students registered forthe classes, but hardly bothered tocome to class and to dohomework, which lowered theclass average. (12/17/2015)
Program Review Reporting Year: 2015-2016Target : Target MetAbout 72% students did related questions correctly(12/17/2015)
Exam - Course Test/Quiz - quizzes,exams and final exams
Enhancement: In the future, IProgram Review Reporting Year: 2017-2018Exam - Course Test/Quiz - On the
09/19/2019 Page 43 of 318Generated by Nuventive Improve

Student LearningOutcomes (SLOs) Assessment Methods Assessment Data Summaries Enhancements
Target for Success: At least 60% ofclass answering this problemcorrectly.
Reflection (CLICK ON ? FOR INSTRUCTIONS): The majorityof the students did a good job of answering this problemcorrectly. Typically students have a difficult time correctlyidentifying the domain and understanding the connectionbetween the domain and the graph of the radical function.
might actually ask the students tocompute the function for two tothree points of their choosing thatare in the domain of the functionand then graph them. This willhelp the students draw a moreaccurate graph, and it couldhopefully help students who donot know/remember what thegraph of this radical function willlook like by deciding to plot morethan just three points to discoverthe shape of the graph.(08/30/2018)
Target : Target Met75% of the class answered this problem correctly.(08/30/2018)
final exam, I asked the followingquestion: Find the domain of h(x) =sqrt(x + 4) and compute h(5) andh(12). Sketch the graph of h(x) andplot the points h(5) and h(12) in yoursketch.
Target for Success: 70% of thestudents would score at least 7/10points on this problem.
Reflection (CLICK ON ? FOR INSTRUCTIONS): It seems thatstudents were more comfortable with these problems onthe final because over 80% of the students were successfulon this problem.
Enhancement: I would have likedfor all students to have access to agraphing calculator so that theycould check their graphs. Whilemost of the students were able toearn at least 7 of the 10 points onthis problem, many of them didn'tearn a perfect score because theydid not graph the functioncorrectly. (06/18/2019)
Program Review Reporting Year: 2018-2019Target : Target MetOf the 24 students who took the final, 20 were able to earnat least 7/10 points on this problem (they were able tograph the function, explain whether or not it is one-to-one,and then graph the inverse). (06/18/2019)
Exam - Course Test/Quiz - On thefinal exam, students are askedquestions about various types offunctions - they are required tograph the functions as well asanswer questions about thefunctions (such as determining if thefunction is one-to-one, and if so, tofind the inverse function). They alsowere asked to work withcomposition of functions.
09/19/2019 Page 44 of 318Generated by Nuventive Improve

MATH 12:Introductory Calculus for Business and Social Science
Student LearningOutcomes (SLOs) Assessment Methods Assessment Data Summaries Enhancements
MATH12_SLO_1 - Use correctnotation and mathematical precisionin the evaluation and interpretationof derivatives and integrals.
Planned Assessment Quarters: 2012-13 2-Fall
SLO Status: Active
Target for Success: The overall goalfor the course is a minimum grade ofC ( 68 % ); thus for any one examthat, too, would be the goal.Items to be emphasized:mathematical presentation andformat; correct use of symbols;correct applications of the derivativerules.Several students on this examreached their highest test score forthe quarter; the class test averagewas also one of the highest of alltests during the entire quarter.
Reflection (CLICK ON ? FOR INSTRUCTIONS): This examdepended more on previous algebra skills as well as newlylearned calculus concepts, as compared to the exam used inevaluation SLO 2. Thus students had a bit more confidenceand knowledge of the mechanics needed in performing thederivative operation.
Program Review Reporting Year: 2012-2013Target : Target Met50 % of the class met the target of a minimum score of C;only 3 students (just about 20 %) were more than 10 pointsbelow target. (02/03/2013)
Reflection (CLICK ON ? FOR INSTRUCTIONS): Analysis wasbased on test scores.
Program Review Reporting Year: 2012-2013Target : Target MetAlmost 50 % of students who took the exam were at orabove the C level (2 students were within 3 points of thatmark, a gap easy to bridge). (02/03/2013)
Comments/Notes: Though theoverall class average met the goal,there were about a third of thestudents who were well above theaverage (at least 10 points = B orbetter) as there were students whowere within that many points of theaverage, and almost an equalnumber who were that many pointsbelow (D, F) the average.
Exam - Course Test/Quiz - An examwhere students show their work toarrive at the answer to the problem;as opposed to a multiplechoice/true-false/fill-in-the-blank setof questions. This first exam coveredthe basics of differential calculus:limits, basic derivatives, and variousrules of differentiation.
Program Review Reporting Year: 2012-2013Target : Target Met16 out of 23 student performed at the level of 70% orhigher. The work of the students who passed showed they
Exam - Course Test/Quiz - I used thefinal test to assess this particularSLO. The final questions werewritten to check the mathematical
09/19/2019 Page 45 of 318Generated by Nuventive Improve

Student LearningOutcomes (SLOs) Assessment Methods Assessment Data Summaries Enhancements
Target for Success: A success isgetting a 70% or higher on the final
Reflection (CLICK ON ? FOR INSTRUCTIONS): The studentswho did not do well in the final was mostly due to lack ofunderstanding of the word problems and not the notation.But to improve the performance maybe next time I will domore worksheets on notations mixed with word problems.
can use integrals and derivatives accurately with correctnotation. (05/11/2013)
precision in the evaluation andinterpretation of derivatives andintegrals.
Target for Success: 70% of thestudents get 70% or higher on thefinal.
Reflection (CLICK ON ? FOR INSTRUCTIONS): Although thestudents did well in finding the solution to the problems,they did make simple notational errors which could've beendue to a rushed work on the final.
Program Review Reporting Year: 2013-2014Target : Target Not MetOnly about half the class (15 out of 25) reached this goal.(11/07/2014)
Exam - Standardized - I used finalexam to assess the students' abilityto use correct notation andmathematical precision in theevaluation and interpretation ofderiavatives and integra.
MATH12_SLO_2 - Evaluate, solve,interpret and communicate businessand social science applications usingappropriate differentiation andintegration methodologies.
Planned Assessment Quarters: 2012-13 2-Fall
SLO Status: Active
Target for Success: The goal (as onall exams) is a minimum score for agrade of C (collectively for the class,as it is for an individual student).Notation, mechanics, and correctuse of integral concepts is desired insolving of mechanical andapplication problems
Reflection (CLICK ON ? FOR INSTRUCTIONS): Moreemphasis apparently needs to be placed not only on themechanics of integration, but also on their applications.Perhaps more 'minitest's (quizzes) with fewer problems oneach -thus using shorter time periods to learn and test-might help with better student understanding andretention of material.
Program Review Reporting Year: 2012-2013Target : Target Met50 % of students scored at or above the target. As thismaterial required more understanding of the concepts ofintegration, students who did not meet the goal scored atleast 10 points below the target. (02/03/2013)
Reflection (CLICK ON ? FOR INSTRUCTIONS): The moreadvanced concept of integration and application wasapparently more difficult for students to grasp; perhapsmore examples in class, fewer but shorter 'minitests'(quizzes) might be in order.
Program Review Reporting Year: 2012-2013Target : Target Met50 % of the students met the goal; those that didn't werewell below (10 pts or more) the target. (02/03/2013)
Comments/Notes: Here studentsobviously had difficulty, as for somestudents (approximately a third) thiswas their lowest test score. For therest, they were at or above target. Are-emphasis of the variousintegration techniques isrecommended.
Exam - Course Test/Quiz - Another'show-your-work' exam; the contentwas on the mechanics of anti-differentiation and integration, withhalf of the exam devoted tomechanics, and the other half toapplications.
09/19/2019 Page 46 of 318Generated by Nuventive Improve
Student LearningOutcomes (SLOs) Assessment Methods Assessment Data Summaries Enhancements
Target for Success: 70% of thestudents get 70% or higher
Reflection (CLICK ON ? FOR INSTRUCTIONS): The final inparticular may have not been the best way of assessing thestudents ability to evaluate, solve, interpret andcommunicate business and social science applications. Thestudents were not able to show what they learned due tothe times final.
Program Review Reporting Year: 2013-2014Target : Target Not MetOnly about 15 out of 25 students who took the finalreceived a 70% or higher (11/07/2014)
Reflection (CLICK ON ? FOR INSTRUCTIONS): By the end ofthe quarter, 70% of students seem to have built andunderstanding of the mathematical process in modelingreal life business and social science problems withmathematical equations using differentiation andintegration. At the same time, there where the 30% whoperformed below expectation. Most of them had startedthe problems but not be able to finish it. More practiceshould be done possibly and worksheets given to helpstudents finish the process for each problem .
Program Review Reporting Year: 2012-2013Target : Target Met16 out of 23 student performed at the level of 70% orhigher. The work of the students who passed showed a verygood understanding of the application problems and how touse differentiation and integration methods in solving reallife business and social science problems. (04/25/2013)
Exam - Course Test/Quiz - An allwritten final exam focused onapplication problems in business andsocial sciences.
09/19/2019 Page 47 of 318Generated by Nuventive Improve

MATH 1A:Calculus
Student LearningOutcomes (SLOs) Assessment Methods Assessment Data Summaries Enhancements
MATH1A_SLO_1 - Analyze andsynthesize the concepts of limits,continuity, and differentiation from agraphical, numerical, analytical andverbal approach, using correctnotation and mathematical precision.SLO Status: Active
Target for Success: None set - Firstcycle Reflection (CLICK ON ? FOR INSTRUCTIONS): Vocabulary
was a carry over from a previous text and not discussed incurrent text, ensure that students have appropriatevocabulary/context for the quizzes.
Enhancement: update lecturenotes to add more robustvocabulary then just the textbook (12/14/2018)
Program Review Reporting Year: 2018-2019Target : Target MetStudents were given two quizzes on continuity and limits.On limits, over 72% of the students answered the questioncorrectlyOn continuity, only 40% answered it correctly but were ableto answer the question properly mostly due to an error inthe quiz. accounting for the error, 79% students answeredthe question in a logical manner. (12/14/2018)
Enhancement: In the future, I willgive students an assessment andreview of the most commonalgebra skills they will need forcalculus at the beginning of theclass to prepare them for thealgebra skills they will need in theproblems for calculus(03/29/2013)
Program Review Reporting Year: 2012-2013Target : Target MetAssessment Data Summary:Quiz 2 (Limits) Question 1 (simplify using factoring andcanceling): 90% scored 4 or higher; Question 2 (simplifyusing radical conjugates and simplify): 57% scored 4 orhigher; Question 3 (limits using the squeeze theorem): 50%scored 4 or higher; Question 4 (One-sided limits): 95%scored 4 or higher; Common errors made: algebraic errorsincluding incorrect canceling and simplifying of expressions;in question #3, many students did not know how to startthe problem in order to use the squeeze theorem;Quiz 3 Question 1 (definition of derivative): Out of 7 points,82.5 scored 6 or higher; most common error: algebraicerrors; Question 2(Graphs of derivatives): 89% scored 4 orhigher; most common error was not connecting ahorizontal tangent with a zero derivative graphically.Quiz 4: (Derivatives) 3 pt questions. Question 1a (powerrule): 95% scored 2 or higher; Question 1b (derivs of e^x,sine, cosine) 98% scored 2 or higher; Question 1c (productrule): 95% scored 2 or higher; Question 1d (quotient rule):98% scored 2 or higher; Question 1e (quotient rule andsimplify); 95% scored 2 or higher. Most common errors:
Exam - Course Test/Quiz - Questionsrelated to this SLO were selectedfrom Quizzes 2, 3 and 4. Studentperformance was analyzed for eachchosen question: the number ofpoints received and errors made.The percentages of students whowere awarded various scores werecalculated.
09/19/2019 Page 48 of 318Generated by Nuventive Improve
Student LearningOutcomes (SLOs) Assessment Methods Assessment Data Summaries Enhancements
Reflection (CLICK ON ? FOR INSTRUCTIONS): For the mostpart, students did very well on these assessments. On quiz2, at least 75% of students answered questions 1 and 4correctly. Most of the errors made were due to pooralgebraic skills rather than lack of knowledge of the calculusconcepts. On quiz 3, more than 85% of students scored 4or higher on both questions. On quiz 4, over 95% orstudents answered each question at an acceptable level.The only questions for this student learning outcome thatdid not meet my expectations were those that requiredalgebraic skills.
algebraic errors when asked to simplify; not recognizing aconstant term; 2 students did not use the product rulecorrectly; 3 students used the quotient rule incorrectly(01/11/2013)
Target for Success: Student receivesat least 70% score, which is at least19 points out of a 24 point questionon the final exam.
Reflection (CLICK ON ? FOR INSTRUCTIONS): Whilestudents seemed to be well versed in the basics of takingderivatives using the product, quotient and chain rules forfunctions, they made mistakes when multiple applicationsof chain rule, together with product rule were necessary.Also, students had a difficult time with logarithmicdifferentiation, which is not often needed later in calculus,but is useful in assessing the students' understanding of thechain rule. While a majority of the students (57%) met the
Program Review Reporting Year: 2012-2013Target : Target Not Met17 out of 30 students scored at least 70% on this question,with 3 students receiving 90% or above, 8 studentsreceiving 80% - 89.9% and 6 students receiving 70 - 79.9%. 8students scored below 70% on this question. The mostcommon errors encountered were in: 1) Logarithmicdifferentiation (63% of the students made a conceptualerror), 2) The use of chain rule when multiple applicationsof it were required in the same problem (37% of thestudents made this error) , 3) Implicit differentiation (30%of the students made this error), 4) Differentiation ofparametrically defined curves (20% of the students madethis error), 5) Product rule (13% of the students made thiserror). There were several algebra errors throughout aswell. (02/04/2013)
Exam - Course Test/Quiz - Assessthe synthesis of the use of a varietyof derivative formulas and rules(product rule, quotient rule, chainrule, logarithmic differentiation) tofind the derivative formula ofvarious functions, implicitly definedcurves and parametrically definedcurves on the final exam.
09/19/2019 Page 49 of 318Generated by Nuventive Improve

Student LearningOutcomes (SLOs) Assessment Methods Assessment Data Summaries Enhancements
target above, I selected 'Target Not Met' since there weresome students that did not meet the target.
Target for Success: Success on anexam was scoring at least 70%. Forindividual questions, success wasscoring at least 80% of the totalpoints for that question.
Reflection (CLICK ON ? FOR INSTRUCTIONS): Reflection andAnalysis: For the most part, students did very well on theseassessments. For limits, students sometimes had difficultyinterpreting the values for which a graph wasdiscontinuous, especially those involving removablediscontinuities. The one area on derivatives that studentsstruggled with was being able to identify an interval ofincrease or decrease from the graph of the derivative. Thiscan be very confusing to students, since they tend toidentify the interval on which the derivative is increasing or
Enhancement: : In the future, Iwill give students moreopportunities to analyze graphs offunctions and identify limits,discontinuities and derivativesfrom the graphs. These exerciseswere discussed this quarter, butperhaps an additional groupassignment would help.(06/28/2013)
Program Review Reporting Year: 2012-2013Target : Target MetExam 1: This exam covered techniques of calculating limits,including the squeeze theorem, graphical analysis of limitbehavior, continuity and the Intermediate Value Theorem.88% of students scored 70% or higher on this exam.Students demonstrated good knowledge of limits for mostquestions. The questions for which there were a largenumber of incorrect answers involved graphical recognitionof the value of a limit at infinity (26% incorrect), graphicalrecognition of discontinuity (38% incorrect), graphicalidentification and calculation of removeable discontinuities(31% incorrect), and calculation of limits involving squareroots (29% incorrect.Exam 2: Questions involving the concept and calculation ofderivatives were analyzed. Question 1 asked students toanswer questions about a function when given the graph ofthe derivative. 79% of students were correctly able toidentify where the graph of the original function had ahorizontal asymptote, while only 43% of students were ableto correctly identify the interval on which the function wasdecreasing. 81% of students were correctly able tocalculate a derivative using the definition. Students seemedto be able to calculate derivatives using the varioustechniques. A small number of errors were made due toerrors in using the product rule (10%) or logarithmicdifferentiation (14%) (04/03/2013)
Exam - Course Test/Quiz - Questionsrelated to this SLO were selectedfrom Exam 1 and Exam 2. Exam 1covered limits and continuity, whileExam 2 covered differentiation. Theoverall score on each exam wascomputed, as well as performanceon selected questions. In addition,errors on individual questions wereanalyzed to ascertain the errormade.
09/19/2019 Page 50 of 318Generated by Nuventive Improve

Student LearningOutcomes (SLOs) Assessment Methods Assessment Data Summaries Enhancements
decreasing, rather than making the connection that thegraph of the derivative shows what is happening with theslope of the tangent line.
Reflection (CLICK ON ? FOR INSTRUCTIONS): Continue oureffort to keep and improve the percent of success.
Program Review Reporting Year: 2013-2014Target : Target Metabout 90% students did well graphically with the concepts.75% also did well verbally and analytically. (12/16/2013)
Exam - Course Test/Quiz - Questionson exam 1 and quizzes 1 and 2
Target for Success: Target forSuccess: Success was having at least70% of students score at least 70%on the quiz and on the test.
Reflection (CLICK ON ? FOR INSTRUCTIONS): Reflection andAnalysis:Quiz 2 Limits: Most students did quite well overall on thisquiz. There were some problem areas noted. 6 students(15%) incorrectly interpreted a limit of 0/0 as either 1, 0, orinfinity. They did not recognize that the result meant thatthey had to simplify the problem to determine the limit.There were also some students who made algebraic errorsin simplifying the problem and thus obtained incorrectlimits. A few students also made small errors in the writingout of a squeeze theorem problem. This is a commonproblem in problems which have a proof structure –students are not used to writing solutions in a logicalmanner where one step flows from the other. There wasone problem were students needed to use the formaldefinition of limit in order to prove the value of a limit.Most students were able to correctly write the first part ofthe proof (finding a delta for a given epsilon), but haddifficulty with the second part (showing their delta satisfied
Enhancement:Enhancement/Action: I willcontinue to emphasize that themeaning of 0/0 in the context oflimits. I will also continue toreview algebraic skills. I did a littleof this review, but I think I coulddo more on a daily basis. For theproof problems, I am going to tryanother approach to the epsilondelta proof, that perhaps studentswill understand better.Calculating derivatives is a skillthat students need to build up.Some students catch on quickly,others need more time. By theend of the quarter, most studentshad improved in their derivative-taking skills. (04/06/2015)
Program Review Reporting Year: 2013-2014Target : Target MetAssessment Data Summary:Quiz 2: Limits 70.7% of students scored at least 70% of thepoints on this quiz. In addition, 41.5% scored at least 90%and 60.9% scored above 80% on the quiz.
Exam 2: Derivatives: 73.1% of students scored at least 70%or higher on exam 2. In addition, 53.6% scored at least80%. (04/06/2014)
Exam - Course Test/Quiz - Limits:Quiz 2 covered most types of limits.The scores students received on thequiz were recorded and analyzed.Derivatives: Exam 2 coveredderivatives. The scores studentsreceived on Exam 2 were recordedand analyzed.
09/19/2019 Page 51 of 318Generated by Nuventive Improve
Student LearningOutcomes (SLOs) Assessment Methods Assessment Data Summaries Enhancements
the definition). Again, students had difficulty with the proofformat of the problem.Exam 2: Derivatives. Students did quite well on this exam.Some students had difficulty with using the chain rule,especially its use in conjunction with the product andquotient rules.
Target for Success: Success washaving at least 70% of students scoreat least 70% on exam 1.
Reflection (CLICK ON ? FOR INSTRUCTIONS): Reflection andAnalysis:Exam 1 Limits: Many students did very well on this exam,but there were more students than usual that did not dowell. The major problem is that these students have veryweak algebra and pre-calculus skills. Even though we hadbeen through several examples of common limit problemsand the algebra involved in simplifying them, somestudents were not able to apply these skills to similarproblems on the exam. Part of the problem is that when Icorrected homework, these same students were turning inincorrect solutions to the homework problems. In thesecases, they were not even checking their answers to see ifthey were correct. Some students were still not able tocorrectly identify the general category that a functionbelongs to and three students could not correctlydetermine the domain of a simple rational function.Exam 2: Derivatives: Again, weak algebra skills oftenhindered students in their ability to correctly compute andsimplify derivatives. This was especially true when thestudents were required to compute a derivative using thedefinition of derivative.
Enhancement:Enhancement/Action: Next time Iteach this course, I will try toenhance my review of prerequisitematerial. I have increased thematerial that I review at thebeginning of the quarter, and I tryto review prerequisite material asproblems come up that require acertain technique or concept. Butin the future, I will try to do thismore. I have suggested thatstudents sign up to tutor studentsin lower classes as a way ofreviewing this materialthemselves, and a few studentshave done this. (06/23/2016)
Program Review Reporting Year: 2014-2015Target : Target Not MetExam 1: Limits 68.4% of students scored at least 70% of thepoints on this exam. In addition, 31.6% scored at least 90%and 60.5% scored above 80% on the exam.
Exam 2: Derivatives: 63.4% of students scored at least 70%of the points on this exam. 14.6% scored at least 90% and43.9% scored above 80% on the exam. (06/23/2015)
Exam - Course Test/Quiz - Limits:Exam 1 covered limits from severalpoints of view. The overall score onexam 1 was recorded and analyzed.Derivatives: Exam 2 coveredderivatives from several points ofview. The overall score on exam 2was recorded and analyzed
09/19/2019 Page 52 of 318Generated by Nuventive Improve
Student LearningOutcomes (SLOs) Assessment Methods Assessment Data Summaries Enhancements
Reflection (CLICK ON ? FOR INSTRUCTIONS): Exam 1 Limits:In general, students did well on this exam. The majority ofthe students were able to evaluate limits effectively. The problem that cause students most difficulty was to usethe Intermediate Value Theorem to prove the existence of aroot on an interval for a rational function. Most studentseither incorrectly specified the type of function it was, ordid not mention the type of function at all. Also, somestudents incorrectly stated that the domain was all realnumbers, rather than finding the value where the functionswas undefined and noting that it did not belong to thespecified interval. Students also had trouble correctlycorrectly stating the conclusion, or logically showing all ofthe verification steps.
Exam 2: Derivatives. In general, students did reasonablywell on the exam, although there were some problemareas. The first was in computing the derivative of a simplefunction using the definition of derivative. The problem Igave was the derivative of f(x)=sqrt(x). Although studentswere able to set up the definition, some students did notknow how to simplify the difference quotient. I lookedback over the homework assignments they had been givenand there was only 1 problem involving square roots, butthey had also done similar simplifications in the limitproblems of Chapter 2. Also, students had trouble inrecognizing the progression of derivatives when usingmultiple applications of the chain rule. The other common
Enhancement: I have found thatstudents are weak on the namesof functions and their domains. Inthe future, I will emphasize thismore in the beginning reviewmaterials. Also, I will try to makesure students have more practicein simplifying difference quotientsinvolving roots and rationalfunctions. Finally, I will do moreproblems that have nestedcomposite functions. There isusually an activity that I do withthe class that addresses this, butdue to time constraints thisquarter, I did not do the activity. Iwill not do that again.(03/24/2015)
Program Review Reporting Year: 2014-2015Target : Target MetExam 1: Limits and Continuity: 85.4% of students scored atleast 70% of the points on this exam. In addition, 34%scored at least 90% and 68% scored above 80% on theexam.
Exam 2: Derivatives: 78% of students scored at least 70% ofthe points on this exam. In addition, 26.8% scored at least90% and 46.3% of students scored above 80% on the exam. (03/24/2015)
09/19/2019 Page 53 of 318Generated by Nuventive Improve

Student LearningOutcomes (SLOs) Assessment Methods Assessment Data Summaries Enhancements
error was not recognizing numbers such as e and pi asconstants when computing derivatives.
Reflection (CLICK ON ? FOR INSTRUCTIONS): Exam 1 Limits:Most students did fairly well on the first exam. Somestudents did not remember some of the techniques thathad been discussed in class regarding finding limits. Also,some students did not fully realize that the existence ofasymptotes depended on the limit definitions. They wouldsometimes not recognize an asymptote that met thedefinition, but perhaps did not agree with a preconceivedideas they had about what asymptotes looked like.The problem that caused the greatest difficulty for somestudents was the proof of the existence of a root using theIntermediate Value Theorem. Although we had done andexample in class and the student had homework on thetheorem, I had not asked a question involving theIntermediate Value Theorem on the quiz for that section.As a result, some students were not prepared to do thistype of problem. I also found that students sometimes didnot use a logical order in writing out the various parts of theproof: verification of conditions and using correct languagein the conclusion. I was pleased with the limit proof on the exam. Moststudents were correctly able to find a suitable delta.Exam 2: Derivatives. Students had more difficulty on thisexam than the seconds exam. Some students did notremember some of the techniques for finding derivatives,especially when using combinations of the chain rule withthe product or quotient rules. Also there was a question I
Enhancement: Next time I teachthis course, I will emphasizefinding asymptotes more. I willalso include a question using theIntermediate Value Theorem onone of the quizzes prior to theexam.Calculating derivatives is a skillthat students need to build up. Iwill continue to give practice onusing the chain rule incombination with other rules. Thegraphing question that studentshad difficulty with is one thatperhaps I will delay until we haveexamined graphs in more detail. (12/07/2014)
Program Review Reporting Year: 2014-2015Target : Target Not MetExam 1: Limits 78.6% of students scored at least 70% of thepoints on this exam. In addition, 22% scored at least 90%and 58.6% scored above 80% on the exam.
Exam 2: Derivatives: 63.4% of students scored at least 70%of the points on this exam. 14.6% scored at least 90% and43.9% scored above 80% on the exam. (12/07/2014)
09/19/2019 Page 54 of 318Generated by Nuventive Improve
Student LearningOutcomes (SLOs) Assessment Methods Assessment Data Summaries Enhancements
had asked in which students were looking at the graph ofthe derivative and had to state where the graph had ahorizontal tangent, or where it was increasing. Thestudents had not had any particular problems in homeworklike this, but had done several problems to graph thederivative by viewing the graph of the function. Manystudents had difficulty with this question.
Target for Success: Limits: 70% ofstudents will correctly answer allparts of this question.Graph Behavior: 70% of studentswill correctly score 70% or higher onthe quiz.
Exam - Course Test/Quiz - Limits andcontinuity: The first question onexam 1 tested whether studentscould find various types of limits bylooking at a graph of a functionGraph Behavior: Quiz 7 dealt withthe behavior of graphs usingcalculus. For the 1st problem on thequiz, students were giveninformation about the 1st and 2ndderivatives of a function, but werenot given the formula for the originalfunction. This forced students tointerpret what they were told aboutthe derivatives without benefit ofbeing able to check the graph ontheir calculator. In question 2 onQuiz 7, the students were asked tocalculate the 1st and 2nd derivativeand answer questions about criticalnumbers, intervals ofincrease/decrease, local extrema,concavity and inflection points.
Enhancement: Will grade studentsProgram Review Reporting Year: 2015-2016Exam - Course Test/Quiz - Used 3
09/19/2019 Page 55 of 318Generated by Nuventive Improve

Student LearningOutcomes (SLOs) Assessment Methods Assessment Data Summaries Enhancements
Target for Success: Class gets 70% orabove correct on question
Reflection (CLICK ON ? FOR INSTRUCTIONS): This class didvery well. Only the 3rd problem seemed to give thestudents some frustrations. Problem 3 was probably thehardest. What's most apparent is that if a student didn't dowell with any of the questions, then they probably didn't dowell with all 3. This seems to support the assertion thatweak students didn't do well overall, while strong studentsdid well in all categories.Related Documents:Workbook1-F15.xlsx
on the same 3 problems in thewinter for comparison.(03/27/2016)
Target : Target MetWill grade for correctness 3 problems from final exampertaining to limits. Problem pertained to graph given of afunction that had several features, including discontinuities,infinite limits, limits that didn't exist, etc. Each of the 3problems chosen tested for a different kind of limit.(03/27/2016)
Reflection (CLICK ON ? FOR INSTRUCTIONS): As in the fall,the students met the target of 70% or above forcorrectness. And as again in the fall, students who missedany one of the questions had a higher instance of missingall three, meaning students who did unsatisfactory in theunderstanding of one concept had difficulty in all, whereasstudents who understood one concept generallyunderstood them all.Related Documents:Workbook1-W-16.xlsx
Enhancement: Will grade studentsin the spring on the same 3questions for comparison.(03/27/2016)
Program Review Reporting Year: 2015-2016Target : Target MetWill grade for correctness 3 problems from final exampertaining to limits. Problem pertained to graph given of afunction that had several features, including discontinuities,infinite limits, limits that didn't exist, etc. Each of the 3problems chosen tested for a different kind of limit. Theseare the same 3 problems as given in the fall. Will compareclasses. (03/27/2016)
problems from the final exam thatasks about limits of a function that isnot continuous and contains infinitelimits.
Target for Success: 70% passinggrades of C or better
Enhancement: The exam (#2 andpart of #3) covers a wide variety ofproblems, some basic, someadvanced. It's a little bit difficult to
Program Review Reporting Year: 2017-2018Target : Target MetMiniTest 2 83 % passed with at least a C (at least a scoreof 68 %) , and Minitest 3 , 65 % passed (04/03/2018)
Exam - Course Test/Quiz - Exam orQuiz
09/19/2019 Page 56 of 318Generated by Nuventive Improve

Student LearningOutcomes (SLOs) Assessment Methods Assessment Data Summaries Enhancements
Reflection (CLICK ON ? FOR INSTRUCTIONS): Minitestscover the basics; on the chapter exam -which covers notonly the basics but applications- Exam 2 had a 58 % passrate.Related Documents:1030 Math 1A Winter 2018.xls
pinpoint what problemsspecifically cover this SLO #1.(04/03/2018)
Reflection (CLICK ON ? FOR INSTRUCTIONS): Most studentsstruggled on definition of limit including graph and derivingderivative of inverse trig functions, i will spend more timecreating vocab card for students on definition as well asgroup work to derive inverse trig functions in class
Program Review Reporting Year: 2015-2016Target : Target MetQuiz 3: 33 out of 38 students got a passing gradeExam 1: 33 out of 45 students got a passing gradeExam 2: 26 out of 40 students got a passing grade(06/22/2016)
Target for Success: My target forsuccess was that 70% of the classwould answer the problem entirelycorrect or almost entirely correct.
Reflection (CLICK ON ? FOR INSTRUCTIONS): I was verypleased with this result because students in the past have adifficult time determining where a function is continuousand/or differentiable based on the graph of the functionand then trying to apply the definitions of continuity anddifferentiability to verify their answers.
Enhancement: For future classes, Iwill write up more examples ofthese problems to work on forhomework or include on morequizzes so students understandthe importance of distinguishingbetween continuity anddifferentiability as well as applyingthe definitions correctly.(04/09/2019)
Program Review Reporting Year: 2018-2019Target : Target MetI found that 26 out of 34 students successfully answeredthis question. This means that around 76% of the classsuccessfully answered this question. (04/09/2019)
Comments/Notes: This question wasout of 10 points, and if studentsscored a 7/10 or higher, then Icounted this as a success.
Exam - Course Test/Quiz - On thefinal exam, I asked students to grapha piecewise defined function andasked the students to identify fromthe graph where the function wasnot continuous and where it was notdifferentiable. I then asked thestudents to verify that the functionwas indeed not continuous and notdifferentiable at those points byusing the definition of continuity at apoint, differentiability at a point,and/or results from class.
09/19/2019 Page 57 of 318Generated by Nuventive Improve

Student LearningOutcomes (SLOs) Assessment Methods Assessment Data Summaries Enhancements
MATH1A_SLO_2 - Evaluate thebehavior of graphs in the context oflimits, continuity and differentiability.
SLO Status: Active
Target for Success: Quiz 3: Scoring 4or higher on a 5 point questionQuiz 7: 1a scoring 2 out of 2 points;1b scoring 3 out of 4 points; 1cscoring 2 out of 3 points; 1d scoring3 out of 5 points
Reflection (CLICK ON ? FOR INSTRUCTIONS): reinforce thestructure of graphing using calculus. students tend to jumpbetween domain, limits, diff, and miss points because theyforget to add a component.
Enhancement: reinforce thestructure of graphing usingcalculus. students tend to jumpbetween domain, limits, diff, andmiss points because they forget toadd a component. (12/14/2018)
Program Review Reporting Year: 2017-2018Target : Target MetQuiz 4 has questions on shapes of graphs based ondifferentiability with 80%+ students answered correctly.Exam 2 had questions related to graph with limits, diff, andcontinuity, over 70% students passed this exam.(12/14/2018)
Reflection (CLICK ON ? FOR INSTRUCTIONS): Students didquite well on the question from quiz 3. But they did have
Enhancement: In the future I willgiven more problems such as theone from quiz 7, in which they donot have the formula for thefunction to fall back on, but onlyhave information about thederivative. I gave a few in aslightly different format, but I willdesign a worksheet give themmore practice. (03/29/2013)
Program Review Reporting Year: 2012-2013Target : Target MetQuiz 3 Question 2 (Graphing the derivative from the graphof a function) 89% scored 4 or higher. Most commonerrors were made in correctly interpreting the behavior ofthe derivative from the behavior of the original function,especially related to increasing/decreasing graphs, andhorizontal tangent linesQuiz 7 Question1 (interpreting graphical aspects of afunction from information about its derivative): 1a 87%scored 2; errors made included subtle errors such asindicating the endpoints were critical numbers, and failingto recognize what a critical number was; 1b 47% scored 3 orhigher; common errors included confusing the 1st and 2ndderivative tests in identifying local extema; 1c 76% scored 2or higher; many students were able to correctly identify theinflection point, but not able to explain why. 5 studentswere unable to say what the critical numbers were; 1d 69%scored 3 or higher. This was the most difficult part ? graphthe function given only the information about thederivative. The most common error made was thinking thatan indefined 1st and 2nd derivative meant that the functionitself was undefined. Other errors included not correctlygraphing the increasing or decreasing parts of the function,not correctly representing the concavity of the graph, andnot interpreting 0 derivatives correctly. (01/11/2013)
Exam - Course Test/Quiz - Questionsrelated to this SLO were selectedfrom Quiz 3 and quiz 7. Studentperformance was analyzed for eachquestion: the number of pointsreceived and errors made. Thepercentages of students who wereawarded various scores werecalculated.
09/19/2019 Page 58 of 318Generated by Nuventive Improve

Student LearningOutcomes (SLOs) Assessment Methods Assessment Data Summaries Enhancements
trouble with question 7. Most students were able tocorrectly identify critical numbers, but had difficultydetermining whether they were local extrema. A fairnumber of students also were unable to correctly identifythe critical numbers. In part, it was probably due to the factthat they had not had a problem before where the functionitself was not given and they only had the informationabout the derivative.
Target for Success: Quiz 3: Scoring 4or higher on a 5 point questionSuccess on each part of a questionwas scoring at least 80% of thepoints for that part. Success on thelaboratory was scoring 70% or more.
Enhancement: Next time I teachthis course, I am going to covertopics in a slightly different orderthat may help with the confusionaround the Second Derivative test.I will also be more careful aboutbringing the Second DerivativeTest as supporting evidence whendiscussing local extrema. As far asthe distinction between a functionbeing undefined and itsderivatives being undefined, I willcontinue to discuss or havestudents analyze functions thatask students to explore thisdistinction. (06/28/2013)
Program Review Reporting Year: 2012-2013Target : Target MetQuestion 4, Exam 3: This question gave students a tablewith information about the first and second derivative of anunknown continuous function: where it was positive,negative, zero and undefined. The students were askedquestions about the original unknown function: what werethe critical numbers, whether the critical number was alocal maximum, minimum or neither, and where there wereinflection points. Students did very well on this question.Only 18% of students made errors related to criticalnumbers and local extrema. Some students discountedcritical numbers for which the derivative was undefined,because they thought that the function would also beundefined (the function was stated to be continuous). Inthe question about inflection points, 2 students used asimilar incorrect reasoning to discount an x-value with anundefined 2nd derivative.Question 5, Exam 3: This question asked students severalquestions about a function given as a formula. Essentiallythey were asked to analyze the details of the function inpreparation for graphing, although they were not requiredto actually graph the function. Students did very well onthis question. The only part of this problem that studentshad any difficult with was in part f, where they were askedto determine intervals on which the function was concaveup and concave down. 31% of students were not able tocorrectly construct a sign graph as instructed correctly,mostly because of incorrect determination of concavity onthe intervals.Families of Curves Lab: In this lab, students were given a
Exam - Course Test/Quiz - Questionsrelated to this SLO were selectedfrom Exam 3. The performance oneach selected question wasrecorded. In addition, errors onindividual questions were analyzedto ascertain the error made. Inaddition, a group laboratory wasgiven asking the students to analyzea family of functions using calculus.
09/19/2019 Page 59 of 318Generated by Nuventive Improve

Student LearningOutcomes (SLOs) Assessment Methods Assessment Data Summaries Enhancements
Reflection (CLICK ON ? FOR INSTRUCTIONS): The main areaof confusion for students in this area seems to be related tothe 2nd derivative. Some students confused the SecondDerivative Test for local extrema with tests for concavityand inflection points. The other area of confusion was thathaving an undefined 1st or 2nd derivative does notnecessarily mean the function itself is undefined.
family of functions to analyze using calculus. They wereasked to graph several members of the family, note therelative extrema, inflection points, and intervals ofincrease/decrease and concavity, and then verify theirobservations using calculus. Students worked in groups of 3or 4 on this lab. The results were very good. 74% ofstudents scored 90% or above on this lab, and 90% scoredabove 80%. Only 1 students who was absent on the day itwas worked on in class, and thus did the project alone,scored below 70%. (04/03/2013)
Reflection (CLICK ON ? FOR INSTRUCTIONS): The conceptscovered by this SLO are a bit more concrete than the onesin SLO # 1. It was easier to relate concept to graph.
Enhancement: As the minitestcovers the basics, the exam goesbeyond basics to applications, andsometimes a problem or two notseen before, but can be solvedusing the information covered inclass. No surprise exampercentage of success is lowerthan minitest percentage ofsuccess, but the problemsthemselves change in nature andcomplexity. (04/03/2018)
Program Review Reporting Year: 2017-2018Target : Target Met20 out of 23 passed this minitest # 3; 87 % pass; for Exam #3 , 14 out of 20 (70 % ) passed (04/03/2018)
Reflection (CLICK ON ? FOR INSTRUCTIONS): work toimprove the percentage
Program Review Reporting Year: 2013-2014Target : Target Met78% students mastered the topics on the exams(12/16/2013)
Exam - Course Test/Quiz - Exam,quiz or final question
Enhancement: Limits andcontinuity: In the future, I will tryto give students more opportunity
Program Review Reporting Year: 2014-2015Target : Target Not MetLimits: Only 50% of the students were able to correctly
Exam - Course Test/Quiz -Assessment Method:Limits: The last question on quiz 1
09/19/2019 Page 60 of 318Generated by Nuventive Improve

Student LearningOutcomes (SLOs) Assessment Methods Assessment Data Summaries Enhancements
Target for Success: Target forSuccess:Limits: 70% of students will correctlyanswer all parts of this question.Graph Behavior: 70% of studentswill correctly score 70% or higher onthe quiz.
Reflection (CLICK ON ? FOR INSTRUCTIONS): Limits andcontinuity: Most students, although errors were made, didOK on this question. The most common area of confusionwas recognizing a removable discontinuity. Also, somestudents missed one of the horizontal asymptotes shown.There were a few students who seem totally confusedabout the how limits manifest in the graph of a function.
Graph Behavior: The first question on the exam askedstudents to determine critical numbers, local extrema, andinflection points by using information about the derivativeand 2nd derivative of a function. I have given a similarproblem on a worksheet this quarter and we discussed theproblem in class. Although many students did well on thequestion, some students were unable to correctly interpretthe 1st and 2nd derivative information and what it told usabout a graph. Some of them were answering the questionas if the information was that of the original function.However, most students did much better on the Exam 3question regarding graphs, which showed improvement inunderstanding of what the derivative tells us about a graph.
in class time to look at suchproblems.Graph Behavior: I did give thestudents a similar problem and wediscussed it after they had workedon it in groups. I think many in theclass did better than in the past. Iwill continue to discuss similarproblems.
Graph Behavior: I think thatstudents just need to have time toabsorb some of the concepts. Iwas happy that the students, forthe most part did better on theexam when presented with asomewhat harder graphingquestion, and were able tocorrectly interpret the informationgiven by the derivative and 2ndderivative. In the future, I willcontinue to give at least twoopportunities to students tograpple with this type of problem. (06/23/2016)
answer at least 70% of the questions correctly. This percentwas much lower than in past quarters.
Graph Behavior: 63.2% of the students scored 70% orhigher on Quiz 7, which had questions related to usingcalculus to analyze graphs of functions. Many of thestudents who scored poorly on this exam had difficultyinterpreting the graph behavior just from information aboutthe sign of the derivative and 2nd derivative, without havingthe formula for the original function. However, on Exam 3,which also had a question asking them to use the equationsof f’(x) and f”(x) to answer questions about relativeextrema, inflection points, intervals of increase anddecrease, and concavity, the students did much better. 82%of the students scored at least 70% on this problem, and45% of the students did not miss any points on the problemat all. (06/23/2015)
tested whether students could findvarious types of limits by looking at agraph of a functionGraph Behavior: Students weregiven a quiz asking them to analyzecurves using limits, continuity anddifferentiability. In the firstquestion, students were only giveninformation about the 1st and 2ndderivatives (positive and negative)They were asked questions aboutintervals of increase/decrease, localextrema, intervals of concavity andpoints of inflection; and finally theywere asked to sketch the functionusing the information provided. Inthe second question, students weregiven the equation of a curve, andwere asked to calculate analyze andgraph the curve using 1st and 2ndderivatives.
09/19/2019 Page 61 of 318Generated by Nuventive Improve

Student LearningOutcomes (SLOs) Assessment Methods Assessment Data Summaries Enhancements
Reflection (CLICK ON ? FOR INSTRUCTIONS): Reflection andAnalysis:Limits: The two students who missed all of the graphicallimit question were very confused about the connectionbetween limits and the graph of a function. Sometimes aone-to-one approach with the student can clear up suchmisconceptions.
Graph Behavior: Students actually did quite well on the 1stquestion. Most students were able to correctly identify thecorrect areas of increase/decrease and the local extrema,and the concavity intervals. Some students incorrectlythought that if a derivative was undefined, then the graphwould also be undefined.The second question was more like the homework they hadbeen given. Some students had trouble correctly findingand simplifying the derivatives, particularly the 2ndderivative, and made mistakes because of that. Somestudents need much more algebra proficiency.
Enhancement:Enhancement/Action:Limits: In the future, I will try togive students more opportunity inclass time to look at suchproblems. I can then ask studentsto see me in my office hour if theyneed more help.Graph Behavior: In the future, Iwill do more algebra review withthe class to build up their skills. (04/06/2015)
Program Review Reporting Year: 2013-2014Target : Target MetAssessment Data Summary:Limits: Only 5 students (12%) made any errors at all on thequiz question. There were two students who missed allparts of the question. The other students made errors inonly one part.
Graph Behavior: 70.8% of students scored at least 70% onthis quiz. (04/06/2014)
Reflection (CLICK ON ? FOR INSTRUCTIONS): Limits and
Enhancement: Limits andcontinuity: In the future, I will tryto give students more opportunityin class time to look at suchproblems. I can then ask studentsto see me in my office hour if theyneed more help.Graph Behavior: Students findthese types of questions a
Program Review Reporting Year: 2014-2015Target : Target MetLimits: Students did very well on this question. Only 4students did not get all parts correct.
Graph Behavior: 78% of the students scored 70% or higheron Quiz 7. (03/24/2015)
Exam - Course Test/Quiz - Limits andcontinuity: The first question onexam 1 tested whether studentscould find various types of limits bylooking at a graph of a functionGraph Behavior: Question 7 on Quiz7 and Question 4 on Exam 3 dealtwith the behavior of graphs usingcalculus. In both cases, students
09/19/2019 Page 62 of 318Generated by Nuventive Improve
Student LearningOutcomes (SLOs) Assessment Methods Assessment Data Summaries Enhancements
Target for Success: Limits: 70% ofstudents will correctly answer allparts of this question.Graph Behavior: 70% of studentswill correctly score 70% or higher onquestions selected from the quiz andexam.
continuity: The students who missed all of the graphicallimit question were very confused about the connectionbetween limits and the graph of a function. Sometimes aone-to-one approach with the student can clear up suchmisconceptions.
Graph Behavior: Students did quite well on these as awhole. The main point of confusion seems to be when thederivative or 2nd derivative is undefined. Some studentsfelt that that meant that the function itself was alsoundefined. Some students failed to list the number as acritical point or a possible point of inflection. This, ofcourse, gave incorrect results when they did the sign graph.For the question where they were given the equation of thefunction, some students had difficulty simplifying anexpression that had negative fractional exponents.
challenge, but it does force themto rely solely on the informationgiven by the derivatives. In thefuture, I will give more practicewith this type of problem. I willcontinue to review algebraic skillswith my students. (03/24/2016)
Reflection (CLICK ON ? FOR INSTRUCTIONS): Limits andcontinuity: The three students who missed all of thegraphical limit question were very confused about theconnection between limits and the graph of a function.Sometimes a one-to-one approach with the student canclear up such misconceptions.
Graph Behavior: Students did quite well on these as awhole. The main point of confusion seems to be when thederivative or 2nd derivative is undefined. Some students
Enhancement: Limits andcontinuity: In the future, I will tryto give students more opportunityin class time to look at suchproblems. I can then ask studentsto see me in my office hour if theyneed more help.Graph Behavior: Students findthese types of questions achallenge, but it does force themto rely solely on the informationgiven by the derivatives. In thefuture, I will give more practicewith this type of problem. (03/29/2014)
Program Review Reporting Year: 2014-2015Target : Target MetAssessment Data Summary:Limits: Only 3 students (5%) were not able to correctlyanswer the questions about limit values and existence fromthe graph provided
Graph Behavior: 70% of the students correctly answeredthe question on Quiz 7, while 78.9% of the studentscorrectly answered scored at least 70% of the points onquestion 4 of the exam. (12/07/2014)
were given information about the1st and 2nd derivatives of a function,but were not given the formula forthe function f(x). This forcedstudents to interpret what they weretold about the derivatives withoutbenefit of being able to check thegraph on their calculator.
09/19/2019 Page 63 of 318Generated by Nuventive Improve
Student LearningOutcomes (SLOs) Assessment Methods Assessment Data Summaries Enhancements
felt that that meant that the function itself was alsoundefined. Some students failed to list the number as acritical point or a possible point of inflection. This, ofcourse, gave incorrect results when they did the sign graph.
Target for Success: 70% of studentswill score 70% or higher on Exam 1and Exam 2
Exam - Course Test/Quiz - Limits:Exam 1 covered limits from severalpoints of view. The overall score onexam 1 was recorded and analyzed.Derivatives: Exam 2 coveredderivatives from several points ofview. The overall score on exam 2was recorded and analyzed
Target for Success: Hopefully, 70%or above of the students in the classget this question correct.
Exam - Course Test/Quiz - Used aproblem from the final exam thatasks about an infinite limit.
Target for Success: Hopefully, 70%of the class or above get theproblem correct.
Exam - Course Test/Quiz - Usedproblem from the final exam thatasks about an infinite limit of afunction. (Active)
Target for Success: 70% of studentsgot questions correct Reflection (CLICK ON ? FOR INSTRUCTIONS): Target met,
will focus on more variety and test further elements infuture.
Program Review Reporting Year: 2015-2016Target : Target MetThree multiple choice questions looking at a graph anddetermining limit, continuity, and derivative. out of 108question answers, students answered 88 correctly, or 81%success rate (06/22/2016)
Exam - Course Test/Quiz - Finalexam questions used a graph andasked students to identify where itwas (dis)continuous, derivativebehavior, and limit
Exam - Course Test/Quiz - On the
09/19/2019 Page 64 of 318Generated by Nuventive Improve

Student LearningOutcomes (SLOs) Assessment Methods Assessment Data Summaries Enhancements
Target for Success: My target forsuccess is 70% of the studentssuccessfully answering this question.
Reflection (CLICK ON ? FOR INSTRUCTIONS): I was veryhappy to see so many students answer this questionsuccessfully and was somewhat surprised with thesurprisingly large number of students who successfullyanswered this question.
Enhancement: I was happy withthe results, but feel that I need toput another problem that is a bitmore challenging to the studentsnext time or a follow up questionthat will push the students'understanding of how to applycalculus to graph functions.(04/09/2019)
Program Review Reporting Year: 2018-2019Target : Target Met33 out of 34 students answered this question correctly. Thismeans that roughly 97% of the class answered this questioncorrectly. (04/09/2019)
Comments/Notes: This question wasout of 10 points, and if the studentsreceived a 7/10 or higher on thisquestion, then I considered it asuccess.
final exam, I asked students tosketch the graph of f(x) = x^4-2x^2using the first and second derivativesto find critical points, intervalswhere the function was increasingand decreasing as well as theconcavity of the function.
MATH1A_SLO_3 - Recognize,diagnose, and decide on theappropriate method for solvingapplied real world problems inoptimization, related rates andnumerical approximation.SLO Status: Active
Target for Success: Success is scoring10 points or higher out of 12 onquestion 3 and 4 points or higher outof 5 pts on question #12.
Reflection (CLICK ON ? FOR INSTRUCTIONS): target wasmet but the in the future, it would be good to break downeach part of this slo into distinct assignments: Lab, Quiz,Exam.
Enhancement: target was met butthe in the future, it would be goodto break down each part of this slointo distinct assignments: Lab,Quiz, Exam. In the future, have alab purely around linearapproximation, related rates, andoptimization. (12/14/2018)
Program Review Reporting Year: 2018-2019Target : Target MetExam 2 had questions on related rates, linearapproximation, and optimization. over 70% of studentspassed this exam.Quiz 5 had a questions on netowns method and 72% (avgacross three questions) of students answered thesecorrectly. (12/14/2018)
Enhancement: In the future, whenI teach these types of problems,on the first day of presentation, Iwill have them only draw thediagram, list the givens and writethe equation indicating therelationship between thevariables. I will not show themhow to solve the problem until thesecond day. I think that this way,the students will not be sooverwhelmed by the entire
Program Review Reporting Year: 2012-2013Target : Target MetQuiz 5 #3 (Related Rates): 75% scored 10 or higher;common errors made included not being able to write therelationship between the variables and failing to recognizethe constant value in the problem. Other errors madeincluded failing to indicate given information as requested,and substituting in the rates and values at an inappropriatetime in the solutionFinal Exam #12 (Optimization): 49% scored 4 or higher.Another 11% made errors in the set up of the problem, butthen were able to correctly find the solution of that
Exam - Course Test/Quiz - Questionsrelated to this SLO were selectedfrom Quiz 5 and the final exam.Student performance was analyzedquestion #3 on Quiz 5 and question#12 on the final exam: the numberof points received and errors made.The percentages of students whowere awarded various scores werecalculated.
09/19/2019 Page 65 of 318Generated by Nuventive Improve

Student LearningOutcomes (SLOs) Assessment Methods Assessment Data Summaries Enhancements
Reflection (CLICK ON ? FOR INSTRUCTIONS): Most studentsdid quite well on this problem. However, there were agood number of students who did not have the proceduredown sufficiently well. I think that students would benefitfrom practicing small parts of the process in isolation,before putting them together in the entire procedure.Many students have difficulty with application problems.Some students were thrown off by its similarity to a slightlydifferent problem given on Exam 3, and solved it as if itwere the other problem. Although the students were givenseveral homework problems in this category and severalexamples were discussed in class, I think students needmore practice setting up application
process. I also will allow for timein class for students to do at leastpart of the process in groups.(03/29/2013)
problem. Common errors made were to fail to check thatthe solution was an absolute maximum and failing tocorrectly compute the derivative. 3 students were unableto set up the problem at all. (01/11/2013)
Target for Success: Success is scoring80% or more of the total pointsallotted for the question.
Reflection (CLICK ON ? FOR INSTRUCTIONS): I felt that thisquarter, students had a much better handle on theseapplication problems. This quarter I broke the topic of
Enhancement: : I will continue topresent these topics with thechanges made this quarter. I thinkthe group work was especiallybeneficial, so I hope to do more ofthat next time I teach these topics.(06/28/2013)
Program Review Reporting Year: 2012-2013Target : Target MetExam 2 #7 (Related Rates): 69% of students scored 70% orhigher on this question. The most common error made (10students) was failing to recognize a constant in theproblem. 18 students had difficulty listing correctly thegiven and/or desired rates of the problem. 9 students didnot know how to solve the problem.Exam 3 #6 (Optimization): 82% scored 70% or higher. Themost common error made (16 students) was not fullyjustifying that the local maximum found was an absolutemaximum. Also, some students did not correctly give theanswer requested in the problem (the dimensions of eachpen as opposed to the dimension of the whole area). Butthese were actually relatively minor errors. There wereonly 7 students who did not know the basic process forsolving an optimization problem, missing more than half ofthe points allotted for the problem (04/03/2013)
Exam - Course Test/Quiz - Questionsrelated to this SLO were selectedfrom Exam 2 (Related Rates) andExam 3 (Optimization). Studentperformance on each question wasrecorded. The percentages ofstudents who were awarded variousscores were calculated.
09/19/2019 Page 66 of 318Generated by Nuventive Improve
Student LearningOutcomes (SLOs) Assessment Methods Assessment Data Summaries Enhancements
related rates into 3 days: the first I discussed how to set upthe problems and list the information given. Students thenpracticed in group. The second day I showed how to solvethe problem. The third day the students worked in groupson a problem. Students seemed much more comfortablethan last quarter. Their ability to set up problems alsocarried over for the optimization problem.
Reflection (CLICK ON ? FOR INSTRUCTIONS): The minitestcovers problems in the first half of the chapter; the examcovers mostly problems in the second half of the chapter.The nature of the problems changes rather drastically frombeginning to end of chapter.
Enhancement: As problemschange from a 'mechanical'technique to more of an'analytical/synthesis' technique,students seem to have a bit moredifficulty with setting up andsolving the variousword/application/story problemsthat they encountered.(04/03/2018)Follow-Up: The final exam, whichis comprehensive and covers allthe major topics in bothmechanical and application formhad an 18 out of 23 ( 78 % )pass rate. (04/03/2018)
Program Review Reporting Year: 2017-2018Target : Target Met18 out of 22 passed this SLO concept - 82 % on minitest 5 ;only 12 out of 23 ( 52 % ) passed the corresponding exam 4.( a 67-68 % considered passing) (04/03/2018)
Reflection (CLICK ON ? FOR INSTRUCTIONS): Morestudents seem to have trouble to do application problems.More classroom discussions and more homework practicewould be helpful.
Program Review Reporting Year: 2013-2014Target : Target Met65% students are able to do related question correctly onthe exams. (12/16/2013)
Exam - Course Test/Quiz - Exam 3and final exam
Reflection (CLICK ON ? FOR INSTRUCTIONS): Althoughsome students did very well on the exam, as a whole, I was
Enhancement: I will continue toemphasize the points on whichstudents had difficulty. Inparticular, I think students needmore practice on applicationproblems of several types. I will
Program Review Reporting Year: 2014-2015Target : Target Met70.7 % of students scored at least 70% on the exam.(06/23/2015)
Exam - Course Test/Quiz -Assessment Method:Student scores were recorded fromExam 3 which covered applicationsof the derivative.
09/19/2019 Page 67 of 318Generated by Nuventive Improve

Student LearningOutcomes (SLOs) Assessment Methods Assessment Data Summaries Enhancements
Target for Success: Target forSuccess: 70% of students will score70% or higher on this exam.
disappointed in the results of the exam. Many studentshad difficulty with the related rates question, which was asimple problem similar to an example I had done in class,and similar to a homework problem. A few students didnot know how to do a related rates problem by taking thederivative with respect to time, and other students did notrecognize the constant in the problem, or confused othergive values as constants. In the optimization problem,some students had difficulty writing the expression for cost,which was the quantity to be minimized. Some studentsinstead wrote the equation for the surface area – a relatedquantity – and then tried to introduce the cost at a latertime. A few students also did not correctly justify that theanswer they found was the absolute minimum cost. On thegraphing problems, a few students are still confused that aderivate may be undefined and the function f(x) becontinuous for all numbers.
try to expand my homework setswith other problems to give thestudents more practice.(06/23/2016)
Reflection (CLICK ON ? FOR INSTRUCTIONS): Althoughsome students did very well on the exam, as a whole, I wasdisappointed in the results of the exam. Many studentshad difficulty with the related rates question, which was asimple problem similar to an example I had done in class,and similar to a homework problem. A few students didnot know how to do a related rates problem by taking thederivative with respect to time, and other students did notrecognize the constant in the problem, or confused othergive values as constants. In the optimization problem,some students had difficulty writing the expression for cost,which was the quantity to be minimized. Some studentsinstead wrote the equation for the surface area – a relatedquantity – and then tried to introduce the cost at a latertime. A few students also did not correctly justify that theanswer they found was the absolute minimum cost. On thegraphing problems, a few students are still confused that aderivate may be undefined and the function f(x) be
Enhancement: I will continue toemphasize the points on whichstudents had difficulty. Inparticular, I think students needmore practice on applicationproblems of several types. I willtry to expand my homework setswith other problems to give thestudents more practice.(03/24/2016)
Program Review Reporting Year: 2014-2015Target : Target Met70.7 % of students scored at least 70% on the exam.(03/24/2015)
09/19/2019 Page 68 of 318Generated by Nuventive Improve
Student LearningOutcomes (SLOs) Assessment Methods Assessment Data Summaries Enhancements
continuous for all numbers.
Reflection (CLICK ON ? FOR INSTRUCTIONS): Students didactually quite well on the exam. Regarding the relatedrates problem, most students did quite well. The mostcommon mistake made was failing to record the rate of adecreasing quantity as negative. This resulted in anincorrect solution. In the optimization problem, studentsdid very well overall. A few students had difficulty writingthe expression for cost, which was the quantity to bemaximized. Some students instead wrote the equation forthe surface area – a related quantity – and then tried tointroduce the cost at a late time. A few students also didnot correctly justify that the answer they found was theabsolute minimum cost. On the graphing problems, a fewstudents are still confused that a derivative may beundefined and the function f(x) be continuous for allnumbers.
Enhancement: I will continue toemphasize the points on whichstudents had difficulty. Inparticular, next exam I will makesure I state in the directions forthe problem, the main things Ineed to see in order to receive fullcredit. I did this with the relatedrates problem, but failed to do itfor the maximization problem.(03/29/2014)
Program Review Reporting Year: 2014-2015Target : Target MetAssessment Data Summary: 82.5 % of students scored atleast 70% on the exam. In fact, 67.5 % scored at least 80%on the exam. (12/07/2014)
Reflection (CLICK ON ? FOR INSTRUCTIONS): Reflection andAnalysis:Students did actually quite well on the exam. Regarding therelated rates problem, although most students did well,some students had difficulty identifying the rates that weregiven, and especially the rate that is being solved for. A fewstudents did not correctly follow the procedure to solve forthe desired rate. In the optimization problem, students didvery well overall. Minor points were taken off for not fullyjustifying the fact that the local minimum or maximumfound was actually the absolute minimum or maximum.
Enhancement:Enhancement/ActionI will continue to emphasize theprocedures for these types ofproblems, which students finddifficult. This quarter, I broke theprocess down to moremanageable parts and it seemedto help many students. (04/06/2015)
Program Review Reporting Year: 2013-2014Target : Target MetAssessment Data Summary: 78 % of students scored at least70% on the exam. In fact, 73.1 % scored at least 80% on theexam. (04/06/2014)
09/19/2019 Page 69 of 318Generated by Nuventive Improve

Student LearningOutcomes (SLOs) Assessment Methods Assessment Data Summaries Enhancements
Target for Success: 70% of studentsgo the answers correct
Reflection (CLICK ON ? FOR INSTRUCTIONS): With currentbook format, some of the last topics covered wereoptimization and numerical analysis. I spend first week ofMath 1A reviewing pre-cal students need to be successful inclass but will focus on just 1 class next time so I can spendmore time on optimization/numerical analysis.
Program Review Reporting Year: 2015-2016Target : Target Not MetQuiz 5: 16 out of 33 students passedExam 3: 27 out of 36 students passed
Exam 3 had question on related rates, Quiz 5 had questionon optimization and numerical approximation.(06/22/2016)
Exam - Course Test/Quiz - Exam 3and Quiz 5: asked students to solverelated rates, optimization andnumerical approximation questions
Target for Success: My goal forsuccess was having 70% of thestudents answer this questioncorrectly.
Reflection (CLICK ON ? FOR INSTRUCTIONS): I was pleasedwith how the students answered this question. I feel that Imight create a slightly harder version of this question forfuture exams.
Enhancement: For future classes, Iwill try to think of variations of thisquestion to test students'understanding of how to solvesimilar problems. (04/10/2019)
Program Review Reporting Year: 2018-2019Target : Target Met23 of the 29 students who took the final exam answeredthis problem correctly. This meant that about 79% of thestudents successfully answered the question. (04/10/2019)
Comments/Notes: This problem wasout of 10 points, and if the studentreceived a 7/10 or higher on thequiz, then I felt that the studentanswered the question correctly.
Exam - Course Test/Quiz - On thefinal exam, I asked the students anoptimize the volume of a box thathas an open top and has aconstrained surface area.
09/19/2019 Page 70 of 318Generated by Nuventive Improve

MATH 1B:Calculus
Student LearningOutcomes (SLOs) Assessment Methods Assessment Data Summaries Enhancements
MATH1B_SLO_1 - Analyze thedefinite integral from a graphical,numerical, analytical, and verbalapproach, using correct notation andmathematical precision.SLO Status: Active
Enhancement: The class is close tomeeting the objectives.(01/10/2018)
Reflection (CLICK ON ? FOR INSTRUCTIONS): Towards themiddle/end of the term I sent an email to those full-timeinstructors teaching Math 1B; only one responded, whodecried the weak preparation of the 1B students in thatinstructor's class. I think my exams may be harder thanmost other instructors' exams.
Program Review Reporting Year: 2017-2018
16 out of 25 students passed this first minitest, 64 %.(01/10/2018)
Target : Target Not MetDirectly related to Student LearningOutcome (SLO)
Target for Success: 75% students willbe able to solve integral problemsgraphically , numerically, analyticallyand verbally. Reflection (CLICK ON ? FOR INSTRUCTIONS): assign more
homework in these areas to reinforce their understanding.
Enhancement: continue the workto keep the success. (06/08/2013)
Program Review Reporting Year: 2012-2013Target : Target Metabout 80% students showed their abilities in the four areason their homework assignments, about 70% also did well onthe quizzes and exams. (05/03/2013)
Exam - Course Test/Quiz - Exams,quizzes and homework
Target for Success: 70% success
Reflection (CLICK ON ? FOR INSTRUCTIONS): results are asexpected. We will continue our effort.
Program Review Reporting Year: 2012-2013Target : Target Metabout 70% students of the class are able to demonstratetheir understanding of the definite integral in these aspects.(07/31/2013)
Exam - Course Test/Quiz - examsand quizzes
Target for Success: The exam wasscored out of 60 points. Due to thecomplexity of the questions a scoreof 36 or above is considered passing.
Reflection (CLICK ON ? FOR INSTRUCTIONS): Somestudents seemed to only learn one or two specific types ofspecific problems related to the definition and notation ofthe definite integral. They would then proceed to use thesetechniques even if the problem didn’t warrant them. This is
Enhancement: Restructure courseto allow for one or two discussionsin the first unit.Create a pdf homeworkassignments in order to weanstudents off of solution manuals. (10/14/2016)
Program Review Reporting Year: 2015-2016Target : Target Not MetOut of the 36 students who finished this course, only 35 ofthem took this assessment. Out of those 35, 24 of thempassed the midterm. This gave a success rate of 69%. Theaverage score was a 40.5.
(10/14/2016)
Exam - Course Test/Quiz - Studentswere given a midterm where theyhad to recognize the definiteintegral, analytically evaluate thedefinite integral from its definition,numerically approximate the definiteintegral and determine the level oferror, and understand the definiteintegrals relationship with area.
09/19/2019 Page 71 of 318Generated by Nuventive Improve

Student LearningOutcomes (SLOs) Assessment Methods Assessment Data Summaries Enhancements
The target for success in thisassessment is to have at least 80% ofthose students completing thecourse, passing the exam.
indicative of students who have a memorization approachto mathematics. Even if they get those one or two problemscorrect they still don’t know why they got them correct.One student confided that her study group did thehomework by copying the solutions manual, and then theywould sit around memorizing additional homeworksolutions.Students continue to struggle with inequality argumentsand bounding functions and errors.
Reflection (CLICK ON ? FOR INSTRUCTIONS): A majority ofthe students have been exposed to integral calculus beforetaking this course. Unfortunately they tend to believe thatthe Fundamental Theorem of Calculus (FTC) is the definitionof the definite integral. These students were particularlyresistant to the Riemann sum definition which is used todevelop the applications of integration. By delaying theintroduction of the FTC to the second half of the quarter, Ihad the time to break down some of these notions. Usingcalculators to evaluate definite integrals during this part ofthe course also helped connect the students to numericalapproximation.
Program Review Reporting Year: 2013-2014Target : Target MetOut of the 25 students completing the course, 21 of thempassed the midterm. The average score on the midterm was40.4 out of 60. (12/12/2013)
Target for Success: Hope is that theaverage score obtained by thestudents on this problem is 7 orabove (70%).
Reflection (CLICK ON ? FOR INSTRUCTIONS): Target wasmet although the hope is that the average score wouldhave been higher.Related Documents:SLO Data S14.xls
Program Review Reporting Year: 2013-2014Target : Target MetFor this question, the average student score was a 7 out of10 exactly for a 70% average. Although this met our hopes,we thought the average score would be a little higher.(11/06/2014)
Comments/Notes: A nice problem
Exam - Course Test/Quiz - Usedquestion from the final exam. "Findthe indefinite integral of thefollowing function." Problemrequired student to use a doublesubstitution. Problem was work 10points.
09/19/2019 Page 72 of 318Generated by Nuventive Improve

Student LearningOutcomes (SLOs) Assessment Methods Assessment Data Summaries Enhancements
that required students to think alittle beyond the typical substitutionproblem.
Target for Success: 70% of thestudents will score at least 70% onthe exam.
Reflection (CLICK ON ? FOR INSTRUCTIONS): Students didvery well on this exam. Some students had difficultyapplying the limit definition of the definite integral toevaluate a definite integral. There was also a question thatasked students to write the meaning of a definite integral inthe context of a problem about the stock values. Overall,however, students did well.
Enhancement: Next time, I willgive students feedback on theverbal interpretation of thedefinite integral. (03/18/2016)
Program Review Reporting Year: 2015-2016Target : Target Met92% of students scored 70% or higher on this exam. In fact,42% of the students scored above 90%. (03/18/2016)
Exam - Course Test/Quiz - Resultsfrom Exam 1 on the definition of thedefinite integral was recorded andanalyzed. This exam contained avariety of questions from graphical,numerical and analytic approaches,as well as applications
Target for Success: The goal was tohave everyone pass the test with ascore of 70% correct or higher.
Reflection (CLICK ON ? FOR INSTRUCTIONS): Although theindividual scores did not meet the target, having a mean of77.2% correct on that exam was acceptable and it wasdetermined that the missed concepts could be revisited andlearning supported without having to re-test.
Enhancement: This assessmentactually gave me good feedbackabout the level of understandingfor these very important topics. Inthe future, I will make sure to putmore emphasis on the areas thatthe students who struggled themost (the ones with scores below70%) had the most difficulty with.(03/30/2016)
Program Review Reporting Year: 2015-2016Target : Target Not Metmean score was 77.2%, however every student did not passwith a 70% or higher. (03/30/2016)
Exam - Course Test/Quiz - The firstexam of the quarter was made upcompletely by problems thatrequired analyzing the definiteintegral from a graphical, numerical,and verbal approach. Students wereasked to rewrite a definite integralas a limit of Riemann sums andcompute the value; write a finiteRiemann sum for a transcendentalfunction; Give upper and lowerestimates of sums using a table ofvalues; Graphically express themidpoint approximation for an areausing 6 rectangles; Explain themeaning and relationship of 4methods of computing Riemannsums
Exam - Course Test/Quiz - questionsrelated to definite integral in variousapproaches were given on quizzes ,tests and the final
09/19/2019 Page 73 of 318Generated by Nuventive Improve

Student LearningOutcomes (SLOs) Assessment Methods Assessment Data Summaries Enhancements
Reflection (CLICK ON ? FOR INSTRUCTIONS): Students donot have solid algebra foundation struggle in calculus.
Enhancement: Encouragestudents to spend more time to dotheir homework and understandthe problems they did(12/21/2016)
Program Review Reporting Year: 2016-2017Target : Target MetAbout 70%-80% of the students who had the time to dotheir homework are able to the related questions on quizzesand tests correctly. (12/21/2016)
Exam - Course Test/Quiz -Homework , quizzes, tests and final
Target for Success: 70 %
Exam - Course Test/Quiz - Usingeither minitest (a quiz of severalquestions, taking about half the classtime) given midway through achapter, or a chapter exam given atthe end of a chapter and taking thefull class period (50 mins).
MATH1B_SLO_2 - Formulate and usethe Fundamental Theorem ofCalculus.
Planned Assessment Quarters: 2012-13 3-Winter
SLO Status: Active
Target for Success: 70% - 75%students show understanding of thetheorem
Reflection (CLICK ON ? FOR INSTRUCTIONS): With theminitest worth 36 points, several students came close to"passing", thus the target was 'almost' met. Similar resultsoccurred on the chapter exam. (61 % 'passed')
Enhancement: It was difficult forme to isolate those questions onthe minitest or exam that dealtspecifically with the Fund. Theor.of Int. Calc. to determine howmany were successful in thisspecific SLO. Overall, studentsseem to have a general idea of theconcept. (01/09/2018)
Program Review Reporting Year: 2017-2018Target : Target Not Met24 students took the minitest ( long quiz, about half thelength of a full exam), 16 passed with a C or better; 20 outof 24 passed with a D or better (01/09/2018)
Reflection (CLICK ON ? FOR INSTRUCTIONS): Students withstrong algebra skills have no trouble to do the problemscorrectly. Some students struggle with the concept of upperlimit function.
Encourage students to practice more homework.
Enhancement: work with studentsclosely to help more students tounderstand the theorem(06/08/2013)
Program Review Reporting Year: 2012-2013Target : Target MetAbout 70 % to 75 % students answer the related questionscorrectly. (01/31/2013)
Exam - Course Test/Quiz - Questionsfrom quiz 2 and exam 1
Target for Success: 70 % successProgram Review Reporting Year: 2012-2013Target : Target MetMost students did very well on the part I of the theorem, afew more students have some trouble with the part II of the
exams, quizzes and homework
09/19/2019 Page 74 of 318Generated by Nuventive Improve

Student LearningOutcomes (SLOs) Assessment Methods Assessment Data Summaries Enhancements
Reflection (CLICK ON ? FOR INSTRUCTIONS): work morewith the students on the part II of the theorem, and assignmore homework problems related to part II of the theorem.
theorem. (07/31/2013)
Target for Success: The quiz wasscored out of 20 points. Due to thecomplexity of the questions a scoreof 12 or above is considered passing.The target for success in thisassessment is to have at least 80% ofthose students completing thecourse, passing the quiz.
Reflection (CLICK ON ? FOR INSTRUCTIONS): Studentsseem to resist problems that they don’t deem to becomputational in nature. The idea that the FundamentalTheorems have conditions that need to be met continues toelude them. Despite separating my approaches to definiteand indefinite integrals, students have trouble keepingthem separate. This quarter, students seemed particularlybothered by the integral valued function. There seemed tobe a disconnect about the difference between an integralevaluated from a to b and an integral evaluated from a to x.Students were also hampered by a fundamental inability todifferentiate using the product rule.I noticed that far more students completed this course thanin the past. Unfortunately, roughly the same number ofstudents passed the class. By and large I am happier to seethe students trying until the very end. Now that I havestudents trying longer (which may be a factor of limitedretakes) I need to find ways to help them succeed.
Enhancement: Repetition,Examples and Counterexamples.The students are being exposed tothe Fundamental Theorems but donot seem to internalize what theysay. Exposure to commonmistakes along with theircorrections may help themovercome a lack of attention todetails.In lecture, I might approachdefinite integrals with a differentvariable (dummy) long beforeintroducing integral valuedfunctions to make the transitionmore natural. It might also be agood idea to present the idea ofg(x) verbally as an “area” functionin advance of using the integralnotation.
(10/14/2016)
Program Review Reporting Year: 2015-2016Target : Target Not MetOut of the 36 students completing the course, only 23 ofthem received a passing score. This led to a passing rate ofonly 64%. Their average score was a 13.3. (10/14/2016)
Reflection (CLICK ON ? FOR INSTRUCTIONS): Students hadthe greatest difficulty formulating the FundamentalTheorems. They have a great deal of troublecomprehending the conditional nature of the theorems.They could list all of the components of the theorem, buthad difficulty expressing which pieces implied which other
Program Review Reporting Year: 2013-2014Target : Target MetOut of the 25 students completing the course, 22 of thempassed the quiz. The average score on the quiz was 15.1 outof 20. (12/12/2013)
Exam - Course Test/Quiz - Studentswere given a quiz where they had toformulate and apply the first andsecond fundamental theorem ofcalculus.
09/19/2019 Page 75 of 318Generated by Nuventive Improve

Student LearningOutcomes (SLOs) Assessment Methods Assessment Data Summaries Enhancements
pieces. Part of the trouble lies in the fact that the theoremswork 98% of the time in the course. I also noticed thatstudents whose first language was not English seemed tobe more susceptible to this problem.
Target for Success: This problem wasworth 10 points and the hope is, theaverage number of points obtainedby the students will be 7 or above(70%).
Reflection (CLICK ON ? FOR INSTRUCTIONS): We werepleased here. This was not an easy problem. The data forthis SLO was taken from one class only because in the otherclass, the problem was given as an extra credit and notrequired. Thus, many students chose not to try it.
Program Review Reporting Year: 2013-2014Target : Target MetThe average score for this problem was a 7.42 out of 10 foran average score of 74.2%. This met our goals.(11/06/2014)
Comments/Notes: Again, a niceproblem that required students tothink more deeply about how theFundamental Theorem could beused to solve a problem.
Exam - Course Test/Quiz - Usedproblem from the final exam.Problem required student to applythe Fundamental Theorem ofCalculus in order to solve for anunknown quantity.
Target for Success: 70% of studentswill score at least 70% on the quiz.
Reflection (CLICK ON ? FOR INSTRUCTIONS): Students didfairly well on this quiz. The question that some studentsstruggled with was using the first Fundamental Theorem ofCalculus together with the chain rule. Some students failedto multiply by the derivative of the upper limit. Studentsgenerally did well on questions on the 2nd part of theFundamental Theorem.
Enhancement: I will continue togive students practice on theFundamental Theorem of Calculus,especially when one needs to usethe chain rule. (03/18/2017)
Program Review Reporting Year: 2015-2016Target : Target Met82.3% of students scored at least 70% on this quiz.(03/18/2016)
Exam - Course Test/Quiz - Quiz 2contained questions on both the 1stand 2nd Fundamental Theorem ofCalculus. The scores on this quizwere recorded and analyzed.
Target for Success: Target was 70%of students responding correctly.
Reflection (CLICK ON ? FOR INSTRUCTIONS): It wasdetermined that these concepts needed to be revisited andstudents were given an additional quiz that focused solelyon the areas that were missed for the quiz that included theassessment question.
Enhancement: In the future,spend a bit more time on part 2 ofthe FTC. For winter 2016, Idecided to give some additionalinstruction and reassess thestudents the next week.(03/30/2016)
Program Review Reporting Year: 2015-2016Target : Target Not Met69.4% of the students correctly responded to the questiontargeting the second part of the F.T.C. (03/30/2016)
Exam - Course Test/Quiz - Thesecond quiz of the quarter hadseveral questions regarding theF.T.C. One specific question fromthe quiz requiring the proper use ofthe second part of the F.T.C. wasused as a measure of student
09/19/2019 Page 76 of 318Generated by Nuventive Improve

Student LearningOutcomes (SLOs) Assessment Methods Assessment Data Summaries Enhancements
Exam - Course Test/Quiz - questionsof differentiate the upper limitfunction (Fundamental theorem ofcalculus part I) and use definiteintegral to evaluate (Fundamentaltheorem of calculus Part II) were onquizzes, tests and the final. Studentswere required to remember thebasic integral formulas. No notesallowed on any tests.
Target for Success: 75% of studentsscoring above 17.5/25 on the quiz.
Reflection (CLICK ON ? FOR INSTRUCTIONS): Studentsdisplayed a basic understanding of the FTC.
Program Review Reporting Year: 2015-2016Target : Target Met85.7% of students passed the quiz with a score of 18/25 orhigher. (07/12/2016)
Exam - Course Test/Quiz - Quiz 2focused on FTC parts 1 and 2.
Reflection (CLICK ON ? FOR INSTRUCTIONS): Students needto spent more time to study
Enhancement: Encouragestudents to spend more time to dotheir homework and understandthe problems they did.(12/21/2016)
Program Review Reporting Year: 2016-2017Target : Target MetAbout 70% people were able to do the related questionsand sigma notation correctly. (12/21/2016)
Exam - Course Test/Quiz -Homework, quizzes, test 1 and FinalExam
MATH1B_SLO_3 - Apply the definiteintegral in solving problems inanalytical geometry and the sciences.
Outcome Inactive Date: 12/19/2012
Planned Assessment Quarters: 2012-13 2-Fall
SLO Status: Active
Outcome Creation Date: 12/12/2012
Reflection (CLICK ON ? FOR INSTRUCTIONS): I thought thestudents would have done better on this problem. Theproblem given integrates both differential equations andintegration. These topics were covered late in the quarter.Hence, the students maybe didn't have enough time toabsorb/practice the material. In the future, I plan topossibly have extra work sheets that will help studentsunderstand the material quicker.Related Documents:
Enhancement: Next time I teachMath 1B, I plan to give again asimilar question on the final exam.Only next time, I hope to haveextra worksheets to help studentsstudy. (02/08/2013)
Program Review Reporting Year: 2012-2013Target : Target Not MetTook all scores of individual students for this particularproblem (total possible was 20 points) and calculated theaverage score per student. The average was 11 points witha standard deviation of 6.26. A 70% average would havebeen 14 points, so we did not exactly meet our goal.(02/08/2013)
Exam - Course Test/Quiz - Used aproblem from the final exampertaining to a set-up andcalculation of a definite integral in ascience application. Problem is asfollows:
7. A swimming pool whosevolume is 10,000 gal contains waterthat is 0.01% chlorine. Starting at ,city water containing 0.001%chlorine is pumped into the pool at arate of 5 gal/min. The pool waterflows out at the same rate. What isthe percentage of chlorine in thepool after 1 h? When will the poolwater be 0.002% chlorine? Show
09/19/2019 Page 77 of 318Generated by Nuventive Improve

Student LearningOutcomes (SLOs) Assessment Methods Assessment Data Summaries Enhancements
Target for Success: Target was thatwe hoped that the averagepercentage of the problem gottencorrect per student was 70%, whichgenerally represent a passing grade.
Book1.xlsA swimming pool whose volume is 10.doc
Comments/Notes: This is anintegrated problem requiringmathematical skills and criticalthinking.
your work step by step. You don’tneed to simplify your answer.(20points)
Target for Success: 70% students willdo the related questions correctly
Reflection (CLICK ON ? FOR INSTRUCTIONS): Studentsfinished homework before quizzes could do the problemscorrectly.
Program Review Reporting Year: 2012-2013Target : Target MetAbout 80% students did problems correctly on quizzes.About 72% students did correctly on exam 2. (06/10/2013)
Exam - Course Test/Quiz - Quiz 3, 4and exam 2
Target for Success: 70% success.
Reflection (CLICK ON ? FOR INSTRUCTIONS): continue oureffort in the area of application.
Program Review Reporting Year: 2012-2013Target : Target MetAbout 77% students can apply the definite integral insolving problems. Students do better in geometry problems.(07/31/2013)
Exam - Course Test/Quiz - Exam 3and final exam
Target for Success: Each questionwas scored out of 10 points so theassessment was scored out of 50points. Due to the complexity of thequestions a score of 30 or above isconsidered passing. The target for
Reflection (CLICK ON ? FOR INSTRUCTIONS): I don’t knowhow to feel about this assessment. A week before finals, Ibroke my foot and was not around to help students preparefor their final. As such, I don’t know how greatly thestudents’ scores were affected by my absence. On the otherhand, I don’t believe I would have met the target even if Ihad been around.
Program Review Reporting Year: 2015-2016Target : Target Not MetOut of the 34 students completing the course, only 18 ofthem passed this assessment (53%). The average score onthis assessment was 30.5 out of 50. (10/14/2016)
Exam - Course Test/Quiz - The firstfive questions on the students’ finalcovered applications to area,volume, arc length, work, andprobability. The aggregate score onthese 5 questions was used to assessthis SLO.
09/19/2019 Page 78 of 318Generated by Nuventive Improve

Student LearningOutcomes (SLOs) Assessment Methods Assessment Data Summaries Enhancements
success in this assessment is to haveat least 80% of those studentscompleting the course, passing thisassessment.
Reflection (CLICK ON ? FOR INSTRUCTIONS): Throughoutthe course students had a harder time with applicationsthan with theory. (They averaged about 40 and 46 out of 60on the theoretical exams and only averaged 34 and 38 onthe more applied exams.) It seems difficult to find a balancebetween the number of applications and trulyunderstanding how they work. Students are mostcomfortable with applications when they come down to amemorized formula. Unfortunately, I feel that this doesthem the least amount of good. They want to integrate pif(x) squared without knowing that it comes from the cross-sectional area. They want to find the center of masswithout understanding the role of density or even knowingthat moments are additive while centers are not.
Enhancement: The number ofapplications needs to be pareddown so that they can beexpanded upon in lecture.Homework questions for theseapplications needs to besupplemented as the textbookquestions are oriented towardsthe formulas so that even diligentstudents are missing theunderlying principles within theapplications. (09/29/2014)Follow-Up: The proposal toreduce the number of requiredapplications did not pass throughthe department's curriculumprocess. (10/14/2016)
Program Review Reporting Year: 2013-2014Target : Target Not MetOut of the 25 students completing the course, only 16 ofthem passed this assessment. The average score on thisassessment was 34.2 out of 50. (12/12/2013)
Target for Success: Each groupobtain the equation of the bindingcurve in comparison to any standardcurve using transformations; Showclear understanding of the methods
Project - Each group must select anobject like wineglass, flower vase orany similar object that can holdwater. Trace the boundary of theobject on a piece of graph paper(use engineering graph paper forbetter accuracy). The object cannothave straight sides. The final answermust be in reasonable units.Use the above object to determineitsa. Volume,b. Surface area, andc. Work done to empty theobject completely filled with water.
09/19/2019 Page 79 of 318Generated by Nuventive Improve

Student LearningOutcomes (SLOs) Assessment Methods Assessment Data Summaries Enhancements
of using integrals to find volume,Surface-area and work-done. Theproject will be scored for 30 pointsbased on the uniqueness,presentation and accuracy.Related Documents:MATH1B-SLO-3-Group Project
Target for Success: Problem wasworth 15 points. Target is that theaverage score obtained by thestudents is 10.5 or above (70%).
Reflection (CLICK ON ? FOR INSTRUCTIONS): Well, this is adifficult problem to complete without any mistakes at all. Itinvolves both understanding, modeling, setting up anintegral, and evaluating it correctly. So, although our goalwas not met, we believe the students made good effort.
Program Review Reporting Year: 2013-2014Target : Target Not MetThe average score for this problem was an 8.26 out of 15for an average percentage of 55.07%. That did NOT meetour hopes. (11/06/2014)
Comments/Notes: Standardhydrostatic problem that requiresstudents to set up an integral andsolve the problem using standardtechniques of integration.
Exam - Course Test/Quiz - Used afinal exam question on hydrostaticforce. "A semicircle 10 feet indiameter is submerged 2 feet inwater. Find the hydrostatic force onthe object."
Target for Success: 70% of studentswill score at least 70% on Quiz 3.70% of students will score at least70% on Exam 3.
Reflection (CLICK ON ? FOR INSTRUCTIONS): Students didquite well on the quiz. Some students had difficulty whenthey needed to partition the y-axis instead of the x-axis.Some forgot to re-express the function in terms of y.
Students did generally well on the exam. Many studentsstill had difficulty correctly labeling a diagram and showingthe element of volume for the given work problem.Because they were not clear about what they were actuallyfinding, they made mistakes in setting up the integral.
Enhancement: In the future, I willbe more careful about showingstudents how to label the diagramand show the element of volume(or similar element, depending onthe problem). I will be careful toshow how the element of work isgotten from the diagram.(03/18/2017)
Program Review Reporting Year: 2015-2016Target : Target MetQuiz 3: 87.5% of students scored at least 70% on Quiz 3.Exam 3: 77.5% of students scored at least 70% on Exam 3 (03/18/2016)
Exam - Course Test/Quiz - Quiz 3covered finding areas and volumesusing integrals. The results of thisquiz were recorded and analyzed.
Exam 3 covered several applicationsof the integral, including work,calculation of centroids, arclengthand probability.
Enhancement: The only change IProgram Review Reporting Year: 2015-2016Project - Students completed a peer
09/19/2019 Page 80 of 318Generated by Nuventive Improve

Student LearningOutcomes (SLOs) Assessment Methods Assessment Data Summaries Enhancements
Target for Success: 1. Every studentcomplete the project, and 2. Meanproject grade of 85%.
Reflection (CLICK ON ? FOR INSTRUCTIONS): This projectwas very successful. Students did a very good job on theirindividual projects and also did a good job of criticallyanalyzing and grading projects of two of their peers.
would make to this project is inthe instructions to the studentsregarding their explanations of theconcepts. (03/30/2016)
Target : Target MetEvery student completed the project and returned gradedpeer projects. The mean project grade was 90.8%(03/30/2016)
learning project that required themto compute the area between curvesfrom both the dx and dyperspectives, explain therelationship between a definiteintegral and a Riemann sum, graphthe curves, shade the region anddraw appropriate approximatingrectangles. Then students wereasked to grade the project of two oftheir peers.
Exam - Course Test/Quiz - Variousproblems on the applications of thedefinite integral were on quizzes,test 2, 3 and the final. studentslearned to find volumes ofrevolution, solve physics applicationsuch as work, center of mass andhydrostatic force, and use definiteintegral to find probability.
Reflection (CLICK ON ? FOR INSTRUCTIONS): Students whodo not have solid algebra foundation struggled in calculus.
Enhancement: Encouragestudents to spend more time to dotheir homework and understandthe problems they did.(12/21/2016)
Program Review Reporting Year: 2016-2017Target : Target MetAbout 70% of the students acquired the basic analytic skillsto work with applications and the related problems(12/21/2016)
Exam - Course Test/Quiz -Homework, quizzes, tests and finalexams
Reflection (CLICK ON ? FOR INSTRUCTIONS): I emailedother instructors who were teaching Math 1B Fall. '17. Onlyone responded who decried the poor math preparation ofthe students in that instructor's class.
Enhancement: Some studentsconsistently scored low on allminitests and exams.(01/09/2018)
Program Review Reporting Year: 2017-2018Target : Target Not MetAn exam taken by 24 students; 14 students passed with a Cor better; 20 students passed with a D or better(01/09/2018)
Exam - Course Test/Quiz - Exam
09/19/2019 Page 81 of 318Generated by Nuventive Improve

MATH 1C:Calculus
Student LearningOutcomes (SLOs) Assessment Methods Assessment Data Summaries Enhancements
MATH1C_SLO_1 - Graphically,analytically, numerically and verballyanalyze infinite sequences and seriesfrom the perspective of convergence,using correct notation andmathematical precision.SLO Status: Active
Target for Success: None set, firstcycle
Reflection (CLICK ON ? FOR INSTRUCTIONS): Most studentsunderstand the concept of how to test sequence and series.Some students got confused with the result of ratio testand result of the comparison test and their conclusions
Enhancement: More samplequestions for the review of thematerial. (01/14/2013)
Program Review Reporting Year: 2012-2013Target : Target MetAbout 80% students showed good understanding of thevarious tests on the basic problems. When the problems getmore difficult, at least 50% students can answer correctly.(01/14/2013)
Exam - Course Test/Quiz - Questionsfrom exam 2
Target for Success: The exam wasscored out of 60 points. Due to thecomplexity of the questions a scoreof 36 or above is considered passing.The target for success in thisassessment is to have at least 80% ofthose students completing thecourse, passing the exam.
Reflection (CLICK ON ? FOR INSTRUCTIONS): Studentsseemed to struggle with this topic more than any othertopic we covered this quarter. Students continue to entermath 1C deficient in earlier calculus skills. In particular theystruggle with limits and derivatives. The discussions seem tohelp mitigate that for some of the students, but otherstudents are reticent to work with their classmates.
Enhancement: Reduce Midtermsfrom 45% of grade to 40% of gradeto allow for a 5% discussion grade.Hopefully, by attaching points tothe discussion it will encouragethe students to be more receptiveto the group work. (10/14/2016)
Program Review Reporting Year: 2015-2016Target : Target Not MetOut of the 34 students finishing the course only 20 of thempassed the exam. (59%). All 20 of the students who passedthe exam, ended up passing the course (20 out of 23)passed this exam. The average score on the exam was a64%. (10/14/2016)
Reflection (CLICK ON ? FOR INSTRUCTIONS): It is strangethat although the students this quarter were weaker than inpast quarters they seemed more appreciative of the thingswe were trying to learn. One thing I noticed that wasdifferent this quarter was a decrease in participation ondiscussion days. Discussions are focused group problemsolving days. The problems are intended to guide students
Enhancement: Reduce Midtermsfrom 45% of grade to 40% of gradeto allow for a 5% discussion grade.(05/01/2015)
Program Review Reporting Year: 2013-2014Target : Target Not MetOut of the 34 students finishing the course only 21 of thempassed the exam. (62%). Even among those passing thecourse, only 18 out of 25 passed this exam. (72%) Theaverage score on the exam was a 68%. (10/21/2014)
Exam - Course Test/Quiz - Studentswere given a midterm where theyhad to analyze infinite series andsequences and determine whattechniques they could use todetermine convergence ordivergence.
09/19/2019 Page 82 of 318Generated by Nuventive Improve
Student LearningOutcomes (SLOs) Assessment Methods Assessment Data Summaries Enhancements
through many of the difficulties that are encountered withsequences and series. Some students who were also in myMath 1B course the previous quarter suggested that havingno points attached to discussion in Math 1C might accountfor this.
Reflection (CLICK ON ? FOR INSTRUCTIONS): Againstudents seemed more comfortable with this part of thecourse than any other. Series remain alien to the studentswhen we begin the course, but they seem to make theirpeace with the large collection of tools they have todevelop. Students are happy to finish with sequences andseries until they begin working on the rest of the course.They seem to gain some comfort in the homogeneity of thetypes of questions they are asked. (No matter how manydifferent techniques they need to apply, the questions stillcome down to convergence or divergence.)Although no significant improvement was observedbetween last quarter and this quarter, the students seemedto appreciate having series placed into a framework thatrelates to what they associate with calculus. This wasachieved by a lab in the first week where they explored theintegral of e to the power of x squared.
Enhancement: The “minitest” forthis material (the first half ofchapter 11) covered the conceptsof SLO 1. Out of 50 points theaverage was 36. 11 out of 18students were at or above theaverage, and 14 out of 18 scoredat least 60 % (a minimumsuggested criteria as defined in thePLO). (01/02/2014)Enhancement: For Math 1C Fall,2013: For the 'minitest' worth 50points, the average score was 36.11 out of 18 students scored at orabove the average, and 14 out of18 scored at least 60 % (assuggested in the PLO).
This minitest covered the first halfof Ch 11 which focuses on thetopics of convergence anddivergence of sequences andseries. (01/02/2014)
Program Review Reporting Year: 2012-2013Target : Target MetOut of the 26 students completing the course, 21 of thempassed the midterm. The average score on the midterm was44.6 out of 60. (07/26/2013)
Reflection (CLICK ON ? FOR INSTRUCTIONS): It wassurprising to learn that the students were morecomfortable with sequences and series than other parts ofthe course. Students identified the quality of discussionexercises in this chapter as a major reason for success.Despite the math 1A prerequisite, quite a bit of time was
Program Review Reporting Year: 2012-2013Target : Target MetOut of the 25 students completing the course, 20 of thempassed the midterm. The average score on the midterm was44.1 out of 60. (05/01/2013)
09/19/2019 Page 83 of 318Generated by Nuventive Improve

Student LearningOutcomes (SLOs) Assessment Methods Assessment Data Summaries Enhancements
needed to review limits, most students had completelyforgotten about the exponential indeterminate forms.There was some discussion about the target for successwhich seems somewhat arbitrarily. In observing the dataacross all 3 SLOs, it was noted that the highest gradeachieved by any student who did not pass any one of theSLO assessments was a C+. However, it was also noticedthat there was 1 student who passed the course withoutpassing any of the SLO assessments.
Target for Success: The “minitest”for this material (the first half ofchapter 11) covered the concepts ofSLO 1. Out of 50 points the averagewas 36. 11 out of 18 students wereat or above the average, and 14 outof 18 scored at least 60 % (aminimum suggested criteria asdefined in the PLO).
On the minitest, out of 50 points theaverage was 36. 11 out of 18students were at or above theaverage, and 14 out of 18 scored atleast 60 % (a minimum suggestedcriteria as defined in the PLO).On the exam, out of 99 points theaverage was 65; out of 13 studentswho took the exam, 9 scored at least60 %
Comments/Notes: This material wasconceptually quite difficult forstudents. Students understood the
Exam - Course Test/Quiz - Both a'minitest' and an exam were givenfor this material (the first half ofchapter 11), which covered theconcepts of SLO 1.
09/19/2019 Page 84 of 318Generated by Nuventive Improve

Student LearningOutcomes (SLOs) Assessment Methods Assessment Data Summaries Enhancements
concepts of convergence anddivergence, and use of sigmanotation was good; but students haddifficulty determining which test touse for convergence or divergence,and fell into the trap of misusing theinverse of a theorem with thetheorem itself.
Target for Success: A grade of 60%or higher.
Reflection (CLICK ON ? FOR INSTRUCTIONS): TheMATH1C_SLO_1 is traditionally one of the most difficultSLO among all SLOs of higher level courses. By my opinionresults are good taking into account that only 2 studentshave not met the target.
Enhancement: As theenhancement I propose to createa new handout which specificallywill targetthe strategies for a choice of anappropriate tests of convergence(or divergence) of series(04/04/2015)
Program Review Reporting Year: 2014-2015Target : Target Not MetTest 2 has been focused on MATH1C_SLO_1. The result ofTest 2 are the following:Test 2 >=90---------14,>=80--------16, >=70---------9,>=60---------3,<60----------2 (04/04/2015)
Reflection (CLICK ON ? FOR INSTRUCTIONS): Afterdiscussing the issue with the students, many expressed thattheir poor performance was due to inadequate preparationfrom previous courses. Students expressed they werespending more time reviewing topics from 1A and 1B andwere not able to practice the new topic of sequences andseries as much. In the future quarter I will be spending thefirst few days reviews the main topics of the previousquarters.
Program Review Reporting Year: 2013-2014Target : Target Met18 out of 35 students received a grade of 60 or higher whichis about 51%. (01/19/2014)
Exam - Course Test/Quiz - Their fistexam was focused on graphical,analytic, numerical and verbalanalyze infinite sequences and seriesfrom the perspective ofconvergence, using correct notationand mathematical precision.
Target for Success: 60% or higher.
Students were given an exam thatassesses their analysis of infinitesequences and series from theperspective of convergence,analytically, numerically, verbally,and graphically
09/19/2019 Page 85 of 318Generated by Nuventive Improve

Student LearningOutcomes (SLOs) Assessment Methods Assessment Data Summaries Enhancements
Target for Success: 70%
Reflection (CLICK ON ? FOR INSTRUCTIONS): The exam isgenerally most difficult as slo 1 has a high degree ofmathematical rigor relative to students background and Ibelieve is was very close to achieving 70% pass rate evenwithout normalizing to difficulty. I would like to open upmore time in course to slow down and spend extra times onfirst two sections which are fundamental to remainingportions of SLO1
Program Review Reporting Year: 2014-2015Target : Target MetStudents were given an exam on different aspects of SLO 1.The exam was out of 23 points and given the difficulty ofmaterial, a 65% is considered passing. 75% of studentswere able to get a 15+ out of 23 (65% on exam) and 60% ofclass was able to get 16+ out of 23 (70% on exam)(12/01/2014)
Reflection (CLICK ON ? FOR INSTRUCTIONS): Students needmore mixed practice with series to identify the appropriatetest required. More worksheets and group study sessionswill be used. Students also need to improve their notation,so more guidance will be given to model appropriatenotation and justifications.
Program Review Reporting Year: 2014-2015Target : Target Met72% of students correctly analyzed different series forconvergence on an in class quiz, receiving 70% or higher(10/31/2014)
Reflection (CLICK ON ? FOR INSTRUCTIONS): Continue oureffort
Program Review Reporting Year: 2014-2015Target : Target MetMost students can do 70% the related questions correctly(07/27/2014)
Exam - Course Test/Quiz - testquestions related to the SLO onquizzes and tests
Reflection (CLICK ON ? FOR INSTRUCTIONS): Throughclassroom discussions and homework practices, studentsare able to grasp the concepts
Enhancement: some studentsneed to find time to strengthentheir algebra skills (09/28/2015)
Program Review Reporting Year: 2014-2015Target : Target MetExam 2 covers the SLO_1, and class average is 76%(07/26/2015)
Exam - Course Test/Quiz - Exam 2
09/19/2019 Page 86 of 318Generated by Nuventive Improve

Student LearningOutcomes (SLOs) Assessment Methods Assessment Data Summaries Enhancements
Target for Success: 80% of studentspassing the exam with a grade of70/100 or higher.
Reflection (CLICK ON ? FOR INSTRUCTIONS): I believe theassessment was not challenging enough and does notaccurately reflect a deeper understanding of sequences andseries.
Program Review Reporting Year: 2015-2016Target : Target Met93% of students passed the exam with a grade of 70/100 orhigher. (07/12/2016)
Exam - Course Test/Quiz - Exam 1
Target for Success: At least 60% ofthe class answering this questioncorrectly.
Reflection (CLICK ON ? FOR INSTRUCTIONS): I thinkstudents had trouble understanding how variousjustifications for showing a series/sequenceconverged/diverged should be written up.
Enhancement: Next time I teachthis course, I intend to givehandouts going into greater detailfor the various methods forshowing convergence/divergenceand how to write them up.(07/06/2019)
Program Review Reporting Year: 2018-2019Target : Target Not MetThe average score on this question was 9.2/15.(07/06/2019)
Reflection (CLICK ON ? FOR INSTRUCTIONS): I wasgenerally happy with the way the students answered thisquestion, especially considering that this was the firstquestion on the final exam.
Enhancement: Possibly tellstudents to read over the entireexam slowly and carefully beforeanswering the various questions. Ifelt as though the work by the fewstudents who did not do well onthis question was rushed.(02/25/2019)
Program Review Reporting Year: 2018-2019Target : Target MetOf the 33 students who took the final exam, 28 of themanswered this question correctly. This means that roughly85% of the class answered this problem correctly.(02/25/2019)
Exam - Course Test/Quiz - Questionfrom the final exam asking them todetermine if a given infinite serieswas convergent or not. Studentshad to explain what test/theoremsthey were using to determine theconvergence of the series.
MATH1C_SLO_2 - Apply infinitesequences and series inapproximating functions.SLO Status: Active
Target for Success: The quiz wasscored out of 20 points. Due to thecomplexity of the questions a scoreof 12 or above is considered passing.The target for success in thisassessment is to have at least 80% ofthose students completing the
Reflection (CLICK ON ? FOR INSTRUCTIONS): The problemwas on alternating series. I feel I could have done moreusing the integral test.
Enhancement: Spend more timediscussing how Riemann sums canbe used to create upper and lowerbounds for both finite and infiniteseries. (07/06/2019)
Program Review Reporting Year: 2018-2019Target : Target Met26 of 32 students taking the quiz got a passing grade.(07/08/2019)
Enhancement: Try to increase thefocus on approximation and errorbound throughout the material onseries, so that students are morefamiliar with it when we come toTaylor polynomials. (10/14/2016)
Program Review Reporting Year: 2014-2015Target : Target Not Met18 of the 34 students who finished the course received apassing grade. (53%) The average score was a 11.2. Thereseems to be limited correlation between those who did wellon this SLO and those who passed the class. When
Exam - Course Test/Quiz - Studentswere given quiz where they had touse Taylor polynomials toapproximate two different functionsand then they had to analyze theerror of their approximations.
09/19/2019 Page 87 of 318Generated by Nuventive Improve

Student LearningOutcomes (SLOs) Assessment Methods Assessment Data Summaries Enhancements
course, passing the exam.
Reflection (CLICK ON ? FOR INSTRUCTIONS): Studentscontinue to have problems with the use of polynomials toapproximate functions. They seem to be at war with theirown sense of Math as a class of absolutes as opposed toapproximates. Inequality arguments continue to give themproblems. Despite introducing a review of what it means tobound a function, students still couldn’t keep straight whenthey need to take derivatives and when they didn’t. Thetendency to insist on plugging in endpoints continues.
considering only those students who passed the class, thesuccess rate only raises to 65%. (10/14/2016)
Reflection (CLICK ON ? FOR INSTRUCTIONS): Troublepersists when working with inequalities. Students seemresistant to the use of facts as opposed to equivalences.They seem to have trouble synthesizing what they know.Calculus students have a strong resistance to argumentsthat they view as being based on algebra rather than basedon calculus. Although the target was not met, I was pleasedwith the overall level of success and believe it can beimproved upon in the future.
Enhancement: In order to find anerror bound on a Taylorpolynomial, students need tobound a derivative of the function.Students have trouble graspingwhat it means to bound afunction. Perhaps if a “review” ofbounding functions preceded thediscussion of error bounds,students might feel morecomfortable bounding derivatives.This would allow time to focus onthe difference between bounds,upper and lower bounds,maximums, and maximums ofmagnitudes. A betterunderstanding of the vocabularyshould help the students focus onwhat they are trying to do.(05/01/2015)
Program Review Reporting Year: 2013-2014Target : Target Not Met24 of the 32 students who finished the course and took thequiz received a passing grade. (75%) The average score wasa 14.4. Of the 8 who did not pass, 7 showed some level ofunderstanding, scoring between 40% and 50%.(10/21/2014)
Program Review Reporting Year: 2012-2013Target : Target MetOut of the 26 students completing the course, only 25 ofthem were there to take the quiz. Out of this subset of 25students, 20 passed the quiz. The average score on the quizwas 14.5 out of 20. (It should be noted that one of thestudents who did not pass arrived to class with only 2minutes left on the 20 minute quiz. Ignoring that score of 2,
09/19/2019 Page 88 of 318Generated by Nuventive Improve
Student LearningOutcomes (SLOs) Assessment Methods Assessment Data Summaries Enhancements
Reflection (CLICK ON ? FOR INSTRUCTIONS): Althoughstudents hated the lab that was created to help improvetheir understanding of using Taylor polynomials toapproximate functions, it did seem to improve theirunderstanding of the process. Students still struggle withthe conditional nature of Taylor’s inequality and inequalityarguments in general. Although these roadblocks persist, Iwas pleased to observe an increased awareness of theseobstacles.In addition to the lab on error bounds, students were aidedby the overall framework that was given to the material(focus on how to integrate functions we know areintegrable but we do not know what that integral is.) It alsoseemed to help that I deviated from the text, presentingTaylor polynomials before the Taylor series.
the average would raise to 15) (07/26/2013)
Reflection (CLICK ON ? FOR INSTRUCTIONS): Students hada great deal of trouble working with the conditionalstatement involved with Taylor’s inequality. There waswide-spread belief that to bound the n+1 derivative,students need only plug in the endpoints of the interval.Students are particularly uncomfortable working withinequality arguments despite having seen similararguments when covering the squeeze theorem and thecomparison test. Part of the problem may be attributable toan over reliance on examples where the derivative is eitherincreasing or decreasing.
Enhancement: Develop moreexamples where the bound cannotbe found at an endpoint. Create alab assignment based onpolynomial approximation anderror bounds to ensure thatstudents get a better feel for thedetails. Increase emphasis onapproximations when dealing withseries prior to the introduction ofpower series. (05/01/2013)
Program Review Reporting Year: 2012-2013Target : Target Not MetOut of the 25 students completing the course, 19 of thempassed the quiz. The average score on the midterm was13.9 out of 20. (05/01/2013)
Target for Success: 70% students willcorrectly do these questions Reflection (CLICK ON ? FOR INSTRUCTIONS): Assign more
homework to have students practice their algebra skills.
Program Review Reporting Year: 2012-2013Target : Target Metabout 71% students had the correct concepts to do theproblems. Some made algebraic errors (01/14/2013)
Exam - Course Test/Quiz - 4questions on exam 3 related to theSLO
09/19/2019 Page 89 of 318Generated by Nuventive Improve
Student LearningOutcomes (SLOs) Assessment Methods Assessment Data Summaries Enhancements
Target for Success: As before, a 60 %target was used. For both parts ofthe exam, 8 out of 15 and 9 out of 15met the target.Comments/Notes: From some of thewritten work on the exam, it looks asif some students tried to deriveeverything (as if using the first partof the chapter all over again), ratherthan taking advantage of derivativeor integration of a function toproduce a new function. Studentsdid well on particular problems thatrequired computing the amount oferror or the number of termsneeded to achieve a certainaccuracy.
Exam - Course Test/Quiz - A two-part exam was given covering thesecond half of ch. 11 (materialcommensurate with SLO-2). Onepart was an in-class exam, the otherwas a takehome set of problemscovering power series for variousfunctions and their intervals & radiiof convergence.
Target for Success: 70% of studentsgetting 70% or higher on the quiz(7/10).
Reflection (CLICK ON ? FOR INSTRUCTIONS): Studentsperformed better in this quiz vs the first test. They feltmore comfortable with the material and have a betterunderstanding of the series. The quiz was a lot morefocused which allowed the students to prepare better for it.
Program Review Reporting Year: 2013-2014Target : Target Met19 out of 27 students (about 70%) of the students receiveda grade of 7 out of 10 or higher. (01/19/2014)
Exam - Course Test/Quiz - Quiz 4was focused on using infinite seriesto approximate a function.
Target for Success: 60%
Reflection (CLICK ON ? FOR INSTRUCTIONS): Continue our
Program Review Reporting Year: 2014-2015Target : Target MetOver 60% of the class show understanding of the topics ontests (07/27/2014)
Exam - Course Test/Quiz - Quizzes,exam 3 and final
09/19/2019 Page 90 of 318Generated by Nuventive Improve

Student LearningOutcomes (SLOs) Assessment Methods Assessment Data Summaries Enhancements
effort to improve
Target for Success: 70% of studentsreceive a 70% or better on thequestion.
Reflection (CLICK ON ? FOR INSTRUCTIONS): Students needmore practice with integrating and differentiating known PSrepresentations to obtain additional representations. Morepractice with creating PS representations is needed.
Program Review Reporting Year: 2014-2015Target : Target Not Met43% of students correctly created the power seriesrepresentation for a given function, receiving a 70% orbetter (12/11/2014)
Reflection (CLICK ON ? FOR INSTRUCTIONS): Studentsadequately understood topics around functionapproximation. I would like to structure a quiz solelyaround this slo to get a more granular knowledge ofstudent understanding to further refine lecture.
Program Review Reporting Year: 2014-2015Target : Target MetThere were two questions on final exam related to slo 2which 43 students took. Out of 86 total answers, 66 werecorrect of a 76.7% pass rate. (12/10/2014)
Exam - Course Test/Quiz - Questionon final exam.
Reflection (CLICK ON ? FOR INSTRUCTIONS): Studentscompleted the related homework assignment also did wellon the test.
Enhancement: How can we helpstudents to find the time to dotheir homework? (07/26/2015)
Program Review Reporting Year: 2014-2015Target : Target Met80% students did well on the topics (07/26/2015)
Exam - Course Test/Quiz -Homework and test
Reflection (CLICK ON ? FOR INSTRUCTIONS): I was fairlypleased with how many of these questions students cameup with on their own and answered correctly. I believe thatthis translated to students doing better on this material on
Enhancement: For future boardquizzes in Math 1c, I will create alist of a few more involvedproblems that apply infinite seriesto approximating functions andmake sure that at least a threegroups commit to answering thequestions on that list of problemsthat I create. (02/25/2019)
Program Review Reporting Year: 2018-2019Target : Target MetAt the time of the second board quiz, there were 42students enrolled in the course. 34 of those studentscreated at least one question and solution that askedstudents to apply infinite sequences and series in order toapproximate functions. This means that about 81% of theclass understood how to answer a question involvingapplications of infinite series to approximate functions.(02/25/2019)
Exam - Course Test/Quiz - I used mysecond board quiz as my assessmentmethod. For board quizzes, studentsneed to form groups of 2-4 students,create two questions and twosolutions to those questions, andthen share those questions andsolutions with the rest of the class.
For this board quiz, I noticed that atleast 10 groups created questionsthat ask students to find and/orapply power series expansions ofcommon functions to solve a
09/19/2019 Page 91 of 318Generated by Nuventive Improve
Student LearningOutcomes (SLOs) Assessment Methods Assessment Data Summaries Enhancements
Target for Success: At least 70% ofthe class.
the second midterm.problem.
MATH1C_SLO_3 - Synthesize andapply vectors, polar coordinatesystem and parametricrepresentations in solving problemsin analytic geometry, includingmotion in space.SLO Status: Active
Target for Success: The exam wasscored out of 54 points. Due to thecomplexity of the questions a scoreof 32 or above is considered passing.The target for success in thisassessment is to have at least 80% ofthose students completing thecourse, passing the exam.
Reflection (CLICK ON ? FOR INSTRUCTIONS): Although, I amfailing to reach my target within the entire class, I am happyto see that I am meeting the target within those studentswho are passing the class, particularly for those who moveon to Math 1D where an understanding of this material isimportant. I find it interesting that this class scored higheston this material whereas my previous class scored loweston this material. I am unsure as to whether this reflectschanges I have made to my presentation of the material orwhether it reflects a different set of perspectives from thestudents. Half of the course is dominated by sequences andseries (which seems much more abstract to students) andthe second half of the course is dominated by geometricand physics considerations. It is not uncommon for astudent to lean one direction or another. If these results area reflection of this difference between students, how can Ibridge the gap between them?
Enhancement: Spend more timeinteracting with my fellow Calculusinstructors, particularly those whofall more on the geometric andphysics side of the material sincemy own inclinations lean towardsthe abstract.
(10/14/2016)
Program Review Reporting Year: 2015-2016Target : Target Not MetOut of the 34 students finishing the course only 21 of thempassed the exam. (62%). However, among those passing thecourse, 19 out of 23 passed this exam. (83%) The averagescore on this exam was a 70%.
(10/14/2016)
Reflection (CLICK ON ? FOR INSTRUCTIONS): Students havetrouble escaping the two-dimensional thinking that has
Enhancement: Reduce Midtermsfrom 45% of grade to 40% of gradeto allow for a 5% discussion gradeto increase discussionparticipation. Continue to developa stronger framework for thismaterial. Seek out applicationsthat are not physics based toprevent students from leaning on
Program Review Reporting Year: 2013-2014Target : Target Not Met: Out of the 34 students finishing the course only 19 ofthem passed the exam. (56%). Even among those passingthe course, only 18 out of 25 passed this exam. (72%) Theaverage score on this exam was a 65%.
(10/21/2014)
Exam - Course Test/Quiz - Studentswere given a midterm in which theyneed to use vector functions, polarequations, and parametricrepresentations to solve problemsinvolving planes, lines, curvature,area, and motion in space.
09/19/2019 Page 92 of 318Generated by Nuventive Improve

Student LearningOutcomes (SLOs) Assessment Methods Assessment Data Summaries Enhancements
served them so well until now. Even that is not entirelyaccurate, they have an insistence upon Cartesian thinking.There were two marked separations among students. Thosestudents with a physics background were more comfortableworking with vectors, but they wanted to jump to resultswithout reasoning. By contrast, those students without aphysics background had so much trouble with vectors thatthey often couldn’t get to the critical thinking parts of thequestions. The other major difference I noticed wasbetween those students who attended the discussions andthose who did not. Although some students who did notattend did quite well on the exam, they still had troublejustifying their work and others who did not attend wereextremely lost on some of the problems. Those who didattend discussion seemed to have a more even level ofcomprehension across the material and a betterunderstanding of how to communicate their work. I havestill not found the coherent framework I hope to find forthis half of the course. It has helped to link polar withparametric equations, parametric equations with vector-valued functions, and Kepler’s Laws with polar equations.
knowledge withoutunderstanding. (05/01/2015)
Reflection (CLICK ON ? FOR INSTRUCTIONS): Studentscontinue to show the most difficulty in working with thegeometric aspects of the course. Several studentsexpressed dislike and discomfort with graphing. Althoughvectors are covered in Math 43 and again in some physicscourses, not all of the students have exposure to thosecourses. Also, those who have taken physics classes areresistant to showing the work required of them, believingthat whatever was adequate for their physics class shouldbe fine in their calculus class. Students were remindedseveral times before the exam, that I would be looking for
Enhancement: Perhaps studentswould be able to cope with thediversity of questions in thegeometric parts of the coursebetter if that part of the coursewere given an all-encompassingframework similar to the onedeveloped for the first half of thecourse. (02/01/2014)
Program Review Reporting Year: 2012-2013Target : Target Not MetThe exam was scored out of 60 points. Due to thecomplexity of the questions a score of 36 or above isconsidered passing. Out of the 26 students completing thecourse, 20 of them passed the midterm. The average scoreon the midterm was 41.0 out of 60. (07/26/2013)
09/19/2019 Page 93 of 318Generated by Nuventive Improve
Student LearningOutcomes (SLOs) Assessment Methods Assessment Data Summaries Enhancements
different things than their physics instructors and thatcertain formulas were forbidden so that they coulddemonstrate an understanding of the relationships ofmotion from a rate of change perspective.The reworked discussions seemed to improve matterssignificantly, but there is still a way to go. Despite anemphasis on critical thinking skills throughout the quarter,students still want to memorize that "this problem" is "thattype of problem" and it should be done "this particularway". This problem is more pronounced as we work withvectors due to the diversity of situations that can bedescribed with vectors.
Reflection (CLICK ON ? FOR INSTRUCTIONS): Some weresurprised that the students did better with series than theydid with vector functions. Others had encountered similarsituations in the past. Series are alien to the students butthis strangeness may encourage them to study harder. Bycontrast, students are familiar with vectors from previousmath and physics courses, so they may take the material forgranted. There seems to be some difficulty in recognizingthat a variety of problems are related. The focus on how todo “a particular” problem interferes with getting a grasp ofthe broader topics.
Enhancement: Since studentsseemed to feel that thediscussions for sequences andseries were much more helpfulthan the discussions for vectorfunctions and coordinate systems,the discussions for the moregeometric sections need to beimproved. (06/28/2013)
Program Review Reporting Year: 2012-2013Target : Target Not MetOut of the 25 students completing the course, 17 of thempassed the midterm. The average score on the midterm was34.6 out of 54. (05/01/2013)
Reflection (CLICK ON ? FOR INSTRUCTIONS): Studentsseem to have more trouble with dimension 3 vectors. Spentmore time on the subject.
Program Review Reporting Year: 2012-2013Target : Target MetAbout 75% students did dimension 2 vector questions onthe exams correctly , about 68% students did bothdimension 2 and dimension3 vector questions on theseexams correctly. (01/14/2013)
Exam - Course Test/Quiz - Multiplequestions on both exam 1 and exam3
Exam - Course Test/Quiz - 'show-
09/19/2019 Page 94 of 318Generated by Nuventive Improve

Student LearningOutcomes (SLOs) Assessment Methods Assessment Data Summaries Enhancements
Target for Success: A score of 68 % istypically my target for success forany student on any minitest orexam. (just slightly above 2/3 of thevalue of the minitest or exam)Comments/Notes: For those whohad polar coordinates in Trig, orvectors in Physics, clearly this (andthe other) material was much easierthan the material on series andsequences.
your-work' exams were used for thechapters covering the material andconcepts in SLO-3. Average scoresfor the 18 students wererespectively 63, 70, & 79. Overall,2/3 of the students were at or abovethe average for any given test.
Target for Success: 70% of studentsgetting 70% or higher on their exam.
Reflection (CLICK ON ? FOR INSTRUCTIONS): Students areadequately undertanding this SLO but I would like to tailormore quizzes around individual pieces of this SLO to get abetter understanding of student understanding to betterfocus lecture.
Program Review Reporting Year: 2014-2015Target : Target Metout of 44 students who took exam 2, 32 received a passinggrade for a total pass rate of 32/44 = 72.7%. (11/05/2014)
Reflection (CLICK ON ? FOR INSTRUCTIONS): Students feltthe topics relied on materials from Math43, precalsulus,which some had low preparation for and had to review a lotmore. I will be devoting more days to these material andprovide students with handouts helping the review thematerial from the precalculus course.
Program Review Reporting Year: 2013-2014Target : Target Not Met18 out of 26 students, about 69%, received a grade of 70 orhigher. (01/19/2014)
Exam - Course Test/Quiz - Secondtest questions focused on usingvectors and polar/parametricrepresentations to solve problems.
Target for Success: 70%
Program Review Reporting Year: 2014-2015Target : Target MetAbout 72% students mastered the topics on the tests.
Exam - Course Test/Quiz - quizzes,exam 2
09/19/2019 Page 95 of 318Generated by Nuventive Improve

Student LearningOutcomes (SLOs) Assessment Methods Assessment Data Summaries Enhancements
Reflection (CLICK ON ? FOR INSTRUCTIONS): Keep up oureffort
(07/27/2014)
Target for Success: 70% of studentsreceive a 70% or better on thisquestion. Reflection (CLICK ON ? FOR INSTRUCTIONS): Students did
well on this question
Enhancement: Introduce materialon motion earlier, beforecurvature. (07/08/2019)
Program Review Reporting Year: 2018-2019Target : Target MetStudents averaged 10 out of 12 points on final examquestion on vectors. (07/06/2019)
Reflection (CLICK ON ? FOR INSTRUCTIONS): Students needmore practice with curvature. They were fine sketching,differentiating and sketching the derivative vectors, but hadtrouble with the curvature formula.
Program Review Reporting Year: 2014-2015Target : Target Met77% of students correctly sketched, differentiated andfound curvature of a space curve, obtaining a 70% or higheron this question. (12/11/2014)
Exam - Course Test/Quiz - Questionon final exam
Reflection (CLICK ON ? FOR INSTRUCTIONS): studentsapply themselves are able to understand the topics well.
Enhancement: Vectors andmotion in space maybechallenging for some. More timeto discuss the topics would behelpful (07/26/2015)
Program Review Reporting Year: 2014-2015Target : Target Met75% students pass the test (07/26/2015)
Exam - Course Test/Quiz - Test 1 andtest 3
Target for Success: 70% of the classanswering this problem correctly.
Reflection (CLICK ON ? FOR INSTRUCTIONS): I was glad tosee that so many students answered this question correctly,especially since a number of them had trouble with thesetypes of problems on one of the previous midterms in theclass.
Enhancement: Since so manystudents did really well on thisquestion, I might put a bit moreinvolved problem that is similar tothis one on a future final exam orrequire the students to convertthe equations of the circle andcardioid from rectangularcoordinates to polar coordinatesas an add extra step to thisproblem and test theirunderstanding of convertingbetween rectangular and polarcoordinates. (02/25/2019)
Program Review Reporting Year: 2018-2019Target : Target MetOf the 33 students who took the final exam, 28 of themanswered this question correctly. This means that about85% of the class got this problem correct. (02/25/2019)
Exam - Course Test/Quiz - On thefinal exam, I asked students tosketch the graphs of two curves, acircle and a cardioid, that were givenin polar coordinates. I then askedthem to find the enclosed areainside of the cardioid and outside ofsphere using an integral.
09/19/2019 Page 96 of 318Generated by Nuventive Improve
MATH 1D:Calculus
Student LearningOutcomes (SLOs) Assessment Methods Assessment Data Summaries Enhancements
MATH1D_SLO_1 - Graphically andanalytically synthesize and applymultivariable and vector-valuedfunctions and their derivatives, usingcorrect notation and mathematicalprecision.SLO Status: Active
Target for Success: My target forsuccess was for at least two thirds ofthe students taking the final to earnat least 75% of the available pointson at least four of the six problemsmentioned above.
Reflection (CLICK ON ? FOR INSTRUCTIONS): With 40 out of51 students demonstrating proficiency on this SLO, it wassuccessfully met.
Program Review Reporting Year: 2012-2013Target : Target MetAt least 75% of the available points on:6 problems - 12 students5 problems - 13 students4 problems - 15 students3 problems - 6 students2 problems - 3 students1 problem - 2 students (05/02/2013)
Exam - Course Test/Quiz - Problems1a, 1b, 2, 5, 7 and 10 on the finalexam relate to this SLO.
Target for Success: At least 70% ofthe students passing Exam 1. Reflection (CLICK ON ? FOR INSTRUCTIONS): 28 of the 40
students (70%)passed the Exam 1. 81% of the studentswere quite competent in explaining both the geometric andthe physical interpretation of partial derivatives. Inproblems relating to three-dimensional surfaces that areanalogous to mountain ranges, 62% were able to evaluatedirectional derivatives, but were unable to analyze thesteepness and rates of ascent and descent in particularcompass directions. Furthermore, this group was unable touse gradient vectors to find trajectories of heat seekingobjects.
Enhancement: I will provide morerealistic problems from a widerrange of fields that require notonly the understanding of theconcepts, but also theinterpretation of results.(02/04/2014)
Program Review Reporting Year: 2013-2014Target : Target MetTwenty-eight out of 40 (70%) students passed Exam 1.(01/29/2014)
Exam - Course Test/Quiz - Evaluatethe percentage of students passingExam 1.
Target for Success: 70% of studentspass the test with a grade of 70 orhigher.
Reflection (CLICK ON ? FOR INSTRUCTIONS): Students didvery well. Although the time to learn the material wasrather short the course met the target.
Enhancement: I would like toinclude more graphical approachin the test in the future.(10/08/2017)
Program Review Reporting Year: 2016-2017Target : Target MetOut of 42 students 41 of them passed the test (74%).(10/08/2017)
Exam - Course Test/Quiz - I will usethe First test performance for thisSLO as the topics were based onthese objectives.
Enhancement: The next time Iteach the class, I could ask thestudents to verify that mixed
Program Review Reporting Year: 2017-2018Target : Target MetAround 94% of the students answered this question
Exam - Course Test/Quiz - On thefinal exam, I asked students tocompute the partial derivatives with
09/19/2019 Page 97 of 318Generated by Nuventive Improve

Student LearningOutcomes (SLOs) Assessment Methods Assessment Data Summaries Enhancements
Target for Success: At least 90% ofthe students answering this problemcorrectly.
Reflection (CLICK ON ? FOR INSTRUCTIONS): Almost theentire class answered this question correctly. This was thevery first question on the final exam and was meant to givethe students a mental boost and help build their confidencefor the exam.
partial derivatives of thecommute. (08/28/2018)
correctly. (08/28/2018)respect to the variables x and y forf(x,y) = (y + 2e^(3x))ln(x^2 + 4) +tan(x^3 + 5y + 1)
MATH1D_SLO_2 - Use double, tripleand line integrals in applications,including Green's Theorem, Stokes'Theorem and Divergence Theorem.SLO Status: Active
Target for Success: I judge successon this SLO to be for at least twothirds of the students taking the finalexam to earn at least 75% of thepossible points on at least 5 of the 8problems listed above.
Reflection (CLICK ON ? FOR INSTRUCTIONS): The target forthis SLO was met, but just barely. I will work to improve myteaching of these topics the next time I teach Math 1D.
Program Review Reporting Year: 2012-2013Target : Target MetEarning at least 75% of the possible points on...8 problems - 6 students7 problems - 14 students6 problems - 8 students5 problems - 7 students4 problems - 5 students3 problems - 2 students2 problems - 6 students1 problem - 1 student0 problems - 2 students (05/02/2013)
Exam - Course Test/Quiz - Problems3a, 3b, 4a, 4b, 6, 8, 9 and 11 on thefinal exam addressed this SLO.
Target for Success: At least 70% ofthe students passing Exam 2.
Reflection (CLICK ON ? FOR INSTRUCTIONS): In this course,we extended the basic ideas of differential and integralcalculus to functions of two or more variables. Moststudents had no problem evaluating partial derivatives andmultiple integrals. In Exam 2, 84% of the students were ableto evaluate double and triple integrals, but only 64% wereable to set up triple integrals to find the volume boundedby several surfaces. And only 58% were able to evaluatetriple integrals using only geometric interpretation andsymmetry.
Enhancement: Assign moreproblems that require bothgraphing surfaces, and to set uptriple integrals to find volumebounded by such surfaces.(02/24/2014)
Program Review Reporting Year: 2013-2014Target : Target Met26 of the 36 (72%) students passed Exam 2. (02/20/2014)
Exam - Course Test/Quiz - Evaluatethe percentage of students passingExam 2
Target for Success: 70% of studentsget a passing grade of 70 or higher. Reflection (CLICK ON ? FOR INSTRUCTIONS): The class did
Enhancement: For future courses Iwill be using more worksheets andput more time between the lastday to cover the material and the
Program Review Reporting Year: 2016-2017Target : Target Metout of 42 students 30 of them passed the test (71%).(10/08/2017)
Exam - Course Test/Quiz - Oursecond test covered the objectives inthis SLO.
09/19/2019 Page 98 of 318Generated by Nuventive Improve

Student LearningOutcomes (SLOs) Assessment Methods Assessment Data Summaries Enhancements
well but I think with more practice they could have doneeven better. Maybe the time between covering the materialand the test was not long enough.
day of the test. (10/08/2017)
Target for Success: I anticipated thatat least 70% of the students shouldanswer this question correctly.
Reflection (CLICK ON ? FOR INSTRUCTIONS): Even thoughmy target was met, there were more students than Iexpected who made a few errors in setting up the doubleintegral.
Enhancement: Next time I teachthe class, I need to make sure Ispend a little bit more timecovering the surface area ofsurfaces. (08/28/2018)
Program Review Reporting Year: 2017-2018Target : Target MetExactly 80% of the class answered this exercise correctly.(08/28/2018)
Exam - Course Test/Quiz - On thefinal exam, I asked the students thefollowing: Setup, but do notevaluate, the double integral for thesurface area of the helicoidr(u,v) = <u cos(v), u sin(v), v> for 0 <=u <= 2 and 0 <= v <= 4 pi.
MATH1D_SLO_3 - Synthesize the keyconcepts of differential, integral andmultivariate calculus.SLO Status: Active
Target for Success: I considersuccess to be for at least two thirdsof the class to earn at least 75% onthe final exam.
Reflection (CLICK ON ? FOR INSTRUCTIONS): The targetwas almost met. I will strive to improve its teaching thenext time I teach Math 1D.
Program Review Reporting Year: 2012-2013Target : Target Not Met32 students scored at least 90 out of 120 on the final exam.19 students did not. (05/02/2013)
Exam - Course Test/Quiz - Looking atthe overall grade on the final exam.
Target for Success: At least 75% ofthe students passing Exam 3
Reflection (CLICK ON ? FOR INSTRUCTIONS): 27 of the 35(77%) students passed Exam 3. 72% of students were ableto determine a particular line integral was independent ofpath and hence use the short-cut by applying theFundamental Theorem of line integrals, on the other hand,85% of the students failed to test for independence and didthe problem directly – a significant challenge. This was alsotrue in application of Green’s Theorem and DivergenceTheorem as some students failed to see that thesetheorems were not a mere convenience, but a necessity inevaluating more challenging line integrals.
Enhancement: I need to do moreproblems where the students areasked to make correct choicesbefore actually attempting theproblem. (03/28/2014)
Program Review Reporting Year: 2013-2014Target : Target MetOver all 77% of the students passed the Exam84% correctly evaluated line integrals.68% used proper theorems in evaluating line integrals. (03/13/2014)
Exam - Course Test/Quiz - Evaluatethe percentage of students passingExam 3.
Enhancement: I would startProgram Review Reporting Year: 2016-2017Exam - Course Test/Quiz - The third
09/19/2019 Page 99 of 318Generated by Nuventive Improve

Student LearningOutcomes (SLOs) Assessment Methods Assessment Data Summaries Enhancements
Target for Success: 70% of studentsget a grade of 70 or higher. Reflection (CLICK ON ? FOR INSTRUCTIONS): The success
was well below expected. Chapter 16 which is tested in thisexam is a very difficult chapter for students that covers a lotof material and theory. The result are probably normal forthe class but it could be better.
covering the material in thissection a little sooner mixing withother topics to make it morenatural for students.(10/08/2017)
Target : Target Not Met23 out of the 42 students taking this exam passed it (55%)(10/08/2017)
exam covered the materialconcerning this SLO.
Target for Success: At least 70% ofthe students answering this problemcorrectly.
Reflection (CLICK ON ? FOR INSTRUCTIONS): On the firstmidterm, I put a partial differential equations problem onthe exam and a number of students had a difficult timeanswering the question correctly. After seeing that almostthe entire class answered this problem correctly, I decidedto put another PDE problem on the final. I was pleasantlysurprised to see the entire class do much better and learnfrom their mistakes.
Enhancement: Next time I teachthe class, I will be sure toemphasize the importance ofthese types of questions and howthey incorporate a lot of thedifferent multivariabledifferentiation rules. (08/28/2018)
Program Review Reporting Year: 2017-2018Target : Target MetAround 91% of the students answered this questioncorrectly. (08/28/2018)
Exam - Course Test/Quiz - On thefinal exam, I asked the students thefollowing: Show that the functionf(x,t) = sin(x + 3t) + cos(2x + 6t) is asolution to the wave equationf_tt = 9 f_xx.
09/19/2019 Page 100 of 318Generated by Nuventive Improve

MATH 201:Pre-Algebra Refresher
Student LearningOutcomes (SLOs) Assessment Methods Assessment Data Summaries Enhancements
MATH201_SLO_1 - Place, via test atPlacement Office, into a mathematicscourse above Math 210.SLO Status: Active
Target for Success: 50%Exam - Standardized - Exit Test
09/19/2019 Page 101 of 318Generated by Nuventive Improve
MATH 202:Beginning Algebra Refresher
Student LearningOutcomes (SLOs) Assessment Methods Assessment Data Summaries Enhancements
MATH202_SLO_1 - Place, via test atPlacement Office, into a mathematicscourse above Math 212.SLO Status: Active
09/19/2019 Page 102 of 318Generated by Nuventive Improve
MATH 203:Intermediate Algebra Refresher
Student LearningOutcomes (SLOs) Assessment Methods Assessment Data Summaries Enhancements
MATH203_SLO_1 - Place, via test atPlacement Office, into a mathematicscourse above Math 114.SLO Status: Active
09/19/2019 Page 103 of 318Generated by Nuventive Improve

MATH 210:College Math Preparation Level 1: Pre-Algebra
Student LearningOutcomes (SLOs) Assessment Methods Assessment Data Summaries Enhancements
MATH210_SLO_2 - Demonstrate andapply the knowledge and skillsrequired to select the correctintroductory formulas, procedures,and concepts from algebra andgeometry and use them to solveproblems.SLO Status: Active
Target for Success: At least 80% ofstudents should answer thisquestion correctly.
Reflection (CLICK ON ? FOR INSTRUCTIONS): For the firsttwo questions, I was quite happy that a large percentage ofthe students answered these correctly. Leading up to thefinal exam, I did a large number of "flash back" problemsinvolving linear equations and stressed that the studentswill have to have a solid understanding of how to solvelinear equations in order to be successful in Math 212(beginning algebra). This probably meant that the studentsunderstood the importance of studying these types ofproblems.
Enhancement: Next time I teachMath 210, I will try to push thestudents to do slightly harder andmore involved linear equationexercises. The goal is to create astrong algebra foundation for thestudents. I will also try toincorporate more applicationproblems involving linearequations. This will help thestudents understand how to setupand solve linear equations in theirfuture mathematics classes.(12/21/2017)
Program Review Reporting Year: 2016-2017Target : Target MetA total of 29 students took the final exam. Out of thosestudents, 24 answered the first problem correctly (around83%) and 27 answered the second problem correctly(around 93%). (12/21/2017)
Reflection (CLICK ON ? FOR INSTRUCTIONS): I was satisfiedto see that more than 70% of the class answered thisquestion correctly. When I initially covered percentincrease and percent decrease, a number of the studentshad a difficult time with the topic. As a result, I added moreapplication problems to their in-class group work, and I alsodid a number of similar questions during the final reviewsessions at the end of the quarter.
Enhancement: Next time I teachthe class, I will be sure to add inmore application examples at thevery beginning of the percentincrease and percent decreasesection to help students see theutility in learning this topic.(12/21/2017)
Program Review Reporting Year: 2017-2018Target : Target MetA total of 17 students took the final exam. Out of thosestudents, 13 answered this problem correctly (about 76%).(12/21/2017)
Reflection (CLICK ON ? FOR INSTRUCTIONS): I used a lot ofclass time( group activities) to practice order of operationsproblems with class. Many students improved in this areagreatly, while others still had difficulty understanding
Program Review Reporting Year: 2012-2013Target : Target Not Met34 out of 50 students answered this question correctly.(01/26/2013)
Exam - Standardized - Question 2 onfinal exam required students tocorrectly simplify an algebraicexpression by using the order ofoperations.
09/19/2019 Page 104 of 318Generated by Nuventive Improve

Student LearningOutcomes (SLOs) Assessment Methods Assessment Data Summaries Enhancements
mathematical notation. I think that giving students moreproblems to practice would help with mastery.
Target for Success: At least 2/3 ofthe students in the class should beable to score 13 or more points outof 18 on these three problems.
Reflection (CLICK ON ? FOR INSTRUCTIONS): I willendeavor to improve my teaching of this area the next timeI teach Math 210.
Program Review Reporting Year: 2012-2013Target : Target Not Met18 out of 41 students scored at least 13 points out of the 18possible on these four problems. The other 23 studentsscored 12 or fewer. (11/23/2013)
Exam - Course Test/Quiz - Problems13, 14, 15 and 18 on the final exam,worth a total of 18 points, wererelevant to this SLO.
Target for Success: At least 2/3 ofthe students on the final average a70% for these questions.
Reflection (CLICK ON ? FOR INSTRUCTIONS): Target notmet, but was close. Many students came very close toaveraging at least a 70% on the 5 questions.
Program Review Reporting Year: 2013-2014Target : Target Met11 out of the 21 students who took the final met the target.(01/03/2014)
Exam - Course Test/Quiz - 5 out of40 questions on the final wererelated to this SLO.
Target for Success: 60% or morestudents will get a passing grade.
Reflection (CLICK ON ? FOR INSTRUCTIONS): I was pleasedwith the number of students who received a passing gradeon this quiz. The method of instruction I used in classworked well to prepare the students for the quiz problems.
Program Review Reporting Year: 2013-2014Target : Target Met70% of the students received a passing grade on this quiz.(05/05/2014)
Exam - Course Test/Quiz - I gave thestudents a quiz that had 8 questionsthat asked them to find the area ofvarious shapes.
Target for Success: 70% of students Reflection (CLICK ON ? FOR INSTRUCTIONS): target wasmet
Program Review Reporting Year: 2013-2014Target : Target Met74% of students correctly outlined a step by step procedureand found the correct answer. (05/13/2014)
Exam - Course Test/Quiz - percent ofstudents correctly showing a logicalprocess and reaching a final solutionto an application problem.
Target for Success: 70%
Program Review Reporting Year: 2014-2015Target : Target MetStudents took exam 1 where various properties of fractionswhere used and ended with an application problem wherestudents needed to user correct formula to setup and solve.24 out of 30 students passed the exam with a score of 15+out of 21 or a 80% pass rate. (01/26/2015)
Exam - Course Test/Quiz - Gavestudents an exam using various skillsrelated to fraction and ultimatelyending with application problem.
09/19/2019 Page 105 of 318Generated by Nuventive Improve

Student LearningOutcomes (SLOs) Assessment Methods Assessment Data Summaries Enhancements
Reflection (CLICK ON ? FOR INSTRUCTIONS): Studentsadequately understood this SLO and in future classes willfocus more on application problems to understand if thereare other portions of this SLO that could be taught better.
Target for Success: 70% of studentsgetting at least 3 out of 4 points onthe problem
Reflection (CLICK ON ? FOR INSTRUCTIONS): studentsunderstood this problem and in future i would like to createan exam/quiz that focus just on these types of questions.
Program Review Reporting Year: 2014-2015Target : Target Metout of 29 students who took the quiz, 30 scored 3 or morepoints out of 4 on the problem so approximately 75% ofstudents satisfactorily answered this question. (06/26/2015)
Exam - Course Test/Quiz - For quiz5, students were asked to computethe percentage increase tuitionwhich required a 4 step approach.The question was worth 4 points
Target for Success: At least 70% ofstudent could achieve getting anaverage of 70% on those problems.
Exam - Course Test/Quiz - Looked atproblems on final exam thatrequired students to choose thecorrect formula to solve anapplication problem.
Target for Success: 60% of thestudents will get at least 70% ofthese questions correct Reflection (CLICK ON ? FOR INSTRUCTIONS): the target was
met
Program Review Reporting Year: 2017-2018Target : Target Met21 out of 30 students got these problems correct(11/03/2017)
Exam - Course Test/Quiz - 3Problems on Exam 3 used this SLO
Exam - Course Test/Quiz - For thefinal exam, I wanted to test how wellstudents understood how to applythe concepts for solving linearequations that had fractions,decimals, and a mixture of the twotypes of numbers together in asingle problem.
The following exercises were frommy final exam: Solve for x in thefollowing equations3/4x - 1/2 = -3 and 2.3 + .1(x + 2.9) =
09/19/2019 Page 106 of 318Generated by Nuventive Improve

Student LearningOutcomes (SLOs) Assessment Methods Assessment Data Summaries Enhancements
Target for Success: For the firstproblem, the students shouldunderstand how to isolate thevariable x and do arithmeticinvolving fractions. I anticipated80%-90% of the class would answerthis problem correctly.
For the second problem, I wanted tosee how students could extend whatthey did in the first exercise byapplying the distributive law in orderto isolate the x-term and apply theirknowledge of arithmetic withdecimals. I anticipated that around70%-80% of the class would answerthis correctly.
6.9
Target for Success: I anticipated thatat around 60%-70% of the classwould answer this problemcorrectly.
Exam - Course Test/Quiz - On thefinal exam, I wanted to see how wellthe students could apply theirknowledge of percent increase andpercent decrease to everydayproblems. My exam question is asfollows:
You go out to dinner at your favoriterestaurant, Breakfast, Brunch, andBeyond, and your check is for$17.80. You plan on leaving a 20%tip for your meal.How much money will you leave forthe check and tip?
MATH210_SLO_1 - Demonstrate andapply a systematic and logical
Program Review Reporting Year: 2012-2013Target : Target Not Met
Exam - Standardized - Question 37on final exam, which involved finding
09/19/2019 Page 107 of 318Generated by Nuventive Improve

Student LearningOutcomes (SLOs) Assessment Methods Assessment Data Summaries Enhancements
approach to solving arithmetic andgeometric problems.SLO Status: Active
Target for Success: At least 70% ofstudents will answer this questioncorrectly.
Reflection (CLICK ON ? FOR INSTRUCTIONS): Studentsstruggled with using the Pythagorean Theorem, especiallywith the idea of isolating and solving for a variable by takingthe square root of both sides. Students could havebenefited from more in-class practice to gain mastery.
22 out of 50 students answer this question correctly.(01/26/2013)
the missing leg of a right triangleusing the Pythagorean Theorem.
Target for Success: At least 2/3 ofthe students taking the final examshould score 75% or better on thefinal exam.
Reflection (CLICK ON ? FOR INSTRUCTIONS): The Target forsuccess was not close to being met. As a class, we spend agreat deal of time reviewing for the final. Generally,students do worse on the final than their average midtermscore. For this particular class, there was a cluster of highscores (above 85%) with the remainder of students fallingbelow 75%.
Program Review Reporting Year: 2013-2014Target : Target Not Met9 out of the 21 students who took the final scored at least a75% on the final. (01/03/2014)
Reflection (CLICK ON ? FOR INSTRUCTIONS): I willendeavor to do a better job teaching the material next timeI teach Math 210.
Program Review Reporting Year: 2012-2013Target : Target Not Met21 out of 41 students scored at least 75% on the final exam.20 out of 41 students did not. (11/23/2013)
Exam - Course Test/Quiz -Everything on the final exam relatesto this SLO.
Target for Success: 70% of answersshould be correct.
Reflection (CLICK ON ? FOR INSTRUCTIONS): need to workwith more applicatinons
Program Review Reporting Year: 2013-2014Target : Target Met72% of answers were correct (05/13/2014)
Exam - Course Test/Quiz - For quiz4, determine the cost of a rental carwith per day and per mileagecharges using a 5 step systematicapproach
Target for Success: 70%
Reflection (CLICK ON ? FOR INSTRUCTIONS): expandquiz/exam to cover multiple portions of logical/systematicsolving for both arthmetic/geo problems to get better
Program Review Reporting Year: 2014-2015Target : Target Met19 out of 24 students received a 7+ out of 10 on this quiz fora 79% pass rate. (02/18/2015)
Exam - Course Test/Quiz - Quiz 3focused on students combining liketerms and using the distributiveproperty, both of which studentsneed to follow systematic/logicalapproach to solving problems.
09/19/2019 Page 108 of 318Generated by Nuventive Improve

Student LearningOutcomes (SLOs) Assessment Methods Assessment Data Summaries Enhancements
understanding of gaps and re-foucs lecture.
Target for Success: 70% of studentspassing the exam.
Reflection (CLICK ON ? FOR INSTRUCTIONS): I would like todesign an exam/quiz that solely focuses on word problemsthat require students use systematic/logical approach toget a more granular breakdown of student understandingaround this SLO
Program Review Reporting Year: 2014-2015Target : Target MetOut of 36 students who took the exam, 27 received a passgrade or 75% of students passed. (06/26/2015)
Exam - Course Test/Quiz - Exam 1required students to usesystematic/logical approach to solveproblems with fractions and endedin a word problem requiring use offractions to get correct answer.
Target for Success: The class averageon Exam 3 was at least a 70%.
Exam - Course Test/Quiz - Look atperformance on Exam 3 whichcovered solving equations andpercent application problems.
Target for Success: 75% of thestudents will get a 70% or higher onthese problems
Reflection (CLICK ON ? FOR INSTRUCTIONS): the target wasmet
Program Review Reporting Year: 2017-2018Target : Target Met23 out of 30 students received a 70% or higher on theseproblems. (11/03/2017)
Exam - Course Test/Quiz - 2problems on exam 2 covered thisSLO
Target for Success: I anticipated thatabout 70% of the class would answerthis question correctly.
Reflection (CLICK ON ? FOR INSTRUCTIONS): Overall, I wassatisfied with how students answered this problem. One ofthe biggest issues was with students applying thedistribution law correctly with the "-3" and changing thesigns of the terms inside of the parenthesis. This lastquarter, more students than I anticipated had a difficulttime changing the signs of the various terms inside of theparenthesis when solving linear equations. I was happy tosee that a number of the students who struggled with thisconcept earlier in the quarter were able to fix this problemfor the final exam.
Enhancement: Nest time I teachMath 210, I will make sure to domore examples in class to showthe students how to correctlychange the signs of the termsinside of the parenthesis. I alsoplan on assigning more homeworkquestions that require thestudents to be careful with howthey change the signs of the termswithin the parenthesis.(12/21/2017)
Program Review Reporting Year: 2017-2018Target : Target MetA total of 17 students took the final exam. Out of thosestudents, 12 answered the problems correctly (around71%). (12/21/2017)
Exam - Course Test/Quiz - On myfinal exam, I asked students to solvea linear equation that had integercoefficients. The problem was thefollowing:
Solve for x in the equation 2 - 3(x+5)= 7x + 10
09/19/2019 Page 109 of 318Generated by Nuventive Improve

MATH 212:College Math Preparation Level 2: Beginning Algebra
Student LearningOutcomes (SLOs) Assessment Methods Assessment Data Summaries Enhancements
MATH212_SLO_1 - Evaluate real-world situations and distinguishbetween and apply linear andquadratic function modelsappropriately.SLO Status: Active
Target for Success: Although a targetof 70% seems like a natural goal todetermine if students sufficientlyunderstand this student learningoutcome, it ignores the extra stressand anxiety placed upon studentswhen taking a cumulative exam thatrepresents 30% of their grade. Forthis reason, I have set the target forsuccess at 60%. The past three Math212 classes I have taught have seenabout two thirds of those taking thefinal passing the course. For thisreason my target for success is that70% of those students taking thefinal will score 27 points or higher onthe last six questions of the final.
Reflection (CLICK ON ? FOR INSTRUCTIONS): This was adifficult quarter with difficult outcomes. In reflecting withmany different people, I found that Spring is often adifficult quarter for developmental math students.However, when I compare the data with the assessmenttaken in Fall of 2012, I see only a drop of 12%. There seemsto be a fundamental disconnect between the mathproblems and their real world applications. The largestproblem encountered this quarter was studentengagement. Even with participation an active part of theirgrade it was difficult to maintain attendance particularly inthe noon section. As students performed generally morepoorly in this quarter than during previous times I havetaught the class it is difficult to pinpoint what else wasdifferent. Students seemed to have trouble holding ontomaterial from one exam to the next.
Enhancement: To distinguishbetween different function modelsstudents need to be able toremember how to work with eachof them. Since students areforgetting material as it is taught, Iwill try to implement more circularreview in the future.
(01/12/2015)
Program Review Reporting Year: 2013-2014Target : Target Not MetOut of the 45 students across two classes who took thefinal, only 11 of them received a score of 27 or better. Only24% of students met the target. (10/20/2014)
Reflection (CLICK ON ? FOR INSTRUCTIONS): The reasonthat I did not meet the success target was mainly do to thepractice exam that I gave them a week before the examdate in order for them to study it during the weekend. OnMonday before the exam date I asked them if there are anyquestions on the practice exam and only couple of them
Program Review Reporting Year: 2012-2013Target : Target Not MetTo understand and translate word problems in tomathematical equations and then use of the concepts andideas (formulas) covered in Math 212, solve the problems.The Method of assessment was an exam on November 29/2012 for 26 students base on word problems andapplications. The success target was set for 70% and theactual outcome was only 65%. So, the target was not met(02/04/2013)
Exam - Course Test/Quiz - The onlytime that the students encounterapplications in a mixed context(linear models, quadratic models,and linear systems) is on the finalexamination. The last six questionson the final were a scrambled mix ofthese applications with eachcategory being waited equally. Thequestions were scored out of acombined 45 points.
09/19/2019 Page 110 of 318Generated by Nuventive Improve
Student LearningOutcomes (SLOs) Assessment Methods Assessment Data Summaries Enhancements
needed help. Even though, I had solved few of the problemin class I did not put strong emphasis on the importance ofpracticing the practice exam.
Reflection (CLICK ON ? FOR INSTRUCTIONS): The results ofthis assessment was demoralizing particularly whenconsidering the increased emphasis placed on applicationsthis quarter over previous quarters. In trying to understandwhere the gap was occurring I went back through thematerials. Two thirds of the SLOs emphasize applications.Applications account for one quarter of the studentsgrades. One out of every six lecture hours was dedicated toapplications. One out of eight sections covered in the textemphasized applications. There seems to be a gap betweenthe pedagogy for the course and the expectations. It wouldalso be remiss not to consider the fact that this assessmentis based on the very last questions considered in the course.The last six problems on the exam were far and away themost skipped questions on the exam. However, theapplications are placed last to keep from discouragingstudents during their final and promoting the best possibleresults for the students.
Enhancement: Restructure thecourse to introduce applicationsbefore students have learned tosolve them, so that the process oflearning algebraic techniquesremains grounded in the real-world applications. (09/23/2013)
Program Review Reporting Year: 2012-2013Target : Target Not MetOut of 77 students enrolled in two Math 212 sections, 66took the final. The scores ranged from 0 to 45 with anaverage score of 23.7. Only 36% of students me the targetscore of 27 or above. Since the average score was 53%, wealso looked at the percentage of students who scored 50%or above. This lowered criterion still only found 56% ofstudents meeting the target. (12/13/2012)
09/19/2019 Page 111 of 318Generated by Nuventive Improve

Student LearningOutcomes (SLOs) Assessment Methods Assessment Data Summaries Enhancements
Target for Success: 70% of studentswill get better than 70% on theproject.
Project - Project 1 - Linear Equations:Determine Three different equationsof lines through data in scatterplotof data. (Two they pick any twopoints from the given data and findthe line through the points. On thethird they find the 'best fit' line byeyeballing the points.)
Target for Success: At least 70%ofthe students would earn 70% orbetter.
Reflection (CLICK ON ? FOR INSTRUCTIONS): The resultsmay have been confounded by the fact that out of a class of39 only 18 students showed up consistently. This meansthat students who missed lecture and never caught up withnotes or handouts/computer assignments produced verylow scores. Since students struggle with applications I needto spend more time breaking down the wording so thatstudents know which type of model to apply.
Program Review Reporting Year: 2013-2014Target : Target Not MetOnly 62% of the class earned scored 70% or better.Students were able to distinguish between Linear andQuadratic functions and Evaluate values in the setting of avery similar problem presented in lecture but did verypoorly at applying either function models when theapplication was not extremely similar to any shown in class.Roughly 50% of the quiz takers left the two applicationproblems blank (04/16/2013)
Exam - Course Test/Quiz - Therewere 8 open ended questions. Somewere short such as finding the costof an item on sale with taxes.Students were given 25 min. andthen 5 min. to discuss with a partner.
Target for Success: Each group is
Reflection (CLICK ON ? FOR INSTRUCTIONS): In this firstattempt to address this SLO in a non-traditional Algebraclass I only chose 3 familiar real-life relationships. I should
Program Review Reporting Year: 2012-2013Target : Target MetAll groups were able to determine which type of variationfit each problem. Approximately 1/4 of the groups (2-3students) needed assistance analyzing the data todetermine if the relationship was linear, quadratic orneither. (08/04/2013)
Other - Students were presentedwith familiar real-life examplesinvolving two variables and data.Each group should be able toeffectively communicate (eitherwritten or verbal) what type ofmodel made sense and then analyzetheir data to decide if the data sortof fit the model (scatter plot).
09/19/2019 Page 112 of 318Generated by Nuventive Improve

Student LearningOutcomes (SLOs) Assessment Methods Assessment Data Summaries Enhancements
able to justify their decision andshow how they used the data todetermine if the relationship waslinear, quadratic or neither.
include more so that there is not just one of each type. Thegroup presentations relieved the stress of presenting andallowed students to discuss mathematical concepts. I willcontinue this way of assessing this SLO.
Target for Success: I expect 80% ofthe students to be able to accuratelydefine the variables, 70% of thestudents will be able to get the twoof the 4 inequalities needed, 70%graph and shade the inequalitiesaccurately and 70% will write asentence that answers the questionasked.
Reflection (CLICK ON ? FOR INSTRUCTIONS): Actually myexpectations were far too high for this type of problem. Itis apparent I need to spend more time in class workingsystems of inequalities and that the students need to spendmore time doing these types of problems outside of class. Iwill also look at rewording the problem to better lead thestudent to the correct solution.
Program Review Reporting Year: 2013-2014Target : Target Not MetOnly the defining variables target was met, it being 87%.The other categories were 33%, 12%, 7% and 14%.(11/07/2013)
Exam - Course Test/Quiz - While theexam has 10 problems on it I willonly be looking at one wordproblem. The question involves asystem of linear inequalities. Thestudent must define the variables,determine the inequalities needed,graph the inequalities includingshading the appropriate areas, find afeasible point and write a sentencethat describes what that pointmeans in relation to the problem.
Enhancement: I have rewrittenthe second part of the project toprovide more direction to thestudents when analyzing thescenario. Instead of makingsuggestions for points they mightwant to consider, I have provideda series of equations andcalculations for them to do. Thisshould help them with the analysispart.
For the worksheet, I feel that eventhough several students needed
Program Review Reporting Year: 2013-2014Target : Target MetOn the project, 78% of the students scored 40 out of 50 orhigher and 50% scored 45 out of 50 or higher. There weretwo groups (6 students) who scored 100%. One group of 2students scored at the C level and two groups (6 students)scored below passing (below 30 points).
On the worksheet, 80% of the students scored 9 out of 10points or higher. Of the remainder, 2 score 8 out of 10, 1scored 7 out of 10 and 1 scored less than passing. Therewere 3 students in the class who were not present for theassessment. (12/07/2013)
Project - For linear models, studentsdid a group project involving BloodAlcohol Level (BAC)and Legal DrivingLimits. They needed to set up linearequations based on starting a BACand the rate that the bodymetabolizes the alcohol over time.They then analyzed a scenarioconcerning an actual DUI case anddecide whether they thought theperson was guilty of a DUI. Studentswrote a paragraph usingmathematics to justify theirconclusion.
09/19/2019 Page 113 of 318Generated by Nuventive Improve

Student LearningOutcomes (SLOs) Assessment Methods Assessment Data Summaries Enhancements
Target for Success: Success on theproject was scoring at least 40 pointsout of 50. Success on the groupworksheet was scoring at least 9 outof 10 points.
Reflection (CLICK ON ? FOR INSTRUCTIONS): For the mostpart, students did reasonably well on the project. Mostgroups were able to set up the required linear equations,graphs and make the predictions. The students who scoredpoorly did not complete a major part of the assignment,despite time given in class to work on the project.
There were two areas that students had trouble with. Inone part they needed to use a linear equation to do aretrograde analysis and predict a BAC prior to the time theblood alcohol level was tested. Students did not realizethey needed to substitute a negative value for the time inorder to do that. The second area that students haddifficulty with was analyzing the scenario.
Many did not know how to apply the principals they hadlearned to the actual situation. They also had difficultylooking at how the different facts impacted the BAC of thedefendant.
On the worksheet, most students did well. Many studentsdid need help in getting started on the problems, since itput together many concepts we had been studying into oneworksheet. Many students also needed help in writingsentence to interpret their results.
help in completing theassignment, they benefittedgreatly and learned a lot bycompleting the assignment ingroups. I will continue to do thisassignment in future years.
(12/07/2014)
For quadratic models, studentscompleted a worksheet comprisedof two quadratics models. They hadto make various predictions basedon the model and then interprettheir results in a sentence. Studentsworked in groups on thisassessment.
Target for Success: 90% of theprojects will have a score of 80% ofbetter.
Reflection (CLICK ON ? FOR INSTRUCTIONS): XXXXX
Program Review Reporting Year: 2017-2018Target : Target Not Met80% average of those who complete; four are in the processof re-doing the assignment; 10 are still working on the firstsubmission. (11/14/2017)
Reflection (CLICK ON ? FOR INSTRUCTIONS): Despite all thein class time to complete this project, there was one group
Program Review Reporting Year: 2013-2014Target : Target Met1 group got a 64% and one group didn't turn in theassignment. Of the rest all had scores over 80%.(03/27/2014)
Project - Students will complete aproject in groups of 3 where theycreate a scatterplot and then choosetwo different sets of points and findthe equation of the line. They willthen draw the 'best fit' line and findthe equation of that line.Comparison questions will beanswered
09/19/2019 Page 114 of 318Generated by Nuventive Improve
Student LearningOutcomes (SLOs) Assessment Methods Assessment Data Summaries Enhancements
who didn't even bother to turn it in and another who putlittle effort into the project. The other groups did a greatjob!! I do need to spend more time discussing 'best fit' linethe next time I do this project.
Target for Success: I would expect atleast 50% of the students to get bothquestions correct.
Reflection (CLICK ON ? FOR INSTRUCTIONS): Surprizinglysince the quadratic was talked about right before the finalexam, only 4 students got the question correct.
Program Review Reporting Year: 2013-2014Target : Target Not MetOnly 4 out of 18 students got the quadratic questioncorrect. 12 out of 18 got the linear question correct(03/27/2014)
Exam - Course Test/Quiz - The onlyplace they really need to distinguishbetween linear and quadratic is onthe final exam. Therefore two of theproblems will be looked at. Oneconcerning linear and the otherquadratic (obviously.)
Target for Success: 70% of studentswill get the linear and quadraticquestions correct.
Exam - Course Test/Quiz - Finalexam will look at quadratic andlinear equations. pizza
Target for Success: 70% of studentsreceived full credit on thoseproblems.
Reflection (CLICK ON ? FOR INSTRUCTIONS): It is great tosee students can distinguish between linear and quadraticfunction models and can apply it to a real-world situations. Ienjoy to see my students can make connections betweenmath and the real-world situations.
Program Review Reporting Year: 2014-2015Target : Target Met83% of students received full credit on those two problems(11/14/2014)
Exam - Course Test/Quiz - I havegiven them two problems in a test toevaluate Student Learning Outcome1.
Reflection (CLICK ON ? FOR INSTRUCTIONS): study habitseffect the long term recall.
Enhancement: continue tomotivate students to study(04/01/2017)
Program Review Reporting Year: 2016-2017Target : Target MetAbout 90% people can do related questions on quizzescorrectly and at least 70 % can do the similar questionscorrectly on tests (04/01/2017)
Exam - Course Test/Quiz - Studentsare required to do the related topicsas homework assignments, Thelinear and quadratic functionapplications are on quizzes, test 1and the final exam.
Enhancement: Next time I teachthe class, I need to spend moretime at the beginning of the
Program Review Reporting Year: 2016-2017Target : Target MetA total of 31 students took the final exam. Out of those
Exam - Course Test/Quiz - On thefinal exam, I wanted to test thestudents on how well they
09/19/2019 Page 115 of 318Generated by Nuventive Improve

Student LearningOutcomes (SLOs) Assessment Methods Assessment Data Summaries Enhancements
Target for Success: I anticipated thatat least 70% of the students wouldanswer this problem correctly.
Reflection (CLICK ON ? FOR INSTRUCTIONS): While I didhave close to 70% of the class answer this questioncorrectly, I was a bit surprised that there were fewer than70% of the students who answered it completely correctly.For the first midterm, I put a somewhat similar problem onthe exam that asked the students to construct a linearinequality from a word problem. A large number of thestudents were not able to construct the linear inequality forthat problem, even though most of the students did nothave an issue solving the linear equations in the other partsof the exam.
quarter, as well as at the end ofthe quarter, discussing these typesof problems with students. I alsothink that I need to assign morehomework and review problemsthat mirror the problem I asked onmy final exam. (12/21/2017)
students, 21 students either answered the questionperfectly (16 of the 21) or missed only a point or two intrying the solve the inequality (5 of the 21). So, about 68%of the class did a more than satisfactory job of answeringthis question correctly. (12/21/2017)
understood how to setup and solvean application of a linear inequality.The problem from my final exam isas follows:
Your car is worth $1,200. You findout that your car needs somerepairs. The auto shop tells you thatthe parts cost a total of $260, andthe labor cost is $50 per hour. If therepairs are more than the car isworth, then you are going to donateyour car to charity.
Write an inequality that can be usedto determine the maximum numberof hours the mechanic can spendworking on your car, and then solvethe inequality. Interpret your answerin a complete sentence.
Target for Success: My target forsuccess is that the average score forthis problem be a 70% or above.
Reflection (CLICK ON ? FOR INSTRUCTIONS): I will continueto teach this type of problem in a similar way.Related Documents:SLO Data.xlsx
Program Review Reporting Year: 2017-2018Target : Target MetAfter tallying the scores for the problem given, the averagescore was a 77.52%, meaning on average, a student got77.52% of the problem correct. I was very pleased with this.(01/22/2018)
Exam - Course Test/Quiz - For thismethod, I used a final exam questionfrom the final exam which requiredstudents to find the equitation of aline given two points on the line.
Target for Success: 60% of the classwill receive a 70% or higher on theword problems
Reflection (CLICK ON ? FOR INSTRUCTIONS): The targetwas met and I felt like the word problems were a could wayto evaluate this SLO.
Program Review Reporting Year: 2018-2019Target : Target Met62% of the class received a 70% or higher on the wordproblems. (03/28/2019)
Exam - Course Test/Quiz - I will useword problems on exam 3 to assessthis method
09/19/2019 Page 116 of 318Generated by Nuventive Improve

Student LearningOutcomes (SLOs) Assessment Methods Assessment Data Summaries Enhancements
MATH212_SLO_2 - Analyze, interpret,and communicate results of linearand quadratic models in a logicalmanner from four points of view -visual, formula, numerical, andwritten.SLO Status: Active
Target for Success: Although a targetof 70% seems like a natural goal todetermine if students sufficientlyunderstand this student learningoutcome, it ignores the extra stressand anxiety placed upon studentswhen taking a cumulative exam thatrepresents 30% of their grade. Forthis reason, I have set the target forsuccess at 60%. The past three Math212 classes I have taught have seenabout two thirds of those taking thefinal passing the course. For thisreason my target for success is that70% of those students taking thefinal will score 60% or higher on thefinal.
Reflection (CLICK ON ? FOR INSTRUCTIONS): This was adifficult quarter with difficult outcomes. In reflecting withmany different people, I found that Spring is often adifficult quarter for developmental math students. Therewas a marked difference between success on thisassessment as compared with Fall of 2012 (74%). Thelargest problem encountered this quarter was studentengagement. Even with participation an active part of theirgrade it was difficult to maintain attendance particularly inthe noon section. As students performed generally morepoorly in this quarter than during previous times I havetaught the class it is difficult to pinpoint what else wasdifferent. Students seemed to have trouble holding ontomaterial from one exam to the next.
Enhancement: Since students areforgetting material as it is taught, Iwill try to implement more circularreview in the future. (01/12/2015)
Program Review Reporting Year: 2013-2014Target : Target Not MetAcross two sections only 20 out of 45 students scored 60%or higher on the final. The 44% who passed is well belowthe target of 70% (10/20/2014)
Reflection (CLICK ON ? FOR INSTRUCTIONS): Thecorrelation between the target for success in this studentlearning outcome and passing Math 212 seems to indicatethat the target for success was accurately chosen. Still, itwould be nice to see an assessment that could be judged onmore traditional expectations of mastery. Hidden in theassessment data is the fact that 14% of students present atthe census did not even make it to the final. If the 11students who did not take the final were considered tohave scored a 0 then the percentage of those meeting thetarget would drop to 64%, which was below the target for
Enhancement: Develop a moretargeted assessment that can helpmitigate student anxiety. If usingthe final as an assessment again inthe future, consider not only thosestudents who are taking the final,but also those students who havetaken all of the midterms. Treat astudent who has taken all previousexams, but does not take the finalas having a score of 0 for thepurposes of this assessment.(09/23/2013)
Program Review Reporting Year: 2012-2013Target : Target MetOut of 77 students enrolled in two Math 212 sections, 66took the final. The scores ranged from 32% to 99% with anaverage score of 70%. Almost three quarters (74%) of thestudents scored 60% or better on the final. Half of allstudents scored 70% or better. Only one student scoring60% or better on the final (in this case 64%) failed to passthe class. (12/13/2012)
Exam - Course Test/Quiz - As theMath 212 course is focused aroundlinear and quadratic functions, thecumulative final seemed the bestway to assess the students? abilitiesto analyze, interpret, andcommunicate results about thesemodels in the four-fold way ofthinking about functions.
09/19/2019 Page 117 of 318Generated by Nuventive Improve

Student LearningOutcomes (SLOs) Assessment Methods Assessment Data Summaries Enhancements
success. Indeed, some of those students should be countedas having a 0, students who attended up until the end ofthe course who decided they couldn?t pass. However,these students should be differentiated from those whoquit coming halfway through the quarter.
Target for Success: 70% of studentswill get better than 70% on theproject.
Reflection (CLICK ON ? FOR INSTRUCTIONS): Looks likethey did well.
Program Review Reporting Year: 2012-2013Target : Target Met94% of students got better than 70% on the project(02/12/2013)
Reflection (CLICK ON ? FOR INSTRUCTIONS): The reason ofsuccess, partly was due to the student's interest on videotaping the solution of the questions given to them and theirinterest on creating their own way of communication.
Enhancement: I was happy aboutthe result of the project and I willdevelop new strategies to betterthe format of the future projects.(02/04/2013)
Program Review Reporting Year: 2012-2013Target : Target MetThe method of assessment was video taping the solution offew problems project.The target of success was set for 90% for 26 students onDecember /4/2012.The actual percentage went over 92%. So, the targetsuccess was met. (02/04/2013)
Project - Project 1 - Linear Equations:Because the students are calculatingthe equations of lines they need tofirst graph the scatterplot and thenuse the proper formulas to find theequations of three lines. They arealso asked to compare the linesthey've found in completesentences.
Reflection (CLICK ON ? FOR INSTRUCTIONS): Manystudents did not finish the worksheet. Although I gaveextra credit to those that used the tutorial center, I couldhave had the in-class tutor make a stronger connection byfinding a time when he could meet with the students in thetutorial center. Regarding the performance for those whodid finish I could have given an extra day in class andprovided some hints for the harder problems.
Program Review Reporting Year: 2013-2014Target : Target Not MetOnly 68% of the students completed the worksheet. Theaverage score on the worksheet including those that did notfinish was 64%. However, of those groups that completedthe worksheet the average score was 81%. (04/17/2013)
Other - Students spent twodays(inside and outside of class)working collaboratively on aWorksheet containing the followingtypes of problem activities1)Graphing and Recognizing keyattributes of the Graphs2)Creating functions from graphsand then using them to answerquestions with correct functionnotation3)Examining and comparing tablesthat were derived from either alinear or quadratic relationship andthen writing down the numerical
09/19/2019 Page 118 of 318Generated by Nuventive Improve

Student LearningOutcomes (SLOs) Assessment Methods Assessment Data Summaries Enhancements
Target for Success: At least 90% ofthe students would complete thegroup worksheet (some of whichwas done in class) and get at least an80% overall score
difference in (complete sentences).4)Solving an application problemusing key attributes of the linear orquadratic function and then writing2 complete sentences
Target for Success: Given the 17questions on the final which fall intoone of the categories in theassessment method describedabove, each student should earn atleast 70% (or at least get 12questions correct) of the set of 17questions.
Reflection (CLICK ON ? FOR INSTRUCTIONS): Most of thestudents not earning 70% had trouble answering questionsthat require students to read graphs to answer the problemin the story. I will do more sample problems.
Program Review Reporting Year: 2012-2013Target : Target Not MetOf the 32 students that took the final 29 students answered12 or more of the 17 questions correctly. (08/04/2013)
Exam - Course Test/Quiz - Given thefinal has the following types ofproblems: identifying shapes ofgraphs, reading linear and quadraticgraphs, Evaluating functions from agraph and the formula, constructingmodels from a table and writinglinear and quadratic models from astory, I decided to use a set ofquestions from the final to assessthis SLO.
Reflection (CLICK ON ? FOR INSTRUCTIONS): More time
Program Review Reporting Year: 2013-2014Target : Target Not MetFirst target was met with 86% defining the variablescorrectly, getting the equations was far below target at 18%while solving (I gave credit if they solved their incorrectequations correctly) the equations was close at 64%. I wassurprised that only 64% wrote a sentence. I figured theywould at least write something to get some partial credit.(11/07/2013)
Exam - Course Test/Quiz - While theexam has 10 problems on it I willonly be looking at one wordproblems. The question is a simpleinterest problem involving a systemof linear equations. The studentmust define the variables, determinethe equations needed, solve theequations and write a sentence thatanswers the question asked.
09/19/2019 Page 119 of 318Generated by Nuventive Improve

Student LearningOutcomes (SLOs) Assessment Methods Assessment Data Summaries Enhancements
Target for Success: I expect 80% ofthe students to be able to accuratelydefine the variables, 70% of thestudents will be able to get the twoequations needed, 70% will solve thesystem correctly and 90% will write asentence that answers the questionasked.
needs to be spent in class and by the student outside ofclass working these types of problems. The question itselfwas pretty clear so I don't think that needs editing.
Target for Success: Success on theproject was scoring at least 40 pointsout of 50. Success on the groupworksheet was scoring at least 9 outof 10 points.
Reflection (CLICK ON ? FOR INSTRUCTIONS): For the mostpart, students did reasonably well on the project. Mostgroups were able to set up the required linear equations,graphs and make the predictions. The students who scoredpoorly did not complete a major part of the assignment,despite time given in class to work on the project.
There were two areas that students had trouble with. Inone part they needed to use a linear equation to do aretrograde analysis and predict a BAC prior to the time theblood alcohol level was tested. Students did not realizethey needed to substitute a negative value for the time inorder to do that. The second area that students haddifficulty with was analyzing the scenario.
Many did not know how to apply the principals they hadlearned to the actual situation. They also had difficulty
Enhancement: I have rewrittenthe second part of the project toprovide more direction to thestudents when analyzing thescenario. Instead of makingsuggestions for points they mightwant to consider, I have provideda series of equations andcalculations for them to do. Thisshould help them with the analysispart.
For the worksheet, I feel that eventhough several students neededhelp in completing theassignment, they benefittedgreatly and learned a lot bycompleting the assignment ingroups. I will continue to do thisassignment in future years.
(12/07/2014)
Program Review Reporting Year: 2013-2014Target : Target MetOn the project, 78% of the students scored 40 out of 50 orhigher and 50% scored 45 out of 50 or higher. There weretwo groups (6 students) who scored 100%. One group of 2students scored at the C level and two groups (6 students)scored below passing (below 30 points).
On the worksheet, 80% of the students scored 9 out of 10points or higher. Of the remainder, 2 score 8 out of 10, 1scored 7 out of 10 and 1 scored less than passing. Therewere 3 students in the class who were not present for theassessment.
(12/07/2013)
Project - For linear models, studentsdid a group project involving BloodAlcohol Level (BAC)and Legal DrivingLimits. They needed to set up linearequations based on starting a BACand the rate that the bodymetabolizes the alcohol over time.They then analyzed a scenarioconcerning an actual DUI case anddecide whether they thought theperson was guilty of a DUI. Studentswrote a paragraph usingmathematics to justify theirconclusion.For quadratic models, studentscompleted a worksheet comprisedof two quadratics models. They hadto make various predictions basedon the model and then interprettheir results in a sentence. Studentsworked in groups on thisassessment.
09/19/2019 Page 120 of 318Generated by Nuventive Improve

Student LearningOutcomes (SLOs) Assessment Methods Assessment Data Summaries Enhancements
looking at how the different facts impacted the BAC of thedefendant.
On the worksheet, most students did well. Many studentsdid need help in getting started on the problems, since itput together many concepts we had been studying into oneworksheet. Many students also needed help in writingsentence to interpret their results.
Target for Success: 90% of groupsaccurately complete the project.
Reflection (CLICK ON ? FOR INSTRUCTIONS): I spent a greatdeal of time working with the students in class on thisassignment which much improved performance over pastquarters. Still need to work on making sure everyoneunderstands the process.
Enhancement: Editing the projectinstructions for next time I use itso it is more clear on whatstudents are to do when it comesto best fit line. (02/12/2013)
Program Review Reporting Year: 2012-2013Target : Target MetOne group did not turn in the assignment and 1 other wasbelow the 70% goal. Meaning that 94% of the students gotbetter than 70% on the project. (02/12/2013)
Project - Project 1 - Students(working in groups) will create ascatterplot and then pick two pointsand find the equation of that line.They'll repeat this and then comparethe lines they found. Finally they willdo their best 'eye-ball' line(emulating linear regression) andfind the equation of that line andcompare it to the first two. pizza
Target for Success: 80% of groupswill complete with a score of 70% orhigher
Project - Project 2. Studentscomplete 3 systems of equationsproblems and 1 systems ofinequality problems. Create posterboard presentations of the problemsand present one problem to theclass acting at 'teacher'. pizza
Target for Success: 70% of studentsreceive full credit on those problems
Reflection (CLICK ON ? FOR INSTRUCTIONS): It is importantthat students learn every math topic from different pointsof view-visual, formula, numerical and written, in order tomake a better connections in their brain to help them with
Program Review Reporting Year: 2014-2015Target : Target Met35 out of 40 students got all of them correct, which that isabout 88% (12/05/2014)
Exam - Course Test/Quiz - I havegiven them 4 problems in a test toevaluate Student Learning Outcome2.
09/19/2019 Page 121 of 318Generated by Nuventive Improve

Student LearningOutcomes (SLOs) Assessment Methods Assessment Data Summaries Enhancements
their future math classes, job and life in general.
Reflection (CLICK ON ? FOR INSTRUCTIONS): Students whospend required amount of time to study are successful onall forms of tests
Enhancement: continue tomotivate students to spend timeto study. (04/01/2017)
Program Review Reporting Year: 2016-2017Target : Target Metmore than 90% can do questions correctly on quizzes, about75% students do well on these areas on the tests(04/01/2017)
Exam - Course Test/Quiz - Studentsare tested these areas on quizzesand tests throughout the quarter
Target for Success: Target forsuccess is that the average pointsachieved on the problem will beabove 70%.
Reflection (CLICK ON ? FOR INSTRUCTIONS): For this typeof problem, I need to try something new when teaching it. Ithink because the problem does require both new andolder skills learned during the quarter, it's more difficultthan usual.Related Documents:SLO Data.xlsx
Program Review Reporting Year: 2017-2018Target : Target Not MetFor this problem, the students did not do so well. Theaverage percentage of the point achieved was a 53.49%.This was a little disappointing. The problem given was nottoo difficult and the students had reviewed such problemsjust before the final exam. (01/22/2018)
Exam - Course Test/Quiz - For thismethod, I used a problem (again)from the final exam which requiredstudents to graph a quadratic modelshowing all points of interest, vertex,x and y intercepts, and so forth.
Target for Success: 60% of thestudents will receive a 70% or higheron the 5 problems.
Reflection (CLICK ON ? FOR INSTRUCTIONS): I will use thismethod the next time I teach 212. The students did well onthese problems
Program Review Reporting Year: 2018-2019Target : Target Met68% of the students received 70% or higher on theproblems. (03/28/2019)
Exam - Course Test/Quiz - I will givethe students a quiz that focuses onthis assessment. There will be 5problems that will ask them toanalyze, interpret, and communicateresults of linear and quadraticmodels in a logical manner from fourpoints of view - visual, formula,numerical, and written.
MATH212_SLO_3 - Demonstrate anappreciation and awareness ofapplications in their daily lives.SLO Status: Active
Program Review Reporting Year: 2013-2014Target : Target MetOf the 53 students who turned in portfolio problems, 49 of
Portfolio Review - Throughout thequarter students were asked to writea question from the context of
09/19/2019 Page 122 of 318Generated by Nuventive Improve

Student LearningOutcomes (SLOs) Assessment Methods Assessment Data Summaries Enhancements
Target for Success: In order to moveon to Math 114, I would hope that astudent would average a 6 acrossthe three written questions. Thepast three Math 212 classes I havetaught have seen about 66% ofthose completing the course passing.For these reasons my target forsuccess is that 70% of those studentscompleting the course will average a6 or higher on their portfolio.
Reflection (CLICK ON ? FOR INSTRUCTIONS): Whenstudents participated in the portfolio they seemed to reallyengage with the material. They enjoyed taking applicationsfrom their video games and bachelorette parties and all theother personal facets of their lives to write math problems.However, participation remained a problem. There was agreat deal of difficulty in getting them involved. Less thanhalf the students completed all three portfolio problems,despite the problem being worth 10% of a midterm grade ineach case and having several days to work on it. If this isindeed a factor of the Spring quarter, then we need to findnew ways to compete with the weather at this time of year.
them averaged a 6 or better. However, only 23 of the 53students turned in all three problems. 20 students turned in2 problems and the remaining 10 turned in only oneproblem. (10/20/2014)
Reflection (CLICK ON ? FOR INSTRUCTIONS): Studentsshowed a tendancy to follow the path of least resistance. Asa result, they wrote a lot of questions that, while comingfrom the context of the world around them, were hard tobelieve the student might actually care about answering.Although they are connecting these applications to the realworld, there seems to be a disconnect in their numeracy.They tend to choose values that have no connection withtheir chosen context, but which make for easy calculations.In short, their questions tend to resemble traditional wordproblems rather than true applications. Students found itmuch harder to see quadratic models in the world aroundthem as opposed to linear models. It does appear that theirability to connect their questions to things that interestthem (sports, hobbies, jobs, etc.) increased theirengagement in the material.
Enhancement: Students mightbenefit from learning how to setup mathematical models beforethey develop the skills to solvethem. In this way it would beeasier to concentrate onmeaningful values and helpencourage their numeracy. Thismight also help introduce thestudents to the way thesequestions are developed (asopposed to "extracting" anequation from a paragraph).(09/23/2013)
Program Review Reporting Year: 2012-2013Target : Target MetOut of 77 students enrolled in two Math 212 sections 69turned in a portfolio. The portfolio scores ranged from 4.0to 7.7. A score of 6.0 or better was attained by 77% ofthese students. Only 30% of the students scored 7.0 orhigher. (12/13/2012)
their own lives that could beanswered using linear models,quadratic models, and a system oflinear equations. These were scoredon a 10 point rubric that evaluatedthe questions for solvability, context,realism of the values used, andoriginality of the question. Theaverage score on this portfolio ofquestions will be used to assess theSLO.
09/19/2019 Page 123 of 318Generated by Nuventive Improve
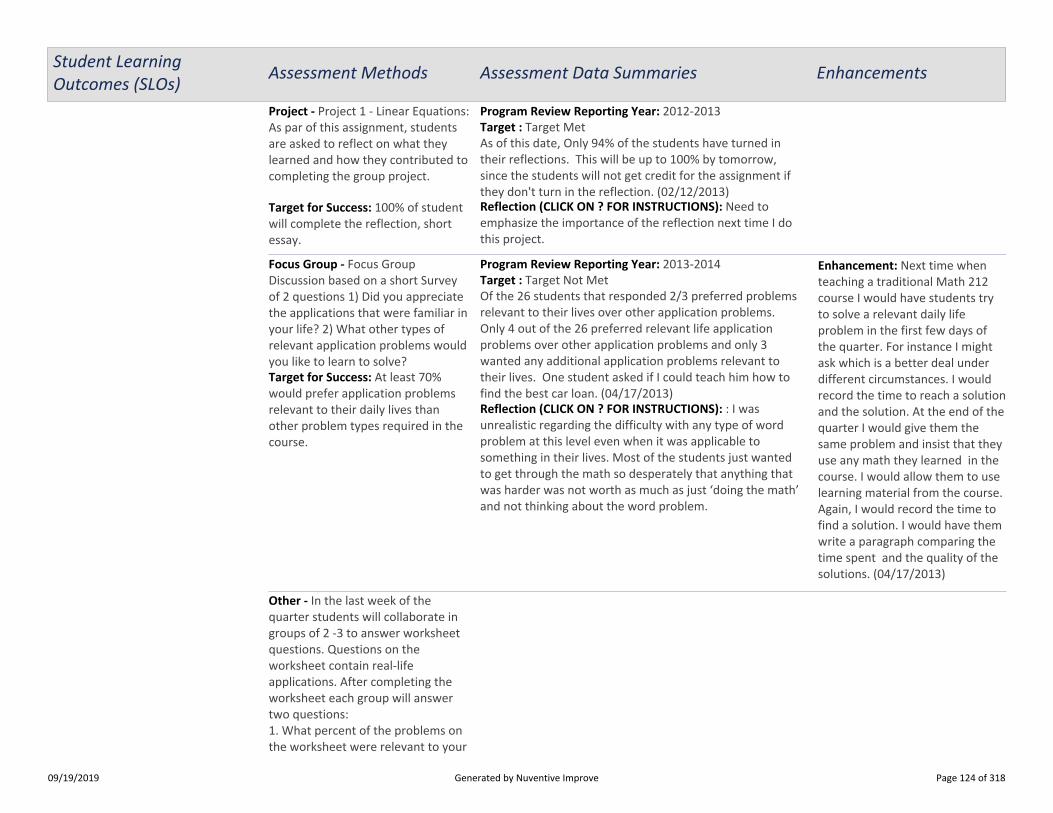
Student LearningOutcomes (SLOs) Assessment Methods Assessment Data Summaries Enhancements
Target for Success: 100% of studentwill complete the reflection, shortessay.
Reflection (CLICK ON ? FOR INSTRUCTIONS): Need toemphasize the importance of the reflection next time I dothis project.
Program Review Reporting Year: 2012-2013Target : Target MetAs of this date, Only 94% of the students have turned intheir reflections. This will be up to 100% by tomorrow,since the students will not get credit for the assignment ifthey don't turn in the reflection. (02/12/2013)
Project - Project 1 - Linear Equations:As par of this assignment, studentsare asked to reflect on what theylearned and how they contributed tocompleting the group project.
Target for Success: At least 70%would prefer application problemsrelevant to their daily lives thanother problem types required in thecourse.
Reflection (CLICK ON ? FOR INSTRUCTIONS): : I wasunrealistic regarding the difficulty with any type of wordproblem at this level even when it was applicable tosomething in their lives. Most of the students just wantedto get through the math so desperately that anything thatwas harder was not worth as much as just ‘doing the math’and not thinking about the word problem.
Enhancement: Next time whenteaching a traditional Math 212course I would have students tryto solve a relevant daily lifeproblem in the first few days ofthe quarter. For instance I mightask which is a better deal underdifferent circumstances. I wouldrecord the time to reach a solutionand the solution. At the end of thequarter I would give them thesame problem and insist that theyuse any math they learned in thecourse. I would allow them to uselearning material from the course.Again, I would record the time tofind a solution. I would have themwrite a paragraph comparing thetime spent and the quality of thesolutions. (04/17/2013)
Program Review Reporting Year: 2013-2014Target : Target Not MetOf the 26 students that responded 2/3 preferred problemsrelevant to their lives over other application problems.Only 4 out of the 26 preferred relevant life applicationproblems over other application problems and only 3wanted any additional application problems relevant totheir lives. One student asked if I could teach him how tofind the best car loan. (04/17/2013)
Focus Group - Focus GroupDiscussion based on a short Surveyof 2 questions 1) Did you appreciatethe applications that were familiar inyour life? 2) What other types ofrelevant application problems wouldyou like to learn to solve?
Other - In the last week of thequarter students will collaborate ingroups of 2 -3 to answer worksheetquestions. Questions on theworksheet contain real-lifeapplications. After completing theworksheet each group will answertwo questions:1. What percent of the problems onthe worksheet were relevant to your
09/19/2019 Page 124 of 318Generated by Nuventive Improve

Student LearningOutcomes (SLOs) Assessment Methods Assessment Data Summaries Enhancements
Target for Success: 1. The averagepercent of problems found useful isat least 75%2. The average percent of techniquesused outside this course is at least50%
daily lives?2. What percent of the problemsolving techniques for these real lifeapplications will you actually useonce done with the course?
Target for Success: As a way of'seeing' student awareness ofapplications, I expect that at least80% of the students will at leastattempt to do part of each problem.
Reflection (CLICK ON ? FOR INSTRUCTIONS): I was verypleased that almost all students made and attempt at theseword problems. Most just defined the variables but that isa great start!!
Program Review Reporting Year: 2013-2014Target : Target MetWell over the stated goal was obtained as 92% of thestudents attempted the interest problem and 96% ofstudents attempted the inequality problem. (11/07/2013)
Exam - Course Test/Quiz - While theexam has 10 problems on it I willonly be looking at two wordproblem. One dealing with simpleinterest with a system of linearequations, the other with a systemof linear inequalities.
Target for Success: Successfulgroups will score at least 40 pointsout of 50 on the group project
Reflection (CLICK ON ? FOR INSTRUCTIONS): : For the mostpart, students did reasonably well on the project. Mostgroups were able to set up the required linear equations,graphs and make the predictions. The students who scoredpoorly did not complete a major part of the assignment,despite time given in class to work on the project.
There were two areas that students had trouble with. Inone part they needed to use a linear equation to do a
Enhancement: I have rewrittenthe second part of this project toprovide more direction to thestudents when analyzing thescenario. Instead of makingsuggestions for points they mightwant to consider, I have provideda series of equations andcalculations for them to do. Thisshould help them with the analysispart.
For the retrograde analysis, I willmake sure as I help students that Iemphasize that time is negative
Program Review Reporting Year: 2013-2014Target : Target Met78% of the students scored 40 out of 50 or higher and 50%scored 45 out of 50 or higher. There were two groups (6students) who scored 100%. One group of 2 studentsscored at the C level and two groups (6 students) scoredbelow passing (below 30 points). (11/15/2013)
Project - Students did a groupproject involving Blood Alcohol Level(BAC)and Legal Driving Limits. Theyneeded to set up linear equationsbased on starting a BAC and the ratethat the body metabolizes thealcohol over time. They thenanalyzed a scenario concerning anactual DUI case and decide whetherthey thought the person was guiltyof a DUI. Students wrote aparagraph using mathematics tojustify their conclusion
09/19/2019 Page 125 of 318Generated by Nuventive Improve

Student LearningOutcomes (SLOs) Assessment Methods Assessment Data Summaries Enhancements
retrograde analysis and predict a BAC prior to the time theblood alcohol level was tested. Students did not realizethey needed to substitute a negative value for the time inorder to do that. The second area that students haddifficulty with was analyzing the scenario. Many did notknow how to apply the principals they had learned to theactual situation. They also had difficulty looking at how thedifferent facts impacted the BAC of the defendant.
when going back in time. (12/07/2014)
Target for Success: 95% of studentswill get this question correct.
Reflection (CLICK ON ? FOR INSTRUCTIONS): Not exactlysure what else can be done other than having studentspractice more of these types of problems. I was rathersurprised that the number who got it right was so low as wehave done several of these types of problems in class and inthe homework.
Program Review Reporting Year: 2013-2014Target : Target Not MetOnly 6/21 students got this question correct. (02/03/2014)
Exam - Course Test/Quiz - Looking atone problem on Quiz 4 dealing withfinding the original price of a phone.Students will understand theconcept of reduction in price.
Target for Success: At least 70% ofthe students will do the problemcorrectly.
Reflection (CLICK ON ? FOR INSTRUCTIONS): Quite pleasedwith how the students did with this problem.
Program Review Reporting Year: 2014-2015Target : Target Met71% of the students were able to do the problem byaccurately defining the variables, find the system ofequations, solving and answering the question with asentence (11/06/2014)
Exam - Course Test/Quiz - Exam 1Problem on investment problem
Target for Success: At least 80percent of students complete theproject with a grade of 90% orbetter.
Reflection (CLICK ON ? FOR INSTRUCTIONS): This projectmade them think of how basic algebra knowledge can helpthem with their everyday life problems and decisionmakings. The majority of them did the project in group oftwo or three, that help them to make friends for that classand other classes they take in future, as some of themreported.
Program Review Reporting Year: 2014-2015Target : Target Met36 out of 40 students about 90% turned in the projectcompleted and scored above 90% (11/19/2014)
Project - I gave them a project toexamine three different cellphonecompany career and choose whichone is more suitable with theirneeds. They could do the project ingroup or individually, but they had tosubmit their final work individually.
Enhancement: continue toProgram Review Reporting Year: 2016-2017Exam - Course Test/Quiz -
09/19/2019 Page 126 of 318Generated by Nuventive Improve

Student LearningOutcomes (SLOs) Assessment Methods Assessment Data Summaries Enhancements
Reflection (CLICK ON ? FOR INSTRUCTIONS): more skillslead more appreciation
motivate students to spend timeon homework (04/01/2017)
Target : Target Metalmost all students showed up for the final exam finishedthe 90% of homework (04/01/2017)
homework are related to these areasand points are given for doing theproblems
Target for Success: Target forsuccess is again, that the averagepoints obtained on the problem willbe a 70% or above.
Reflection (CLICK ON ? FOR INSTRUCTIONS): Again, theaverage points obtained fell short of the target. Thisproblem involved skills that were taught earlier in the classonly. I would have thought that students would have donebetter since those skills had time to sink in. I think in thefuture, I might return to those skills at the end of thequarter (time permitting) and review before the final exam.Related Documents:SLO Data.xlsx
Program Review Reporting Year: 2017-2018Target : Target Not MetFor this problem, the average points obtained per studentwas a 52.62%, short of the 70% I was hoping for success.(01/22/2018)
Exam - Course Test/Quiz - For thisassessment, I again used a problemfrom the final exam. It was a trueapplication problem (mixtureproblem) that required students toset up and solve an application.
Target for Success: The students willcomplete this project during classand 80% of them should receive a70% or higher
Reflection (CLICK ON ? FOR INSTRUCTIONS): The studentsenjoyed this project and I plan to use it again in the future!
Program Review Reporting Year: 2018-2019Target : Target Met82% of the students received a 70% or higher on theproject. (03/28/2019)
Project - I had the students completea groupwork that had them applywhat we are learning to a plane tripthey can take to Hawaii.
09/19/2019 Page 127 of 318Generated by Nuventive Improve
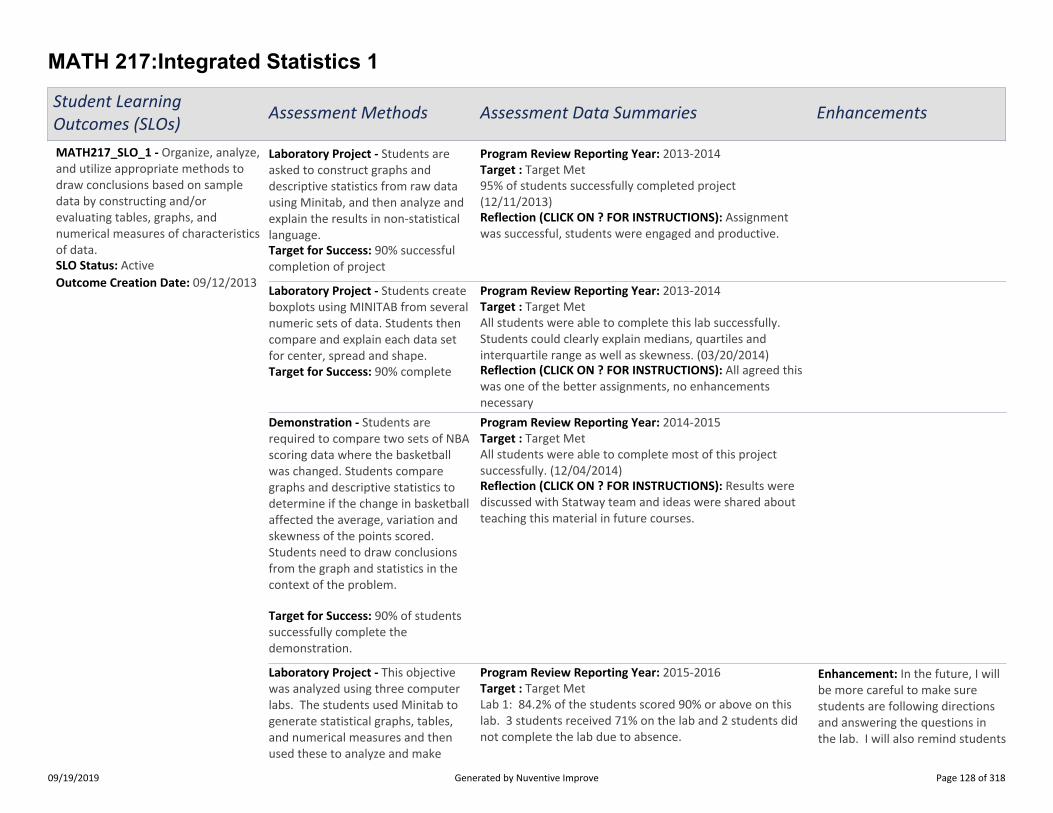
MATH 217:Integrated Statistics 1
Student LearningOutcomes (SLOs) Assessment Methods Assessment Data Summaries Enhancements
MATH217_SLO_1 - Organize, analyze,and utilize appropriate methods todraw conclusions based on sampledata by constructing and/orevaluating tables, graphs, andnumerical measures of characteristicsof data.SLO Status: ActiveOutcome Creation Date: 09/12/2013
Target for Success: 90% successfulcompletion of project
Reflection (CLICK ON ? FOR INSTRUCTIONS): Assignmentwas successful, students were engaged and productive.
Program Review Reporting Year: 2013-2014Target : Target Met95% of students successfully completed project(12/11/2013)
Laboratory Project - Students areasked to construct graphs anddescriptive statistics from raw datausing Minitab, and then analyze andexplain the results in non-statisticallanguage.
Target for Success: 90% complete Reflection (CLICK ON ? FOR INSTRUCTIONS): All agreed thiswas one of the better assignments, no enhancementsnecessary
Program Review Reporting Year: 2013-2014Target : Target MetAll students were able to complete this lab successfully.Students could clearly explain medians, quartiles andinterquartile range as well as skewness. (03/20/2014)
Laboratory Project - Students createboxplots using MINITAB from severalnumeric sets of data. Students thencompare and explain each data setfor center, spread and shape.
Target for Success: 90% of studentssuccessfully complete thedemonstration.
Reflection (CLICK ON ? FOR INSTRUCTIONS): Results werediscussed with Statway team and ideas were shared aboutteaching this material in future courses.
Program Review Reporting Year: 2014-2015Target : Target MetAll students were able to complete most of this projectsuccessfully. (12/04/2014)
Demonstration - Students arerequired to compare two sets of NBAscoring data where the basketballwas changed. Students comparegraphs and descriptive statistics todetermine if the change in basketballaffected the average, variation andskewness of the points scored.Students need to draw conclusionsfrom the graph and statistics in thecontext of the problem.
Enhancement: In the future, I willbe more careful to make surestudents are following directionsand answering the questions inthe lab. I will also remind students
Program Review Reporting Year: 2015-2016Target : Target MetLab 1: 84.2% of the students scored 90% or above on thislab. 3 students received 71% on the lab and 2 students didnot complete the lab due to absence.
Laboratory Project - This objectivewas analyzed using three computerlabs. The students used Minitab togenerate statistical graphs, tables,and numerical measures and thenused these to analyze and make
09/19/2019 Page 128 of 318Generated by Nuventive Improve
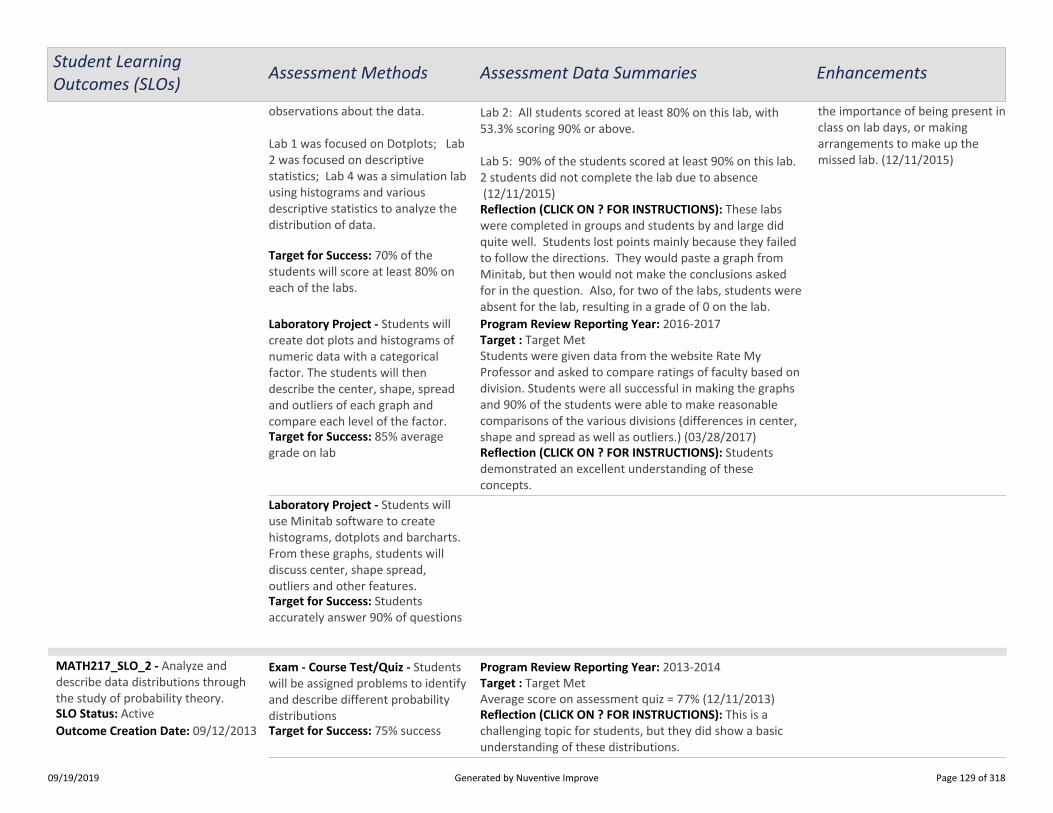
Student LearningOutcomes (SLOs) Assessment Methods Assessment Data Summaries Enhancements
Target for Success: 70% of thestudents will score at least 80% oneach of the labs.
Reflection (CLICK ON ? FOR INSTRUCTIONS): These labswere completed in groups and students by and large didquite well. Students lost points mainly because they failedto follow the directions. They would paste a graph fromMinitab, but then would not make the conclusions askedfor in the question. Also, for two of the labs, students wereabsent for the lab, resulting in a grade of 0 on the lab.
the importance of being present inclass on lab days, or makingarrangements to make up themissed lab. (12/11/2015)
Lab 2: All students scored at least 80% on this lab, with53.3% scoring 90% or above.
Lab 5: 90% of the students scored at least 90% on this lab.2 students did not complete the lab due to absence (12/11/2015)
observations about the data.
Lab 1 was focused on Dotplots; Lab2 was focused on descriptivestatistics; Lab 4 was a simulation labusing histograms and variousdescriptive statistics to analyze thedistribution of data.
Target for Success: 85% averagegrade on lab Reflection (CLICK ON ? FOR INSTRUCTIONS): Students
demonstrated an excellent understanding of theseconcepts.
Program Review Reporting Year: 2016-2017Target : Target MetStudents were given data from the website Rate MyProfessor and asked to compare ratings of faculty based ondivision. Students were all successful in making the graphsand 90% of the students were able to make reasonablecomparisons of the various divisions (differences in center,shape and spread as well as outliers.) (03/28/2017)
Laboratory Project - Students willcreate dot plots and histograms ofnumeric data with a categoricalfactor. The students will thendescribe the center, shape, spreadand outliers of each graph andcompare each level of the factor.
Target for Success: Studentsaccurately answer 90% of questions
Laboratory Project - Students willuse Minitab software to createhistograms, dotplots and barcharts.From these graphs, students willdiscuss center, shape spread,outliers and other features.
MATH217_SLO_2 - Analyze anddescribe data distributions throughthe study of probability theory.SLO Status: ActiveOutcome Creation Date: 09/12/2013 Target for Success: 75% success
Reflection (CLICK ON ? FOR INSTRUCTIONS): This is achallenging topic for students, but they did show a basicunderstanding of these distributions.
Program Review Reporting Year: 2013-2014Target : Target MetAverage score on assessment quiz = 77% (12/11/2013)
Exam - Course Test/Quiz - Studentswill be assigned problems to identifyand describe different probabilitydistributions
09/19/2019 Page 129 of 318Generated by Nuventive Improve
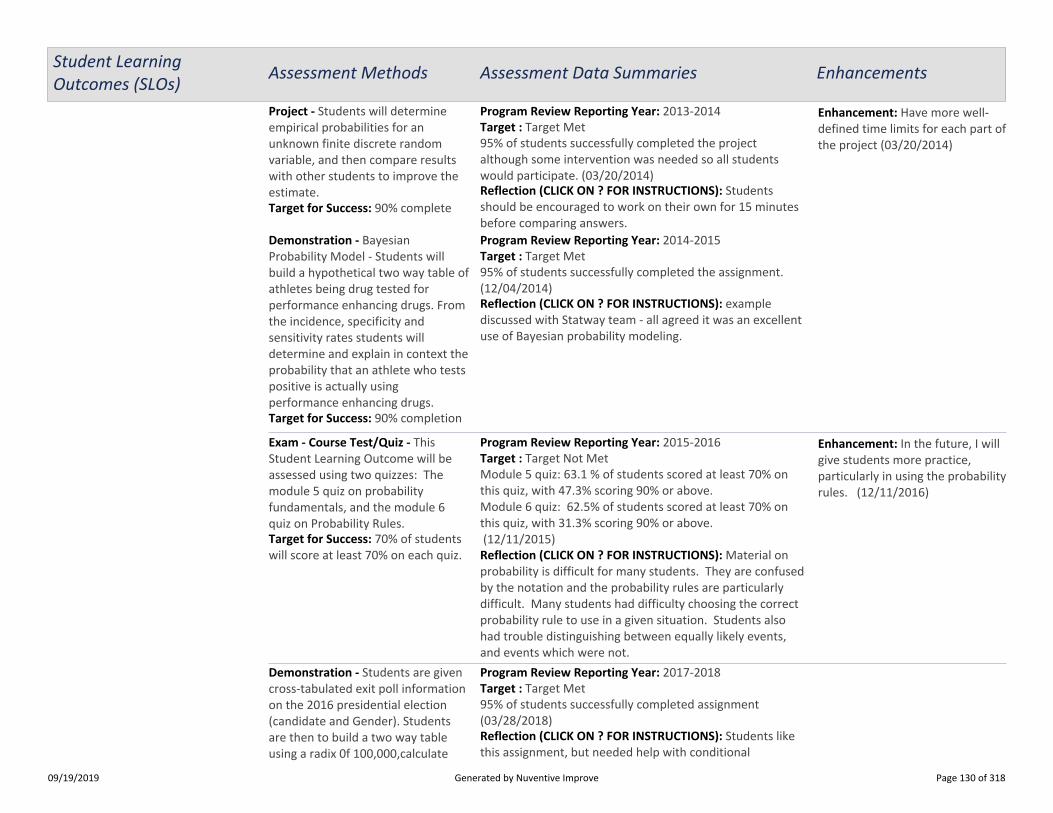
Student LearningOutcomes (SLOs) Assessment Methods Assessment Data Summaries Enhancements
Target for Success: 90% completeReflection (CLICK ON ? FOR INSTRUCTIONS): Studentsshould be encouraged to work on their own for 15 minutesbefore comparing answers.
Enhancement: Have more well-defined time limits for each part ofthe project (03/20/2014)
Program Review Reporting Year: 2013-2014Target : Target Met95% of students successfully completed the projectalthough some intervention was needed so all studentswould participate. (03/20/2014)
Project - Students will determineempirical probabilities for anunknown finite discrete randomvariable, and then compare resultswith other students to improve theestimate.
Target for Success: 90% completion
Reflection (CLICK ON ? FOR INSTRUCTIONS): examplediscussed with Statway team - all agreed it was an excellentuse of Bayesian probability modeling.
Program Review Reporting Year: 2014-2015Target : Target Met95% of students successfully completed the assignment.(12/04/2014)
Demonstration - BayesianProbability Model - Students willbuild a hypothetical two way table ofathletes being drug tested forperformance enhancing drugs. Fromthe incidence, specificity andsensitivity rates students willdetermine and explain in context theprobability that an athlete who testspositive is actually usingperformance enhancing drugs.
Target for Success: 70% of studentswill score at least 70% on each quiz. Reflection (CLICK ON ? FOR INSTRUCTIONS): Material on
probability is difficult for many students. They are confusedby the notation and the probability rules are particularlydifficult. Many students had difficulty choosing the correctprobability rule to use in a given situation. Students alsohad trouble distinguishing between equally likely events,and events which were not.
Enhancement: In the future, I willgive students more practice,particularly in using the probabilityrules. (12/11/2016)
Program Review Reporting Year: 2015-2016Target : Target Not MetModule 5 quiz: 63.1 % of students scored at least 70% onthis quiz, with 47.3% scoring 90% or above.Module 6 quiz: 62.5% of students scored at least 70% onthis quiz, with 31.3% scoring 90% or above. (12/11/2015)
Exam - Course Test/Quiz - ThisStudent Learning Outcome will beassessed using two quizzes: Themodule 5 quiz on probabilityfundamentals, and the module 6quiz on Probability Rules.
Reflection (CLICK ON ? FOR INSTRUCTIONS): Students likethis assignment, but needed help with conditional
Program Review Reporting Year: 2017-2018Target : Target Met95% of students successfully completed assignment(03/28/2018)
Demonstration - Students are givencross-tabulated exit poll informationon the 2016 presidential election(candidate and Gender). Studentsare then to build a two way tableusing a radix 0f 100,000,calculate
09/19/2019 Page 130 of 318Generated by Nuventive Improve

Student LearningOutcomes (SLOs) Assessment Methods Assessment Data Summaries Enhancements
Target for Success: 85% successfullycomplete assignment.
probability
Reflection (CLICK ON ? FOR INSTRUCTIONS): Students werevery interested in this project as it was conducted rightbefore the inauguration. The project also led to a discussionabout recognizing the difference between inferences fromreal data and false claims or "alternative" facts.
Program Review Reporting Year: 2016-2017Target : Target MetStudents created the two way table based based on the exitpolls and then compared the totals to the popular vote forverification. Students then showed that there was a cleargender gap in the results with Women overwhelmingsupporting Clinton and Men supporting Trump.(03/28/2017)
marginal, joint and conditionalprobabilities and determine ifgender and candidate selection areindependent or dependent events.
MATH217_SLO_3 - Evaluate real-world situations and apply linear,quadratic and exponential functionmodels appropriately.SLO Status: ActiveOutcome Creation Date: 09/12/2013 Target for Success: 90% completion
Reflection (CLICK ON ? FOR INSTRUCTIONS): We felt thatsome changes should be made to the presentation of thismaterial, especially the linear and exponential models.
Enhancement: Create newworksheets for linear andquadratic models and use themnext quarter (W2014)(12/11/2013)
Program Review Reporting Year: 2013-2014Target : Target Metlinear model - 80% successexponential model - 70% successquadratic model - 85% successoverall average 78% success (12/11/2013)
Demonstration - Students willcomplete worksheets thatdemonstrate a knowledge of realworld situations involving linear,quadratic and exponential models.
Target for Success: 90% completionReflection (CLICK ON ? FOR INSTRUCTIONS): Studentsworked with different data sets and using scatter plotswere able to discern the models.
Program Review Reporting Year: 2017-2018Target : Target Met95% of students completed assignment (03/28/2018)
Reflection (CLICK ON ? FOR INSTRUCTIONS): We felt thenew supplemental material was a great improvement over
Enhancement: Add model buildingto quadratic handout(03/20/2014)
Program Review Reporting Year: 2013-2014Target : Target MetStudents were able to successfully work with linear andexponential models, but struggled with quadratic models.However, over 90% of students successfully completed theproject (03/20/2014)
Project - Students work in groups tobuild an appropriate model (linear,exponential or quadratic) fromcontext rich scenarios.
09/19/2019 Page 131 of 318Generated by Nuventive Improve
Student LearningOutcomes (SLOs) Assessment Methods Assessment Data Summaries Enhancements
FA2013 material, but there could be more examples ofquadratic model building
Target for Success: 75% successReflection (CLICK ON ? FOR INSTRUCTIONS): Students wereable to successfully tell the difference from the threemodels.
Program Review Reporting Year: 2016-2017Target : Target MetStudents were given examples of each three models: Agravity example fro quadratic, a depreciation example forexponential and a blood alcohol concentration example forlinear. Using technology, the students derived the equationsand used the equations to make predictions and explain theresults in context. (03/28/2017)
Reflection (CLICK ON ? FOR INSTRUCTIONS): Discussed quizresults with a colleague - we agreed the student success inworking with rich context problems supports the productivepersistence pedagogy used in Statway.
Program Review Reporting Year: 2014-2015Target : Target MetAverage score on quiz was 80%, some students had troublewith using the correct language in context, but most weresuccessful in the traditionally challenging topic in algebra.(12/04/2014)
Exam - Course Test/Quiz - Studentsare given data for several problemsand are asked to 1) choose theappropriate model (linear, quadraticor exponential) that fits the data, 2)Find an equation to model the data,3) Use the model to makepredictions, 4) present answers incontext.
Target for Success: 70% of thestudents will score 70% or higher onthe exam and the quiz.
Reflection (CLICK ON ? FOR INSTRUCTIONS): The scores forthe linear and exponential models exam were just shy ofmeeting target. For these students, who had not taken analgebra course before, the material on exponentialfunctions was difficult. Also, students often had troubleinterpreting their results.
Enhancement: In the future, I willprovide more practice on theaspects of algebra andinterpretation of results for linear,exponential and quadratic models.Students need much morepractice than that provided in theworksheets, so I will supplementwith additional exercises.(12/11/2015)
Program Review Reporting Year: 2015-2016Target : Target Not MetLinear and Exponential models: 63.1% of students scored atleast 70% on this exam. Of these, 15.8% scored above 90%,and another 31.6% scored between 80% and 90%. 7students scored below 70%.
Quadratic models: 76.4% of students scored at least 70%on this quiz, with 64.6% scoring above 90%. 4 studentsscored below 70%, of whom 3 were absent for the quiz. (12/11/2015)
Exam - Course Test/Quiz - Thislearning outcome is being assessedthrough the results of Exam 2, whichcontained questions on linear andexponential models, as well as linearregression. The quadratic model isbeing assessed by the Quadraticquiz.
09/19/2019 Page 132 of 318Generated by Nuventive Improve
Student LearningOutcomes (SLOs) Assessment Methods Assessment Data Summaries Enhancements
The scores on the quadratics quiz were much better, withstudents achieving the target on this assessment
09/19/2019 Page 133 of 318Generated by Nuventive Improve

MATH 22:Discrete Mathematics
Student LearningOutcomes (SLOs) Assessment Methods Assessment Data Summaries Enhancements
MATH22_SLO_1 - Critique amathematical statement for its truthvalue, defend choice by formulatinga mathematical proof or constructinga counterexample.SLO Status: Active
Target for Success: Scoring at least 6points out of 8 was consideredsuccess. (Identifying that the relationwas not transitive, and providing acounterexample, were worth 3points together; identifying that therelation was symmetric, and writinga proof, were worth 5 pointstogether.)
Reflection (CLICK ON ? FOR INSTRUCTIONS): I was satisfiedto see that I had more than 60% of the class answer thisquestion correctly. These types of problems gave thestudents a difficult time on previous exams and quizzesbecause they were not asked to simply prove somethingwas true or find a counterexample. Instead, the studentsneeded to work with smaller examples that helped themgain insight into why a statement should be true or false.This taught the students how to patiently work through thevarious parts of the problem in order to gain a betterunderstanding for why the statement in the problem iseither true or false.
Enhancement: Next time I teachthe class, I plan on spending moretime having the studentsdetermine if a mathematicalstatement is true or false throughin-class group work. This way theywill have a better understandingof the definition they are workingwith and how to constructexamples and counterexamples.(12/21/2017)
Program Review Reporting Year: 2016-2017Target : Target MetA total of 42 students took the final exam. Out of thosestudents, 27 students answered this problem correctly(about 64%). (12/21/2017)
Reflection (CLICK ON ? FOR INSTRUCTIONS): The rate ofsuccess was acceptable. Almost everyone identified arelevant counterexample. Students who had difficulty withthe question generally failed to follow the formal proofwriting structure of stating hypotheses and invokingrelevant definitions upfront. It might be worthwhile to addan exercise which focuses primarily on writing only the firstline of a formal proof, and on translating statements usingdefinitions (ie. x^2+3 is prime if and only if (fill in the blank),xRy if and only if (fill in the blank), x is not in A union Bcomplement if and only if (fill in the blank).
Program Review Reporting Year: 2012-2013Target : Target Met76% of the students scored at least 6 points out of 8.71% of the students scored at least 7 points out of 8.29% of the students scored 8 points out of 8. (02/04/2013)
Exam - Course Test/Quiz - Quiz 7:Students were asked to determine ifa particular relation on the integerswas transitive and/or symmetric,and to provide a proof if a propertywas true, and a counterexample ifthe property was false. In this case,the relation was symmetric but nottransitive, so a proof and acounterexample were each required.
Program Review Reporting Year: 2012-2013Target : Target Met72% of the students were correctly able to identify that theouter function need not be one-to-one and were able to
Exam - Course Test/Quiz - On thefinal exam, the students were askedto determine if the "outer" functionin a composition of two functions
09/19/2019 Page 134 of 318Generated by Nuventive Improve

Student LearningOutcomes (SLOs) Assessment Methods Assessment Data Summaries Enhancements
Target for Success: Given that 72%of the students did the problem fullycorrectly and and additional 16%identified the correct truth value, Iwould consider the target met.
Reflection (CLICK ON ? FOR INSTRUCTIONS): Overall, this isquite satisfactory.
produce a correct counterexample. 16% of the studentswere able to identify that the outer function need not beone-to-one, but were not able to produce an appropriatecounterexample. 8% of the students responded that theouter function must be one-to-one and attempted to provethat. 4% of the students left the problem blank.(07/14/2013)
must be one-to-one, given that thecomposite function is one-to-one.
Target for Success: I anticipated thatat least 60% of the students wouldanswer this problem correctly.
Reflection (CLICK ON ? FOR INSTRUCTIONS): I was satisfiedto see that I had more than 60% of the class answer thisquestion correctly. These types of problems gave thestudents a difficult time on previous exams and quizzesbecause they were not asked to simply prove somethingwas true or find a counterexample. Instead, the studentsneeded to work with smaller examples that helped themgain insight about why a statement should be true or false.This taught the students how to patiently work through thevarious parts of problem in order to gain a betterunderstanding for why the statement in the problem iseither true or false.
Enhancement: Next time I teachthe class, I plan on spending moretime having the studentsdetermine if a mathematicalstatement is true or false throughin class group work. This way theywill gain a better understanding ofthe definitions they are workingwith and how to constructexamples and counterexamples.(12/21/2017)
Program Review Reporting Year: 2016-2017Target : Target MetA total of 42 students took the final exam. Out of thosestudents, 27 students answered this problem correctly(about 64%). (12/21/2017)
Exam - Course Test/Quiz - On thefinal exam, I wanted to test how wellthe students could determine if astatement would be true or not, andthen have the students try and provethe statement if they thought it wastrue or create a counterexample ifthey thought the statement wasfalse. The problem on my final examwas the following:
If f: X->Y and g: Y ->Z are functionand g o f: X->Z is onto, then must f:X-> Y be onto, as well? If so, proveit. If not, then give acounterexample.
MATH22_SLO_2 - Analyze and applypatterns of discrete mathematicalstructures to demonstratemathematical thinking.SLO Status: Active
Target for Success: Scoring at least 3points out of 4 was consideredsuccess.
Reflection (CLICK ON ? FOR INSTRUCTIONS): The rate ofsuccess was excellent. The only students who did not get aperfect score identified the equivalence classes correctly,but failed to write the final answer in proper notation.
Program Review Reporting Year: 2012-2013Target : Target MetAll students scored at least 3 points out of 4.88% scored 4 points out of 4. (02/04/2013)
Exam - Course Test/Quiz - Quiz 7:Students were asked to identify thepartition induced on a particular setof integers by an equivalencerelation.
Program Review Reporting Year: 2012-2013Target : Target Met
Exam - Course Test/Quiz - On thefinal exam, the students were asked
09/19/2019 Page 135 of 318Generated by Nuventive Improve

Student LearningOutcomes (SLOs) Assessment Methods Assessment Data Summaries Enhancements
Target for Success: I would like tohave seen more students completean indirect proof such as this onecorrectly. However, there definitelywas evidence of correct orsignificantly correct mathematicalthinking in the first two categories ofstudents, 88% total, describedabove.
Reflection (CLICK ON ? FOR INSTRUCTIONS): Overall, theresults were satisfactory.
56% of the students were able to do the proof correctly orwith one minor mistakes (5 to 6 points out of 6 points). 32%of the students were able to make good progress on theproof, but had one significant or two small errors (4 pointsout of 6). The errors mostly resulted from either not doingthe proof by contradiction and attempting it directly, or bymaking an error at the start of the proof in assuming thecorrect negation. The remaining 12% of the students maderather insignificant progress, but showed someunderstanding (2 out of 6 points). (07/14/2013)
to prove that for any sets A, B and C,if C is a subset of B-A, then theintersection of A and C must beempty. This is a classic proof bycontradiction, which requires thestudent to first correctly identify thenegation of the statement and thencome to a contradiction.
09/19/2019 Page 136 of 318Generated by Nuventive Improve
MATH 23:Engineering Statistics
Student LearningOutcomes (SLOs) Assessment Methods Assessment Data Summaries Enhancements
MATH23_SLO_1 - Organize, analyze,and utilize appropriate methods todraw conclusions based on sampledata by constructing and/orevaluating tables, graphs, andnumerical measures of characteristicsof data.
SLO Status: Active
MATH23_SLO_2 - Use calculus basedmathematics to construct, analyze,apply, and simulate probability andsampling distributions in theory andapplications, and to justifyappropriate statistical analyses andinferential methods.SLO Status: Active
MATH23_SLO_3 - Collect data,interpret, compose and defendconjectures, and communicate theresults of random data usingstatistical analyses such as intervaland point estimates, hypothesis tests,and regression analysis.SLO Status: Active
09/19/2019 Page 137 of 318Generated by Nuventive Improve
MATH 241:Academic Excellence in Precalculus
Student LearningOutcomes (SLOs) Assessment Methods Assessment Data Summaries Enhancements
MATH241_SLO_1 - Analyze anddevelop linear, polynomial,exponential, logarithmic and implicitfunction models.
Planned Assessment Quarters: 2012-13 2-Fall
SLO Status: Active
Reflection (CLICK ON ? FOR INSTRUCTIONS): Moreemphasis needs to be placed on (i) algebraic manipulation,(ii) multiple representations of a function, especiallygraphical interpretation; (iii) transformations of parentfunctions; (iv) characteristics of parent functions, such asdomain, range, intercepts, & symmetry.
Enhancement: I will allocate moretime in class toward havingstudents graph transformations offunctions, labeling all of the keyaspects of the graph anddescribing the effects on eachfrom the transformations. I willalso administer the same types ofproblems the next time I teachmath 41 and track the progressmade. (02/14/2013)
Program Review Reporting Year: 2012-2013Target : Target MetOut of 42 students taking MT #3, 11 students performedwell (earning at least 90%) on all 4 problems, 8 studentsperformed well on 3 of 4 problems, 9 students performedwell on 2 of 4 problems, 7 students performed well on 1 of4 problems, and 7 students performed well on 0 of 4problems. (02/14/2013)
Exam - Course Test/Quiz - Look atstudent performance on four MT #3problems, in which students wereasked to evaluate, graph, andtransform algebraic &transcendental functions.
Reflection (CLICK ON ? FOR INSTRUCTIONS): Students wereable to identify & explain the differences betweenexponential & logarithmic relationships reasonably well.They also did a good job computing the various valuescorrectly. The most recurring issues were explanations ofthe differences & using the logarithmic function in anexponential equation to solve for unknowns.
Program Review Reporting Year: 2013-2014Target : Target Met60% of the class scored 90-100%15% of the class scored 80-90%10% of the class scored 70-80%15% of the class scored <70% (01/24/2014)
Exam - Course Test/Quiz - Used 2problems - one involving anexponential relationship & the othera logarithmic - to assess. Studentswere given a situation and askedwhat type of relationship there wasbetween the variables & why; then,they used data to create a function& evaluated various values using thefunction.
Target for Success: At least 70% ofthe questions are answered correctly
Reflection (CLICK ON ? FOR INSTRUCTIONS): Moreemphasis needs to be placed on (i) using exponential &logarithmic functions to solve equations; (ii)
Program Review Reporting Year: 2014-2015Target : Target MetOut of 32 students taking exams 1-3, 11 students performedwell (earning at least 90%) on 4-5 problems, 8 studentsperformed well on 3 of 5 problems, 6 students performedwell on 2 of 5 problems, and 7 students performed well on0-1 of the 5 problems. (12/25/2014)
Exam - Course Test/Quiz - 5problems from exams 1-3 (1 eachfrom the different function models)in which students are asked toanalyze & develop models.
09/19/2019 Page 138 of 318Generated by Nuventive Improve

Student LearningOutcomes (SLOs) Assessment Methods Assessment Data Summaries Enhancements
transformations of parent functions; (iii) using sign analysisto sketch the graphs of polynomial & rational functions.
MATH241_SLO_2 - Communicateconcepts and solutions for problemsboth verbally and in writing.SLO Status: Active
Reflection (CLICK ON ? FOR INSTRUCTIONS): Moreemphasis needs to be placed on dissecting an applicationproblem and (i) converting the information intomathematical expressions; (ii) understanding whichmathematical formulas & procedures to use.
Enhancement: Include many moreopportunities for students to workin groups, dissecting anapplication problem and workingtowards solving it. Then, give timein which the instructor elicitsresponses and discusses multipleways of interpreting and solvingthe problem. (02/14/2013)
Program Review Reporting Year: 2012-2013Target : Target MetOut of 42 students taking the final exam, 14 studentsperformed well (earning at least 90%) on all 3 problems, 12students performed well on 2 of 3 problems, 8 studentsperformed well on 1 of 3 problems, and 8 studentsperformed well on 0 of 3 problems. (02/14/2013)
Exam - Course Test/Quiz - Look atstudent performance on threeapplication problems on the final
Target for Success: High proficiency(>= 90%) for at least 70% of the class
Reflection (CLICK ON ? FOR INSTRUCTIONS): Students wereable to identify & explain the differences between linear &logarithmic relationships reasonably well. They also did agood job computing the various values correctly, especiallywith the linear equations. The most recurring issues wereexplanations of the differences & using the exponentialfunction in a logarithmic equation to solve for unknowns.
Program Review Reporting Year: 2013-2014Target : Target Met70% scored >=90%10% scored 80-90%5% scored 70-80%15% scored <70% (01/24/2014)
Exam - Course Test/Quiz - Used 2problems - one involving a linearrelationship & the other alogarithmic - to assess. Studentswere given a situation and askedwhat type of relationship there wasbetween the variables & why; then,they used data to create a function& evaluated various values using thefunction.
Target for Success: At least 70% ofproblems answered correctly
Reflection (CLICK ON ? FOR INSTRUCTIONS): Students wereproficient in explaining differences among linear,exponential, & logarithmic relationships; however, moreemphasis needs to be placed on dissecting an applicationproblem & converting it into mathematical expressions &equations
Program Review Reporting Year: 2014-2015Target : Target Met50% scored >= 90%20% scored 80-90%10% scored 70-80%20% scored <70% (12/25/2014)
Exam - Course Test/Quiz - 3application problems on exams 1-3
09/19/2019 Page 139 of 318Generated by Nuventive Improve

MATH 242:Academic Excellence in Trigonometry
Student LearningOutcomes (SLOs) Assessment Methods Assessment Data Summaries Enhancements
MATH242_SLO_1 - Analyze anddevelop trigonometric models.
Planned Assessment Quarters: 2012-13 3-Winter
SLO Status: Active
Reflection (CLICK ON ? FOR INSTRUCTIONS): A number ofstudents had an issue translating information about acircular ferris wheel to the graph of a sine / cosine function
Enhancement: I will show anapplet of points on the unit circlecorresponding to points on a sine /cosine / tangent graph(10/14/2016)
Program Review Reporting Year: 2015-2016Target : Target Met28 of the 40 students earned 75% to full credit on theproblem; 5 students earned 50-75% credit on the problem;7 students earned less than 50% credit on the problem(10/14/2016)
Reflection (CLICK ON ? FOR INSTRUCTIONS): Manystudents did well on the question. Among students who didnot, issues that occurred were: (1) students misinterpretedthe range of heights as the amplitude; (2) studentsmisinterpreted the min height as the vertical shift; (3)students were unable to write the trigonometric model 2different ways (using sine and then cosine).
Program Review Reporting Year: 2012-2013Target : Target Met25 students met the objective at a high level of proficiency(earning at least 90% on the problem). 8 students met asatisfactory level of proficiency (earning 70-90% on theproblem). 7 students had an unsatisfactory level ofproficiency (earning below 70% on the problem).(06/26/2013)
Exam - Course Test/Quiz - A finalexam question involving a ferriswheel in which students are asked tocreate a trigonometric functionmodeling the height of an individualon the wheel, finding characteristicssuch as height, max, min, frequency,and period.
MATH242_SLO_2 - Communicateconcepts and solutions for problemsboth verbally and in writing.
Planned Assessment Quarters: 2012-13 3-Winter
SLO Status: Active
Reflection (CLICK ON ? FOR INSTRUCTIONS): I willcommunicate more of the potential misconceptions togroups that solve the problem correctly
Program Review Reporting Year: 2015-2016Target : Target MetStudents, in groups of 2-3, presented their solutions toapplication problems involving trigonometric models. Theyexplained their process, solution, stumbles along the way,and potential misconceptions (10/14/2016)
Program Review Reporting Year: 2012-2013Target : Target MetStudents completed various application problems in teams,
Presentation/Performance -Students complete applicationproblems, explain their solutions inwriting as well as using equations &formulas, and present their solutionsto the class
09/19/2019 Page 140 of 318Generated by Nuventive Improve

Student LearningOutcomes (SLOs) Assessment Methods Assessment Data Summaries Enhancements
Reflection (CLICK ON ? FOR INSTRUCTIONS): Students metthe target. Some areas of improvement and potentialfuture issues include: (1) developing writing skills for Englishlanguage learners; (2) Getting students to explain ideas &concepts more than their procedures during presentations.
explained their solution algebraically & in writing, and thenpresented their findings to the class. Problems included:ferris wheel trigonometric models; bearings of planesinvolving Law of Cosines & Law of Sines; angle of elevation /depression problems involving right triangle trigonometry(06/26/2013)
09/19/2019 Page 141 of 318Generated by Nuventive Improve

MATH 243:Academic Excellence in Precalculus
Student LearningOutcomes (SLOs) Assessment Methods Assessment Data Summaries Enhancements
MATH243_SLO_1 - Analyze anddevelop trigonometric, matrix, anddiscrete models for problems withintwo- and three- dimensionalCartesian or polar coordinatesystems.SLO Status: Active
Target for Success: Correct solution& clear & coherent explanation
Reflection (CLICK ON ? FOR INSTRUCTIONS): Students areproficient at the matrix row operations but have troublewith notation, labeling their row operations
Enhancement: I will showexamples of notation for eachtype of row operation to betterprepare students (10/14/2016)
Program Review Reporting Year: 2015-2016Target : Target MetStudents worked in groups of 3-4 students & completedmatrix model problems & then presented their solutions infront of class. All groups completed problems correctly &explained solution (10/14/2016)
Reflection (CLICK ON ? FOR INSTRUCTIONS): Students areproficient in (1) setting up system of equations; (2) findingsolution using matrix operations. Students have difficultyrepresenting solutions to systems of linear equationsgraphically and differentiating among solutions that arerepresented graphically as a point, line, plane, or 3-space.
Program Review Reporting Year: 2012-2013Target : Target MetStudents worked in groups of 3-4 students & completedmatrix model problems & then presented their solutions infront of class. All groups completed problems correctly &explained solution (09/22/2013)
Presentation/Performance -Students complete & present thesolution to a matrix model problem
Target for Success: Correct solution.Understandable & clear presentation
Reflection (CLICK ON ? FOR INSTRUCTIONS): Students hadthe most difficulty explaining and visualizing the graphicaldifference among 0, 1, and infinitely many solutions
Enhancement: I will show anapplet displaying the graphicaldifference among 0, 1, andinfinitely many solutions(10/14/2016)
Program Review Reporting Year: 2015-2016Target : Target MetStudents worked in groups of 2-4 & completed a linearsystem & matrix application problem & then presentedtheir solutions in front of the class. All groups completedproblems corrected & 1-2 students per group presentedsolution & answered questions from the class & myself.(10/14/2016)
Program Review Reporting Year: 2013-2014Target : Target MetStudents worked in groups of 2-4 & completed a linearsystem & matrix application problem & then presentedtheir solutions in front of the class. All groups completed
Presentation/Performance -Students complete & present thesolution to a linear system & matrixapplication problem to the class.
09/19/2019 Page 142 of 318Generated by Nuventive Improve

Student LearningOutcomes (SLOs) Assessment Methods Assessment Data Summaries Enhancements
Reflection (CLICK ON ? FOR INSTRUCTIONS): Studentscorrectly set up systems of equations, found the solutionusing matrix operations & checked their solution using acalculator. Students have difficulty explaining the differencegraphically among no, one, and infinite solutions.
problems corrected & 1-2 students per group presentedsolution & answered questions from the class & myself.(12/24/2014)
MATH243_SLO_2 - Communicateconcepts and solutions for problemsboth verbally and in writing.SLO Status: Active
Target for Success: Correct solutions& clear & coherent explanations
Reflection (CLICK ON ? FOR INSTRUCTIONS): Students weresuccess presenting expressing their solutions in writing,describing each of the main steps in writing. However, anumber of students, notably international students, stillstruggle with expressing their mathematical ideas orally infront of class.
Program Review Reporting Year: 2012-2013Target : Target MetStudents worked in groups of 3-4 students & completedmatrix model problems & then presented their solutions infront of class. All groups completed problems correctly &explained solution (09/22/2013)
Presentation/Performance -Students complete & presentsolutions to the practice final examproblems.
Target for Success: Correct solution.Understandable & clear presentation
Reflection (CLICK ON ? FOR INSTRUCTIONS): Students wereproficient in explaining the algebraic operations needed tocomplete the problem. However, a number of students stillhave difficulty expressing multiple representations (i.e.graphical representation of infinite solutions to system ofequations)
Program Review Reporting Year: 2015-2016Target : Target MetStudents worked in groups of 2-4 & completed a linearsystem & matrix application problem & then presentedtheir solutions in front of the class. All groups completedproblems corrected & 1-2 students per group presentedsolution & answered questions from the class & myself.(12/24/2014)
Presentation/Performance -Students complete & present thesolution to a linear system & matrixapplication problem to the class.
09/19/2019 Page 143 of 318Generated by Nuventive Improve

MATH 2A:Differential Equations
Student LearningOutcomes (SLOs) Assessment Methods Assessment Data Summaries Enhancements
MATH2A_SLO_1 - Construct andevaluate differential equation modelsto solve application problems.
Planned Assessment Quarters: 2012-13 2-Fall
SLO Status: Active
Outcome Creation Date: 09/24/2012
Target for Success: The studentsshould be able to complete eachtask at a level of 60% and above forsuccess. Reflection (CLICK ON ? FOR INSTRUCTIONS):
MATH_2A_SLO_1 is difficult for students who take anintroductory differential equations course. A constructionof models for phenomena from different field of sciencerequire acquaintance with some Laws pertained to asubject matter. So some students need to comprehendthese laws in conjunction with learning theory on solvingdifferential equations.
Enhancement: The main difficultyexperienced by the students whenthey have been assessed on SLO 1is a construction of thecorresponding differentialequation model, i.e. to transformthe word description of theprocess into the correspondinginitil value problem. I plan todevelop a handout dealing withthis issue. Namely, it will contain4 type of problems, which requireto transform the physicalexperiment into the initial valueproblem for 1st or 2nd orderdifferential equation.(09/30/2013)
Program Review Reporting Year: 2012-2013Target : Target MetMATH-2A_SLO_1 has been assessed on Test 2. Thedistribution of grades is the following:>=90%---4 students; >=80%---13; >=70%----16 students;>=60%---5 students; <60%----0 student. (07/31/2013)
Reflection (CLICK ON ? FOR INSTRUCTIONS): The results onthe assessment of MATH_2A_SLO_1 are lower comparingwith the results on the assessment of MATH-2A_SLO2. Thiscan be explained that a construction and evaluating modelsusing Differential Equations is much more complicated task,comparing with more formal MATH-2A_SLO-2, where thedifferential equation is given in advance and a studentneeds just to choose an appropriate technique. Setting up amodel requires sometimes to knoe specific laws from thecorresponding branch of science (physics, chemistry,biology, etc.).This contributes to the difficulties, experienced by studentsperformimg this task.
Enhancement: The main difficultyexperienced by the students onSLO 1 is the transformation of theword description of the physicalexperiment into the correspondinginitial value problem for theappropriate differential equation.The special handout will bedeveloped to help students tolearn this type of translation,including the initial valueproblems for 1 st and 2nd orderdifferential equations.(09/30/2013)
Program Review Reporting Year: 2012-2013Target : Target MetMATH2A_SLO_1 has been assessed mainly on Test 2. Thedistribution of grades on Test 2 is the following :>=90%---5 students; >=80%---13; >=70%----7 students;>=60%---13students; <60%----0 student. (07/31/2013)
Exam - Course Test/Quiz - Thestudents will be assessed in coursethrough Tests , quizzes, and Projects.
09/19/2019 Page 144 of 318Generated by Nuventive Improve

Student LearningOutcomes (SLOs) Assessment Methods Assessment Data Summaries Enhancements
Reflection (CLICK ON ? FOR INSTRUCTIONS): Most of thestudents who dropped or withdrew from the class haddifficulties with integration techniques which is essential insolving differential equation problems. Of the students whoremained, some of them had difficulties with some of theconcepts, and in analyzing differential equations problems,and in applying appropriate solution techniques.
Enhancement: The specialhandout will be developed to helpstudents correctly to transform aword description of a physicalexperiment into the correspondinginitial value problem for 1st or 2ndorder differential equation(09/30/2013)
Program Review Reporting Year: 2012-2013Target : Target MetThe students who completed the course, met the requiredand stated target for success with more than 50% attainingaLevel of success of more than 80%. (12/20/2012)
Target for Success: 70% of thestudents get 70% or more on thefinal.
Reflection (CLICK ON ? FOR INSTRUCTIONS): The studentsdid very well in the final that could be due to the time wespent reviewing and practicing the skills.
Program Review Reporting Year: 2013-2014Target : Target Met29 out of 35 students passed the final. (11/07/2014)
Exam - Course Test/Quiz - Studentsskill was assessed through thecomprehensive final.
Target for Success: 70% of studentsget a grade of 70 or higher.
Reflection (CLICK ON ? FOR INSTRUCTIONS): The studentsdid very well in this exam and seemed to understand thematerial for this exam although there is definitely room forimprovement.
Enhancement: I will beincorporating more applicationproblems for future quarters.(10/08/2017)
Program Review Reporting Year: 2016-2017Target : Target Met27 out of 38 students taking this exam passed. (about 71%)(10/08/2017)
Exam - Course Test/Quiz - Exam twocovered the objectives in this SLO.
MATH2A_SLO_2 - Classify, solve andanalyze differential equationproblems by applying appropriatetechniques and theory.
Planned Assessment Quarters: 2012-13 2-Fall
SLO Status: Active
Outcome Creation Date: 09/24/2012
Target for Success: The studentsshould be able to complete eachtask at a level of 60% and above forsuccess.
Program Review Reporting Year: 2012-2013Target : Target Not MetMATH_2A_SLO_2 has been assessed through Test 1 andTest 3 of the course. The distributions of grades are thefollowing:Test 1:>=90%---16 students; >=80%---11; >=70%----4students; >=60%---4 students; <60%----4 student.Test 3: >=90%---28 students; >=80%---0; >=70%----2students; >=60%---2 students; <60%----0 student.The targethas been met on Test 3, but not on Test 1. (07/31/2013)
Exam - Course Test/Quiz - Thestudents will be assessed in coursethrough tests , quizzes, and acomprehensive final exam.
09/19/2019 Page 145 of 318Generated by Nuventive Improve

Student LearningOutcomes (SLOs) Assessment Methods Assessment Data Summaries Enhancements
Reflection (CLICK ON ? FOR INSTRUCTIONS): The fact that 4students failed Test 1 is a confirmation that some studentsregistered for the class actually are not prepared for thesophistication of the concepts and the methods developedand employed in the class. Those who "survived" Test 1 aresuccessful in the course under normal circumstances. Theresults of Test 3 show that the students who did notwithdraw form the class are very successful incomprehension of the course material.
Reflection (CLICK ON ? FOR INSTRUCTIONS): SLO2 of thecourse is more formal than SLO1. It requires to learn theclassification of differential equations, learn thecorresponding techniques to solve them and decide whichmethod should be applied for a particular differentialequations.Most of the students were highly successful inperforming this task as we can conclude from the results onTest 1 and Test 3.
Program Review Reporting Year: 2012-2013Target : Target MetSLO2 for MATH-2A class has been done through Test 1 andTest 3. The distribution of grades is the following.Test 1: >=90%---15 students; >=80%---11; >=70%----1students; >=60%---1 students; <60%----0 student.Test 3: >=90%---16 students; >=80%---10; >=70%----1students; >=60%---1 students; <60%----0 student.(07/31/2013)
Reflection (CLICK ON ? FOR INSTRUCTIONS): Most of thestudents who dropped or withdrew from the class haddifficulties with integration techniques which is essential insolving differential equation problems. Of the students whoremained, some of them had difficulties with some of theconcepts, and in analyzing differential equations problems,and in applying appropriate solution techniques.
Program Review Reporting Year: 2012-2013Target : Target MetThe students who completed the course, met the requiredand stated target for success with more than 50% attaininga level of success of more than 80%. (04/02/2013)
Enhancement: Students wereProgram Review Reporting Year: 2012-2013
09/19/2019 Page 146 of 318Generated by Nuventive Improve

Student LearningOutcomes (SLOs) Assessment Methods Assessment Data Summaries Enhancements
Reflection (CLICK ON ? FOR INSTRUCTIONS): Most of thestudents who dropped or withdrew from the class haddifficulties with integration techniques which is essential insolving differential equation problems. Of the students whoremained, some of them had difficulties with some of theconcepts, and in analyzing differential equations problems,and in applying appropriate solution techniques.
given extensive integral tables.Problems were classified to enablethe students to easily identify theappropriate and applicablesolution techniques. Projects, withstep by step guidance, were givento enhance the students ability toanalyze and solve different typesof differential equations.(12/20/2012)
Target : Target MetThe students who completed the course, met the requiredand stated target for success with more than 50% attainingaLevel of success of more than 80%. (12/20/2012)
Reflection (CLICK ON ? FOR INSTRUCTIONS): 86% ofstudents did very well in the final. That could be because ofthe fact that we spent a lot of time reviewing thetechniques and after a quarter they knew how to approachmost of the problems. Still 14% did not do as hoped. Thatcould be due to the time elapsed since we covered some ofthe earlier techniques and models. Maybe next time we willhave a review of the earlier techniques to solve that issue.Overall the results exceed expectation.
Program Review Reporting Year: 2012-2013Target : Target MetFor this assessment I use the final test score. The final hadquestions addressing each and every portion of this SLO.Target is that 80% of students will get 70% or higher.(12/11/2012)
Target for Success: 70% of studentsget 70% or more on the final. Reflection (CLICK ON ? FOR INSTRUCTIONS): Almost half of
the test revolved on this skill and students did very well.That could also be because of the extended time spent inpracticing these skills.
Program Review Reporting Year: 2013-2014Target : Target Met29 out of 35 students did very well on the final and passed.(11/07/2014)
Exam - Course Test/Quiz - Acomprehensive written final wasused.
Enhancement: Although theresults were good I feel I will addmore applications in the class.
Program Review Reporting Year: 2016-2017Target : Target Met30 out of 36 students who took the exam passed with a
Exam - Course Test/Quiz - Ourcomprehensive final covered theobjectives in this SLO.
09/19/2019 Page 147 of 318Generated by Nuventive Improve

Student LearningOutcomes (SLOs) Assessment Methods Assessment Data Summaries Enhancements
Target for Success: 70% of studentsget a grade of 70 or higher. Reflection (CLICK ON ? FOR INSTRUCTIONS): The result was
much better than expected but that could be because thespecial focus on these objectives this quarter.
(10/08/2017)grade of 70 or higher (83%). (10/08/2017)
09/19/2019 Page 148 of 318Generated by Nuventive Improve

MATH 2B:Linear Algebra
Student LearningOutcomes (SLOs) Assessment Methods Assessment Data Summaries Enhancements
MATH2B_SLO_1 - Construct andevaluate linear systems/models tosolve application problems.SLO Status: Active
Target for Success: The student setup a system of linear equations in anunknown quantity, then use anelimination method to solve for theunknowns.
Reflection (CLICK ON ? FOR INSTRUCTIONS): Moreapplications could be used, though students areunderstanding what is presented.
Program Review Reporting Year: 2013-2014Target : Target Met27/29 students completed this topic correctly on an exam(01/06/2014)
Reflection (CLICK ON ? FOR INSTRUCTIONS): Spend moretime preparing students back ground knowledge on RLCcircuits using hand outs and reading references. Thealternative is to have the students work a network problemthat involves traffic flow as this type of problem does notrequire basic knowledge in in science and engineering.
Enhancement: Proved studentswith a handout on Ohm's law andKirchhoff''s voltage and currentlaws and reference material onthese topics. (06/06/2013)
Program Review Reporting Year: 2012-2013Target : Target Met23 out of 36 students had perfect success setting up theequations and finding the correct values for the current, 10students have set up the equations with minor errors incoefficients, and three students had difficulty setting up thesystem of equations. (06/06/2013)
Exam - Course Test/Quiz - A quizquestion in which the students solvea network, RLC circuit) problemusing Ohms law, Kirchkhoff's Voltageand current laws and linear systemof equations to find the value of thecurrent in different parts of thecircuit (network).
Target for Success: 70% of studentssetting a system of linear equationsto find the coefficients.
Reflection (CLICK ON ? FOR INSTRUCTIONS): In order toimprove the results I would next time explain the problemverbally for the students before and assigning thehomework.
Program Review Reporting Year: 2012-2013Target : Target Met29 out of 41 students who turned in their homework set thesystem up correctly and those who set up the systemcorrectly were able to solve the system since the solvingprocess is at a precalculus level. The students who did notcomplete the problem correctly had misread the problem orwere not sure about what was asked from them.(09/23/2013)
Project - For their first homeworkstudents had to set up a system tofind an equation for a circle passingthrough three points.
Enhancement: The next time Iteach the course I plan to allocatemore time to applications.(12/21/2017)
Program Review Reporting Year: 2017-2018Target : Target Met36 students took an exam question asking them to usetechniques of linear algebra to fit a parabola to specified
Exam - Course Test/Quiz - Thestudents were given a final exam inwhich they had to solve anapplication problem (problem #4).
09/19/2019 Page 149 of 318Generated by Nuventive Improve

Student LearningOutcomes (SLOs) Assessment Methods Assessment Data Summaries Enhancements
Target for Success: 70% students getanswer the question correctly. Reflection (CLICK ON ? FOR INSTRUCTIONS): It was
suggested (and I agreed) that I could rearrange the courseto spend more time on applications, possibly including aproject.
points. The average score was 89%. (12/21/2017)
Reflection (CLICK ON ? FOR INSTRUCTIONS): The studentdid well. The application problem was from one of the morerecent topics and students had practiced similar problemsin the days before in class.
Enhancement: I would take similarapproach to this topic for otherapplications as well to get similarresults. (10/08/2017)
Program Review Reporting Year: 2016-2017Target : Target MetOut of the 36 students taking the final 28 of them answeredthe question correctly. (77%) (10/08/2017)
MATH2B_SLO_2 - Solve problems bydeciding upon and applyingappropriate algorithms/conceptsfrom linear algebra.SLO Status: Active
Target for Success: The student useGaussian Elimination to solve linearsystems.
Reflection (CLICK ON ? FOR INSTRUCTIONS): Material couldhave emphasized computational issues more.
Enhancement: Writing handoutsgiving additional material and tipson Gaussian elimination.(12/21/2017)
Program Review Reporting Year: 2017-2018Target : Target Met33 students answered a test question as described aboveand scored an average of 82%. (12/21/2017)
Reflection (CLICK ON ? FOR INSTRUCTIONS): More workcan be done on picking the most effective method
Program Review Reporting Year: 2013-2014Target : Target Met24 out of 28 students completed a question on the finalexam correctly. (01/06/2014)
Reflection (CLICK ON ? FOR INSTRUCTIONS): Make surethat students can identify free variables in the reducedsystem and understanding the rule of leading ones orpivots. The concept was simple enough that most studentswere able to write complete and correct solutions.
Enhancement: Have studentswork out problems that aregraded and returned to studentsbefore testing or assign computerlaps that are graded and andreviewed by students immediatelyupon completion. (06/06/2013)
Program Review Reporting Year: 2012-2013Target : Target MetThe 36 students that answered questions that cover SLO_2had an overall average of approximately 86%. Somestudents made errors in the elimination method thatrequires pencil paper computations, others made mistakesin the problem that requires writing a parametric solution.(06/06/2013)
Exam - Course Test/Quiz - Testquestions in which the studentssolve a linear system of equationsthat have unique solutions, infinitenumber of solution and no solutions.The solution involves using matricesand Gaussian Elimination andreading the solution to the systemfrom the reduced system orparametrize the solution in theinfinitely many solutions case.
09/19/2019 Page 150 of 318Generated by Nuventive Improve

Student LearningOutcomes (SLOs) Assessment Methods Assessment Data Summaries Enhancements
Target for Success: 70% of studentsget a passing score of 70 or higher.
Reflection (CLICK ON ? FOR INSTRUCTIONS): Studentsperformed very well in this test which could mean theyunderstood the concept well. However students whomissed the mark did because of calculation errors and somewere not able to relate linear algebra to the problems. Nexttime I will be doing sample problems to show studentsmethods of approaching problems with the theory of linearalgebra.
Program Review Reporting Year: 2012-2013Target : Target Met38 students out of 46 who participated in test one receiveda grade of 70 or higher which is 82%. (09/23/2013)
Exam - Course Test/Quiz - Exam 1was made up of several problemsthat required linear algebra methodsin solving.
Target for Success: 70% of studentsget a grade of 70 or above.
Reflection (CLICK ON ? FOR INSTRUCTIONS): The studentsdid not do as well as I felt they should have but that couldbe because the level of difficulty of the material and thelittle time between covering the martial and the exam. Theydid much better by the final.
Enhancement: I think using anappropriate worksheet would helpwith this topic and increase thesuccess. (10/08/2017)
Program Review Reporting Year: 2016-2017Target : Target Not MetOut of 36 students who took the test 24 of them received apassing score. (66%) (10/08/2017)
Exam - Course Test/Quiz - Oursecond test was based on this SLO.
MATH2B_SLO_3 - Apply theoreticalprinciples of linear algebra to defineproperties of linear transformations,matrices and vector spaces.SLO Status: Active
Target for Success: The studentsachieve 60% or higher on testsquizzes and homework assignmets..
Reflection (CLICK ON ? FOR INSTRUCTIONS): I think it waseffective relating linear transformations as geometrictransformations on R^n.
Enhancement: Use of graphingsoftware could be used to createillustrations to further illustratethis material. (12/21/2017)
Program Review Reporting Year: 2017-2018Target : Target Met36 students did an exam question on the relation betweenlinear transformations and matrices. The average score was11.3/12 (94%). (12/21/2017)
Reflection (CLICK ON ? FOR INSTRUCTIONS): More workshould be done on creating the matrix representation of atransform and on finding the kernel and inverse of thetransformation
Program Review Reporting Year: 2013-2014Target : Target Met20 out of 28 students completed a question on the finalexam correctly (01/06/2014)
Program Review Reporting Year: 2012-2013Target : Target Met
Exam - Course Test/Quiz - Thestudents solve problems on tests,quizzes and homework in which theydemonstrate their understanding oflinear transformations, theircorresponding matrices and andactions applied to vector spaces.
09/19/2019 Page 151 of 318Generated by Nuventive Improve
Student LearningOutcomes (SLOs) Assessment Methods Assessment Data Summaries Enhancements
Reflection (CLICK ON ? FOR INSTRUCTIONS): none
Approximately 75% of the students who took the final examscored 100% in defining and applying lineartransformations, the other 25% had partial success on atleas one of the problems. (07/01/2013)
Target for Success: 70% of studentsget a passing score of 70 or higher.
Reflection (CLICK ON ? FOR INSTRUCTIONS): The targetwas just barely met. Looking back maybe the time spentwas not as much as some of the students needed inunderstanding the relatively abstract concept of vectorspaces. Next time I will spend more time with examples toclarify the topic more.
Program Review Reporting Year: 2012-2013Target : Target Met31 students out of 44 who participated in test 2 received agrade of 70 or higher. (09/23/2013)
Exam - Course Test/Quiz - Test twowas all problems involving applyingprinciples of linear algebra to lineartransformations and vector spaces(chapter 4 or Anton).
Target for Success: 70% of studentsgetting a grade of 70 or higher.
Reflection (CLICK ON ? FOR INSTRUCTIONS): The classalmost met the target. I think the numbers don't do justiceto the performance. The students picked up the conceptvery well but I feel we could've spent more time on thetopics.
Enhancement: Like other SLO's Iam planning on using moreworksheets for the class.(10/08/2017)
Program Review Reporting Year: 2016-2017Target : Target Metout of 31 student 21 students passed the test (68%)(10/08/2017)
Exam - Course Test/Quiz - Our thirdexam covered this SLO.
09/19/2019 Page 152 of 318Generated by Nuventive Improve

MATH 41:Precalculus I: Theory of Functions
Student LearningOutcomes (SLOs) Assessment Methods Assessment Data Summaries Enhancements
MATH41_SLO_1 - Investigate,evaluate, and differentiate betweenalgebraic and transcendentalfunctions in their graphic, formulaic,and tabular representations.
Planned Assessment Quarters: 2012-13 2-Fall
SLO Status: ActiveTarget for Success: 70% of studentswill achieve a C or better.
Reflection (CLICK ON ? FOR INSTRUCTIONS): Moreemphasis needs to be placed on (i) algebraic manipulation,(ii) multiple representations of a function, especiallygraphical interpretation; (iii) transformations of parentfunctions; (iv) characteristics of parent functions, such asdomain, range, intercepts, & symmetry.
Enhancement: I will allocate moretime in class toward havingstudents graph transformations offunctions, labeling all of the keyaspects of the graph anddescribing the effects on eachfrom the transformations. I willalso administer the same types ofproblems the next time I teachmath 41 and track the progressmade. (02/14/2013)
Program Review Reporting Year: 2012-2013Target : Target MetOut of 42 students taking MT #3, 11 students performedwell (earning at least 90%) on all 4 problems, 8 studentsperformed well on 3 of 4 problems, 9 students performedwell on 2 of 4 problems, 7 students performed well on 1 of4 problems, and 7 students performed well on 0 of 4problems. (02/14/2013)
Exam - Course Test/Quiz - Look atstudent performance on four MT #3problems, in which students wereasked to evaluate, graph, andtransform algebraic &transcendental functions.
Target for Success: There were 12points possible on the problemgiven. Our target would be 70% orhigher in points obtained perstudent.
Related Documents:Math41-W13.xls
Reflection (CLICK ON ? FOR INSTRUCTIONS): The studentswho did not well had done less than 60% of the assignedhomework and in most casese none of the three extra-credit homework assignments.
Enhancement: Increase the weightof the homework toward the finalgrade from 10% to 15%.(01/25/2017)
Program Review Reporting Year: 2016-2017Target : Target Not Met60% of students achieved 75% of questions correctly(01/25/2017)
Reflection (CLICK ON ? FOR INSTRUCTIONS): PROS:Students did a very good job explaining the transformationin words, using terminology like phase shift, stretch, shrink/ compress, & reflect well. They also did a good jobtransforming the coordinate points from the parent totransformed function. CONS: Students have difficultytransforming when there are 2-3 transformations with theinput variable.
Program Review Reporting Year: 2013-2014Target : Target Not Met65% scored >=90%10% scored 80-90%10% scored 70-80%15% scored <70% (01/24/2014)
Comments/Notes: The averagepoints obtained per student was6.5/12 or 54%. This is below whatwe have hoped for. We feel we needto do a better job on either teachingor reviewing graphing functions andapplying transformations beforegiving test.
Exam - Course Test/Quiz - Graph thegiven functions by hand.Functions are exponential and logfunction with transformations.Students were graded forcompletion and accuracy in graphcreation.
Exam - Course Test/Quiz - Used
09/19/2019 Page 153 of 318Generated by Nuventive Improve

Student LearningOutcomes (SLOs) Assessment Methods Assessment Data Summaries Enhancements
Target for Success: There were atotal of 20 points possible for the 2questions. The target was highproficiency (>=90%) on 70% of theexams.
formulaic representations oftransformations of 2 functions - alogarithmic & an exponential - andhad students, on an exam, describethe transformations (1) in words; (2)based on how the points aretransformed; (3) based on how thegraph is transformed. Students wererequired describe all 3 and thensketch the graph of the transformedfunctions
Reflection (CLICK ON ? FOR INSTRUCTIONS): I am pleasedwith the results. But, I will continue to work on expandingtechniques of graphing when teachingRelated Documents:SLO Data W14.xls
Program Review Reporting Year: 2013-2014Target : Target MetAfter totaling the scores for this problem on the final exam,the average score was 12.2 out of 15 for an average percentof 81.39%. This well exceeds my target of success.(04/15/2014)
Exam - Course Test/Quiz - Useproblem from #3 from Final Examwhich requires student to graph arational function showing all steps.
3. Consider the rationalfunction: f(x)= (x^2 - x - 2)/(x^2 - 5x+ 6)(a) Factor the top & bottom &write f(x)in factored form(b) Find the domain of f(x) .Determine if f(x) has any verticalasymptotes and/or holes and wherethese would be.(c) If f(x) has any commonfactors to cancel, cancel them andwrite f(x)in reduced form. You canuse the reduced form for the rest ofthe problem. If has no commonfactors to cancel, proceed with theoriginal .(d) Find the x-intercept(s) (ifany).(e) Find the y-intercept (if it
09/19/2019 Page 154 of 318Generated by Nuventive Improve

Student LearningOutcomes (SLOs) Assessment Methods Assessment Data Summaries Enhancements
Target for Success: The total pointsfor this problem is 15, so I am hopingthat students get 70% or higher (10points or higher).
exists).(f) Find the equation of anyhorizontal asymptote for .(g) Sketch the graph of f(x)bytesting points on either side of eachvertical asymptote.
Target for Success: Expect morethan75% of the students to sketchthe graph nearer to accuracy and>=10% of the students to be able toat least get the shape of the graph.
Reflection (CLICK ON ? FOR INSTRUCTIONS): Most of thestudents who failed in graphing rational functions startedout without simplifying the given function and in finding thezeros by factoring. A handfull of students did notunderstand the nature of asymtotes. Around 10% of thestudents did not get the correct transformations from thestandard functions.
Program Review Reporting Year: 2013-2014Target : Target MetMore than 72% of the students were able to graph thefunctions closer to accuracy. About 16% could identify thenature of the function and get closer to the shape of thecurve. 15% made mistakes in finding the zeros andidentifying the asymptotes of rational function.(06/25/2014)
Exam - Course Test/Quiz - In theMidterm and Final Exam studentswere asked to recognize, analyseand graph the given functions byhand. Functions are rational,exponential and logarithmic functionwith transformations. Students weregraded for completion and accuracyof the graph.
Reflection (CLICK ON ? FOR INSTRUCTIONS): It seems thatsome students were struggling with finding the domain and
Enhancement: Having graphingcalculators (TI-83 or TI-84) wouldbe helpful for students who wantto graph the functions usingtechnology to further understandanalyzation. (10/18/2016)
Program Review Reporting Year: 2015-2016Target : Target MetOf the 80 students who took this exam, 62 were able toearn at least 8 points on this problem. This accounts for77.5% of the entire class. (06/11/2016)
Exam - Course Test/Quiz - On thesecond midterm of the quarter,students are asked to analyze thefunction g(x)=3(x-1)^2 +2. Theanalyzation process requiresstudents to identify the parentfunction f(x), to describe the
09/19/2019 Page 155 of 318Generated by Nuventive Improve

Student LearningOutcomes (SLOs) Assessment Methods Assessment Data Summaries Enhancements
Target for Success: Our target is that70% of all students are successful onthis problem. They are consideredsuccessful if they are able to answer80% of it. This means that they areable to earn 8 of the 10 possiblepoints. There is little to no work tobe graded as either the answer isright or wrong.
the range of the inverse function of g. In the future, it maybe a good idea to emphasize the relationship between theoriginal function and its inverse function and how thedomain of g is the range of the inverse of g. Similarly, itwould be helpful to graph both functions on the exam sothat the students can clearly see the picture.
transformation from f(x) to g(x) (orvice versa), to determine the domainand range of g(x), and to determinethe domain and the range of it’sinverse function g^-1(x).
Target for Success: Our target is that70% of all students are successful onthis problem. They are consideredsuccessful if they are able to answer80% of it. This means that they areable to earn 8 of the 10 possiblepoints.
Reflection (CLICK ON ? FOR INSTRUCTIONS): It would behelpful to graph both functions on the exam so that thestudents can clearly see the picture. Although I’ve tried thisassessment method in another quarter without the graph, Ithought it would be a good idea to do so again to see ifstudents would graph the functions for themselves toanalyze them. It would be a good idea in the future to havethe graphs provided.
Enhancement: Having graphingcalculators (TI-83 or TI-84) wouldbe helpful for students who wantto graph the functions usingtechnology to further understandanalyzation. (10/24/2017)
Program Review Reporting Year: 2017-2018Target : Target MetOf the 76 students who took this exam, 59 were able toearn at least 8 points on this problem. This accounts for77.6% of the entire class. (10/24/2017)
Exam - Course Test/Quiz - On anexam, students are asked to analyzethe function g(x)=9(x-2)^2 +3. Theanalyzation process requiresstudents to identify the parentfunction f(x), to describe thetransformation from f(x) to g(x) (orvice versa), to determine the domainand range of g(x), and to determinethe domain and the range of it’sinverse function g^-1(x).
Exam - Course Test/Quiz - I used aproblem from Final Exam whichrequired students to graph a rationalfunction by showing all steps.Consider the rational function: f(x) =(x^2 - x - 2)/(x - 1)(a) Find the domain of f(x) .
09/19/2019 Page 156 of 318Generated by Nuventive Improve

Student LearningOutcomes (SLOs) Assessment Methods Assessment Data Summaries Enhancements
Target for Success: This problem isworth 8 points. Target for success isat least 70% or higher (5.6 points orhigher per student).Comments/Notes: The averagepoints obtained per student was5.7/8 or 71%. This is above thetarget success.
(b) Identify all intercept(s).(c) Determine if f(x) has any verticalasymptotes and/or holes.(d) Find any slant or horizontalasymptotes(e) Plot additional solution points asneeded to graph the function.
Target for Success: 70%
Exam - Course Test/Quiz - Studentsare tested on the day of learning thematerial as well as on midterms andthe final exam
Target for Success: The target forsuccess was 70% of students takingthe exam.
Reflection (CLICK ON ? FOR INSTRUCTIONS): I staged thequestion first asking students to draw the parenttranscendental function (e^x) then asked them to graph thetransformation e^-x-4. The initial drawing helped orientthe students.
Enhancement: I'll use additionaltransformations next quarter andwill continue to provideworksheets that help studentsmaster the topic. (12/13/2018)
Program Review Reporting Year: 2018-2019Target : Target MetResponses of results were examined. 72% of students whotook the exam successfully graphed the base transcendentalfunction. (12/13/2018)
Exam - Course Test/Quiz - On thethird midterm, students were askedto graph and analyzetransformations of transcendentalfunctions by hand. Students weregraded for completion and accuracyof the graph.
Enhancement: I'm not sure if thiswould be a good idea - but it'ssomething to consider. Perhaps Icould remind students on the quizto find the domain of the rationalfunction first to remind them thatit's important not to plot pointsthat do not exist (and to use opencircles instead). (01/02/2019)
Program Review Reporting Year: 2017-2018Target : Target MetOf the 38 students who took the quiz, 28 studentscompletely and correctly answered the question (I diddeduct points for minor errors, such as forgetting to putparentheses around coordinate points, but still consideredthe question to be answered correctly). There were 3students who almost answered the questions fully correctly,but I deducted points because they did not use open circles
Exam - Course Test/Quiz - On thesixth quiz of the quarter, studentsare asked to consider a rationalfunction. They are required toidentify the x- and y-intercepts, findany horizontal and verticalasymptotes, and then sketch thegraph (they may choose to usetables or other techniques to sketch
09/19/2019 Page 157 of 318Generated by Nuventive Improve

Student LearningOutcomes (SLOs) Assessment Methods Assessment Data Summaries Enhancements
Target for Success: At least 70% ofthe students should answer thequestion completely and correctly.
Reflection (CLICK ON ? FOR INSTRUCTIONS): I believe thatthere would have been more than 74% of the students whoanswered the question completely and correctly if thestudents had more time during the quiz to check their work.Some of the points that were deducted were due tomistakes that may have been caught if they had a few moreminutes.
for where a point was excluded from the domain of therational function. (01/02/2019)
the graph).
MATH41_SLO_2 - Synthesize, model,and communicate real-lifeapplications and phenomena usingalgebraic and transcendentalfunctions.SLO Status: Active
Target for Success: 70% of studentswill correctly answer questions.
Reflection (CLICK ON ? FOR INSTRUCTIONS): Moreemphasis needs to be placed on dissecting an applicationproblem and (i) converting the information intomathematical expressions; (ii) understanding whichmathematical formulas & procedures to use.
Enhancement: Include many moreopportunities for students to workin groups, dissecting anapplication problem and workingtowards solving it. Then, give timein which the instructor elicitsresponses and discusses multipleways of interpreting and solvingthe problem. (02/14/2013)
Program Review Reporting Year: 2012-2013Target : Target MetOut of 42 students taking the final exam, 14 studentsperformed well (earning at least 90%) on all 3 problems, 12students performed well on 2 of 3 problems, 8 studentsperformed well on 1 of 3 problems, and 8 studentsperformed well on 0 of 3 problems. (02/14/2013)
Exam - Course Test/Quiz - Look atstudent performance on threeapplication problems on midterm orfinal
Target for Success: 70% of thepossible points correct.
Related Documents:Math41-W13-2.xls
Comments/Notes: The mean scorewas 4 out of 10. Students are morecomfortable dealing with numbersrather than variables. Which Ibelieve more practice is necessarywith problems without numbers.
Exam - Course Test/Quiz - Problem:"For a saving account in whichinterest is compoundedcontinuously, derive the tripling timeformula in terms of the interest rater."
Enhancement: Assign more wordProgram Review Reporting Year: 2016-2017Target : Target Met
Exam - Course Test/Quiz - Have 2questions on the final regarding real-
09/19/2019 Page 158 of 318Generated by Nuventive Improve

Student LearningOutcomes (SLOs) Assessment Methods Assessment Data Summaries Enhancements
Target for Success: 75% of studentswill get at least one right.
Reflection (CLICK ON ? FOR INSTRUCTIONS): The studentswho did not do well had difficulty interpreting andanalyzing word problems.
problems. (01/25/2017)80% of students achieved 71% of questions correctly(01/25/2017)
Reflection (CLICK ON ? FOR INSTRUCTIONS): I am pleasedthey did so well, my emphasis on application problemsseems to have paid off.
Program Review Reporting Year: 2012-2013Target : Target MetOf the 32 students taking the final, 30 got at least one of thetwo application questions. In fact 24 (75%) got thealgebraic question right, meeting the target right there!(07/25/2013)
life applications, one algebraic andone transcendental.
Target for Success: High proficiency(>= 90%) for at least 70% of theclass.
Reflection (CLICK ON ? FOR INSTRUCTIONS): Students wereable to identify & explain the differences between linear &logarithmic relationships reasonably well. They also did agood job computing the various values correctly. The mostrecurring issues were explanations of the differences &using the exponential function in a logarithmic equation tosolve for unknowns.
Program Review Reporting Year: 2013-2014Target : Target Met70% scored >=90%10% scored 80-90%5% scored 70-80%15% scored <70% (01/24/2014)
Exam - Course Test/Quiz - Used 2problems - one involving a linearrelationship & the other alogarithmic - to assess. Studentswere given a situation and askedwhat type of relationship there wasbetween the variables & why; then,they used data to create a function& evaluated various values using thefunction.
Reflection (CLICK ON ? FOR INSTRUCTIONS): Target wasmet. I think the problem went well. Was very pleased.Related Documents:SLO Data W14.xls
Program Review Reporting Year: 2013-2014Target : Target MetAfter tallying the scores for problem #2 from the final exam,the average score was 9.83 out of 12 for an averagepercentage of 81.94%. (04/15/2014)
Exam - Course Test/Quiz - Useproblem #2 on Final Exam whichrequires student to create & use areal-life model.2. Suppose the population ofthe world is known to be growingexponentially. In 2000, thepopulation was 6.08 billion and in2010, had risen to 6.85 billion. (a)Find a model , that would give thepopulation of the world, in billions,for years since 2000. (b) After how
09/19/2019 Page 159 of 318Generated by Nuventive Improve
Student LearningOutcomes (SLOs) Assessment Methods Assessment Data Summaries Enhancements
Target for Success: The question isworth 12 points altogether. I amhoping that students score 70% ofthe possible points or higher (8points or higher).
many years will the population reach50 billion (the theoretical capacity ofthe Earth)? What year will this be?
Target for Success: Expected to havemore than 80% of the class tosucceed in building the right modelfor at least one of the 2 problems.70% to solve completely these real-life problem completely.
Reflection (CLICK ON ? FOR INSTRUCTIONS): Overall theunderstanding of the real-life application of function wasgood.
Program Review Reporting Year: 2013-2014Target : Target Met78 students (2 sections) took the final exam covering thesetwo types of real-life problems. 77% of the student got atleast one of the two questions completely correct. Amongthe other students most of them wrote the models correctbut made mistakes in solving the exponential equation.(06/27/2014)
Exam - Course Test/Quiz - Twoquestions are given in the finalexam, to find a suitablemathematical model to representthe real-life problems, showing therelationship between the variablesand evaluating the unknown. Thefirst one is to build a model todetermine the interest earnedthrough an investment compoundedannually vs. compoundedcontinuously. The second is to buildan exponential growth/decay modelto solve a radio-active decayproblem.
Reflection (CLICK ON ? FOR INSTRUCTIONS): Students wereable to model real-life applications using mathematicalequations. The translation portion from words to math
Enhancement: It would be nice tohave all students have access to agraphing calculator (TI-83 or TI-84)so that the data points could beplotted and viewed easily. Thiswould further emphasize the ideaof interpolation or extrapolation.(10/18/2016)
Program Review Reporting Year: 2015-2016Target : Target MetOf the 80 students who took the exam, 67 were able toanswer the question fully, earning either 4 or 5 of the totalof 5 points on the problem. Since 67 of 80 (approximately84%) students were successful on this problem, the targethas been met. (05/05/2016)
Exam - Course Test/Quiz - Studentsare asked to answer the followingquestion on a midterm exam duringthe Winter 2016 quarter: The salesfor Apple, Inc. in 2004 wereapproximately $8.28 billion. In 2010,the sales were approximately $65.23billion. Find the equation of the linethat would represent the sales ofApple, Inc. If necessary, round the
09/19/2019 Page 160 of 318Generated by Nuventive Improve
Student LearningOutcomes (SLOs) Assessment Methods Assessment Data Summaries Enhancements
Target for Success: 70% of allstudents are successful on thisproblem if they are able to answer80% of it. This means that they areable to earn 4 of the 5 possiblepoints. The first part is worth 3points and the second part is worth2 points (explanation of whether theexample is an interpolation or anextrapolation).
tends to be a more difficult part of math for some students,but it seems that with doing lots of practice problems priorto the exam day, the students were successful.
slope to the nearest two decimalplaces. Using the equation from parta, predict the sales for 2016. Thenbriefly explain why this prediction isan example of interpolation orextrapolation.
Target for Success: 70% of allstudents are successful on thisproblem if they are able to answer80% of it. This means that they areable to earn 4 of the 5 possiblepoints. The first part is worth 3points and the second part is worth2 points (explanation of whether the
Reflection (CLICK ON ? FOR INSTRUCTIONS): Students wereable to model real-life applications using mathematicalequations. It was also great that immediately following thereturn of the exams, I was able to use desmos todemonstrate the idea of interpolating and extrapolatingdata.
Enhancement: It would be nice tohave all students have access to agraphing calculator (TI-83 or TI-84)so that the data points could beplotted and viewed easily. Thiswould further emphasize the ideaof interpolation or extrapolation.(10/24/2017)
Program Review Reporting Year: 2016-2017Target : Target MetOf the 76 students who took the exam, 67 were able toanswer the question fully, earning either 4 or 5 of the totalof 5 points on the problem. Since 67 of 76 (approximately88.1%) students were successful on this problem, the targethas been met. (10/24/2017)
Exam - Course Test/Quiz - Studentsare asked to answer the followingquestion on a midterm exam duringthe Spring 2017 quarter: The salesfor Target in 2004 wereapproximately $8.28 billion. In 2010,the sales were approximately $65.23billion. Find the equation of the linethat would represent the sales ofTarget. If necessary, round the slopeto the nearest two decimal places.Using the equation from part a,predict the sales for 2016. Thenbriefly explain why this prediction isan example of interpolation orextrapolation.
09/19/2019 Page 161 of 318Generated by Nuventive Improve

Student LearningOutcomes (SLOs) Assessment Methods Assessment Data Summaries Enhancements
example is an interpolation or anextrapolation).
Target for Success: Problem 22 isworth 4 points and problem 23 isworth 4 points. Total 8 points.Target for success is at least 70% orhigher (5.6 points or higher perstudents).
Exam - Course Test/Quiz - I usedtwo problems from Final Exam #22and #23.(#22) Compound interest problem. Atotal of $12,000 is invested at anannual interest rate of 9%. Find thebalance after 5 yeas if it iscompounded monthly andsemiannually.(#23) A sculpture has hyperboliccross section, figure is given. Writean equation that models the curvedsides of the sculpture.
Target for Success: 70%
Exam - Course Test/Quiz -homework completion and similarquestions on midterms and the finalexam
Target for Success: We would like toReflection (CLICK ON ? FOR INSTRUCTIONS): This was agood question to determine if students can apply
Enhancement: After grading theexam, it's helpful to show thestudents all of the solutions sothat if there were any mistakes orany confusion, this could becleared immediately. As stated inthe reflection, I would rewrite theproblem to have 3 parts to be veryclear on what is expected from thestudents in their solutions.(12/13/2018)
Program Review Reporting Year: 2017-2018Target : Target MetOf the 38 students who took the final exam, 35 answeredthe question (3 did not attempt the problem). Of the 35students who attempted the problem, 27 studentscompleted at least 70% of the problem, meaning that theywere able to identify the model, find the model, and thenanswer the question using the model. The other 8 studentsdid not correctly identify the model (exponential growth).This means that 27/35 students were successful inanswering the question, which accounts for about 77% ofthe students who attempted the problem. (12/12/2018)
Exam - Course Test/Quiz - Studentsare tested (on an exam) on anapplication problem regardingexponential growth. They arerequired to identify that it is anexponential growth problem (asopposed to exponential decay,logarithmic, or logistic). They arealso required to find the model thatrepresents the problem, and thenanswer a question about theproblem using the model that theyfound.
09/19/2019 Page 162 of 318Generated by Nuventive Improve

Student LearningOutcomes (SLOs) Assessment Methods Assessment Data Summaries Enhancements
see at least 70% of the problemcompleted. This means that thestudents are able to identify themodel, find the model (even if someof the numbers are off), and thenanswer the question using themodel.
exponential functions to answering real-life applications. Ifelt that the students were given enough time to attemptthe problem, even though 3 students did not try theproblem at all. I believe that the problem was writtenclearly, although it may have been helpful to have variousparts, prompting students to first identify the model in parta, write the model in part b, and then answer the questionin part c, though some may argue that students need to beable to go through this work on their own to truly test theirunderstanding. Perhaps the step-by-step approach shouldhave been clearly explained in class first.
09/19/2019 Page 163 of 318Generated by Nuventive Improve

MATH 42:Precalculus II: Trigonometric Functions
Student LearningOutcomes (SLOs) Assessment Methods Assessment Data Summaries Enhancements
MATH42_SLO_1 - Formulate,construct, and evaluate trigonometricmodels to analyze periodicphenomena, identities, andgeometric applications.SLO Status: Active
Target for Success: For the averagepercentage of the problem donecorrectly students to be at or above75%.
Reflection (CLICK ON ? FOR INSTRUCTIONS): Well, theresults were disappointing although one class did almostmeet the target of 70%. Both classes were taught the samemethods and given the same assignments. As mentionedearlier, the problem used for assessment is a difficultproblem, if not the most difficult problem, the studentsencountered during the quarter requiring many taughtskills. In the future, I will continue to teach the material thesame way, but might assign more problems for practice.Related Documents:SLO Data W17.xls
Program Review Reporting Year: 2016-2017Target : Target Not MetData was collected for two classes. Average score for class#1 was 57.86% and for class #2 it was 67.68%. So, bothclasses fell short of target of 70%. Interestingly, one classhad a significantly higher score than the other. Thecombined score for both classes was 62.77%. (04/16/2017)
Reflection (CLICK ON ? FOR INSTRUCTIONS): I am verypleased with the results and frankly, was not expectingthem. This quarter, I did a little more to teach the conceptsof the law of Sines such as giving an in class handout.However, I think overall, the main reason why the averagescore was higher was the make-up of students in this classas opposed to the fall. The students, overall, were higherachieveing in all aspects of the class.Related Documents:SLO Data W-S 13.xls
Program Review Reporting Year: 2012-2013Target : Target MetAs in the fall, each student's answer was reviewed andassigned a point score from 1 to 10 in completing theproblem. The average student score was 9.114, whichtranslates to a 91.14% correct per student per problem. Thismore than exceeded the target of success of 75% and wassignificantly higher that the average student score of 79%for the fall. (04/19/2013)
Comments/Notes: P
Exam - Course Test/Quiz - Used aLaw of Sines problem from the finalexam to assess student's ability toformulate and evaluatetrigonometric models of a geometricapplication. Student was required touse the Law of Sines twice in theproblem in order to get the correctsolution. Problem was not seen bystudents previously in course.
09/19/2019 Page 164 of 318Generated by Nuventive Improve

Student LearningOutcomes (SLOs) Assessment Methods Assessment Data Summaries Enhancements
Reflection (CLICK ON ? FOR INSTRUCTIONS): Overall, I wassatisfied with the results, especially since the students hadnot seen a problem quite like that one on any previoushomework, quiz or test (I got & used a problem from adifferent text after seeing it and liking it). For the most part,students either got the entire problem correctly or missed italmost completely...not much in between.Related Documents:Math 42 SLOAC Data.xlsxProblem.doc
Enhancement: Performed theexact same action as in January.Gave the same problem on finalexam as in Fall quarter. Again,students did not know ahead oftime the problem they were goingto be given and final examquestions from the fall were notgiven out. Average student scorefor Winter quarter was 91.14%,significantly higher that in the fall.(04/19/2013)Enhancement: Hope to readminister the same type ofproblem and assessment at theend of the Winter 2013 quarterand compare outcomes.(04/15/2013)
Program Review Reporting Year: 2012-2013Target : Target MetThe average percentage of the problem done correctly bystudents was 79.73%, meaning on average, studentscompleted 79.73% of the problem correctly. This is ontarget and represents a passing score on this problem(grade of C+) (01/30/2013)
Target for Success: 70% of thestudents assessed will achieve 70%or better on the assessment
Reflection (CLICK ON ? FOR INSTRUCTIONS): Trigonometry,unlike the other courses in the 41-42-43 series where sometopics are repeated, presents new and totally unfamiliarconcepts to the student.
Program Review Reporting Year: 2014-2015Target : Target MetTest T/F answers are assigned one point. Written qustions10 points each. The average student score was 29.8, whichtranslates to a 74.9% passing rate. This more thanexceeded the target of success of 70%. (01/22/2015)
Reflection (CLICK ON ? FOR INSTRUCTIONS): Students stillhave trouble evaluating composition of inversetrigonometric functions and trigonometric functions. Morepractice on relating the ranges of the inverse trigonometricfunctions is needed.
Program Review Reporting Year: 2012-2013Target : Target Met15/20 achieved 70% or better on this assessment.(07/02/2013)
Other - A mid course review will begiven that summarizes the topics tothat point. Topics will includesolving right triangles, solvingtrigonometric equations,trigonometric applications andinverse trigonometric functions.
Program Review Reporting Year: 2012-2013Target : Target Met
Exam - Course Test/Quiz - Thestudents are asked to solve an
09/19/2019 Page 165 of 318Generated by Nuventive Improve

Student LearningOutcomes (SLOs) Assessment Methods Assessment Data Summaries Enhancements
Target for Success: The student tobe able to set up tools such asdefinition of variables,use of geometric models andfigures, and find trigonometricrelationships between these variables, thenrespond to the question asked for inthe problemin a complete sentence(s).
Reflection (CLICK ON ? FOR INSTRUCTIONS): Improve inhelping students that lack problem solving skills by addingsets of problems at different levels of difficulties of the typein the assessment and encourage them to finish theirassignment on time by working together inside and outsidethe classroom, then collect and give feed back to studentsbefore major assessments.
About 2/3 of the students were able to set up the problemcompletely and show understanding of the processexplained in class and the text book. About half thestudents have correct answers. (04/25/2013)
Comments/Notes: About 2/3 of thestudents were able to set up theproblem completely and showunderstanding of the processexplained in class and the text book.About half the students have correct answers.
application problem in which timeand distance are involved. To write a completesolution, the students have to define variables and use definition ofbearing, represent the problemgeometricallythen use trigonometric relationsbetween lines and angles and useproper unitsto be able to compute distance andtime values asked for in theproblem.
Target for Success: None set - firstcycle.
Reflection (CLICK ON ? FOR INSTRUCTIONS): There was a78.3 success rate. Students were very successful in solvingtrig equations or evaluating trig functions . However,several students had difficulty in interpreting a word
Program Review Reporting Year: 2013-2014Target : Target MetThe students solve problems on tests, quizzes andhomework in which they demonstrate their understandingof trigonometric functions as applied to word problems.(06/09/2014)
Exam - Course Test/Quiz - Studentswill be able to determine when touse the Law of Sines or the Law ofCosines. On the final, the studentswill be able to complete a problemthat uses both of these.
09/19/2019 Page 166 of 318Generated by Nuventive Improve

Student LearningOutcomes (SLOs) Assessment Methods Assessment Data Summaries Enhancements
problem into math and setting up the solution for theproblem.
Reflection (CLICK ON ? FOR INSTRUCTIONS): Need to set agoal where partial credit is also part of the goal.
Program Review Reporting Year: 2013-2014Target : Target Not Met14 out of 39 students correctly answered the question, or36%. Only 4 could not even begin to answer the question.(12/19/2013)
Target for Success: Each of theTrue/False questions is worth 1point. There is no penalty for wronganswers to encourage “educated”answers through critical thinking.The written part is worth 15-25points. The problems are taken fromthe book and tend to be morecomplex that the True/False ones. Acombine score of 60 or above isconsidered passing. The target forsuccess in this assessment is to haveat least 68% of those studentscompleting the course received apassing grade
Reflection (CLICK ON ? FOR INSTRUCTIONS): That implies asuccess rate of 75% which was above the targeted rate of68%.
Program Review Reporting Year: 2014-2015Target : Target Met32 students completed the course. Out of the 32 students24 had a score of 70 or above. (03/23/2016)
Reflection (CLICK ON ? FOR INSTRUCTIONS): Unlike Math41 and Math 43 which are mainly repetition of theconcepts learned in Algebra. Math 42, Trigonometry, is anew topic for most of the students.. It requires a moreconcentrated effort to grasp the new concepts. A goodindicator for success in this class is the studentpreparedness and the amount of homework a studentdoes. In general, students who do 90% or more of theassigned homework tend to be very successful.
Program Review Reporting Year: 2014-2015Target : Target MetThe class had an overall 68.2% success rate. (03/14/2016)
Comments/Notes:
Exam - Course Test/Quiz -Assessment Method: Threemidterms consisting of two parts: 1)20-25 True/False question to assessthe students’ analytical skills andunderstanding of the basictrigonometric functions. 2) A three-problem write-in part to assessstudent understanding of periodicphenomena as they apply to real lifesituations. The lowest test wasdropped.
Enhancement: In the future, IProgram Review Reporting Year: 2016-2017Exam - Course Test/Quiz - To do myassessment, I took what I think is the
09/19/2019 Page 167 of 318Generated by Nuventive Improve

Student LearningOutcomes (SLOs) Assessment Methods Assessment Data Summaries Enhancements
Target for Success: My target forsuccess is for students to achieve70% of the possible points or higher,so roughly 11 out of 15 points.
Reflection (CLICK ON ? FOR INSTRUCTIONS): Although thetarget was not met, I was still somewhat satisfied with theresults. This was clearly the hardest problem on the test,and required almost everything the students had learnedthroughout the quarter.Related Documents:SLO Data F16.xls
plan, as always, to think of newerand better ways of presenting thematerial that relates to theproblem chosen to do the SLO.(02/11/2017)
Target : Target Not MetAfter scoring all the finals, one class received a 67.17%average for the problem and the other class received a62.55% average. These were kind of close to the 70% target,but obviously fell a little short. (02/11/2017)
most comprehensive problem fromthe final exam for both my Math 42classes in the fall. I think theproblem fits the description of theSLO well. The problem is anavigation type problem where thestudents must use the ideas ofvectors to solve. There is heavyusage of modeling, trigonometry,and geometry. The problem wasworth 15 points on the final. So,student received anywhere from ascore of 0 to 15.
Target for Success: Target forsuccess is 70% completion of theproblem or higher.
Exam - Course Test/Quiz - To do myassessment, I again took what I thinkis the most comprehensive problemfrom the final exam for both myMath 42 classes in the winter. Thiswas the same problem from the fall,so we will be able to comparedifferences in student achievement.The problem is a navigation typeproblem where the students mustuse the ideas of vectors to solve.There is heavy usage of modeling,trigonometry, and geometry. Theproblem was worth 15 points on thefinal. So, student received anywherefrom a score of 0 to 15. (Active)
Program Review Reporting Year: 2017-2018Target : Target MetOf the 40 students who took this third midterm, 3 studentsleft the problem blank, 29 students answered the question
Exam - Course Test/Quiz - Studentsare asked to solve the followingapplication problem:A ship travels 40 miles due west and
09/19/2019 Page 168 of 318Generated by Nuventive Improve
Student LearningOutcomes (SLOs) Assessment Methods Assessment Data Summaries Enhancements
Target for Success: At least 70% ofthe students will earn 70% or betteron this assessment.
Reflection (CLICK ON ? FOR INSTRUCTIONS): I amwondering if it would have been helpful for the 3 studentswho did not answer the question to have seen a picture ofthe problem. I am torn on this idea because part of solvingan application problem means that the student needs to tryto illustrate the scenario, but I understand that there maybe some confusion if the problem is not written out asclearly.
and earned at least 7 out of 10 points and 8 studentsearned below 7 of the 10 points of the problem. This meansthat 29/40 (or 72.5%) of the students showed theirunderstanding of the use of law of cosines and how itapplies to a bearing problem. (01/02/2018)
then changes direction northwest topoint B. After traveling 30 miles inthis new direction, the ship is 56miles from its point of departure, callit point C. Find the bearing frompoint B to C. Round to two decimalplaces. This question is written in a way totest students’ ability to formulate,construct, and evaluatetrigonometric models to analyzeperiodic phenomena, identities, andgeometric applications. Specifically,they are tested on their use of thelaw of cosine.
Target for Success: Students havingreceived 70% of points for problemor above Reflection (CLICK ON ? FOR INSTRUCTIONS): The target
was met easily! The average score on the problem was an82%, well above the 70% target. I think the target for thisclass might have been so easily met because this was anMPS class and the students were able to have ample timeto practice this type of problem both at home and in groupwork in the classroom.Related Documents:SLO Data W19.xls
Enhancement: No enhancementsplanned at this time.(04/06/2019)
Program Review Reporting Year: 2018-2019Target : Target MetUsed integrated application problem from final exam to seeif students could set up and solve a navigation problem anduse the correct trig skills to solve. (04/06/2019)
Comments/Notes: I've given thistype of problem before. Will beinteresting to compare past results.
Exam - Course Test/Quiz -Integrated application problem fromfinal exam
09/19/2019 Page 169 of 318Generated by Nuventive Improve

MATH 43:Precalculus III: Advanced Topics
Student LearningOutcomes (SLOs) Assessment Methods Assessment Data Summaries Enhancements
MATH43_SLO_1 - Analyze,investigate, and evaluate linearsystems, vectors, and matricesrelated to two or three dimensionalgeometric objects.
Planned Assessment Quarters: 2012-13 4-Spring
SLO Status: Active
Outcome Creation Date: 12/31/2009
Target for Success: Target is toobtain at least 70% correct answersby each student.Related Documents:MATH-43,F12,Test 2.docMATH-43,F12,Test 2(SLO 1).docx
Reflection (CLICK ON ? FOR INSTRUCTIONS): Students didexcept when applying rules when one vector is reflected onanother.
Enhancement: Moreproblems/examples involvingvector reflected on anotherincluding using visuals and havingstudents complete problemsalready half-solved. (04/25/2018)
Program Review Reporting Year: 2017-2018Target : Target Met70% earned a C or better on the test.The test problems had students implement vectors inphysics-focused applications. (04/25/2018)
Reflection (CLICK ON ? FOR INSTRUCTIONS): Students didwell especially considering that the topic of vectors is a newtopic for these students.
Enhancement: More time shouldbe spent on vectors as was donethis time. Make it possible forstudents to be able take the sameinstructor for MATH 41 - 43 andencourage such. (01/17/2018)
Program Review Reporting Year: 2017-2018Target : Target Met78% percent of the students earned a C or better on thevector questions from Exam 3. (01/17/2018)
Reflection (CLICK ON ? FOR INSTRUCTIONS): Next time Iteach this course I will not allow a note card for exams. Ibelieve the students relied too heavily on their note cardand did not study enough on each of their exams thisquarter.
Program Review Reporting Year: 2016-2017Target : Target Not MetLess than 64% of students (51/80) scored a 70% or higheron the exam (12/18/2016)
Reflection (CLICK ON ? FOR INSTRUCTIONS): Students needmore work on applications of matrices.
Program Review Reporting Year: 2013-2014Target : Target Met30/41 of students obtained 70% or higher on a quiz.(02/28/2014)
Enhancement: The specialassignments on definitions andvocabulary are planned todevelop. Also, the homework willbe enhanced by the extraquestions on the previously
Program Review Reporting Year: 2012-2013Target : Target MetThe results are the following:at least 90%---19 students; at least 80%---18 students; atleast 70%----7 students;at least 60%---0 students; less than 60%----0 students.(01/29/2013)
Exam - Course Test/Quiz -MATH43_SLO_1 has been assessedby the second regular test.
09/19/2019 Page 170 of 318Generated by Nuventive Improve

Student LearningOutcomes (SLOs) Assessment Methods Assessment Data Summaries Enhancements
Reflection (CLICK ON ? FOR INSTRUCTIONS): The resultsoverall are satisfactory. The distribution of incorrectanswers for each question reveals that most of the studentshad missed the question 5a (31 out of 44) required to give aformal definition of an inverse matrix. This confirm the factthat students pay attention mostly to operational side ofthe course (calculations), leaving the conceptual side(definitions, vocabulary) undeveloped.Also, question 4 on graphing of the solution set of thequadratic inequality in two variables, has caused difficultiesfor many students, since the corresponding graphingquestions has been covered during Test 1 and many of thestudents has forgotten the corresponding technique.
covered topics. (11/10/2013)Enhancement: The specialassignments on definitions andvocabulary are planned todevelop. Also, the homework willbe enhanced by the extraquestions on the previouslycovered topics. (01/29/2013)
Target for Success: At least 70%correct answers by each student
Reflection (CLICK ON ? FOR INSTRUCTIONS): Students werevery proficient in converting word problems to equationsby naming the variables & identifying the coefficients.Students were also very proficient in (1) algebraicmanipulations to solve for the variables and (2) using theirgraphing calculator to find the solutions.
Enhancement: The specialassignments on definitions andvocabulary are planned todevelop. Also, the homework willbe enhanced by the extraquestions on the previouslycovered topics. (11/10/2013)
Program Review Reporting Year: 2012-2013Target : Target MetApproximately 78% of the questions were answeredcorrectly. (09/22/2013)
Exam - Course Test/Quiz - Questionsfrom Exam 1
Target for Success: At least 70% ofstudents receive 7/10 or higher
Reflection (CLICK ON ? FOR INSTRUCTIONS): Students whoare also engaged in course work such as computer scienceor physics do well. The others find the concepts difficult tograsp.
Enhancement: Give them real lifeproblems. (03/14/2019)
Program Review Reporting Year: 2018-2019Target : Target MetApproximately 70% of students received 70% or better.(03/14/2019)
Exam - Course Test/Quiz - Bi-WeeklyQuiz
Target for Success: At least 70%correct answers by each student
Reflection (CLICK ON ? FOR INSTRUCTIONS): Students werevery proficient in converting the description of therelationships to equations by naming variables, identifyingthe coefficients, and constructing the equations. Students
Program Review Reporting Year: 2013-2014Target : Target MetApproximately 82% of the questions were answeredcorrectly. (12/24/2014)
Exam - Course Test/Quiz - Questionsfrom Exam 1
09/19/2019 Page 171 of 318Generated by Nuventive Improve

Student LearningOutcomes (SLOs) Assessment Methods Assessment Data Summaries Enhancements
were proficient with algebraic manipulations to solve forthe variables & using their TI to check their algebraic work.
Target for Success: 70% of thestudents will receive 70% or better
Reflection (CLICK ON ? FOR INSTRUCTIONS): I was happywith the performance from the students
Program Review Reporting Year: 2016-2017Target : Target Met80% of the students received 70% or better (04/21/2017)
Exam - Course Test/Quiz - Themethod for assessing the outcomewas quiz 7. The questions as thestudents to perform vectoroperations and analyze, investigate,and evaluate linear systems.
MATH43_SLO_2 - Graph and analyzeregions/curves represented byinequalities or trigonometric, polar,and parametric equations, includingconic sections.
Planned Assessment Quarters: 2012-13 2-Fall
SLO Status: Active
Outcome Creation Date: 12/31/2009Target for Success: Target is 70% ofcorrect answers for each student ofthe class.
Reflection (CLICK ON ? FOR INSTRUCTIONS): Polarcoordinates and conic sections are new topics for students.Much of the issues is the lack of ability to interpret theproblem and visualize the problem as appropriate.
Enhancement: Advise students toreach out to the tutoring center.(04/25/2018)
Program Review Reporting Year: 2017-2018Target : Target Not Met65% of students received a passing grade. (04/25/2018)
Reflection (CLICK ON ? FOR INSTRUCTIONS): Though thedistribution of grades overall positive, the target has notbeen met by 6 students.Two questions, namely 4 and 8,were especially difficault for the students.21 studentsanswered incorrectly question 4 (a polar representation ofa given point with given rectangular coordinates) and 21students answered incorrectly on question 8 on a polarequation of the conic section.
Enhancement: Questions 4 and 8are planned to replace by similar,but less challenging questions.A development of specialhandouts on utilization of graphicscalculators for graphing equationsin parametric and polarrepresentations. (01/29/2013)
Program Review Reporting Year: 2012-2013Target : Target Not MetTotal: 43 students.At least 90%---13 students; at least 80%----17 students; atleast 70%----7 students;at least 60%----5 students; less 60%----1 student. (01/29/2013)
Exam - Course Test/Quiz -Assessment of MATH43_SLO_2 isbased on the results of the firstregular test. Additionally, thedistribution of the incorrect answersfor all questions has been providedand analyzed.
Target for Success: At least 70% ofstudents answer the questionscorrectly Reflection (CLICK ON ? FOR INSTRUCTIONS): Students were
very proficient in shading solution regions by (1) identifying
Enhancement: The specialassignments on definitions andvocabulary are planned todevelop. Also, the homework willbe enhanced by the extraquestions on the previously
Program Review Reporting Year: 2012-2013Target : Target MetApproximately 72% of the related questions were answeredcorrectly. (09/22/2013)
Exam - Course Test/Quiz - Questionsfrom Exam 2
09/19/2019 Page 172 of 318Generated by Nuventive Improve

Student LearningOutcomes (SLOs) Assessment Methods Assessment Data Summaries Enhancements
the direction of the inequality & (2) checking by substitutinga point. Students were less proficient in sketching polarcurves, especially identifying roses, lemniscates, and othercomplicated polar curves.
covered topics. (11/10/2013)
Target for Success: At least 70% ofstudents receive 7/10 or higher Reflection (CLICK ON ? FOR INSTRUCTIONS): Students had
trouble graphing parametric equations and convertingthem to rectangular form. More practice should be doneon graphing without a calculator.
Program Review Reporting Year: 2013-2014Target : Target Not Met21/40 = 52.5% received 7/10 or higher (03/07/2014)
Exam - Course Test/Quiz - Bi-Weeklyquiz
Target for Success: At least 70% ofthe questions are answeredcorrectly. Reflection (CLICK ON ? FOR INSTRUCTIONS): Students were
very proficient in manipulating inequalities to simplifythem, sketch the line or curve, and then shade theappropriate section by checking points & checking thedirection of the inequality. Students were not proficient insketching polar curves (such as roses, lemniscates). Theirgraphs were not correct due to inaccuracies in plottingpoints & classifying the graphs algebraically.
Program Review Reporting Year: 2013-2014Target : Target Met45% of the questions received at least 90% credit. 25% ofthe questions received at least 80% credit. (12/24/2014)
Exam - Course Test/Quiz - Questionsfrom Exam 2
Target for Success: At least 70% ofthe students will receive 70% orbetter.
Reflection (CLICK ON ? FOR INSTRUCTIONS): The problemsfor exam 3 did a good job covering the SLO
Program Review Reporting Year: 2016-2017Target : Target Met75% of the students received 70% or better (04/21/2017)
Exam - Course Test/Quiz - Themethodology for assessing theoutcome was exam 3. The questionson the exam asked students toanalyze regions and curvesrepresented by various equations.
MATH43_SLO_3 - Analyze, develop,and evaluate formulas for sequencesand series; Justify those formulas bymathematical induction.
Planned Assessment Quarters: 2012-SLO Status: Active
Exam - Course Test/Quiz -Assessment of MATH43_SLO_3 hasbeen done by the third regular test.Additionally, the distribution ofincorrect answers for each questionhas been provided and analyzed.
09/19/2019 Page 173 of 318Generated by Nuventive Improve

Student LearningOutcomes (SLOs) Assessment Methods Assessment Data Summaries Enhancements
13 2-FallOutcome Creation Date: 12/31/2009
Target for Success: Target is toobtain at least 70% correct answerson the test questions by eachstudent in the class.
Target for Success: At least 70% ofstudents answer the questionscorrectly
Reflection (CLICK ON ? FOR INSTRUCTIONS): Students havenot developed strong critical thinking skills. Present somevery simplistic cases so that students will believe in themethod.
Program Review Reporting Year: 2017-2018Target : Target Not Met45% passed the test on induction. (04/25/2018)
Reflection (CLICK ON ? FOR INSTRUCTIONS): Students needmore practice with symbolic logic. They struggle applyingthe nth step to the (n+1)th step in induction. I have morecollaborative examples in class.
Program Review Reporting Year: 2013-2014Target : Target Not Met23/44 students correctly evaluated a sequence formula onthe final exam (03/28/2014)
Reflection (CLICK ON ? FOR INSTRUCTIONS): Students werevery proficient in using the arithmetic & geometricsequence formulas to find nth terms, given various piecesof information. Students were proficient in proving thearithmetic & geometric series formulas and very proficientin using those formulas to calculate sums.
Enhancement: The specialassignments on definitions andvocabulary are planned todevelop. Also, the homework willbe enhanced by the extraquestions on the previouslycovered topics. (11/10/2013)
Program Review Reporting Year: 2012-2013Target : Target MetApproximately 77% of related questions were answeredcorrectly. Most difficult topic for the students was themethod of mathematical induction. In future I am planningto develop an additional assignment to cover the topic inmore depth, including examples of using the method forinequalities and in geometry. (09/22/2013)
Exam - Course Test/Quiz - Questionsfrom the final exam
Target for Success: Correct answerson at least 70% of related questionson the assessments
Program Review Reporting Year: 2013-2014Target : Target Met45% of questions earned at least 90% credit; 35% ofquestions earned at least 80% credit. Mathematicalinduction was one of the most difficult topics in the coursefor students. Students were proficient in using
Exam - Course Test/Quiz - Questionsfrom exam 2 & the final exam
09/19/2019 Page 174 of 318Generated by Nuventive Improve

Student LearningOutcomes (SLOs) Assessment Methods Assessment Data Summaries Enhancements
Reflection (CLICK ON ? FOR INSTRUCTIONS): Students werevery proficient in distinguishing between arithmetic &geometric sequences using (1) sigma notation & (2) whenterms were individually written. Students were also veryproficient in (1) using arithmetic sum & geometric sumformulas to find nth partial sums & infinite sums; (2) usingnth term formulas.
mathematical induction to prove various sum formulas buthad more trouble with product formulas and factorrelationships. (12/24/2014)
Target for Success: At least 75% ofthe students will receive 70% orhigher.
Reflection (CLICK ON ? FOR INSTRUCTIONS): More groupwork on math induction will be more helpful in futurequarters
Program Review Reporting Year: 2016-2017Target : Target Met76% of the students received 70% or higher (04/21/2017)
Exam - Course Test/Quiz - Themethodology for assessing theoutcome was exam 2. Severalquestions asked the students toanalyze, develop, and evaluateformulas and to justify the formulasusing mathematical induction.
09/19/2019 Page 175 of 318Generated by Nuventive Improve

MATH 44:Introduction to Contemporary Mathematics
Student LearningOutcomes (SLOs) Assessment Methods Assessment Data Summaries Enhancements
MATH44_SLO_1 - Analyzecontemporary mathematicalproblems, apply problem solvingtechniques using a variety ofmethods, and communicate theresults mathematically through avariety of forms.SLO Status: Active
Target for Success: I would want theaverage score for each student to be80% or above.
Reflection (CLICK ON ? FOR INSTRUCTIONS): I liked thisproblem. I might try a variation of this problem next time.
Program Review Reporting Year: 2012-2013Target : Target MetThe average score correct on this problem was 84%; I ampleased. (09/21/2013)
Comments/Notes: All work had tobe shown. Partial credit was given.
Exam - Course Test/Quiz - Usedproblem from final exam. Problemwas as follows: Consider thefollowing set of numbers: 035000141101 Is this a legitimate bar codefor a product? Use the correctformula. Remember that the lastdigit is a check digit. Show all work.
This problem was worth 10 points onthe final exam. The number of pointscorrect by each student will betabulated. Each student willtherefore be assigned a scorebetween 1 and 10.
Target for Success: I would want theaverage score for each student to be
Reflection (CLICK ON ? FOR INSTRUCTIONS): I think I ammoving in the right direction on teaching this kind ofproblem.Related Documents:SLO Data F13.xls
Program Review Reporting Year: 2013-2014Target : Target MetThe average score for this problem was over a 92%, which isgood and above my target of 80%. It is also above theaverage score of last quarter. (01/03/2014)
Exam - Course Test/Quiz - Usedproblem from final exam. Problemwas as follows: Consider thefollowing set of numbers: 035000141101 Is this a legitimate bar codefor a product? Use the correctformula. Remember that the lastdigit is a check digit. Show all work.
This problem was worth 10 points onthe final exam. The number of pointscorrect by each student will betabulated. Each student willtherefore be assigned a scorebetween 1 and 10.
09/19/2019 Page 176 of 318Generated by Nuventive Improve

Student LearningOutcomes (SLOs) Assessment Methods Assessment Data Summaries Enhancements
80% or above.Comments/Notes: Used sameproblem last quarter.
MATH44_SLO_2 - Demonstrate andcorrectly apply basic mathematicaltechniques in at least five of thefollowing ten areas: symmetry, graphtheory, fractals and chaos theory,topology, number theory, geometry,combinatorics, methods of socialchoice, probability and statistics,economics and personal finance.SLO Status: Active
Target for Success: I would hope thestudents would achieve 80% of thepossible points or above.
Reflection (CLICK ON ? FOR INSTRUCTIONS): Even though Idid not meet my goal, I am still pleased with the results. Ilike this problem for the combination of skills it tests.
Program Review Reporting Year: 2012-2013Target : Target Not MetThe average percent correct on this problem was 78.12%.This is still a good score (well above passing) but falls a littlebelow my goal of 80%. (09/21/2013)
Comments/Notes: Part (a) wasworth 10 points; Part (b) was worth7 points. All work must be show.
Exam - Course Test/Quiz - I used aproblem from the final exam. Theproblem had two parts. Thecombined score for both parts is 17points. The problem was as follows:Consider the object created by doingthe following:(i) Start with a solid square.(ii) Make 8 copies of the square,shrink each down to 1/3 its sidelengths and arrange the eight tocreate a bigger square with themiddle missing. The first two stageshave been done for you (shown indiagram).
(a) Draw as accurately as you can,the object at steps 3 and 4.(b) If your answer to part (a) is yes,this is a fractal, compute thedimension of the fractal using thecorrect formula.
Since problem (total) was worth 17points, each student is assigned ascore between 0 and 17.
Program Review Reporting Year: 2013-2014Target : Target Not MetSadly, the average score on this SLO was a 62.27%. I hadhoped to reach 80%. This type of problem is somewhat
Exam - Course Test/Quiz - I used aproblem from the final exam. Theproblem had two parts. Thecombined score for both parts is 15
09/19/2019 Page 177 of 318Generated by Nuventive Improve

Student LearningOutcomes (SLOs) Assessment Methods Assessment Data Summaries Enhancements
Target for Success: I would hope thestudents would achieve 80% of thepossible points or above.
Reflection (CLICK ON ? FOR INSTRUCTIONS): I will continueto think about new ways of teaching this problemRelated Documents:SLO Data F13.xls
conceptual and non-algebraic in nature. (01/03/2014)
Comments/Notes: Used basicallythe same question last quarter.Worth 15 points this time instead of17.
points. The problem was as follows:Consider the object created by doingthe following:(i) Start with a solid square.(ii) Make 8 copies of the square,shrink each down to 1/3 its sidelengths and arrange the eight tocreate a bigger square with themiddle missing. The first two stageshave been done for you (shown indiagram).
(a) Draw as accurately as you can,the object at steps 3 and 4.(b) If your answer to part (a) is yes,this is a fractal, compute thedimension of the fractal using thecorrect formula.
Since problem (total) was worth 15points, each student is assigned ascore between 0 and 15.
MATH44_SLO_3 - Examine andevaluate myths and realities aboutthe contemporary discipline ofmathematics and its practitioners.SLO Status: Active
Reflection (CLICK ON ? FOR INSTRUCTIONS): I am pleasedwith the results and was overjoyed by the level of quality ofthe reports given. Students were not shy at all (was apossible concern).
Program Review Reporting Year: 2012-2013Target : Target MetReport average score was 93.2%. I am very pleased. Onlyreason why average was not higher is because somestudents did not do report at all, which I need to addressbetter next time. (09/21/2013)
Presentation/Performance - Here, Iassigned an oral report. Eachstudent had to chose acontemporary mathematician to doa report on. Report had to tell ofmathematician's life and whathe/she worked on. Person chosen todo report on had to be verified byinstructor ahead of time, and inmost cases was a person from a
09/19/2019 Page 178 of 318Generated by Nuventive Improve

Student LearningOutcomes (SLOs) Assessment Methods Assessment Data Summaries Enhancements
Target for Success: I would like theclass average for this report to be90% or above.Comments/Notes: Report had to beat least 500 words, read to the class,and include all necessary diagrams,etc. that explained whatmathematician worked on.
culturally diverse or genderbackground. Report was worth 25points.
Target for Success: I would like theclass average for this report to be90% or above.
Reflection (CLICK ON ? FOR INSTRUCTIONS): I will continueto do this assignment.Related Documents:SLO Data F13.xls
Program Review Reporting Year: 2013-2014Target : Target MetThis SLO was met excellently. The average score was a 10out of 10. Everybody who did a presentation did a good joband thankfully, everybody that completed the class(although not all passed) finished this assignment.(01/03/2014)
Comments/Notes: Did the same lastquarter.
Presentation/Performance - Here, Iassigned an oral report. Eachstudent had to chose acontemporary mathematician to doa report on. Report had to tell ofmathematician's life and whathe/she worked on. Person chosen todo report on had to be verified byinstructor ahead of time, and inmost cases was a person from aculturally diverse or genderbackground. Report was worth 25points.
09/19/2019 Page 179 of 318Generated by Nuventive Improve

MATH 46:Mathematics for Elementary Education
Student LearningOutcomes (SLOs) Assessment Methods Assessment Data Summaries Enhancements
MATH46_SLO_1 - Analyzemathematical problems fromelementary mathematics, applyproblem solving techniques using avariety of methods, solve theseproblems individually and in groups,and communicate resultsmathematically through a variety offorms.SLO Status: Active
Target for Success: Successfullyanswering question
Reflection (CLICK ON ? FOR INSTRUCTIONS): the averagenumber of correct answers for problems 1,2,13,and 40were 2.86 or about 71% which would indicate that classwas able to understand majority of the activities aroundSLO1
Program Review Reporting Year: 2012-2013Target : Target MetOn the final, there were several questions related to SLO1that were asked:
1. Using a 2x2 grid, how many way are there to get fromPoint P to Point Q (application of pascal's triangle)2. Game consists of two players. Each player takes turnsputting down 1,2, or 3 sticks. The first player to leave atotal of 40 sticks wins the game. What is the winningstrategy.13. The mental arithematic technique of easy combinationsis40. Which of the following is not a step in the Polya'sproblem solving principles (12/11/2012)
Exam - Course Test/Quiz - Questionson Exam
MATH46_SLO_2 - Utilize ideas fromnumber theory, distinguish types andproperties of numbers, and employmathematical rules for operating onrational and irrational numbers usingverbal, symbolic, geometric, andnumerical methods.SLO Status: Active
Target for Success: Ability to answerquestions satisfactorily.
Reflection (CLICK ON ? FOR INSTRUCTIONS): The classaverage for number of correct answers to above was 5.13or about 73.33% which implies that students wereadequately able to learn/apply SLO 2.
Program Review Reporting Year: 2012-2013Target : Target MetOn Final Exam, questions 12,19,20,25,26, and 36 related toSLO-2:12. Using units, strips, and mats, how would you representthe number 325?19. Which of the following represents -2?20. At mail time, you are delivered a check of $48 and a billfor $31. Which of the following represent this situation:25. Which of the following represent 2/6?26. Which of the followign represent 2 x 3/5?36. To see if a number is divisible by 9, we added up thedigits and determine: (12/11/2012)
Exam - Course Test/Quiz - ExamQuestions
09/19/2019 Page 180 of 318Generated by Nuventive Improve
Student LearningOutcomes (SLOs) Assessment Methods Assessment Data Summaries Enhancements
MATH46_SLO_3 - Examine andevaluate myths and realities aboutthe contemporary discipline ofmathematics and its practitioners.SLO Status: Active
Target for Success: Students identifyand analyze myths and realitiessuccessfully, and identify specificactivities in the class whichaddressed these issues.Comments/Notes: Examples of classtopics identified by students:(1) Alternative or unconventionalcalculation algorithms and theirhistory and usage(2) Recent writings by Keith Devlinand others on "the math gene,"which posit that nearly all humanbeings "have a math mind."(3) Contemporary videos by Vi Hart,Dan Meyers and others presentingmathematical ideas and issues inmath education in entertainingmanner(4) A variety of stories from recentand past history relating to who andhow people have done mathematics(5) Findings of the Brazilian StreetMath study, and related recentstudies on the influence of context insuccess in mathematical problemsolving.(6) How number theory is used incredit card and other codesdemonstrates the ubiquity ofmathematics
Focus Group - Focus groups:students divided into smalldiscussion groups and asked to makelist of ways in which courseaddressed myths and realities ofmathematics and report in largerclass discussion.
Other - Journals: students create
09/19/2019 Page 181 of 318Generated by Nuventive Improve
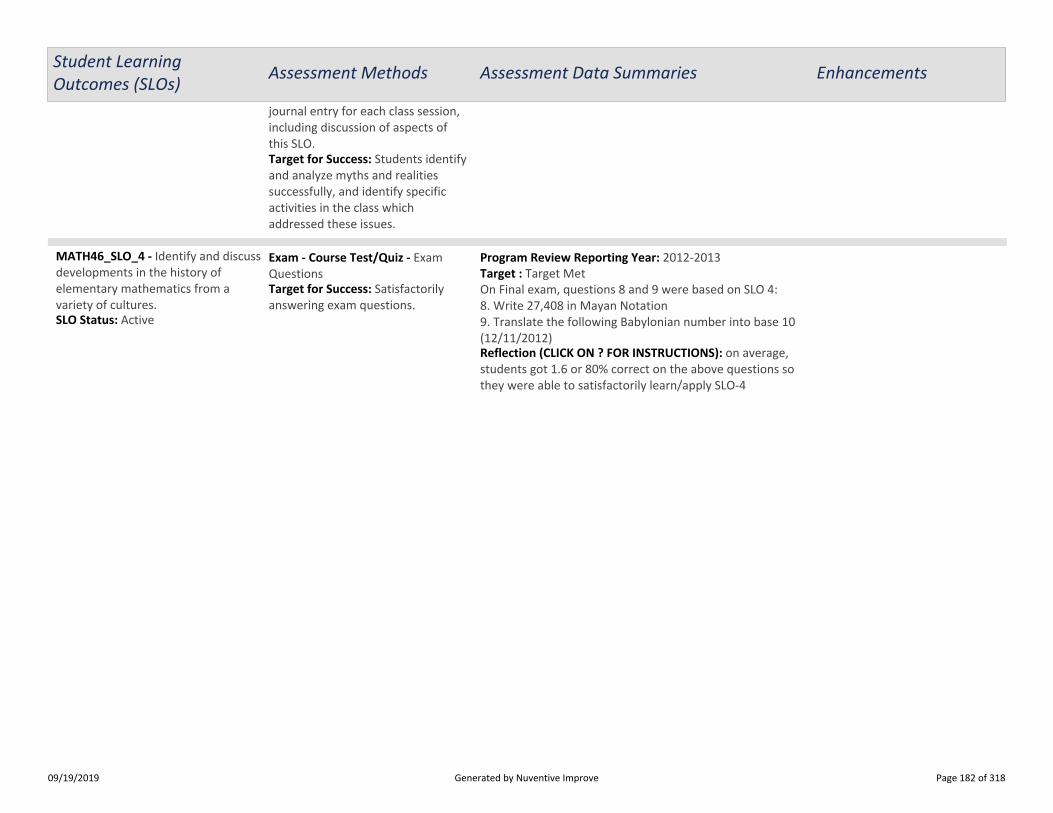
Student LearningOutcomes (SLOs) Assessment Methods Assessment Data Summaries Enhancements
Target for Success: Students identifyand analyze myths and realitiessuccessfully, and identify specificactivities in the class whichaddressed these issues.
journal entry for each class session,including discussion of aspects ofthis SLO.
MATH46_SLO_4 - Identify and discussdevelopments in the history ofelementary mathematics from avariety of cultures.SLO Status: Active
Target for Success: Satisfactorilyanswering exam questions.
Reflection (CLICK ON ? FOR INSTRUCTIONS): on average,students got 1.6 or 80% correct on the above questions sothey were able to satisfactorily learn/apply SLO-4
Program Review Reporting Year: 2012-2013Target : Target MetOn Final exam, questions 8 and 9 were based on SLO 4:8. Write 27,408 in Mayan Notation9. Translate the following Babylonian number into base 10(12/11/2012)
Exam - Course Test/Quiz - ExamQuestions
09/19/2019 Page 182 of 318Generated by Nuventive Improve
MATH 76 (&X&Y):Special Projects in Probability and Statistics
Student LearningOutcomes (SLOs) Assessment Methods Assessment Data Summaries Enhancements
MATH76(&X&Y)_SLO_1 - Investigatean area of special interest in the fieldsof probability and statistics anddemonstrate an appropriate level ofunderstanding and expertise.SLO Status: Special ProjectsOutcome Creation Date: 08/24/2015
09/19/2019 Page 183 of 318Generated by Nuventive Improve

MATH 77(&X&Y):Special Projects in Mathematics
Student LearningOutcomes (SLOs) Assessment Methods Assessment Data Summaries Enhancements
MATH77_SLO_1 - Investigate an areaof special interest and demonstratean appropriate level of understandingand expertise.SLO Status: Active
09/19/2019 Page 184 of 318Generated by Nuventive Improve

MATH 78 (&X&Y):Special Projects in Pure Mathematics
Student LearningOutcomes (SLOs) Assessment Methods Assessment Data Summaries Enhancements
MATH78(&X&Y)_SLO_1 - Investigatean area of special interest in puremathematics and demonstrate anappropriate level of understandingand expertise.SLO Status: Special ProjectsOutcome Creation Date: 08/24/2015
09/19/2019 Page 185 of 318Generated by Nuventive Improve

MATH 79 (&X&Y):Special Projects in Applied Mathematics
Student LearningOutcomes (SLOs) Assessment Methods Assessment Data Summaries Enhancements
MATH79(&X&Y)_SLO_1 - Investigatean area of special interest in appliedmathematics and demonstrate anappropriate level of understandingand expertise.SLO Status: Special ProjectsOutcome Creation Date: 08/24/2015
09/19/2019 Page 186 of 318Generated by Nuventive Improve

Dept - (PSME) Chemistry
Assessment: Course/Service Four Column
CHEM 10:Introductory Chemistry
Student LearningOutcomes (SLOs) Assessment Methods Assessment Data Summaries Enhancements
CHEM10_SLO_1 - Acquire afundamental understanding of whatinformation is presented in theperiodic table of the elements.SLO Status: Archived SLO StatementOutcome Creation Date: 04/10/2013
Target for Success: 70% (This ismuch higher than the averagesuccess rate of around 60% based onAmerican Chemical Society).
Reflection (CLICK ON ? FOR INSTRUCTIONS): SLO #1 isquite general and somewhat philosophical for the audienceof Chem 10. As non-major students, they might not need toanalyze chemical data with the scientific method in theirprofession, be it what they choose.
It is proposed that the outcome statement be changed to to“Acquire a fundamental understanding of what informationis presented in the periodic table of the elements.” Theperiodic table of the elements is probably seen by anyonewho has received some formal education. A demonstrationon what information one can obtain from this table wouldhave Chem 10 serve its audience as part of their generaleducation requirement.
This will be assessed in the next cycle.
Enhancement: Change outcomestatement and re-evaluate theoutcome. (04/02/2013)
Program Review Reporting Year: 2012-2013Target : Target Not Met22 out of 45 (50%) students answered this questioncorrectly. (03/26/2013)
Exam - Course Test/Quiz - Questionused: In Berzelius's experimentswhich illustrated the law of definiteproportions, 10.00 grams of leadreacts with 1.55 grams of sulfur andproduced 11.55 grams of leadsulfide. When the same amount oflead were left to react with excessiveamount of sulfur, 3.00 grams, again11.55 grams of lead sulfide wereproduced along with 1.45 grams ofsulfur left. How many grams of leadsulfide will be produced when 18.00grams of lead reacts with 1.55 gramsof sulfur?A) 11.55 g B) 19.55 g
C) 18.00 g D) 8.00g
CHEM10_SLO_2 - Evaluate therelationship between molecularstructure and chemical properties of
Enhancement: Change outcomestatement and re-evaluate. Newoutcome to be assessed:
Program Review Reporting Year: 2012-2013Target : Target Not Met23 out of 45 (50%) students answered this question
Exam - Course Test/Quiz - Based onthe Lewis structures, which of thefollowing molecule is polar?
09/19/2019 Page 187 of 318Generated by Nuventive Improve

Student LearningOutcomes (SLOs) Assessment Methods Assessment Data Summaries Enhancements
compounds.SLO Status: Archived SLO Statement
Target for Success: 70% (This ismuch higher than the averagesuccess rate as defined by theAmerican Chemical Society).
Reflection (CLICK ON ? FOR INSTRUCTIONS): SLO #2 isquite advanced for the audience of Chem 10. It would beappropriate for students taking organic chemistry. As non-major students, they do not need to be able to drawmolecular structures and make predictions on molecularproperties.
It is proposed that outcome statement for SLO #2 bechanged to “Demonstrate a fundamental understanding ofthe octet rule in predicting how elements combine to formchemical compounds”. The proposed SLO #1 addresses thealphabet of chemistry, and the proposed SLO #2 points outthe essence of a chemical reaction: how to combine lettersto form words in the language of chemistry.
Question used to evaluate the proposed SLO #2:
What is the predicted ionic charge for a Na ion?A) + 1 B) + 2 C) + 3
D) – 1
36 out of 45 (80%) students answered this questioncorrectly.
Demonstrate a fundamentalunderstanding of the octet rule inpredicting how elements combineto form chemical compounds(04/02/2013)
correctly. (03/26/2013)A) CO2 B) CH4C) NH3 D) H2
CHEM10_SLO_3 - Demonstrate anunderstanding of chemical principlessuch as atomic structure, chemicalbonding, mole concept, and acids andbases
Planned Assessment Quarters: 2016-17 4-Spring
SLO Status: COR_Update_Necessary
Outcome Creation Date: 10/02/2015
Target for Success: 70% Reflection (CLICK ON ? FOR INSTRUCTIONS): The targetwas not met. Improvements needed in the text.
Enhancement: A new textbookthat will discuss chemistry in acontext will be used from the Fallof 2017. (03/22/2017)
Program Review Reporting Year: 2016-2017Target : Target Not MetThe average score on the exam was 68% (03/22/2017)
Exam - Course Test/Quiz - A midterm exam in which the concepts inthe SLO are tested
CHEM10_SLO_4 - Demonstrate anunderstanding of the scientificmethod by performing laboratoryexperimentsSLO Status: COR_Update_Necessary
Target for Success: 70%Reflection (CLICK ON ? FOR INSTRUCTIONS): Lab
Enhancement: A new labcurriculum is being developed.(03/22/2017)
Program Review Reporting Year: 2016-2017Target : Target Not Met68% (03/22/2017)
Laboratory Project - Use lab quizzesor exams
09/19/2019 Page 188 of 318Generated by Nuventive Improve

Student LearningOutcomes (SLOs) Assessment Methods Assessment Data Summaries Enhancements
Planned Assessment Quarters: 2016-17 4-SpringOutcome Creation Date: 10/02/2015
experiments need to be improved. Labs need to becontextual and must lead to critical thinking and must bemore interesting and things students can relate to ineveryday life. Labs must also teach students good skills andtechniques.
CHEM10_SLO_5 - Develop problemsolving techniques by applying the\Scientific Method\" to chemicaldata."SLO Status: Active_Pending_RevisionOutcome Creation Date: 02/10/2018
CHEM10_SLO_6 - Analyze and solvechemical questions utilizinginformation presented in the periodictable of the elements.SLO Status: Active_Pending_Revision
CHEM10_SLO_7 - Evaluate currentscientific theories and observationsutilizing a scientific mindset and anunderstanding of matter and thechanges it undergoes.SLO Status: Active_Pending_Revision
09/19/2019 Page 189 of 318Generated by Nuventive Improve

CHEM 12A:Organic Chemistry
Student LearningOutcomes (SLOs) Assessment Methods Assessment Data Summaries Enhancements
CHEM12A_SLO_1 - Predict theproduct of a chemical reaction.SLO Status: Active_Pending_Revision
Target for Success: 70% (which ishigher than the national averagesuccess rate reported by theAmerican Chemical Society). Reflection (CLICK ON ? FOR INSTRUCTIONS): A detailed
reflection is provided at the end of the final outcome.
Enhancement: A detailed actionplan is provided at the end of thefinal outcome. (04/02/2013)
Program Review Reporting Year: 2012-2013Target : Target Not MetNumber of Responses: 38Number of Correct: 24Number of Incorrect:14Average % Correct: 63% (12/10/2010)
Exam - Course Test/Quiz - Anincomplete chemical reaction wasprovided and students were asked topredict the products of that reaction.
CHEM12A_SLO_2 - Apply principles ofthermodynamics, kinetics, andequilibrium to organic reactionsystems.SLO Status: Active_Pending_Revision
Target for Success: 70% (which ishigher than the national averagesuccess rate reported by theAmerican Chemical Society)
Reflection (CLICK ON ? FOR INSTRUCTIONS): A detailedreflection is provided at the end of the final outcome.
Enhancement: A detailed actionplan is provided at the end of thefinal outcome. (04/02/2013)
Program Review Reporting Year: 2012-2013Target : Target MetNumber of Responses: 38Number of Correct: 28Number of Incorrect:10Average % Correct: 74% (12/10/2010)
Exam - Course Test/Quiz - Select therate law for the following reactionCH¬3CH2CH2CHBrCH3 + OH- ? Br- +CH¬3CH2CH2CHOHCH3
CHEM12A_SLO_3 - Generate logicalstepwise reaction mechanisms.SLO Status: Active_Pending_Revision
Target for Success: 70% (which ishigher than the national averagesuccess rate reported by theAmerican Chemical Society)
Reflection (CLICK ON ? FOR INSTRUCTIONS): A detailedreflection is provided at the end of the final outcome.
Enhancement: A detailed actionplan is provided at the end of thefinal outcome. (04/02/2013)
Program Review Reporting Year: 2012-2013Target : Target MetNumber of Responses: 38Total points possible: 10% students obtaining 70% or above (7/10 pts): 29% (11students)% students obtaining 50% or above (5/10 pts): 24% (9students)% students obtaining 20% (3/15 pts): 15% (47% students) (12/10/2010)
Exam - Course Test/Quiz - Provide amechanistic explanation for theformation of the observed productsin the following reaction. (A chemicalreaction was provided).
CHEM12A_SLO_4 - Constructmolecular structure fromspectroscopic data.SLO Status: Active_Pending_Revision
Enhancement: One majorshortcoming of our assessment isthat we were unable to obtain anyinformation regarding the student
Program Review Reporting Year: 2012-2013Target : Target MetTotal points possible: 20% students obtaining 100% points possible (20/20 pts): 61%
Exam - Course Test/Quiz - AnUnknown Compound, L, has theformula C5H10O2. Elucidate thestructure of L by scrutinizing it IR, 1H
09/19/2019 Page 190 of 318Generated by Nuventive Improve
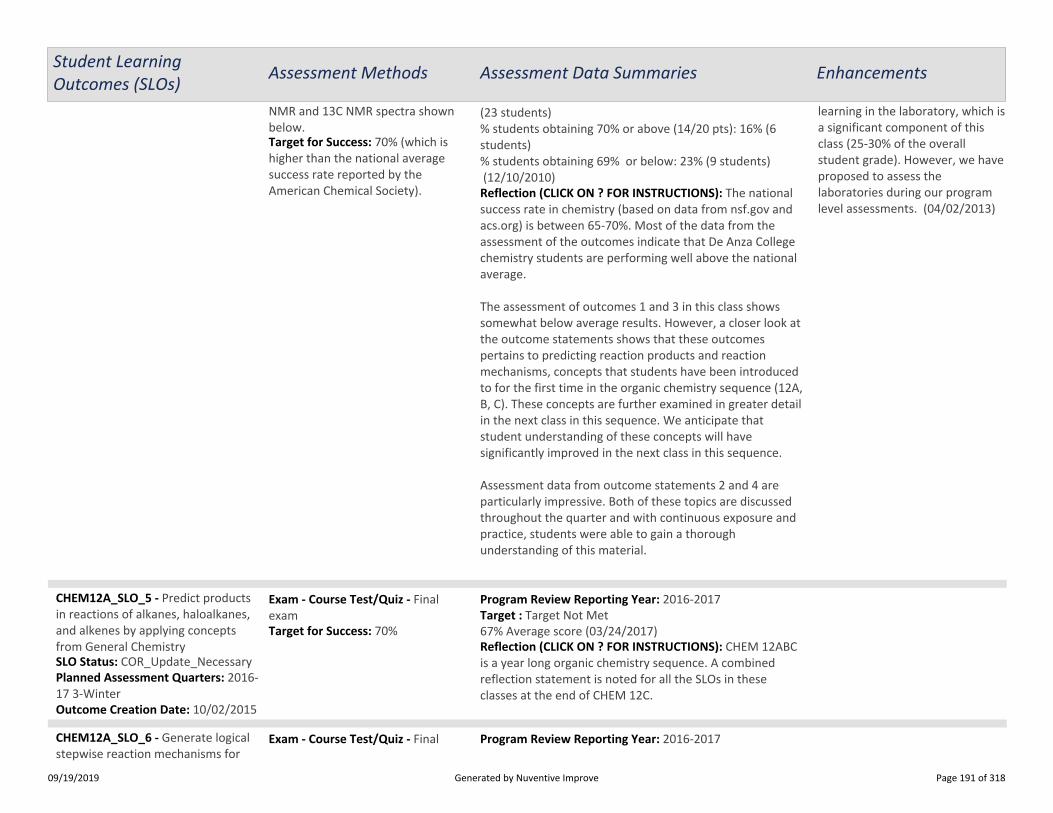
Student LearningOutcomes (SLOs) Assessment Methods Assessment Data Summaries Enhancements
Target for Success: 70% (which ishigher than the national averagesuccess rate reported by theAmerican Chemical Society). Reflection (CLICK ON ? FOR INSTRUCTIONS): The national
success rate in chemistry (based on data from nsf.gov andacs.org) is between 65-70%. Most of the data from theassessment of the outcomes indicate that De Anza Collegechemistry students are performing well above the nationalaverage.
The assessment of outcomes 1 and 3 in this class showssomewhat below average results. However, a closer look atthe outcome statements shows that these outcomespertains to predicting reaction products and reactionmechanisms, concepts that students have been introducedto for the first time in the organic chemistry sequence (12A,B, C). These concepts are further examined in greater detailin the next class in this sequence. We anticipate thatstudent understanding of these concepts will havesignificantly improved in the next class in this sequence.
Assessment data from outcome statements 2 and 4 areparticularly impressive. Both of these topics are discussedthroughout the quarter and with continuous exposure andpractice, students were able to gain a thoroughunderstanding of this material.
learning in the laboratory, which isa significant component of thisclass (25-30% of the overallstudent grade). However, we haveproposed to assess thelaboratories during our programlevel assessments. (04/02/2013)
(23 students)% students obtaining 70% or above (14/20 pts): 16% (6students)% students obtaining 69% or below: 23% (9 students) (12/10/2010)
NMR and 13C NMR spectra shownbelow.
CHEM12A_SLO_5 - Predict productsin reactions of alkanes, haloalkanes,and alkenes by applying conceptsfrom General Chemistry
Planned Assessment Quarters: 2016-17 3-Winter
SLO Status: COR_Update_Necessary
Outcome Creation Date: 10/02/2015
Target for Success: 70%Reflection (CLICK ON ? FOR INSTRUCTIONS): CHEM 12ABCis a year long organic chemistry sequence. A combinedreflection statement is noted for all the SLOs in theseclasses at the end of CHEM 12C.
Program Review Reporting Year: 2016-2017Target : Target Not Met67% Average score (03/24/2017)
Exam - Course Test/Quiz - Finalexam
CHEM12A_SLO_6 - Generate logicalstepwise reaction mechanisms for
Program Review Reporting Year: 2016-2017Exam - Course Test/Quiz - Final
09/19/2019 Page 191 of 318Generated by Nuventive Improve

Student LearningOutcomes (SLOs) Assessment Methods Assessment Data Summaries Enhancements
simple organic reactions
Planned Assessment Quarters: 2016-17 2-Fall
SLO Status: COR_Update_Necessary
Outcome Creation Date: 10/02/2015
Target for Success: 70%Reflection (CLICK ON ? FOR INSTRUCTIONS): CHEM 12ABCis a year long organic chemistry sequence. A combinedreflection statement is noted for all the SLOs in theseclasses at the end of CHEM 12C
Target : Target Not Met59% average score. (03/24/2017)
exam
CHEM12A_SLO_7 - Constructmolecular structures from IR and 1HNMR data
Planned Assessment Quarters: 2016-17 2-Fall
SLO Status: COR_Update_Necessary
Outcome Creation Date: 10/02/2015
Target for Success: 70%Reflection (CLICK ON ? FOR INSTRUCTIONS): CHEM 12 ABCis a year long organic chemistry sequence. A combinedreflection statement is noted for all the SLOs in theseclasses at the end of CHEM 12C.
Program Review Reporting Year: 2016-2017Target : Target Not Met69% average score (03/24/2017)
Exam - Course Test/Quiz - Lab finalexam
09/19/2019 Page 192 of 318Generated by Nuventive Improve

CHEM 12B:Organic Chemistry
Student LearningOutcomes (SLOs) Assessment Methods Assessment Data Summaries Enhancements
CHEM12B_SLO_1 - Apply molecularorbital theory to predict the outcomeof selected chemical reactions.SLO Status: Active_Pending_Revision
Target for Success: 70% (which ishigher than the national averagesuccess rate reported by theAmerican Chemical Society) Reflection (CLICK ON ? FOR INSTRUCTIONS): A detailed
reflection is provided at the end of the final outcome
Enhancement: A detailed actionplan is provided at the end of thefinal outcome. (04/02/2013)
Program Review Reporting Year: 2012-2013Target : Target MetNumber of Responses: 33Number of Correct: 32Number of Incorrect:1Average % Correct: 97% (03/31/2011)
Exam - Course Test/Quiz - Achemical reaction was provided andstudents were asked to predict theproducts formed.
CHEM12B_SLO_2 - Apply resonancetheory to predict the major and minorproducts of chemical reactions.SLO Status: Active_Pending_Revision Target for Success: 70% (which is
higher than the national averagesuccess rate reported by theAmerican Chemical Society)
Reflection (CLICK ON ? FOR INSTRUCTIONS): A detailedreflection is provided at the end of the final outcome.
Enhancement: A detailed actionplan is provided at the end of thefinal outcome. (04/02/2013)
Program Review Reporting Year: 2012-2013Target : Target Not MetNumber of Responses: 33Number of Correct: 18Number of Incorrect:13Average % Correct: 55% (03/25/2011)
Exam - Course Test/Quiz - Studentswere asked to predict the kineticproduct of a chemical reaction.
CHEM12B_SLO_3 - Generate logicalmulti-step syntheses of increasinglycomplex molecules.SLO Status: Active_Pending_Revision
Target for Success: 70% (which ishigher than the national averagesuccess rate reported by theAmerican Chemical Society)
Reflection (CLICK ON ? FOR INSTRUCTIONS): A detailedreflection is provided at the end of the final outcome.
Enhancement: A detailedreflection is provided at the end ofthe final outcome. (04/02/2013)
Program Review Reporting Year: 2012-2013Target : Target MetNumber of Responses: 33Total points possible: 20% students obtaining 100% points possible (20/20 pts): 67%(22 students)% students obtaining 85% (17/20 pts): 15% (5 students)% students obtaining 75% (15/20 pts): 6% (2students)% students obtaining 50% (10/20 pts): 12% (4 students) (03/25/2011)
Exam - Course Test/Quiz - Propose asynthesis for the product givenbelow using the indicated startingmaterials as the only sources ofcarbon.
CHEM12B_SLO_4 - Construct logicalstepwise reaction mechanisms forincreasingly complex chemicalsystems.SLO Status: Active_Pending_Revision Target for Success: 70% (which is
Enhancement: Action plan iscurrently pending. (04/02/2013)
Program Review Reporting Year: 2012-2013Target : Target MetNumber of Responses: 33Total points possible: 15% students obtaining 100% points possible (15/15 pts): 64%
Exam - Course Test/Quiz - Propose amechanism for the followingreaction (a chemical reaction wasprovided)
09/19/2019 Page 193 of 318Generated by Nuventive Improve

Student LearningOutcomes (SLOs) Assessment Methods Assessment Data Summaries Enhancements
higher than the national averagesuccess rate reported by theAmerican Chemical Society)
Reflection (CLICK ON ? FOR INSTRUCTIONS): A reflection iscurrently pending.
(21 students)% students obtaining 80% (12/15 pts): 15% (5 students)% students obtaining 53% (8/15 pts): 6% (2 students)% students obtaining 20% (3/15 pts): 15% (5 students) (03/25/2011)
CHEM12B_SLO_5 - Construct logicalmulti-step syntheses for organicmolecules incorporating a variety offunctional groups.
Planned Assessment Quarters: 2016-17 3-Winter
SLO Status: COR_Update_Necessary
Outcome Creation Date: 10/02/2015
Target for Success: 70%Reflection (CLICK ON ? FOR INSTRUCTIONS): CHEM 12 ABCis a year long sequence in organic chemistry. A combinedreflection statement is noted for all the SLOs in theseclasses at the end of CHEM 12C
Program Review Reporting Year: 2016-2017Target : Target Met78% (03/24/2017)
Exam - Course Test/Quiz - Finalexam
CHEM12B_SLO_6 - Use molecularorbital theory and resonance toexplain reactions of conjugateddienes, benzene and other moleculeswith conjugated p systems
Planned Assessment Quarters: 2016-17 3-Winter
SLO Status: COR_Update_Necessary
Outcome Creation Date: 10/02/2015
Target for Success: 70%Reflection (CLICK ON ? FOR INSTRUCTIONS): CHEM 12 ABCis a year long sequence in organic chemistry. A combinedreflection statement is noted for all the SLOs in theseclasses at the end of CHEM 12C
Program Review Reporting Year: 2016-2017Target : Target Met85% (03/24/2017)
Exam - Course Test/Quiz - Finalexam
CHEM12B_SLO_7 - Constructmolecular structures of increasinglycomplex molecules from IR, 1H NMR,and 13C NMR data
Planned Assessment Quarters: 2016-17 3-Winter
SLO Status: COR_Update_Necessary
Outcome Creation Date: 10/02/2015
Target for Success: 70%Reflection (CLICK ON ? FOR INSTRUCTIONS): CHEM 12 ABCis a year long sequence in organic chemistry. A combinedreflection statement is noted for all the SLOs in theseclasses at the end of CHEM 12C
Program Review Reporting Year: 2016-2017Target : Target Met69% (03/24/2017)
Exam - Course Test/Quiz - Lab finalexam
09/19/2019 Page 194 of 318Generated by Nuventive Improve

CHEM 12C:Organic Chemistry
Student LearningOutcomes (SLOs) Assessment Methods Assessment Data Summaries Enhancements
CHEM12C_SLO_1 - Apply theprinciples of thermodynamics,kinetics, equilibrium to biologicallyimportant molecules.
Planned Assessment Quarters: 2013-14 1-Summer
SLO Status: Active_Pending_Revision
Outcome Creation Date: 04/22/2014
Target for Success: 70%
Reflection (CLICK ON ? FOR INSTRUCTIONS): Aside fromthe unfortunate fact that the target for this outcome wasnot met, the data indicate a wide variability in studentsuccess.
In this problem, the student was presented with a series ofchemical reactions in which the substrate, reagent, orproduct was missing, and the student had to provide theappropriate compound(s) for each reaction. The problemfocused on one core ability in organic chemistry: to be ableto identify the type of chemical reaction based on thechanges in molecular structure that occur or the set ofreagents indicated. The student must be able to identify thetransformation that is occurring, the types of substratesthat normally undergo this transformation, and, in manycases, the stereochemical and regiochemical consequencesfor the products that are formed based on the reagentsused. The student must also be aware of specific reactionconditions (for example, temperature or pH) that may beassociated with a particular transformation. This “fill-in-the-blank” problem is distinct from a mechanism problem – inwhich students must show the step-by-step flow ofelectrons during a chemical reaction – or a synthesisproblem – for which the student must devise a viablesynthetic route based on the given starting materials. Whileall three of these types of problems – fill-in-the-blank,mechanism, and synthesis – are found on all majorassessments for the course (exams and the final) as well aseveral of the minor assessments (quizzes), the dataindicate that more emphasis needs to be placed on quicklyand correctly identify reactions by the reagents used or thetransformation that occurs.
Enhancement: Reassess thisoutcome during the Spring 2014quarter to track progress andallow a comparison between theregular and summer sessions.(04/22/2014)
Program Review Reporting Year: 2013-2014Target : Target Not MetAverage: 29/48 (60%)Standard deviation: 10Median: 29.5n: 26 (04/22/2014)
Exam - Course Test/Quiz - Anincomplete chemical reaction waspresent and the student was askedto provide the missing compound(s).
09/19/2019 Page 195 of 318Generated by Nuventive Improve

Student LearningOutcomes (SLOs) Assessment Methods Assessment Data Summaries Enhancements
It is recommended that this outcome again be assessed inthe Spring 2014 quarter (the next time the course isoffered) to track the progress towards achieving the target.
CHEM12C_SLO_2 - Conductsectroscopic analysis and identifiystructures of biologically importantmolecules.
Planned Assessment Quarters: 2013-14 1-Summer
SLO Status: Active_Pending_Revision
Outcome Creation Date: 04/22/2014
Target for Success: 70%
Reflection (CLICK ON ? FOR INSTRUCTIONS): In thisquestion, the student was asked to identify five keystructural features of carbohydrates: the type of functionalgroup (aldehyde versus ketone), the size of the ring thatcould form during cyclization (furanose versus pyranose),the number of carbons in the sugar (triose, tetrose,pentose, etc.), the configuration of the ultimatestereocenter (d versus l), and the configuration of theanomeric position upon cyclization (alpha versus beta).
Although the target for this assessment was met, it isrecommended that this outcome be split into twooutcomes to separately address the spectroscopicidentification of biological molecules.
Enhancement: Reassess thisoutcome during the Spring 2014quarter to track progress andallow a comparison between theregular and summer sessions.(04/22/2014)
Program Review Reporting Year: 2013-2014Target : Target MetAverage: 13/16 (78%)Standard deviation: 5Median: 15n: 26 (04/22/2014)
Exam - Course Test/Quiz - There arefive important structural features bywhich cyclic monosaccharides can bedescribed. For each of those fivestructural features, first write adescription of that structuralfeature, then state two terms usedto describe that structural featureand define each term.
CHEM12C_SLO_3 - Generatestepwise reaction mechanisms ofbiologically important molecules.
Planned Assessment Quarters: 2013-14 1-Summer
SLO Status: Active_Pending_Revision
Outcome Creation Date: 04/22/2014
Target for Success: 70%
Reflection (CLICK ON ? FOR INSTRUCTIONS): This questionexplored the ability to write a complete, detailed reactionmechanism, showing the step-by-step flow of electronsduring a particular chemical reaction. Along withretrosynthetic analysis, the elucidation, understanding, andapplication of reaction mechanism is one of thecornerstones of modern organic chemistry. Byunderstanding the mechanism of a reaction, the student
Enhancement: Reassess thisoutcome during the Spring 2014quarter to track progress andallow a comparison between theregular and summer sessions.(04/23/2014)
Program Review Reporting Year: 2013-2014Target : Target MetAverage: 23/32 (72%)Standard deviation: 6Median: 23n: 26 (04/22/2014)
Exam - Course Test/Quiz - Thereagents for four different reactionswere presented. For each reaction,the student was asked to write acomplete mechanism for thereaction, indicating all mechanismarrows, charges, and lone electrons,and properly reflectingstereochemistry and regiochemistrywhere appropriate.
09/19/2019 Page 196 of 318Generated by Nuventive Improve

Student LearningOutcomes (SLOs) Assessment Methods Assessment Data Summaries Enhancements
can successfully predict the outcome of a reaction, not onlyin terms of correctly identifying the functional grouptransformation that may occur, but also the sterochemicaland regiochemical consequences of the reaction. It istherefore reassuring to see that, as a whole, the studentswere successful in writing the mechanisms for the reactionspresented in this problem, as the reactions wererepresentative of key mechanisms presented during thequarter.
Although the target for this assessment was met, itrecommended that the wording of this assessment bebroadened to include molecules that are not directlyimportant biologically, to more faithfully reflect both theintent and the method used in this assessment.
CHEM12C_SLO_4 - Design logicalsyntheses and structuralmodifications of biologicallyimportant molecules.
Planned Assessment Quarters: 2013-14 1-Summer
SLO Status: Active_Pending_Revision
Outcome Creation Date: 04/22/2014Target for Success: 70%
Reflection (CLICK ON ? FOR INSTRUCTIONS): This questionassessed the ability of the student, given a particular set ofstarting materials, to identify the sequence of reagents thatshould be used to accomplish a significant synthetictransformation. The question required the student to applythe principles of retrosynthetic analysis to identify potentialsynthetic intermediates and, thereby, viable syntheticroutes. In identifying these routes, the student must takeinto consideration the changes in functional groups or thecarbon framework that occur, along with any relevantstereochemical or regiochemical changes.
Although the target was met, it is recommended that thewording of this assessment be broadened to includemolecules that are not directly important biologically, tomore faithfully reflect both the intent and the method usedin this assessment.
Enhancement: Reassess thisoutcome during the Spring 2014quarter to track progress andallow a comparison between theregular and summer sessions.(04/23/2014)
Program Review Reporting Year: 2013-2014Target : Target MetAverage: 13/18 (74%)Standard deviation: 4Median: 14n: 26 (04/23/2014)
Exam - Course Test/Quiz - Thestudent was present with two targetcompounds. For each compound,the student was asked to present amulti-step synthetic route in whichthe target molecule would besynthesized from a given set ofstarting materials.
09/19/2019 Page 197 of 318Generated by Nuventive Improve
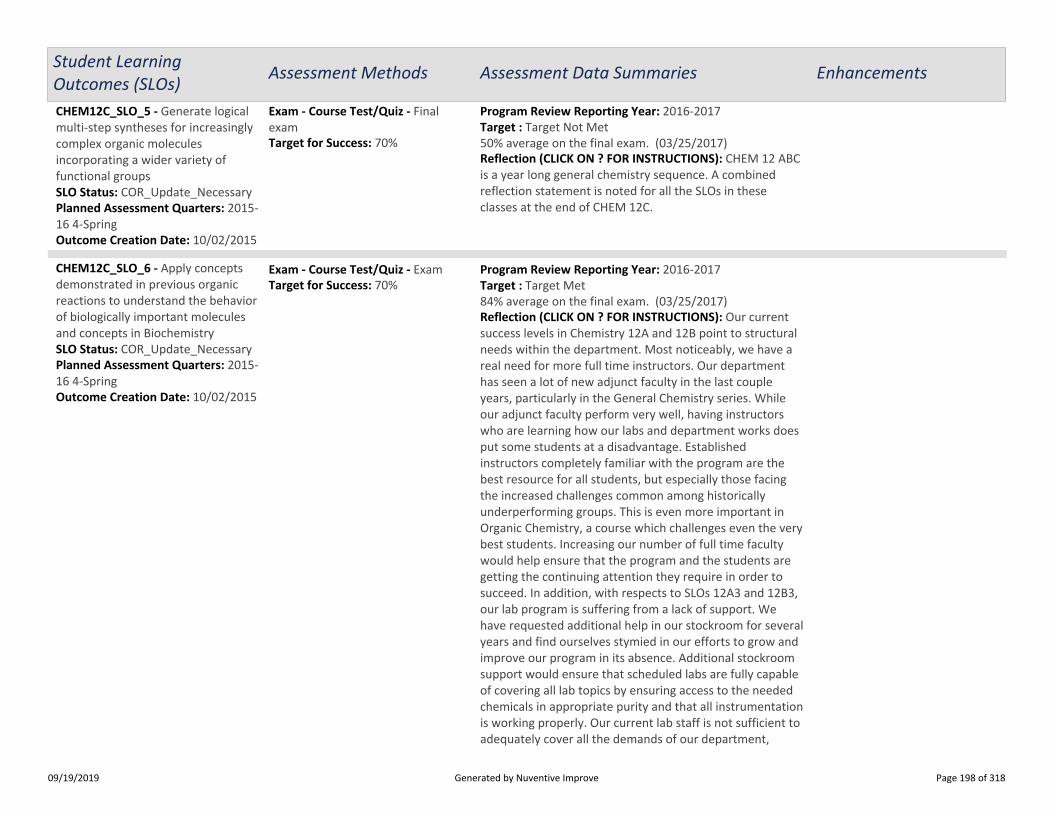
Student LearningOutcomes (SLOs) Assessment Methods Assessment Data Summaries Enhancements
CHEM12C_SLO_5 - Generate logicalmulti-step syntheses for increasinglycomplex organic moleculesincorporating a wider variety offunctional groups
Planned Assessment Quarters: 2015-16 4-Spring
SLO Status: COR_Update_Necessary
Outcome Creation Date: 10/02/2015
Target for Success: 70%Reflection (CLICK ON ? FOR INSTRUCTIONS): CHEM 12 ABCis a year long general chemistry sequence. A combinedreflection statement is noted for all the SLOs in theseclasses at the end of CHEM 12C.
Program Review Reporting Year: 2016-2017Target : Target Not Met50% average on the final exam. (03/25/2017)
Exam - Course Test/Quiz - Finalexam
CHEM12C_SLO_6 - Apply conceptsdemonstrated in previous organicreactions to understand the behaviorof biologically important moleculesand concepts in Biochemistry
Planned Assessment Quarters: 2015-16 4-Spring
SLO Status: COR_Update_Necessary
Outcome Creation Date: 10/02/2015
Target for Success: 70%
Reflection (CLICK ON ? FOR INSTRUCTIONS): Our currentsuccess levels in Chemistry 12A and 12B point to structuralneeds within the department. Most noticeably, we have areal need for more full time instructors. Our departmenthas seen a lot of new adjunct faculty in the last coupleyears, particularly in the General Chemistry series. Whileour adjunct faculty perform very well, having instructorswho are learning how our labs and department works doesput some students at a disadvantage. Establishedinstructors completely familiar with the program are thebest resource for all students, but especially those facingthe increased challenges common among historicallyunderperforming groups. This is even more important inOrganic Chemistry, a course which challenges even the verybest students. Increasing our number of full time facultywould help ensure that the program and the students aregetting the continuing attention they require in order tosucceed. In addition, with respects to SLOs 12A3 and 12B3,our lab program is suffering from a lack of support. Wehave requested additional help in our stockroom for severalyears and find ourselves stymied in our efforts to grow andimprove our program in its absence. Additional stockroomsupport would ensure that scheduled labs are fully capableof covering all lab topics by ensuring access to the neededchemicals in appropriate purity and that all instrumentationis working properly. Our current lab staff is not sufficient toadequately cover all the demands of our department,
Program Review Reporting Year: 2016-2017Target : Target Met84% average on the final exam. (03/25/2017)
Exam - Course Test/Quiz - Exam
09/19/2019 Page 198 of 318Generated by Nuventive Improve

Student LearningOutcomes (SLOs) Assessment Methods Assessment Data Summaries Enhancements
particularly given the increase in regulatory oversight andrestrictions.
09/19/2019 Page 199 of 318Generated by Nuventive Improve

CHEM 1A:General Chemistry
Student LearningOutcomes (SLOs) Assessment Methods Assessment Data Summaries Enhancements
CHEM1A_SLO_1 - Identify and explaintrends in the periodic table.SLO Status: Active_Pending_Revision
Target for Success: 70% (which ismuch higher than the nationalaverage success rate as presented bythe American Chemical Society).
Reflection (CLICK ON ? FOR INSTRUCTIONS): Aconsolidated reflection has been provided at the end of thethree outcomes.
Enhancement: A consolidatedenhancement plan is provided inoutcome # 3 (04/02/2013)
Program Review Reporting Year: 2012-2013Target : Target Not MetAverage: 2.5/5Standard Deviation: 2/5Median: 3/5 (07/29/2010)
Exam - Course Test/Quiz - (a) Whichhas a greater affinity for electrons (amore negative value of electronaffinity) and why?Sodium or Magnesium(b) Which has a greater ionizationenergy and why?Nitrogen or oxygen
CHEM1A_SLO_2 - Construct balancedreaction equations and illustrateprinciples of stoichiometry.SLO Status: Active_Pending_Revision
Target for Success: 70% (which ishigher than the national averagesuccess rate reported by theAmerican Chemical Society)
Reflection (CLICK ON ? FOR INSTRUCTIONS): Acomprehensive reflection statement is provided at the endof outcome # 3
Enhancement: A consolidatedreflection statement is provided atthe end of outcome # 3(04/02/2013)
Program Review Reporting Year: 2012-2013Target : Target MetAverage: 8.1/10Standard Deviation: 2.6/10Median: 10/10 (07/29/2010)
Exam - Course Test/Quiz - Howmany grams of phosphine (PH3) canform when 37.5 g of phosphorousand 83.0 L of hydrogen has react atSTP?
P4(s) + H2(g) ?PH3(g) [unbalanced]
CHEM1A_SLO_3 - Apply the first lawof thermodynamics to chemicalreactions.SLO Status: Active_Pending_Revision
Reflection (CLICK ON ? FOR INSTRUCTIONS): The nationalsuccess rate in chemistry (based on data from nsf.gov andacs.org) is between 65-70%. The assessment data of the
Enhancement: This data is from arelatively small sample size (onegroup of 25 students during thesummer quarter). In order to havea more comprehensiveassessment of the learningoutcomes, we plan to evaluate theoutcomes in more sections. Also,the current assessment only
Program Review Reporting Year: 2012-2013Target : Target MetAverage: 8.4/10Standard Deviation: 2.7/10Median: 10/10 (04/02/2013)
Exam - Course Test/Quiz - Highpurity benzoic aicd (C6H5COOH;?Hrxn for combustion = -3227kJ/mol) is used as a standard forcalibrating bomb calorimeters. A1.221-gram sample of benzoic acid isburned in a bomb calorimeter whoseheat capacity is 1365 J/°C. What isthe observed temperature change?
09/19/2019 Page 200 of 318Generated by Nuventive Improve

Student LearningOutcomes (SLOs) Assessment Methods Assessment Data Summaries Enhancements
Target for Success: 70% (which ishigher than the national averagesuccess rate as reported by theAmerican Chemical Society).
outcomes for this chemistry class indicates that theperformance of De Anza College chemistry students isabove the national average.
From this limited sample, we were still able to arrive atsome interesting conclusions. Outcome statement one, forinstance, stems from a conceptual learning objective andstudent’s data here indicated a lower success rate than inoutcome statement three which involved numericalproblem solving skills.
Even more interesting, the objectives related to SLO-1 arenot directly dealt with in any of the laboratory experiments.Whereas the objectives related to SLO-3 are discussed via alaboratory experiment besides in lecture.
This data supports our theory that laboratory experiencesthat closely parallel material discussed in the lecture isessential for students to be successful in chemistry. Ideally,it would be beneficial to the students if we were to modifythe laboratory program to incorporate experimentsperfectly aligned with the lecture. The limiting factor inhaving a highly challenging and exceptional laboratoryprogram is primarily due to limitations in resources.Specifically, the staffing situation in our laboratories is sub-par; we have one staff member undertaking theresponsibilities of three entirely different positions(stockroom manager, hazardous waste manager, laboratorycoordinator). Changes to our laboratory curriculum involvegreat deal of planning: developing new laboratoryexperiments, ordering required chemicals and othersupplies, writing a new laboratory manual, creating wastelabels, organizing different necessary equipment, trainingstudent workers in appropriate laboratory preparations,just to name a few. All of these tasks require largeinvestments of time from both the faculty and the singlestockroom personnel. While the faculty may be able todevelop new and interesting laboratory experiments, it isimpossible to implement these without complete synergy
evaluated the lecture componentof the class. This class has alaboratory component, which isweighted, at 25% -30% of thestudent’s total performance in theclass. In a future term, we plan toevaluate and assess the outcomesin the laboratory as well.(04/02/2013)
09/19/2019 Page 201 of 318Generated by Nuventive Improve

Student LearningOutcomes (SLOs) Assessment Methods Assessment Data Summaries Enhancements
with the (lone) stockroom personnel.
Students will greatly benefit from a richer laboratoryexperience, and this is likely to lead to a much improvedaccomplishment and success of the learning outcomes.However, due to limitations in resources such projects arecurrently purely theoretical concepts.
CHEM1A_SLO_4 - Solve problemsrelated to balanced chemicalequations and illustrate the principlesof stoichiometry.
Planned Assessment Quarters: 2016-17 3-Winter
SLO Status: COR_Update_Necessary
Outcome Creation Date: 10/02/2015
Target for Success: 70%
Reflection (CLICK ON ? FOR INSTRUCTIONS): CHEM 1 ABCis a year long general chemistry sequence. A combinedreflection statement is noted for all the SLOs in theseclasses at the end of CHEM 1C.
Program Review Reporting Year: 2016-2017Target : Target Not Met64.1% average score on the first mid term exam in sections6/62 in the winter quarter. Exam administered on January29th by Elizabeth Pollom. (03/25/2017)
Exam - Course Test/Quiz - Mid termexam covering these topics.
CHEM1A_SLO_5 - Demonstrate anunderstanding of the scientificmethod by performing laboratoryexperiments.
Planned Assessment Quarters: 2016-17 3-Winter
SLO Status: COR_Update_Necessary
Outcome Creation Date: 10/02/2015
Target for Success: 70%
Reflection (CLICK ON ? FOR INSTRUCTIONS): CHEM 1 ABCis a year long general chemistry sequence. A combinedreflection statement is noted for all the SLOs in theseclasses at the end of CHEM 1C.
Program Review Reporting Year: 2016-2017Target : Target Not Met58% average score in the lab final exam (03/25/2017)
Laboratory Project - Lab exam
09/19/2019 Page 202 of 318Generated by Nuventive Improve
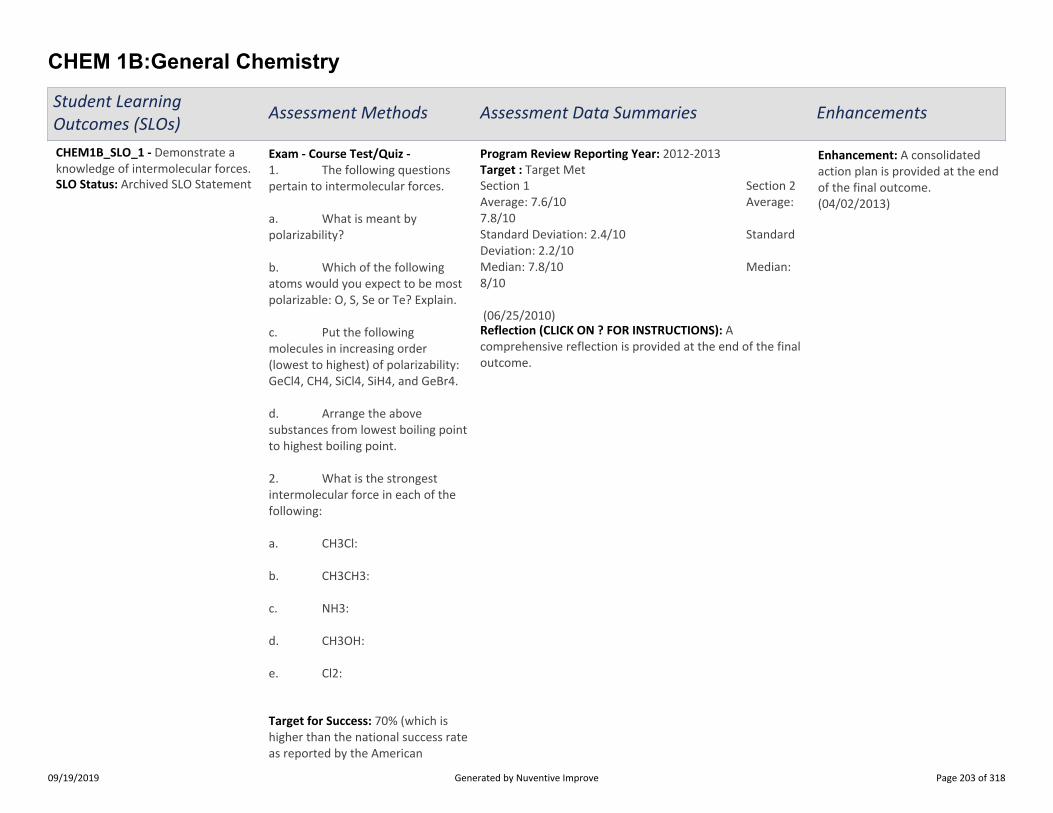
CHEM 1B:General Chemistry
Student LearningOutcomes (SLOs) Assessment Methods Assessment Data Summaries Enhancements
CHEM1B_SLO_1 - Demonstrate aknowledge of intermolecular forces.SLO Status: Archived SLO Statement
Target for Success: 70% (which ishigher than the national success rateas reported by the American
Reflection (CLICK ON ? FOR INSTRUCTIONS): Acomprehensive reflection is provided at the end of the finaloutcome.
Enhancement: A consolidatedaction plan is provided at the endof the final outcome.(04/02/2013)
Program Review Reporting Year: 2012-2013Target : Target MetSection 1 Section 2Average: 7.6/10 Average:7.8/10Standard Deviation: 2.4/10 StandardDeviation: 2.2/10Median: 7.8/10 Median:8/10
(06/25/2010)
Exam - Course Test/Quiz -1. The following questionspertain to intermolecular forces.
a. What is meant bypolarizability?
b. Which of the followingatoms would you expect to be mostpolarizable: O, S, Se or Te? Explain.
c. Put the followingmolecules in increasing order(lowest to highest) of polarizability:GeCl4, CH4, SiCl4, SiH4, and GeBr4.
d. Arrange the abovesubstances from lowest boiling pointto highest boiling point.
2. What is the strongestintermolecular force in each of thefollowing:
a. CH3Cl:
b. CH3CH3:
c. NH3:
d. CH3OH:
e. Cl2:
09/19/2019 Page 203 of 318Generated by Nuventive Improve
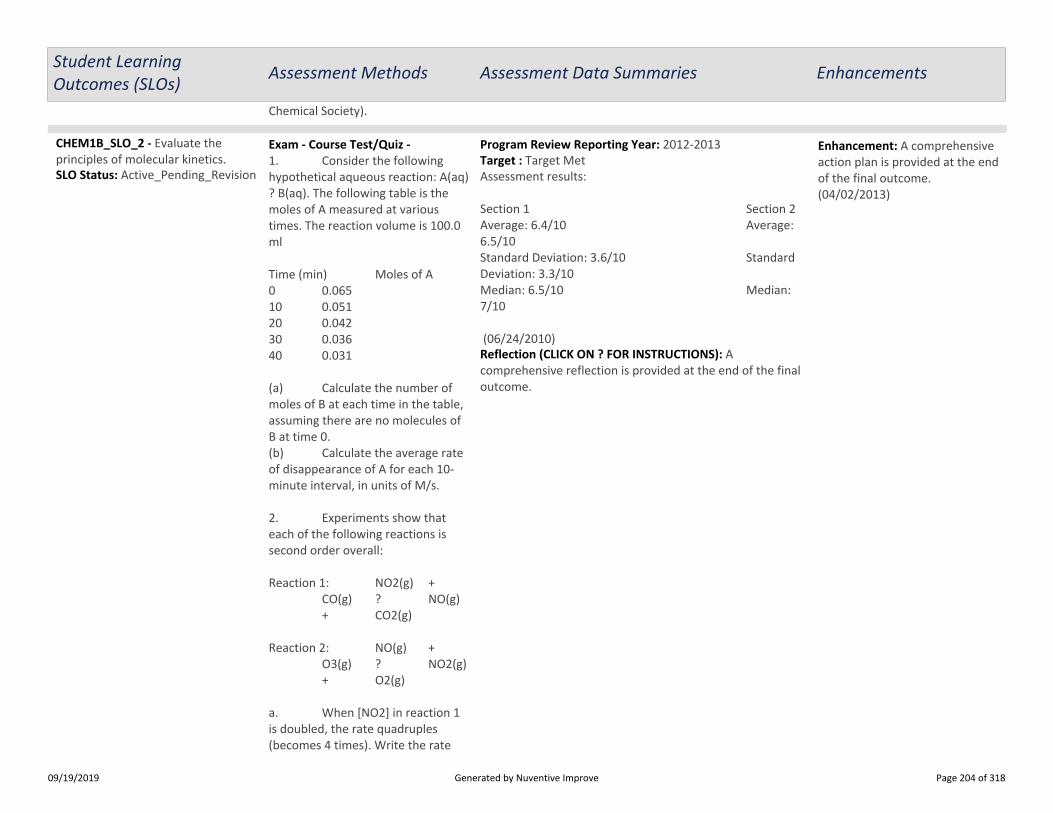
Student LearningOutcomes (SLOs) Assessment Methods Assessment Data Summaries Enhancements
Chemical Society).
CHEM1B_SLO_2 - Evaluate theprinciples of molecular kinetics.SLO Status: Active_Pending_Revision
Reflection (CLICK ON ? FOR INSTRUCTIONS): Acomprehensive reflection is provided at the end of the finaloutcome.
Enhancement: A comprehensiveaction plan is provided at the endof the final outcome.(04/02/2013)
Program Review Reporting Year: 2012-2013Target : Target MetAssessment results:
Section 1 Section 2Average: 6.4/10 Average:6.5/10Standard Deviation: 3.6/10 StandardDeviation: 3.3/10Median: 6.5/10 Median:7/10
(06/24/2010)
Exam - Course Test/Quiz -1. Consider the followinghypothetical aqueous reaction: A(aq)? B(aq). The following table is themoles of A measured at varioustimes. The reaction volume is 100.0ml
Time (min) Moles of A0 0.06510 0.05120 0.04230 0.03640 0.031
(a) Calculate the number ofmoles of B at each time in the table,assuming there are no molecules ofB at time 0.(b) Calculate the average rateof disappearance of A for each 10-minute interval, in units of M/s.
2. Experiments show thateach of the following reactions issecond order overall:
Reaction 1: NO2(g) +CO(g) ? NO(g)+ CO2(g)
Reaction 2: NO(g) +O3(g) ? NO2(g)+ O2(g)
a. When [NO2] in reaction 1is doubled, the rate quadruples(becomes 4 times). Write the rate
09/19/2019 Page 204 of 318Generated by Nuventive Improve

Student LearningOutcomes (SLOs) Assessment Methods Assessment Data Summaries Enhancements
Target for Success: 70% (which ishigher than the national averagesuccess rate as reported by theAmerican Chemical Society)
law for this reaction.
b. When the [NO] in reaction2 is doubled, the rate doubles. Writethe rate law for this reaction.
c. In reaction 1, the initial[NO2] is twice the initial [CO]. Whatis the ratio of the initial rate ofreaction to the rate at 50%completion?
CHEM1B_SLO_3 - Apply principles ofchemical equilibrium to chemicalreactions.SLO Status: Active_Pending_Revision
Target for Success: 70% (which ishigher than the national average
Reflection (CLICK ON ? FOR INSTRUCTIONS): Acomprehensive reflection is provided at the end of the finaloutcome.
Enhancement: A comprehensiveaction plan is provided at the endof the final outcome.(04/02/2013)
Program Review Reporting Year: 2012-2013Target : Target MetSection 1 Section 2Average: 8.2/10 Average:8/10Standard Deviation: 2.8/10 StandardDeviation: 3/10Median: 10/10 Median:10/10 (06/25/2010)
Enhancement: A comprehensiveaction plan is provided at the endof the final outcome.(04/02/2013)
Program Review Reporting Year: 2012-2013Target : Target MetSection 1 Section 2Average: 8.2/10 Average:8/10Standard Deviation: 2.8/10 StandardDeviation: 3/10Median: 10/10 Median:10/10
Exam - Course Test/Quiz -Consider the decomposition ofphosphorous pentachloride:
PCl5(g) PCl3(g) +Cl2(g) KC = 1.80 at 250°
C
a. If 0.300 M PCl5 is placed ina 500-ml container at 250°C, whatare the equilibrium concentrationsof PCl5, PCl3, and Cl2?b. Suppose to the abovemixture at equilibrium, you add0.100 moles of Cl2(g) (inside the500-ml container), what are the newequilibrium concentrations of PCl5,PCl3, and Cl2?
09/19/2019 Page 205 of 318Generated by Nuventive Improve

Student LearningOutcomes (SLOs) Assessment Methods Assessment Data Summaries Enhancements
success rate reported by theAmerican Chemical Society) Reflection (CLICK ON ? FOR INSTRUCTIONS): A
comprehensive reflection statement is provided at the endof the final outcome.
(06/24/2010)
CHEM1B_SLO_4 - Apply the secondand third laws of thermodynamics tochemical reactions.SLO Status: Active_Pending_Revision
Reflection (CLICK ON ? FOR INSTRUCTIONS): The nationalsuccess rate in chemistry (based on data from nsf.gov andacs.org) is between 65-70%. The assessment data of theoutcomes for this chemistry class indicates that theperformance of De Anza College chemistry students isabove the national average.
Based on the two sections that were assessed, we notedthat the success rate of students meeting or exceeding thenational average is greater in this class than in Chem 1A,the pre-requisite for this class. The minimum performancestandard that students are expected to meet in order to beadmitted to Chem 1B is a C in Chem 1A. It seems thatstudents meeting this standard are adequately prepared totackle the challenges of this class.
It was also interesting to note that, this particular class hasan exceptionally well-developed laboratory program, whichis perfectly aligned with the lecture. Even though thevarious outcomes were assessed in lecture, our contentionis that the experimental demonstration of the lectureobjectives through processes of self-discovery in thelaboratory provides for a much stronger understanding andretention of the theories discussed in the lecture. In thenext round of assessment, we will evaluate the outcomes in
Enhancement: In the next roundof assessment, we will evaluatethe outcomes in the laboratoryprogram.
This class also serves as a modelfor the kinds of developmentalactivities that we should engagein, in our other chemistry classes.(04/02/2013)
Program Review Reporting Year: 2012-2013Target : Target MetSection 1 Section 2Average: 7.6/10 Average:7.7/10Standard Deviation: 3.3/10 StandardDeviation: 2.7/10Median: 10/10 Median:9/10 (06/25/2010)
Exam - Course Test/Quiz -1. Given the following twoequations: ?G° = ?H° – T?S° and ?G°= -RTlnK; and assumption that ?H°and ?S° are constants over a widerange of temperatures (all thesymbols have the usual meanings).If K1 is the equilibrium constant at atemperature T1 and K2 is theequilibrium constant at atemperature T2, show that:
2. What is the standardmolar entropy (in ) of condensationof water at 100°C? A usefulgeneralization known as Troutan’srule states that for many liquids attheir normal boiling points, thestandards molar entropy ofvaporization has a value of about 87J-mol-1K-1. The enthalpy ofvaporization of water is 40.67kJ/mol.
a. Given that water vaporizesat 100°C, what is the value for thestandard molar entropy ofvaporization for water?b. According to Troutan’srule: for many liquids at their normalboiling points, the standard molarentropy of vaporization is about 87J-mol-1K-1? Does the valuecalculated in part (a) agree with
09/19/2019 Page 206 of 318Generated by Nuventive Improve
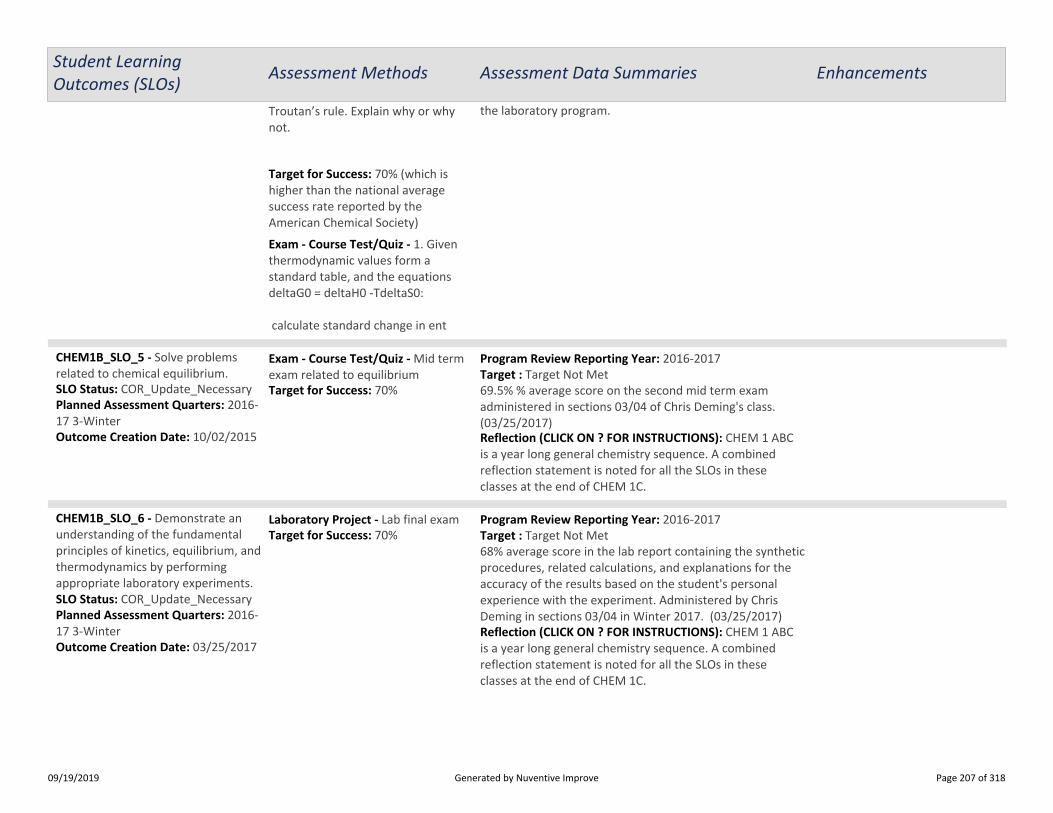
Student LearningOutcomes (SLOs) Assessment Methods Assessment Data Summaries Enhancements
Target for Success: 70% (which ishigher than the national averagesuccess rate reported by theAmerican Chemical Society)
the laboratory program.Troutan’s rule. Explain why or whynot.
Exam - Course Test/Quiz - 1. Giventhermodynamic values form astandard table, and the equationsdeltaG0 = deltaH0 -TdeltaS0:
calculate standard change in ent
CHEM1B_SLO_5 - Solve problemsrelated to chemical equilibrium.
Planned Assessment Quarters: 2016-17 3-Winter
SLO Status: COR_Update_Necessary
Outcome Creation Date: 10/02/2015
Target for Success: 70%
Reflection (CLICK ON ? FOR INSTRUCTIONS): CHEM 1 ABCis a year long general chemistry sequence. A combinedreflection statement is noted for all the SLOs in theseclasses at the end of CHEM 1C.
Program Review Reporting Year: 2016-2017Target : Target Not Met69.5% % average score on the second mid term examadministered in sections 03/04 of Chris Deming's class.(03/25/2017)
Exam - Course Test/Quiz - Mid termexam related to equilibrium
CHEM1B_SLO_6 - Demonstrate anunderstanding of the fundamentalprinciples of kinetics, equilibrium, andthermodynamics by performingappropriate laboratory experiments.
Planned Assessment Quarters: 2016-17 3-Winter
SLO Status: COR_Update_Necessary
Outcome Creation Date: 03/25/2017
Target for Success: 70%
Reflection (CLICK ON ? FOR INSTRUCTIONS): CHEM 1 ABCis a year long general chemistry sequence. A combinedreflection statement is noted for all the SLOs in theseclasses at the end of CHEM 1C.
Program Review Reporting Year: 2016-2017Target : Target Not Met68% average score in the lab report containing the syntheticprocedures, related calculations, and explanations for theaccuracy of the results based on the student's personalexperience with the experiment. Administered by ChrisDeming in sections 03/04 in Winter 2017. (03/25/2017)
Laboratory Project - Lab final exam
09/19/2019 Page 207 of 318Generated by Nuventive Improve
CHEM 1C:General Chemistry and Qualitative Analysis
Student LearningOutcomes (SLOs) Assessment Methods Assessment Data Summaries Enhancements
CHEM1C_SLO_1 - Apply the principlesof equilibrium and thermodynamicsto electrochemical systems.SLO Status: Active_Pending_Revision
Target for Success: 70% (which ishigher than the national averagesuccess reported by the AmericanChemical Society)
Reflection (CLICK ON ? FOR INSTRUCTIONS): Students arenot successfully learning this outcome. The outcomeassessed here has to do with several concepts, some ofwhich are discussed in the previous class of this sequence.Although, a review of those topics is included in this class,the complexity of those topics provided justification tospend more time on those topics.
Enhancement: The departmentwill examine a realignment oftopics in the entire generalchemistry sequence to providemore time for discussions of morecomplex topics. (04/02/2013)
Program Review Reporting Year: 2012-2013Target : Target Not Met
Section 1 Section 2Mean 5.3 5.7Standard Deviation 4.1 4.1Median 5 5 (03/28/2013)
Exam - Course Test/Quiz - Thesolubility product constant (KSP) forPd(OH)2 is 3.0 × 10⁻²⁸. Given thatthe standard reduction potential forPd2+/Pd is 0.915 V. Calculate thestandard reduction potential for thefollowing:
Pd(OH)2(S) + 2e ? Pd(S) + 2OH-(aq
CHEM1C_SLO_2 - Apply the principlesof transition metail chemistry topredict outcomes of chemicalreactions and physical properties.SLO Status: Active_Pending_Revision
Reflection (CLICK ON ? FOR INSTRUCTIONS): The data hereindicates that students are only learning this outcome to amodest extent. In order to provide a more in-depthunderstanding of this topics, perhaps a related laboratoryexperiment must be included which can illustrate some ofthe principles discussed in the lecture.
Enhancement: The departmentwill consider incorporatinglaboratory topics to illustrate theprinciples being discussed here.Future assessments couldprobably be conducted in thelaboratory. (04/02/2013)
Program Review Reporting Year: 2012-2013Target : Target Met
Section 1 Section 2Mean 6.0 7.0Standard Deviation 2.9 2.8Median 6 8 (03/28/2013)
Exam - Course Test/Quiz - Back in1895, before the days of systematicnomenclature from IUPAC ofcoordination compounds, a studentsynthesized three chromiumcoordination compounds all of whichhad the same formula CrCl3(H2O)6.Further analysis of the threecompounds showed the followingproperties:
Color Chloride ions insolution(not part of the complex)Compound 1 Violet 3Compound 2 Light Green
2Compound 3 Dark Green
1
Keeping in mind that chromiumforms octahedral complexes, answer
09/19/2019 Page 208 of 318Generated by Nuventive Improve

Student LearningOutcomes (SLOs) Assessment Methods Assessment Data Summaries Enhancements
Target for Success: 70% (which ishigher than the national averagesuccess reported by the AmericanChemical Society)
the following questions:
a. Give the correct formulasof the three compounds and alsotheir names.b. Which, if any, of the threecompounds will have geometricisomers? Draw the geometricisomers of this compound.c. Will the central metal ionin each compound have a high spinor low spin electron configuration?Draw an orbital diagram to illustrateyour answer.d. Which of the threecompounds will be paramagneticand which will be diamagnetic?e. Suggest a simpleexperiment to confirm the numberof chloride ions present in solution ineach of the compounds.
CHEM1C_SLO_3 - Evaluate isotopicdecay pathways.SLO Status: Active_Pending_Revision
Target for Success: 70% (which ishigher than the national average
Reflection (CLICK ON ? FOR INSTRUCTIONS): The studentsare definitely learning this topic and understanding theideas and concepts well.
Enhancement: At this time nomajor action plan isrecommended. (04/02/2013)
Program Review Reporting Year: 2012-2013Target : Target Met
Section 1 Section 2Mean 8.7 8.5Standard Deviation 2.2 2.7Median 10 10 (03/28/2013)
Exam - Course Test/Quiz - A volcaniceruption melts a large chunk of rock,and all the gases are expelled. Aftercooling, 40Ar accumulates from theongoing decay of 40K in the rock.Half life of 40K is 1.25 × 10⁹ yr.When a piece of rock is analyzed, itis found to contain 1.38 mmol(millimoles) of 40K and 1.14 mmol of40Are. How long ago did the rockcool?
09/19/2019 Page 209 of 318Generated by Nuventive Improve

Student LearningOutcomes (SLOs) Assessment Methods Assessment Data Summaries Enhancements
success reported by the AmericanChemical Society)
CHEM1C_SLO_4 - Combine principlesof equilibrium and thermodynamicsand solve problems related toelectrochemical systems.
Planned Assessment Quarters: 2015-16 4-Spring
SLO Status: COR_Update_Necessary
Outcome Creation Date: 10/02/2015
Target for Success: 70%Reflection (CLICK ON ? FOR INSTRUCTIONS): CHEM 1ABC isa year long general chemistry sequence. A combinedreflection statement is noted for all the SLOs in theseclasses at the end of CHEM 1C.
Program Review Reporting Year: 2016-2017Target : Target Met79% average score (03/25/2017)
Exam - Course Test/Quiz - Mid termexam
CHEM1C_SLO_5 - Analyze unknowninorganic salts qualitatively andidentify the cations and anionspresent in them.
Planned Assessment Quarters: 2015-16 4-Spring
SLO Status: COR_Update_Necessary
Outcome Creation Date: 10/02/2015
Target for Success: 70%
Reflection (CLICK ON ? FOR INSTRUCTIONS): GeneralChemistry is a year long sequence comprised of threeclasses each of which has a lecture and a laboratorycomponent. The SLOs in these classes were generallydivided into two parts- one testing learning outcomes in thelecture and other testing learning outcomes in thelaboratory.
Based on the assessment of the lecture outcome, we havelearned that the students are having a difficult time withthe recently adopted free textbook from OpenStax. As aresult the department is negotiating with publishers ofconventional textbooks to obtain a low-cost deal for thestudents. We also learned that students understood lecturetopics better when there was a closely related laboratoryexperiment.
Most of the laboratory exercises in these classes workadequately. However, there are some that requiresignificant overhauling. The department plans to work onthis in the coming year. Laboratory overhaul is both laborintensive and capital intensive. To this end, the departmentis requesting funds to support this process. The funds willbe utilized for 1) purchasing equipment that will be used in
Program Review Reporting Year: 2016-2017Target : Target Met80% average score on lab practical exam for cations.(03/25/2017)
Laboratory Project - Lab report foranalysis of cations and anions.
09/19/2019 Page 210 of 318Generated by Nuventive Improve

Student LearningOutcomes (SLOs) Assessment Methods Assessment Data Summaries Enhancements
experiments 2) purchasing new chemicals 3) updating someof the older equipment with more modern substitutes.
Finally, the department would like to emphasize that due tothe heavy reliance on the laboratory program in all ourcurriculum, it is not only important to have adequatefinancial resources for equipment and supplies for thelaboratory, but also an additional full time staff person tomanage the day to day laboratory operations. This willenable us to add more sections of these high demandclasses (each of which have full waiting lists in all theirsections) and ultimately increase enrollment significantlywhich will be a benefit to 1) students 2) the chemistrydepartment 3) the college and 4) the district.
CHEM1C_SLO_6 - Demonstrate aknowledge of intermolecular forces.
SLO Status: Active_Pending_RevisionOutcome Creation Date: 02/10/2018
09/19/2019 Page 211 of 318Generated by Nuventive Improve

CHEM 25:Preparation Course for General Chemistry
Student LearningOutcomes (SLOs) Assessment Methods Assessment Data Summaries Enhancements
CHEM50_SLO_1 - Assess thefundamental concepts of modernatomic and molecular theory.SLO Status: Active
Target for Success: 70% (which ishigher than the national averagesuccess rate reported by theAmerican Chemical Society).
Reflection (CLICK ON ? FOR INSTRUCTIONS): A detailedreflection is provided at the end of the final outcome.
Enhancement: A detailed actionplan is provided at the end of finaloutcome. (04/02/2013)
Program Review Reporting Year: 2012-2013Target : Target Not Met#3) Number of Responses: 37Number of Correct: 19Number of Incorrect:18Average % Correct: 51.4%#34) Number of Responses: 37Number of Correct: 25Number of Incorrect:12Average % Correct: 67.6% (06/24/2010)
Exam - Course Test/Quiz - 3. Howmany neutrons are in the nucleus ofan atom of 6027 Co?34. What is the molecular shape ofNH¬3?
CHEM50_SLO_2 - Evaluate thestandard classes of chemicalreactions.SLO Status: Active
Target for Success: 70% (which ishigher than the national averagesuccess rate reported by theAmerican Chemical Society).
Reflection (CLICK ON ? FOR INSTRUCTIONS): A detailedreflection is provided at the end of the final outcome.
Enhancement: A detailed actionplan is provided at the end of finaloutcome. (04/02/2013)
Program Review Reporting Year: 2012-2013Target : Target Not Met15) Number of Responses: 37Number of Correct: 21Number of Incorrect:16Average % Correct: 56.8%
16) Number of Responses: 37Number of Correct: 34Number of Incorrect: 3Average % Correct: 91.9 % (06/25/2010)
Exam - Course Test/Quiz - 15. Whatare the predicted products from thefollowing neutralization reaction?16. What is the formula of thepredicted product from heatingmagnesium metal and nitrogen gas?
CHEM50_SLO_3 - Demonstrate afundamental understanding ofmathematical concepts pertaining tochemical experimentation andcalculations.SLO Status: Active
Enhancement: The proposals inthe reflection statement willrequire considerable additionalresources, which we currentlylack. While the tutorial centerprovides students with anopportunity for drop-in tutoring;the number of tutors available is a
Program Review Reporting Year: 2012-2013Target : Target Not Met28. Number of Responses: 37Number of Correct: 16Number of Incorrect: 21Average % Correct: 43.2 %
48. Number of Responses: 37Number of Correct: 28
Exam - Course Test/Quiz - 28. Howmany moles of helium occupy avolume of 5.00L at 227.0ºC and 5.00atm?48. If 37.5 mL of 0.100 M calciumchloride reacts completely withaqueous silver nitrate, what is themass of AgCl (143.32g/mol)precipitate?
09/19/2019 Page 212 of 318Generated by Nuventive Improve

Student LearningOutcomes (SLOs) Assessment Methods Assessment Data Summaries Enhancements
Target for Success: 70% (which ishigher than the national averagesuccess rate reported by theAmerican Chemical Society). Reflection (CLICK ON ? FOR INSTRUCTIONS): The national
success rate in chemistry (based on data from nsf.gov andacs.org) is between 65-70%. The assessment data of theoutcomes for this chemistry class indicates that theperformance of De Anza College chemistry students is at orabove the national average. While this is encouraging, wefeel that there is scope for further improvement. Since thisis a “preparation” class for General Chemistry coursesequence, our experience has been that, those studentswho simply meet the minimum required performancestandards in this class are having difficulties in the GeneralChemistry sequence. The primary methods by which we canelevate student performance to far above averagestandards would be: 1) by providing students greatersupport via tutorials/recitations and education about studyskills; and 2) by providing students a better laboratoryexperience by tying in the lab experiences more closelywith the lecture.
small number compared to thetotal number of students enrolledin this class. Additionally, thetutorial center is not equipped toprovide students with guidanceregarding study skills, or strategiesfor being successful in chemistry(and sciences in general).
Based on our assessment of adifferent chemistry class (Chem1B) in which the lecture andlaboratory are extremely wellcoordinated, we concluded thatlaboratory experiences thatclosely parallel material discussedin the lecture is essential forstudents to be successful inchemistry. The limiting factor inhaving a highly challenging andexceptional laboratory program isprimarily due to limitations inresources. Specifically, the staffingsituation in our laboratories is sub-par; we have one staff memberundertaking the responsibilities ofthree entirely different positions(stockroom manager, hazardouswaste manager, laboratorycoordinator). Changes to ourlaboratory curriculum involve agreat deal of planning: developingnew laboratory experiments,ordering required chemicals andother supplies, writing a newlaboratory manual, creating wastelabels, organizing differentnecessary equipment, trainingstudent workers in appropriatelaboratory preparations, just to
Number of Incorrect: 9Average % Correct: 75.7% (06/25/2010)
09/19/2019 Page 213 of 318Generated by Nuventive Improve
Student LearningOutcomes (SLOs) Assessment Methods Assessment Data Summaries Enhancements
name a few. All of these tasksrequire large investments of timefrom both the faculty and thesingle stockroom full-timepersonnel. While the faculty maybe able to develop new andinteresting laboratoryexperiments, it is impossible toimplement these withoutcomplete synergy with the (lone)stockroom personnel.
Students will greatly benefit froma richer laboratory experience,and this is likely to lead to a muchimproved accomplishment andsuccess of the learning outcomes.However, due to limitations inresources such projects arecurrently purely theoreticalconcepts. (04/02/2013)
09/19/2019 Page 214 of 318Generated by Nuventive Improve

CHEM 30A:Introduction to General, Organic and Biochemistry I
Student LearningOutcomes (SLOs) Assessment Methods Assessment Data Summaries Enhancements
CHEM30A_SLO_1 - Solvestoichiometric problems by applyingappropriate molar relationships.SLO Status: Archived SLO Statement
Target for Success: 70% (higher thanthe average success rate reported bythe American Chemical Society)
Reflection (CLICK ON ? FOR INSTRUCTIONS): A detailedsummary of the reflection is at the end of the finaloutcome.
Enhancement: A detailed actionplan is at the end of the finaloutcome. (04/02/2013)
Program Review Reporting Year: 2012-2013Target : Target MetAverage score: 70/100Standard Deviation: 21/100Median: 75/100Success rate: 70% (03/25/2011)
Exam - Course Test/Quiz - 8. (10points) In the following reactionbetween sulfuric acid and sodiumhydroxide, 12.5 ml of sodiumhydroxide are needed to reactcompletely with 37.5 ml of 0.200 Msulfuric acid. What is theconcentration (molarity) of thesodium hydroxide?
2NaOH + H2SO4 ?Na2SO4 + 2H
9. (10 points) How many mlof 3.00 M HCl are needed tocompletely react with 4.85 grams ofcalcium carbonate according to thefollowing reaction?
CaCO3 + 2HCl? CaCl2+ H2CO3
10. (10 points) How many mlof 0.500 M magnesium nitrate areneeded to react with 10.0 ml of0.250 M potassium phosphateaccording to the followingUNBALANCED reaction? (you willneed to balance the equation priorto solving the problem)
Mg(NO3)2 + K3PO4? Mg3(PO4)2+ KNO3
09/19/2019 Page 215 of 318Generated by Nuventive Improve
Student LearningOutcomes (SLOs) Assessment Methods Assessment Data Summaries Enhancements
CHEM30A_SLO_2 - Predict thebehavior of ideal gasses using KineticMolecular Theory.SLO Status: Archived SLO Statement
Reflection (CLICK ON ? FOR INSTRUCTIONS): A detailedreflection statement if at the end of the final outcome
Enhancement: A detailed actionplan is at the end of the finaloutcome. (04/02/2013)
Program Review Reporting Year: 2012-2013Target : Target MetAverage score: 36/50Standard Deviation: 8.3/50Median: 36/50Success rate: 72% (03/25/2011)
Exam - Course Test/Quiz - 1. Whichof the following is a unit of pressureequal to 1 mm Hg?
(a) 1 atm(b) 1 kPa(c) 1 psi(d) 1 torr(e) none
of the above
2. What is the term for a gasat 273 K and 760 mm Hg pressure?
(a)atmospheric temperature
and pressure(b)
experimental temperatureand pressure
(c) idealgas temperature and pressure
(d)standard temperature and
pressure(e) none
of the above
3. If a gas pressure gaugereads 15 mm Hg, what is thepressure in atmospheres?
(a) 0.020atm
(b) 0.20atm
(c) 15 atm(d) 1100
atm(e) 11,000
09/19/2019 Page 216 of 318Generated by Nuventive Improve

Student LearningOutcomes (SLOs) Assessment Methods Assessment Data Summaries Enhancements
atm
4. If a steel scuba tankcontains compressed air at 2250 psi,what is the pressure expressed inatmospheres? (1atm = 14.7 psi)
(a) 2.96atm
(b) 29.6atm
(c) 75.3atm
(d) 153atm
(e) 3.31 ×10⁴ atm
5. Which of the followingchanges decreases the pressure of agas?
(a)increasing the volume
(b)decreasing the
temperature(c)
decreasing the number ofgas molecules
(d) all ofthe above
(e) noneof the above
09/19/2019 Page 217 of 318Generated by Nuventive Improve
Student LearningOutcomes (SLOs) Assessment Methods Assessment Data Summaries Enhancements
6. A sample of argon gas at520 mm Hg expands from 0.150 L to0.300 L. If the temperature remainsconstant, what is the final pressure?
(a) 260mm Hg
(b) 520mm Hg
(c) 760mm Hg
(d) 1040mm Hg
(e) noneof the above
7. If the pressure of 1.50 L ofhydrogen gas at 100 °C decreasesfrom 0.500 atm to 0.115 atm, whatis the final volume? Assumetemperature remains constant.
(a) 0.345 L(b) 0.652 L(c) 1.50 L(d) 3.45 L(e) 6.52 L
8. A 5.00 L volume of ethanegas is heated from 298 K to 596 K. Ifthe pressure remains constant, whatis the final volume?
(a) 2.50 L(b) 4.58 L(c) 5.00 L(d) 5.46 L
09/19/2019 Page 218 of 318Generated by Nuventive Improve

Student LearningOutcomes (SLOs) Assessment Methods Assessment Data Summaries Enhancements
(e) 10.0 L
9. If a volume of nitric oxidegas at 25.0 °C increases from 2.00 Lto 3.00 L, what is the final Celsiustemperature? Assume pressureremains constant.
(a) –74 °C(b) 17 °C(c) 38 °C(d) 174 °C(e) 199 °C
10. A sample of air at 7.50 atmis heated from 224 K to 448 K. If thevolume remains constant, what isthe final pressure?
(a) 4.57atm
(b) 3.75atm
(c) 6.15atm
(d) 12.3atm
(e) 15.0atm
09/19/2019 Page 219 of 318Generated by Nuventive Improve

Student LearningOutcomes (SLOs) Assessment Methods Assessment Data Summaries Enhancements
11. The pressure of sulfurtrioxide gas at 25 °C increases from0.500 atm to 1.00 atm. What is thefinal Celsius temperature if thevolume remains constant?
(a) –124 °C
(b) 149 °C(c) 323 °C(d) 422 °C(e) 596 °C
12. If a 50.0 mL sample ofxenon gas is at 0.921 atm and 27 °C,what is the volume of the gas atSTP?
(a) 41.9mL
(b) 49.4mL
(c) 50.6mL
(d) 54.9mL
(e) 59.7mL
13. A sample of laughing gasoccupies 0.250 L at 14.7 psi and–80.0 °C. If the volume of the gas is0.375 L at 25.0 °C, what is thepressure?
(a) 6.35
09/19/2019 Page 220 of 318Generated by Nuventive Improve

Student LearningOutcomes (SLOs) Assessment Methods Assessment Data Summaries Enhancements
psi(b) 14.3
psi(c) 15.1
psi(d) 31.4
psi(e) 34.0
psi
14. An atmospheric samplecontains nitrogen at 599 torr, oxygenat 154 torr, argon at 6 torr, andcarbon dioxide. Assuming standardpressure, what is the partial pressureof carbon dioxide gas?
(a) 1 torr(b) 6 torr(c) 439
torr(d) 759
torr(e) 1519
torr
15. Which of the followingstates that the pressure and volumeare inversely proportional for a gasat constant temperature?
(a) Boyle’slaw
(b)Charles’s law
(c) Dalton’s law
(d) Gay-Lussac’s law
09/19/2019 Page 221 of 318Generated by Nuventive Improve
Student LearningOutcomes (SLOs) Assessment Methods Assessment Data Summaries Enhancements
(e) noneof the above
16. Which of the followingstates that the volume and Kelvintemperature are directlyproportional for a gas at constantpressure?
(a) Boyle’slaw
(b)Charles’s law
(c) Dalton’s law
(d) Gay-Lussac’s law
(e) noneof the above
17. Which of the followingstates that the pressure exerted by agas is inversely proportional to itsvolume and directly proportional toits Kelvin temperature?
(a) Boyle’slaw
(b)Charles’s law
(c) Gay-Lussac’s law
(d)combined gas law
(e) none
09/19/2019 Page 222 of 318Generated by Nuventive Improve
Student LearningOutcomes (SLOs) Assessment Methods Assessment Data Summaries Enhancements
Target for Success: 70% (higher thanthe average success rate reported bythe American Chemical Society)
of the above
18. Which of the followingstates that the pressure exerted by amixture of gases is equal to the sumof the individual gas pressures?
(a) Boyle’slaw
(b)Charles’s law
(c) Dalton’s law
(d) Gay-Lussac’s law
(e) noneof the above
CHEM30A_SLO_3 - Apply acid-basechemical principles to biologicalprocesses.SLO Status: Archived SLO Statement
Reflection (CLICK ON ? FOR INSTRUCTIONS): The data fromthis assessment cycle showed us that students werelearning the outcomes outlined for this class. Although thetarget success rate was met in all three outcomes, theperformance could be further enhanced. This class is thefirst of a two-quarter sequence of introduction to general,organic, and biochemistry classes whose target student-group is those entering the allied health professions. Thelearning outcomes and the assessment tools employed forappropriate for this class and the results indicate a goodsuccess rate.
Enhancement: The success rate inthis class could be enhanced byimproving the lab curriculum.Following this assessment, the labcurriculum for these two classesare undergoing a major revision.The outcomes must be re-evaluated in two-three years todetermine the effect of therevised curriculum. (04/02/2013)
Program Review Reporting Year: 2012-2013Target : Target MetAverage score: 39/50Standard Deviation: 8/50Median: 39/50Success rate: 78% (03/25/2011)
Exam - Course Test/Quiz - 1)According to the Bronsted-Lowrydefinition,
A) an acid is a proton acceptor.B) a base produces ions in aqueoussolutions.C) a base is a proton donor.D) a base is a proton acceptor.E) an acid acts as the solvent.
2) Identify the Bronsted-Lowry acidin the following reaction.
A)
09/19/2019 Page 223 of 318Generated by Nuventive Improve

Student LearningOutcomes (SLOs) Assessment Methods Assessment Data Summaries Enhancements
B)C)D)E)
3) The correct formula for sulfuricacid is
A) .B) .C) .D)E) .
4) Which of the following statementscorrectly describes the hydronium-hydroxide balance in the givensolution?
A) In acids, [ ] is greater than [ ].B) In bases, [ ] = [ ].C) In neutral solutions, [ ] =[ ].D) In bases, [ ] is greater than [ ].E) In bases, [ ] is less than [ ].
5) What is the [ ] in a solution with [ ]= ?
A)B)C)D)
09/19/2019 Page 224 of 318Generated by Nuventive Improve
Student LearningOutcomes (SLOs) Assessment Methods Assessment Data Summaries Enhancements
E)
6) What is the [ ] in a solution thathas a [ ] = ?
A)B)C)D)E)
7) What is the pH of a solution with [] = ?
A)B) -9.0C) 5.0D) -5.0E) 9.0
8) What is the pH of a solution with [] = ?
A) 10.0B) -10.0C) 4.0D) -4.0E)
9) A solution with [ ] of has a pH of________.
09/19/2019 Page 225 of 318Generated by Nuventive Improve

Student LearningOutcomes (SLOs) Assessment Methods Assessment Data Summaries Enhancements
A) 2.3B) -2.3C) 11.7D) 7.0E) 5.0
10) The [ ] of a solution with pH = 9.7is
A) 9.7 M.B) .C) .D) .E)
11) An acid and base react to form asalt and water in a(n) ________reaction.
A) ionizationB) dissociationC) oxidationD) neutralizationE) reduction
12) Which of the following is thecorrectly balanced equation for thecompleteneutralization of with ?
09/19/2019 Page 226 of 318Generated by Nuventive Improve
Student LearningOutcomes (SLOs) Assessment Methods Assessment Data Summaries Enhancements
A)B)C)D)E)
13) The neutralization reactionbetween and produces the saltwith the formula
A) .B) .C) .D) .E) .
14) The function of a buffer is to
A) change color at the end point of atitration.B) maintain the pH of a solution.C) be a strong base.D) maintain a neutral pH.E) act as a strong acid.
15) Which of the following is a buffersystem?
A) NaCl andB) HCl and NaOHC) andD) NaCl and NaOHE) and HCl
09/19/2019 Page 227 of 318Generated by Nuventive Improve

Student LearningOutcomes (SLOs) Assessment Methods Assessment Data Summaries Enhancements
Target for Success: 70% (higher thanaverage success rate reported by theAmerican Chemical Society)
16) 25.0 mL of 0.212 M NaOH isneutralized by 13.6 mL of an HClsolution. The molarity of the NaOHsolution is
A) 0.212 M.B) 0.115 M.C) 0.500 M.D) 0.390 M.E) 0.137 M.
17) A 10.0 mL of 0.121 M isneutralized by 17.1 mL of KOHsolution. The molarity of the KOHsolution is
A) 0.207 M.B) 0.4141 M.C) 0.0708 M.D) 0.428 M.E) 0.142 M.
CHEM30A_SLO_4 - Solvestoichiometric problems pertaining toreactions between acids and bases.
Planned Assessment Quarters: 2016-17 3-Winter
SLO Status: Active
Outcome Creation Date: 10/02/2015
Target for Success: 70%Reflection (CLICK ON ? FOR INSTRUCTIONS): CHEM 30 AB isa sequence of two classes. A combined reflection statementis noted at the end of the SLO for 30B.
Program Review Reporting Year: 2016-2017Target : Target MetX (03/25/2017)
Exam - Course Test/Quiz - Titrationproblem from final mid term exam.
CHEM30A_SLO_5 - Demonstrate anunderstanding of the scientificmethod by performing laboratory
Target for Success: 70%Program Review Reporting Year: 2016-2017Target : Target Met
Laboratory Project - Lab final exam
09/19/2019 Page 228 of 318Generated by Nuventive Improve

Student LearningOutcomes (SLOs) Assessment Methods Assessment Data Summaries Enhancements
experiments.
Planned Assessment Quarters: 2016-17 3-Winter
SLO Status: Archived SLO Statement
Outcome Creation Date: 10/02/2015
Reflection (CLICK ON ? FOR INSTRUCTIONS): CHEM 30 AB isa sequence of two classes. A combined reflection statementis noted at the end of the SLOs for 30B.
72% average score in the lab final exam (03/25/2017)
CHEM30A__SLO_6 - Identify thedifferences between elements andcompounds and describe thechemical bonding in compounds-ionics vs. covalent.SLO Status: ActiveOutcome Creation Date: 09/25/2017
Target for Success: 70%
Reflection (CLICK ON ? FOR INSTRUCTIONS): The differencebetween ionic and covalent bonds is fundamental tounderstanding the difference in behavior between twomajor classes of substances: ionic and molecular. Thisdifference in behavior affects both the chemical reactivityof different substances as well as their physical properties.Although the target was met, it is hoped that the successrate can be increased further, as an intuitive understandinghow atoms bond reoccurs throughout the course.
Program Review Reporting Year: 2017-2018Target : Target Met76% average score on exam problem (03/23/2019)
Exam - Course Test/Quiz - Definethe term electronegativity. Then,explain the difference between acovalent and an ionic bond andexplain how electronegativity can beused to determine what kind bondwill form between two atoms.
09/19/2019 Page 229 of 318Generated by Nuventive Improve
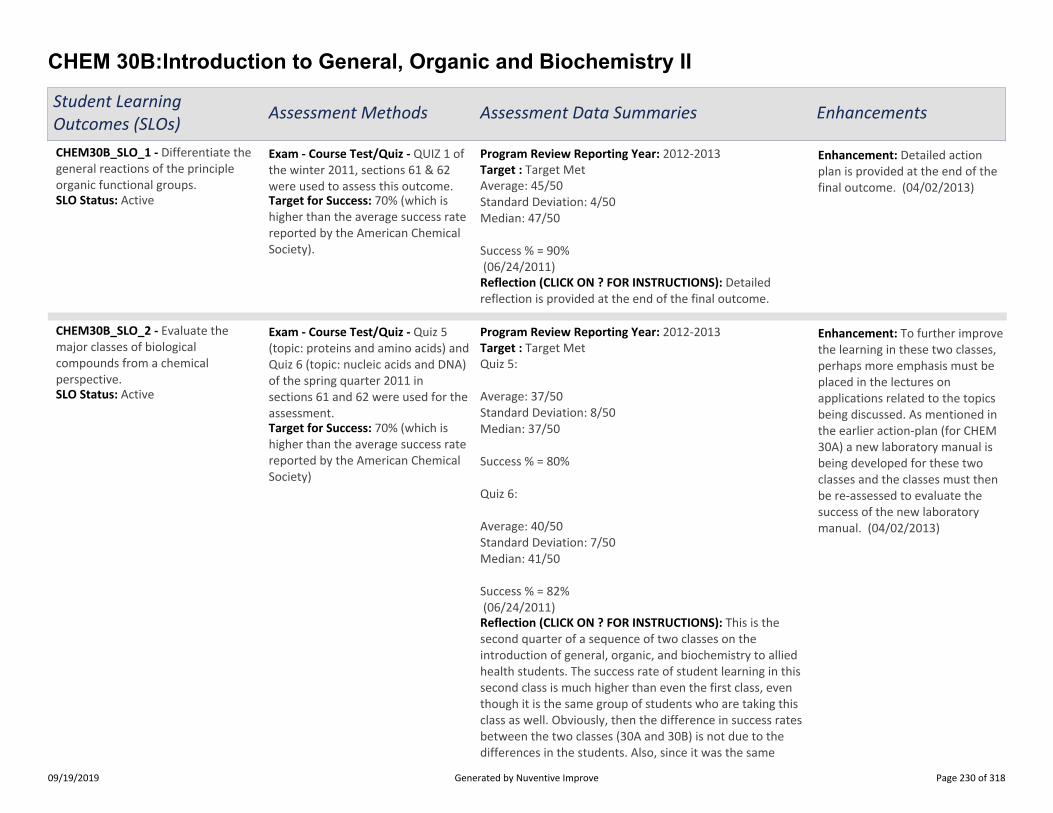
CHEM 30B:Introduction to General, Organic and Biochemistry II
Student LearningOutcomes (SLOs) Assessment Methods Assessment Data Summaries Enhancements
CHEM30B_SLO_1 - Differentiate thegeneral reactions of the principleorganic functional groups.SLO Status: Active Target for Success: 70% (which is
higher than the average success ratereported by the American ChemicalSociety).
Reflection (CLICK ON ? FOR INSTRUCTIONS): Detailedreflection is provided at the end of the final outcome.
Enhancement: Detailed actionplan is provided at the end of thefinal outcome. (04/02/2013)
Program Review Reporting Year: 2012-2013Target : Target MetAverage: 45/50Standard Deviation: 4/50Median: 47/50
Success % = 90% (06/24/2011)
Exam - Course Test/Quiz - QUIZ 1 ofthe winter 2011, sections 61 & 62were used to assess this outcome.
CHEM30B_SLO_2 - Evaluate themajor classes of biologicalcompounds from a chemicalperspective.SLO Status: Active
Target for Success: 70% (which ishigher than the average success ratereported by the American ChemicalSociety)
Reflection (CLICK ON ? FOR INSTRUCTIONS): This is thesecond quarter of a sequence of two classes on theintroduction of general, organic, and biochemistry to alliedhealth students. The success rate of student learning in thissecond class is much higher than even the first class, eventhough it is the same group of students who are taking thisclass as well. Obviously, then the difference in success ratesbetween the two classes (30A and 30B) is not due to thedifferences in the students. Also, since it was the same
Enhancement: To further improvethe learning in these two classes,perhaps more emphasis must beplaced in the lectures onapplications related to the topicsbeing discussed. As mentioned inthe earlier action-plan (for CHEM30A) a new laboratory manual isbeing developed for these twoclasses and the classes must thenbe re-assessed to evaluate thesuccess of the new laboratorymanual. (04/02/2013)
Program Review Reporting Year: 2012-2013Target : Target MetQuiz 5:
Average: 37/50Standard Deviation: 8/50Median: 37/50
Success % = 80%
Quiz 6:
Average: 40/50Standard Deviation: 7/50Median: 41/50
Success % = 82% (06/24/2011)
Exam - Course Test/Quiz - Quiz 5(topic: proteins and amino acids) andQuiz 6 (topic: nucleic acids and DNA)of the spring quarter 2011 insections 61 and 62 were used for theassessment.
09/19/2019 Page 230 of 318Generated by Nuventive Improve
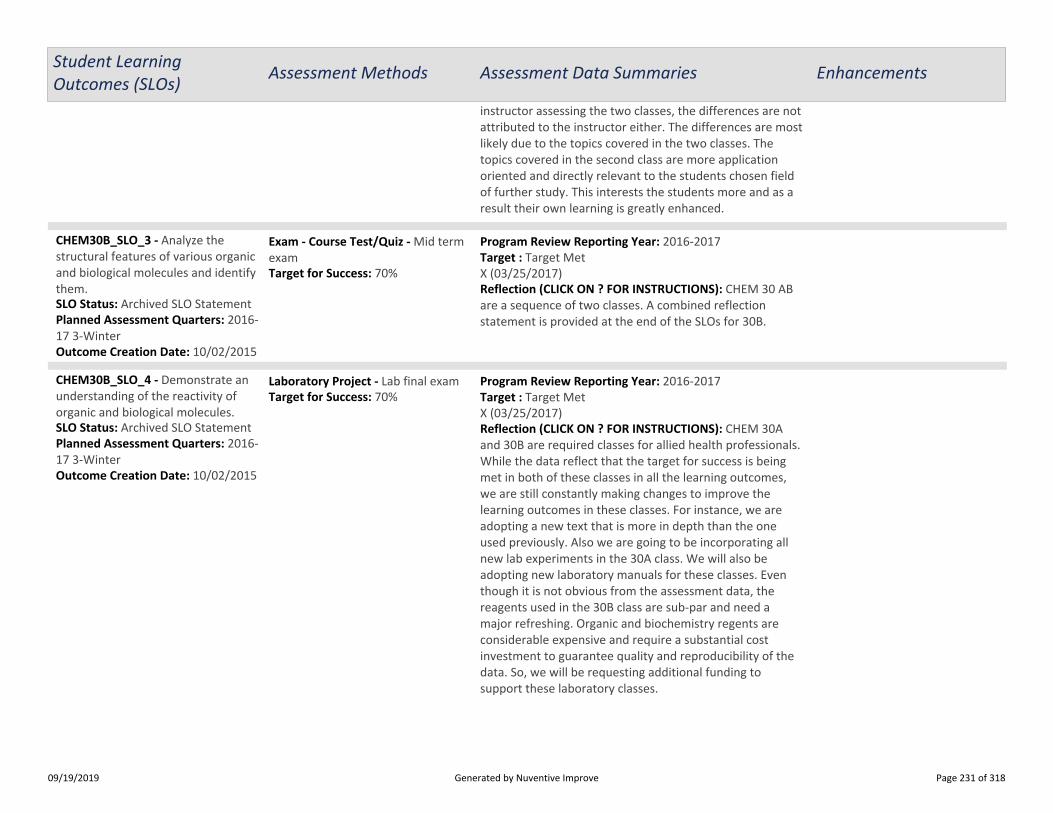
Student LearningOutcomes (SLOs) Assessment Methods Assessment Data Summaries Enhancements
instructor assessing the two classes, the differences are notattributed to the instructor either. The differences are mostlikely due to the topics covered in the two classes. Thetopics covered in the second class are more applicationoriented and directly relevant to the students chosen fieldof further study. This interests the students more and as aresult their own learning is greatly enhanced.
CHEM30B_SLO_3 - Analyze thestructural features of various organicand biological molecules and identifythem.
Planned Assessment Quarters: 2016-17 3-Winter
SLO Status: Archived SLO Statement
Outcome Creation Date: 10/02/2015
Target for Success: 70%Reflection (CLICK ON ? FOR INSTRUCTIONS): CHEM 30 ABare a sequence of two classes. A combined reflectionstatement is provided at the end of the SLOs for 30B.
Program Review Reporting Year: 2016-2017Target : Target MetX (03/25/2017)
Exam - Course Test/Quiz - Mid termexam
CHEM30B_SLO_4 - Demonstrate anunderstanding of the reactivity oforganic and biological molecules.
Planned Assessment Quarters: 2016-17 3-Winter
SLO Status: Archived SLO Statement
Outcome Creation Date: 10/02/2015
Target for Success: 70%
Reflection (CLICK ON ? FOR INSTRUCTIONS): CHEM 30Aand 30B are required classes for allied health professionals.While the data reflect that the target for success is beingmet in both of these classes in all the learning outcomes,we are still constantly making changes to improve thelearning outcomes in these classes. For instance, we areadopting a new text that is more in depth than the oneused previously. Also we are going to be incorporating allnew lab experiments in the 30A class. We will also beadopting new laboratory manuals for these classes. Eventhough it is not obvious from the assessment data, thereagents used in the 30B class are sub-par and need amajor refreshing. Organic and biochemistry regents areconsiderable expensive and require a substantial costinvestment to guarantee quality and reproducibility of thedata. So, we will be requesting additional funding tosupport these laboratory classes.
Program Review Reporting Year: 2016-2017Target : Target MetX (03/25/2017)
Laboratory Project - Lab final exam
09/19/2019 Page 231 of 318Generated by Nuventive Improve

CHEM 77 (X-Y):Special Projects in Chemistry
Student LearningOutcomes (SLOs) Assessment Methods Assessment Data Summaries Enhancements
CHEM77_SLO_1 - Demonstrate, via aculmination of the aims and methodsspecified in sections 3, 4, and 5 of theSpecial Projects contract, a mastery ofthe relevant overarching concepts.SLO Status: Active_Pending_RevisionOutcome Creation Date: 02/11/2018
09/19/2019 Page 232 of 318Generated by Nuventive Improve

Dept - (PSME) Astronomy
Assessment: Course/Service Four Column
ASTR 10:Stellar Astronomy
Student LearningOutcomes (SLOs) Assessment Methods Assessment Data Summaries Enhancements
ASTR10_SLO_1 - Appraise thebenefits to society of astronomicalresearch concerning stars and stellarsystems.SLO Status: Active
Target for Success: 65%
Reflection (CLICK ON ? FOR INSTRUCTIONS): As with all theother data gathered in this first round of assessments,there is still more discussion going on about the datagathering itself than about what to do on the basis of thedata. In particular, we need to find a way to be moreuniform in our data gathering in the future in order not tobe “comparing apples and oranges” and to establish ameaningful baseline.Two issues are particularly problematic for us in the datagathering we have done in this first round for bothAstronomy 4 and Astronomy 10: different testing formatsand different times during the quarter when assessmentswere done.Testing formats: The four of us who teach Astronomycourses use three different formats of “bubble sheet”exams. Two use conventional “one best answer” multiplechoice exams. One (Dr. Cichanski) uses an innovativeformat in which some partial credit is given for certain not-optimum responses. The other (Mr. Harrington) uses aformat in which students explicitly assess whether eachanswer in a single question group is right or wrong. We are
Enhancement: A more uniformprotocol for gathering data will beformulated by the department, inwhich data will be gathered at thesame time in the quarter(probably final exams) anddifferences in testing styles will beaccommodated in a way thatproduces results that canlegitimately be compared to oneanother. The latter will be helpedsignificantly when and iffunctioning software is installedfor the PSM&E Division’s newInsight 4es test sheet scannerfrom Scantron. (04/18/2014)
Program Review Reporting Year: 2013-2014Target : Target MetMidterm Exams, Astronomy 10, Spring 2013 (Cichanski):One question was related to this objective. 55 people tookthe test, of whom 37 answered the question correctly, for asuccess rate of 67%. (04/18/2014)
Exam - Course Test/Quiz - Multiple-choice questions.
09/19/2019 Page 233 of 318Generated by Nuventive Improve

Student LearningOutcomes (SLOs) Assessment Methods Assessment Data Summaries Enhancements
having lively discussions about how to compare our scoresin a meaningful way while preserving our individual testingmethods.Times of assessment: The Astronomy 10 assessments wereconducted on midterm exams, in which students werebeing tested on the material for the first time. TheAstronomy 4 assessments were conducted on acomprehensive final exam, so students were being testedon most of the material for at least a second time. Scoreson the latter are likely to be higher than on the former, andthat is borne out in the results. This will be an easier issueto fix in the future than the disparate test formats issue willbe.
ASTR10_SLO_2 - Evaluate the impacton Earth's characteristics of theevolution of stars and stellar systems.SLO Status: Active
Target for Success: 65%
Enhancement: They type ofknowledge that students wereasked to demonstrate in thisquestion might well be reinforcedby some type of in-class question,such as on a "lecture-tutorial"worksheet or with the use of ananonymous in-class voting system.(06/30/2019)
Program Review Reporting Year: 2016-2017Target : Target Not MetAssessment Data Summary, end of 2018-2019Prepared by Marek Cichanski, Astronomy Dept. CoordinatorTo assess ASTR10_SLO_2, I chose a multiple-choice questionfrom the third (of three) midterm exams from myAstronomy 10 class.Background Information: My multiple-choice questionstypically have four choices, one of which (the best answer)gets full points. There is usually a second-best choice, whichgets about 3/4 of the full points, and two "wrong answer"choices that get 1/2 of the full points. This partial-creditsystem accomplishes roughly the same thing as "curving"the grades, while still using a fixed grading scale, and thusavoids putting the students in direct competition with eachother for grades.
This SLO concerns stellar evolution, which is the set ofchanges that a star goes through during its lifetime. As starsconsume the fuel in their cores (typically hydrogen duringmost of their lifetime), they undergo changes. Thesechanges can affect the planets orbiting those stars,particularly if the star becomes brighter, for example. Thiscan affect the temperatures of the planets. When the Sunconsumes all of the available hydrogen in its core, for
Exam - Course Test/Quiz - Multiple-choice questions.
09/19/2019 Page 234 of 318Generated by Nuventive Improve

Student LearningOutcomes (SLOs) Assessment Methods Assessment Data Summaries Enhancements
Reflection (CLICK ON ? FOR INSTRUCTIONS): It isinteresting that 88% of the students picked an answerchoice that had at least of the correct words ("bigger"and/or "brighter") in it. To me, this seems to suggest thatthe majority of the students had at least someunderstanding of how this fundamental aspect of stellarevolution proceeds.
example, it will become much larger and brighter for awhile, even though that might seem counter-intuitive.
The question that I chose to assess for this SLO concernedthe fundamentals of this process. It asked the students: As astar fuses hydrogen into helium, what outward changes arenoticeable in the star? The best answer was that the starwill become larger and brighter. This question had two"second best" answers, each of which contained one (butnot both) of those words. The one wrong answer choicesaid "smaller and dimmer".
52% of students chose the best answer, with 36% choosingone or the other of the "second-best" answers. 12% chosethe wrong answer. (06/30/2019)
Reflection (CLICK ON ? FOR INSTRUCTIONS): In earlyplanning for the SLO assessment process, the Astronomydepartment laid out a goal of 65% as a target for success inthis type of SLO assessment (multiple-choice examquestions). In this case, the success rate on this questionwas several percentage points below the goal. There maybe several reasons for this. One primary reason may berelated to the more difficult nature of most of the materialin Astronomy 10, as compared to Astronomy 4. Most
Enhancement: As of Winter 2019,when this assessment (from the2016-2017 school year) wasentered into TracDat, theAstronomy department hashistorically graded students inAstronomy 10 by means of a smallnumber of exams. Typically,students are graded on the basisof 2 or 3 midterm exams and afinal exam. One possible way ofimproving student performanceon answers to objective-type testquestions would be to divide thequarter's assessments into asmaller number of quizzes, and/orto conduct formative assessmentson a regular basis. These more-
Program Review Reporting Year: 2016-2017Target : Target Not MetA question from a multiple-choice test was assessed. Thisquestion came from the final exam for the 7:30amAstronomy 10 class in Winter 2017. Of the 26 studentstaking the exam, 58% of them selected the correct answerto a question about the Sun's main-sequence lifetime,compared to a star with 15 times the Sun's mass.(03/20/2019)
09/19/2019 Page 235 of 318Generated by Nuventive Improve

Student LearningOutcomes (SLOs) Assessment Methods Assessment Data Summaries Enhancements
students who take Astronomy at De Anza College takeAstronomy 4 (Solar System Astronomy). The course inquestion here, Astronomy 10 (Stellar Astronomy), involvesa greater understanding of concepts from physics, due tothe astrophysics-centered nature of the subject material.Like Astronomy 4, though, Astronomy 10 has noprerequisites in mathematics, physics, or chemistry, inorder to provide non-science-major students the chance tofulfill their physical-science requirements while learningabout stars, galaxies, and the universe. This does, however,require instructors in Astronomy 10 to teach a number ofconcepts from physics in a conceptual, non-mathematicalway along with the astronomical facts and concepts in thecourse.
frequent formative assessments /practice questions could beassessed during most of the classperiods by means of anonymousin-class voting systems.(03/20/2019)
Reflection (CLICK ON ? FOR INSTRUCTIONS): As with all theother data gathered in this first round of assessments,there is still more discussion going on about the datagathering itself than about what to do on the basis of thedata. In particular, we need to find a way to be moreuniform in our data gathering in the future in order not tobe “comparing apples and oranges” and to establish ameaningful baseline.Two issues are particularly problematic for us in the datagathering we have done in this first round for bothAstronomy 4 and Astronomy 10: different testing formatsand different times during the quarter when assessmentswere done.Testing formats: The four of us who teach Astronomycourses use three different formats of “bubble sheet”exams. Two use conventional “one best answer” multiplechoice exams. One (Dr. Cichanski) uses an innovativeformat in which some partial credit is given for certain not-optimum responses. The other (Mr. Harrington) uses a
Enhancement: That this onequestion on one midterm missedthe target for success by 2% is notof concern, primarily because it isin line with the percentage ofsuccess with all the otherquestions on similar examquestions in this instructor'stesting format for midterms andthe final success rates in coursesfor this instructor are notsignificantly different fromeveryone else in the department.The percentage success on thisquestion is a manifestation moreof a difference in testing style thana difference in teaching/learningeffectiveness.
A more uniform protocol forgathering data will be formulatedby the department, in which datawill be gathered at the same timein the quarter (probably finalexams) and differences in testing
Program Review Reporting Year: 2013-2014Target : Target Not MetMidterm Exams, Astronomy 10, Spring 2013 (Cichanski):One question was related to this objective. 49 people tookthe test, of whom 31 answered the question correctly, for asuccess rate of 63%. (04/18/2014)
09/19/2019 Page 236 of 318Generated by Nuventive Improve
Student LearningOutcomes (SLOs) Assessment Methods Assessment Data Summaries Enhancements
format in which students explicitly assess whether eachanswer in a single question group is right or wrong. We arehaving lively discussions about how to compare our scoresin a meaningful way while preserving our individual testingmethods.Times of assessment: The Astronomy 10 assessments wereconducted on midterm exams, in which students werebeing tested on the material for the first time. TheAstronomy 4 assessments were conducted on acomprehensive final exam, so students were being testedon most of the material for at least a second time. Scoreson the latter are likely to be higher than on the former, andthat is borne out in the results. This will be an easier issueto fix in the future than the disparate test formats issue willbe.
styles will be accommodated in away that produces results that canlegitimately be compared to oneanother. The latter will be helpedsignificantly when and iffunctioning software is installedfor the PSM&E Division’s newInsight 4es test sheet scannerfrom Scantron. (04/18/2014)
Target for Success: 50%
Exam - Course Test/Quiz - Analysisof responses to exam questions thatdirectly relate to this objective.
ASTR10_SLO_3 - Evaluateastronomical news items or theoriesabout stellar astronomy based uponthe scientific method.SLO Status: Active
Target for Success: 65%
Enhancement: Questions like thisone may be a good example ofwhere further time may be worthputting in to the explanation ofgeneral relativity. For example, ifstudents see more examples ofimages of gravitational lensing,along with animations showing the3-D layout of how the lensingworks (such as those created bythe European SouthernObservatory for their ESOCastvideos), they might be more likelyto recognize an image like thisone. Having done that, they mightassociate the correct explanationwith the image. (06/30/2019)
Program Review Reporting Year: 2016-2017Target : Target Not MetAssessment Data Summary, end of 2018-2019Prepared by Marek Cichanski, Astronomy Dept. CoordinatorTo assess ASTR4_SLO_3, I chose a multiple-choice questionfrom the final exam from my Astronomy 10 class.Background Information: My multiple-choice questionstypically have four choices, one of which (the best answer)gets full points. There is usually a second-best choice, whichgets about 3/4 of the full points, and two "wrong answer"choices that get 1/2 of the full points. This partial-creditsystem accomplishes roughly the same thing as "curving"the grades, while still using a fixed grading scale, and thusavoids putting the students in direct competition with eachother for grades.
This SLO is concerned with evaluating theories, and this is atthe core of the scientific method. The question I chose to
Exam - Course Test/Quiz - Multiple-choice questions.
09/19/2019 Page 237 of 318Generated by Nuventive Improve

Student LearningOutcomes (SLOs) Assessment Methods Assessment Data Summaries Enhancements
Reflection (CLICK ON ? FOR INSTRUCTIONS): The lowpercentage of students choosing the correct answer is notentirely surprising, given that the topic at hand concernssome of the more advanced topics in astrophysics, namelydark matter and Einstein's general theory of relativity. Thispoints up one of the greatest fundamental challenges in aclass like Astronomy 10, namely that it is basically a coursein astrophysics, but which cannot have prerequisites inphysics or math. This necessitates considerable time beingspent on teaching the relevant physics, such as an overviewof general relativity and its implications, such asgravitational lensing.
assess was about observational evidence for dark matter inclusters of galaxies. A scientist in the 1930s first noticed thatthe galaxies in clusters were moving too quickly (as theyorbit the centers-of-mass of the clusters) for this to beexplainable by the visible matter in the galaxies. Theypostulated the existence of an invisible form of mattercalled dark matter (DM). The dark matter makes theclusters so massive that they can bend light, and somegalaxy clusters appear surrounded by distorted, arc-likeimages of background galaxies. This effect is called"gravitational lensing", and is an important form ofevidence that supports the DM discovery from the 1930s.
Students were shown an image of a galaxy cluster with"lensed arcs", taken by the Hubble Space Telescope. Theywere asked how this image gives evidence of DM in galaxyclusters. 33% of students chose the best answer (the lensedarcs), and 11% chose the second-best answer (DM isconcentrated at the centers of the galaxies themselves,which is an oblique reference to the true fact that manygalaxies have supermassive black holes at their centers.These black holes are not the DM, however.) 44% ofstudents chose one of the wrong answers. (06/30/2019)
Enhancement: A more uniformprotocol for gathering data will beformulated by the department, inwhich data will be gathered at thesame time in the quarter
Program Review Reporting Year: 2013-2014Target : Target MetMidterm Exams, Astronomy 10, Spring 2013 (Cichanski):One question was related to this objective. 55 people tookthe test, of whom 39 answered the question correctly, for a
09/19/2019 Page 238 of 318Generated by Nuventive Improve

Student LearningOutcomes (SLOs) Assessment Methods Assessment Data Summaries Enhancements
Reflection (CLICK ON ? FOR INSTRUCTIONS): As with all theother data gathered in this first round of assessments,there is still more discussion going on about the datagathering itself than about what to do on the basis of thedata. In particular, we need to find a way to be moreuniform in our data gathering in the future in order not tobe “comparing apples and oranges” and to establish ameaningful baseline.Two issues are particularly problematic for us in the datagathering we have done in this first round for bothAstronomy 4 and Astronomy 10: different testing formatsand different times during the quarter when assessmentswere done.Testing formats: The four of us who teach Astronomycourses use three different formats of “bubble sheet”exams. Two use conventional “one best answer” multiplechoice exams. One (Dr. Cichanski) uses an innovativeformat in which some partial credit is given for certain not-optimum responses. The other (Mr. Harrington) uses aformat in which students explicitly assess whether eachanswer in a single question group is right or wrong. We arehaving lively discussions about how to compare our scoresin a meaningful way while preserving our individual testingmethods.Times of assessment: The Astronomy 10 assessments wereconducted on midterm exams, in which students werebeing tested on the material for the first time. TheAstronomy 4 assessments were conducted on acomprehensive final exam, so students were being testedon most of the material for at least a second time. Scoreson the latter are likely to be higher than on the former, andthat is borne out in the results. This will be an easier issueto fix in the future than the disparate test formats issue willbe.
(probably final exams) anddifferences in testing styles will beaccommodated in a way thatproduces results that canlegitimately be compared to oneanother. The latter will be helpedsignificantly when and iffunctioning software is installedfor the PSM&E Division’s newInsight 4es test sheet scannerfrom Scantron. (04/18/2014)
success rate of 71%. (04/18/2014)
09/19/2019 Page 239 of 318Generated by Nuventive Improve

ASTR 15L:Astronomy Laboratory
Student LearningOutcomes (SLOs) Assessment Methods Assessment Data Summaries Enhancements
ASTR15L_SLO_1 - Evaluate claimsabout the nature of the physicaluniverse using the scientific methodof hypothesis testing.SLO Status: ActiveOutcome Creation Date: 09/11/2013
Target for Success: 65%
Reflection (CLICK ON ? FOR INSTRUCTIONS): This was avery interesting assessment result. Nearly the entire classchose one of the two best answers, although only half of
Enhancement: Changing thewording of this question and/or itsanswer choices might be aworthwhile experiment in thiscase. If essentially the samequestion could be asked adifferent way, it would beinteresting to see if a significantchange in the percentage ofcorrect answers would occur.(06/30/2019)
Program Review Reporting Year: 2018-2019Target : Target Not MetAssessment Data Summary, end of 2018-2019Prepared by Marek Cichanski, Astronomy Dept. CoordinatorTo assess ASTR15L_SLO_1, I chose a multiple-choicequestion from the final exam from my Astronomy 15 labclass.Background Information: My multiple-choice questionstypically have four choices, one of which (the best answer)gets full points. There is usually a second-best choice, whichgets about 3/4 of the full points, and two "wrong answer"choices that get 1/2 of the full points. This partial-creditsystem accomplishes roughly the same thing as "curving"the grades, while still using a fixed grading scale, and thusavoids putting the students in direct competition with eachother for grades.
This SLO concerns evaluation of claims about the nature ofthe physical universe, i.e. hypothesis testing. An example ofwhere this can be done is in considering the phases of theMoon. One of the labs is concerned with moon phases.Introductory portions of this lab exercise present theaccepted model of how the Moon orbits the Earth, and howthis affects the phase that the Moon displays to usobservers on Earth. One simple way that a person could testthis model is to postulate the Moon showing a particularphase, and then asking what phase it would show sometime later.
The question I chose to assess this SLO asked the studentswhich phase the Moon would show 1 week after NewMoon. 49% of students chose the best answer (the FirstQuarter phase), and another 49% of students chose thesecond-best answer (a thin crescent). Only 2% of studentschose one of the wrong answers. (06/30/2019)
Exam - Course Test/Quiz - Multiple-choice questions.
09/19/2019 Page 240 of 318Generated by Nuventive Improve

Student LearningOutcomes (SLOs) Assessment Methods Assessment Data Summaries Enhancements
them chose the single best answer. Looking at the resultsand the answer choices, it is possible that ambiguity mayhave played a role here. New Moon occurs when the Moonis not visible in the nighttime sky, appearing near the Sun,and thus being invisible to us here on Earth, lost in the bluedaytime sky. After New Moon, the Moon appears as a thincrescent, eventually appearing half lit-up about a weekafter New Moon. This is the First Quarter phase. Studentsmight have thought "The Moon goes through a crescentappearance in the days after New Moon, so it is possiblethat if it's ABOUT one week after New Moon, it still mightappear crescent in some way".
Reflection (CLICK ON ? FOR INSTRUCTIONS): The numberof students successfully answering the question was a fewpercentage points below the overall target for success thatwas established by the Astronomy department in its initialplanning for the SLO assessment process.
Enhancement: For thisassessment, an exam question wasused, but the course in question(ASTR 15L Astronomy laboratory)is primarily graded by havingstudents turn in laboratory reportsat the end of each class session. Itmight be more useful, for futureassessments of SLOs in ASTR 4, toselect questions from the labhandouts, which the studentsanswer after performingcollaborative work, in conjunctionwith their fellow students andwith the opportunity to ask theirinstructor questions in class.(03/20/2019)
Program Review Reporting Year: 2017-2018Target : Target Not MetFor this SLO assessment, a question from the ASTR 15 labfinal (a multiple-choice exam) was assessed. The questionasked "Why would it be strange to see the Sun at the sky'sNorth Celestial Pole?" This question required students toevaluate the likelihood of a particular configuration ofobjects in the sky, and this type of thinking is integral to theprocess of hypothesis testing. In the Spring 2018 class, 61%of the students chose the correct answer for this question.(03/20/2019)
Reflection (CLICK ON ? FOR INSTRUCTIONS): The new labcourse appears to be satisfying this objective, but it needsto be monitored for several more quarters before a
Enhancement: Data will continueto be gathered as more sections ofthis new course are taught. Atpresent, the data are too sparse tobase any significant changes on.(04/18/2014)
Program Review Reporting Year: 2013-2014Target : Target MetOne question on the final exam in both Fall, 2013, andWinter, 2014 (identical question in both quarters)addressed this objective. 38 people total took those exams,of whom 27 answered this question correctly for a successrate of 71% (04/18/2014)
09/19/2019 Page 241 of 318Generated by Nuventive Improve

Student LearningOutcomes (SLOs) Assessment Methods Assessment Data Summaries Enhancements
statistically significant number of students have beentested.
ASTR15L_SLO_2 - Compare andcontrast the histories of solar-systembodies (e.g. moons, planets,asteroids, comets, meteorites) byintegrating data from spacecraft andEarth-based observatories.SLO Status: ActiveOutcome Creation Date: 09/11/2013
Target for Success: 65%
Reflection (CLICK ON ? FOR INSTRUCTIONS): A largemajority of students chose the correct answer to this
Enhancement: With a result likethis, it is important to avoid simplysaying "It isn't broken, thus isdoesn't need to be fixed". If, forexample, the laboratory exerciseon exoplanets were to be revised,it would be important to keep thecore activities from the lab as itexisted at this time. Most of all,the students were able to usecomputer simulations to see theeffects that a planet's mass anddistance from it star have on thestar's "wobble". It would beimportant to retain these core"virtual experiments" in anyrevised version of this lab.(06/30/2019)
Program Review Reporting Year: 2018-2019Target : Target MetAssessment Data Summary, end of 2018-2019Prepared by Marek Cichanski, Astronomy Dept. CoordinatorTo assess ASTR15L_SLO_2, I chose a multiple-choicequestion from the final exam from my Astronomy 15 labclass.Background Information: My multiple-choice questionstypically have four choices, one of which (the best answer)gets full points. There is usually a second-best choice, whichgets about 3/4 of the full points, and two "wrong answer"choices that get 1/2 of the full points. This partial-creditsystem accomplishes roughly the same thing as "curving"the grades, while still using a fixed grading scale, and thusavoids putting the students in direct competition with eachother for grades.
This SLO is concerned with solar system bodies of varioustypes, such as planets. This can refer to the different planetsin our solar system, or in solar systems other than the onewe live in. (Solar systems around other stars have beendiscovered in abundance during the late 20th and early 21stcenturies. The planets in these systems are called"exoplanets".)
To assess this SLO, I chose a test question that started byreminding the students that most of the first exoplanets tobe detected were "hot Jupiters". The question went on toask them why planets of this type are relatively easy todetect. The correct answer said that these planets' largemasses and close proximity to their stars allowed theplanets to induce large radial-velocity "wobbles" in thosestars' motions. 82% of students chose the correct answer,8% chose the 2nd-best answer, and 10% chose one of thewrong answers. (06/30/2019)
Exam - Course Test/Quiz - Multiple-choice questions
09/19/2019 Page 242 of 318Generated by Nuventive Improve

Student LearningOutcomes (SLOs) Assessment Methods Assessment Data Summaries Enhancements
question. It is interesting to ask whether specific factorscould have contributed to this high level of success. Onepossibility could be that the topic had been covered in thesecond-to-last laboratory of the quarter, rather than earlyin the quarter. Another possible factor, although moregeneral, could have been that a lab class has much moreinteraction between instructor and students, and betweenstudents while they work on their labs. The moreinteractive and collaborative nature of the class - incontrast to a lecture class - might have contributed to therelatively high success level.
Reflection (CLICK ON ? FOR INSTRUCTIONS): The new labcourse appears to be satisfying this objective, but it needsto be monitored for several more quarters before astatistically significant number of students have beentested.
Enhancement: Data will continueto be gathered as more sections ofthis new course are taught. Atpresent, the data are too sparse tobase any significant changes on.(04/18/2014)
Program Review Reporting Year: 2013-2014Target : Target MetOne lab final exam question addressed this objective in Fall,2013. Of the 23 people who took the test, 18 answered thisquestion correctly, for a success rate of 78%. (04/18/2014)
09/19/2019 Page 243 of 318Generated by Nuventive Improve

ASTR 4:Solar System Astronomy
Student LearningOutcomes (SLOs) Assessment Methods Assessment Data Summaries Enhancements
ASTR4_SLO_1 - Appraise the benefitsto society of planetary research andexploration.SLO Status: Active Target for Success: 65% correct
responses.
Reflection (CLICK ON ? FOR INSTRUCTIONS): As with all theother data gathered in this first round of assessments,there is still more discussion going on about the datagathering itself than about what to do on the basis of thedata. In particular, we need to find a way to be moreuniform in our data gathering in the future in order not tobe “comparing apples and oranges” and to establish ameaningful baseline.Two issues are particularly problematic for us in the datagathering we have done in this first round for bothAstronomy 4 and Astronomy 10: different testing formatsand different times during the quarter when assessmentswere done.Testing formats: The four of us who teach Astronomycourses use three different formats of “bubble sheet”exams. Two use conventional “one best answer” multiplechoice exams. One (Dr. Cichanski) uses an innovativeformat in which some partial credit is given for certain not-optimum responses. The other (Mr. Harrington) uses aformat in which students explicitly assess whether eachanswer in a single question group is right or wrong. We arehaving lively discussions about how to compare our scoresin a meaningful way while preserving our individual testingmethods.Times of assessment: The Astronomy 10 assessments wereconducted on midterm exams, in which students werebeing tested on the material for the first time. TheAstronomy 4 assessments were conducted on acomprehensive final exam, so students were being testedon most of the material for at least a second time. Scoreson the latter are likely to be higher than on the former, andthat is borne out in the results. This will be an easier issue
Enhancement: A more uniformprotocol for gathering data will beformulated by the department, inwhich data will be gathered at thesame time in the quarter(probably final exams) anddifferences in testing styles will beaccommodated in a way thatproduces results that canlegitimately be compared to oneanother. The latter will be helpedsignificantly when and iffunctioning software is installedfor the PSM&E Division’s newInsight 4es test sheet scannerfrom Scantron. (04/18/2014)
Program Review Reporting Year: 2013-2014Target : Target MetFinal Exam, Astronomy 4.02, Winter 2014 (Harrington): Fourquestions were related to this objective. 120 students tookthe exam. Of the 480 responses to those questions, 455were correct, for a success rate of 95%. (04/18/2014)Comments/Notes: 65% is the
minimum passing score for astudent.
Exam - Course Test/Quiz - Objective-oriented multiple choice examquestions.
09/19/2019 Page 244 of 318Generated by Nuventive Improve

Student LearningOutcomes (SLOs) Assessment Methods Assessment Data Summaries Enhancements
to fix in the future than the disparate test formats issue willbe.
ASTR4_SLO_2 - Compare andcontrast the development ofplanetary systems and of the majorpanet types, including those factorsthat have led to Earth's uniquecharacteristics.SLO Status: Active
Target for Success: 65%
Enhancement: Reflecting furtheron these results, it is possible thatthe role of rocks in storing theEarth's carbon dioxide might beworth describing in more detail. Itmight be worth illustrating thisvisually in lecture, such as withslides of ancient limestonedeposits, and modern limestone-deposition environments (like theBahamas) to emphasize howcarbon dioxide is taken out of theEarth's atmosphere, but onlybecause the Earth has liquid wateron its surface. (06/30/2019)
Program Review Reporting Year: 2018-2019Target : Target Not MetAssessment Data Summary, end of 2018-2019Prepared by Marek Cichanski, Astronomy Dept. CoordinatorTo assess ASTR4_SLO_2, I chose a multiple-choice questionfrom the third (of three) midterm exams from myAstronomy 4 class.Background Information: My multiple-choice questionstypically have four choices, one of which (the best answer)gets full points. There is usually a second-best choice, whichgets about 3/4 of the full points, and two "wrong answer"choices that get 1/2 of the full points. This partial-creditsystem accomplishes roughly the same thing as "curving"the grades, while still using a fixed grading scale, and thusavoids putting the students in direct competition with eachother for grades.
To assess SLO 2, I chose a question about the Earth andVenus. In planetary science, Earth and Venus are oftenconsidered "near-twin" planets because of their similarsizes and masses. The temperatures at their surfaces,however, are very different, with the surface temperatureon Venus being hotter than the melting points of aluminumand lead. The students were asked why these two planetshave developed so differently, with such different surfaceconditions. The best answer to this question is that most ofthe Earth's carbon dioxide is locked up in rocks likelimestone, whereas Venus's is almost all in its atmosphere,leading to a runaway greenhouse effect. The second-bestanswer describes Mars's atmosphere, without mentioningthat planet by name. Mars, like Venus, has an atmospherethat is nearly all carbon dioxide, but is too thin to trap muchheat, and consequently is very cold.
60% of the students chose the best answer, 18% chose thesecond-best answer, and 22% chose one of the wrong
Exam - Course Test/Quiz - Objective-oriented multiple-choice questions.
09/19/2019 Page 245 of 318Generated by Nuventive Improve

Student LearningOutcomes (SLOs) Assessment Methods Assessment Data Summaries Enhancements
Reflection (CLICK ON ? FOR INSTRUCTIONS): Severalquarters ago, the Astronomy department set a target of65% correct responses as defining success. The responsesto this question came close to that target.
answers. (06/30/2019)
Reflection (CLICK ON ? FOR INSTRUCTIONS): In theAstronomy department's planning for SLO assessment, atarget of 65% correct responses was established. Theresults of this question met the target. If an even higherpercentage of students were to correctly answer a questionlike this (i.e. closely related to the SLO), that would be evenbetter.
Enhancement: As of Winter 2019,when this assessment (from the2017-2018 school year) wasentered into TracDat, theAstronomy department hashistorically graded students inAstronomy 4 by means of a smallnumber of exams. Typically,students are graded on the basisof 2 or 3 midterm exams and afinal exam. One possible way ofimproving student performanceon answers to objective-type testquestions would be to divide thequarter's assessments into asmaller number of quizzes, and/orto conduct formative assessmentson a regular basis. These more-frequent formative assessments /practice questions could beassessed during most of the classperiods by means of anonymousin-class voting systems.(03/20/2019)
Program Review Reporting Year: 2017-2018Target : Target MetA multiple-choice question was assessed. This questioncame from the second (of 3) midterm exams given inSection 1 of ASTR 4 in Spring 2018. The question concernedthe following topic: In our solar system, how can the planetsbe divided into two major categories?74% of the 47 students taking the test answered thequestion correctly. (Inner planets: Rock and metal, Outerplanets: hydrogen and helium gas and liquid) (03/20/2019)
Reflection (CLICK ON ? FOR INSTRUCTIONS): As with all theother data gathered in this first round of assessments,there is still more discussion going on about the datagathering itself than about what to do on the basis of the
Enhancement: A more uniformprotocol for gathering data will beformulated by the department, inwhich data will be gathered at thesame time in the quarter(probably final exams) anddifferences in testing styles will beaccommodated in a way thatproduces results that canlegitimately be compared to one
Program Review Reporting Year: 2013-2014Target : Target MetFinal Exam, Astronomy 4.02, Winter 2014 (Harrington): Ninequestions were related to this objective. 120 students tookthe exam. Of the 1,080 responses to those questions, 932were correct, for a success rate of 86%. (04/18/2014)
09/19/2019 Page 246 of 318Generated by Nuventive Improve

Student LearningOutcomes (SLOs) Assessment Methods Assessment Data Summaries Enhancements
data. In particular, we need to find a way to be moreuniform in our data gathering in the future in order not tobe “comparing apples and oranges” and to establish ameaningful baseline.Two issues are particularly problematic for us in the datagathering we have done in this first round for bothAstronomy 4 and Astronomy 10: different testing formatsand different times during the quarter when assessmentswere done.Testing formats: The four of us who teach Astronomycourses use three different formats of “bubble sheet”exams. Two use conventional “one best answer” multiplechoice exams. One (Dr. Cichanski) uses an innovativeformat in which some partial credit is given for certain not-optimum responses. The other (Mr. Harrington) uses aformat in which students explicitly assess whether eachanswer in a single question group is right or wrong. We arehaving lively discussions about how to compare our scoresin a meaningful way while preserving our individual testingmethods.Times of assessment: The Astronomy 10 assessments wereconducted on midterm exams, in which students werebeing tested on the material for the first time. TheAstronomy 4 assessments were conducted on acomprehensive final exam, so students were being testedon most of the material for at least a second time. Scoreson the latter are likely to be higher than on the former, andthat is borne out in the results. This will be an easier issueto fix in the future than the disparate test formats issue willbe.
another. The latter will be helpedsignificantly when and iffunctioning software is installedfor the PSM&E Division’s newInsight 4es test sheet scannerfrom Scantron. (04/18/2014)
ASTR4_SLO_3 - Evaluate astronomicalnews items or theories concerningsolar system astronomy based uponthe scientific method.SLO Status: Active
Target for Success: 65%
Enhancement: Based on theAssessment Data Summary andthe Reflection for this SLO at theend of the 2018-2019 school year,I may consider going over samplequestions in class, to show howthe appearance of a "familiar-
Program Review Reporting Year: 2018-2019Target : Target Not MetAssessment Data Summary, end of 2018-2019Prepared by Marek Cichanski, Astronomy Dept. CoordinatorTo assess ASTR4_SLO_3, I chose two multiple-choicequestions from the first (of three) midterm exams from myWinter 2019 Astronomy 4 class.
Exam - Course Test/Quiz - Objective-oriented multiple-choice questions.
09/19/2019 Page 247 of 318Generated by Nuventive Improve

Student LearningOutcomes (SLOs) Assessment Methods Assessment Data Summaries Enhancements
Reflection (CLICK ON ? FOR INSTRUCTIONS): When Iexamined the choices that students made on bothquestions, it appeared that the most popular choices bothincluded the phrase "shows a full cycle of phases". On thefirst of the two questions described in the Assessment Data
looking" or "correct-looking"phrase can be a trap for theunwary. Further, deeper readingof the choices can be necessary tofind the right one. (06/30/2019)
Background Information: My multiple-choice questionstypically have four choices, one of which (the best answer)gets full points. There is usually a second-best choice, whichgets about 3/4 of the full points, and two "wrong answer"choices that get 1/2 of the full points. This partial-creditsystem accomplishes roughly the same thing as "curving"the grades, while still using a fixed grading scale, and thusavoids putting the students in direct competition with eachother for grades.
The two questions that I chose to assess SLO 3 bothconcerned an important moment from the history ofastronomy, when the pioneering astronomer Galileo Galileiobserved the planet Venus through the telescope, to seewhether it showed a full cycle of phases like the Moon, oronly crescent phases. This was an example of usingobservational data to determine which of two hypothesesabout the nature of the solar system (geocentric orheliocentric) was more likely to be correct. This is anexample of "evaluating a theory based on upon thescientific method", to quote from this SLO.
In the first question, students were asked what Galileo saw,and how it didn't fit with the geocentric model. 12% of thestudents taking this test chose the correct answer, 27%chose the second best answer, and 32% chose the wronganswers.
In the second question, students were given a perspectivedrawing of Venus orbiting the Sun, and showing differentphases at different points in its orbit, as seen from Earth.Students were asked how the images of Venus in thisdiagram compare with what Galileo saw. 55% chose thebest answer, 13% chose the second-best answer, and 32%chose the wrong answers. (06/30/2019)
09/19/2019 Page 248 of 318Generated by Nuventive Improve
Student LearningOutcomes (SLOs) Assessment Methods Assessment Data Summaries Enhancements
Summary, it was one of the WRONG choices that had thatphrase in it. On the second of the two questions describedin the Assessment Data Summary, it was the CORRECTchoice that had that phrase in it.This suggests to me that students may "key in" on aparticular phrase that they've encountered in their readingsor in the lecture, even if that phrase is found in one of thewrong answer choices. It suggests, but does not prove, thatthey might not be taking the time to read all of the choicescarefully enough to encounter the specific details thatmatter the most.
Reflection (CLICK ON ? FOR INSTRUCTIONS): As with all theother data gathered in this first round of assessments,there is still more discussion going on about the datagathering itself than about what to do on the basis of thedata. In particular, we need to find a way to be moreuniform in our data gathering in the future in order not tobe “comparing apples and oranges” and to establish ameaningful baseline.Two issues are particularly problematic for us in the datagathering we have done in this first round for bothAstronomy 4 and Astronomy 10: different testing formatsand different times during the quarter when assessmentswere done.Testing formats: The four of us who teach Astronomycourses use three different formats of “bubble sheet”exams. Two use conventional “one best answer” multiplechoice exams. One (Dr. Cichanski) uses an innovativeformat in which some partial credit is given for certain not-optimum responses. The other (Mr. Harrington) uses aformat in which students explicitly assess whether eachanswer in a single question group is right or wrong. We arehaving lively discussions about how to compare our scores
Enhancement: A more uniformprotocol for gathering data will beformulated by the department, inwhich data will be gathered at thesame time in the quarter(probably final exams) anddifferences in testing styles will beaccommodated in a way thatproduces results that canlegitimately be compared to oneanother. The latter will be helpedsignificantly when and iffunctioning software is installedfor the PSM&E Division’s newInsight 4es test sheet scannerfrom Scantron. (04/18/2014)
Program Review Reporting Year: 2013-2014Target : Target MetFinal Exam, Astronomy 4.02, Winter 2014 (Harrington):Seven questions were related to this objective. 120students took the exam. Of the 840 responses to thosequestions, 769 were correct, for a success rate of 92%.(04/18/2014)
09/19/2019 Page 249 of 318Generated by Nuventive Improve
Student LearningOutcomes (SLOs) Assessment Methods Assessment Data Summaries Enhancements
in a meaningful way while preserving our individual testingmethods.Times of assessment: The Astronomy 10 assessments wereconducted on midterm exams, in which students werebeing tested on the material for the first time. TheAstronomy 4 assessments were conducted on acomprehensive final exam, so students were being testedon most of the material for at least a second time. Scoreson the latter are likely to be higher than on the former, andthat is borne out in the results. This will be an easier issueto fix in the future than the disparate test formats issue willbe.
09/19/2019 Page 250 of 318Generated by Nuventive Improve
Dept - (PSME) Physics
Assessment: Course/Service Four Column
PHYS 10:Concepts of Physics
Student LearningOutcomes (SLOs) Assessment Methods Assessment Data Summaries Enhancements
PHYS10_SLO_1 - Critically examinenew, previously un-encounteredproblems, analyzing and evaluatingtheir constituent parts, to constructand explain a logical solution utilizing,and based upon, the fundamentallaws of physics in general.
SLO Status: Active
Target for Success: 70% of studentsto pass
Reflection (CLICK ON ? FOR INSTRUCTIONS): Overall I’mnot ashamed to confess that physics 10 provides asuccessful environment for the non-science major to learnand appreciate the subject. The class is not about masteringthe subject, but appreciating it. The course could use a labto compliment the lecture but the logistics would becomplicated.
Program Review Reporting Year: 2012-2013Target : Target MetOn one sample question of this instructor’s own evilinvention, out of fifty students about ten students got itright (not bad actually), twenty or so chose the next bestanswer (still correct but not as good) and the rest well, whatcan I say (see below)?
(12/04/2013)
Exam - Course Test/Quiz - Althoughnumerous written, verbal quizzes aregiven, the most fun is had with themultiple choice exams. Non-sciencemajors must grapple with not justfinding the “right” answer but, andhere is the good part, the “best” or“most correct” answer. As alwaysthe true test of knowledge is howyou handle yourself when you don’talready know the answer (i.e., it isnot about memorizing answers).
09/19/2019 Page 251 of 318Generated by Nuventive Improve

PHYS 2A:General Introductory Physics
Student LearningOutcomes (SLOs) Assessment Methods Assessment Data Summaries Enhancements
PHYS2A_SLO_1 - Critically examinenew, previously un-encounteredproblems, analyzing and evaluatingtheir constituent parts, to constructand explain a logical solution utilizing,and based upon, the fundamentallaws of mechanics
Planned Assessment Quarters: 2012-13 3-Winter
SLO Status: Active
Target for Success: 70% of studentsto solve it correctly.
Reflection (CLICK ON ? FOR INSTRUCTIONS): About 13% ofthe class needed to improve their analytical and problemsolving skills. 72% success was acceptable for the class.Areas for improvement would be to further help studentsdevelop their analytical and problem solving skills using theprinciples/laws/theories of classical mechanics. Based onprevious performances for such a class, the results arereasonably acceptable.
Program Review Reporting Year: 2012-2013Target : Target MetAbout 72% of the class was able to solve the problemcorrectly, 15% partially got itcorrect, and 13% did not know how to solve it.(11/17/2013)
Exam - Course Test/Quiz - Asassessment tools we used selectivenew un-encountered problems onthe lecture final. Assessment wasthen based on the scores obtainedon these selective problems on anindividual and overall class basis. Thefollowing problem on the lecturefinal was used as an assessment: 7.
A wheel of radius 0.30 m ismounted on a frictionless horizontalaxle as shown below. A masslesscord is wrapped around the wheeland attached to a 4.0 kg block thatslides down a frictionless inclineplane of angle ? = 30. The blockaccelerates down the surface at 3.0m/s2. Calculate the moment ofinertia of the wheel about the axleof rotation.
PHYS2A_SLO_2 - Gain confidence intaking precise and accurate scientificmeasurements, with theiruncertainties, and then withcalculations from them, analyze theirmeaning as relative, in anexperimental context, to theverification and support of physicstheories.SLO Status: Active
Reflection (CLICK ON ? FOR INSTRUCTIONS): About 75% ofthe class was able to solve the problem correctly, 15%partially got it correct, and 10% did not know how to solveit. 75% success was acceptable for the class and thus thereweren't any apparent student needs and issues revealed.75% success on error analysis was acceptable for the class,but not outstanding especially since it's 5% less than thelast assessment. Area for improvement
Program Review Reporting Year: 2012-2013Target : Target MetAbout 75% of the the class solved the problem correctly.This result was 5% less than the last assessment.Nonetheless, it was still above the expected target.(11/17/2013)
Exam - Course Test/Quiz - Properknowledge of the Scientific LabReport as accessed in the lab finalincluding; scientific measurementswith uncertainties, error analysis,calculations, and hands-onexperience with the experimentalmethod. The following problem wasused as an assessment on erroranalysis in the lab:Given the metalblock provided, using the propermeasuring instrument, measure thedimensions and the mass withuncertainty and then calculate the
09/19/2019 Page 252 of 318Generated by Nuventive Improve
Student LearningOutcomes (SLOs) Assessment Methods Assessment Data Summaries Enhancements
Target for Success: 70% of studentsto solve correctly.
would be to further help students develop a conceptual andpractical understanding of the physics principles in the lab.Based on previous performances for such a class, theresults are reasonably acceptable.
density and uncertainty.
09/19/2019 Page 253 of 318Generated by Nuventive Improve

PHYS 2B:General Introductory Physics
Student LearningOutcomes (SLOs) Assessment Methods Assessment Data Summaries Enhancements
PHYS2B_SLO_1 - Critically examinenew, previously un-encounteredproblems, analyzing and evaluatingtheir constituent parts, to constructand explain a logical solution utilizing,and based upon, the fundamentallaws of electricity and magnetism.SLO Status: Active
Target for Success: 70% of class topass
Reflection (CLICK ON ? FOR INSTRUCTIONS): The subjectmatter is challenging for this level of student (i.e., not theconceptual physics student and not the engineering major).Abstract thinking is difficult; after all, no one has ever seenan electric field. The goal of any course should be to inspirethe student to think about the world in a new way andreflect upon his or her place in it. Physics 2B succeeds inteaching most, if not all, students that electric and magneticphenomena can be understood with careful and thoughtfulproblem solving techniques. The assessment proceduresare valid and accurately reflect learning.
Program Review Reporting Year: 2012-2013Target : Target MetFor the typical 2B exam problem that has been slightlyaltered from a homework problem, out of twenty ninestudents, seven demonstrated mastery, nine appliedgeneral problem solving skills indicating a grasp onconcepts, twelve were inadequately prepared andincapable of generalizing problems solving skills. Onestopped attending after a poor first exam. (12/04/2013)
Exam - Course Test/Quiz - Exams arethe most telling testimony of thedepth of a student’s knowledge inthis field. These students areconfronted with basic, one-step ortwo, problems and, at this level,most students still find problemsolving quite challenging. Usually theproblems used to evaluatecomprehension are similar to thosewith which the students is familiar,but altered slightly by the instructor.By doing so, the instructor candetermine if a solution has merelybeen memorized, or if trueunderstanding has been achieved.Perfection is not the goal. By testingin this manner, a student canglimpse what it means tounderstand. That glimpse is valuableunto itself.
PHYS2B_SLO_2 - Gain confidence intaking precise and accurate scientificmeasurements, with theiruncertainties, and then withcalculations from them, analyze theirmeaning as relative, in anexperimental context, to theverification and support of physicstheories.SLO Status: Active
Reflection (CLICK ON ? FOR INSTRUCTIONS): Most studentssucceed in the lab portion of this class if they consistently
Program Review Reporting Year: 2012-2013Target : Target MetMost students demonstrate adequate ability to takereasonably accurate measurements. For the most recentquarter, 95 percent of the students were able to pass thisexam. Because there is an element of concretenessinherent to the measurement and data analysis in the labsetting, many students at this level find the lab morecomprehensible and therefore more enjoyable.
(12/04/2013)
Exam - Course Test/Quiz - In the lab,many useful skills are learned. Thestudents learn how to use electricalmeasurement tools including theoscilloscope and build rudimentarycircuits. The lab final requires eachstudent demonstrate every skillacquired during the quarter. Inaddition to testing the student’sability to measure electricalproperties appropriately, the labfinal also tests a student’s ability toanalyze data and perform
09/19/2019 Page 254 of 318Generated by Nuventive Improve

Student LearningOutcomes (SLOs) Assessment Methods Assessment Data Summaries Enhancements
Target for Success: 70% of studentsto pass
attend and apply a bit of effort. Paying attentionthroughout the quarter and keeping a good lab notebookare the keys to success in lab. Since many students enjoyand gain confidence in their ability during the lab portion ofthis class, more lab time would be beneficial for thestudents. Unfortunately, more lab time than the coursecurrently offers would not articulate to transfer institutions.
uncertainty analysis.
09/19/2019 Page 255 of 318Generated by Nuventive Improve
PHYS 2C:General Introductory Physics
Student LearningOutcomes (SLOs) Assessment Methods Assessment Data Summaries Enhancements
PHYS2C_SLO_1 - Critically examinenew, previously un-encounteredproblems, analyzing and evaluatingtheir constituent parts, to constructand explain a logical solution utilizing,and based upon, the fundamentallaws of optics, thermodynamics,fluids, and modern physics.SLO Status: Active
Target for Success: 70% of studentsto solve correctly
Reflection (CLICK ON ? FOR INSTRUCTIONS): About 20% ofthe class needed to improve their analytical and problemsolving skills. 80% success was acceptable for the class.Areas for improvement would be to further help studentsdevelop their analytical and problem solving skills using theprinciples/laws/theories of thermodynamics. Based onprevious performances for such a class, the results arereasonably acceptable.
Program Review Reporting Year: 2012-2013Target : Target MetAbout 80% of the class was able to solve the problemcorrectly, 15% partially got it correct, and 5% did not knowhow to solve it. (11/24/2013)
Exam - Course Test/Quiz - Asassessment method we usedselective new un-encounteredproblems on the lecture final.Assessment was then based on thescores obtained on these selectiveproblems on an individual andoverall class basis.The followingproblem on the lecture final wasused as an assessment: Calculatethe energy required to convert a 1.0g block of ice at -30.0oC to steam at120.0oC. The specific heat of ice is2090 J/(kg Co), the heat of fusion ofwater is 3.34 x 10⁵ (J/kg), the heat ofvaporization of water is 2.26 x 10⁶(J/kg), and the specific heat of steamis 2010 J/(kg Co).
PHYS2C_SLO_2 - Gain confidence intaking precise and accurate scientificmeasurements, with theiruncertainties, and then withcalculations from them, analyze theirmeaning as relative, in anexperimental context, to theverification and support of physicstheories.SLO Status: Active
Reflection (CLICK ON ? FOR INSTRUCTIONS): 76% successwas acceptable for the class and thus there weren't anyapparent student needs and issues revealed. 76% successon error analysis was acceptable for the class, but notoutstanding. Area for improvement would be to furtherhelp students develop a conceptual and practicalunderstanding of the physics principles in the lab. Based onprevious performances for such a class, the results arereasonably acceptable.
Program Review Reporting Year: 2012-2013Target : Target MetAbout 76% of the class was able to solve the problemcorrectly, 20% partially got it correct, and 4% did not knowhow to solve it. (11/24/2013)
Exam - Course Test/Quiz - Properknowledge of the Scientific LabReport was used as an assessmentmethod during the lab final. Thisincluded understanding scientificmeasurements with uncertainties,error analysis, calculations, andhands-on experience with theexperimental method. The followingproblem was used as an assessmenton error analysis in the lab: 1.
Measure the dimensionsof the metal object with the verniercalipers:H= __________________D= __________________
09/19/2019 Page 256 of 318Generated by Nuventive Improve

Student LearningOutcomes (SLOs) Assessment Methods Assessment Data Summaries Enhancements
Target for Success: 70% of studentsto solve correctly
2. Calculate the volume ofthe object.3. Measure the mass with thetriple-beam balance:M = _________________4. Calculate the density ofthe object along with theuncertainty.5. Using Archimede’sPrinciple prove the equation:6. Submerge the object witha string into the water containerprovided and measure the tensionusing the spring scale. Calculatedensity using the equation in step(5).7. Compare by taking theresult of step (4) to be the expectedvalue. That is calculate the % error.8. Identify one source ofrandom AND systematic error inyour results.9. Explain why the errors arerandom/systematic and what effectdid they have on the densitycalculations.
09/19/2019 Page 257 of 318Generated by Nuventive Improve

PHYS 4A:Physics for Scientists and Engineers: Mechanics
Student LearningOutcomes (SLOs) Assessment Methods Assessment Data Summaries Enhancements
PHYS4A_SLO_1 - Critically examinenew, previously un-encounteredproblems, analyzing and evaluatingtheir constituent parts, to constructand explain a logical solution utilizing,and based upon, the fundamentallaws of mechanics.
SLO Status: Active
Target for Success: 70% of studentsto solve correctly
Reflection (CLICK ON ? FOR INSTRUCTIONS): About 25% ofthe class needed to improve their analytical and problemsolving skills. 70% success was acceptable for the class.Areas for improvement would be to further help studentsdevelop their analytical and problem solving skills using theprinciples/laws/theories of classical mechanics. Based onprevious performances for such a class, the results arereasonably acceptable.
Program Review Reporting Year: 2012-2013Target : Target MetAbout 70% of the class was able to solve the problemcorrectly, 5% partially got it correct, and 25% did not knowhow to solve it. (11/24/2013)
Exam - Course Test/Quiz - As anassessment method we usedselective new un-encounteredproblems on the lecture final.Assessment was then based on thescores obtained on these selectiveproblems on an individual andoverall class basis.The followingproblem on the lecture final wasused as an assessment: Theacceleration of a marble in a certainfluid is proportional to its velocitysquared, and is given (in units ofm/s2) by a = -3v2 for v > 0. If themarble enters this fluid with a speedof 1 m/s, calculate the speed of themarble at t = 1/3 s after it enters thefluid.
PHYS4A_SLO_2 - Gain confidence intaking precise and accurate scientificmeasurements, with theiruncertainties, and then withcalculations from them, analyze theirmeaning as relative, in anexperimental context, to theverification and support of physicstheories.SLO Status: Active
Reflection (CLICK ON ? FOR INSTRUCTIONS): 85% successwas acceptable for the class and thus there weren't anyapparent student needs and issues revealed. 85% successon error analysis was acceptable for the class. Area forimprovement would be to further help students develop aconceptual and practical understanding of the physicsprinciples in the lab. Based on previous performances forsuch a class, the results are reasonably acceptable.
Program Review Reporting Year: 2012-2013Target : Target MetAbout 85% of the class was able to solve the problemcorrectly, 5% partially got it correct, and 10% did not knowhow to solve it. (11/24/2013)
Exam - Course Test/Quiz - Properknowledge of the Scientific LabReport was used as an assessmentmethod during the lab final. Thisincluded understanding scientificmeasurements with uncertainties,error analysis, calculations, andhands-on experience with theexperimental method. The followingproblem was used as an assessmenton error analysis in the lab: Considerthe following set of data for thedimensions of a rectangularaluminum block for the density lab:
L1 = 3.868 cm ± 0.001 cm
09/19/2019 Page 258 of 318Generated by Nuventive Improve

Student LearningOutcomes (SLOs) Assessment Methods Assessment Data Summaries Enhancements
Target for Success: 70% of studentsto solve correctly
L2 = 2.540 cm ± 0.001 cmL3 = 1.826 cm ± 0.001 cmM = 48.59 g ± 0.01 g
1. What instrument was usedto measure the length dimensions ofthe block?2. What instrument was usedto measure the mass of the block?3. Calculate the volume ofthe block.4. Calculate the uncertaintyin the volume of the block.5. Calculate the density ofthe block.6. Calculate the uncertaintyin the density of the block.7. What was the source oferror for the uncertainty in thedensity?8. Was the propagating errorin the density (uncertainty)significant? Explain.
09/19/2019 Page 259 of 318Generated by Nuventive Improve
PHYS 4B:Physics for Scientists and Engineers (Electricity and Magnetism)
Student LearningOutcomes (SLOs) Assessment Methods Assessment Data Summaries Enhancements
PHYS4B_SLO_1 - Critically examinenew, previously un-encounteredproblems, analyzing and evaluatingtheir constituent parts, to constructand explain a logical solution utilizing,and based upon, the fundamentallaws of electricity and magnetism.SLO Status: Active
Target for Success: 70% of studentsto solve correctly
Reflection (CLICK ON ? FOR INSTRUCTIONS): Nobody eversaid learning physics was easy and this proves it; there arethose who consider this class among the most difficult atthe college. The bottom line is that studying well (i.e., timespent with quality concentration) pays off and not studyingdoesn’t; getting students to appreciate this is the realchallenge. A low student-to-teacher ratio is critical; officehour work with just a handful of students is productive. Thegood fight never ends.
Program Review Reporting Year: 2012-2013Target : Target Not MetOf the forty-two students presented with the problems, twogot the problem completely correct, six explained theproblem well, twenty gave explanations that would beconsidered mediocre but marginally acceptable and the restdid not have any idea about what they were talking about.
(12/04/2013)
Exam - Course Test/Quiz - Thestudents were presented with aproblem they had never seen (sincethe instructor made it up exclusivelyfor their exam) within anexamination format. They wererequired to present a thorough andcomplete explanation that includedmathematical and verbal logic toarrive at the final answer.
PHYS4B_SLO_2 - Gain confidence intaking precise and accurate scientificmeasurements, with theiruncertainties, and then withcalculations from them, analyze theirmeaning as relative, in anexperimental context, to theverification and support of physicstheories.SLO Status: Active
Target for Success: 70% of studentsto use properly
Reflection (CLICK ON ? FOR INSTRUCTIONS): People canlearn manual measurement skills if they have enough timeand adequate feedback. It is easy to test a student to see ifthey can measure a number accurately. Repetition is thekey here. All thing considered, I think we are doing a goodjob here. The students with trouble need more practicetime.
Program Review Reporting Year: 2012-2013Target : Target MetReally, they did pretty well here. Using equipment is easierto learn than abstract mathematical thinking and concepts.Of the twenty people who took one lab final (there wasanother one given to a second class), ten measured withacceptable accuracy, five moderately well and five othersjust didn’t get it. (12/04/2013)
Exam - Course Test/Quiz - Thestudents were given ampleopportunity to learn, use, andoperate the oscilloscope. They weretold flat out that they would have touse one to take measurements ontheir lab final exam and indeed,that’s what happened.
09/19/2019 Page 260 of 318Generated by Nuventive Improve

PHYS 4C:Physics for Scientists and Engineers: Fluids, Waves, Optics and Thermodynamics
Student LearningOutcomes (SLOs) Assessment Methods Assessment Data Summaries Enhancements
PHYS4C_SLO_1 - Critically examinenew, previously un-encounteredproblems, analyzing and evaluatingtheir constituent parts, to constructand explain a logical solution utilizing,and based upon, the fundamentallaws of waves, fluids, optics, andthermodynamics.SLO Status: Active
Target for Success: 70% of studentsto pass
Reflection (CLICK ON ? FOR INSTRUCTIONS): This is a scorethat is a little low even for students taking advanced physicsclasses. Expected average would be more like 70 %.However this is an improvement over scores from 2012where the final exam average was 57 %. My analysis isthat students benefitted from a more rigorous treatment offormal thermodynamic proofs – a format which isunfamiliar to many students. I also believe that attentionto the difference between force and energy in waveanalysis led to better results on wave questions.
Program Review Reporting Year: 2012-2013Target : Target Not MetAverage score on final exam Winter 2013 Physics 4C was 64% indicating that students were able to learn approximately2/3 of the conceptual and problem solving skills.
(12/04/2013)
Exam - Course Test/Quiz - Finalexamination to test conceptualunderstanding as well as problemsolving ability
PHYS4C_SLO_2 - Gain confidence intaking precise and accurate scientificmeasurements, with theiruncertainties, and then withcalculations from them, analyze theirmeaning as relative, in anexperimental context, to theverification and support of physicstheories.SLO Status: Active
Target for Success: 70% of studentsto pass
Reflection (CLICK ON ? FOR INSTRUCTIONS): This is anacceptable percentage for advanced physics lab indicatingthat students understood, reasonably well, the scientificmethod, the physics of the experiments as well asuncertainty analysis. For Winter of 2012 the score was63.5 %. The improvement may be due to having studentsanalyze the physics of the experiments prior to entering thelab so that they can focus on the experiment a little better(which aids data collection as well as anaylsis). I think that Iwill continue that proactice going forward.
Program Review Reporting Year: 2012-2013Target : Target MetThe average student score on the lab final was 76.5 percentfor physics 4C Winter 2013 (12/04/2013)
Exam - Course Test/Quiz - Studentsare given a lab final in which theymust explain physical aspects of theequipment that was used to doexperiments, the theory behind theexperiments and do “error analysis”(analysis of data given uncertainties)
09/19/2019 Page 261 of 318Generated by Nuventive Improve

PHYS 4D:Physics for Scientists and Engineers (Modern Physics)
Student LearningOutcomes (SLOs) Assessment Methods Assessment Data Summaries Enhancements
PHYS4D_SLO_1 - Critically examinenew, previously un-encounteredproblems, analyzing and evaluatingtheir constituent parts, to constructand explain a logical solution utilizing,and based upon, the fundamentallaws of modern physics.SLO Status: Active
Target for Success: 70% of studentsto solve it correctly.
Reflection (CLICK ON ? FOR INSTRUCTIONS): About 5% ofthe class needed to improve their analytical and problemsolving skills. 90% success was acceptable for the class.Areas for improvement would be to further help studentsdevelop their analytical and problem solving skills using theprinciples/laws/theories of quantum mechanics. Based onprevious performances for such a class, the results arereasonably acceptable.
Program Review Reporting Year: 2012-2013Target : Target MetAbout 90% of the class was able to solve the problemcorrectly, 5% partially got it correct, and 5% did not knowhow to solve it. (11/24/2013)
Exam - Course Test/Quiz - As anassessment method we usedselective new un-encounteredproblems on the lecture final.Assessment was then based on thescores obtained on these selectiveproblems on an individual andoverall class basis.The followingproblem on the lecture final wasused as an assessment: An electronmoving in a 1-D box of length L istrapped in the n = 5 state.a. Calculate the probability offinding the electron in the( 0.2L < x < 0.4L)b. Calculate the probability offinding the electron within theinterval ?x = 0.001L at x = 3L/8.(Hint: since ?x is very small you donot have to integrate!)c. Calculate the energy of theelectron in this state.d. Write the completewavefunction.e. If the particle is in the n =1000 state, what is the probability offinding the electron in the interval(L/3<x<2L/3)?
PHYS4D_SLO_2 - Gain confidence intaking precise and accurate scientificmeasurements, with theiruncertainties, and then withcalculations from them, analyze their
Program Review Reporting Year: 2012-2013Target : Target MetAbout 85% of the class was able to solve the problemcorrectly, 10% partially got it correct, and 5% did not knowhow to solve it. (11/24/2013)
Exam - Course Test/Quiz - Properknowledge of the Scientific LabReport was used as an assessmentmethod during the lab final. Thisincluded understanding scientific
09/19/2019 Page 262 of 318Generated by Nuventive Improve

Student LearningOutcomes (SLOs) Assessment Methods Assessment Data Summaries Enhancements
meaning as relative, in anexperimental context, to theverification and support of physicstheories.SLO Status: Active
Reflection (CLICK ON ? FOR INSTRUCTIONS): 85% successwas acceptable for the class and thus there weren't anyapparent student needs and issues revealed. 85% successon error analysis was acceptable for the class. Area forimprovement would be to further help students develop aconceptual and practical understanding of the physicsprinciples in the lab. Based on previous performances forsuch a class, the results are reasonably acceptable.
measurements with uncertainties,error analysis, calculations, andhands-on experience with theexperimental method. The followingproblem was used as an assessmenton error analysis in the lab:
a) The Fractional EnergyResolution is defined by thefollowing expression:Fractional energy resolution= ....
a)Explain why Fractional EnergyResolution is important in anyenergy spectroscopy experimentsuch as the one you performed.b) Suppose you measured thefractional energy resolution of threedifferent gamma-rays and the resultswere the following:
gamma-ray 1: 0.055 gamma-ray 2: 0.982 gamma-ray 3: 0.00046
Draw a sketch of how each of thepeaks should appear in the gamma-ray spectrum. c) Is it preferable to have lowresolution peaks or high resolutionpeaks? Explain your answer.d) Explain one systematic andone random source of error involvedthat may have led you to identify thewrong elements in the unknownsample.
Systematic Error-Random Error -
09/19/2019 Page 263 of 318Generated by Nuventive Improve

Student LearningOutcomes (SLOs) Assessment Methods Assessment Data Summaries Enhancements
Target for Success: 70% of studentsto solve correctly
09/19/2019 Page 264 of 318Generated by Nuventive Improve

PHYS 50:Preparatory Physics
Student LearningOutcomes (SLOs) Assessment Methods Assessment Data Summaries Enhancements
PHYS50_SLO_1 - Critically examinenew, previously un-encounteredproblems, analyzing and evaluatingtheir constituent parts, to constructand explain a logical solution utilizing,and based upon, the fundamentallaws of mechanicsSLO Status: Active
Target for Success: 70% of studentsto solve it correctly
Reflection (CLICK ON ? FOR INSTRUCTIONS): About 15% ofthe class needed to improve their analytical and problemsolving skills. 75% success was acceptable for the class.Areas for improvement would be to further help studentsdevelop their analytical and problem solving skills using theprinciples/laws/theories of classical mechanics. Based onprevious performances for such a class, the results arereasonably acceptable.
Program Review Reporting Year: 2012-2013Target : Target MetAbout 75% of the class was able to solve the problemcorrectly, 10% partially got it correct, and 15% did not knowhow to solve it. (11/24/2013)
Exam - Course Test/Quiz - As anassessment method we usedselective new un-encounteredproblems on the lecture final.Assessment was then based on thescores obtained on these selectiveproblems on an individual andoverall class basis.The followingproblem on the lecture final wasused as an assessment: A cat isstanding on a stationary merry-go-round at a radius of 6.0 m from thecenter of the ride. Then theoperator turns on the ride and bringsit up to a rotating rate of onerevolution every 4.0 s. Calculate theminimum coefficient of friction sothat the cat doesn’t “slide off”.
09/19/2019 Page 265 of 318Generated by Nuventive Improve

PHYS 77 (X-Y):Special Projects in Physics
Student LearningOutcomes (SLOs) Assessment Methods Assessment Data Summaries Enhancements
PHYS77_SLO_1 - Investigate an areaof special interest and demonstratean appropriate level of understandingand expertise.SLO Status: ActiveOutcome Creation Date: 02/11/2018
09/19/2019 Page 266 of 318Generated by Nuventive Improve

Dept - (PSME) Geology
Assessment: Course/Service Four Column
GEOL 10:Introductory Geology
Student LearningOutcomes (SLOs) Assessment Methods Assessment Data Summaries Enhancements
GEOL10_SLO_2 - Use data andobservations to track and predictchanges in the Earth system resultingfrom dynamic Earth Processes.
Planned Assessment Quarters: 2011-12 2-Fall, 2011-12 3-Winter, 2011-124 -Spring
SLO Status: Active
Outcome Creation Date: 07/15/2012
Target for Success: 50% of studentswill answer this question correctly.
Enhancement: Since there seemsto have been some confusionregarding apparent polar-wanderpaths and field reversals, it mightbe worth emphasizing thedifference by means of some sortof in-class exercise, like think-pair-share questions or anyonymous,`clicker'-style voting. (06/30/2019)
Program Review Reporting Year: 2018-2019Target : Target Not MetAssessment Data Summary, end of 2018-2019Prepared by Marek CichanskiTo assess GEOL10_SLO_2, I chose a multiple-choicequestion from the third (of three) midterm exams from myGeology 10 class.Background Information: My multiple-choice questionstypically have four choices, one of which (the best answer)gets full points. There is usually a second-best choice, whichgets about 3/4 of the full points, and two "wrong answer"choices that get 1/2 of the full points. This partial-creditsystem accomplishes roughly the same thing as "curving"the grades, while still using a fixed grading scale, and thusavoids putting the students in direct competition with eachother for grades.
This SLO concerns changes that occur to the Earth system asa result of process that operate in and on the Earth. Oneexample of this is the motions of the continents, which area consequence of the larger set of plate-tectonic motionsthat occur in the Earth's lithosphere. These motions arerecorded at times and places where the Earth's magneticfield (which, it should be pointed out, does not cause themotions) gets "frozen into" certain types of rock. Thispaleomagnetic record allowed geoscientists in the mid-20thcentury to determine that it was not the Earth's magnetic
Exam - Course Test/Quiz - Questionsfrom midterm exams and questionsfrom final exam, selected for theirrelevance to SLO 2.
09/19/2019 Page 267 of 318Generated by Nuventive Improve
Student LearningOutcomes (SLOs) Assessment Methods Assessment Data Summaries Enhancements
Reflection (CLICK ON ? FOR INSTRUCTIONS): Takentogether, the percentages of students choosing the bestand second-best answers amounts to two-thirds of theclass. It is interesting to consider possible reasons why alarge fraction of the class chose the second-best answer,which referred to the reversals of the magnetic field. Onehypothesis that could explain this would be a type of'recency bias'. When the material about continental driftand plate tectonics was presented, the part about apparentpolar-wander paths was presented first. Then there was asection about the reversals of the Earth's magnetic field. Itis possible that, when presented with a complicated-lookingquestion about paleomagnetism, students might havegrabbed the most "recently-installed" information, whichwas about reversals.
poles that had wandered, but the continents.
The question I chose for assessing this SLO asked thestudents to imagine collecting paleomagnetic records fromseveral continents, at many times throughout Earth history.If the resulting "apparent polar-wander paths" from thesedifferent continents only agree for the present time, whatdoes this mean? The correct answer is that the continentshave moved. The second-best answer is that there hasrecently been a magnetic field reversal. 47% of studentschose the correct answer, 20% chose the second-bestanswer, and 33% chose one of the wrong answers.(06/30/2019)
Enhancement: Enhancement /Action:
This is a generalized Action planfor Enhancement of studentsuccess in the Student LearningOutcomes for Geology 10. It isbased on SLOAC results for oneyear of SLO 1 (2010-2011) and oneyear of SLO 2 (2011-2012).
Averaged over two school years
Program Review Reporting Year: 2011-2012Target : Target MetThis SLO was assessed by tabulating the multiple-choiceresponses that the students selected on their tests. (TheParscore system made it possible to count how manystudents selected `a', `b', etc? for any given question.) Foreach test question used in the SLO assessment, there is acorrect response, one or more `bad' responses, and in mostcases, an `almost correct' response. Each question had fourchoices, total - one correct, two or three bad choices, and inmost cases, one `almost correct' choice.
09/19/2019 Page 268 of 318Generated by Nuventive Improve

Student LearningOutcomes (SLOs) Assessment Methods Assessment Data Summaries Enhancements
and both SLOs, a broad patternexists for student performance ona typical 4-item multiple-choicequestion from an in-class exam:About 60 percent of the studentschoose the correct response, withthe remainder of the chosenresponses distributed prettyevenly between the threeincorrect choices. Thisperformance level thus representsa `baseline' from whichimprovements can be sought.
Examples of low and high successrates on SLO-assessmentembedded questions can bedrawn from a number of differentparts of the `parameter space'represented by the overall pool ofassessed questions. In some cases,students will succeed at an SLO byremembering key facts or datathat they need in order to assess ahypothesis or track or predictsome change in the Earth system.In other cases, the key facts areremembered less well, resulting ina lower success rate on the SLO.To the extent that this iscorrelated with subject matter,the most difficult `memorychallenges' occur in the mostcomplex subjects covered inGeology 10, particularly thesubject of plate tectonics. Thissuggests that where the materialinvolves a large number of detailsthat have to be `kept straight',additional pedagogical emphasis is
Each test question that was chosen for SLO assessment wasevaluated in the following way: The percentage of studentschoosing the `correct', `almost', and `bad' choices werereported as a percentage of total responses. The totalnumber of tests used in the assessment was also recorded.For example, if 75 tests were used, this was reported as`N=75'.
The results of the tabulation(s) can be seen as a PDF file inthe `Related Documents'.
For the assessment of SLO 2 in Spring 2012, questions werechosen from the midterm exams (2 from the second exam,`E2', and one from the third exam, `E3'), and from the finalexam. The class assessed in Spring 2012 was a night class.
On E2, the first question assessed involved looking at somedrawings of tilted rock layers, and using the sedimentarystructures in those layers to decide which drawing showed aset of overturned rock layers. The percentages of correctanswers chosen (47 percent) and incorrect answers chosen(53 percent) were similar.
E2, second question: Students were asked to imagine thatthey were measuring and describing the thicknesses andcompositions of a stack of sedimentary beds. Given thatthey are able to see the exposed edges of these layers, whathappened to the layers after deposition? This tests studentson their understanding of Steno's third principle, a key toolin using data to track and predict changes in the Earthsystem. 78 percent of students chose the correct response(erosion), 13 percent chose the `almost' response (tilting),and 9 percent chose one or the other of the bad responses(metamorphism, folding).
On E3, students were asked to imagine that they have seengneiss (a metamorphic rock) in the Alps. Where did thedeformation that they observe in the rock form? 60 percentchose the correct answer (in the mid to lower crust), 9percent chose the `almost' answer (in the upper crust), and
09/19/2019 Page 269 of 318Generated by Nuventive Improve

Student LearningOutcomes (SLOs) Assessment Methods Assessment Data Summaries Enhancements
Reflection (CLICK ON ? FOR INSTRUCTIONS): E2, firstquestion: In this case, students did not generally do a goodjob of recognizing `upside-down' sedimentary structures.They had been presented with examples of this sort ofthing in class, but did not seem to have retained the pointof the examples as well as might be desired. As with manyof the other `reflections and analyses' in the first cycle ofSLO 1 and 2 assessments, it might be concluded that agreater degree of `hands-on' involvement with the material,through problem-solving exercises, might improve studentperformance on this SLO.
E2, second question: Student success on this question wasgood, with correct responses outnumbering incorrect onesby nearly 4 to 1. The point in question here, Steno's thirdprinciple (sometimes called `concealed stratification' or`lateral continuity'), was given particular emphasis by theinstructor during lecture. This raises - but does not prove -the possibility that it is possible to increase student successin a particular measure of an SLO simply through careful
needed.
Students in Geology 10 face otherchallenges as well, such asinterpreting visual cues fromdrawings, or visualizing scenariosdescribed to them in words. Thissuggests that additionalpedagogical emphasis may beneeded for all forms ofvisualization and visual patternrecognition.
Specific pedagogical actions can beundertaken to try and increasesuccess rates on SLOs. The mostattractive set of new teachingmethods falls under the headingof `peer instruction'. Pioneered byinstructors like Eric Mazur, aphysics professor at Harvard, theyinvolve students attempting toanswer conceptual questionsabout the material, and thenattempting to explain theiranswers to each other. Peer-instruction methods can takemany forms, such as `think-pair-share' exercises, and the use ofPersonal Response System(`clickers'). Research by instructorslike Mazur at Harvard, and anumber of instructors in Geologyand Astronomy at severaluniversities, have demonstrated(through research and data) thatpeer-instruction methods cansignificantly enhance studentunderstanding of material.
31 percent chose one or the other of the bad answers (inthe inner or outer core).
Final, first question assessed: As in Fall 2011 and Winter2012, students were asked why Precambrian rocks do notshow much of a fossil record. 83 percent of students chosethe correct answer (organisms had not yet evolved hardskeletal parts), 4 percent chose the `almost' answer (therewere no more organisms with hard skeletal parts, whichgets Earth history backward), and 13 percent chose one orthe other of the bad answers (non-factual accounts ofclimate and sedimentation).
Final exam, second question: Students were asked todescribe some of the original evidence for an ice age. 63percent of students selected the correct choice (morainesfar from present-day glaciers), no one selected the `almost'choice (volcanic landforms that erupted through ice), and37 percent selected one or the other of the bad choices(non-factual scenarios). (07/18/2012)
09/19/2019 Page 270 of 318Generated by Nuventive Improve

Student LearningOutcomes (SLOs) Assessment Methods Assessment Data Summaries Enhancements
emphasis of that topic in class.
E3: A large fraction of the students chose answers thatwere wide of the mark, and which reflected amisunderstanding of where (in the Earth) different types ofdeformation occur, and the fact that the iron from the coredoes not get exposed at the surface. The material on typesof deformation probably needs to be presented in adifferent way, along with a re-emphasis of the point (madeat the beginning of the quarter) that the core is too densefor any of it to be exposed at the Earth's surface.
Final, first question: The success rate were quite high forthis assessment of SLO 2, at nearly 85 percent. This part ofthe story of the evolutionary history of life on Earth seemsto be a reasonably straightforward thing for students tounderstand and to recall.
Final, second question: Success was high, at over 60percent, but a significant fraction of the class (slightly over athird) chose one of the factually incorrect scenarios given asanswer choices. This raises the question of how completelythe subject was covered in the reading and lectures,relative to other parts of the topic of glaciation. Previousquarters (e.g. Winter 2012) did better on this assessment ofSLO 2, so clearly it is possible for students to succeed athigher rates in this area.Related Documents:Geol_10_SLO_2_Sp2012
The Geology department hasalready done research on thesemethods, and has madepreliminary efforts to experimentwith them. For example, in-classexperiments have been done inGeology 10 to try and use thePSME Division's set of clickers inclass. Thus far, these experimentshave mostly involved trying towork out the *logistical* details ofimplementing systems like thoseused at other schools. Given thefact that De Anza College does nothave graduate teaching assistantsor other resources, such as a 4-year school might have, theimplementation of peer-instruction methods can bedifficult. Additionally, whereas a 4-year school might easily be able toask its students to buy in-classtools like clickers, this would be adifficult thing to ask of ourstudents. Thus, it has beennecessary to experiment with therather basic set of clickersavailable in the PSME Division.New ways of implementing thistechnology, in which the studentsdo not buy or own their ownclickers, are in the process ofdevelopment.
While technology like `clickers' isonly one example of peer-basedinstruction, it is generally hopedthat experiments with peerinstruction and related pedagogycan lead to greater student
09/19/2019 Page 271 of 318Generated by Nuventive Improve
Student LearningOutcomes (SLOs) Assessment Methods Assessment Data Summaries Enhancements
success in the learning outcomesfor Geology 10. Experiments withthese methods over the next fewyears will hopefully yield data thatcan be compared with the 2010-2011 and 2011-2012 cycles for SLO1 and SLO 2. (07/18/2012)
Enhancement: Enhancement /Action:
This is a generalized Action planfor Enhancement of studentsuccess in the Student LearningOutcomes for Geology 10. It isbased on SLOAC results for oneyear of SLO 1 (2010-2011) and oneyear of SLO 2 (2011-2012).
Averaged over two school yearsand both SLOs, a broad patternexists for student performance ona typical 4-item multiple-choicequestion from an in-class exam:About 60 percent of the studentschoose the correct response, withthe remainder of the chosenresponses distributed prettyevenly between the threeincorrect choices. Thisperformance level thus representsa `baseline' from whichimprovements can be sought.
Examples of low and high successrates on SLO-assessmentembedded questions can bedrawn from a number of differentparts of the `parameter space'represented by the overall pool of
Program Review Reporting Year: 2011-2012Target : Target MetThis SLO was assessed by tabulating the multiple-choiceresponses that the students selected on their tests. (TheParscore system made it possible to count how manystudents selected `a', `b', etc? for any given question.) Foreach test question used in the SLO assessment, there is acorrect response, one or more `bad' responses, and in mostcases, an `almost correct' response. Each question had fourchoices, total - one correct, two or three bad choices, and inmost cases, one `almost correct' choice.
Each test question that was chosen for SLO assessment wasevaluated in the following way: The percentage of studentschoosing the `correct', `almost', and `bad' choices werereported as a percentage of total responses. The totalnumber of tests used in the assessment was also recorded.For example, if 75 tests were used, this was reported as`N=75'.
The results of the tabulation(s) can be seen as a PDF file inthe `Related Documents'.
For the assessment of SLO 2 in Winter 2011, one questionwas selected from each midterm exam (`E1', `E2', and `E3'),and two questions were selected from the final exam.
On E1, the students were asked to imagine that they wereexploring the Goat Rocks, a real place in Washington state.This group of small mountains are the remnants of anextinct, eroded volcano, made of alternating layers of ashand lava. What type of volcano was the Goat Rocks at an
09/19/2019 Page 272 of 318Generated by Nuventive Improve
Student LearningOutcomes (SLOs) Assessment Methods Assessment Data Summaries Enhancements
assessed questions. In some cases,students will succeed at an SLO byremembering key facts or datathat they need in order to assess ahypothesis or track or predictsome change in the Earth system.In other cases, the key facts areremembered less well, resulting ina lower success rate on the SLO.To the extent that this iscorrelated with subject matter,the most difficult `memorychallenges' occur in the mostcomplex subjects covered inGeology 10, particularly thesubject of plate tectonics. Thissuggests that where the materialinvolves a large number of detailsthat have to be `kept straight',additional pedagogical emphasis isneeded.
Students in Geology 10 face otherchallenges as well, such asinterpreting visual cues fromdrawings, or visualizing scenariosdescribed to them in words. Thissuggests that additionalpedagogical emphasis may beneeded for all forms ofvisualization and visual patternrecognition.
Specific pedagogical actions can beundertaken to try and increasesuccess rates on SLOs. The mostattractive set of new teachingmethods falls under the headingof `peer instruction'. Pioneered byinstructors like Eric Mazur, a
earlier time in Earth history? 62 percent of students chosethe correct response (a composite volcano, or`stratovolcano'), 10 percent chose the `almost' response (ashield volcano), and 28 percent chose one or the other ofthe bad responses (cinder cone, rhyolite dome, both ofwhich are relatively small).
On E2, students were asked about the significance of the`leftovers' of weathering. By choosing the correct response,they could demonstrate their understanding of how rocksand Earth materials change through time. 62 percent ofstudents chose the correct response (the `leftovers' are theingredients of sedimentary rocks), 32 percent chose one orthe other of the bad responses (various factually incorrectstatements), and 6 percent chose the `almost' response.
E3: The re-arrangement of the positions of the continentsthrough time is one of the most important changes in theEarth system that can be tracked with data. In the selectedquestion from E3, students were asked to identify a piece ofevidence that had been used by Alfred Wegener when hefirst proposed the existence of the supercontinent Pangea.66 percent of students chose the correct answer (Paleozoicorogens divided across the Atlantic), 18 percent chose the`almost' answer (pre-Paleozoic orogens divided across thePacific), and 16 percent chose one or another of the badanswers (various non-factual accounts).
Final exam, first question: As was done for SLO 2 in Fall2011, students were asked why Precambrian rocks don'tshow much of a fossil record. 69 percent of students chosethe correct answer (organisms hadn't yet evolved hardskeletal parts), 9 percent chose the `almost' answer (therewere no more organisms with hard skeletal parts, a choicewhich gets Earth history backward), and 22 percent choseone or the other of the bad answers (non-factual accountsof erosion and sedimentation).
Final exam, second question: Students were asked todescribe some of the original evidence for an ice age. 78
09/19/2019 Page 273 of 318Generated by Nuventive Improve
Student LearningOutcomes (SLOs) Assessment Methods Assessment Data Summaries Enhancements
Reflection (CLICK ON ? FOR INSTRUCTIONS): E1: Studentssucceeded at SLO 2 at a high level, over 60 percent,although this number could conceivably be improved. It ispossible that those students who got the question wrongmight have had difficulty *visualizing* the landscape beingvery different in the past. They might also have failed topick up on the key clue - that the alternating layers of ashand lava are what made the old edifice a compositevolcano.
E2: Student success was reasonably high - about 2-to-1 infavor of the correct response over the aggregate of the badones - but it might be higher, if students had moreexperience working with the concept of the rock cycle.
E3: Student success was good for this particular assessmentof SLO 2, with the percentage of correct choices greatlyoutnumbering the percentages for any of the other choices.It seemed in this case that students remembered well the`story' of how Wegener first proposed continental drift.
Final, first question: Students succeeded at a high level onSLO 2 in this case, with correct responses very greatlyoutnumbering incorrect ones. However, it might bepossible to increase the success rate in this aspect of SLO 2.This would involve finding a way to make studentsremember this facts about the history of life on Earthbetter, or making it easier to understand those facts. Onesuggestion might be to incorporate more exercisesinvolving paleontology and fossils into the class, either asthink-pair-share exercises in the lecture hall, or in thelaboratory portion of the class.
Final, second question: The success rate was fairly high forthis assessment of SLO 2. In order to try and improve the
physics professor at Harvard, theyinvolve students attempting toanswer conceptual questionsabout the material, and thenattempting to explain theiranswers to each other. Peer-instruction methods can takemany forms, such as `think-pair-share' exercises, and the use ofPersonal Response System(`clickers'). Research by instructorslike Mazur at Harvard, and anumber of instructors in Geologyand Astronomy at severaluniversities, have demonstrated(through research and data) thatpeer-instruction methods cansignificantly enhance studentunderstanding of material.
The Geology department hasalready done research on thesemethods, and has madepreliminary efforts to experimentwith them. For example, in-classexperiments have been done inGeology 10 to try and use thePSME Division's set of clickers inclass. Thus far, these experimentshave mostly involved trying towork out the *logistical* details ofimplementing systems like thoseused at other schools. Given thefact that De Anza College does nothave graduate teaching assistantsor other resources, such as a 4-year school might have, theimplementation of peer-instruction methods can bedifficult. Additionally, whereas a 4-
percent of students selected the correct choice (morainesfar from present-day glaciers), 9 percent selected the`almost' choice (volcanic landforms that erupted throughice), and 13 percent selected one or the other of the badchoices (non-factual scenarios). (07/18/2012)
09/19/2019 Page 274 of 318Generated by Nuventive Improve

Student LearningOutcomes (SLOs) Assessment Methods Assessment Data Summaries Enhancements
success rate, it would probably be necessary for students tohave read, heard, or researched an even more detailedaccount of the Earth's glacial history and how this historywas elucidated.
Related Documents:Geol_10_SLO_2_W2012
year school might easily be able toask its students to buy in-classtools like clickers, this would be adifficult thing to ask of ourstudents. Thus, it has beennecessary to experiment with therather basic set of clickersavailable in the PSME Division.New ways of implementing thistechnology, in which the studentsdo not buy or own their ownclickers, are in the process ofdevelopment.
While technology like `clickers' isonly one example of peer-basedinstruction, it is generally hopedthat experiments with peerinstruction and related pedagogycan lead to greater studentsuccess in the learning outcomesfor Geology 10. Experiments withthese methods over the next fewyears will hopefully yield data thatcan be compared with the 2010-2011 and 2011-2012 cycles for SLO1 and SLO 2. (07/18/2012)
Enhancement: Enhancement /Action:
This is a generalized Action planfor Enhancement of studentsuccess in the Student LearningOutcomes for Geology 10. It isbased on SLOAC results for oneyear of SLO 1 (2010-2011) and oneyear of SLO 2 (2011-2012).
Averaged over two school years
Program Review Reporting Year: 2011-2012Target : Target MetThis SLO was assessed by tabulating the multiple-choiceresponses that the students selected on their tests. (TheParscore system made it possible to count how manystudents selected `a', `b', etc? for any given question.) Foreach test question used in the SLO assessment, there is acorrect response, one or more `bad' responses, and in mostcases, an `almost correct' response. Each question had fourchoices, total - one correct, two or three bad choices, and inmost cases, one `almost correct' choice.
09/19/2019 Page 275 of 318Generated by Nuventive Improve
Student LearningOutcomes (SLOs) Assessment Methods Assessment Data Summaries Enhancements
and both SLOs, a broad patternexists for student performance ona typical 4-item multiple-choicequestion from an in-class exam:About 60 percent of the studentschoose the correct response, withthe remainder of the chosenresponses distributed prettyevenly between the threeincorrect choices. Thisperformance level thus representsa `baseline' from whichimprovements can be sought.
Examples of low and high successrates on SLO-assessmentembedded questions can bedrawn from a number of differentparts of the `parameter space'represented by the overall pool ofassessed questions. In some cases,students will succeed at an SLO byremembering key facts or datathat they need in order to assess ahypothesis or track or predictsome change in the Earth system.In other cases, the key facts areremembered less well, resulting ina lower success rate on the SLO.To the extent that this iscorrelated with subject matter,the most difficult `memorychallenges' occur in the mostcomplex subjects covered inGeology 10, particularly thesubject of plate tectonics. Thissuggests that where the materialinvolves a large number of detailsthat have to be `kept straight',additional pedagogical emphasis is
Each test question that was chosen for SLO assessment wasevaluated in the following way: The percentage of studentschoosing the `correct', `almost', and `bad' choices werereported as a percentage of total responses. The totalnumber of tests used in the assessment was also recorded.For example, if 75 tests were used, this was reported as`N=75'.
The results of the tabulation(s) can be seen as a PDF file inthe `Related Documents'.
For SLO 2 in Fall 2011, one question was selected from eachof the three midterm exams (`E1', `E2', and `E3'), and twoquestions were selected from the final exam.
On E1, the students were asked to imagine that they wereexamining some ancient rocks, and those rocks haveundergone intense chemical weathering. What would bestdescribe the environment in which this weatheringoccurred? 56 percent of students chose the correctresponse (an environment with a lot of water), 10 percentchose the `almost' response (a wet, but *cold*environment), and 34 percent chose one or the other of thebad responses (dry environments).
On E2, students were asked about changes in the Earthsystem in this way: What events marked the boundariesbetween the Paleozoic and Mesozoic Eras, and between theMesozoic and Cenozoic Eras? 61 percent of studentsselected the correct response (mass extinctions), 13 percentselected the `almost' response (mass extinctions, with oneof the extinction dates wrong), and 26 percent selected oneor the other of the bad responses (evolution of varioustraits that did not lead to mass extinctions).
On E3, students were asked to choose what sort of datawould best provide evidence for the changing relativepositions of continents (i.e. continental drift) through time?34 percent of students chose the correct answer (ancient,non-tilted lava flows in Antarctica, with horizontal
09/19/2019 Page 276 of 318Generated by Nuventive Improve

Student LearningOutcomes (SLOs) Assessment Methods Assessment Data Summaries Enhancements
Reflection (CLICK ON ? FOR INSTRUCTIONS): E1: Althoughcorrect responses outnumbered bad responses by nearly 2-to-1, the percentage of correct responses could be higher.It is possible that students simply hadn't memorizedenough facts about chemical weathering, or that they hadtrouble visualizing the environment at the Earth's surfacechanging through geologic time. Possible pedagogicalresponses might include changing the way this material ispresented in lecture, or using a clicker question toemphasize this point, if the logistical and cost-to-studentsissues surrounding clickers can be fully settled.
E2: Student success was fairly good on this question,although it would be desirable to improve the percentageof students choosing `mass extinctions'. This is a case wherethe students probably needed to simply have the relevant
needed.
Students in Geology 10 face otherchallenges as well, such asinterpreting visual cues fromdrawings, or visualizing scenariosdescribed to them in words. Thissuggests that additionalpedagogical emphasis may beneeded for all forms ofvisualization and visual patternrecognition.
Specific pedagogical actions can beundertaken to try and increasesuccess rates on SLOs. The mostattractive set of new teachingmethods falls under the headingof `peer instruction'. Pioneered byinstructors like Eric Mazur, aphysics professor at Harvard, theyinvolve students attempting toanswer conceptual questionsabout the material, and thenattempting to explain theiranswers to each other. Peer-instruction methods can takemany forms, such as `think-pair-share' exercises, and the use ofPersonal Response System(`clickers'). Research by instructorslike Mazur at Harvard, and anumber of instructors in Geologyand Astronomy at severaluniversities, have demonstrated(through research and data) thatpeer-instruction methods cansignificantly enhance studentunderstanding of material.
paleomagnetic fields in them), 16 percent of students chosethe `almost' answer (same, but with steeply-inclined fields),and 50 precent chose one or the other of the bad answers(various pieces of evidence for paleomagnetic reversals).
On the final exam, the first question selected forassessment of SLO 2 concerned the fossil record. Studentswere asked why Precambrian rocks do not show much of afossil record? 79 percent of students chose the correctresponse (organisms had not yet evolved hard skeletalparts), 3 percent chose the `almost' response (there wereno more organisms with had skeletal parts, which isfactually incorrect), and 18 percent chose one or the otherof the two bad responses (non-factual claims about climateand sedimentation).
The second question chosen from the final exam concernedice ages. What was some of the original evidence for an iceage? 74 percent of students selected the correct choice(moraines far from present-day glaciers), 25 percentselected one or the other of the bad choices (factuallyincorrect accounts), and only 1 percent selected the`almost'choice (volcanic landforms that erupted through ice).(07/18/2012)
09/19/2019 Page 277 of 318Generated by Nuventive Improve

Student LearningOutcomes (SLOs) Assessment Methods Assessment Data Summaries Enhancements
facts memorized better. The fact that the geological timescale is divided on the basis of events in the history of life,particularly mass extinctions, is probably less amenable topeer-instruction methods and critical-thinking exercises,compared to other aspects of SLO 2. This may be a casewhere students need better training in how to memorizerelevant information. In-class training or homeworktraining, such as by making study cards of the sort theinstructor used in college, might be a worthwhile form of`in-class study skills training'.
E3: As has been noticed in the assessment of SLO 1,questions related to plate tectonics tend to have the lowestsuccess rates in SLO 2 as well. This may be a case in whichstudents generally have more difficulty understanding themany details of paleomagnetism and plate-tectonic theorythan the instructor does. Plate tectonics, especially as itintersects with the various SLOs, may require specialattention, either in the form of revised lectures, morelecture time, covering it earlier in the quarter, and/or theuse of new pedagogical techniques, such as those thatinvolve peer-instruction techniques.
Final, first question assessed: Student success was quitegood on SLO 2, at nearly 80 percent correct. This is a casewhere they seemed to remember the details of the`Cambrian' explosion of life forms with hard skeletal parts,and its importance for the geological record. Although thisis a `success story' for SLO 2, it may be worth asking `whatmade the students remember *this* part of the storybetter than, say the information about mass extinctionsfrom the E2 question?
Final, second question assessed: Student success on thisquestion was quite good, with correct responsesoutnumbering the others by nearly 3 to 1.
Related Documents:
The Geology department hasalready done research on thesemethods, and has madepreliminary efforts to experimentwith them. For example, in-classexperiments have been done inGeology 10 to try and use thePSME Division's set of clickers inclass. Thus far, these experimentshave mostly involved trying towork out the *logistical* details ofimplementing systems like thoseused at other schools. Given thefact that De Anza College does nothave graduate teaching assistantsor other resources, such as a 4-year school might have, theimplementation of peer-instruction methods can bedifficult. Additionally, whereas a 4-year school might easily be able toask its students to buy in-classtools like clickers, this would be adifficult thing to ask of ourstudents. Thus, it has beennecessary to experiment with therather basic set of clickersavailable in the PSME Division.New ways of implementing thistechnology, in which the studentsdo not buy or own their ownclickers, are in the process ofdevelopment.
While technology like `clickers' isonly one example of peer-basedinstruction, it is generally hopedthat experiments with peerinstruction and related pedagogycan lead to greater student
09/19/2019 Page 278 of 318Generated by Nuventive Improve

Student LearningOutcomes (SLOs) Assessment Methods Assessment Data Summaries Enhancements
Geol_10_SLO_2_Fall2011success in the learning outcomesfor Geology 10. Experiments withthese methods over the next fewyears will hopefully yield data thatcan be compared with the 2010-2011 and 2011-2012 cycles for SLO1 and SLO 2. (07/18/2012)
GEOL10_SLO_1 - Apply the principlesof scientific methodology to evaluatehypotheses on how the earth worksas an integrated system.
Planned Assessment Quarters: 2010-11 2-Fall, 2010-11 3-Winter, 2010-114-Spring
SLO Status: Active
Outcome Creation Date: 07/15/2012
Target for Success: 50% of studentswill get the correct answer for thisquestion.
Reflection (CLICK ON ? FOR INSTRUCTIONS): The overall
Enhancement: It will be worthcontinuing to emphasize themodel of the Earth that ispresented at the beginning of thequarter. This may help students toachieve a reasonably high level ofsuccess on questions of this type,as they did in this case.(06/30/2019)
Program Review Reporting Year: 2018-2019Target : Target MetAssessment Data Summary, end of 2018-2019Prepared by Marek CichanskiTo assess GEOL10_SLO_1, I chose a multiple-choicequestion from the first (of three) midterm exams from myGeology 10 class.Background Information: My multiple-choice questionstypically have four choices, one of which (the best answer)gets full points. There is usually a second-best choice, whichgets about 3/4 of the full points, and two "wrong answer"choices that get 1/2 of the full points. This partial-creditsystem accomplishes roughly the same thing as "curving"the grades, while still using a fixed grading scale, and thusavoids putting the students in direct competition with eachother for grades.
This SLO concerns the Earth as a system, and this systemhas many components. The question I chose to assess thisSLO dealt with the major compositional parts of the Earthsystem, namely its compositional layers. These are the core,mantle, and crust, which became separated from eachother shortly after the Earth's formation, due to theirdifferent densities. The question asked students to choosethe best description of the core, mantle, and crust, and thereason for their separation. The best answer was that thecore is metal and is denser than the other layers, which aremade of rock. 81% of students chose this answer. 4% ofstudents chose the 2nd-best answer, which claimed themantle is the metal layer, and 15% of students chose one ofthe wrong answers. (06/30/2019)
Exam - Course Test/Quiz - Questionsfrom midterm exams and questionsfrom final exam, selected for theirrelevance to SLO 1.
09/19/2019 Page 279 of 318Generated by Nuventive Improve
Student LearningOutcomes (SLOs) Assessment Methods Assessment Data Summaries Enhancements
success rate for this question was good. Although it isimpossible to know for sure what the students werethinking as they made their answer choices, it seemsplausible that they had the correct mental model of theEarth in mind. This is emphasized early in the quarter, in thefirst lecture, and the first reading assignments. Thedifferentiation of the Earth (i.e. its separation into layersbased on density) is described by analogy to substances ofdifferent densities, like oil and vinegar.
Enhancement: This is ageneralized Action plan forEnhancement of student successin the Student Learning Outcomesfor Geology 10. It is based onSLOAC results for one year of SLO1 (2010-2011) and one year of SLO2 (2011-2012).
Averaged over two school yearsand both SLOs, a broad patternexists for student performance ona typical 4-item multiple-choicequestion from an in-class exam:About 60 percent of the studentschoose the correct response, withthe remainder of the chosenresponses distributed prettyevenly between the threeincorrect choices. Thisperformance level thus representsa `baseline' from whichimprovements can be sought.
Examples of low and high successrates on SLO-assessmentembedded questions can bedrawn from a number of differentparts of the `parameter space'represented by the overall pool ofassessed questions. In some cases,
Program Review Reporting Year: 2010-2011Target : Target MetThis SLO was assessed by tabulating the multiple-choiceresponses that the students selected on their tests. (TheParscore system made it possible to count how manystudents selected `a', `b', etc? for any given question.) Foreach test question used in the SLO assessment, there is acorrect response, one or more `bad' responses, and in mostcases, an `almost correct' response. Each question had fourchoices, total - one correct, two or three bad choices, and inmost cases, one `almost correct' choice.
Each test question that was chosen for SLO assessment wasevaluated in the following way: The percentage of studentschoosing the `correct', `almost', and `bad' choices werereported as a percentage of total responses. The totalnumber of tests used in the assessment was also recorded.For example, if 75 tests were used, this was reported as`N=75'.
The results of the tabulation(s) can be seen as a PDF file inthe `Related Documents'.
The Spring 2011 class that was selected for SLO 1assessment was a 30-person night class. One question wasselected from each of the four graded items in the course:The three midterm exams (`E1', `E2', and `E3'), and the finalexam.
On E1, students were asked what was the *early* evidencefor organized atomic structure in crystals? The hypothesis
09/19/2019 Page 280 of 318Generated by Nuventive Improve
Student LearningOutcomes (SLOs) Assessment Methods Assessment Data Summaries Enhancements
students will succeed at an SLO byremembering key facts or datathat they need in order to assess ahypothesis or track or predictsome change in the Earth system.In other cases, the key facts areremembered less well, resulting ina lower success rate on the SLO.To the extent that this iscorrelated with subject matter,the most difficult `memorychallenges' occur in the mostcomplex subjects covered inGeology 10, particularly thesubject of plate tectonics. Thissuggests that where the materialinvolves a large number of detailsthat have to be `kept straight',additional pedagogical emphasis isneeded.
Students in Geology 10 face otherchallenges as well, such asinterpreting visual cues fromdrawings, or visualizing scenariosdescribed to them in words. Thissuggests that additionalpedagogical emphasis may beneeded for all forms ofvisualization and visual patternrecognition.
Specific pedagogical actions can beundertaken to try and increasesuccess rates on SLOs. The mostattractive set of new teachingmethods falls under the headingof `peer instruction'. Pioneered byinstructors like Eric Mazur, aphysics professor at Harvard, they
that crystals have such an atomic structure is a key part ofan understanding of what terrestrial planets are made of,and in this question, students needed to distinguishbetween the *early* evidence, which suggests a hypothesisin the first place, and *later* evidence, which tests thehypothesis. 58 percent of student selected the correctchoice (constancy of interfacial angles from crystal tocrystal), 25 percent selected the `almost' choice (laterevidence, such as from X-ray diffraction), and 17 percent ofstudents selected one or another of the bad choices (otherfacts about minerals).
On E2, the students were asked to imagine that they werediscussing a desert landscape with a friend, such as thatfound in areas like Joshua Tree, where extremely large,rounded boulders are found. In the question, a friendsuggests that the boulders were rounded by streamtransport. What alternative hypothesis might be suggested?95 percent of students gave the correct answer, than theboulders had been joint-bounded blocks whose corners andedges has been rounded off by chemical weathering whilestill buried under soil.
On E3, students were asked to describe the new evidencethat revived the hypothesis of continental drift, after it wasdismissed in the early 20th century. Student responses weresplit (at 42 percent) between the correct choice (apparentpolar-wander paths that didn't match from continent tocontinent) and the two bad choices. 16 percent of studentschose the `almost' answer (data related to purportedrotation of continents).
On the final exam, the question selected for assessment ofSLO 1 was similar to one used for W2011. Students wereasked to imagine examining beds of sedimentary rock inwidely separated areas. How might they test the hypothesisthat the beds were deposited at the same time? Studentresponses were evenly split (at 42 percent) between thecorrect choice (same fossils in the two areas) and an`almost' choice (same rock types in the two areas). 16
09/19/2019 Page 281 of 318Generated by Nuventive Improve

Student LearningOutcomes (SLOs) Assessment Methods Assessment Data Summaries Enhancements
Reflection (CLICK ON ? FOR INSTRUCTIONS): E1: Overall,students performed well on this question, selecting thecorrect choice by a more than 2-to-1 margin over the`almost' choice, and by a more than 3-to-1 margin over theaggregate of the bad choices.
E2: Students overwhelmingly recalled the correct story thatreally explains the existence of large, rounded rock massesin desert areas.
E3: As in Winter 2011, student success on SLO 1, in thetopic area of plate tectonics, was not especially good. Thismay reflect the general complexity of the topic. Conceptssuch as paleomagnetism and apparent polar-wander pathsare quite complex. It may be necessary to devote moretime in lecture to these topics, and/or to do more hands-onexercises in lab, as well as possibly employing peer-instruction techniques, in which students would help eachother clarify and reinforce their understanding.
Final: The split between *fossil correlation* and correlationof lithologies suggests that the students might not haveunderstood the importance of the principle of fossilsuccession. It may be worth clarifying this point in thelecture, and/or the peer-instruction techniques suggestedabove, for E3.Related Documents:Geol_10_SLO_1_Sp2011
involve students attempting toanswer conceptual questionsabout the material, and thenattempting to explain theiranswers to each other. Peer-instruction methods can takemany forms, such as `think-pair-share' exercises, and the use ofPersonal Response System(`clickers'). Research by instructorslike Mazur at Harvard, and anumber of instructors in Geologyand Astronomy at severaluniversities, have demonstrated(through research and data) thatpeer-instruction methods cansignificantly enhance studentunderstanding of material.
The Geology department hasalready done research on thesemethods, and has madepreliminary efforts to experimentwith them. For example, in-classexperiments have been done inGeology 10 to try and use thePSME Division's set of clickers inclass. Thus far, these experimentshave mostly involved trying towork out the *logistical* details ofimplementing systems like thoseused at other schools. Given thefact that De Anza College does nothave graduate teaching assistantsor other resources, such as a 4-year school might have, theimplementation of peer-instruction methods can bedifficult. Additionally, whereas a 4-year school might easily be able to
percent of students selected the other `almost' choice(volcanic ash in the sediment), and no students selected thebad choice (rocks are metamorphosed). (07/18/2012)
09/19/2019 Page 282 of 318Generated by Nuventive Improve
Student LearningOutcomes (SLOs) Assessment Methods Assessment Data Summaries Enhancements
ask its students to buy in-classtools like clickers, this would be adifficult thing to ask of ourstudents. Thus, it has beennecessary to experiment with therather basic set of clickersavailable in the PSME Division.New ways of implementing thistechnology, in which the studentsdo not buy or own their ownclickers, are in the process ofdevelopment.
While technology like `clickers' isonly one example of peer-basedinstruction, it is generally hopedthat experiments with peerinstruction and related pedagogycan lead to greater studentsuccess in the learning outcomesfor Geology 10. Experiments withthese methods over the next fewyears will hopefully yield data thatcan be compared with the 2010-2011 and 2011-2012 cycles for SLO1 and SLO 2. (07/18/2012)
Enhancement: This is ageneralized Action plan forEnhancement of student successin the Student Learning Outcomesfor Geology 10. It is based onSLOAC results for one year of SLO1 (2010-2011) and one year of SLO2 (2011-2012).
Averaged over two school yearsand both SLOs, a broad patternexists for student performance ona typical 4-item multiple-choice
Program Review Reporting Year: 2010-2011Target : Target MetThis SLO was assessed by tabulating the multiple-choiceresponses that the students selected on their tests. (TheParscore system made it possible to count how manystudents selected `a', `b', etc? for any given question.) Foreach test question used in the SLO assessment, there is acorrect response, one or more `bad' responses, and in mostcases, an `almost correct' response. Each question had fourchoices, total - one correct, two or three bad choices, and inmost cases, one `almost correct' choice.
Each test question that was chosen for SLO assessment was
09/19/2019 Page 283 of 318Generated by Nuventive Improve

Student LearningOutcomes (SLOs) Assessment Methods Assessment Data Summaries Enhancements
question from an in-class exam:About 60 percent of the studentschoose the correct response, withthe remainder of the chosenresponses distributed prettyevenly between the threeincorrect choices. Thisperformance level thus representsa `baseline' from whichimprovements can be sought.
Examples of low and high successrates on SLO-assessmentembedded questions can bedrawn from a number of differentparts of the `parameter space'represented by the overall pool ofassessed questions. In some cases,students will succeed at an SLO byremembering key facts or datathat they need in order to assess ahypothesis or track or predictsome change in the Earth system.In other cases, the key facts areremembered less well, resulting ina lower success rate on the SLO.To the extent that this iscorrelated with subject matter,the most difficult `memorychallenges' occur in the mostcomplex subjects covered inGeology 10, particularly thesubject of plate tectonics. Thissuggests that where the materialinvolves a large number of detailsthat have to be `kept straight',additional pedagogical emphasis isneeded.
Students in Geology 10 face other
evaluated in the following way: The percentage of studentschoosing the `correct', `almost', and `bad' choices werereported as a percentage of total responses. The totalnumber of tests used in the assessment was also recorded.For example, if 75 tests were used, this was reported as`N=75'.
The results of the tabulation(s) can be seen as a PDF file inthe `Related Documents'.
Student response data were tabulated for all three midtermexams (`E1', `E2', and `E3'), as well as for two questions onthe final exam.
On E1, a question about mineral cleavage was assessed. Thestudents were asked to imagine a friend who suggests thatminerals are made of atoms arranged in organized patterns.(This is, in fact, true.) They were further asked to imaginethat they, the students, have proposed breaking a mineralto check for cleavage. (This is, in fact, a good test of thefriend's hypothesis.) Question: What is a `fool you' mineralthat lacks cleavage? This question requires the students toknow enough about minerals and their cleavage to avoid animportant pitfall that might arise when testing the friend'shypothesis.
Student responses were about equally split between thecorrect choice (quartz, 39 percent), the `almost' response(pyroxene, which rarely displays its cleavage characteristicswell, 31 percent, and the two bad answers (feldspar, mica,which both show distinct cleavage).
The selected question from E2 asked the students to try andimagine examining layers of sedimentary rock in widely-separated areas. How might they determine whether thelayers in the two areas are of the same age? 60 percent ofthe students selected the best answer (finding index fossils),32 percent chose the various bad answers, and only 6percent chose the `almost' answer (finding fossils oforganisms with hard skeletal parts).
09/19/2019 Page 284 of 318Generated by Nuventive Improve

Student LearningOutcomes (SLOs) Assessment Methods Assessment Data Summaries Enhancements
Reflection (CLICK ON ? FOR INSTRUCTIONS): E1: It wouldbe desirable to see more students select the correctanswer. This is a case in which the students needed to havedone some straightforward memorization, and less thanhalf of them memorized the information correctly.Improving performance on this aspect of SLO 1 willprobably involve finding ways to motivate the students todo a better job of the `memorization' part of their studying.
E2: By choosing the correct answer 2-to-1 over theaggregate of both bad answers, students succeeded prettywell at SLO 1 in this case.
challenges as well, such asinterpreting visual cues fromdrawings, or visualizing scenariosdescribed to them in words. Thissuggests that additionalpedagogical emphasis may beneeded for all forms ofvisualization and visual patternrecognition.
Specific pedagogical actions can beundertaken to try and increasesuccess rates on SLOs. The mostattractive set of new teachingmethods falls under the headingof `peer instruction'. Pioneered byinstructors like Eric Mazur, aphysics professor at Harvard, theyinvolve students attempting toanswer conceptual questionsabout the material, and thenattempting to explain theiranswers to each other. Peer-instruction methods can takemany forms, such as `think-pair-share' exercises, and the use ofPersonal Response System(`clickers'). Research by instructorslike Mazur at Harvard, and anumber of instructors in Geologyand Astronomy at severaluniversities, have demonstrated(through research and data) thatpeer-instruction methods cansignificantly enhance studentunderstanding of material.
The Geology department hasalready done research on thesemethods, and has made
On E3, the tabulated question asked the students what*new* evidence revived the debate over continental drift,after the hypothesis had been rejected in the early 20thcentury? In this case, 71 percent of students selected one orthe other of the bad answers. 16 percent selected the`almost' answer, and only 13 percent selected the correctanswer (apparent polar-wander paths that did not matchfrom continent to continent).
The first tabulated question from the final exam asked thestudents to imagine examining an outcrop of igneous rock.What would constitute good evidence for an *intrusive*origin of the igneous rock? 64 percent of students selectedthe correct answer (an igneous dike cutting across otherrocks), 31 percent selected one or the other of the badanswers (descriptions of sedimentary rocks), and only 5percent selected the `almost' answer.
The second tabulated question from the final exam askedthe students to imagine examining a tilted sequence ofsedimentary beds. What might indicate that the beds wereoverturned, if such were the case? Student responses weresplit evenly between the correct answer (downward-finingin a sandstone bed) and the three bad answers(descriptions of sedimentary structures in *upright*orientations). (07/18/2012)
09/19/2019 Page 285 of 318Generated by Nuventive Improve
Student LearningOutcomes (SLOs) Assessment Methods Assessment Data Summaries Enhancements
E3: Clearly, the subject of plate tectonics is sufficientlycomplicated and detailed that students stand a fair chanceof not succeeding at SLO 1. It is probably worth examininghow the lectures are structured and presented, andconsidering using newer pedagogical methods, such asthose described under the category of `peer instruction'.
Final, question 1: By choosing the correct answer 2-to-1over the aggregate of both bad answers, studentssucceeded pretty well at SLO 1 in this case.
Final, question 2: It seemed clear from the 50-50 splitbetween correct and incorrect answers that the studentshad not done a sufficient job of `keeping straight' thedetails about sedimentary structures, and/or they had notcorrectly visualized the problem. Possible ways ofimproving performance on this type of question mightinclude giving them practice work of some sort, such asmaking drawings of sedimentary structures in tiltedsequences of beds, and exchanging them with otherstudents to analyze and interpret.Related Documents:Geol_10_SLO_1_W2011
preliminary efforts to experimentwith them. For example, in-classexperiments have been done inGeology 10 to try and use thePSME Division's set of clickers inclass. Thus far, these experimentshave mostly involved trying towork out the *logistical* details ofimplementing systems like thoseused at other schools. Given thefact that De Anza College does nothave graduate teaching assistantsor other resources, such as a 4-year school might have, theimplementation of peer-instruction methods can bedifficult. Additionally, whereas a 4-year school might easily be able toask its students to buy in-classtools like clickers, this would be adifficult thing to ask of ourstudents. Thus, it has beennecessary to experiment with therather basic set of clickersavailable in the PSME Division.New ways of implementing thistechnology, in which the studentsdo not buy or own their ownclickers, are in the process ofdevelopment.
While technology like `clickers' isonly one example of peer-basedinstruction, it is generally hopedthat experiments with peerinstruction and related pedagogycan lead to greater studentsuccess in the learning outcomesfor Geology 10. Experiments withthese methods over the next few
09/19/2019 Page 286 of 318Generated by Nuventive Improve

Student LearningOutcomes (SLOs) Assessment Methods Assessment Data Summaries Enhancements
years will hopefully yield data thatcan be compared with the 2010-2011 and 2011-2012 cycles for SLO1 and SLO 2. (07/18/2012)
Reflection (CLICK ON ? FOR INSTRUCTIONS): The questionused in this assessment required the students to envisiontesting a hypothesis. They are presented with thehypothesis that a particular rock sample is a metamorphicrock called *schist*, which forms when pre-existing rock(typically shale or mudstone) is exposed to high heat andpressure in the roots of a developing mountain range. Whatobservable characteristics should the sample show, if it is infact schist? It should show a foliation defined by aligned
Enhancement: Enhancement /Action:
This is a generalized Action planfor Enhancement of studentsuccess in the Student LearningOutcomes for Geology 10. It isbased on SLOAC results for oneyear of SLO 1 (2010-2011) and oneyear of SLO 2 (2011-2012).
Averaged over two school yearsand both SLOs, a broad patternexists for student performance ona typical 4-item multiple-choicequestion from an in-class exam:About 60 percent of the studentschoose the correct response, withthe remainder of the chosenresponses distributed prettyevenly between the threeincorrect choices. Thisperformance level thus representsa `baseline' from whichimprovements can be sought.
Examples of low and high successrates on SLO-assessmentembedded questions can bedrawn from a number of differentparts of the `parameter space'represented by the overall pool ofassessed questions. In some cases,students will succeed at an SLO byremembering key facts or data
Program Review Reporting Year: 2011-2012Target : Target MetThis SLO was assessed by tabulating the multiple-choiceresponses that the students selected on their tests. (TheParscore system made it possible to count how manystudents selected `a', `b', etc? for any given question.) Foreach test question used in the SLO assessment, there is acorrect response, one or more `bad' responses, and in mostcases, an `almost correct' response. Each question had fourchoices, total - one correct, two or three bad choices, and inmost cases, one `almost correct' choice.
Each test question that was chosen for SLO assessment wasevaluated in the following way: The percentage of studentschoosing the `correct', `almost', and `bad' choices werereported as a percentage of total responses. The totalnumber of tests used in the assessment was also recorded.For example, if 75 tests were used, this was reported as`N=75'.
The results of the tabulation(s) can be seen as image files inthe `Related Documents'.
For the question used in this assessment, about half of thestudents selected the correct answer, and about halfselected incorrect answers. (07/17/2012)
09/19/2019 Page 287 of 318Generated by Nuventive Improve

Student LearningOutcomes (SLOs) Assessment Methods Assessment Data Summaries Enhancements
mica crystals.Related Documents:Geol10_SLO_1_F2010_E2
that they need in order to assess ahypothesis or track or predictsome change in the Earth system.In other cases, the key facts areremembered less well, resulting ina lower success rate on the SLO.To the extent that this iscorrelated with subject matter,the most difficult `memorychallenges' occur in the mostcomplex subjects covered inGeology 10, particularly thesubject of plate tectonics. Thissuggests that where the materialinvolves a large number of detailsthat have to be `kept straight',additional pedagogical emphasis isneeded.
Students in Geology 10 face otherchallenges as well, such asinterpreting visual cues fromdrawings, or visualizing scenariosdescribed to them in words. Thissuggests that additionalpedagogical emphasis may beneeded for all forms ofvisualization and visual patternrecognition.
Specific pedagogical actions can beundertaken to try and increasesuccess rates on SLOs. The mostattractive set of new teachingmethods falls under the headingof `peer instruction'. Pioneered byinstructors like Eric Mazur, aphysics professor at Harvard, theyinvolve students attempting toanswer conceptual questions
09/19/2019 Page 288 of 318Generated by Nuventive Improve

Student LearningOutcomes (SLOs) Assessment Methods Assessment Data Summaries Enhancements
about the material, and thenattempting to explain theiranswers to each other. Peer-instruction methods can takemany forms, such as `think-pair-share' exercises, and the use ofPersonal Response System(`clickers'). Research by instructorslike Mazur at Harvard, and anumber of instructors in Geologyand Astronomy at severaluniversities, have demonstrated(through research and data) thatpeer-instruction methods cansignificantly enhance studentunderstanding of material.
The Geology department hasalready done research on thesemethods, and has madepreliminary efforts to experimentwith them. For example, in-classexperiments have been done inGeology 10 to try and use thePSME Division's set of clickers inclass. Thus far, these experimentshave mostly involved trying towork out the *logistical* details ofimplementing systems like thoseused at other schools. Given thefact that De Anza College does nothave graduate teaching assistantsor other resources, such as a 4-year school might have, theimplementation of peer-instruction methods can bedifficult. Additionally, whereas a 4-year school might easily be able toask its students to buy in-classtools like clickers, this would be a
09/19/2019 Page 289 of 318Generated by Nuventive Improve

Student LearningOutcomes (SLOs) Assessment Methods Assessment Data Summaries Enhancements
difficult thing to ask of ourstudents. Thus, it has beennecessary to experiment with therather basic set of clickersavailable in the PSME Division.New ways of implementing thistechnology, in which the studentsdo not buy or own their ownclickers, are in the process ofdevelopment.
While technology like `clickers' isonly one example of peer-basedinstruction, it is generally hopedthat experiments with peerinstruction and related pedagogycan lead to greater studentsuccess in the learning outcomesfor Geology 10. Experiments withthese methods over the next fewyears will hopefully yield data thatcan be compared with the 2010-2011 and 2011-2012 cycles for SLO1 and SLO 2. (07/18/2012)
Program Review Reporting Year: 2010-2011Target : Target MetQuestion 1 (data from 12 students):
Correct choice: 58 percentAlmost-correct choice: 25 percentIncorrect choices: 17 percent
Question 2 (data from 24 students):
Correct choice: 96 percentAlmost-correct choice: 4 percentIncorrect choices: 0 percent
Question 3 (data from 19 students):
09/19/2019 Page 290 of 318Generated by Nuventive Improve

Student LearningOutcomes (SLOs) Assessment Methods Assessment Data Summaries Enhancements
Reflection (CLICK ON ? FOR INSTRUCTIONS): As this wasthe first SLO assessed by the department, the assessmentdata have been examined for a baseline of target successdate. The first fact that is apparent in the data is thatsuccess percentages can vary greatly. In the case ofQuestion 2, virtually the entire class recognized the correctalternative hypothesis. For the other questions, slightlymore or less than half of the class chose the best answer,with most of the remaining students choosing the `almostcorrect' answer.
This raises a number of interesting questions regarding howstudent success on SLO tasks may arise. While the SLOs aredesigned to be represent important cognitive skills, it isalways possible for `skill acquisition' to be mimicked by`learning a story'. It is possible that in the case of some orall of these questions, the `story' behind how scientistsfigured out the relevant portion of the Earth system mighthave been more or less memorable for students. This could,in turn, depend on how the material was presented in class.
Correct choice: 42 percentAlmost-correct choice: 16 percentIncorrect choices: 42 percent
Question 4 (data from 24 students):
Correct choice: 42 percentAlmost-correct choice 1: 42 percentAlmost-correct choice 2: 16 percentIncorrect choice: 0 percent (05/01/2012)
GEOL10_SLO_3 - Use observationsfrom the crust and lithosphere of theEarth to determine geologic history athand-sample, outcrop, local, andregional scales.SLO Status: Active
Target for Success: 50% of studentsanswering this question select thecorrect multiple-choice answer.
Enhancement: It could be arguedthat the reasonably high successrate for this question reinforcesthe need to go over examples inlecture, as well as in lab. If timepermitted, even more examplescould be provided to the students- perhaps as anonymous in-class
Program Review Reporting Year: 2018-2019Target : Target MetAssessment Data Summary, end of 2018-2019Prepared by Marek CichanskiTo assess GEOL10_SLO_3, I chose a multiple-choicequestion from the second (of three) midterm exams frommy Geology 10 class.Background Information: My multiple-choice questions
Exam - Course Test/Quiz -Embedded Assessment: Questionswill be chosen from exams, whichare relevant to SLO 3 for Geology 10.
09/19/2019 Page 291 of 318Generated by Nuventive Improve
Student LearningOutcomes (SLOs) Assessment Methods Assessment Data Summaries Enhancements
Reflection (CLICK ON ? FOR INSTRUCTIONS): Students didreasonably well on this question. They had been givenexamples of unconformities in the textbook and in lecture,and we had gone through some whole-class problem-solving examples of them in the lecture class. Additionally,they had been given exercises of this type in the laboratoryportion of the class.
voting questions - to try and getthe success rate even higher.(06/30/2019)
typically have four choices, one of which (the best answer)gets full points. There is usually a second-best choice, whichgets about 3/4 of the full points, and two "wrong answer"choices that get 1/2 of the full points. This partial-creditsystem accomplishes roughly the same thing as "curving"the grades, while still using a fixed grading scale, and thusavoids putting the students in direct competition with eachother for grades.
This SLO is concerned with determining geologic historyfrom evidence such as would be collected by a geologistdoing field work. On the second midterm, I asked thestudents a "slide question", in which they were shown aview of a portion of the Grand Canyon. They had to choosethe statement that best describes the geologic sequence ofevents that led to the scene shown in the slide. Historicalinterpretation of this type often includes the identificationof features called "unconformities", which represent timegaps in the geologic record, usually due to erosion. Thecorrect answer was one in which the students recognizedan unconformity between the tilted and beveled Hakataishale and the flat-lying Tapeats sandstone above it. 73% ofstudents picked the best answer, and the remaining 27% ofstudents picked one of the three wrong answers. (Therewas no "2nd-best" answer in this case.) (06/30/2019)
Enhancement: Piecing togetherthe geologic history of an area canbe broken down into sub-tasks,like the one in the question thatwas assessed. It might be usefulfor the students to perform moreexamples of these sub-tasks, as aform of practice question and,
Program Review Reporting Year: 2018-2019Target : Target MetTo assess this SLO in Fall 2018, a multiple-choice questionfrom the final examination was selected. The questionasked how a geologist might determine whether twowidely-separated sequences of sedimentary rocks are thesame age or not. (Answer: Look for the same assemblage offossils in each sequence.) This type of geologic evaluation,
09/19/2019 Page 292 of 318Generated by Nuventive Improve

Student LearningOutcomes (SLOs) Assessment Methods Assessment Data Summaries Enhancements
Reflection (CLICK ON ? FOR INSTRUCTIONS): It was good tosee that the percentage of students correctly answering thequestion exceeded the target percentage. Naturally, ofcourse, it would be desirable to try and increase thatpercentage if possible.
more generally, as a type offormative assessment during classtime. This might be done by posingsample questions to the class andcollecting real-time anonymousresponses with some type of in-class anonymous voting system.(03/20/2019)
called correlation, is integral to the process of working outthe geologic history of a portion of the Earth's crust.Of the 45 students who took the exam, 68% of themanswered the question correctly. (03/20/2019)
Reflection (CLICK ON ? FOR INSTRUCTIONS): 32 out of 52students answered this question correctly. It appears that areasonably large number of students remembered andwere able to apply a mental model of the flow pattern in aglacier.
Program Review Reporting Year: 2012-2013Target : Target MetSelected Question: Students were asked to evaluate theselection of a site on a glacier where they could find theoldest ice. (04/22/2014)
Reflection (CLICK ON ? FOR INSTRUCTIONS): 14 out of 52students answered this question correctly. This may be dueto the complex nature of how ophiolite complexes form.Alternatively, it may be due to the counterintuitive natureof ophiolites, since they are ocean-crustal rock exposed onland.
Program Review Reporting Year: 2012-2013Target : Target Not MetSelected Question: If you found an ophiolite, what does thisimply about the geologic history of the region in question?(Answer: The ophiolite represents an ocean basin that wasclosed by plate collision.) (04/22/2014)
Program Review Reporting Year: 2012-2013Target : Target MetSelected Question: Students were presented with a scenarioin which they are examining an outcrop with more than onerock type, including igneous rock. To interpret part of thehistory of this part of the Earth's crust, students have topredict the type of evidence they might see that wouldimply an intrusive origin for the igneous rock. (Answer: It is
09/19/2019 Page 293 of 318Generated by Nuventive Improve

Student LearningOutcomes (SLOs) Assessment Methods Assessment Data Summaries Enhancements
Reflection (CLICK ON ? FOR INSTRUCTIONS): 53 out of 69students answered the question correctly. This seems tosuggest that a reasonably large fraction of the studentswere able to remember and apply the principle of relativedating.
a dike, which cuts across older rock layers.) (04/22/2014)
Reflection (CLICK ON ? FOR INSTRUCTIONS): 33 out of 70students answered this correctly. This is below the 50%target threshold set for the first SLOAC / PLOAC cycle. Therelatively low success rate for this question may be due tothe fact that blueschist is an exotic type of metamorphicrock that is only briefly discussed in class.
Program Review Reporting Year: 2012-2013Target : Target Not MetSelected Question: Students were asked to imagine thatthey were examining an outcrop of blueschist (an exotichigh-pressure, low-temperature metamorphic rock). Whatis the geohistorical significance of the fact that this rock,which formed underground, is exposed at the Earth'ssurface? (Answer: Uplift and erosion has exposed the rocksafter they formed.) (04/22/2014)
Reflection (CLICK ON ? FOR INSTRUCTIONS): 28 out of 52students answered this question correctly. This is just overthe 50% criterion selected for the first SLOAC / PLOAC cycle.It appears that it is challenging for students to visualize theappearance of a sedimentary structure after more than 90degrees of rotation.
Program Review Reporting Year: 2012-2013Target : Target MetSelected Question: Students were asked to imagine lookingat a layer of sandstone that has been tilted more than 90degrees, and evaluate the type of evidence that would berequired in order to determine that more than 90 degreesof tilting had taken place. (Answer: Graded beds in whichthe grains get smaller downward, instead of upward as isthe usual pattern.) (04/22/2014)
Program Review Reporting Year: 2012-2013Target : Target Not MetSelected Question: Students were asked to imagine looking
09/19/2019 Page 294 of 318Generated by Nuventive Improve

Student LearningOutcomes (SLOs) Assessment Methods Assessment Data Summaries Enhancements
Reflection (CLICK ON ? FOR INSTRUCTIONS): 34 out of 69students answered this question correctly. This is just underthe 50% criterion selected for the first SLOAC / PLOAC cycle.It appears that it is challenging for students to visualize theappearance of a sedimentary structure after more than 90degrees of rotation.
at a layer of sandstone that has been tilted more than 90degrees, and evaluate the type of evidence that would berequired in order to determine that more than 90 degreesof tilting had taken place. (Answer: Graded beds in whichthe grains get smaller downward, instead of upward as isthe usual pattern.) (04/22/2014)
Reflection (CLICK ON ? FOR INSTRUCTIONS): 53 out of 61students answered this question correctly, showing that areasonable number of them were able to evaluate whatkind of evidence would be suitable for supporting thehypothesis of continental drift.
Program Review Reporting Year: 2012-2013Target : Target MetSelected Question: In addition to the `fits' between thecontinents on either side of the Atlantic, what evidence didWegener use to support his hypothesis of continental drift?(Answer: Late Paleozoic [and older] geology) (04/22/2014)
Reflection (CLICK ON ? FOR INSTRUCTIONS): 48 out of 52students answered this question correctly. This shows thatmost students were able to determine which rock unit isolder (or younger) than another unit, based on the contactrelationships between the units.
Program Review Reporting Year: 2012-2013Target : Target MetSelected Question: Students were given a description of asedimentary rock layer, which sits unconformably onmetamorphic basement rock, with both units cut by anigneous dike. The students had to use the ages of themetamorphic rock and the dike to constrain the age of thesedimentary rock. (04/22/2014)
Program Review Reporting Year: 2012-2013Target : Target MetSelected Question: Students were given a description of a
09/19/2019 Page 295 of 318Generated by Nuventive Improve
Student LearningOutcomes (SLOs) Assessment Methods Assessment Data Summaries Enhancements
Reflection (CLICK ON ? FOR INSTRUCTIONS): 64 out of 70students answered this question correctly. This shows thatmost students were able to determine which rock unit isolder (or younger) than another unit, based on the contactrelationships between the units.
sedimentary rock layer, which sits unconformably onmetamorphic basement rock, with both units cut by anigneous dike. The students had to use the ages of themetamorphic rock and the dike to constrain the age of thesedimentary rock. (04/22/2014)
Reflection (CLICK ON ? FOR INSTRUCTIONS): 46 out of 52students answered this question correctly. It appears that areasonable number of students can apply Steno's 3rdprinciple (sometimes called `Original Lateral Continuity' or`Concealed Stratification') to envision one or more geologicevents that occurred AFTER a rock unit formed.
Program Review Reporting Year: 2012-2013Target : Target MetSelected Question: Students were asked what are theimplications of visible, eroded edges of layers ofsedimentary rock. (Answer: Erosion has occurred after thelayers were deposited.) (04/22/2014)
Reflection (CLICK ON ? FOR INSTRUCTIONS): 55 out of 70students answered this question correctly. It appears that areasonable number of students can apply Steno's 3rdprinciple (sometimes called `Original Lateral Continuity' or`Concealed Stratification') to envision one or more geologicevents that occurred AFTER a rock unit formed.
Program Review Reporting Year: 2012-2013Target : Target MetSelected Question: Students were asked what are theimplications of visible, eroded edges of layers ofsedimentary rock. (Answer: Erosion has occurred after thelayers were deposited.) (04/22/2014)
Program Review Reporting Year: 2012-2013Target : Target MetSelected Question: Students were told to imagine that theywere hiking in a small mountain range in Washington Statecalled the Goat Rocks, made of lava flows and deposits of
09/19/2019 Page 296 of 318Generated by Nuventive Improve
Student LearningOutcomes (SLOs) Assessment Methods Assessment Data Summaries Enhancements
Reflection (CLICK ON ? FOR INSTRUCTIONS): 45 out of 69students correctly answered this question. It appears that areasonable number of students can extrapolate from adescription of the present scene to a plausible picture ofthe landscape at an earlier point in its history.
volcanic ash. They were asked to interpret what this arealooked like before extensive erosion. Answer: Astratovolcano, like nearby Mt. Rainier. (04/22/2014)
Reflection (CLICK ON ? FOR INSTRUCTIONS): 59 out of 76students correctly answered this question. It appears that areasonable number of students can extrapolate from adescription of the present scene to a plausible picture ofthe landscape at an earlier point in its history.
Program Review Reporting Year: 2012-2013Target : Target MetSelected Question: Students were told to imagine that theywere hiking in a small mountain range in Washington Statecalled the Goat Rocks, made of lava flows and deposits ofvolcanic ash. They were asked to interpret what this arealooked like before extensive erosion. Answer: Astratovolcano, like nearby Mt. Rainier. (04/22/2014)
GEOL10_SLO_4 - Apply scientificmethodology and geologic principlesto analyze the impact of the Earthsystem on humanity, from specificnatural hazards and the availability,use, and distribution of Earthresources.
Planned Assessment Quarters: 2013-14 2-Fall, 2013-14 3-Winter
SLO Status: Active
Target for Success: 50% or more ofstudents will answer this questioncorrectly.
Enhancement: The best thing I canthink of would be to give thestudents several exampleproblems, perhaps in the form of aseries of in-class anonymousvoting questions, or perhaps in theform of a take-home, multiple-choice worksheet. (06/30/2019)
Program Review Reporting Year: 2018-2019Target : Target Not MetAssessment Data Summary, end of 2018-2019Prepared by Marek CichanskiTo assess GEOL10_SLO_4, I chose a multiple-choicequestion from the first (of three) midterm exams from myGeology 10 class.Background Information: My multiple-choice questionstypically have four choices, one of which (the best answer)gets full points. There is usually a second-best choice, whichgets about 3/4 of the full points, and two "wrong answer"choices that get 1/2 of the full points. This partial-creditsystem accomplishes roughly the same thing as "curving"the grades, while still using a fixed grading scale, and thusavoids putting the students in direct competition with eachother for grades.
This SLO is concerned with using geologic principles to
Exam - Course Test/Quiz -Embedded Assessment: Questionswill be chosen from exams, whichare relevant to SLO 3 for Geology 10.
09/19/2019 Page 297 of 318Generated by Nuventive Improve

Student LearningOutcomes (SLOs) Assessment Methods Assessment Data Summaries Enhancements
Reflection (CLICK ON ? FOR INSTRUCTIONS): I wassurprised that more students did not choose the correctdrilling target. The problem used on the test was verysimilar to the example that we went over in the lecture onoil geology.
identify geologic hazards and resources. The question that Ichose to assess this SLO asked the students to look at ahypothetical geologic cross-section and choose which (offour possible underground locations) would be the bestdrilling target for oil. 54% of students chose the best target,15% chose the second-best target, and 31% chose one ofthe wrong answers. (06/30/2019)
Reflection (CLICK ON ? FOR INSTRUCTIONS): 38 out of 45students answered this question correctly. A large fractionof students were able to answer a relatively complicated,hypothetical `application' question, based on basicknowledge of how reservoir rocks work.
Program Review Reporting Year: 2013-2014Target : Target MetWhen exploring for oil or natural gas, why would a heavilyquartz-cemented sandstone make a poor reservoir rock?(Answer: The quartz cement fills the pore spaces toothoroughly, reducing the rock's ability to hold fluids.)(04/23/2014)
Reflection (CLICK ON ? FOR INSTRUCTIONS): 15 out of 45students answered this question correctly. The lowpercentage of correct answers is puzzling in this case.Although the students were presented with the correctinformation about the definition of an epicenter, they werelargely unable to recognize such a scenario in a list. Thisshows that what seems like straightforward application ofknowledge can be more complicated than initiallyexpected.
Program Review Reporting Year: 2013-2014Target : Target Not MetSelected Question: During a Bay Area earthquake, if therocks begin breaking underneath Cupertino, where is theepicenter? (Answer: Cupertino) (04/23/2014)
Program Review Reporting Year: 2013-2014
09/19/2019 Page 298 of 318Generated by Nuventive Improve
Student LearningOutcomes (SLOs) Assessment Methods Assessment Data Summaries Enhancements
Reflection (CLICK ON ? FOR INSTRUCTIONS): 26 out of 42students answered this question correctly. A reasonablenumber of them were able to distinguish an aftershockfrom one of the individual wave onsets (such as the onsetof the P or S waves).
Target : Target MetDuring a Bay Area earthquake (or any earthquake), what arethe characteristics of an aftershock? (Answer: An aftershockis a separate earthquake, with its own P, S, and surfacewaves.) (04/23/2014)
Reflection (CLICK ON ? FOR INSTRUCTIONS): 23 out of 44students answered this question correctly. This was barelyabove the first-SLOAC-cycle baseline target of 50% correct.This suggests a problem in the separation of variables:What, specifically, might have caused relatively fewstudents to select the correct answer? Difficultyremembering the relevant facts? The fact that they werebeing asked to envision a prior-history scenario that no onewas around to see?
Program Review Reporting Year: 2013-2014Target : Target MetWhat does the sediment that makes up a typical oilreservoir rock look like before it gets lithified into rock?(Answer: Grains of sand) (04/23/2014)
Reflection (CLICK ON ? FOR INSTRUCTIONS): 37 out of 45students answered this question correctly. It appears that areasonably large proportion of students were able to applybasic knowledge (of the influence of silica content onmagma viscosity) to a hypothetical scenario.
Program Review Reporting Year: 2013-2014Target : Target MetSelected Question: If it were possible to alter thecharacteristics of a lava being erupted by a volcano (it'snot), what alteration would make an eruption like the 1980eruption of Mt. St. Helens LESS explosive? (Answer: Areduction in the silica content of the lava) (04/23/2014)
Program Review Reporting Year: 2013-2014Target : Target MetSelected Question: If one wants to build a house with a view
09/19/2019 Page 299 of 318Generated by Nuventive Improve

Student LearningOutcomes (SLOs) Assessment Methods Assessment Data Summaries Enhancements
Reflection (CLICK ON ? FOR INSTRUCTIONS): 38 out of 45students answered this question correctly. This seems toshow that a reasonably fraction of students can recognizevolcanic hazards and evaluate strategies for minimizingthem.
of a stratovolcano like Mt. Etna or Mt. St. Helens, whatshould one consider doing? (Answer: Building at aconsiderable distance from the volcano, to reduce hazardsfrom lahars and pyroclastic flows.) (04/23/2014)
Reflection (CLICK ON ? FOR INSTRUCTIONS): 23 out of 33students answered this question correctly. The relevantmaterial is covered near the end of the quarter. This raisesthe interesting possibility that students might have aneasier time remembering and applying concepts that werecovered recently. Such a conclusion is not certain, however,since other assessments of this SLO have had high successrates (e.g. question about volcanic hazards), despite comingfrom the beginning of the quarter.
Program Review Reporting Year: 2013-2014Target : Target MetSelected Question: Imagine that your water well runs dry.How might your neighbor (who has installed a well thatpumps at a very high flow rate) have caused this? (Answer:Their well has caused a cone of depression in the water-table surface, causing the water table to drop below thebottom of your well.) (04/23/2014)
Reflection (CLICK ON ? FOR INSTRUCTIONS): 30 out of 33students answered this question correctly. It is possible thatthe vivid nature of volcanic hazards, and/or their directbearing on human life and safety, may have made thismaterial easier to remember and this question easier toanswer correctly.
Program Review Reporting Year: 2013-2014Target : Target MetSelected Question: From a list of possible hazards, whichones are likely to come from a stratovolcano? (Answer:Lahars and pyroclastic flows) (04/23/2014)
Program Review Reporting Year: 2013-2014Target : Target Met
09/19/2019 Page 300 of 318Generated by Nuventive Improve

Student LearningOutcomes (SLOs) Assessment Methods Assessment Data Summaries Enhancements
Reflection (CLICK ON ? FOR INSTRUCTIONS): 25 out of 33students answered this question correctly. In this case,answering this question may have been a fairlystraightforward matter of factual recall, by rememberingthe lecturer's description of how he participated in this sortof work during a job he held between college and graduateschool. This raises the interesting question of whether ornot a topic can be understood and remembered moreeffectively if it can be related to personal experience.
Selected Question: In a case of groundwater contamination,such as from leaking underground gasoline storage tanks,how can the groundwater be cleaned most effectively?(Answer: By drilling wells and pumping & treating thegroundwater.) (04/23/2014)
Reflection (CLICK ON ? FOR INSTRUCTIONS): 19 out of 67students answered this question correctly. In this case, thelow percentage of correct responses may not be as much amatter of pedagogical approach as simply a matter of nothaving covered the Christchurch example in much detail.This was an example of an item from the course's`What2Know' list that was briefly described in the book, butnot in the lecture. Although not all topics from the`What2Know' list can be discussed in detail in class, suchcoverage probably increases the number of students whowill get a question correct.
Program Review Reporting Year: 2013-2014Target : Target Not MetSelected Question: Students were asked what causedflooding by water, mud, and sand (that came up out of theground) during the 2011 earthquakes in Christchurch, NewZealand. (Answer: Liquefaction of soil due to strong groundshaking.) (04/23/2014)
Program Review Reporting Year: 2013-2014Target : Target MetSelected Question: Students were given a set of geologicfactors that might conceivably affect the development of anoil field. They had to assess the relative importance of thesefactors, and select the one that is NOT important forforming an economical deposit of hydrocarbons. (Answer:Heating by a plutonic intrusion) (04/23/2014)
09/19/2019 Page 301 of 318Generated by Nuventive Improve

Student LearningOutcomes (SLOs) Assessment Methods Assessment Data Summaries Enhancements
Reflection (CLICK ON ? FOR INSTRUCTIONS): 47 out of 70students answered this question correctly. Although thepercentage would ideally be higher, it shows that at leastsome of the students were able to integrate ideas fromother portions of the course (such as the section onmetamorphism) into an analysis of the factors necessary forgenerating oil and gas.
Reflection (CLICK ON ? FOR INSTRUCTIONS): Starting in Fall2013, the Geology lecture about the geology of oil andnatural gas was modified to include a discussion of new oil-extraction techniques. 48 out of 70 students answered thisquestion correctly, showing that a reasonable number ofthem can use their knowledge of these new techniques toselect a suitable drilling target, as though they were oil-exploration geologists.
Program Review Reporting Year: 2013-2014Target : Target MetSelected Question: When trying to extract oil using the newtechnique of hydrofracturing, is limestone a good targetrock? (Answer: No, because it's not a typical hydrocarbonsource rock.) (04/23/2014)
Reflection (CLICK ON ? FOR INSTRUCTIONS): 46 out of 76students answered this question correctly. It appears that areasonable number of students were able to recall thedetails of what a pyroclastic flow is and why it represents asignificant hazard.
Program Review Reporting Year: 2013-2014Target : Target MetSelected Question: Why is a pyroclastic flow so hazardous?Students were expected to be able to evaluate and selectthe correct reason why this volcanic hazard is so significant.(Answer: It is a mixture of hot volcanic ash and hot volcanicgases.) (04/22/2014)
09/19/2019 Page 302 of 318Generated by Nuventive Improve

GEOL 20:General Oceanography
Student LearningOutcomes (SLOs) Assessment Methods Assessment Data Summaries Enhancements
GEOL20_SLO_1 - Apply the principlesof scientific methodology to testhypotheses as to how the Earth'soceans work as an integrated system.SLO Status: Active
Exam - Course Test/Quiz - Objectivetesting of student's ability torecognize scientific methodology inposed situations in general that latercan be related to natural systemssuch as Earth's oceans.
Sample Questions from SubjectMastery Tests
The following questions have beenextracted from Subject MasteryTests and mapped onto course SLOsin General Oceanography. They arerepresentative of questions asked ineach of the classes during the termsexamined.
Science and the Scientific MethodBasic Knowledge & GeneralUnderstanding
Questions 1 through 5: MultipleChoice: "Mental Warm Up"1. Two fellow students in ahumanities class on campus noticethat their professor glares everytime he sees the young woman inthe front row texting beneath herdesk. Taking notice of the professor’s response to the young woman’sbehavior would be an example of a(n):a. experimentb. theoryc. hypothesisd. observatione. scientific law or principle
09/19/2019 Page 303 of 318Generated by Nuventive Improve
Student LearningOutcomes (SLOs) Assessment Methods Assessment Data Summaries Enhancements
2. The same young womansits in the front row of a historyclass, which is also attended by yourtwo friends. They notice in this classas well her history professor seemsupset with her when she uses hercell phone beneath her desk to text.Noticing that other people in theback row are texting as well, theyconclude that the professors justhave it “out for this student.” Yourfriends’ conclusion would be anexample of a(n):a. experimentb. theoryc. hypothesisd. observatione. scientific law or principle
3. Your friends decide to testtheir conclusion by looking at theyoung woman’s test scores fromthese two classes. As a control, theydecided to ask the other students inthe front rows about their grades aswell. This test of their conclusion isa(n):a. experimentb. theoryc. hypothesisd. observatione. scientific law or principle
4. The data showed thatevery single person sitting in thefront row of each of these classesreceived an “A” on the first test. Theyoung woman was given an “F” byboth instructors. Your friends felt
09/19/2019 Page 304 of 318Generated by Nuventive Improve

Student LearningOutcomes (SLOs) Assessment Methods Assessment Data Summaries Enhancements
Target for Success: In statisticalanalysis of correct responses,students answering these kinds ofsituational questions regardingscientific methodology are expectedto exceed a mastery of over 80%.
Related Documents:G20_SLO_assessment01.docx
Comments/Notes: Questions aresimilar from term to term but notthe same. The idea is to getstudents to first familiarizethemselves with recognizingscientific methodology in morefamiliar situations before applyingthat understanding to the oceansystem.
vindicated as the results of theirwork supports their conclusion thatthe two professors are “out to getthis young woman.” The methodemployed to consider whether ornot the two professors were biasedagainst this student:a. is an example of thinkingby imitation.b. is based on faith.c. is an example of scientificmethodology.d. is an example ofargumentative reasoning.
5. Hint to question 4 above,does scientific methodologyguarantee a correct answer?a. YESb. NO
GEOL20_SLO_2 - Use observations Exam - Course Test/Quiz - Objective
09/19/2019 Page 305 of 318Generated by Nuventive Improve

Student LearningOutcomes (SLOs) Assessment Methods Assessment Data Summaries Enhancements
and data to characterize the dynamicEarth processes that act to shape theocean floor and analyze the record ofthese processes within marinesediments and oceanic crust.
SLO Status: Active
Target for Success: Target forsuccess for this SLO is 75% forstudent populations active in GEOL20 classes.Related Documents:G20_SLO_assessment01.docx
testing questions of multiple typesare used in course Subject MasteryTest. Examples of questions coveringSLO_2 are shown can be found in theattached document along withanalysis of three terms of testing.
GEOL20_SLO_3 - Analyze the dynamicmovement of the water column ofthe oceans, through an application ofthe physical principles of oceancurrents, waves, and tides and theireffect on coastal systems andprocesses.
SLO Status: Active
Target for Success: Target forsuccess for the GEOL 20 studentpopulation participating in SubjectMastery Testing is 75%.Related Documents:G20_SLO_assessment01.docx
Exam - Course Test/Quiz - Objectivetesting questions of multiple typesare used in course Subject MasteryTest. Examples of questions coveringSLO_3 are shown can be found in theattached document along withanalysis of three terms of testing.
GEOL20_SLO_4 - Apply scientificmethodology and the principles ofoceanography to analyze the impactof the ocean system on humanity,from specific natural hazards and theavailability, use, and distribution ofocean resources.SLO Status: Active Target for Success: Target for
success of GEOL 20 studentsparticipating in Subject Mastery
Exam - Course Test/Quiz - Objectivetesting questions of multiple typesare used in course Subject MasteryTest. Examples of questions coveringSLO_4 can be found in the attacheddocument along with analysis ofthree terms of testing.
09/19/2019 Page 306 of 318Generated by Nuventive Improve

Student LearningOutcomes (SLOs) Assessment Methods Assessment Data Summaries Enhancements
Testing is 75% accurate responses totest questions.
Related Documents:G20_SLO_assessment01.docx
Comments/Notes: Attachmentshows only a small sample ofquestions in this area related tocoastal hazards. This SLO area hasmultiple assessment strategies inplace.
Target for Success: It is expectedthat 90% of the student populationdemonstrate a knowledge of coastalprocesses and the impact of theseprocesses on coastal habitation,within the specific requirements ofthe activity.Related Documents:Introductory Coastal Workshop
Laboratory Project - This is a fieldproject done by oceanographystudents using parts of the SanMateo County Coast as a naturalfield laboratory. Students are givenan assignment to consider naturalbeach processes as these impacthuman habitation of the CaliforniaCoast. Project is turned in andreviewed for accuracy ofmeasurements and for clarity ofconclusions and application tomaterial learned in the third unit ofthe oceanography course.
09/19/2019 Page 307 of 318Generated by Nuventive Improve

Dept - (PSME) Meteorology
Assessment: Course/Service Four Column
MET 10:Weather and Climate Processes
Student LearningOutcomes (SLOs) Assessment Methods Assessment Data Summaries Enhancements
MET10_SLO_1 - Analyze and explainthe objective techniques used bysynoptic meteorologists andclimatologists to forecast our planet'sweather and to predict futurechanges in our planet's climate. .SLO Status: Active
Target for Success: Target is 85%accuracy
Reflection (CLICK ON ? FOR INSTRUCTIONS): Target met.Course is an introductory physical sciences survey course.It is designed to stimulate interest in the sciences byfocusing on student success.
Program Review Reporting Year: 2011-2012Target : Target MetQuestion 5 - 91%Question 6 - 98%Question 7 - 98%Question 9 - 98%Question 16 - 100%Average = 97% (01/09/2014)
Exam - Course Test/Quiz - TestQuestions - 10 SLOAC AssessmentQuestions incorporated into finalexam.
Target for Success: 80% of studentswho attempt the question will earn ascore of 7 or higher out of 10
Reflection (CLICK ON ? FOR INSTRUCTIONS): Target wasmet.
Enhancement: Incorporate morediscussion activities in both face-to-face and online sections thatallow students to openly evaluatemeasurement and forecasttechniques used bymeteorologists. (02/20/2018)
Program Review Reporting Year: 2017-2018Target : Target MetThe Assessment was given in 2 sections of Met 10. Oneface-to-face section and the other section was online
Results: 22 of 26 (84.6%) were successful (02/20/2018)
Reflection (CLICK ON ? FOR INSTRUCTIONS): We felt thatthe primary reason why the target was not met wasbecause of a lack of active discussion regarding the
Enhancement: Incorporateadditional discussion questionsregarding objective forecastingtechniques into onlineassignments. (03/06/2018)
Program Review Reporting Year: 2017-2018Target : Target Not MetOnline: 40 of 51 (78.4%) were successful (02/20/2018)
Exam - Course Test/Quiz - WrittenQuestion included on MidtermExam.
09/19/2019 Page 308 of 318Generated by Nuventive Improve
Student LearningOutcomes (SLOs) Assessment Methods Assessment Data Summaries Enhancements
objective techniques used. The techniques were presentedprimarily through video lectures without any real dialogueon why they are necessary.
Target for Success: 80% of Studentswill answer this question correctly.
Reflection (CLICK ON ? FOR INSTRUCTIONS): The targetwas met.
Enhancement: While the targetwas met, there is still room forimprovement. Enhancements willinclude additional discussion ofisobar analysis and the pressuregradient force. (05/02/2018)
Program Review Reporting Year: 2017-2018Target : Target Met92% of students answered this question correctly.(02/12/2018)
Exam - Course Test/Quiz - Mid-termExam Question - “Tightly packedisobars produce _____ pressuregradient forcesand _____ winds.”
Target for Success: 80% of studentswill answer this question correctly
Reflection (CLICK ON ? FOR INSTRUCTIONS): Target Met.
Enhancement: While the targetwas met, not everyone correctlyanswered the question.Enhancements will includeadditional activities identifyingand distinguishing different typesof thunderstorms. (05/02/2018)
Program Review Reporting Year: 2017-2018Target : Target Met98% of students answered this question correctly.(03/26/2018)
Exam - Course Test/Quiz - FinalExam Question – “At what time ofday is an air mass thunderstormmore likely todevelop?”
MET10_SLO_2 - Assess and critiquethe impact of meteorology andclimatology as sciences on local,national and international economic,environmental, ethical and politicalissues including climate change.SLO Status: Active Target for Success: Target is 85%
accuracy.Reflection (CLICK ON ? FOR INSTRUCTIONS): Target met.Course is an introductory level physical sciences surveycourse. It is designed to stimulate interest in the sciences byfocusing on student success.
Program Review Reporting Year: 2011-2012Target : Target MetQuestion 22 = 98%Question 31 = 96%Question 32 = 97%Question 34 = 97%Question 43 = 50%Average is 87% (01/09/2014)
Exam - Course Test/Quiz - TestQuestions - 10 SLOAC AssessmentQuestions incorporated into finalexamination for the course.Questions 22,31 32, 34 and 43 forSLOAC 2.
Target for Success: Class average oneach of the assignment questions
Enhancement: The departmentplans to introduce a morethorough unit in the course thatcovers the role of science indeveloping local, regional, andinternational climate policies andto expand the group activity into amore involved project.(03/20/2018)
Program Review Reporting Year: 2017-2018Target : Target Met16 students participated in the activityAverages of 5 questions:Question 1: (100%)Question 2: (91%)Question 3: (100%)Question 4: (72%)Question 5: (100%)
Project - An in-class groupassignment where students answerquestions explaining the role thatMeteorologists have played informing local/regional/internationalclimate policies (e.g. ParisAgreement).
09/19/2019 Page 309 of 318Generated by Nuventive Improve

Student LearningOutcomes (SLOs) Assessment Methods Assessment Data Summaries Enhancements
greater than 70% (7/10)Reflection (CLICK ON ? FOR INSTRUCTIONS): Target Met.However, only 16 students participated in the activity,which was entirely in-class (absent students were unable toparticipate). As a result, the department feels that therecould be great variation from class to class with regards tothe success rate. While enhancements will be suggestedbelow, the department plans on re-assessing this SLO innext quarter's face-to-face Meteorology course in order tofeel more confident with the results.
Average: 92% (03/20/2018)
Reflection (CLICK ON ? FOR INSTRUCTIONS): The access toonline resources has allowed many of our students gain abetter understanding of Global Climate Change policy.Using these resources will be helpful in further enhancingthis assessment and coverage of this outcome.
Enhancement: Expand thisassignment into a course projectthat will allow students more timeto explore climate change policy.(05/02/2018)
Program Review Reporting Year: 2017-2018Target : Target Met41 Students participated in the assessment with an averageof 90% (9/10) (03/16/2018)
Target for Success: 80% of studentswill answer this question correctly.
Reflection (CLICK ON ? FOR INSTRUCTIONS): Target Met.
Enhancement: Enhancements willinclude additional examples ofwhat latitudes receive the mostintense solar radiation.(05/02/2018)
Program Review Reporting Year: 2017-2018Target : Target Met94% of students answered this question correctly.(02/12/2018)
Exam - Course Test/Quiz - Mid-termExam Question – “For maximumwinter warmth, in the NorthernHemisphere, largewindows in a house should face?
Target for Success: 80% of studentswill answer this question correctly
Reflection (CLICK ON ? FOR INSTRUCTIONS): In thisassessment, it was clear that our students were well awareof our role as a carbon dioxide emitter. However, seeing asthere was a 100% success rate, the department plans to usedifferent assessment questions in the future in order toidentify and "patch up" other unapparent weaknesses inthis outcome.
Enhancement: Since thisassessment had 100% success, thedepartment plans on identifyingother areas through assessmentthat need enhancement.(05/02/2018)
Program Review Reporting Year: 2017-2018Target : Target Met100% of students answered this question correctly.(03/26/2018)
Exam - Course Test/Quiz - FinalExam Question – “Which country isthe world leader in Carbon Dioxideemissions?”
09/19/2019 Page 310 of 318Generated by Nuventive Improve

MET 10L:Meteorology Laboratory
Student LearningOutcomes (SLOs) Assessment Methods Assessment Data Summaries Enhancements
MET10L_SLO_1 - Assess and defendthe analysis and decision-making skillsemployed by meteorologists todiagnose air patterns, understand airmotions and predict futureatmospheric conditions.SLO Status: Active_Pending_Revision
09/19/2019 Page 311 of 318Generated by Nuventive Improve

MET 20L:Climate Studies Laboratory
Student LearningOutcomes (SLOs) Assessment Methods Assessment Data Summaries Enhancements
MET20L_SLO_1 - To identify theprimary reasons for studying Earth'sclimate system and how it functionsand to become more aware of thesignificance of climate, climatevariability and climate change for ourwell being wherever we live.SLO Status: Course Not CurrentlyTaughtOutcome Creation Date: 09/12/2013
09/19/2019 Page 312 of 318Generated by Nuventive Improve
Dept - (PSME) Engineering
Assessment: Course/Service Four Column
ENGR 10:Introduction to Engineering
Student LearningOutcomes (SLOs) Assessment Methods Assessment Data Summaries Enhancements
ENGR10_SLO_1 - The student will beable to analyze, graph and develop aformula for a given data set.SLO Status: Active
ENGR10_SLO_2 - The student will beable to write technicaldocumentation both written andorally.SLO Status: Active
ENGR10_SLO_3 - The student willwork collaboratively on anengineering team.SLO Status: Active
09/19/2019 Page 313 of 318Generated by Nuventive Improve
ENGR 35:Statics
Student LearningOutcomes (SLOs) Assessment Methods Assessment Data Summaries Enhancements
ENGR35_SLO_1 - The student will beable to analyze two- and three-dimensional force systems on rigidbodies in static equilibrium usingvector and scalar analysis methods.SLO Status: Active
09/19/2019 Page 314 of 318Generated by Nuventive Improve

ENGR 37:Introduction to Circuit Analysis
Student LearningOutcomes (SLOs) Assessment Methods Assessment Data Summaries Enhancements
ENGR37_SLO_1 - The student will beable to analyze circuits containingresistive, capacitive, inductive passiveelements, along with op-ampsinterconnected to voltage and currentsources.SLO Status: Active
ENGR37_SLO_2 - The student will beable to use circuit laws and networktheorems to solve DC steady statecircuits, RC, RL, and RLC DC circuittransients and sinusoidal AC steadystate circuits.SLO Status: Active
09/19/2019 Page 315 of 318Generated by Nuventive Improve
ENGR 77 (X-Y):Special Projects in Engineering
Student LearningOutcomes (SLOs) Assessment Methods Assessment Data Summaries Enhancements
ENGR77_SLO_1 - Investigate an areaof special interest and demonstratean appropriate level of understandingand expertise.SLO Status: ActiveOutcome Creation Date: 02/11/2018
09/19/2019 Page 316 of 318Generated by Nuventive Improve

ENGR 78 X-Z:Special Projects in Electrical Engineering
Student LearningOutcomes (SLOs) Assessment Methods Assessment Data Summaries Enhancements
ENGR78X-Z_SLO_1 - Investigate anarea of special interest in the fields ofElectrical Engineering anddemonstrate an appropriate level ofunderstanding and expertise.SLO Status: Special ProjectsOutcome Creation Date: 08/24/2015
09/19/2019 Page 317 of 318Generated by Nuventive Improve

ENGR 79 X-Z:Special Projects in Mechanical Engineering
Student LearningOutcomes (SLOs) Assessment Methods Assessment Data Summaries Enhancements
ENGR79X-Z_SLO_1 - Investigate anarea of special interest anddemonstrate an appropriate level ofunderstanding and expertise.SLO Status: Special ProjectsOutcome Creation Date: 08/24/2015
09/19/2019 Page 318 of 318Generated by Nuventive Improve