Assessment and Monitoring of Land Degradation Using ...
28
1 Assessment and Monitoring of Land Degradation Using Geospatial Technology in Bathinda District, Punjab, India Naseer Ahmad, Puneeta Pandey* Centre for Environmental Sciences and Technology, Central University of Punjab, Bathinda, Punjab-151001, India Correspondence to: Puneeta Pandey ([email protected]) 5 Abstract. Land degradation leads to alteration in ecological and economic functions due to decrease in productivity and quality of the land. The aim of the present study was to assess land degradation with the help of geospatial technology - Remote Sensing (RS) and Geographical Information System (GIS)) in Bathinda district, Punjab. The severity of land degradation was estimated by analysing the physico-chemical parameters in the laboratory and correlating them with satellite based studies. The results revealed that the soils in the study area were exposed to the salt intrusion which could be mainly 10 attributed to irrigation practices in the state of Punjab. Most of the soil samples of the study area were largely found slightly or moderately saline with a few salt-free sites. Further, majority of the soil samples were calcareous and a few samples were alkaline or sodic in nature. A comparative analysis of temporal satellite datasets of Landsat-7 ETM+ and Landsat-8 OLI_TIRS of the year 2000 and 2014 respectively, revealed that the water body showed a slight decreasing trend from 2.46 km 2 in 2000 to 1.87 km 2 in 2014; while, the human settlements and other built-up areas expanded from 586.25 km 2 to 891.09 15 km 2 in a span of 14 years. The results also showed a decrease in area under barren land from 68.9847 km 2 in 2000 to 15.2602 km 2 in the year 2014. Significant correlation was observed between the Digital Number (DN) of near Infrared band and pH and EC. Therefore, it is suggested that the present study can be applied to projects with special relevance to soil scientists, environmental scientists and planning agencies that can use the present study as a baseline data to combat land degradation and conserve land resources in an efficient manner. 20 Keywords: Remote Sensing (RS), Digital Number (DN), Geographical Information System (GIS), Calcareous, Alkaline 1 Introduction The land use and land cover change (LULCC) effects have turn out to be a prime issue for the scientists concerned with global environmental change (Munoz-Rojas et al., 2015; Ochoa et al.,2016). The land use activities have a considerable influence on the people posing serious consequences on social, economic, and ecological aspects of humans surrounding 25 (Burchinal, 1989; FAO, 1997). Land degradation is the process that makes land unsuitable for human beings as well as for soil ecosystems (Kimpe and Warkentin, 1998), occurs in arid, semi-arid and sub-humid areas as a result of anthropogenic activities and climatic variations (Barbero-Sierra et al., 2015) and eventually puts livelihoods and sustainable development at risk (Fleskens and Solid Earth Discuss., doi:10.5194/se-2016-172, 2017 Manuscript under review for journal Solid Earth Published: 2 January 2017 c Author(s) 2017. CC-BY 3.0 License.
-
Upload
khangminh22 -
Category
Documents
-
view
15 -
download
0
Transcript of Assessment and Monitoring of Land Degradation Using ...

1
Assessment and Monitoring of Land Degradation Using Geospatial
Technology in Bathinda District, Punjab, India
Naseer Ahmad, Puneeta Pandey* Centre for Environmental Sciences and Technology, Central University of Punjab, Bathinda, Punjab-151001, India
Correspondence to: Puneeta Pandey ([email protected]) 5
Abstract. Land degradation leads to alteration in ecological and economic functions due to decrease in productivity and
quality of the land. The aim of the present study was to assess land degradation with the help of geospatial technology -
Remote Sensing (RS) and Geographical Information System (GIS)) in Bathinda district, Punjab. The severity of land
degradation was estimated by analysing the physico-chemical parameters in the laboratory and correlating them with satellite
based studies. The results revealed that the soils in the study area were exposed to the salt intrusion which could be mainly 10
attributed to irrigation practices in the state of Punjab. Most of the soil samples of the study area were largely found slightly
or moderately saline with a few salt-free sites. Further, majority of the soil samples were calcareous and a few samples were
alkaline or sodic in nature. A comparative analysis of temporal satellite datasets of Landsat-7 ETM+ and Landsat-8
OLI_TIRS of the year 2000 and 2014 respectively, revealed that the water body showed a slight decreasing trend from 2.46
km2 in 2000 to 1.87 km
2 in 2014; while, the human settlements and other built-up areas expanded from 586.25 km
2 to 891.09 15
km2 in a span of 14 years. The results also showed a decrease in area under barren land from 68.9847 km
2 in 2000 to 15.2602
km2 in the year 2014. Significant correlation was observed between the Digital Number (DN) of near Infrared band and pH
and EC. Therefore, it is suggested that the present study can be applied to projects with special relevance to soil scientists,
environmental scientists and planning agencies that can use the present study as a baseline data to combat land degradation
and conserve land resources in an efficient manner. 20
Keywords: Remote Sensing (RS), Digital Number (DN), Geographical Information System (GIS), Calcareous, Alkaline
1 Introduction
The land use and land cover change (LULCC) effects have turn out to be a prime issue for the scientists concerned with
global environmental change (Munoz-Rojas et al., 2015; Ochoa et al.,2016). The land use activities have a considerable
influence on the people posing serious consequences on social, economic, and ecological aspects of humans surrounding 25
(Burchinal, 1989; FAO, 1997).
Land degradation is the process that makes land unsuitable for human beings as well as for soil ecosystems (Kimpe and
Warkentin, 1998), occurs in arid, semi-arid and sub-humid areas as a result of anthropogenic activities and climatic
variations (Barbero-Sierra et al., 2015) and eventually puts livelihoods and sustainable development at risk (Fleskens and
Solid Earth Discuss., doi:10.5194/se-2016-172, 2017Manuscript under review for journal Solid EarthPublished: 2 January 2017c© Author(s) 2017. CC-BY 3.0 License.

2
Stringer, 2014). It is the alteration in ecological and economic functions due to the decrease in the productivity and quality of
the land (Hill et al., 2005) that leads to decline in the biological productivity of land due to climate change and human
activities (Zhang et al., 2014). Land degradation poses a great threat to the food security and damages the environmental
safety of land as well as influenced the sustainable development of society and economy (Zhao et al., 2013). Degradation of
soil is a desertification processes that leads to exhaustion of other natural resources in both developed and developing 5
countries and affect arid, dry and even sub-humid areas (Omuto et al., 2014; Stringer and Harris, 2014). The degradation of
soil happens not only as a result of interaction between physico-chemical and biological factors comprising topography, soil
properties and climatic features (Brevik et al., 2015; Taguas et al., 2015), but also includes human factors, land use
management practices (Khaledian et al., 2013; Camprubi et al., 2015; Costa et al., 2015; Cerda et al., 2016). Improper land
use practice has been attributed as one of the major causes of land degradation by various researchers (Biro et al., 2013; De 10
Souza et al., 2013; Pallavicini et al., 2014; Mohawesh et al., 2015).The resilience and stability of landscape are affected to a
great extent by the soil system which in turn affected by the inherent balance between inputs and nutrient loss and carbon
(Amundson et al., 2015).
Land degradation is a severe problem due to which 1.5 billion people are threatened (Nachtergaele et al., 2010) and about
1·9 billion hectares of land and 250 million people are affected worldwide (Low, 2013). There is an increasing trend in 15
severity of degradation, covering most of the world’s land area which includes 30% forests, 20% cultivated areas, and 10%
grasslands undergoing degradation (Bai et al., 2008). According to Barrett and Hollington (2006), approximately, 10 to 20
million populations live on the land affected by salts with poor productivity and under alarming threats of ecosystem
destruction. Every year approximately 6 million hectares of agricultural land turn into unproductive due to various processes
of the soil degradation (Asio et al., 2009). A target of zero net land degradation (ZNLD) at RIO + 20 was set by United 20
Nations Convention to Combat Desertification (UNCCD) held in Brazil in 2012, aimed at reducing the rate of land
degradation and promoting the rate of restoration of already degraded land (Easdale, 2016).
According to an estimation of Indian Council of Agricultural Research (ICAR, 2010), about 120.40 million hectares (out of
328.73 M ha) of land in the country is affected by land degradation. In the state of Punjab, 2.33% (1172.84 km2) of the land
area is considered as wasteland; the highest area under wasteland being of Muktsar district (186.8 km2), followed by 25
Ferozpur (148.1 km2), Bathinda (144.4 km
2) and Gurdaspur (94.5 km
2).Change detection studies of LULC in an area have
proven to be very effective in assessing the potential adverse impacts on environment (Leh et al., 2013). Hence, it becomes
essential to devise effective strategies for land management at landscape level by analysing the extent of land degradation
using model simulation studies for LULC dynamics (Gessesse et al., 2015).
Though the land area of Punjab under different wasteland categories is less as compared to other states (State of 30
Environment Punjab, 2007) but the land degradation assessment and monitoring is very essential to improve understanding
and assistance in decision-making processes. Hence, this research uses both remote sensing methods as well as physico-
Solid Earth Discuss., doi:10.5194/se-2016-172, 2017Manuscript under review for journal Solid EarthPublished: 2 January 2017c© Author(s) 2017. CC-BY 3.0 License.

3
chemical analysis of soil for assessing the severity of land degradation. The results obtained by both the approaches have
been correlated to get a better picture of the extent of land degradation in Bathinda, a semi-arid town in western India.
2 Materials and Method
2.1 Study area
Bathinda is one of the historical and important cotton-producing towns of North-western India, situated in the Malwa region 5
of Southern Punjab. The total geographical area (TGA) of the district is about 336,725 hectares (3367.25 km2) and lies
between 29˚.33ˈ-30˚.36ˈ North latitude and 74˚.38ˈ-75˚.46ˈ East longitude. The study area shows typical condition of
desertification and soil salinization; hence, effective means of combating soil salinization and desertification need to be
pursued. From the study area, a total 21 sites (Figure 1) were selected for soil sample collection for the analysis of physico-
chemical parameters. 10
Figure 1: Sampling sites of the study area
Solid Earth Discuss., doi:10.5194/se-2016-172, 2017Manuscript under review for journal Solid EarthPublished: 2 January 2017c© Author(s) 2017. CC-BY 3.0 License.

4
2.2 Satellite data
The least-clouded multispectral Landsat satellite images of the year 2000 and 2014 (Table 1) were procured from United
States Geological Survey (USGS) (www.usgs.gov) and Global Land Cover Facility (GLCF) (www.glcf.umd.edu).
Table 1: Details of the Satellite Images used for study
Spacecraft
ID
WRS: P/R Acquiring
Date
Dataset/
Sensor ID
Producer Attri. Type Location
Landsat_7 2: 148/039 2000-12-25 ETM+ Earthsat Ortho,
Nv
GeoTIFF India
Landsat_8 2: 148/039 2014-10-21 OLI_TIRS USGS GLS-
2000
GeoTIFF India
5
2.3 Software used
Satellite image processing software, Earth Resources and Data Analysis System (ERDAS) Imagine (Hexagon Geospatial -
formerly ERDAS, Inc.) and ArcGIS 10.1 (Environmental Systems Research Institute-ESRI product) were used to process,
classify, analyse and display the satellite images.
2.4 Land use land cover (LULC) map of Bathinda 10
The false colour composite (FCC) of multi-temporal Landsat satellite images of the year 2000 and 2014was generated on
1:50,000 scale. Further, unsupervised classification using ISODATA algorithm was carried out to gain an idea about spectral
variability of classes. In this method, the separation of clusters of pixels was carried out based on statistically similar spectral
response patterns, to gain information categories by determining classes that were spectrally different, and then defined their
information value (Lillesand and Kiefer, 1994). Finally, land use land cover map was generated by supervised classification 15
using Maximum Likelihood Classifier (MLC) algorithm, wherein the pixels of unknown class were allocated to a particular
land use class in which it had the highest likelihood of membership.
2.5 Physico-chemical Analysis of soil
For the present study, three physic-chemical parameters- pH, EC and Alkalinity were analysed for 21 soil samples in the
study area as represented in Table 2. 20
Solid Earth Discuss., doi:10.5194/se-2016-172, 2017Manuscript under review for journal Solid EarthPublished: 2 January 2017c© Author(s) 2017. CC-BY 3.0 License.

5
Table 2: Parameters of soil analysis
S. No. Parameter Method Instrument Reference
1 pH IS: 2720, part 1-1983 pH meter (OAKTAN-PC
2700)
IS 1987
2 Electrical
Conductivity (EC)
IS: 14767-2000 EC- Meter (Systronic
water analyser 371).
IS 2000
3 Alkalinity IS 2035 (part 23)-
Reaffirmed 2003
Titration assemblage Gupta, 2007
2.5.1 pH: The pH was determined in accordance with the procedure of IS: 2720, part 1-1983where pH meter (OAKTAN-PC
2700) was used to record the pH in an extract of 1:2 of soil or supernatant liquid.
5
2.5.2 Electrical Conductivity (EC): The measurement of Electrical Conductivity was done in accordance with IS: 14767-
2000using EC- Meter (Systronic water analyser 371. An extract of soil sample or supernatant liquid of 1:2 soil water
suspension was prepared and filtered using Whatman’s filter paper to avoid any interference before recording the
conductivity by EC-meter.
10
2.5.3 Alkalinity: With the help of Titration method, the Alkalinity of the soil samples was measured using 0.05N H2SO4,
0.5% Methyl red indicator and 0.25% phenolphthalein indicator. Since, the carbonates were absent in the solution, it did not
turn into pink. It was then titrated till the color changed from yellow to rose red, indicated as the end point of titration. The
concentration of bicarbonates was calculated from the formula as given in Eq. (1)
(1) 15
2.6 Correlation of Satellite data with physico-chemical parameters
The Digital Numbers (DN) of the satellite image at the respective sampling sites was correlated with the pH and EC readings
to gain an idea about the efficacy of satellite data in relation to laboratory analysis of soil samples.
Solid Earth Discuss., doi:10.5194/se-2016-172, 2017Manuscript under review for journal Solid EarthPublished: 2 January 2017c© Author(s) 2017. CC-BY 3.0 License.

6
3. Results and Discussion
3.1 LULC map of Bathinda
The False Colour Composite (FCC) image was prepared for the year 2000 Landsat ETM+ satellite data using “432 RGB”
band combination (Figure 2a) while the band combination of “543 RGB” was used for the Landsat 8 satellite image (Figure
2b) for the year 2014. 5
Figure 2(a): FCC of Landsat ETM+ of 2000
Solid Earth Discuss., doi:10.5194/se-2016-172, 2017Manuscript under review for journal Solid EarthPublished: 2 January 2017c© Author(s) 2017. CC-BY 3.0 License.
7
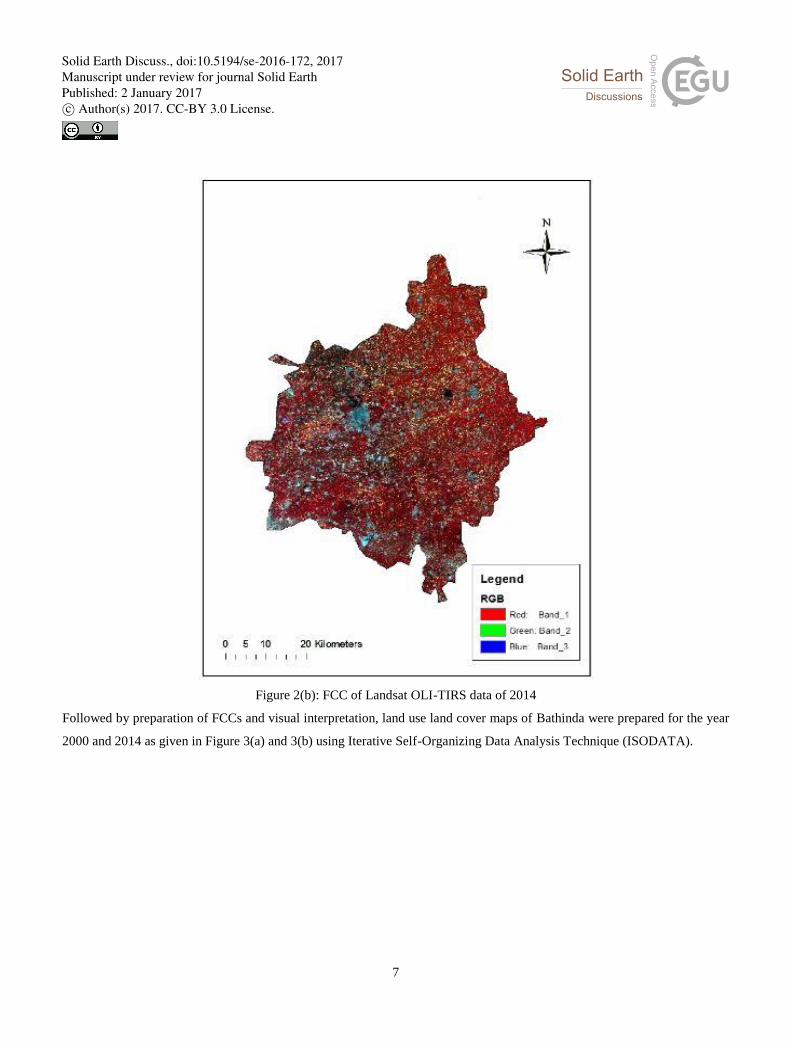
Figure 2(b): FCC of Landsat OLI-TIRS data of 2014
Followed by preparation of FCCs and visual interpretation, land use land cover maps of Bathinda were prepared for the year
2000 and 2014 as given in Figure 3(a) and 3(b) using Iterative Self-Organizing Data Analysis Technique (ISODATA).
Solid Earth Discuss., doi:10.5194/se-2016-172, 2017Manuscript under review for journal Solid EarthPublished: 2 January 2017c© Author(s) 2017. CC-BY 3.0 License.

8
Figure 3(a): LULC map of Bathinda using unsupervised classification for 2000
Solid Earth Discuss., doi:10.5194/se-2016-172, 2017Manuscript under review for journal Solid EarthPublished: 2 January 2017c© Author(s) 2017. CC-BY 3.0 License.
9
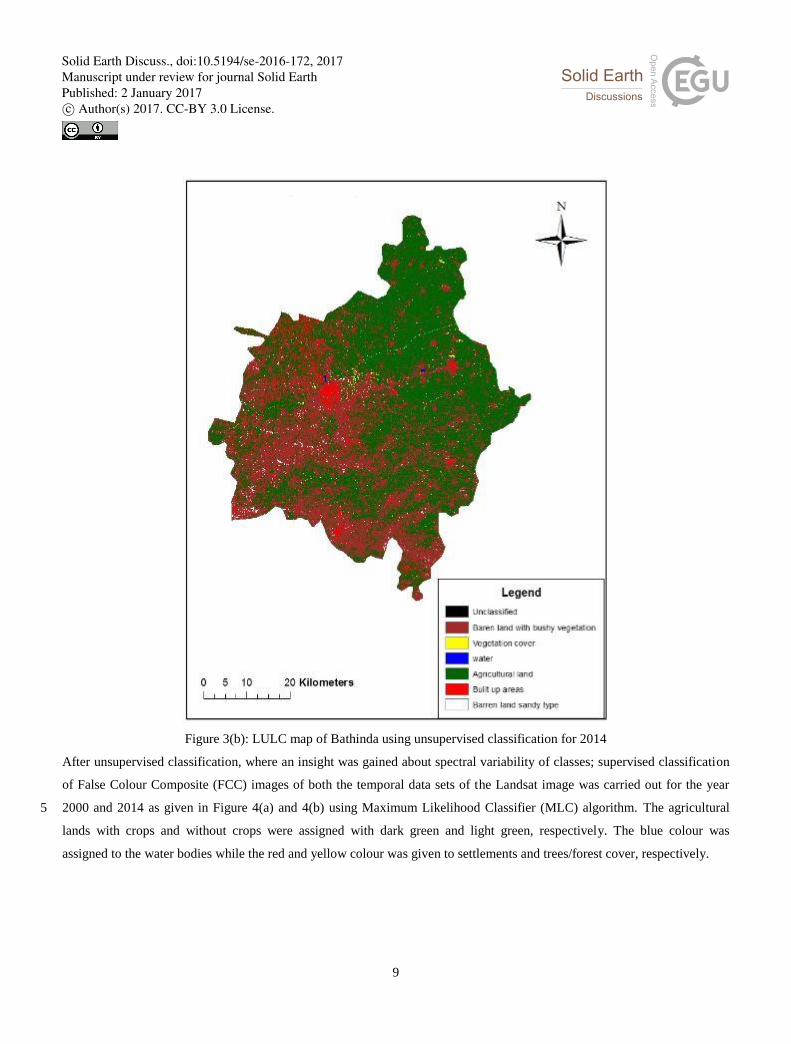
Figure 3(b): LULC map of Bathinda using unsupervised classification for 2014
After unsupervised classification, where an insight was gained about spectral variability of classes; supervised classification
of False Colour Composite (FCC) images of both the temporal data sets of the Landsat image was carried out for the year
2000 and 2014 as given in Figure 4(a) and 4(b) using Maximum Likelihood Classifier (MLC) algorithm. The agricultural 5
lands with crops and without crops were assigned with dark green and light green, respectively. The blue colour was
assigned to the water bodies while the red and yellow colour was given to settlements and trees/forest cover, respectively.
Solid Earth Discuss., doi:10.5194/se-2016-172, 2017Manuscript under review for journal Solid EarthPublished: 2 January 2017c© Author(s) 2017. CC-BY 3.0 License.

10
Figure 4(a): LULC map (Supervised classification) of Bathinda for 2000
Solid Earth Discuss., doi:10.5194/se-2016-172, 2017Manuscript under review for journal Solid EarthPublished: 2 January 2017c© Author(s) 2017. CC-BY 3.0 License.

11
Figure 4(b): LULC map (Supervised classification) of Bathinda for 2014
3.2 Accuracy Assessment
The overall classification accuracy of the Landsat image (supervised classification) of the year 2000 was found to be 96.48%
and the overall Kappa Statistics was found to be 0.947 (Table 3(a). Similarly, for Landsat image (supervised classification) 5
of the year 2014, it was found to be 97.66% with Kappa Statistics of 0.964 (Table 3(b). It indicated that the results were
appreciably better than random of the values contained in an error matrix (Jensen, 1996).
Solid Earth Discuss., doi:10.5194/se-2016-172, 2017Manuscript under review for journal Solid EarthPublished: 2 January 2017c© Author(s) 2017. CC-BY 3.0 License.

12
Table 3: Accuracy Assessment Report
3(a) Accuracy Totals (year 2000):
S. No. Class Name Reference
Totals
Classified
Totals
Number
Correct
Producer’s
Accuracy
User’s
Accuracy
1 Unclassified 115 114 114 ----- -----
2 Water 0 0 0 ----- -----
3 Human settlements and built up
areas
10 13 9 90.00% 69.23%
4 Agricultural land 43 40 40 93.02% 100.00%
5 Agricultural land without crops 81 85 81 100.00% 95.29%
6 Trees/Forest cover 0 0 0 ----- -----
7 Barren land 7 4 3 42.86% 75.00%
8 TOTALS 256 256 247
Overall Classification Accuracy = 96.48%
Kappa (K^) Statistics: Conditional Kappa for each Category was also obtained. The overall Kappa statistics was 0.947.
3(b) Accuracy Totals (year 2014): 5
S. No. Class Name Reference
Totals
Classified
Totals
Number
Correct
Producer’s
Accuracy
User’s
Accuracy
1 Unclassified 128 128 128 ----- -----
2 Water 0 0 0 ----- -----
3 Human settlements and built up
areas
38 39 18 100.00% 97.44%
4 Agricultural land 67 70 66 98.51% 94.29%
5 Agricultural land without crops 21 18 17 80.95% 94.44%
6 Trees/Forest cover 1 1 1 100.00% 100.00%
7 Barren land 1 0 0 42.86% 75.00%
8 TOTALS 256 256 250
Overall Classification Accuracy = 97.66%
Kappa (K^) Statistics: From the results the overall Kappa statistics (conditional Kappa for each Category of the year 2014)
was 0.964.
Solid Earth Discuss., doi:10.5194/se-2016-172, 2017Manuscript under review for journal Solid EarthPublished: 2 January 2017c© Author(s) 2017. CC-BY 3.0 License.

13
3.3 Change Detection Analysis
To analyse the change occurring between different land features for a period of 14 years, the supervised images of both the
year 2000 and 2014 were used as input images and the change was highlighted as 20% increase (blue colour) and 20%
decrease in the final map (pink colour) depicting change detection (Figure 5). Rest of the classes included unclassified,
unchanged, some increased and some decreased which were pointed out in black colour. The increased portion 5
predominantly indicated the expansion of settlements with little increase in vegetation. The decreased portion depicted the
decrease in overall land area under agriculture (with or without crops).
Figure 5: Change Detection Map of Bathinda district
Table 4 describes the change detection in total area (km2) covered by different LULC between the year 2000 and 2014 10
procured from Landsat satellite data.
Table 4: Change detection in different LULC (km2) between 2000 and 2014
S. No. LULC Class Area (km2) in
2000
Area (km2) in
2014
Change Detection (km2)
between 2000-2014
1. Water 2.46 1.8783 0.58 (decrease)
Solid Earth Discuss., doi:10.5194/se-2016-172, 2017Manuscript under review for journal Solid EarthPublished: 2 January 2017c© Author(s) 2017. CC-BY 3.0 License.

14
2. Human
settlements and
built up areas
586.25 891. 10 304.85 (increase )
3. Agricultural land 3002.23 2399.80 602.44 (decrease)
4. Trees/Forest
cover
29.43 45.73 16.30 (increase)
5. Barren land 68.98 15.26 53.7243 (decrease)
With reference to Table 4, the area under water body, human settlements and built-up areas, agricultural land, trees/ forest
cover and barren land was found to be 1.87 km2, 891.09 km
2, 2399.79 km
2, 45.73 km
2 and 10.35 km
2, respectively. The
water body showed a slight decreasing trend from 2.46 km2 in 2000 to 1.87 km
2 in 2014. The human settlements and other
built-up areas expanded from 586.25 km2 to 891.09 km
2 in the 14 years span of time. This could also be attributed to 5
increasing urbanization in the city of Bathinda during the last 14 years.
3.4 Laboratory Analysis for Physico-Chemical Parameters:
The values of pH, EC and Alkalinity of the soil samples collected from the study area are given in table no. 5.
Table 5: Results of physico-chemical parameters of soil
S.NO. SITE pH EC (dS/m) Methyl
Orange
Alkalinity
(HCO3-) g/L
as CaCO3
SOIL TYPE
1 JassiPauwali 8.11 4.04 0.161 Calcareous, Slightly
saline
2 Talwandi Sabo 7.78 2.63 0.161 Calcareous, Salt
free
3 Maur 8.44 2.50 0.140 Alkali or Sodic
soils, Salt free
4 Rampuralphul- a 8.20 8.78 0.161 Calcareous or
saline, Moderately
saline
5 Rampuraphul- b 7.84 8.17 0.122 Calcareous,
Moderately saline
6 Ballhawali 7.90 5.89 0.109 Calcareous, Slightly
saline
7 Poohla 8.13 4.10 0.101 Calcareous, Slightly
saline
8 Military Cantt. 7.37 4.01 0.122 Calcareous, Slightly
saline
9 Patel Nagar 7.87 2.83 0.109 Calcareous, Salt
free
Solid Earth Discuss., doi:10.5194/se-2016-172, 2017Manuscript under review for journal Solid EarthPublished: 2 January 2017c© Author(s) 2017. CC-BY 3.0 License.

15
10 Model Town- 3 8.15 2.15 0.140 Calcareous, Salt
free
11 Model Town- 1 7.95 4.73 0.092 Calcareous, Slightly
saline
12 Nachhattar Nagar- a 7.94 3.04 0.162 Calcareous, Salt
free
13 Jaisinghwalla 8.59 4.11 0.131 Alkali or Sodic
soils, Slightly saline
14 Badal 8.23 1.97 0.092 Calcareous, Salt
free
15 Gidderbaha 8.44 4.71 0.223 Alkali or Sodic
soils, Slightly saline
16 Mehmasirja 8.39 6.23 0.140 Alkali or Sodic
soils, Slightly saline
17 Lakhi jungle 8.45 4.12 0.109 Alkali or Sodic
soils, Slightly saline
18 Thermal Colony 7.87 4.28 0.070 Calcareous, Slightly
saline
19 CUPB Campus 8.31 4.70 0.092 Calcareous, Slightly
saline
20 Nachhattar Nagar- b 7.92 4.12 0.122 Calcareous, Slightly
saline
21 Mansa Road near
CUPB
7.94 4.02 0.131 Calcareous, Slightly
saline
It was observed that all the 21 soil samples collected from different locations of the study area were mostly alkaline in
nature. None of the sampling site was found to be neutral or acidic in nature. The pH range was observed to be lowest in
Military Cantt. (pH =7.37) and highest in Jaisingh Walla (pH =8.59) in the study area (Table 5).The value of Electrical
Conductivity(EC) ranged between 1.97 dS/m in Badal and 8.78 dS/m in Rampuraphul- a of the study area. 60-70 percent of 5
soil samples were “slightly or moderately saline”. Rest of the samples were categorized as “salt free” ones with the values
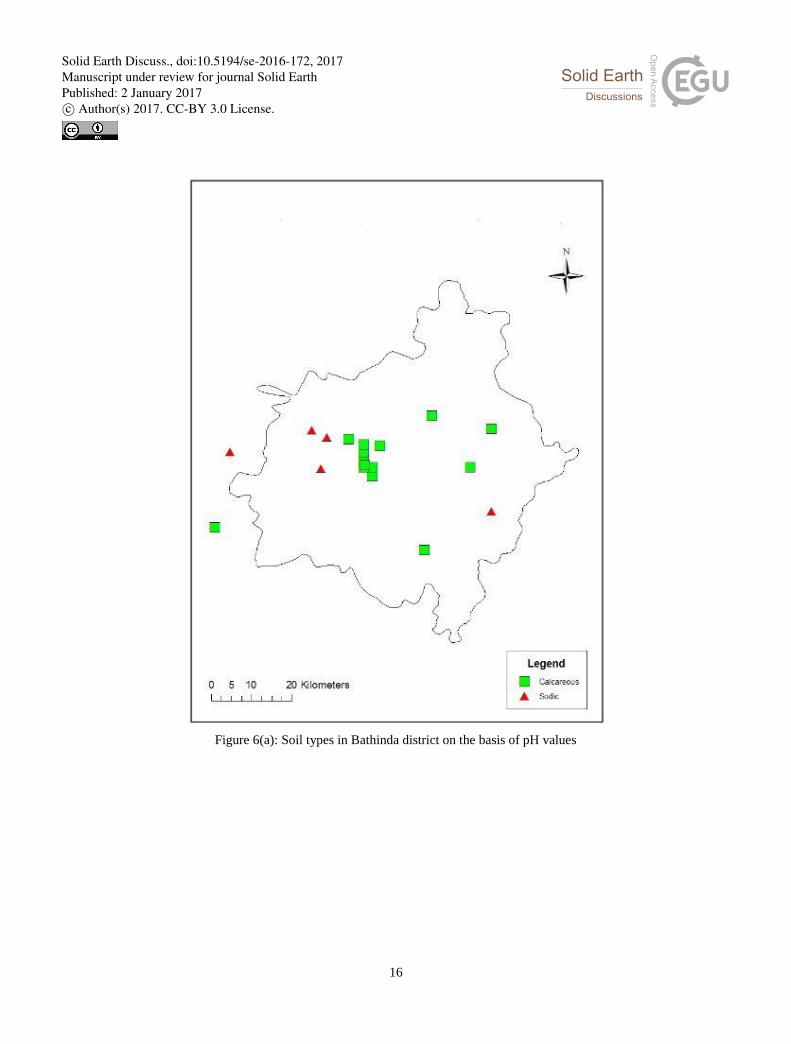
lesser than 4. Based on the pH values, a map for sampling sites as shown in Figure 6(a) was composed in ArcGIS 10.1
software depicting the calcareous and sodic soils at selected sampling sites. On the basis of EC values, salinity of the
sampling sites was depicted in the Figure 6(b), which showed that the soils towards the Bathinda city were largely “slightly
saline” and few were salt free regions. 10
Solid Earth Discuss., doi:10.5194/se-2016-172, 2017Manuscript under review for journal Solid EarthPublished: 2 January 2017c© Author(s) 2017. CC-BY 3.0 License.
16
Figure 6(a): Soil types in Bathinda district on the basis of pH values
Solid Earth Discuss., doi:10.5194/se-2016-172, 2017Manuscript under review for journal Solid EarthPublished: 2 January 2017c© Author(s) 2017. CC-BY 3.0 License.

17
Figure 6(b): Soil types in Bathinda district on the basis of EC values
Phenolphthalein Alkalinity was absent due to the absence of carbonate ions (CO32-
). The alkalinity was then determined by
Methyl Alkalinity which indicated the presence of bicarbonate (HCO3-) ions. The Methyl orange/Total Alkalinity of the soils
of the study area was observed to be in the range of 0.070 to 0.223 (HCO3-) g/L as CaCO3. The results revealed that the saline 5
and alkaline nature of the soils contain larger proportion of sodium, potassium and magnesium and thus, infertile.
Solid Earth Discuss., doi:10.5194/se-2016-172, 2017Manuscript under review for journal Solid EarthPublished: 2 January 2017c© Author(s) 2017. CC-BY 3.0 License.

18
3.5 Correlation between Physico-Chemical Parameters and Satellite Data Analysis for 2014
Based on the results obtained from laboratory analysis of soil, an attempt was made to establish correlation for band 3
(green), band 5 (NIR) and band 7 (SWIR) of Landsat 8 satellite image for the year 2014 with the pH and Electrical
Conductivity of the soil. The Digital Number of corresponding sites was correlated with the physico-chemical parameters.
Table 6: Correlation between band 5 and Physico-Chemical Parameters 5
DN pH EC
DN 1 ----- -----
pH 0.477 1 -----
EC 0.285 -0.003 1
On the basis of computation of correlation, no significant correlation was observed between physico-chemical parameters
and visible (band 3) and short-wave infrared (band 7) of the satellite image; hence, the values have not been reported here.
Near infrared band (band 5), however, exhibited significant correlation with physico-chemical parameters compared to rest
of the bands; thus, proving it to be a better indicator of soil quality. 10
4. Discussion
A variety of remote sensing data has been used for identifying and monitoring salt-affected areas, including aerial
photography, video images, Infrared thermography, visible and infrared multispectral and microwave images (Metternicht
and Zinck, 2002).
4.1 LULC map of Bathinda: Image Classification and Accuracy Assessment 15
The digital image classification helped in the identifying, delineating and mapping of the land use/land cover into a number
of classes. It has been recommended by various researchers for its potential to detect, map and monitor degradation problems
(Sujatha et al., 2000). The classes identified include water bodies, human settlements and built up areas, agricultural land,
trees/forest cover and barren land. Multispectral data was used for classification and the categorization on numerical basis
related with the spectral pattern of the data for each and every pixel (Lillesand and Kiefer, 1994). 20
4.2 Change detection analysis
The change detection study deals with the comparison of aerial photographs or satellite image of a region taken at different
time periods (Petit et al., 2001), performed on a temporal scale to access landscape change caused due to anthropogenic
activities on the land (Gibson and Power, 2000). In order to understand landscape patterns for proper land management and
decision making improvements; it becomes necessary to consider upon the changes and interactions between human 25
Solid Earth Discuss., doi:10.5194/se-2016-172, 2017Manuscript under review for journal Solid EarthPublished: 2 January 2017c© Author(s) 2017. CC-BY 3.0 License.

19
activities and natural phenomenon (Prakasam, 2010). The remote-sensing change detection has been proven to be a cost-
effective method of creating LULC inventories and monitoring land change over time (Coppin et al., 2004; Fry et al., 2011).
The results of the present study reveal that area under barren land has decreased from 68.98 km2 in 2000 to 15.26 km
2 in the
year 2014. This could be due to expansion of settlements and built up areas (Silambarasan et al., 2014) or partly due to
increased vegetation. The settlement expansion on agricultural and forest land is affecting the humans by exposing forest 5
ecosystems and negative impacts of habitat destruction within the forest ecosystem (Stimson et al., 2005). The improper
land use is regarded as one of the chief agents of land degradation, which has previously been observed by various
researchers (Biro et al., 2013; De Souza et al., 2013; Pallavicini et al., 2014; Mohawesh et al., 2015).However, since
settlements and barren land exhibit similar spectral reflectance, slight mixing may have occurred between the two LULC
classes. Zubair (2006) conducted the evaluation of change detection in land use and land cover of Ilorin and its Environs in 10
Kwara State, Nigeria and ultimately concluded that the rapid growth in built-up land was one of the reasons of changing the
land use and land cover. The extension of urban land could be a major loss of the cropland (Jin-Song, 2009). While studying
the land use pattern in Khed Tehsil of Pune district, Jadhav and Nagarale (2011) also concluded that growth of population,
urbanization and transportation network were the socioeconomic factors which changed the land use pattern of Khed Tehsil.
Fazal (2000) in his study on the urban expansion and loss of agricultural land of Saharanpur city, India concluded that rapid 15
conversion of agricultural areas to non-agricultural uses has occurred due to hike in price of land for market operations.
Verheye and Paul (1997) revealed that a bulk of households, especially in developing countries, depend on land and other
natural resources for satisfying their urgent needs in achieving their long-term aspirations. Such interaction between
environment and land use activities show some considerable impacts on the fundamental processes of ecosystem processes
comprising nutrient cycling, soil erosion and human vulnerability (Sala et al., 2000; Foley et al., 2005). Usually the sprawl 20
takes place on urban fringe or along transportation routes (Silambarasan et al., 2014). Such expansion reinforces segregation
of income and economic disproportion between urban and suburban communities (Wu, 2006). This high urban sprawl has
led to an increased urban land uses, and on the other hand, led to a decreased barren land in the in the form of settlement
(Ali, 2011). In the present study, an increase in vegetation was observed in 2014 compared to 2000 which could be due to
recent plantation programmes organized in the region at various educational, institutional and municipal levels. Such 25
plantation may act as 'foster ecosystems' (Lugo, 1988) and accelerates the development of genetic and biochemical diversity
on degraded sites (Verma et al., 1982). Sadeghravesh et al. (2016) suggested adopting spatial planning and estimating
ecological potential at local, regional and national levels and adapting the applications to land resources to minimize land
degradation by way of analyzing desertification strategies using linear assignment method. Further, the strategies to prevent
improper change of land use, development and reclamation of plant cover and controlling overcharging of groundwater 30
resources were identified as the most important strategies for combating desertification.
Solid Earth Discuss., doi:10.5194/se-2016-172, 2017Manuscript under review for journal Solid EarthPublished: 2 January 2017c© Author(s) 2017. CC-BY 3.0 License.
20
4.3 Laboratory analysis for physico-chemical parameters
The land degradation results in damage to the physical, chemical, or biological properties of the soil which leads to decline
in productivity (Chartres, 1987). Thus, it became essential for incorporating the physico-chemical parameters in the present
study.
Most of the soil samples were found to be calcareous or saline; while some of the other samples were alkali or sodic in 5
nature (www.dird-pune.gov.in/phec.htm).This means that soils contained very high calcium content. The high calcium
content keeps the soil in aggregated form and good physical conditions. This is in agreement with the findings of Abbas and
Khan (2007) who stated that remotely sensed data integrated with ground truthing verification and physico-chemical analysis
is a useful tool for assessment of soil salinity and alkalinity. The remote sensing has been recommended for its potential to
detect, map and monitor degradation problems (Sujatha et al., 2000) including their spread and effect with time (Sommer et 10
al., 1998).
On the basis of EC values given by Ghassemi et al. (1995), it was found that some parts of the study area were slightly
saline, some moderately saline and a few areas were salt-free in nature. The saline nature of the soil revealed that the soils
contain sodium as soluble salts (usually as SO42-
or chloride). The soils usually prefer calcium and magnesium over sodium
as a result of which these soils usually have good aeration and aggregate stability (Mathew, 2014). The electrical 15
conductivity and total salt content of a soil extract are the most widely used parameters for describing soil salinity (Liu et al.,
2006). Although there are several soil-water ratios used in EC measurements of soil extract, such as 1:1, 1:2, 1:5, 1:10, and
also saturation (Zhang et al., 2003), in China 1:5 is the most popular. By the amount of cation exchange capacity (CEC) and
percentage of clay, especially high electrical conductivity, the high levels of organic carbon in the low density vegetation
areas (due to destruction of vegetation) are affected (Vagen et al., 2006). 20
From the results obtained, it could be assessed that the soil is affected by inappropriate activities during past several decades
such as loss of soil fertility, erosion, soil salinization etc. Due to the land degradation, vulnerable populations and fragile
ecosystems get affected with irreversible results (Bisaro et al., 2014). The consequences of land degradation may lead to the
vegetation loss, soil degradation and pollution of soil, water and air, which need to be addressed to curb the further
degradation (Novara et al., 2013; Batjes et al., 2014; Olang et al., 2014; Srinivasarao et al., 2014). Since the whole state of 25
Punjab is intensively cultivated with 80% of water resources being used for irrigation; the irrigation and overdrafting are
some of the main causes of salinization or intrusion of various salts into the soil system (Tiwana, 2007). The ground water
irrigation practised predominantly in Bathinda district, is one of the main factors of soil salinization which in turn leads to
land degradation (El Baroudy, 2011). The salt remains behind in the soil when water is taken up by plants or lost to
evaporation causing soil salinity (Slinger and Tenison, 2007). The zones receiving low rainfall, shallow water table depth 30
and hot and dry moisture regions in the irrigated areas of the old alluvial plains are found primarily affected by salt soils
(Manua and Sharma, 2005). The soils were largely found slightly saline or moderately saline with a few sites found salt free
regions. The saline nature of the soil revealed that the soils contain sodium as soluble salts usually as SO42-
or chloride. The
Solid Earth Discuss., doi:10.5194/se-2016-172, 2017Manuscript under review for journal Solid EarthPublished: 2 January 2017c© Author(s) 2017. CC-BY 3.0 License.

21
soils usually prefer calcium and magnesium over sodium as a result of which these soils usually have good aeration and
aggregate stability (Mathew, 2014).
Although the degree of salinity was not too high that the soil quality could be affected; but still some remedial measures
must be adopted to prevent any problem that might affect the quality of the land as well as the yield in the near future. In
such regions where irrigation is predominantly practised, the remote sensing could be used as a valuable tool for obtaining 5
relevant data on soil salinity (Al Khaier, 2003). Symeonakis et al. (2016) proposed that land degradation being a dynamic
process; should not be based on static datasets, rather its assessment should incorporate various temporal datasets while
devising parameters for indicators of environmental sensitivity. Thus, according to Behmanesh et al. (2016), various criteria
for mapping environmentally sensitive areas were climate, vegetation, soil, groundwater and socio-economic characteristics
of land over different time periods. 10
4.4 Correlation Analysis
On the basis of results, the correlation coefficients between soil salinity (Electrical Conductivity) and related Digital Number
(DN) values using Landsat data could be helpful in calculating and ascertaining the significant relation between satellite data
and soil salinity. The Salt affected soils in arid regions, show a high reflectance, especially when a salt crust (whitish color)
is formed. (Alavi-Panah and Goossens, 2001).Further, Mehrjardi et al. (2008) proved that correlation between digital 15
numbers of satellite images and soil salinity could be an efficient parameter for assessing the land degradation by preparing
soil salinity maps from remotely sensed data.
5 Conclusion
From the results, it was found that the area under human settlements and built up areas expanded by about 10.56%. The land
under agricultural practices decreased from 3002.23 km2 to 2399.79 km
2. The increased human settlements indicated the 20
alarming growth of human population and the associated increased pressure on land resources due to rising population. The
areas under trees/ forest cover increased markedly from 29.4345 km2 to 45.7326 km
2. This indicates recent plantation
measures adopted by various agencies in the region. The physico-chemical analysis proved to be very useful in assessing the
degree of salinization where most of the regions had calcareous soil with slight to moderate salinity and none of the sampling
site was found to be highly saline. Correlation studies between the spectral response of the soil and the physico-chemical 25
parameters (pH, EC and alkalinity) revealed that Band 5 was a good indicator of physico-chemical parameters of soil. Thus,
it is highly recommended to use multi-temporal, multi-sensor and multi-spectral remotely sensed data for land use / land
cover mapping; coupled with GIS to assess the extent of land degradation; which would aid in sound decision making
towards restoration of degraded lands and conservation of land resources in an efficient manner. The present study is a useful
tool for analysis of environmental sensitivity at regional scale and the identification of hotspots of land degradation. 30
Although the present study does not provide a detailed insight into the causes and manifestations of land degradation;
Solid Earth Discuss., doi:10.5194/se-2016-172, 2017Manuscript under review for journal Solid EarthPublished: 2 January 2017c© Author(s) 2017. CC-BY 3.0 License.

22
nevertheless, the present study would help to identify areas vulnerable to land degradation. This would also help in achieving
better results with limited investment and avoid wastage of natural resources.
6 Acknowledgements
The authors express their gratitude to National Remote Sensing Centre, Hyderabad for providing IRS P6 LISS-III data to 5
carry out the present study. The study was supported by the Central University of Punjab, Bathinda under UGC fellowship
for M.Phil.-Ph.D. research scholars (CUPB/MPH-PHD/SEES/EVS/2013-14/17). The authors declare no conflict of interest.
References
Abbas, A. and Khan, S.: Using remote sensing techniques for appraisal of irrigated soil salinity. In: Oxley L, Kulasiri D.
(eds.), International Congress on Modelling and Simulation (MODSIM). Modelling and Simulation Society of Australia and 10
New Zealand, Brighton, 2632-2638, 2007.
Al Khaier, F.: Soil salinity detection using satellite remote sensing. International institute for Geo-information science and
earth observation, Enschede, the Netherlands, 2003.
AlaviPanah, S. K., and Goossens, R.: Relationship between the Landsat TM, MSS data and soil salinity, J. Agr. Sci.
Tech.,3, 21-23, 2001. 15
Ali, K. O., Hashim, N., Rostam, K., and Jusoh, H.: Spatial growth of the semi-squatter settlement in Tripoli, Libya,
International Journal of Research and Reviews in Applied Sciences, 9, 478-485, 2011.
Amundson, R., Berhe, A. A., Hopmans, J. W., Olson, C., Sztein, A. E., and Sparks, D. L.: Soil science. Soil and human
security in the 21st century.Science, 348 (6235), 1261071, doi:10.1126/science.1261071, 2015.
Asio, V. B., Jahn, R., Perez, F. O., Navarrete, I. A., and Abit, Jr. S. M.: A review of soil degradation in the Philippines, 20
Annals of Tropical Research, 31, 69-94, 2009.
Bai, Z. G., Dent, D. L., Olsson, L., and Schaepman, M. E.: Global assessment of land degradation and improvement.
Identification by remote sensing.pp. 70. Report No. 12, 2008/01, ISRIC, Wageningen, 2008.
Barbero-Sierra, C., Marques, M. J., Ruiz-Pérez, M., Escadafal, R., and Exbrayat, W.: How is Desertification Research
Addressed in Spain? Land versus Soil Approaches, Land Degrad. Dev., 26, 423-432, doi: 10.1002/ldr.2344, 2015. 25
Barrett-Lennard, E. G. and Hollington, P. A.: Development of a national program on saline agriculture for Pakistan, 2006.
http://www.cazs.bangor.ac.uk/salinity/reports/National program.htm.Accessed on 09/07/2016.
Batjes, N. H.: Projected changes in soil organic carbon stocks upon adoption of recommended soil and water practices in the
Upper Tana River Catchment, Kenia, Land Degrad. Dev., 25, 278-287, doi:10.1002/ldr.2141, 2014.
Behmanesh, B., Barani, H., AbediSarvestani, A., Reza Shahraki, M., and Sharafatmandrad, M.: Rangeland degradation 30
assessment: A new strategy based on the ecological knowledge of indigenous pastoralists, Solid Earth, 7, 611-619, doi:
http://dx.doi.org/10.5194/se-7-611-2016, 2016.
Solid Earth Discuss., doi:10.5194/se-2016-172, 2017Manuscript under review for journal Solid EarthPublished: 2 January 2017c© Author(s) 2017. CC-BY 3.0 License.

23
Biro, K., Pradhan, B., Buchroithner, M., and Makeschin, F.: Land use/Land cover change analysis and its impact on soil
properties in the northern part of Gadarif region, Sudan. Land Degrad. Dev., 24, 90-102, doi:10.1002/ldr.1116, 2013.
Bisaro, A., Kirk, M., Zdruli, P., and Zimmermann, W.: Global drivers setting desertification research priorities: Insights
from a stakeholder consultation forum. Land Degrad. Dev., 25, 5-6, doi: 10.1002/ldr.222025, 2014.
Brevik, E. C., Cerda, A., Mataix-Solera, J., Pereg, L., Quinton, J. N., Six, J., and Van Oost, K.: The interdisciplinary nature 5
of soil, Soil, 1: 117-129, doi: 10.5194/soil-1-117-2015, 2015.
Burchinal, L. S.: Lecture Notes and Steps in Conducting a Survey. Presented at the 2nd
Annual Forestry Extension Workshop
on the Methodologies and Techniques in Conductive Forestry Extension Program in Sudan, 1989.
Camprubi, A., Zarate, I. A., Adholeya, A., Lovato, P. E., and Calvet, C.: Field performance and essential oil production of
mycorrhizal rosemary in restoration low-nutrient soils. Land Degrad. Dev., 26, 793-799, doi: 10.1002/ldr.2229, 2015. 10
Cerda, A., Gonzalez-Pelayo, O., Gimenez-Morera, A., Jordan, A., Pereira, P., Novara, A., Brevik, E. C., Prosdocimi, M.,
Mahmoodabadi, M., Keesstra, S., Garcia, Orenes, F., and Ritsema, C.: The use of barley straw residues to avoid high erosion
and runoff rates on persimmon plantations in Eastern Spain under low frequency – high magnitude simulated rainfall events,
Soil Research, 54, 154-165, doi: 10.1071/SR15092, 2016.
Chartres, C. J.: Australia’s land resources at risk: In land degradation- Problems and Policies. Chap. 1.1.Physical and 15
biological aspects of land degradation, pp 7-26.University of Cambridge, Melbourne, Australia, 1987.
Coppin, P., Jonckheere, I., Nackaerts, K., Muys, B., and Lambin, E.: Digital change detection methods in ecosystem
monitoring: A review, Int. J. Remote. Sens., 25, 1565-1596, doi: http://dx.doi.org/10.1080/0143116031000101675, 2004.
Costa, J. L., Aparicio, V., and Cerda, A.: Soil physical quality changes under different management systems after 10 years in
the Argentine humid Pampa, Solid Earth, 6, 361-371. doi: 10.5194/se-6-361-2015, 2015. 20
De Souza, R. G., Da Silva, D. K. A., De Mello, C. M. A., Goto, B. T., Da Silva, F. S. B., Sampaio, E. V. S. B., and Maia, L.
C.: Arbuscularmycorrhizal fungi in revegetated mined dunes, Land Degrad. Dev., 24, 147-155, doi:10.1002/ldr.1113, 2013.
Easdale, M. H.: Zero net livelihood degradation – the quest for a multidimensional protocol to combat desertification, Soil,
2, 129-134, doi: 10.5194/soil-2-129-2016, 2016.
El Baroudy, A. A.: Monitoring land degradation using remote sensing and GIS techniques in an area of the middle Nile 25
Delta, Egypt, Catena, 87, 201-208, doi:10.1016/j.catena.2011.05.023, 2011.
FAO: State of the World’s Forest. Situation and Prospects for Forest Conservation and Development, Rome, 1997.
Fazal, S.: Urban expansion and loss of agricultural land -A GIS based study of Saharanpur city, India, Environ. Urban., 12,
133-149, doi: http://dx.doi.org/10.1177/095624780001200211, 2000.
Fleskens, L. and Stringer, L. C.: Land management and policy responses to mitigate desertification and land degradation, 30
Land Degrad. Dev., 25, 1-4, doi: 10.1002/ldr.2272, 2014.
Foley, J. A., DeFries, R., Asner, G. P., Barford, C., Bonan, G., Carpenter, S. R., Chapin, F. S., Coe, M. T., Daily, G. C., and
Gibbs, H. K.: Global consequences of land use. Science, 309, 570-574, doi: http://dx.doi.org/10.1126/science.1111772,
2005.
Solid Earth Discuss., doi:10.5194/se-2016-172, 2017Manuscript under review for journal Solid EarthPublished: 2 January 2017c© Author(s) 2017. CC-BY 3.0 License.

24
Fry, J., Xian, G., Jin, S., Dewitz, J., Homer, C., Yang, L., and Wickham, J. D.: Completion of the 2006 national land cover
database for the conterminous United States, Photogram. Eng. Rem. S., 77, 858-864, ISSN: 0099-1112, 2011.
Gessesse, B., Bewket, W., and Brauning, A.: Model-based characterization and monitoring of runoff and soil erosion in
response to land use/land cover changes in the Modjo Watershed, Ethiopia, Land Degrad. Dev., 26: 711-724, doi: 10.
1002/ldr.2276, 2015. 5
Ghaemi, M., Astaraei, A. R., Sanaeinejad, S. H., and Zare, H.: Using satellite data for soil cation exchange capacity studies,
Int. Agrophys., 27, 409-417, doi: 10.2478/intag-2013-0011, 2013.
Ghassemi, F., Jakeman, A. J., and Nix, H. A.: Salinization of land and water resources: Human causes, management and case
studies. Centre for Resources and Environmental Studies, ANU, Canberra. University of New South Wales Press, Sydney,
Australia. pp562, 1995. 10
Gibson, P., and Power, C.: Introductory Remote Sensing: Digital Image Processing and Applications, Route ledge, pp 92-
112, 2000.
Gupta, P. K.: Methods in Environmental Analysis Water Soil and Air, 2nd
ed. 229-231. Bharat Printers, 2007.
Hill, M. J., Braaten, R., Veitch, S. M., Lees, B. G., and Sharma, S.: Multi-criteria decision analysis in spatial decision
support: the ASSESS analytic hierarchy process and the role of quantitative methods and spatially explicit analysis, Environ. 15
Modell.Softw., 20, 955-976, doi:10.1016/j.envsoft.2004.04.014, 2005.
http:// www.dird-pune.gov.in/phec.htm. Accessed on Nov. 6, 2014.
http:// www.glcf.umd.edu/. Accessed on Dec. 17, 2015.
http:// www.usgs.gov/. Accessed on Dec. 17, 2015.
http://www.mssanz.org.au/MODSIM07/papers/46_s60/UsingRemotes60_Abbas_.pdf. Accessed on July 09, 2016. 20
ICAR (Indian Council of Agricultural Research): State of Indian Agriculture, 2012-2013. A report of Department of
Agriculture and Cooperation, New Delhi.9, 2010.
IS (Indian Standard): Method of test for soils. Determination of the specific electrical conductivity of soils.IS: 14767-2000,
2000.
IS (Indian Standard): Methods of test for soils. Determination of pH value.IS: 2720, part 1-1983, 1987. 25
Jadhav, M. R. S., and Nagarale, V.: Changing land use pattern: A case study of Khedtahsil of the Pune district, Maharashtra
state, Golden Research Thoughts, 1, 1-4, 2011.
Jensen, J. R.: Introductory Digital Image Processing: A Remote Sensing Perspective, 2nd
ed. Prentice Hall, Inc., Upper Saddle
River, New Jersey, USA, 1996.
Jin-Song, D., Ke, W., Jun, L. I., and Yan-Hua, D.: Urban Land Use Change Detection Using Multi sensor Satellite Images. 30
Soil Science Society of China, Pedosphere, 19, 96-103, doi: 10.1016/S1002-0160(08)60088-0, 2009.
Khaledian, Y., F. Kiani, S. Ebrahimi, E. C. Brevik, and J. Aitkenhead-Peterson. Assessment and monitoring of soil
degradation during land use change using multivariate analysis, Land Degrad. Dev., doi:10.1002/ldr.2541, 2016.
Solid Earth Discuss., doi:10.5194/se-2016-172, 2017Manuscript under review for journal Solid EarthPublished: 2 January 2017c© Author(s) 2017. CC-BY 3.0 License.
25
Kimpe, C. R. de., and Warkentin, B. P.: Soil functions and the future of natural resources. In: Blume, H. P., Eger, H.,
Fleischhauer, E., Hebel, A., Reij, C., and Steiner, K. G. (eds.). Towards sustainable land use: Furthering cooperation
between people and institutions, Adv. Geoecol., 1, 3-10, 1998.
Leh, M., Bajwa, S., and Chaubey, I.: Impact of land use change on erosion risk: An integrated remote sensing, geographic
information system and modelling methodology, Land Degrad. Dev., 24, 409- 421, doi: 10.1002/ldr.1137, 2013. 5
Lillesand, T. M.and Kiefer, R. W.: Remote Sensing and Image Interpretation 3rd
ed.:John Wiley and Sons, New York. 161-
163, 1994.
Liu, G. M., Yang, J. S., and Yao, R. J.: Electrical conductivity in soil extracts: Chemical factors and their intensity. Institute
of Soil Science, Chinese Academy of Sciences, Nanjing (China), Pedosphere, 16, 100-107, doi: 10.1016/S1002-
0160(06)60031-3, 2006. 10
Low, P. S. (ed): Economic and social impacts of desertification, land degradation and drought. White Paper I. UNCCD 2nd
Scientific Conference, prepared with the contributions of an international group of scientists, 2013.
http://2sc.unccd.int/fileadmin/unccd/upload/documents/WhitePapers/White_Paper_1.pdf; Accessed on September 16, 2016.
Lugo, A. E.: The future of the forest: Ecosystem rehabilitation in the tropics, Environment, 30, 16-20, 41- 45,
doi:10.1080/00139157.1988.9930900, 1988. 15
Manua, A. K.and Sharma, R. C.: Computerized database on salt affected soils of Haryana state, J. Indian Soc. Remote,33,
447-455, doi: 10.1007/BF02990017, 2005.
Mathew, J.: Wizard Geography for General Studies, 7th
ed. Career Classics: New Delhi, India. 55, 2014.
Mehrjardi, R. T., Taze, M., Mahmoodi, Sh., and Saheb, J. E.: Accuracy Assessment of Soil Salinity Map in Yazd-Ardakan
Plain, Central Iran, Based on Landsat ETM+ Image, Am. Eurasian J. Agric. Environ. Sci.,3, 708-712, ISSN 1818-6769, 20
2008.
Metternicht, G. I., and Zinck, J. A.: Remote sensing of soil salinity: potentials and constraints, Remote Sens. Environ., 5812,
1-20, doi: 10.1016/S0034-4257(02)00188-8, 2002.
Mohawesh, Y., Taimeh, A., and Ziadat, F.: Effects of land usechanges and conservation measures on land degradation under
a Mediterranean climate, Solid Earth Discuss., 7, 115-145, doi: 10.5194/sed-7-115-2015, 2015. 25
Munoz-Rojas, M., Jordan, A., Zavala, L. M., Dela, R. D., Abd-Elmabod, S. K., and Anaya-Romero, M.: Impact of Land Use
and Land Cover Changes on Organic Carbon Stocks in Mediterranean Soils (1956-2007). Land Degrad. Dev., 26, 168-179,
doi: 10.1002/ldr.2194, 2015.
Nachtergaele, F., Petri, M., Biancalani, R., Van Lynden, G., and Van Velthuizen, H.: Global land degradation information
system (GLADIS). Beta Version. An information database for land degradation assessment at global level. Land 30
Degradation Assessment in Drylands Technical Report, no. 17. FAO, Rome, Italy, 2010.
Novara, A., Gristina, L., Guaitoli, F., Santoro, A., and Cerda, A.: Managing soil nitrate with cover crops and buffer strips in
Sicilian vineyards, Solid Earth, 4, 255-262, doi:10.5194/se-4-255- 2013, 2013.
Solid Earth Discuss., doi:10.5194/se-2016-172, 2017Manuscript under review for journal Solid EarthPublished: 2 January 2017c© Author(s) 2017. CC-BY 3.0 License.
26
Ochoa, P. A., Fries, A., Mejia, D., Burneo, J. I., Ruiz-Sinoga, J. D., and Cerda, A.: Effects of climate, land cover and
topography on soil erosion risk in a semiarid basin of the Andes, Catena, 140, 31-42, doi: 10.1016/j.catena.2016.01.011,
2016.
Olang, L. O., Kundu, P. M., Ouma, G., and Furst, J.: Impact of land cover change scenarios on storm runoff generation: A
basis for management of the Nyando basin, Kenya, Land Degrad. Dev., 25, 267-277, doi:10.1002/ldr.2140, 2014. 5
Omuto, C. T., Balint, Z., and Alim, M. S.: A framework for national assessment of land degradation in the drylands: A case
study of Somalia, Land Degrad. Dev., 25, 105-119, 2014.
Pallavicini, Y., Alday, J. G., and Martinez-Ruiz, C. F.: Factors affecting herbaceous richness and biomass accumulation
patterns of reclaimed coal mines, Land Degrad. Dev., doi:10.1002/ldr.2198, 2014.
Petit, C., Scudder, T., and Lambin, E.: Quantifying processes of land-cover by remote sensing, resettlement and rapid land-10
cover change in south-eastern Zimbabwe remote sensing, Int. J. Remote Sens., 22, 3435-3456,
doi:10.1080/01431160010006881, 2001.
Prakasam, C.: Land use and land cover change detection through remote sensing approach: A case study of Kodaikanaltaluk,
Tamil Nadu, International Journal of Geomatics and Geosciences, 1, 150-158, ISSN 0976-4380, 2010.
Sadeghravesh, Hassan M., Khosravi, H., and Ghasemian, S.: Assessment of combating-desertification strategies using the 15
linear assignment method, Solid Earth, 7, 673-683. doi: http://dx.doi.org/10.5194/se-7-673-2016
Sala, O. E., Chapin III, F. S., Armesto, J. J., Berlow, E., Bloomfield, J., Dirzo, R., Huber-Sanwald, E., Huenneke, L. F.,
Jackson, R. B., and Kinzig, A.: Global Biodiversity Scenarios for the Year 2100, Science, 287, 1770-1774, doi:
http://dx.doi.org/10.1126/science.287.5459.1770, 2000.
Silambarasan, K., Vinaya, M. S., and Babu, S. S.: Urban Sprawl Mapping and Landuse Change Detection in and around 20
Udupi Town: A Remote Sensing based Approach, Int. J. Sci. Res. Eng. Technol., 2, 815-820, ISSN 2278-0882, 2014.
Slinger, D. and Tenison, K.: Salinity Glove Box Guide: NSW Murray &Murrumbidgee Catchments, NSW Department of
Primary Industries. In: Irrigation Salinity Causes and Impacts, October 2009, 2007. http://www.dpi.nsw.gov.au/primefacts
Sommer, S., Hill, J., and Megier, J.: The potential of remote sensing for monitoring rural land use changes and their effects
on soil conditions, Agric. Ecosyst. Environ., 67, 197-209, 1998. 25
Srinivasarao, C. H., Venkateswarlu, B., Lal, R., Singh, A. K., Kundu, S., Vittal, K. P. R., Patel, J. J., and Patel, M. M.: Long-
term manuring and fertilizer effects on depletion of soil organic carbon stocks under pearl millet-cluster bean-castor rotation
in western India, Land Degrad. Dev., 25, 173-183, doi:10.1002/ldr.1158, 2014.
State of Environment Punjab: A Report by Punjab State Council for Science & Technology, Chandigarh in collaboration
with The Energy & Resources Institute (TERI), New Delhi. pp 83, 2007.http://www.punenvis.nic.in& 30
http://www.punjabenvironment.com.Accessed on May 17, 2016.
Stimson, H. C., Breshears, D. D., Ustin, S. L., and Kefauver, S. C.: Spectral sensing of foliar water conditions in two co-
occurring conifer species: PinusedulisandJuniperusmonosperma, Remote Sens. Environ., 96, 108-118, doi:
http://dx.doi.org/10.1016/j.rse.2004.12.007, 2005.
Solid Earth Discuss., doi:10.5194/se-2016-172, 2017Manuscript under review for journal Solid EarthPublished: 2 January 2017c© Author(s) 2017. CC-BY 3.0 License.

27
Stringer, L. C., and Harris, A.: Land degradation in Dolj county, southern Romania: environmental changes, impacts and
responses, Land Degrad. Dev., 25, 17-28, 2014.
Sujatha, G., Dwivedi, R. S., Sreenivas, K., and Venkataratnam, L.: Mapping and monitoring of degraded lands in part of
Jaunpur district of Uttar Pradesh using temporal spaceborne multispectral data, Int. J. Remote Sens., 21, 519-531,
doi:10.1080/014311600210722, 2000. 5
Symeonakis, E., Karathanasis, N., Koukoulas, S., and Panagopoulos, G.: Monitoring sensitivity to land degradation and
desertification with the environmentally sensitive area index: The Case of Lesvos Island, Land Degrad. Dev., 27, 1562-1573.
doi:10.1002/ldr.2285, 2016.
Taguas, E. V., Arroyo, C., Lora, A., Guzman, G., Vanderlinden, K., and Gomez, J. A.: Exploring the linkage between
spontaneous grass cover biodiversity and soil degradation in two olive orchard micro-catchments with contrasting 10
environmental and management conditions, The Soil, 1, 651–664, doi: 10.5194/soil-1-651-2015, 2015.
Tiwana, N. S., Jerath, N., Ladhar, S. S., Singh, G., and Paul, R.: State of Environment Punjab. A Report by Punjab State
Council for Science & Technology (PSCST), Chandigarh in collaboration with The Energy & Resources Institute (TERI),
83, New Delhi, 2007. http://www.punenvis.nic.in&www.punjabenvironment.com. Accessed on May, 17, 2016.
Vagen, T. G., Shepherd, K. D., and Walsh, M. G.: Sensing landscape level change in soil fertility following deforestation 15
and conversion in the highlands of Madagascar using Vis-NIR spectroscopy, Geoderma, 133, 281-294,
doi:10.1016/j.geoderma.2005.07.014, 2006.
Verheye, W. and Paul, W.: Land Use Planning for Sustainable Development, University of Gent, Belgium, 1997.
Verma, S. C., Jain, R. K., Rao, M. V., Misra, P. N., and Murty, A. S.: Influence of canopy on soil composition of man-made
forest in alkali soil of Banthra (Lucknow), Indian For., 108, 431- 437, ISSN No. 0019-4816, 1982. 20
Wu, J.: Environmental amenities, urban sprawl, and community characteristics, J. Environ. Econ.Manage., 52, 527-547,
2006.
Yazdani, M., Monavari, S. M., Omrani, G. A., Shariat, M., Hosseini, S. M.: Landfill site suitability assessment by means of
geographic information system analysis. Solid Earth, 6, 945-956, doi: http://dx.doi.org/10.5194/se-6-945-2015, 2015.
Zhang, J., Niu, J., Bao, T., Buyantuyev, A., Zhang, Q., Dong, J., and Zhang, X.: Human induced dryland degradation in 25
Ordos plateau, China, revealed by multi-level statistical modelling of normalized difference vegetation index and rainfall
time series, J. Arid Land, 6, 219-229, doi: 10.1007/s40333-013-0203-x, 2014.
Zhang, Y. B., Deng, A. Y., and Zhuang, T. C.: Relation between soil salinity in intertidal zone and electric conductivity,
Ecology and Environment, 12, 164-165, doi:10.5846/stxb201305311254, 2003.
Zhao, X., Dai, J., and Wang, J.: GIS-based evaluation and spatial distribution characteristics of land degradation in Bijiang 30
watershed. International Conference on Combating Land Degradation in Agricultural Areas (ICCLD’10) Zian City, PR
China. 11-15 October 2010. SpringerPlus, 2(Supplement 1): S8, doi: 10.1186/2193-1801-2-S1-S8, 2013.
Solid Earth Discuss., doi:10.5194/se-2016-172, 2017Manuscript under review for journal Solid EarthPublished: 2 January 2017c© Author(s) 2017. CC-BY 3.0 License.

28
Zubair, O. A.: Monitoring the Growth of Settlements in Ilorin, Nigeria (A GIS and Remote Sensing ach). Appro The
International Archives of the Photogrammetry, Remote Sensing and Spatial Information Sciences. Vol. XXXVII. Part B6b.
Beijing 2008, 2006.
5
Solid Earth Discuss., doi:10.5194/se-2016-172, 2017Manuscript under review for journal Solid EarthPublished: 2 January 2017c© Author(s) 2017. CC-BY 3.0 License.