
Differences in Occupants' Satisfaction and Perceived ... - MDPI
Upload
khangminh22Category
view
1download
0
ASSESSING THE PERCEIVED
SERVICE QUALITY LEVELS IN
THE LIBYAN PRIVATE AND
PUBLIC BANKING SECTORS: A
CUSTOMER PERSPECTIVE
ASHRAF ELMAYAR
A thesis submitted in partial fulfilment of the
requirements of the University of Northumbria
at Newcastle Upon Tyne for the degree of
Doctor of Philosophy in Business and
Management
March 2011
ii
ABSTRACT
It is increasingly being recognised that service quality has a strong correlation with customer
satisfaction. Researchers have debated the topic of private banking sector versus public
banking sector in both Western and Far East countries, and found that the private banking
sector outperforms the public banking sector in many areas, including productivity,
efficiency, and profitability. However, literature and empirical studies on banking service
quality in Libya are scarce, and this potentially impacts on organisation performance. This
research aimed to assess and compare the levels of service quality provided by the Libyan
private and public banking sectors to identify if there are significant differences between the
private and public banking sectors in terms of service quality levels, as perceived by bank
customers.
The research adopted a survey questionnaire based on the amended Banking Service Quality
Scale. It included six service quality dimensions, broken down into 31 statements, for
capturing the wide range of services offered by banks. A total of 2000 questionnaires were
administered to customers of the two banking sectors (public and private) and 740 (370 from
each sector) were returned, which amounts to a 37% response rate.
The research findings show that there are significant differences between the Libyan private
and public banking sectors in terms of customer perceptions of service quality and the degree
of importance attached to various dimensions of service quality. The results also suggest
there is a relationship between bank status and customers‟ age, occupation, number of branch
visits, and period of relationship with a bank. The study has revealed, however, that there is
no relationship between customer gender and bank status.
The research has significant implications for Libyan banks in terms of developing
operational, marketing and human resource strategies, and can help Libyan banks to
incorporate service quality issues into their strategic planning. The study may be useful for
application in countries with a similar banking culture as Libya.
This study contributes to the understanding of service quality in terms of the Libyan banking
context. The added value of this study emanates from the fact the research was conducted in
Libya (a developing country with an extremely limited amount of service quality research
conducted therein), and the fact it measured and assessed the service quality in both Libyan
private and public banking sectors which form, along with the central bank, the entire Libyan
banking system.
Key Words: Service quality, private banking sector, public banking sector, Libya, Banking
Service Quality, service quality measurement.

iii
TABLE OF CONTENTS
ABSTRACT ................................................................................................................................. ii
TABLE OF CONTENTS ............................................................................................................. iii
LIST OF TABLES ....................................................................................................................... ix
LIST OF FIGURES ..................................................................................................................... xi
ACKNOWLEDGEMENT........................................................................................................... xii
DEDICATION .......................................................................................................................... xiii
DECLARATION ........................................................................................................................xiv
Chapter 1: Introduction to the Thesis .........................................................................................2
1.0 Introduction .............................................................................................................................2
1.1 Libyan Banking System ...........................................................................................................2
1.1.1 The structure of the banking sector in Libya ......................................................................2
1.1.2 Central Bank of Libya .......................................................................................................3
1.2 The Importance of the Study ....................................................................................................4
1.3 Research Aim...........................................................................................................................6
1.4 Research Question....................................................................................................................6
1.5 Research Objectives .................................................................................................................6
1.6 What This Research Will Do ....................................................................................................7
1.7 Structure of the Thesis ..............................................................................................................8
1.7.1 Chapter One ......................................................................................................................8
1.7.2 Chapter Two......................................................................................................................8
1.7.3 Chapter Three ....................................................................................................................8
1.7.4 Chapter Four .....................................................................................................................9
1.7.5 Chapter Five ......................................................................................................................9
1.7.6 Chapter Six ..................................................................................................................... 10
1.7.7 Chapter Seven ................................................................................................................. 10
Chapter 2: Service Quality Concept .......................................................................................... 15
2.0 Introduction ........................................................................................................................... 15
2.1 Definitions of Service Quality ................................................................................................ 15
2.2 General Characteristics of Service Necessary for Measuring Quality ...................................... 23
2.3 Service Quality Perceptions .................................................................................................... 24
2.4 Customer Expectations ........................................................................................................... 27
2.4.1 Expectations concept ....................................................................................................... 27
2.4.2 How expectations are formed........................................................................................... 29
2.4.3 Factors influencing expectations ...................................................................................... 29

iv
2.4.3.1 Factors influencing desired expectations ................................................................... 32
2.4.3.2 Factors influencing adequate expectations ................................................................. 32
2.5 Service quality models ........................................................................................................... 33
2.5 1 North American school .................................................................................................... 34
2.5.1.1 The antecedents of service quality gaps ..................................................................... 37
2.5.2 Nordic school .................................................................................................................. 41
2.5.3 Hierarchical Model .......................................................................................................... 44
2.5.4 Other service quality models ............................................................................................ 47
2.6 The Importance of Service Quality ......................................................................................... 61
2.6.1 Achieving customer satisfaction ...................................................................................... 62
2.6.2 Achieving customer loyalty and retention ........................................................................ 64
2.6.3 Enhancing financial performance ..................................................................................... 66
2.6.4 Ensuring the success of marketing strategy ...................................................................... 66
2.6.5 Enhancing IT capability to improve customer orientation ................................................. 67
2.6.6 Ensuring service interaction is well-developed ................................................................. 67
2.6.7 Focusing on „easily doing business‟ with customers ......................................................... 68
2.7 Perceived Service Quality Improvement ................................................................................. 68
2.7.1 Regular measurement of service quality ........................................................................... 69
2.7.2 Investment in service quality processes and systems ........................................................ 70
3.7.3 Empowering employees to implement a high level of service quality ............................... 72
2.8 Conclusion ............................................................................................................................. 74
Chapter 3: Measuring Service Quality ...................................................................................... 77
3.0 Introduction ........................................................................................................................... 77
3.1 Service Quality Dimensions ................................................................................................... 77
3.2 The SERVQUAL Instrument.................................................................................................. 80
3.2.1 SERVQUAL instrumentation .......................................................................................... 81
3.2.1.1 SERVQUAL expectation measure (E) ...................................................................... 81
3.2.1.2 SERVQUAL perception measure .............................................................................. 81
3.2.1.3 The structure of the SERVQUAL instrument ............................................................ 81
3.2.2 SERVQUAL related research .......................................................................................... 82
3.2.2.1 The implications of SERVQUAL within service industries ....................................... 82
3.2.2.2 The value of the SERVQUAL instrument ................................................................. 83
3.2.2.3 SERVQUAL criticisms ............................................................................................. 85
3.3 Measuring Service Quality in a Specific Banking Context ...................................................... 88
3.3.1 Possible measurement solution ........................................................................................ 98
3.3.1.1 Bahia and Nantel‟s Scale (BSQ) ............................................................................... 98

v
3.3.1.2 Positive issues related to the BSQ Scale .................................................................. 101
3.4 Conclusion ........................................................................................................................... 102
3.4.1 Chapter summary .......................................................................................................... 102
Chapter 4: Private Banking Sector versus Public Banking Sector ......................................... 104
4.0 Introduction ......................................................................................................................... 104
4.1 Retail Banking ..................................................................................................................... 104
4.1.1 History of retail banking ................................................................................................ 104
4.1.2 Structure of retail banking ............................................................................................. 105
4.2 An Overview of the Differences between Private and Public Banking Sectors ...................... 106
4.3 Private versus Public Banks.................................................................................................. 107
4.3.1 Private versus public banks in a specific western context ............................................... 107
4.3.2 Private versus public banks in an Asian context ............................................................. 109
4.4 Connecting the Literature Gap to the Research Question....................................................... 112
4.5 Summary of the Key Findings from the Review of the Literature .......................................... 115
4.6 Chapter Summary ................................................................................................................ 117
Chapter 5: Research Methodology and Methods .................................................................... 119
5.0 Introduction ......................................................................................................................... 119
5.1 Chapter Objective ................................................................................................................ 119
5.2 Research Question................................................................................................................ 119
5.3 Research Objectives ............................................................................................................. 120
5.4 The Research Hypotheses ..................................................................................................... 120
5.5 Overview of the Research Process ........................................................................................ 121
5.6 Elements of the Research Process ......................................................................................... 123
5.8 Issues of Research Methodology and Methods...................................................................... 127
5.8.1 The choice of research strategy ...................................................................................... 127
5.8.2 Quantitative versus qualitative research methods ........................................................... 128
5.8.3 Justification for using a quantitative strategy in the present research study ..................... 132
5.8.4 Categories of research design......................................................................................... 132
5.9 Methods of Data Collection: Quantitative Survey (questionnaire) ......................................... 132
5.9.1 Research scale and data collection method ..................................................................... 134
5.10 Scale Pilot-testing............................................................................................................... 137
5.10.1 Feedback from pilot study............................................................................................ 140
5.11 Sampling Plan .................................................................................................................... 143
5.11.1 Sampling methods ....................................................................................................... 144
5.11.1.1 Probability sampling ............................................................................................. 144
5.11.1.2 Non probability sampling ...................................................................................... 145
vi
5.11.2 Sampling Procedure ..................................................................................................... 147
5.11.3 Determining the sample size ........................................................................................ 148
5.11.4 The sampling choice, location, and unit ....................................................................... 149
5.12 Methods of Research Statistical Analysis ............................................................................ 153
5.12.1 What Independent Samples T-Test? ............................................................................. 153
5.12.1.1 Why Independent Samples T-Test? ....................................................................... 154
5.12.2 What is factor analysis? ............................................................................................... 154
5.12.2.1 Why exploratory factor analysis? .......................................................................... 156
5.12.3 What is Cronbach‟s coefficient alpha test? ................................................................... 156
5.12.3.1 Why Cronbach‟s coefficient alpha test?................................................................. 157
5.12.4 What is Chi-Square? .................................................................................................... 157
5.12.4.1 Why Pearson‟s chi-square? ................................................................................... 157
5.13 Sources of Research Data: Primary and Secondary Sources ................................................ 157
5.15 Chapter Summary............................................................................................................... 159
Chapter 6: Data Analysis and Findings .................................................................................. 162
6.0 Introduction ......................................................................................................................... 162
6.1 Chapter Aims and Objectives ............................................................................................... 162
6.2 Research Hypotheses, Settings, Sampling and Procedures .................................................... 163
6.2.1 Research hypotheses ...................................................................................................... 163
6.2.2 Research settings, participants and demographic issues .................................................. 164
6.2.2.1 Private Banking Sector ........................................................................................... 165
6.2.2.2 Public banking sector .............................................................................................. 166
6.2.3 The response rate ........................................................................................................... 169
6.2.4 Ethical issues ................................................................................................................. 169
6.3 Questionnaire Data Analysis ................................................................................................ 169
6.3.1 Data analysis (Phase 1): Levels of service quality .......................................................... 169
6.3.1.1 Effectiveness and assurance dimension ................................................................... 170
6.3.1.2 Access dimension ................................................................................................... 171
6.3.1.3 Price dimension ...................................................................................................... 171
6.3.1.4 Tangibles dimension ............................................................................................... 172
6.3.1.5 Services portfolio dimension ................................................................................... 173
6.3.1.6 Reliability dimension .............................................................................................. 174
6.3.2 Data analysis (Phase 2): Hypotheses testing ................................................................... 176
6.3.3 Data analysis (Phase 3) Comparison between the Libyan private and public banks‟
customers in terms of the degree of importance attached to various dimensions of service quality.
.............................................................................................................................................. 182
vii
6.3.3.1 Factor analysis results: Private banking sector ......................................................... 183
6.3.3.2 Factor Analysis Results: Public Banking Sector ...................................................... 189
6.3.4 Data analysis (Phase 4): Analysing participants‟ characteristics according to bank Status
.............................................................................................................................................. 196
6.3.4.1 Pearson‟s Chi-Square test of participants‟ gender according to banking sector ......... 196
6.3.4.2 Pearson‟s Chi-Square test of participants‟ age according to bank status ................... 197
6.3.4.3 Pearson‟s Chi-Square test of participants‟ occupation according to bank status ........ 199
6.3.4.4 Pearson‟s Chi-Square test of participants‟ number of branch visits according to bank
status 201
6.3.4.5 Pearson‟s Chi-Square test of participants‟ relationship with bank (duration of
relationship with bank) according to banking sector ............................................................ 202
6.4 Discussion on the Study‟s Statistical Tests‟ Results .............................................................. 203
6.4.1 Mean scores of customers‟ perceptions of service quality............................................... 203
6.4.2 Independent Samples T-Test results (testing research hypotheses) ................................. 206
6.4.3 Exploratory Factor Analysis results ............................................................................... 207
6.4.4 Pearson‟s Chi-Square test results ................................................................................... 209
6.4.5 The current difficulties confronting public banks in Libya.............................................. 210
6.4.5.1 Managerial Difficulties ........................................................................................... 211
6.4.5.2 Accessibility and technology-related difficulties ..................................................... 214
6.5 Summary of Research Outcomes .......................................................................................... 214
6.6 Chapter Summary ................................................................................................................ 216
Chapter 7: Conclusion and Recommendations ....................................................................... 219
7.0 Introduction ......................................................................................................................... 219
7.1 Chapter Objective ................................................................................................................ 219
7.2 Brief Review ........................................................................................................................ 219
7.2.1 Brief review of research theoretical background............................................................. 220
7.2.2 Review of research findings ........................................................................................... 222
7.3 Implications of the study ...................................................................................................... 225
7.3.1 Theoretical implications ................................................................................................ 225
7.3.2 Managerial implications ................................................................................................ 225
7.3.3 Implications for marketing management practices .......................................................... 228
7.3.3.1 Monitoring customer perceptions of service quality................................................. 228
7.3.3.2 Application of the service quality instrument........................................................... 228
7.3.3.3 Marketing segmentation .......................................................................................... 230
7.3.3.4 Service quality improvement process ...................................................................... 230
7.4 Research Contribution to Knowledge and Distinctiveness ..................................................... 230
7.5 Research Limitations and Issues of Generalisation ................................................................ 232

viii
7.6 Recommendations for Future Studies ................................................................................... 233
References ................................................................................................................................ 235
Appendixes ............................................................................................................................... 262

ix
LIST OF TABLES
Table 2.1 General Definitions of Service Quality 17
Table 2.2 The Frequency of the Service Quality Definitions within the Last Four Decades
19
Table 2.3 Takenchi and Quelch Table of Quality Perception Factors 26
Table 2.4 The Differences between North American School Model,
Nordic School Model, and Hierarchical Model
46
Table 2.5 Primary Focus of Service Quality Models 58
Table 2.6 Similarities in the Focus of Service Quality Models 59
Table 3.1 SERVQUAL‟s Theoretical and Operational Criticisms 87
Table 3.2 Review of Replication Studies of the SERVQUAL scale 92
Table 3.3 Review of Comparative Studies between SERVQUAL and
Other Models
93
Table 3.4 Review of Studies Created Niche Scales by Modifying
SERVQUAL Model or by Using Alternative Service Quality Dimensions
94
Table 5.1 Elements of Research Process 124
Table 5.2
The Description of Objectivism, Subjectivism and
Constructionism
125
Table 5.3 Comparison of the Two Major Philosophical Stances 126
Table 5.4 Fundamental Differences between Qualitative and
Qualitative Research Strategies
127
Table 5.5 The Strengths and Limitations of Quantitative Research 129
Table 5.6 The Strengths and Limitations of Qualitative Research 130
Table 5.7 Differences between Quantitative and Qualitative Research Methods
131
Table 5.8 The Revised Items of the BSQ Scale 142
Table 5.9 Literature Evidences on Using Non-Probability Sampling 147
Table 6.1 Bank Customers‟ Demographic Characteristics 167
Table 6.2 Mean Effectiveness and Assurance Scores for Customers‟
Perceptions
170
Table 6.3 Mean Access Scores for Customers‟ Perceptions 171
Table 6.4 Mean Price Scores for Customers‟ Perceptions 172
Table 6.5 Mean Tangibles Scores for Customers‟ Perceptions 172
Table 6.6 Mean Services Portfolio Scores for Customers‟ Perceptions 173
Table 6.7 Mean Reliability Scores for Customers‟ Perceptions 174
Table 6.8 The Results of Independent Samples T-Test Analysis of the
Effectiveness and Assurance Dimension
177
Table 6.9 The Results of Independent Samples T-Test Analysis of the
Access Dimension
178
Table 6.10 The Results of Independent Samples T-Test Analysis of the
Price Dimension
179
Table 6.11 The Results of Independent Samples T-Test Analysis of the
Tangibles Dimension
180
Table 6.12 The Results of Independent Samples T-Test Analysis of the
Services Portfolio Dimension
180
Table 6.13 The Results of Independent Samples T-Test Analysis of the
Reliability Dimension
181
Table 6.14 Total Variance Explained 185
Table 6.15 Scale Components Communalities 186
Table 6.16 Rotated Component Matrixa 187
Table 6.17 Summary of Results for Factor Analysis of the Scale
Dimensions
188
Table 6.18 Total Variance Explained 191
x
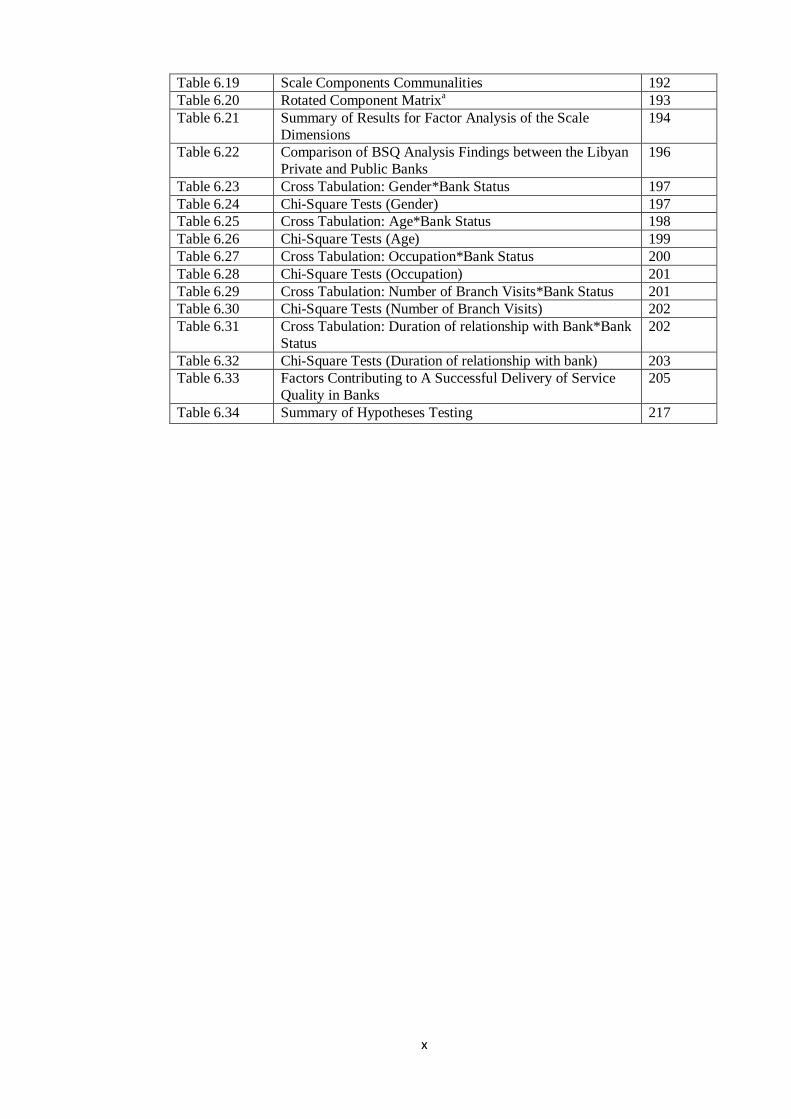
Table 6.19 Scale Components Communalities 192
Table 6.20 Rotated Component Matrixa 193
Table 6.21 Summary of Results for Factor Analysis of the Scale
Dimensions
194
Table 6.22 Comparison of BSQ Analysis Findings between the Libyan
Private and Public Banks
196
Table 6.23 Cross Tabulation: Gender*Bank Status 197
Table 6.24 Chi-Square Tests (Gender) 197
Table 6.25 Cross Tabulation: Age*Bank Status 198
Table 6.26 Chi-Square Tests (Age) 199
Table 6.27 Cross Tabulation: Occupation*Bank Status 200
Table 6.28 Chi-Square Tests (Occupation) 201
Table 6.29 Cross Tabulation: Number of Branch Visits*Bank Status 201
Table 6.30 Chi-Square Tests (Number of Branch Visits) 202
Table 6.31 Cross Tabulation: Duration of relationship with Bank*Bank
Status
202
Table 6.32 Chi-Square Tests (Duration of relationship with bank) 203
Table 6.33 Factors Contributing to A Successful Delivery of Service
Quality in Banks
205
Table 6.34 Summary of Hypotheses Testing 217
xi
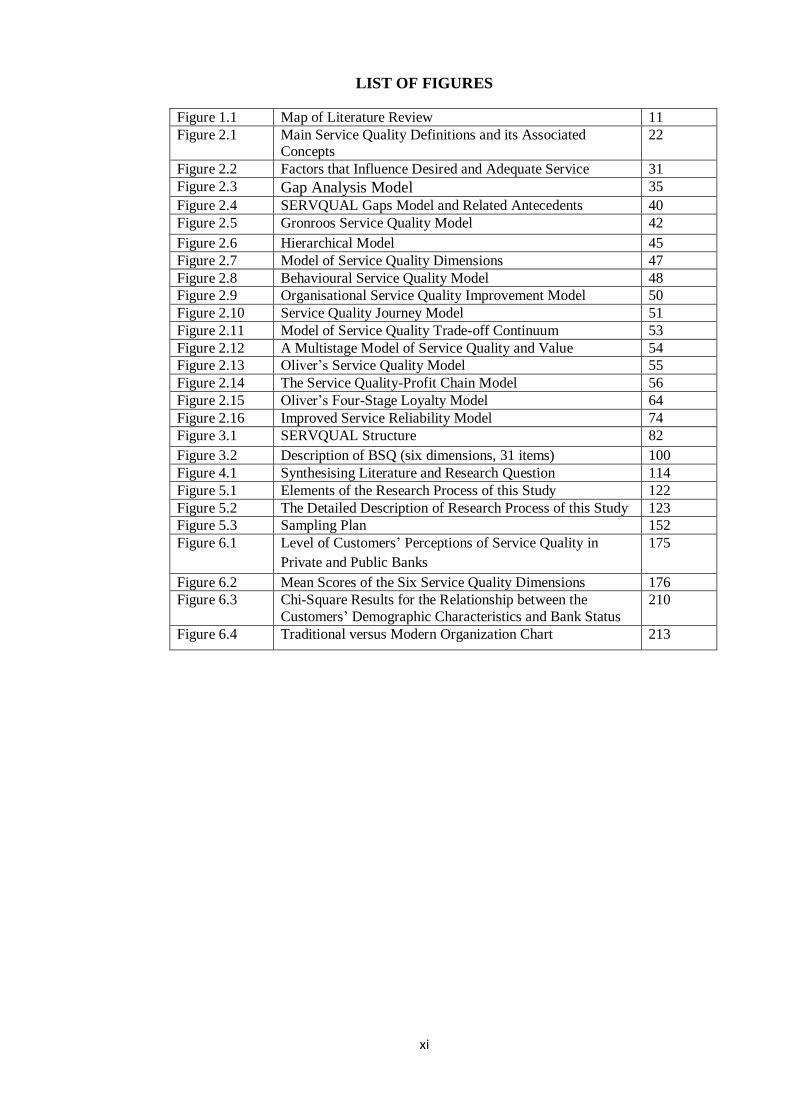
LIST OF FIGURES
Figure 1.1 Map of Literature Review 11
Figure 2.1 Main Service Quality Definitions and its Associated Concepts
22
Figure 2.2 Factors that Influence Desired and Adequate Service 31
Figure 2.3 Gap Analysis Model 35
Figure 2.4 SERVQUAL Gaps Model and Related Antecedents 40
Figure 2.5 Gronroos Service Quality Model 42
Figure 2.6 Hierarchical Model 45
Figure 2.7 Model of Service Quality Dimensions 47
Figure 2.8 Behavioural Service Quality Model 48
Figure 2.9 Organisational Service Quality Improvement Model 50
Figure 2.10 Service Quality Journey Model 51
Figure 2.11 Model of Service Quality Trade-off Continuum 53
Figure 2.12 A Multistage Model of Service Quality and Value 54
Figure 2.13 Oliver‟s Service Quality Model 55
Figure 2.14 The Service Quality-Profit Chain Model 56
Figure 2.15 Oliver‟s Four-Stage Loyalty Model 64
Figure 2.16 Improved Service Reliability Model 74
Figure 3.1 SERVQUAL Structure 82
Figure 3.2 Description of BSQ (six dimensions, 31 items) 100
Figure 4.1 Synthesising Literature and Research Question 114
Figure 5.1 Elements of the Research Process of this Study 122
Figure 5.2 The Detailed Description of Research Process of this Study 123
Figure 5.3 Sampling Plan 152
Figure 6.1 Level of Customers‟ Perceptions of Service Quality in
Private and Public Banks
175
Figure 6.2 Mean Scores of the Six Service Quality Dimensions 176
Figure 6.3 Chi-Square Results for the Relationship between the
Customers‟ Demographic Characteristics and Bank Status
210
Figure 6.4 Traditional versus Modern Organization Chart 213
xii
ACKNOWLEDGEMENT
This study was made possible due to the contribution of many people. Now that I have the
opportunity to express my gratitude to all of them, first and foremost I would like to state how
indebted and grateful I am to my direct supervisor, Dr Ike-Elechi Ogba. His wide knowledge
and logical way of thinking have been of great value to me. His guidance, encouragement,
support and invaluable professional advice have had an enormous impact on my thesis, and I
have learned a great deal from him. I would also like to thank my second supervisor, Mr Nigel
Coates, who kept an eye on the progress of my work and was always available when I needed
his advice.
I would like to thank Mr John Robinson, my previous principle supervisor, for his guidance
and support. A big thanks also goes to all the staff of Newcastle Business School, who
facilitated the completion of this research. My sincere thanks are due to Mrs Esha Smith, Mrs
Carol Miller and Mrs Sara Boon for their help during the period of my study.
I would like to express sincere gratitude to all my colleagues in the research suite at the
Newcastle Business School for their support and encouragement to complete this research.
I would like to thank the managers of the four commercial banks in Libya for their
cooperation. I would also like to thank all the respondents who completed the research
questionnaire. I wish to express appreciation to my brothers Fathalla, Mohammed and Kakhlid
for their great encouragement.
Finally, I would like to dedicate this work to my beloved country Libya.
Ashraf Elmayar, April 2011.

xiii
DEDICATION
To my wife, for her love, patience and sharing every moment with me during this work.
Without her, it would not have been possible.
To my mother, for everything she has done for me, especially including me in her prayers.
To the memory of my father, in remembrance of the sacrifice he made
so that this work was possible.
I dedicate this thesis to them for their love, patience, understanding, and sacrifice.

xiv
DECLARATION
This is to declare that I am responsible for the work submitted in this thesis, that the
thesis is my own except as specified in acknowledgments, and that this thesis has not
been submitted to any other institution.
Name
Signature
Date

1
Chapter One
Introduction to the Thesis

2
Chapter 1: Introduction to the Thesis
1.0 Introduction
The main purpose of this chapter is to present an outline of the research area and provide
justification for conducting this research. As the research is focused on the Libyan private
and public banking sectors, an introduction to the Libyan banking system is provided. This is
followed by a discussion on importance of the study.
The chapter also outlines and presents the research question, aim, and objectives. It also
discusses, in sections 1.5 and 1.6, the purpose of the research and what the research will do.
Section 1.7 presents the thesis structure.
1.1 Libyan Banking System
This thesis attempts to examine service quality levels in the Libyan private and public
banking sectors. It is thus important to briefly present the banking system operating in Libya.
1.1.1 The structure of the banking sector in Libya
The Libyan banking sector is dominated by the Central Bank of Libya and commercial
banks. Commercial banks have been major financial institutions since the first public bank
commenced operations in 1957. Local commercial banks consist of both state-owned and
privately owned banks. There are six state-owned commercial banks and eight private banks
in Libya. The public banks are Gumhouria Bank, National Commercial Bank, Sahara Bank,
Al Umma Bank, Wahda Bank, and Libyan Foreign Bank, while the private banks are
Commerce and Development Bank, Aman Bank for Commerce and Investment, Al-Wafa
Bank, Alejmaa Alarabi Bank, Mediterranean Bank, National Banking Corporation,
Development Bank, and Alsaraya Trading and Development Bank (Central Bank of Libya-
Banks Directory, 2009).
Currently, foreign banks are not allowed to offer retail services (Mahmud et al., 2008) but
can only open representative offices under the terms of law governing the Libyan banking
system. Foreign banks which have done so include the BACB (British Arab Commercial
Bank), the Arab Banking Corporation (ABC), Bank fur Arbeitund Wirtschaft, and more
recently, HSBC.
The entry of private banks to the market occurred in 1996 when the first private bank was
established (Bank of Commerce and Development), offering a range of retail banking
services in competition with public banks. Since that time, the growth and development of
the private banking sector in Libya has continued and reached eight private banks. In

3
contrast, the number of public banks stood at eleven in 1996, but was reduced by the Central
Bank of Libya to six banks in 2009. This indicates that the Libyan public banking sector
suffers from weaknesses in terms of performance and needs to be restructured. These
weaknesses associated with public banks in Libya have contributed to the growth of
privately-owned banks. In line with this view, the Central Bank of Libya announced in
November 2010 that in accordance with its plan for restructuring and modernizing the public
banking sector aimed at improving services, Gumhoria and Umma banks, the largest and the
fifth largest Libyan state owned commercial banks, would be merged (Almanara News,
2010). According to the Central Bank of Libya, the merger will provide access to better
products and services in the future, as well as provide access to a wide network of branches.
Furthermore, the Central Bank of Libya will attempt to make the new bank a modern and
profitable bank within the next few years.
1.1.2 Central Bank of Libya
One of the most important financial institutions in any modern economy is the country‟s
central bank. Generally, a central bank is an agency of the government that has the important
public policy functions of monitoring the operation of the financial system and controlling
the growth of money supply. Central banks ordinarily do not deal directly with the public;
rather, they are “bankers‟ banks”, communicating with commercial banks and securities
dealers to carry out their essential policy making functions.
The Central Bank of Libya (CBL) is 100% state-owned and represents the monetary
authority in Libya, enjoying the status of an autonomous corporate body. The law that
established the Central Bank of Libya stipulates that its objectives should be focused on
maintaining monetary stability in Libya, and promoting the sustained growth of the economy
in accordance with the general economic policy of the Libyan government. The CBL started
its operations on April 1st 1956, replacing the Libyan Currency Committee which was
established in 1951 and whose functions were focused on maintaining sterling assets against
the issue of local currency, thus having no role in controlling money supply or credit, or
supervising banks.
According to Alqadhafi (2002), the functions and policies of the Central Bank of Libya are:
1. Issuing Libyan banknotes.
2. Sustaining the stability of the internal and external value of Libyan currency.
3. Management of state reserves of gold and foreign exchange.
4. Regulating the credit and banking system policy within the framework of common
state policy, with the objective of achieving national economy and development
goals.
4
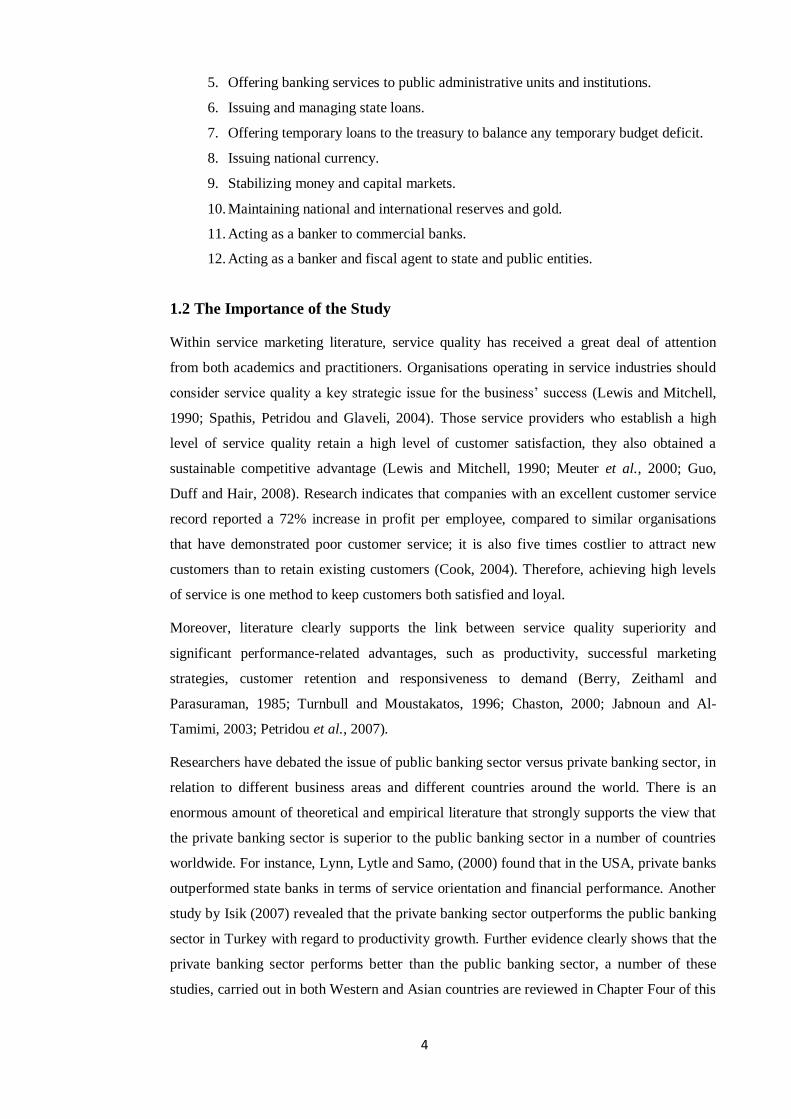
5. Offering banking services to public administrative units and institutions.
6. Issuing and managing state loans.
7. Offering temporary loans to the treasury to balance any temporary budget deficit.
8. Issuing national currency.
9. Stabilizing money and capital markets.
10. Maintaining national and international reserves and gold.
11. Acting as a banker to commercial banks.
12. Acting as a banker and fiscal agent to state and public entities.
1.2 The Importance of the Study
Within service marketing literature, service quality has received a great deal of attention
from both academics and practitioners. Organisations operating in service industries should
consider service quality a key strategic issue for the business‟ success (Lewis and Mitchell,
1990; Spathis, Petridou and Glaveli, 2004). Those service providers who establish a high
level of service quality retain a high level of customer satisfaction, they also obtained a
sustainable competitive advantage (Lewis and Mitchell, 1990; Meuter et al., 2000; Guo,
Duff and Hair, 2008). Research indicates that companies with an excellent customer service
record reported a 72% increase in profit per employee, compared to similar organisations
that have demonstrated poor customer service; it is also five times costlier to attract new
customers than to retain existing customers (Cook, 2004). Therefore, achieving high levels
of service is one method to keep customers both satisfied and loyal.
Moreover, literature clearly supports the link between service quality superiority and
significant performance-related advantages, such as productivity, successful marketing
strategies, customer retention and responsiveness to demand (Berry, Zeithaml and
Parasuraman, 1985; Turnbull and Moustakatos, 1996; Chaston, 2000; Jabnoun and Al-
Tamimi, 2003; Petridou et al., 2007).
Researchers have debated the issue of public banking sector versus private banking sector, in
relation to different business areas and different countries around the world. There is an
enormous amount of theoretical and empirical literature that strongly supports the view that
the private banking sector is superior to the public banking sector in a number of countries
worldwide. For instance, Lynn, Lytle and Samo, (2000) found that in the USA, private banks
outperformed state banks in terms of service orientation and financial performance. Another
study by Isik (2007) revealed that the private banking sector outperforms the public banking
sector in Turkey with regard to productivity growth. Further evidence clearly shows that the
private banking sector performs better than the public banking sector, a number of these
studies, carried out in both Western and Asian countries are reviewed in Chapter Four of this
5
research (Bei and Shang, 2006; Bonin, Hasan and Wachtel, 2002; Cornell et al., 2005;
Nakane and Weintraub, 2005; Braz, 1999; Megginson, 2005; Kangis and Kareklis, 2001).
However, there are only two studies which investigated the differences between the private
banking and public banking sectors in terms of service quality levels. The first study, carried
out in Greece, by Kangis and Voukelator (1997) found that the services offered by banks in
the private sector had a more favourable impact on customers‟ perceptions of quality
received than those services offered by banks in the public sector. The second study was
conducted in India and applied by Sureshchandar, Rajendran and Anantharaman (2003); the
study showed that in terms of customer perceptions of service quality, foreign banks seemed
to be performing well, followed by private sector banks and then public sector banks.
The originality and value of this research emanates from the fact that this research will be the
first comprehensive study to investigate the differences between the Libyan private and
public banking sectors, in terms of perceived service quality. There has been little research
carried out in the Libyan banking sector relating to service quality, it can therefore be argued
that literature on Libyan banking service quality is scarce and there are few empirical and
non-empirical studies covering this topic. For instance, there are only two studies that have
explored organisational issues within the Libyan banking sector. One of these studies was
undertaken by Twati and Gammack (2007), in which technology levels in the public banking
sector were examined, the researchers found that Libyan public banks still deal with
customers in an inefficient manual way. The second study was carried out by Elmayar
(2007) and measured the levels of service quality in the Bank of Commerce and
Development (a private bank), this study revealed that customers of the bank have high
perceptions of service quality. The limitations of the literature on this topic clearly show that
there is a gap in the area of research into Libyan banking service quality. Therefore, this
research will aim to fill the gap in the literature thus complementing and adding to previous
research by expanding the study of service quality to include Libyan banks, a context that is
characterised by the very limited research.
A study by Welsh and Raven (2006) on the importance of service quality to both customers
and employees in retail settings in a number of Arab countries, concluded that customers and
employees in those regions are unique in many ways and that more studies should be
conducted to understand service quality in different cultures. Moreover, service quality
issues in the banking industry, within developing economies, have long been neglected when
compared to research available in developed economies including Europe and the USA
(Angur, Nataraagan and Jahera, 1999). The literature clearly suggests conducting research on
service quality in different environmental circumstances as culture affects customer
perceptions of service quality (Loizides, 2005). This fact motivated the researcher to further
6
investigate and explore this area in Libya, a region that perhaps would benefit greatly from
research in the area of service quality.
From a research stand point, the present study is important because it will measure and
assess service quality in both the private and public banking sectors in Libya in order to
identify if there are any significant differences between the two groups of banks in terms of
customer perceptions of service quality. The two banking sectors, private and public are
competing against each other; therefore it was deemed appropriate to explore the extent to
which service perceptions compared among their customers. Moreover, it will identify the
areas of weakness with respect to service quality, and offer suitable solutions. In addition,
the research will identify the most important service quality dimensions for each banking
sector and will also analyse the relationship between the customer demographic variables
and the bank status of ownership, as demographic characteristics are an accepted basis for
segmenting markets and customers (Blech and Blech, 1993; Kotler and Armstrong, 1991).
Investigating these aspects will in fact add to the existing body of knowledge since there is a
lack of research in the region.
1.3 Research Aim
The aim of this study has been to identify if there are significant differences between the
Libyan private and public banking sectors in terms of service quality perceptions. By doing
so, this research has extended the study of private banking sector versus public banking
sector in relation to service quality perceptions to a non-Western setting, in which similar
studies are limited.
1.4 Research Question
As mentioned earlier, the aim of this research has been to identify whether there are any
significant differences between the Libyan private and public banking sectors in terms of
perceived service quality. In order to meet this research aim, the following research question
has been formulated:
Are there significant differences in customer perceptions of service quality within the
Libyan private and public banking sectors?
1.5 Research Objectives
The research aim comprises a number of objectives, as follows:
1. To explore literature on the concept of service quality.
2. To examine various approaches to measuring service quality, with a focus on
banking service quality measurement.
7
3. To identify the actual levels of service quality provided to bank customers by
Libyan private and public sector banks.
4. To identify the differences between Libyan private and public bank customers in
terms of the degree of importance they attach to various dimensions of service
quality.
5. To identify if customer demographic characteristics are related to the banking
sector they use (bank status).
6. To draw conclusions and recommendations that will help Libyan banks to deal
with service quality issues.
1.6 What This Research Will Do
Based on the research aim, the research has attempted to review related literature in order to
extract interrelated concepts of service quality, and also identify an appropriate instrument
for effective measurement of service quality levels in the Libyan private and public banking
sectors. Based on the outcomes originating from the literature review, this research has used
a standard scale to measure service quality within Libyan banks, as the literature clearly
suggests that a standard scale should be used when a study is comparative in nature. This
approach was seen as the most suitable and helped in the comparison of Libyan private
banks with public banks in terms of customer perceptions of service quality, thus addressing
the research aim, question and objectives.
The selected scale was piloted for scale validity and modification before the main data
collection. After preparing the questionnaire in its final version, 1000 questionnaires were
administered to each banking sector based on the selected sampling procedure.
Statistical methods have been used to help address the research aim, question and objectives.
These statistical methods are as follows:
1. Frequencies: to describe the respondents‟ characteristics.
2. Means: to identify the actual levels of service quality provided to Libyan private and
public bank customers, as described by the scale items (questionnaire statements).
3. Independent-Samples T-Test: to identify the significance of differences in the means
of customers‟ perceptions on the private and public banking sectors, as measured by
the thirty-one items included in the scale, thus testing the seven research hypotheses
at a statistically significant level (p > 0.05).
4. Factor analysis: to identify the differences between Libyan private and public bank
customers in terms of the degree of importance they attach to various dimensions of
service quality.
5. Cronbach‟s coefficient alpha test: to examine scale reliability and internal
consistency.

8
6. Chi-Square: to test the relationship between customers‟ demographic characteristics
and the type of banking sector they use.
Finally, the research extracts valuable insights and conclusions from the statistical test
results.
1.7 Structure of the Thesis
This thesis consists of seven chapters. An overview of these chapters is provided below.
1.7.1 Chapter One
Chapter One introduces the Libyan banking system. It also focuses on presenting the
importance of the study, research question, aim, and objectives. The chapter also discusses
what the research does and provides an overview of the thesis structure.
1.7.2 Chapter Two
The aim of Chapter Two is to introduce the topic of service quality and the many interrelated
concepts affecting it. The main area of discussion concerns the definitions of service quality.
Also, the formal models (theoretical framework) of service quality proposed by several
academics are presented, and service quality perceptions and expectations are discussed. An
extensive examination is made of the importance of service quality. Emphasis is placed on
the topic of perceived service quality improvement and related research studies found in the
literature.
1.7.3 Chapter Three
Chapter Three looks at the characteristics of services necessary for measuring quality, and
how service quality can be measured in the banking sector in particular. Therefore, the
purpose of the chapter is to discover an effective instrument for measuring service quality in
banks. Accordingly, it explores and seeks to understand major developments in the
measurement of service quality. It reviews existing literature regarding different service
quality scales in order to decide on a valid and reliable tool for measuring service quality in
the banking sector. The chapter is organised into sections that cover all of these aspects. The
first section deals with the general characteristics of services that help to measure quality.
The second section focuses on service quality dimensions originating from service quality
studies covering various service industries and countries. The third section sheds light on the
conceptual model of service quality as a basis for service quality measurement. The fourth
section focuses on providing a further understanding of service quality gaps identified in the
previous section. The fifth section sheds light on the background to the service quality gaps.
The sixth section outlines a well known instrument for measuring service quality, namely the

9
SERVQUAL instrument. Research showing its applicability, value, critique, and
modifications are reviewed. The last section reviews literature related to the instruments and
scales that are used to measure service quality in the banking sector. Chapter Three,
therefore, explains why they are the most appropriate instruments for effective measurement
of service quality in Libyan banks.
1.7.4 Chapter Four
The main objective of this chapter is to explore the findings and outcomes of research studies
on the topic of private banks versus public banks. Therefore, a review of existing literature is
carried out to discover the findings of studies covering private banks versus public banks in
both Western and Asian contexts in order to identify whether private or public banks are
superior in the countries investigated. The viewpoints and outcomes of these studies have
been used to develop the research hypotheses. This chapter, therefore, begins by providing a
short introduction to retail banks and their structure. An overview of the differences between
private banks and public banks is presented. This is followed by an outline of research into
private banks versus public banks in Western and Asian countries. Finally, the literature is
linked to the present study‟s research question, and a summary of the literature review is
given.
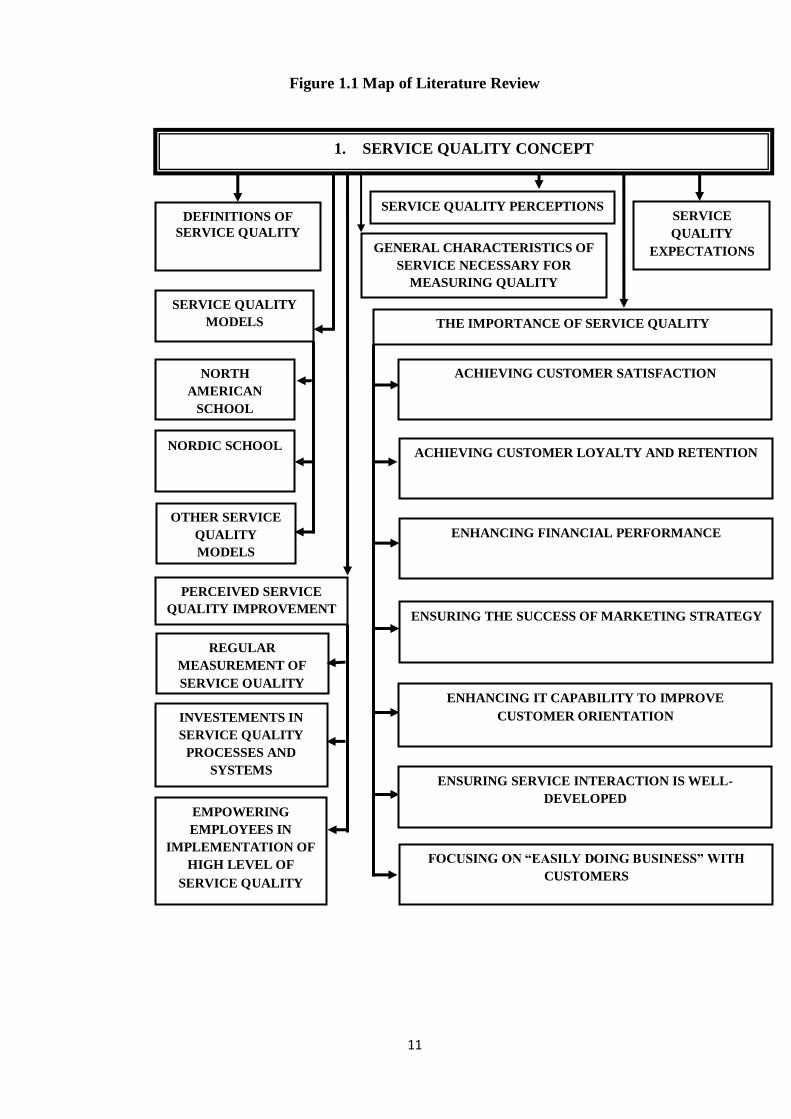
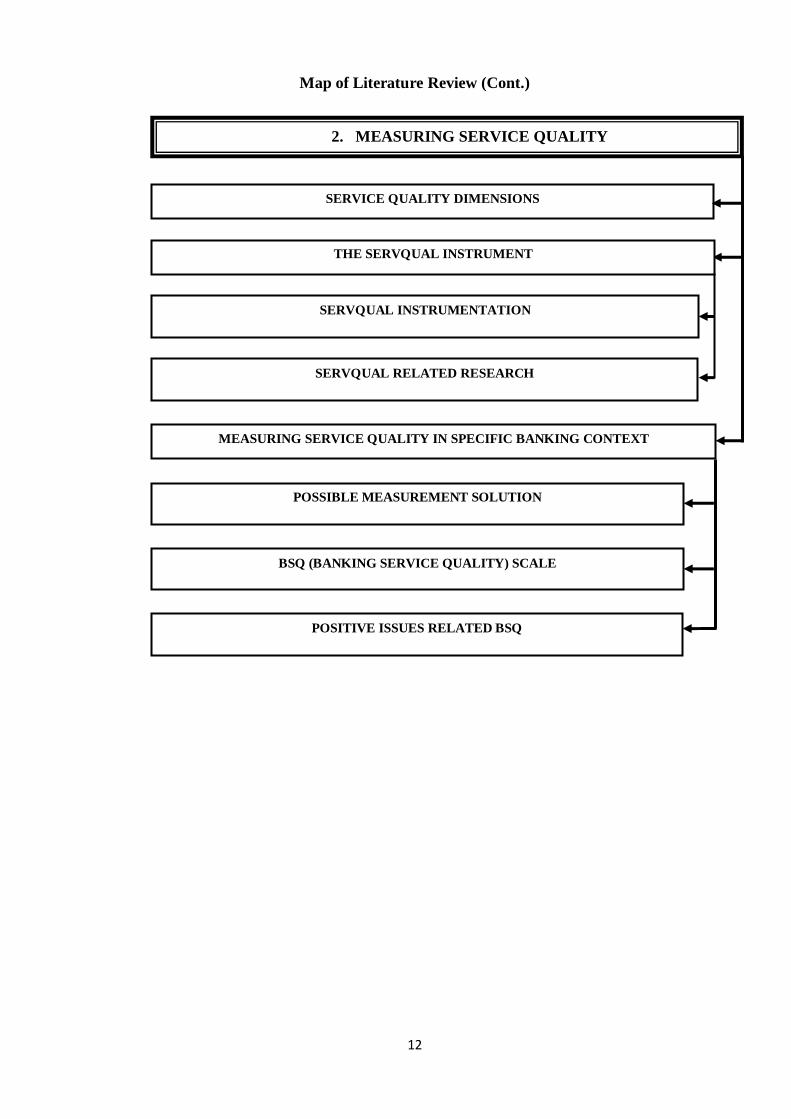
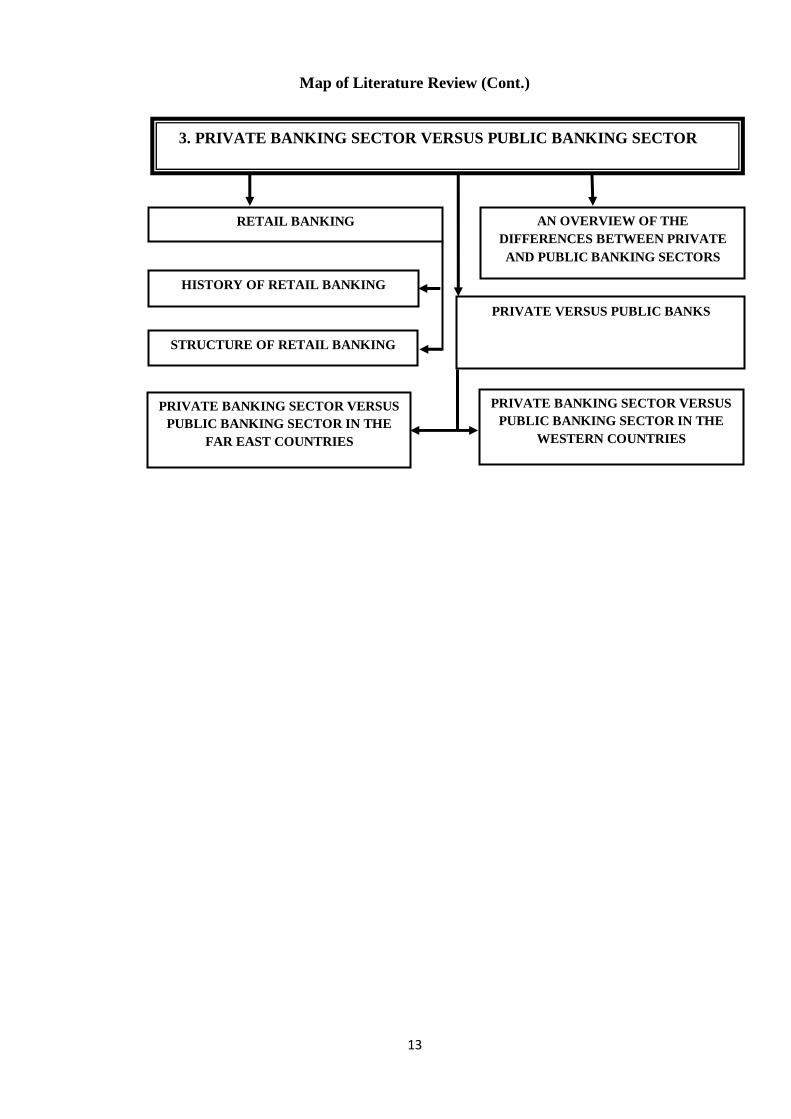
The literature review in this research is divided into three chapters, as mentioned above.
They cover the concepts of service quality, measuring service quality, and private banking
sector versus public banking sector. A map of the literature review of this research is shown
in Figure 1.1 below.
1.7.5 Chapter Five
The purpose of Chapter Five is to provide an overview of the research methods that were
available to the researcher. It starts with a presentation of the research objectives, question
and hypotheses. This is followed by a review of the research process, methodological
philosophies, strategies and methods surrounding the research study. Empirical data
collection issues are also discussed. This is followed by a presentation of the methods used
for the scale pilot-testing, as well as feedback from the pilot study. A discussion follows
covering sampling issues, including a presentation of probability and non-probability
sampling methods, sample size, sampling procedure, and sampling location. This chapter
also presents the methods used for data analysis, and finally it discusses the ethical issues
related to the research study.
10
1.7.6 Chapter Six
The aim of Chapter Six is to provide and discuss the results (findings of the research) of the
research data analysis. Therefore, the chapter discusses the statistical analysis of the
customers‟ perceptions of service quality through a comparison between Libyan private and
public banks. The chapter starts by presenting the research question and research hypotheses.
This is followed by an account of the demographic characteristics of the respondents. It also
presents the questionnaire data analysis in terms of levels of service quality in the two
banking sectors, and then the research hypotheses are tested. Significant differences between
the private and public banking sectors with regards customer perceptions of service quality
are discussed. These include differences in service quality dimensions such as effectiveness
and assurance, access, price, tangibles, services portfolio, and reliability. Accordingly, the
seven research hypotheses are accepted. This is followed by a factor analysis that confirms
the six BSQ dimensions within the two banking sectors, but with a different degree of
importance. A Pearson‟s Chi-Square test of participants‟ demographic characteristics has
been used to identify if the customer characteristics of gender, age, occupation, frequency of
branch visits, and period of dealing with a bank are related to customers‟ banking status. The
results show that there is a relationship between bank status and the customer characteristics
of age, occupation, frequency of branch visits, and period of dealing with the bank, while
there is no relationship between customer gender and bank status. Finally, this chapter
discusses the study‟s statistical test results.
1.7.7 Chapter Seven
Chapter Seven aims to extract valuable insights and conclusions with regard to the findings
of the research. A brief review of the theoretical background to the research and the research
findings is made. Then, theoretical, managerial and marketing implications of the study are
discussed. This is followed by a discussion on the research contribution. Limitations of the
study are then identified and presented. Finally, recommendations for further research are
made.
11
Figure 1.1 Map of Literature Review
1. SERVICE QUALITY CONCEPT
DEFINITIONS OF
SERVICE QUALITY
SERVICE QUALITY PERCEPTIONS SERVICE
QUALITY
EXPECTATIONS
THE IMPORTANCE OF SERVICE QUALITY
ACHIEVING CUSTOMER SATISFACTION
ACHIEVING CUSTOMER LOYALTY AND RETENTION
ENHANCING FINANCIAL PERFORMANCE
ENSURING THE SUCCESS OF MARKETING STRATEGY
ENHANCING IT CAPABILITY TO IMPROVE
CUSTOMER ORIENTATION
ENSURING SERVICE INTERACTION IS WELL-
DEVELOPED
FOCUSING ON “EASILY DOING BUSINESS” WITH
CUSTOMERS
SERVICE QUALITY
MODELS
NORTH
AMERICAN
SCHOOL
NORDIC SCHOOL
OTHER SERVICE
QUALITY
MODELS
PERCEIVED SERVICE
QUALITY IMPROVEMENT
REGULAR
MEASUREMENT OF
SERVICE QUALITY
INVESTEMENTS IN
SERVICE QUALITY
PROCESSES AND
SYSTEMS
EMPOWERING
EMPLOYEES IN
IMPLEMENTATION OF
HIGH LEVEL OF
SERVICE QUALITY
GENERAL CHARACTERISTICS OF
SERVICE NECESSARY FOR
MEASURING QUALITY
12
Map of Literature Review (Cont.)
2. MEASURING SERVICE QUALITY
SERVICE QUALITY DIMENSIONS
THE SERVQUAL INSTRUMENT
SERVQUAL INSTRUMENTATION
SERVQUAL RELATED RESEARCH
MEASURING SERVICE QUALITY IN SPECIFIC BANKING CONTEXT
POSSIBLE MEASUREMENT SOLUTION
BSQ (BANKING SERVICE QUALITY) SCALE
POSITIVE ISSUES RELATED BSQ
13
Map of Literature Review (Cont.)
3. PRIVATE BANKING SECTOR VERSUS PUBLIC BANKING SECTOR
RETAIL BANKING
HISTORY OF RETAIL BANKING
STRUCTURE OF RETAIL BANKING
AN OVERVIEW OF THE
DIFFERENCES BETWEEN PRIVATE
AND PUBLIC BANKING SECTORS
PRIVATE VERSUS PUBLIC BANKS
PRIVATE BANKING SECTOR VERSUS
PUBLIC BANKING SECTOR IN THE
WESTERN COUNTRIES
PRIVATE BANKING SECTOR VERSUS
PUBLIC BANKING SECTOR IN THE
FAR EAST COUNTRIES

14
Chapter Two
Service Quality Concept

15
Chapter 2: Service Quality Concept
2.0 Introduction
Service quality is a concept that has attracted the interest of researchers in the field of
operations management and marketing research. Studies undertaken by both academics and
practitioners indicate that service quality has a strong correlation with customer satisfaction,
financial performance, manufacturing costs, customer retention, customer loyalty, and the
success of marketing strategy (Cronin and Taylor, 1992; Cronin, Brady and Hult, 2000;
Duncan and Elliot, 2004; Wong, Rexha and Phau, 2008). Organisations operating within the
service sector consider service quality to be a strategic component of their marketing plan
(Lewis and Mitchell, 1990; Spathis, Petridou and Glaveli, 2004). Through this, organisations
can reach a higher level of service quality, a higher level of customer satisfaction, and can
maintain a constant competitive advantage (Lewis and Mitchell, 1990; Meuter et al., 2000;
Guo, Duff and Hair, 2008).
Due to cultural and environmental effects, in general, customers of services behind different
international boundaries perceive service quality differently. Therefore managers should
recognise first that environmental factors can affect service quality perceptions and second
that service quality should be clearly defined and conceptualised. A good quality of service
gives a competitive advantage to any business. However, it is particularly important for
banks. Al-Hawari and Hartley (2005) have proposed that customer service quality
perceptions have a significant influence on a bank‟s success.
This chapter aims is to explore the literature on the concept of service quality. The chapter
therefore is divided into seven sections. The first section deals with different definitions of
service quality. The second section outlines the general characteristics of services. The third
section attempts to describe service quality perceptions. The fourth section sheds light on
service quality expectations. The fifth section reviews literature on service quality models.
The importance of service quality is highlighted in section six. Finally, section seven
provides information on how perceived service quality can be improved.
2.1 Definitions of Service Quality
The term „service quality‟ is commonly used to express different concepts. Johnston and
Clark (2005) use the term „service quality‟ to describe how an organisation treats its
customers. Accordingly, service quality covers how customers‟ requirements and desires are
met, as well as how the service delivered matches customers‟ expectations. Furthermore,
Johnston and Clark suggest that service quality is the consideration of various related
16
components, including satisfaction, the relative impression of an organisation‟s services, and
the quality that is delivered.
It can be seen from the above that service quality can be defined as customer satisfaction,
which is the outcome of the assessment made by a customer about the service offered. This
assessment is based on comparisons of their perceptions of service delivery with their prior
expectations. This is similar to Cronin and Taylor‟s (1992) definition, that service quality is
the vital antecedent of customer satisfaction.
Sasser et al. (1978) and Caruana (2002) have pointed out that service quality is the result of
the comparison made by customers about what they feel service firms should offer, and
perceptions of the performance of firms providing the services. Gronroos (1984) also defines
service quality as the outcome of the comparison that consumers make between their
expectations and perceptions.
Parasuraman, Zeithaml and Berry (1985) have reviewed various studies on service quality
and offer three propositions, as follows:
1. Service quality is not as easy for a customer to evaluate as goods quality;
2. Service quality perception is the outcome of the comparison that a customer makes
between their expectations and the performance of a service;
3. Quality assessment not only depends on the outcome of a service, but also includes
assessment of the process of service delivery.
Parasuraman, Zeithaml and Berry (1988, p. 16) define service quality as “a global judgement
or attitude, relating to superiority of the service, whereas satisfaction is related to a specific
transaction”. This clearly suggests that service quality is an overall judgement of a service
provider and the outcome of the comparison between customers‟ perceptions and their
expectations (Zeithaml, 1988).
In their attempt to offer a different definition of service quality based on the importance of
service quality, Petridou et al. (2007) define service quality as a route to competitive
advantage, as well as corporate profitability, for the service organisation involved. There is
also a view that service quality is the outcome of internal and external actions, whereby the
external customer defines the perceived service quality while the internal customer defines
the quality of the processes that produce the service (Goetsch and Davis, 1997).
It has also been argued that by involving the customer in defining service quality it is
important to first determine the quality of service level offered by the organisation.
Therefore, the quality of service level can be defined as the relationship between the
expected and the perceived service from the perspective of the customer. Furthermore,
involving customers in the co-service process may even increase their understanding of the
difficulty of maintaining the right level of service quality (Edvardsson, Thomasson and John,
17
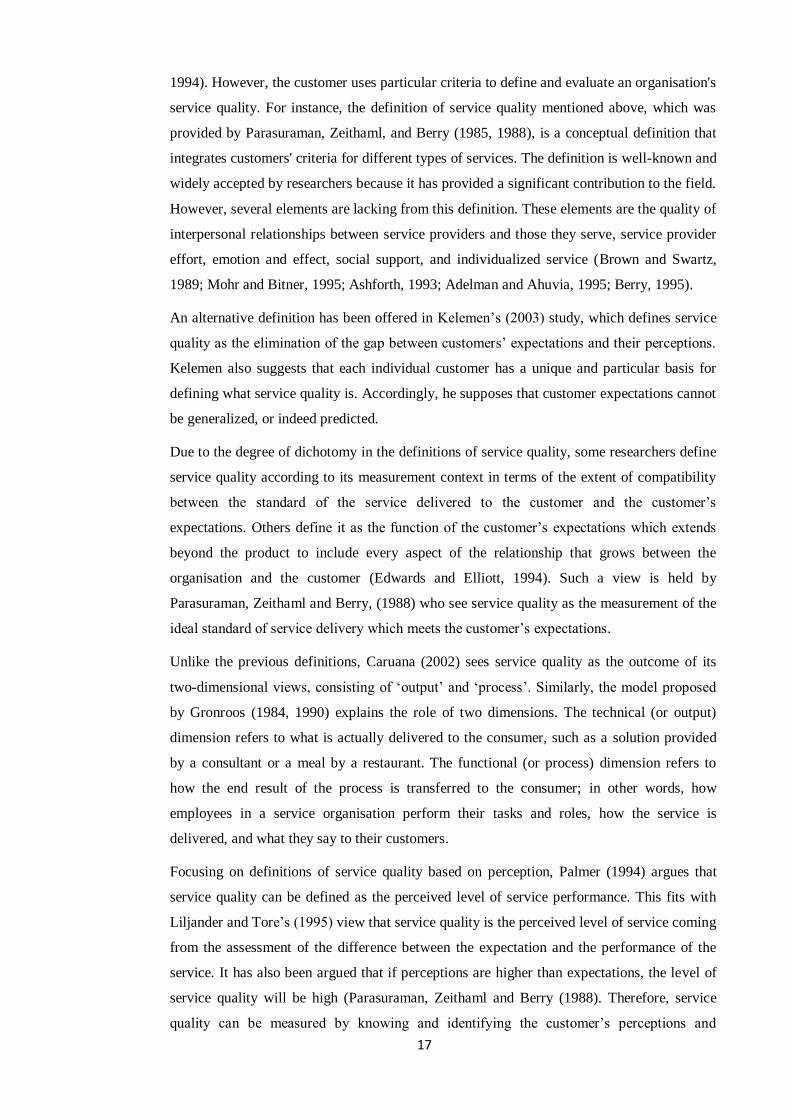
1994). However, the customer uses particular criteria to define and evaluate an organisation's
service quality. For instance, the definition of service quality mentioned above, which was
provided by Parasuraman, Zeithaml, and Berry (1985, 1988), is a conceptual definition that
integrates customers' criteria for different types of services. The definition is well-known and
widely accepted by researchers because it has provided a significant contribution to the field.
However, several elements are lacking from this definition. These elements are the quality of
interpersonal relationships between service providers and those they serve, service provider
effort, emotion and effect, social support, and individualized service (Brown and Swartz,
1989; Mohr and Bitner, 1995; Ashforth, 1993; Adelman and Ahuvia, 1995; Berry, 1995).
An alternative definition has been offered in Kelemen‟s (2003) study, which defines service
quality as the elimination of the gap between customers‟ expectations and their perceptions.
Kelemen also suggests that each individual customer has a unique and particular basis for
defining what service quality is. Accordingly, he supposes that customer expectations cannot
be generalized, or indeed predicted.
Due to the degree of dichotomy in the definitions of service quality, some researchers define
service quality according to its measurement context in terms of the extent of compatibility
between the standard of the service delivered to the customer and the customer‟s
expectations. Others define it as the function of the customer‟s expectations which extends
beyond the product to include every aspect of the relationship that grows between the
organisation and the customer (Edwards and Elliott, 1994). Such a view is held by
Parasuraman, Zeithaml and Berry, (1988) who see service quality as the measurement of the
ideal standard of service delivery which meets the customer‟s expectations.
Unlike the previous definitions, Caruana (2002) sees service quality as the outcome of its
two-dimensional views, consisting of „output‟ and „process‟. Similarly, the model proposed
by Gronroos (1984, 1990) explains the role of two dimensions. The technical (or output)
dimension refers to what is actually delivered to the consumer, such as a solution provided
by a consultant or a meal by a restaurant. The functional (or process) dimension refers to
how the end result of the process is transferred to the consumer; in other words, how
employees in a service organisation perform their tasks and roles, how the service is
delivered, and what they say to their customers.
Focusing on definitions of service quality based on perception, Palmer (1994) argues that
service quality can be defined as the perceived level of service performance. This fits with
Liljander and Tore‟s (1995) view that service quality is the perceived level of service coming
from the assessment of the difference between the expectation and the performance of the
service. It has also been argued that if perceptions are higher than expectations, the level of
service quality will be high (Parasuraman, Zeithaml and Berry (1988). Therefore, service
quality can be measured by knowing and identifying the customer‟s perceptions and
18
expectations. This clearly supports the opinion that service quality definitions rely on
abstract dimensions, such as perceptions, expectations, and satisfaction. Consequently,
service quality can be measured by identification of the differences between the abstractions.
For instance, if service quality is defined as the difference between expectations and
perceptions from which the level of satisfaction can be derived, it seems logical that
measuring the difference between the two will lead to not only a definition of service quality
but also a measurement of its existence or nonexistence, regardless of what „quality‟ may be
(Parasuraman, Zeithaml and Berry, 1988). The measurement of these differences is called
„gap analysis‟ (Parasuraman, Zeithaml and Berry, 1985).
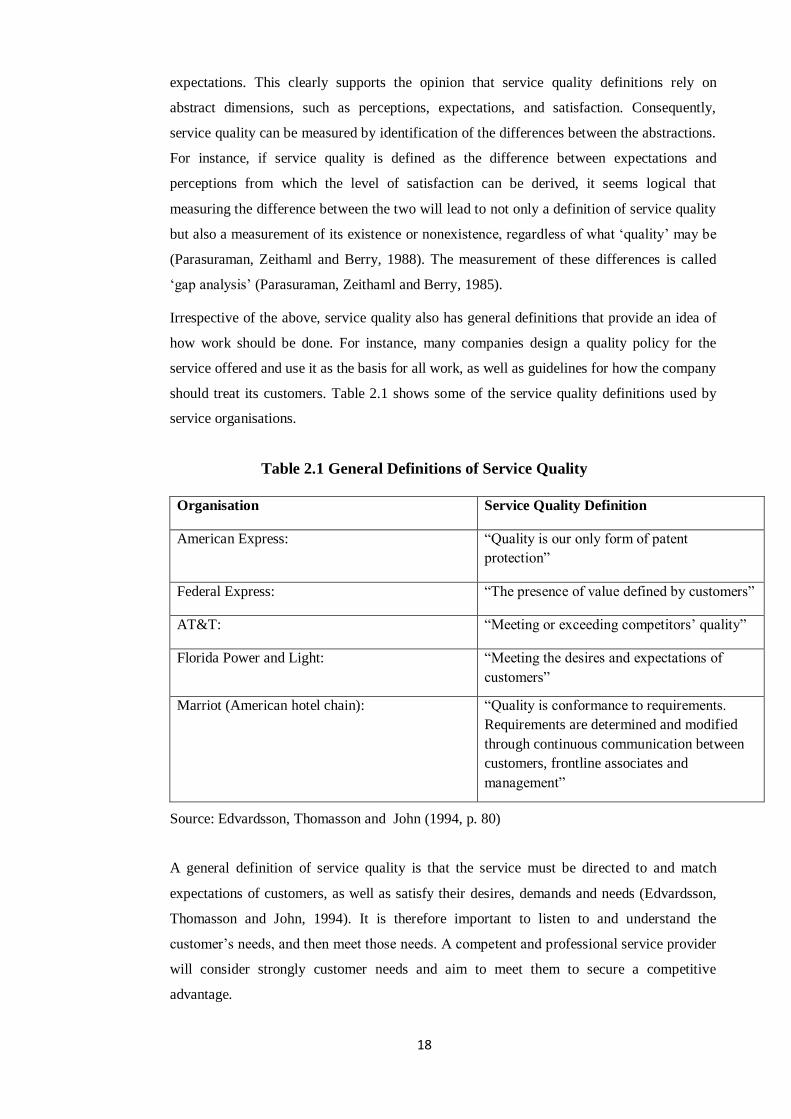
Irrespective of the above, service quality also has general definitions that provide an idea of
how work should be done. For instance, many companies design a quality policy for the
service offered and use it as the basis for all work, as well as guidelines for how the company
should treat its customers. Table 2.1 shows some of the service quality definitions used by
service organisations.
Table 2.1 General Definitions of Service Quality
Organisation Service Quality Definition
American Express: “Quality is our only form of patent
protection”
Federal Express: “The presence of value defined by customers”
AT&T: “Meeting or exceeding competitors‟ quality”
Florida Power and Light: “Meeting the desires and expectations of
customers”
Marriot (American hotel chain): “Quality is conformance to requirements.
Requirements are determined and modified
through continuous communication between
customers, frontline associates and
management”
Source: Edvardsson, Thomasson and John (1994, p. 80)
A general definition of service quality is that the service must be directed to and match
expectations of customers, as well as satisfy their desires, demands and needs (Edvardsson,
Thomasson and John, 1994). It is therefore important to listen to and understand the
customer‟s needs, and then meet those needs. A competent and professional service provider
will consider strongly customer needs and aim to meet them to secure a competitive
advantage.

19
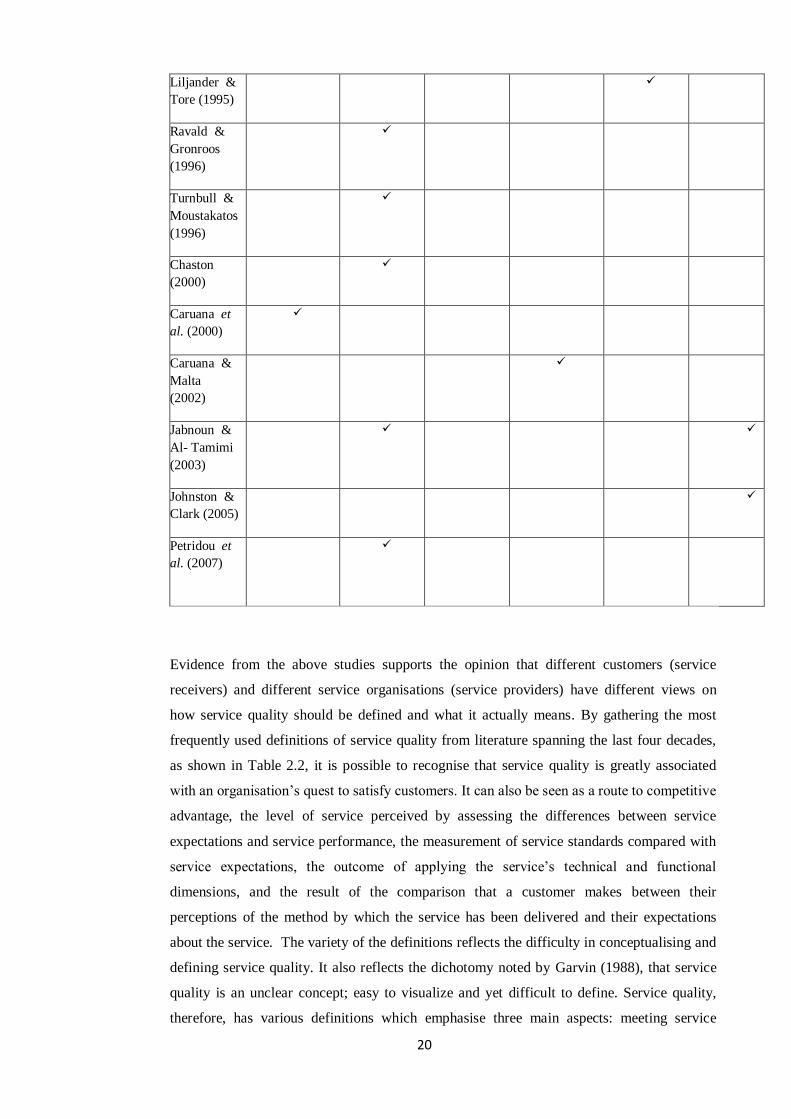
It is useful to note that early definitions are important as they seem to present a clear picture
of what service quality actually means. The frequency with which these definitions have
been used in various studies published over the last forty years, is great (see Table 2.2).
Table 2.2 Frequency of Service Quality Definitions over the Last Four Decades
Definition
Author
and
Year
The result of
the comparison
that customers
make between
their
expectations
about a service
and their
perceptions of
the way that a
service has
been
performed
A route to
competitive
advantage
and
corporate
profitability
The
measurement
of the extent
of
compatibility
between the
standard of
the service
delivered to
the customer
and the
customer‟s
expectations
The outcome of
applying the
service‟s
technical and
functional
dimensions
The
perceived
level of
service
coming from
the
assessment of
the difference
between the
expectation
and the
performance
of the service
Meeting
customer
satisfaction
Sasser et al.
(1978)
Gronroos
(1982)
Gronroos
(1984)
Parasura-
man et al.
(1986)
Lewis
(1987)
Gronroos
(1990)
Cronin &
Taylor
(1992)
Edwards &
Elliott
(1994)
Palmer
(1994)
20
Liljander &
Tore (1995)
Ravald &
Gronroos
(1996)
Turnbull &
Moustakatos
(1996)
Chaston
(2000)
Caruana et
al. (2000)
Caruana &
Malta
(2002)
Jabnoun &
Al- Tamimi
(2003)
Johnston &
Clark (2005)
Petridou et
al. (2007)
Evidence from the above studies supports the opinion that different customers (service
receivers) and different service organisations (service providers) have different views on
how service quality should be defined and what it actually means. By gathering the most
frequently used definitions of service quality from literature spanning the last four decades,
as shown in Table 2.2, it is possible to recognise that service quality is greatly associated
with an organisation‟s quest to satisfy customers. It can also be seen as a route to competitive
advantage, the level of service perceived by assessing the differences between service
expectations and service performance, the measurement of service standards compared with
service expectations, the outcome of applying the service‟s technical and functional
dimensions, and the result of the comparison that a customer makes between their
perceptions of the method by which the service has been delivered and their expectations
about the service. The variety of the definitions reflects the difficulty in conceptualising and
defining service quality. It also reflects the dichotomy noted by Garvin (1988), that service
quality is an unclear concept; easy to visualize and yet difficult to define. Service quality,
therefore, has various definitions which emphasise three main aspects: meeting service

21
specifications, meeting customer expectations, and meeting customer satisfaction. For
instance, to define service quality as a route to competitive advantage, it is vital to specify
the service and at what particular level it will meet customer expectations and satisfaction.
By doing this, organisations can exceed the service quality level offered by their competitors.
Obviously, these three areas cannot be separated because they are strongly related to each
other. For instance, by meeting the service specification, customer expectations and
satisfaction will be met. Figure 2.1 shows the relation between commonly used service
quality definitions and corresponding concepts.

22
Figure 2.1 Main Service Quality Definitions and Associated Concepts
Measurement of the extent of
compatibility between the standard of
the service delivered to the customer
and the customer‟s expectations
The perceived level of service coming
from the assessment of the difference
between the expectation and the
performance of the service
The result of the comparison that a
customer makes between their
expectations about a service and their
perception of the way that the service
has been performed
Meeting service specification
Meeting customer
expectation
Meeting customer
satisfaction
Meeting customer satisfaction
The outcome of applying the service‟s
technical and functional dimensions
A route to competitive advantage
23
Based on the above, one way of starting to develop an appropriate definition of service
quality is to understand what the purpose of service quality is. If the purpose is to meet
customer expectations, then the definition will be “meeting customer expectations”
(Johnston and Clark, 2005). Another potentially useful way to define service quality is to
understand how service organisations see service quality from a customer‟s perspective.
Whatever the perspective, it is obvious that service quality cannot be viewed outside its
conceptual meaning, with an emphasis on meeting the service specification, meeting
customer expectations, and meeting customer satisfaction.
2.2 General Characteristics of Service Necessary for Measuring Quality
Researchers have defined service characteristics as a group of intangible activities resulting
from the interaction between the service provider and the customer, as well as the
organizational system and the material resources. More specifically, service itself has been
defined as work performance or “deed, act or performance” (Lovelocke, 1992), while the
organisational system of a service organisation has been defined as the sophisticated skills
and benefits gained by the customer when using or leasing an organisation‟s facilities,
maintenance, or professional advice (Juran and Gryna, 1988). The service of an organisation
has also been described by Juran as the direct sale to, and contact with, users, in
circumstances where a huge number of individual transactions give the company the chance
to obtain feedback about its service quality. Additionally, he adds that the benefits of a
service are not physically storable or transportable, and that the output and the delivery occur
at the same time. Gummesson (1987, p. 22) suggests that “services are something that can be
bought and sold but which you cannot drop on your food”. Zeithaml, Parasuraman and Berry
(1990) define service as the benefits that one party can offer to another that are essentially
intangible. This view is in agreement with the earlier research of Stanton (1986), who
mentions that services are essentially intangible and separately identified. He also adds that
services are activities that provide satisfaction and are not necessary tied to the sale of a
product or another service.
Palmer (1994) has considered the intangibility of service. He argues that service is intangible
because, unlike goods, service has no physical presence. In light of the fact that service is
intangible, it is hard to measure it; therefore, a customer who wishes to evaluate service
quality relies on tangible characteristics such as delivery, consistency, customization and
speed. This clearly explains the importance of confidence and trust in measuring an
intangible service such as banking (Al-Marri, Ahmad and Zairi, 2007).
Even though service is intangible, it has particular characteristics. For instance, service is not
storable; therefore the opportunity to sell or buy service can easily be lost (Shields, 1995).
Service itself cannot be owned, but the right to direct the service process is owned instead

24
(Palmer, 1994). It has also been suggested that “service is inseparable from production since
the production and the consumption of the service occur at the same time and the same place,
the customer is involved in service production. It is therefore very difficult to centralize the
mass production of service” (Obaid, 2006, p. 15). For instance, when a customer gives a
particular instruction to a hairdresser or provides an accountant with particular documents, it
is understood that the customer has influenced the quality of the service delivery.
Besides using service characteristics, service cannot be easily inspected or examined. This is
because it mainly depends on human interaction and expression (Kotler and Turner, 1993).
Service does not have a limit and cannot be determined before it is handed over (Wille,
1993). Service is also variable, therefore it is difficult to control and monitor the services
processes to ensure that they meet the standards set by management (Palmar, 1994). Service
cannot be easily displayed either and cannot have its price easily defined (Zeithmal, Berry
and Parasuraman, 1992). In addition, service cannot be evaluated prior to its use; a customer
must rely on his or her experience of the service itself to reach an objective judgment during
and even after the service delivery process (Zeithaml, Berry and Parasuraman, 1990). In
contrast, tangible products have a limited number of characteristics, therefore their quality
can be easily judged. Service is not measurable or countable, and cannot be tested or
inventoried, at least not in ways that would make it possible to ensure the quality of the
product (Zeithaml, Berry and Parasuraman, 1992).
The leadership of a service provider should have a clear vision of the service it provides in
order to distinguish it from other providers. Additionally, they must recognise that
embracing a service strategy can positively impact profitability and that such a strategy is a
never-ending journey. They must also work to improve the reliability dimension (Zeithaml,
Parasuraman and Berry 1990).
2.3 Service Quality Perceptions
Researchers have defined customer perceptions as global judgments of customers relating to
the superiority of a service, which is influenced by a number of factors including education
level and social background (Parasuraman, Zeithaml and Berry, 1988; Sureshchandar,
Rajendran and Aantharaman, 2002; O‟Neill and Palmer, 2003), consumers‟ beliefs
concerning the service received (Parasuraman, Zeithaml and Berry, 1985), consumer
directed interactions with services (Bitner, Brown and Meuter, 2000), the evaluation of
customers when interacting with the service at a specific moment in time (Cronin and Tayor,
1994; Zeithaml, Bitner and Gremler, 2009), consumer judgement of the actual service
performance (Lewis, 1989), the process by which an individual selects, interprets and
organizes stimuli into a coherent and meaningful image of the world (Schiffman and Kanuk,
1987), and customers‟ opinions of the service or product (Foster, 2004). More precisely,
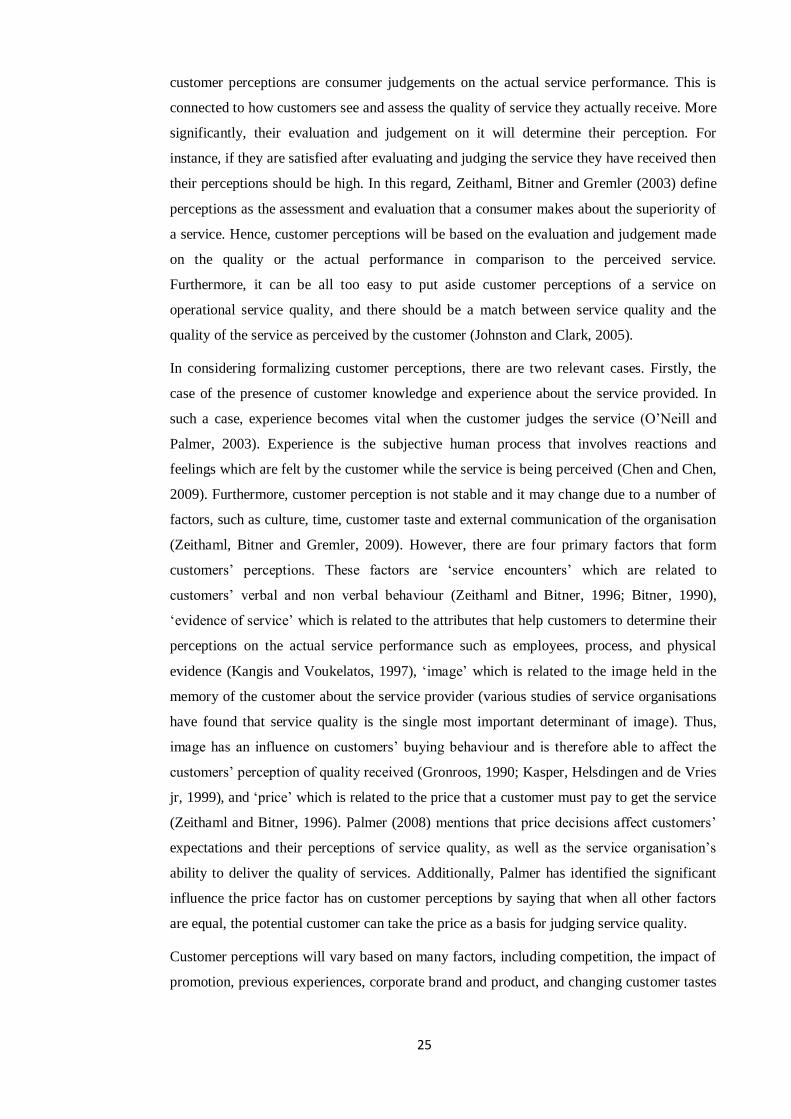
25
customer perceptions are consumer judgements on the actual service performance. This is
connected to how customers see and assess the quality of service they actually receive. More
significantly, their evaluation and judgement on it will determine their perception. For
instance, if they are satisfied after evaluating and judging the service they have received then
their perceptions should be high. In this regard, Zeithaml, Bitner and Gremler (2003) define
perceptions as the assessment and evaluation that a consumer makes about the superiority of
a service. Hence, customer perceptions will be based on the evaluation and judgement made
on the quality or the actual performance in comparison to the perceived service.
Furthermore, it can be all too easy to put aside customer perceptions of a service on
operational service quality, and there should be a match between service quality and the
quality of the service as perceived by the customer (Johnston and Clark, 2005).
In considering formalizing customer perceptions, there are two relevant cases. Firstly, the
case of the presence of customer knowledge and experience about the service provided. In
such a case, experience becomes vital when the customer judges the service (O‟Neill and
Palmer, 2003). Experience is the subjective human process that involves reactions and
feelings which are felt by the customer while the service is being perceived (Chen and Chen,
2009). Furthermore, customer perception is not stable and it may change due to a number of
factors, such as culture, time, customer taste and external communication of the organisation
(Zeithaml, Bitner and Gremler, 2009). However, there are four primary factors that form
customers‟ perceptions. These factors are „service encounters‟ which are related to
customers‟ verbal and non verbal behaviour (Zeithaml and Bitner, 1996; Bitner, 1990),
„evidence of service‟ which is related to the attributes that help customers to determine their
perceptions on the actual service performance such as employees, process, and physical
evidence (Kangis and Voukelatos, 1997), „image‟ which is related to the image held in the
memory of the customer about the service provider (various studies of service organisations
have found that service quality is the single most important determinant of image). Thus,
image has an influence on customers‟ buying behaviour and is therefore able to affect the
customers‟ perception of quality received (Gronroos, 1990; Kasper, Helsdingen and de Vries
jr, 1999), and „price‟ which is related to the price that a customer must pay to get the service
(Zeithaml and Bitner, 1996). Palmer (2008) mentions that price decisions affect customers‟
expectations and their perceptions of service quality, as well as the service organisation‟s
ability to deliver the quality of services. Additionally, Palmer has identified the significant
influence the price factor has on customer perceptions by saying that when all other factors
are equal, the potential customer can take the price as a basis for judging service quality.
Customer perceptions will vary based on many factors, including competition, the impact of
promotion, previous experiences, corporate brand and product, and changing customer tastes
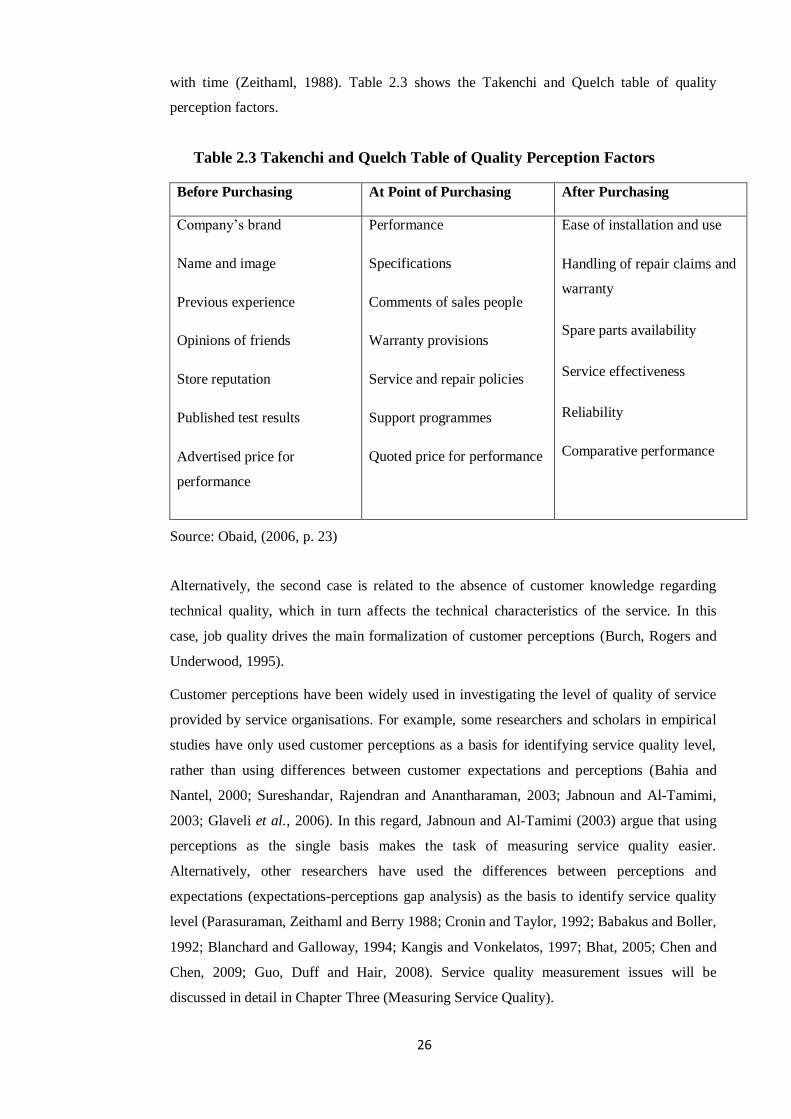
26
with time (Zeithaml, 1988). Table 2.3 shows the Takenchi and Quelch table of quality
perception factors.
Table 2.3 Takenchi and Quelch Table of Quality Perception Factors
Before Purchasing At Point of Purchasing After Purchasing
Company‟s brand
Name and image
Previous experience
Opinions of friends
Store reputation
Published test results
Advertised price for
performance
Performance
Specifications
Comments of sales people
Warranty provisions
Service and repair policies
Support programmes
Quoted price for performance
Ease of installation and use
Handling of repair claims and
warranty
Spare parts availability
Service effectiveness
Reliability
Comparative performance
Source: Obaid, (2006, p. 23)
Alternatively, the second case is related to the absence of customer knowledge regarding
technical quality, which in turn affects the technical characteristics of the service. In this
case, job quality drives the main formalization of customer perceptions (Burch, Rogers and
Underwood, 1995).
Customer perceptions have been widely used in investigating the level of quality of service
provided by service organisations. For example, some researchers and scholars in empirical
studies have only used customer perceptions as a basis for identifying service quality level,
rather than using differences between customer expectations and perceptions (Bahia and
Nantel, 2000; Sureshandar, Rajendran and Anantharaman, 2003; Jabnoun and Al-Tamimi,
2003; Glaveli et al., 2006). In this regard, Jabnoun and Al-Tamimi (2003) argue that using
perceptions as the single basis makes the task of measuring service quality easier.
Alternatively, other researchers have used the differences between perceptions and
expectations (expectations-perceptions gap analysis) as the basis to identify service quality
level (Parasuraman, Zeithaml and Berry 1988; Cronin and Taylor, 1992; Babakus and Boller,
1992; Blanchard and Galloway, 1994; Kangis and Vonkelatos, 1997; Bhat, 2005; Chen and
Chen, 2009; Guo, Duff and Hair, 2008). Service quality measurement issues will be
discussed in detail in Chapter Three (Measuring Service Quality).
27
In summary, service quality perceptions refers to consumer evaluation and judgement of the
actual performance of a service. More precisely, it means how customers perceive services,
how they evaluate and judge the service, whether they have prior experience or not, and
whether they are satisfied or not. With regards to formalizing perceptions, it is also important
to mention that customer perceptions are influenced by primary factors such as service
encounters, evidence of service, image and price.
2.4 Customer Expectations
The concept of expectations plays a vital role in most recent arguments found in service
quality literature (Zeithaml, Bitner and Gremler, 2009). Even though this concept is widely
discussed, there is still much to discover about what expectations actually are, what role they
perform, and how service and product managers within organisations should understand the
importance and impact of expectations (Johnston and Clark, 2005). The concept of
expectations has been implemented in different areas of business. For instance, expectations
have been recognised as very important, especially in terms of satisfaction with a service and
product performance (Zeithaml, Bitner and Gremler, 2009). Lately, expectations have been
considered a particular feature of the service operations management field (Johnston and
Clark, 2005). In addition, expectations issues have clearly emerged in relation to service
quality concerns (Parasuraman, Zeithaml and Berry, 1988).
2.4.1 Expectations concept
A number of researchers have attempted to clarify the expectations concept whilst discussing
and analyzing the nature and management of services. In most cases, to discover overall
service quality and customer satisfaction there is a need to compare customer expectations
and the status of their perceptions of service performance (Parasuraman, Zeithaml and Berry,
1988). This task actually helps researchers and managers to evaluate and measure service
quality levels and customer satisfaction. The aforementioned authors also note the difference
between three concepts: service quality, service encounter satisfaction, and total satisfaction.
The term „customer satisfaction‟ can be seen as satisfaction at the point of delivery. For
example, customer dis/satisfaction with the level of service they have received will reflect
the customer‟s view about a specific interaction of current reality (Johnston and Clark,
2005). Even though there is a consensus that service quality and customer satisfaction are
mostly influenced by expectations, work is still required in this area to describe this process
and how it is actually occurs (Zeithaml, Bitner and Gremler, 2009).
Although there is extensive literature available on service quality that supports the idea of
expectations, with some exceptions (Berry and Parasuraman, 1991; Parasuraman, Zeithaml
and Berry, 1988; Johnston and Clark, 2005; Zeithaml, Bitner and Gremler, 2009; Leventhal,

28
2008) a definition of the concept of expectations rarely exists. According to Zeithaml, Bitner
and Gremler (2009, p. 75), customer expectations are “beliefs about service delivery that
serve as standards or reference points against which performance is judged”. Kasper,
Helsdingen and Gabbott (2006, p. 184) define customer expectations as “norms, values,
wishes and needs”. Typically, the concept of expectations found in organizational literature
is defined in two ways. The first defines it by focusing on customer behaviour. An
expectation is seen as self-likelihood in which the behaviour will result in specific outcomes.
In most cases, there is an exchange between this approach and the term of expectancy
(Bardwell, 1984). The second defines the concept of expectations according to customer
desires (Parasuraman and Berry, 1991).
In general, expectations can be seen as the likelihood of individuals, in the immediate or near
future, experiencing a particular pattern of events. This broad concept has emerged in several
contexts as service performance expectations (Ilgen, 1971), product assessment (Churchill
and Suprenant, 1982), and job concerns and employee roles (Ghobadian, 1993).
Within service management literature, there are clear differences between definitions of
expectations. Boulding et al. (1993) and Zeithaml, Berry and Parasuraman (1993) have been
at the forefront of clarifying a definition. They argue that the definition of expectations exists
in two principal conceptualizations. The first principle conceptualization is related to
customer satisfaction/dissatisfaction literature, such as the definition developed by Zeithaml,
Berry and Parasuraman, (1993) who define expectations as predictions made by customers
related to what is likely to happen during an impending exchange or transaction. This
definition suits predictive expectations in terms of the likelihood or probability of the
occurrence of future affairs. The alternative conceptualization considers expectations to
generally be what customers ideally want.
Researchers have defined customer expectations as what customers believe should happen
(Boulding et al., 1993; Johnston and Clark, 2005), what customers hope for (Zeithaml, Berry
and Parasuraman, 1993), what customers wish for (Edvardsson, Thomasson and John, 1994),
what customers expect from an excellent service provider (Zeithaml, Parasuraman and
Berry, 1990), and what customers predict product and service performance to be like in the
future (Liljander and Tore, 1995). These definitions found in service quality literature
indicate that in general, expectations are expressions of what customers believe a service
provider should offer (should expectations), rather than would offer.
It can be presumed that these two perspectives are, in most cases, used mutually in
arguments on service quality, making it difficult to translate results, particularly in
evaluation and measurement issues. Furthermore, the concept of customer expectations
should encompass both what customers believe and what customers want, although this is
based on the capability of the service provider. Continuing with this conceptualisation,
29
„should expectations‟ are not the same as desired standards (Boulding et al., 1993). For
instance, the customer may believe that an expensive hotel should have a swimming pool
available for customers (should expectations), even though the customer may have no desire
to use it.
It can be concluded from the above that the term „expectations‟ can be used to describe what
customers think or believe a service organisation is capable of providing (should happen)
and what customers predict about service events (will happen). Therefore, it is important for
organisations to be aware of customer expectations (Wilson et al., 2008), as understanding
and knowing customer expectations will lead to customer satisfaction (Dutta and Dutta,
2009).
2.4.2 How expectations are formed
Researchers have widely discussed how expectations are formed. Expectations can be based
on image (Gronroos, 1990), word of mouth, past experience (Zeithaml, Bitner and Gremler,
2009), market communication, traditional marketing mix and customer pre-attitudes
(Leventhal, 2008), and customer needs (Edvardsson, Thomasson and John, 1994). Customer
needs can be divided into three categories (Leventhal 2008), as follows:
1. Must be needs - those needs which will only be missed if not provided;
2. Expected needs - those needs which customers can predict;
3. Exciting requirements - those unexpected needs which lead to a good level of
satisfaction.
In many cases, customers‟ „expected needs‟ can be transformed to „must be needs‟, which
can be a motive for service or goods providers to carry out continuous improvement (Lim,
Tang and Jackson, 1999). However, customers‟ expectations can be adapted to particular
services or products, leading to customers not changing their providers or suppliers
(Leventhal, 2008). Continuing with the same concept, when customers get new information
about other providers or suppliers, they will weigh up the cost of moving to the new provider
versus staying with the adapted provider (Gilbert, Lumpkin and Dant, 1992).
2.4.3 Factors influencing expectations
Customer expectations can be influenced by many factors. Berry and Parasuraman (1991)
discuss two levels of expectations, arguing that customer service expectations exist at two
different levels. These are the desired level and the adequate level. The desired level refers to
the service that a customer hopes to receive, which means the desired level is a blend of the
customer‟s beliefs about what the service „can be‟ and „should be‟. The adequate level refers
to the service that the customer can accept. It is therefore the task of the customer to assess

30
what the service „will be‟. The best example of the adequate level is the level of service
predicted by the customer. Furthermore, the difference between the desired level and the
adequate level is known as the tolerance zone, which changes over time from service to
service and from customer to customer (Kasper, Helsdingen and Gabbott, 2006). According
to Zeithaml, Bitner and Gremler (2009, p. 80), it is “the extent to which customers recognise
and are willing to accept variations in service”.
The factors influencing customer expectations can be categorised as factors influencing
desired expectations, and factors influencing adequate expectations. Figure 2.2 below shows
the factors that influence desired and adequate expectations.
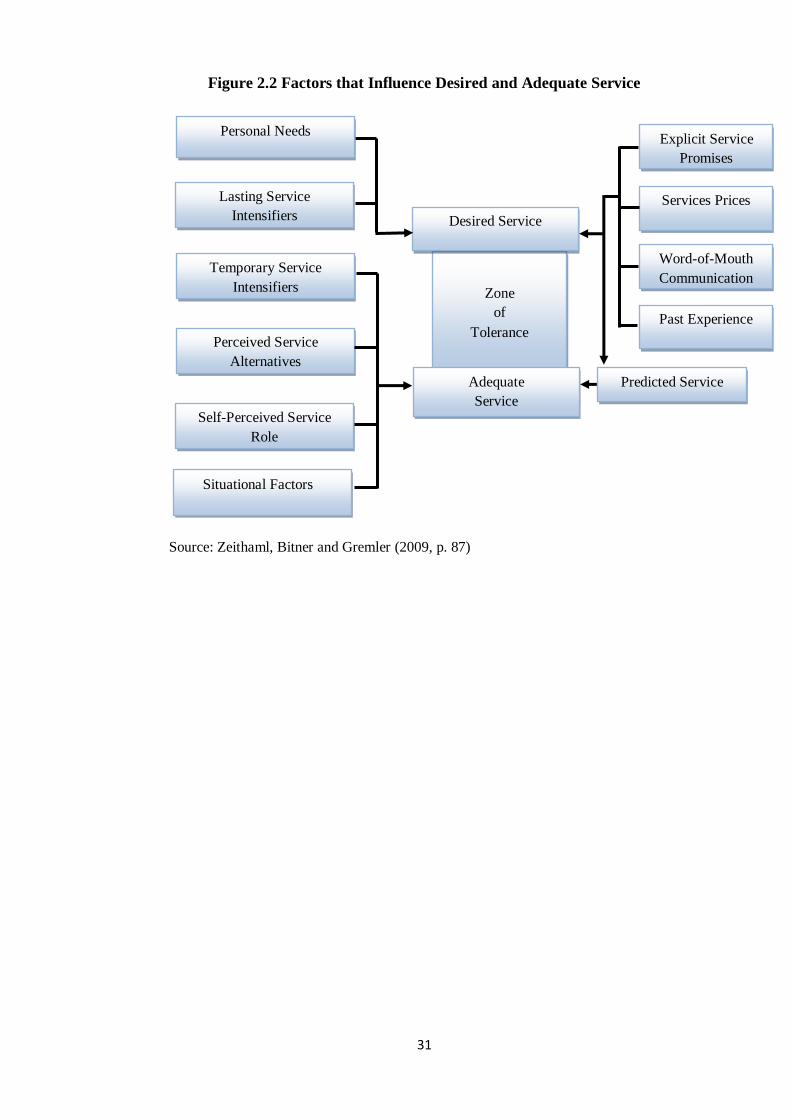
31
Figure 2.2 Factors that Influence Desired and Adequate Service
Source: Zeithaml, Bitner and Gremler (2009, p. 87)
Explicit Service Promises
Personal Needs
Lasting Service
Intensifiers
Temporary Service
Intensifiers
Perceived Service
Alternatives
Self-Perceived Service
Role
Situational Factors
Zone
of
Tolerance
Desired Service
Adequate
Service
Predicted Service
Services Prices
Word-of-Mouth
Communication
Past Experience
32
2.4.3.1 Factors influencing desired expectations
According to Zeithaml, Bitner and Gremler (2009) and Zeithaml, Berry and Parasuraman
(1993), there are two factors that influence desired expectations. They are personal needs and
lasting service intensifiers. Firstly, personal needs are vital factors that shape customers‟
desires, and they can be broken down into four categories: physical needs, social needs,
psychological needs, and functional needs. Secondly, lasting service intensifiers can be
broken down into two further categories:
1. Derived service expectations - this takes place when customer expectations are
driven by another person or group of people.
2. Personal service philosophy - which is defined as customer attitudes regarding the
meaning of the service and dealing of the service provider.
2.4.3.2 Factors influencing adequate expectations
Zeithaml, Berry and Parasuraman (1993) have identified a group of factors that affect
adequate expectations, as follows:
1. Temporary service intensifiers - this refers to individual factors that form an urgent
need for a service, such as emergency situations.
2. Perceived service alternatives - this refers to the availability of alternative service
providers.
3. Customer self-perceived service role - this refers to how customers believe they are
affecting service delivery by performing their own roles.
4. Situational factors - this refers to the conditions of service performance resulting
from the service provider‟s control.
Predicted service is the service level that customers believe it is appropriate to receive. In
turn, predictive service will be influenced by four factors, as follows:
1. Explicit service promises - these refer to personal and non-personal statements
regarding the services provided for customers by organisations. These promises are
represented in different forms, such as contracts, communication through service
departments, personal selling, and advertisements. These forms have direct influence
on both the desired service and predicted service. This influence may be based on
the difficulty the customer has to evaluate product or service quality (Zeithaml,
Berry and Parasuraman, 1993).
2. Service prices - this refers to the price that the customer has to pay to get the service.
A study by Zeithaml (1988) shows that in most cases, customers use tangibles and
price as surrogates of quality. Generally, it is recognised that when a customer pays a
33
high price they can expect a high quality service. Similarly, a customer who stays at
a posh hotel may desire and predict high standards of service.
3. Word-of-mouth communication - the role of word-of-mouth communication in
forming customer expectations of service is well supported by a number of studies
(Parasuraman, Zeithaml and Berry, 1985; Johnston and Clark, 2005; Zethaml, Berry
and Parasuraman, 1993; Zeithaml, Bitner and Gremler, 2009). Word-of-mouth
communication includes personal statements or sometimes non-personal statements
given by parties other than organisations. Furthermore, because of the difficulty that
customers face when evaluating services prior to purchasing, word-of-mouth
communication appears to be quite important. Word-of-mouth communication
sources include consumer reports, friends, and family, who influence the levels of
desired service and predicted service (Zeithaml, Berry and Parasuraman, 1993).
4. Past experience - this refers to previous knowledge about the service provided by a
previous service provider. Past experience is another factor that shapes predictions
and desires (Smith and Swinyard, 1983). Specifically, evidence given by Woodruff,
Cadotte and Jenkins (1987) proves that using different experience norms leads to
customer satisfaction. These norms are focussed on brands and the typical
performance of particular brands.
2.5 Service quality models
Recently, the conceptualization of service quality has been given a great deal of attention by
researchers. The launch of „service quality‟ has made it necessary to obtain a clear
understanding of service quality from an advantage standpoint. Reaching a clear
understanding of this point is necessary, but not sufficient to guide service quality
improvement. Therefore, conceptual models have become very important because they
enable organisation managers to identify service quality shortfalls and plan the launch of
service quality improvements (Seth, Deshmukh and Vrat, 2005; Ahmad et al., 2009). In
broad terms, service quality models attempt to discover relationships among salient
variables, which are like a simplified description of the actuality. However, the majority of
service quality models propose multidimensionality conceptualisation of service quality.
This has led to the recognition that service quality should be measured from a customer‟s
perspective (Parasuraman, Zeithaml and Berry, 1988).
Within service literature, the theoretical framework of service quality has been described
through two schools of service quality models. These are the North American school and the
Nordic school (Caro and Garcia, 2007; Karatepe, Yavas and Babakus, 2005). It has been
noted that the North American school model and Nordic school model have been integrated
into a new hierarchical model (Brady and Cronin, 2001). This section will review these two
34
schools of thought, as well as the hierarchical model. This section will also introduce other
service quality models available in literature which reflect the importance and dimensions of
service quality. Each model represents a different point of view and has been constructed to
emphasize a particular bias and build a particular service quality concept. The models will be
presented in this section in chronological order.
2.5 1 North American school
The most widely known service quality model found in literature is the Gap Analysis Model,
which stems from the North American school. The model was developed by Parasuraman,
Zeithaml and Berry (1988) (Prayag, 2007; O„Neill and Palmer, 2003; Karatepe, Yavas and
Babakus, 2005). This model is also known as the disconfirmation model, and it was first
developed in 1985, being modified and amended in 1988, 1991 and 1994 (Akbaba, 2006).
The Gap Analysis Model is useful in providing managers with tools that help improve
service quality levels offered by organisations. The model is based on five gaps, with the
consumer gap (gap 5) being the most important gap. The consumer gap is the difference
between customer expectations and perceptions of the service they receive (Zeithaml, Bitner
and Gremler, 2009). Knowing and understanding the customer gap (gap 5) is vital for
improving service quality levels in firms; however, it cannot be closed or reduced without
closing the other gaps (1-4) (Wilson et al., 2008). Closing gaps 1 to 4 is pivotal for closing
the customer gap, as shown in Figure 2.4 below (Zeithaml, Bitner and Gremler, 2009). Gaps
1 to 4 are called provider gaps and are internal gaps caused by the organisation itself that
provides the service (Wilson et al., 2008). They are less well researched than the customer
gap (Urban, 2009). However, the direction and size of gap 5 is affected by gaps 1 to 4;
therefore, to enhance service quality, gaps 1 to 4 need to be closed or reduced (Kasper,
Helsdingen and Gabbott, 2006).
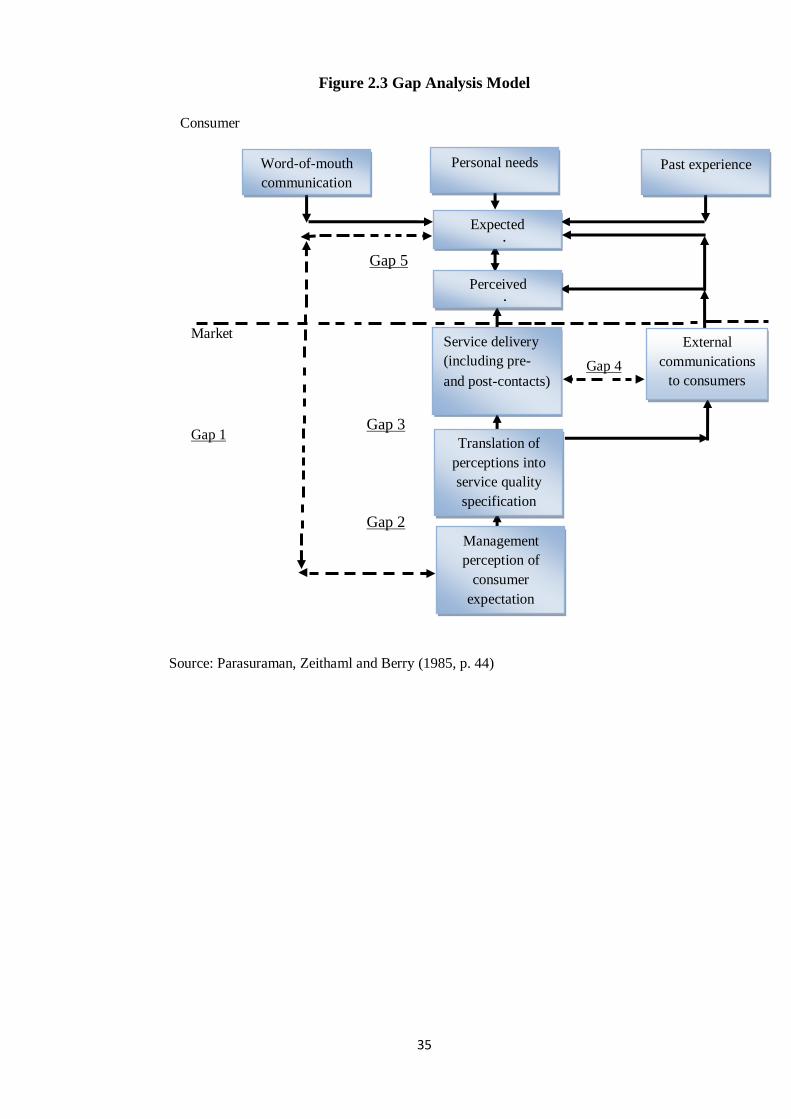
35
Figure 2.3 Gap Analysis Model
Consumer
Market
Gap 4
Gap 1
Source: Parasuraman, Zeithaml and Berry (1985, p. 44)
Word-of-mouth
communication
Personal needs Past experience
Expected
service
Perceived
service
Service delivery
(including pre-
and post-contacts)
Translation of
perceptions into
service quality
specification
Management
perception of
consumer expectation
External
communications
to consumers
Gap 2
Gap 3
Gap 5
36
The model shown in Figure 2.3 illustrates perceived service quality as a function of five
gaps. These gaps are described below (Kolter and Armstrong, 2010):
1. Consumer expectation – management perception gap (gap 1):
This gap is the result of the difference between consumer expectations and
management perceptions, which in turn leads to customer assessments of service
quality being affected. An organisation‟s management may not have accurate
perceptions of what exact expectations consumers have and they may be unaware
of the important service aspects which customers look for. This gap is caused by a
lack of proper market/ customer focus, an unwillingness of management to tackle
customers‟ problems, and a lack of communication between management levels. In
many organisations the marketing department does not automatically ensure
market focus. In such cases, effective processes developed by management, market
analysis tools and attitude are required.
2. Service quality specification gap (gap 2):
This gap is the result of the difference between management perceptions of
consumer expectations and the organisation‟s service quality specifications, which
in turn affects service quality from the consumer‟s point of view. More precisely,
management may be unable to translate customer expectations into service quality
specifications. Obviously, this means that the existence of this gap is based on
aspects related to service design. A railway company, for instance, may note that
their customers need a better meal service on long journeys. This request,
therefore, needs to be met in the form of better food menus being introduced for
customers.
3. Service delivery gap (gap 3):
This gap is the result of the difference between service quality specifications and
actual service delivery, which influences service quality from the consumer‟s point
of view. Guidelines for service delivery do not ultimately guarantee high-quality
service delivery. The reasons behind this gap include insufficient support for front
line staff (who are responsible for service delivery), and process problems. For
instance, the railway company in the previous example may provide such an
extensive menu that it does not leave enough time to serve the customer, which
leads to the customer developing a perception of poor quality. If the stewardesses
are not friendly with customers, once again the investment in the meal service will
be useless in improving perceptions of quality. Employees should be properly
trained to ensure that service delivery matches or exceeds service specifications.

37
4. External communication gap (gap 4):
This gap is the result of the difference between actual service delivery and external
communications about the service, which influences service quality from a
consumer‟s point of view. Organisations should fashion consumer expectations via
their external communications. A more positive perception of service quality can
be promoted through real expectation. For instance, the service organisation should
confirm that its marketing and promotion material precisely describes the service
offered and delivered. In reality, this is why service organisations should separate
operation and marketing functions. External factors such as advertising and
promotion may lead to an increase in the expectations of customers about the
service. It is therefore necessary for companies to promise only that which they are
able to deliver, otherwise customers can become frustrated.
5. Expected service – perceived service gap (gap 5):
This gap is the result of the difference between service quality, as perceived by
consumers, and expected service, which depends on the nature of the gaps
associated with marketing, design and service. Customers, for instance, have
expectations formed from past experiences, word-of-mouth, and personal needs.
Customer perceptions are the subjective evaluation or assessment of the actual
service at the time of service delivery.
It can be seen that the above model is a diagnostic tool. If management uses this model
properly, they can find out systematically their service quality shortfalls. In other words, the
Gap Analysis Model helps to identify gaps between a number of variables and aspects
influencing service quality.
2.5.1.1 The antecedents of service quality gaps
Zeithaml, Parasuraman and Berry (1990) have identified certain factors that lie behind the
existence of service quality gaps. These factors have been called antecedents. For instance, it
has been identified that gap 1 results from the difference between customer expectations and
management perceptions of those expectations (Parasuraman, Zeithaml and Berry 1985).
The antecedents that stand behind this gap are unawareness of marketing research, weak
upward contact, and multiplicity of administration levels in a firm. Zeithaml, Berry and
Parasuraman (1992) go through these antecedents that result in gap 1, linking service quality
management with marketing research orientation, which in turn includes three significant
elements:
1. The amount of marketing research conducted.
38
2. How an organisation makes marketing research work.
3. How the focus of the marketing research meets the objectives.
They also report that in the case of paying more attention to operational factors, marketing
research focused on customer needs will be neglected. This occurs particularly when the
management is operation-oriented, thus it pays less attention to marketing research.
Consequently, this weakness in marketing research can widen the gap.
Zeithaml, Berry and Parasuraman (1992) link upward contact with several elements,
including:
The quality of contact between the customers and personnel.
The contact or interaction between managers and customers.
The extent of the communication between managers and employees.
The nature of communication between the customer and personnel has a vital role in
delivering the specified messages. For example, it has been noted that face-to-face
communication is the most successful method. Zeithaml, Berry and Parasuraman (1992) add
that customers‟ expectations and perceptions can be predicted by the contact between
employees and a customer, and management should improve this sort of communication by
creating a number of effective tools, whether from an employee or customer side.
In a different context, Grapentine (1998) has identified a number of elements that can be
categorized as levels of management. These elements are the layers that may exist between
top managers and customer contact personnel, which in turn affect the size of the gap.
With regard to gap 2, it has been mentioned that this gap occurs between management
perceptions of customer expectations and an organisation‟s service quality specification
(Parasuraman, Zeithaml and Berry, 1985). Zeithaml, Berry and Parasuraman (1992) have
identified certain antecedents such as management commitments not fitting service quality
programs, weaknesses in formulating tasks and setting goals, and the practical impression.
They have also identified some indicators of management commitment in terms of service
quality. For example, providing the required resources for service quality programs, and
commitment from top management of providing consistent and effective strategies, will
provide an idea about the extent of the management commitment to design and delivery of
the desired service quality levels.
Goal-setting by management has been discussed by Zeithaml, Berry and Parasuraman (1992)
and their work shows that using technology to formalize standards for hardware and software
programs raises the competence of service quality processes. Using technology also eases
service quality measurement, facilitates problem recovery, and quickens responses. Thus,
failure to pay sufficient attention to these issues can eventually lead to augmentation of the

39
gap. Zeithaml, Parasuraman and Berry (1990) present another antecedent of gap 2, namely
the perception of feasibility, in which management sees its ability in terms of meeting
customer expectations.
It has been identified that gap 3 proceeds from the difference between an organisation‟s
service quality specifications made by the organisation and the actual service delivery
(Parasuraman, Zeithaml and Berry, 1985). The antecedents of gap 3 have been identified by
Zeithaml, Berry and Parasuraman (1992), who suggest there are a number of factors
involved including a failure to work as a team, the failure of supervisors in monitoring and
controlling systems, role ambiguity, role conflict, and a lack of perceived control. It has been
recognised that gap 3 results from the inability of employees to specify the service at the
desired level. To explain the role of teamwork as factor that is an antecedent to gap 3, team
work elements can be seen to include customer contact personnel feeling that the
management provides the care, internal programs of customer service, internal cooperation
within the firm between business units, involving employees in service quality programs,
and management programs in developing employee commitment towards service quality
issues. Job competence of employees refers to the ability of employees to conduct their job
functions and the feeling among employees that they should be committed to carrying out
their work effectively, which is known as „employees‟ job fitness‟. There are certain tools
that can help with correct performance of a job, such as effective equipment. This is known
as „technology job fitness‟.
According to Zeithaml, Berry and Parasuraman (1992), the element of supervisory control
systems includes the ability of the management to evaluate employees‟ work based on their
actual efforts, instead merely by the quality of output. The element of role conflict occurs
when the policies of management contrast with the quality specification. In addition, another
element which has an impact on this antecedent is the amount of paperwork that is used to
complete the service and the internal communications between departments that are required
to deliver the service. Additionally, the element of role ambiguity includes a lack of
information being available that is needed to deliver the service, the ambiguity of goals and
specifications to employees, and infrequent communication between an organisation‟s units.
The element of perceived control includes the availability of time given to customers to
contact employees, the ability of management to predict the demands and needs of both
employees and customers, and the ability of employees to control their job.
It has been noted that gap 4 results from the differences between service delivery and
external communication (Parasuraman, Zeithaml and Berry, 1985). Accordingly, the
antecedents behind this gap are weakness in the communication between an organisation and
its branches, and the ability of personnel to perform the promised service (an organisation
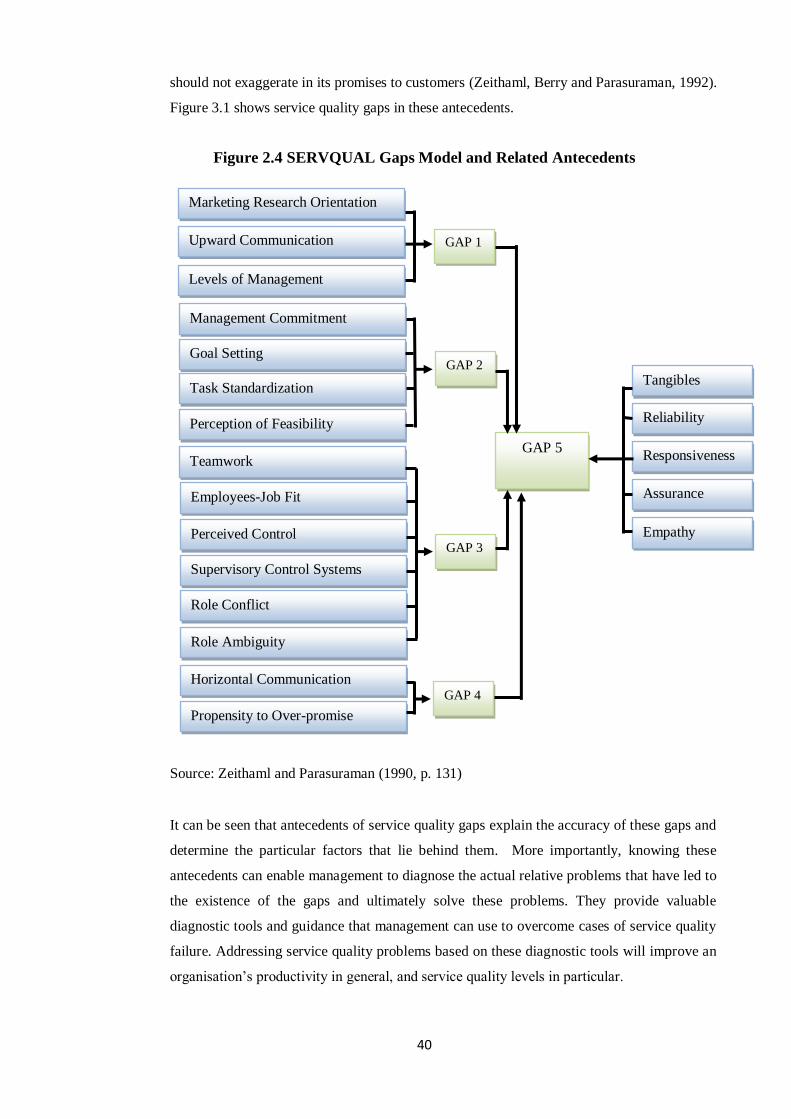
40
should not exaggerate in its promises to customers (Zeithaml, Berry and Parasuraman, 1992).
Figure 3.1 shows service quality gaps in these antecedents.
Figure 2.4 SERVQUAL Gaps Model and Related Antecedents
Source: Zeithaml and Parasuraman (1990, p. 131)
It can be seen that antecedents of service quality gaps explain the accuracy of these gaps and
determine the particular factors that lie behind them. More importantly, knowing these
antecedents can enable management to diagnose the actual relative problems that have led to
the existence of the gaps and ultimately solve these problems. They provide valuable
diagnostic tools and guidance that management can use to overcome cases of service quality
failure. Addressing service quality problems based on these diagnostic tools will improve an
organisation‟s productivity in general, and service quality levels in particular.
Marketing Research Orientation
Upward Communication
Levels of Management
Management Commitment
Goal Setting
Task Standardization
Perception of Feasibility
Teamwork
Employees-Job Fit
Perceived Control
Supervisory Control Systems
Role Conflict
Role Ambiguity
Horizontal Communication
Propensity to Over-promise
GAP 1
GAP 2
GAP 3
GAP 4
GAP 5
Tangibles
Reliability
Responsiveness
Assurance
Empathy
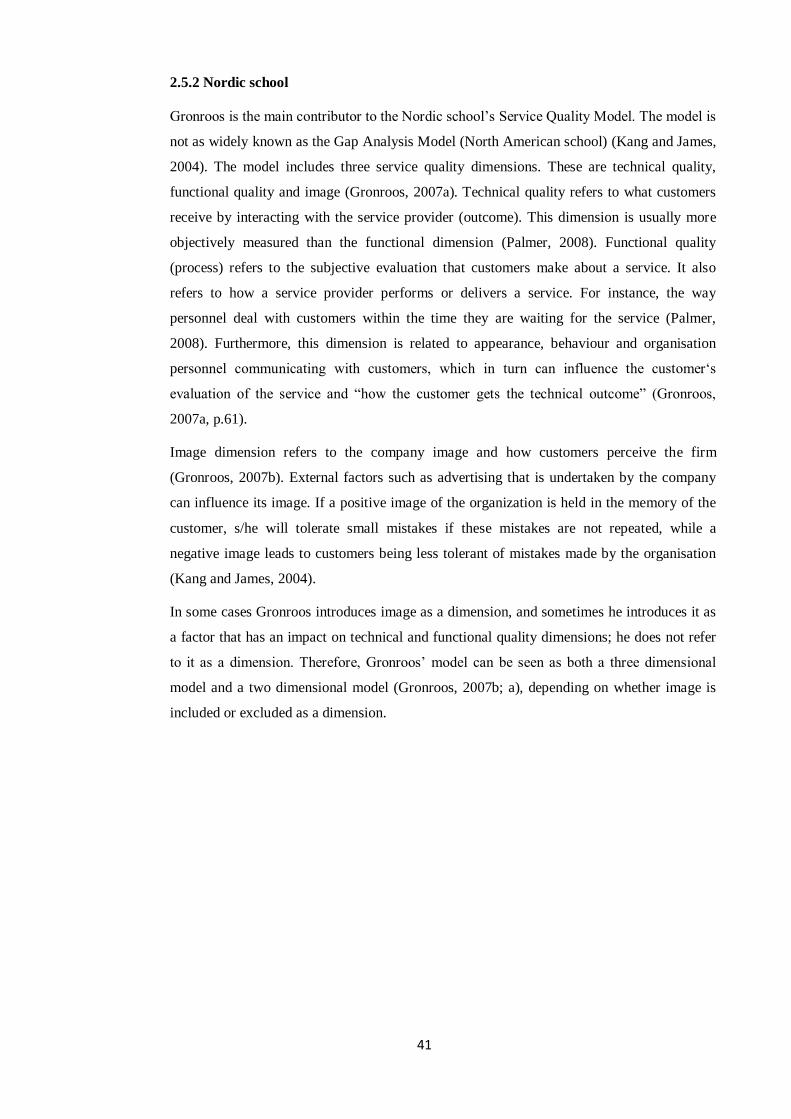
41
2.5.2 Nordic school
Gronroos is the main contributor to the Nordic school‟s Service Quality Model. The model is
not as widely known as the Gap Analysis Model (North American school) (Kang and James,
2004). The model includes three service quality dimensions. These are technical quality,
functional quality and image (Gronroos, 2007a). Technical quality refers to what customers
receive by interacting with the service provider (outcome). This dimension is usually more
objectively measured than the functional dimension (Palmer, 2008). Functional quality
(process) refers to the subjective evaluation that customers make about a service. It also
refers to how a service provider performs or delivers a service. For instance, the way
personnel deal with customers within the time they are waiting for the service (Palmer,
2008). Furthermore, this dimension is related to appearance, behaviour and organisation
personnel communicating with customers, which in turn can influence the customer„s
evaluation of the service and “how the customer gets the technical outcome” (Gronroos,
2007a, p.61).
Image dimension refers to the company image and how customers perceive the firm
(Gronroos, 2007b). External factors such as advertising that is undertaken by the company
can influence its image. If a positive image of the organization is held in the memory of the
customer, s/he will tolerate small mistakes if these mistakes are not repeated, while a
negative image leads to customers being less tolerant of mistakes made by the organisation
(Kang and James, 2004).
In some cases Gronroos introduces image as a dimension, and sometimes he introduces it as
a factor that has an impact on technical and functional quality dimensions; he does not refer
to it as a dimension. Therefore, Gronroos‟ model can be seen as both a three dimensional
model and a two dimensional model (Gronroos, 2007b; a), depending on whether image is
included or excluded as a dimension.

42
Figure 2.5 Gronroos‟ Service Quality Model
Source: Gronroos (2007, p. 77)
It can be noted from Figure 2.5 (Nordic model) above that experienced service has only three
dimensions: technical quality, functional quality and image. Expected service, on the other
hand, has many components including marketing, communication, sales, image, word-of-
mouth and customer needs (Gronroos, 2007b). The experienced service and the expected
service determine the perceived service. For instance, a customer has high perceptions of
service quality when his or her experiences meet their expectations (Gronroos, 2007b).
Gronroos (2000) argues that the perceived service quality is not an outcome of the technical
and functional dimension only, but an outcome of the difference between the customer‟s
expectations of service quality and the customer‟s experiences of service quality. He also
adds that to reach high levels of service quality, seven criteria must be met, as follows:
1. Professionalism and skills - this refers to employees‟ skills in an organisation
and how they use these skills when dealing with customer problem solving
(outcome dimension).
2. Attitude and behaviour - this refers to the friendless of the organisation‟s
employees (process dimension).
Expected Service Perceived Service
Experienced
Service
Image
Technical
Quality Outcome
Functional
Quality Process
Marketing Communications
Image
Word-of-Mouth
Customer Needs and Values
Sales
Public Relations
Image

43
3. Accessibility and flexibility - this refers to the speed of service delivery, the
operating hours of the organisation and the systems used within the organisation
to facilitate delivery of the service to the customer (process dimension).
4. Reliability and trustworthiness - this is the criteria that are related to the ability
of the organisation to perform the promised service accurately and without
errors (process dimension).
5. Service recovery - this refers to the way in which the organisation deals with
service failure and how they rectify the situation (process dimension).
6. Serviscape - this refers to the organisation‟s physical aspects which support a
pleasurable experience (process dimension).
7. Reputation and credibility - this refers to the customer‟s faith about the service
provider and how s/he receives value for their money (image).
On the other hand, there is another model which can be categorised under the Nordic school
(Athanassopoulos, 2000). This model includes three dimensions, as follows (Lehtinen and
Lehtinen, 1991):
1. Physical quality - this refers to the physical products (goods) consumed
within the service process. In most cases physical quality is evaluated in
an objective manner. It also includes physical support which facilitates the
service production. Physical support is further divided into two elements:
the environment of the service such as the decoration and facilities within
an organisation, and the equipment such as PCs in the case of a bank.
2. Interactive quality - this refers to the interaction that customers have with
employees or any other elements (i.e. ATM machines in banks) within an
organisation. It also includes the interaction customers have with each
other.
3. Corporate quality - this is the dimension that is related to the history of the
organisation and its image. This dimension takes time to evolve.
Lehtinnen and Lehtinen (1991) have created another service quality model based on the
customer‟s point of view. It includes two dimensions:
1. Process quality - this dimension represents the way the customer sees the
production process. Therefore, this dimension can be taken as the
subjective assessment of the service process. Process quality stems from a
match between the customer‟s style and the provider‟s style, and if there
is a mismatch between the two, low quality will be perceived by the
customer.

44
2. Output quality - this refers to the customer‟s judgment of the end result of
the service. It is further divided into two elements: tangibles (i.e. car
wash) and intangibles (i.e. tourism that depends on feelings of customer).
2.5.3 Hierarchical Model
The Hierarchical Model was developed by Brady and Cronin (2001), who adapted the views
of Rust and Oliver (1994) and Dabholkar, Thorpe and Tenz (1996). They concluded in their
model that perceived service quality is based on three dimensions (see Figure 2.6). These
dimensions are customer employee interaction, service environment and outcome.
Furthermore, they argued that service quality is a multidimensional and multilevel construct.
Therefore, the hierarchical model conceptualised service quality based on three dimensions:
interaction quality, physical environment quality and outcome quality. For each dimension
there are three sub-dimensions which form the perception of that dimension. The combined
perception of interaction quality, physical environment quality and outcome quality leads to
the overall service quality perception.
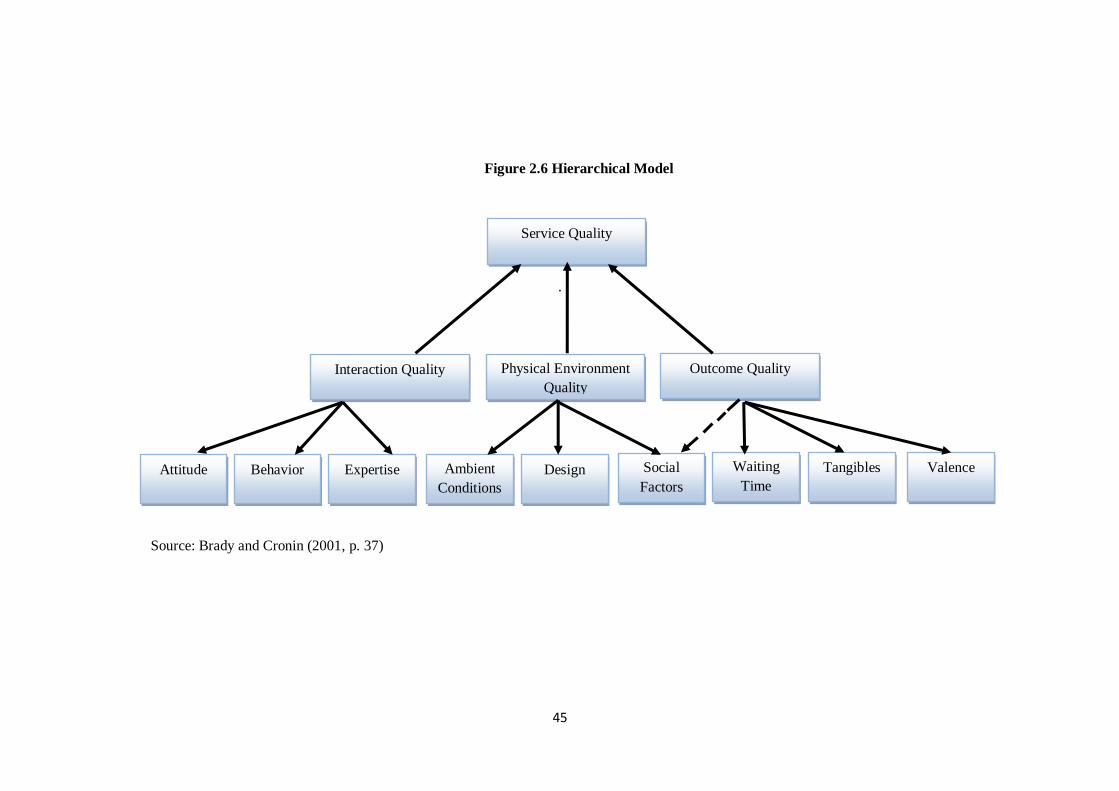
45
Figure 2.6 Hierarchical Model
.
Source: Brady and Cronin (2001, p. 37)
Service Quality
Outcome Quality Physical Environment
Quality
Interaction Quality
Attitude Behavior Expertise Ambient
Conditions
Design Social
Factors
Waiting
Time
Tangibles Valence
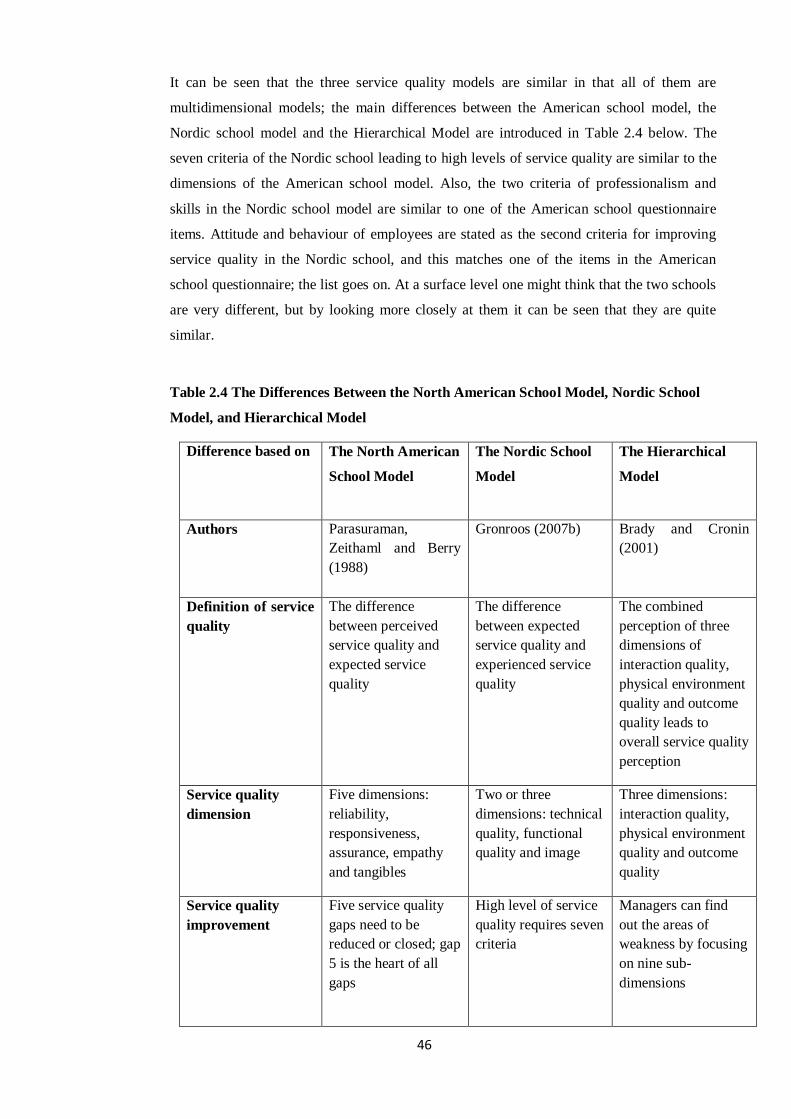
46
It can be seen that the three service quality models are similar in that all of them are
multidimensional models; the main differences between the American school model, the
Nordic school model and the Hierarchical Model are introduced in Table 2.4 below. The
seven criteria of the Nordic school leading to high levels of service quality are similar to the
dimensions of the American school model. Also, the two criteria of professionalism and
skills in the Nordic school model are similar to one of the American school questionnaire
items. Attitude and behaviour of employees are stated as the second criteria for improving
service quality in the Nordic school, and this matches one of the items in the American
school questionnaire; the list goes on. At a surface level one might think that the two schools
are very different, but by looking more closely at them it can be seen that they are quite
similar.
Table 2.4 The Differences Between the North American School Model, Nordic School
Model, and Hierarchical Model
Difference based on
The North American
School Model
The Nordic School
Model
The Hierarchical
Model
Authors
Parasuraman,
Zeithaml and Berry
(1988)
Gronroos (2007b) Brady and Cronin
(2001)
Definition of service
quality
The difference
between perceived
service quality and
expected service
quality
The difference
between expected
service quality and
experienced service
quality
The combined
perception of three
dimensions of
interaction quality,
physical environment
quality and outcome
quality leads to
overall service quality
perception
Service quality
dimension
Five dimensions:
reliability,
responsiveness,
assurance, empathy
and tangibles
Two or three
dimensions: technical
quality, functional
quality and image
Three dimensions:
interaction quality,
physical environment
quality and outcome
quality
Service quality
improvement
Five service quality
gaps need to be
reduced or closed; gap
5 is the heart of all
gaps
High level of service
quality requires seven
criteria
Managers can find
out the areas of
weakness by focusing
on nine sub-
dimensions

47
2.5.4 Other service quality models
Other service quality models can be found in literature. These models are based on the
importance of service quality, how service quality can be improved and the dimensions of
service quality. For instance, dimensions of service quality are those service attributes which
a customer might have expectations about, and also the service needs that are to be received
by the customer at a specified level (Johnston and Clark, 2005). Parasuraman, Zeithaml and
Berry (1985) developed the Service Quality Dimensions Model, identifying ten dimensions
that are determinants of perceived service quality. They mentioned that in order to assess the
service quality offered by any business, customers rely on a set of dimensions as criteria.
These dimensions are shown in Figure 2.7 below.
Figure 2.7 Service Quality Dimensions Model
Source: Parasuraman, Zeithaml and Berry (1985, p. 48)
The model suggests, in addition to the three factors that affect or shape customers'
expectations (word-of-mouth, personal needs and past experience), ten dimensions as
follows: access; communication; competence; courtesy; credibility; responsiveness; security;
tangibles; reliability; and understanding, knowing the customer. It can be noted that these
dimensions are not independent of each other, as Zeithaml and Parasuraman (1990)
mentioned in their book, as an overlap may occur between two or more of them.
There is no doubt that one of the most important factors that influences service quality
success is the balance between customers and staff in an organisation. Beddowes et al.
(1987) developed the Behavioural Service Quality Model based on behavioural
considerations. This model is shown in Figure 2.8. Their research mentioned that common
Service Quality Dimensions:
1. Access
2. Communication
3. Competence
4. Courtesy
5. Credibility
6. Responsiveness
7. Security
8. Tangibles
9. Reliability
10. Understanding, Knowing
the Customer
W.O.M Personal
Needs
Past
Experience
Expected Service
Perceived
Service
Perceived
Service Quality

48
mistakes are made by service organisations when considering customer expectations as part
of marketing efforts, without balancing this with development of staff and systems to
enhance what the organisation can offer. This model clearly identifies other important factors
that have an impact on service quality success, such as effectiveness of the service delivery
system.
Figure 2.8 Behavioural Service Quality Model
Source: Beddowes et al. (1987, p. 62)
Moore (1987) also suggested a model that includes six steps, as shown in Figure 2.9. The
model is descriptive and introduces a route map of how to launch a „quality‟ drive.
Accordingly, its focus is external but it does not clearly link quality problems to losing the
appropriate market focus. It can also be noted that the model does not supply a mechanism
for the purpose of identifying potential areas where quality shortfall might arise. The key
components of this model are steps 2, 3 and 4. Step 4, „quality action plan‟, is the key output
Service concept
External presentation: marketing mix
communication
Internal operations:
staff
process systems
Balancing factor
Customer expectations Staff expectations
Service delivery
system
------The Crunch---------
Experience
Loyalty
Profit

49
of it. It can be seen that a plan will ideally include: (a) an objective statement; (b) a
description of the proposed improvement; (c) an order of priority; (d) an implementation
schedule; and (e) a list of required resources. Both internal and external customer satisfaction
should be measured by this proposed monitoring system. It can be added that this model has
the ability to provide a framework for addressing broad organisational quality issues.

50
Figure 2.9 Organisational Service Quality Improvement Model
Source: Moore (1987, p. 58)
Identify quality problems
Provide staff and financial
resources
Integrate quality improvement
with other corporate programmes Emphasize importance of quality
improvement efforts
Define external and
internal customers
Identify expectations
Assess magnitude of
quality problems
Identify causes of low
quality and estimate cost of
low service quality
Step 1
Obtain
management
commitment
Step 2
Identify customer
expectations
Step 3
Evaluate
performance
Step4
Develop quality
strategies
Step 5
Implement
strategy
Step 6
Monitor
performance
Assess effectiveness of
quality improvement Revise standards and
plans, and identify
changes in customers
Change culture
Improve performance
Reduce costs
Commitment statement
Quality objectives
Quality standards Quality action plans
Monitoring systems

51
It is generally recognised that customers assess the service they receive. Their expectations
are also important to determine whether they are satisfied or not. Accordingly, the question
will come to mind as to how expectations affect service quality. Nash (1988) suggested a
model based on the „service journey‟ idea. This model is depicted in Figure 2.10, which
shows the typical stages of a „service journey‟.
Figure 2.10 Service Quality Journey Model
Source: Nash (1988, p. 61)
The experience and expectations shaped prior to purchase help to form the expectations of
the next stage, and the „service journey‟ is initiated by „need‟. If there is a match between
Need
Formal
communication
Word-of-mouth
Accessibility
Compare need
with perceived offering
Compare
expectation
against experience
Perceived quality
Initial
expectation Expectation
Experience Expectation
Preparing/
purchase Joining Participation Leaving Reflection
Experience Experience Experience
Expectation Expectation Expectation
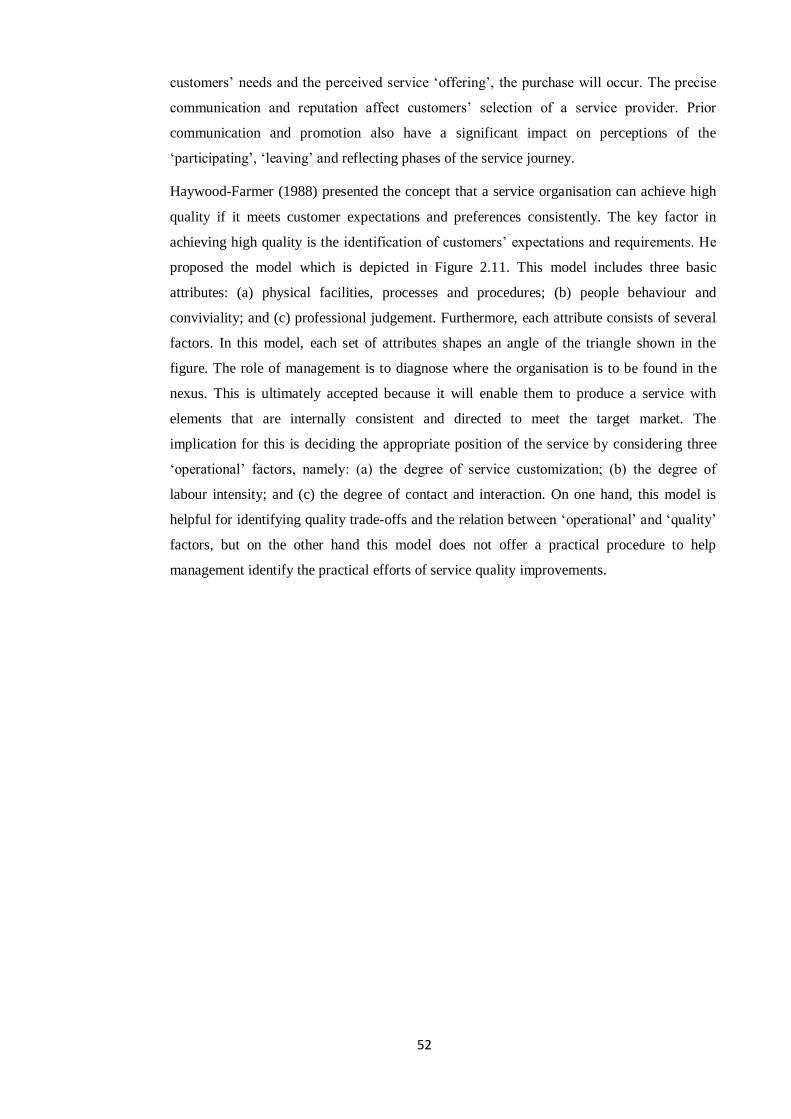
52
customers‟ needs and the perceived service „offering‟, the purchase will occur. The precise
communication and reputation affect customers‟ selection of a service provider. Prior
communication and promotion also have a significant impact on perceptions of the
„participating‟, „leaving‟ and reflecting phases of the service journey.
Haywood-Farmer (1988) presented the concept that a service organisation can achieve high
quality if it meets customer expectations and preferences consistently. The key factor in
achieving high quality is the identification of customers‟ expectations and requirements. He
proposed the model which is depicted in Figure 2.11. This model includes three basic
attributes: (a) physical facilities, processes and procedures; (b) people behaviour and
conviviality; and (c) professional judgement. Furthermore, each attribute consists of several
factors. In this model, each set of attributes shapes an angle of the triangle shown in the
figure. The role of management is to diagnose where the organisation is to be found in the
nexus. This is ultimately accepted because it will enable them to produce a service with
elements that are internally consistent and directed to meet the target market. The
implication for this is deciding the appropriate position of the service by considering three
„operational‟ factors, namely: (a) the degree of service customization; (b) the degree of
labour intensity; and (c) the degree of contact and interaction. On one hand, this model is
helpful for identifying quality trade-offs and the relation between „operational‟ and „quality‟
factors, but on the other hand this model does not offer a practical procedure to help
management identify the practical efforts of service quality improvements.
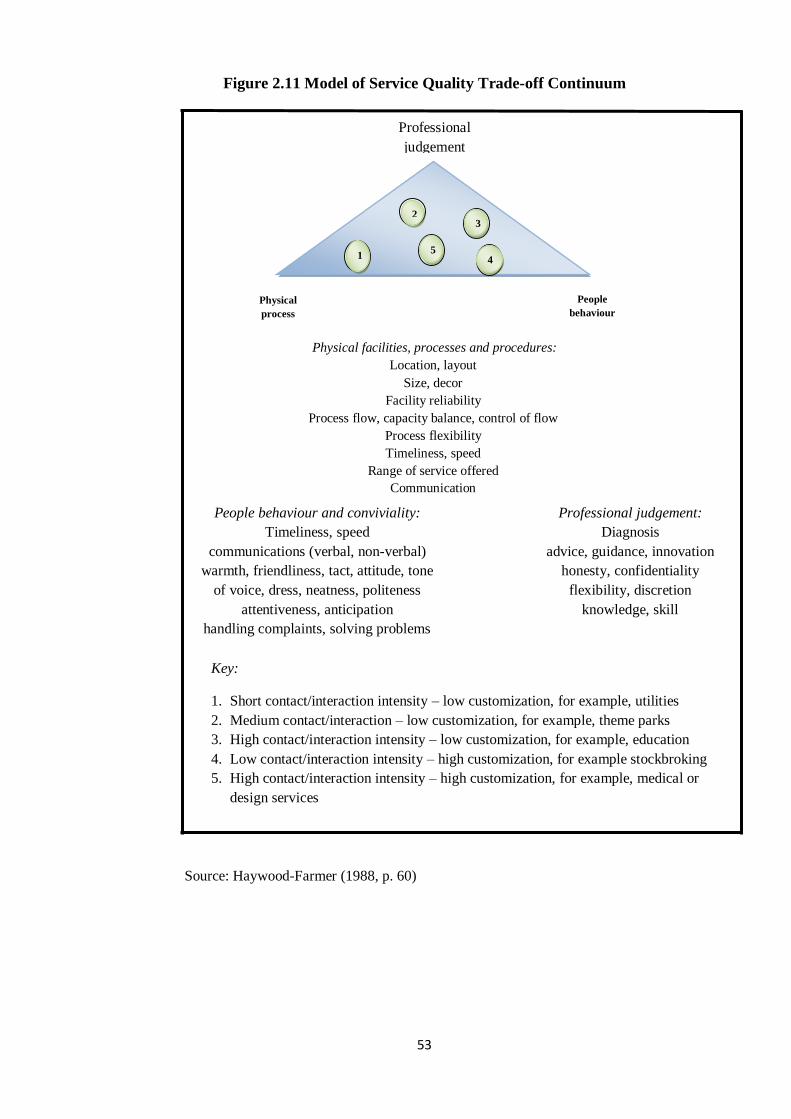
53
Figure 2.11 Model of Service Quality Trade-off Continuum
Source: Haywood-Farmer (1988, p. 60)
Professional
judgement
Physical
process
People
behaviour
1
2
5
3
4
Physical facilities, processes and procedures:
Location, layout
Size, decor
Facility reliability
Process flow, capacity balance, control of flow
Process flexibility
Timeliness, speed
Range of service offered
Communication
People behaviour and conviviality:
Timeliness, speed
communications (verbal, non-verbal)
warmth, friendliness, tact, attitude, tone
of voice, dress, neatness, politeness
attentiveness, anticipation handling complaints, solving problems
Professional judgement:
Diagnosis
advice, guidance, innovation
honesty, confidentiality
flexibility, discretion
knowledge, skill
Key:
1. Short contact/interaction intensity – low customization, for example, utilities
2. Medium contact/interaction – low customization, for example, theme parks
3. High contact/interaction intensity – low customization, for example, education
4. Low contact/interaction intensity – high customization, for example stockbroking
5. High contact/interaction intensity – high customization, for example, medical or
design services
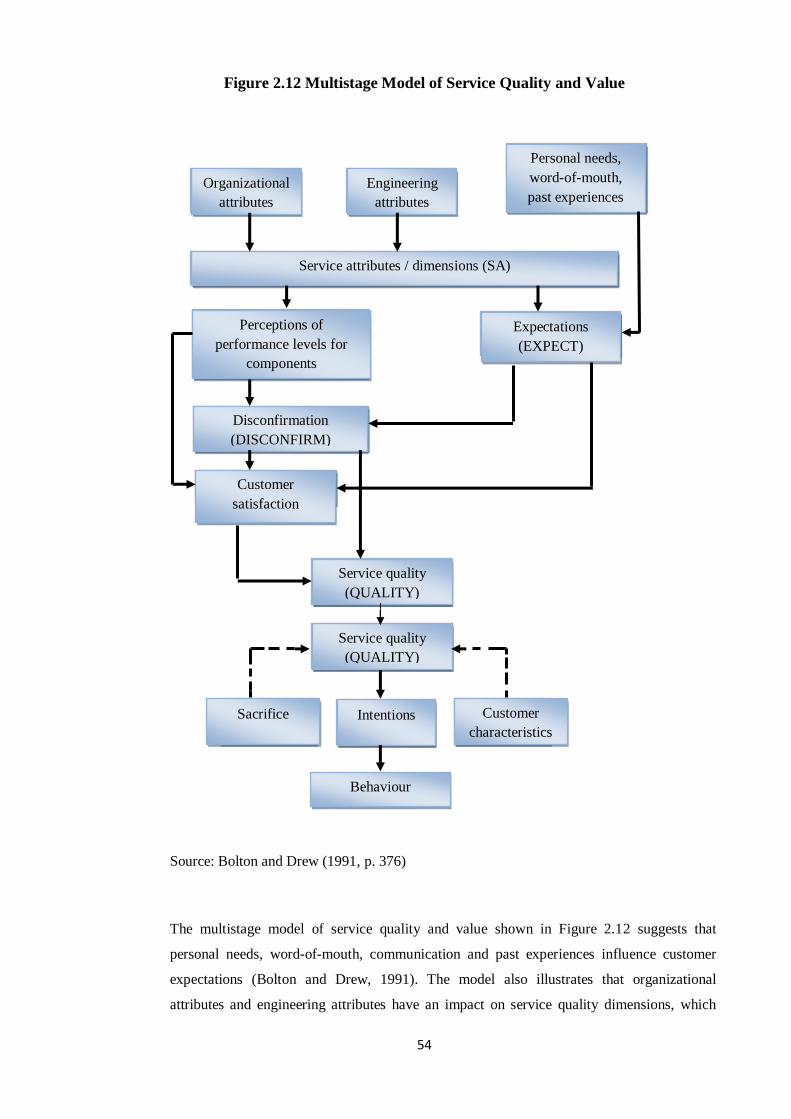
54
Figure 2.12 Multistage Model of Service Quality and Value
Source: Bolton and Drew (1991, p. 376)
The multistage model of service quality and value shown in Figure 2.12 suggests that
personal needs, word-of-mouth, communication and past experiences influence customer
expectations (Bolton and Drew, 1991). The model also illustrates that organizational
attributes and engineering attributes have an impact on service quality dimensions, which
Organizational
attributes
Engineering
attributes
Personal needs,
word-of-mouth,
past experiences
Service attributes / dimensions (SA)
Perceptions of
performance levels for
components
(PERFORM)
Expectations
(EXPECT)
Disconfirmation
(DISCONFIRM)
Customer
satisfaction
Service quality
(QUALITY)
Service quality
(QUALITY)
Intentions Sacrifice Customer
characteristics
Behaviour
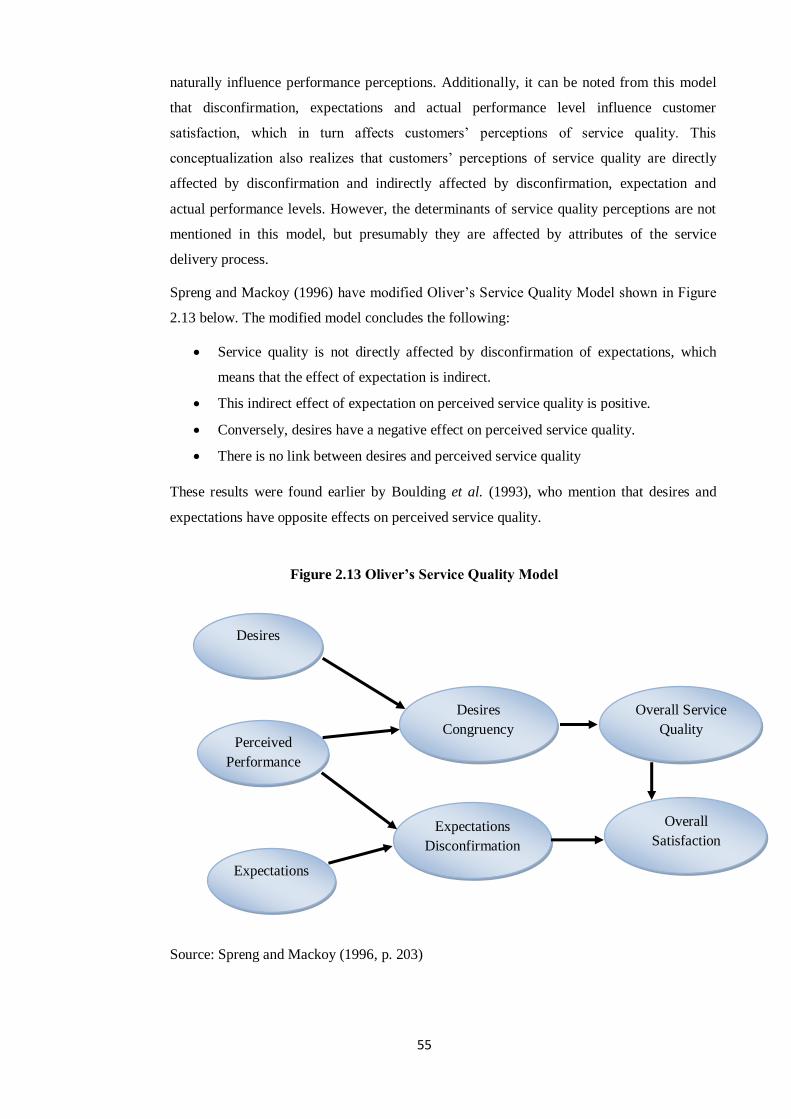
55
naturally influence performance perceptions. Additionally, it can be noted from this model
that disconfirmation, expectations and actual performance level influence customer
satisfaction, which in turn affects customers‟ perceptions of service quality. This
conceptualization also realizes that customers‟ perceptions of service quality are directly
affected by disconfirmation and indirectly affected by disconfirmation, expectation and
actual performance levels. However, the determinants of service quality perceptions are not
mentioned in this model, but presumably they are affected by attributes of the service
delivery process.
Spreng and Mackoy (1996) have modified Oliver‟s Service Quality Model shown in Figure
2.13 below. The modified model concludes the following:
Service quality is not directly affected by disconfirmation of expectations, which
means that the effect of expectation is indirect.
This indirect effect of expectation on perceived service quality is positive.
Conversely, desires have a negative effect on perceived service quality.
There is no link between desires and perceived service quality
These results were found earlier by Boulding et al. (1993), who mention that desires and
expectations have opposite effects on perceived service quality.
Figure 2.13 Oliver‟s Service Quality Model
Source: Spreng and Mackoy (1996, p. 203)
Desires
Perceived
Performance
Expectations
Desires
Congruency
Overall Service Quality
Expectations
Disconfirmation
Overall
Satisfaction

56
The Service Quality-Profit Chain Model shown in Figure 2.14 supports the link between
improvements in service quality and improvements in financial performance. As mentioned
earlier in this chapter, there is a strong correlation between service quality and financial
performance. Paraskevas (2001) points out that high profitability can be achieved by a group
of employees who apply service quality internally and deliver the resultant service to
external customers.
Figure 2.14 Service Quality-Profit Chain Model
Source: Heskett, Sasser and Schlesinger (1997, p. 166)
This model presumes that the implementation of internal service quality (in the workplace)
leads to employee satisfaction. Furthermore, employee satisfaction in turn increases
Internal service quality (the
working environment, workplace)
Employee satisfaction
Employee productivity Employee retention
External service value
Customer satisfaction
Customer loyalty
Revenue growth
Improved profitability

57
employee productivity and retention. All of those attributes are reflected positively in
external service value. Within this model, high service value leads to customer satisfaction
and loyalty, which in turn results in revenue and profitability growth. Eventually, the
resultant improvements have a positive impact on internal service quality. This has led to the
idea that passing these attributes together between the internal (workplace) and external (the
customer) environment will form a service-profit chain.
The aforementioned models of service quality can be employed by management in service
organizations to improve service quality performance. Eight models have been presented in
this section, each with a different focus. Table 2.5 shows the primary focus of each model.

58
Table 2.5 Primary Focus of Service Quality Models
Model Primary focus of the model
Service Quality Dimensions
Parasuraman, Zeithaml and Berry (1985)
This model shows service quality dimensions and
their relation to expected and perceived service. It
also shows the factors that influence customer
expectations.
Behavioural Service Quality
Beddowes et al. (1987)
This model proves the significance of the influence
of behaviour of delivery personnel on perceived
quality. It also suggests that a balance between
customer and staff expectations leads to a good
quality of service. Furthermore, the model
provides an overview of the importance of the
delivery system.
Organizational Service Quality Improvement
Moore (1987)
This model provides a framework for applying a
quality improvement programme. It also shows the
steps involved in a quality improvement
programme and the pertinent factors of each step.
Service Quality Journey
Nash (1988)
This model provides the stages of the service
journey. Furthermore, it shows the impact of
experience at each stage on shaping the
expectations and perception of service quality.
Service Quality Trade-off Continuum
Haywood-Farmer (1988)
This model identifies quality trade-offs using three
service attributes, namely: (a) degree of
customization; (b) degree of labour intensity; (c)
degree of contact and interaction.
Multistage Model of Service Quality and Value
Bolton and Drew (1991)
This model supports the view that customer
expectations are influenced by personal needs,
word-of-mouth, and past experience. It also
illustrates that organizational attributes and
engineering attributes influence service quality
dimensions, which in turn influence perceptions of
performance.
Oliver‟s Service Quality Model
Spreng and Mackoy (1996)
This model suggests that customer expectations
have an indirect effect on service quality.
Furthermore, it also proposes that desires have a
negative effect on perceived service quality.
Service Quality-Profit Chain
Heskett, Sasser, Schlesinger (1997)
This model supports the correlation between
improvements in service quality and improvements
in financial performance.
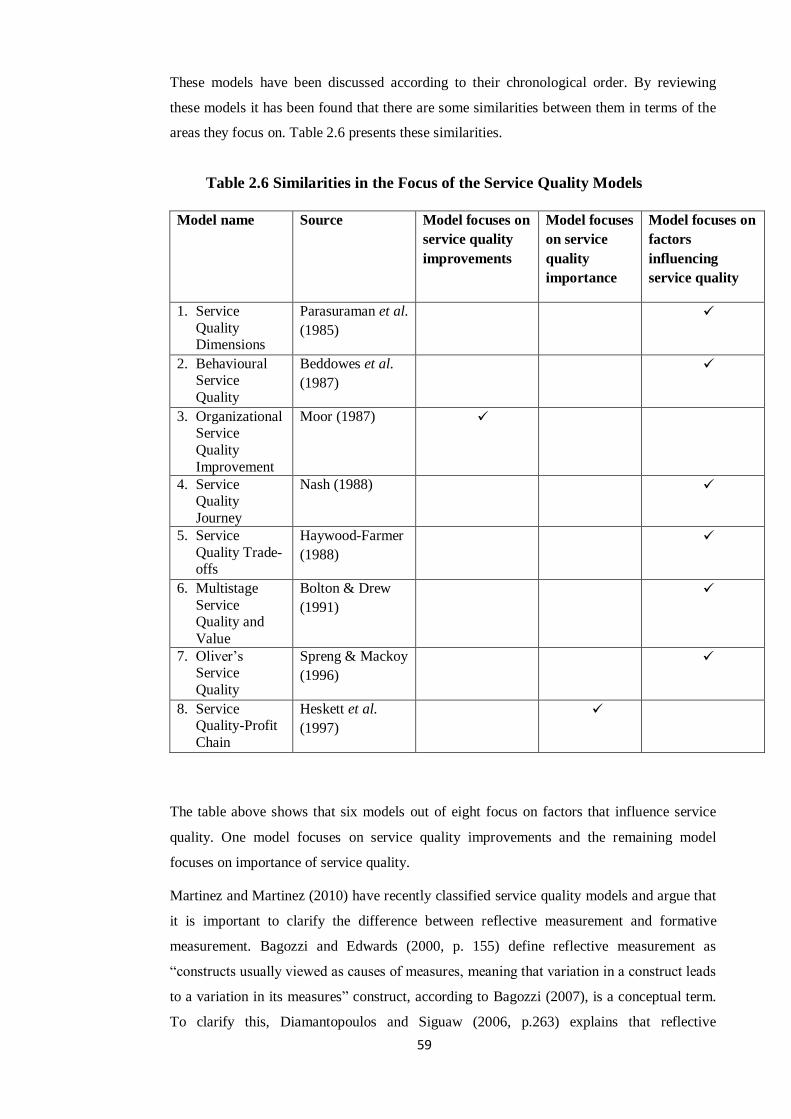
59
These models have been discussed according to their chronological order. By reviewing
these models it has been found that there are some similarities between them in terms of the
areas they focus on. Table 2.6 presents these similarities.
Table 2.6 Similarities in the Focus of the Service Quality Models
Model name Source Model focuses on
service quality
improvements
Model focuses
on service
quality
importance
Model focuses on
factors
influencing
service quality
1. Service
Quality Dimensions
Parasuraman et al.
(1985)
2. Behavioural Service
Quality
Beddowes et al.
(1987)
3. Organizational Service
Quality
Improvement
Moor (1987)
4. Service Quality
Journey
Nash (1988)
5. Service
Quality Trade-offs
Haywood-Farmer
(1988)
6. Multistage
Service Quality and
Value
Bolton & Drew
(1991)
7. Oliver‟s Service
Quality
Spreng & Mackoy
(1996)
8. Service Quality-Profit
Chain
Heskett et al.
(1997)
The table above shows that six models out of eight focus on factors that influence service
quality. One model focuses on service quality improvements and the remaining model
focuses on importance of service quality.
Martinez and Martinez (2010) have recently classified service quality models and argue that
it is important to clarify the difference between reflective measurement and formative
measurement. Bagozzi and Edwards (2000, p. 155) define reflective measurement as
“constructs usually viewed as causes of measures, meaning that variation in a construct leads
to a variation in its measures” construct, according to Bagozzi (2007), is a conceptual term.
To clarify this, Diamantopoulos and Siguaw (2006, p.263) explains that reflective
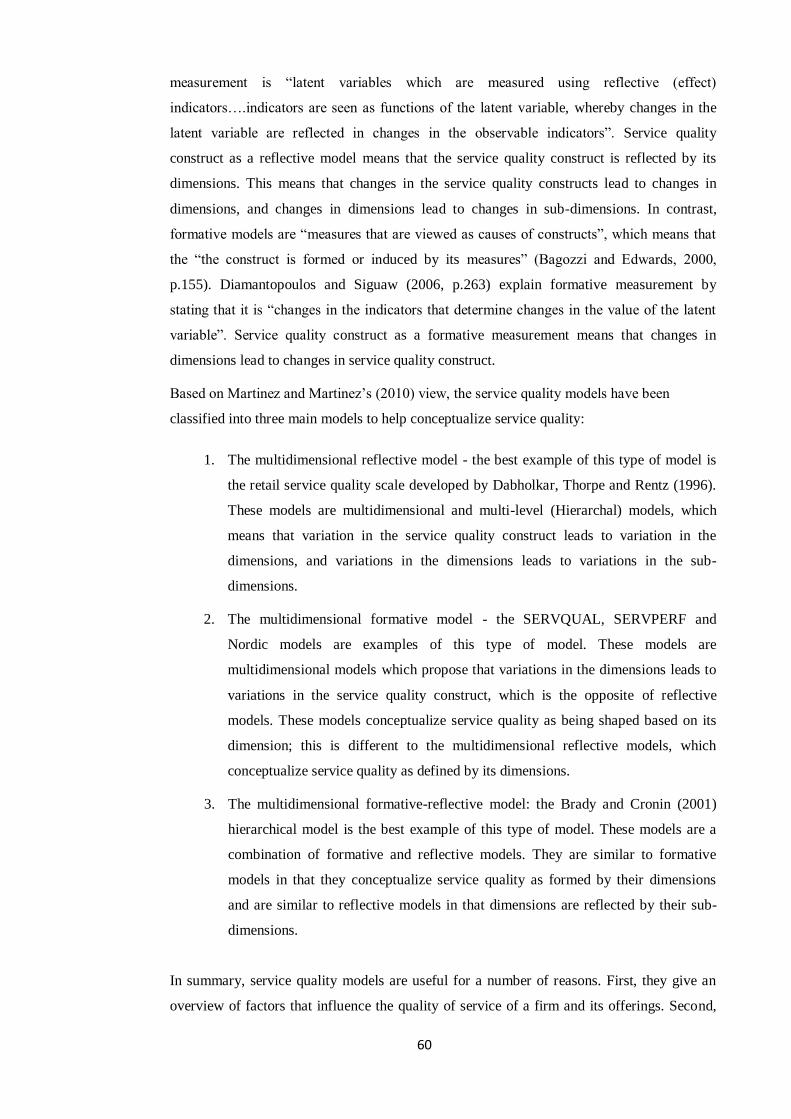
60
measurement is “latent variables which are measured using reflective (effect)
indicators….indicators are seen as functions of the latent variable, whereby changes in the
latent variable are reflected in changes in the observable indicators”. Service quality
construct as a reflective model means that the service quality construct is reflected by its
dimensions. This means that changes in the service quality constructs lead to changes in
dimensions, and changes in dimensions lead to changes in sub-dimensions. In contrast,
formative models are “measures that are viewed as causes of constructs”, which means that
the “the construct is formed or induced by its measures” (Bagozzi and Edwards, 2000,
p.155). Diamantopoulos and Siguaw (2006, p.263) explain formative measurement by
stating that it is “changes in the indicators that determine changes in the value of the latent
variable”. Service quality construct as a formative measurement means that changes in
dimensions lead to changes in service quality construct.
Based on Martinez and Martinez‟s (2010) view, the service quality models have been
classified into three main models to help conceptualize service quality:
1. The multidimensional reflective model - the best example of this type of model is
the retail service quality scale developed by Dabholkar, Thorpe and Rentz (1996).
These models are multidimensional and multi-level (Hierarchal) models, which
means that variation in the service quality construct leads to variation in the
dimensions, and variations in the dimensions leads to variations in the sub-
dimensions.
2. The multidimensional formative model - the SERVQUAL, SERVPERF and
Nordic models are examples of this type of model. These models are
multidimensional models which propose that variations in the dimensions leads to
variations in the service quality construct, which is the opposite of reflective
models. These models conceptualize service quality as being shaped based on its
dimension; this is different to the multidimensional reflective models, which
conceptualize service quality as defined by its dimensions.
3. The multidimensional formative-reflective model: the Brady and Cronin (2001)
hierarchical model is the best example of this type of model. These models are a
combination of formative and reflective models. They are similar to formative
models in that they conceptualize service quality as formed by their dimensions
and are similar to reflective models in that dimensions are reflected by their sub-
dimensions.
In summary, service quality models are useful for a number of reasons. First, they give an
overview of factors that influence the quality of service of a firm and its offerings. Second,

61
they help management to understand issues related to the service quality construct. Third,
they facilitate how service quality shortfalls develop. Finally, they help to apply
improvement programmes. On the other hand, it is also important to look at the limitations of
models. Models are usually invariably simplified versions of reality. The basic role of the
model is to show simply relationships between complex phenomena (Ghobadian, Speller and
Jones, 1994). Therefore, it can be noted from the models presented in this section that they
deal with social phenomena. Indeed, service quality can be affected significantly by human
behaviour. Additionally, these models cannot sufficiently manage every complexity that an
organisation may face. However, it has been found that early service quality models have the
power to build the service quality concept. This is evident from such models focussing on
areas of service quality in terms of dimensions, importance, factors that influence it, and how
it can be improved. In other words, these models effectively contribute to the circle of the
service quality concept. For instance, it is recognised that service quality itself means
meeting or exceeding customer needs and requirements; but without knowing the value of it
and the factors which may affect it, the concept is still indecisive.
2.6 The Importance of Service Quality
Generally, the importance of service quality is undeniable in that good service quality
impacts positively on business performance. Delivering a good level of service to customers
is essential for achieving success and surviving in the competitive world (Wang, Lo and Hui,
2003). Furthermore, providing high quality of services and products enhances the reputation
of the firm, attracts new customers through word-of-mouth, and increases profitability
(Julian and Ramaseshan, 1994). Service quality is recognised as a key strategic issue for
organisations operating in service sectors (Lewis and Mitchell, 1990; Spathis, Petridou and
Glaveli, 2004). Organisations achieving a higher level of service quality have high levels of
customer satisfaction, which is an antecedent of sustainable competitive advantage (Lewis
and Mitchell, 1990; Meuter et al., 2000; Guo, Duff and Hair, 2008). Moreover, studies
undertaken by researchers in the field indicate that having a service quality strategy has a
strong correlation with financial performance, manufacturing costs, customer loyalty,
customer retention, word-of-mouth referral, price insensitivity, sales growth, responsiveness
to demand, a successful marketing strategy, development of an organisation‟s strategy,
having better understanding of the customer, matching service delivery with expectations of
the customer, providing strong customer orientation, and enhancing IT capability
(Parasuraman, Zeithaml and Berry, 1985; Ravald and Gronroos, 1996; Turubull and
Moustakatos, 1996; Chaston, 2000; Jabnoun and Al-Tamimi, 2003; Wang, Lo and Hui,
2003; Bell, Auh and Smalley, 2005; Petridou et al., 2007; Zhu and Nakata, 2007; Parnell
and Menefee, 2007; Scotti, Harmon and Behson, 2007).

62
A review of work focusing on service quality shows the importance of this concept in
extracting or maximising value from customers. Therefore, there is clarity in the concept of
service quality linked to the management of customer relationships, and the value that this
brings to organisations. In accordance with existing literature (Cronin and Taylor, 1992;
Cronin, Brady and Hult, 2000; Norreklit, 2000; Rao and Kelkar, 1997; Zhu and Nakata,
2007; Metters and Marucheck, 2007; Stading and Altay, 2007), several factors will be
presented to highlight the importance of service quality. They can be considered as the
critical foundation of best practice in service quality in organisations:
1. Achieving customer satisfaction
2. Achieving customer loyalty and retention
3. Enhancing financial performance
4. Ensuring the success of the marketing strategy
5. Ensuring service interaction is well-developed
6. Focusing on „easily doing business‟ with customers
7. Enhancing IT capability to improve customer orientation
2.6.1 Achieving customer satisfaction
Customer satisfaction is the measure of product or service quality. For example, if service
quality meets customer expectations and needs, then customer satisfaction will be achieved
(Gatchalian, 1999; Oliver, 1980). If it does not then customer satisfaction will not be
achieved (de Wulf, 2003). It is not surprising that unsatisfied customers are often the cause
of negative word-of-mouth communication as they report negative impressions to other
customers (Lewis, 1991; Newman, 2001; Caruana, 2002). Positive and negative word-of-
mouth communication is very important, especially in Arabic countries such as Libya where
social life and culture are structured in such a way that social relationships among people are
very strong.
Numerous researchers have identified customer satisfaction as a task of function in which the
consumer accesses service quality, product quality and price, while others see customer
satisfaction as the outcome when a customer comes back but the product does not (Obaid,
2006). Furthermore, Lee, Lee and Yoo (2000) describe customer satisfaction as an emotional
reaction of a customer after accessing a service or product. It has also been described by
Cronin and Taylor (1992) as “transaction-specific”. Customer satisfaction is the only
relevant objective for ensuring stable and continuously increasing business in an organisation
(Goetsch and Stanley, 1997). Similarly, Palmer (1994) argues that customer satisfaction is
more important than quality in influencing purchasing intention. On the other hand, in an
empirical study by Cronin and Taylor (1994), they tried to clarify the difference between
63
service quality and customer satisfaction by stating that the former is about long-term
attributes while the latter is a transitory judgement of service quality.
Within service literature it is argued that there is a strong correlation between service quality
and customer satisfaction (Cronin and Taylor, 1992; Taylor and Baker, 1994; Zeithaml and
Bitner, 1996). More precisely, some researchers and academics have mentioned that
customer satisfaction is an antecedent of service quality (Parasuraman, Zeithaml and Berry,
1985, 1988, 1994; Parasuraman and Berry, 1991; Bitner, 1990; Carman, 1990).
Alternatively, other researchers indicate that service quality is an antecedent of customer
satisfaction (Bolton and Drew, 1991; Anderson and Sullivan, 1993; Cronin and Taylor,
1992, 1994), and that service quality is not equivalent to satisfaction (Oliver, 1980).
However, empirical studies carried out by Fisk, Brown and Bitner (1993) and Levesque and
McDongall (1996) support the view that service quality dimensions are important in
determining customer satisfaction. For example, a study by Levesque and McDongall (1996)
shows that the performance of a service provider in relation to the core dimensions of service
quality is a vital driver for customer satisfaction. Other researchers have focused on this link,
suggesting that enhanced service quality impacts positively on customer satisfaction (Bitner,
Booms and Mohr, 1994; Anderson, Fornell and Lehmann, 1994).
In recent years, the relationship between service quality and customer satisfaction has been
examined in the banking sectors of various countries. For example, Amin and Isa (2008, p.
205) indicate in their study that “service quality is positively associated with customer
satisfaction in Malaysian Islamic banking”. Similarly, research carried out in the retail
banking sector in the UAE supports the view that service quality dimensions appear to be
associated with customer satisfaction (Jamal and Naser, 2002). This has been further
supported by Othman and Owen (2001), who mention that there is a significant relationship
between service quality and customer satisfaction in Islamic banking in Kuwait. Moreover,
Karatape, Yavas and Babakus (2005) state that service quality appears to have the strongest
effect on satisfaction, adding that customer satisfaction is a mediator between service quality
and purchase intention in conventional banking. In addition, Arasly, Katircioglu and
Mehtap-Smadi (2005) point out that service quality is a vital predictor of customer
satisfaction in Turkey‟s banking industry.
In reality, the relationship between service quality and customer satisfaction is still subject to
great academic debate. For example, Bahia and Nantel (2000) point out that no consensus
has been reached regarding the causal relationship between service quality and customer
satisfaction. However, literature clearly suggests that applying high levels of service quality
leads to higher levels of customer satisfaction. It would also appear that a satisfied customer
makes an intention to repurchase and engages in word-of-mouth referring, which in turn will

64
increase profit, while having dissatisfied customers leads to poor marketing and turnover
ratio.
2.6.2 Achieving customer loyalty and retention
Customer loyalty, with its final influence on repurchasing, is perhaps the most important
construct in services marketing. Customer loyalty has been conceptualized as the probability
of repeat purchase to the proportion of purchase (Dick and Basu, 1994). It has also been
defined by Oliver (1997, p. 392) as “a deeply held commitment to rebuy or repatronize a
preferred product or service consistently in the future, despite situational influences and
marketing efforts having the potential to cause switching behaviour”.
Service literature has supported the view that there is a correlation between service quality
and customer loyalty (e.g. Boulding et al., 1993; Cronin, Brady and Hult, 2000; Zeithaml,
Berry and Parasuraman, 1996). Kurtz and Clow (1998) prove this relationship when they
mention that customers who accept the quality of service they receive will be the most loyal
and the least willing to switch to a new service provider. More precisely, an empirical study
by Bell, Auh and Smalley (2005) found that the main effect of technical service quality on
customer loyalty was stronger than the effect of functional service quality.
Many researchers have investigated the topic of customer loyalty and its relation to service
quality and customer satisfaction in depth. Oliver (1997), for example, has suggested the
Four-Stage Loyalty Model shown in Figure 2.15. Each stage represents a greater degree of
loyalty. The first stage proposed by this model is „cognitive loyalty‟, indicating that
customers may continue to patronize one store rather than other stores because of the better
service provided.
Figure 2.15 Oliver‟s Four-Stage Loyalty Model
Source: Oliver (1997, p. 394)
Continuing in the same context, Sivadas and Baker-Prewitt (2000) have examined the
applicability of Oliver‟s model in the store loyalty context. Their findings indicate that
service quality, satisfaction, and fostering a favourable relative attitude have a positive
Cognitive
Loyalty Affective
Loyalty
Cognitive
Loyalty
Action
Loyalty
65
impact on the probability of customers recommending the store to others, which leads to an
increase in repurchase intentions which in turn fosters store loyalty. More recently, the
findings of a study by Caruana (2002, p. 28) provide a similar view but with a slight
extension, confirming that “service quality is found to act on service loyalty via customer
satisfaction”. In other words, the research of Caruana supports the view that customer
satisfaction performs a mediating role in the link between service quality and service loyalty.
Accordingly, the concepts of service quality, customer satisfaction, and service loyalty are
interrelated other. Indeed, loyal customers who repeat purchase and recommend others to
purchase can positively affect any business.
In a different context, customer retention is about the long-term maintenance of service
relationships between the customer and the service provider. Customer retention through a
company‟s products or services is often seen as one of the key factors that leads to a
company‟s success. The link between service quality and customer retention, whether via a
direct relationship or via customer satisfaction, has been typically formulated by marketing
practitioners and scholars, especially in the area of building relationships between firms and
customers (e.g., Naumann and Giel, 1995; Engel, Blackwell and Miniard, 1993; Woodruff,
1993; Henning-Thurau and Klee, 1997; Kurtz and Clow, 1998). In this regard, “service
quality is indeed an important driver of customer retention” (Ranaweera and Neely, 2003, p.
244). Furthermore, it has been recognised that improved service quality enhances customers‟
willingness to buy again, to buy other services, to buy more, to become less price sensitive,
and to tell others about their positive experience (Anderson, Fornell and Lehmann, 1994;
Bolton, Kannan and Bramlett, 2000; Venetis and Ghauri, 2004; Rust, Zahorik and
Keiningham, 1995). A model proposed by Hennig-Turan and Klee (1997) suggests that the
relationship between satisfaction and customer retention is moderated by service quality. In
turn, both service quality and customer satisfaction are vital in encouraging buyers to
develop an intention to purchase in the future (Palmer, 2008). This was proved earlier by the
most comprehensive study in the field carried out by Zeithaml, Berry and Parasuraman
(1996). The study supports the view that service quality impacts on different intentions, such
as doing more business, the inclination to buy more, and recommending others to buy. The
same view has been expressed in a study by Venetis and Ghauri (2004), who focused on the
contribution of service quality to customer retention. They found that service quality
contributes very strongly to the maintenance of long-term customer relationships. Similarly,
Ranaweera and Neely (2003) conclude in their study that service quality perception is the
strongest driver of customer retention.
It can be noted, therefore, that service quality is strongly linked with customer retention,
which reflects its importance in developing customer willingness to maintain a relationship
with a service provider, which in turn contributes to the success of the business.

66
2.6.3 Enhancing financial performance
Customer service quality and its measurement is an extensively documented field. It is
clearly important to explore the correlation between service quality and financial
performance in literature. It is widely argued that there is a positive relationship between
service quality and profitability via customer loyalty, satisfaction and referrals (Heskett and
Schlesinger, 1994; Zahoric and Rust, 1992; Rust, Zahorik and Keiningham, 1995). Perhaps
the most important study in this area is the widely known „service profit chain‟ of Heskett
and Schlesinger (1994). This study developed a model that links internal service quality to
external service quality, customer satisfaction, employee satisfaction, productivity, customer
loyalty and retention, revenue growth, and profitability. This model was recently adopted in
the study of Duncan and Elliot (2004), who examined the link between service quality,
financial performance, and efficiency. The study supported the positive relationship between
service quality and financial performance, whereas the positive relationship between
efficiency and financial performance, and the positive relationship between service quality
and efficiency were rejected. These results provide empirical evidence of the positive
relationship between service quality and financial performance, a fact which has also been
proved by Parasuraman (2002).
The positive relationship between customer satisfaction/service quality and financial
performance measures has also been reported within accounting literature (Kaplan and
Norton, 1996; Ittner and Larcer, 1998; Norreklit, 2000; Banker, Potter and Srinivasan, 2000).
However, in the banking context, it has been argued that service quality is a factor that
positively influences financial performance, as measured by profitability (Soteriou and
Zenious, 1998; Cuganesan, Bradley and Booth, 1997; Duncan and Elliot, 2004).
In summary, the positive relationship between customer service quality and financial
performance has been supported in literature by academics and scholars in the areas of
services, marketing, and accounting. This proves that service quality value is one of the most
significant factors leading to business success.
2.6.4 Ensuring the success of marketing strategy
Organisations that continually apply high levels of service quality have been shown to be
more successful in their marketing strategies. In this respect, Rao and Kelkar (1997) have
mentioned that success in customer retention, as well as in cross-selling products and
services to customers, can be achieved by applying good levels of service quality. In other
research, it has been shown that service quality strongly impacts on customer satisfaction
(Taylor and Baker, 1994; Fornell, 1992), and that satisfaction, in turn, positively affects the
salesperson‟s relationship orientation (Tam and Wong, 2001). More specifically, Wong,

67
Rexha and Phau (2008) have found that highly perceived service quality within traditional
bank services ensures more successful cross-selling of e-banking products.
The value of branding in developing an effective marketing strategy has been well
documented in business literature (Low and Lamb, 2000; Keller, 2003; Gladden and Funk,
2002). In this regard, Alexandris, Papadopoulos and Kaltsatou (2008) support the link
between service quality and brand associations, as well as the role of service quality in
developing appropriate strategies for building brand names, which helps marketers to
effectively build their brand.
Literature strongly supports the view that service quality can assist in the clear development
of marketing strategies. The link between service quality and marketing strategy has been
emphasized by many researchers, which justifies why service organisation managers use
service quality to achieve a competitive advantage over their competitors.
2.6.5 Enhancing IT capability to improve customer orientation
A study by Zhu and Nakata (2007) argues that customer orientation, driven by service
quality, impacts significantly, albeit indirectly, on business performance. Furthermore, the
study argues that the relationship between customer orientation and business performance
can be positively influenced by IT capability.
The impact of IT capability on customer orientation is the result of enhanced service quality
driven by IT changes. For instance, improved IT capability would likely lead to increased
automation and better connectivity. This would then lead to the facilitation of customer
related activities such as the sharing of customer knowledge within the organisation,
gathering customer information, analysing customer information and behaviour, making
decisions and planning customer initiatives.
2.6.6 Ensuring service interaction is well-developed
As mentioned earlier, there is a clear correlation between service quality, customer
satisfaction, and strong financial performance (Metters and Marucheck, 2007; Heskett and
Schlesinger, 1994; Zahoric and Rust, 1992; Rust, Zahorik and Keiningham, 1995). It is
recognised that customer satisfaction is the result of service quality, which is driven in large
part by customer perceptions and expectations of an organisation‟s service interaction with
its customers. This clearly suggests that service interaction is pivotal in the opinions of
customers about organisations, which in turn leads to the issue of the need for service
interaction to be developed.
In other research, it has been found that service interaction, when it is analysed, can be
defined as a group of activities designed to meet customer needs and requirements through
68
providing some sort of experience. It can also be noted that some of these activities seem
naturally simple, but their impact is vital in generating positive service interaction. Examples
include orchestrating surprises in interactions, engaging customers for a personal experience,
and implementing high variability in interactions (Elmayar, 2007).
2.6.7 Focusing on „easily doing business‟ with customers
It is argued that numerous themes should be employed in the processes of improving service
quality so as to deliver better business performance. More importantly, a vital factor in
achieving excellent service quality is the „ease of doing business‟ between an organisation
and its customers. It has been found in the research of Stading and Altay (2007) that
improved business performance with customers is the result of customers easily being able to
deal with an organisation. This clearly suggests that the ease with which customers deal with
employees in an organisation demonstrates the attributes which need to be enhanced and
extended so as to improve business with customers.
The concept of „ease of doing business‟ was discussed earlier in the research such as
Parasuraman, Zeithaml and Berry (1985, 1988). From a customer‟s perspective, this concept
can be considered as a measure of customers‟ opinions and beliefs about a service, which is a
large part of the overall customer service measure. From an organisation‟s perspective, „ease
of doing business‟ is associated with customer relationship management, as it defines the
management of the overall customer interaction. For instance, in a survey questionnaire,
such as the SERVQUAL instrument developed by Parasuraman, Zeithaml and Berry (1988),
this issue can be measured through a number of statements.
In summary, different themes have been presented in this section which reflects the
importance of service quality. Management service and marketing literature arguably support
the view that service quality is vital in different areas, such as achieving customer
satisfaction, achieving customer loyalty and retention, enhancing financial performance,
ensuring the success of a marketing strategy, ensuring service interaction is well-developed,
focusing on „easily doing business‟ with customers, and enhancing IT capability to improve
customer orientation. This clearly explains why service organisations use service quality to
achieve a competitive advantage.
2.7 Perceived Service Quality Improvement
A critical input of the SERVQUAL instrument (Parasuraman, Zeithaml and Berry, 1988), as
well as modified SERVQUAL instruments (Othman and Owen, 2001; Jabnoun and Al-
Tamimi, 2003; Jabnoun and Khalifa, 2005), is customer perceptions of service quality levels
of an organisation. Once the organisation acts on potential opportunities for improvement, it
can be expected that customer service quality levels will improve. However, translation of

69
this improvement into better levels of service quality as perceived by customers must be
implemented, in order to to satisfy customers. This will be the case if customers‟
expectations are indeed fulfilled and changes are apparent and meet customers‟ desires.
However, if the changes of the organisation are superficial and do not effectively improve
service quality levels, then customers will not have the perception of service quality
improvement and further tests utilising the SERVQUAL or modified SERVQUAL
instruments will show similar or even worse ratings than when first measured.
In a different context, service quality improvement can be seen from both customer and
organisation perspectives. In this respect, it is recognised that “the perceived service quality
improvement can be taken from the viewpoints of both the customer and the organisation”
(Elmayar, 2007, p. 18). Support for this view is found in the earlier work of Ghobadian
(1993), who mentions that the key ingredients of service quality improvements are:
1. Market and customer focus;
2. Motivated and well-trained frontline staff;
3. A well designed process;
4. Development of responsibility and authority to front line staff;
5. A clear definition of quality;
6. Effective external communications; and
7. Service quality measurement.
From reviewing literature regarding this topic (Parasuraman, Zeithaml and Berry, 1985,
1988, 1994; Lee et al., 2004; Berry, Parasuraman and Zeithaml, 1994; Edvardsson, 1998;
Armistead and Clark, 1992; Martin, 1993), it has been found that the following factors are
important for ensuring the perception of service quality improvement comes to fruition:
1. Regular measurement of service quality levels
2. Investment in service quality processes and systems
3. Empowering employees to implement a high level of service quality
2.7.1 Regular measurement of service quality
The SERVQUAL scale developed by Parasuraman, Zeithaml and Berry (1985, 1988) is
frequently used to determine service quality levels. It dominates service quality improvement
because of its superior diagnostic ability (Parasuraman, Zeithaml and Berry, 1994).
Connected to this concept, a study by Lee et al. (2004) reached a similar conclusion with
little extension. It was carried out using the fast-food industry as a case study. The research
proposes that competitive service quality levels be considered to improve service quality
levels measured by the SERVQUAL instrument, with a ratio score scale. Competitive
service quality is analysed by customer assessment, relative to each service attribute. Then a

70
ratio score is calculated to determine which attributes are improved and which attributes
need to be improved. Measuring service quality levels to identify areas of weakness has been
supported by others, such as Beach and Burns (1995) who focused on developing procedures
to help managers identify potential areas requiring change within organisational services.
These procedures include measuring customer satisfaction with services offered and the
perception of services in comparison to competitors‟ offerings. By doing so, services that
require change will be identified. More recently, Perng (2007) has suggested two procedures
for improving service quality in the refurbishment industry. These procedures include a data
base module and a user interface. The SERVQUAL instrument can first be employed to
measure service quality level. Then, the second procedure is applied to assist contractors in
developing optimal strategy and evaluating required resources to identify improvements
needed.
Use of a modified SERVQUAL instrument to measure service quality so as to identify poor
services has also been supported in literature. Othman and Owen (2001), for example,
modified a SERVQUAL instrument to measure service quality in Kuwait Finance House
(KFH). Their findings suggest that managers should be aware of religious factors to improve
ways of providing services and products to customers. Continuing within the same context,
Jabnoun and Al-Tamimi (2003) have also used a modified SERVQUAL instrument to
measure service quality in UAE commercial banks. They point out that banks should focus
more on human skills to increase overall service quality levels. Likewise, Jabnoun and
Khalifa (2005) modified a service quality instrument to measure service quality levels in
conventional and Islamic banks in the UAE. Their findings are similar to those of Othman
and Owen (2001) and Jabnoun and Khalifa (2005), in that they state managers of Islamic
banks should pay more attention to personal skills and the religious validity of their services
in order to improve quality.
2.7.2 Investment in service quality processes and systems
Processes for improving service quality which organisations can carry out may take different
forms. Research by Berry, Parasuraman and Zeithaml (1994) has suggested ten lessons that
need to be learnt in order to improve service quality. They are as follows:
1. Listening to customers precedes action;
2. Good service recovery can overcome poor service delivery;
3. Reliability is essential;
4. Poor service quality is a system design problem, not an employee problem;
5. Customers want basic service;
6. Service excellence includes both outcomes and processes;
7. Customers expect fairness;

71
8. Service takes teamwork;
9. Employee feedback is vital to service improvement; and
10. Leaders should serve employees.
Likewise, Edvardsson (1998) has presented thirteen propositions, which are regarded as his
attempt to develop service with built-in quality. These propositions are as follows:
1. The Managing Director should divide responsibility within the organisation;
2. Quality should be placed as a key goal for leadership and company culture;
3. The organisation should know exact customer needs;
4. Service quality improvement is everybody‟s responsibility within an organisation;
5. Organisations should focus on new service development and service design;
6. Organisations should improve and reengineer the service continuously to prevent mistakes from happening;
7. Organisations should recognise that quality improvement drives productivity
and profitability;
8. Organisations should guarantee the service to make it more distinct;
9. Organisations should compare their services with others, as well as learn from
them;
10. Organisations should manage customers‟ complaints effectively, as this will be a unique chance to correct quality failings;
11. Organisations should increasingly stress employee commitment and customer
involvement in perceived service quality;
12. Organisations should increasingly stress the systematic measuring of service
quality for customers, employees, and owners;
13. Organisations should recognise that the need for service quality improvement is
based on work in the long run.
Other suggestion have been made by Zeithaml and Parasuraman (1990), who mention that
organisations should focus on balancing customers‟ perceptions and expectations to improve
service quality. In the same context, Parasuraman, Zeithaml and Berry (1985) focuss on the
importance of customer expectations in improving service quality and find that organisation
executives across many industries did not know about their customers‟ expectations, which
prevented them from translating customers‟ needs into service design processes that would
properly address those needs. Likewise, Hensel (1990) emphasizes the role of customer-
based service system designs for meeting customer expectations. Similarly, after ten years
the findings of a study by Allred and Addams (2000) were the same in that they indicated
that knowing customer expectations was vital for improving service quality. They also
suggested that organisations should develop a good system for gathering information about

72
customer expectations, keeping in mind that customer expectations change over time, hence
information needs to be frequently updated.
Alternatively, Harvey (1998) has proposed two improvement processes for enhancing
service quality, namely improving design quality and improving conformance quality,
arguing that improving design quality will help service designers and service delivery
processes meet customers‟ requirements, while improving conformance quality is linked to
the processes of guaranteeing results, service recovery, mystery shopping, statistical process,
customer involvement, and demonstrating service standards. In other research, public
relations practice has been recognised as useful for assisting practitioners‟ understanding of
the challenges they face as part of enhancing the quality of service (Heath, Leth and Nathan,
1994).
3.7.3 Empowering employees to implement a high level of service quality
Achieving high quality services or products is a core function of management in any
company. According to Rapert and Wren (1998), it stands alongside the other eight core
functions of management, which are employee satisfaction, customer satisfaction, retaining
employees, financial performance, revenue growth, market share, recruitment and retaining
of employees, organisation image building, and cost-effective service delivery.
More often than not, achieving quality services and products is a key target for organisations.
A high level of quality can be achieved through understanding customer requirements
(Parasuraman, Zeithaml and Berry, 1985, 1988), as well as top management and employee
empowerment (Martin, 1993). In this respect, Armistead and Clark (1992) have proven the
importance of systems, strategies and employees in achieving a high level of quality.
Specifically, they state that involving and empowering employees is vital to improve quality
and to create a motivational environment to get them involved in planning the standards of
service they wish to offer, as well as solving related problems. Similarly, Wille (1992) has
mentioned that employees‟ attitudes and behaviour are the main factors contributing to
quality of service. He goes on to explain that correct employee behaviour should include
listening carefully to customers, giving clear explanations to customers when needed, and
acting promptly, while the correct personality of employees should include a good attitude,
friendliness, kindness, courtesy, responsibility, looking and dressing appropriately, and
having a clean and tidy environment.
Researchers have agreed that employees can contribute to improving service quality.
Parasuraman, Zeithaml and Berry (1988), for example, have recognised the significant role
of employees in achieving a high level of service quality. They designed the SERVQUAL
instrument to measure the actual level of service quality based on five dimensions. Three
dimensions out of these five dimensions are linked to employees‟ commitment, attitude, and

73
behaviour. Jabnoun and Al-Tamimi (2003) define these three service quality dimensions as
follows:
1. Assurance - This dimension refers to employees‟ knowledge, courtesy and ability to
convey trust and confidence.
2. Empathy - This dimension refers to employees‟ ability to provide individual
attention to customers.
3. Responsiveness - This dimension refers to employees‟ willingness to help
customers.
Even though researchers and academics have customised and modified the SERVQUAL
instrument, they have not ignored the role of employees‟ commitment in determining the
service quality level, as many have included related service quality dimensions in their
developed instruments (Othman and Owen, 2001; Jabnoun and Al- Tamimi, 2003; Jabnoun
and Khalifa, 2005).
Empowering employees will lead to improved organisation morale, a reduction in
employees‟ absenteeism, an increase in productivity, and an enhancement of the overall
culture of the organisation. In this regard, Parasuraman and Berry (1991) have developed the
Improved Service Reliability Model shown in Figure 2.16 below. This model illustrates the
potential benefits of improving a reliable service by empowering employees and providing
customer care.

74
Figure 2.16 Improved Service Reliability Model
Source: Parasuraman and Berry (1991, p. 18)
2.8 Conclusion
By reviewing service marketing and operations management literature it has been revealed
that service quality has received a great deal of attention from both academics and
practitioners. Furthermore, it has been proven by literature that having a good quality
service enables a company to satisfy customers, neutralize competition and leads the market.
In this chapter, definitions of service quality have been discussed as well as service quality
perceptions and expectations. In addition, service quality models have been reviewed by
Improved service reliability
Higher retention and more
business from current customers
Increased positive word-of-
mouth
Greater opportunity for
charging premium prices
Improved marketing
effectiveness and higher sales revenues
Reduced cost of redoing
service
Higher employee morale and
enthusiasm
Lower employee turnover
Increased productivity and
lower cost
Higher profit

75
focusing on Gaps Analysis Model structure in order to understand the extent of its benefits.
This chapter also concludes that there are five gaps for service quality. The first gap occurs
between consumer expectations and management perceptions. The second gap exists
between management perceptions of customer expectations and the organisation‟s service
quality specification. The third gap is found between service quality specification and the
actual service delivery. Referring to the fourth gap, it is between the actual service delivery
and the external communications about the service. The fifth gap exists between customer
expectations and his or her perceptions. Furthermore, the reasons for the occurrence of these
five gaps were also discussed. In line with above, the antecedents of service quality gaps
were also comprised.
Furthermore, the service quality importance and improvements have been discussed.
It is clear from what has been discussed that the service quality concept plays a major role in
achieving quality in service organisations, as it considers how customer needs, requirements,
and desires can be met, how customers can be satisfied, and how they should be treated.
Accordingly, a quality service organisation will, on a regular basis, attempt to determine the
requirements of its customers and translate these requirements into service and delivery
process specifications. The next chapter focuses on how service quality is measured, as this
will help to select the effective scale or instrument for the effective service quality
measurement in the Libyan retail banks.
76
Chapter Three
Measuring Service Quality
77
Chapter 3: Measuring Service Quality
3.0 Introduction
In recent years researchers and practitioners have paid significant attention to the subject of
service quality measurement, devoting a great deal of time and effort into the research,
focusing on the development of service quality measures.
This chapter provides the fundamental basis of the study describing how service quality can
be measured, particularly in the banking sector. It aims to discover the most effective tool for
measuring service quality in banks. It will, therefore, explore and seek to understand the
major developments in the measurement of service quality. In addition, the objective of this
chapter will be to review existing literature and explore the various measuring instruments
used in different service sectors. A range of studies will be analyzed in order to establish a
valid and reliable instrument for measuring service quality in the banking sector.
This chapter is arranged in sections that will cover all of these aspects. The first section
sheds light on service quality dimensions. The second section investigates SERVQUAL, the
most widely used instrument for measuring service quality. Research related to its
applicability, value, criticisms, and modifications will also be reviewed. Finally, the
literature regarding the specified instruments and scales used for measuring service quality in
the banking sector will be reviewed. This chapter will therefore lead the researcher towards
an appropriate instrument for measuring levels of service quality in the banking sector in
Libya.
3.1 Service Quality Dimensions
In the last two decades, more work and effort has been devoted to help organisations
understand service quality determinants. Service quality dimensions can be considered as
determinants of service quality levels. In this regard, Parasuraman, Zeithaml and Berry
(1985) pointed out that customers rely on a set of criteria or dimensions to evaluate and
determine the service quality of any business. In addition, based on their focus group studies
with customers and service providers, ten determinants of service quality were originally
identified. These are reliability, competence, responsiveness, tangibles, credibility, access,
security, communication, courtesy and knowing and understanding the customer. In later
research, within the same year, Berry, Zeithaml and Parasuraman (1985, p. 47) pointed out
that “although the relative importance of the categories would vary from one service industry
to the next, we believe the determinants of service quality in most (if not all) consumer
service industries are included in the list”.

78
Subsequently, these ten dimensions were consolidated into five dimensions, (assurance,
responsiveness, tangibles, empathy and reliability) to develop a skeleton of the multi-item
SERVQUAL scale (Parasuraman, Zeithaml and Berry, 1988). Indeed, the consolidation of
the ten dimensions into these five dimensions was supported by the earlier research of Berry,
Zeithaml and Parasuraman (1985). The research concluded that there is a strong correlation
between, on one side, credibility, competence, communication, courtesy and security, and on
the other side, between understanding customers and access; it then defined two broad
dimensions, empathy and assurance, which are the same as the SERVQUAL dimensions.
Jabnoun and Al-Tamimi (2003, p. 559,560) defined these five dimensions as “reliability
refers to the ability to perform the service dependably and accurately. Responsiveness refers
to employees‟ willingness to help customers and provide prompt service. Tangibles refer to
the physical facilities, equipment, and appearance of personnel. Assurance refers to
employees‟ knowledge, courtesy, and ability to convey trust and confidence. Empathy refers
to the level of caring and individual attention given to customers”.
Furthermore, Zeithaml, Parasuraman and Berry (1990) also established that the reliability
dimension was the most important dimension, followed by responsiveness, assurance and
empathy, while tangibles were of the least concern for the service customers.
Other research has found that in the case of evaluating service quality, three dimensions
should be used (Stewart and Walsh, 1992). These are:
1. Core service. This refers to the service designed specifically to meet customers‟
needs.
2. Physical conditions. This refers to the physical conditions of the environment where
the service is provided.
3. Service relationship. This refers to the link between service provider and service
receiver.
A different view was also given by Garvin (1988), who identified eight dimensions for
assessing service quality levels. These are: performance, ventures, reliability, serviceability,
durability, conformance, aesthetics and perceived quality.
While Sasser, cited in Philip (1997) argued that service quality has five different dimensions:
1. Attitude. This refers to the politeness and social manners of the service provider.
2. Availability. This refers to location, training, frequency, and accessibility.
3. Security. This refers to physical safety and confidence.
4. Consistency. This refers to a permanent and consistent level of service quality.
5. Completeness. This refers to the existence of a full range of services and facilities.

79
Unlike the above views, Naser, Jamal and Al-Khatib (1999) have proposed three dimensions
of service quality:
1. Experience quality. This refers to wearability, taste, and satisfaction, these are
determined after the purchase or during the consumption of the service.
2. Search quality. This refers to price, fee, smell, style, colour, and fit, these are defined
prior to the purchase.
3. Credence quality. This refers to dimensions that require a good level of skills.
However, it is noted from Skelcher‟s (1992) work that service quality dimensions have four
elements. Each element has a number of dimensions:
1. The service setting. This includes the appearance of buildings; service outlets must
be physically accessible; equipment must be reliable and easy to handle; employees
and equipment should be of a good standard.
2. Service characteristics. This includes standards of providing services; availability of
services and products to suit customers‟ needs; stability in service performance;
reliability of accurate, dependable, and consistent service; equal provision of service
to all customers; timelines to suit the customers.
3. Customer power. This means customers should have a choice concerning the
standard nature of service; customers should have the chance to influence service
and policy; customers should have the right to complain about faults and obtain
redress; customers should be informed of, and know their rights; and they also have
a voice.
4. Personal relationship. This includes competence and skills; courtesy; individual
responsiveness to customer needs and requirements; knowledge and back-up of
staff; security; credibility; communication with customers to provide feedback; and
politeness.
Various arguments regarding service quality dimensions emerged in the increased research
in the field, though it was noted that some cases were based on the work of Berry, Zeithaml
and Parasuraman (1985) and Parasuramn, Zeithaml and Berry (1985) and (1988). Some of
these common arguments are listed below:
Gronroos (1990) suggested six determinants of perceived good service quality:
attitudes and behaviour; reliability and trustworthiness; reputation and credibility;
flexibility and accessibility; professionalism and skills; recovery.
Albrecht and Zemke (1985) proposed four dimensions: spontaneity; care and
concern; recovery and problem solving.
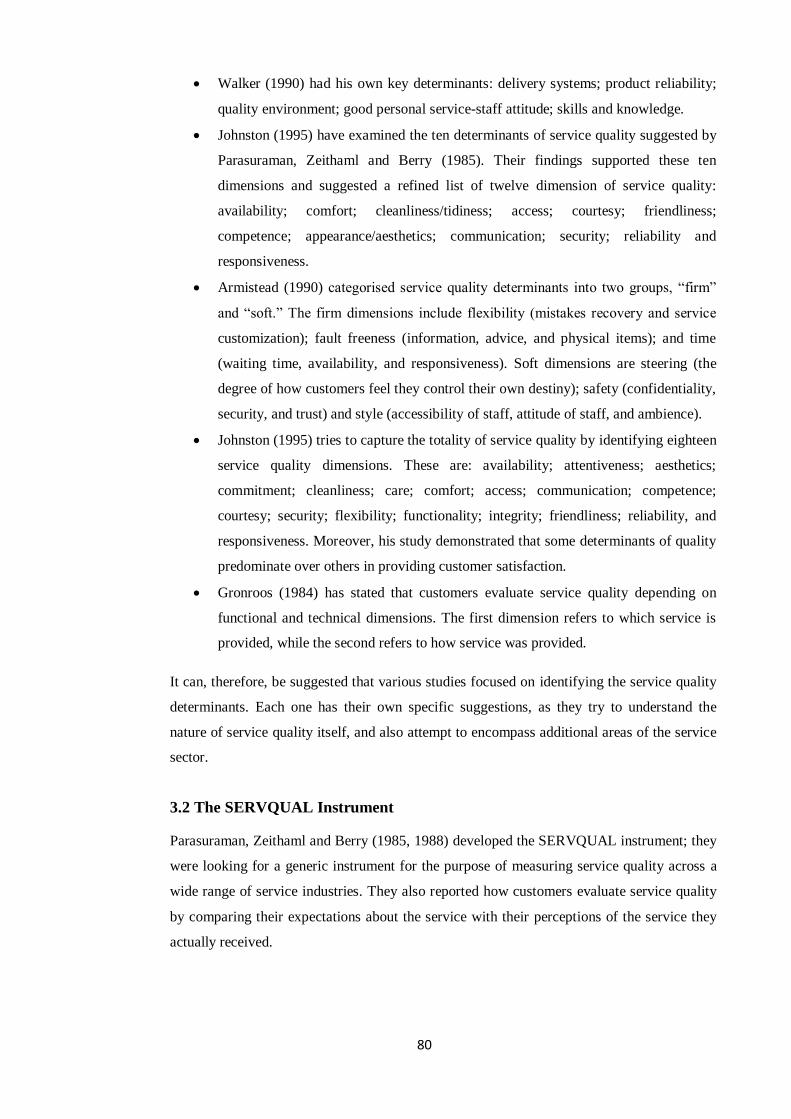
80
Walker (1990) had his own key determinants: delivery systems; product reliability;
quality environment; good personal service-staff attitude; skills and knowledge.
Johnston (1995) have examined the ten determinants of service quality suggested by
Parasuraman, Zeithaml and Berry (1985). Their findings supported these ten
dimensions and suggested a refined list of twelve dimension of service quality:
availability; comfort; cleanliness/tidiness; access; courtesy; friendliness;
competence; appearance/aesthetics; communication; security; reliability and
responsiveness.
Armistead (1990) categorised service quality determinants into two groups, “firm”
and “soft.” The firm dimensions include flexibility (mistakes recovery and service
customization); fault freeness (information, advice, and physical items); and time
(waiting time, availability, and responsiveness). Soft dimensions are steering (the
degree of how customers feel they control their own destiny); safety (confidentiality,
security, and trust) and style (accessibility of staff, attitude of staff, and ambience).
Johnston (1995) tries to capture the totality of service quality by identifying eighteen
service quality dimensions. These are: availability; attentiveness; aesthetics;
commitment; cleanliness; care; comfort; access; communication; competence;
courtesy; security; flexibility; functionality; integrity; friendliness; reliability, and
responsiveness. Moreover, his study demonstrated that some determinants of quality
predominate over others in providing customer satisfaction.
Gronroos (1984) has stated that customers evaluate service quality depending on
functional and technical dimensions. The first dimension refers to which service is
provided, while the second refers to how service was provided.
It can, therefore, be suggested that various studies focused on identifying the service quality
determinants. Each one has their own specific suggestions, as they try to understand the
nature of service quality itself, and also attempt to encompass additional areas of the service
sector.
3.2 The SERVQUAL Instrument
Parasuraman, Zeithaml and Berry (1985, 1988) developed the SERVQUAL instrument; they
were looking for a generic instrument for the purpose of measuring service quality across a
wide range of service industries. They also reported how customers evaluate service quality
by comparing their expectations about the service with their perceptions of the service they
actually received.

81
3.2.1 SERVQUAL instrumentation
The focus of Parasuraman and his colleagues in the period of 1985-1988 was on GAP 5 (the
expected service/perceived service gap). The article, published in 1988, was titled
“SERVQUAL: a multi-item scale for measuring consumer perceptions of service quality.”
This article introduced the famous equation, “Q = P – E, (Q = quality, P = perception, E =
expectation)” (p. 19). Accordingly, SERVQUAL measures customer‟s expectations and
perceptions separately.
3.2.1.1 SERVQUAL expectation measure (E)
This section of the SERVQUAL instrument deals with customers‟ opinions of services, more
precisely, how the customer shows the extent of what they think of the services offered by
the organisation. Each statement should describe the features in the scale and the customer
selects between 1 (strongly disagree) and 7 (strongly agree) for each statement, which
reflects how the customer perceives the services described and how the statements meet their
expectations. In view of this, there are no right or wrong answers (Prarsuraman, Zeithaml
and Berry, 1988).
3.2.1.2 SERVQUAL perception measure
The statements in the perception section deal with customers‟ feelings about the perceived
service. In this section the customer has to show the extent of their satisfaction about the
services provided by an organisation and described by the scale statements. Once again
customers select one of the numbers between 1 (strongly disagree) and 7 (strongly agree).
Again there are no right or wrong answers, customers are just required to choose the number
that best shows his or her perceptions about the perceived service (Parasuraman, Zeithaml
and Berry, 1988).
3.2.1.3 The structure of the SERVQUAL instrument
The structure of the SERVQUAL instrument is based on five service quality dimensions. In
other words, SERVQUAL statements, as a survey questionnaire, represent the translation of
these five service quality dimensions (Parasuraman, Zeithaml and Berry, 1994): tangibles;
responsiveness; reliability; empathy; and assurance (see Figure 3.1 below).
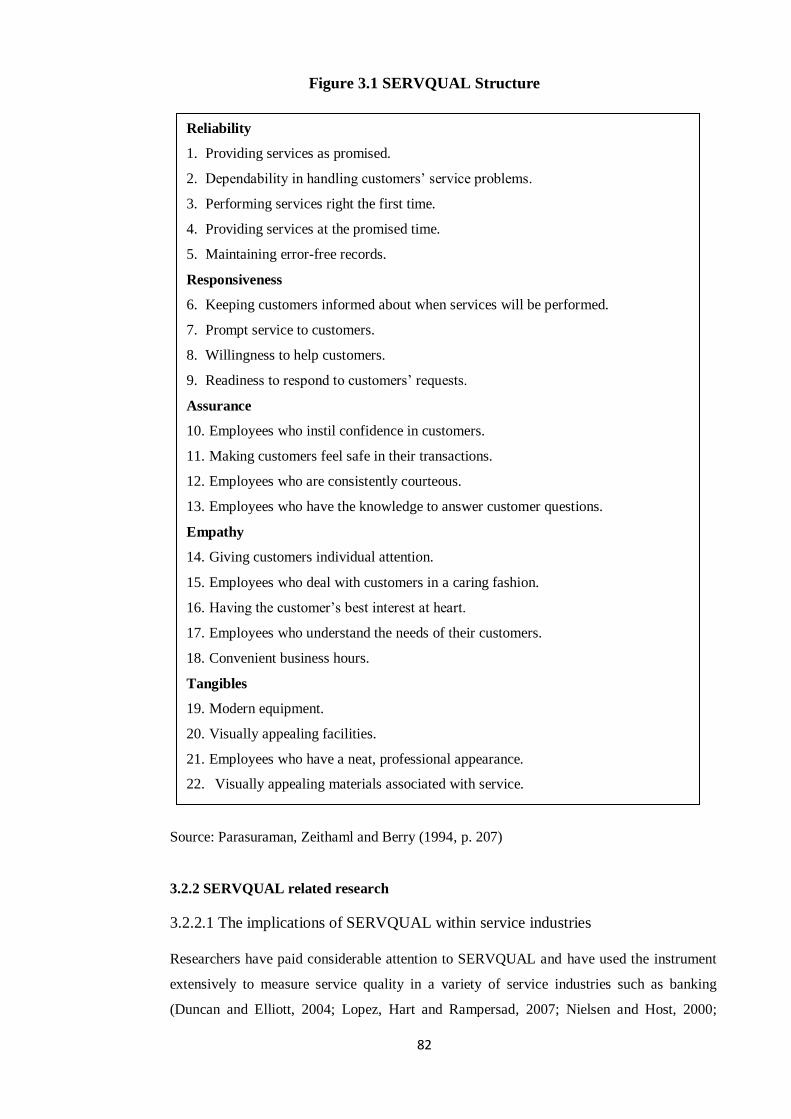
82
Figure 3.1 SERVQUAL Structure
Source: Parasuraman, Zeithaml and Berry (1994, p. 207)
3.2.2 SERVQUAL related research
3.2.2.1 The implications of SERVQUAL within service industries
Researchers have paid considerable attention to SERVQUAL and have used the instrument
extensively to measure service quality in a variety of service industries such as banking
(Duncan and Elliott, 2004; Lopez, Hart and Rampersad, 2007; Nielsen and Host, 2000;
Reliability
1. Providing services as promised.
2. Dependability in handling customers‟ service problems.
3. Performing services right the first time.
4. Providing services at the promised time.
5. Maintaining error-free records.
Responsiveness
6. Keeping customers informed about when services will be performed.
7. Prompt service to customers.
8. Willingness to help customers.
9. Readiness to respond to customers‟ requests.
Assurance
10. Employees who instil confidence in customers.
11. Making customers feel safe in their transactions.
12. Employees who are consistently courteous.
13. Employees who have the knowledge to answer customer questions.
Empathy
14. Giving customers individual attention.
15. Employees who deal with customers in a caring fashion.
16. Having the customer‟s best interest at heart.
17. Employees who understand the needs of their customers.
18. Convenient business hours.
Tangibles
19. Modern equipment.
20. Visually appealing facilities.
21. Employees who have a neat, professional appearance.
22. Visually appealing materials associated with service.

83
Mukherjee and Nath, 2005; Lam, 2002; Jiang, Klein and Crampton, 2002; Arasli,
Katircioglu and Mehtap-Smadi, 2005; Wong, Rexha and Phau, 2008; Arasli, Mehtap-Smadi
and Katircioglu, 2005;Lassar, Manolis and Winsor, 2000; Kangis and Voukelatos, 1997);
higher education (Oldfield and Baron, 2000; Dotchin and Oakland, 1994); health care
(Kilbourne et al., 2004; Lim and Tang, 2000; Babakus and Mangold, 1991; Carman, 1990);
tourism industry (Augustyn and Ho, 1998; Hudson, Hudson Miller, 2004); retail chain
(Parasuraman, Zeithaml and Berry, 1994; Dabholkar, Thorpe and Rentz, 1996); clubs (Lam,
Wong and Yeung, 1997); Library services (Yu et al., 2008; Cook and Thompson, 2001);
restaurant (Bojanic and Rosen, 1994); internet portals (Liu, Du and Tsai, 2008); fast food
(Lee and Ulgado, 1997); information systems (Jiang, Klein and Crampton, 2000); and
telecommunications (Van der Wal, Pampallis and Bond, 2002; Lai et al., 2007).
In line with the above, it can be argued that various researchers have taken SERVQUAL as a
measure of service quality in different service industries. Furthermore, it was noted from the
review that there have been a number of empirical studies that dealt with service quality
measurement in the banking industry using the SERVQUAL instrument. In addition, this
instrument has also been used in different countries; these include: China (Lam, 2002);
Cyprus (Arasli, Katircioglu and Mehtap-Smadi, 2005; Arasli, Mehtap-Smadi and
Katircioglu, 2005); Australia (Baldwin and Sohal, 2003); the United States (Jiang, Klein and
Crampton, 2000; Pitt, Watson and Kavan, 1995; Babakus and Boller, 1992; Kilbourne et
al., 2004); the UK (Kilbourne et al., 2004; Pitt et al., 1995); South Africa (Van der Wal,
Pampallis and Bond, 2002); Korea (Kettinger, Lee and Lee, 1995); and The Netherlands
(Kettinger, Lee and Lee, 1995).
3.2.2.2 The value of the SERVQUAL instrument
SERVQUAL (Parasuraman, Zeithaml and Berry, 1985, 1988) was originally designed to be
a universal scale within and across a broad range of services. Accordingly, it has been widely
used by researchers and practitioners (Francis, 1996). As a measure of service quality, the
literature fully supports the significant role of SERVQUAL; for instance, Rouhani (1997)
utilized the SERVQUAL scale for measuring service quality in marketing consultancy
offices in Singapore and Australia. The SERVQUAL role was vital in identifying the
difference, in the same industry, between these two countries in terms of perceived quality.
The difference is caused by the disparity in economic, social, and cultural aspects of
Singapore and Australia.
Liljander and Standvik (1995) examined the link between perceived service quality and the
intention to re-buy. They used SERVQUAL to measure this link and their findings indicated
that there is a correlation between price and quality. Accordingly, SERVQUAL instrument
in this context can be considered as a fundamental tool in proving this relationship.
84
Shields (1995) used the SERVQUAL instrument to measure service quality in academic
advisory services. This study indicates that it is vital to consider the academic advisory
processes as a step in a long-term relationship with students, which in turn makes it
necessary to train individuals, who are responsible for dispensing academic advice, to
accomplish this task so that levels of service can be executed to the highest standard. This
study also recommended a continuous measurement process in order to make service quality
processes more effective, thus proving the importance of conducting research in the area of
service quality.
Roest and Theo (1995) suggested that customer expectations of service quality could be used
as a reference point or standard for the evaluation of service quality. Taking this into
consideration, the SERVQUAL instrument includes the elements that particularly measure
customer expectations. It is designed based on this aspect and also includes the perceptions
element. Accordingly, the differences between the measured customer expectations and
perceptions will refer to the level of service quality (Parasuraman, Zeithaml and Berry,
1988).
Lim and Tang (2000, p. 297) pointed out that “the use of the SERVQUAL instrument
demonstrated the areas in which hospitals in Singapore are close to meeting patient
expectations and areas in which the hospitals fall far short of expectations. In this way,
Singapore hospitals can improve their level of quality and the effectiveness of SERVQUAL,
TQM can be monitored over time, with resources being shifted to those areas which most
heavily influence patient perceptions of service quality.” This view is supported by the
earlier research of Babakus and Mangold (1991, p. 780). They stated that “one of
SERVQUAL‟s major contributions to the health care industry will be its ability to identify
symptoms and to provide a starting point for the examination of underlying problems that
inhibit the provision of quality services”. Similarly, it was reported that adapting the
SERVQUAL instrument was effective in specific service sectors such as health services
(Dotchin and Oakland, 1994).
With reference to SERVQUAL administration issues, the study by Newman and Cowling
(1996) revealed that there were no difficulties in administrating SERVQUAL through self-
administered questionnaires or via telephone.
Researchers have stated that SERVQUAL can engender notable results concerning customer
satisfaction. For example, Mehta and Durvasula (1998) utilized the SERVQUAL instrument
to measure service quality in the overall business-to-business of the shipping industry in
Singapore. Additionally, customer satisfaction was also measured in the field of shipping
services, where various service quality variables were confirmed as; Moment of Truth,
Service Encounter, and Boundary Spanning.
85
In addition, Yavas, Bilgin and Shemwell (1997) found that satisfaction was determined by a
five-item measure, which related to the five dimensions of SERVQUAL. In this regard,
Augustyn and Ho (1998) concluded that the SERVQUAL model is of the utmost importance
for achieving the real meaning of consumer satisfaction. Recently, Lopez, Hart and
Rampersad, (2007) also confirmed that the service quality dimensions identified by
Parasuraman, Zeithaml and Berry (1985, 1988) are significant and valuable in describing
customer satisfaction in South Florida‟s retail banking.
The same view came from Haller (1995), whose study aimed to classify the antecedents that
contribute to customer satisfaction and dissatisfaction. He used the SERVQUAL instrument
to measure customer satisfaction. His study also examined the uncertainty associated with
perceived service quality and clearly indicated a number of elements influencing this
uncertainty, such as past experience and employees failing to deliver the service.
With regard to the stability and validity of SERVQUAL, Alsayyed (1998) mentioned that
SERVQUAL had both validity and stability when he used it to measure service quality in
hotels. He also added that SERVQUAL can be used as a measurement tool in the future, in
the area of hospitality services.
Likewise, Wong, Rexha and Phau (2008) pointed to the robustness, stability and validity of
the SERVQUAL measure. In this respect, Kenneth (1993) supported the validity of the
SERVQUAL instrument in solving service quality problems and he added that the concepts
of expectations and perceptions are obviously defined.
3.2.2.3 SERVQUAL criticisms
In spite of the popularity of the SERVQUAL scale as a measure of service quality, there
have been theoretical and operational criticisms raisen. Arasli, Mehtap-Smadi and
Katircioglu (2005, p. 45) stated that “although there have been many studies using the
SERVQUAL model as a framework in measuring service quality, there have also been
theoretical and operational criticisms directed towards this model in the service marketing
literature”.
The conceptualization of the “gap score” has been criticised. For instance, it has been
proposed that the concept of “subtraction”, continued in the SERVQUAL instrument, has no
equivalent theories of psychological function (Ekinci and Riley, 1998). The adoption of “gap
score” is suggested to be a poor option to measure the construct of psychology (Van Dyke,
Prybutok and Kappelman, 1999) since there is no established evidence that customers
accurately evaluate the quality of service by using perception-minus-expectation scores
(Ekinci and Riley, 1998; Peter, Churchill and Brown, 1992; Buttle, 1996).
86
In addition, the operational validity of the "gap score" was also questioned and criticised in
that these scores are unlikely to be separated from their component scores (Brown, Churchill
and Peter, 1993).
It has been increasingly emphasised that using perceptions scores, as in SERVPERF, is
likely to be more effective and accurate in identifying the overall assessment of quality of
service (McAlexander, Kaldenberg and Koenig, 1994; Cronin and Taylor, 1992). This debate
has led to further research and examination of the SERVQUAL instrument (Duncan and
Elliott, 2004).
Cronin and Taylor's (1992) view on gap scores measure fits with Teas (1993a, 1993b) where
there is a positive relationship between expectations and performance, however, this will
have a negative effect on the reliability of the SERVQUAL gap measure. Furthermore,
because the statistical variance of expectation and performance scores is different, it is
difficult to conduct subsequent tests of statistical significance (Churchill and Peter, 1993).
Additionally, including customer expectations in the SERVQUAL measure has been
criticised since it leads to multiple interpretations (Teas, 1994). With this view in mind,
researchers defined customer expectations as; customer wants, customer desires, service
organisations should deliver adequate service and ideal standards of service which would
enable multiple interpretations by customers. The expectations of service will also vary from
one customer to another according to what they expect from their service provider.
The dimensional structure of the SERVQUAL instrument has also been criticised. It can be
argued that various studies within the literature, (Babakus and Boller, 1992; Engelland,
Workman and Signh, 2000; Carman, 1990; Headley and Miller, 1993; Parasuraman,
Zeithaml and Berry, 1991), reported that factor-loading patterns indicate a weakness related
to convergent validity. This is because a number of SERVQUAL items had the highest
loadings on different dimensions from those stated by Parasuraman, Zeithaml and Berry,
(1988). Therefore, SERVQUAL is not valid or suitable for measuring service quality within
all service sectors (Babakus and Boller, 1992). Accordingly, it is important to refine
SERVQUAL when it is employed for use in a specific service sector (Guo, Angus and Hair,
2008). In this regard, other researchers who ran confirmatory factor analysis to test a five-
factor model, reported poor validity (Badri, Abdulla and Al-Madani, 2005; Cui, Lewis and
Park, 2003). Various studies have introduced different dimensions for measuring service
quality, including: one dimension (Lam, Wong and Yeung, 1997; Cronin and Taylor, 1992);
two dimensions (Gounaris, 2005; Babakus and Boller, 1992); three dimensions (Najjar and
Bishu, 2006; Arasli, Mehtap-Smadi and Katircioglu, 2005; Cui, Lewis and Park, 2003); four
dimensions (Kilbourne et al., 2004); six dimensions (Headley and Miller, 1993; Carman,
1990); seven dimensions (Walbridge and Delene, 1993); and nine dimensions (Carman,
1990).
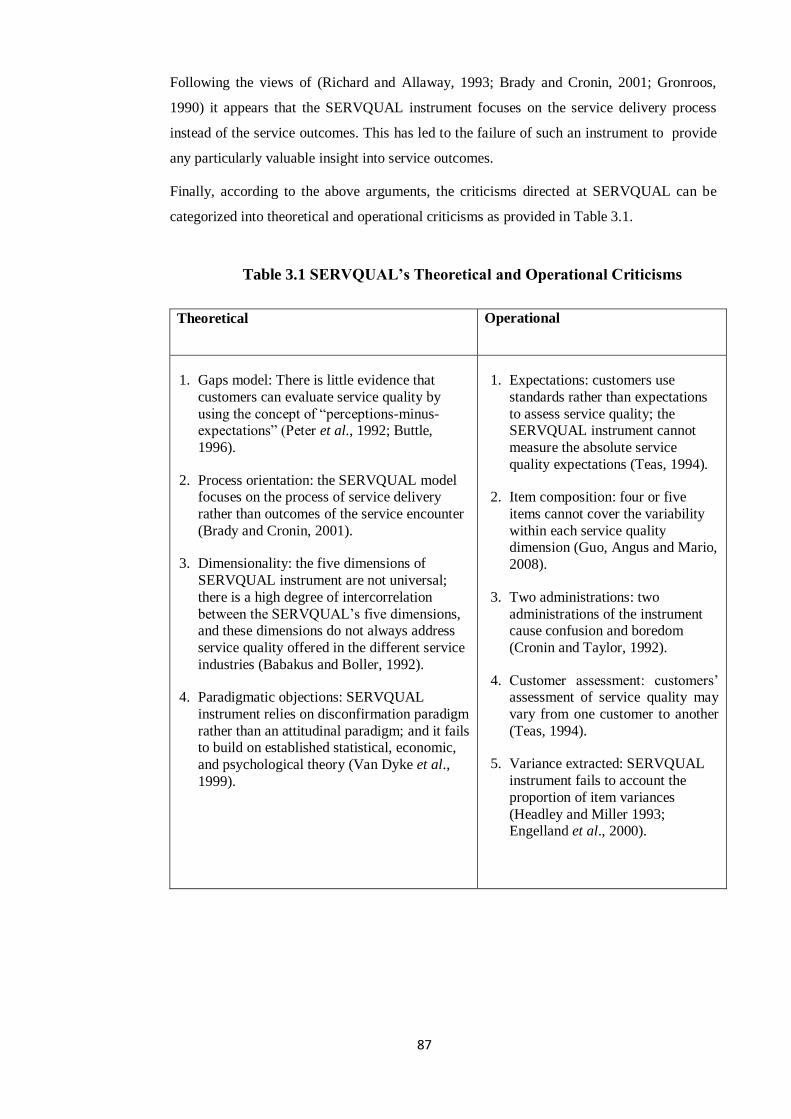
87
Following the views of (Richard and Allaway, 1993; Brady and Cronin, 2001; Gronroos,
1990) it appears that the SERVQUAL instrument focuses on the service delivery process
instead of the service outcomes. This has led to the failure of such an instrument to provide
any particularly valuable insight into service outcomes.
Finally, according to the above arguments, the criticisms directed at SERVQUAL can be
categorized into theoretical and operational criticisms as provided in Table 3.1.
Table 3.1 SERVQUAL‟s Theoretical and Operational Criticisms
Theoretical Operational
1. Gaps model: There is little evidence that
customers can evaluate service quality by
using the concept of “perceptions-minus-expectations” (Peter et al., 1992; Buttle,
1996).
2. Process orientation: the SERVQUAL model focuses on the process of service delivery
rather than outcomes of the service encounter
(Brady and Cronin, 2001).
3. Dimensionality: the five dimensions of
SERVQUAL instrument are not universal;
there is a high degree of intercorrelation
between the SERVQUAL‟s five dimensions, and these dimensions do not always address
service quality offered in the different service
industries (Babakus and Boller, 1992).
4. Paradigmatic objections: SERVQUAL
instrument relies on disconfirmation paradigm
rather than an attitudinal paradigm; and it fails to build on established statistical, economic,
and psychological theory (Van Dyke et al.,
1999).
1. Expectations: customers use
standards rather than expectations
to assess service quality; the SERVQUAL instrument cannot
measure the absolute service
quality expectations (Teas, 1994).
2. Item composition: four or five
items cannot cover the variability
within each service quality dimension (Guo, Angus and Mario,
2008).
3. Two administrations: two
administrations of the instrument cause confusion and boredom
(Cronin and Taylor, 1992).
4. Customer assessment: customers‟ assessment of service quality may
vary from one customer to another
(Teas, 1994).
5. Variance extracted: SERVQUAL
instrument fails to account the
proportion of item variances
(Headley and Miller 1993; Engelland et al., 2000).
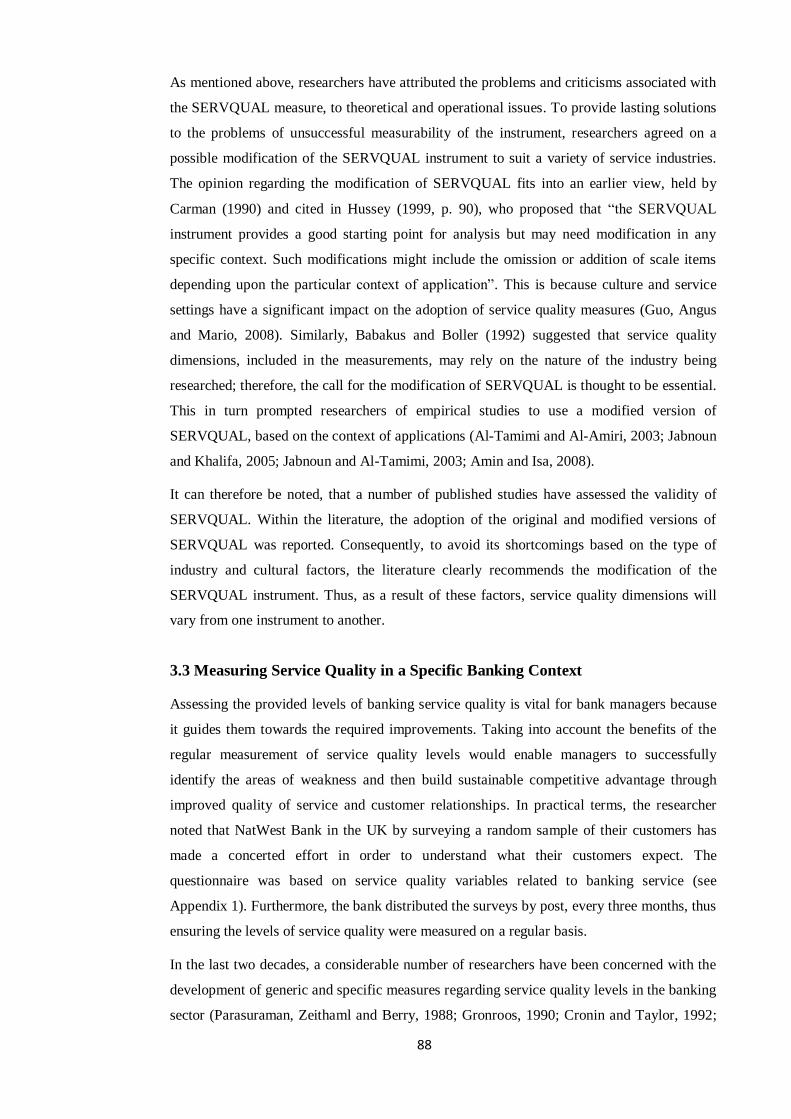
88
As mentioned above, researchers have attributed the problems and criticisms associated with
the SERVQUAL measure, to theoretical and operational issues. To provide lasting solutions
to the problems of unsuccessful measurability of the instrument, researchers agreed on a
possible modification of the SERVQUAL instrument to suit a variety of service industries.
The opinion regarding the modification of SERVQUAL fits into an earlier view, held by
Carman (1990) and cited in Hussey (1999, p. 90), who proposed that “the SERVQUAL
instrument provides a good starting point for analysis but may need modification in any
specific context. Such modifications might include the omission or addition of scale items
depending upon the particular context of application”. This is because culture and service
settings have a significant impact on the adoption of service quality measures (Guo, Angus
and Mario, 2008). Similarly, Babakus and Boller (1992) suggested that service quality
dimensions, included in the measurements, may rely on the nature of the industry being
researched; therefore, the call for the modification of SERVQUAL is thought to be essential.
This in turn prompted researchers of empirical studies to use a modified version of
SERVQUAL, based on the context of applications (Al-Tamimi and Al-Amiri, 2003; Jabnoun
and Khalifa, 2005; Jabnoun and Al-Tamimi, 2003; Amin and Isa, 2008).
It can therefore be noted, that a number of published studies have assessed the validity of
SERVQUAL. Within the literature, the adoption of the original and modified versions of
SERVQUAL was reported. Consequently, to avoid its shortcomings based on the type of
industry and cultural factors, the literature clearly recommends the modification of the
SERVQUAL instrument. Thus, as a result of these factors, service quality dimensions will
vary from one instrument to another.
3.3 Measuring Service Quality in a Specific Banking Context
Assessing the provided levels of banking service quality is vital for bank managers because
it guides them towards the required improvements. Taking into account the benefits of the
regular measurement of service quality levels would enable managers to successfully
identify the areas of weakness and then build sustainable competitive advantage through
improved quality of service and customer relationships. In practical terms, the researcher
noted that NatWest Bank in the UK by surveying a random sample of their customers has
made a concerted effort in order to understand what their customers expect. The
questionnaire was based on service quality variables related to banking service (see
Appendix 1). Furthermore, the bank distributed the surveys by post, every three months, thus
ensuring the levels of service quality were measured on a regular basis.
In the last two decades, a considerable number of researchers have been concerned with the
development of generic and specific measures regarding service quality levels in the banking
sector (Parasuraman, Zeithaml and Berry, 1988; Gronroos, 1990; Cronin and Taylor, 1992;
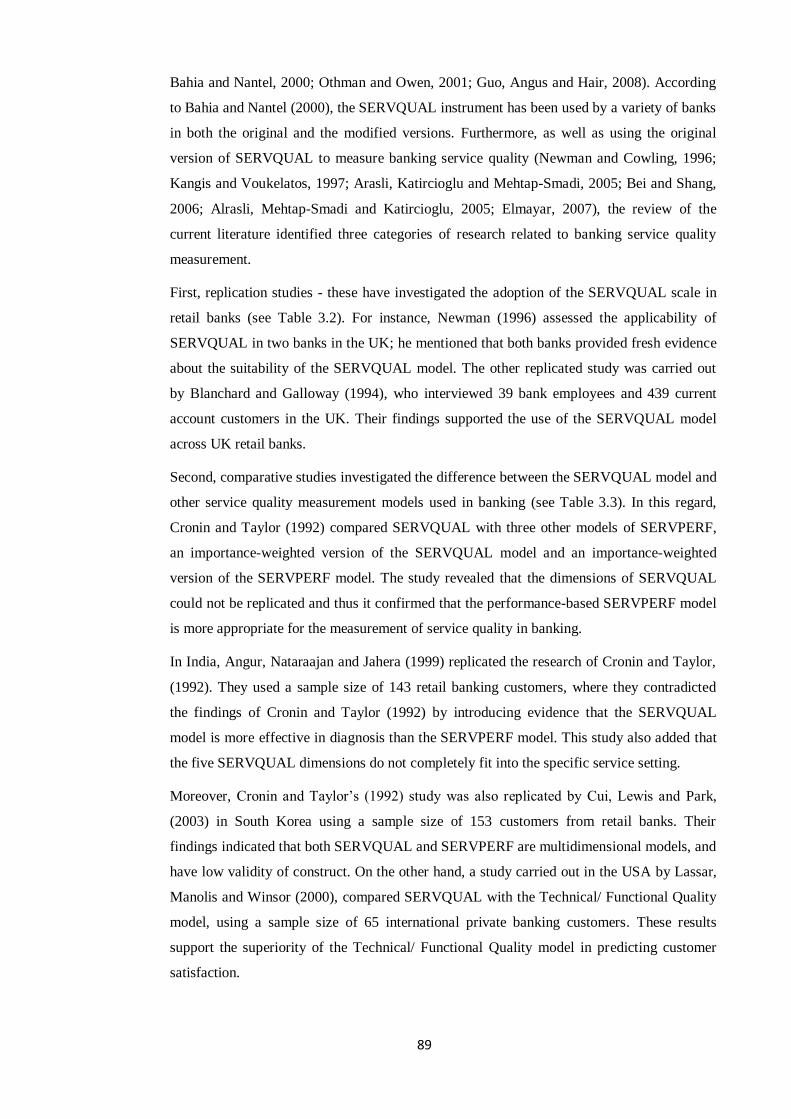
89
Bahia and Nantel, 2000; Othman and Owen, 2001; Guo, Angus and Hair, 2008). According
to Bahia and Nantel (2000), the SERVQUAL instrument has been used by a variety of banks
in both the original and the modified versions. Furthermore, as well as using the original
version of SERVQUAL to measure banking service quality (Newman and Cowling, 1996;
Kangis and Voukelatos, 1997; Arasli, Katircioglu and Mehtap-Smadi, 2005; Bei and Shang,
2006; Alrasli, Mehtap-Smadi and Katircioglu, 2005; Elmayar, 2007), the review of the
current literature identified three categories of research related to banking service quality
measurement.
First, replication studies - these have investigated the adoption of the SERVQUAL scale in
retail banks (see Table 3.2). For instance, Newman (1996) assessed the applicability of
SERVQUAL in two banks in the UK; he mentioned that both banks provided fresh evidence
about the suitability of the SERVQUAL model. The other replicated study was carried out
by Blanchard and Galloway (1994), who interviewed 39 bank employees and 439 current
account customers in the UK. Their findings supported the use of the SERVQUAL model
across UK retail banks.
Second, comparative studies investigated the difference between the SERVQUAL model and
other service quality measurement models used in banking (see Table 3.3). In this regard,
Cronin and Taylor (1992) compared SERVQUAL with three other models of SERVPERF,
an importance-weighted version of the SERVQUAL model and an importance-weighted
version of the SERVPERF model. The study revealed that the dimensions of SERVQUAL
could not be replicated and thus it confirmed that the performance-based SERVPERF model
is more appropriate for the measurement of service quality in banking.
In India, Angur, Nataraajan and Jahera (1999) replicated the research of Cronin and Taylor,
(1992). They used a sample size of 143 retail banking customers, where they contradicted
the findings of Cronin and Taylor (1992) by introducing evidence that the SERVQUAL
model is more effective in diagnosis than the SERVPERF model. This study also added that
the five SERVQUAL dimensions do not completely fit into the specific service setting.
Moreover, Cronin and Taylor‟s (1992) study was also replicated by Cui, Lewis and Park,
(2003) in South Korea using a sample size of 153 customers from retail banks. Their
findings indicated that both SERVQUAL and SERVPERF are multidimensional models, and
have low validity of construct. On the other hand, a study carried out in the USA by Lassar,
Manolis and Winsor (2000), compared SERVQUAL with the Technical/ Functional Quality
model, using a sample size of 65 international private banking customers. These results
support the superiority of the Technical/ Functional Quality model in predicting customer
satisfaction.

90
Third, studies that have created niche models or instruments, whether by modifying the
SERVQUAL model or using alternative service quality dimensions supported by the
literature (see Table 3.4). The modified model of SERVQUAL, introduced by the
researchers, is based on five dimensions completely or partly selected from the original
SERVQUAL dimensions, in addition to the new dimensions. These niche measures seem to
be superior, within the banking setting, to those of the original SERVQUAL model.
For instance, Jabnoun and Khalifa (2005, p. 374) suggest that “the concerns of service
quality may differ from one country to another.” Accordingly, the researchers modified
SERVQUAL to incorporate a scale including thirty items distributed through four
dimensions: (1) personal skills; (2) reliability; (3) values; and (4) image. This modification
was made to fit the service quality of UAE conventional and Islamic banks.
Similarly, Amin and Isa (2008) modified SERVQUAL for the effective measurement of
service quality in Malaysian Islamic banks. They used the five original SERVQUAL
dimensions incorporating one additional dimension, compliance, to measure Malaysian
Islamic banking service quality. These six dimensions were then broken down into 26 items.
In a study regarding Islamic banks in Kuwait, Othman and Owen (2001) focused on the
validity of the SERVQUAL dimensions. They modified it to produce the CARTER scale
which includes 34 items across six dimensions, namely “compliance with Islamic law,
assurance, reliability, tangibles, empathy and responsiveness” (p. 9).
Additionally, Bahia and Nantel (2000) used some of the SERVQUAL dimensions with the
incorporation of additional dimensions emerging from a marketing mix framework,
subsequently developing the Banking Service Quality (BSQ) scale. This scale consists of 31
items across the six dimensions of “effectiveness and assurance, access, price, tangibles,
service portfolio and reliability” (p. 87).
Continuing with the modification of the SERVQUAL scale, Guo, Angus and Hair (2008)
developed an instrument specifically to measure service quality in Chinese corporate banks.
They used SERVQUAL as a starting point for the research leading to the creation of their
new measure, which is Chinese Banking Service Quality (CBSQ). They included 20 items
across four dimensions: (1) reliability; (2) human capital; (3) communication; and (4)
technology.
Furthermore, Jabnoun and Al-Tamimi (2003) also modified SERVQUAL for service quality
measurement in the commercial banks in the UAE. The instrument comprises 30 items
belonging to the five SERVQUAL dimensions. In this study, the results of factor analysis
defined three dimensions, namely, empathy, tangibles, and human skills. In research
conducted by Obaid (2006), the SERVQUAL model was modified to measure service
quality in the UAE banks. The service quality dimensions used in this modified model are

91
tangibles, assurance, reliability, responsiveness, empathy, Islamic banking variables, overall
service quality, avoiding interest-based financing and familiarity with products and services.
In the same context, Karatepe, Yavas and Babakus, (2005) adjusted the SERVQUAL scale
to measure service quality in banks in Cyprus, using 20 items within four dimensions: (1)
service environment; (2) interaction quality; (3) empathy; and (4) reliability.
As mentioned earlier, independent scales or models have been developed to measure service
quality in banks, in other words, these independent measures are not based on the
SERVQUAL model. In this respect, Avkiran (1994) developed BANKSERV based on retail
banking in Australia, and included 17 items distributed within the four dimensions of staff
conduct, credibility, communication and access to teller services.
Additionally, Aldlaigan and Buttle (2002) created a new scale to fit the banking service
sector in the UK. This scale, called SYSTRA-SQ, includes 21 items within four dimensions.
These dimensions are: (1) service system quality; (2) behavioural service quality; (3)
machine service quality; and (4) service transactional accuracy.
Sureshchandar, Rajendran and Anantharaman (2002) produced an alternative scale for
measuring service quality in Indian banks. This scale consists of 41 items across the five
dimensions: core service or service product; human element of service delivery;
systemization of service delivery; tangibles of service and social responsibility.

92
Table: 3.2 Review of Replication Studies of the SERVQUAL Scale
Author Country Sample Findings
500 customers, 1,350 customers and 84000
customers.
The study reported that both banks were able to
provide fresh evidence about the suitability of the
SERVQUAL model in measuring banking service
quality.
Newman (1996) UK
Blanchard and
Galloway (1994)
UK 439 customers and 39 bank employees. The findings supported the application of the
SERVQUAL model within UK retail banks.
However the study also identified SERVQUAL‟s
failure to provide any suggestions towards
service quality improvements.

93
Table 3.3 Review of Comparative Studies between SERVQUAL and Other Models
Author(s) Country Sample Findings
Cronin and Taylor
(1992)
USA 660 customers. The study rejected the replication of SERVQUAL dimensions
and suggested that the SERVPERF model is superior.
Angur, Nataraajan
and Jahera (1992)
India The researchers used a sample size of 143 retail
banking customers.
The study reported that the SERVQUAL model is more effective
than SERVPERF in providing diagnostic information.
Lasser, Manolis
and Winsor (2000)
USA The authors used a sample size of 65
international private banking customers.
The results support the superiority of the Technical/ Functional
Quality model in predicting customer satisfaction.
Cui, Lewis and
Park (2003)
South Korea The sample size used in this study was 153 retail
banking customers.
The results indicated that both SERVQUAL and SEVPERF have
low construct validity.
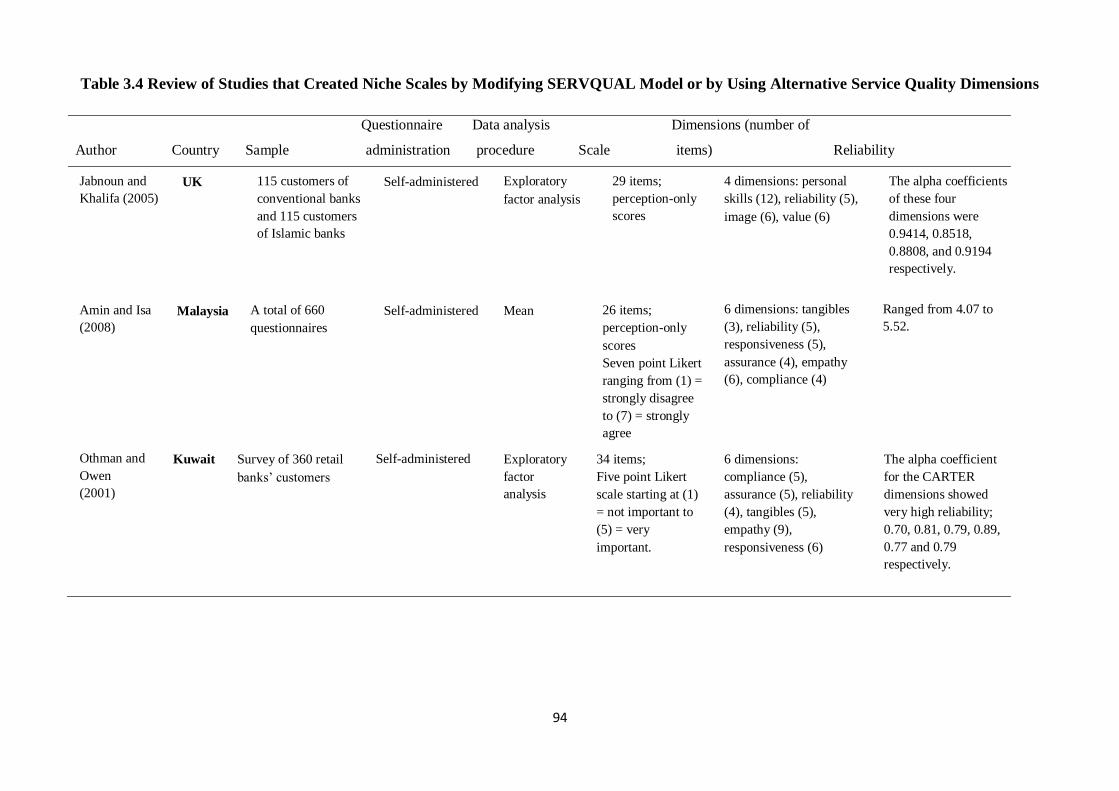
94
Table 3.4 Review of Studies that Created Niche Scales by Modifying SERVQUAL Model or by Using Alternative Service Quality Dimensions
Questionnaire Data analysis Dimensions (number of
Author Country Sample administration procedure Scale items) Reliability
Jabnoun and
Khalifa (2005)
UK 115 customers of
conventional banks
and 115 customers
of Islamic banks
Self-administered Exploratory
factor analysis
29 items;
perception-only
scores
4 dimensions: personal
skills (12), reliability (5),
image (6), value (6)
The alpha coefficients
of these four
dimensions were
0.9414, 0.8518,
0.8808, and 0.9194
respectively.
Amin and Isa
(2008)
Malaysia A total of 660
questionnaires
Self-administered Mean 26 items;
perception-only
scores
Seven point Likert
ranging from (1) =
strongly disagree
to (7) = strongly
agree
6 dimensions: tangibles
(3), reliability (5),
responsiveness (5),
assurance (4), empathy
(6), compliance (4)
Ranged from 4.07 to
5.52.
Othman and
Owen
(2001)
Kuwait Survey of 360 retail
banks‟ customers
Self-administered
The alpha coefficient
for the CARTER
dimensions showed
very high reliability;
0.70, 0.81, 0.79, 0.89,
0.77 and 0.79
respectively.
Exploratory
factor
analysis
34 items;
Five point Likert
scale starting at (1)
= not important to
(5) = very
important.
6 dimensions:
compliance (5),
assurance (5), reliability
(4), tangibles (5),
empathy (9),
responsiveness (6)

95
Questionnaire Data analysis Dimensions (number
Author(s) Country Sample administration procedure Scale of items) Reliability
Bahia and
Nantel (2000)
Canada 115 retail banking
customers
Self-administered Cronbach‟s
alpha
31 items;
perception-only
scores
6 dimensions: effectiveness
and assurance (13), access
(5), price (5), tangibles
(4 ), service portfolio (2),
reliability (2).
The Cronbach‟s alpha
scores were 0.96,
0.93, 0.88, 0.78, 0.90
and 0.87 respectively.
Guo, Duff
and Hair
(2008)
China In –depth interviews
with 18 financial
managers.
259 corporate
customers
Self-administered Exploratory
and
confirmatory
factor analysis
20 items;
including
expectations and
perceptions scores.
Seven-point Likert
response format
starting at (1) =
strongly disagree
to (7) = strongly
agree
4 dimensions: reliability
(3), human capital (7),
communication (6),
technology (4).
The alpha scores were
0.88, 0.93, 0.93 and
0.90 respectively.
The overall reliability
for the CBSQ scale is
0.965.
Jabnoun and
Al-Tamimi
(2003)
UAE 462 customers of
local and foreign
banks
Self-administered
The alpha scores were
0.9256, 0.790, and
0.7656 respectively.
Exploratory
factor
analysis
22 items;
perception-only
scores
3 dimensions: human
skills (12), tangibles (5),
empathy (5).
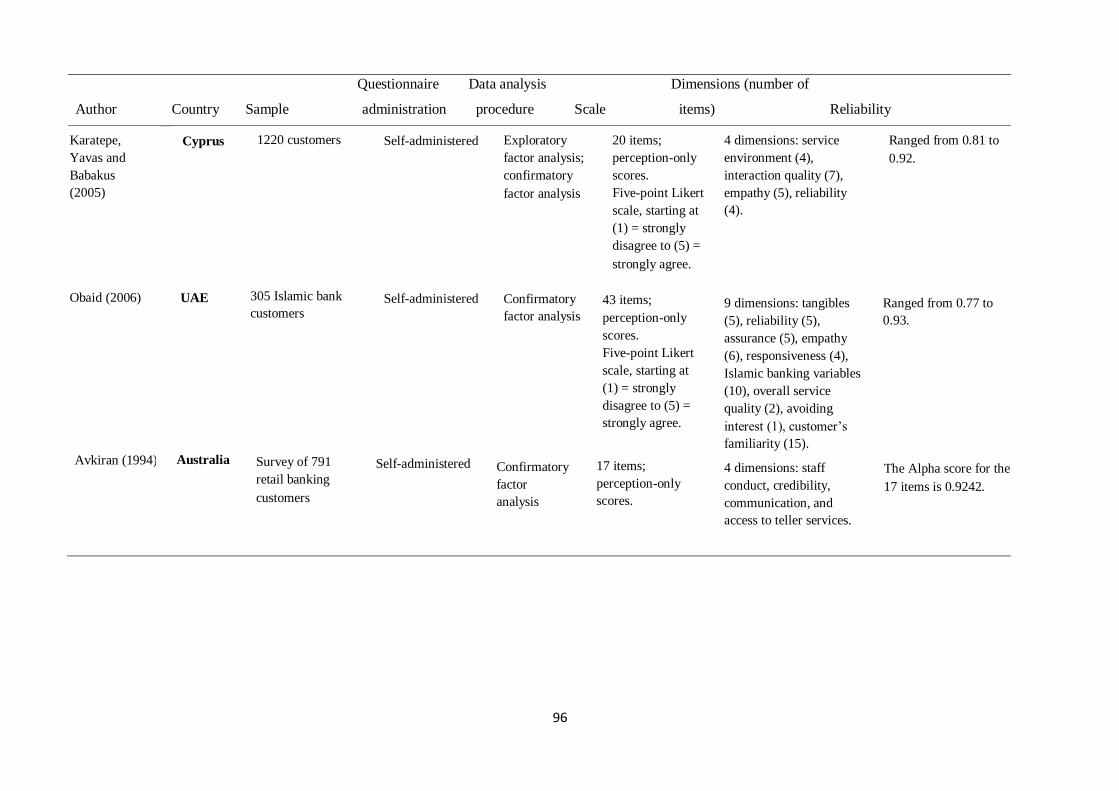
96
Questionnaire Data analysis Dimensions (number of
Author Country Sample administration procedure Scale items) Reliability
Karatepe,
Yavas and
Babakus
(2005)
Cyprus 1220 customers Self-administered Exploratory
factor analysis;
confirmatory
factor analysis
20 items;
perception-only
scores.
Five-point Likert
scale, starting at
(1) = strongly
disagree to (5) =
strongly agree.
4 dimensions: service
environment (4),
interaction quality (7),
empathy (5), reliability
(4).
Ranged from 0.81 to
0.92.
Obaid (2006) UAE 305 Islamic bank
customers Self-administered Confirmatory
factor analysis
43 items;
perception-only
scores.
Five-point Likert
scale, starting at
(1) = strongly
disagree to (5) =
strongly agree.
9 dimensions: tangibles
(5), reliability (5),
assurance (5), empathy
(6), responsiveness (4),
Islamic banking variables
(10), overall service
quality (2), avoiding
interest (1), customer‟s
familiarity (15).
Ranged from 0.77 to
0.93.
Avkiran (1994) Australia Survey of 791
retail banking
customers
Self-administered
The Alpha score for the
17 items is 0.9242.
Confirmatory
factor
analysis
17 items;
perception-only
scores.
4 dimensions: staff
conduct, credibility,
communication, and
access to teller services.

97
Questionnaire Data analysis Dimensions (number of
Author Country Sample administration procedure Scale items) Reliability
Aldlaigan and
Buttle (2002)
UK 975 bank customers Mail survey Exploratory
factor analysis
21 items;
perception-only
scores
Seven point Likert
ranging from (1) =
strongly disagree
to (7) = strongly
agree
4 dimensions: service
system quality (11),
behavioural service
quality (5), machine
service transactional
accuracy (3).
Ranged from 0.80 to
0.93.
Sureshchandar,
Rajendran and
Anantharaman .
(2002)
India Survey of 360
retail banks‟
customers
Self-administered
Ranged from 0.82 to
0.96.
Confirmatory
factor
analysis
41 items;
perception-only
scores
Seven point Likert
ranging from (1) =
very poor to (7) =
very good
5 dimensions: core
service or service product
(5), human element of
service delivery (17),
systemization of service
delivery (6), tangibles of
service (6), social
responsibility (7).

98
It can therefore be argued from reviewing the literature in the area of banking service quality
measurement that SERVQUAL (Parasuraman, Zeithaml and Berry, 1985, 1988), which was
designed as a universal scale applicable within and across a wide range of service settings,
has been used, replicated, and modified within specific banking-service sectors (see Tables
3.2 – 3.4 ). Although the SERVQUAL scale has been utilized to measure service quality in
banking and other service industries, the universality of the SERVQUAL dimensions has
been criticised and questioned (Babakus and Boller, 1992; Carman, 1990).
Furthermore, Babakus and Boller‟s (1992) study identified the fact that SERVQUAL is not
valid for measuring service quality across the entire service sector. In addition, as mentioned
earlier in this chapter, there were a number of criticisms directed at SERVQUAL in terms of
dimensional structure (Cronin and Taylor, 1992), inclusion of the gap scores measure
(Babakus and Boller, 1992), and the universality of the broader five dimensions (Engelland,
Workman and Signh, 2000). The consequence, therefore, is the ineffective measurability of
the SERVQUAL scale within the banking service industry.
3.3.1 Possible measurement solution
To provide a lasting solution to the problem of the unsuccessful measurability of
SERVQUAL, researchers agreed on a possible modification of the SERVQUAL model to
suit the specific service settings (Bahia and Nantel, 2000; Jabnoun and Khalifa, 2005; Amin
and Isa, 2008; Othman and Owen, 2001; Guo, Angus and Hair, 2008; Jabnoun and Al-
Tamimi, 2003; Obaid, 2006; Karatepe, Yavas and Babakus, 2005).
It is assumed therefore, that to measure service quality effectively and successfully in banks,
the measurement instrument or scale should be a “reliable and valid standard scale for the
measurement of perceived quality in banking services” (Bahia and Nantel, 2000, p. 84). In
this respect, the focus of the study of Bahia and Nantel (2000) was to develop a valid and
reliable standard scale for measuring service quality in retail banking. This scale was later
used by Glaveli et al. (2006) to measure the perceived service quality in retail banks in five
Balkan countries. Petridou et al. (2007) also applied the scale when measuring service
quality in retail banks in Greece and Bulgaria. Both studies have confirmed the validity and
reliability of the scale as a measure of service quality in retail banks.
3.3.1.1 Bahia and Nantel‟s Scale (BSQ)
The Banking Service Quality scale was developed to measure the perceived service quality
in retail banking. Bahia and Nantel (2000) used a number of the SERVQUAL dimensions,
such as assurance, tangibles and reliability and incorporated additional dimensions such as
access and courtesy, as suggested by Carman (1990), as well as “additional dimensions in
order to cover all the facets of the marketing mix. Booms and Bitner‟s (1981) framework

99
was used to represent the marketing mix with the seven Ps: (1) product/service; (2) place; (3)
process; (4) participants; (5) physical surroundings; (6) price; and (7) promotion” (Bahia and
Nantel, 2000, p. 85).
After modification, the dimensional structure of the scale was based on six dimensions,
related to specific banking services, broken down into 31 items (see Figure 3.2). The scale is
a seven-point Likert scale starting at (1) = strongly disagree to (7) = strongly agree. The first
dimension is effectiveness and assurance. Effectiveness refers to the delivery of service,
(especially the courtesy and friendliness of the employees), and the ability of staff to inspire
a feeling of security, while assurance refers to the staff‟s ability to exhibit their
communication skills and to deal with customers‟ needs in a confidential manner. The
second dimension is access, which measures the speed of service delivery. The third
dimension, price, assesses the service delivery cost. The fourth dimension is tangibles which
refers to the personal appearance of staff and the existence and cleanliness level of the
bank‟s physical facilities. The fifth dimension is services portfolio which measures the
range, innovation and consistency of services offered by banks. The sixth dimension is
reliability which assesses the ability of bank employees to deliver the promised service
accurately and without error.
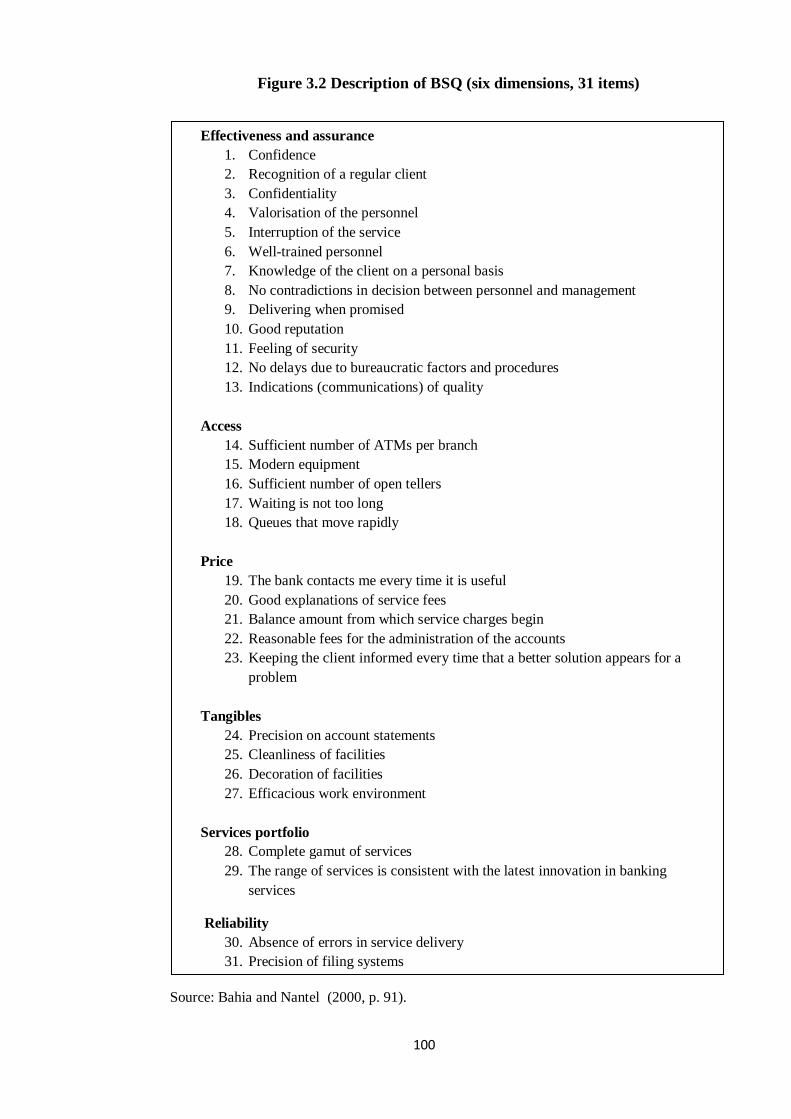
100
Figure 3.2 Description of BSQ (six dimensions, 31 items)
Source: Bahia and Nantel (2000, p. 91).
Effectiveness and assurance
1. Confidence
2. Recognition of a regular client
3. Confidentiality
4. Valorisation of the personnel
5. Interruption of the service
6. Well-trained personnel
7. Knowledge of the client on a personal basis
8. No contradictions in decision between personnel and management
9. Delivering when promised
10. Good reputation
11. Feeling of security
12. No delays due to bureaucratic factors and procedures
13. Indications (communications) of quality
Access
14. Sufficient number of ATMs per branch
15. Modern equipment
16. Sufficient number of open tellers
17. Waiting is not too long
18. Queues that move rapidly
Price
19. The bank contacts me every time it is useful
20. Good explanations of service fees
21. Balance amount from which service charges begin
22. Reasonable fees for the administration of the accounts
23. Keeping the client informed every time that a better solution appears for a
problem
Tangibles
24. Precision on account statements
25. Cleanliness of facilities
26. Decoration of facilities
27. Efficacious work environment
Services portfolio
28. Complete gamut of services
29. The range of services is consistent with the latest innovation in banking
services
Reliability
30. Absence of errors in service delivery
31. Precision of filing systems
101
3.3.1.2 Positive issues related to the BSQ Scale
The nomological, discriminant and convergent validity of the BSQ scale have been tested
(SERVQUAL vs BSQ), and the results revealed reliable validity for the BSQ model in the
three tests. The other positive feature of the BSQ model is that this scale is specifically
designed and developed to deal with perceived service quality within the retail banking
industry (Petridou et al., 2007; Glaveli et al., 2006).
Furthermore, the construct (items and dimensions) of BSQ is deemed to be much more
consistent, as the loadings of BSQ variables ranged from 0.57 to 0.89 (Bahia and Nantel,
2000). In contrast, SERVQUAL was criticized in that “many of its variables‟ loadings since
nine of the 22 variables had loadings below the tolerated threshold of 0.5” (p. 88). Bahia and
Nantel (2000, p. 89) compared BSQ with SERVQUAL and identified another positive point:
“All five dimensions of SERVQUAL are correlated to Dim of BSQ. This could lead to
at least two conclusions. First, this is congruent with the critique of SERVQUAL
concerning the interdependence of all its dimensions. In the case of BSQ this problem
had been avoided as these five dimensions were all included in Dim1 which is
independent from the other dimensions of BSQ. Second, apart from the five
dimensions of SERVQUAL all included in the first dimension of BSQ, there were also
other dimensions completely independent from the dimensions of SERVQUAL (except
for Dim2 which is correlated with the first dimension of SERVQUAL)”.
This in fact confirms that BSQ has the particularities of service quality in the banking sector.
In addition, the six dimensions of the BSQ scale match a wider range of marketing variables
(Guo, Duff and Hair, 2008), than the original SERVQUAL dimensions. It is also interesting
to note that, unlike SERVQUAL, in the BSQ model, expectations and perceptions scores are
not collected in separate sections. This actually solves the problem should the respondent
forget to rate his or her perception score for the item, when he or she arrives at the
expectations section (Lewis and Mitchell, 1990).
In view of the above, it can be argued that the three main problems related to the
SERVQUAL model, namely its dimensionality, its universality, and the use of expectation-
perception disconfirmation approach, are completely avoided when implementing the BSQ
model.
This research study is by nature a comparative study, aiming to compare private banks with
public banks in terms of perceived service quality from a customer perspective. The
literature clearly suggests using a standard scale in this type of research (Petridou et al.,
2007; Glaveli et al., 2006; Kangis and Voukelatos, 1997; Spathis, Petridou and Glaveli,
2004).
102
The existing literature therefore proves to the researcher that the perceived levels of service
quality, in Libyan private and public retail banks, can be effectively measured by using the
modified SERVQUAL model, the BSQ scale, comprising 31 items distributed within six
dimensions.
3.4 Conclusion
The previous discussion has demonstrated that the SERVQUAL model has been used to
measure service quality in a variety of businesses in general and the banking sector in
particular.
It should also be emphasised that many researchers have questioned and criticised the
SERVQUAL model in terms of its dimensionality, its universality, and the use of
expectations-perceptions scores separately. These criticisms led to doubts concerning the
validity and reliability of SERVQUAL as a tool for measuring service quality in banking
sector.
To conclude, in order to overcome the shortcomings of the SERVQUAL model, it is
suggested that a modified model be used, based on the SERVQUAL dimensions, to measure
the levels of service quality in retail banks. This modified model should reflect the unique
characteristics, relating to this type of business, by incorporating additional dimensions into
the original SERVQUAL dimensions, and taking into consideration retail banking themes
such as those used in the BSQ model.
3.4.1 Chapter summary
This chapter reviewed a number of available studies on service quality dimensions with their
significant contributions as to how these dimensions were considered as determinants of
service quality levels.
This chapter has also provided an historical view on the SERVQUAL model as a scale for
measuring service quality in different service sectors in general, and in the banking sector in
particular. The criticisms which were directed at the SERVQUAL model were also
discussed. Finally, this chapter has reviewed the research related to the measurement of
service quality levels in banking in order to create an effective and valid scale or instrument
that would fit the themes of retail banking.
In view of the above, service quality levels can be effectively measured in Libyan private
and public banking sectors by using the BSQ scale which was developed specifically to
measure service quality in retail banks.
The following chapter will discuss in detail the topic of private banking sector versus public
banking sector.

103
Chapter Four
Private Banking Sector versus Public
Banking Sector
104
Chapter 4: Private Banking Sector versus Public Banking Sector
4.0 Introduction
The main objective of this chapter is to review the findings and outcomes of studies on the
topic of private banks versus public banks. It will, therefore, start with an introduction to
retail banks and their structure.
Thereafter, the chapter will provide an overview on the differences between private banks
and public banks.
The main aim of this chapter is to review the existing literature to consider the findings of
the studies on private banks versus public banks, in both Western and Asian contexts, in
order to identify the superiority between the private and public banks in those countries. The
viewpoints and outcomes of these studies will be used as a basis for developing the research
hypotheses.
4.1 Retail Banking
Financial services industry is one of the largest and most important industries in the
developed economies, and within that, banking can be seen as the largest sector.
Furthermore, there are several types of banks including retail banks, corporate banks,
investment banks, credit unions (Shah and Clarke, 2009), and Islamic banks (Amin and Isa,
2008). Shah and Clarke (2009) add that banks exhibit obvious differences in terms of size
and also the range and number of services provided.
4.1.1 History of retail banking
Basic banking services such as saving, borrowing for business or personal use, or deposits
for safe-keeping are as old as human civilisation, while the organised banking services
emerged in Europe in the 15th and 16
th century. During this time banks began opening their
branches in different commercial areas of big cities. In the 19th century, banks started to
merge their branch network, in order to operate in a more integrated manner (Consoli, 2003).
Acquisitions and mergers helped banks to rapidly develop and grow, but because of the
absence of information and communication technologies at that time, their services remained
mostly local. The policy of opening new branches continued to expand business, but the
services offered by the banks were limited to deposits, withdrawals, and basic loan services.
During this period, banks started to standardize their record keeping and accounting practices
which promoted the connection between branches. Furthermore, the arrival of the typewriter
at the end of the 19th century facilitated internal/external communications and other tools
such as telegraph communication. After the Second World War, the inception of computers
105
enabled the banking industry to achieve more organised data, which in turn ensured the data
was more accurate and more easily accessible (Shah and Clarke, 2009).
Consoli (2003) adds that in mid 1960s further technological advances brought about the
development of cash machines, later becoming known as Automated Teller Machines
(ATMs). While in the 1980s the automation of data processing spread rapidly to branches
allowing most internal operations to become fully automated, however, their benefits to
customers remained very limited. At the end of the 1980s and during the early 1990s the use
of computers expanded to all areas of banking which enhanced and improved the
standardization of products and service delivery, concluding that technology then became a
source of competitive advantage (Shah and Clarke, 2009). The use of IT in banks is
fundamental because it drastically reduced the costs (Consoli, 2003). This growth in IT
continues in retail banking to the present day.
4.1.2 Structure of retail banking
According to Shah and Clarke (2009), the traditional banking business model is based on
physical decentralization, with branches distributed around populated areas to provide a wide
range of services. The benefits that can be gained from branch investment are distributing
banking services, encouraging branch usage, and maintaining the contact with customers. In
this regard, Jayawardhena and Foley (2000) stated that having a large network of branches is
one form of competitive advantage because it aids geographic access enabling customers to
reach the bank's services. Shah and Clarke (2009) agree with Jayawardhena and Foley‟s
argument where they mentioned that in the past the main source of retail banking services
distribution was branches, but they add that in the current climate other channels of
distribution have made their way into the retail banks, such as telephone banking and e-
banking, which has led to the number of branches steadily declining. Nowadays, the majority
of banks prefer to deliver their services and products through these multiple channels.
The density of the bank‟s ATM network or the average proximity of ATMs availability for
customers is vital in terms of cash management and convenience. In the UK for instance,
banks, in the last decade, have significantly increased the number of ATMs in their network.
Recently however, because the charging fee for using ATMs has grown, the number of free
ATMs may begin to decline (Donze and Dubec, 2008). Fraering and Minor (2006) have
argued that in retail banks, current accounts still play a fundamental role in terms of the
relationship between banks and their customers. Current accounts provide access to deposit-
holding services, direct debit facilities, and payment services with payment books/cards.
This can be taken as a vehicle for building relationships between customers and their banks.
However, the entire structure of retail banks may change since the internet-only banking
model offers a potential alternative. The rationale behind internet-only banking is the need to

106
reduce the operational costs of traditional branch networks and telephone call centres. This
can be seen as a competitive advantage because lower operational costs could mean offering
higher value to customers (Shah and Clarke, 2009).
4.2 An Overview of the Differences between Private and Public Banking Sectors
According to Davis (1994), the changes which, started in the mid-1980s, (growing financial
awareness by customers, government legislation, economic pressures on traditional markets,
increased competition in the market place), led to the opening up of the market for retail
financial services. The strong competition within the market place suggests that some
financial service organisations may disappear, and as a result, small banks may merge with
their larger counterparts (Birch, 1995).
Taking the above issues into consideration, the marketing strategy of banks will be
dependent on the differentiation of the services provided (Ellwood, 1994). The entry of
private banking into the market place has increased the customers' expectations regarding
customer service (Thampy and Madanmohan, 1999). This also led to banks opening the door
to customers with new options for service (Panigrahy, 2000).
On the other hand, despite the fact that private banks have kindled a competitive spirit within
the public banks themselves, the public banking sector is not yet up to the task, as is the case
with the private banking sector, concerning the quality of services offered with relation to
diversity, the range of service offered, depth, and intensity (Sureshchandar, Rajendran and
Anantharaman, 2003).
Kangis and Kareklis (2001, p. 32) have examined the governance in the banking
environment; they presented a more explicit argument in that “the term public banks denotes
banks under the control of the state and private banks those under the control of private
capital. Public banks are controlled by the state either directly, by holding the majority of
shares or voting rights, or indirectly by controlling some institutional investors among the
larger shareholders.” In an attempt to proffer a solution to the question and controversies
surrounding the relationship between the control and the influence in public and private
banks, Kangis and Kareklis (2001, p. 32) state that “control and influence could be
correlated, but the relationship is not easy to identify; the distinction between public and
private banks is thus a proxy for a notion going beyond the simple technical ownership of the
share capital, to include the structure of influence”.
Kangis and Kareklis (2001) also established that public and private banks behave and deal
differently with their customers and employees; public banks are likely to be under political
control, more bureaucratic, usually more honest and less concerned with the profits. In this
respect, Haskel and Sanchis (1995, p. 314) add that “private firms are only concerned with

107
profits and insist on a high level of effort. By contrast, public sector firms are assumed to
have broader social objectives in mind, including the welfare of union members”.
Among the key findings in Kangis and Kareklis‟s (2001) research was that managers of
Greek private banks were more mobile in their jobs. Furthermore, private banks used more
control mechanisms and displayed a different working climate. They also found that there is
political obligation on the public banking sector to serve less profitable and poorer
customers. Therefore, considering the private sector as profit-seeking organisations has led
to the neglect of public services (Andreassen, 1995). However, “unlike private organisations
pursuing profit goals, the public service organisations received the vast majority of their
funding from government subsidies and merely a small amount from market user fees” (Ti
Bei and Shang, 2006, p. 2).
Many studies support the view that public organisations do not better serve public interest
(Sapienza, 2004; Grossman and Krueger, 1993), and that public organisations are typically
inefficient (Boycko, Schleifer and Vishny, 1995). For instance, La Porta, Lopez-de-Silanes
and Shleifer (2002) pointed out that public sector banks are associated with slower financial
performance and lower growth of productivity. Moreover, it was also found that public
banks tend to be associated with poor marketing strategies and with poorly developed banks
(Barth, Caprio and Levine, 1999), while, Shleifer and Vishney (1997) argued that private
organisations are preferable in terms of incentives and costs.
It can be concluded from the above discussion that public-owned banks, unlike private
banks, are not in the position where profitability, productivity, and performance efficiency is
achieved. This stems from the different objectives of the two ownerships.
4.3 Private versus Public Banks
Comparing private banks with public banks in terms of different business areas, was a point
of debate and discussion within the literature. The research that was undertaken on this
theme can be divided in two categories. The first category includes research work examining
the situation in Western countries, while the second category concerns the research work
undertaken in Asian countries.
4.3.1 Private versus public banks in a specific western context
Within the past two decades, many publications have focused on the issue of the private
banking sector against public banking sector in Western countries, in different areas of
business such as customer perceptions and expectations of service quality, the growth of
branch networks, organisational service orientation, managers‟ practices and behaviour, bank
108
performance, profitability, productivity, and efficiency. The research works focusing on this
subject are highlighted below:
Kangis and Voukelatos (1997) compared private banks with public banks in
Greece in terms of customer expectations and perceptions of service quality.
They collected their data at different times and locations using a wide range of
customers. Their questionnaire contained statements based on the SERVQUAL
model. The study showed that customers of private banks have a similar profile
of expectations of service quality as those in public banks. While customers
perceptions of the services offered were superior in private banks.
Braz (1999) investigated the re-privatisation of some of Portugal‟s banks after they
were nationalised following a military coup in 1974. Based on his own analysis
and published literature, the author argues that private banks reduced staff at a
more rapid rate than the public banks. Moreover, private banks are growing
rapidly in terms of branch networks and the productivity and efficiency has also
significantly increased.
Lynn, Lytle and Samo (2000) measured organisational service orientation in
Slovenian banks, a newly established private bank and a large and older public
bank. In their study they used SERV*OR, a scale developed by Lytle, Hom and
Mokwa (1998) to measure the organisational service orientation using a sample
size of 105 employees from the two banks. The findings of the study showed that
private banks outperformed public banks in both service orientation and financial
performance.
Kangis and Kareklis (2001) carried out their research to compare private banks
with public banks in terms of managers‟ behaviour and practices. The researchers
used a behavioural approach where the target respondents were managers from a
sample of public and private banks in Greece. The results have shown that there
are observable differences between the behaviour and practices in public and
private banks. Whereas the managers in the case of private banks showed greater
alignment of interests, this was not the case with managers in public banks. The
research outcome also supports the view that managers in private banks care
about the values of their institution more than managers in public banks.
Bonin, Hasan and Wachtel (2002) investigated the impact of ownership structure
on bank performance within six economies in a state of transition: Poland;
Romania; Czech Republic; Bulgaria; Croatia; and Hungary. They used a sample
size of 222 observations, as well as ownership and financial data from those six
countries, for the years 1999 and 2000. Their findings have evidently shown that

109
profitability, measured by return on equity and return on assets, is higher with
private banks than public banks, and foreign banks show the highest profitability.
Nakane and Weintraub (2005) looked at the privatization experience of nearly 250
banks in Brazil, in the years between 1990 and 2001. The researchers found that
ownership is a vital determinant of productivity. Therefore, it was not surprising
when they reported that private banks were significantly more productive than
public banks. Their research outcomes also support that privatisation significantly
increased the productivity.
Megginson (2005) has also investigated the economics of bank privatisation by
surveying the empirical literature in this area. He conducted his research in two
stages. In the first stage, he measured the performance of state-owned banks
around the world. In the second stage, he assessed why many governments chose
to privatise their very large public banks. The empirical evidence clearly showed
that the privately-owned banks are more efficient than state-owned banks.
Isik (2007) examined the responsiveness of different ownership forms on the
changing business environment in Turkey. The research was conducted in two
stages. In the first stage, the researcher used Malmquis index theory to estimate
the scale efficiency change indexes, the total factor productivity change,
efficiency change, technological change and the pure efficiency change for the
Turkish banks. The second stage demonstrated how the researcher utilised the
least generalised regression format which tests the significance of productivity
differences between different ownership forms. The study showed that
productivity growth was highest in the foreign banks followed by private banks,
and lowest in the public banks.
It can therefore be argued, from reviewing various studies (Kangis and Voukelatos, 1997;
Braz, 1999; Lynn, Lytle and Samo, 2000; Kangis and Kareklis, 2001; Bonin, Hasan and
Wachtel, 2002; Nakane and Weintraub, 2005; Megginson, 2005; Isik, 2007) that the private
banking sector is superior, when compared with the public banking sector in a number of
western countries (Greece, Portugal, Slovenia, Poland, Brazil, and Turkey), in terms of
customer perceptions of service quality, the growth of branch networks, productivity,
efficiency, organisational service orientation, financial performance, managers‟ behaviour
and practices and profitability.
4.3.2 Private versus public banks in an Asian context
There have been significant efforts by researchers in Asian countries on the topic of private
banks versus public banks. For instance, in Taiwan Bei and Shang (2006) assessed the

110
customer satisfaction of public banks and compared them with their private competitors.
Among the key findings of their research, it was noted that the overall customer satisfaction
of public banks is far less than that of private banks.
Sureshchandar, Rajendran and Anantharaman (2003) focused in their research on
investigating the critical factors of customer perception of service quality in banks in India.
Their study compared three groups of banks (foreign banks, private banks, and public
banks), with respect to the service quality factors from a customer perspective. The study
clearly revealed that technological factors (core service and systematisation of service
delivery), contribute more in differentiating the three groups of banks, while the people-
oriented factor (human element of service delivery), contributes less to the discrimination. It
also showed that foreign banks appear to be performing better than both private and public
banks.
In a broader perspective, Cornett, et al. (2005) have examined the performance differences
between private banks and public banks in sixteen Far Eastern countries between the years of
1989 and 1998. The sixteen countries are: Bangladesh, China, Hong Kong, India, Indonesia,
South-Korea, Macau, Malaysia, Nepal, Pakistan, Philippines, Singapore, Sri Lanka, Taiwan,
Thailand, and Vietnam. The data used in this research was based on year-end financial
statement data, within the specified period, for the sixteen countries. This data was obtained
from the 1997-2000 Bank Scope CDs; this database consists of detailed information based
on annual balance sheets and income statements. The ownership information was obtained
from the “Shareholder Information” section in the Bank Scope database and from additional
sources when needed.
Following the outcomes of the study, it was demonstrated that over the period between 1989
and 1998 public banks generally operated less efficiently and less profitably than private
banks. Furthermore, the bank‟s performance worsens as the extent of public ownership
increases. The study also found that in 1997 and 1998 (during the Asian economic crisis) the
performance of both private and public banks significantly deteriorated. However, the
researchers mentioned that this deterioration in the performance of public banks was notably
greater than that of private banks. Finally, the study showed that greater state ownership of
banks prompted slower economic and financial performance for the countries in question.
A review of available literature on the topic of private banks versus public banks, in Western
and Asian countries, confirms that the areas of comparison between both types of banks are:
1. Customer expectations and perceptions;
2. Customer satisfaction;
3. Financial performance;
4. Profitability;
111
5. Productivity;
6. Efficiency;
7. Business performance;
8. The growth of branch networks;
9. Organisational service orientation; and
10. Managers‟ behaviour and practices.
Therefore, the literature provides the evidence concerning the superiority of the private
banking sector within different areas of business. In reference to the works of Kangis and
Voukelatos (1997), Lewis and Mitchell (1990), Meuter et al. (2000), and Guo, Duff and Hair
(2008), customer perceptions and customer satisfaction were linked to service quality. In
other words, in organisations achieving higher levels of service quality, their customers have
high perceptions and high levels of customer satisfaction. More precisely, as mentioned
earlier in Chapter Two of this research, customer perception was defined by Lewis (1989) as
the consumer‟s judgment on the actual service performance. In addition, Johnston and Clark
(2005) suggested that a match should be found between service quality and the quality or
performance of the service, as perceived by the customer. However, researchers and scholars
tend to link customer perceptions with service levels by arguing that customer perceptions
should be used as a basis, or reference point, for identifying service quality levels
(Surshandar, Rajendran and Anantharaman, 2003; Jabnoun and Al-Tamimi, 2003; Glaveli et
al., 2006). Therefore, using customer perceptions as a basis will ease the task of measuring
service quality (Jabnoun and Al-Tamimi, 2003). This determines that when customers are
satisfied after judging the service they received, their perceptions should be higher.
Earlier arguments made in this research (Chapter Two) also point to the possible fact that
there is strong correlation between service quality and customer satisfaction (Taylor and
Baker, 1994; Cronin and Taylor, 1992; Zeithaml and Bitner, 1996). This is because customer
satisfaction is an antecedent of service quality (Parasuraman, Zeithaml and Berry, 1985,
1988, 1991, 1994; Bitner, 1990; Carman, 1990). Hence, improved service quality will
positively impact customer satisfaction (Anderson, Fornell and Lehmann, 1994; Bitner,
Booms and Mohr, 1994). This argument agrees with the view of Razak, Chong and Lin
(2007) that service quality measurement leads to an improvement in service quality, thus
enhancing customer satisfaction.
Conversely, the relationship between service quality and financial performance, also
discussed in Chapter Two of this research, demonstrated that there is a positive relationship
between service quality and financial performance (Kaplan and Norton, 1996; Norreklit,
2000; Banker, Potter and Srinivasan, 2000; Ittner and Larcer, 1998). Furthermore, within the
banking sector it was proposed that service quality has a positive influence on the financial
112
performance, measured by profitability (Soterion and Zenious, 1998; Cugaresan, Bradley
and Booth, 1997; Doncan and Elliot, 2002).
As previously mentioned that Leonard and Sasser (1982) stated that there is a positive
relationship between quality and productivity. They pointed out that in their experience high
quality consistently results in heightened productivity.
The integration of the above views will therefore lead to the emergence of the fact that
customer satisfaction, financial performance, profitability, and productivity are strongly
correlated with service quality.
According to the above viewpoints and outcomes originating from theoretical and empirical
studies, this research proposes that there are significant differences between the private
banking sector and public banking sector in Libya in terms of perceived service quality.
4.4 Connecting the Literature Gap to the Research Question
Based on the literature studies regarding the service quality concept, measuring service
quality, and the issue of private banking sector versus public banking sector, a summary can
be drawn that the literature review in this research starts by examining various definitions
and meanings attributed to the concept of service quality, the importance of service quality,
and how service quality can be improved. It also explored the measurement of banking
service quality, and the outcomes seem to suggest that service quality levels in Libyan
private and public banks can be measured by using the BSQ scale, developed by Bahia and
Nantel (2000), which was specifically designed to measure service quality in retail banks.
The rationale behind this research, focusing on the literature studies, is to enable the
researcher to undertake quantitative research, aimed not only at examining the meaning of
service quality and how service quality can be measured, but also to assist in exploring
answers to the research question:
Are there significant differences between the Libyan private and public banking
sectors related to service quality perceptions?
To address this research question, the researcher will explore issues set out within the main
research aim (to identify if there are significant differences between the Libyan private and
public banking sectors in terms of customer perceptions of service quality) and research
objectives which are:
1. To explore the literature on the concept of service quality.
2. To examine various approaches in measuring service quality focusing on banking
service quality measurement.

113
3. To identify the actual levels of service quality provided to banks‟ customers in
Libyan private and public banking sectors.
4. To identify the differences between the Libyan private and public banks‟
customers in terms of the degree of importance attached to various dimensions of
service quality.
5. To identify if the customer demographic characteristics are related to their banking
sector (bank status).
6. To draw conclusions and recommendations that help Libyan banks in dealing with
service quality issues.
It can be seen that the research question and objectives provide the need for exploring further
studies on the issues associated with private banks versus public banks, considering the areas
of comparison between both types of banks. Examining the available research in this matter,
with reference to the superiority of private banks, produced theoretical and empirical
evidence suggesting that private banks outperform public banks, in Western and Asian
countries, in different areas of business. The questions arising from this argument are: Does
this situation exist in developing countries such as Libya? And, Are there significant
differences between the Libyan private and public banking sectors in terms of service quality
perceptions? Addressing these questions will fill the gap in the literature identified in this
area, since there is no existing research relating to banking service quality in Libya.
Furthermore, the development of the service economy and the many changes regarding the
environment surrounding service industries has created the need for continuing the focus on
service quality (Loizides, 2005).
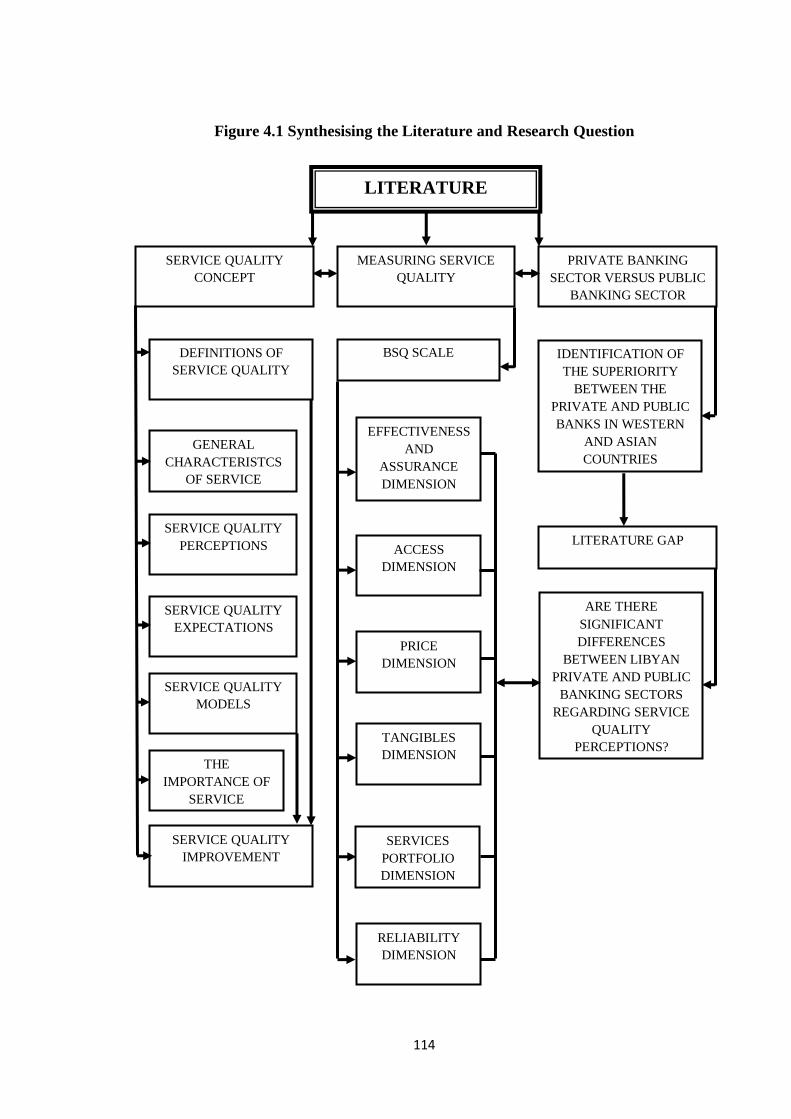
114
Figure 4.1 Synthesising the Literature and Research Question
LITERATURE
REVIEW
SERVICE QUALITY
CONCEPT
MEASURING SERVICE
QUALITY
PRIVATE BANKING
SECTOR VERSUS PUBLIC
BANKING SECTOR
DEFINITIONS OF
SERVICE QUALITY
SERVICE QUALITY
PERCEPTIONS
SERVICE QUALITY
EXPECTATIONS
SERVICE QUALITY
MODELS
THE
IMPORTANCE OF
SERVICE
QUALITY
SERVICE QUALITY
IMPROVEMENT
BSQ SCALE
b
IDENTIFICATION OF
THE SUPERIORITY
BETWEEN THE
PRIVATE AND PUBLIC
BANKS IN WESTERN
AND ASIAN
COUNTRIES
LITERATURE GAP
ARE THERE
SIGNIFICANT
DIFFERENCES
BETWEEN LIBYAN
PRIVATE AND PUBLIC
BANKING SECTORS
REGARDING SERVICE
QUALITY
PERCEPTIONS?
EFFECTIVENESS
AND
ASSURANCE
DIMENSION
ACCESS
DIMENSION
PRICE
DIMENSION
TANGIBLES
DIMENSION
SERVICES
PORTFOLIO
DIMENSION
RELIABILITY
DIMENSION
GENERAL
CHARACTERISTCS
OF SERVICE
115
Figure 4.1 provides the link, or connection, between the outcomes from the literature review
and the research question. It is expected therefore, when this literature is pursued, it will lead
to an appropriate understanding of the concept of service quality, a suitable scale for the
effective measurement of banking service quality in Libyan private and public banks and the
development of the research hypotheses.
Based on the above viewpoints, and the outcomes originating from the studies on the topic of
private banks versus public banks in Western and Asian countries, the following hypotheses
are formulated:
Hypothesis 1: There is significant difference between the Libyan private and public banking
sectors in terms of service quality with respect to the effectiveness and assurance dimension.
Hypothesis 2: There is significant difference between the Libyan private and public banking
sectors in terms of service quality with respect to the access dimension.
Hypothesis 3: There is significant difference between the Libyan private and public banking
sectors in terms of service quality with respect to the price dimension.
Hypothesis 4: There is significant difference between the Libyan private and public banking
sectors in terms of service quality with respect to the tangibles dimension.
Hypothesis 5: There is significant difference between the Libyan private and public banking
sectors in terms of service quality with respect to the services portfolio dimension.
Hypothesis 6: There is significant difference between the Libyan private and public banking
sectors in terms of service quality with respect to the reliability dimension.
Hypothesis 7: There is significant difference between the Libyan private and public banking
sectors with respect to all service quality dimensions together.
The hypothetical assumptions will inform the basis of this research study, since this research
will measure service quality levels in Libyan private and public banking sectors using the
BSQ scale to identify any significant differences between the two banking sectors in terms of
service quality perceptions.
4.5 Summary of the Key Findings from the Review of the Literature
The concept of service quality, service quality measurement and the differences between the
private banking sector and the public banking sector have been critically examined in
Chapters Two, Three and Four of this research. The conclusions arising from this review are
summarised below:
1. Within the literature there are various definitions of service quality aimed at contributing
to the meaning of service quality.
116
2. By gathering the most commonly used definitions in the literature from the last four
decades, it is possible to emphasize that service quality means meeting customer
satisfaction, meeting customer expectations and meeting service specifications (Johnston
and Clark, 2005; Parasuraman, Zeithaml and Berry, 1988). It was also found that there is
an overlap between the three definitions that cannot be separated since they are
dependent on each other, for example, by meeting service specifications, the customer
expectations and satisfaction will be met. These three definitions are more acceptable to
this research. More importantly, this research adopted the BSQ scale, using 31
statements to measure service quality in the Libyan commercial banks based on
customers‟ assessment of how they are satisfied with services. In this research, the extent
of satisfaction of Libyan banks‟ customers is meant service quality, which fits with the
argument that service quality means meeting customer satisfaction.
3. The review of various service quality models revealed that the models, in addition to
their evident role in conceptualising service quality, also provided key elements to
service quality measurements and improvements. In other words, the models suggested a
number of facets which can lead to an improvement in service quality levels such as a
clear understanding of service quality and the factors influencing it, the measurement of
service quality and feedback, clear market, customer focus, customer care, an effective
processes and system and motivated staff.
4. The theoretical framework of service quality can be described through two schools of
thought. These are the North American School (Gap Analysis Model) and the Nordic
School. The North American School is the most widely reported theoretical framework
in the literature proposed by Parasuraman, Zeithaml and Berry (1985). The model
identified a set of gaps existing between customer perceptions and the tasks associated
with service delivered. These gaps are measured by the difference between the two
scores - performance-minus–expectation (P-E). While the Nordic School, proposed by
Gronroos (1984), suggests that service quality is conceptualised as the result of
comparisons between perceived and expected service, with perceived service quality
being influenced by technical and functional dimensions.
5. To help conceptualise service quality, service quality models were classified into three
types: multidimensional reflective models (hierarchal model); multidimensional
formative models (SERVQUAL); and multidimensional formative-reflective models
(Brady and Cronin‟s hierarchical model). This research adopted a multidimensional
formative model, (BSQ, originally based on SERVQUAL), as the most appropriate scale
for measuring service quality in Libyan banks.
6. The review of the literature also found that the SERVQUAL instrument had been
replicated and modified specifically for the banking-service sector (Newman, 1996;
Jabnoun and Khalifa, 2005; Bahia and Nantel, 2000). It was also found from the review
117
that despite the widespread usage of the SERVQUAL instrument, it was questioned in
terms of theoretical and operational criticisms which led researchers to agree on possible
modifications of SERVQUAL based on the type of service industry under review (Bahia
and Nantel, 2000; Guo, Angus and Mrio, 2008; Jabnoun and Al-Tamimi, 2003). The
researcher selected the BSQ scale, which is a modified version of the original
SERVQUAL scale and specifically suits research conducted within the banking sector. It
includes three dimensions from the SERVQUAL scale (assurance, tangibles and
reliability) and three additional dimensions related to banking (access, price and service
portfolio). This scale will be further tested (pilot study) in terms of validity and
suitability for the effective measurement in Libyan banks.
7. The review of literature in Chapter Four found that private banks in Western and Asian
countries outperform public banks in terms of customer perceptions of service quality,
financial performance, productivity, efficiency, the growth of branch network business
performance, organisational service orientation and managers‟ behaviour and practices.
This research utilised this evidence as a base for developing the research hypotheses.
4.6 Chapter Summary
This chapter has given an historical view on retail banking; the structure of retail banking
was also discussed followed by an overview of the differences between the private and
public banks including their concerns and how they are controlled. By reviewing the
literature on the issue of private banks versus public banks, this chapter accepted that private
banks outperform public banks in a number of Western and Asian countries in terms of
different business areas. The chapter connected the literature with the research question, and
continued with an explanation of how the research hypotheses were developed. Finally, this
chapter outlined the findings from the literature review, and guided the researcher in the
development of the subsequent chapter on research methodology and methods.

118
Chapter Five
Research Methodology and Methods
119
Chapter 5: Research Methodology and Methods
5.0 Introduction
The nature and the type of research are very important factors in influencing the research
design and also the selection the appropriate research philosophy (Saunders, Lewis and
Thornhill, 2009).
The chapter starts with a presentation of the research study‟s question, objectives and
hypotheses. Moreover, research epistemology and theoretical perspective, strategies and
methods surrounding this research are explored. This includes a discussion of the nature and
importance of research methods follows, and the chosen quantitative research methods
available for data collection. Furthermore, the procedure employed to conduct the customers‟
survey is presented.
The research instrument chosen to measure perceived service quality in Libyan private and
public banks is presented. The next section describes the method used for the scale pilot-
testing, as well as the feedback which came from this pilot study.
A discussion follows on probability and non-probability sampling methods. This also
includes the methods of sample size and population selection and the methods of data
analysis. Finally, there is a discussion of ethical issues.
5.1 Chapter Objective
The purpose of this chapter is to discuss the research methods and methodology available to
the researcher in order to answer the research question and address the research aim and
objectives.
5.2 Research Question
The aim of this study centres on identifying if there are significant differences between the
two banking sectors (private and public sectors) in terms of customer perceptions of service
quality. Another aspect of this aim is to provide a clear picture of the actual levels of service
quality of the Libyan private banking sector and public banking sector. It is possible to
express the aim of the study in the following research question:
Are there significant differences in customer perceptions of service quality within the
Libyan private and public banking sectors?
Providing valid and consistent answer to this research question requires the use of an
effective scale with which to measure perceived service quality in the Libyan private and
public banking sectors. Therefore the literature was reviewed to identify an effective

120
instrument for that particular purpose. This will help to answer the research question and to
meet the research objectives.
5.3 Research Objectives
The main aim of this study is to identify if there are significant differences between the
Libyan private and public banking sectors in terms of the perceived service quality levels.
This research also intends to address the following objectives:
1. To explore literature on the concept of service quality.
2. To examine various approaches in measuring service quality with a focus on
banking service quality measurement.
3. To identify the actual levels of service quality provided to banks‟ customers in
Libyan private and public banking sectors.
4. To identify the differences between the Libyan private and public banks‟
customers in terms of the degree of importance attached to various dimensions of
service quality.
5. To identify if the customer demographic characteristics are related to their banking
sector (bank status).
6. To draw conclusions and recommendations that help Libyan banks in dealing with
service quality issues.
5.4 The Research Hypotheses
The hypothetical assumptions will inform the basis of the current study, as this study will
measure service quality levels in Libyan private and public banking sectors using BSQ scale.
The BSQ scale originating from the earlier discussions in this research includes service
quality dimensions of effectiveness and assurance, access, price, tangibles, services portfolio,
and reliability found to be relevant in assessing and measuring service quality in retail
banking as studied and identified within Chapter Three of this research in the work of Bahia
and Nantel (2000). Therefore using these service quality dimensions in determining and
assessing the actual levels of service quality in Libyan private and public banking sectors has
allowed the researcher to develop and generate the research hypotheses based on BSQ
dimensions as these six dimensions in total will touch and cover every service offered by the
Libyan banks. Furthermore, addressing every dimension is vital in the case of banking. In
this regard, the findings of the study of Kangis and Vouklatos (1997) indicated that banks
should be looking carefully at each one of the services quality dimensions where customers
perceive receiving different services. Moreover, looking at each one of the dimensions of
service quality is more fundamental approach need to be considered (Parasuraman, Zeithaml
and Berry, 1994; Hammer and Champy, 1994; Morris and Brandon, 1993).
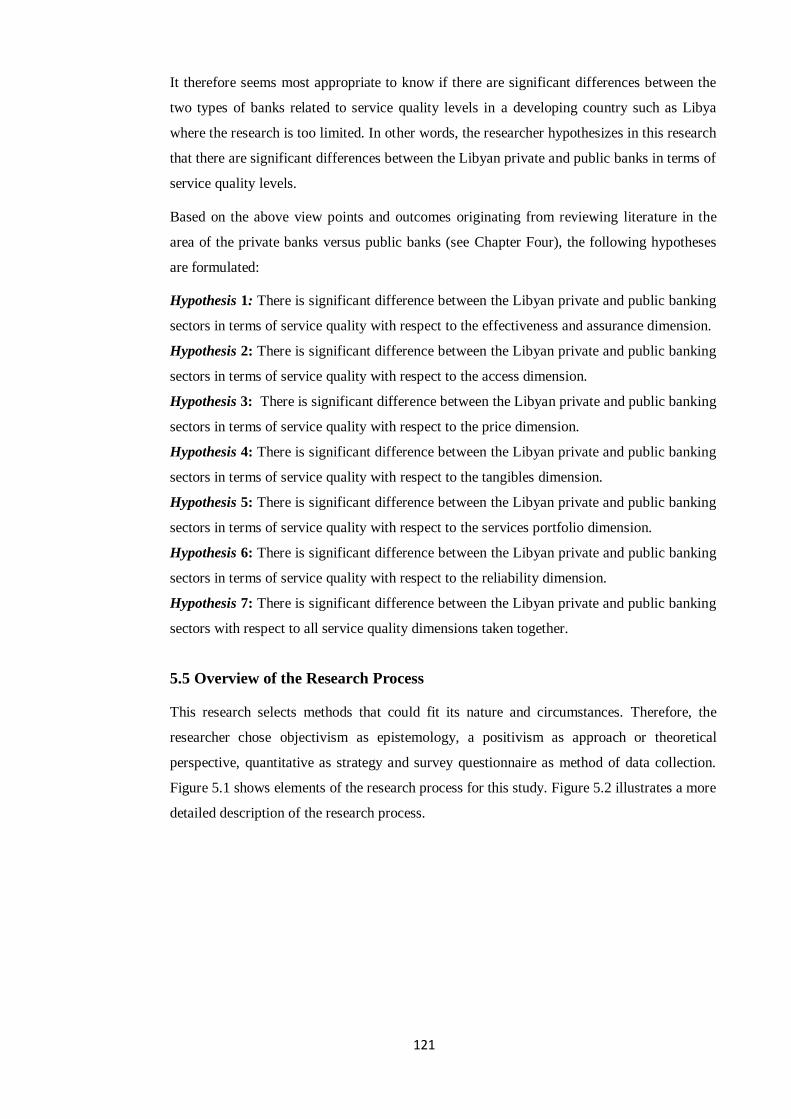
121
It therefore seems most appropriate to know if there are significant differences between the
two types of banks related to service quality levels in a developing country such as Libya
where the research is too limited. In other words, the researcher hypothesizes in this research
that there are significant differences between the Libyan private and public banks in terms of
service quality levels.
Based on the above view points and outcomes originating from reviewing literature in the
area of the private banks versus public banks (see Chapter Four), the following hypotheses
are formulated:
Hypothesis 1: There is significant difference between the Libyan private and public banking
sectors in terms of service quality with respect to the effectiveness and assurance dimension.
Hypothesis 2: There is significant difference between the Libyan private and public banking
sectors in terms of service quality with respect to the access dimension.
Hypothesis 3: There is significant difference between the Libyan private and public banking
sectors in terms of service quality with respect to the price dimension.
Hypothesis 4: There is significant difference between the Libyan private and public banking
sectors in terms of service quality with respect to the tangibles dimension.
Hypothesis 5: There is significant difference between the Libyan private and public banking
sectors in terms of service quality with respect to the services portfolio dimension.
Hypothesis 6: There is significant difference between the Libyan private and public banking
sectors in terms of service quality with respect to the reliability dimension.
Hypothesis 7: There is significant difference between the Libyan private and public banking
sectors with respect to all service quality dimensions taken together.
5.5 Overview of the Research Process
This research selects methods that could fit its nature and circumstances. Therefore, the
researcher chose objectivism as epistemology, a positivism as approach or theoretical
perspective, quantitative as strategy and survey questionnaire as method of data collection.
Figure 5.1 shows elements of the research process for this study. Figure 5.2 illustrates a more
detailed description of the research process.

122
Figure 5.1 Elements of the Research Process of this Study
Positivism
Quantitative
Survey
Objectivism
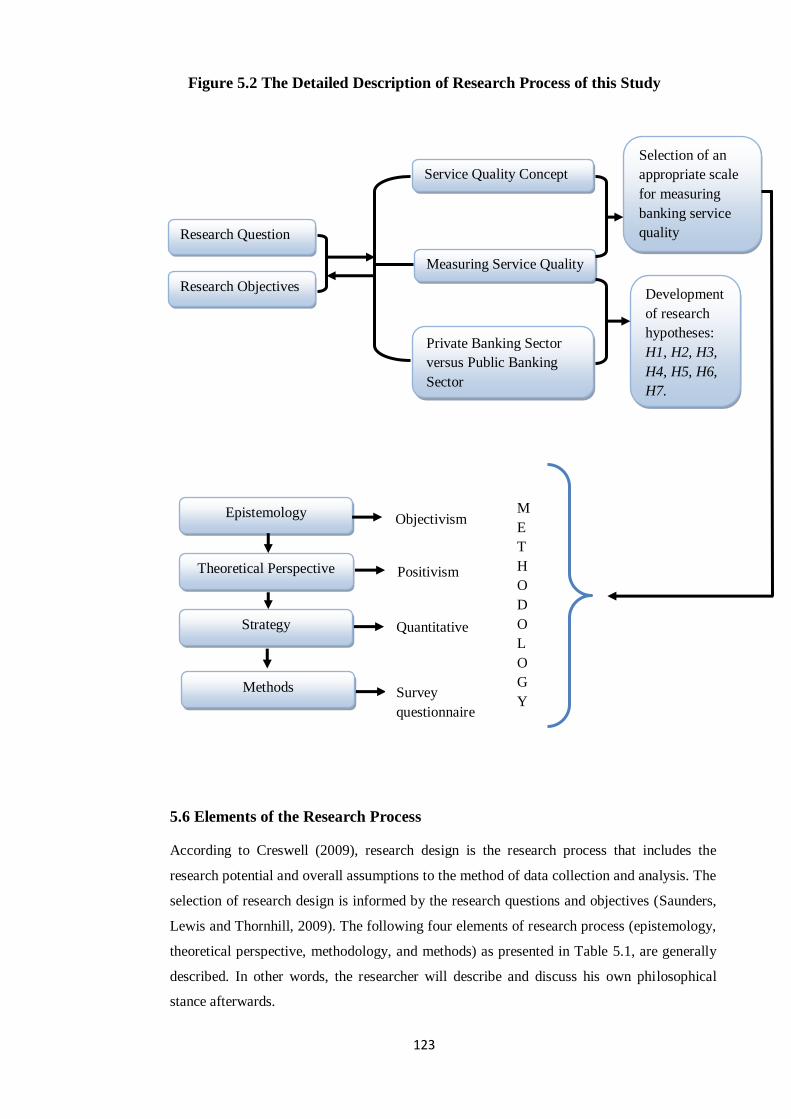
123
Figure 5.2 The Detailed Description of Research Process of this Study
5.6 Elements of the Research Process
According to Creswell (2009), research design is the research process that includes the
research potential and overall assumptions to the method of data collection and analysis. The
selection of research design is informed by the research questions and objectives (Saunders,
Lewis and Thornhill, 2009). The following four elements of research process (epistemology,
theoretical perspective, methodology, and methods) as presented in Table 5.1, are generally
described. In other words, the researcher will describe and discuss his own philosophical
stance afterwards.
Research Question
Research Objectives
Service Quality Concept
Measuring Service Quality
Private Banking Sector
versus Public Banking
Sector
Selection of an
appropriate scale
for measuring
banking service
quality
Development
of research
hypotheses:
H1, H2, H3,
H4, H5, H6,
H7.
Methods Survey
questionnaire
Theoretical Perspective
Strategy
Positivism
Quantitative
M
E
T
H
O
D
O
L
O
G
Y
Epistemology Objectivism

124
Table 5.1 Elements of Research Process
Definition Examples Literature
evidence
Epistemology The assumption of
Knowledge which is part
of the methodology and
how it is attained.
Objectivism,
subjectivism
constructivism
Creswell (2009)
and Crotty (1998)
Theoretical
perspective
The philosophical stance
that informs the basis of
methodology
Interpretive,
positivism,
postmodernism
Creswell (2009)
and Crotty (1998)
Methodology This refers to the reason
for selecting a method
and how this method is
adopted
Phenomenological
research, action
research, survey
research
Collis and Hussey
(2003) and Crotty
(1998)
Methods The tools and techniques
of date collection and
analysis
Questionnaires,
interviews,
observations
Crotty (1998) and
Saunders, Lewis
and Thornhill
(2009, 2007)
5.7 The Research Epistemology and Theoretical Perspective
Epistemology is “the theory of knowledge embedded in the theoretical perspective and
thereby in the methodology” (Crotty, 1998, p. 3). Epistemology provides the researcher with
the philosophical grounding that could help to decide what types of knowledge are adequate
and legitimate (Crotty, 2006). Saunders, Lewis and Thornhill (2007, p. 102) add that
“epistemology concerns what constitutes acceptable knowledge in a field of study.” The
same view was delivered by Bryman and Bell (2011); they argue that epistemology concerns
what should be regarded as acceptable knowledge in a discipline. Therefore, it is vital to
identify, justify and explain the epistemological stance the researcher intends to adopt
(Crotty, 2006). This is because the epistemological stance influences the researcher‟s
selection of methodology (Creswell, 2009).
According to Crotty (2006), there are three types of epistemology; these are objectivism,
subjectivism and constructionism. Table 5.2 below describes the three types of
epistemology.

125
Table 5.2 The Description of Objectivism, Subjectivism and Constructionism
Epistemology Description Literature Evidence
Objectivism
Things can exist as meaningful entities.
Research can discover objective truth
and meaning.
The researcher and the area being
researched are independent.
It is mainly associated with a positivist
approach.
Crotty (1998, 2006);
Johnson and Duberley
(2000); Collis and
Hussey (2003).
Subjectivism
Social phenomena are created from the
perceptions and consequence actions of
social actors.
The research is not separated from what
it is being researched.
It is mainly associated with an
interpretivist approach.
Saunders, Lewis and
Thornhill (2009);
Johnson and Duberley
(2000); Collis and
Hussey (2003).
Constructionism
It assumes that social phenomena and
their meanings are continually being
accomplished by social actors.
There is no objective truth the research
can discover.
The meaning is not discovered but
constructed.
Bryman and Bell
(2011); Crotty (2006).
According to Crotty (1998, pp. 5-6), objectivism is “the epistemological view that things
exist as meaningful entities independently of consciousness and experience, that they have
truth and meaning residing in them as objects (objective truth and meaning therefore) and
that careful (scientific) research can attain that objective truth and meaning.” It can also be
argued that objectivism is considered as a system of knowledge resulting from the interaction
with a social and physical environment (Crotty, 1998). This in fact supports the view that
undertaking planned and logical research, to know and understand what is assumed as fact
about the world around us, can help to establish the assumptions of knowledge as accurate or
false. However, objectivism is underpinning the positivist stance and may involve the use of
survey questionnaires and quantitative methods of statistical analysis (Crotty, 1998).
Keeping the above points in mind, this research is concerned with understanding knowledge
as objective proof of hypothetical statements/assumptions (the research hypotheses).
Moreover, the area under research is based on the opinions of the banks‟ customers (service

126
quality assessment), and this clearly suggests that the researcher is indeed separated from the
area under research; hence his opinions and views cannot influence the research.
Accordingly, the researcher believes that objectivism is the appropriate epistemological
stance that could help him to effectively understand the research and thus address the
research objectives.
With regard to the theoretical perspective, there are two major philosophical stances; these
are positivism and interpretivism (Collis and Hussey, 2003). Interpretivism is “a term given
to a contrasting epistemology to positivism” (Brayman and Bell, 2007, P. 17). Table 5.3
below compares the two approaches.
Table 5.3 Comparison of the Two Major Philosophical Stances
Positivist Interpretivist
Assumptions Objective world which
science can measure and
„mirror‟ with privileged
knowledge.
Intersubjective world which
science can represent with
concepts; social construction
of reality.
Aim
To discover universal laws
that can be used to predict
human activity.
To uncover the socially
constructed meaning of reality
as understood by an
individual or group.
Source: Adapted from Cavana, Delahaye and Sekaran (2001, p. 10).
Researchers in different fields of studies have focused to identify the origins of the positivist
approach to research and link the name of the founder to it. In this regard, Crotty (1998, p.
19) has pointed out that “the coining of the word „positivism‟ is often attributed to Auguste
Comte” (Crotty, 1998, p. 19). However, this view has its dissenters; some researchers
believe that the positivist approach pre-dated Comte (Crotty, 1998), although he made it
more popular than any other researcher of his time. Crotty (1998, p. 20) also summarised the
fundamental idea behind positivism by saying that it is an attempt to study and obtain
“knowledge that is not arrived at speculatively but is grounded firmly and exhaustively in
something that is posited”. It can be also noted that positivism from Comte‟s point of view is
about the practice related to research (the search for true knowledge) embracing flexibility
yet remaining homogenous. However, according to Comte‟s opinion, positivist approach is a
process of arriving at research conclusions through planned, organised, convinced activities
and not by mere assumptions (Crotty, 1998).
127
Positivism usually adopts quantitative methods reliant on hypotheses testing for
generalisation from the sample (tend to be large) of the population, and usually uses survey
to produce the findings (Collis and Hussey, 2003). Bryman and Bell (2011, p. 15) argue that
in a positivist approach “the purpose of theory is to generate hypotheses that can be tested
and that will thereby allow explanations of laws to be assessed”. It is also concerned with
empirical science and suggests that scientific knowledge is objective, certain and accurate
(Crotty, 2006), which in fact explains that positivism in social sciences can be concluded in a
specific way just like natural sciences (Collis and Hussey, 2003). Therefore, it is sometimes
seen as a scientific method (Creswell, 2007), based on facts or causes because it comes from
facts which can be observed or experimented (Collis and Hussey, 2003). More importantly,
it fundamentally forms the social science basis and it helps us understand the world after it
provides us with the required knowledge (May, 2001).
This research adopts positivism as theoretical perspective for planned and organised research
activities, strategies and research findings and conclusions. This research is based on
hypotheses testing; since it assumes that there are significant differences between the Libyan
private and public banking sectors in terms of customer perceptions of service quality. Many
researchers focusing on service quality have followed a positivist approach because of the
complex nature of service quality (Schembri and Sandberg, 2002). The developers of
SERVQUAL (the best known researchers in the area of service quality) scale have also used
a positivist approach in their studies of service quality (Parasuraman, Zeithaml and Berry,
1998). More precisely, Ladhari (2008) reviewed 30 service quality scales, and pointed out
that all the researchers had adopted a positivist approach. For these reasons, the researcher
believes that positivist is the most suitable approach in order to reach the research findings
and conclusions.
5.8 Issues of Research Methodology and Methods
5.8.1 The choice of research strategy
As mentioned earlier, the choice of research strategy is always informed by the type and the
nature of the research one is conducting. Furthermore, the choice of research strategy needs
to “employ research strategies most appropriate to the circumstances surrounding any given
study” (Davidson 2001 cited in Ogba, 2007, p. 100). Therefore, this research will employ the
strategies which accommodate its needs, and also assist in:
1. Developing and testing hypotheses
2. Helping to measure the perceived service quality quantitatively in Libyan private
and public banking sectors.
This is because the research is centred on banking service quality and its measurement.

128
5.8.2 Quantitative versus qualitative research methods
Going through the research design process, it is vital to decide is whether to use quantitative
strategy, qualitative strategy or both (mixed methods).
Quantitative research is a research strategy that centres on quantification in the collection
and analysis of data, while qualitative research can be construed as a research strategy that
usually centres on words in data collection and analysis (Bryman and Bell, 2007). Similarly,
Blumberg, Cooper, and Schindler, (2008) suggested that quantitative research relies on
numbers and figures (quantitative information), while qualitative research bases its accounts
on words, sentences and narratives (qualitative information). The same view was delivered
by Saunders, Lewis and Thornhill (2007), who distinguished between quantitative and
qualitative research by defining the former as research focused upon numeric (numbers) or
non-numeric (words). Also they stated that (p. 145):
Quanitative is predominantly used as a synonym for any data collection techniques
(such as a questionnaire) or data analysis procedure (such as graphs or statistics) that
generates or uses numerical data. In contrast qualitative is used predominantly as a
synonym for any data collection technique (such as an interview) or data analysis
procedure (such as categorising data) that generates or uses non-numerical data.
Bryman and Bell (2007) have presented in their textbook the fundamental differences
between quantitative and qualitative research strategies as shown below:
Table 5.4 Fundamental Differences between Qualitative and Qualitative
research Strategies
Quantitative Qualitative
Principal orientation to the
role of theory to research
Epistemological orientation
Ontological orientation
Deductive; testing of theory
Natural science model, in
particular positivism
Objectivism
Inductive; generation of
theory
Interpretivism
Constructionism
Source: Bryman and Bell (2007, p. 426)
However, there are certain assumptions which underlie quantitative and qualitative methods
(Dobbin and Gatowski, 1999). In quantitative research, reality is the point that can
objectively be studied; it is independent of and objective to the researcher, and therefore the
researcher should be independent of and remain distant from what is being measured and
studied.

129
Conversely, in qualitative research multiple realities are taking place within any given
situation, influencing the research, the individuals under investigation and the reader
interpreting the results. In conducting the research, the researcher also strives to reduce the
distance between the researcher and those individuals being researched or interviewed.
Gronssnickle and Raskin (2001) have identified certain strengths and limitations for
quantitative research as shown in the Table 5.5 below:
Table 5.5 The Strengths and Limitations of Quantitative Research
Strengths Limitations
Reliable: the results of quantitative research
are an accurate representation of the population being studied, when it is done
correctly.
Large Scale: quantitative research also
necessitates the standardisation of questionnaires and interview techniques;
they can easily cross geographical
boundaries and respondents from the entire target population can be involved.
In-depth analysis: statistical analysis
techniques can be implemented with quantitative data, from simple statistics such
as averages or frequencies, to more
complicated statistics such as factor analysis,
conjoint analysis and cluster analysis.
Replicable and tractable: in quantitative
research, results would be nearly identical if
identical studies were conducted concurrently among the same population.
Limited for explorations: in the quantitative
research, the methods of questionnaires and interviewing techniques tends to test the
predetermined hypotheses only, therefore
some potentially interesting spontaneous or
tangential responses may be excluded or missed.
Response to innovative concepts: it is much
more beneficial and valuable when it is conducted for the purpose of understanding
the established concepts, because it is
challenging to convey innovative concepts to interviewees.
Accessibility: quantitative data is an
abstraction and it is difficult to interpret.
Potentially misleading: quantitative research can be affected (regarding its
legitimacy) by many factors, e.g.
questionnaires can include data collection methods which can introduce bias.
Neglects self-reflection: quantitative
research treats people as if they were part of
the “natural world” and neglects important issues such as self-reflection (a special
feature of humans).
Static: one of its limitations is that quantitative research captures only a static
view of life.
Source: Gronssnickle and Raskin (2000, p. 86)
With regards to qualitative research, Grossnickle and Raskin (2001) have also identified
some strengths and limitations for qualitative research as provided in the Table 5.6 below:

130
Table 5.6 The Strengths and Limitations of Qualitative Research
Strengths Limitations
Ideal exploratory tool: qualitative research presents flexibility of investigation when
benefiting from having direct access to
customers' views and ideas.
Increases the value of subsequent quantitative research: it can be taken as an
excellent planning tool before engaging in
more sophisticated and expensive quantitative research.
Provides deep feedback rather than just
number crunching data: it may be good for providing a much richer insight than data-
centric methods and also a context for
interpreting the findings.
Group dynamics enhance results: participants can interact with each other and
thus draw out opinions and ideas that might
not have come up in one-to-one situations.
Provides the human perspective: the results
which emerge from qualitative research are
more accessible and understandable.
Small number of participants: involving large number of participants in this research
would be prohibitively costly.
Representativeness of results: as this
research uses small samples, it is rarely completely representative and the possibility
exists that respondents' characteristics are
significantly different from the rest of the population.
Selective data interpretation: researcher's
bias can be involved through his or her selective data interpretation that will lead
only to support the researcher's theoretical
conclusion. The researcher might also intend
to interpret the data through his or her introspection, feelings and thoughts.
Inability to track small differences:
generally, marketing successes and failures are caused by small differences in a
marketing mix, and qualitative research does
not satisfactorily distinguish these small differences.
Source: Gronssnickle and Raskin (2000, p. 51)
In addition, the differences between quantitative and qualitative research methods based on
the view of Martella, Nelson and Martella (1999) are presented in the Table 5.7 below:
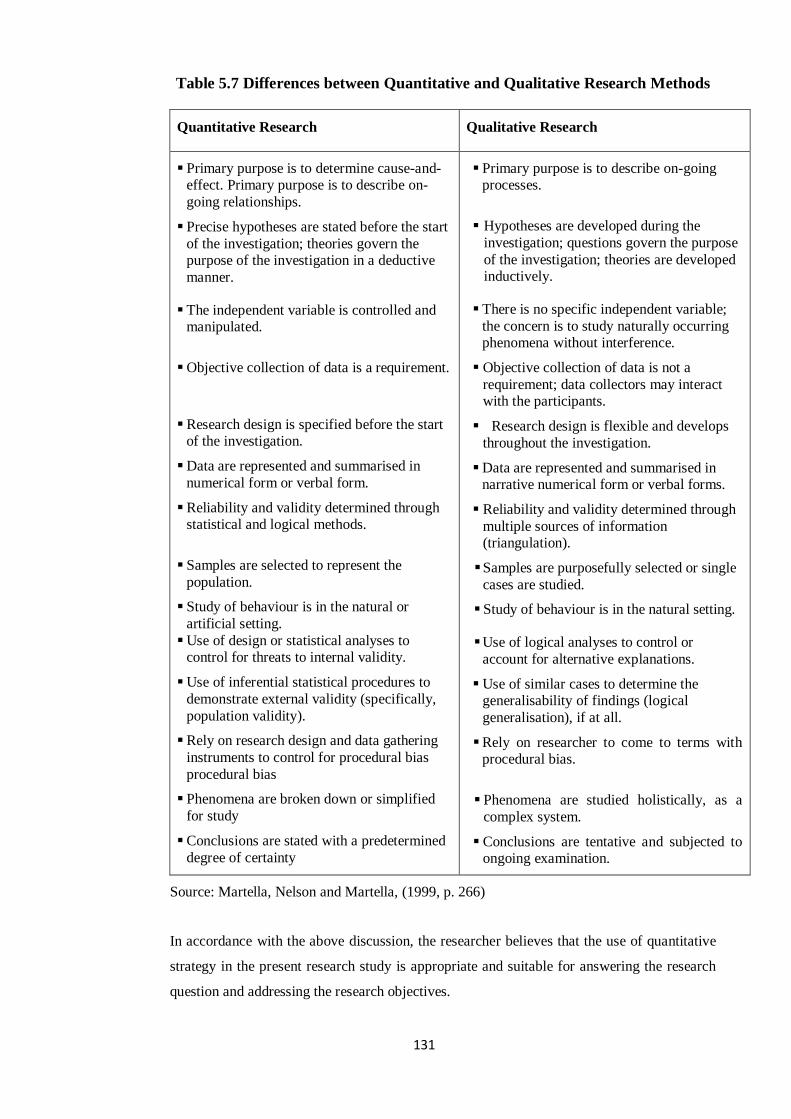
131
Table 5.7 Differences between Quantitative and Qualitative Research Methods
Quantitative Research Qualitative Research
Primary purpose is to determine cause-and-effect. Primary purpose is to describe on-
going relationships.
Precise hypotheses are stated before the start
of the investigation; theories govern the purpose of the investigation in a deductive
manner.
The independent variable is controlled and manipulated.
Objective collection of data is a requirement.
Research design is specified before the start of the investigation.
Data are represented and summarised in
numerical form or verbal form.
Reliability and validity determined through statistical and logical methods.
Samples are selected to represent the
population.
Study of behaviour is in the natural or
artificial setting.
Use of design or statistical analyses to control for threats to internal validity.
Use of inferential statistical procedures to
demonstrate external validity (specifically,
population validity).
Rely on research design and data gathering
instruments to control for procedural bias
procedural bias
Phenomena are broken down or simplified
for study
Conclusions are stated with a predetermined
degree of certainty
Primary purpose is to describe on-going processes.
Hypotheses are developed during the
investigation; questions govern the purpose
of the investigation; theories are developed inductively.
There is no specific independent variable;
the concern is to study naturally occurring phenomena without interference.
Objective collection of data is not a
requirement; data collectors may interact with the participants.
Research design is flexible and develops
throughout the investigation.
Data are represented and summarised in narrative numerical form or verbal forms.
Reliability and validity determined through
multiple sources of information (triangulation).
Samples are purposefully selected or single
cases are studied.
Study of behaviour is in the natural setting.
Use of logical analyses to control or
account for alternative explanations.
Use of similar cases to determine the generalisability of findings (logical
generalisation), if at all.
Rely on researcher to come to terms with procedural bias.
Phenomena are studied holistically, as a
complex system.
Conclusions are tentative and subjected to ongoing examination.
Source: Martella, Nelson and Martella, (1999, p. 266)
In accordance with the above discussion, the researcher believes that the use of quantitative
strategy in the present research study is appropriate and suitable for answering the research
question and addressing the research objectives.
132
5.8.3 Justification for using a quantitative strategy in the present research study
As noted earlier, the selection of research strategy, methodologies and methods is dependant
upon the type and the nature of research one is conducting. In view of this, the use of
quantitative strategy was judged completely appropriate. This because firstly, the research
involves (as earlier noted) the measurement of service quality in banking and this requires
that a considerable percentage of a population (a large number of participants) be involved;
therefore, this activity may not be perfectly conducted using qualitative methods. Secondly,
the literature evidently supports the conclusion that the appropriate strategy for
understanding and measuring service quality in banking is quantitative approach using a
survey questionnaire (Jabnoun and Al-Tamimi, 2003; Guo, Duff and Hair, 2008; Arasli,
Katircioglu and Mehtap-Smadi, 2005; Bahia and Nantel, 2000; Petridou, et al., 2007; Glaveli
et al., 2006; Spathis, Petridou and Glaveli, 2004).
The above argument therefore justifies the adoption of positivism and the adoption of a
quantitative research strategy through survey questionnaire to investigate banking service
quality in Libya.
5.8.4 Categories of research design
Marketing research can be categorised into three types (Smith, 1998):
1. Diagnostic/ Exploratory Research: this kind of research is mainly about the
discovery of insights and ideas;
2. Descriptive research: where the research is focusing on describing the attitudinal
and behavioural characteristics of a particular group; and
3. Causal Research: this research is concerned with identifying and determining the
exact cause and effect of particular relationships.
However, this research study can be linked with two of these types. It is diagnostic in nature
since it intends to identify areas of weakness and strengths in the service quality in Libyan
retail banks through customers' ranges of attitudes; further, it is descriptive in nature as it
intends to build assessments of service quality profiles of customers based on the main bank
they deal with.
5.9 Methods of Data Collection: Quantitative Survey (questionnaire)
The study will depend on BSQ scale to measure customers‟ perceptions of service quality in
Libyan private and public banking sectors. This scale (Banking Service Quality) was
developed by Bahia and Nantel (2000) and was designed specifically for measuring service
quality in the banking environment. This scale formulates the questionnaire used in this
133
research, which was distributed to the banks‟ customers based on the targeted sample size.
Thus, quantitative method and survey questionnaire strategy were adopted in this study to
collect the data from respondents.
Unlike a qualitative strategy, a quantitative strategy is mostly devoted to offering and
exploring the relationship between variables (two or more) depending on the hypothetical
research statements. Aaker, Kumar and Day (1995, p. 199) pointed out that “survey is the
overwhelming choice of researchers for collecting primary data”. According to Trochim
(2001), survey research is commonly used over the years and it has remained amongst the
most imperative strategy for measurement-based research in organisational, applied and
social science research. Furthermore, a survey is usually a method to collect quantifiable data
from participants in order to measure, examine, analyse and generalise the findings
(Zikmund and Babin, 2010), and also it is “a research technique in which a sample is
interviewed in some form or behaviour of respondents is observed and described in some
way” (p. 64). Surveys are commonly linked to deductive logic and by using it, data can be
collected from the sample and statistically analysed (Saunders, Lewis and Thornhill, 2007).
Surveys usually identify the participants‟ perceptions in terms of attitudes, opinions and
beliefs; they also enable the understanding of consumer preferences (Fowler, 2002). More
precisely, “survey research... is the method of collecting information by asking a set of
preformulated questions in a predetermined sequence in a structured questionnaire to a
sample of individuals drawn so as to be representative of a defined population” (Hulton,
1990, p. 8). Therefore, survey research is “associated as research approach with the idea of
asking groups of people questions” (Blaxter, Hughes, and Tight, 2001, p. 77). These
questions should be logical and follow a certain order that allows participants to express
facts, attitudes and comments (Hague, 2002). The latter also mentioned that by using a
survey, information can be collected from respondents by making face to face contact,
sending the questionnaire by post, making telephone calls or using other methods of data
collection. Additionally, the survey questions should be organised in a way that make it
easier for respondents to follow (Saunders, Lewis and Thornhill, 2007).
However, Saunders, Lewis and Thornhill (2007) have identified a variety of factors which
influence the election of questionnaire strategy:
Respondents‟ characteristics from whom the data will be collected.
Importance of obtaining a particular person as respondent.
Importance of the answers provided by respondents.
Size of sample required for the analysis process, taking into account the response
rate.
Types of question needed for data collection.
134
Number of questions required to be asked to collect the data.
Furthermore, the selection of questionnaire will be influenced by the following resources
(Saunders Lewis and Thornhill, 2007):
Time available for completing the data collection.
Financial resources available for data collection and entry.
Availability of interviewers that will assist in the data collection process.
How easy is the automation of data entry.
In line with the above argument, the survey questionnaire is the most commonly used
method for collecting data in the field. It is important to note that a quantitative questionnaire
is referred to and supported within similar studies (measuring service quality in banking) in
the literature (Jabnoun and Khalifa, 2005; Kangis and Voukelatos, 1997; Karatepe, Yavas
and Babakus, 2005; Lassar, Manolis and Winsor, 2000; Newman and Cowling, 1996;
Othman and Owen, 2001). For instance, the research of Ladhari (2008) reviewed 30 different
service quality studies and it found that the quantitative method (survey questionnaire) was
the main approach for data collection. Furthermore, the use of survey questionnaire within a
wide range of service industries was also supported by the Marketing Team (Parasuraman,
Zeithaml and Berry, 1988; 1991; 1994).Therefore this research adopts a quantitative strategy
in the form of a research questionnaire.
5.9.1 Research scale and data collection method
As noted earlier, the scale used for measuring the perceived service quality in Libyan private
and public banking sectors was Banking Service Quality (BSQ) Scale developed by Bahia
and Nantel (2000). The BSQ scale was preferred to SERVQUAL model. The Banking
Service Quality scale (BSQ) used in this research study consists of 31 items of service
quality relevant to the banking sector (retail banking). These 31 items are distributed across
six dimensions: effectiveness and assurance; access; price; tangibles; service portfolio; and
reliability (see Figure 3.3 in Chapter Three).
However, BSQ scale was chosen in this research instead of SERVQUAL scale to measure
the perceived service quality in Libyan private and public banking sectors for the following
reasons:
The BSQ scale deals exclusively with the perceived service quality within the
special context of retail banking, thus it is the standard scale that was designed
specifically for measuring service quality in a banking environment (Petrido et al.,
2007; Glaveli et al., 2006), and this is not the case with SERVQUAL scale which
was designed to measure service quality within a wide range of service industries
(universal scale).

135
The item‟s inclusion in the different dimensions of the BSQ construct was much
more consistent when it was piloted in this research study (see section 5.10). The
SERVQUAL model was criticized regarding its dimensions and items (Babakus
and Boller, 1992; Cronin and Taylor, 1992; Carman, 1990; Brady and Cronin,
2001; Teas, 1994).
SERVQUAL dimensions were all included in Dim1 which is independent from the
other dimensions of the BSQ, and also these other dimensions were completely
independent from the dimensions of SERVQUAL, except for Dim 2 which is
correlated with the first dimension of SERVQUAL (Bahia and Nantel, 2000). This
in fact confirms that the BSQ incorporates the particularities of service quality in
the banking sector.
The six dimensions of the BSQ scale cover a broader range of marketing variables
(Guo, Angus and Hair, 2008) than is the case with the original SERVQUAL
dimensions.
The three main problems related to SERVQUAL model which are its
dimensionality, its universality, and the use of an expectation-perception
disconfirmation approach, are completely avoided in the case of the BSQ model.
The above therefore proves for the researcher that the perceived service quality levels in the
Libyan private and public retail banks can be effectively measured by using the modified
SERVQUAL model, which is the BSQ scale comprising 31 items distributed within six
dimensions.
In order to obtain the relevant answer to the research question, the questionnaire was
developed. This questionnaire consisted of two parts. The first part contained the 31 items
from the original BSQ model (Bahia and Nantel, 2000). The second part aimed to build the
demographic profile of the customer sample in terms of gender, age, profession, number of
branch visits, and the duration of their relation with the bank. This demographic information
was requested for last in order to allow respondents to answer the vital information (service
quality questions) with a fresher mind. For measuring perceptions of service quality,
respondents (banks‟ customers) were asked to indicate the degree to which their bank
satisfied the described statements (questionnaire items).
This research will use only perceptions scores to identify the service quality levels, because
the gap score has been criticised for the use of an expectations construct (Carman, 1990;
Babakus and Boller, 1992), plus the superior predictive and convergent validity of the
perception-only scores has been supported (Cronin and Taylor, 1992; Dabholkar, Thorpe and
Rentz, 1996), especially in the banking sector (McDougall and Levesque, 1994).
136
Similar to most service quality studies, a Likert scale was employed for the purpose of this
research study. The seven-point Lirket scale is widely and recently used by academics. The
literature supports the view that there is a positive relationship between number of scale
points and scale reliability (Dillon, Madden and Firtle, 1990; Malhorta, 1996). Furthermore,
Malhorta (1996) argues that if sophisticated statistical techniques are used in a study, then
seven or more categories are desired. Therefore, in this research respondents were asked to
rate each item on a Likert-type scale by assigning a value of 1= (strongly disagree) to 7=
(strongly agree), as suggested by Bahia and Nantel (2000).
Before distributing the questionnaire to the banks‟ customers, all concerns about using BSQ
cross-culturally were considered. The scale therefore was piloted in order to identify any
obstacles which might obstruct the collection of required data. Accordingly, it was slightly
amended. The corrections mainly concerned the phrasing of some of the scale statements.
The pre-test of the scale (pilot study) is discussed in detail in the next section. After the pilot
study, the questionnaire was amended and prepared in its final version (see Appendix 2).
For investigating the levels of service quality provided by the private and public banking
sectors in Libya, questionnaires were distributed to the banks‟ customers with a non-
probability convenience sample size of 1000 questionnaires for each banking sector, giving a
total of 2000 questionnaires. The sample size concerns and issues are discussed in section
5.11.
Given the timeline of this research study, data collection was decided to be collected within
four months time. To avoid any confusion as regards the data collection, the researcher
decided to collect data from each banking sector separately, starting with the private sector
which comprised two banks within four branches. This means that two months were allotted
to collect data from each banking sector. Accordingly, the researcher decided to collect data
from each bank branch over a two weeks period. 370 usable questionnaires were collected
from private banks within two months, with care to consider equal distribution between the
four branches in terms of the number of questionnaires, then the researcher moved to public
banks using the same approach, and he continued collecting data until he collected 370
usable questionnaires within 65 days. It can therefore be noted that because of limitations in
timing, 370 questionnaires were collected from a total of 1000 questionnaires administered
to each banking sector with 37% response rate. The data collection was carried out over a
period of 125 days within the months of November, December 2009 and January, February,
March 2010. The questionnaire was administered by face-to-face contact. According to
Saunders, Lewis and Thornhill, (2007, p. 234), convenience sampling “involves selecting
haphazardly those cases that are easiest to obtain for your sample”. Therefore, in this
research, respondents were selected haphazardly in the banks‟ branches, further, in order to
overcome the problems related to participation refusals in the survey, the researcher selected
137
the next customer available who was willing to participate in the research, and thus the
sample selection process was continued.
As mentioned above, the questionnaires were administered by face-to-face contact and in
accordance with the convenience sampling procedure, (approaching customers based on their
availability in the banks‟ branches).
Keeping the above points in mind, the researcher distributed the survey to customers who
were willing to participate. The researcher provided the participants with a short introduction
informing them of the purpose of the research, also requesting they read the introductory
letter attached to the questionnaire, which gave further information in greater detail. After
accepting the questionnaires the banks‟ customers were asked to complete them in the area
of the branch set aside for this purpose.The researcher waited inside the bank in order to
collect the completed questionnaires and observed that the time taken to complete the
questionnaire ranged between 11-15 minutes.
The choice of administering the questionnaire by face-to-face contact was based on the
following considerations:
Face to face contact is the most effective method to collect data by questionnaires
in the less-developed countries (Kumar, 2000).
It yields high percentages of acceptable returns and has a relatively low refusal rate
(Saunders, Lewis and Thornhill, 2007).
Libyan people have a good experience of using questionnaires by face-to face
contact rather than using telephone or e-mail survey. This is because many
institutions and organisations in education and other business sectors commonly
adopting the same method of survey (face-to-face).
The Libyan post system is still facing many problems regarding numbering and
coding the streets and buildings, which prevent administering questionnaire by
post.
Internet surveys are still of limited use in Libya given the small number of internet
users.
5.10 Scale Pilot-testing
The stage of data collection should never begin without adequate pre-test of the content and
physical appearance of items (Dillon, Madden and Firtle, 1993; Malhorta, 1996; Churchill,
1995). The pilot-testing of scale items is considered as testing items on a small sample for
the purposes of improving these items by identifying and eliminating potential problems
(Malhotra, 1996). In other words, it helps to identify those items which were perceived by

138
pilot respondents as ambiguous and to encourage them to provide any suggestions or
comments that could improve the response as well as the general quality of the survey.
In this research the items and dimensions of the scale (Banking Service Quality Scale) were
developed by the available literature (Bahia and Nantel, 2000), and were tested in two stages.
Firstly, the draft questionnaire was piloted among the Libyan students at Northumbria
University in the UK. At this stage care was taken to choose students who already have bank
accounts in Libya whether in private or public banks. The literature provides support for pre-
assessment of the questionnaire items by friends and colleagues. For instance, Buckingham
and Saunders (2004, p. 84) state: “the easiest way of testing it out is on friends and
colleagues. This pre-test will help you judge how long the questionnaire takes to complete
and it should throw up any obvious problems in question wording or accompanying
instructions”.
There is no doubt that the purpose of piloting the questionnaire according to Reeves and
Harper‟s (1981) view, is to make the researcher more familiar with potential problems of
data collection and also with dangers of social desirability bias and interviewer bias
governing the survey. Furthermore, the questions which cause problems as a result of the
classification or translation can be identified. Errors in the instructions given to respondents
and errors in wording can also be discovered and corrected. Finally, the length of the survey
in terms of the number of questions and the time needed to complete can be checked and
managed.
The research to identify customers‟ perceptions about service quality levels in Libyan retail
banking (private and public banking) forms the main area of investigation of this research
study. Based on a theoretical background of service quality, the researcher prepared a
version of the BSQ scale (see Appendix 2) developed by Bahia and Nantel (2000), as this
scale will be used for measuring service quality in Libyan banks. In this research, the
purpose of the pre-testing exercise is mainly to refine the scale items in terms of wording
after translating it into Arabic language, and also to identify any other problems as
mentioned above. Prior to conducting the pilot test, the questionnaire was translated by
professionals from English to Arabic (see Appendix 4) in order to enable respondents of the
pilot study and thereafter Libyan banks‟ customers to participate in the research. The Arabic
version of the questionnaire was translated into the English language using the same layout
(see Appendix 5), following the back translation procedure (Craig and Douglas, 2005). The
main purpose of applying back translation is to make sure that all idioms and local
expressions were properly addressed, and to improve translation equivalence. Moreover,
“both verbal and nonverbal instruments need to be translated so that they can be used in
different linguistic and cultural contexts” (Craig and Douglas, 2005, p. 254).

139
Prior to conducting the pilot study, the researcher designed a guide for the interviews in the
two stages with a predetermined set of goals to be met:
Assessing the wording of items (wording difficulty) included in the questionnaire.
Assessing whether or not it is necessary to eliminate any item(s).
Examining the need for generating additional items that had not been provided by
the current scale.
Assessing the importance of the six service quality dimensions included in the
scale in relation to bank services.
Testing the appropriateness of the sequence and layout of the questionnaire items.
For this purpose, the respondents were asked to comment upon anything that they felt would
improve its quality in terms of understanding and response. In this pilot study, twelve Libyan
students from Northumbria University in the UK were interviewed; the need for personal
interviews was imperative since the subject of questioning required personal interaction with
the participant and concerned their views, opinions and comments. Accordingly, a copy of
the questionnaire was handed out to each participant, and the researcher gave a brief
introduction as to the purpose of the survey as well as the interview to be conducted. Each
participant was asked to assess the questionnaire after which he was asked to assess the
wording of each item and to state any problems he encountered while reading the statements
in terms of wording difficulty and readability. Each participant was also asked to provide any
additional items which had not been included in the questionnaire, and also to supply
remarks related to the items which needed to be eliminated from the questionnaire based on
their personal views. Moreover, each respondent was asked to contribute their experience
and knowledge to attribute the appropriateness and importance of the six service quality
dimensions in complimenting banking services. The comments or suggestions provided by
each respondent were noted separately.
Secondly, after reviewing responses from the first stage, certain questions/ items in the pilot
survey questionnaires were identified. The questionnaire was again reviewed with twelve
bank customers in Libya (six customers from private banks and six customers from public
banks) to note their reactions and viewpoints towards these items in this questionnaire. This
procedure also complements the views of Dobbin and Gatowski‟s (1999) and Zikmund et al.
(2010). They suggested that in pre-test or pilot, the proposed survey is distributed to a small
number of people who are very similar to the people who would be participating in real
study, as each participant from amongst a banks‟ customers has a bank account in one of the
Libyan banks, whether private or public. The customers were interviewed separately to
discuss the questionnaire using the same guidance as in the first stage; the only exception
was that they were asked to complete the questionnaire and were observed carefully from
beginning to end without interruption to estimate the average time required for answering the
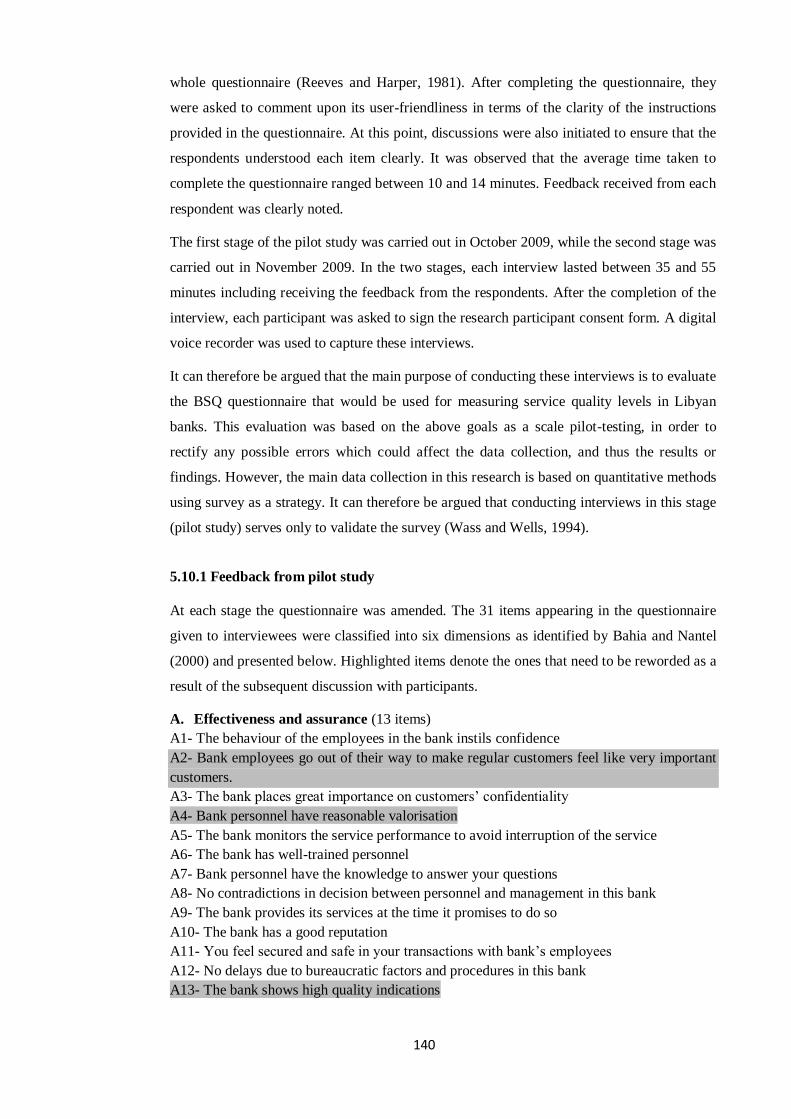
140
whole questionnaire (Reeves and Harper, 1981). After completing the questionnaire, they
were asked to comment upon its user-friendliness in terms of the clarity of the instructions
provided in the questionnaire. At this point, discussions were also initiated to ensure that the
respondents understood each item clearly. It was observed that the average time taken to
complete the questionnaire ranged between 10 and 14 minutes. Feedback received from each
respondent was clearly noted.
The first stage of the pilot study was carried out in October 2009, while the second stage was
carried out in November 2009. In the two stages, each interview lasted between 35 and 55
minutes including receiving the feedback from the respondents. After the completion of the
interview, each participant was asked to sign the research participant consent form. A digital
voice recorder was used to capture these interviews.
It can therefore be argued that the main purpose of conducting these interviews is to evaluate
the BSQ questionnaire that would be used for measuring service quality levels in Libyan
banks. This evaluation was based on the above goals as a scale pilot-testing, in order to
rectify any possible errors which could affect the data collection, and thus the results or
findings. However, the main data collection in this research is based on quantitative methods
using survey as a strategy. It can therefore be argued that conducting interviews in this stage
(pilot study) serves only to validate the survey (Wass and Wells, 1994).
5.10.1 Feedback from pilot study
At each stage the questionnaire was amended. The 31 items appearing in the questionnaire
given to interviewees were classified into six dimensions as identified by Bahia and Nantel
(2000) and presented below. Highlighted items denote the ones that need to be reworded as a
result of the subsequent discussion with participants.
A. Effectiveness and assurance (13 items)
A1- The behaviour of the employees in the bank instils confidence
A2- Bank employees go out of their way to make regular customers feel like very important
customers.
A3- The bank places great importance on customers‟ confidentiality
A4- Bank personnel have reasonable valorisation
A5- The bank monitors the service performance to avoid interruption of the service
A6- The bank has well-trained personnel
A7- Bank personnel have the knowledge to answer your questions
A8- No contradictions in decision between personnel and management in this bank
A9- The bank provides its services at the time it promises to do so
A10- The bank has a good reputation
A11- You feel secured and safe in your transactions with bank‟s employees
A12- No delays due to bureaucratic factors and procedures in this bank
A13- The bank shows high quality indications
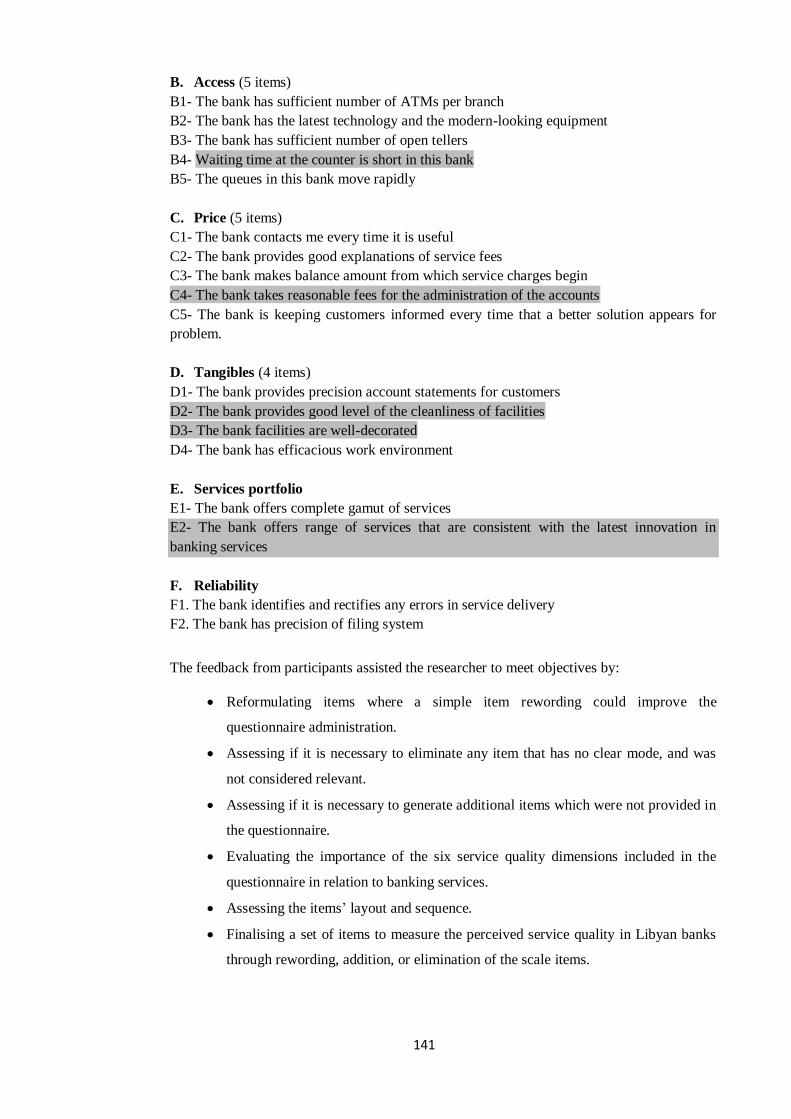
141
B. Access (5 items)
B1- The bank has sufficient number of ATMs per branch
B2- The bank has the latest technology and the modern-looking equipment
B3- The bank has sufficient number of open tellers
B4- Waiting time at the counter is short in this bank
B5- The queues in this bank move rapidly
C. Price (5 items)
C1- The bank contacts me every time it is useful
C2- The bank provides good explanations of service fees
C3- The bank makes balance amount from which service charges begin
C4- The bank takes reasonable fees for the administration of the accounts
C5- The bank is keeping customers informed every time that a better solution appears for
problem.
D. Tangibles (4 items)
D1- The bank provides precision account statements for customers
D2- The bank provides good level of the cleanliness of facilities
D3- The bank facilities are well-decorated
D4- The bank has efficacious work environment
E. Services portfolio
E1- The bank offers complete gamut of services
E2- The bank offers range of services that are consistent with the latest innovation in
banking services
F. Reliability
F1. The bank identifies and rectifies any errors in service delivery
F2. The bank has precision of filing system
The feedback from participants assisted the researcher to meet objectives by:
Reformulating items where a simple item rewording could improve the
questionnaire administration.
Assessing if it is necessary to eliminate any item that has no clear mode, and was
not considered relevant.
Assessing if it is necessary to generate additional items which were not provided in
the questionnaire.
Evaluating the importance of the six service quality dimensions included in the
questionnaire in relation to banking services.
Assessing the items‟ layout and sequence.
Finalising a set of items to measure the perceived service quality in Libyan banks
through rewording, addition, or elimination of the scale items.
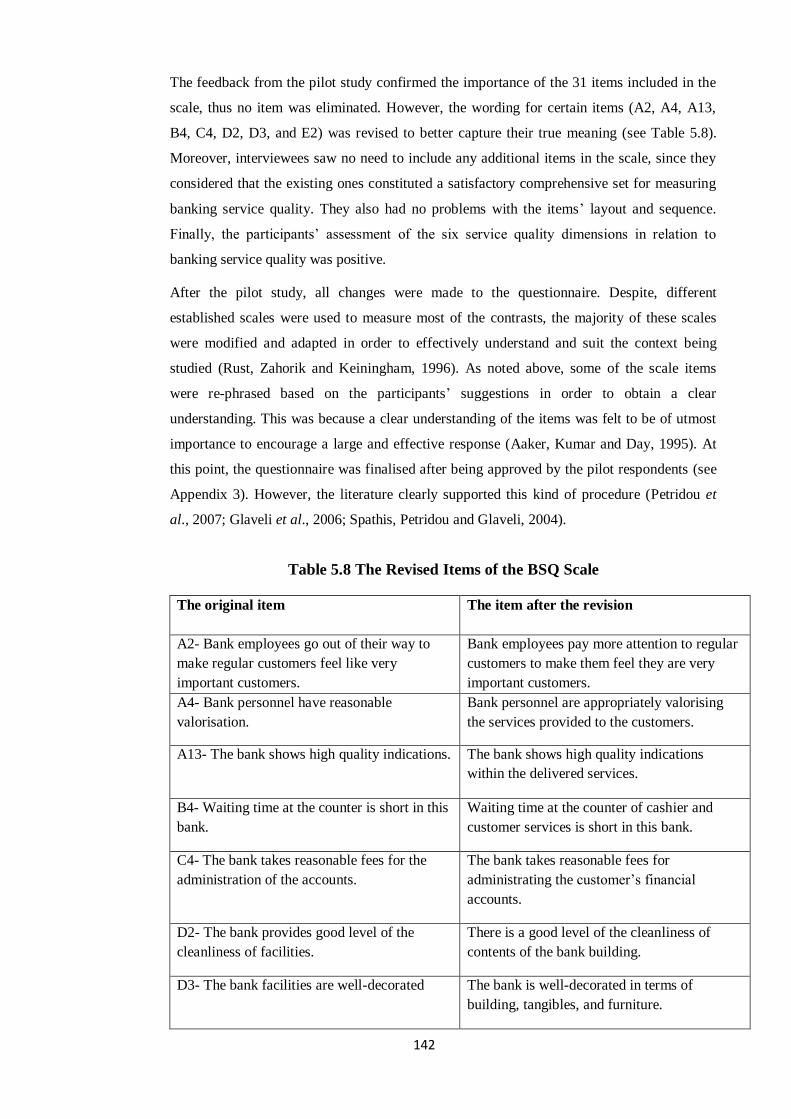
142
The feedback from the pilot study confirmed the importance of the 31 items included in the
scale, thus no item was eliminated. However, the wording for certain items (A2, A4, A13,
B4, C4, D2, D3, and E2) was revised to better capture their true meaning (see Table 5.8).
Moreover, interviewees saw no need to include any additional items in the scale, since they
considered that the existing ones constituted a satisfactory comprehensive set for measuring
banking service quality. They also had no problems with the items‟ layout and sequence.
Finally, the participants‟ assessment of the six service quality dimensions in relation to
banking service quality was positive.
After the pilot study, all changes were made to the questionnaire. Despite, different
established scales were used to measure most of the contrasts, the majority of these scales
were modified and adapted in order to effectively understand and suit the context being
studied (Rust, Zahorik and Keiningham, 1996). As noted above, some of the scale items
were re-phrased based on the participants‟ suggestions in order to obtain a clear
understanding. This was because a clear understanding of the items was felt to be of utmost
importance to encourage a large and effective response (Aaker, Kumar and Day, 1995). At
this point, the questionnaire was finalised after being approved by the pilot respondents (see
Appendix 3). However, the literature clearly supported this kind of procedure (Petridou et
al., 2007; Glaveli et al., 2006; Spathis, Petridou and Glaveli, 2004).
Table 5.8 The Revised Items of the BSQ Scale
The original item The item after the revision
A2- Bank employees go out of their way to
make regular customers feel like very
important customers.
Bank employees pay more attention to regular
customers to make them feel they are very
important customers.
A4- Bank personnel have reasonable
valorisation.
Bank personnel are appropriately valorising
the services provided to the customers.
A13- The bank shows high quality indications. The bank shows high quality indications
within the delivered services.
B4- Waiting time at the counter is short in this
bank.
Waiting time at the counter of cashier and
customer services is short in this bank.
C4- The bank takes reasonable fees for the
administration of the accounts.
The bank takes reasonable fees for
administrating the customer‟s financial
accounts.
D2- The bank provides good level of the
cleanliness of facilities.
There is a good level of the cleanliness of
contents of the bank building.
D3- The bank facilities are well-decorated The bank is well-decorated in terms of
building, tangibles, and furniture.
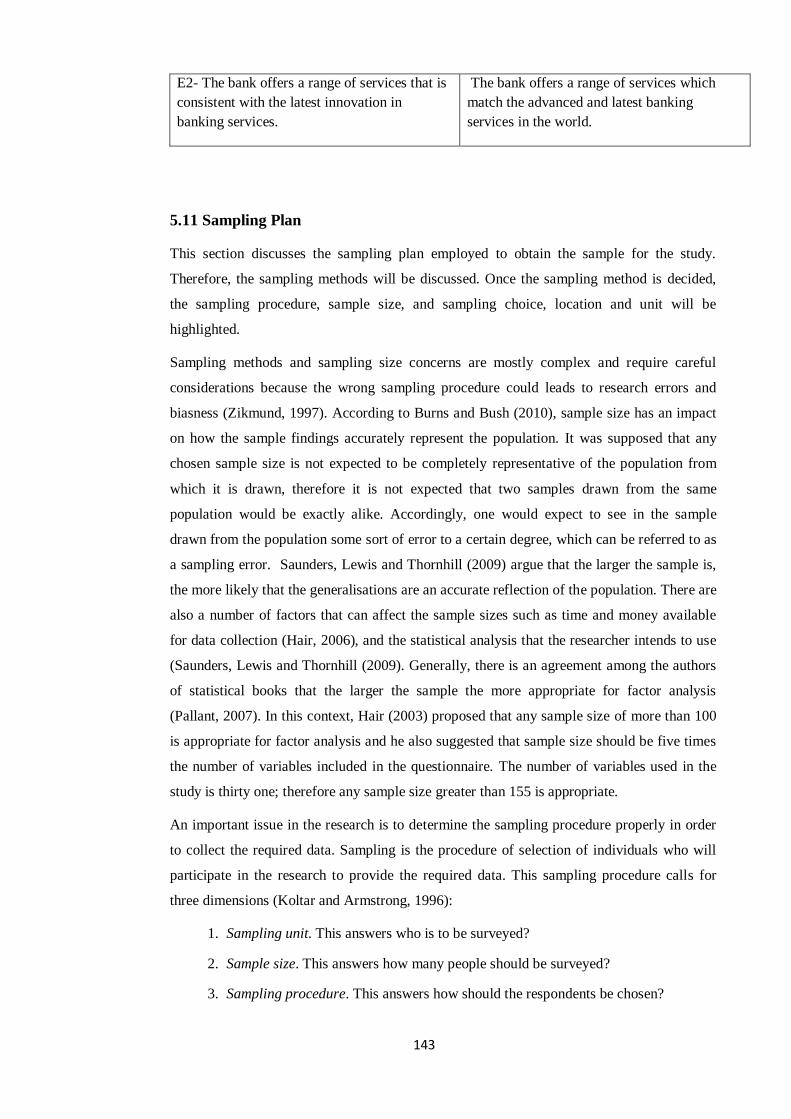
143
E2- The bank offers a range of services that is
consistent with the latest innovation in
banking services.
The bank offers a range of services which
match the advanced and latest banking
services in the world.
5.11 Sampling Plan
This section discusses the sampling plan employed to obtain the sample for the study.
Therefore, the sampling methods will be discussed. Once the sampling method is decided,
the sampling procedure, sample size, and sampling choice, location and unit will be
highlighted.
Sampling methods and sampling size concerns are mostly complex and require careful
considerations because the wrong sampling procedure could leads to research errors and
biasness (Zikmund, 1997). According to Burns and Bush (2010), sample size has an impact
on how the sample findings accurately represent the population. It was supposed that any
chosen sample size is not expected to be completely representative of the population from
which it is drawn, therefore it is not expected that two samples drawn from the same
population would be exactly alike. Accordingly, one would expect to see in the sample
drawn from the population some sort of error to a certain degree, which can be referred to as
a sampling error. Saunders, Lewis and Thornhill (2009) argue that the larger the sample is,
the more likely that the generalisations are an accurate reflection of the population. There are
also a number of factors that can affect the sample sizes such as time and money available
for data collection (Hair, 2006), and the statistical analysis that the researcher intends to use
(Saunders, Lewis and Thornhill (2009). Generally, there is an agreement among the authors
of statistical books that the larger the sample the more appropriate for factor analysis
(Pallant, 2007). In this context, Hair (2003) proposed that any sample size of more than 100
is appropriate for factor analysis and he also suggested that sample size should be five times
the number of variables included in the questionnaire. The number of variables used in the
study is thirty one; therefore any sample size greater than 155 is appropriate.
An important issue in the research is to determine the sampling procedure properly in order
to collect the required data. Sampling is the procedure of selection of individuals who will
participate in the research to provide the required data. This sampling procedure calls for
three dimensions (Koltar and Armstrong, 1996):
1. Sampling unit. This answers who is to be surveyed?
2. Sample size. This answers how many people should be surveyed?
3. Sampling procedure. This answers how should the respondents be chosen?

144
Basically, the sampling methods can be categorised into probability sampling and non-
probability sampling (Saunders, Lewis and Thornhill, 2007; Craig and Donglas, 2005;
Malhorta, 1996; Churchill, 1995; Parasuraman, 1991), each of which can be broken down
into different sampling types:
1. Probability Sampling- Simple Random Sampling; Systematic Sampling; Stratified
Random Sampling; Cluster Sampling; and Multi-Stage Sampling.
2. Non-Probability Sampling- Quota Sampling; Purposive or Judgemental Sampling;
Snowball Sampling; Self Selection Sampling and Convenience Sampling.
5.11.1 Sampling methods
5.11.1.1 Probability sampling
In probability sampling, each unit of the defined population has a known and non-zero
chance of being included in the sample. This type of sampling is the most widely used by
researchers as a result of its sound theoretical basis, and accordingly, mathematics of
probability can legitimately be used. Probability sampling is the complete objective method
of sampling a population. Within this method of sampling, the calculation of confidence
limits for sampling error will be allowed to obtain a representative sample. This sampling
technique also maximises the ability to examine the accuracy of estimates obtained from the
survey (Tansey, 2007).
(1) Simple Random Sampling. This is the most well-known method of probability sampling.
In this method each element of a population has an equal chance to be selected. The
population elements are selected one at the same time, independent of each other and without
replacement. This can be achieved for instance by using random number tables. This method
helps to avoid subjective bias arising from a personal selection of sampling units. Saunders,
Lewis and Thornhill (2007, p. 218) add “this form of sampling is not suitable if you are
undertaking a survey that covers a large geographical area and requires face-to-face contact”.
On the other hand, they mention that simple random sampling would still be suitable for a
large geographical area in the case of using alternative technique of collecting data such as
postal questionnaires or telephone interviewing.
(2) Systematic Random Sampling. In this sampling method, all elements of a population are
not given equal chance of selection. It involves choosing every nth person from a target
population list after the first unit is selected at random. Saunders, Lewis and Thornhill (2007,
p. 221) have noted that “systematic sampling is suitable for geographically dispersed cases
only if you do not require face-to-face contact when collecting your data”.

145
(3) Stratified Random Sampling. Within this sampling method, the population is divided into
mutually exclusive groups or strata (such as age groups), and random samples are drawn
from each group. The homogeneity in each group is more than the total population, which in
turn contributes to the accuracy of the sampling process (Saunders, Lewis and Thornhill,
2007).
(4) Cluster Sampling. This is the probability sampling that differs because it seeks to select
clusters of population elements, instead of selecting individual elements of population. This
method is adopted when "natural" groupings are evident in the population. The total
population is divided into clusters chosen randomly and within these clusters every unit is
sampled. Elements within a cluster should be as heterogeneous as possible. But there should
be homogeneity between clusters (Craig and Donglas, 2005).
Often a 2-stage sample design is adopted, where the first stage sampling includes the
selection of clusters and the second stage the selection of elements within the selected
cluster; sub-sampling within clusters may give a better estimate of the total.
(5) Multistage Sampling. In this method cluster sampling and stratified sampling are
combined.
5.11.1.2 Non probability sampling
Non-probability sampling is the second most common method of sampling. In this sampling
method the elements of a population do not have equal chance of selection with the sample.
It relies on personal judgement of the researcher in the selection process. This sampling
method can be categorised into different types (Tansey, 2007):
(1) Quota Sampling. It is the most widely used type of non-probability sampling. It seeks to
ensure that the sample is representative by selecting elements in a way that the proportion of
the sample elements possessing a certain characteristic (e.g. age, gender, social class, etc.) is
approximately the same as the proportion of the elements with the characteristic in the
population. However, quotas are set by the researcher and, the selection of the actual
respondents is the responsibility of the interviewer; therefore, this can lead to bias, the
degree of which cannot be objectively measured.
(2) Purposive or Judgemental Sampling. It selects the elements of population by means of
"expert judgement". Following this procedure, experienced individuals in the subject matter
of the survey select what they believe to be the best sample for that particular research. It is
also noted that there is no objective method of assessing the reliability of sampling results. In
contrast to convenience sampling, judgemental sampling tends to take more time and money
to assemble.

146
(3) Snowball Sampling. This method is often adopted when it is difficult to obtain elements
of the targeted population. Within this type of sampling, a contact with one or two cases in
the population will be needed, then these cases will be asked to identify further cases, and
these new cases will be also asked to identify new cases (and so on). The researcher must
stop when either no new cases are given or the sample is as larger as is manageable.
(4) Convenience Sampling. It is also called accidental sampling. It seeks to obtain people
who are most conveniently available. Convenience samples are often adopted to obtain a
large number of completed questionnaires quickly and economically.
In view of above discussions, this research adopts what it considers to be the most suitable
sampling methods. The researcher therefore adopted non-probability sampling. The
respondents to the survey were chosen using a non-random selection method. A non-
probability sample was chosen versus a probability sample primarily due to the large
population that potentially could be involved, the absence of a sampling frame, the need for
undertaking a survey that covers a large geographical area and the limitations in the timing
of conducting the survey and costs. However, probability sampling requires the availability
of satisfactory population lists, (e.g. sample frames), and it usually includes considerable
costs of time and money (Saunders, Lewis and Thornhill, 2007). This does not affect the
results as non-probability samples can still be used effectively in similar research (see Table
5.9 below).

147
Table 5.9 Literature Evidence on Using Non-Probability Sampling
It can be argued that the literature suggested the benefits of using non-probability sampling
when the circumstances involved prevent conducting probability sampling. Henry (1990, p.
32) for instance reported “only in the cases where probability samples cannot be used are
non probability samples viable”. In the same context, Saunders, Lewis and Thornhill (2007,
p. 226) stated that “within business research such as market surveys and case study research,
this may either not be possible (as you do not have a sampling frame) or appropriate to
answering your research question. This means your sample must be selected some other way.
Non-probability sampling (or non-random sampling) provides a range of alternative
techniques to select samples based on your subjective judgement”.
5.11.2 Sampling Procedure
For the non-probability sample, the procedure of convenience sampling is adopted to
generate the respondents for the survey. The respondents were customers of private and
public banks, and they were selected based on their availability as they went to the bank
Author Research main aim Sampling method
Alrasli, Mehtap-Smadi and
Katircioglu, (2005)
Alrasli, Katircioglu and
Mehtap-Smadi, (2005)
Caro (2008)
Kim and Jin (2002)
Elmayar (2007)
To measure service quality
perceptions of Greek Cypriot
bank customers.
To analyze and compare
service quality in commercial
banking sector in the Turkish
and Greek-speaking areas.
To develop comprehensive
model for measuring service
quality in travel industry.
To determine whether the
retail service quality scale
could be validated in a
discount retail setting in the
USA and Korea.
To measure service quality
levels in the Bank of
Commerce and Development
in Libya.
Non-probability
convenience sampling
Non-probability
convenience sampling
Non-probability
convenience sampling
Non-probability
convenience sampling
Non-probability
convenience sampling

148
branch for a particular product or service. Thus the survey was not based on a group of
respondents from a totally random selection as the primary basis was for a respondent to
have been going into one of the banks‟ branches. The reasons for adopting convenience
sampling are:
1. It is suitable to obtain a large number of completed questionnaires quickly and
economically.
2. It enables the researcher to access people who are most conveniently available in the
branches of the chosen banks. This facilitates the administration of the questionnaires
face-to-face, which is the only option in Libya (given the impossibibility of
conducting postal or internet questionnaires).
3. The sample selection process can be continued until the required sample size has been
reached (Saunders, Lewis, and Thornhill 2007).
4. This method of sampling can obtain a good response rate (Craig and Douglas, 2005).
Furthermore, the literature supports the adoption of this procedure within similar research
(see Table 5.9 above). Bryman and Bell (2007, p. 98) justifies the use of convenience
sampling procedures in the field of business and management by stating that: “it also perhaps
ought to be recognised that convenience sampling probably plays a more prominent role than
is sometimes supposed. Certainly, in the field of business and management, convenience
samples are very common and indeed are more prominent than samples based on probability
sampling”.
5.11.3 Determining the sample size
In general, it is advisable to use a fairly large sample in order to obtain results which are
representative of the population. In order to decide upon the appropriate sample size for this
research, the researcher reviewed some of the sample sizes used in similar research on
measuring banking service quality as a guide to an adequate research sample size. It was
noted for instance that Petridou, et al., (2007) distributed 350 questionnaires to the customers
of Greek banks, and they also distributed 200 questionnaires to the customers of Bulgarian
banks, making a total of a 550 questionnaires. Glaveli et al. (2006) have measured banking
service quality in the countries of Greece, Bulgaria, Serbia, Albania, and Macedonia. They
used sample sizes of 153, 70, 40, 40, and 37 questionnaires respectively, giving a total of a
340 questionnaires. Also Jabnoun and AlTamimi (2003) used a sample size of 800
questionnaires distributed to the customers of major local and foreign banks in the UAE.
Arasli, Katircioglu and Mehtap-Smadi (2005) distributed 138 questionnaires to the Turkish
speaking area and 130 to the Greek-speaking area of Cyprus. In the study of Arasli, Mehtap-
Smadi and Katircioglu (2005) a total of 260 retail bank customers were surveyed in Greek
Cypriot regions. Sureshchandar, Rajendran and Anantharman (2003) distributed their
149
questionnaires to the customers of Indian public, private and foreign banks using sample
sizes of 98, 86 and 93 respondents respectively, giving a total of 277. Jabnoun and Khalifa
(2005) used a sample size of 230 respondents. 115 questionnaires were distributed to the
Islamic banks‟ customers and 115 questionnaires were distributed to conventional banks‟
customers in the UAE. A large sample size was adopted by Spathis, Petridou and Glaveli,
(2004). Their sample consisted of 1260 individual customers of public and private banks in
urban and rural Greece. Al-Tamimi and Al-Amiri (2003) distributed 700 questionnaires to
two UAE Islamic banks.
The total sample sizes of these studies averages 520 with unequal distribution across the
countries in which they were used. In deciding on this research sample size the researcher
also considered the fact that “Minimum sample sizes for a quantitative consumer survey are
of the order of 300 to 500 respondents” (Crouch, 1984, p. 142). Furthermore, the following
two points were considered before deciding the sample size being used in this research study
(Nachmias and Nachmais, 1981):
The larger sample size is needed for the sample to be representative.
The sample size should meet the statistical requirements of a particular statistical
analysis that the researcher wishes to conduct.
In view of above arguments and after reviewing the literature, the researcher has considered
that to use a sample size of 1000 customers for each banking sector would be suitable and
appropriate for this type of research. Also, the sample method used in this research allows
the researcher to use his subjective judgment in terms of a sampling plan.
5.11.4 The sampling choice, location, and unit
The sample choice of this research is 1000 for Libyan private banking customers and 1000
for Libyan public banking customers as a targeted sample size. This sample size will
comprise two banks from the private sector and two banks from the public sector. Two
branches were selected from each bank, with care to include variation in geographic location
and size. These branches therefore, were selected in a number of cities within the East and
West of Libya.
The respondents surveyed (sampling unit) in this research are the customers of Libyan
private and public banking sectors and they are based on the following choice:
Customers of the private banking sector:
1. Bank of Commerce and Development
a. The main branch in the Benghazi city (the second largest city- East of Libya).
b. The branch of Tobruk city (one of the smallest cities- East of Libya).
150
2. Aman Bank for Commerce and Investment
a.The main branch in the Tripoli city (the first largest city- West of Libya).
b. The branch of Alzawia city (one of the smallest cities- West of Libya).
Customers of the public banking sector:
3. Gumhouria Bank
a.The main branch in the Benghazi city.
b. Branch of Tobruk city.
4. National Commercial Bank
a.The main branch in the Tripoli city.
b. The branch of Alzawia city.
The choice of these four banks is based on the following considerations:
1. The choice of the two largest banks from the private sector and the two largest
banks from the public sector is suitable for representing the private banking sector
and public banking sector, and thus the comparison between the sectors can be
made in terms of service quality levels.
2. The researcher selected these four large banks within the two sectors because of the
high level of resources that these banks should devote to address service quality
issues.
3. These four banks are well established in comparison with other banks, therefore it
is expected that their customers are aware about service quality issues which in
turn enable them to judge the actual levels of service quality.
4. The researcher selected banks‟ branches within large cities and also within small
cities in the East and West of Libya in order to support possible generalisation for
data collection process within the Libyan regions. This because these areas host
more than 80 percent of the Libyan population and also to get equal chance for
assessing service quality levels in branches located in large and small cities
equally.
Accordingly, personal contact was made to the manager of each bank, to talk about the
purpose of the research. A letter attached to the organisational consent form explaining the
nature and purpose of the research was given to the four banks managers to obtain
permission for the research to be undertaken. This letter was drafted explaining the nature
and objectives of the research and the advantages arising for the banks. This, in turn, resulted
in acceptances from the four banks, but based on two conditions- firstly, no information
relating to the lists of customers can be provided to the researcher, and secondly a report
must to be submitted to each bank as regards the findings of the study. The conditions were
agreed by the researcher. However, there is a statement issued by the Libyan government
saying that all organisations operating in Libya should assist students if their research is for
purely academic purposes; ultimately, this in fact helped the researcher to get the signed
consent forms back.

151
Figure 5.3 below illustrates a more detailed description of the sampling plan used in this
research, including the sampling method, procedure, size, location, as well as the number of
returned questionnaires and the timing of conducting the survey.

152
Figure 5.3 Sampling Plan
Absence of sampling frame
Limitation in the timing of conducting the survey
Sampling Method
Sampling Procedure
Sample Size
Sampling Location
Private Banking Sector Public Banking Sector
Bank B Bank A
Branch C Branch D Branch A Branch B
L. City S. City L. City S. City
East East West West
250
2 Weeks
95
250
2 Weeks
92
250
2 Weeks
84
250
2 Weeks
99
Bank C Bank D
Branch E Branch F Branch G Branch H
L. City
East
S. City
East
L. City
West
S. City
West
250
2 Weeks
81
250
2 Weeks
92
250
2 Weeks 89
250
2 Weeks
62
Total: 370 Usable Questionnaires/ Time: 4 Weeks
Non-Probability Sampling
Convenience Sampling
1000 customers from each banking sector
Total: 370 Usable Questionnaires
Time: 4 Weeks + 5 Days
More
5 Days
46 Quest-
ionnaires
153
5.12 Methods of Research Statistical Analysis
The researcher undertook all the data processing and analysis. The analysis of questionnaires
was carried out by using the statistical package SPSS 17.0 for windows. SPSS program
enables data from surveys and experiments to be analysed fully and flexibly (Garson, 2005).
According to Procter (1997, p. 197), “Statistical analysis is undertaken to identify patterns
that are not as easy to see in the data. This is often the case why very large amounts of data
need analysis”. Before using the SPSS program, each item or question was given a common
variable name to distinguish them; further, each item was coded for the purpose of entering
the data into the SPSS program. On the other hand, the researcher was also responsible for
the storage and backup of all electronic data.
The researcher‟s choice of data analysis was influenced by Petridou, et al. (2007); Glaveli et
al. (2006); and Kangis and Voukelatos‟s (1997) views on measuring and comparing service
quality levels in banks. In line with these views, the following statistical analysis methods
were employed:
1. Frequencies: to describe the respondents‟ characteristics.
2. Means: to identify the actual levels of the service quality provided to Libyan
private and public banks‟ customers as described by the scale items (questionnaire
statements).
3. Independent-Samples T-Test: to identify the significance of means‟ differences of
customers‟ perceptions between the private and public banking sectors as
measured by the thirty-one items included in the scale, and thus testing the seven
research hypotheses at a statistically significant level (p > 0.05).
4. Factor analysis: to identify the differences between the Libyan private and public
banks‟ customers in terms of the degree of importance attached to various
dimensions of service quality.
5. Cronbach‟s coefficient alpha test: to examine the scale reliability and internal
consistency.
6. Chi-Square: to test the relationship between the customers‟ demographic
characteristics and the type of banking sector.
5.12.1 What Independent Samples T-Test?
Independent Samples T-Test compares the difference in the means values of two samples or
groups using a measure of the spread of the scores. Saunders, Lewis and Thornhill (2007, p.
447), have noted that “If the likelihood of any differences between these two groups
occurring by chance alone is low, this will be represented by a large t statistic with a
probability less than 0.05. This is termed statistically significant”. It can therefore be argued
that independent samples t-test includes sampling from both populations and examining for
differences in their mean values (Robson, Pemberton and McGrane, 2008).

154
5.12.1.1 Why Independent Samples T-Test?
The main objective of this research study is to identify if there are significant differences
between private and public banking sectors in terms of perceived service quality levels.
Having established that the both samples (private banks‟ customers and public banks‟
customers) exist independently of each other, a comparison between them can be made using
independent samples t-test measure which tests the mean (the mean scores of customer
perceptions of service quality) differences between the two samples and thus research
hypotheses can be tested. In this regard, Robson, Pemberton and McGrane (2008), concluded
that if sig (2 tailed) value ≥ 0.05, the researcher rejects the alternative hypothesis, while if sig
(2 tailed) value < 0.05 the researcher accepts it.
The researcher considered the use of the Independent Samples T-Test as the best technique
to address the research aim and answer the research question. In addition, he noted that
despite the fact there are alternative techniques, such as the ANOVA test, which can identify
the variance in the mean scores for independent samples, this technique could not be applied
in this instance since the ANOVA test is used to compare three or more independent samples
(Robson, Pemberton and McGrane, 2008 and Saunders, Lewis and Thornhill, 2007), whereas
this research involves only two independent samples. These are private banks‟ customers and
public banks‟ customers, it can, therefore, be argued that the Independent Samples T-Test
can be utilised to compare the two groups of banks in terms of customer perceptions of
service quality. In addition, the literature clearly suggests the use of such a technique in
similar comparative studies (comparison of two independent samples). For instance, Kangis
and Voukelatos (1997) compared the private banking sector with the public banking sector in
Greece, in terms of customer expectations and perceptions. Petridou, et al. (2007) compared
Greek and Bulgarian banks with respect to service quality levels, both studies used the
Independent Samples T-Test in order to identify the variance in the mean scores between the
two samples.
5.12.2 What is factor analysis?
Factor analysis is a statistical technique attempting to identify underlying factors, or
dimensions, that explain the correlations within the variables (item statements) that have
been used, and further, describe what the factors represent conceptually. The theoretical
basis for factor analysis is that variables are correlated because they share one or more
common components. That is, correlations among variables are explained by underlying
factors (Garson, 2005; Field, 2009). In other words, it could be utilised for examining the
relationships or interrelationships among variables (Coakes and Steed, 2001). Furthermore, it
is also used for the purpose of developing and evaluating of scales (Pallant, 2007; Field,
2009).
155
There are two techniques of factor analysis noted by Kinnear and Gray (2010). The first
technique is exploratory factor analysis, while the second is confirmatory factor analysis.
Within employing exploratory factor analysis, the underlying structure of a relatively large
set of variables will be uncovered and identified. The researcher's a priori assumption is that
any indicator may be associated with any factor. There is no prior theory and one uses factor
loadings to intuit the factor structure of the data. Exploratory factor analysis is the most
commonly used form of factor analysis (Garson, 2005).
In the confirmatory factor analysis, the researcher predicts the number of factors with
specific loading (Kinnear and Gray 2010). When adopting confirmatory factor analysis, it
can be determined if the number of factors and loadings of studied variables conform to what
is expected on the basis of pre-established theory. Studied variables are chosen based on a
prior theory and factor analysis is adopted to examine if they load in line with the expected
number of factors. The researcher's a priori expectation is that each factor is associated with
a specified subset of indicator variables. A minimum requirement of confirmatory factor
analysis is that one hypothesises beforehand the number of factors in the model, and usually
also forms expectations about which variables will load on which factors (Garson, 2005).
Principal component analysis (PCA) is the most common technique of exploratory factor
analysis, and this seeks a linear combination of variables such that the maximum variance is
extracted from the variables (Garson, 2005; Kinnear and Gray, 2010; Cooper and Schindler,
2008). Principal component analysis then removes this variance and moves to the second
linear combination, which explains the maximum proportion of the remaining variance, and
so on (Tabachnick and Fidell, 2007). By doing so, consecutive factors are extracted. Because
each consecutive factor is defined to maximise the variability that is not captured by the
preceding factor, consecutive factors are independent of each other; this is the principal axis
method and results in orthogonal (unrelated and uncorrelated) factors (Garson, 2005).
Factor loadings are an important considerion when performing factor analysis. They are the
correlation of the variables with the factor, and when the loading is clear, the interpretation
of the factors becomes easier (Zikmund et al., 2010). The other point which should be
known is factor rotation which is the method leading to the interpretation of factors by
illustrating the variables that group together (Pallant, 2007).
However, before performing factor analysis, the suitability of data must be tested. This can
be done by running two measures; Kaiser-Meyer-Olkin (KMO) measure, testing the sample
adequacy, and Bartlett‟s measure testing the sampling sphericity (Pallant, 2007).
156
5.12.2.1 Why exploratory factor analysis?
Exploratory factor analysis in the form of Principal Component Analysis is used in this
research to arrive at the examination of the suitability and validity of dimensions and items
of the BSQ scale for the effective measurement of service quality within the Libyan banking
context, in order to obtain clear structure of these scale dimensions and items. Furthermore,
Principal Component Analysis is also used to identify the maximum variance extracted from
the variables and thus the most important factors based on the total variance can be identified
(Garson, 2005).
5.12.3 What is Cronbach‟s coefficient alpha test?
Cronbach's Alpha coefficient of reliability (or consistency) is a measure of squared
correlation between observed scores and true scores. Zikmund and Babin (2010b, p. 334)
noted that “reliability is an indicator of a measure‟s internal consistency”. Reliability is thus
measured in terms of the ratio of true score variance to observed score variance (Garson,
2005). Garson also adds that the more consistent within-subject responses are, and the
greater the variability between subjects in the sample, the higher Cronbach's alpha will be;
also, the alpha will be higher when there is homogeneity of variances among items than
when there is not.
Hair et al. (1998) noted that when the alpha score is higher, the reliability of the test will be
greater. There isn't a generally agreed cut-off, but researchers see that commonly 0.70 and
above is acceptable (Nunally, 1978). Garson (2005) argues that within social sciences, the
more acceptable alpha score is 0.70 or higher for a set of items to be considered a scale,
while others are as lenient as 0.60. According to Asubonteng, McClearry and Swan (1996),
high reliabilities are desirable such as 0.90 or above, whilst reliabilities below 0.60 may
demand additional research in order to develop a revised instrument with greater reliability.
An internal consistency measure is the average of inter-item correlation. According to Yu
(2005), Cronbach's alpha measures how well a set of items measures a single unidimensional
latent construct. When data have a multidimensional structure, Cronbach's alpha will usually
be low. Additionally, if the average of inter-item correlation is low, alpha will be low; if the
inter-item correlations are high, then there is evidence that the items are measuring the same
underlying construct (Yu, 2005). As the average inter-item correlation increases, Cronbach's
alpha increases as well. Thus, the expression "high" or "good" reliability means that items
measure well a single unidimensional latent construct. If one has multi-dimensional data,
overall Cronbach's alpha will generally be low for all items. In this case, the researcher ran a
factor analysis to see which items loaded highest on which dimensions, and then took the
alpha of each subset of items separately (Yu, 2005).

157
5.12.3.1 Why Cronbach‟s coefficient alpha test?
By running Cronbach‟s coefficient alpha test, the researcher attempted to further test for the
scale construct after conducting factor analysis. The goal was to obtain a concise scale whose
items would be meaningful to private and public banks in Libya. 0.7 will be used as the
minimal accepted level. This is fact accepted by the literature, as many studies used
reliability to test the service quality scales with levels ranged from 0.6 to 0.96 (Jabnoun and
Khalifa, 2005; Caro and Garcia, 2007; Akbaba, 2006; Chowdhary and Prakash, 2007).
5.12.4 What is Chi-Square?
Chi-Square is the statistical instrument or test that helps to identify the significance of any
association between two categorical variables (Robson, Pemberton and McGrane, 2008). In
other words, it is the test of relationship between variables. The statistical significance of
association refers to the chance of assuming that there is a relationship when in actual fact
there is none. According to Robson, Pemberton and McGrane (2008, p. 170), “the usual level
of significance for a business application is either the 1% or 5% significance level. The 1%
or 5% level measures the probability of a Type I error”. It was also noted that if the
probability of the test statistic is very low (usually p= 0.05 or lower), then the statistically
significant relationship will be identfied (Saunders, Lewis and Thornhill, 2007).
There are different types of Chi-Square tests such as Pearson‟s Chi-Square, Likelihood ration
Chi-square, Chi-square goodness-of-fit test, and Mantel-Haenszel‟s Chi-square. Pearson‟s
Chi-square is the most commonly used and it was utilised in this research study.
5.12.4.1 Why Pearson‟s chi-square?
Pearson‟s Chi-Square test calculates the probability of association between two variables. In
other words, it examines whether or not this association is statistically significant. This
research requires the test for association (relationship), in order to test the degree of
independence or possible relationships between participants‟ demographic variables of age,
gender, occupation, number of branch visits and period of dealing with bank and bank status.
Therefore, Chi-square was seen as the most suitable statistical test to examine these
relationships.
5.13 Sources of Research Data: Primary and Secondary Sources
There are two generic classifications of research data sources. These are primary research
and secondary research. Primary research is concerned with the collection of non-published
data, while secondary research is concerned with researching the existing information
(literature) available (Saunders, Lewis and Thornhill, 2007). The data in this research study
158
comes from both primary and secondary sources. The primary data came from responses
from questionnaires administered to non- probability sample size of 2000 banks‟ customers
within the eight selected banks‟ branches from private and public banking sectors in Libya.
The secondary data source is from academic articles, various printed and electronic journals,
books, research theses and referable working papers on the topic of service quality including
its measurement within the banking sector.
5.14 Ethical Issues and Approaches
In considering the nature of this research study and its involvement with human participants
(banks‟ customers), ethical issues were an important considerion and thus were viewed as
fundamental to the successful completion of this study (Wisker, 2008). Cooper and Schindler
(2008, p. 34) mentioned that “ethics are norms or standard of behaviour that guide moral
choices about our behaviour and our relationship with others”. The researcher set out to
identify and address potential or actual ethical issues as they arose. The first step was to
practically observe possible ethical matters that may arise through the data collection process
as a result of the culture of the country in which the research was conducted. Furthermore,
the researcher paid close attention to ensure that nobody is harmed as a result of the research
(Cooper and Schindler, 2008). Hence, ethical guidelines evidently protect participants from
harm when answering interview questions or any other method (de Leeuw, Hox and
Dillman, 2008). The researcher should consider two points when conducting survey
research; informed consent and protection of confidentiality (de Leeuw, Hox and Dillman,
2008; Czaja and Blair, 2005). de Leeuw, Hox and Dillman (2008) go a step further to
explain how these two points can be assured:
Informed consent: Within informed consent, the researcher should provide all
information to participants about the potential harm that may occur, and the
researcher also should ensure that the participants understand the information very
well. Moreover, the researcher should not influence the participants in anyway, and
there should be evidence of their agreement to participate in the research.
Confidentiality protection: Breaching confidentiality is the biggest risk to
respondents. This could lead to loss of employment, criminal prosecution or
embarrassment. Confidentiality can be breached by for instance, forgetting to
remove a participant‟s personal details such as name, telephone number and address.
The factor might breach confidentiality is that the information is not stored rightly.
This could enable unauthorised person to obtain access to this information.
In this study, the researcher kept the above points in mind and he also followed the ethical
guidelines provided by Northumbria University. Accordingly, an agreement was reached
159
between the selected banks‟ managements and the researcher on completing the
questionnaires by customers in selected banks‟ branches, and according to this agreement,
organisation consent forms have been signed by concerned banks‟ managers. With regard to
customers‟ participation, participants in the pilot study were aware of the purpose and the
objectives of the research via Informed Consent Forms. Additionally, participants in the real
study were also informed about the purpose and the objectives of the research via the front
page (introductory letter) attached to the questionnaire. Moreover, the confidentiality was
maintained as the participants in both the pilot study and real study were informed not to
supply their names or any information that could identify them. In addition, the respondents
were not asked any personal questions; therefore, in this survey there was no potential for
any respondent to come to harm. The respondents were also aware that their participation in
the research was entirely voluntary.
However, the data collection process was successfully completed without any ethical
concerns capable of invalidating the data collection.
5.15 Chapter Summary
This chapter reviewed some of the philosophical (theoretical) views held by a number of
researchers. Furthermore, this chapter reviewed the interpretation given to positivism by
certain researchers such as August Comte. It concludes therefore that eventhough positivism
is a logical research process, it can be considered as part of a flexible approach to the
research (Crotty, 1998).
This chapter also provided a conclusive justification for the adoption of quantitative method
through a research survey. Moreover, it highlighted the benefits of using the survey strategy
as a method of data collection which was deemed the most suitable method for collecting the
present research data.
It should be emphasised once more that the research instrument used in the present study is
intended to measure service quality perceptions in Libyan private and public banking sectors
from customers‟ perspectives. The format and the structure of the instrument used is based
on the work of Bahia and Nantel (2000), and consists of 31 items distributed across six
service quality dimensions which are effectiveness and assurance, access, price, tangibles,
service portfolio and reliability.
Through adoption of quantitative research methods, the sample for the customers‟ survey
research was drawn by convenience non-random selection, and the data was collected from
customers of the selected eight branches distributed between four banks, two from the
private sector and two from the public sector. The data was collected through face to face
contact. Methods of research statistical analysis were also presented and discussed.

160
It can therefore be concluded that there is a need for this research to progress with this
research data analysis, findings and conclusions. This indeed will confirm if the above
methods will provide valid research outcomes through answering research question,
addressing research objectives and testing research hypotheses.
The next chapter will consider research data analysis and will also discuss the research
outcomes and findings, which will help to answer the research question and address the
research objectives.

161
Chapter Six
Data Analysis and Findings

162
Chapter 6: Data Analysis and Findings
6.0 Introduction
The service quality level in the Libyan private and public banking sectors was measured by
using BSQ scale. The scale was modified and adopted for this study (see Chapter Five). A
Seven-Point Likert Scale was used to measure customer perceptions of service quality, while
the nominal part of the questionnaire was used to reflect on participants‟ demographic
characteristics.
The chapter therefore provides information on the research data analysis outcomes (findings)
and discusses the statistical analysis of the customers‟ perceptions of service quality through
a comparison between the Libyan private and public banks. The chapter also focuses on
discussing the outcomes from data analysis.
This chapter therefore begins with highlighting the chapter aims and objectives. The second
section will present the research question, while the third section will shed light on the
research hypotheses. The research settings and questionnaire administration will be
highlighted in section four. Section five will provide the descriptive statistics of the study
sample. The sixth section includes the descriptive analysis of service quality. The seventh
section will involve testing the research hypotheses.
In section eight, the BSQ dimensions were subjected to factor analysis in order to identify
the differences between the Libyan private and public banking sectors in terms of the degree
of importance attached to various dimensions of service quality. The ninth section includes
testing the relationship between the demographic characteristics of banks‟ customers and the
bank status. The discussion on the study statistical tests‟ results will be also provided in this
chapter. Finally, the summary of the research outcomes will be presented.
6.1 Chapter Aims and Objectives
To present descriptive analysis of customers‟ perceptions of service quality levels in the
Libyan private and public banking sectors.
To present outcomes of the statistical test aimed at comparing the Libyan private and public
banks in terms of customers‟ perceptions of service quality.
To empirically establish and present the BSQ dimensions and test its validity, reliability and
suitability for the effective measurement of service quality levels within Libyan private and
public banking sectors.
To establish the degree of importance attached to various dimensions of service quality by
customers of Libya‟s private and public banks.
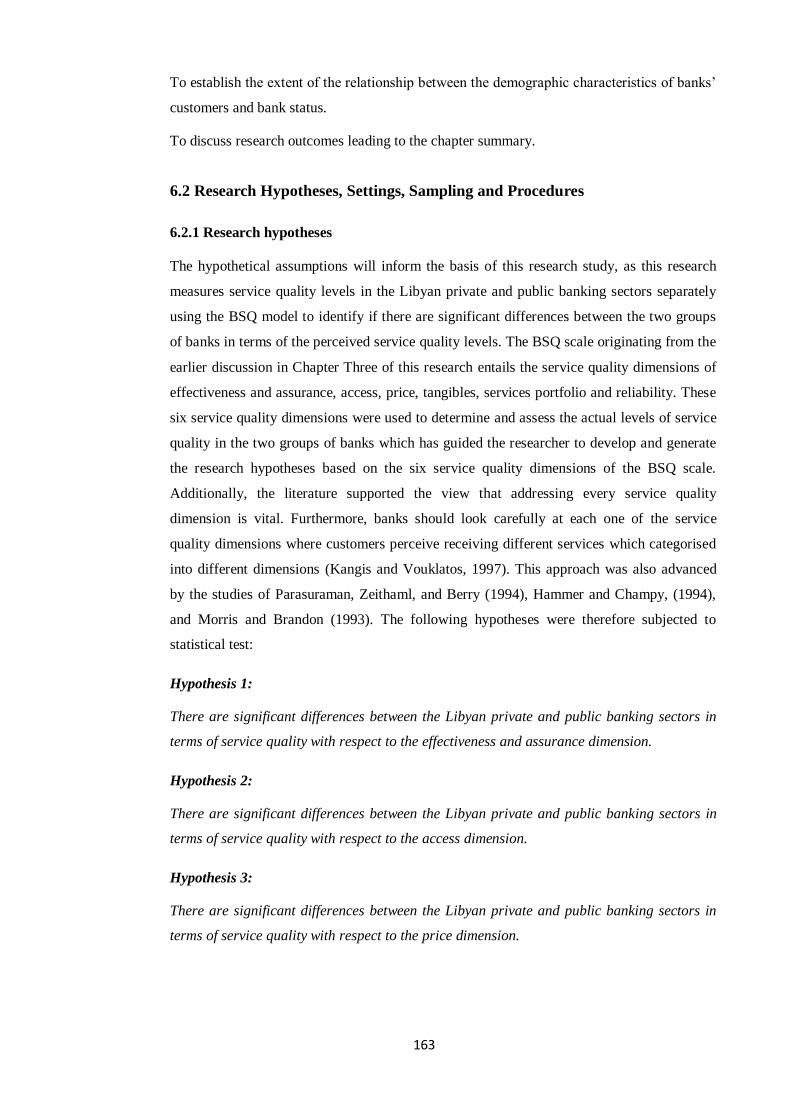
163
To establish the extent of the relationship between the demographic characteristics of banks‟
customers and bank status.
To discuss research outcomes leading to the chapter summary.
6.2 Research Hypotheses, Settings, Sampling and Procedures
6.2.1 Research hypotheses
The hypothetical assumptions will inform the basis of this research study, as this research
measures service quality levels in the Libyan private and public banking sectors separately
using the BSQ model to identify if there are significant differences between the two groups
of banks in terms of the perceived service quality levels. The BSQ scale originating from the
earlier discussion in Chapter Three of this research entails the service quality dimensions of
effectiveness and assurance, access, price, tangibles, services portfolio and reliability. These
six service quality dimensions were used to determine and assess the actual levels of service
quality in the two groups of banks which has guided the researcher to develop and generate
the research hypotheses based on the six service quality dimensions of the BSQ scale.
Additionally, the literature supported the view that addressing every service quality
dimension is vital. Furthermore, banks should look carefully at each one of the service
quality dimensions where customers perceive receiving different services which categorised
into different dimensions (Kangis and Vouklatos, 1997). This approach was also advanced
by the studies of Parasuraman, Zeithaml, and Berry (1994), Hammer and Champy, (1994),
and Morris and Brandon (1993). The following hypotheses were therefore subjected to
statistical test:
Hypothesis 1:
There are significant differences between the Libyan private and public banking sectors in
terms of service quality with respect to the effectiveness and assurance dimension.
Hypothesis 2:
There are significant differences between the Libyan private and public banking sectors in
terms of service quality with respect to the access dimension.
Hypothesis 3:
There are significant differences between the Libyan private and public banking sectors in
terms of service quality with respect to the price dimension.
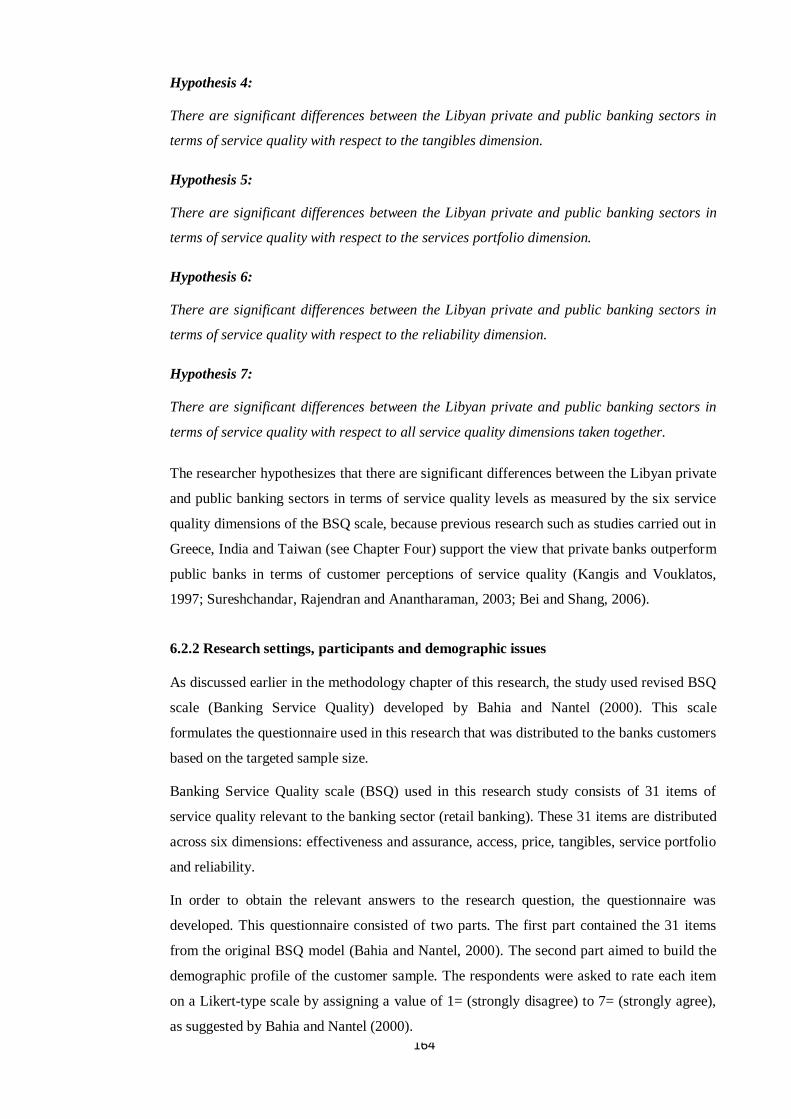
164
Hypothesis 4:
There are significant differences between the Libyan private and public banking sectors in
terms of service quality with respect to the tangibles dimension.
Hypothesis 5:
There are significant differences between the Libyan private and public banking sectors in
terms of service quality with respect to the services portfolio dimension.
Hypothesis 6:
There are significant differences between the Libyan private and public banking sectors in
terms of service quality with respect to the reliability dimension.
Hypothesis 7:
There are significant differences between the Libyan private and public banking sectors in
terms of service quality with respect to all service quality dimensions taken together.
The researcher hypothesizes that there are significant differences between the Libyan private
and public banking sectors in terms of service quality levels as measured by the six service
quality dimensions of the BSQ scale, because previous research such as studies carried out in
Greece, India and Taiwan (see Chapter Four) support the view that private banks outperform
public banks in terms of customer perceptions of service quality (Kangis and Vouklatos,
1997; Sureshchandar, Rajendran and Anantharaman, 2003; Bei and Shang, 2006).
6.2.2 Research settings, participants and demographic issues
As discussed earlier in the methodology chapter of this research, the study used revised BSQ
scale (Banking Service Quality) developed by Bahia and Nantel (2000). This scale
formulates the questionnaire used in this research that was distributed to the banks customers
based on the targeted sample size.
Banking Service Quality scale (BSQ) used in this research study consists of 31 items of
service quality relevant to the banking sector (retail banking). These 31 items are distributed
across six dimensions: effectiveness and assurance, access, price, tangibles, service portfolio
and reliability.
In order to obtain the relevant answers to the research question, the questionnaire was
developed. This questionnaire consisted of two parts. The first part contained the 31 items
from the original BSQ model (Bahia and Nantel, 2000). The second part aimed to build the
demographic profile of the customer sample. The respondents were asked to rate each item
on a Likert-type scale by assigning a value of 1= (strongly disagree) to 7= (strongly agree),
as suggested by Bahia and Nantel (2000).
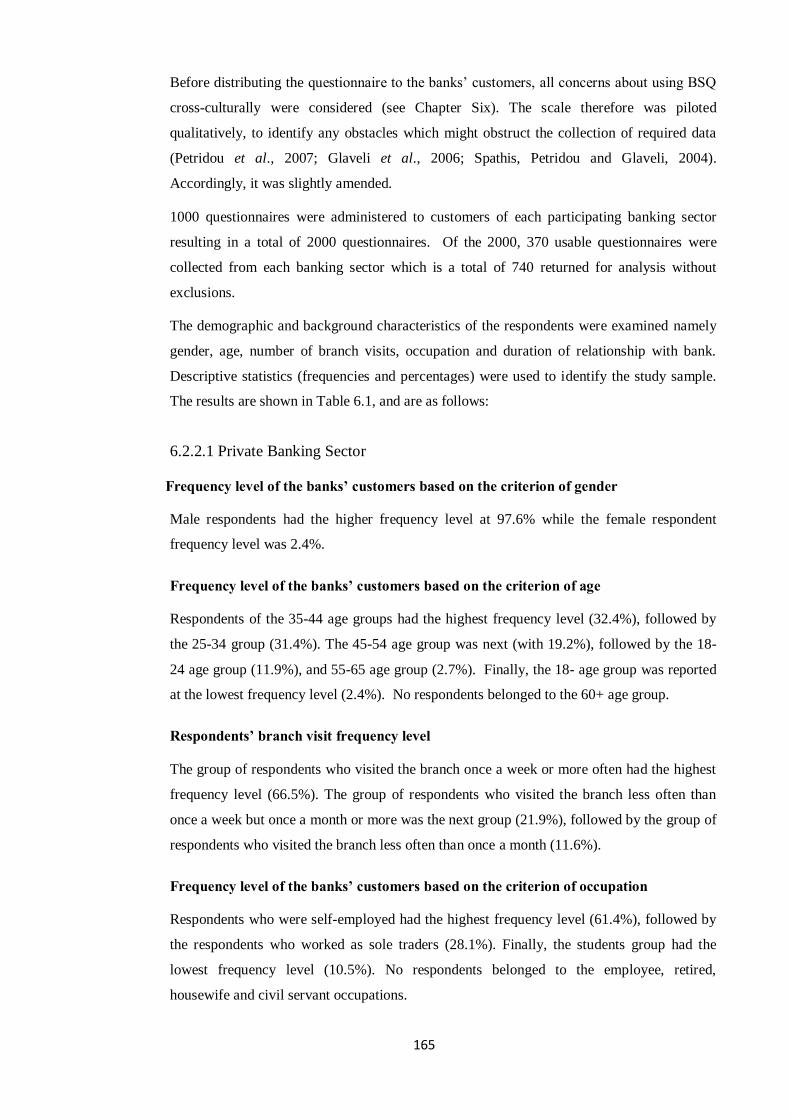
165
Before distributing the questionnaire to the banks‟ customers, all concerns about using BSQ
cross-culturally were considered (see Chapter Six). The scale therefore was piloted
qualitatively, to identify any obstacles which might obstruct the collection of required data
(Petridou et al., 2007; Glaveli et al., 2006; Spathis, Petridou and Glaveli, 2004).
Accordingly, it was slightly amended.
1000 questionnaires were administered to customers of each participating banking sector
resulting in a total of 2000 questionnaires. Of the 2000, 370 usable questionnaires were
collected from each banking sector which is a total of 740 returned for analysis without
exclusions.
The demographic and background characteristics of the respondents were examined namely
gender, age, number of branch visits, occupation and duration of relationship with bank.
Descriptive statistics (frequencies and percentages) were used to identify the study sample.
The results are shown in Table 6.1, and are as follows:
6.2.2.1 Private Banking Sector
Frequency level of the banks‟ customers based on the criterion of gender
Male respondents had the higher frequency level at 97.6% while the female respondent
frequency level was 2.4%.
Frequency level of the banks‟ customers based on the criterion of age
Respondents of the 35-44 age groups had the highest frequency level (32.4%), followed by
the 25-34 group (31.4%). The 45-54 age group was next (with 19.2%), followed by the 18-
24 age group (11.9%), and 55-65 age group (2.7%). Finally, the 18- age group was reported
at the lowest frequency level (2.4%). No respondents belonged to the 60+ age group.
Respondents‟ branch visit frequency level
The group of respondents who visited the branch once a week or more often had the highest
frequency level (66.5%). The group of respondents who visited the branch less often than
once a week but once a month or more was the next group (21.9%), followed by the group of
respondents who visited the branch less often than once a month (11.6%).
Frequency level of the banks‟ customers based on the criterion of occupation
Respondents who were self-employed had the highest frequency level (61.4%), followed by
the respondents who worked as sole traders (28.1%). Finally, the students group had the
lowest frequency level (10.5%). No respondents belonged to the employee, retired,
housewife and civil servant occupations.

166
Frequency level of the banks‟ customers based on the criterion of duration of
relationship with bank
Respondents who had been dealing with the bank for more than five years had the highest
frequency level (75.4%). This was followed by the respondents who had been dealing with
bank for three-five years (18.9%). Respondents who have had a relationship with the bank
for two years were next (4.3%), followed by respondents dealing with the bank for one year
(1.4%). No respondents belonged to the group where the duration of time of dealing with
bank was six months and three months.
6.2.2.2 Public banking sector
Frequency level of the banks‟ customers based on the criterion of gender
Male respondents had the higher frequency level at 99.2% while female respondent
frequency level was 0.8%.
Frequency level of the banks‟ customers based on the criterion of age
Respondents of the 45-54 age group had the highest frequency level (46.5%), followed by
the 35-44 group (33.8%). The 25-34 age group was next (12.7%), followed by the 55-65 age
group (7%). No respondents belonged to the 18-, 18-24, 65+ age groups.
Respondents‟ branch visit frequency level
The group of respondents who visited the branch less often than once a week but once a
month or more had the highest frequency level (73.5%). The group of respondents who
visited the branch less often than once a month was the next group (26.5%). No respondents
belonged to the group who visited the branch once a week or more often.
Frequency level of the banks‟ customers based on the criterion of occupation
Respondents currently in employment had the highest frequency level (97.3%), followed by
the retired respondents (1.4%). Finally, „other‟ occupation had the lowest frequency level
(.3%). No respondents belonged to the self-employed, student, housewife and civil servant
occupations.
Frequency level of the banks‟ customers based on the criterion of duration of
relationship with bank
Respondents who dealt with the bank for more than five years had the highest frequency
level (60%). The respondents who dealt with bank for three-five years and two years ranked
the same level at (20%). No respondents belonged to the duration of one year, six months
and three months as a time of dealing with bank.
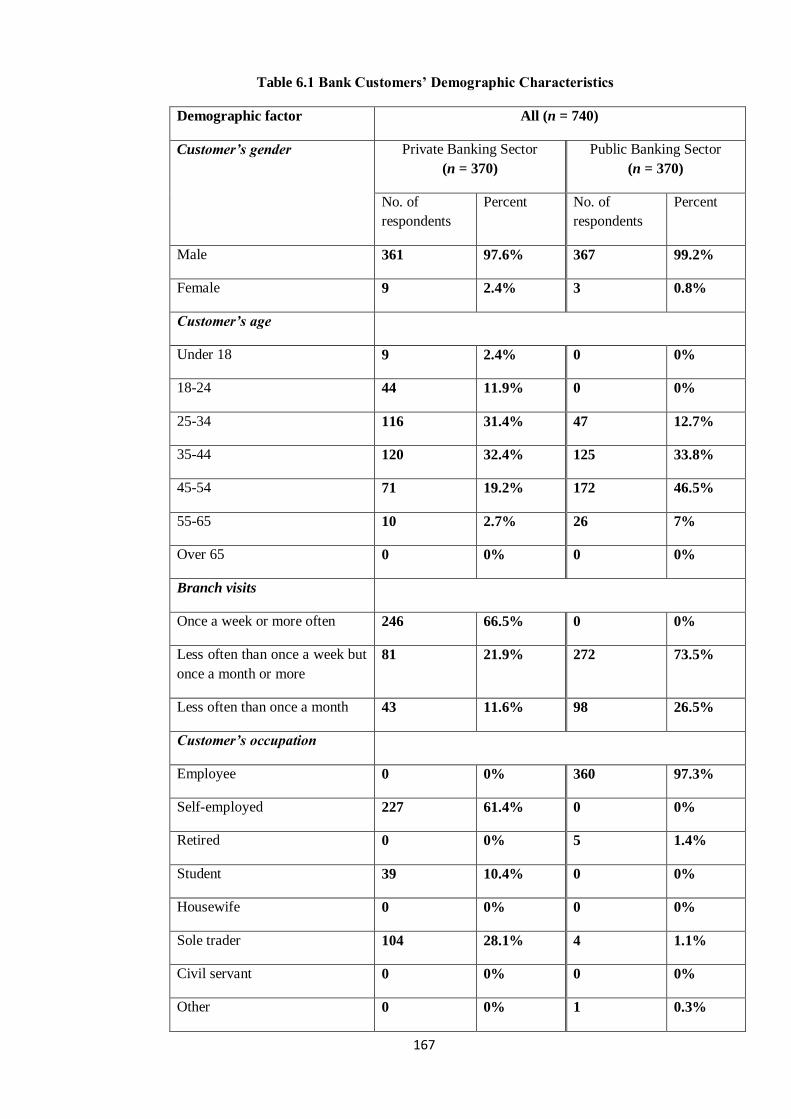
167
Table 6.1 Bank Customers‟ Demographic Characteristics
Demographic factor All (n = 740)
Customer’s gender Private Banking Sector
(n = 370)
Public Banking Sector
(n = 370)
No. of
respondents
Percent No. of
respondents
Percent
Male 361 97.6% 367 99.2%
Female 9 2.4% 3 0.8%
Customer’s age
Under 18 9 2.4% 0 0%
18-24 44 11.9% 0 0%
25-34 116 31.4% 47 12.7%
35-44 120 32.4% 125 33.8%
45-54 71 19.2% 172 46.5%
55-65 10 2.7% 26 7%
Over 65 0 0% 0 0%
Branch visits
Once a week or more often 246 66.5% 0 0%
Less often than once a week but
once a month or more
81 21.9% 272 73.5%
Less often than once a month 43 11.6% 98 26.5%
Customer’s occupation
Employee 0 0% 360 97.3%
Self-employed 227 61.4% 0 0%
Retired 0 0% 5 1.4%
Student 39 10.4% 0 0%
Housewife 0 0% 0 0%
Sole trader 104 28.1% 4 1.1%
Civil servant 0 0% 0 0%
Other 0 0% 1 0.3%

168
Duration of relationship with
bank
More than 5 years 279 75.4% 222 60%
3-5 years 70 18.9% 74 20%
2 years 16 4.3% 74 20%
1 year 5 1.4% 0 0%
6 months 0 0% 0 0%
3 months 0 0% 0 0%
Demographic characteristics are an accepted basis for segmenting markets (Blech and Blech,
1993), although literature has also suggested that gender is a vital factor that could affect the
perceptions of service quality (Webster, 1989; Stafford, 1996). It was also noted within the
research, that there are differences between men and women in terms of the degree of
importance attached to service quality (Stafford, 1996). These differences may be due to the
differential treatment of men and women in commercial exchange (Gutek, 1995), or the
distinctive patterns of behaviour and personality associated with gender (Hofstede, 1991).
However, biological and physical differences, gender identity (“feminine” and “masculine”
traits) and attitudes of gender, all have potential influence on human behaviour and
perceptions (Fischer and Arnold, 1994).
In the current study, the data was collected from both men and women. It can be seen from
Table 6.1 that women accounted for only 2.4% of the final sample of private banks‟
respondents, and for 0.8% of the final sample of public banks‟ respondents; therefore,
because of the existing culture female participation in the research was minimal. Libyan
women tend to visit the bank only when there is an urgent need; otherwise they ask their
brother, father or husband to visit the bank instead, therefore, their presence in the bank is
limited. With regards to surveying women in Libya, it can also be observed that women are
unlikely to talk to strangers; this behaviour is in fact common in the majority of Middle
Eastern countries because of cultural influences (Kumar, 2000).
With regard to the customer‟s occupation, it is evident that public banks in Libya should pay
attention to employees, as these currently constitute over 97% of the total number of
customers surveyed. While, in private banks, attention should be paid to people who are self-
employed as these account for 61.4% of the total number of customers surveyed. The
outcome will help the management of Libyan private and public banks when developing
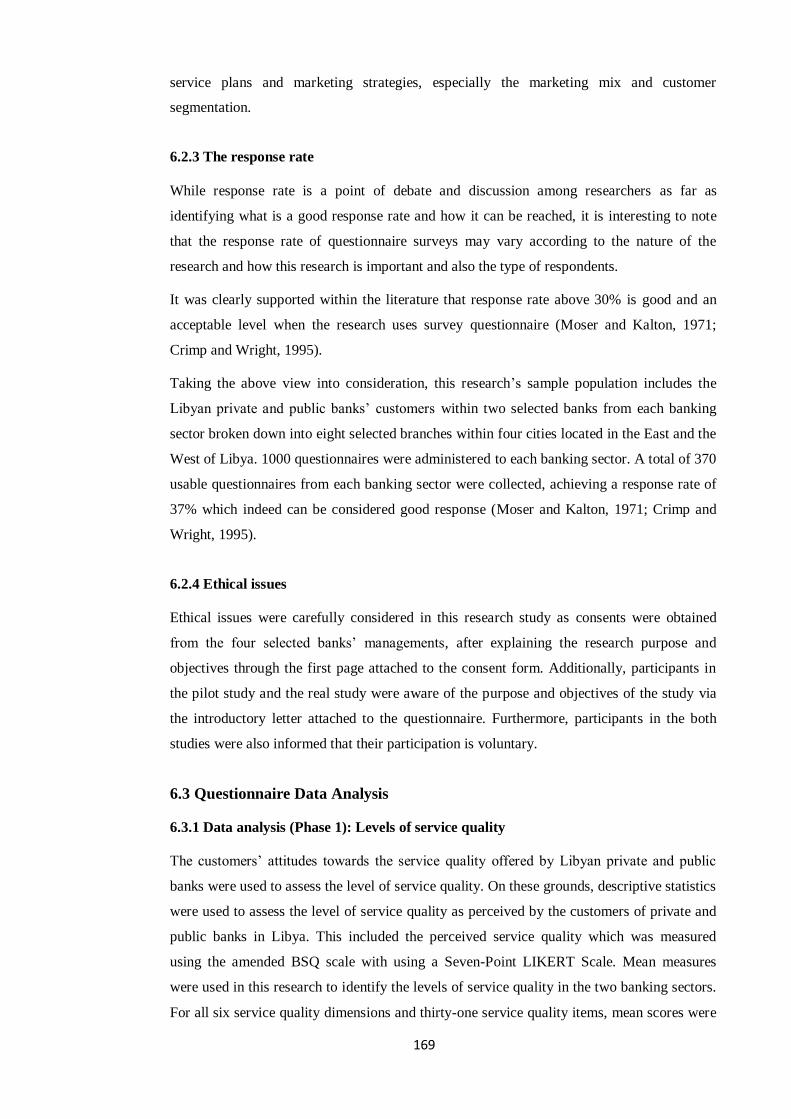
169
service plans and marketing strategies, especially the marketing mix and customer
segmentation.
6.2.3 The response rate
While response rate is a point of debate and discussion among researchers as far as
identifying what is a good response rate and how it can be reached, it is interesting to note
that the response rate of questionnaire surveys may vary according to the nature of the
research and how this research is important and also the type of respondents.
It was clearly supported within the literature that response rate above 30% is good and an
acceptable level when the research uses survey questionnaire (Moser and Kalton, 1971;
Crimp and Wright, 1995).
Taking the above view into consideration, this research‟s sample population includes the
Libyan private and public banks‟ customers within two selected banks from each banking
sector broken down into eight selected branches within four cities located in the East and the
West of Libya. 1000 questionnaires were administered to each banking sector. A total of 370
usable questionnaires from each banking sector were collected, achieving a response rate of
37% which indeed can be considered good response (Moser and Kalton, 1971; Crimp and
Wright, 1995).
6.2.4 Ethical issues
Ethical issues were carefully considered in this research study as consents were obtained
from the four selected banks‟ managements, after explaining the research purpose and
objectives through the first page attached to the consent form. Additionally, participants in
the pilot study and the real study were aware of the purpose and objectives of the study via
the introductory letter attached to the questionnaire. Furthermore, participants in the both
studies were also informed that their participation is voluntary.
6.3 Questionnaire Data Analysis
6.3.1 Data analysis (Phase 1): Levels of service quality
The customers‟ attitudes towards the service quality offered by Libyan private and public
banks were used to assess the level of service quality. On these grounds, descriptive statistics
were used to assess the level of service quality as perceived by the customers of private and
public banks in Libya. This included the perceived service quality which was measured
using the amended BSQ scale with using a Seven-Point LIKERT Scale. Mean measures
were used in this research to identify the levels of service quality in the two banking sectors.
For all six service quality dimensions and thirty-one service quality items, mean scores were

170
calculated for customers‟ perceptions of private and public banking sectors (these are
presented in Tables 6.2 to 6.7 below.
6.3.1.1 Effectiveness and assurance dimension
The effectiveness and assurance dimension emerge from the degree of importance of the
following items (see Table 6.2):
Table 6.2 Mean Effectiveness and Assurance Scores for Customers‟ Perceptions
Dimension Private Banking Sector
(n = 370)
Public Banking Sector
(n = 370)
Effectiveness and Assurance Customers‟ perceptions Customers‟ perceptions
Confidence 5.2000 2.8459
Recognition of a regular client 5.2649 2.8027
Confidentiality 5.4838 4.0324
Valorisation of the client by personnel 4.9405 2.5946
Interruption of the service 5.1000 1.5919
Well-trained personnel 5.8000 2.5324
Knowledge of the client on a personnel
basis
5.7622 1.8784
No contradictions in decisions between
personnel and management
5.1946 2.9432
Delivering when promised 5.2405 1.7324
Good reputation 5.4486 1.7349
Feeling of security 5.3757 3.1676
No delays due to bureaucratic factors and
procedures
5.5270 1.8541
Indications (communication) of quality 5.6486 1.8054
Mean Scores 5.3835 2.4243
In general the mean score of perceptions of the effectiveness and assurance dimension for
customers of the private banking sector is 5.3835 out of seven (high customer perceptions),
and for customers of the public banking sector is 2.4243 out of seven (low customer
perceptions). This clearly shows that the perceived level of service quality provided to

171
customers (with regard to effectiveness and assurance dimension) in the private banking
sector is high and the perceived level of service quality provided to customers with regard to
the same dimension in the public banking sector is low, which indicates that private banking
sector outperforms public banking sector in terms of effectiveness and assurance dimension.
6.3.1.2 Access dimension
Access is measured according to the significance of the following items (see Table 6.3):
Table 6.3 Mean Access Scores for Customers‟ Perceptions
Dimension Private Banking Sector
(n = 370)
Public Banking Sector
(n = 370)
Access Customers‟ perceptions Customers‟ perceptions
Sufficient number of ATMs per branch 6.2595 1.8703
Modern equipment 6.0595 1.5108
Sufficient number of open tellers 5.7216 1.5127
Waiting is not too long 5.9514 1.4892
Queues that move rapidly 6.0703 1.4135
Mean Scores 6.0124 1.5593
The mean score of perceptions of the access dimension for customers of the private banking
sector is 6.0124 (high customer perceptions), and for customers of the public banking sector
is 1.5593 (low customer perceptions). This clearly shows that the perceived level of service
quality provided to customers (with regard to access dimension) in the private banking sector
is high and the perceived level of service quality provided to customers with regard to the
same dimension in the public banking sector is low, which proves that the private banking
sector outperforms public banking sector in terms of access dimension.
6.3.1.3 Price dimension
Price dimension is measured by taking into consideration the degree of importance of the
following items (see Table 6.4):
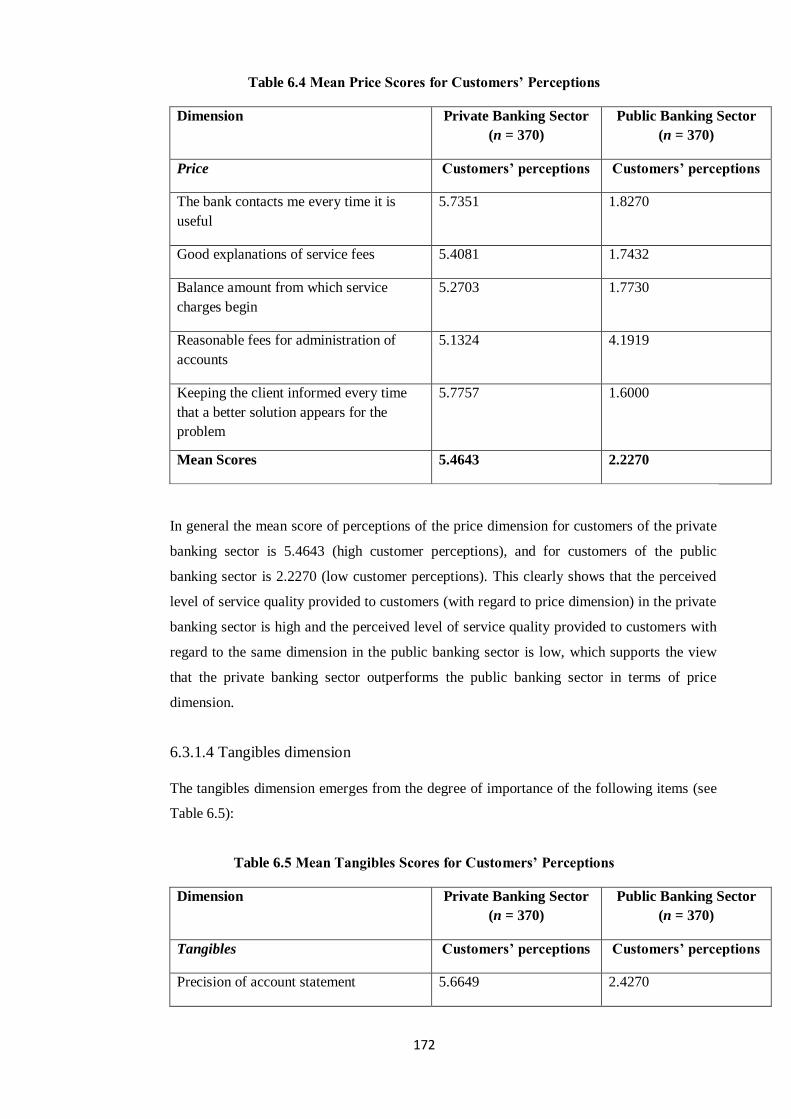
172
Table 6.4 Mean Price Scores for Customers‟ Perceptions
Dimension Private Banking Sector
(n = 370)
Public Banking Sector
(n = 370)
Price Customers‟ perceptions Customers‟ perceptions
The bank contacts me every time it is
useful
5.7351 1.8270
Good explanations of service fees 5.4081 1.7432
Balance amount from which service
charges begin
5.2703 1.7730
Reasonable fees for administration of
accounts
5.1324 4.1919
Keeping the client informed every time
that a better solution appears for the
problem
5.7757 1.6000
Mean Scores 5.4643 2.2270
In general the mean score of perceptions of the price dimension for customers of the private
banking sector is 5.4643 (high customer perceptions), and for customers of the public
banking sector is 2.2270 (low customer perceptions). This clearly shows that the perceived
level of service quality provided to customers (with regard to price dimension) in the private
banking sector is high and the perceived level of service quality provided to customers with
regard to the same dimension in the public banking sector is low, which supports the view
that the private banking sector outperforms the public banking sector in terms of price
dimension.
6.3.1.4 Tangibles dimension
The tangibles dimension emerges from the degree of importance of the following items (see
Table 6.5):
Table 6.5 Mean Tangibles Scores for Customers‟ Perceptions
Dimension Private Banking Sector
(n = 370)
Public Banking Sector
(n = 370)
Tangibles Customers‟ perceptions Customers‟ perceptions
Precision of account statement 5.6649 2.4270
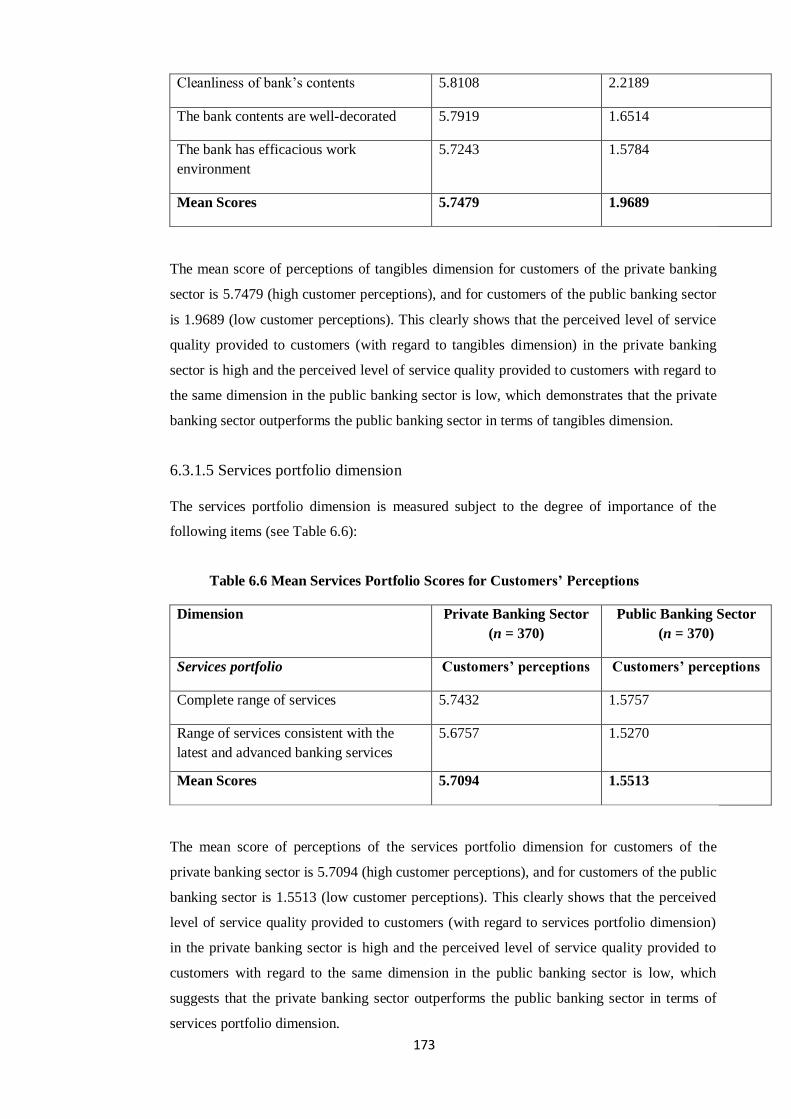
173
Cleanliness of bank‟s contents 5.8108 2.2189
The bank contents are well-decorated 5.7919 1.6514
The bank has efficacious work
environment
5.7243 1.5784
Mean Scores 5.7479 1.9689
The mean score of perceptions of tangibles dimension for customers of the private banking
sector is 5.7479 (high customer perceptions), and for customers of the public banking sector
is 1.9689 (low customer perceptions). This clearly shows that the perceived level of service
quality provided to customers (with regard to tangibles dimension) in the private banking
sector is high and the perceived level of service quality provided to customers with regard to
the same dimension in the public banking sector is low, which demonstrates that the private
banking sector outperforms the public banking sector in terms of tangibles dimension.
6.3.1.5 Services portfolio dimension
The services portfolio dimension is measured subject to the degree of importance of the
following items (see Table 6.6):
Table 6.6 Mean Services Portfolio Scores for Customers‟ Perceptions
Dimension Private Banking Sector
(n = 370)
Public Banking Sector
(n = 370)
Services portfolio Customers‟ perceptions Customers‟ perceptions
Complete range of services 5.7432 1.5757
Range of services consistent with the
latest and advanced banking services
5.6757 1.5270
Mean Scores 5.7094 1.5513
The mean score of perceptions of the services portfolio dimension for customers of the
private banking sector is 5.7094 (high customer perceptions), and for customers of the public
banking sector is 1.5513 (low customer perceptions). This clearly shows that the perceived
level of service quality provided to customers (with regard to services portfolio dimension)
in the private banking sector is high and the perceived level of service quality provided to
customers with regard to the same dimension in the public banking sector is low, which
suggests that the private banking sector outperforms the public banking sector in terms of
services portfolio dimension.

174
6.3.1.6 Reliability dimension
The reliability dimension emerges after checking the importance of the following items (see
Table 6.7):
Table 6.7 Mean Reliability Scores for Customers‟ Perceptions
Dimension Private Banking Sector
(n = 370)
Public Banking Sector
(n = 370)
Reliability Customers‟ perceptions Customers‟ perceptions
Absence of errors in service delivery 5.9351 1.5405
Precision of filing systems 6.1324 1.8486
Mean Scores 6.0337 1.6945
The mean score of perceptions of the reliability dimension for customers of the private
banking sector is 6.0337 (high customer perceptions), and for customers of the public
banking sector is 1.6945 (low customer perceptions). This clearly shows that the perceived
level of service quality provided to customers (with regard to the reliability dimension) in the
private banking sector is high and the perceived level of service quality provided to
customers with regard to the same dimension in the public banking sector is low, which
proves that the private banking sector outperforms the public banking sector in terms of
reliability dimension.
It can be seen from the Figure 6.1 below that the perceptions of private banks‟ customers
were higher than the perceptions of public banks‟ customers.

175
Figure 6.1 Levels of Customers‟ perceptions of Service Quality in Private and
Public Banks
Figure 6.2 depicts graphical representations of the mean scores of service quality perceptions
for the customers of both private and public banks with regards to the six service quality
dimensions.

176
Figure 6.2 Mean Scores of the Six Service Quality Dimensions
Moreover, it can also be noted from the figure above that the biggest difference is related to
the access dimension (the average score of customer perception is 6.0124 for the private
banking sector, and 1.5593 for the public banking sector) followed by the reliability
dimension (the average score of customer perception is 6.0337 for the private banking sector,
and 1.6945 for public banking sector), then the services portfolio dimension followed by
tangibles dimension, price dimension, and effectiveness and assurance dimension. However,
conducting the Independent-Samples T-Test will help to explore the significant differences
statistically between the two banking sectors with respect to service quality dimensions.
6.3.2 Data analysis (Phase 2): Hypotheses testing
The analysis of Independent Samples T-Test was used to explore the differences in the mean
values of dependent variables (the BSQ dimensions) between the two groups of customers
(private banks‟ customers and public banks‟ customers). The testing of the hypotheses is
based on the assumption that the confidence level is 0.05, which is generally accepted by
social science researchers.

177
Hypothesis 1
There are significant differences between the Libyan private and public banking sectors in
terms of service quality with respect to the effectiveness and assurance dimension.
The Independent Samples T-Test analysis showed significant differences between the
Libyan private and public banking sectors regarding the effectiveness and assurance items,
where (f) value is equal to 2.95 and is significant at the level of 0.000, which is lower than
the acceptable confidence level (0.05). Therefore Hypothesis 1 is accepted and it may be
concluded that there are significant differences in perception between customers of the
Libyan private and public banking sectors regarding the effectiveness and assurance items as
indicators of service quality. The results are shown in the Table 6.8 below:
Table 6.8 The Results of Independent Samples T-Test Analysis of the
Effectiveness and Assurance Dimension
Dimension Sector
Effectiveness and assurance
Private Public t-test p-value
5.3836 2.4266 246.189 0.000
1. Confidence 5.2000 2.8459 55.076 0.000
2. Recognition of a regular client 5.2649 2.8027 50.185 0.000
3. Confidentiality 5.4838 4.0324 50.185 0.000
4. Valorisation of the personnel 4.9405 2.5946 54.836 0.000
5. Interruption of the service 5.1000 1.5919 77.098 0.000
6. Well-trained personnel 5.8000 2.5324 98.153 0.000
7. Knowledge of the client on a personnel basis 5.7622 1.8784 121.027 0.000
8. No contradictions in decision between personnel
and management
5.1946 2.9432 42.912 0.000
9. Delivering when promised 5.2405 1.7324 86.589 0.000
10. Good reputation 5.4486 1.7349 70.757 0.000
11. Feeling of security 5.3757 3.1676 51.769 0.000
12. No delays due to bureaucratic factors and 5.5270 1.8541 69.958 0.000
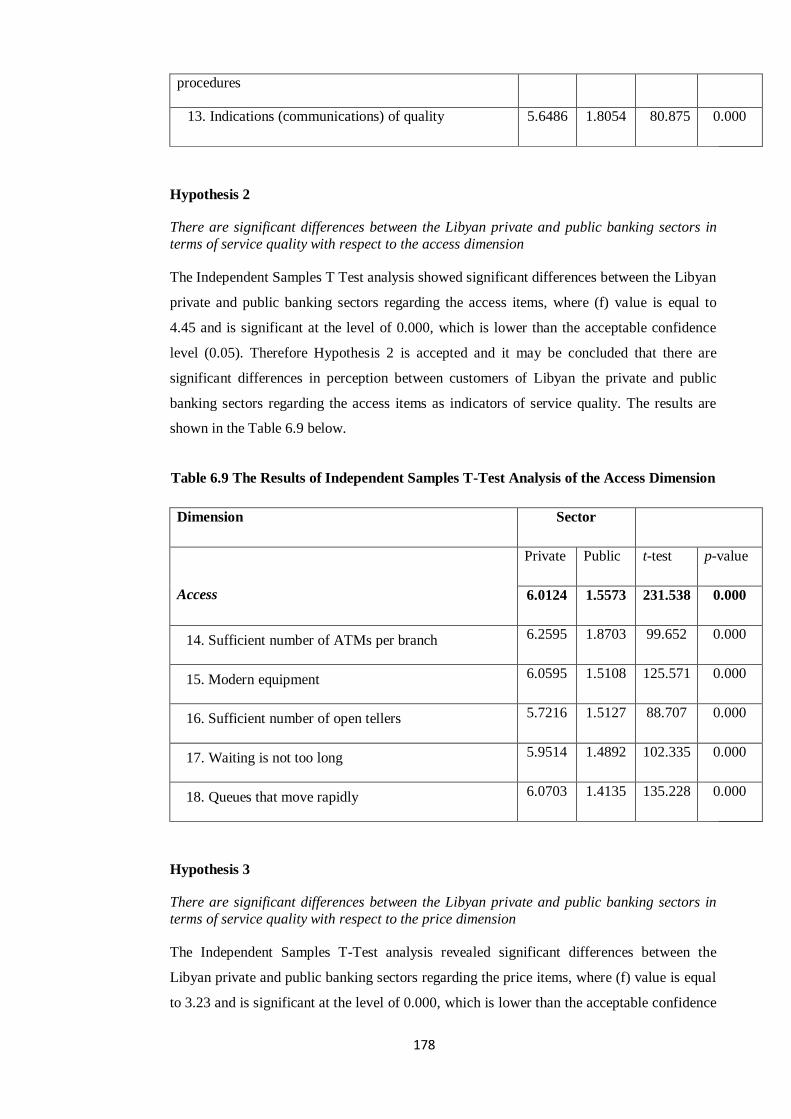
178
procedures
13. Indications (communications) of quality 5.6486 1.8054 80.875 0.000
Hypothesis 2
There are significant differences between the Libyan private and public banking sectors in
terms of service quality with respect to the access dimension
The Independent Samples T Test analysis showed significant differences between the Libyan
private and public banking sectors regarding the access items, where (f) value is equal to
4.45 and is significant at the level of 0.000, which is lower than the acceptable confidence
level (0.05). Therefore Hypothesis 2 is accepted and it may be concluded that there are
significant differences in perception between customers of Libyan the private and public
banking sectors regarding the access items as indicators of service quality. The results are
shown in the Table 6.9 below.
Table 6.9 The Results of Independent Samples T-Test Analysis of the Access Dimension
Dimension Sector
Access
Private Public t-test p-value
6.0124 1.5573 231.538 0.000
14. Sufficient number of ATMs per branch 6.2595 1.8703 99.652 0.000
15. Modern equipment 6.0595 1.5108 125.571 0.000
16. Sufficient number of open tellers 5.7216 1.5127 88.707 0.000
17. Waiting is not too long 5.9514 1.4892 102.335 0.000
18. Queues that move rapidly 6.0703 1.4135 135.228 0.000
Hypothesis 3
There are significant differences between the Libyan private and public banking sectors in
terms of service quality with respect to the price dimension
The Independent Samples T-Test analysis revealed significant differences between the
Libyan private and public banking sectors regarding the price items, where (f) value is equal
to 3.23 and is significant at the level of 0.000, which is lower than the acceptable confidence
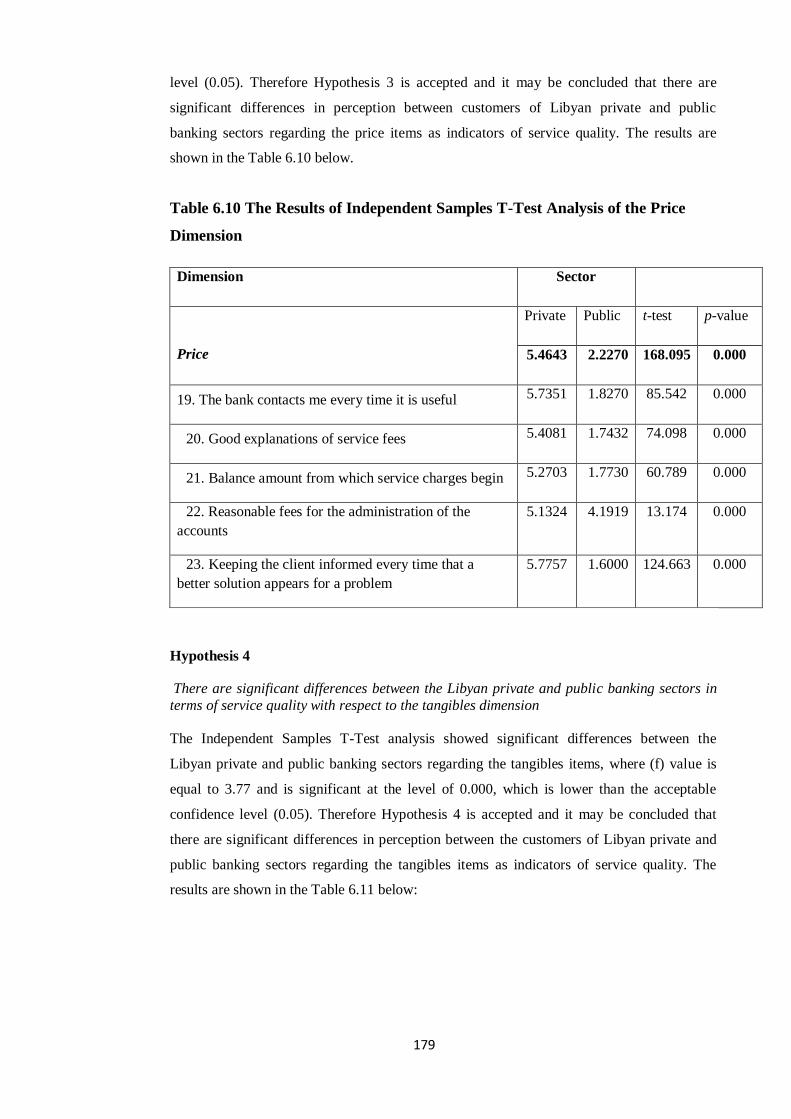
179
level (0.05). Therefore Hypothesis 3 is accepted and it may be concluded that there are
significant differences in perception between customers of Libyan private and public
banking sectors regarding the price items as indicators of service quality. The results are
shown in the Table 6.10 below.
Table 6.10 The Results of Independent Samples T-Test Analysis of the Price
Dimension
Dimension Sector
Price
Private Public t-test p-value
5.4643 2.2270 168.095 0.000
19. The bank contacts me every time it is useful 5.7351 1.8270 85.542 0.000
20. Good explanations of service fees 5.4081 1.7432 74.098 0.000
21. Balance amount from which service charges begin 5.2703 1.7730 60.789 0.000
22. Reasonable fees for the administration of the
accounts
5.1324 4.1919 13.174 0.000
23. Keeping the client informed every time that a
better solution appears for a problem
5.7757 1.6000 124.663 0.000
Hypothesis 4
There are significant differences between the Libyan private and public banking sectors in
terms of service quality with respect to the tangibles dimension
The Independent Samples T-Test analysis showed significant differences between the
Libyan private and public banking sectors regarding the tangibles items, where (f) value is
equal to 3.77 and is significant at the level of 0.000, which is lower than the acceptable
confidence level (0.05). Therefore Hypothesis 4 is accepted and it may be concluded that
there are significant differences in perception between the customers of Libyan private and
public banking sectors regarding the tangibles items as indicators of service quality. The
results are shown in the Table 6.11 below:
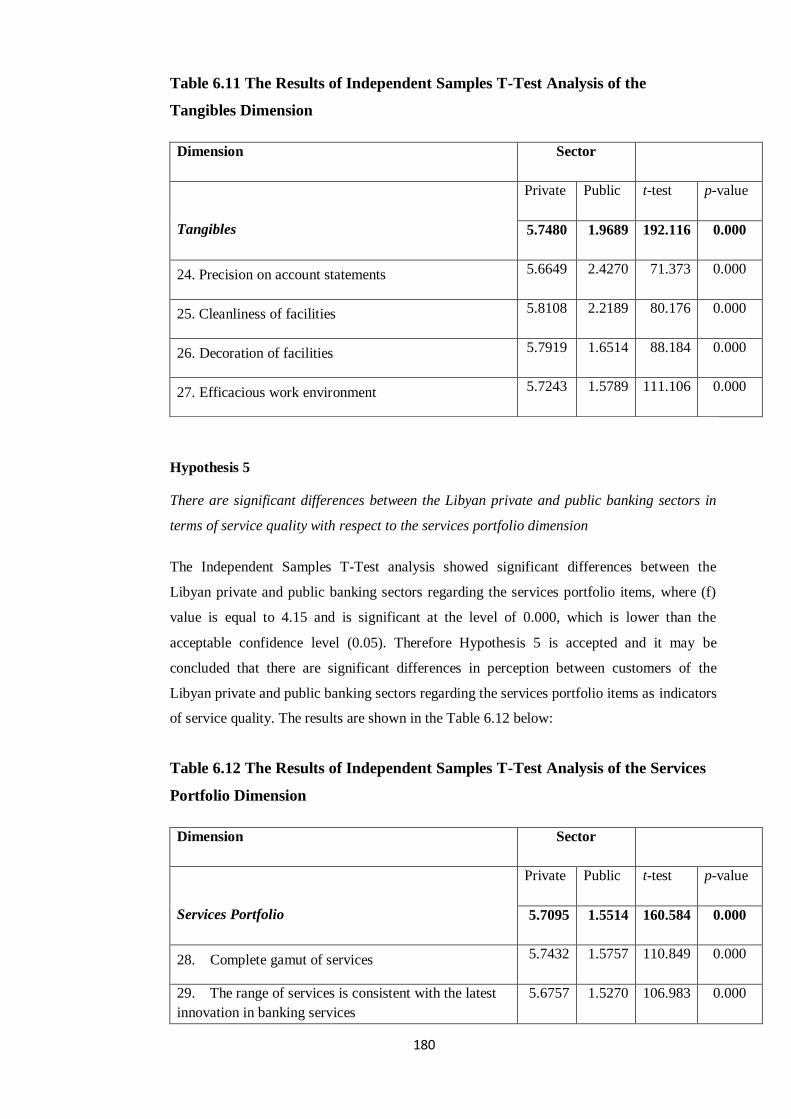
180
Table 6.11 The Results of Independent Samples T-Test Analysis of the
Tangibles Dimension
Dimension Sector
Tangibles
Private Public t-test p-value
5.7480 1.9689 192.116 0.000
24. Precision on account statements 5.6649 2.4270 71.373 0.000
25. Cleanliness of facilities 5.8108 2.2189 80.176 0.000
26. Decoration of facilities 5.7919 1.6514 88.184 0.000
27. Efficacious work environment 5.7243 1.5789 111.106 0.000
Hypothesis 5
There are significant differences between the Libyan private and public banking sectors in
terms of service quality with respect to the services portfolio dimension
The Independent Samples T-Test analysis showed significant differences between the
Libyan private and public banking sectors regarding the services portfolio items, where (f)
value is equal to 4.15 and is significant at the level of 0.000, which is lower than the
acceptable confidence level (0.05). Therefore Hypothesis 5 is accepted and it may be
concluded that there are significant differences in perception between customers of the
Libyan private and public banking sectors regarding the services portfolio items as indicators
of service quality. The results are shown in the Table 6.12 below:
Table 6.12 The Results of Independent Samples T-Test Analysis of the Services
Portfolio Dimension
Dimension Sector
Services Portfolio
Private Public t-test p-value
5.7095 1.5514 160.584 0.000
28. Complete gamut of services 5.7432 1.5757 110.849 0.000
29. The range of services is consistent with the latest
innovation in banking services
5.6757 1.5270 106.983 0.000

181
Hypothesis 6
There are significant differences between the Libyan private and public banking sectors in
terms of service quality with respect to the reliability dimension
The Independent Samples T-Test analysis showed significant differences between the
Libyan private and public banking sectors regarding the reliability items, where (f) value is
equal to 4.33 and is significant at the level of 0.000, which is lower than the acceptable
confidence level (0.05). Therefore Hypothesis 5 is accepted and it may be concluded that
there are significant differences in perception between customers of the Libyan private and
public banking sectors regarding the reliability items as indicators of service quality. The
results are shown in the Table 6.13 below:
Table 6.13 The Results of Independent Samples T test Analysis of the Reliability
Dimension
Dimension Sector
Reliability
Private Public t-test p-value
6.0338 1.6949 149.63 0.000
30. Absence of errors in service delivery 5.9351 1.5405 115.301 0.000
31. Precision of filing system 6.1324 1.8486 102.594 0.000
Hypothesis 7
There are significant differences between the Libyan private and public banking sectors in terms of service quality with respect to all service quality dimensions taken together
The independent Samples T-Test analysis showed significant differences between the Libyan
private and public banking sectors regarding all service quality dimensions taken together,
where (f) value is equal to 1.27 and is significant at the level of 0.000, which is lower than
the acceptable confidence level (0.05). Therefore Hypothesis 7 is accepted and it may be
concluded that there are significant differences in perception between customers of the
Libyan private and public banking sectors regarding all service quality dimensions taken
together.
182
6.3.3 Data analysis (Phase 3) Comparison between the Libyan private and public
banks‟ customers in terms of the degree of importance attached to various dimensions
of service quality.
The statistical factor analysis was run to identify the differences between the Libyan private
and public banks‟ customers in terms of the degree of importance attached to various
dimensions of service quality.
Factor analysis attempts to identify underlying factors or dimensions that have been used and
further, to describe what the factors represent conceptually (Garson, 2005).
In this research, exploratory factor analysis in the form of principal component analysis
(PCA) was adopted for each sample separately (private banks‟ sample and public banks‟
sample). A statistical analysis was performed using the Statistical Program for Social
Sciences (SPSS) for Windows, release 17.0. Prior to conducting factor analysis, Bartlett's
test of sphericity was employed in the two samples. Sphericity means that data are
uncorrelated. Factor analysis, however, assumes that a set of variables are associated with
each other. Moderately significant inter-correlations between items are required to uncover
the latent structure of a set of variables. In a Bartlett's test, a high Chi-Square value with a
low p value (p<0.001) indicates a significant relationship between the items, which suggests
that the data are suitable for factor analysis (Morgan and Griego, 1998). In this research
study, the outcomes of the Bartlett‟s test confirmed that both the private banks‟ sample
(2435.039; p<.001) and the public banks‟ sample (2396.794; p<.001) are suitable for factor
analysis.
The principal component factor analysis used a varimax rotation solution with Kaiser
Normalization, which is the most common rotation option (Garson, 2005).
Garson (2005) defines factor loading as the correlation coefficient between the items and
factors. The factor-loading coefficient used for the analysis of the present study was set at
0.50. Thus, items with factor-loading coefficients less than 0.50 did not correlate with any of
the factors, and were subsequently dropped.
Communality for an item is computed as the sum of squared factor loadings for that variable.
If the communality exceeds 1.0, there is a spurious solution, which may reflect too small a
sample or the researcher has too many or too few factors (Garson, 2005). For the purposes of
this study, the researcher set the minimum acceptable item correlation with a factor at 0.50.
Thus, items having a lower than 0.50 communality coefficient do not interpret the factors
(Garson, 2005).
On the other hand, the main aim of this research is to compare the Libyan private banking
sector with the public banking sector in terms of service quality levels, therefore one scale is
required to measure service quality in the two groups of banks as this will facilitate
183
conducting the comparison between the two banking sectors. In this research adopting factor
analysis for the chosen scale before measuring the service quality in the two groups of banks
will shift the focus of the research away from its main aim mentioned above. This because
factor analysis should be run in the two banking sectors‟ samples, and this could generate
two different scales (one scale for each banking sector) subsequently leading to the
impossibility of conducting the comparison between the two groups of banks.
The literature also demonstrated the adoption of standard scales such as the BSQ scale in the
case of comparisons without running factor analysis. For instance, Glaveli et al. (2006)
compared the level of service quality between Greek and Bulgarian banks using the BSQ
scale in its original structure before adopting factor analysis, as the main objective of their
research was to compare the Greek and Bulgarian banks in terms of service quality. They ran
factor analysis later to identify the dimensions of banking service quality in Greek and
Bulgarian retail bank customers.
Periduo et al. (2007) compared the service quality perceptions among the bank customers of
five Balkan countries: Greece, Bulgaria, Albania, Macedonia, and Serbia. The BSQ scale
was used to measure banking service quality in those countries before adopting factor
analysis which was run later to identify the degree of importance of the service quality
dimensions for each country.
Spathis, Petridou and Glaveli (2004) tried to identify the gender-related differences in the
quality perceptions of Greek bank customers. They also used BSQ to measure service quality
in the Greek banks before running factor analysis. In their research, factor analysis was
adopted later to identify the gender-related differences in the degree of importance attached
to various dimensions of service quality by customers of Greek banks.
In line with the above view points, the researcher followed the literature, in the sense that an
amended BSQ scale (due to the pilot study outcomes) was used to measure service quality
within the Libyan private and public banking sectors before running factor analysis, as this
will help to address the main aim of this research. Furthermore, the third objective of this
research is to identify the differences between the Libyan private and public banks‟
customers in terms of the degree of importance attached to the various dimensions of service
quality. This requires adopting factor analysis in the two banking sectors‟ samples.
6.3.3.1 Factor analysis results: Private banking sector
The thirty-one items of the BSQ scale were subjected to PCA and the output was fifteen
items (components). Accordingly, a clear factor structure appeared as a result of the factor
analysis (PCA) which identified six factors extracted and they accounted for 74.323 per cent

184
of the variance across the sample (see Table 6.14 below). These six factors are similar to the
ones existing in the original BSQ scale but with different importance attached as follows:
1. The first factor extraction is effectiveness and assurance. This consisted of five
items which accounted for 19.337 per cent of the total variance in the perceived
service quality dimensions.
2. The second factor identified from the principal component analysis is tangible.
This included four items which accounted for 15.314 per cent of the total variance.
3. The third factor extraction is access. It consisted of two items accounted for 11.037
per cent of the total variance.
4. The fourth factor is services portfolio, with one item included, and it accounted for
9.771 per cent of the total variance.
5. The fifth factor identified from the analysis outcomes is reliability, including one
item, and it accounted for 9.077 per cent of the total variance.
6. The sixth factor is price. It consisted of two items and accounted for 7.839 per cent
of the total variance.
All six factors extracted showed Eigenvalue above .1. The Initial Eigenvalues of the six
factors are 3.193, 2.297, 1.656, 1.466, 1.362, and 1.176 respectively. According to Garson
(2005), the factor that has low Eigenvalue (less than 1.0) is contributing little to the
explanation of variances in the variables and may be ignored as redundant compared to
important factors. Therefore, only six of the fifteen factors were actually extracted in this
analysis. As mentioned above that six factors extractions represent a total of 74.323 per cent
of the fifteen items which confirmed the scale representation of all service quality-related
items found within the scale.

185
Component
Initial Eigenvalues
Extraction Sums of Squared
Loadings
Rotation Sums of Squared
Loadings
Total
% of
Variance
Cumulative
% Total
% of
Variance
Cumulative
% Total
% of
Variance
Cumulative
%
1 3.193 21.283 21.283 3.193 21.283 21.283 2.900 19.334 19.334
2 2.297 15.314 36.598 2.297 15.314 36.598 2.251 15.007 34.341
3 1.656 11.037 47.635 1.656 11.037 47.635 1.743 11.623 45.964
4 1.466 9.771 57.407 1.466 9.771 57.407 1.483 9.887 55.851
5 1.362 9.077 66.484 1.362 9.077 66.484 1.396 9.308 65.159
6 1.176 7.839 74.323 1.176 7.839 74.323 1.375 9.164 74.323
7 .958 6.389 80.712
8 .759 5.059 85.772
9 .558 3.717 89.489
10 .474 3.158 92.647
11 .377 2.512 95.159
12 .304 2.030 97.189
13 .224 1.493 98.682
14 .131 .877 99.559
15 .066 .441 100.000
Extraction Method: Principal Component Analysis.
The above table therefore supports the view that the fifteen items are related to the six
factors extracted. There also evidence of high communalities across the scale components
(above 0.50) as shown in the table 6.15 below. This indicates that the variables are related to
each other, and also that the fifteen items actually interpret the factors extracted.
Table 6.14 Total Variance Explained

186
Table 6.15 Scale Components Communalities
Initial Extraction
Confidentiality 1.000 .588
Well-trained personnel 1.000 .877
Delivering when promised 1.000 .807
Feeling of security 1.000 .633
Indications (communications) of
quality
1.000 .643
Modern equipment 1.000 .794
Precision on account statements 1.000 .646
Decoration of facilities 1.000 .530
Efficacious work environment 1.000 .915
Sufficient number of ATMs per
branch
1.000 .604
Sufficient number of open tellers 1.000 .823
The range of services is consistent
with the latest innovation in
banking services
1.000 .898
Absence of errors in service
delivery
1.000 .554
Reasonable fees for the
administration of the accounts
1.000 .807
Good explanations of services
fees
1.000 .884
Extraction Method: Principal Component Analysis.
Furthermore, there was evidence about the connection of the fifteen items to the six factors
extracted by the rotated factor/component matrix which confirmed the following: five items
were used to measure the effectiveness and assurance dimension; four items were used to
measure tangibles dimension; two items were used to measure access dimension; one item
was used to measure services portfolio dimension; one item was used to measure reliability
dimension; and two items were used to measure price dimension. The six factors and their
correlated items are clearly shown in the table 6.16 below:
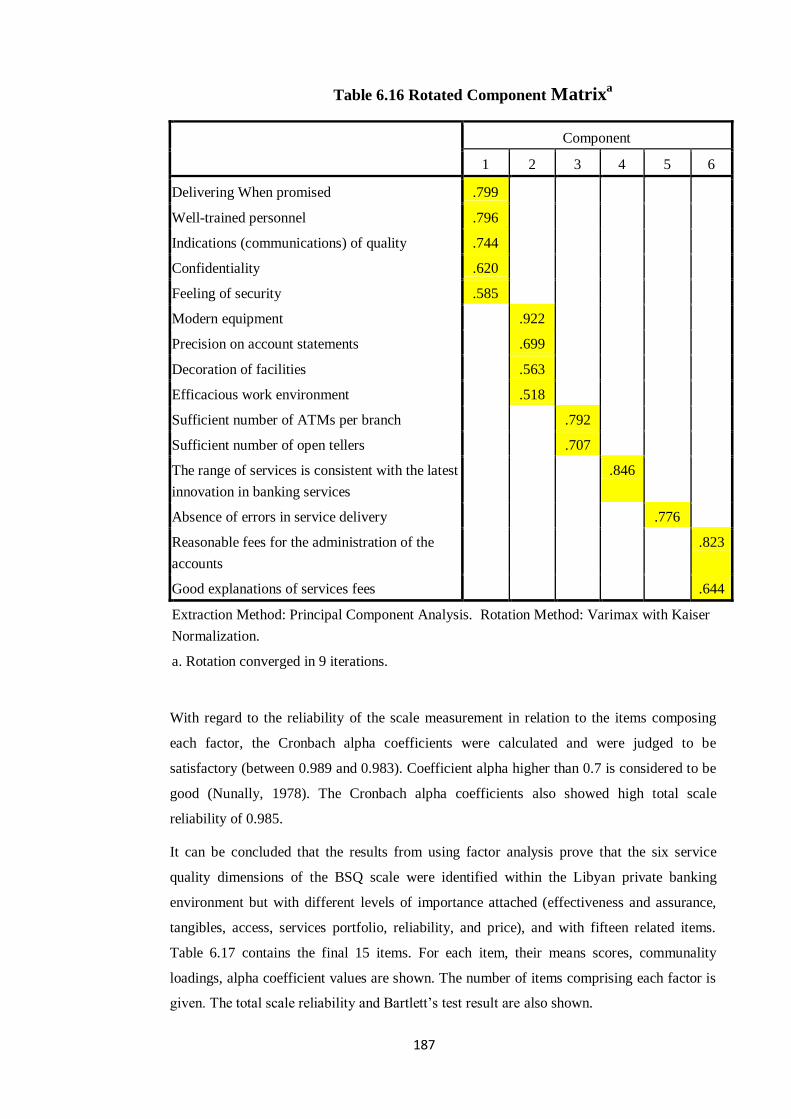
187
Component
1 2 3 4 5 6
Delivering When promised .799
Well-trained personnel .796
Indications (communications) of quality .744
Confidentiality .620
Feeling of security .585
Modern equipment .922
Precision on account statements .699
Decoration of facilities .563
Efficacious work environment .518
Sufficient number of ATMs per branch .792
Sufficient number of open tellers .707
The range of services is consistent with the latest
innovation in banking services
.846
Absence of errors in service delivery .776
Reasonable fees for the administration of the
accounts
.823
Good explanations of services fees .644
Extraction Method: Principal Component Analysis. Rotation Method: Varimax with Kaiser
Normalization.
a. Rotation converged in 9 iterations.
With regard to the reliability of the scale measurement in relation to the items composing
each factor, the Cronbach alpha coefficients were calculated and were judged to be
satisfactory (between 0.989 and 0.983). Coefficient alpha higher than 0.7 is considered to be
good (Nunally, 1978). The Cronbach alpha coefficients also showed high total scale
reliability of 0.985.
It can be concluded that the results from using factor analysis prove that the six service
quality dimensions of the BSQ scale were identified within the Libyan private banking
environment but with different levels of importance attached (effectiveness and assurance,
tangibles, access, services portfolio, reliability, and price), and with fifteen related items.
Table 6.17 contains the final 15 items. For each item, their means scores, communality
loadings, alpha coefficient values are shown. The number of items comprising each factor is
given. The total scale reliability and Bartlett‟s test result are also shown.
Table 6.16 Rotated Component Matrixa
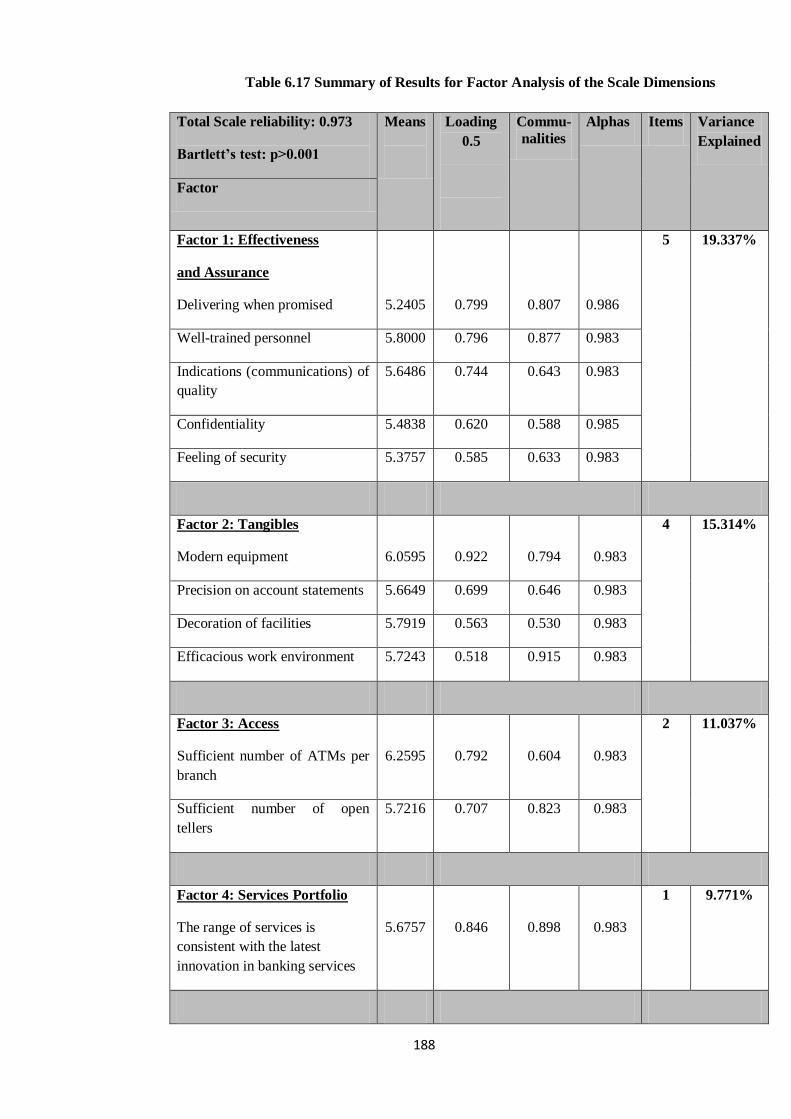
188
Table 6.17 Summary of Results for Factor Analysis of the Scale Dimensions
Total Scale reliability: 0.973
Bartlett‟s test: p>0.001
Means
Loading
0.5
Commu-
nalities
Alphas Items Variance
Explained
Factor
Factor 1: Effectiveness
and Assurance
Delivering when promised
5.2405
0.799
0.807
0.986
5 19.337%
Well-trained personnel 5.8000 0.796 0.877 0.983
Indications (communications) of
quality
5.6486 0.744 0.643 0.983
Confidentiality 5.4838 0.620 0.588 0.985
Feeling of security 5.3757 0.585 0.633 0.983
Factor 2: Tangibles
Modern equipment
6.0595
0.922
0.794
0.983
4 15.314%
Precision on account statements 5.6649 0.699 0.646 0.983
Decoration of facilities 5.7919 0.563 0.530 0.983
Efficacious work environment 5.7243 0.518 0.915 0.983
Factor 3: Access
Sufficient number of ATMs per
branch
6.2595
0.792
0.604
0.983
2 11.037%
Sufficient number of open
tellers
5.7216 0.707 0.823 0.983
Factor 4: Services Portfolio
The range of services is
consistent with the latest
innovation in banking services
5.6757
0.846
0.898
0.983
1 9.771%
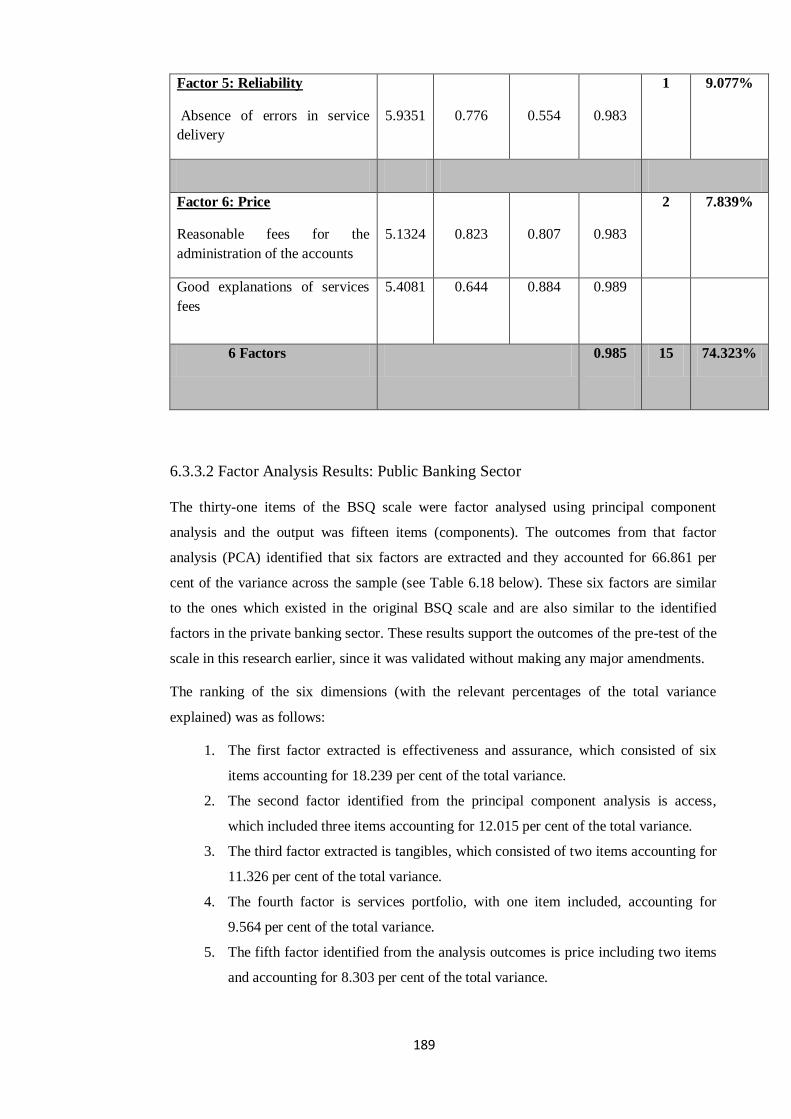
189
Factor 5: Reliability
Absence of errors in service
delivery
5.9351
0.776
0.554
0.983
1 9.077%
Factor 6: Price
Reasonable fees for the
administration of the accounts
5.1324
0.823
0.807
0.983
2 7.839%
Good explanations of services
fees
5.4081
0.644
0.884 0.989
6 Factors 0.985
15 74.323%
6.3.3.2 Factor Analysis Results: Public Banking Sector
The thirty-one items of the BSQ scale were factor analysed using principal component
analysis and the output was fifteen items (components). The outcomes from that factor
analysis (PCA) identified that six factors are extracted and they accounted for 66.861 per
cent of the variance across the sample (see Table 6.18 below). These six factors are similar
to the ones which existed in the original BSQ scale and are also similar to the identified
factors in the private banking sector. These results support the outcomes of the pre-test of the
scale in this research earlier, since it was validated without making any major amendments.
The ranking of the six dimensions (with the relevant percentages of the total variance
explained) was as follows:
1. The first factor extracted is effectiveness and assurance, which consisted of six
items accounting for 18.239 per cent of the total variance.
2. The second factor identified from the principal component analysis is access,
which included three items accounting for 12.015 per cent of the total variance.
3. The third factor extracted is tangibles, which consisted of two items accounting for
11.326 per cent of the total variance.
4. The fourth factor is services portfolio, with one item included, accounting for
9.564 per cent of the total variance.
5. The fifth factor identified from the analysis outcomes is price including two items
and accounting for 8.303 per cent of the total variance.

190
6. The sixth factor is reliability, which consisted of one item and accounted for 7.323
per cent of the total variance.
All six factors extracted showed an Eigenvalue above .1. The Initial Eigenvalues of the six
factors are 2.736, 1.802, 1.669, 1.448, 1.246 and 1.098 respectively, which indicates that the
six factors extracted are contributing well to the explanation of variances. As mentioned
above the six factor extractions represent a total of 66.861 per cent of the fifteen items which
confirmed the scale representation of all service quality-related items found within the scale.

191
Component
Initial Eigenvalues Extraction Sums of Squared
Loadings
Rotation Sums of Squared
Loadings
Total
% of
Variance
Cumulative
% Total
% of
Variance
Cumulative
% Total
% of
Variance
Cumulative
%
1 2.736 18.239 18.239 2.736 18.239 18.239 2.210 14.734 14.734
2 1.802 12.015 30.254 1.802 12.015 30.254 1.797 11.978 26.712
3 1.699 11.326 41.581 1.699 11.326 41.581 1.631 10.875 37.587
4 1.448 9.654 51.235 1.448 9.654 51.235 1.566 10.439 48.026
5 1.246 8.303 59.538 1.246 8.303 59.538 1.470 9.802 57.828
6 1.098 7.323 66.861 1.098 7.323 66.861 1.355 9.034 66.861
7 .932 6.214 73.075
8 .903 6.021 79.096
9 .774 5.162 84.258
10 .647 4.315 88.573
11 .621 4.142 92.715
12 .391 2.607 95.323
13 .357 2.379 97.701
14 .261 1.742 99.443
15 .084 .557 100.000
Extraction Method: Principal Component Analysis.
The above table therefore reveals that the fifteen items are related to the six factors extracted.
There is also evidence of high communalities across the scale components (above 0.50) as
shown in the table 6.19 below. This confirms that the variables are related to each other.
Table 6.18 Total Variance Explained
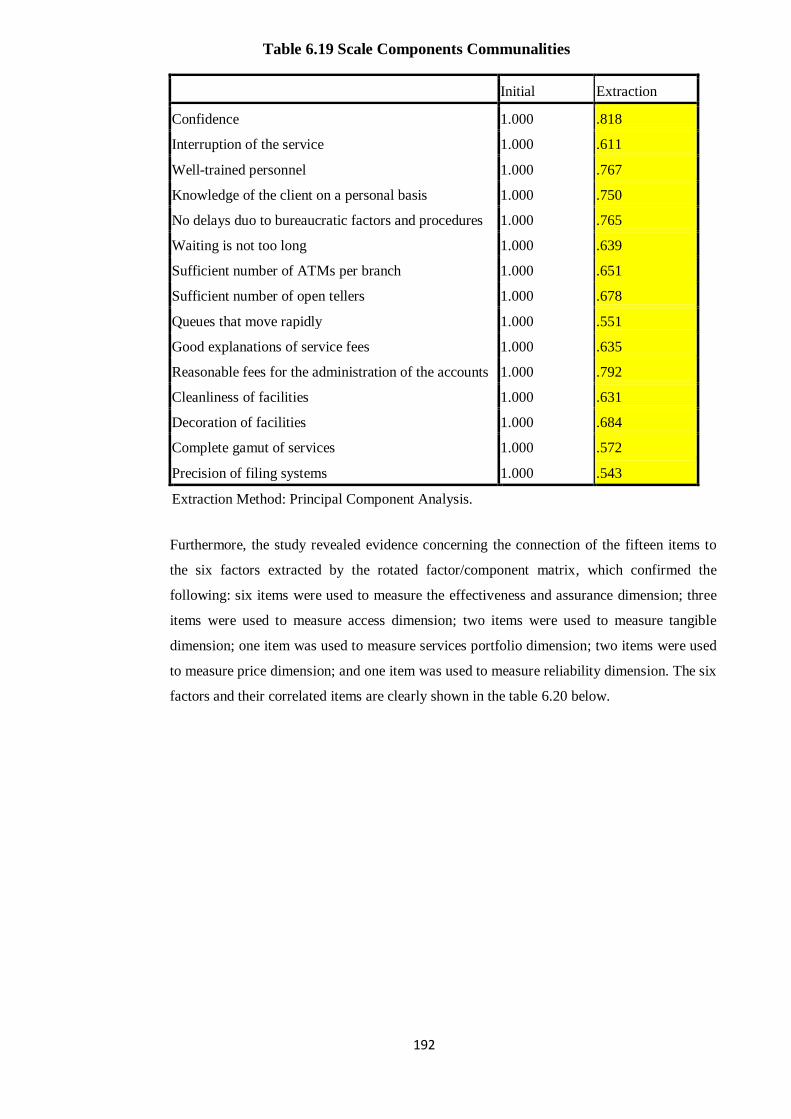
192
Initial Extraction
Confidence 1.000 .818
Interruption of the service 1.000 .611
Well-trained personnel 1.000 .767
Knowledge of the client on a personal basis 1.000 .750
No delays duo to bureaucratic factors and procedures 1.000 .765
Waiting is not too long 1.000 .639
Sufficient number of ATMs per branch 1.000 .651
Sufficient number of open tellers 1.000 .678
Queues that move rapidly 1.000 .551
Good explanations of service fees 1.000 .635
Reasonable fees for the administration of the accounts 1.000 .792
Cleanliness of facilities 1.000 .631
Decoration of facilities 1.000 .684
Complete gamut of services 1.000 .572
Precision of filing systems 1.000 .543
Extraction Method: Principal Component Analysis.
Furthermore, the study revealed evidence concerning the connection of the fifteen items to
the six factors extracted by the rotated factor/component matrix, which confirmed the
following: six items were used to measure the effectiveness and assurance dimension; three
items were used to measure access dimension; two items were used to measure tangible
dimension; one item was used to measure services portfolio dimension; two items were used
to measure price dimension; and one item was used to measure reliability dimension. The six
factors and their correlated items are clearly shown in the table 6.20 below.
Table 6.19 Scale Components Communalities
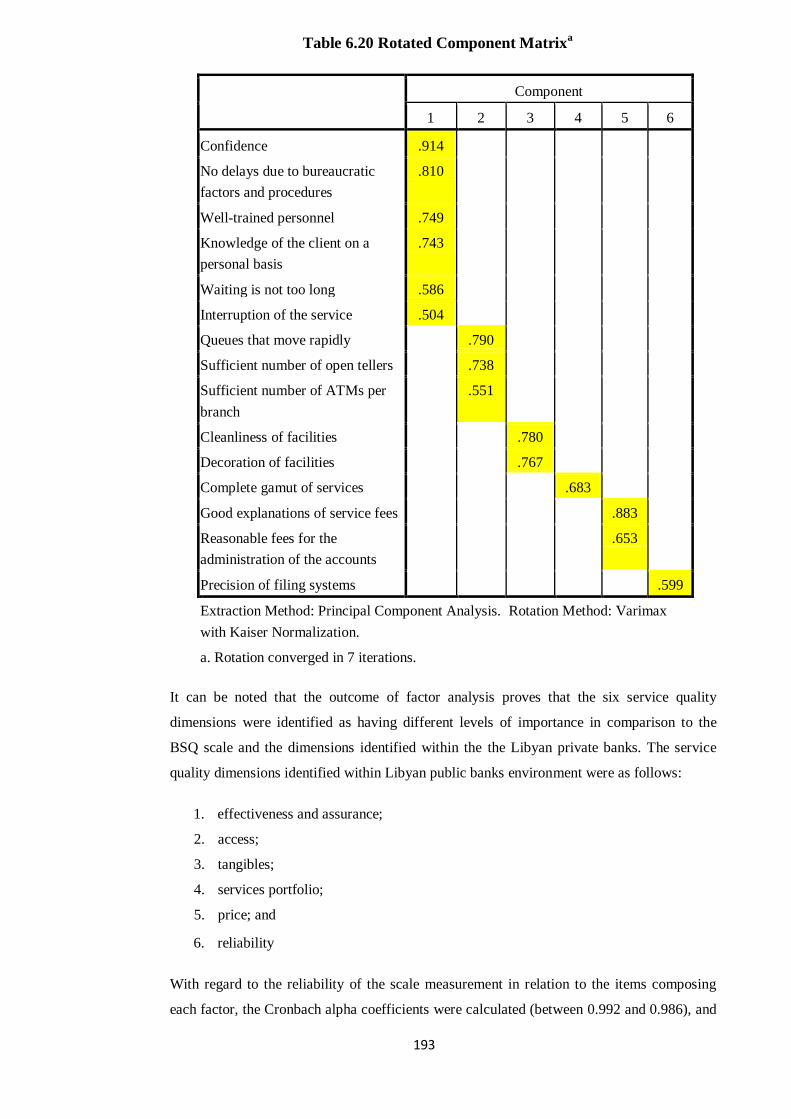
193
Component
1 2 3 4 5 6
Confidence .914
No delays due to bureaucratic
factors and procedures
.810
Well-trained personnel .749
Knowledge of the client on a
personal basis
.743
Waiting is not too long .586
Interruption of the service .504
Queues that move rapidly .790
Sufficient number of open tellers .738
Sufficient number of ATMs per
branch
.551
Cleanliness of facilities .780
Decoration of facilities .767
Complete gamut of services .683
Good explanations of service fees .883
Reasonable fees for the
administration of the accounts
.653
Precision of filing systems .599
Extraction Method: Principal Component Analysis. Rotation Method: Varimax
with Kaiser Normalization.
a. Rotation converged in 7 iterations.
It can be noted that the outcome of factor analysis proves that the six service quality
dimensions were identified as having different levels of importance in comparison to the
BSQ scale and the dimensions identified within the the Libyan private banks. The service
quality dimensions identified within Libyan public banks environment were as follows:
1. effectiveness and assurance;
2. access;
3. tangibles;
4. services portfolio;
5. price; and
6. reliability
With regard to the reliability of the scale measurement in relation to the items composing
each factor, the Cronbach alpha coefficients were calculated (between 0.992 and 0.986), and
Table 6.20 Rotated Component Matrixa
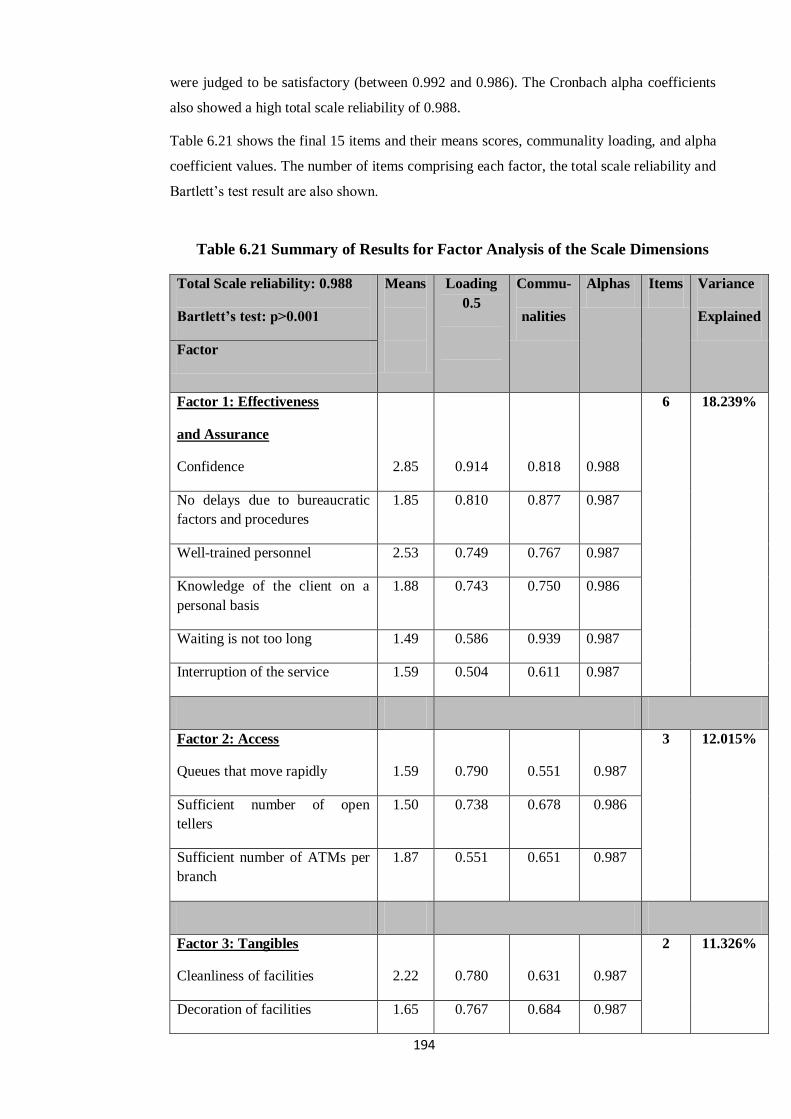
194
were judged to be satisfactory (between 0.992 and 0.986). The Cronbach alpha coefficients
also showed a high total scale reliability of 0.988.
Table 6.21 shows the final 15 items and their means scores, communality loading, and alpha
coefficient values. The number of items comprising each factor, the total scale reliability and
Bartlett‟s test result are also shown.
Table 6.21 Summary of Results for Factor Analysis of the Scale Dimensions
Total Scale reliability: 0.988
Bartlett‟s test: p>0.001
Means
Loading
0.5
Commu-
nalities
Alphas Items Variance
Explained
Factor
Factor 1: Effectiveness
and Assurance
Confidence
2.85
0.914
0.818
0.988
6 18.239%
No delays due to bureaucratic
factors and procedures
1.85 0.810 0.877 0.987
Well-trained personnel 2.53 0.749 0.767 0.987
Knowledge of the client on a
personal basis
1.88 0.743 0.750 0.986
Waiting is not too long 1.49 0.586 0.939 0.987
Interruption of the service 1.59 0.504 0.611 0.987
Factor 2: Access
Queues that move rapidly
1.59
0.790
0.551
0.987
3 12.015%
Sufficient number of open
tellers
1.50 0.738 0.678 0.986
Sufficient number of ATMs per
branch
1.87 0.551 0.651 0.987
Factor 3: Tangibles
Cleanliness of facilities
2.22
0.780
0.631
0.987
2 11.326%
Decoration of facilities 1.65 0.767 0.684 0.987
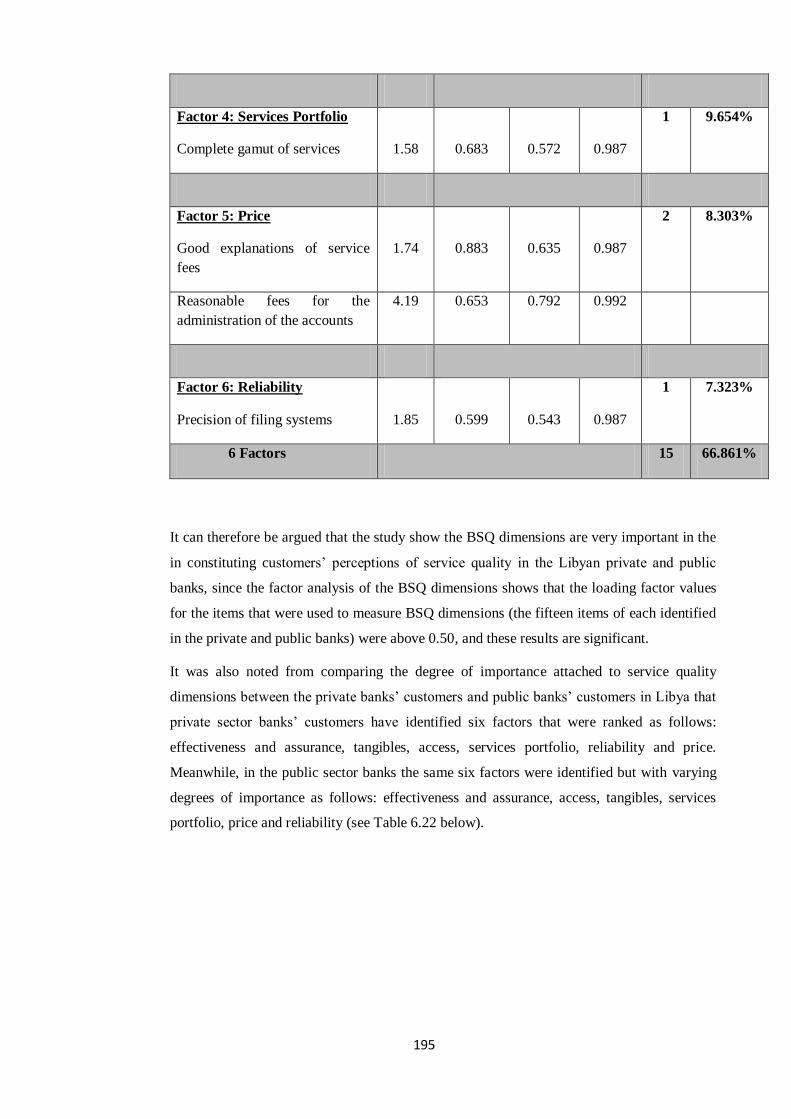
195
Factor 4: Services Portfolio
Complete gamut of services
1.58
0.683
0.572
0.987
1 9.654%
Factor 5: Price
Good explanations of service
fees
1.74
0.883
0.635
0.987
2 8.303%
Reasonable fees for the
administration of the accounts
4.19 0.653 0.792 0.992
Factor 6: Reliability
Precision of filing systems
1.85
0.599
0.543
0.987
1 7.323%
6 Factors 15 66.861%
It can therefore be argued that the study show the BSQ dimensions are very important in the
in constituting customers‟ perceptions of service quality in the Libyan private and public
banks, since the factor analysis of the BSQ dimensions shows that the loading factor values
for the items that were used to measure BSQ dimensions (the fifteen items of each identified
in the private and public banks) were above 0.50, and these results are significant.
It was also noted from comparing the degree of importance attached to service quality
dimensions between the private banks‟ customers and public banks‟ customers in Libya that
private sector banks‟ customers have identified six factors that were ranked as follows:
effectiveness and assurance, tangibles, access, services portfolio, reliability and price.
Meanwhile, in the public sector banks the same six factors were identified but with varying
degrees of importance as follows: effectiveness and assurance, access, tangibles, services
portfolio, price and reliability (see Table 6.22 below).
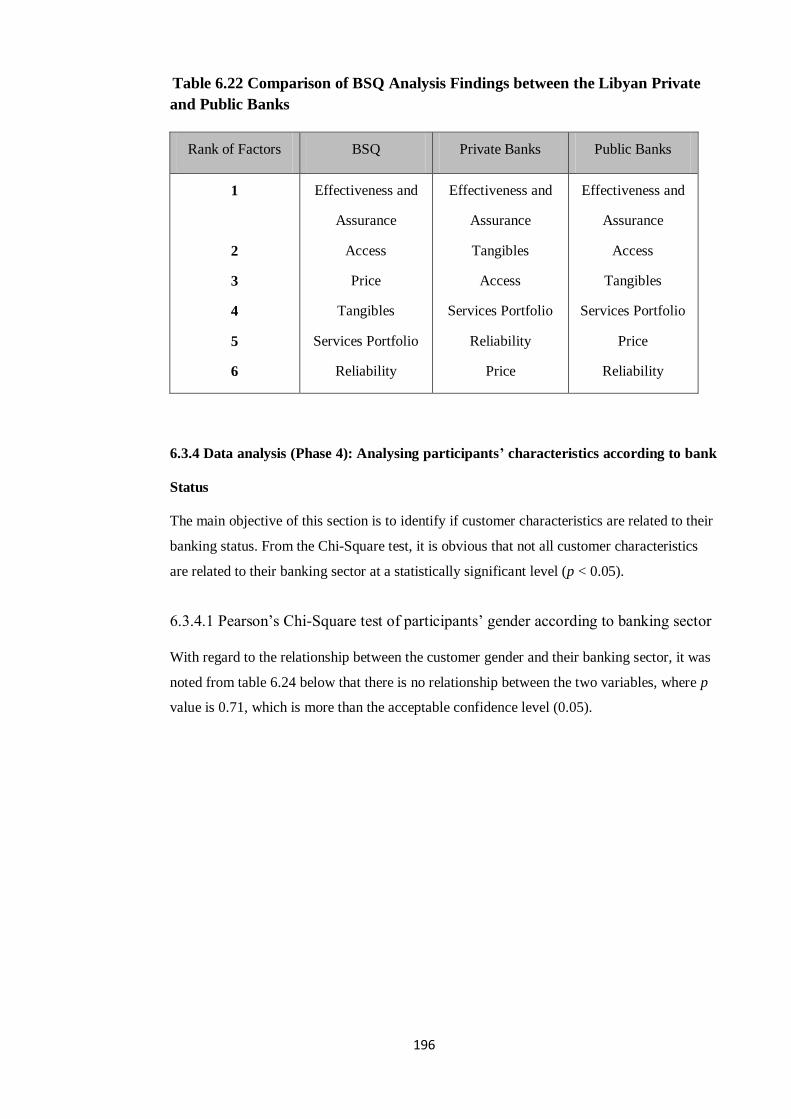
196
Table 6.22 Comparison of BSQ Analysis Findings between the Libyan Private
and Public Banks
Rank of Factors BSQ Private Banks Public Banks
1
2
3
4
5
6
Effectiveness and
Assurance
Access
Price
Tangibles
Services Portfolio
Reliability
Effectiveness and
Assurance
Tangibles
Access
Services Portfolio
Reliability
Price
Effectiveness and
Assurance
Access
Tangibles
Services Portfolio
Price
Reliability
6.3.4 Data analysis (Phase 4): Analysing participants‟ characteristics according to bank
Status
The main objective of this section is to identify if customer characteristics are related to their
banking status. From the Chi-Square test, it is obvious that not all customer characteristics
are related to their banking sector at a statistically significant level (p < 0.05).
6.3.4.1 Pearson‟s Chi-Square test of participants‟ gender according to banking sector
With regard to the relationship between the customer gender and their banking sector, it was
noted from table 6.24 below that there is no relationship between the two variables, where p
value is 0.71, which is more than the acceptable confidence level (0.05).

197
Table 6.23 Cross Tabulation: Gender*Bank Status
Banking Sector
Total Private Sector Public Sector
gender Male Count 361 367 728
% within gender 49.6% 50.4% 100.0%
% within sector 97.6% 99.2% 98.4%
% of Total 48.8% 49.6% 98.4%
Female Count 9 3 12
% within gender 75.0% 25.0% 100.0%
% within sector 2.4% .8% 1.6%
% of Total 1.2% .4% 1.6%
Total Count 370 370 740
% within gender 50.0% 50.0% 100.0%
% within sector 100.0% 100.0% 100.0%
% of Total 50.0% 50.0% 100.0%
Table 6.24 Chi-Square Tests
Value Df
Asymp. Sig.
(2-sided)
Exact Sig. (2-
sided)
Exact Sig. (1-
sided)
Pearson Chi-Square 3.049a 1 .081
Continuity Correctionb 2.118 1 .146
Likelihood Ratio 3.189 1 .074
Fisher's Exact Test .090 .071
Linear-by-Linear
Association
3.045 1 .081
N of Valid Cases 740
a. 0 cells (.0%) have expected count less than 5. The minimum expected count is 6.00.
b. Computed only for a 2x2 table
6.3.4.2 Pearson‟s Chi-Square test of participants‟ age according to bank status
The analysis results showed that there is a relationship between customer age and the
banking sector where p value is .000 which is lower than the acceptable confidence level
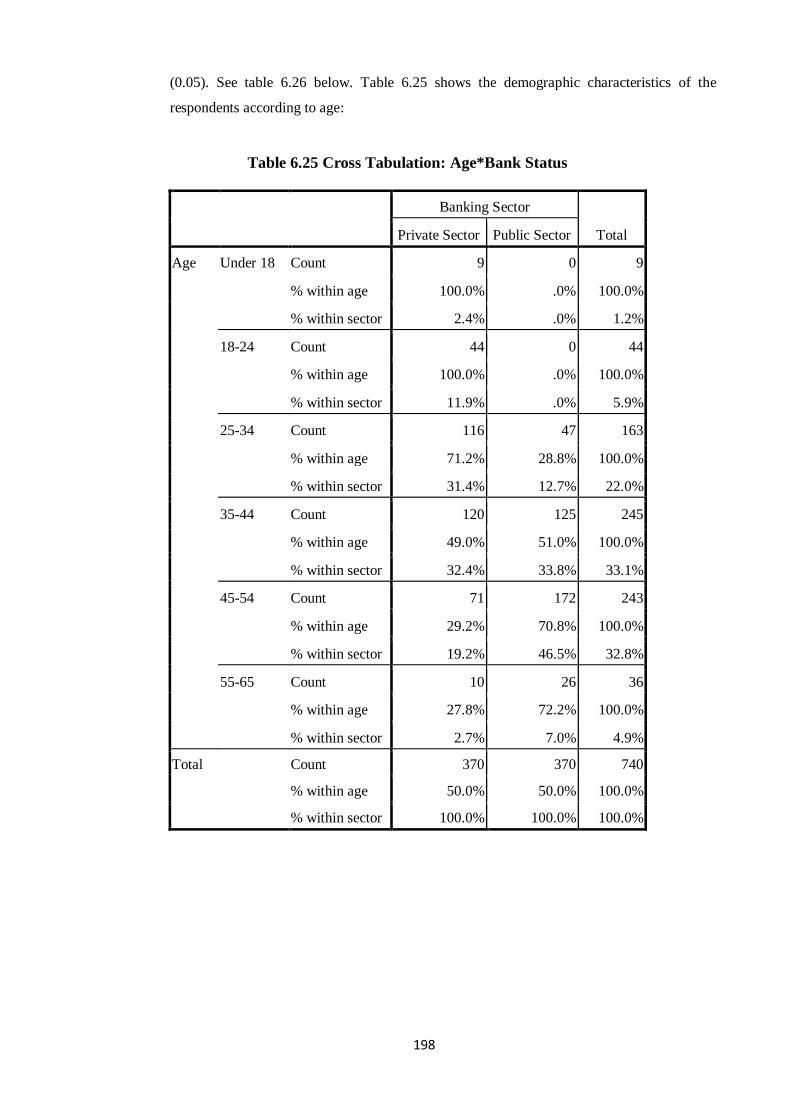
198
(0.05). See table 6.26 below. Table 6.25 shows the demographic characteristics of the
respondents according to age:
Table 6.25 Cross Tabulation: Age*Bank Status
Banking Sector
Total Private Sector Public Sector
Age Under 18 Count 9 0 9
% within age 100.0% .0% 100.0%
% within sector 2.4% .0% 1.2%
18-24 Count 44 0 44
% within age 100.0% .0% 100.0%
% within sector 11.9% .0% 5.9%
25-34 Count 116 47 163
% within age 71.2% 28.8% 100.0%
% within sector 31.4% 12.7% 22.0%
35-44 Count 120 125 245
% within age 49.0% 51.0% 100.0%
% within sector 32.4% 33.8% 33.1%
45-54 Count 71 172 243
% within age 29.2% 70.8% 100.0%
% within sector 19.2% 46.5% 32.8%
55-65 Count 10 26 36
% within age 27.8% 72.2% 100.0%
% within sector 2.7% 7.0% 4.9%
Total Count 370 370 740
% within age 50.0% 50.0% 100.0%
% within sector 100.0% 100.0% 100.0%

199
Table 6.26 Chi-Square Tests
Value df
Asymp. Sig. (2-
sided)
Pearson Chi-Square 131.401a 5 .000
Likelihood Ratio 154.372 5 .000
Linear-by-Linear
Association
124.639 1 .000
N of Valid Cases 740
a. 2 cells (16.7%) have expected count less than 5. The minimum
expected count is 4.50.
6.3.4.3 Pearson‟s Chi-Square test of participants‟ occupation according to bank status
The relationship between customer occupation and the banking sector was positive where p
value is .000 which is lower than the acceptable confidence level (0.05). See table 6.28
below. Table 6.27 shows the demographic characteristics of the respondents according to
occupation:
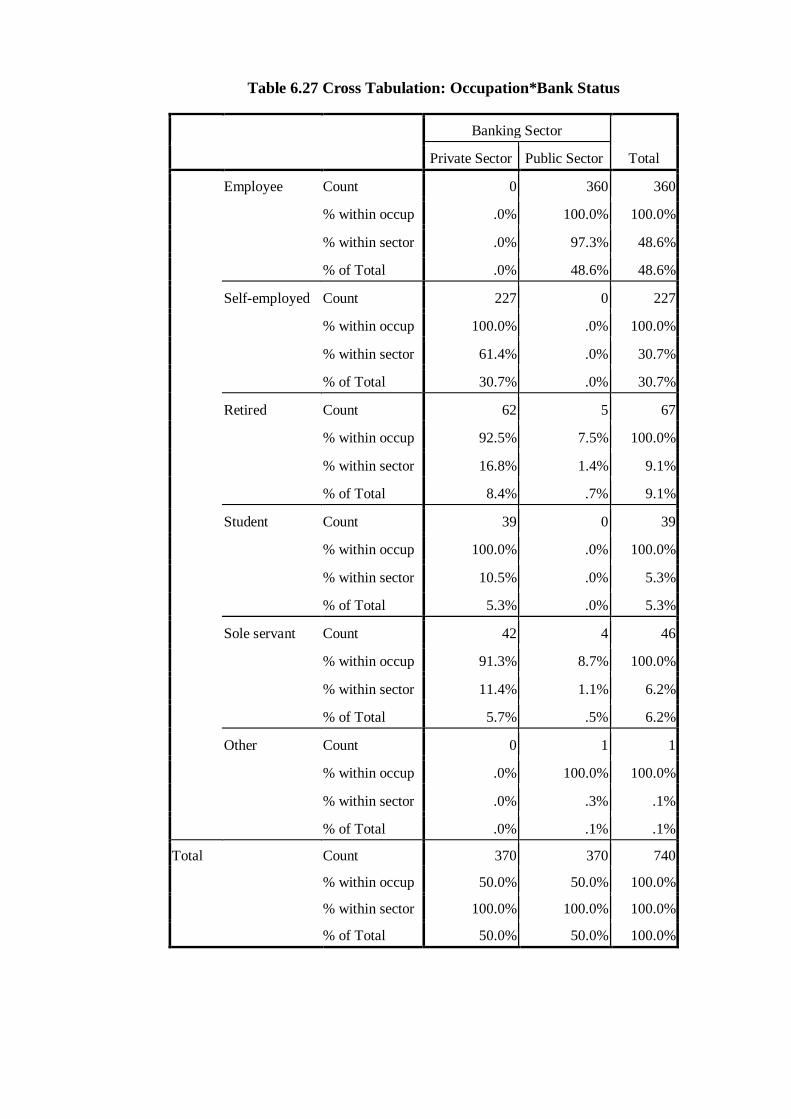
200
Table 6.27 Cross Tabulation: Occupation*Bank Status
Banking Sector
Total Private Sector Public Sector
Employee Count 0 360 360
% within occup .0% 100.0% 100.0%
% within sector .0% 97.3% 48.6%
% of Total .0% 48.6% 48.6%
Self-employed Count 227 0 227
% within occup 100.0% .0% 100.0%
% within sector 61.4% .0% 30.7%
% of Total 30.7% .0% 30.7%
Retired Count 62 5 67
% within occup 92.5% 7.5% 100.0%
% within sector 16.8% 1.4% 9.1%
% of Total 8.4% .7% 9.1%
Student Count 39 0 39
% within occup 100.0% .0% 100.0%
% within sector 10.5% .0% 5.3%
% of Total 5.3% .0% 5.3%
Sole servant Count 42 4 46
% within occup 91.3% 8.7% 100.0%
% within sector 11.4% 1.1% 6.2%
% of Total 5.7% .5% 6.2%
Other Count 0 1 1
% within occup .0% 100.0% 100.0%
% within sector .0% .3% .1%
% of Total .0% .1% .1%
Total Count 370 370 740
% within occup 50.0% 50.0% 100.0%
% within sector 100.0% 100.0% 100.0%
% of Total 50.0% 50.0% 100.0%

201
Table 6.28 Chi-Square Tests
Value df
Asymp. Sig.
(2-sided)
Pearson Chi-Square 706.884a 5 .000
Likelihood Ratio 963.108 5 .000
Linear-by-Linear
Association
303.012 1 .000
N of Valid Cases 740
a. 2 cells (16.7%) have expected count less than 5. The minimum
expected count is .50.
6.3.4.4 Pearson‟s Chi-Square test of participants‟ number of branch visits according
to bank status
It was also found from the Chi-Square test that there is a positive relationship between the
number of branch visits and the banking sector, where p value is .000 which is lower than the
acceptable confidence level (0.05); see Table 6.30 below. Table 6.29 displays the
demographic characteristics of the respondents according to number of branch visit:
Table 6.29 Cross Tabulation: Number of Branch Visits*Bank Status
Number of branch visits
Total
Once a week or
more often
Less often than
once a week
but once a
month or more
Less often than
once a month
Sector Private Sector Count 246 81 43 370
% within sector 66.5% 21.9% 11.6% 100.0%
Public Sector Count 0 272 98 370
% within sector .0% 73.5% 26.5% 100.0%
Total Count 246 353 141 740
% within sector 33.2% 47.7% 19.1% 100.0%

202
Table 7.30 Chi-Square Tests
Value df
Asymp. Sig.
(2-sided)
Pearson Chi-Square 370.800a 2 .000
Likelihood Ratio 472.155 2 .000
Linear-by-Linear
Association
243.156 1 .000
N of Valid Cases 740
a. 0 cells (.0%) have expected count less than 5. The minimum
expected count is 70.50.
6.3.4.5 Pearson‟s Chi-Square test of participants‟ relationship with bank
(duration of relationship with bank) according to banking sector
With regard to the relationship between the period of dealing with the bank and the banking
sector, it was noted from the Chi-Square test that there is a positive relationship between the
two variables where p value is .000 which is lower than the acceptable confidence level
(0.05), see Table 6.32 below. The demographic characteristics of the respondents according
to the period of dealing with bank are shown in Table 6.31 below:
Table 6.31 Cross Tabulation: Duration of relationship with Bank*Bank Status
Period of relationship with bank
Total
More than
5 year 3-5 years 2 years 1 year
Sector Private Sector Count 279 70 16 5 370
% within sector 75.4% 18.9% 4.3% 1.4% 100.0%
Public Sector Count 222 74 74 0 370
% within sector 60.0% 20.0% 20.0% .0% 100.0%
Total Count 501 144 90 5 740
% within sector 67.7% 19.5% 12.2% .7% 100.0%

203
Table 6.32 Chi-Square Tests
Value Df
Asymp. Sig.
(2-sided)
Pearson Chi-Square 48.974a 3 .000
Likelihood Ratio 54.067 3 .000
Linear-by-Linear
Association
27.966 1 .000
N of Valid Cases 740
a. 2 cells (25.0%) have expected count less than 5. The minimum
expected count is 2.50.
6.4 Discussion on the Study‟s Statistical Tests‟ Results
6.4.1 Mean scores of customers‟ perceptions of service quality
Descriptive statistics such as means measure were used to examine the levels of service
quality as perceived by the customers of Libyan private and public banks. The means
measure results showed that private banks outperform public banks in terms of service
quality levels as measured by service quality dimensions of effectiveness and assurance,
access, price, tangibles, services portfolio and reliability. The private banking sector was
superior in terms of delivering all six dimensions used in the measurement.
These outcomes were in line with findings of studies by Kangis and Vouklatos (1997),
Sureshchandar, Rajendran and Anantharaman (2003). These researchers used different
service quality instruments to compare the private banks with public banks in terms of
service quality levels and their findings demonstrated the superiority of the private banks.
On the other hand, these research findings in fact explain why customers started moving
towards private banks in Libya, since in 2001 there was one private bank (Bank of
Commerce and Development) and ten public banks (Central Bank of Libya). Today there are
eight private banks and six public banks, which evidently reflects the rapid growth of the
private banking sector. In contrast, the number of public banks was reduced from ten banks
in 2001 to six banks in 2010 (Central Bank of Libya). A major reason for this is that
customers change their service providers when faced with the unsatisfactory resolution of
problems (Levesque and McDougall, 1996).
In this decade the Libyan government started implementing the privatization policy within
the public banks because of the weak performance associated with this sector (Central Bank
of Libya). Additionally, some of the public banks try to benefit from the experience of the
international financial institutions to increase the performance levels. For instance, the

204
management of Al-Gamhuria Bank (a public Bank) has reached an agreement in Jun 2010
with Oxford Prince Group, which is an institution for consultancy and research (Almanara
News). Moreover, the Libyan Government has signed a contract in June 2010 with
institutions from France and Tunisia to train some of the public banks employees on the
international standards of banking services (Almanara News, 2010).
Because these findings showed low levels of service quality in the Libyan public banking
sector in terms of all service quality dimensions, the managements of the public banks
should focus on the antecedents that play a crucial role in determining the level of service
quality and in enhancing customer loyalty and customer satisfaction, which in turn increase
the bank‟s share of customers and in the long run enable the bank to achieve high
profitability. The studies of Almossawi (2001), Edris (1997), Johnston (1997), Kangis and
Passa (1997) and Levesque and McDougall (1996) identified a set of antecedents that play a
very important role in forming the customers‟ attitudes towards service quality in banks.
These antecedents include: the attentiveness and commitment shown by the staff to their
customer; friendliness of staff; communication with customer; efficiency of staff and
confidentiality of the service; personnel; employees‟ ability to listen to customer enquiries
and react positively to his/her needs and complaints; employees‟ trustworthiness and
demonstration of knowledge; employees‟ courteousness and responsiveness; help in
financial emergencies; bank experience; bank image; knowledge of firm‟s activities; shorter
waiting time and promptness; prompt provision of services and products; size of bank‟s
assets; word of mouth and physical cues; media; competitive finance rates; distributing high
profits on savings; price; availability of problem recovery systems; furniture and employees‟
appearance; functionality of machines; ATMs; reliability of transactions; computers;
promises such as error-free statements; and finally, accurate financial transaction.
Table 6.33 summarizes those antecedents which play a vital role in forming the attitudes of
customers towards service quality in the bank:

205
Table 6.33 Factors Contributing to a Successful Delivery of Service Quality in
Banks
Factors
Type
Responsiveness Employee
Personal attention Employee
Trustworthiness Employee
Promptness Employee
Helpfulness Employee
Friendless Employee
Willingness to communicate Employee
Cooperativeness Employee
Competence skills Employee
Discrete behaviour Employee
Interaction skills Employee
Professional advice Employee
Past experience Goodwill
Reputation and image Goodwill
Progressiveness Goodwill
Friendly advice Goodwill
Financial stability Goodwill
Fees and expenses Policy
Price Policy
Timing and opening hours Policy
Availability of products and services Policy
Staff training Policy
Technology-based Policy
Innovation Policy
Understanding customer‟s needs Policy
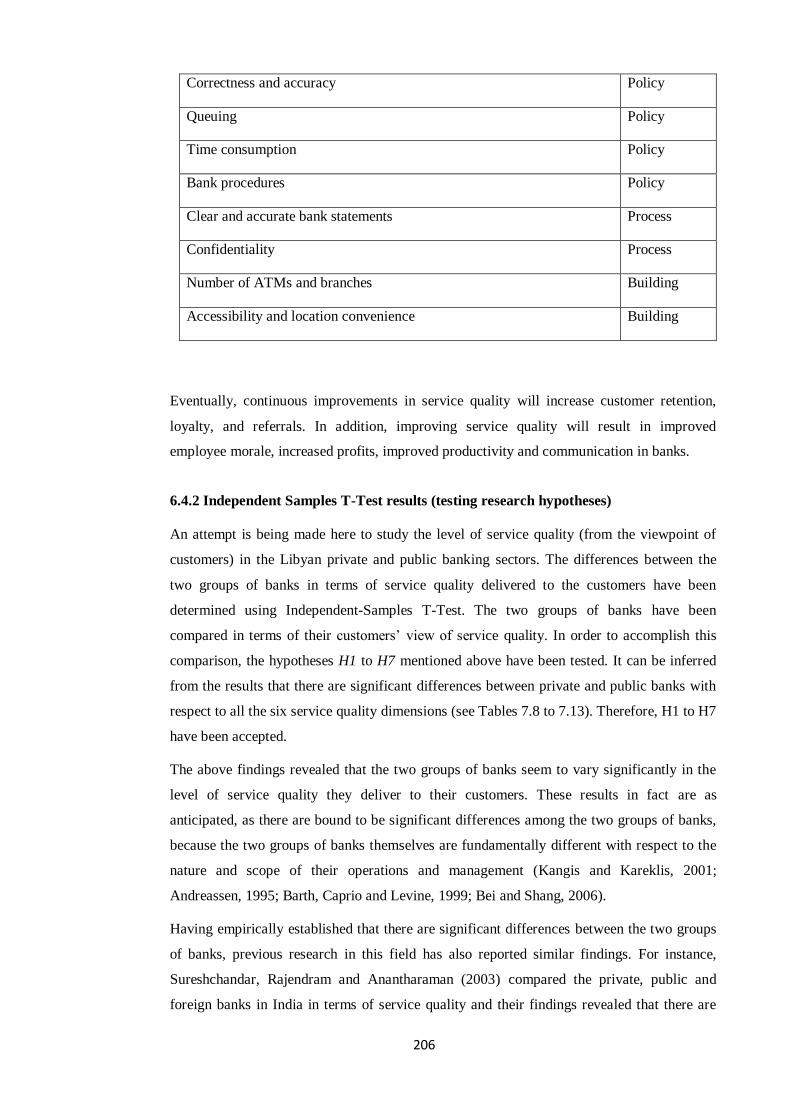
206
Correctness and accuracy Policy
Queuing Policy
Time consumption Policy
Bank procedures Policy
Clear and accurate bank statements Process
Confidentiality Process
Number of ATMs and branches Building
Accessibility and location convenience Building
Eventually, continuous improvements in service quality will increase customer retention,
loyalty, and referrals. In addition, improving service quality will result in improved
employee morale, increased profits, improved productivity and communication in banks.
6.4.2 Independent Samples T-Test results (testing research hypotheses)
An attempt is being made here to study the level of service quality (from the viewpoint of
customers) in the Libyan private and public banking sectors. The differences between the
two groups of banks in terms of service quality delivered to the customers have been
determined using Independent-Samples T-Test. The two groups of banks have been
compared in terms of their customers‟ view of service quality. In order to accomplish this
comparison, the hypotheses H1 to H7 mentioned above have been tested. It can be inferred
from the results that there are significant differences between private and public banks with
respect to all the six service quality dimensions (see Tables 7.8 to 7.13). Therefore, H1 to H7
have been accepted.
The above findings revealed that the two groups of banks seem to vary significantly in the
level of service quality they deliver to their customers. These results in fact are as
anticipated, as there are bound to be significant differences among the two groups of banks,
because the two groups of banks themselves are fundamentally different with respect to the
nature and scope of their operations and management (Kangis and Kareklis, 2001;
Andreassen, 1995; Barth, Caprio and Levine, 1999; Bei and Shang, 2006).
Having empirically established that there are significant differences between the two groups
of banks, previous research in this field has also reported similar findings. For instance,
Sureshchandar, Rajendram and Anantharaman (2003) compared the private, public and
foreign banks in India in terms of service quality and their findings revealed that there are
207
significant differences between private and public banks with respect to all factors of service
quality used in the measurement.
Kangis and Voukelatos (1997) have compared private banks with public banks in Greece and
when they applied T-Test on the differences between the mean scores of the two groups of
banks, it was noted that in eight out of the twelve service quality items, the differences were
statistically significant.
Ultimately, the present study has critically examined the differences between the private and
public banks in Libya in terms of service quality (from the perspective of customers). The
two groups of banks seem to vary significantly with respective to delivery of the six service
quality dimensions of effectiveness and assurance, access, price, tangibles, services portfolio
and reliability.
6.4.3 Exploratory Factor Analysis results
It was noted from the factor analysis outcome that for private sector banks the first factor
explains the higher percentage of variation 19.337% and 18.239% for private and public
sector banks respectively. More importantly, the private and public banks‟ customers
emphasise a great degree of importance on effectiveness and assurance dimension as this
was ranked as the first factor in both banking sectors. For private banks‟ customers,
delivering the promised service, training the banks‟ personnel, indications of quality,
confidentiality and feeling of security seem to constitute the most important items within the
effectiveness and assurance items. For public banks‟ customers, however, confidence and
delays due to bureaucratic factors and procedures are of high importance. The recognition as
regular customers means knowing the customer on a personal basis, waiting time, and
interruption of the service are proved to be of high value too.
Price is the least important factor for the customers of private sector banks explaining the
percentage of variation 7.839 %, while reliability is the least important factor for the
customers of public sector banks explaining the percentage of variation 7.323%. The
positioning of pricing as the least relevant factors in the formation of service quality
perceptions of private banks‟ customers may be due to the fact that price competition is a
recent development in Libyan banking. Reliability is the least important factor for public
banks‟ customers, and this could be due to the fact that the majority of public banks‟
customers are from public sector‟s employees. They consider the effective and high speed of
service delivery as urgent needs. This is because that they suffering from bad infrastructure
associated with public banks (Twati and Gammack, 2007). Although they ranked the
reliability dimension as the last factor, this does not mean that the dimension is not important
for them; rather, this could be the consequence of prioritising other needs in its place.

208
When compared with private banks, it is no wonder that public banks, are able to deliver top
class service (e.g. ATM, telephone banking, room service facility, and other innovative
services) more effectively as identified from the previous analysis in the section of
descriptive analysis of service quality. This in fact could make the public banks‟ customers
consider the importance of service quality dimensions based on their needs.
However, the customers of the two groups of banks attach great importance to effectiveness
and assurance, and their view of the latter dimension is in line with the findings of studies
undertaken by Glaveli et al. (2006) and Petridou et al. (2007) who argue that effectiveness
and assurance are the most important dimensions for banks‟ customers in Greece, since the
effectiveness dimension was ranked as the most important dimension followed by assurance
dimension. This view agrees with Bahia and Nantel‟s (2000) empirical conclusions in that
the effectiveness and assurance is the most important dimension for the banking customers in
Canada.
According to these findings, the managers of the private and public banks should make a
considerable effort to ensure the effective delivery of service (especially the courtesy and
friendliness of employees) and the ability of staff to inspire a feeling of security. Also banks
managers should make sure that the staff have the ability to deal confidentially with and
exhibit their communication skills to clients. Furthermore, the management must guarantee
that bank employees are able to show a personal interest in their customers‟ concerns and
understand their needs.
It is therefore argued that the results clearly demonstrate that there is a difference between
the ranking of the quality dimensions by customers of the Libyan private and public banking
sectors, which addresses the third research objective (to identify if there are differences
between the Libyan private and public banks‟ customers in terms of the degree of
importance attached to various dimensions of service quality).
This analysis should be considered in the light of the following reality- the set of service
quality dimensions appeal to customers in varying degree of importance. For this reason, in
many cases a quality factor appears to have a low weight factor, however and this does not
necessarily mean that it is not important to customers.
The questionnaire used in this study reflected a high degree of reliability, with BSQ
dimensions reaching 0.973 within private banks and 0.988 within public banks; this means
that the composition of the BSQ scale as a whole is perfectly suitable to measure the
perceived level of service quality offered by Libyan private and public banking sectors. The
results also showed high percentages of the total variance explained for each dimension
within the groups of banks. This in fact reflects the importance of these dimensions in the
formation of customer perceptions of the private and public banks regarding the level of
209
service quality offered by each bank. These results also confirm that BSQ is a standard scale
and its dimensions are suitable, valid and reliable for measuring service quality within the
banking environment (Bahia and Nantel, 2000; Petridou et al., 2007; Glaveli et al., 2006;
Spathis, Petridou and Glaveli, 2004).
However, the evident validity and reliability of BSQ in this research study is not surprising,
although it was originally developed in Canada (a Western country). This because the
literature clearly supported that some customer satisfaction measures are transferable across
cultural and international boundaries. For instance, the study of Veloutsou et al. (2005, p. 22)
examined a customer satisfaction survey in four culturally diverse contexts, and they found
that:
“Some common satisfaction measures identified in previous studies can be used to
gauge the relative service satisfaction effectiveness across international boundaries.
Some slight modifications may improve the reliability and suitability of these
measures. However, these modifications are not really necessary, since the original
measures are both reliable and valid”.
6.4.4 Pearson‟s Chi-Square test results
It was noted that a test was carried out to establish the relationship between the demographic
factors of customers and the type of banking sector (bank status). The demographic factors
included customer gender, customer age, customer occupation, the number of branch visits
and the duration of relationship with bank. The results showed that there is no relationship
between the customer gender and the type of banking sector, while they showed the
existence of a significant relationship between the other demographic variables (customer
age, customer occupation, number of branch visits and the duration of relationship with
bank) and the bank status. Figure 6.3 sheds light on this relationship. Thus it is
recommended to the management of Libyan banks that they consider these pivotal elements
when they set out their marketing segmentation plan. Notably, the relationship between the
demographic characteristics of the banks‟ customers and bank status was not examined
within the literature of previous research. Therefore, somewhat surprisingly perhaps, it is
noted that this study will be the first piece of research to investigate this relationship.
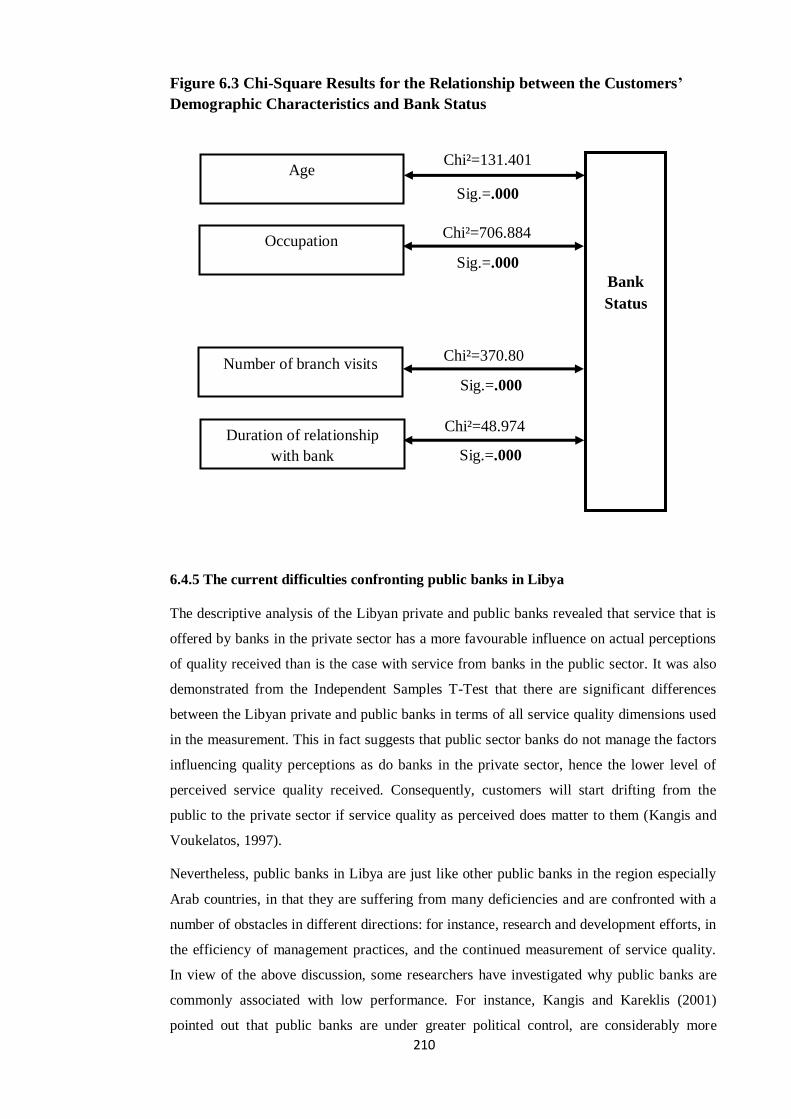
210
Figure 6.3 Chi-Square Results for the Relationship between the Customers‟
Demographic Characteristics and Bank Status
6.4.5 The current difficulties confronting public banks in Libya
The descriptive analysis of the Libyan private and public banks revealed that service that is
offered by banks in the private sector has a more favourable influence on actual perceptions
of quality received than is the case with service from banks in the public sector. It was also
demonstrated from the Independent Samples T-Test that there are significant differences
between the Libyan private and public banks in terms of all service quality dimensions used
in the measurement. This in fact suggests that public sector banks do not manage the factors
influencing quality perceptions as do banks in the private sector, hence the lower level of
perceived service quality received. Consequently, customers will start drifting from the
public to the private sector if service quality as perceived does matter to them (Kangis and
Voukelatos, 1997).
Nevertheless, public banks in Libya are just like other public banks in the region especially
Arab countries, in that they are suffering from many deficiencies and are confronted with a
number of obstacles in different directions: for instance, research and development efforts, in
the efficiency of management practices, and the continued measurement of service quality.
In view of the above discussion, some researchers have investigated why public banks are
commonly associated with low performance. For instance, Kangis and Kareklis (2001)
pointed out that public banks are under greater political control, are considerably more
Age
Occupation
Number of branch visits
Duration of relationship
with bank
Chi²=131.401
Sig.=.000
Chi²=706.884
Sig.=.000
Chi²=370.80
0 Sig.=.000
Chi²=48.974
Sig.=.000
Bank
Status
211
bureaucratic, and appear less concerned about the profit. They also add that there is a
political imperative on public banks to serve less profitable and poorer customers. Therefore,
considering the private sector as composed of profit-seeking organisations has led to the
neglect of public services (Andreassen, 1995).
Within the outcomes of the study of Ti Bei and Shang (2006), it was revealed that public
organisations rely on government for large part of their funding, while these organisations
merely receive a small amount from market user fees, which reflects that public banks tend
to be associated with poor marketing strategies (Barth, Caprio and Levine, 1999). It was also
clear from the findings of the study of Ti Bei and Shang (2006) that public banks have no
competitive advantage compared with their private competitors. Also, they found that there
were no training programs for public banks‟ employees including two areas. The first is
customer-oriented service standard for enhancing the employees‟ basic performance. The
second area is service related information for improving employees‟ understanding of
service.
With regard to the current difficulties confronting public banks in Libya, the empirical
results of the present study have shown the areas of weakness associated with public banks.
For public banking services, there was a low level of quality for all service attributes (see
Tables 6.2 to 6.7). The results are 2.4242, 1.5593, 2.2270, 1.9689, 1.5513 and 1.6945 for the
services quality dimensions of effectiveness and assurance, access, price, tangibles, services
portfolio and reliability respectively.
Following the service literature, the problems associated with Libyan public banks can be
diagnosed in the form of managerial difficulties and accessibility and technology-related
difficulties.
6.4.5.1 Managerial Difficulties
Following service literature, it was noted that there are certain factors which lie behind the
existence of the service quality gaps (Zeithaml, Parasuraman and Berry, 1990; Parasurman,
Zeithaml and Berry, 1988; Zeithaml, Berry and Parasuraman, 1992).
Zeithaml, Parasuraman and Berry, (1990) did mention that four major gaps may exist and
prevent the organisation from reaching a high level of service quality. These gaps are caused
by managerial practices and are as follows:
1. Gap One: the management and employees do not have the knowledge and are
unaware of the customers' needs as a result of failing to conduct appropriate research
and development or not recognising and implementing research findings, along with
weak upward communication.

212
2. Gap Two: absence of management commitment and an absence of service quality
standards.
3. Gap Three: existence of difficulties which are related to employee performance; for
instance, employee job-fit, role conflict, role ambiguity, supervisory functions,
control, team working and technology.
4. Gap Four: absence of horizontal communication and tendency to publicize
unrealistic promises.
In this regard, the Libyan public banks appear to be in need of investing more funds in
management skills training, setting training plans for their employees, empowering
employees by giving them responsibilities and a real voice, encouraging employees to see
service quality as their responsibility, enhancing upward and downward communications,
and building rewards systems and continuous improvement. In particular, the findings of this
study confirm those of another study, which demonstrated that the public banking sector is
not yet up to the task (unlike the private banking sector) of respecting the quality of services
they deliver in terms of diversity, the range of service offered, depth, and intensity
(Sureshchandar, Rajendran and Anantharaman, 2003). It can be argued that part of the
responsibility for the low performance of public banks can be directed to managers.
Within literature, it was suggested that management should have a flexible organisational
structure as part of their modern vision and strategy. Figure 7.4 shows the traditional and
modern model of organisational structure:

213
Figure 6.4 Traditional versus Modern Organization Chart
Source: Obaid (2006, p. 224)
Zeithaml, Berry and Parasuraman, (1992) have also stated that the extent of communication
between managers and employees is the most important antecedent of service quality.
Additionally, there are number of elements that can be categorised under the levels of
management. These elements are the layers that may exist between the top managers and
customer contact personnel, which in turn affect the size of service quality gap (Grapentine,
1998).
In addition, managers negatively affect service quality levels when they ignore their role in
providing the required resources for service quality programmes and also when they are
away from their commitment in providing the consistent and effective strategies for
designing and delivering the desired service quality levels. In view of the above discussion
the successful bank management has a pivotal role in delivering the desired levels of service
quality. As identified in this research, public banks providing low levels of service quality to
Traditional Model Modern Model
Work Force
Middle
Management
Top
Management
Middle
Management
Work
Force
Top
Mana-
gement
S
u
p
p
o
r
t
S
u
p
p
o
r
t
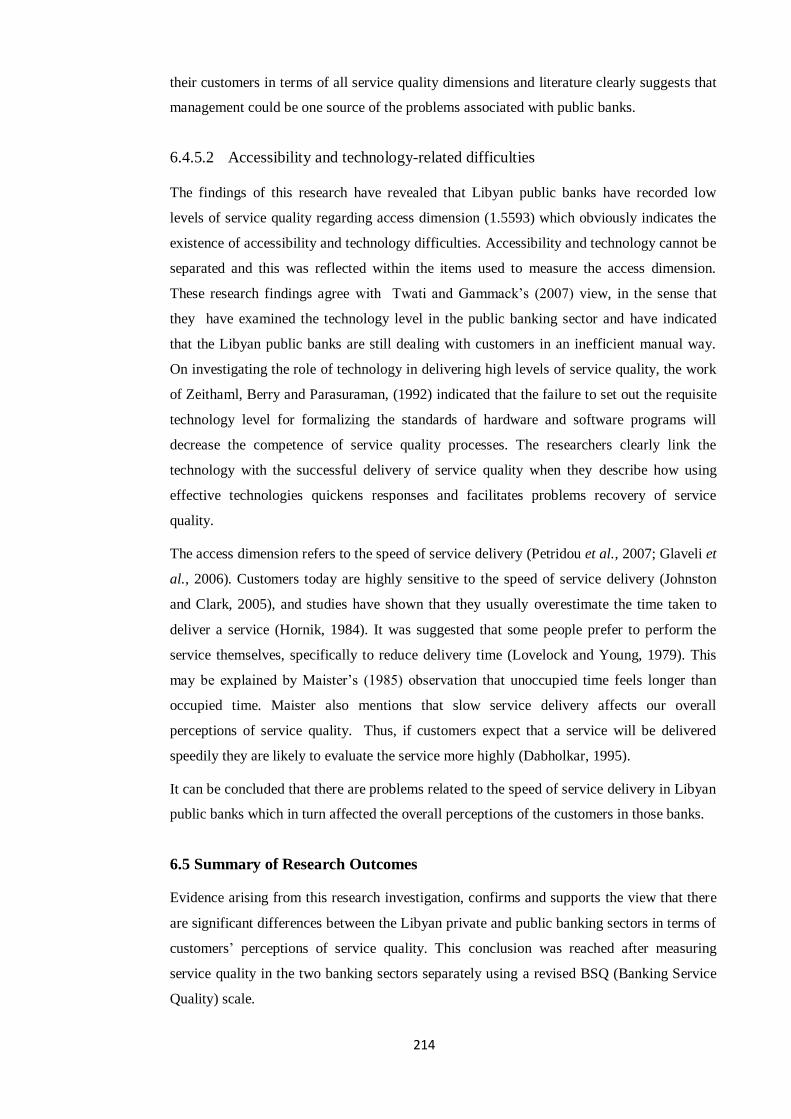
214
their customers in terms of all service quality dimensions and literature clearly suggests that
management could be one source of the problems associated with public banks.
6.4.5.2 Accessibility and technology-related difficulties
The findings of this research have revealed that Libyan public banks have recorded low
levels of service quality regarding access dimension (1.5593) which obviously indicates the
existence of accessibility and technology difficulties. Accessibility and technology cannot be
separated and this was reflected within the items used to measure the access dimension.
These research findings agree with Twati and Gammack‟s (2007) view, in the sense that
they have examined the technology level in the public banking sector and have indicated
that the Libyan public banks are still dealing with customers in an inefficient manual way.
On investigating the role of technology in delivering high levels of service quality, the work
of Zeithaml, Berry and Parasuraman, (1992) indicated that the failure to set out the requisite
technology level for formalizing the standards of hardware and software programs will
decrease the competence of service quality processes. The researchers clearly link the
technology with the successful delivery of service quality when they describe how using
effective technologies quickens responses and facilitates problems recovery of service
quality.
The access dimension refers to the speed of service delivery (Petridou et al., 2007; Glaveli et
al., 2006). Customers today are highly sensitive to the speed of service delivery (Johnston
and Clark, 2005), and studies have shown that they usually overestimate the time taken to
deliver a service (Hornik, 1984). It was suggested that some people prefer to perform the
service themselves, specifically to reduce delivery time (Lovelock and Young, 1979). This
may be explained by Maister‟s (1985) observation that unoccupied time feels longer than
occupied time. Maister also mentions that slow service delivery affects our overall
perceptions of service quality. Thus, if customers expect that a service will be delivered
speedily they are likely to evaluate the service more highly (Dabholkar, 1995).
It can be concluded that there are problems related to the speed of service delivery in Libyan
public banks which in turn affected the overall perceptions of the customers in those banks.
6.5 Summary of Research Outcomes
Evidence arising from this research investigation, confirms and supports the view that there
are significant differences between the Libyan private and public banking sectors in terms of
customers‟ perceptions of service quality. This conclusion was reached after measuring
service quality in the two banking sectors separately using a revised BSQ (Banking Service
Quality) scale.

215
The findings above therefore address the main aim of the study (To identify if there
significant differences between the Libyan private and public banking sectors in terms of
customer perceptions of service quality) and provides an answer to the research question:
Are there significant differences between the Libyan private and public banking sectors in
terms of customers‟ perceptions of service quality?
In addition, the study addressed the following research objectives:
1. To explore literature on the concept of service quality.
2. To examine various approaches in measuring service quality with focus on banking
service quality measurement.
3. To identify the actual levels of service quality provided to banks‟ customers in
Libyan private and public banking sectors.
4. To identify the differences between the Libyan private and public banks‟ customers
in terms of the degree of importance attached to various dimensions of service
quality.
5. To identify if the customer demographic characteristics are related to their banking
sector (bank status).
Accordingly, the findings from the research show that:
1. To address the first and second research objectives the literature was reviewed with
regard to the areas of service quality concept and measuring service quality.
2. The levels of service quality provided by private banking sector to their customers
with regard to all service quality dimensions are high, while the levels of service
quality provided public banking sector to their customers with regard to all service
quality dimensions were low.
3. There are differences between the Libyan private and public banks‟ customers in
terms of the degree of importance attached to various dimensions of service quality.
The private banks customers ranked the six dimensions as effectiveness and
assurance, tangibles, access, services portfolio, reliability and price, while the public
banks customers ranked the six dimensions as effectiveness and assurance, access,
tangibles, services portfolio, price and reliability.
4. Not all customer characteristics are related to their bank status. The results show that
there is no relationship between customer gender and bank status, while there is a
positive relationship between bank status and demographic variables of customer
age, customer occupation, the number of branch visits and duration of relationship
with bank.

216
6.6 Chapter Summary
This chapter investigated the service quality levels provided by the Libyan private and public
banks. The chapter also examined the research hypotheses concerning the differences
between private and public banks in terms of customers‟ perceptions of service quality.
These hypotheses, together with a summary of the test results are shown in table 6.34 below.
In addition, in this chapter the dimensions of BSQ were factor analysed to compare the
private and public banks‟ customers in terms of the degree of importance attached to various
dimensions of service quality, and also to examine the suitability and validity of the six
service quality dimensions - effectiveness and assurance, access, price, tangibles, services
portfolio and reliability - for measuring service quality levels within Libyan banks.
This was followed by Pearson‟s Chi-Square analysis to investigate the relationship between
the participants‟ demographic characteristics and bank status. The chapter also discussed the
results of statistical tests used in this study.
Based on the research hypotheses test results and the results of other statistical tests used in
the present study, the next chapter will present the research findings and implications. The
next chapter will also introduce the reader to the research contribution, limitations and
suggestions for future research.

217
Table 6.34 Summary of Hypotheses Testing
Hypotheses
Results
H.1.
There are significant differences between the Libyan private and
public banking sectors in terms of service quality with respect to the
the effectiveness and assurance dimension.
Supported
H.2. There are significant differences between the Libyan private and
public banking sectors in terms of service quality with respect to the
access dimension.
Supported
H.3. There are significant differences between the Libyan private and public
banking sectors in terms of service quality with respect to the price
dimension.
Supported
H.4. There are significant differences between the Libyan private and
public banking sectors in terms of service quality with respect to the
tangibles dimension.
Supported
H.5. There are significant differences between the Libyan private and
public banking sectors in terms of service quality with respect to the
services portfolio dimension.
Supported
H.6. There are significant differences between the Libyan private and
public banking sectors in terms of service quality with respect to the
reliability dimension.
Supported
H.7. There are significant differences between the Libyan private and public
banking sectors in terms of service quality with respect to all service
quality dimensions taken together.
Supported

218
Chapter Seven
Conclusion and Recommendations
219
Chapter 7: Conclusion and Recommendations
7.0 Introduction
This study aimed at measuring the perceived service quality of the Libyan private and public
banking sectors to identify if there are significant differences between the two groups of
banks in terms of customer perceptions of service quality.
This chapter will present the conclusion that arises from the discussion of the study‟s
findings. It begins with the presentation of the brief review of the research theoretical
background and research findings.
Then, implications of the study are provided. In addition, a discussion on research
contributions is made. Finally, limitations of the study and generalization issues are
considered. The chapter ends by providing recommendations for future studies.
7.1 Chapter Objective
The purpose of this chapter is to extract valuable insights and conclusions with regard to the
findings, contribution and implications of the study.
7.2 Brief Review
Evidence from various studies supports that private banks outperform public banks with
respect to service quality levels (Kangis and Voukelatos, 1997; Bei and Shang, 2006).
Although, much has been written on the topic of service quality, there is no research
investigating the differences between the private and public banks in terms of the perceived
service quality in a developing country such as Libya. However, the existing literature
extensively supported the idea of conducting research into the topic of service quality in
different environmental circumstances, because environmental and cultural factors could
affect customer perceptions of service quality (Furrer, Liu and Sudharshan, 2000; Witkowski
and Wolfinbarger, 2000).
Therefore, an analysis of banks in Libya from a “service quality perspective” should be an
interesting prospect. Such an investigation may provide the banks with subtle, intricate
information that will help them to reach the elusive competitive edge they are searching for.
Furthermore, these service quality issues have long been ignored in developing economies
when compared to research carried out in developed economies such as USA and Europe
(Firoz and Maghrabi, 1994; Kassem, 1989).
This study on banking service quality has been dominated by research aimed at measuring
the perceived service quality of the Libyan private and public banking sectors. The study
220
used a modified BSQ scale which was originally developed by Bahia and Nantel (2000), and
comprised six service quality dimensions of effectiveness and assurance, access, price,
tangibles, services portfolio and reliability. It was proved within the literature that these six
service quality dimensions are valid and suitable for the effective measurement of service
quality within the banking environment (Glaveli et al., 2006; Petridou et al., 2007; Spathis,
Petridou and Glaveli, 2004). After the pilot study, BSQ scale was slightly amended;
basically, the alterations entailed rewording some of the scale items. The statistical analysis
of the study showed that the six service quality dimensions mentioned above are indeed
valid, reliable and suitable to measure service quality within Libyan banks which helped to
achieve the research objectives.
7.2.1 Brief review of research theoretical background
The most important questions that have been extensively debated within the research
literature over the last three decades are what is perceived service quality? How must service
quality be measured? (Parasuraman, Zeithaml and Berry, 1985, 1988, 1994; Cronin and
Taylor, 1992; Brady and Cronin, 2001). In order to provide answers for these two questions,
the literature on service quality proposed numerous models originating from different
researchers across the world. Chapter Two of this research reviewed some of these models.
It was identified that within the literature review of this research, service quality models have
really contributed a better understanding of the service quality concept. Overall, the
theoretical framework of service quality can be described through two schools of service
quality models. These schools are North American School (Gap Analysis Model) and Nordic
School.
The North American Gap School: This model is the most widely reported theoretical
framework of service quality and it was suggested by Parasuraman, Zeithaml and
Berry (1985). Gap Analysis Model identifies a set of gaps that exist relating to
executive perceptions of service quality and the tasks linked with service delivery to
customers. According to their view, service quality gaps are measured by the
difference between the two scores- performance-minus-expectations (P-E).
The Nordic School: This model was developed by Gronroos (1984). Here, service
quality is conceptualised as the result of a comparison between expected service and
perceived service. Groonroos also argues that perceived service quality is being
assessed by technical and functional dimensions. Technical dimension refers to what
a consumer perceived during their interaction with the service, while functional
dimension refers to how technical quality is transferred to the customers.

221
The two models were integrated later into one model which is Hierarchical model. This
model was developed by Brady and Cronin (2001), and they concluded in their model that
perceived service quality is based on three dimensions of customer employee interaction,
service environment and outcome. Within this model it was supported that service quality is
a multidimensional and multilevel construct. For each dimension there are three sub-
dimensions which form the perception of that dimension. The combined perception of
interaction quality, physical environment quality and outcome quality could lead to the
overall service quality perception.
All these three models share a common aspect in that they propose a multidimensional
service quality conceptualization which was originally linked to the measurement of
customer perceptions of service quality. It can therefore be argued that service quality
models offer a framework for understanding the concept of service quality as well as how
service quality can be measured through each proposed conceptualization.
More recently, marketing literature has offered another classification of service quality
models as Martinez and Martinez‟s (2010) work has classified service quality models into
three distinct groups, showing their conceptualization:
Multidimensional reflective model: This model suggests that the proposed
dimensions have different forms as shown by perceived service quality. Similarly,
these dimensions result in variations in their respective subdimensions, and, lastly,
the indicators are observable representations of each subdimension (e.g. Hierarchal
model).
Multidimensional formative models: The service quality construct is built by its
dimensions and this does not exist separately from its dimensions. SERVQUAL and
SERVPERF are conceptually the best examples of these kinds of models. These
models proposed that perceived service quality is derived from dimensions.
Accordingly, dimensions and service quality are not separate concepts.
Multidimensional formative-reflective model: This kind of model includes both the
formative and reflective approaches whereby service quality construct is built by the
primary dimensions. These dimensions are reflected by several sub dimensions
which act as indicators of the dimensions (e.g. Hierarchal model). Furthermore,
additional items can be added to measure the dimensions and subdimensions.
Following the literature review in Chapter Two, the thesis also focused on studying various
methods employed to measure service quality as an alternative conceptualization of service
quality. For instance, several studies suggest using modified versions of SERVQUAL model
based on the industry that the scale is being employed for (Cronin and Taylor, 1992;
Parasuraman, Zeithaml, and Berry, 1991, 1994; Bahia and Nantel, 2000). This study

222
therefore supports these previous studies resulting in the successful conceptualization and
measurement of service quality by the use of modified SERVQUAL instrument based on the
banking industry (BSQ Scale).
The SERVQUAL scale developed by Parasuraman, Zeithaml and Berry (1988) comprises
22-items which measure service quality along five dimensions, namely: reliability:
responsiveness; assurance; empathy; and tangibles. This scale forms the foundation on which
all other works have been built. Although, it was widely used by researchers, the
conceptualization, operationalization, dimensionality, measurement and applications of
SERVQUAL have been subjected to a number of criticisms (Cronin and Taylor, 1992;
Carman, 1990; Buttle, 1996). Having established such apprehension on the efficacy of
SERVQUAL across different service settings, the major problems associated with the scale
are its dimensionality, universality, and the use of the perception-expectation
disconfirmation approach. In an effort to conceptualize service quality (by taking into
account the aspects of customer-perceived service quality including those related to
banking), Bahia and Nantel (2000) modified SERVQUAL model. They identified six factors
of service quality as referred to above in order to form the BSQ instrument which has been
developed in order to optimally capture all the aspects of service quality, and specifically
address the issues of the banking industry. Therefore, they incorporated additional items
such as access as suggested by Carman (1990), and they also incorporated items which
represent the marketing mix of the “7Ps” (product/service, place, process, participants,
physical surroundings, price and promotion) as identified in the framework of Boom and
Bitner (1981) cited in Bahia and Nantel (2000). In comparing BSQ with SERVQUAL, it was
argued that the distinctive feature of BSQ for banks is related to its content validity. For
instance, the price dimension and services portfolio dimension are absent from SERVQUAL.
It is for this reason (content validity) that the BSQ was chosen for measuring service quality
levels in Libyan banks.
The conclusion that emerges from the discussion and debate is that the conceptualization and
measurement of perceived service quality remains a controversial topics in the service
marketing literature to date, as the necessity of building more creative models of service
quality is still stressed within the literature (Martinez and Martinez, 2010), because of
shortcomings that accompany the existing models.
7.2.2 Review of research findings
The main aim set for this research study was to establish if there are significant differences
between the Libyan private and public banking sectors in terms of service quality levels as
perceived by banks‟ customers. This aim comprises a number of objectives, whose methods
of achievement are summarized and discussed later in this section. In order to detail the
223
major findings of the study, it was worth mentioning that five statistical techniques were
employed in this research to analyze the empirical data collected from customers in the
Libyan private and public banks, they are: means measure, Independent Samples-T Test,
Cronbach‟s coefficient alpha, Factor Analysis, and Pearson‟s Chi-Square, using SPSS,
version 16. These statistical tests were used to analyze 740 usable data from an administered
2000 questionnaires with 37% response rate. The hypotheses associated with the above study
aim were developed as a result of the literature reviews. Based on the research aim and
objective, research findings could be classified under four categories: the first category is the
finding from means measure, the second category is the finding from Independent Samples-
T Test, the third category is the finding from Factor Analysis, and finally the fourth category
is the finding from Pearson‟s Chi-Square.
First, finding from means measure. This finding is relating to addressing the third research
objective (To assess the service quality levels provided to banks‟ customers in the Libyan
private and public banking sectors). Mean scores of the items comprising the six dimensions
used in the measurement were calculated. The mean measure results show that customers of
private banks had higher perceptions than customers of public banks with respect to all six
service quality dimensions (effectiveness and assurance, access, price, tangibles, services
portfolio, and reliability). The results also showed that the biggest difference is related to the
access dimension followed by the reliability dimension, then the services portfolio
dimension followed by the tangibles dimension, price dimension, and the effectiveness and
assurance dimension.
Second, finding from the Independent Sample T-Test. This finding addresses the research
aim, to answer the research question (Are there significant differences between the Libyan
private and public banking sectors in terms of the perceived service quality levels, and to test
research hypotheses. Independent Samples T-Test results propose that there are significant
differences between the Libyan private and public banking sectors regarding the
effectiveness and assurance items, therefore Hypothesis 1 (There are significant differences
between the Libyan private and public banking sectors in terms of service quality with
respect to the effectiveness and assurance dimension) is accepted. It was also found that
there are significant differences between the Libyan private and public banking sectors
regarding the access items, therefore Hypothesis 2 (There are significant differences between
the Libyan private and public banking sectors in terms of service quality with respect to the
access dimension) is accepted. In addition, the results of the statistical test suggest that there
are significant differences between the Libyan private and public banking sectors regarding
the price items, therefore Hypothesis 3 (There are significant differences between the Libyan
private and public banking sectors in terms of service quality with respect to the price
dimension) is accepted. The results also showed that there are significant differences

224
between the Libyan private and public banking sectors regarding the price items, therefore
Hypothesis 4 (There are significant differences between the Libyan private and public
banking sectors in terms of service quality with respect to the tangibles dimension) is
accepted. Furthermore, the findings indicated that there are significant differences between
the Libyan private and public banking sectors regarding the services portfolio items,
therefore Hypothesis 5 (There are significant differences between the Libyan private and
public banking sectors in terms of service quality with respect to the services portfolio
dimension) is accepted. Also there are significant differences between the Libyan private and
public banking sectors regarding the reliability items, therefore Hypothesis 6 (There are
significant differences between the Libyan private and public banking sectors in terms of
service quality with respect to the reliability dimension) is accepted. The statistical test
results also showed that there are significant differences between the Libyan private and
public banking sectors regarding all service quality dimensions taken together, therefore
Hypothesis 7 (There are significant differences between the Libyan private and public
banking sectors in terms of service quality with respect to all services service quality
dimensions taken together) is accepted.
Third, finding from Factor Analysis. This finding addresses the fourth research objectives
(To compare customers of Libyan private and public banks in terms the degree of
importance attached to various dimensions of service quality). The Factor Analysis results
show service quality dimensions comprising the BSQ scale are very important in forming
customers‟ perceptions of service quality in the Libyan private and public banks, since the
results illustrate that the loading factor values for the items that were used to measure BSQ
dimensions (the fifteen items of each identified in the private and public banks) were above
0.50 and these results are significant. It was also observed from comparing the degree of
importance attached to the service quality dimensions between the private and public banks‟
customers that private sector banks‟ customers have identified six factors that were ranked as
follows: effectiveness and assurance, tangibles, access, services portfolio, reliability and
price. While, in the public sector banks the same six factors were identified but with different
degree of importance as follows: effectiveness and assurance, access, tangibles, services
portfolio, price and reliability.
Fourth, finding from Pearson‟s Chi-Square test. This finding addresses the fifth research
objective (To identify if there are relationship between the customer demographic
characteristics and bank status). The results showed that there is a relationship between
demographic variables of age, occupation, number of branch visits, and duration of
relationship with bank status, while there is no relationship between demographic variables
of gender and bank status.
225
These research findings have important empirical implications as discussed and presented
below.
7.3 Implications of the study
These research findings provide interesting insights and generated theoretical implications,
managerial implications and implications for marketing management practices and human
resource management, which still need to be considered within the public banking sector
(since the present research results showed that customers of public banks in Libya expressed
low perceptions of service quality).
7.3.1 Theoretical implications
This study has demonstrated that the dimensions of the BSQ model which were used to
measure the perceived service quality of Libyan private and public banking sectors, are
characterized by a good level of validity and reliability; it is therefore appropriate for
measuring the perceived level of service quality in the Libyan banks.
This study also confirms the findings of other studies which demonstrated that private banks
outperform public banks in terms perceived service quality levels (Kangis and Voukelatos,
1997; Sureshchandar, Rajendaran and Anantharaman, 2003).
7.3.2 Managerial implications
Amongst the research findings of this study, it was found that Libyan public banks expressed
low levels of perceived service quality with respect to all dimensions, and by following the
literature, the problem can be attributed to the fact that Libyan public banks are suffering
from managerial difficulties (Zeithaml, Parasuraman and Berry, 1990; Parasuraman,
Zeithaml and Berry, 1988; Zeithaml, Berry and Parasuraman, 1992). On the basis of these
results, the following recommendations are suggested in order to improve managerial
practices and service quality levels in public banks as well as in private banks in Libya.
1. The organisation chart seems to be old style and hierarchal and this is the case in
many developing countries especially within public sector (Al-Hassani, 2004). This
kind of organisation chart is includes a large number of complicated management
levels and communication channels, which lead to the presence of role ambiguity,
lack of empowerment, and lengthy procedures. Furthermore, the large number of
levels between top and bottom management could lead to miscommunication;
therefore, it is suggested that banks should work to minimize the number of these
levels of management. A modern organisation chart is suggested for public banks,
as this chart is characterized by acceptable levels of authorization and delegation of
226
responsibilities, and enables essential upward and downward communications (see
Figure 6.4, Chapter Seven).
2. Libyan banks‟ management is encouraged to improve the communication between
advertising departments and employees who come into contact with customers, and
to avoid exaggeration in advertisements. The only effective way to improve
communication and improve service quality standards is the establishment of
functional, horizontal and vertical communication (Gillian and Mahmoud, 2001). In
addition, managers should select service champions who can create plans and
supervise the implementation of service improvement (Zeithaml, Parasuraman and
Berry, 1990). Also, they recommended that the management establishes a quality
leadership team (QLT), whose responsibility is to lead the programme of service
quality, supervise the service quality training plan, hold the proper quality
documentation including quality measurement, strategy, objectives, goals, values,
and build quality indicators, in addition, service quality leadership team should
assign a key contact person (KCP) in each branch to strengthen the relationships
with banks‟ customers (Young, 1992).
3. Employees should be confident about how to perform their jobs, as role conflict and
ambiguity can make their confidence decline (see Chapter Two). Therefore,
managers should find ways to prevent this from happening. Otherwise, this will lead
to a decrease in customers‟ perceived service quality. Role ambiguity also reduces
the ability of an employee to adapt to the change in the service encounter. Managers
should make every effort to ensure that the role of employees is fully understood by
them. Even so, effective training programmes can help relieve employees' role
ambiguity (Hartline and Ferrell, 1993). Reducing role conflict may depend on the
managers' communication with their employees (Reardon and Enis, 1990).
Management ability to effectively alleviate the employees' role conflict and
ambiguity, and emphasizing the objective of superior service quality play a vital role
in enhancing customer service. Managers should also be aware that supervision style
has a significant impact on external service quality. Supportive supervision with
respect to motivating staff and giving them regular feedback about their performance
has an important role in helping contact employees meet the needs of the bank
customers. In addition, the working environment in the organization plays a vital
role in enhancing employees' performance. Managers must find ways to make the
working environment supportive and more comfortable to contact employees. In
reality, a good working atmosphere with regard to employees‟ supportive
supervision and comfortable working environment could positively influence the
organization's service quality. Moreover, managers should be aware that employees
227
service vision has a direct impact on customers' perceptions of service quality
(Berry, Parasuraman and Zeithaml, 1994; Bitner, Booms and Tetreault, 1990; Jones
and Sasser, 1995). Managers must reinforce the importance of service quality and
customer satisfaction by consistently communicating a service vision for the firm.
Moreover, getting employees to feel responsible for meeting and exceeding
customer needs, and creating lasting impressions of the bank are important in
delivering high levels of service quality. It can be argued that, having service-
oriented people at all levels of the organization is linked with an organization's
ability to improve customer service. In addition, the challenges for the service
managers are to select and recruit employees who have the ability to deal with
external customers. In recruiting employees, the managers have to be sure that
contact employees have the skills to satisfy bank customers' needs. Managers are
recommended to find different ways to increase contact employees' job satisfaction.
The service encounter lies in the interaction between contact employees and
customers; satisfied employees are more likely to engage in behaviour that assists
and satisfies customers, because employees who perceive high levels of job
satisfaction will have higher levels of work effort and job performance. Meeting
employees‟ wants and needs is very important to increase staff job satisfaction. By
meeting the needs of personnel, the bank upgrades its capabilities for satisfying the
needs of its customers.
4. The research findings suggested that public banks are suffering from technological
difficulties. It is worthy mentioning that technological support has a positive impact
on contact employees' performance and a bank's service quality. Having effective
technology helps employees to perform the job effectively and deliver a superior
customer service (Lytle, Hom and Mokwa, 1998). Having high standards of
technology helps contact employees to provide an error-free and fast service to bank
customers, and also provide employees with easy to access information about
external customers. Therefore, managers must find ways to improve bank
technology. Furthermore, providing resources required for service quality enhances
the technology standards of the bank.
5. Managers should be aware of the importance and role of training in improving
customer service in banks. The findings of the present study showed that, Libyan
public banks‟ customers expressed low perceptions for the items matching
employees training (item 6: The bank has well-trained personnel, item 7: Bank
personnel have the knowledge to answer your questions); the results were 2.5325
and 1.8784 respectively. In such case, managers should train employees on how to
provide high levels of service quality, and how to improve their communication,
228
teamwork and information technology skills. Moreover, management must try to
increase the resourses committed to training programs, especially, the quality
training programmes. Management must also attempt to recruit highly qualified
human resource directors who have a solid background in service quality and thus
able to prepare training programmes, set self-development plans for employees and
develop strategic planning for managers.
6. Top Management style should involve open, strong, visible and charismatic
leadership. It should also support and commit to service quality.
Overall, it can be concluded that within the creative management of the construct of service
quality, managers may contribute to the achievement of both external marketing goals and
internal bank goals, as improving the level of service quality provided to the customers may
help to benefit the public bank, in terms of customer satisfaction, customer loyalty and then
profitability.
7.3.3 Implications for marketing management practices
It is recommended that Libyan banks should work on improving their marketing strategies
and policies to enhance the levels of service quality, and this may include the following:
7.3.3.1 Monitoring customer perceptions of service quality
It can be argued that good service quality raises customer perceptions and as a result if the
bank fails to manage customer perceptions, service quality levels may decrease. Therefore,
there should be frequent investigation and monitoring of customers' perceptions, which
should substantial and continuous (Rust, Zeithaml, and Lemon, 2000).
7.3.3.2 Application of the service quality instrument
As can be seen from the findings of the present research, customers of private and public
banks have ranked all service quality dimensions used in the scale as important dimensions
including effectiveness and assurance, access, price, tangibles, services portfolio, and
reliability. This in fact reflects the suitability, validity and reliability of the BSQ dimension
as an effective measurement of service quality in the Libyan banks. Therefore, using this
instrument on regular basis can be useful for identifying the levels of service quality
provided as perceived by the banks‟ customers, and also allows comparisons to be made
across different parts of the same service on a geographical or other demographic basis.
Moreover, considering the application of the service quality instrument could help banks
diagnose where performance improvement can best be targeted.
229
In the present research study, it was noted from the means measure results that mean scores
of customers‟ perceptions of all six service quality dimensions in Libyan public banks were
low, and thus the public banks need to allocate resources to these items comprising the six
dimensions in an attempt to reduce the magnitude of the low perceptions. If customer
perceptions are close to seven (as the scale is Seven-Point Likert) the customer needs are
fully met and the banks need take no action.
Although, the public banks' customers have recorded low perceptions with respect to all six
dimensions, the lowest perceptions scores were related to access (1.5593) and the services
portfolio (1.5513) dimensions. If the managers prefer to diagnose performance on a more
general level, the same methodology could apply to the service quality dimensions, and
information on service quality perceptions could also help banks to understand performance
weaknesses. In some cases, managers may consider that the results obtained using a service
quality measurement instrument are probably not completely objective nor a very accurate
representation of the true picture, but they should recognise that the application of such
instruments is useful to help identify the direction in which the bank should move.
In addition, there remains the question of what the present instrument is measuring. For
instance, one needs to examine the influence of reputation in measuring customers'
perceptions. The reason for examining this relationship is because the survey scores might
reflect on reputation than on bank performance. In this regard, Newman's (2001) study of
banking, found that only five points could separate the best and worst performance for the
banks' branches of a network reach over 850, and also that the biggest noted change in
SERVQUAL scores coincided with promoting the corporate image (reputation) in the media.
As identified within Chapter Two of this research (section on customer perceptions),
previous research significantly emphasised the importance of corporate image or reputation
in formulating the customers‟ perceptions. Brown and Swartz (1989) for example isolated a
number of factors influencing customers‟ perceptions of service quality. Amongst these
factors, corporate image had a significant impact on the perception formulation process.
They also proposed that corporate image can be taken as mediator and influencer of filter of
service quality. Similarly, Newman (2001) stated that, in the UK, the success of new entrants
with powerful brand names in various industries propose that company image or reputation
overrides service quality perceptions. In the same context, Nguyen and LeBlanc (1998)
supported the view that corporate image or reputation is a component which considered as an
important element in determining customer perceptions of service quality.
The instrument used in this study included one item “The bank has a good reputation” which
expresses the very important element of forming customer perceptions of service quality.
Bearing this in mind, Libyan banks can benefit from the application of such instrument in

230
controlling and managing customer perceptions of service quality, as if reputation of the
bank is good in the mind of a customer, problems with the outcomes or the process, which
this customer may have, to some extent are likely to be excused by the image perceptions. If
the image is negative, quality problems are more likely to be perceived as worse than they
are in reality.
7.3.3.3 Marketing segmentation
Findings of the present study confirm that there is a relationship between customers‟
demographic characteristics of age, occupation, number of branch visits and period of
relationship with bank status. It is therefore recommended that special attention be paid to
theses four categories when banks set out their marketing segmentation plan.
7.3.3.4 Service quality improvement process
Quality improvement in the Libyan public banking sector is urgently recommended as a
result of low levels of service quality currently being provided to their customers (see
Chapter Six) and also in view of the presence of the competitors such as private banks.
Otherwise customers will continue moving towards private banks, because the major reason
why customers change their service provider is encountering unsatisfactory problem
resolution (Levesque and McDougall, 1996).
Ballantyne (1993) identified a number of actions for the purpose of improving service
quality:
1. Designing a good fit for performance measurement, customer satisfaction
measurement, staff motivation, and rewards paid through framework of the service
quality programme.
2. Organising service offering by the assignment of tasks, procurement of resources,
acquisition of personnel and facilities and execution of the plan.
3. Reassessing the historic role of managers in the planning (the research, design,
selection and sequencing of tasks associated with the provision of a service
offering).
Therefore, these three actions can be linked with service quality dimensions, which lead to
generate a management agenda concerning tasks to be implemented in the service offering.
7.4 Research Contribution to Knowledge and Distinctiveness
The present study makes unique contributions to the service marketing literature. For
instance, this study is the first empirical research exclusively to examine the differences
231
between the private and public banking sectors in terms of perceived service quality levels in
an Arabic and developing country such as Libya. The previous study that examined the
differences between the two banking sectors in terms of service levels was carried out in
Greece by Kangis and Voukelatos (1997), therefore it was worthwhile testing if such case
does exist in developing economy such as Libya, where different environmental and cultural
factors exist. The distinctiveness of this contribution is that this research is the first of its
kind in Libya. No previous research has been conducted to investigate the differences
between the Libyan banking private and public banking sectors in terms of customer
perceptions of service quality. Therefore, this study will provide valuable advices for both
academics and practitioners in the Libyan banking industry, and also will provide boundless
opportunities for future academic related research in an environment with limited research
resources on studies of banking service quality in Libya.
The second important contribution is the examination of the differences between the two
groups of banking customers in Libya, in terms of the degree of importance attached to
various dimensions of service quality. The importance and distinctiveness of this
contribution comes from the fact that this was the first attempt in the service marketing
literature to examine these differences. Therefore, this will help management to understand
and appreciate the most important dimensions of service quality for the banks‟ customers.
This research has also made another distinctive and significant contribution to the marketing
service literature, as this study is the first research that examined and analysed the
relationship between the customers' demographic characteristics (age, gender, occupation,
number of branch visists, and period of relationship with bank) and bank status of
ownership, and this will help Libyan banks with the planning and designing of their
marketing segmentations.
Furthermore, the modified BSQ scale for the measurement of service quality levels is a
significant contribution to knowledge as future researchers will have access to an already
examined and tested tool for their studies. In addition, from a practical point of view, the
scale can be used by Libyan banks for identifying the areas of weakness in terms of service
quality and thus suggesting better solutions. It can also be argued that this study is distinctive
in that it complements the growing call for empirical study on the measurement of service
quality in different environments (Jabnoun and Khalifa, 2005).
Finally, the investigation of the relationship between the bank status of ownership and the
demographic aspects of the banks‟ customers, (gender, age, occupation, number of branch
visits and period of relationship with bank), will open the door for further research into the
reasons and factors driving customers in their choice of bank, not only within developing
countries, but also within developed countries.
232
The above, therefore, support the fact that the present research study made important and
distinctive contributions to the body of knowledge as it responded to the identified research
gaps. The added value of this study emanates from the fact the research was conducted in
Libya (a developing country with an extremely limited amount of service quality research
conducted therein), and the fact it measured and assessed the service quality levels in both
the private and public banking sectors which form, along with the Central Bank, the entire
Libyan banking system.
7.5 Research Limitations and Issues of Generalisation
The sample of customers sought from the banks reflects upon the non probability sampling,
and as discussed in Methodology Chapter involves the application of techniques like
convenience sampling.
In this regard, Bryman (1989) has justified the use of non-random sampling, and stated two
major reasons for the popular use of non-probability sampling. The first reason is the
increasing difficulty of obtaining access to the organisations for survey research, and the
second reason is that researchers may have certain constraints placed upon them that
discourage them from choosing random sampling. Although these two reasons apply equally
to this research, there are certain limitations associated with non-random sampling
techniques that cannot be ignored.
The researcher cannot estimate the representativeness of non-probability samples, and
therefore cannot estimate the population's parameters. Bryman (1989) pointed out that
though a random sample may not be feasible in certain situations, it "need not mean that
samples with a high level of apparent representativeness cannot be contrived" (p. 117). No
matter how representative a non-random sample is, it is argued that it cannot allow for an
objective evaluation of the adequacy of the sample (Churchill, 1995).
Also, the issue of generalisability and selection error in non-random sampling seems
questionable. In this context, Deming (1990) argues that a non-random sample introduces a
potential for bias that cannot be overcome by increasing the size of the sample. Although, the
large sample size used in this research, the representativeness of the sample in the study may
require further examination.
Schwab (1985) has noted that most of the empirical studies published in journals conduct
non-random sampling, and he argued that “if one took generalisation to a population using
statistical inference seriously, one would recommend rejecting nearly all manuscripts
submitted” (p. 173).

233
Another area of possible consideration as a likely limitation concerns the use of a standard
questionnaire. As discussed in the Methodology Chapter of this research this study used a
standard questionnaire based on the structure of the BSQ scale. The previous literature
clearly favoured this kind of methodology when the research is by nature a comparative
study (Glaveli et al., 2006; Petridou et al., 2007; Spathis, Petridou and Glaveli, 2004), which
is the case of the present research study, as this research aimed to compare private banks
with public banks in terms of perceived service quality levels. Although the questionnaire
was tested in the pilot study by colleagues and banks‟ customers (hence ensuring the face
validity of the instrument) and also the scale dimensions were completely identified by the
customers of the two groups of banks (as identified from the factor analysis results), an
extensive primary qualitative research with bank managers, employees and customers
through focus group interviews should be a priority for the construction of the questionnaire
(Parasuraman, Zeithaml and Berry, 1988).
7.6 Recommendations for Future Studies
This study provides guidelines for further research. Firstly, the research findings revealed
that customers of public banks expressed low perceptions of service quality. An additional
study is needed to help explore and provide insights into the low perceptions of public
banks‟ service. This study should be qualitative in its nature to enable deeper understanding
of consumer behaviour.
The results also suggested that there seems to be a great amount of variation with respect to
the levels of service quality offered by the two groups of banks. These results may be less
valid in a different service industry. Therefore, this study could be replicated within other
services (e.g., healthcare, hotels, education, and transportation) to further examine these
research hypotheses.
The research results also showed that there are relationship between the customers‟
demographic characteristics of age, occupation, number of branch visits, and period of
relationship with bank and bank status. Since this research is the first study to identify this
relationship, future research would seek to further explore factors driving such a relationship.
In other words, such investigation would provide avenues to question and understand
circumstances leading to the development of such a relationship and further extend the
available knowledge on the service quality topic. It is also necessary in order for
organisations and their management to make workable and reliable decisions.
Another suggestion for future research is to investigate if these demographic variables affect
perceptions of service quality dimensions such as effectiveness and assurance, access, price,
tangibles, services portfolio, and reliability, which might enable Libyan banks to plan their
marketing and organisational strategies more effectively.
234
As noted above, this research aimed at measuring service quality in the Libyan private and
public banking sectors to identify if there are significant differences between the two groups
of banks with respect to perceived service quality levels. While this approach was useful in
contributing to knowledge by establishing a good level of understanding of the meaning,
measurement and management of service quality within Libyan banking context, the study
did not address the impact of national culture on customer perceptions of service quality; it
will therefore be worthiley for an additional study to focus on investigating the impact of
national culture on customers‟ perceptions of service quality within the Libyan banking
context.
Overall, the above future research suggestions could help improve the quality of available
literatures on the service quality topic especially in such contexts as are characterized by
limited research. It could also help organisations including top management in such a
country to reach a good level of understanding of service quality meaning, measurement, and
management. In addition, conducting further studies based on the above recommendations
could open up doors to knowledge of unseen areas of service quality.
235
References
Aaker, D. A., Kumar, V., and Day, G. S. (1995) Marketing Research, 5th edn, New York:
John Wiley and Sons.
Adelman, M. B. and Ahuvia, A. (1994) Beyond smiling: social support and service quality:
139-71.
Adelman, M. B. and Ahuvia, A. C. (1995) Social support in the service sector: The
antecedents, processes, and outcomes of social support in an introductory service, Journal of
Business Research, 32 (3), pp. 273-82.
Ahmad, N., Awan, M., Raouf, A. and Leigh, S. (2009) Development of a service quality
scale for pharmaceutical supply chains, International Journal of Pharmaceutical and
Healthcare, 3 (1), pp. 26-45.
Akbaba, A. (2006) Measuring service quality in the hotel industry: A study in a business
hotel in Turkey, Hospitality Management, 25, pp. 170-192.
Al Sayyed, I. (1997) Banking service segmentation by using service quality dimensions as
one of the retail banking utility bases, The Journal of Commerce Faculty for Scientific
Researches, 34 (1), pp. 64-73.
Al Sayyed, I. (1998) The effect of organisation culture factors on service quality, The
Journal of Commerce Faculty for Scientific Researches, 35(1), pp. 97-109.
Albrecht, K. and Zemke, R. (1985) Service America. Dow Jones-Irwin, Homewood, IL.
Aldaigan, A. H. and Buttle, F. A. (2002) SYSTRA-SQ: a new measure of bank service
quality, International Journal of Service Industry Management, 13 (4), pp. 362-81.
Alexandris, S. D., Papadopoulos, P. and Kaltsatou (2008) Testing the role of service quality
on the development of brand associations and brand loyalty, Managing Service Quality, 18
(3), pp. 239-54.
Al-Hassani, E. (2004) Light on the Islamic finance forum. Al Khaleej Newspaper, No. 9090,
UAE, 8 April, 2004.
Al-Hawari, M., N. Hartley, N. and Ward, T. (2005), Measuring Banks' Automated Service
Quality: A Confirmatory Factor Analysis Approach, Marketing Bulletin, 16, pp. 1-19.
Allred, A. T. and Addams, H. L. (2000) Service quality at banks and credit unions: what do
their customers say?, International Journal of Bank Marketing, 18 (4), pp. 200-207.
Almanara News (2010) Central Bank of Libya. 01 November [Online]. Available at:
http://www.cbl.gov.ly/en/inc/print.php?id=642.
Al-Marri, K., Ahmed, A. and Zairi, M. (2007) Excellence in service: an empirical study of
the UAE banking sector, International Journal of Quality and Reliability Management 24
(2), pp. 164-76.

236
Almossawi, M. (2001) Bank selection criteria employed by college students in Bahrain: an
empirical analysis, International Journal of Bank Marketing, 19 (3), pp. 115-25.
Alqadhafi, S. A. M. (2002) LIBYAN AND THE XXI CENTURY. One 9 Media.
Al-Tamimi, H. A. H. and Al-Amiri, A. (2003) Analysing service quality in the UAE Islamic
banks, Journal of Financial Services Marketing, 8 (2), pp. 119-32.
Amin, M. and Isa, Z. (2008) An examination of the relationship between service quality
perception and customer stisfaction, International Journal of Islamic and Middle Eastern
Finance and Management, 1 (3), pp. 191-209.
Anderson, E. W. and Sullivan, M. W. (1993) The antecedents and consequences of customer
satisfaction for firms, Marketing Science, 12, pp. 125-43.
Anderson, E. W., Fornell, C. and Lehmann, D. R. (1994) Customer satisfaction, market
share, and profitability: findings from Sweden, Journal of Marketing, 58 (3), pp. 53-66.
Andreassen, T. W. (1995) (Dis)satisfaction with public services: the case of public
transportation, Journal of Services Marketing, 9 (5), pp. 30-41.
Angur, M. G., Nataraajan, R. and Jahera Jr, J. S. (1999) Service quality in the banking
industry: an assessment in a developing economy, International Journal of Bank Marketing
17 (3), pp. 116-23.
Arasli, H., Katircioglu, S. T. and Mehtap-Smadi, S. (2005) A comparison of service quality
in the banking industry, International Journal of Bank Marketing, 23 (7), pp. 508-26.
Arasli, H., Mehtap-Smadi, S. and Katircioglu, S. T. (2005) Customer service quality in the
Greek Cypriot banking industry, Managing Service Quality, 15 (1), pp. 41-56.
Armistead, C. G. and Clark, G. (1992) Customer service and support: implementing effective
strategies. London, Pitman Pulishing.
Armistead, C.G. (1990) Service Operations Strategy: Framework for Matching the Service.
Ashforth, B. E. (1993) EMOTIONAL LABOR IN SERVICE ROLES: THE INFLUENCE
OF IDENTITY, Academy of Management Review, 18 (1), pp. 88-115.
Asubonteng, P., McCleary, K. and Swan, J. (1996), SERVQUAL revisited: a critical review
of service quality, Journal of Services Marketing, 10 (6), pp. 62-81.
Athanassopoulos, A. (2000) Customer Satisfaction Cues To Support Market Segmentation
and Explain SwitchingBehavior, Journal of Business Research, 47, pp. 191-207.
Augustyn, M. and Ho, S. K. (1998) Service quality and tourism, Journal of Travel Research
37 (1), pp. 71-75.
Avkiran, N. K. (1994) Developing an instrument to measure customer service quality in
branch banking, International Journal of Bank Marketing, 12 (6), pp. 10-18.
Babakus, E. and Boller, G. W. (1992) An empirical assessment of the SERVQUAL scale,
Journal of Business Research, 24(3), pp. 253-68.

237
Babakus, E. and Mangold, W. G. (1991) Adapting the SERVQUAL scale to hospital
services: an empirical investigation, Health Services Research, 26 (6), pp. 767-86.
Badri, M. A., Abdulla, M. and Al-Madani, A. (2005) Information technology center service
quality: Assessment and application of SERVQUAL, International Journal of Quality and
Reliability Management, 22 (8/9), pp. 819-48.
Bagozzi, R. (2007) On the Meaning of Formative Measurement and How It Differs From
Reflective Measurement: Comment on Howell, Breivik, and Wilcox, Psychological
Methods, 12 (2), pp. 229-37.
Bagozzi, R. and Edwards, J. (2000) On the Nature and Direction of Relationships Between
Constructs and Measures', Psychology Methods, 5 (5), pp. 155-74.
Bahia, K. and Nantel, J. (2000) A reliable and valid measurement scale for the perceived
service quality of banks, International Journal of Bank Marketing, 18 (2), pp. 84-91.
Bahia, K., Paulin, M. and Perrien, J. (2000) Reconciliating literature about client satisfaction
and perceived service quality, Journal of Professional Services Marketing, (2), pp. 27-41.
Baldwin, A. and Sohal, A. (2003) Service quality factors and outcomes in dental care,
Managing Service Quality, 13 (1), pp. 207-16.
Ballantyne, D. (1993) Turning the wheel of quality improvement–continuously,
International Journal of Bank Marketing, 8 (2), pp. 3-11.
Banker, R. D., Potter, G. and Srinivasan, D. (2000) An empirical investigation of an
incentive plan that includes nonfinancial performance measures, Accounting Review 75 (1),
pp. 65-92.
Baron, S. and Harris, K. (2003) Services Marketing: Texts and Cases. New York,
PALGRAVE.
Barth, J. R., Caprio, J. G. and Levine, R. (2003) The regulation and supervision of banks
around the world: A new database. Brookings-Wharton Papers on Financial Services. R. E.
Litan and R. Herring.
Bartlett, J., Kotrlik, J. and Higgins, C. (2001) Organizational research: Determining
appropriate sample size in survey research, INFORMATION TECHNOLOGY LEARNING
AND PERFORMANCE JOURNAL, 19, pp. 43-50.
Beach, L. R. and Burns, L. R. (1995) The service quality improvement strategy,
International Journal of Service Industry Management, 6 (5), pp. 5-15.
Beddowes, P., Gulliford, S., Knight, M. and Saunders, I. (1987) Service Success! Who is
Getting There, Operations Management Association, University of Nottingham.
Bei, L. T. and Shang, C. F. (2006) Building marketing strategies for state-owned enterprises
against private ones based on the perspectives of customer satisfaction and service quality,
Journal of Retailing and Consumer Services, 13 (1), pp. 1-13.

238
Bell, S. J., Auh, S. and Smalley, K. (2005) Customer relationship dynamics: service quality
and customer loyalty in the context of varying levels of customer expertise and switching
costs, Journal of the Academy of Marketing Science, 33 (2), pp. 169-83.
Berry, L. L. (1983) Relationship Marketing, in Emerging Perspectives on Services
Marketing. Chicago, American Marketing Association.
Berry, L. L. (1995) On great services, a framwork for action. New York, The Free Press.
Berry, L. L. (1995) Relationship marketing of services-growing interest, emerging
perspectives, Journal of Academy of Marketing Science, 23 (4), pp. 236-45.
Berry, L. L. and Parasuraman, A. (1991) Marketing Services, Competing through Quality.
New York, The Free Press.
Berry, L. L., Parasuraman, A. and Zeithaml, V. A. (1988) SERVQUAL: a multi-item scale
for measuring consumer perceptions of service quality, Journal of Retailing, 64 (1), pp. 12-
40.
Berry, L. L., Parasuraman, A. and Zeithaml, V. A. (1994) Improving Service Quality in
America: Lessons Learned [and Executive Commentary], The Academy of Management
Executive (1993-2005), 8 (2), pp. 32-52.
Berry, L. L., Zeithaml, V. A. and Parasuraman, A. (1985) Quality counts in services, too,
Business Horizons, 28 (3), pp. 44-52.
Bhat, M. A. (2005) Corelates of service quality in banks: an empirical investigation, Journal
of Service Research, 5 (1), pp. 77-99
Birch, P. (1995) Adapting to change. Banking World.
Bitner, M. J. (1990), Evaluating service encounters: the effects of physical surroundings and
employee responses, The Journal of Marketing, 54, pp. 69-82.
Bitner, M. J., Booms, B. H. and Mohr, L. A. (1994) Critical service encounters: the
employee's viewpoint, The Journal of Marketing, 58 (4), pp. 95-106.
Bitner, M. J., Booms, H. B. and Tetreault, M. S. (1990), The service encounter: diagnosing
favorable and unfavorable incidents, Journal of Marketing, 54 (1), pp. 71-84.
Bitner, M. J., Brown, S. W. and Meuter, M.L. (2000) Technology infusion in service
encounters, Academy of Marketing Science Journal, 28 (1), pp. 138-49.
Bitner, M., Booms, B. and Mohr, L. (1994) Critical service encounters: the employee's
viewpoint, The Journal of Marketing, 58 (4), pp. 95-106.
Blaikie, N. (2007) Approaches To Social Enquiry. 2nd edn. Cambridge: Polity Press.
Blanchard, R. F. and Galloway, R. L. (1994) Quality in Retail Banking, International
Journal of Service Industry Management, 5 (4), pp. 5-23.

239
Blaxter, L., and Hughes, C. and Tight, M. (2001) How to research. Buckingham, Open
University Press.
Blech, G. E. and Blech, M. A. (1993) Introduction to Advertising and Promotion. 2nd edn.
Irwin, Homewood.
Blumberg, B., Cooper, D. R. and Schindler, P. S. (2008) Business research methods.
McGraw-Hill.
Bojanic, D. C. and Rosen, D. (1994) Measuring service quality in restaurants: an application
of the SERVQUAL instrument, Journal of Hospitality & Tourism Research, 18 (1), pp. 3-14.
Bolton, R. N. and Drew, J. H. (1991) A Multistage Model of Customers' Assessments of
Service Quality and Value, Journal of Consumer Research, 17 (4), pp. 375-84.
Bolton, R. N., Kannan, P. K. and Bramlett, M. D. (2000) Implications of loyalty program
membership and service experiences for customer retention and value, Journal of the
Academy of Marketing Science, 28 (1), pp. 95-108.
Bonin, J., Hasan, I. and Wachtel, P. (2002) Ownership structure and bank performance in the
transition economies of central and eastern Europe: A preliminary report. Working Paper,
New York University.
Boris, B., Donald, R. and Pamela, S. (2008) Business Research Methods. Berkshire:
McGraw-Hill Education.
Boulding, W., Kalra, A., Staelin, R. and Zeithaml, V. A. (1993) A Dynamic Process Model
of Service Quality: From Expectations to Behavioral Intentions, Journal of Marketing
Research, 30 (2), pp. 7-27.
Boycko, M., Schleifer, A. and Vishny, R. W. (1995) Privatizing Russia. M.I.T. Press,
Cambridge.
Brady, M. K. and Cronin Jr, J. J. (2001) Some new thoughts on conceptualizing perceived
service quality: a hierarchical approach, Journal of Marketing, 65 (3), pp. 34-49.
Braz, J. (1999) Bank (re)privatization in Portugal, Paper presented at World Bank/Federal
Reserve Bank of Dallas Conference on Bank Privatization, Washington, DC, March 1999.
Brown, S. W. and Swartz, T. A. (1989) A gap analysis of professional service quality,
Journal of Marketing, 53, pp. 92-98.
Brown, T. J., Churchill G. A. and Peter, J. P. (1993) Research note: improving the
measurement of service quality, Journal of Retailing, 69 (1), pp. 127-139.
Bryman, A. (1989) Research methods and organization studies. Routledge.
Bryman, A. and Bell, E. (2007) Business research methods. Oxford: Oxford University
Press.
Bryman, A. and Bell, E. (2011) Business research methods. Oxford: Oxford University
Press.
240
Buckingham, A. and Saunders, P. (2004) The survey methods workbook: from design to
analysis. Polity Pr.
Burch, E., Rogers, H. P. and Underwood, J. (1995) Exploring SERVPERF: An Empirical
Investigation of the Importance-Performance, Service Quality Relationship in the Uniform
Rental Industry, saber. uca. edu/docs/proceedings11/95ama 121.
Burns, A. and Bush, R. (2010) Marketing Research. 6th edn. Boston: Pearson.
Buttle, F. (1996) SERVQUAL: review, critique, research agenda, European Journal of
Marketing, 30 (1), pp. 8-32.
Carman, J. M. (1990) Consumer perceptions of service quality: an assessment of the
SERVQUAL dimensions, Journal of retailing, 66 (1), pp. 33-55.
Caro, L. and Garcia, J. (2007) Measuring perceived service quality in urgent transport
service, Journal of Retailing and Consumer Services, 14 (1), pp. 60-72.
Caro, M. (2008) Developing a multidimensional and hierarchical service quality model for
the travel agency industry, Tourism Management, 29 (4), pp. 706-20.
Caruana, A. (2002) Service loyalty: the effects of service quality and the mediating role of
customer satisfaction, European Journal of Marketing, 36 (7/8), pp. 811-28.
Cavana, R., Delahaye, L. and Sekaran, U. (2001) Applied business research: Quantitative
and Quantitative Methods.John Wiley &Sons Australia.
Chalmers, A. (1999) What is this thing called science. 3rd edn. Buckingham: Open
University Press.
Chaston, I. (2000) Relation Marketing and the Orientation Customers Requir of Suppliers
(cover story), Service Industries Journal, 20 (3), pp. 147-66.
Chen, C. and Chen, F. (2009) Experience quality, perceived value, satisfaction and
behavioral intentions for heritage tourists, Tourism Management, xxx, pp. 1-7.
Chen, K.-K., Chang, C.-T. and Lai, C.-S. (2009) Service quality gaps of business customers
in the shipping industry, Transportation Research Part E: Logistics and Transportation
Review, 45 (1), pp. 222-37.
Chowdhary, N. and Prakash, M. (2007) Prioritizing service quality dimensions, Managing Service Quality, 17 (5), pp. 493-509.
Churchill, G. A. J. (1995) Marketing Research: Methodological Foundations, . The Dryden
Press.
Churchill, G. and Suprenant, C. (1982) An investigation into the determinants of customer
satisfaction, Journal of Marketing Research, 19, pp. 491-504.
Clarke, G. and Cull, R. (1999) Why privatize? The case of Argentina's public provincial
banks, World Development, 27 (5), pp. 865-86.
241
Coakes, S. J. and Steed, L. G (2001) SPSS for Windows: analysis without anguish. Brisbane:
John Wiley.
Collis, J. and Hussey, R. (2003) Business research: A practical guide for undergraduate and
postgraduate students. 2nd edn. New York: Palgrav Macmillan.
Consoli, D. (2003), The evolution of retail banking services in United Kingdom: a
retrospective analysis, Centre for Research on Innovation and Competition, University of
Manchester.
Cook, C. and Thompson, B. (2001) Psychometric properties of scores from the web-based
LibQUAL+ study of perceptions of library service quality, Library Trends, 49 (4), pp. 585-
604.
Cook, S. (2004) Measuring Customer Service Effectiveness. Hants: Gower Publishing Ltd.
Cooper, D. and Schindler, P. (2008) Business Research Methods. 10th edn. Boston:
McGraw-Hill International Edition.
Cornett, M., Guo, L., Khaksari, S. and Tehranian, H. (2005) The impact of corporate
governance on performance differences in privately-owned versus state-owned banks: An
international comparison, Boston College.
Craig, C. S. and Douglas, S. P. (2005) International Marketing Research. Chichester: John
Wiley.
Creswell, J. (2007) Qualitative Inquiry and Research Design: Choosing Among Five
Approaches. 2nd edn. Thousand Oaks: Sage Publication.
Creswell, J. (2009) Research Design: Qualitative, Quantitative, and mixed methods
approach. London: Sage Publication.
Crimp, M. and Wright, L.T. (1995) The Marketing Research Process, Prentice-Hall,
Englewood
Cronin Jr, J. J. and Taylor, S. A. (1992) Measuring service quality: a reexamination and
extension, The Journal of Marketing, 56, pp. 55-68.
Cronin, J. J. and Taylor, S. A. (1994) SERVPERF versus SERVQUAL: reconciling
performance-based and perceptions-minus-expectations measurement of service quality,
Journal of Marketing, 58 (1), pp. 125-31.
Cronin, J. J., Brady, M. K. and Hult, G. T. (2000) Assessing the effects of quality, value, and
customer satisfaction on consumer behavioral intentions in service environments, Journal of
Retailing, 76 (2), pp. 193-218.
Crotty, M. (1998) The foundations of social research: meaning and perspective in the
research process. Sage London.
Crotty, M. (2006) The Foundations of Social Research: Meaning and Perspective in the
Research Process. SAGE Publications Ltd.

242
Crouch, S. (1984) Marketing Research for Managers Butterworth-Heinemann, London, UK.
Cuganesan, S., Bradley, G. and Booth, P. (1997) Service quality and oganisational
performance indicators. Management Service Quality. J. Lemmink and P. Kunst, Paul
Chapman Publishing, London.
Cui, C. C., Lewis, B. R. and Park, W. (2003) Service quality measurement in the banking
sector in South Korea, International Journal of Bank Marketing, 21 (4), pp. 191-201.
Dabholkar, P. (1995) The convergence of customer satisfaction and service quality
evaluations with increasing customer patronage, University of Tennessee, 8, pp. 32-43.
Dabholkar, P. A., Shepherd, C. D., and Thorpe, D. I. (2000) A comprehensive framework for
service quality: an investigation of critical conceptual and measurement issues through a
longitudinal study, Journal of Retailing, 76 (2), pp. 139-73.
Dabholkar, P. A., Thorpe, D. I. and Rentz, J. O. (1996) A measure of service quality for
retail stores scale development and validation, Journal of Academy of Marketing Science 24
(1), pp. 3-16.
Davis, B. (1994) Change is the only constant. Banking World.
de Leeuw, E., Hox, J. and Dillman, D. (2008) International Handbook of Survey
Methodology. New York: Lawrence Erlbaum Associates.
de Wulf, K. (2003) Services Management. Harlow: Prentic-Hall.
Delanty, G. (1997) Social Science: Beyond Constructivism and Realism. Minneapolis:
University of Minnesota Press.
Deming, W. (1990) Sample design in business research. Wiley-Interscience.
Diamantopoulos, A. and Siguaw, J. (2006) Formative Versus Reflective Indicators in
Organizational Measure Development: A Comparison and Empirical Illustration, British
Journal of Management, 17, pp. 263-82.
Dick, A. S. and Basu, K. (1994) Customer loyalty: toward an integrated conceptual
framework, Journal of the Academy of Marketing Science, 22 (2), pp. 99-113.
Dillon, W. R., Madden, T. J. and Firtle, N. H. (1990) Marketing Research in a Markeing
Environment. Homewood, Boston.
Dillon, W. R., Madden, T. J. and Firtle, N. H. (1993) Essentials of marketing research.
Boston: Irwin Homewood.
Dillon, W., Madden, T. and Firtle, N. (1990) Marketing research in a marketing
environment. Boston: Irwin Homewood.
Dobbin, S. A. and Gatowski, S. I. (1999) Quantitative and qualitative research. A Judge's
Deskbook on the Basic Philosophies and Methods of Science. USA: State Justic Institute.
Donze, J. and Dubec, I. (2008) The effects of regulating interchange fees at cast on the ATM
market University'e des Sciences Sociales de Toulouse, TSE (GREMAQ).

243
Dotchin, J. A. and Oakland, J. S. (1994) Total Quality Management in Services Part 3:
Distinguishing Perceptions of Service Quality, International Journal of Quality and
Reliability Management, 11 (4), pp. 6-28.
Dotchin, J. A. and Oakland, J. S. (1994) Total Quality Management in Services,
International Journal of Quality and Reliability Management, 11 (3), pp. 27-42.
Duncan, E. and Elliott, G. (2002) Customer service quality and financial performance among
Australian retail financial institutions, Journal of Financial Services Marketing, 7 (1), pp.
25-41.
Duncan, E. and Elliott, G. (2004) Efficiency, customer service and financial performance
among Australian financial institutions, International Journal of Bank Marketing, 22 (5), pp.
319-42.
Duncan, E. and Elliott, G. (2004) Efficiency, customer service and financial performance
among Australian financial institutions, International Journal of Bank Marketing, 22 (5), pp.
319-42.
Dutta, K. and Dutta, A. (2009) Customer expectation and perception across the Indian banking industry and the resultant financial implications, Journal of Services Research,, 9
(1), pp. 32-49.
Edris, T. (1997) Services considered important to business customers and determinants of
bank selection in Kuwait: a segmentation analysis, International Journal of Bank Marketing,
15 (4), pp. 126-33.
Edvardsson, B. (1998) Service quality improvement, Managing Service Quality, 8 (2), pp.
142-49.
Edvardsson, B., Thomasson, B. and John, O. (1994) Quality of Service MAKING IT REALLY
WORK Berkshire. McGrow-Hill Book Company Europe.
Ekinci, Y. and Riley, M. (1998) A critique of the issues and theoretical assumptions in
service quality measurement in the lodging industry: Time to move the goal-posts?
International Journal of Hospitality Management, 17 (4), pp. 349-362.
Ellwood, P. (1994) Thriving through service. Banking World.
Elmayar, A. (2007) Measuring service quality in the Bank of Commerce and Development.
Master Dissertation. University of Sunderland.
Engel, J. F., Blackwell, R. D. and Miniard, P. W. (1993) Comsumer Behavior. The Dryden
Press.
Engelland, B. T., Workman, L. and Signh, M. (2000) Ensuring service quality for campus
career services centers: A modified SERVQUAL scale, Journal of marketing Education 22
(3), pp. 236-45.
Fay, B. (1996) Contemporary Philosophy of Social Science: A Multicultural Approach.
Massachusetts: Blackwell Publishers Inc.
244
Fick, G. R. and Ritchie, B. (1991) Measuring service quality in the travel and tourism
industry, Journal of Travel Research, 30 (2), pp. 2-9.
Field, A. P. (2009) Discovering Statistics Using SPSSS. SAGE Publications Ltd
Firoz, N. M. and Maghrabi, A. S. (1994) The role of service marketing in economic
development: an analysis. International Journal of Management, 2, pp. 641-74.
Fischer, A. and Arnold, S. J. (1994) Sex, gender identity, gender role attitudes, and consumer
behaviour, Psychology and Marketing, 11 (2), pp. 163-82.
Fisk, R. F., Brown, S.W. and Bitner, M. J. (1993) Teaching the evolution of service
marketing literature, Journal of Marketing, 69 (1), pp. 61-103.
Fisk, R., Grove, S., John, J., Hoffman, K. and Bateson, J. (2004) Interactive services
marketing. Houghton Mifflin.
Fornell, C. (1992) A national customer satisfaction barometer: the Swedish experience, The
Journal of Marketing, 56, pp. 6-21.
Foster, S. T. (2004) Managing Quality: An Integrative Approach. New Jersey: Pearson
Prentice Hall.
Fowler, F. (2002) Survey Research Methods. Thousand Oaks: Sage Publications.
Fraering, M. and Minor, M. (2006) Sense of community: an exploratory study of US
consumers of financial services, International Journal of Bank Marketing, 24 (5), pp. 284-
306.
Furrer, O., Liu, B. and Sudharshan, D. (2000) The relationships between culture and service
quality perceptions: basis for cross-cultural market segmentation and resource allocation,
Journal of ServiceRresearch, 2 (4), pp. 355-71.
Garson, G. D. (2005) Factor Analysis. Crolina, North Carolina State University.
Garvin, D. A. (1988) Managing quality: The strategic and competitive edge. New York: Free
Press.
Gatchalian, M. M. (1999) Quality assessment through statistically-based sensory evaluation
methods, The TQM Magazine, 11 (6), pp. 389–95.
George, W. R. and Berry, L. L. (1981) Guidelines for the Advertising of Services, Business
Horizons, 24 (5), pp. 52-56.
Ghobadian, A. (1993) Service quality Concepts and Models, International Journal of
Quality and Reliability Management, 11 (9), pp. 43-66.
Ghobadian, A., Speller, S. and Jones, M. (1994) Service quality concepts and models,
International Journal of Quality & Reliability Management, 11 (9), pp. 43-66.
Gilbert, F. W., Lumpkin, J. R. and Dant, R. P. (1992) Adaptation and customer expectations
of health care options, Journal of Health Care Management, 12 (3), pp. 46-55.
245
Gill, J. and Johnson, O. (2005) Research Methods for Managers. 3rd edn.: Sage
Publications.
Gladden, J. M. and Funk, D. C. (2002) Developing an understanding of brand associations in
team sport: empirical evidence from consumers of professional sport, Journal of Sport
Management, 16 (1), pp. 54-81.
Glaveli, N., Petridou, E., Liassides, C. and Spathis. C. (2006) Bank service quality: evidence
from five Balkan countries, Emerald Group Publishing Limited, 16 (4), pp. 380-94.
Goetsch, D. L. and Stanley, B. D. (1997) Introduction to total quality: quality management
for production, processing, and services. New Jersey: Prentice-Hall Inc.
Gounaris, S. (2005) Measuring service quality in b 2 b services: an evaluation of the
SERVQUAL scale vis-a-vis the INDSERV scale, Journal of Services Marketing, 19 (6), pp.
421-35.
Grapentine, T. (1998) The history and future of service quality assessment, Marketing
Research, 10 (4), pp. 4-20.
Gronroos, C. (1982) Strategic management and marketing in the service sector. Helsingfors:
Swedish School of Economics and Business Administration.
Gronroos, C. (1984) A service quality model and its market implications, European Journal
of Marketing, 18 (4), pp. 36-44.
Gronroos, C. (1990) Service Management and Marketing. Lexington Books.
Gronroos, C. (2000) Service Management and Marketing: A Customer Relationship
Management Approach. 2nd edn. Chichester: Wiley.
Gronroos, C. (2007a) In Search of a New Logic for Marketing: Foundations of
Contemporary Theory. West Sussex: John Wiley & Sons Ltd.
Gronroos, C. (2007b) Service Management and Marketing: Customer Management in
Service Competition. 3rd edn. West Sussex John Wiley & Sons Ltd.
Grossman, G. and Krueger, A. (1993) Environmental impact of a North-American free trade
agreement. The U. S.- Mexico Free Trade Agreement. Cambridge: P. Garber. M.I.T. Press.
Grossnickle, J. and Raskin, O. (2000) Handbook of online marketing research: Knowing
your customer using the Net. New York: McGraw-Hill Companies.
Gummesson, E. (1987) Lip service- a neglected area in services marketing, Journal of
Services Marketing, 1 (1), pp. 19-23.
Gummesson, E. (1987) The new marketing--Developing long-term interactive relationships,
Long Range Planning, 20 (4), pp. 10-20.
Guo, X., Duff, A. and Hair, M. (2008) Service quality measurement in the Chinese corporate
banking market, International Journal of Bank Marketing, 26 (5), pp. 305-27.

246
Gutek, B A. (1995) The Dynamics of Service: Reflections on the Changing Nature of
Customer/Provider Interactions, Jossey-Bass, San Francisco, CA.
Hague, P. (2002) Market research: a guide to planning, methodology & evaluation. 3rd edn.
London Kogan Page.
Hair, J. (2003) Essentials of Business Research Methods. New Jersey: Hoboken.
Hair, J., Anderson, R., Tatham, R. and Black, W. (1998) Multivariate Data Analysis. 5th
edn. New Jersey: Prentice Hall.
Haller, S. (1995). Measuring service quality: The results of a longitudinal study in further
education in Managing service quality. P. Kunst and L. Jose. London, Paul Chapman: 13-27.
Hamer, L. O., Liu, B. S.-C. and Sudharshan, D. (1999) The effects of intra-encounter
changes in expectations of percrived service quality models, Journal of Service Research, 1
(3), pp. 275-89.
Hammer, M. and Champy, J. (1994) Reengineering the corporation: A Manifesto for
Business Revolution, New York: Harper Business.
Hanson, D. J. and Grimmer, M. R. (2007) ''The mix of qualitative and quantitative research
in major marketing journals 1993-2002'', European Journal of Marketing, 41 (1/2), pp. 58-
70.
Hartline, M. and Ferrell, O. (1993) Service quality implementation: the effects of
organizational socialization and managerial actions on customer-contact employee
behaviours. Marketing Science Institute.
Harvey, J. (1998) Service quality: a tutorial, Journal of Operations Management, 16 (5), pp.
583-97.
Haskel, J. and Sanchis, A. (1995) Privatization and x-inefficiency. London: Center for
Economic Policy Research.
Haywood-Farmer, J. (1988) A Conceptual Model of Service Quality, International Journal
of Operations and Production Research, 8 (6), pp. 19-29.
Headley, D. E. and Miller, S. J. (1993) Measuring service quality and its relationship to
future consumer behaviour, Journal of Health Care Marketing, 13 (4), pp. 32-41.
Heath, R. L., Leth, S. A. and and Nathan, K. (1994) Communicating Service Quality
Improvement: Another Role for Public Relations, Public Relations Review, 20 (1), pp. 29-41.
Hennig-Thurau, T. and Klee. A. (1997) The impact of customer satisfaction and relationship
quality on customer retention: a critical reassessment and model development, Psychology
and Marketing, 14 (8), pp. 737-64.
Henry, G. T. (1990) Practical sampling. Sage Publications, Inc.
Hensel, J. S. (1990) Service quality improvement and control: A customer-based approach,
Journal of Business Research, 20 (1), pp. 43-54.

247
Heskett, J. L. and Schlesinger, L. A. (1994) Putting the service-profit chain to work, Harvard
Business Review, 72 (2), 164-75.
Heskett, J. L., Sasser, W. E. and Schlesinger, L. A. (1997) The Service Profit Chain. New
York: Free Press.
Hofstede, G. (1991) Culture and Organisations, New York: McGraw-Hill.
Hornik, J. (1984) Subjective vs. objective time measures: A note on the perception of time in
consumer behaviour, Journal of Consumer Research, 11 (1), pp. 615-18.
Hudson, S., Hudson, P. and Miller, G. A. (2004) The measurement of service quality in the
tour operating sector: a methodological comparison, Journal of Travel Research, 42 (3), pp.
305-12.
Hussey, J. and Hussey, R. (1997) Business Research: A Practical Guide for Undergraduate
and Postgraduate Students. London: MacMillan Press Ltd.
Hussey, M. K. (1999) Using the concept of loss: an alternative SERVQUAL measure, The
Service Industries Journal, 19 (4), pp. 89-101.
Idris, T. A. (1996) Measuring service quality by SERVQUAL: An empirical study of health
care in the state of Kuwait, Arab Journal of Administration Science, 4 (1).
Ilgen, D. (1971) Satisfaction with performance as a function of the initial level of expected
performance and the deviation from expectations, Organizational Behavior and Human
Performance, 6, pp. 345-61.
Isik, I. (2007) Bank ownership and productivity developments: evidence from Turkey,
Studies in Economics and Finance, 24 (2), pp. 115-39.
Ittner, C. D. and Larcker, D. F. (1998) Are nonfinancial measures leading indicators of
financial performance? An analysis of customer satisfaction, Journal of Accounting
Research, 36, pp. 1-35.
Jabnoun, N. & Khalifa, A. (2005) A customized measure of service quality in the UAE,
Managing Service Quality, 15 (4), pp. 374-88.
Jabnoun, N. and Al-Tamimi, H. A. H. (2003) Measuring perceived service quality at UAE
commercial banks, International Journal of Quality and Reliability Management, 20 (4), pp.
458-472.
Jabnoun, N. and Khalifa, A. (2005) A customized measure of service quality in the UAE,
Managing Service Quality, 15 (4), pp. 374-88.
Jamal, A. and Naser, K. (2002) Customer satisfaction and retail banking: an assessment of
some of the key antecedents of customer satisfaction in retail banking, International Journal
of Bank Marketing, 20 (4), 146-60.
Jayawardhena, C. and Foley, P. (2000) Changes in the banking sector–the case of Internet
banking in the UK, Internet Research: Electronic Networking Applications and Policy, 10
(1), pp. 19-30.

248
Jiang, J. J., Klein, G. and Crampton, S. M. (2000) A note on SERVQUAL reliability and
validity in information system service quality measurement, Decision Sciences, 31 (3), pp.
725-44.
Johnson, P. and Duberley, J. (2000) Understanding Management Research: An Introduction
to Epistemology. London: Sage Publications.
Johnston, R. and Clark, G. (2005) Service Operations Management. 2nd edn. Prentice Hall.
Johnston, R. (1987) A Framework for Developing a Quality Strategy in a Customer
Processing Operation, International Journal of Quality Healthcare, 1 (2), pp. 37-46.
Johnston, R. (1995) The determinants of service quality: satisfiers and dissatisfiers,
International Journal of Service Industry Management, 6 (5), pp. 53-71.
Jones, T. and J. Sasser, J. (1995) Why satisfied customers defect, Harvard Business Review,
73 (6), pp. 89-99.
Julian, C. C. and Ramaseshan, B. (1994) The role of customer-contact personnel in the
marketing of a retail bank's services, International Journal of Retail & Distribution
Management, 22 (5), pp. 29-34.
Juran, J. M. and Gryna, F. M. (1988) Juranïs Quality Control Handbook, New York:
McGraw-Hill.
Kang, G. and James, J. (2004) Service quality dimensions: an examination of Gronroos„s
service quality model, Managing Service Quality, 14 (4), pp. 266-77.
Kangis, P. and V. Passa (1997) Awareness of service charges and its influence on customer
expectations and perceptions of quality in bankin, Journal of Services Marketing, 11 (2), pp.
105-17.
Kangis, P. and Voukelatos, V. (1997) Private and public banks: a comparison of customer
expectations and perceptions, International Journal of Bank Marketing, 15 (7), pp. 279-87.
Kangis., P. and Kareklis, P. (2001) Governance and Organisational Controls in Public and
Private Banks, Corporate Governance, 1 (1), pp. 31-8.
Kaplan, R. S. and Norton, D. P. (1996) The balanced scorecard: Translating strategy into
action. Boston: Harvard Business School Press.
Karatepe, O. M., Yavas, U. and Babakus, E. (2005) Measuring service quality of banks:
scale development and validation, Journal of Retailing and Consumer Services, 12 (5), pp.
373-83.
Kasper, H., Helsdingen, P. V. and de Vries jr, W. (1999) Services Marketing Management.
Chichester: John Wiley & Sons Ltd.
Kasper, H., Helsdingen, P. V. and Gabbie, O. (2006) Services Marketing Management: A
Strategic Perspective. 2nd edn. West Sussex: John Wiley & Sons, Ltd.

249
Kassem, S. (1988) Service marketing: the Arabian Gulf experience, Journal of Services
Marketing, 31 (3), pp. 61-71.
Kelemen, M. L. (2003). Managing Quality. SAGE Publications Ltd
Keller, K. L. (2003) Brand synthesis: The multidimensionality of brand knowledge, Journal
of Consumer Research, 29 (4), pp. 595-600.
Kettinger, W. J., Lee, C. C. and Lee, S. (1995) Global Measures of Information Service
Quality: A Cross-National Study*, Decision Sciences, 26 (5), pp. 569-88.
Kilbourne, W. E., Duffy, J. A., Duffy, M. and Giarchi, G. (2004) The applicability of
SERVQUAL in cross-national measurements of health-care quality, Journal of Services
Marketing 18 (7), pp. 524-33.
Kim, S. and Jin, B. (2002) Validating the retail service quality scale for US and Korean
customers of discount stores: an exploratory study, Journal of Services Marketing, 16 (3),
pp. 223-37.
Kinnear, P. and Gray, C. (2010) PASW 17 Statistics Made Simple. New York: Pyschology
Press.
Kinnear, P. and Gray, C. (2010) PASW 17 Statistics Made Simple. New York: Pyschology
Press.
Klein, G. and Carr, C. L. (2002) Measuring information system service quality: SERVQUAL
from the other side, MIS Quarterly, 26 (2), pp. 145-166.
Kolter, P. (1994) Marketing management. Analysis, planning, implementation, and control.
Englewood Cliffs, NJ: Prentic-Hall.
Kotler, P. and Armstrong, G. (1996) Principles of Marketing. 7nd edn. New Jersey: Prentice-
Hall international.
Kotler, P. and Armstrong, G. (2010) Principles of Marketing. 13th edn. London: Pearson.
Kotler, P. and Turner, R. E. (1993) Marketing management: analysis, planning,
implementation, and control. Scarborough, Prentice Hall.
Kumar, V. (2000) International marketing research. NJ, Prentice Hall Englewood Cliffs.
Kurtz, D. L. and Clow, K. E. (1998) Services marketing. New York: J. Wiley & Sons.
La Porta, R., Lopez-de-Silanes, F. and Shleifer, A (2002) Government ownership of banks,
The Journal of Finance, 57 (1), 265-301.
La Porta, R., Lopez-de-Silanes, F. and Shleifer, A. (1998) Law and Finance, Journal of
Political Economy, 106, pp. 1113-55.
Ladhari, R. (2008) Alternative measures of service quality: a review, Managing Service
Quality, 18 (1), pp. 65-86.
250
Lai, F., Hutchinson, J., Li, D. and Bai, C. (2007) An empirical assessment and application of
SERVQUAL in mainland China's mobile communications industry, International Journal of
Quality and Reliability Management, 24 (3), pp. 244-62.
Lam, T. K. P. (2002) Making sense of SERVQUAL's dimensions to the Chinese customers
in Macau, Journal of Market-Focused Management, 5 (10), pp. 43-58.
Lam, T., Wong, A. and Yeung, S. (1997) Measuring service quality in clubs: an application
of the SERVQUAL instrument, Australian Journal of Hospitality Management, 4, pp. 7-14.
Lassar, W. M., Manolis, C. and Winsor, R. D. (2000) Service quality perspectives and
satisfaction in private banking, Journal of Services Marketing, 14 (2/3), pp. 244-72.
Lee, H., Lee, Y. and Yoo, D. (2000) The determinants of perceived service quality and its
relationship with satisfaction, Journal of Services Marketing, 14 (2/3), pp. 217-31.
Lee, M. and Ulgado, F. M. (1997) Consumer evaluations of fast-food services: a cross-
national comparison, Journal of Services Marketing, 11 (1), pp. 39-50.
Lee, S., Kim, Y., Hemmington, N. and Yun, D. (2004) Competitive service quality
improvement (CSQI): a case study in the fast-food industry, Food Service Technology, 4, pp.
75-84.
Lehtinen, U. and Lehtinen, J. (1991) Two Approaches to Service Quality Dimensions, The
Service Industries Journal, 11 (3), pp. 287-303.
Leonard, F. and Sasser, W. (1982) The incline of quality, Harvard Business Review, 60 (5),
pp. 163-71.
Leventhal, L. (2008) The role of understanding customer expectations in aged care,
International Journal of Health Care Quality Assurance, 21 (1), pp. 50-9.
Levesque, T. and McDougall, G. H. G. (1996) Determinants of customer satisfaction in retail
banking, International Journal of Bank Marketing, 14(7), pp. 12-20.
Lewis, B. R. (1989) Quality in the service sector: a review, International Journal of Bank
Marketing, 7 (5), pp. 4-12.
Lewis, B. R. (1991) Service quality: an international comparison of bank customers‟
expectations and perceptions, Journal of Marketing Management, 7 (1), pp. 47-62.
Lewis, B. R. and Mitchell, V. W. (1990) Defining and measuring the quality of customer
service, Marketing Intelligence & Planning, 8 (6), pp. 11-17.
Liljander, V. and T. Strandvik (1995) The nature of customer relationships in services,
Advances in services marketing and management, 4, pp. 141-67.
Liljander, V. and Tore, S. (1995) The relation between service quality, satisfaction and
intentions in Managing service quality. P. Kunst and J. L. (ed). London, UK, Paul Chapman
Publishing Ltd: 45-61.

251
Lim, P. C. and Tang, N. K. H. (2000) A study of patients' expectations and satisfaction in
Singapore hospitals, International Journal of Health Care Quality Assurance, 13 (7), pp.
290-99.
Lim, P. C., Tang, N. K. H. and Jackson, P. M. (1999) An innovative framework for health
care performance measurement, Managing Service Quality, 9 (6), pp. 423-34.
Liu, C.-T., Du, T. C. and Tsai, H-H (2009) A study of the service quality of general portals,
Information & Management, 46 (1), pp. 52-56.
Loizides, A. (2005) Service quality in retail banking in Cyprus. PhD Thesis. The University
of Manchester.
Lopez, J., Hart, L. K. and Rampersad, A. (2007) Ethnicity and customer satisfaction in the
financial services sector, Managing Service Quality, 17 (3), pp. 259-74.
Lovelock, C, and Young, R (1979) Look to consumers to increase productivity, Harvard
Business Review, 57 (3), pp. 168-78.
Lovelocke, C. H. (1992) Classifying service strategic marketing insights, Managing service
marketing: Text and readings. 2nd edn. Florida: The Dryden Press.
Low, G. S. and Lamb, C. W. (2000) The measurement and dimensionality of brand
associations, Journal of Product and Brand Management, 9 (6/7), pp. 350-68.
Lynn, M. L., Lytle, R. S. and Samo B. (2000) Service orientation in transitional markets:
does it matter? European Journal of Marketing, 34 (3/4), pp. 279-98.
Lytle, R. S., Hom, P. W. and Mokwa, M. P. (1998) SERV*OR: a managerial measure of
organizational service orientation, Journal of Retailing, 74 (4), pp. 447-54.
Mahmud, R. M., Bahloul, M. K., Abdoudyen, M. E., Mukhtar, K., Nanette, P. and David, S.
(2008) Libya A Guid To Comercial Law, Banking Law And Accounting. London: GMB
PUBLISHING.
Maister, D. (1985) The psychology of waiting lines in Czepiel, J., Solomon, M. and
Malhotra, N. K. (1996) Markeing Research: An Applied Orientation. New Jersey: Prentice-
Hall.
Martella, R., Nelson, R. and Marchand-Martella, N. (1999) Research methods: Learning to
become a critical research consumer. Allyn & Bacon.
Martin, L. L. (1993) Total quality management in human service organizations. California:
Sage Publications Inc.
Martinez, J. and Martinez, L. (2010) Some insights on conceptualizing and measuring
service quality, Journal of Retailing and Consumer Services, 17, pp. 29-42.
Martinez, J. and Martinez, L. (2010) Some insights on conceptualizing and measuring service quality, Journal of Retailing and Consumer Services, 17, pp. 29-42.
252
May, T. (2001) Social Research: Issues, Methods and Progress. 3rd edn. Buckingham: Open
University Press.
McAlexander, J. H., Kaldenberg, D. O. and Koenig, H. F. (1994) Service quality
measurement: examination of dental practices sheds more light on the relationships between
service quality, satisfaction, and purchase intentions in a health care setting, Journal of
Health Care Marketing, 14 (3), pp. 34-40.
McDougall, G. and Levesque, T. (1994) A revised view of service quality dimensions: an
empirical investigation, Journal of Professional Services Marketing, 11 (1), pp. 189-210.
Megginson, W. L. (2005) The economics of bank privatization, Journal of Banking &
Finance, 29, pp. 1931-80.
Mehta, S. C. and Durvasula, S. (1998) Relationships between SERVQUAL dimensions and
organisational performance in the case of a business-to-business service, Journal of Business
and Industrial Marketing, 13 (1), pp. 40-53.
Metters, R. and Marucheck, A. (2007) Service ManagementAcademic Issues and Scholarly
Reflections from Operations Management Researchers, Decision Sciences, 38 (2), pp. 195-
214.
Meuter, M. L., Ostrom, A. L., Roundtree, R. I. and Bitner, M. J. (2000) Self-Service
Technologies: Understanding Customer Satisfaction with Technology-Based Service
Encounters, Am Marketing Assoc, 64, pp. 50-64.
Mohr, L. A. and Bitner, M. J. (1995) The role of employee effort in satisfaction with service
transactions, Journal of Business Research, 32 (3), pp. 239-52.
Moore, C. D. (1987) Outclass the Competition with Service Distinction. Mortgage Banking,
47 (11).
Morgan, G. and Griego, O. (1998) Easy use and interpretation of SPSS for Windows:
answering research questions with statistics. Lawrence Erlbaum.
Morris, D. and Brandon, J. (1994) Re-engineering your business. New York: McGraw-Hill.
Moser, C. and Kalton, G. (1971) Survey methods in social investigation. ,2nd edn,
Heinemann Educational Books.
Mukherjee, A. and Nath, P. (2005) An empirical assessment of comparative approaches to
service quality measurement, Journal of Services Marketing, 19 (3), pp. 174-84.
Nachmias, D. and Nachmias, C. (1981) Research methods in the social sciences. 2nd edn. St.
Martin‟s Press.
Najjar, L., and Bishu, R. R (2006). Service quality: A case study of a bank. The Quality
Management Journal, 81 (31), pp. 166-250.
Nakane, M. I. and Weintraub, D. B. (2005) Bank privatization and productivity: Evidence
for Brazil, Journal of Banking & Finance, 29, pp. 2259-89.
253
Naser, K., Jamal, A. and Al-Khatib, K. (1999) Islamic banking: a study of customer
satisfaction and preferences in Jordan, International Journal of Bank Marketing, 17 (3), 135-
51.
Nash, C. (1988) A Question of Service: Action Pack, Business Management Programme,
Hotel and Catering Industry Training Board, London: National Consumer Council.
Naumann, E. and Giel, K. (1995) Customer satisfaction measurement and management:
using the voice of the customer. Cincinnati: Thomson Executive Press.
Newman, K. and Cowling, A. (1996) Service quality in retail banking: the experience of two
British clearing banks, International Journal of Bank Marketing, 14 (6), pp. 3-11.
Newman, K. (1996) Promoting service quality in British retail banking: the experience of
two British clearing banks, International Journal of Bank Marketing, 14 (6), pp. 1-9.
Newman, K. (2001) Interrogating SERVQUAL: a critical assessment of service quality
measurement in a high street retail bank, International Journal of Bank Marketing, 19 (3),
pp. 126-39.
Nguyen, N and LeBlanc, G. (1998) The mediating role of corporate image on customers‟
retention decisions: an investigation in financial services, International Journal of Bank
Marketing, 16 (2), pp. 52–65.
Nielsen, J. F. and Host, V. (2000) The path to service encounter performance in public and
private „bureaucracies‟, The Service Industries Journal, 20 (1), pp. 40-60.
Norreklit, H. (2000) The balance on the balanced scorecard a critical analysis of some of its
assumptions, Management Accounting Research, 11 (1), pp. 65-88.
Nunally, J. and Bernstein, I. (1978) Psychometric theory, New York: McGraw-Hill.
O„Neill, M. and Palmer, A. (2003) An exploratory study of the effects of experience on
consumer perceptions of the service quality construct, Managing Service Quality, 13 (3), pp.
187-96.
Obaid, S. H. A. A. Z. (2006) Islamic banks and service quality: an empirical study of the
UAE. PhD Thesis. University of Durham.
Ogba, I. (2007) Organisational Commitment in Developing Countries: The Case of Nigeria.
PhD Thesis. Newcastle Business School, Northumbria University.
Oldfield, B. M. and Baron, S. (2000) Student perceptions of service quality in a UK
university business and management faculty, Quality Assurance in Education, 8 (2), pp. 85-
95.
Oliver, R. L. (1980) A cognitive model of the antecedents and consequences of satisfaction
decisions, Journal of Marketing Research, 17 (10), pp. 460-69.
Oliver, R. L. (1993) A conceptual model of service quality and service satisfaction:
compatible goals, different concepts, Advances in Services Marketing and Management, 2,
pp. 65-85.
254
Oliver, R. L. (1997) Satisfaction: A behavioral perspective on the consumer. New York:
McGraw Hill.
Othman, A. and Owen, L. (2001) Developing an instrument to measure customer service
quality SQ in Islamic banking, International Journal of Islamic Financial Services, 3 (1), pp.
1-26.
Othman, A. and Owen, L. (2002) The multi dimensionality of Carter Model to measure
customer service quality (SQ) in Islamic banking industry: a study in Kuwait finance house,
International Journal of Islamic Financial Services, 3 (4).
Othman, A. Q. and Owen, L. (2001) Adopting and measuring customer service quality (SQ)
in Islamic banks: a case study in Kuwait finance house, International Journal of Islamic
Financial Services, 3 (1).
Pallant, J. (2007) SPSS Survival manual: A Step by Step Guide to Data Analysis using SPSS
for Windows. 3rd edn. Berkshire, England: McGraw Hill: Open University Press.
Palmer, A. (1994) Principles of Services Marketing. Berkshire, England: McGraw-Hill Book
Company Europe.
Palmer, A. (2008) Priciples of Service Marketing. 5th edn. London: The McGraw-Hill
Companies.
Panigrahy, D. (2000) Relationship marketing: an opportunity for bankers in the next
millenium. Proceedings of the International Conferenc on Delivering Service Quality
Managerial Challenges for the 21st Century, New Delhi, pp. 85-91.
Paraskevas, A. (2001) Exploring hotel internal service chains: a theoretical approach,
International Journal of Contemporary Hospitality Management, 13 (5), pp. 251-58.
Parasuraman, A. & Berry, L. (1991) Marketing services: competing through quality. Free
Press.
Parasuraman, A. (2002) Service quality and productivity: a synergistic perspective,
Managing Service Quality, 12 (1), pp. 6-9.
Parasuraman, A., Zeithaml, V. A. and Berry, L. L. (1994) Alternative scales for measuring
service quality: a comparative assessment based on psychometric and diagnostic criteria,
Journal of Retailing, 70 (3), pp. 201-30.
Parasuraman, A., Zeithaml, V. A. and Berry, L. L. (1994) Reassessment of expectations as a
comparison standard in measuring service quality: implications for further research, The
Journal of Marketing, 58, pp. 111-24.
Parasuraman, A., Zeithaml, V. A. and Berry (1991) Refining and reassessment of the
SERVQUAL scale, Journal of Retailing, 67 (4), pp. 420-50.
Parasuraman, A., Zeithaml, V. and Berry, L. (1988) SERVQUAL: A Multi-Item Scale for
Measuring Consumer Perceptions of Service Quality, Journal of Retailing, 64 (1), pp. 12-40.

255
Parasuraman, A., Zeithaml. V. A. and Berry, L. L. (1985) A conceptual model of service
quality and its implications for future research, Journal of Marketing, 49, pp. 41-50.
Parnell, J. A. and Menefee, M. L. (2007) The view changes at the top: resolving differences
in managerial perspectives on strategy, SAM Advanced Management Journal, 72 (2), pp. 4-
14.
Perng, Y. H. (2007) A Service Quality Improvement Dynamic Decision Support System for
Refurbishment Contractors, Total Quality Management & Business Excellence, 18 (7), pp.
731-49.
Peter, J. P., Churchill Jr, G. A. and Brown, T. (1993) Caution in the use of difference scores
in consumer research, Journal of Consumer Research, 19, pp. 655-62.
Petridou, E., Spathis, C., Glaveli, N. and Liassides, C. (2007) Bank service quality: empirical
evidence from Greek and Bulgarian retail customers, International Journal of Quality &
Reliability Management, 24 (6), pp. 568-85.
Philip, G. and Hazlett, S. A. (1997) The measurement of service quality: a new PCP
attributes model, International Journal of Quality and Reliability Management, 14 (2), pp.
260-86.
Pitt, L. F., Watson, R. T. and Kavan, C. B. (1995) Service quality: a measure of information
systems effectiveness, MIS quarterly, 19 (2), pp. 173-87.
Pizam, A. and Ellis, T. (1999) Customer satisfaction and its measurement in hospitality
enterprises, International Journal of Contemporary Hospitality Management, 11 (7), pp.
326-39.
Prayag, G. (2007) Assessing international tourists„ perceptions of service quality at Air
Mauritius, International Journal of Quality & Reliability Management, 24 (5).
Ranaweera, C. and Neely, A. (2003) Some moderating effects on the service quality-
customer retention link. International Journal of Operations and Production Management,
23 (2), pp. 230-48.
Rao, C. P. and Kelkar, M. M. (1997) Relative impact of performance and importance ratings
on measurement of service quality, Journal of Professional Services Marketing, 15 (2), pp.
69-86.
Rapert, M. I. and Wren, B. M. (1998) Service quality as a competitive opportunity, Journal
of Services Marketing, 12 (3), pp. 223-35.
Ravald, A. and Gronroos, C. (1996) The value concept and relationship marketing, European
Journal of Marketing, 30 (2), pp. 19-30.
Razak, M., Chong, S. and Lin, B. (2007) Service quality of a local Malaysian bank:
customers' expectations, perceptions, satisfaction and loyalty, International Journal of
Services and Standards, 3 (1), pp. 18-38.
Reardon, K. and Enis, K. (1990) Establishing a Companywide Customer Orientation through
Persuasive Internal Marketing, Management Communication Quarterly, 3 (3), pp. 376-87.
256
Reeves, T. and Harper, D. G. (1981) Surveys at work: student project manual. McGraw-Hill.
Rice, G. and Mahmoud, E. (2001) Integrating quality management, creativity and
innovation in Islamic banks. Citeseer.
Richard, M. D. and Allaway, A. W. (1993) Service quality: insights and managerial
implications from the frontier in Service Quality: New Directions in Theory and Practice.
(eds) Rust, R. T. and Oliver, R. L. Sage Publications, Thousand Oaks, CA: 1-19.
Robson, A., Pemberton, J. and McGrane, A. (2008) Business Research Analysis. McGraw-
Hill.
Roest, H. and Theo, V. (1995) Quality marks: Prospective tools in managing service quality
perceptions. Managing service quality. (eds) Paul, K. and Jose, L. London: Paul Chapman:
65-78.
Rouhani, F. (1997) Perceived quality of small to medium professional marketing consultancy
service in Australia and Singapore, Small Business Unit, Curtin University of Technology
Press.
Rust, R. and Oliver, R. (1994) Service Quality: New Directions in Theory and Practice.
Thousand Oaks: Sage Publications.
Rust, R. T., Zahorik, A. J, and Keiningham, T. L. (1996) Service Marketing. New York:
HarperCollins College Publishers.
Rust, R. T., Zahorik, A. J. and Keiningham, T. L. (1995) Return on quality (ROQ): making
service quality financially accountable, Journal of Marketing, 59, pp. 58-70.
Rust, R., Zeithaml, V. and Lemon, K. N. (2000) Driving customer equity. New York: Free
Press.
Sapienza, P. (2004) The effects of government ownership on bank lending, Journal of
Financial Economics, 72, pp. 357-84.
Sasser, W. E., Olsen, R.P. and Wyckoff, D. D. (1978) Management of Service Operattions:
Text and Cases. Boston: Allyn & Bacon.
Saunders, M., Lewis, P. and Thornhill, A. (2009) Research Methods for Business students.
5th edn. Essex: Pearson Education Limited.
Saunders, M., Thornhill, A. and Lewis, P. (2007) Research methods for business students.
Financial Times/Prentice Hall.
Schembri, S. and Sandberg, J. (2002) Service quality and the consumer's expereince: towards
an interpretive approach, Marketing Theory, 2 (2), pp. 189-205.
Schiffman, L. G. and Kanuk, L. L. (1987) Consumer Behavior. Englewood Cliffs NJ,
Prentic-Hall.
257
Schwab, D. P. (1985) Reviewing empirically based manuscripts: perspectives on Process in
Publishing in the Organisational Sciences, Cummings L. L. and P. J. Frost, P. J. (eds.),
Irwin: Homewood, pp. 171-81.
Scotti, D. J., Harmon, J. and Behson, S. J. (2007) Links among high-performance work
environment, service quality, and customer satisfaction: an extension to the healthcare
sector... including commentary by Messina DJ, Journal of Healthcare Management, 52 (2),
pp. 109-25.
Seth, N., Deshmukh, S. G. and Vrat, P. (2005) Service quality models: a review,
International Journal of Quality & Reliability Management, 22 (9), pp. 913-49.
Shah, M. and Clarke, S. (2009) E-Banking Management- Issues, Solutions, and Strategies.
London: Information Science Reference.
Shleifer, A. and Vishny, R. W. (1997) A survey of corporate governance, Journal of Finance
52, pp. 737-83.
Sivadas, E. and Baker-Prewitt, J. L. (2000) An examination of the relationship between
service quality, customer satisfaction, and store loyalty, International Journal of Retail &
Distribution Management, 28 (2), pp. 73-82.
Skelcher, C. (1992) Managing for service quality. Longman: Harlow.
Smith, D. (1998) Designing market research studies in The ESOMAR handbook of market
and opinion research. McDonald, C. and Vangelder, P. (eds.)Esomar.
Smith, R. E. and Swinyard, W. R. (1983) Attitude-Behavior Consistency: The Impact of
Product Trial Versus Advertising, Journal of Marketing Research, 20 (8), pp. 257-67.
Soteriou, A. and Zenios, S. (1998) Operations, quality, and profitability in the provision of
banking services, Management Science, 45 (9), pp. 1221-38.
Spathis, C., Petridou, E. and Glaveli, N. (2004) Managing service quality in banks:
customers gender effects, Emerald Group Publishing Limited, 14 (1), pp. 90-102.
Spreng, R. A. and R. D. Mackoy (1996) An empirical examination of a model of perceived
service quality and satisfaction, Elsevier. 72, pp. 201-14.
Spreng, R. A., Mackenzie, S. B. and Olshavsky, R. W. (1996) A re-examination of the
determinants of consumer satisfaction, Journal of Marketing, 60 (3), pp. 15-32.
Stading, G. and Altay, N. (2007) Delineating the Ease of Doing Business Construct within
the SupplierCustomer Interface, The Journal of Supply Chain Management, 43 (2), pp. 29-
38.
Stafford, M. R. (1996) Demographic discriminators of service quality in banking, The
Journal of Service Marketing, 10 (4), pp. 6-22.
Stanton, W. J. (1986) Fundamentals of marketing. Singapore: McGraw-Hill.

258
Stewart, J. and Walsh, K. (1992) Change in the management of public services, Public
Administration, 70 (4), pp. 499-518.
Sureshchandar, G. S., Rajendran, C. and Anantharaman, R. N. (2002) Determinants of
customer-perceived service quality: a confirmatory factor analysis approach, Journal of
Services Marketing, 16 (1), pp. 9-34.
Sureshchandar, G. S., Rajendran, C. and Anantharaman, R. N. (2003) Customer perceptions
of service quality in the banking sector of a developing economy: a critical analysis,
International Journal of Bank Marketing, 21 (5), pp. 233-42.
Tabachnick, B. and Fidell, L. (2007) Using Multivariate Statistics. 5th edn. Boston: Pearson.
Tam, J. L. M. and Wong, Y. H. (2001) Interactive selling: a dynamic framework for services,
Journal of Services Marketing, 15 (4/5), pp. 379-96.
Tansey, O. (2007) Process tracing and elite interviewing: a case for non-probability
sampling, PS: Political Science and Politics, 40 (04), pp. 765-72.
Tashakkori, A. and Teddlie, C. (1998) Mixed Methods: Combining Qualitative and
Qunatitative Approaches. Thousand Oaks: Sage Publications.
Taylor, S. and Baker, T. (1994) An assessment of the relationship between service quality
and customer satisfaction in the formation of consumers' purchase intentions, Journal of
Retailing, 70 (2), pp. 163-78.
Teas, R. K. (1993a) Consumer expectations and the measurement of perceived service
quality, Journal of Professional Services Marketing, pp. 8 (2): 33-54.
Teas, R. K. (1993b) Expectations, performance evaluation, and consumers' perceptions of
quality, The Journal of Marketing, 57 (4), pp. 18-34.
Teas, R. K. (1994) Expectations as a comparison standard in measuring service quality: an
assessment of a reassessment, The Journal of Marketing, 58 (1), pp. 132-39.
Thampy, A. and Madanmohan, T. R. (1999) Indian Overseas Bank: Customer Service
Survey. Bangalore: Indian Institute of Mnagement.
Trochim, W. K. (2001) Research methods knowledge base. Ohio: Atomic Dog Publishing.
Turnbull, P. W. and Moustakatos, T. (1996) Marketing and investment banking: relationship
and competitive advantage, Emerald Group Publishing Limited, 14 (2), pp. 38-49.
Twati, J. and Gammack, J. (2006) The impact of organisational culture innovation on the
adoption of IS/IT: the case of Libya, Journal of enterprise information management, 19 (2),
pp. 175-91.
Urban, W. (2009) Service Quality Gaps and their role in service enterprises development,
Baltic Journal on Sustainability, 15 (4), pp. 631–45.
259
Van der Wal, R. W. E., Pampallis, A. and Bond, C. (2002) Service quality in a cellular
telecommunications company: a South African experience, Managing Service Quality, 12
(5), pp. 323-35.
Van Dyke, T. P., Prybutok, V. R. and Kappelman, L. A. (1999) Cautions on the use of the
SERVQUAL measure to assess the quality of information systems services, Decision
Sciences, 30 (3), pp. 877-92.
Veloutsou, C., Gilbert, G., Moutinho, L. A. and Goode, M. M. H. (2005) Measuring
transaction-specific satisfaction in services: Are the measures transferable across cultures?,
European Journal of Marketing, 39 (5/6), pp. 606-28.
Venetis, K. A. and Ghauri, P. N. (2004) Service quality and customer retention: building
long-term relationships, European Journal of Marketing, 38 (11/12), pp. 1577-98.
Walbridge, S. W. and Delene, L. M. (1993) Measuring physician attitudes of service quality,
Journal of Health Care Marketing, 13 (1), pp. 7-15.
Walker, D. (1990) Customer first: a strategy for quality service. Gower, Aldershot.
Wallace, D., Giese, J. and Johnson, J. (2004) Customer retailer loyalty in the context of
multiple channel strategies, Journal of Retailing, 80, pp. 249-63.
Wang, Y., Lo, H. P. and Hui, Y. V. (2003) The antecedents of service quality and product
quality and their influences on bank reputation: evidence from the banking industry in China,
Managing Service Quality, 13 (1), pp. 72-83.
Wass, V. J. and Wells, P. E. (1994). Principles and practice in business and management
research. England: Brookfield, Aldershot..
Webster, C. (1989) Can consumers be segmented on the basis of their service quality
expectations? Journal of Service Marketing, 8 (2), pp. 35-53.
Welsh, D. H and Raven, P (2006) Family Business in the Middle East: An Eexploratory
Study of Retail Management in Kuwait and Lebanon, FAMILY BUSINESS REVIEW, XIX
(1), pp. 29-48.
Wille, E. (1992) Quality: achieving excellence. London: Century Business.
Wilson, A., Zeithaml, V., Binter, M. and Gremler, D. (2008) Service Marketing: Intergrating
Customer Focus Across the Firm. London: The McGraw-Hill Companies.
Wisker, G. (2008) The Postgraduate Research Handbook. 2nd edn. New York: Palgrave
Macmillian.
Witkowski, T. H. and Wolfinbarger, M. F. (2000) The formality dimension of service quality
in Thailand and Japan, Annual Conference of the Association for Consumer Research. Salt
Lake City. October/2000.
Witkowski, T. H. and Wolfinbarger, M. F. (2001) The formality dimension of service quality
in Thailand and Japan, Advances in Consumer Research, 28, pp. 153-60.
260
Wong, D. H., Rexha, N. and Phau, I. (2008) Re-examining traditional service quality in an e-
banking era, International Journal of Bank Marketing, 26 (7), pp. 526-45.
Woodruff, R. B. (1993) Developing and applying consumer satisfaction knowledge:
Implications for future research, Journal of Consumer Satisfaction, Dissatisfaction and
Complaining Behavior, 6, pp. 1-11.
Woodruff, R. B., Cadotte, E. R. and Jenkins, R. L. (1987) Expectations and Norms in
Models of Consumer Satisfaction. Journal of Marketing Research 24 (8), 305-14.
Yavas, U., Bilgin, Z. and Shemwell, D. J. (1997) Service quality in the banking sector in an
emerging economy: a consumer survey, International Journal of Bank Marketing, 15 (6), pp.
217-23.
Young, M. P. (1992) Objective analysis of the topological organisation of the primate
cortical visual system. Nature, Lond.
Yu, C. (2005) Using SAS for item analysis and test construction. Educational Assessment
Course Homepage.
Yu, L., Hong, Q., Gu, S. and Wang, Y. (2008) An epistemological critique of gap theory
based library assessment: the case of SERVQUAL, Journal of Documentation, 64 (4), pp.
511-51.
Zahorik, A. J. and Rust, R. T. (1992) Modeling the impact of service quality on profitability:
a review, Advances in service marketing and management. pp. 247-76.
Zahorik, A.J. and Rust, R.T. (1992) Modeling the impact of service quality on profitability: a
review in Advances in Services Marketing andManagement,Swartz, T.A., Bowen, D.E. and
Brown, S.W (eds), JAI Press, Greenwich, pp. 247-76.
Zeithaml, V. A. (1988) Consumer perceptions of price, quality and value: a means-end
model and aynthesis of evidence, Journal of Marketing, 52 (3), pp. 2-22.
Zeithaml, V. A. and Bitner, M. J. (1996) Services marketing. New York: McGraw-Hill.
Zeithaml, V. A. and Parasuraman, A. (1990) Delivering Quality Service: Balancing
Customer Perceptions and Expectations. New York: Free Press.
Zeithaml, V. A., Berry, L. L. and Parasuraman, A. (1988) Communication and control
processes in the delivery of service quality, The Journal of Marketing, 52 (4), pp. 35-48.
Zeithaml, V. A., Berry, L. L. and Parasuraman, A. (1992) Communication and control
processes in the delivery of service quality. in Managing service marketing: Text and
readings, John, E. G. (eds), 2nd edn. Florida: The Dryden Press: 35-48.
Zeithaml, V. A., Berry, L. L. and Parasuraman, A. (1993) The nature and determinants of
customer expectations of service, Journal of Academy of Marketing Science, 21 (1), pp. 1-
12.
Zeithaml, V. A., Berry, L. L. and Parasuraman, A. (1996) The behavioural consequences of
service quality, Journal of Marketing, 60, pp. 31-46.
261
Zeithaml, V. A., Bitner, M. J. and Gremler, D. D. (2003) Services marketing: Integrating
customer focus across the firm. McGraw-Hill Companies.
Zeithaml, V. A., Bitner, M. J. and Gremler, D. D. (2009) Services Marketing. New York:
McGraw-Hill.
Zeithaml, V. A., Parasuraman, A. Berry, L. L. (1990) Delivering service quality. New York:
Free Press.
Zhu, Z. and Nakata, C. (2007) Re-examining the link between customer orientation and
business performance: The role of information system, Journal of Marketing Theory and
Practice, 15 (3), 187-203.
Zikmund, G. W. (1994) Business Research Methods. 4th edn. New York: The Dryden Press.
Zikmund, W. and Babin, B. (2010) Exploring Marketing Research. 10th edn. United
Kingdom: South-Western Cengage Learning.
Zikmund, W. G. (1997) Exploring Marketing Research. Texas: Dryden Press, Forth Worth.
Zikmund, W., Babin, B., Carr, J. and Griffin, M. (2010) Business Research Methods. 8th
edn. United Kingdom: South-Western, Cengage Learning.
Central Bank of Libya (2009) Available at: http://cbl.gov.ly/en/home/index.php?cid=102.
(Accessed: 29th July 2009)
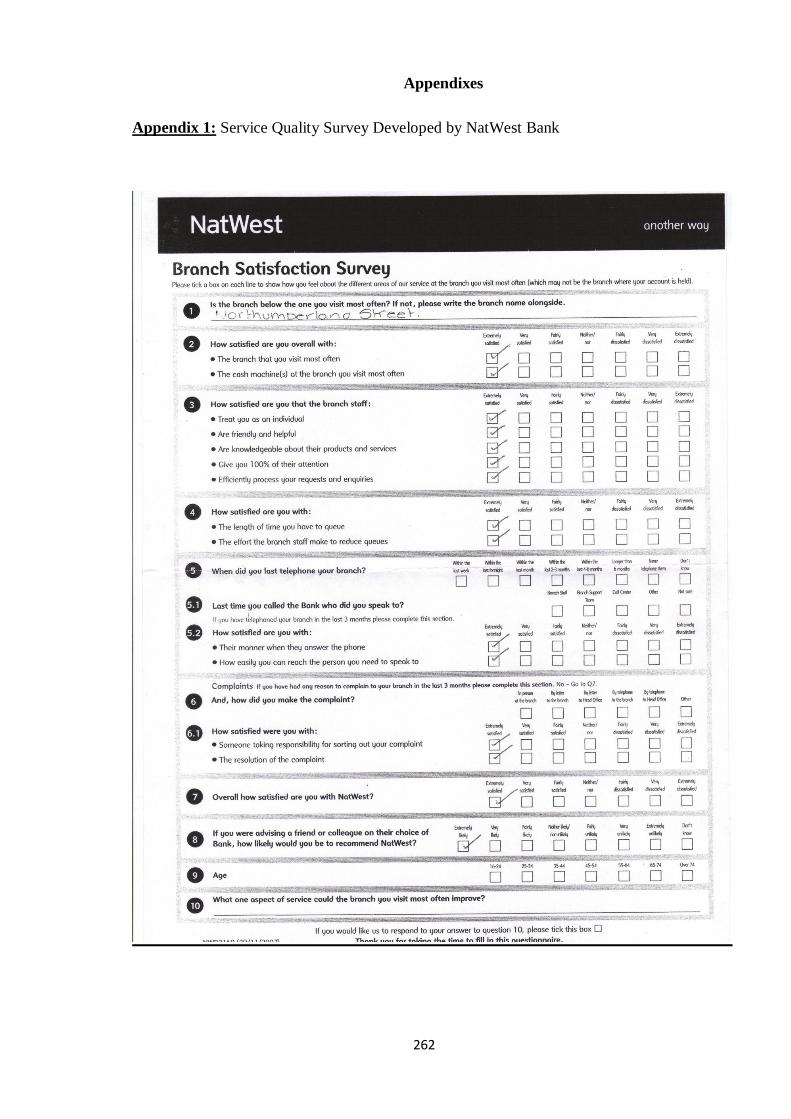
262
Appendixes
Appendix 1: Service Quality Survey Developed by NatWest Bank
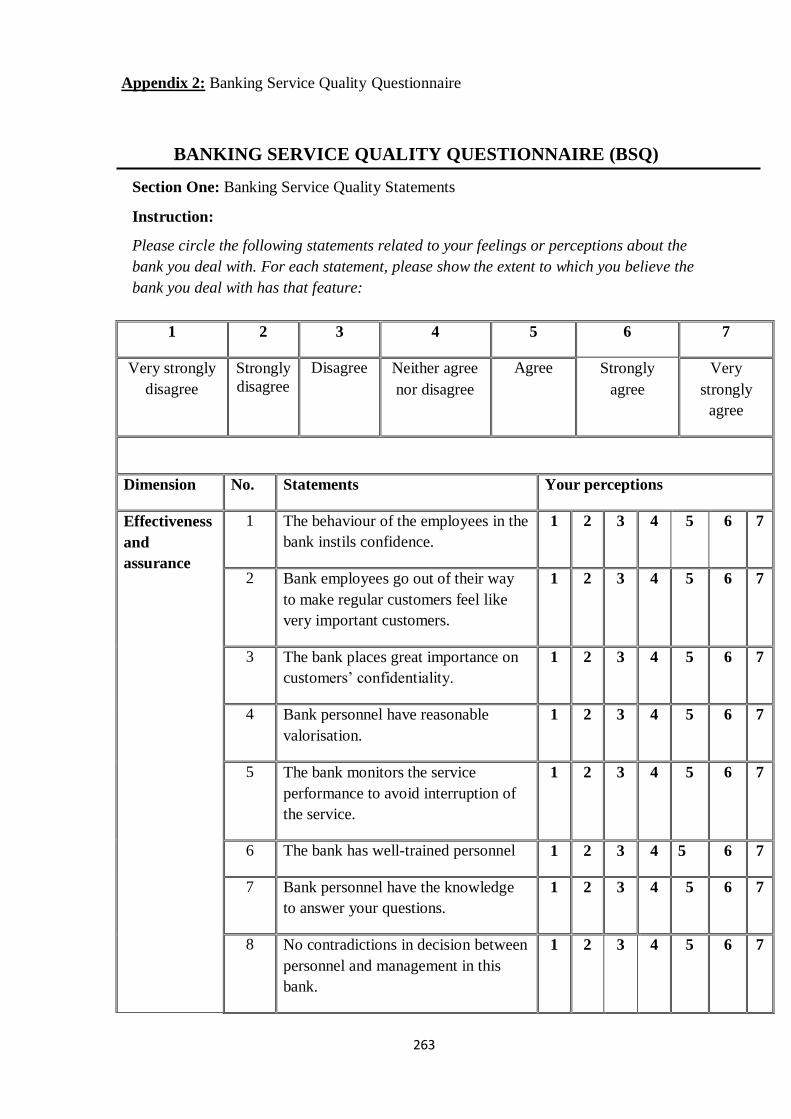
263
BANKING SERVICE QUALITY QUESTIONNAIRE (BSQ)
Section One: Banking Service Quality Statements
Instruction:
Please circle the following statements related to your feelings or perceptions about the
bank you deal with. For each statement, please show the extent to which you believe the
bank you deal with has that feature:
1 2 3 4 5 6 7
Very strongly
disagree
Strongly
disagree
Disagree Neither agree
nor disagree
Agree Strongly
agree
Very
strongly
agree
Dimension No. Statements Your perceptions
Effectiveness
and
assurance
1 The behaviour of the employees in the
bank instils confidence.
1 2 3 4 5 6 7
2 Bank employees go out of their way
to make regular customers feel like
very important customers.
1 2 3 4 5 6 7
3 The bank places great importance on
customers‟ confidentiality.
1 2 3 4 5 6 7
4 Bank personnel have reasonable
valorisation.
1 2 3 4 5 6 7
5 The bank monitors the service
performance to avoid interruption of
the service.
1
2 3 4 5 6 7
6 The bank has well-trained personnel 1 2 3 4 5 6 7
7 Bank personnel have the knowledge
to answer your questions.
1 2 3 4 5 6 7
8 No contradictions in decision between
personnel and management in this
bank.
1 2 3 4 5 6 7
Appendix 2: Banking Service Quality Questionnaire

264
9 The bank provides its services at the
time it promises to do so.
1 2 3 4 5 6 7
10 The bank has good reputation. 1 2 3 4 5 6 7
11 You feel secured and safe in your
transactions with bank‟s employees
1 2 3 4 5 6 7
12 No delays due to bureaucratic factors
and procedures in this bank.
1 2 3 4 5 6 7
13 The bank shows high quality
indications.
1 2 3 4 5 6 7
Access 14 The bank has sufficient number of
ATMs per branch.
1 2 3 4 5 6 7
15 The bank has the latest technology and
the modern-looking equipment.
1 2 3 4 5 6 7
16 The bank has sufficient number of
open tellers.
1 2 3 4 5 6 7
17 Waiting time at the counter is short in
this bank.
1 2 3 4 5 6 7
18 The queues in this bank move rapidly. 1 2 3 4 5 6 7
Price 19 The bank contacts me every time it is
useful.
1 2 3 4 5 6 7
20 The bank provides good explanations
of service fees.
1 2 3 4 5 6 7
21 The bank makes balance amount from
which service charges begin.
1 2 3 4 5 6 7
22 The bank takes reasonable fees for the
administration of the accounts.
1 2 3 4 5 6 7
23 The bank keeps customers informed
every time that a better solution
appears for the problem.
1 2 3 4 5 6 7

265
Tangibles 24 The bank provides precision account
statements for customers.
1 2 3 4 5 6 7
25 The bank provides good level of the
cleanliness of facilities.
1 2 3 4 5 6 7
26 The bank facilities are well-decorated. 1 2 3 4 5 6 7
27 The bank has efficacious work
environment.
1 2 3 4 5 6 7
Services
portfolio
28 The bank offers complete gamut of
services.
1
2 3 4 5 6 7
29 The bank offers a range of services that
is consistent with the latest innovation in
banking services.
1 2 3 4 5 6 7
Reliability 30
The bank identifies and rectifies any
errors in the service delivery.
1 2 3 4 5 5 6
31
The bank has precision of filing systems. 1 2 3 4 5 6 7
Section Two: Customer‟s Demographic and Background Characteristics
Instruction:
Please consider the following questions, which concern your personal details. These
details are needed for purely statistical reasons. Please answer the question by circling the
number that matches your personal situation/views.
Question One: What is your age?
Under 18 1
18-24 2
25-34 3

266
35-44 4
45-54 5
55-65 6
Over 65 7
Question Tow: What is your gender?
Male 1
Female 2
Question Three: How often do you visit your branch? (That is the branch where you have
main account.)
Once a week or more often 1
Less often than once a week but once a month or more 2
Less often than once a month 3
Question Four: What is your occupation?
Employee 1
Self-employed 2
Retired 3
Student 4
Housewife 5
Sole trader 6
Civil servant 7
Other 8
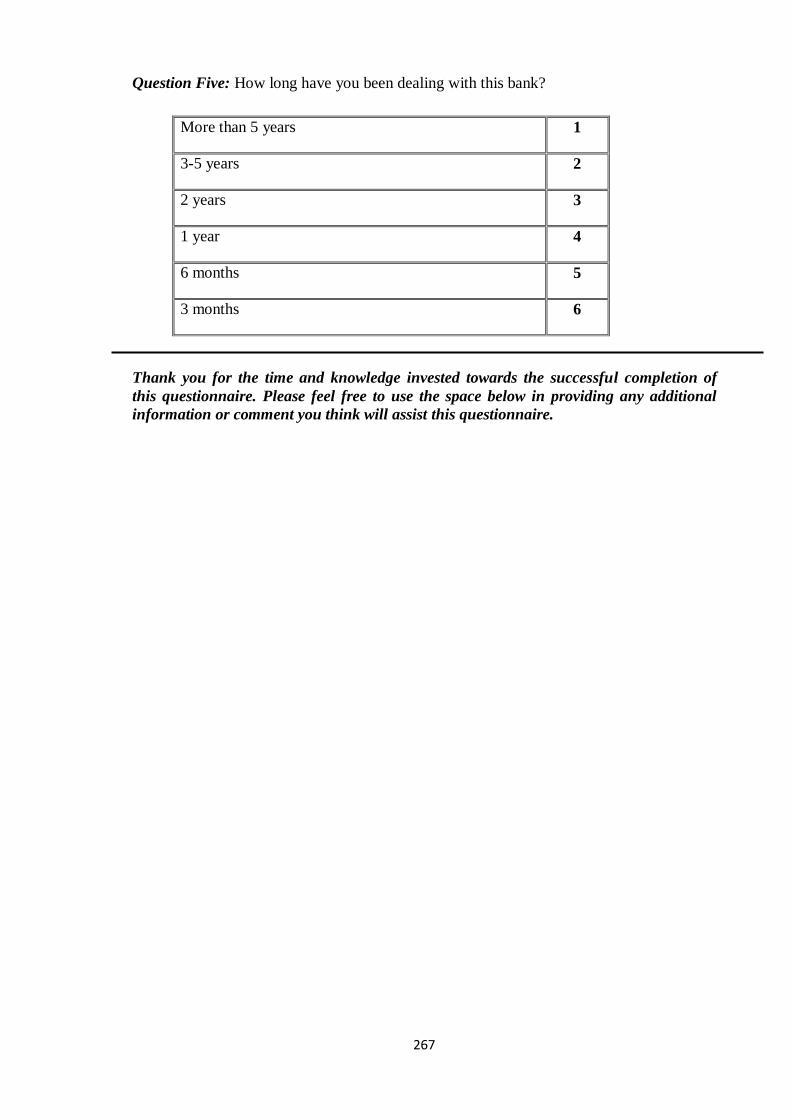
267
Question Five: How long have you been dealing with this bank?
More than 5 years 1
3-5 years 2
2 years 3
1 year 4
6 months 5
3 months 6
Thank you for the time and knowledge invested towards the successful completion of
this questionnaire. Please feel free to use the space below in providing any additional
information or comment you think will assist this questionnaire.

268
Appendix 3: The Revised Banking Service Quality Questionnaire (Arabic version/final version)
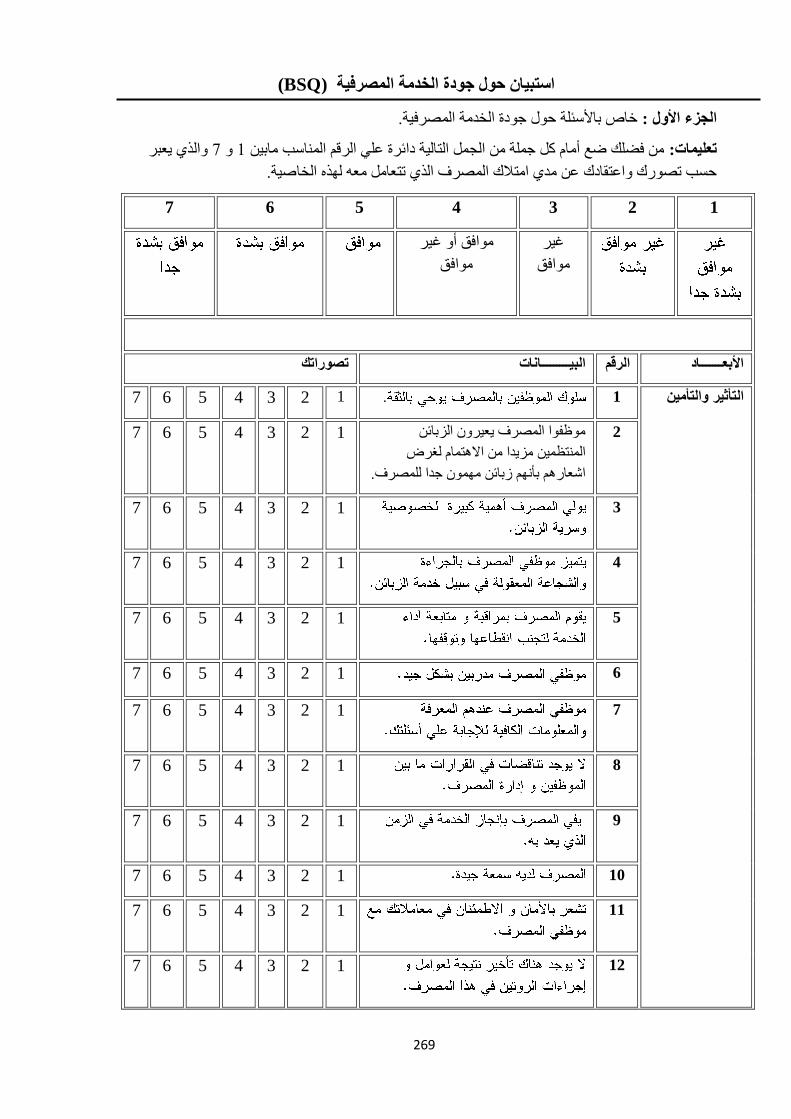
269
(BSQ) استبيان حول جودة الخذمت المصرفيت
.خبص ثبألسئلخ حل جدح الخذهخ الوصشفخ الجزء األول :
الزي عجش 7 1هي فضله ضع أهبم ول جولخ هي الجول التبلخ دائشح عل الشلن الوبست هبثي : تعليماث
.الن الوصشف الزي تتعبهل هع لز الخبصخحست تصسن اعتمبدن عي هذي اهت
7 6 5 4 3 2 1
هافك أ غش
هافك
غش
هافك
األبعـــــــاد الرقم البيـــــــــاواث تصوراتك
7 6 5 4 3 2 1 . تأثير والتأميهال 1
هظفا الوصشف عشى الضثبئي 1 2 3 4 5 6 7
الوتظوي هضذا هي االتوبم لغشض
.اشعبسن ثأن صثبئي هوى جذا للوصشف
2
7 6 5 4 3 2 1
3
7 6 5 4 3 2 1
4
7 6 5 4 3 2 1
5
7 6 5 4 3 2 1 6
7 6 5 4 3 2 1
7
7 6 5 4 3 2 1
8
7 6 5 4 3 2 1
9
7 6 5 4 3 2 1 10
7 6 5 4 3 2 1
11
7 6 5 4 3 2 1
12
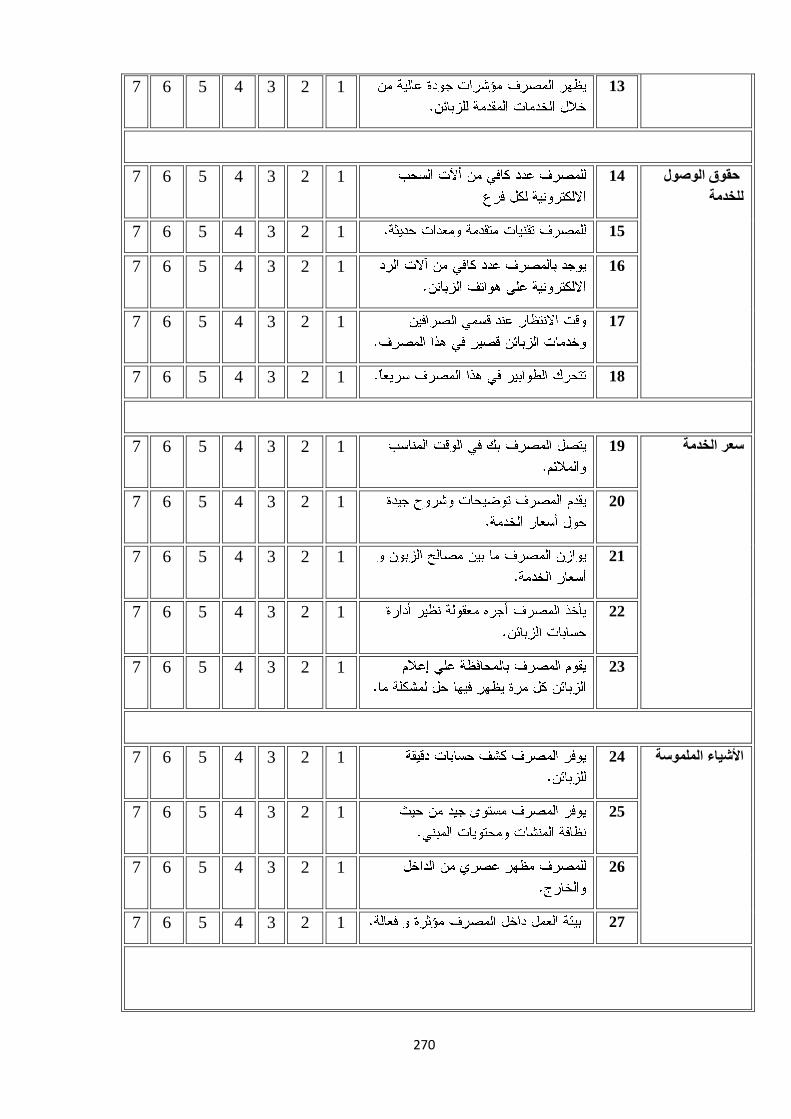
270
7 6 5 4 3 2 1
13
7 6 5 4 3 2 1
حقوق الوصول 14
للخذمت
7 6 5 4 3 2 1 15
7 6 5 4 3 2 1
16
7 6 5 4 3 2 1
17
7 6 5 4 3 2 1 18
7 6 5 4 3 2 1
سعر الخذمت 19
7 6 5 4 3 2 1
20
7 6 5 4 3 2 1
21
7 6 5 4 3 2 1
22
7 6 5 4 3 2 1
23
7 6 5 4 3 2 1
األشياء الملموست 24
7 6 5 4 3 2 1
25
7 6 5 4 3 2 1
26
7 6 5 4 3 2 1 27

271
7 6 5 4 3 2 1
ثحقيبت الخذما 28
7 6 5 4 3 2 1
29
7 6 5 4 3 2 1
الجذارة بالثقت 30
واالعتماد
7 6 5 4 3 2 1 31
.؟الجببد الشخصخ للضثى هب عوـــــــــــشن الجزء الثاوي :
ز الجببد هطلثخ فمط لألغشاض . الشجبء اعتجبس األسئلخ التبلخ الوتعلمخ ثبلجببد الشخصخ :تعليماث
. الشجبء ضع دائشح عل الشلن الزي الءم ثببته الشخصخ. اإلحصبئخ
هب عوـــــــــــشن؟ :السؤال األول
1 81
2 8142
3 4242
4 4222
5 2222
6 2252
عبم فوب فق 7 65
السؤال الثاوي : هب جســـــه؟
روــــــــش 1
أثــــــــى 2
(الزي ث حسبثه الشئس)ون عذد الوشاد الت تضس فب الوصشف؟ :السؤال الثالث
1
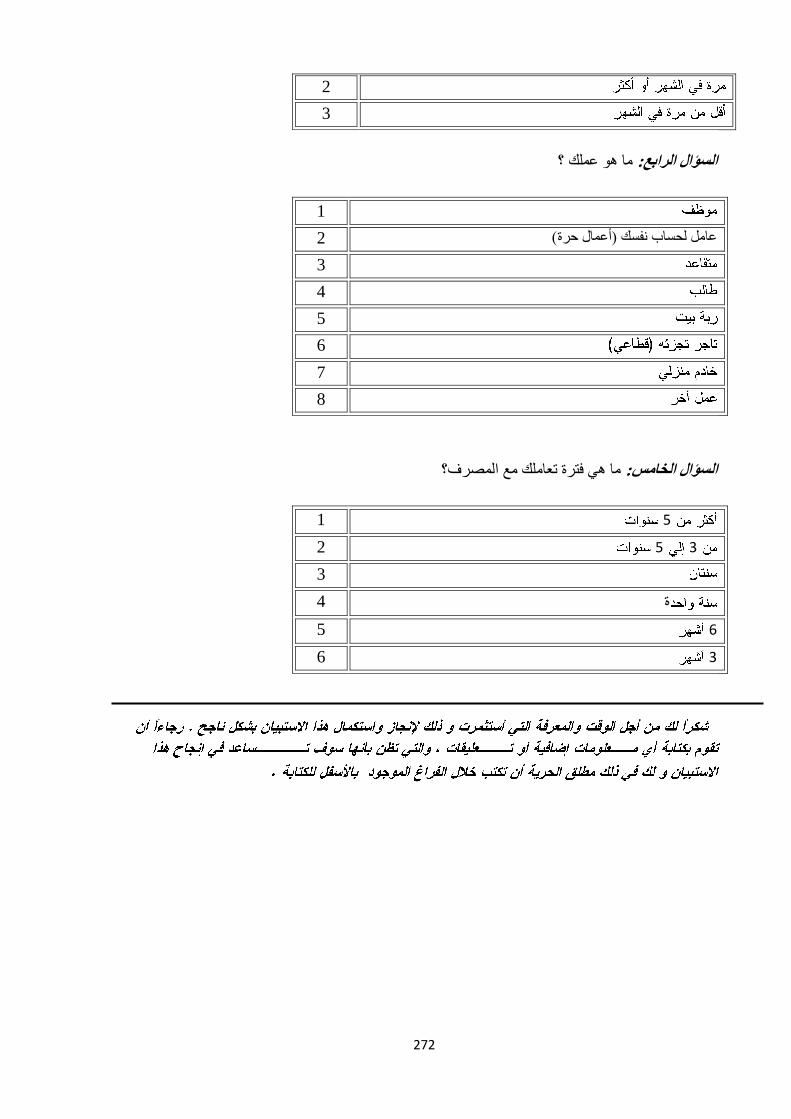
272
2
3
هب عوله ؟ :السؤال الرابع
1
(أعوبل حشح)لحسبة فسه عبهل 2
3
4
5
6
7
8
الوصشف؟هب فتشح تعبهله هع :السؤال الخامس
1 2
2 42
3
ح 4
5 5
6 4

273
Appendix 4: The Translated Version of the Questionnaire
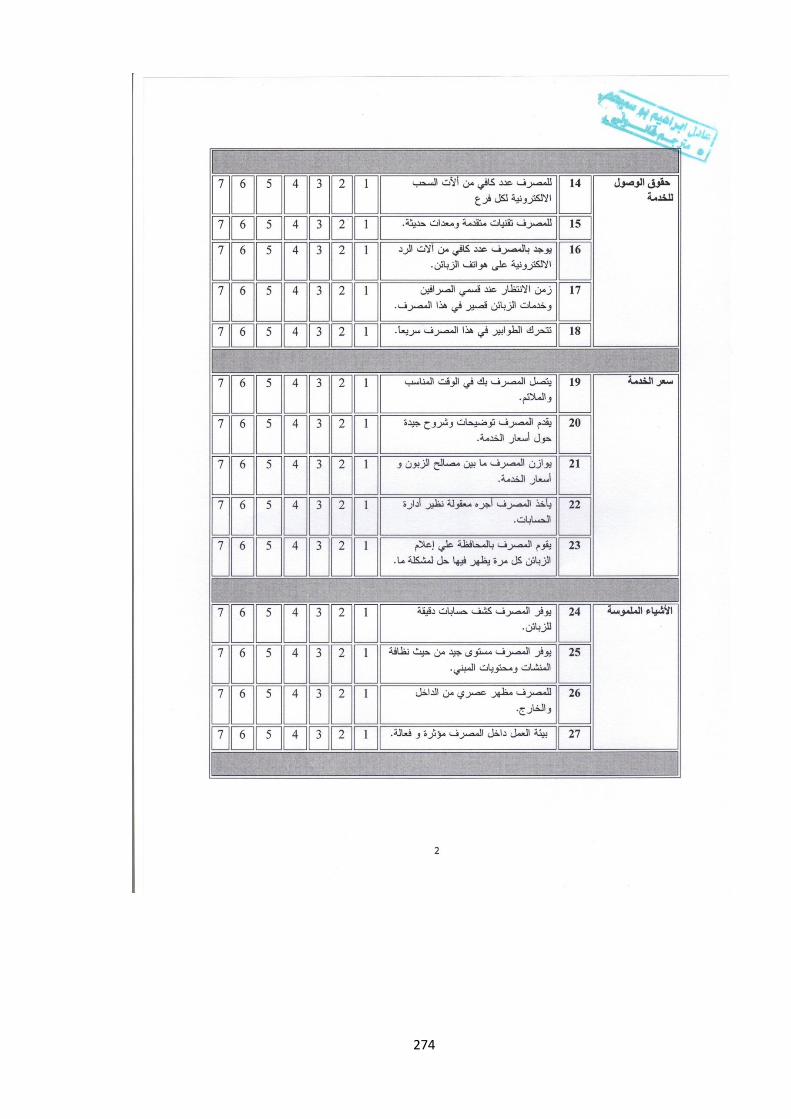
274

275

276

277
Appendix 5: Back Translated Version of the Questionnaire

278
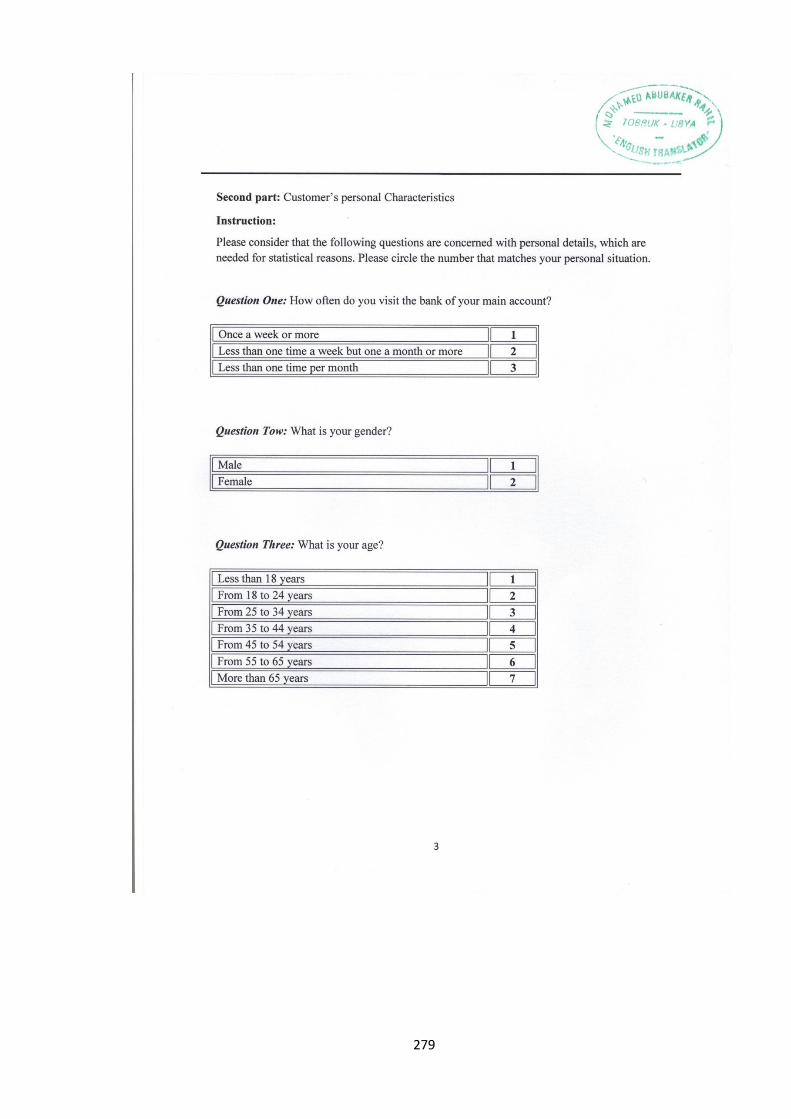
279
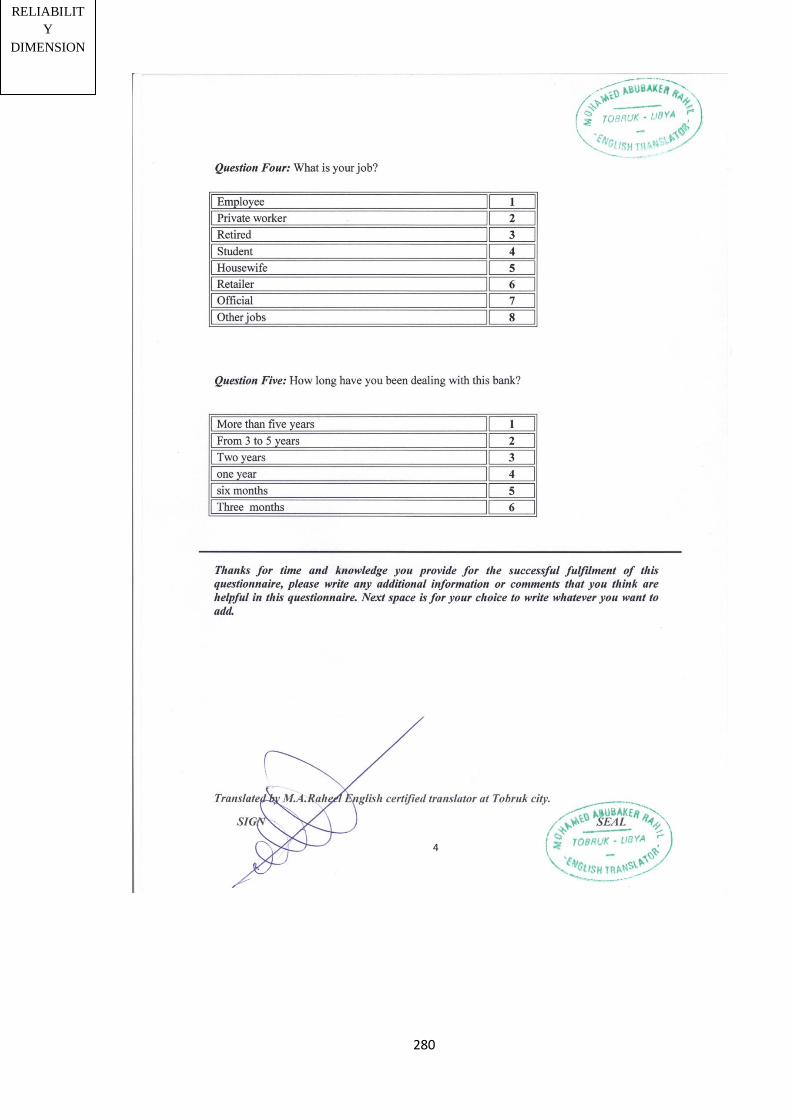
280
The study
reported that
both banks
were able to
provide fresh
evidence
about the
suitability of
the
SERVQUAL
model in
measuring
banking
service
quality.
500
customers,
1,350
customers
and 84000
customers
UK Newman
(1996)
The findings
supported the
application of
SERVQUAL
model within
UK retail
banks, but on
the other side,
the study
evidently
identified
SERVQUAL
failure to
provide any
suggestions
towards
service
quality
improvement
s.
439
customers
and 39 bank
employees.
UK Blanchard
and Galloway
(1994)
The study
rejected the
replication of
SERVQUAL
dimensions
and suggested
that
SERVPERF
model is
more superior
than
SERVQUAL.
660
customers
USA Cronin and
Taylor (1992)
The study
reported that
SERVQUAL
model is
more
effective than
SERVPERF
in providing
diagnostic
information .
The
researchers
used sample
size of 143
retail banking
customers.
India Angur et al
(1992)
The results
support the
superiority of
the
Technical/
Functional
Quality
model in
predicting
customer
satisfaction.
The authors
used sample
size of 65
international
private
banking
customers.
USA Lasser et al
(2000)
The results
indicated that
both
SERVQUAL
has low
construct
validity.
The sample
size used in
study was
153 retail
banking
customers.
South Korea Cui et al
(2003)
The alpha
coefficients
of these four
dimensions
were 0.9414,
0.8518,
0.8808, and
0.9194
respectively.
4 dimensions:
personal
skills (12),
reliability (5),
image (6),
value (6)
29 items;
perception-
only scores
Exploratory
factor
analysis
Self-
administered
115
customers of
conventional
banks and
115
customers of
Islamic banks
UK Jabnoun and
Khalifa
(2005)
A total of 660
questionnaire
s
Ranged from
4.07 to 5.52
6 dimensions:
tangibles (3),
reliability (5),
responsivenes
s (5),
assurance (4),
empathy (6),
compliance
(4)
26 items;
perception-
only scores
Seven point
Likert
ranging from
(1) = strongly
disagree to
(7) = strongly
agree
Amin and Isa
(2008)
Malaysia Self-
administered
Mean Survey of 360
retail banks‟
customers
Kuwait The alpha
coefficient
for the
CARTER
dimensions
showed very
high
reliability
(0.70, 0.81,
0.79, 0.89,
0.77 and 0.79
respectively).
6 dimensions:
compliance
(5), assurance
(5), reliability
(4), tangibles
(5), empathy
(9),
responsivenes
s (6)
Othman and
Owen (2001)
Self-
administered
Exploratory
factor
analysis
34 items
Five point
Likert scale
starting at (1)
= not
important to
(5) = very
important.
6 dimensions:
effectiveness
and assurance
(13), access
(5), price (5),
tangibles
(4 ), service
portfolio (2),
reliability (2)
The
Cronbach‟s
alpha scores
were 0.96,
0.93, 0.88,
0.78, 0.90
and 0.87
respectively.
Bahia and
Nantel (2000)
31 items;
perception-
only scores
Cronbach‟s
alpha
Self-
administered
115 retail
banking
customers
Canada The alpha
scores were
0.88, 0.93,
0.93 and 0.90
respectively.
The overall
reliability for
the CBSQ
scale is 0.965
4 dimensions:
reliability (3),
human capital
(7),
communicati
on (6),
technology
(4).
20 items;
including
expectations
and
perceptions
scores.
Seven-point
Likert
response
format
starting at (1)
= strongly
disagree to
(7) = strongly
agree
Exploratory
and
confirmatory
factor
analyses
In –depth
interviews
with 18
financial
managers.
259 corporate
customers
Guo et al
(2008)
China Self-
administered
The alpha
scores were
0.9256,
0.790, and
0.7656
respectively.
Jabnoun and
Al-Tamimi
(2003)
462
customers of
local and
foreign banks
3 dimensions:
human skills
(12),
tangibles (5),
empathy (5).
UAE Self-
administered
Exploratory
factor
analysis
22 items;
perception-
only scores
Karatepe et
al. (2005)
Ranged from
0.81 to 0.92
20 items;
perception-
only scores.
Five-point
Likert scale,
starting at (1)
= strongly
disagree to
(5) = strongly
agree.
Exploratory
factor
analysis;
confirmatory
factor
analysis
1220
customers
4 dimensions:
service
environment
(4),
interaction
quality (7),
empathy (5),
reliability (4)
Self-
administered
Cyprus Obaid (2006) Ranged from
0.77 to 0.93
9 dimensions:
tangibles (5),
reliability (5),
assurance (5),
empathy (6),
responsivenes
s (4), Islamic
banking
variables
(10), overall
service
quality (2),
avoiding
interest (1),
customer‟s
familiarity
(15).
43 items;
perception-
only scores.
Five-point
Likert scale,
starting at (1)
= strongly
disagree to
(5) = strongly
agree.
UAE 305 Islamic
bank
customers
Self-
administered
Confirmatory
factor
analysis
The Alpha
score for the
17 items is
0.9242
Avkiran
(1994)
Confirmatory
factor
analysis
17 items;
perception-
only scores.
Australia Survey of 791
retail banking
customers
Self-
administered
4 dimensions:
staff conduct,
credibility,
communicati
on, and
access to
teller
services.
Ranged from
0.80 to 0.93
4 dimensions:
service
system
quality (11),
behavioural
service
quality (5),
machine
service
transactional
accuracy (3)
21 items;
perception-
only scores
Seven point
Likert
ranging from
(1) = strongly
disagree to
(7) = strongly
agree
Exploratory
factor
analysis
Mail survey 975 bank
customers
UK Aldlaigan and
Buttle (2002) 41 items;
perception-
only scores
Seven point
Likert
ranging from
(1) = very
poor to (7) =
very good
Survey of 360
retail banks‟
customers
Ranged from
0.82 to 0.96
Sureshchanda
r et al. (2002)
India Self-
administered
Confirmatory
factor
analysis
5 dimensions:
core service
or service
product (5),
human
element of
service
delivery (17),
systemization
of service
delivery (6),
tangibles of
service (6),
social
responsibility
(7)
Effective
ness and
assurance
1. C
o
n
fi
d
e
n
c
e
2. R
e
c
o
g
n
it
i
o
n
o
f
a
r
e
g
u
l
a
r
c
li
e
n
t
3. C
o
n
fi
d
e
n
ti
a
li
t
y
4. V
a
l
o
ri
s
a
ti
o
n
o
f
t
h
e
Cha
pter
Fou
r
Privat
e
Banki
ng
Sector
versus
Public
Banki
ng
Sector
LITERA
TURE
REVIE
W
SERVICE
QUALITY
CONCEPT
MEASURIN
G SERVICE
QUALITY
PRIVATE
BANKING
SECTOR
VERSUS
PUBLIC
BANKING
SECTOR
DEFINITION
S OF
SERVICE
QUALITY
IDENTIFICA
TION OF
THE
SUPIORITY
BETWEEN
THE
PRIVATE
AND
PUBLIC
BANKS IN
WESTERN
AND ASIAN
COUNTRIES
BSQ SCALE
b
EFFECTIVE
NESS AND
ASSURANC
E
DIMENSION
SERVICE
QUALITY
PERCEPTIO
NS
SERVICE
QUALITY
EXPECTATI
ONS
ACCESS
DIMENSION
LITERATUR
E GAP
ARE THERE
SIGNIFICAN
T
DIFFERENC
ES
BETWEEN
LIBYAN
PRIVATE
AND
PUBLIC
BANKING
SECTORS
REGARDIN
G SERVICE
QUALITY
PERCEPTIO
NS?
SERVICE
QUALITY
MODELS
PRICE
DIMENSION
THE
IMPORTAN
CE OF
SERVICE
QUALITY
TANGIBLES
DIMENSION
SERVICE
QUALITY
IMPROVEM
ENT
SERVICES
PORTFOLIO
DIMENSION
RELIABILIT
Y
DIMENSION
Copyright © 2022 FDOKUMEN