Assessing Systems for Hiring and Deploying Teachers in the ...
16
This note is part of a series outlining analysis and results from the Philippines Public Expenditure Tracking and Quantitative Service Delivery Study conducted by the Department of Education and the World Bank with the support of the Australian Government through the Australia-World Bank Philippines Development Trust Fund. WWW.WORLDBANK.ORG/PH 1 Philippines Education Note JUNE 2016 | NO. 2 Assessing Systems for Hiring and Deploying Teachers in the Philippines Introduction Over the last decade, research from many different countries has demonstrated the important role played by teachers in improving students’ learning and increasing their competencies. 1 Studies from countries as different as the US and Indonesia have shown the enormous benefits that follow from having adequate and effective teachers working in a country’s schools. In Indonesia, a value-added analysis of student learning outcomes found that the more teachers know, the greater the improvements in the learning competencies of primary and junior secondary students. 2 In the US, better teaching in elementary and secondary schools has been shown to increase students’ college participation rates, raise their subsequent earnings, and improve other long-term outcomes. 3 Ensuring that schools have enough teachers to provide education in classes that are small enough to foster a good learning environment is an important first step. While the optimal size of classes and the impact of reduc- ing class sizes continue to be debated, it is clear that very large class sizes are detrimental to learning. Moreover, evidence from recent impact evaluations in developing countries shows that, on the whole, reducing class sizes in elementary schools improves learning. 4 In the Philip- pines, the Department of Education (DepEd) has class size standards for each grade in elementary and high schools. Providing enough teachers to fulfill these standards in all schools can contribute to a good learning environment for basic education students throughout the country. The distribution of public school teachers is also a key de- terminant of the efficiency of overall government spend- ing. Public spending on teacher salaries has increased Public Disclosure Authorized Public Disclosure Authorized Public Disclosure Authorized Public Disclosure Authorized
-
Upload
khangminh22 -
Category
Documents
-
view
1 -
download
0
Transcript of Assessing Systems for Hiring and Deploying Teachers in the ...

This note is part of a series outlining analysis and results from the Philippines Public Expenditure Tracking and Quantitative Service Delivery Study conducted by the Department of Education and the World Bank with the support of the Australian Government through the Australia-World Bank Philippines Development Trust Fund.
WWW.WORLDBANK.ORG/PH 1
Philippines Education Note JUNE 2016 | NO. 2
Assessing Systems for Hiring and Deploying Teachers in the PhilippinesIntroductionOver the last decade, research from many different countries has demonstrated the important role played by teachers in improving students’ learning and increasing their competencies.1 Studies from countries as different as the US and Indonesia have shown the enormous benefits that follow from having adequate and effective teachers working in a country’s schools. In Indonesia, a value-added analysis of student learning outcomes found that the more teachers know, the greater the improvements in the learning competencies of primary and junior secondary students.2 In the US, better teaching in elementary and secondary schools has been shown to increase students’ college participation rates, raise their subsequent earnings, and improve other long-term outcomes.3
Ensuring that schools have enough teachers to provide education in classes that are small enough to foster a good learning environment is an important first step. While the optimal size of classes and the impact of reduc-ing class sizes continue to be debated, it is clear that very large class sizes are detrimental to learning. Moreover, evidence from recent impact evaluations in developing countries shows that, on the whole, reducing class sizes in elementary schools improves learning.4 In the Philip-pines, the Department of Education (DepEd) has class size standards for each grade in elementary and high schools. Providing enough teachers to fulfill these standards in all schools can contribute to a good learning environment for basic education students throughout the country.
The distribution of public school teachers is also a key de-terminant of the efficiency of overall government spend-ing. Public spending on teacher salaries has increased
Pub
lic D
iscl
osur
e A
utho
rized
Pub
lic D
iscl
osur
e A
utho
rized
Pub
lic D
iscl
osur
e A
utho
rized
Pub
lic D
iscl
osur
e A
utho
rized
2 WWW.WORLDBANK.ORG/PH
Assessing Systems for Hiring and Deploying Teachers in the Philippines
dramatically in recent years. Between 2010 and 2014, teacher salary spending increased from PHP 103 billion to PHP 172 billion (at 2014 constant prices). By 2014, teacher salaries rep-resented about 9 percent of the national government budget of the Philippines.5 This puts into sharp focus how important an efficient distribution of teachers can be. Allocating teachers to schools that already have a sufficient number while others continue to experience shortages is inefficient and potentially wasteful. Conversely, distributing the teacher workforce ef-ficiently and equitably can both improve student learning and optimize the use of scarce public resources.
The purpose of this policy note is twofold. First, it aims to assess the adequacy, efficiency, and distribution of existing allocations of teacher positions across and within schools. Second, it evaluates current systems for hiring and deploying teachers and identifies areas in which they can be strengthened.6 The findings of this note are based on a comprehensive survey of the public education system in the Philippines that tracked public education expenditure and assessed the quality of education services (see Box 1).
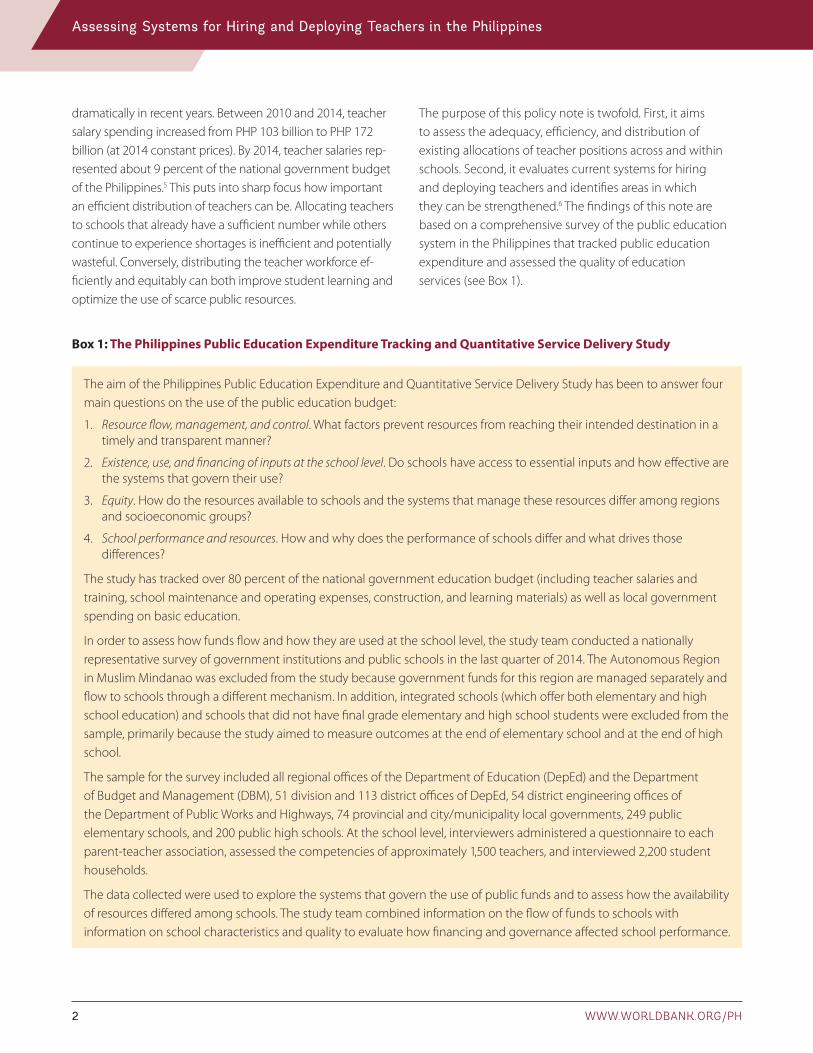
Box 1: The Philippines Public Education Expenditure Tracking and Quantitative Service Delivery Study
The aim of the Philippines Public Education Expenditure and Quantitative Service Delivery Study has been to answer four main questions on the use of the public education budget:
1. Resource flow, management, and control. What factors prevent resources from reaching their intended destination in a timely and transparent manner?
2. Existence, use, and financing of inputs at the school level. Do schools have access to essential inputs and how effective are the systems that govern their use?
3. Equity. How do the resources available to schools and the systems that manage these resources differ among regions and socioeconomic groups?
4. School performance and resources. How and why does the performance of schools differ and what drives those differences?
The study has tracked over 80 percent of the national government education budget (including teacher salaries and training, school maintenance and operating expenses, construction, and learning materials) as well as local government spending on basic education.
In order to assess how funds flow and how they are used at the school level, the study team conducted a nationally representative survey of government institutions and public schools in the last quarter of 2014. The Autonomous Region in Muslim Mindanao was excluded from the study because government funds for this region are managed separately and flow to schools through a different mechanism. In addition, integrated schools (which offer both elementary and high school education) and schools that did not have final grade elementary and high school students were excluded from the sample, primarily because the study aimed to measure outcomes at the end of elementary school and at the end of high school.
The sample for the survey included all regional offices of the Department of Education (DepEd) and the Department of Budget and Management (DBM), 51 division and 113 district offices of DepEd, 54 district engineering offices of the Department of Public Works and Highways, 74 provincial and city/municipality local governments, 249 public elementary schools, and 200 public high schools. At the school level, interviewers administered a questionnaire to each parent-teacher association, assessed the competencies of approximately 1,500 teachers, and interviewed 2,200 student households.
The data collected were used to explore the systems that govern the use of public funds and to assess how the availability of resources differed among schools. The study team combined information on the flow of funds to schools with information on school characteristics and quality to evaluate how financing and governance affected school performance.

PHILIPPINES EDUCATION NOTE 3
The note shows that substantial progress has been made in the Philippines in terms of reducing teacher shortages and improving the systems used to hire and deploy teachers. At the school level, class sizes have been reduced significantly, and teacher absenteeism rates are low compared with other countries. Despite these successes, some inefficiencies in the distribution of teachers and bottlenecks in the hiring process remain. In particular, the systems for hiring and deploying teachers need to be strengthened and need to be focused on those schools and regions with continuing teacher shortages. Also, there is a need to develop a system to govern the transfer of teachers between schools in order to reverse the growing number of schools with surplus teachers.
The Availability of Teachers in Elementary and High SchoolsIn order to operate effectively, schools require an adequate number of teachers that turn up regularly and on time
to teach. Using the PETS-QSDS data, this section looks at trends in the overall level and distribution of teachers across basic education and patterns of teacher absenteeism across the Philippines.
Level and Distribution of Teachers
The Government of the Philippines has made enormous strides in recent years in providing schools with sufficient teachers. A key indicator of the adequacy of the number of teachers in the school system is the student-teacher ratio (STR). It measures the number of students per teacher and provides a very rough proxy of average class sizes. Over the last decade, STRs have been reduced considerably in basic education (Figure 1). For example, between 2011 and 2014, the number of students for every high school teacher fell from 37 to 27.7 This and other decreases in the numbers of students per teacher were the result of an aggressive hir-ing policy in those three years, during which an additional 123,000 elementary and high school teachers were hired, the equivalent of an increase of 24 percent in the total stock of teachers.
Figure 1: Student-teacher Ratios in Basic Education Have Fallen Significantly in Recent Years Student-teacher ratios (STRs) and teacher numbers in basic education, 2006–2014
0
100
200
300
400
500
0
10
20
30
40
50
2006
2007
2008
2009
2010
2011
2012
2013
2014
Total teachers (right axis)
Student-teacher ratio (left axis)
STR
STR
Teachers (000s)
Teachers (000s)
0
100
200
300
400
500
0
10
20
30
40
50
2006
2007
2008
2009
2010
2011
2012
2013
2014
Total teachers (right axis)
Student-teacher ratio (left axis)
Elementary schools High schools
Source: BEIS data on enrolment and number of teachers from DepEd factsheet, various years.
Note: Data from the PETS-QSDS survey found similar student-teacher ratios for 2014.

4 WWW.WORLDBANK.ORG/PH
Assessing Systems for Hiring and Deploying Teachers in the Philippines
Despite achieving significant improvements in recent years, the Philippines still has some of the highest student-teacher ratios in East Asia and the Pacific and among countries at a similar stage of economic development. For example, in 2014 the high school STR in the Philippines was 27:1 compared to a region-wide average of 16:1. Even among the world’s lower-middle-income countries, the Philippines does not compare well, with an average STR in elementary schools of 36:1 compared with 31:1 for all lower-middle-income countries.
Looking beyond national averages in the PETS-QSDS survey data, it can be seen that STRs tend to be worse in urban schools. For example, there is an average of 39 students for every teacher in elementary schools in highly urbanized cities compared to only 29 in schools located in municipalities.8 Differences in STRs in high schools are not as stark, but large urban schools have higher STRs than schools in rural areas.9
The distribution of teachers throughout the Philippines is uneven, and many schools do not have enough teachers according to DepEd’s standards. While DepEd does not have fixed norms for school-level STRs, it does have guidelines on class size and on the ideal number of teachers per class for each grade. According to these guidelines, the average STR in elementary schools should be 35:1 while in high school the average STR should be 27:1.10 The distribution of STRs
in the PETS-QSDS survey data reveals that approximately 29 percent of elementary schools and 37 percent of high schools do not have enough teachers (Figure 2). Perhaps unsurprisingly, the proportion of schools in urban areas with teacher shortages is much higher than schools in rural municipalities.
While a significant proportion of schools have teacher shortages, a large number of other schools, particularly at the elementary level, seem to have a surplus of teachers. About 52 percent of all elementary schools have STRs below existing standards (Figure 2). Lower STRs are frequently found in schools located in remote areas where there are not enough students in a school’s catchment area to meet the STR guidelines. Indeed, a greater proportion of schools in rural municipalities tend to have STRs that are below existing guidelines compared to city schools. However, a significant number of schools in more densely populated areas also have low STRs. It is possible that transferring teachers from these schools to schools with teacher shortages would be a more efficient option than hiring additional teachers.
To get a better picture of the real learning environment faced by students in the Philippines, the study team observed around 7,000 classes and discovered that class sizes were much smaller than student-teacher ratios suggest. Only 9 percent of classes in elementary and high schools
Figure 2: Student-teacher Ratios Reveal that Many Schools Have Teacher Shortages Percentage of schools by student-teacher ratio, 2014
0%
20%
40%
60%
>35 28–35 20–27 <200%
20%
40%
60%
>40 36–40 30 to 35 <30
Elementary schools High schools
Source: PETS-QSDS national survey – school-level data.

PHILIPPINES EDUCATION NOTE 5
Figure 3: Many High School Principals Report Shortages of Subject Specialist Teachers Percentage of high school principals reporting subject specialist teacher shortages and magnitude of need, 2014
0%
20%
40%
60%
80%
100%
Filip
ino
Mak
abay
an
Mat
h
Scie
nce
Engl
ish
Teac
her n
eed
as %
of s
tock
0%
10%
20%
30%
40%
50%
HU
Cs
Oth
er C
ities
Mun
icip
aliti
es
Nat
iona
l
Perc
enta
ge o
f sch
ools
(%)
Schools reporting shortages Relative size of teacher shortage
Source: PETS-QSDS national survey – school-level data.
Notes: Makabayan covers social studies, home economics, music, art, health and values.
had more students than the relevant DepEd guideline (40-45 for elementary and 40 for high schools). The apparent contradiction between these findings and the proportion of schools experiencing teacher shortages is explained by shifting. Approximately 30 percent of all elementary and high schools in the study reported operating more than one shift in at least one grade. However, the use of multiple shifts raises concerns about the amount of learning time each student receives and for this reason DepEd is slowly phasing out shifting in all schools.
High school principals report significant teacher shortages in some subject areas even though DepEd currently has no specific norms.11 Approximately one-third of all high school principals interviewed during the PETS-QSDS survey reported having a shortage of subject specialist teachers (Figure 3). In the absence of any DepEd norms, it is difficult to assess how large these shortages are. However, the school principals who reported a shortage were asked to estimate
their needs in each subject. Comparing these self-reported numbers with a school’s existing stock of teachers showed that there were substantial shortages of Filipino teachers (Figure 3). Schools also reported that their shortages of mathematics, science, and English teachers were equivalent to about 30 percent of their existing workforce.
Teacher Attendance
Knowing how many teachers are allocated to each school is important for planning purposes, but whether they turn up to teach every day on time is more important for student outcomes. The PETS-QSDS survey carried out unannounced visits to the sampled elementary and high schools to record teacher attendance (Box 2). Survey enumerators observed teachers arriving at school and recorded the time when they arrived. Later on during the school visit, they recorded data on all of the teachers teaching in the school and their shift pattern in order to calculate absenteeism rates.

6 WWW.WORLDBANK.ORG/PH
Assessing Systems for Hiring and Deploying Teachers in the Philippines
Figure 4: Teacher Absenteeism Rates in the Philippines Are Low Primary/elementary teacher absenteeism rates in selected countries, various years
0%
5%
10%
15%
20%
25%
30%
Uganda India Pakistan Zambia Bangladesh PNG Ecuador Peru Mongolia Indonesia(2013)
Philippines(2014)
Cambodia(2004)
Sources: Philippines - PETS-QSDS national survey – school-level data. Data on Indonesia come from Analytical and Capacity Development Partnership (2014). “Teacher Absenteeism in Indonesia: Policy brief.” Jakarta. Data for all other countries come from Rogers, F. H. and E. Vegas. (2009). “No More Cutting Class? Reducing Teacher Absence and Providing Incentives for Performance.” Policy Research Working Paper. No. WPS 4847. World Bank, Washington D.C.
Notes: The Philippines study measured teacher absenteeism for teachers who were expected to be present at the beginning of the school day, whereas other studies checked teacher absenteeism at different times of the school day. All absenteeism rates are for 2002–2004 unless otherwise stated.
Box 2: Procedures for Measuring Teacher Absenteeism through Observation
The approach to directly observing teacher attendance that was adopted in the Philippines PETS-QSDS survey followed procedures and protocols used in a number of other well-known surveys of provider absence in health and education.
DepEd’s regional and division offices were not informed in advance about which schools would be visited by the PETS-QSDS survey teams. Where it was not possible to arrive unannounced on the first day of their school visit, survey teams would complete all other survey activities in the school and then come back to the school at a later date, usually after they had finished surveying the other sample schools in the city or municipality.
The survey teams would arrive at the sampled schools at least one hour before the start of the school day. An enumerator was posted at each school entrance and at the office where teachers officially recorded their arrival (on fingerprint readers or in manual records). As the teachers arrived, the team would record their full name and time of arrival.
After the teacher observation, field team supervisors transferred information from each enumerator’s observation schedule to the teacher roster for the school. As part of the wider school survey, the team collected information on all school teachers and identified those who were scheduled to be at the school at the time when the teacher observation exercise was undertaken. This yielded information on the number of teachers who were supposed to be present at the time of the observation to compare with the number of teachers who actually arrived. Information on the punctuality of each teacher was also recorded.
The survey team did not monitor the activities of the teachers once they were in school. This made it impossible to discover how many teachers were actually present and teaching in the classrooms after they had arrived at the school as some other studies have done. Other studies have also checked for absenteeism at different times of the day to get a more thorough picture of teacher attendance throughout the day. However, given the size of many of the schools visited by the survey teams in the Philippines and the large amount of other school-level information that they collected, it was not feasible to do this as part of the PETS-QSDS study.
Source: Rogers, H. and M. Koziol (2012). “Provider Absence Surveys in Education and Health: A Guidance Note.” World Bank, Washington D.C.
This exercise showed that overall levels of teacher absence in the Philippines are low. The percentage of teachers that were absent on the day of the direct observations by the survey teams was 7.6 percent for elementary school
teachers and 5.9 percent for high school teachers. These rates are low compared with other countries that have similar measures of teacher absenteeism rates (Figure 4).

PHILIPPINES EDUCATION NOTE 7
While overall rates are low, teacher absenteeism appears to be higher in highly urbanized cities (Figure 5). In high schools located in highly urbanized cities (HUCs), almost 1 in 10 teachers were found to be absent in 2014. This absenteeism rate is 53 percent higher than the national average.12 The factors that may contribute to these higher than average rates may be the larger size of schools in these areas, greater difficulties in terms of traffic congestion in getting to city schools, and greater demands on teachers’ time.
On the whole, poorer children attend schools with lower rates of teacher absenteeism than wealthier children. The PETS-QSDS survey included a nationally representative sample of public elementary and high school student households. Using the information on consumption and asset ownership collected from these survey households, it was possible to rank student households by their estimated levels of per capita household consumption.13 This ranking reveals that students in the bottom 20 percent of households in terms of consumption tend to attend schools with lower rates of teacher absenteeism than students from the wealthiest 20
percent of households. This reflects the greater proportion of wealthier students attending schools in highly urbanized cities where rates of teacher absenteeism are higher.
Levels of absenteeism varied according to a number of teacher and school characteristics.14 Absenteeism rates tended to be higher for more experienced teachers, although this was only statistically significant for elementary school teachers.15 Schools that appeared to be more supportive of teachers also appeared to have lower absenteeism. For example, elementary schools where principals routinely observed teachers in their classrooms tended to have lower rates of teacher absenteeism. Moreover, schools where teachers filled in their professional development plans more regularly tended to have better teacher attendance rates but the effects were only statistically significant for high schools. Regular visits from the DepEd division office also improves teacher attendance especially in high schools. On the whole, schools with better facilities (such as electricity) also had better teacher attendance, but this effect was only statistically significant for high schools.
Figure 5: Absenteeism Rates in Highly Urbanized Cities are Higher than the National Average Teacher absenteeism rates by school location, 2014
0%
5%
10%
15%
HU
Cs
Oth
erCi
ties
Nat
iona
l0%
5%
10%
15%
HU
Cs
Oth
erCi
ties
Mun
icip
aliti
es
Mun
icip
aliti
es
Nat
iona
l
Elementary schools High schools
Source: PETS-QSDS national survey – school-level data.

8 WWW.WORLDBANK.ORG/PH
Assessing Systems for Hiring and Deploying Teachers in the Philippines
The majority of teachers who were recorded as absent were out of school for permissible reasons (Figure 6). Relatively few elementary school teachers and only 16 percent of high school teachers were absent for unofficial reasons. More than one-third of elementary school teachers and a quarter of high school teachers who were absent on the day of the survey team’s surprise visit were reported to be on sick leave. Another quarter of elementary school teachers and about 15 percent of high school teachers were away from school because they were taking official leave (casual, maternity, or earned leave). Teachers were also frequently absent from their schools while undertaking official duties elsewhere, including attending division-led training, managing school maintenance and other operating funding, and participating in meetings at the division office.
School principals appear to monitor teacher attendance closely. The survey collected information from official teacher attendance records in schools to assess their accuracy. These official records were similar to the PETS-QSDS direct observation data, which suggests that schools were keeping good records of teacher attendance. On the basis of these records, it appears that school principals take regular action to address teacher absenteeism and tardiness. Approximately 17 percent of all elementary and 49 percent of high school principals had taken action against teachers who were regularly absent or late. However, their disciplinary actions tended to be limited to verbal or written warnings.
Teacher Hiring and DeploymentBased on data from the PETS-QSDS survey, this section assesses the effectiveness of government systems at allocating teacher resources to the neediest schools and their ability to hire and place new teachers effectively.
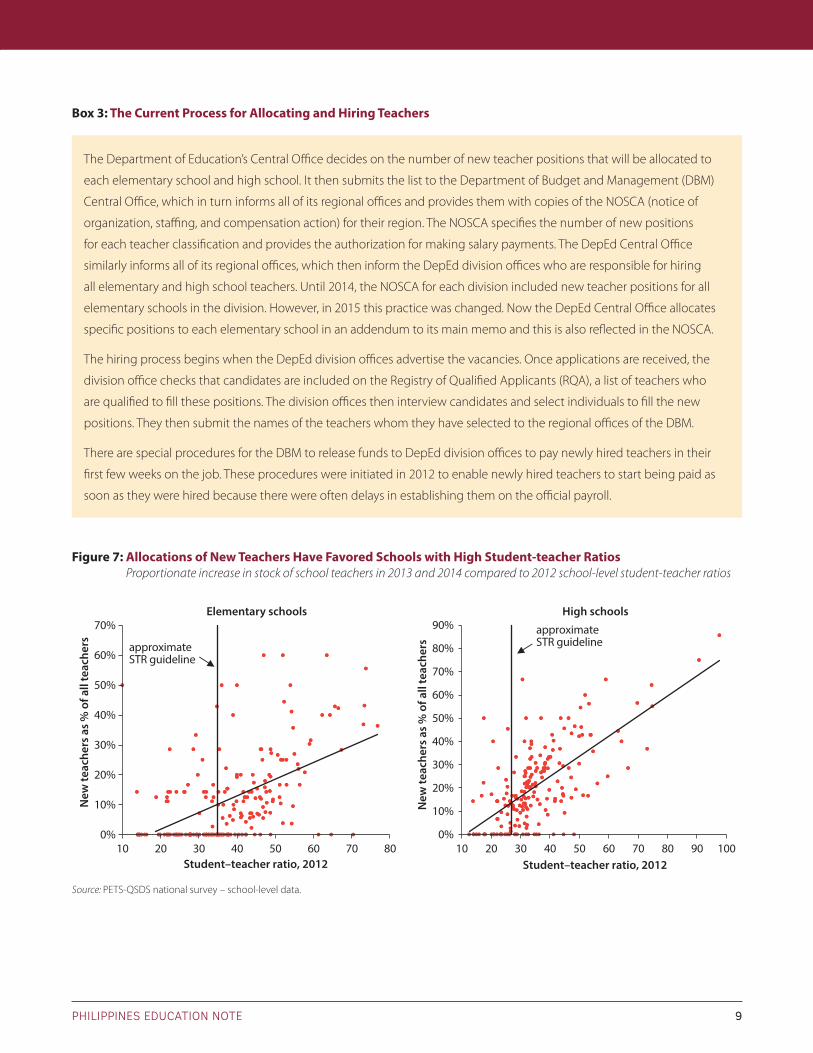
Allocation of New TeachersThe allocation of new teachers in 2013 and 2014 was largely in line with need. In 2013 and 2014, approximately 90,000 new basic education teachers were hired through an allocation process managed by DepEd (Box 3). School-level data from the PETS-QSDS survey show that, on the whole, new teachers were allocated to schools with high STRs (Figure 7).16 However, it is clear that there is still room for improvement in the targeting of new teacher allocations. For example, a large number of elementary schools with STRs higher than DepEd’s guideline of 35 students per teacher were allocated no additional teachers in either 2013 or 2014. Moreover, a number of schools that already had relatively low STRs were allocated extra teachers.
While the recent hiring and allocating of a large number of new teachers has significantly reduced the number of schools with a teacher shortage, it has also increased the
Figure 6: Most Teacher Absence was for Permitted Purposes Percentage of absent teachers by reason of absence, 2014
0%
10%
20%
30%
40%
O�
cial
dut
ies
Sick
leav
e
Uno
�ci
al
Oth
er le
ave
Trai
ing
Tran
sfer
red
0%
10%
20%
30%
40%
Sick
leav
e
Oth
er le
ave
O�
cial
dut
ies
Trai
ning
Uno
�ci
al
Tra
nsfe
rred
Elementary schools High schools
Source: PETS-QSDS national survey – school-level data.
PHILIPPINES EDUCATION NOTE 9
Figure 7: Allocations of New Teachers Have Favored Schools with High Student-teacher Ratios Proportionate increase in stock of school teachers in 2013 and 2014 compared to 2012 school-level student-teacher ratios
0%
10%
20%
30%
40%
50%
60%
70%
10 20 30 40 50 60 70 80
New
teac
hers
as
% o
f all
teac
hers approximate
STR guideline
Student–teacher ratio, 2012
0%
10%
20%
30%
40%
50%
60%
70%
80%
90%
10 20 30 40 50 60 70 80 90 100
New
teac
hers
as
% o
f all
teac
hers
Student–teacher ratio, 2012
approximate STR guideline
Elementary schools High schools
Source: PETS-QSDS national survey – school-level data.
Box 3: The Current Process for Allocating and Hiring Teachers
The Department of Education’s Central Office decides on the number of new teacher positions that will be allocated to
each elementary school and high school. It then submits the list to the Department of Budget and Management (DBM)
Central Office, which in turn informs all of its regional offices and provides them with copies of the NOSCA (notice of
organization, staffing, and compensation action) for their region. The NOSCA specifies the number of new positions
for each teacher classification and provides the authorization for making salary payments. The DepEd Central Office
similarly informs all of its regional offices, which then inform the DepEd division offices who are responsible for hiring
all elementary and high school teachers. Until 2014, the NOSCA for each division included new teacher positions for all
elementary schools in the division. However, in 2015 this practice was changed. Now the DepEd Central Office allocates
specific positions to each elementary school in an addendum to its main memo and this is also reflected in the NOSCA.
The hiring process begins when the DepEd division offices advertise the vacancies. Once applications are received, the
division office checks that candidates are included on the Registry of Qualified Applicants (RQA), a list of teachers who
are qualified to fill these positions. The division offices then interview candidates and select individuals to fill the new
positions. They then submit the names of the teachers whom they have selected to the regional offices of the DBM.
There are special procedures for the DBM to release funds to DepEd division offices to pay newly hired teachers in their
first few weeks on the job. These procedures were initiated in 2012 to enable newly hired teachers to start being paid as
soon as they were hired because there were often delays in establishing them on the official payroll.

10 WWW.WORLDBANK.ORG/PH
Assessing Systems for Hiring and Deploying Teachers in the Philippines
Figure 8: Hiring New Teachers Has Reduced Teacher Shortages but Has Also Increased the Number of Schools with Surplus Teachers Percentage of schools by student-teacher ratio, 2012 and 2014 school years
0%
20%
40%
60%
>40 36–40 30 to 35 <300%
20%
40%
60%
>35 28–35 20–27 <20
2012 2014 2012 2014
Elementary schools High schools
Source: PETS-QSDS national survey – school-level data.
number of schools with teacher surpluses (Figure 8).17 The proportion of elementary schools with teacher shortages dropped from 46 percent to 29 percent between 2012 and 2014. The proportion of high schools with teacher shortages also dropped, from 70 percent to 38 percent over a similar period. However, the percentage of schools with teacher surpluses has also increased. At the elementary level, the proportion of schools with STRs below 30 increased from 41 percent to 52 percent between 2012 and 2014. On closer inspection, it is likely that some of these schools may be unable to achieve the STRs outlined in the DepEd guidelines, but in most cases, while the surplus teachers are easing the burden in their particular schools, they are not the most efficient use of public education spending.
Until recently, DepEd’s process for allocating teacher positions among schools was based on a color coding system according to which schools with high STRs were prioritized.18 However, a recent assessment of this system revealed that the allocations did not always follow the
color coding system.19 The current system now uses DepEd guidelines on class sizes and teacher-class ratios to identify each school’s need for teaching staff. However, there is no official DepEd order or memo to guide division offices in how to make new teacher hiring decisions. This makes it difficult to monitor DepEd’s allocation decisions.
More than one-third of high school principals and almost a quarter of elementary school principals interviewed for the PETS-QSDS survey felt that DepEd’s current methods of allocating new teachers was unfair and suboptimal. The high school principals felt that the lack of a mechanism to account for geographical differences and the need for subject-specific teachers were significant weaknesses. Similar opinions were expressed at the division level by school division superintendents (SDSs), about half of whom reported that they had not received an adequate number of new teacher positions in the previous two years. Moreover, one-fifth of SDSs said that they had not been consulted by their regional office on their teacher needs for 2014.

PHILIPPINES EDUCATION NOTE 11
Teacher Hiring Process
The PETS-QSDS survey tracked the timeliness of the teacher hiring process in 2013 and 2014. There are four key steps in the teacher hiring process that determine whether teachers are hired according to the DepEd guidelines, are ready to start teaching at the beginning of the school year, and are paid on time:
1. The DBM provides the list of teacher positions to DepEd’s division offices and/or DepEd’s regional offices. The DBM regional offices release to DepEd division offices the NOSCA (notice of organization, staffing, and compensation action), which contains information on the number and type of all teacher posts in each division.
2. The DepEd division offices post a list of qualified applicants. DepEd division offices verify and post the Registry of Qualified Applicants (RQA) in the division office. The list consists of all individuals with the required qualifications to be a public school teacher in the division.
3. The DepEd division offices interview and appoint new teachers. Each division office holds interviews for all new positions within its jurisdiction and then submits a list of new hires to the DepEd and/or DBM regional office.
4. The DBM releases the allotment to pay new teachers. Once the DBM regional office receives the list of new hires
from each division, it releases a special payment in the form of a special allotment release order (SARO), which division offices then use to pay their newly hired teachers until they are put on the regular payroll, usually in the following financial year.
The PETS-QSDS survey collected data from the DepEd division offices on the timing of these critical steps in the hiring process during the 2013 school year.20
A significant proportion of DepEd division offices continue to experience delays in completing the key steps of the hiring process. Table 1 compares the benchmarks that the DepEd Central Office issued for the completion of key steps with the actual completion dates achieved by the 51 DepEd division offices sampled in the PETS-QSDS study. It shows that nearly half of all division offices receive the notification of their allocation of new teacher posts late. The late receipt of the NOSCA leads to further delays in the hiring process. Around 40 percent of DepEd division offices are late posting the registry of qualified applicants but are able to catch up a little by hiring teachers more quickly (Table 1). Only around two-thirds of division offices received their allotment to pay teachers on time, with most schools receiving it on or after the beginning of the school year.
However, there is evidence that there have been some improvements in the overall timeliness of the teacher hiring process in the DepEd division offices. The PETS-QSDS
Table 1: Benchmarks and Actual Timing of Key Steps in the Teacher Hiring Process, 2013
Receipt of NOSCA
Posting of registry of qualified applicants
Submission of list of filled
positions
Receipt of SARO
(1) (2) (3) (4)
Benchmark date for completing each step March 2013 April 2013 June 2013 July 2013
Date on which the key steps were completed in the sample DepEd divisions:
¾ Earliest date December 2012 January 2013 January 2013 January 2013
¾ Average date January 2013 May 2013 May 2013 July 2013
¾ Latest date May 2014 May 2014 August 2014 -
Percentage of divisions that completed the process on or before benchmark date 56% 61% 75% 67%
Source: PETS-QSDS national survey – DepEd division office data.
Notes: Numbers in parenthesis refer to the steps outlined in the text.

12 WWW.WORLDBANK.ORG/PH
Assessing Systems for Hiring and Deploying Teachers in the Philippines
analysis of the 2013 hiring process shows that it took on average five months from the time when the division offices receive the NOSCA to their submission of the list of filled positions to DepEd and the DBM. In 2007, a similar analysis found that this process had taken as long as 18 months to complete.21
Despite these improvements, divisions reported that about one-third of the new teacher positions for the 2013–14 school year remained unfilled even by the end of the 2014 calendar year (Figure 9). The large number of new teachers unable to report for work at their new schools was partly the result of delays in the hiring process outlined in Table 1. For example, 65 percent of the divisions where teachers were not in post at the start of the school year reported receiving the NOSCA late, while 22 percent reported posting the RQA late, and 19 percent reported submitting the list of filled positions late. However, the majority of divisions where teachers were not in post at the start of the school year had completed all processes on time. It is likely that delays in the submission by teachers and verification by division offices of teacher documentation partly explains these delays in the final step of getting new teachers into the classroom. However, further research is needed to fully understand why these delays occur and to identify ways to address them.
It was not the aim of the PETS-QSDS study to evaluate the hiring process at the division level, but SDSs and school principals did feel that these processes were on the whole fair. About 90 percent of SDSs agreed that the process for hiring new teachers results in the best teachers being hired, while 86 percent of elementary school principals and 80 percent of high school principals agreed with this statement. The school principals who disagreed raised a number of reasons, including the overly selective nature of the recruitment process, the lack of weight given to demonstration teaching, and the lack of focus on subject specialization.
Tracking of Funds for Newly Hired Teachers
The study team’s tracking of fund flows for newly hired teachers revealed inconsistencies in the data and poor record keeping. Information on the budget allocation for newly hired teachers was not available from either the DepEd division offices or the DBM’s regional offices.22 This meant that the team was largely unable to track the flow of funds between these two sets of offices. In the rare cases where it was possible to do so, only one-third of the divisions reported receiving the same amount as the amount reported by the DBM regional office. About half of the remaining divisions reported receiving substantially more in SAROs than the DBM had reported releasing. This may be because the SAROs received by these division offices contained funds for additional payments. Fewer than a quarter of divisions reported receiving substantially less than the amount reported by the DBM regional office. This lack of consistency between the DBM and DepEd division offices is concerning and highlights the need to strengthen monitoring and reporting mechanisms.
Teacher Transfers
Transferring teachers from one school to another is a useful way to redress imbalances in the distribution of teachers and increase the efficiency of public spending. Decisions about teacher transfers within each division are made by the SDS, and a transfer can be requested by the school principal, a teacher, or the SDS based on needs of the schools in the division. However, it is more complicated to transfer a teaching post across divisions or regions as this requires the approval of the central offices of both DepEd
Figure 9: A Significant Number of Newly Hired Teachers Were Not in Post at the Beginning of the School Year Percentage of teacher posts allotted for the 2013 school year where newly hired teachers were in post by the final quarter of the 2014 calendar year
0%
20%
40%
60%
80%
Kindergarten Elementary High School
Source: PETS-QSDS national survey – DepEd division office data.

PHILIPPINES EDUCATION NOTE 13
and the DBM. DepEd’s recent medium-term expenditure plan (2014 to 2020) estimated that, in 2012, there were about 23,000 excess elementary school teachers and about 5,000 excess high school teachers. Even if only 25 percent of the surplus teachers (a conservative estimate) were transferred to schools with shortages, this would enable DepEd to save about PHP 3.8 billion annually.23
However teacher transfers are rarely used to address the uneven distribution of teachers and the growing proportion of schools with teacher surpluses. The PETS-QSDS interviews with a nationally representative sample of Grade 6 and 10 teachers showed that fewer than 2 percent of teachers were transferred in 2013. It is also likely that the majority of these teacher transfers were made for personal family reasons rather than to redress imbalances in the distribution of teachers.
Any efforts to use teacher transfers to redistribute the allocation of teachers across the country are currently
constrained both by the 1968 Magna Carta for Public School Teachers and by the localization law. The Magna Carta gives teachers the right to refuse a transfer without being disciplined or fired. However, the latest DepEd order on teacher transfers in 2013 indicates that teachers can be transferred without the teacher’s consent in certain cases. These include situations where a teacher’s existing school has an STR lower than the DepEd guidelines of 35:1 for elementary schools and 27:1 for high schools. The new clause is a clear attempt to give SDSs greater authority to use transfers to manage teacher distribution.24 Nevertheless, the Magna Carta states that teachers can contest transfers even in such cases by appealing to the Director of Public Schools. The localization law gives priority to appointing and assigning teachers to residents of the barangay, city, or municipality in which the school is located. While this has the potential to increase the diversity of the teaching force, support mother tongue policies, and ensure that schools in remote areas have teachers in place, it does constrain teacher management.

14 WWW.WORLDBANK.ORG/PH
Assessing Systems for Hiring and Deploying Teachers in the Philippines
Policies for Strengthening Teacher Hiring and DeploymentOver the last five years, the strong focus on improving school learning environments has led to a substantial increase in the availability of teachers in basic education schools across the Philippines. Moreover, teacher absenteeism rates are low and compare favorably with other countries. Systems to allocate and hire teachers have also improved, and the time taken to complete key steps in the process has been shortened considerably. However, this policy note has shown that many schools still do not have enough teachers or enough of the right mix of teachers, and the over-supply of teachers in some schools is emerging as a key issue. The note has also shown that, despite recent improvements in the formal
processes governing the hiring of teachers, there are still frequent and significant delays in getting teachers into the classroom.
Having a clear set of guidelines that outline the size, allocation, and hiring of the required teaching force in the Philippines based on expected class sizes and curriculum load would be a useful tool to support the more equitable allocation of both new and existing teachers. The last DepEd memorandum on teacher allocation processes was issued in 2010, and its guidance is now outdated. Specific guidelines for specialist subject positions will also be necessary to ensure that schools have enough specialist teachers and can plan effectively. Ensuring that these guidelines are widely disseminated throughout all levels of DepEd and to the wider public would enable better decision-making within DepEd and increase the transparency of all decisions made about teacher deployment.
Table 2: Strengthening Systems to Hire and Deploy Teachers
Findings Policy suggestions
Further improvements in teacher distribution are needed
• Further develop guidelines/norms for school-level teaching needs, particularly for subject-specific teachers in high schools
• Monitor the distribution of teachers more closely to ensure efficiency and develop and implement the Human Resource Information System (HRIS)
• Revise teacher transfer policy to make it a more effective tool to improve teacher distribution
Hiring and deployment systems need to be strengthened
• Strengthen the accountability of regional and divisional offices for carrying out processes in a timely way
• Improve monitoring to ensure hiring timelines are met and that teachers are in post at the beginning of the school year
• Improve coordination between the DBM and DepEd regional offices
High teacher absenteeism in highly urbanized cities
• Increase the authority of DepEd division offices and schools to deal with absenteeism
• Link teachers’ attendance to their career development and performance bonuses
• Explore the potential for increasing community involvement in monitoring teacher attendance

PHILIPPINES EDUCATION NOTE 15
DepEd Central Office needs to monitor the hiring process more closely, ensuring that regional and divisional offices are adhering to the hiring timetable and providing them with additional support where necessary. However, further research is needed to understand why so many newly hired teachers are unable to take up their posts before the start of the school year, even when all of the administrative formalities appear to have been completed.
Making more information available on the existing teaching force would improve initial teacher allocations and facilitate future planning. It is currently difficult for DepEd division offices to obtain anything more than basic information on teacher allocations in their division without having to go through large numbers of paper files. Given the large number of schools and teachers in most divisions, this is a barrier to the efficient planning of division-level teacher workforces. Plans are underway within DepEd to develop a Human Resource Information System (HRIS), which will provide planners at all levels of the department with the necessary information and capacity to make well-informed decisions about teacher allocations.
If DepEd were to adopt a more flexible and effective deployment and transfer policy (taking into account special circumstances such as remote schools), this would have the potential to greatly improve the distribution of teachers and ultimately increase the learning opportunities available to all children. The 2013 DepEd order on teacher transfers and its alignment with school staffing guidelines was an important development, but further efforts will be needed to reconcile this policy with existing regulations and agreements on teacher employment conditions if it
is to be effective. Introducing additional incentives such as cost-of-living adjustments within teacher salaries and reevaluating hardship allowances in supporting transfers of teachers to remote schools would help to make transfers more attractive. However, incentives of this kind need to be introduced carefully and evaluated quickly to ensure that they are delivering the desired outcomes.
Systems at the school level for monitoring teacher attendance appear to work well, but sanctions for absenteeism and lateness are weak. On the whole, teacher absenteeism rates are low in the Philippines, but in highly urbanized cities as many as one in ten teachers were absent during the study team’s unannounced visits. The findings of the study suggest that school principals and division supervisors need to have a wider range of sanctions and incentives to address attendance issues. For example, attendance rates could be a key results indicator in teachers’ performance plans and ultimately be linked to their career development and to performance-based bonuses. Research from other countries has shown that school governing councils and parents can help to reduce teacher absenteeism. A systematic global review concluded that “a combination of close monitoring (community/parents level) and attractive incentives (teacher level) showed the highest potential to reduce teacher absenteeism.”25
Over the last five years, the Philippines government has greatly increased the size of the basic education teacher workforce. Ensuring that the teacher workforce is serving the neediest schools and redressing imbalances in the existing distribution of teachers will ensure that these increases will translate into better student learning outcomes.

16 WWW.WORLDBANK.ORG/PH
Assessing Systems for Hiring and Deploying Teachers in the Philippines
Endnotes1 See, for example, Bruns, B. and J. Luque (2014). “Great Teachers:
How to Raise Student Learning in Latin America and the Caribbean.” World Bank, Washington, D.C.
2 De Ree, J. (2016). “How Much Teachers Know and How Much It Matters in Class: Analyzing Three Rounds of Subject-specific Test Score Data of Indonesian Students and Teachers.” Policy Research Working Paper No. WPS 7556. World Bank, Washington, D.C.
3 Chetty, R., J. Friedman, and J. Rockoff. (2011). “The Long-term Impacts of Teachers: Teacher Value-added and Student Outcomes in Adulthood.” National Bureau of Economic Research, Cambridge MA.
4 See, for example, McEwan, P. (2013). “Improving Learning in Primary Schools of Developing Countries: A Meta-Analysis of Randomized Experiments.” Wellesley College, Wellesley, MA.
5 This includes salaries for technical positions.
6 A second note in this series focuses on teacher quality and assesses the systems used to strengthen the competencies of teachers in the existing workforce.
7 In this section, years refer to school years. For example, 2014 refers to the 2014/15 school year.
8 Highly urbanized cities are cities with a population of more than 200,000 and with average revenues of at least PHP 50 million in 1991 prices. Other cities are defined as cities that do not meet the criteria to be classified as highly urbanized. Municipalities are administrative units for all other areas in the Philippines.
9 While STRs for each grade are not discussed in detail in this note, they show, on the whole, that STRs tend to be higher in the earlier grades.
10 These estimates were calculated by combining the ideal class size and the ideal number of teachers per class as recommended in the DepEd service standards.
11 Elementary school teachers are expected to be generalists.
12 Differences between absenteeism rates in HUCs and other cities and municipalities are not statistically different from the national average.
13 The household questionnaire included a short module on consumption and a set of questions on assets that have been used by the Department of Social Welfare and Development (DSWD) to undertake a proxy means testing (PMT) approach to estimating household consumption per capita. The results reported here are based on information gathered using the PMT approach, and a full description is included in a separate note.
14 The full results of the regression analysis reported here is included in additional annexes and tables accompanying the main PETS-QSDS report.
15 Years of experience were also positively related to absenteeism, but the results were not statistically significant.
16 A similar analysis was also carried out at the division level, which confirmed that there was a positive relationship between high STRs and new teacher allocations.
17 The figures for shortages and surplus teachers are based on the approximate student-teacher ratios estimated from the DepEd guidelines.
18 DepEd order number 77 (2010). “Guidelines on the Allocation/Deployment of New Teaching, Teaching-related, and Non-teaching Positions for FY 2010.” Department of Education, Manila.
19 Albert, J. R. (2012). “Improving Teacher Deployment Practices in the Philippines.” Policy Note 2012-02, Philippines Institute of Development Studies, Manila.
20 Similar data were collected for 2014, but, since the survey was conducted in the last quarter of 2014, this information does not cover all steps.
21 World Bank and AusAID (2010). “Philippines Basic Education Public Expenditure Review.” World Bank and AusAID, Manila.
22 Unfortunately, it was not possible to track payments for newly hired teachers from the DepEd or DBM central offices down to the regional offices because these funds are comingled with funds for all newly created positions, including non-teaching positions, at all levels.
23 DepEd (2013). “Medium-term Expenditure Framework for Basic Education 2014-2020: Enrollment Projections and Cost Simulations under Alternative Scenarios.” Department of Education, Manila.
24 In 2013, DepEd issued an order that granted transferring teachers a one-off redeployment allowance of PHP 18,000. However, this was discontinued after a year.
25 Guerrero. G., J. Leon, M. Zapata, and S. Cueto (2013). “Getting teachers back to the classroom. A systematic review on what works to improve teacher attendance in developing countries.” Journal of Development Effectiveness 5(4): 466-488.