Assessing Occupational Exposure to Chemicals in an International Epidemiological Study of Brain...
17
Ann. Occup. Hyg., Vol. 57, No. 5, pp. 610–626, 2013 © The Author 2013. Published by Oxford University Press on behalf of the British Occupational Hygiene Society. doi:10.1093/annhyg/mes100 610 Assessing Occupational Exposure to Chemicals in an International Epidemiological Study of Brain Tumours MARTIE VAN TONGEREN 1 *, LAUREL KINCL 2,3 , LESLEY RICHARDSON 4 , GEZA BENKE 5 , JORDI FIGUEROLA 2 , TIMO KAUPPINEN 6 , RAMZAN LAKHANI 4 , JÉRÔME LAVOUÉ 4 , DAVE MCLEAN 7 , NILS PLATO 8 and ELISABETH CARDIS 2 FOR THE INTEROCC STUDY GROUP** 1 Centre for Human Exposure Science, Institute of Occupational Medicine (IOM), Research Avenue North, Riccarton, Edinburgh EH14 4AP, UK; 2 Center for Research on Environmental Epidemiology (CREAL), Barcelona, Spain; 3 Oregon State University, Corvallis, USA; 4 University of Montreal Hospital Research Center (CRCHUM), Montreal, Canada; 5 Monash University, Melbourne, Australia; 6 Finnish Institute of Occupational Health (FIOH), Helsinki, Finland; 7 Massey University, Wellington, New Zealand; 8 Karolinska Institute, Stockholm, Sweden Received 13 July 2012; in final form 15 November 2012; Advance Access publication 6 March 2013 The INTEROCC project is a multi-centre case–control study investigating the risk of devel- oping brain cancer due to occupational chemical and electromagnetic field exposures. To estimate chemical exposures, the Finnish Job Exposure Matrix (FINJEM) was modified to improve its performance in the INTEROCC study and to address some of its limitations, resulting in the development of the INTEROCC JEM. An international team of occupational hygienists developed a crosswalk between the Finnish occupational codes used in FINJEM and the International Standard Classification of Occupations 1968 (ISCO68). For ISCO68 codes linked to multiple Finnish codes, weighted means of the exposure estimates were calculated. Similarly, multiple ISCO68 codes linked to a single Finnish code with evidence of heteroge- neous exposure were refined. One of the key time periods in FINJEM (1960–1984) was split into two periods (1960–1974 and 1975–1984). Benzene exposure estimates in early periods were modified upwards. The internal consistency of hydrocarbon exposures and exposures to engine exhaust fumes was improved. Finally, exposure to polycyclic aromatic hydrocarbon and benzo(a)pyrene was modified to include the contribution from second-hand smoke. The cross- walk ensured that the FINJEM exposure estimates could be applied to the INTEROCC study subjects. The modifications generally resulted in an increased prevalence of exposure to chemi- cal agents. This increased prevalence of exposure was not restricted to the lowest categories of cumulative exposure, but was seen across all levels for some agents. Although this work has produced a JEM with important improvements compared to FINJEM, further improvements are possible with the expansion of agents and additional external data. Keywords: cancer epidemiology; case–control; job-exposure matrix *Author to whom correspondence should be addressed. Tel: +44-131-449-8097; Fax: +131-449-8084; e-mail: [email protected] **INTEROCC Study group members: Canada—Daniel Krewski, University of Ottawa; Jack Siemiatycki, University of Montreal Hospital Research Centre; Marie-Elise Parent, INRS-Institut Armand-Frappier; France—Martine Hours, IFSTTAR; Germany—Brigitte Schlehofer and Klaus Schlefer, DFKZ; Israel—Siegal Sadetzki, Gertner Institute, Chaim Shiva Medical Center and Tel Aviv University; UK—Sarah Fleming, University of Leeds. by guest on May 22, 2016 http://annhyg.oxfordjournals.org/ Downloaded from
-
Upload
independent -
Category
Documents
-
view
6 -
download
0
Transcript of Assessing Occupational Exposure to Chemicals in an International Epidemiological Study of Brain...

Ann. Occup. Hyg., Vol. 57, No. 5, pp. 610–626, 2013© The Author 2013. Published by Oxford University Press
on behalf of the British Occupational Hygiene Society.doi:10.1093/annhyg/mes100
610
Assessing Occupational Exposure to Chemicals in an International Epidemiological Study of Brain TumoursMArTIE vAn TOngErEn1*, LAurEL KInCL2,3, LESLEy rIChArdSOn4, gEzA BEnKE5, JOrdI FIguErOLA2, TIMO KAuppInEn6, rAMzAn LAKhAnI4, JérôME LAvOué4, dAvE MCLEAn7, nILS pLATO8 and ELISABETh CArdIS2 FOr ThE InTErOCC STudy grOup**
1Centre for Human Exposure Science, Institute of Occupational Medicine (IOM), Research Avenue North, Riccarton, Edinburgh EH14 4AP, UK; 2Center for Research on Environmental Epidemiology (CREAL), Barcelona, Spain; 3Oregon State University, Corvallis, USA; 4University of Montreal Hospital Research Center (CRCHUM), Montreal, Canada; 5Monash University, Melbourne, Australia; 6Finnish Institute of Occupational Health (FIOH), Helsinki, Finland; 7Massey University, Wellington, New Zealand; 8Karolinska Institute, Stockholm, Sweden
Received 13 July 2012; in final form 15 November 2012; Advance Access publication 6 March 2013
The InTErOCC project is a multi-centre case–control study investigating the risk of devel-oping brain cancer due to occupational chemical and electromagnetic field exposures. To estimate chemical exposures, the Finnish Job Exposure Matrix (FInJEM) was modified to improve its performance in the InTErOCC study and to address some of its limitations, resulting in the development of the InTErOCC JEM. An international team of occupational hygienists developed a crosswalk between the Finnish occupational codes used in FInJEM and the International Standard Classification of Occupations 1968 (ISCO68). For ISCO68 codes linked to multiple Finnish codes, weighted means of the exposure estimates were calculated. Similarly, multiple ISCO68 codes linked to a single Finnish code with evidence of heteroge-neous exposure were refined. One of the key time periods in FInJEM (1960–1984) was split into two periods (1960–1974 and 1975–1984). Benzene exposure estimates in early periods were modified upwards. The internal consistency of hydrocarbon exposures and exposures to engine exhaust fumes was improved. Finally, exposure to polycyclic aromatic hydrocarbon and benzo(a)pyrene was modified to include the contribution from second-hand smoke. The cross-walk ensured that the FInJEM exposure estimates could be applied to the InTErOCC study subjects. The modifications generally resulted in an increased prevalence of exposure to chemi-cal agents. This increased prevalence of exposure was not restricted to the lowest categories of cumulative exposure, but was seen across all levels for some agents. Although this work has produced a JEM with important improvements compared to FInJEM, further improvements are possible with the expansion of agents and additional external data.
Keywords: cancer epidemiology; case–control; job-exposure matrix
*Author to whom correspondence should be addressed. Tel: +44-131-449-8097; Fax: +131-449-8084; e-mail: [email protected]**INTEROCC Study group members: Canada—Daniel Krewski, University of Ottawa; Jack Siemiatycki, University of Montreal Hospital Research Centre; Marie-Elise Parent, INRS-Institut Armand-Frappier; France—Martine Hours, IFSTTAR; Germany—Brigitte Schlehofer and Klaus Schlefer, DFKZ; Israel—Siegal Sadetzki, Gertner Institute, Chaim Shiva Medical Center and Tel Aviv University; UK—Sarah Fleming, University of Leeds.
by guest on May 22, 2016
http://annhyg.oxfordjournals.org/D
ownloaded from
Assessing occupational exposure to chemicals 611
BACKgrOund
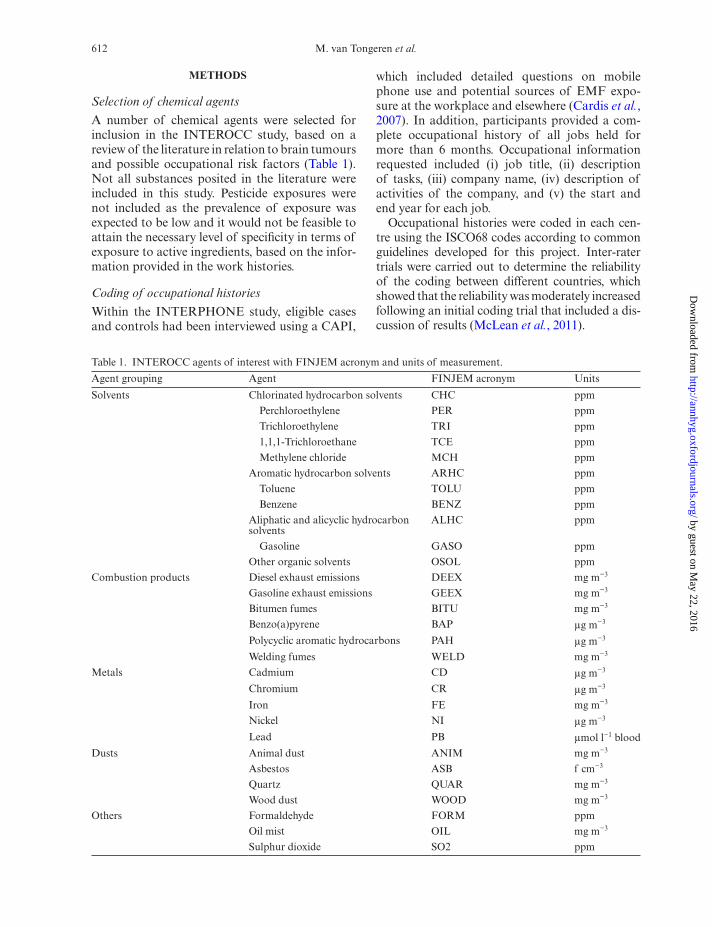
The occupational environment provides a particu-larly fruitful arena for investigating causes of can-cer. A large fraction of known human carcinogens were discovered through studies in the workplace (Siemiatycki et al., 2004). Two distinct epidemio-logical approaches to occupational cancer risk have been used: industry-cohort and community-based case–control studies. The cohort study approach is a powerful tool for studying exposure–disease relationships, but it has several potential limitations, including problems in gaining access to industries, difficulty in obtaining information for potential confounders, limited information on disease status, and loss to follow-up. Another lim-itation of the cohort study is that it is difficult to study rare disease, such as brain cancers (Breslow and Day, 1987). The community-based case–con-trol study approach, which can overcome some of the limitations of cohort studies, must rely on more tenuous methods for assessing occupational exposure (Siemiatycki, 1996).
Methods used in occupational cancer commu-nity-based case–control studies include job or industry-title analyses, self-reports of exposure, job exposure matrices (JEMs), and expert evalu-ation (Siemiatycki, 1996). Some researchers have developed approaches that combine some of these methods (Stewart et al., 1996), allowing for more specific questions to be targeted at subjects likely to have been exposed to the exposures of interest. A more recent approach uses expert systems, job-specific modules, and computer-assisted personal interviews (CAPI) called OccIDEAS (Fritschi et al., 2012). These approaches have advantages and disadvantages, with some trade-off between cost and validity.
The INTERPHONE study was set up in 2000 to evaluate possible risk of glioma, meningioma, acoustic neuroma, and malignant parotid gland tumours in relation to mobile phone use and to other potential risk factors [ionizing radiation, occupational exposure to electromagnetic fields (EMFs), and the subject’s personal and famil-ial medical history] (Cardis et al., 2007; The INTERPHONE Study Group, 2010, 2011). An important component was the collection of an occupational history from each subject and infor-mation about occupational sources of exposure to EMFs. Subsequently, data from 7 countries (Australia, Canada, France, Germany, Israel, New Zealand, and the UK) out of the 13 coun-tries that participated in the INTERPHONE
study were included in the INTEROCC study to investigate the possible interaction between exposure to EMF and chemicals in the workplace on the risk of brain cancer. These seven coun-tries were selected based on the following crite-ria: (i) the core occupational calendar was well conducted and reflects a complete work history; (ii) the local principal investigator (PI) was com-mitted to participating in this study; and (iii) the local PI had access to expertise in occupational exposure assessment. The INTEROCC study includes 2054 glioma, 1924 meningioma, and 695 acoustic neuroma cases, and 5601 population-based controls.
To investigate the effect of exposure to a wide range of chemicals on the risk of brain tumours, it was necessary to relate the occupational history information to quantitative exposure estimates. Given the large number of subjects and the lack of details about each job held, a JEM approach was the only feasible approach. It was decided to use the Finnish job exposure matrix (FINJEM) (Kauppinen et al., 1998), the largest available population-based JEM, as modified during the Nordic Occupational Cancer study (NOCCA) (Kauppinen et al., 2009). The FINJEM cov-ers major occupational exposures occurring in Finland since 1945 and has been successfully applied in a number of studies in Scandinavia and other countries (Dryver et al., 2004; Karipidis et al., 2007).
It was not possible to apply FINJEM directly to the occupational histories of the INTEROCC study population, as the International Standard Classification of Occupations 1968 (ISCO68) was used to code occupational histories in the INTEROCC project, while FINJEM uses the Finnish occupational coding system. Furthermore, following an initial review of the FINJEM expo-sure estimates and comparison of these estimates with estimates from a population-based case–control study of lung cancer in Canada (Lavoué et al., 2012), it was decided to modify some of the FINJEM estimates to deal with some of the observed discrepancies. This paper describes the methods used to modify the FINJEM for applica-tion to the INTEROCC study to assess occupa-tional exposure to a selected group of chemicals and presents a comparison of the modified and original FINJEM exposure estimates. Results of the epidemiological analyses investigating the relationship between exposure to chemicals in the workplace and risk of developing glioma and meningioma will be presented elsewhere.
by guest on May 22, 2016
http://annhyg.oxfordjournals.org/D
ownloaded from
612 M. van Tongeren et al.
METhOdS
Selection of chemical agents
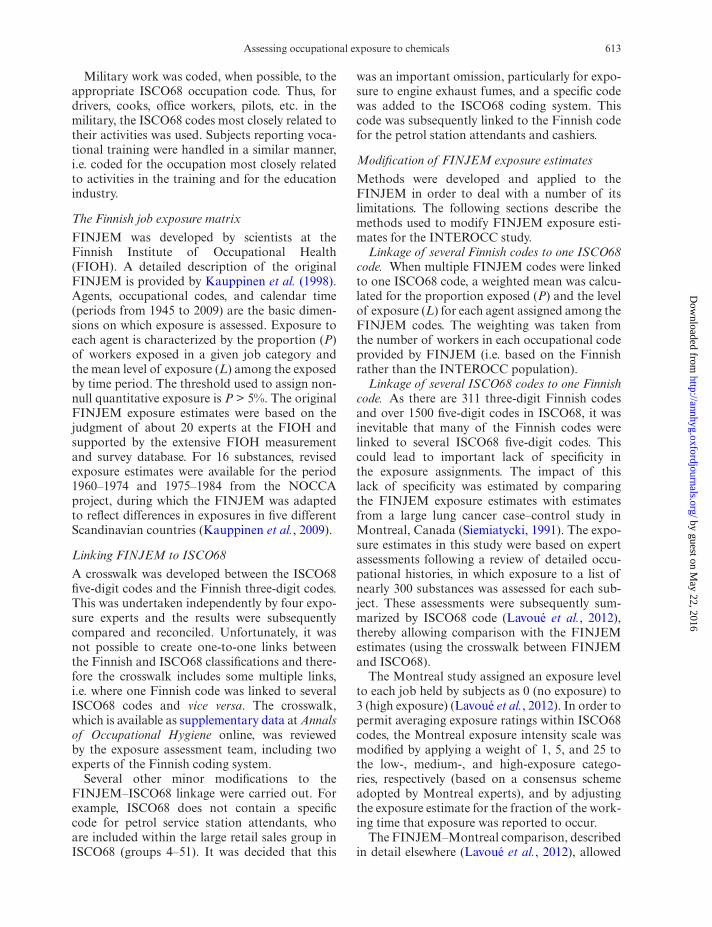
A number of chemical agents were selected for inclusion in the INTEROCC study, based on a review of the literature in relation to brain tumours and possible occupational risk factors (Table 1). Not all substances posited in the literature were included in this study. Pesticide exposures were not included as the prevalence of exposure was expected to be low and it would not be feasible to attain the necessary level of specificity in terms of exposure to active ingredients, based on the infor-mation provided in the work histories.
Coding of occupational histories
Within the INTERPHONE study, eligible cases and controls had been interviewed using a CAPI,
which included detailed questions on mobile phone use and potential sources of EMF expo-sure at the workplace and elsewhere (Cardis et al., 2007). In addition, participants provided a com-plete occupational history of all jobs held for more than 6 months. Occupational information requested included (i) job title, (ii) description of tasks, (iii) company name, (iv) description of activities of the company, and (v) the start and end year for each job.
Occupational histories were coded in each cen-tre using the ISCO68 codes according to common guidelines developed for this project. Inter-rater trials were carried out to determine the reliability of the coding between different countries, which showed that the reliability was moderately increased following an initial coding trial that included a dis-cussion of results (McLean et al., 2011).
Table 1. INTEROCC agents of interest with FINJEM acronym and units of measurement.
Agent grouping Agent FINJEM acronym Units
Solvents Chlorinated hydrocarbon solvents CHC ppm
Perchloroethylene PER ppm
Trichloroethylene TRI ppm
1,1,1-Trichloroethane TCE ppm
Methylene chloride MCH ppm
Aromatic hydrocarbon solvents ARHC ppm
Toluene TOLU ppm
Benzene BENZ ppm
Aliphatic and alicyclic hydrocarbon solvents
ALHC ppm
Gasoline GASO ppm
Other organic solvents OSOL ppm
Combustion products Diesel exhaust emissions DEEX mg m−3
Gasoline exhaust emissions GEEX mg m−3
Bitumen fumes BITU mg m−3
Benzo(a)pyrene BAP μg m−3
Polycyclic aromatic hydrocarbons PAH μg m−3
Welding fumes WELD mg m−3
Metals Cadmium CD μg m−3
Chromium CR μg m−3
Iron FE mg m−3
Nickel NI μg m−3
Lead PB μmol l−1 blood
Dusts Animal dust ANIM mg m−3
Asbestos ASB f cm−3
Quartz QUAR mg m−3
Wood dust WOOD mg m−3
Others Formaldehyde FORM ppm
Oil mist OIL mg m−3
Sulphur dioxide SO2 ppm
by guest on May 22, 2016
http://annhyg.oxfordjournals.org/D
ownloaded from
Assessing occupational exposure to chemicals 613
Military work was coded, when possible, to the appropriate ISCO68 occupation code. Thus, for drivers, cooks, office workers, pilots, etc. in the military, the ISCO68 codes most closely related to their activities was used. Subjects reporting voca-tional training were handled in a similar manner, i.e. coded for the occupation most closely related to activities in the training and for the education industry.
The Finnish job exposure matrix
FINJEM was developed by scientists at the Finnish Institute of Occupational Health (FIOH). A detailed description of the original FINJEM is provided by Kauppinen et al. (1998). Agents, occupational codes, and calendar time (periods from 1945 to 2009) are the basic dimen-sions on which exposure is assessed. Exposure to each agent is characterized by the proportion (P) of workers exposed in a given job category and the mean level of exposure (L) among the exposed by time period. The threshold used to assign non-null quantitative exposure is P > 5%. The original FINJEM exposure estimates were based on the judgment of about 20 experts at the FIOH and supported by the extensive FIOH measurement and survey database. For 16 substances, revised exposure estimates were available for the period 1960–1974 and 1975–1984 from the NOCCA project, during which the FINJEM was adapted to reflect differences in exposures in five different Scandinavian countries (Kauppinen et al., 2009).
Linking FINJEM to ISCO68
A crosswalk was developed between the ISCO68 five-digit codes and the Finnish three-digit codes. This was undertaken independently by four expo-sure experts and the results were subsequently compared and reconciled. Unfortunately, it was not possible to create one-to-one links between the Finnish and ISCO68 classifications and there-fore the crosswalk includes some multiple links, i.e. where one Finnish code was linked to several ISCO68 codes and vice versa. The crosswalk, which is available as supplementary data at Annals of Occupational Hygiene online, was reviewed by the exposure assessment team, including two experts of the Finnish coding system.
Several other minor modifications to the FINJEM–ISCO68 linkage were carried out. For example, ISCO68 does not contain a specific code for petrol service station attendants, who are included within the large retail sales group in ISCO68 (groups 4–51). It was decided that this
was an important omission, particularly for expo-sure to engine exhaust fumes, and a specific code was added to the ISCO68 coding system. This code was subsequently linked to the Finnish code for the petrol station attendants and cashiers.
Modification of FINJEM exposure estimates
Methods were developed and applied to the FINJEM in order to deal with a number of its limitations. The following sections describe the methods used to modify FINJEM exposure esti-mates for the INTEROCC study.
Linkage of several Finnish codes to one ISCO68 code. When multiple FINJEM codes were linked to one ISCO68 code, a weighted mean was calcu-lated for the proportion exposed (P) and the level of exposure (L) for each agent assigned among the FINJEM codes. The weighting was taken from the number of workers in each occupational code provided by FINJEM (i.e. based on the Finnish rather than the INTEROCC population).
Linkage of several ISCO68 codes to one Finnish code. As there are 311 three-digit Finnish codes and over 1500 five-digit codes in ISCO68, it was inevitable that many of the Finnish codes were linked to several ISCO68 five-digit codes. This could lead to important lack of specificity in the exposure assignments. The impact of this lack of specificity was estimated by comparing the FINJEM exposure estimates with estimates from a large lung cancer case–control study in Montreal, Canada (Siemiatycki, 1991). The expo-sure estimates in this study were based on expert assessments following a review of detailed occu-pational histories, in which exposure to a list of nearly 300 substances was assessed for each sub-ject. These assessments were subsequently sum-marized by ISCO68 code (Lavoué et al., 2012), thereby allowing comparison with the FINJEM estimates (using the crosswalk between FINJEM and ISCO68).
The Montreal study assigned an exposure level to each job held by subjects as 0 (no exposure) to 3 (high exposure) (Lavoué et al., 2012). In order to permit averaging exposure ratings within ISCO68 codes, the Montreal exposure intensity scale was modified by applying a weight of 1, 5, and 25 to the low-, medium-, and high-exposure catego-ries, respectively (based on a consensus scheme adopted by Montreal experts), and by adjusting the exposure estimate for the fraction of the work-ing time that exposure was reported to occur.
The FINJEM–Montreal comparison, described in detail elsewhere (Lavoué et al., 2012), allowed
by guest on May 22, 2016
http://annhyg.oxfordjournals.org/D
ownloaded from
614 M. van Tongeren et al.
us to identify a number of ISCO68 groups, each group linked to a single Finnish code, with poten-tial heterogeneous exposure based on Montreal exposure estimates. For example, there is only one FINJEM code for all types of mechanics, whereas there are 21 separate five-digit ISCO68 codes for the different types of mechanics, including motor vehicle mechanics, aircraft engine mechanics, machine fitters, machine assemblers, and precision instrument makers. A 2-fold difference between the minimum and maximum Montreal exposure level assigned to the ISCO68 codes linked to a single FINJEM code was adopted as an arbitrary threshold for deciding if heterogeneity occurred. In these cases, we carried out the following cali-bration procedure. We assumed that the initial FINJEM estimate L for a particular FINJEM code should be the arithmetic mean of the actual exposure estimates for the ISCO68 codes linked to that FINJEM code:
L L
MMi
i= × (1)
where Li is the calibrated estimate for the exposure intensity for ISCO68 code = i; L is the original FINJEM estimate for the FINJEM code, which is linked to ISCO codes i–n; Mi is the exposure estimate from the Montreal study for ISCO68 code = i; and M is the arithmetic average of Mi values. Results of the calibration were peer reviewed, which resulted in some modifications when the calibrations were carried out based on limited number of observations in the Montreal study. For example, the internal calibration of the ISCO68 codes linked to ‘Machine and engine mechanics’ resulted in relatively high exposures to aromatic hydrocarbons for the ISCO68 code ‘Office machine mechanic’, which were in the same order of magnitude as mechanics of heavy and transport machinery. It was decided that this was not realistic and exposure to aromatic hydro-carbons was reduced for this occupational group.
Wide period covered by a critical time window (1960–1984) in FINJEM. FINJEM provides estimates of exposure for several time periods (1945–1959, 1960–1984, 1985–1994, 1995–1997, 1998–2000, 2001–2003, and 2004–2006) and within each period, exposure is assumed to have remained constant. It was felt that the time period 1960–1984 was too wide, especially as it cov-ered an important transition period in the early 1970s in which exposure to many substances was significantly reduced due to a combination
of technological change and increased regula-tion (Kauppinen et al., 2012). For 16 substances, revised exposure estimates were available for the periods 1960–1974 and 1975–1984 from the NOCCA project (Kauppinen et al., 2009). For the remaining 12 agents of interest included in the INTEROCC study, we split the time win-dow. The exposure estimates for the time window 1960–1974 were estimated as the average of the original estimates for time periods 1945–1959 and 1960–1984, while for the time window 1974–1984, this was based on the average estimates from the original 1960–1984 and 1985–1994 time windows.
Inconsistencies of estimates for solvent expo-sure. FINJEM provides estimates for four broad groups of solvents (aliphatic and alicyclic hydro-carbons, aromatic hydrocarbons, chlorinated hydrocarbons, and other organic solvents) as well as seven individual solvents (e.g. benzene, toluene, trichloroethylene) (Table 1). Since the exposure assessments for the development of the FINJEM were carried out independently, agent by agent, some inconsistencies exist in the assignment of exposure estimates between some individual sub-stances and the solvent groups they belong to. For example, FINJEM code 652 (machine and engine mechanics) was assigned exposure to toluene and benzene but not to aromatic hydrocarbons. In order to make these solvent assignments more consistent for a given occupation, the estimates for a solvent group were modified to at least the level of the highest individual solvent exposure within the group (in terms of the product of P × L).
Inconsistencies in exposure estimates for die-sel and gasoline exhaust fumes. Inconsistencies existed with diesel exhaust (DEEX) and gasoline exhaust (GEEX) in FINJEM exposure estimates across various occupational groups. For example, service station attendants were assigned DEEX but not GEEX exposure, while labourers were assigned exposure to GEEX but not to DEEX. Since FINJEM assigned both DEEX and GEEX to motor vehicle and tram drivers (FINJEM code 540), the time period specific ratio of the DEEX to the GEEX exposure intensities (L) for this occupation was used to impute missing DEEX or GEEX exposure intensities for occupations involving road transport. For asphalt workers, who had a higher DEEX exposure level than the other transport occupations, the DEEX/GEEX ratio from FINJEM code 552 (road and tram ser-vice personnel) was used as we felt that this was a more representative reference. The prevalence of the missing DEEX or GEEX exposure was set
by guest on May 22, 2016
http://annhyg.oxfordjournals.org/D
ownloaded from
Assessing occupational exposure to chemicals 615
at the prevalence level for the exhaust exposure already assigned for the same occupational code.
Low exposure estimates for benzene prior to 1974 in FINJEM. There was a consensus in the expo-sure assessment group that benzene use was wide-spread prior to 1974 and that benzene exposure occurred simultaneously with exposure to other solvents, whereas FINJEM only assigned benzene exposure sporadically. FINJEM occupational codes (pre-1974) were reviewed to identify those with no benzene exposure that did have exposure to another indicator solvent for both time periods prior to 1974. The solvent used as an indicator of benzene exposure for a given occupation code was selected in hierarchical order as follows: aromatic hydrocarbon solvents, chlorinated hydrocarbon solvents, aliphatic hydrocarbon solvents, other organic solvents, toluene, and trichloroethylene. The average ratio of the benzene level to the indi-cator solvent level was calculated across FINJEM occupations for each time period (1945–1959 and 1960–1974), where the benzene and indica-tor solvent exposure was non-null. This ratio was applied to the level of the indicator solvent for that occupation to estimate the benzene level. The prevalence for the created benzene level was cop-ied from the indicator solvent. Estimates of ben-zene exposure after 1974 were not modified.
No code for supervisors and foremen in FINJEM. Within ISCO68, there are specific codes for supervisors/foremen in different occupa-tions or industries (ISCO68 group 7-00). However, no equivalent codes are available in the Finnish system, therefore no exposure estimate existed. It was, therefore, decided to link the ISCO68 codes for supervisors to the most appropriate Finnish code (based on the occupation and industry) and arbitrarily reduce the exposure intensity by 25% to account for the fact that the supervisors/fore-men have generally lower exposures than workers they supervise.
Underestimation of exposure to polycyclic aro-matic hydrocarbons and benzo(a)pyrene. The estimates of exposure for polycyclic aromatic hydrocarbon (PAH) and benzo(a)pyrene (B[a]P) in FINJEM ignored the contribution to these agents from exposure to environmental tobacco smoke (ETS). Even though the exposure to PAHs and B[a]P from ETS is likely to be relatively low compared to industrial sources, it was decided to include this source due to the widespread exposure to ETS in the past. Exposure to ETS is assigned by FINJEM as a proportion of the working hours exposed from 1985 to 1994 onwards (although for
some occupations, estimates were only available from 1998 to 2000 onwards). Estimates from 1985 to 1994 or 1998 to 2000 were copied into the ear-lier time periods, assuming exposure to tobacco smoke would have been at least as much in earlier time periods. To estimate exposure to PAH and B[a]P from ETS, data were used from Castro et al. (2011), who observed B[a]P and PAH levels in res-pirable particulate matter (PM2.5) from tobacco smoke of 0.046 ng B[a]P per microgram of PM2.5 and 0.474 ng all PAHs microgram of PM2.5, respectively. Next, we used data from several stud-ies in the UK (Semple et al., 2007, 2010; Gotz et al., 2008) to determine the PM2.5 levels in bars and restaurants. A weighted geometric mean level of PM2.5 of 139 µg m−3 was obtained from these studies. By combining these data, exposure esti-mates for bar and restaurant staff of 65.9 ng m−3 for PAH and 6.4 ng m−3 for B[a]P were calculated.
To extrapolate and obtain estimates of PAH and B[a]P exposure levels for all FINJEM codes, the ratio of the ETS exposure for the occupational code and the ETS exposure for waiters in bars and restaurants (FINJEM code 821) was multiplied by the PAH- and B[a]P-derived estimates obtained for bar and restaurant staff. The prevalence esti-mates for ETS were used for the derived PAH and B[a]P. If FINJEM already assigned an estimate for PAH and B[a]P, then this estimate was over-written only if the derived level from ETS expo-sure (P × L) was higher than the original estimate.
Peer review of all modifications to FINJEM for use in INTEROCC
The chemical exposure assessment team (M.v.T., L.K., L.R., T.K., N.P., G.B., D.M., J.L., and D.K.) reviewed each modification to the FINJEM as it was implemented. The final results after implementation of all modifications were again reviewed for coherence and consistency and those retained are described in this paper.
Comparison of FINJEM and INTEROCC JEM estimates
To evaluate the impact of the modifications made to the exposure estimates when developing the INTEROCC JEM, we compared the results of the exposure assessment when applying the two JEMs on the INTEROCC study population. First, we compared the proportion of exposed INTEROCC study subjects as estimated by FINJEM and INTEROCC JEM for each agent by time period. In this comparison, a subject was considered
by guest on May 22, 2016
http://annhyg.oxfordjournals.org/D
ownloaded from
616 M. van Tongeren et al.
exposed if the proportion of exposed individuals within an ISCO68 category was greater than or equal to 5%. Next, we compared the results after calculating cumulative exposure for all study sub-jects for each agent across the entire occupational history. The cumulative exposure estimate was calculated as the sum of the product of the prob-ability of exposure P, the level of exposure L, and the duration for each job held by a subject. Again, a subject was considered exposed if employed in a job that had been coded to an ISCO68 code with a proportion of exposed individuals greater than or equal to 5%. Cumulative exposure categories were then developed as follows: never exposed, low exposed: bottom 30% of the cumulative exposure distribution, medium exposed 30–60%, high exposed 60–90%, and very high exposed: top 10%. It should be emphasized that the cumulative exposure estimates shown in this article are devel-oped to allow comparison between the FINJEM and INTEROCC JEM. In future papers of the INTEROCC study investigating the association between estimates of occupational exposure and risk of brain tumours, different exposure defini-tions and cumulative exposure categories may be used. In particular, a higher threshold might be selected for the exposed status.
rESuLTS
There were over 35 000 jobs coded in the seven participating INTEROCC countries. As expected, the majority of occupations were in the profes-sional, clerical, sales, and service sectors. The largest professional group consisted of managers and administrators with groups such as health professionals (physicians and nurses), teachers, accountants, and social workers making up the bulk of the other professionals. Clerical workers were by far the most prevalent group followed by occupations in sales. Detailed analyses of occupa-tion and industry distributions and of their asso-ciation with brain tumour risk will be published elsewhere.
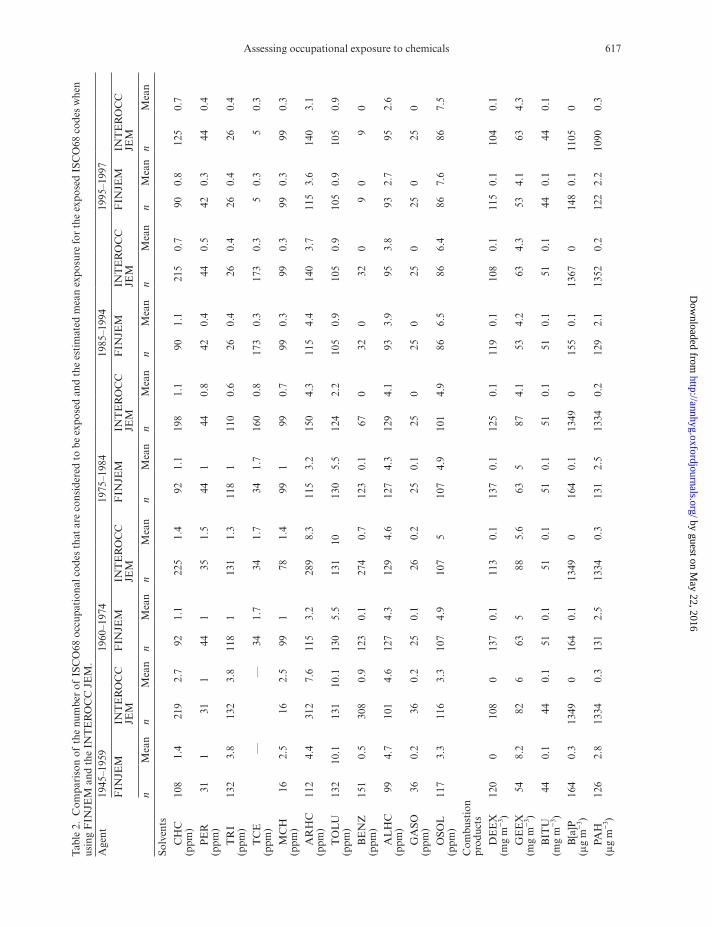
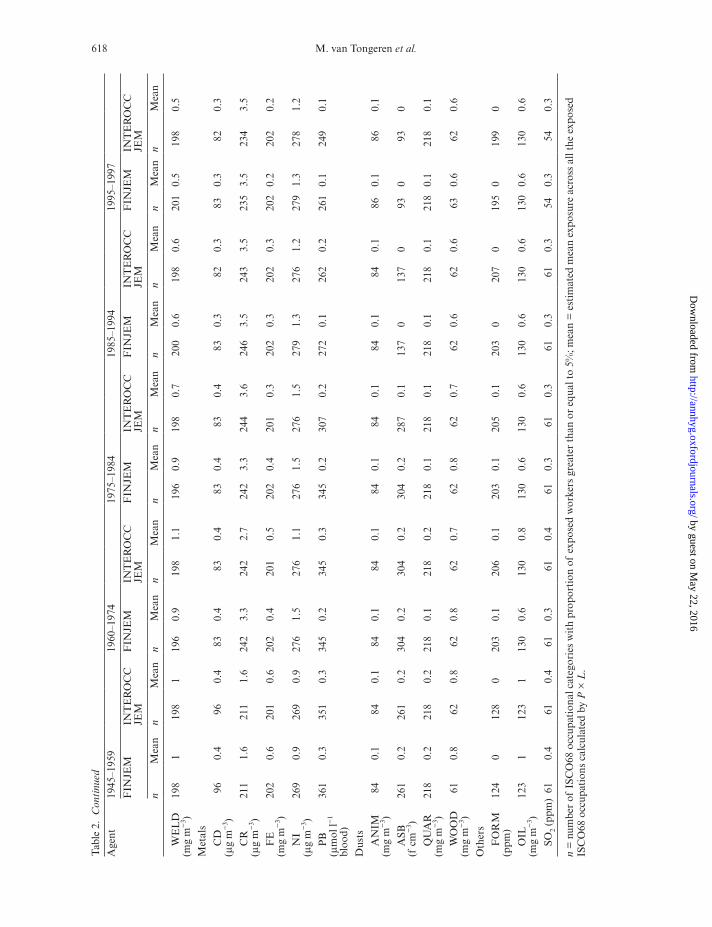
The outcome of all the modifications resulted in considerably more occupations being ‘exposed’ (i.e. with a job code for which it is estimated that at least 5% of workers in this occupation are exposed to the chemicals of interest) in the INTEROCC JEM than in FINJEM for most time periods. Table 2 shows, by agent, the number of occupations (ISCO68 codes) linked to exposure and the mean P × L exposure for the INTEROCC JEM and FINJEM. Notably, as a result of the
modifications, the number of occupations consid-ered as exposed for the solvent groups increased considerably, while for individual solvents, it remained largely unchanged, except for benzene prior to 1974, which increased. Also the num-ber exposed to B[a]P and PAH was drastically increased.
Heterogeneity of exposures resulting from differences in occupations grouped into one Finnish occupational code (see section Linkage of Several ISCO68 Codes to One Finnish Code)
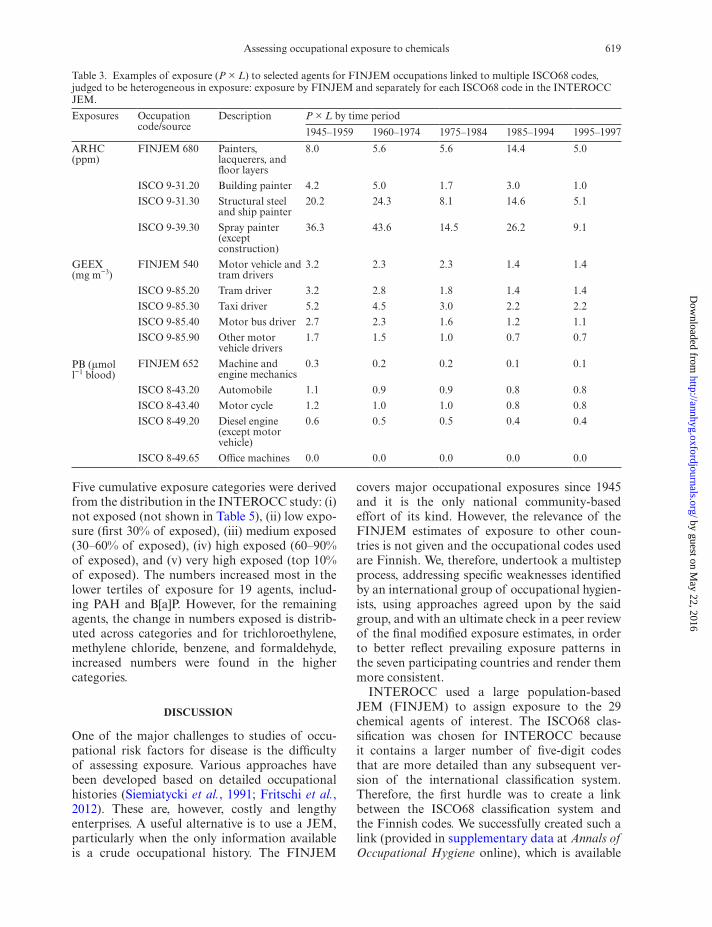
FINJEM-based exposure estimates for groups of ISCO68 codes that were linked to single Finnish occupational codes in the crosswalk were com-pared with estimates for the same ISCO68 codes based on expert judgements in Montreal (Lavoué et al., 2012) to determine if important differences in exposure occurred within these groups of ISCO68 codes. Based on this comparison, exposure esti-mates for six agents (aromatic hydrocarbons, iron, gasoline exhaust, other organic solvents, lead, and welding fumes) for a total of 123 ISCO68 codes were modified. Table 3 shows selected examples of these modifications, while supplementary data at Annals of Occupational Hygiene online provide details of all these modifications. Exposure to aromatic hydrocarbons for painters showed the most dramatic differences with an 8-fold differ-ence between building painters at the lowest end and spray painters at the highest end. Taxi drivers have three times the estimated exposure to gasoline exhaust than other motor vehicle drivers, with lev-els for tram and bus drivers in between. The new levels of blood lead assigned to the different groups of mechanics range from no exposure for mechan-ics not working with motor vehicles (such as office machine mechanics) to levels of 112 µmol l−1 for those repairing automobiles and 119 µmol l−1 for motorcycle mechanics.
Impact of the modifications on prevalence and exposure in the INTEROCC study population
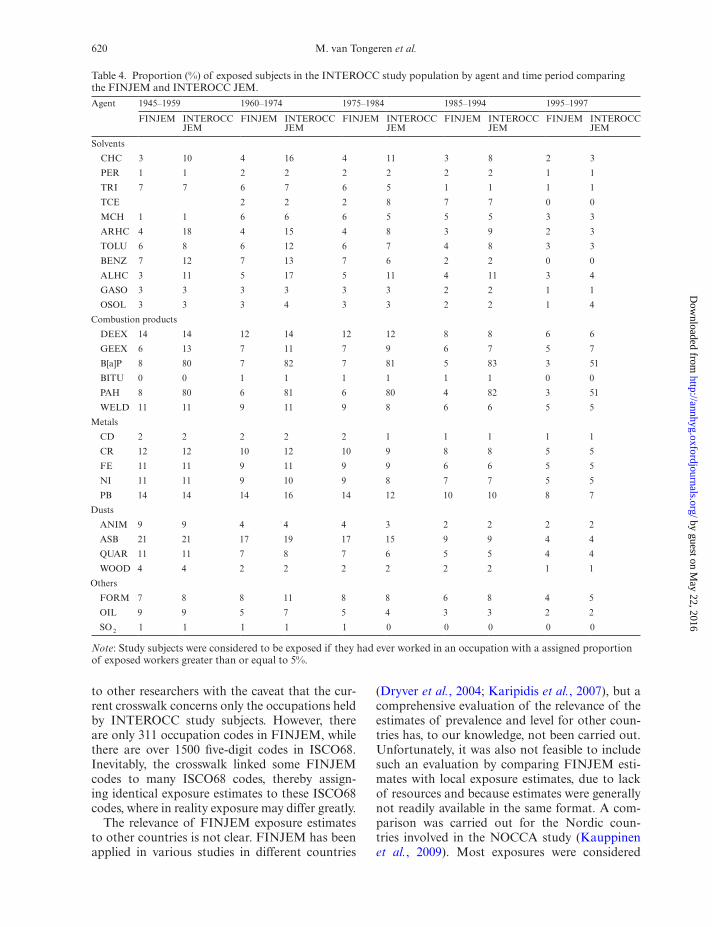
Table 4 shows the prevalence of INTEROCC study subjects exposed to each agent in each time period for FINJEM and the INTEROCC JEM. Due to the modifications, there are significant dif-ferences in numbers exposed for the three solvent groups as well as benzene, B[a]P, PAH, and gaso-line engine emissions across all time periods.
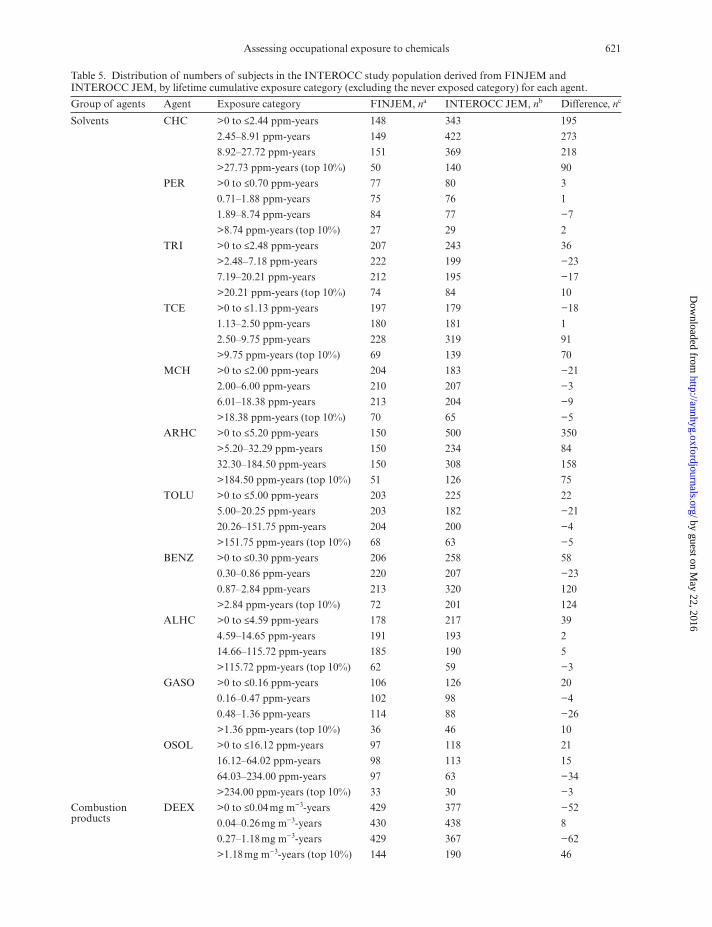
Table 5 shows the distribution of the number of INTEROCC subjects by category of cumulative exposure for each agent as assigned by each JEM.
by guest on May 22, 2016
http://annhyg.oxfordjournals.org/D
ownloaded from
Assessing occupational exposure to chemicals 617
Age
nt19
45–1
959
1960
–197
419
75–1
984
1985
–199
419
95–1
997
FIN
JEM
INT
ER
OC
C
JEM
FIN
JEM
INT
ER
OC
C
JEM
FIN
JEM
INT
ER
OC
C
JEM
FIN
JEM
INT
ER
OC
C
JEM
FIN
JEM
INT
ER
OC
C
JEM
nM
ean
nM
ean
nM
ean
nM
ean
nM
ean
nM
ean
nM
ean
nM
ean
nM
ean
nM
ean
Solv
ents
C
HC
(p
pm)
108
1.4
219
2.7
921.
122
51.
492
1.1
198
1.1
901.
121
50.
790
0.8
125
0.7
P
ER
(p
pm)
311
311
441
351.
544
144
0.8
420.
444
0.5
420.
344
0.4
T
RI
(ppm
)13
23.
813
23.
811
81
131
1.3
118
111
00.
626
0.4
260.
426
0.4
260.
4
T
CE
(p
pm)
——
341.
734
1.7
341.
716
00.
817
30.
317
30.
35
0.3
50.
3
M
CH
(p
pm)
162.
516
2.5
991
781.
499
199
0.7
990.
399
0.3
990.
399
0.3
A
RH
C
(ppm
)11
24.
431
27.
611
53.
228
98.
311
53.
215
04.
311
54.
414
03.
711
53.
614
03.
1
T
OL
U
(ppm
)13
210
.113
110
.113
05.
513
110
130
5.5
124
2.2
105
0.9
105
0.9
105
0.9
105
0.9
B
EN
Z
(ppm
)15
10.
530
80.
912
30.
127
40.
712
30.
167
032
032
09
09
0
A
LH
C
(ppm
)99
4.7
101
4.6
127
4.3
129
4.6
127
4.3
129
4.1
933.
995
3.8
932.
795
2.6
G
ASO
(p
pm)
360.
236
0.2
250.
126
0.2
250.
125
025
025
025
025
0
O
SOL
(p
pm)
117
3.3
116
3.3
107
4.9
107
510
74.
910
14.
986
6.5
866.
486
7.6
867.
5
Com
bust
ion
pr
oduc
ts
D
EE
X
(mg
m−
3 )12
00
108
013
70.
111
30.
113
70.
112
50.
111
90.
110
80.
111
50.
110
40.
1
G
EE
X
(mg
m−
3 )54
8.2
826
635
885.
663
587
4.1
534.
263
4.3
534.
163
4.3
B
ITU
(m
g m
−3 )
440.
144
0.1
510.
151
0.1
510.
151
0.1
510.
151
0.1
440.
144
0.1
B
[a]P
(μ
g m
−3 )
164
0.3
1349
016
40.
113
490
164
0.1
1349
015
50.
113
670
148
0.1
1105
0
PA
H
(μg
m−
3 )12
62.
813
340.
313
12.
513
340.
313
12.
513
340.
212
92.
113
520.
212
22.
210
900.
3
Tab
le 2
. C
ompa
riso
n of
the
num
ber
of I
SCO
68 o
ccup
atio
nal c
odes
tha
t ar
e co
nsid
ered
to
be e
xpos
ed a
nd t
he e
stim
ated
mea
n ex
posu
re fo
r th
e ex
pose
d IS
CO
68 c
odes
whe
n us
ing
FIN
JEM
and
the
IN
TE
RO
CC
JE
M.
by guest on May 22, 2016
http://annhyg.oxfordjournals.org/D
ownloaded from
618 M. van Tongeren et al.
Age
nt19
45–1
959
1960
–197
419
75–1
984
1985
–199
419
95–1
997
FIN
JEM
INT
ER
OC
C
JEM
FIN
JEM
INT
ER
OC
C
JEM
FIN
JEM
INT
ER
OC
C
JEM
FIN
JEM
INT
ER
OC
C
JEM
FIN
JEM
INT
ER
OC
C
JEM
nM
ean
nM
ean
nM
ean
nM
ean
nM
ean
nM
ean
nM
ean
nM
ean
nM
ean
nM
ean
W
EL
D
(mg
m−
3 )19
81
198
119
60.
919
81.
119
60.
919
80.
720
00.
619
80.
620
10.
519
80.
5
Met
als
C
D
(μg
m−
3 )96
0.4
960.
483
0.4
830.
483
0.4
830.
483
0.3
820.
383
0.3
820.
3
C
R
(μg
m−
3 )21
11.
621
11.
624
23.
324
22.
724
23.
324
43.
624
63.
524
33.
523
53.
523
43.
5
F
E
(mg
m−
3 )20
20.
620
10.
620
20.
420
10.
520
20.
420
10.
320
20.
320
20.
320
20.
220
20.
2
N
I
(μg
m−
3 )26
90.
926
90.
927
61.
527
61.
127
61.
527
61.
527
91.
327
61.
227
91.
327
81.
2
P
B
(μm
ol l−
1 bl
ood)
361
0.3
351
0.3
345
0.2
345
0.3
345
0.2
307
0.2
272
0.1
262
0.2
261
0.1
249
0.1
Dus
ts
A
NIM
(m
g m
−3 )
840.
184
0.1
840.
184
0.1
840.
184
0.1
840.
184
0.1
860.
186
0.1
A
SB
(f c
m−
3 )26
10.
226
10.
230
40.
230
40.
230
40.
228
70.
113
70
137
093
093
0
Q
UA
R
(mg
m−
3 )21
80.
221
80.
221
80.
121
80.
221
80.
121
80.
121
80.
121
80.
121
80.
121
80.
1
W
OO
D
(mg
m−
3 )61
0.8
620.
862
0.8
620.
762
0.8
620.
762
0.6
620.
663
0.6
620.
6
Oth
ers
F
OR
M
(ppm
)12
40
128
020
30.
120
60.
120
30.
120
50.
120
30
207
019
50
199
0
O
IL
(mg
m−
3 )12
31
123
113
00.
613
00.
813
00.
613
00.
613
00.
613
00.
613
00.
613
00.
6
SO
2 (pp
m)
610.
461
0.4
610.
361
0.4
610.
361
0.3
610.
361
0.3
540.
354
0.3
n =
num
ber
of I
SCO
68 o
ccup
atio
nal c
ateg
orie
s w
ith
prop
orti
on o
f ex
pose
d w
orke
rs g
reat
er t
han
or e
qual
to
5%; m
ean
= e
stim
ated
mea
n ex
posu
re a
cros
s al
l the
exp
osed
IS
CO
68 o
ccup
atio
ns c
alcu
late
d by
P ×
L.
Tab
le 2
. C
onti
nued
by guest on May 22, 2016
http://annhyg.oxfordjournals.org/D
ownloaded from
Assessing occupational exposure to chemicals 619
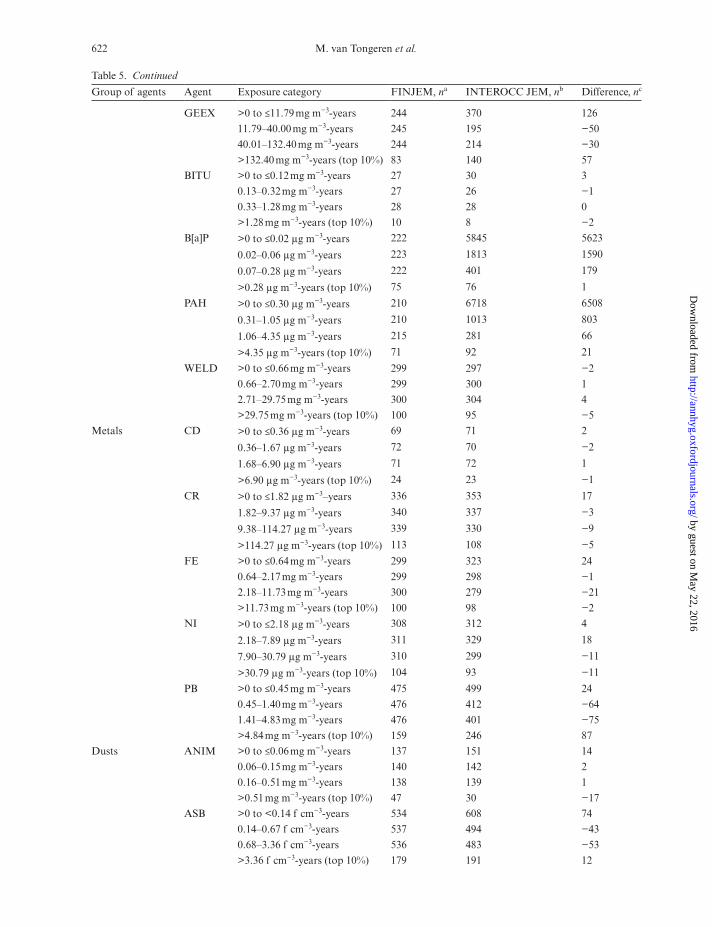
Five cumulative exposure categories were derived from the distribution in the INTEROCC study: (i) not exposed (not shown in Table 5), (ii) low expo-sure (first 30% of exposed), (iii) medium exposed (30–60% of exposed), (iv) high exposed (60–90% of exposed), and (v) very high exposed (top 10% of exposed). The numbers increased most in the lower tertiles of exposure for 19 agents, includ-ing PAH and B[a]P. However, for the remaining agents, the change in numbers exposed is distrib-uted across categories and for trichloroethylene, methylene chloride, benzene, and formaldehyde, increased numbers were found in the higher categories.
dISCuSSIOn
One of the major challenges to studies of occu-pational risk factors for disease is the difficulty of assessing exposure. Various approaches have been developed based on detailed occupational histories (Siemiatycki et al., 1991; Fritschi et al., 2012). These are, however, costly and lengthy enterprises. A useful alternative is to use a JEM, particularly when the only information available is a crude occupational history. The FINJEM
covers major occupational exposures since 1945 and it is the only national community-based effort of its kind. However, the relevance of the FINJEM estimates of exposure to other coun-tries is not given and the occupational codes used are Finnish. We, therefore, undertook a multistep process, addressing specific weaknesses identified by an international group of occupational hygien-ists, using approaches agreed upon by the said group, and with an ultimate check in a peer review of the final modified exposure estimates, in order to better reflect prevailing exposure patterns in the seven participating countries and render them more consistent.
INTEROCC used a large population-based JEM (FINJEM) to assign exposure to the 29 chemical agents of interest. The ISCO68 clas-sification was chosen for INTEROCC because it contains a larger number of five-digit codes that are more detailed than any subsequent ver-sion of the international classification system. Therefore, the first hurdle was to create a link between the ISCO68 classification system and the Finnish codes. We successfully created such a link (provided in supplementary data at Annals of Occupational Hygiene online), which is available
Table 3. Examples of exposure (P × L) to selected agents for FINJEM occupations linked to multiple ISCO68 codes, judged to be heterogeneous in exposure: exposure by FINJEM and separately for each ISCO68 code in the INTEROCC JEM.
Exposures Occupation code/source
Description P × L by time period
1945–1959 1960–1974 1975–1984 1985–1994 1995–1997
ARHC (ppm)
FINJEM 680 Painters, lacquerers, and floor layers
8.0 5.6 5.6 14.4 5.0
ISCO 9-31.20 Building painter 4.2 5.0 1.7 3.0 1.0
ISCO 9-31.30 Structural steel and ship painter
20.2 24.3 8.1 14.6 5.1
ISCO 9-39.30 Spray painter (except construction)
36.3 43.6 14.5 26.2 9.1
GEEX (mg m−3)
FINJEM 540 Motor vehicle and tram drivers
3.2 2.3 2.3 1.4 1.4
ISCO 9-85.20 Tram driver 3.2 2.8 1.8 1.4 1.4
ISCO 9-85.30 Taxi driver 5.2 4.5 3.0 2.2 2.2
ISCO 9-85.40 Motor bus driver 2.7 2.3 1.6 1.2 1.1
ISCO 9-85.90 Other motor vehicle drivers
1.7 1.5 1.0 0.7 0.7
PB (μmol l−1 blood)
FINJEM 652 Machine and engine mechanics
0.3 0.2 0.2 0.1 0.1
ISCO 8-43.20 Automobile 1.1 0.9 0.9 0.8 0.8
ISCO 8-43.40 Motor cycle 1.2 1.0 1.0 0.8 0.8
ISCO 8-49.20 Diesel engine (except motor vehicle)
0.6 0.5 0.5 0.4 0.4
ISCO 8-49.65 Office machines 0.0 0.0 0.0 0.0 0.0
by guest on May 22, 2016
http://annhyg.oxfordjournals.org/D
ownloaded from
620 M. van Tongeren et al.
to other researchers with the caveat that the cur-rent crosswalk concerns only the occupations held by INTEROCC study subjects. However, there are only 311 occupation codes in FINJEM, while there are over 1500 five-digit codes in ISCO68. Inevitably, the crosswalk linked some FINJEM codes to many ISCO68 codes, thereby assign-ing identical exposure estimates to these ISCO68 codes, where in reality exposure may differ greatly.
The relevance of FINJEM exposure estimates to other countries is not clear. FINJEM has been applied in various studies in different countries
(Dryver et al., 2004; Karipidis et al., 2007), but a comprehensive evaluation of the relevance of the estimates of prevalence and level for other coun-tries has, to our knowledge, not been carried out. Unfortunately, it was also not feasible to include such an evaluation by comparing FINJEM esti-mates with local exposure estimates, due to lack of resources and because estimates were generally not readily available in the same format. A com-parison was carried out for the Nordic coun-tries involved in the NOCCA study (Kauppinen et al., 2009). Most exposures were considered
Table 4. Proportion (%) of exposed subjects in the INTEROCC study population by agent and time period comparing the FINJEM and INTEROCC JEM.Agent 1945–1959 1960–1974 1975–1984 1985–1994 1995–1997
FINJEM INTEROCC JEM
FINJEM INTEROCC JEM
FINJEM INTEROCC JEM
FINJEM INTEROCC JEM
FINJEM INTEROCC JEM
Solvents
CHC 3 10 4 16 4 11 3 8 2 3
PER 1 1 2 2 2 2 2 2 1 1
TRI 7 7 6 7 6 5 1 1 1 1
TCE 2 2 2 8 7 7 0 0
MCH 1 1 6 6 6 5 5 5 3 3
ARHC 4 18 4 15 4 8 3 9 2 3
TOLU 6 8 6 12 6 7 4 8 3 3
BENZ 7 12 7 13 7 6 2 2 0 0
ALHC 3 11 5 17 5 11 4 11 3 4
GASO 3 3 3 3 3 3 2 2 1 1
OSOL 3 3 3 4 3 3 2 2 1 4
Combustion products
DEEX 14 14 12 14 12 12 8 8 6 6
GEEX 6 13 7 11 7 9 6 7 5 7
B[a]P 8 80 7 82 7 81 5 83 3 51
BITU 0 0 1 1 1 1 1 1 0 0
PAH 8 80 6 81 6 80 4 82 3 51
WELD 11 11 9 11 9 8 6 6 5 5
Metals
CD 2 2 2 2 2 1 1 1 1 1
CR 12 12 10 12 10 9 8 8 5 5
FE 11 11 9 11 9 9 6 6 5 5
NI 11 11 9 10 9 8 7 7 5 5
PB 14 14 14 16 14 12 10 10 8 7
Dusts
ANIM 9 9 4 4 4 3 2 2 2 2
ASB 21 21 17 19 17 15 9 9 4 4
QUAR 11 11 7 8 7 6 5 5 4 4
WOOD 4 4 2 2 2 2 2 2 1 1
Others
FORM 7 8 8 11 8 8 6 8 4 5
OIL 9 9 5 7 5 4 3 3 2 2
SO 2 1 1 1 1 1 0 0 0 0 0
Note: Study subjects were considered to be exposed if they had ever worked in an occupation with a assigned proportion of exposed workers greater than or equal to 5%.
by guest on May 22, 2016
http://annhyg.oxfordjournals.org/D
ownloaded from
Assessing occupational exposure to chemicals 621
Table 5. Distribution of numbers of subjects in the INTEROCC study population derived from FINJEM and INTEROCC JEM, by lifetime cumulative exposure category (excluding the never exposed category) for each agent.
Group of agents Agent Exposure category FINJEM, na INTEROCC JEM, nb Difference, nc
Solvents CHC >0 to ≤2.44 ppm-years 148 343 195
2.45–8.91 ppm-years 149 422 273
8.92–27.72 ppm-years 151 369 218
>27.73 ppm-years (top 10%) 50 140 90
PER >0 to ≤0.70 ppm-years 77 80 3
0.71–1.88 ppm-years 75 76 1
1.89–8.74 ppm-years 84 77 −7
>8.74 ppm-years (top 10%) 27 29 2
TRI >0 to ≤2.48 ppm-years 207 243 36
>2.48–7.18 ppm-years 222 199 −23
7.19–20.21 ppm-years 212 195 −17
>20.21 ppm-years (top 10%) 74 84 10
TCE >0 to ≤1.13 ppm-years 197 179 −18
1.13–2.50 ppm-years 180 181 1
2.50–9.75 ppm-years 228 319 91
>9.75 ppm-years (top 10%) 69 139 70
MCH >0 to ≤2.00 ppm-years 204 183 −21
2.00–6.00 ppm-years 210 207 −3
6.01–18.38 ppm-years 213 204 −9
>18.38 ppm-years (top 10%) 70 65 −5
ARHC >0 to ≤5.20 ppm-years 150 500 350
>5.20–32.29 ppm-years 150 234 84
32.30–184.50 ppm-years 150 308 158
>184.50 ppm-years (top 10%) 51 126 75
TOLU >0 to ≤5.00 ppm-years 203 225 22
5.00–20.25 ppm-years 203 182 −21
20.26–151.75 ppm-years 204 200 −4
>151.75 ppm-years (top 10%) 68 63 −5
BENZ >0 to ≤0.30 ppm-years 206 258 58
0.30–0.86 ppm-years 220 207 −23
0.87–2.84 ppm-years 213 320 120
>2.84 ppm-years (top 10%) 72 201 124
ALHC >0 to ≤4.59 ppm-years 178 217 39
4.59–14.65 ppm-years 191 193 2
14.66–115.72 ppm-years 185 190 5
>115.72 ppm-years (top 10%) 62 59 −3
GASO >0 to ≤0.16 ppm-years 106 126 20
0.16–0.47 ppm-years 102 98 −4
0.48–1.36 ppm-years 114 88 −26
>1.36 ppm-years (top 10%) 36 46 10
OSOL >0 to ≤16.12 ppm-years 97 118 21
16.12–64.02 ppm-years 98 113 15
64.03–234.00 ppm-years 97 63 −34
>234.00 ppm-years (top 10%) 33 30 −3
Combustion products
DEEX >0 to ≤0.04 mg m−3-years 429 377 −52
0.04–0.26 mg m−3-years 430 438 8
0.27–1.18 mg m−3-years 429 367 −62
>1.18 mg m−3-years (top 10%) 144 190 46
by guest on May 22, 2016
http://annhyg.oxfordjournals.org/D
ownloaded from
622 M. van Tongeren et al.
Table 5. Continued
Group of agents Agent Exposure category FINJEM, na INTEROCC JEM, nb Difference, nc
GEEX >0 to ≤11.79 mg m−3-years 244 370 126
11.79–40.00 mg m−3-years 245 195 −50
40.01–132.40 mg m−3-years 244 214 −30
>132.40 mg m−3-years (top 10%) 83 140 57
BITU >0 to ≤0.12 mg m−3-years 27 30 3
0.13–0.32 mg m−3-years 27 26 −1
0.33–1.28 mg m−3-years 28 28 0
>1.28 mg m−3-years (top 10%) 10 8 −2
B[a]P >0 to ≤0.02 μg m−3-years 222 5845 5623
0.02–0.06 μg m−3-years 223 1813 1590
0.07–0.28 μg m−3-years 222 401 179
>0.28 μg m−3-years (top 10%) 75 76 1
PAH >0 to ≤0.30 μg m−3-years 210 6718 6508
0.31–1.05 μg m−3-years 210 1013 803
1.06–4.35 μg m−3-years 215 281 66
>4.35 μg m−3-years (top 10%) 71 92 21
WELD >0 to ≤0.66 mg m−3-years 299 297 −2
0.66–2.70 mg m−3-years 299 300 1
2.71–29.75 mg m−3-years 300 304 4
>29.75 mg m−3-years (top 10%) 100 95 −5
Metals CD >0 to ≤0.36 μg m−3-years 69 71 2
0.36–1.67 μg m−3-years 72 70 −2
1.68–6.90 μg m−3-years 71 72 1
>6.90 μg m−3-years (top 10%) 24 23 −1
CR >0 to ≤1.82 μg m−3–years 336 353 17
1.82–9.37 μg m−3-years 340 337 −3
9.38–114.27 μg m−3-years 339 330 −9
>114.27 μg m−3-years (top 10%) 113 108 −5
FE >0 to ≤0.64 mg m−3-years 299 323 24
0.64–2.17 mg m−3-years 299 298 −1
2.18–11.73 mg m−3-years 300 279 −21
>11.73 mg m−3-years (top 10%) 100 98 −2
NI >0 to ≤2.18 μg m−3-years 308 312 4
2.18–7.89 μg m−3-years 311 329 18
7.90–30.79 μg m−3-years 310 299 −11
>30.79 μg m−3-years (top 10%) 104 93 −11
PB >0 to ≤0.45 mg m−3-years 475 499 24
0.45–1.40 mg m−3-years 476 412 −64
1.41–4.83 mg m−3-years 476 401 −75
>4.84 mg m−3-years (top 10%) 159 246 87
Dusts ANIM >0 to ≤0.06 mg m−3-years 137 151 14
0.06–0.15 mg m−3-years 140 142 2
0.16–0.51 mg m−3-years 138 139 1
>0.51 mg m−3-years (top 10%) 47 30 −17
ASB >0 to <0.14 f cm−3-years 534 608 74
0.14–0.67 f cm−3-years 537 494 −43
0.68–3.36 f cm−3-years 536 483 −53
>3.36 f cm−3-years (top 10%) 179 191 12
by guest on May 22, 2016
http://annhyg.oxfordjournals.org/D
ownloaded from

Assessing occupational exposure to chemicals 623
to be fairly similar between the Nordic coun-tries, with only a few major differences identified (Kauppinen et al., 2009). Furthermore, a compar-ison was carried out of FINJEM estimates with exposure estimates obtained from expert assess-ments from a large case–control study of lung cancer in Montreal, Canada (Lavoué et al., 2012). The results of this comparison suggested that for some exposure, there were substantial differences between FINJEM estimates and the estimates obtained from the Canadian study, although for exposure to metals, the assessments appear to be reasonably comparable (Lavoué et al., 2012).
A group of exposure assessment experts under-took a review of FINJEM and its relevance to an international study and a range of modifications were developed and implemented. Expanding on the work undertaken for the NOCCA study (Kauppinen et al., 2009), splitting the time period 1960–1984 into pre- and post-1974, more
accurately reflects the changes in exposure levels to many substances from the earlier to the later period. This was a time of increasing regulation in industry, and although changes were not imple-mented uniformly across countries, the trend was similar in most of the INTEROCC countries. It remains an important issue for future work to resolve more precisely when and to what extent the changes in use patterns occurred in each country. For example, the timing for a decrease in asbestos and benzene exposure differs considerably from one country to another.
Assessments for the grouped and individual solvents included in FINJEM were carried out independently and were not previously verified for consistency. In this study, we tried to ensure that the assessments for individual solvents were taken into account for the group solvents. It should be noted that not all individual solvents are included in FINJEM and this could be addressed in future
Table 5. Continued
Group of agents Agent Exposure category FINJEM, na INTEROCC JEM, nb Difference, nc
QUAR >0 to ≤0.13 mg m−3-years 263 274 11
0.13–0.55 mg m−3-years 263 272 9
0.56–2.21 mg m−3-years 263 249 −14
>2.21 mg m−3-years (top 10%) 88 82 −6
WOOD >0 to ≤1.31 mg m−3-years 78 86 8
1.31–4.98 mg m−3-years 79 68 −11
4.98 to 19.00 mg m−3-years 78 79 1
>19.00 mg m−3-years (top 10%) 27 26 −1
Others FORM >0 to ≤0.02 ppm-years 293 192 −101
0.02–0.08 ppm-years 294 240 −54
0.09–0.79 ppm-years 294 415 121
>0.79 ppm-years (top 10%) 98 135 37
OIL >0 to ≤0.25 mg m−3-years 184 166 −18
0.25–2.40 mg m−3-years 184 200 16
2.41–30.60 mg m−3-years 185 184 −1
>30.60 mg m−3-years (top 10%) 63 66 3
SO2 >0 to ≤0.68 ppm-years 21 20 −1
0.68–2.71 ppm-years 21 23 2
2.72–13.45 ppm-years 21 21 0
>13.45 ppm-years (top 10%) 7 6 −1
Note: Study subjects were considered to be exposed if they had ever worked in an occupation with a assigned proportion of exposed workers greater than or equal to 5%. Categories derived from distribution of lifetime cumulative exposure (low exposed: bottom 30% of the cumulative exposure distribution, medium exposed: 30–60%, high exposed: 60–90%, and very high exposed: top 10%).an refers to the number of INTEROCC study subjects categorized in each cumulative exposure category when using the original FINJEM.bn refers to the number of INTEROCC study subjects categorized in each cumulative exposure category when using the INTEROCC JEM.cn refers to the difference in the number of INTEROCC study subjects included in each cumulative exposure category based on the original FINJEM and INTEROCC JEM.
by guest on May 22, 2016
http://annhyg.oxfordjournals.org/D
ownloaded from
624 M. van Tongeren et al.
work. The expert group was also struck by the lack of benzene attribution when other solvents had been assigned in FINJEM for the period prior to 1974. This may relate to the more lim-ited use of benzene in Finland than in many other countries. The modifications resulted in a consid-erable increase in the prevalence of exposure to benzene in the earlier periods. Similar inconsist-encies existed in FINJEM for gasoline and diesel emission exposure assignments. Thus, the assess-ments for motor transport and road maintenance and repair workers led to an overall increase in numbers of subjects exposed to both diesel and gasoline emissions.
Further, the assessment of exposure to B[a]P and PAH did not reflect occupational exposure to ETS. An innovative approach was developed resulting in a significant increase in the prevalence of exposure to both. Although the mean cumu-lative exposure decreased significantly because of the addition of low values, those occupations such as furnace men and foundry workers, where exposure to B[a]P and PAH is the highest, remain the highest exposed occupations. It is worth not-ing that while the modifications to B[a]P and PAH resulted in more subjects exposed in the lowest exposure category, this did not hold for the modi-fications to other substances. For all the other agents, the increase in numbers of occupations can be observed across all levels of exposure.
The fewer the occupation codes used for expo-sure assessment, the more likely it is that greater misclassification will occur because of heteroge-neity of exposure across the subgroups linked to a given code. We attempted to resolve this issue by comparing the FINJEM exposure assessments with individual expert assessment for multiple ISCO68 five-digit codes linked to one Finnish code. This was limited to occupations for which we had sufficient data in the Montreal study to compare the expert assessments. In addition, this was only possible for ISCO68 codes linked to a FINJEM code for which an exposure was assigned. We have shown that calibrating the FINJEM esti-mates to account for these differences in exposure is feasible and important for reducing misclassifi-cation. This is an important area for future work to render population-based JEMs more accurate in their assessments. However, it should also be noted that this problem is closely related to the system of occupational codes used in construct-ing a JEM, which are generally not specifically designed for epidemiological studies (‘t Mannetje and Kromhout, 2003).
In summary, several important modifications to the exposure estimates for the 28 agents of inter-est were implemented, addressing among others some heterogeneity of exposure within FINJEM, the wide time period covered by a critical time window (1960–1984) and inconsistencies within FINJEM for some solvent exposures and diesel and gasoline engine exhaust exposures. Although the work undertaken within the INTEROCC pro-ject has produced some important improvements for researchers using the FINJEM, there remain many areas to be explored further. In addition, the modifications undertaken within INTEROCC were focussed on the particular a priori group of agents selected for analysis of risk of brain can-cer. We did not address issues related to the other chemical or physical agents available in FINJEM, or those agents of interest with very low popula-tion prevalence such as mercury or arsenic.
A link between exposure to pesticides and increased risk of brain tumours has been hypoth-esized (Khuder et al., 1998; Lee et al., 2005; Provost et al., 2007). Pesticide exposure was not included in the INTEROCC study as FINJEM only provides exposure estimates for fungicides, herbicides, and insecticides rather than (catego-ries of) active ingredients. The use of the active ingredients can vary widely across and within countries and over time. Information on historical use of pesticides on crops is available in various countries and could perhaps be used to develop a country-/region-specific exposure matrix for farmers (Dick et al., 2010).
Biocides are a good example of agents where inter-country differences in exposure may be large. Other similar agents are asbestos and silica, where differences have been noticed to occur between Nordic countries (Kauppinen et al., 2009). Furthermore, the nature and level of exposure for chemical and metal workers will depend to a large extent on the chemical and metal industry present in each country.
The comparison of exposure by expert judge-ment in Montreal with FINJEM estimates revealed several circumstances where exposure was null in FINJEM but not in Montreal and we believe that there are several occupational groups for which the FINJEM exposure assess-ment needs to be reviewed. We explored differ-ent approaches to resolving these differences. However, due to the lack of an appropriate basis for estimating occupation-specific preva-lence on the one hand and the lack of the data necessary to establish a reasonable estimate for
by guest on May 22, 2016
http://annhyg.oxfordjournals.org/D
ownloaded from
Assessing occupational exposure to chemicals 625
level of exposure on the other, it was agreed that further work would be required to address this question. It would be extremely valuable to explore other sources of exposure data such as CAREX (Kauppinen et al., 2000) and the SYNERGY JEM (Peters et al., 2012) to fill these potentials gaps in FINJEM.
Both FINJEM and the INTEROCC JEM use the P equal to or greater than 5% as a threshold to assign exposure. For example, if in a given occupational code fewer than 5% of the workers are exposed to an agent, then that occupation is considered unexposed. However, it should be noted that different definitions of exposure can be derived from the estimates of P for risk analyses. Theoretical calculations indicate that high specificity (i.e. avoiding false positive exposure assignments) is important in reducing the misclassification bias when the prevalence of exposure is low (Flegal et al., 1986). As the FINJEM and INTEROCC JEM have assigned both a P (proportion of workers exposed) and I (intensity of exposure), the sen-sitivity and specificity can be modified by using different exposure cut-off points. For example, by using P as a means of defining exposure, a higher specificity can be achieved by assigning exposure only to those occupations where P is high (e.g. 50%). In addition, a recent paper by Burstyn et al. (2012) refers to aggregation bias when using JEMs that provide a proportion of exposed workers as well as an intensity (as is the case in FINJEM and INTEROCC JEM). The aggregation bias is caused by the fact that each occupational code includes both exposed and non-exposed workers. Simulations dem-onstrated that under certain conditions, bias in odds ratios away from the null is possible (Burstyn et al., 2012). The advantage of both the FINJEM and INTEROCC JEM is that these JEMs can be applied in a flexible manner with different cut-off points for P to define the exposed category to try to minimize bias.
Finally, although the ISCO68 occupational clas-sification system remains one of the best available international systems for occupational epidemio-logical studies, despite its limitations compared to more detailed systems such as the two versions of the Dictionary of Occupational Titles used in Canada and the USA from the 1970s, it is becom-ing out of date. There is an urgent need to develop an updated international classification of occupa-tions, which is appropriate for use in cancer epide-miological studies.
SuppLEMEnTAry dATA
Supplementary data can be found at http://annhyg.oxfordjournals.org/.
FundIng
National Institutes for Health (1R01CA124759-01). The INTERPHONE study was sup-ported by funding from the European Fifth Framework Program, ‘Quality of Life and Management of Living Resources’ (contract 100 QLK4-CT-1999901563) and the International Union against Cancer (UICC). The UICC received funds for this purpose from the Mobile Manufacturers’ Forum and GSM Association. In Australia, funding was received from the Australian National Health and Medical Research Council (EME Grant 219129) with funds origi-nally derived from mobile phone service licence fees, a University of Sydney Medical Foundation Program, the Cancer Council NSW, and the Cancer Council Victoria. In Canada, fund-ing was received from the Canadian Institutes of Health Research (project MOP-42525), the Canada Research Chair programme, the Guzzo-CRS Chair in Environment and Cancer, the Fonds de la recherche en sante du Quebec, the Canadian Institutes of Health Research (CIHR), the latter including partial support from the Canadian Wireless Telecommunications Association, the NSERC/SSHRC/McLaughlin Chair in Population Health Risk Assessment at the University of Ottawa. In France, funding was received from l’Association pour la Recherche sur le Cancer (ARC) (Contract N85142) and three network operators (Orange, SFR, and Bouygues Telecom). In Germany, funding was received from the German Mobile Phone Research Program (Deutsches Mobilfunkforschungsprogramm) of the German Federal Ministry for the Environment, Nuclear 45 Safety, and Nature Protection, the Ministry for the Environment and Traffic of the state of Baden- Wurttemberg, the Ministry for the Environment of the state of North Rhine-Westphalia, the MAIFOR Program (Mainzer Forschungsforderungsprogramm) of the University of Mainz. In New Zealand, fund-ing was provided by the Health Research Council, Hawkes Bay Medical Research Foundation, the Wellington Medical Research Foundation, the Waikato Medical Research Foundation, and the Cancer Society of New Zealand. Additional funding for the UK study was received from the
by guest on May 22, 2016
http://annhyg.oxfordjournals.org/D
ownloaded from

626 M. van Tongeren et al.
Mobile Telecommunications, Health and Research (MTHR) program, funding from the Health and Safety Executive, the Department of Health, the UK Network Operators (O2, Orange, T-Mobile, Vodafone, and ‘3’), and the Scottish Executive.
Acknowledgements—The authors would like to thank Anne Sleeuwenhoek (UK), Martine Hours (France), Avital Jarus-Hakak (Israel), Louise Nadon (Canada), and Florence Samkange-Zeeb (Germany) who coded the occu-pations and assisted in the data clean-up and John Cherrie for reviewing the manuscript. We are grateful to Drs Bruce Armstrong (Australia), Maria Blettner (Germany), Joachim Schuz (Germany), and Alistair Woodword for the use of the occupational data from their INTERPHONE study centres for the INTEROCC project.
rEFErEnCES
Breslow NE, Day NE. (1987) Statistical methods in cancer research. Vol. II. The design and analysis of cohort stud-ies. Lyon: International Agency for Research on Cancer.
Burstyn I, Lavoué J, Van Tongeren M. (2012) Aggregation of exposure level and probability into a single metric in job-exposure matrices creates bias. Ann Occup Hyg; 56: 1038–50.
Cardis E, Richardson L, Deltour I et al. (2007) The INTERPHONE study: design, epidemiological meth-ods, and description of the study population. Eur J Epidemiol; 22: 647–64.
Castro D, Slezakova K, Delerue-Matos C et al. (2011) Polycyclic aromatic hydrocarbons in gas and particulate phases of indoor environments influenced by tobacco smoke: levels, phase distributions, and health risks. Atmos Environ; 45: 1799–808.
Dick FD, Semple SE, van Tongeren M et al. (2010) Development of a task-exposure matrix (TEM) for pesti-cide use (TEMPEST). Ann Occup Hyg; 54: 443–52.
Dryver E, Brandt L, Kauppinen T et al. (2004) Occupational exposures and non-Hodgkin’s lymphoma in southern Sweden. Int J Occup Environ Health; 10: 13–21.
Flegal KM, Brownie C, Haas JD. (1986) The effects of exposure misclassification on estimates of relative risk. Am J Epidemiol; 123: 736–51.
Fritschi L, Sadkowsky T, Benke GP et al. (2012) Triaging jobs in a community-based case-control study to increase efficiency of the expert occupational assessment method. Ann Occup Hyg; 56: 458–65.
Gotz NK, van Tongeren M, Wareing H et al. (2008) Changes in air quality and second-hand smoke exposure in hospi-tality sector businesses after introduction of the English smoke-free legislation. J Public Health (Oxf); 30: 421–8.
Karipidis KK, Benke G, Sim MR et al. (2007) Occupational exposure to ionizing and non-ionizing radiation and risk of non-Hodgkin lymphoma. Int Arch Occup Environ Health; 80: 663–70.
Kauppinen T, Uuksulainen S, Saalo A, Mäkinen I (2012) (2012) Trends of occupational exposure to chemical agents in Finland in 1950-2020. Ann Occup Hyg; 57: 593–609.
Kauppinen T, Heikkila P, Plato N et al. (2009) Construction of job-exposure matrices for the Nordic Occupational Cancer Study (NOCCA). Acta Oncol; 48: 791–800.
Kauppinen T, Toikkanen J, Pedersen D et al. (2000) Occupational exposure to carcinogens in the European Union. Occup Environ Med; 57: 10–8.
Kauppinen T, Toikkanen J, Pukkala E. (1998) From cross-tabulations to multipurpose exposure information sys-tems—a new job-exposure matrix. Am J Ind Med; 33: 409–17.
Khuder SA, Mutgi AB, Schaub EA. (1998) Meta-analyses of brain cancer and farming. Am J Ind Med; 34: 252–60.
Lavoué J, Pintos J, Van Tongeren M et al. (2012) Comparison of exposure estimates in the Finnish job-exposure matrix FINJEM with a JEM derived from expert assessments performed in Montreal. Occup Environ Med; 69: 465–71.
Lee WJ, Colt JS, Heineman EF et al. (2005) Agricultural pesticide use and risk of glioma in Nebraska, United States. Occup Environ Med; 62: 786–92.
McLean D, van Tongeren M, Richardson L et al. (2011) Evaluation of the quality and comparability of job cod-ing across seven countries in the INTEROCC study. EPICOH 2011: 23rd International Conference on Epidemiology in Occupational Health. 7–9 September 2011. Oxford, UK: University of Oxford.
Peters S, Vermeulen R, Olsson A et al. (2012) Development of an exposure measurement database on five lung car-cinogens (ExpoSYN) for quantitative retrospective occu-pational exposure assessment. Ann Occup Hyg; 56: 70–9.
Provost D, Cantagrel A, Lebailly P et al. (2007) Brain tumours and exposure to pesticides: a case-control study in southwestern France. Occup Environ Med; 64: 509–14.
Semple S, Maccalman L, Naji AA et al. (2007) Bar workers’ exposure to second-hand smoke: the effect of Scottish smoke-free legislation on occupational exposure. Ann Occup Hyg; 51: 571–80.
Semple S, van Tongeren M, Galea KS et al. (2010) UK smoke-free legislation: changes in PM2.5 concentrations in bars in Scotland, England, and Wales. Ann Occup Hyg; 54: 272–80.
Siemiatycki J. (1991) Risk factors for cancer in the work-place. Boca Raton: CRC Press.
Siemiatycki J. (1996) Exposure assessment in community-based studies of occupational cancer. Occup Hyg; 3: 41–58.
Siemiatycki J, Nadon L, Lakhani R et al. (1991) Chapter 4. Exposure assessment. In Siemiatycki J, editor. Risk fac-tors for cancer in the workplace. Boca Raton: CRC Press.
Siemiatycki J, Richardson L, Straif K et al. (2004) Listing occupational carcinogens; see errata: 113 (2); A 89. Environ Health Perspect; 112: 1447–59.
Stewart PA, Lees PSJ, Francis M. (1996) Quantification of historical exposures in occupational cohort studies. Scand J Work Environ Health; 22: 405–14.
‘t Mannetje A, Kromhout H. (2003) The use of occupation and industry classifications in general population studies. Int J Epidemiol; 32: 419–28.
The INTERPHONE Study Group. (2010) Brain tumour risk in relation to mobile telephone use: results of the INTERPHONE international case-control study. Int J Epidemiol; 39: 675–94.
The INTERPHONE Study Group. (2011) Acoustic neu-roma risk in relation to mobile telephone use: results of the INTERPHONE international case-control study. Cancer Epidemiol; 35: 453–64.
by guest on May 22, 2016
http://annhyg.oxfordjournals.org/D
ownloaded from