Assessing Measurement Invariance of Export Market Orientation: A Study of Chinese and Non-Chinese...
23
41 Assessing Measurement Invariance of Export Market Orientation: A Study of Chinese and Non-Chinese Firms in China ABSTRACT Janet Y. Murray, Gerald Yong Gao, Masaaki Kotabe, and Nan Zhou Submitted February 2007 Accepted May 2007 Journal of International Marketing © 2007, American Marketing Association Vol. 15, No. 4, 2007, pp. 41–62 ISSN 1069-031X (print) 1547-7215 (electronic) In response to numerous calls for the cross-cultural validation of measures used in international research, the authors assess measurement invariance of the export market orientation (EMO) and export performance (EP) constructs using 491 Chi- nese and non-Chinese export ventures in China. The results show that both the EMO and the EP scales are invariant between Chinese and non-Chinese export ventures. In addition, different EMO components have differential effects on EP for Chinese versus non-Chinese firms. To achieve higher EP, Chi- nese firms should focus on export intelligence responsiveness, and non-Chinese firms should concentrate their efforts on export intelligence generation. The authors discuss implica- tions and suggest directions for further research. A firm’s sales growth is increasingly dependent on foreign markets, and exporting is the most common way to penetrate foreign markets. Thus, researchers have devoted much of their attention to developing a better understanding of the factors that influence export performance (EP) (Cadogan et al. 2001). They have cautioned that success in the domestic market does not guarantee success in foreign markets. Thus, it is imperative for firms to develop unique strategies (e.g., adopting market-oriented behaviors) to achieve desirable EP (Cavusgil and Zou 1994). Consequently, export market orien- tation (EMO) has become increasingly important as a major research stream in international business (Hurley and Hult 1998). Export market orientation involves the continuous monitoring of a firm’s customers, competitors, and market environments for the firm to develop and market the appro- priate goods and services that are valued by its customers in export markets (Cadogan et al. 2001; Kohli and Jaworski 1990; Narver and Slater 1990). Previous studies have suggested that there is a positive rela- tionship for both market orientation and EP (Kwon and Hu 2000; Rose and Shoham 2002) and EMO and EP (Akyol and Akehurst 2003; Diamantopoulos, Siguaw, and Cadogan 2000). However, other factors (e.g., cross-national differ- ences) may influence the relationships between EMO and EP (Diamantopoulos, Siguaw, and Cadogan 2000). Although there have been many efforts to examine measurement issues related to market orientation (Cadogan and Diamantopoulos
Transcript of Assessing Measurement Invariance of Export Market Orientation: A Study of Chinese and Non-Chinese...

41
Assessing Measurement Invariance ofExport Market Orientation: A Study ofChinese and Non-Chinese Firms in China
ABSTRACT
Janet Y. Murray,Gerald Yong Gao,Masaaki Kotabe, andNan Zhou
Submitted February 2007Accepted May 2007
Journal of International Marketing© 2007, American Marketing AssociationVol. 15, No. 4, 2007, pp. 41–62ISSN 1069-031X (print)
1547-7215 (electronic)
In response to numerous calls for the cross-cultural validationof measures used in international research, the authors assessmeasurement invariance of the export market orientation(EMO) and export performance (EP) constructs using 491 Chi-nese and non-Chinese export ventures in China. The resultsshow that both the EMO and the EP scales are invariantbetween Chinese and non-Chinese export ventures. In addition,different EMO components have differential effects on EP forChinese versus non-Chinese firms. To achieve higher EP, Chi-nese firms should focus on export intelligence responsiveness,and non-Chinese firms should concentrate their efforts onexport intelligence generation. The authors discuss implica-tions and suggest directions for further research.
A firm’s sales growth is increasingly dependent on foreignmarkets, and exporting is the most common way to penetrateforeign markets. Thus, researchers have devoted much oftheir attention to developing a better understanding of thefactors that influence export performance (EP) (Cadogan etal. 2001). They have cautioned that success in the domesticmarket does not guarantee success in foreign markets. Thus,it is imperative for firms to develop unique strategies (e.g.,adopting market-oriented behaviors) to achieve desirable EP(Cavusgil and Zou 1994). Consequently, export market orien-tation (EMO) has become increasingly important as a majorresearch stream in international business (Hurley and Hult1998). Export market orientation involves the continuousmonitoring of a firm’s customers, competitors, and marketenvironments for the firm to develop and market the appro-priate goods and services that are valued by its customers inexport markets (Cadogan et al. 2001; Kohli and Jaworski1990; Narver and Slater 1990).
Previous studies have suggested that there is a positive rela-tionship for both market orientation and EP (Kwon and Hu2000; Rose and Shoham 2002) and EMO and EP (Akyol andAkehurst 2003; Diamantopoulos, Siguaw, and Cadogan2000). However, other factors (e.g., cross-national differ-ences) may influence the relationships between EMO and EP(Diamantopoulos, Siguaw, and Cadogan 2000). Althoughthere have been many efforts to examine measurement issuesrelated to market orientation (Cadogan and Diamantopoulos

42 Janet Y. Murray, Gerald Yong Gao, Masaaki Kotabe, and Nan Zhou
1995; Matsuno, Mentzer, and Rentz 2000; Oczkowski andFarrell 1998), the psychometric properties of the EMO scaleare underresearched. Although many scholars have madevaluable contributions to the extant literature on EMO, theyhave mostly surveyed firms from a single country, and themajority of studies have examined firms from Western cul-tures. Although EMO measures have been shown to beinvariant across samples of Western firms (e.g., Cadogan,Diamantopoulos, and De Mortanges 1999; Cadogan et al.2001), such examination has yet to be made on non-Westernfirms. This represents a significant research gap regardingthe need for examining EMO using firms from emergingeconomies, such as China. Furthermore, without evidenceon the cross-national invariance of EMO measures in theemerging economy context, knowledge about the relativeimportance of EMO on EP to firms from developed versusdeveloping countries is impeded.
Before cross-cultural findings of the EMO–EP relationshipcan be compared, it is necessary to determine whether meas-urement invariance of EMO and EP exists across countries.Measurement invariance represents “whether or not, underdifferent conditions of observing and studying phenomena,measurement operations yield measures of the same attrib-ute” (Horn and McArdle 1992, p. 117). Establishing measure-ment invariance of constructs in cross-cultural researchinvolves the assessment of configural invariance, metricinvariance, scalar invariance, factor covariance invariance,factor variance invariance, and error variance invariance(Steenkamp and Baumgartner 1998). If evidence in supportof measurement invariance of EMO and EP is lacking, con-clusions regarding cross-national differences on the EMO–EPrelationship can be ambiguous or erroneous. In such a case,“cross-national differences in scale means might be due totrue differences between countries on the underlying con-struct or due to systematic biases in the way people from dif-ferent countries respond to certain items” (Steenkamp andBaumgartner 1998, p. 78). Despite numerous calls for thecross-cultural validation of measures used in internationalresearch, they have been mostly unanswered (Netemeyer,Durvasula, and Lichtenstein 1991).
We contribute to the literature on EMO by assessing themeasurement invariance of EMO and EP using firms fromdifferent countries, including those from Eastern and West-ern cultures. In addition, we investigate whether there aresignificant cross-cultural differences in the EMO–EP rela-tionship. Specifically, we surveyed Chinese (i.e., domestic)and non-Chinese (i.e., foreign firms from the United States,Europe, Japan, and Hong Kong) manufacturing firms inChina that export products from China. Although Hong Kongbecame a SAR (special administrative region) of China effec-
43Measurement Invariance of Export Market Orientation
tive on July 1, 1997, firms from Hong Kong are treated as for-eign firms. Thus, firms from Hong Kong are subject to differ-ent trade and investment policies than those imposed onmainland Chinese firms, and their investments in China areclassified as foreign direct investment. Consequently, weclassify firms from Hong Kong as non-Chinese firms.
We selected China as our research context because China isinarguably the most important manufacturing location forboth Chinese and non-Chinese firms. A key reason for theincreasing number of foreign firms manufacturing in Chinais not only to market products in China but also to exportthem to other foreign markets. For example, one of the topten exporters in China is Motorola. As global competitionhas become increasingly intense, it is imperative for bothChinese and foreign firms to devote more attention to EMO.To the best of our knowledge, no studies have investigatedwhether measurement invariance of EMO and EP existswhen surveying both domestic and foreign firms in a singlecountry or in China. This is an important oversight becauseconstruct equivalence cannot be assumed to exist as long asdomestic and foreign firms are located in the same country.As multinational corporations’ parents often affect both themind-set and the strategy development of their foreign sub-sidiaries substantially, the psychometric properties of a scalemay vary between domestic and foreign firms, even whenthey are located in the same country. Likewise, Samiee andAthanassiou (1998, p. 85) stress that “[c]ross-culturalresearch issues are of critical importance not only when thedata are collected from two or more cultures but also whenconstructs under investigation represent management per-ceptions that span national or cultural boundaries.” Thus,cross-cultural methodology considerations are necessaryeven though data collection is conducted in one culture. Webelieve that we can make significant contributions to theinternational marketing literature by assessing both cross-cultural measurement invariance of EMO and EP in a single-country context and the cross-cultural differences of theEMO–EP relationship.
Despite the significant impact of EMO on a firm’s EP, EMOhas received limited research attention (Akyol and Akehurst2003; Diamantopoulos, Siguaw, and Cadogan 2000). Weadopt the measure of EMO developed in previous studies(Cadogan, Diamantopoulos, and Siguaw 2002; Cadogan et al.2001), which consists of three components: export intelli-gence generation, export intelligence dissemination, andexport intelligence responsiveness. Export intelligence gen-eration involves generating export intelligence by exportstaff and other departments or functions and includes allactivities that constitute the creation of export market intelli-gence and that are focused on export customers, competitors,
EXAMINING THE EMO–EPRELATIONSHIP
Dimensions of EMO

44 Janet Y. Murray, Gerald Yong Gao, Masaaki Kotabe, and Nan Zhou
or environmental changes that affect the firm, its customers,and its competitors. Export intelligence disseminationinvolves disseminating export intelligence among exportstaff, between export staff and other departments (e.g., mar-keting or research and development), or throughout the firm.It includes all activities that involve the sharing of exportmarket intelligence and that are focused on export cus-tomers, competitors, or environmental changes that affect thefirm, its customers, and its competitors. Export intelligenceresponsiveness involves the design and implementation ofall responses to the generated and disseminated intelligence.These responses are directed toward export customers, com-petitors, or environmental changes that affect the firm, itscustomers, and its competitors (Cadogan, Diamantopoulos,and De Mortanges 1999).
As we mentioned previously, despite numerous calls for thecross-national validation of measures used in internationalresearch, they have been mostly unanswered (Netemeyer,Durvasula, and Lichtenstein 1991). A key concern in extend-ing theories and their associated constructs to other coun-tries is whether the instruments designed to measure thefocal constructs are cross-nationally invariant (Hui andTriandis 1985). “If evidence supporting a measure’s invari-ance is lacking, conclusions based on that scale are at bestambiguous and at worst erroneous” (Steenkamp and Baum-gartner 1998, p. 78). In assessing measurement invariance incross-cultural research, it is necessary to assess the config-ural invariance, metric invariance, scalar invariance, factorcovariance invariance, factor variance invariance, and errorvariance invariance (Steenkamp and Baumgartner 1998).
Configural invariance assesses whether the same pattern offactor loadings exists across different countries. Metricinvariance assesses whether the factor loadings are identicalfor each scale item across countries. If an item has metricinvariance, meaningful cross-national comparisons can bemade based on the different scores of the item because the “observed item differences are indicative of similarcross-national differences in the underlying construct”(Steenkamkp and Baumgartner 1998, p. 80). Scalar invari-ance examines whether there is consistency between cross-country differences in latent versus observed means byimposing equal intercept constraints. Factor covarianceinvariance assesses whether the correlations among factorsare equal. Factor variance invariance and error varianceinvariance examine whether the factor loadings and errorvariances are identical for each scale item across countries,respectively. If items are metrically invariant and if the factorvariances and error variances are cross-nationally invariant,the items are equally reliable across countries (Steenkampand Baumgartner 1998).
Measurement Invariance ofEMO and EP

45Measurement Invariance of Export Market Orientation
Although cross-cultural validation has been made on EMO,it was performed using U.K. and Dutch exporters (Cadogan,Diamantopoulos, and De Mortanges 1999). To the best of ourknowledge, no studies have examined the issue of the meas-urement invariance of EMO and EP using firms from Easternand Western cultures. Although Cadogan, Diamantopoulos,and De Mortanges (1999, p. 698) find that measurementinvariance exists between U.K. and Dutch exporters andtheir “results provide strong evidence of the cross-culturalstability of the [EMO] scale,” it may or may not be the casebetween firms from Eastern and Western cultures. Likewise,EMO’s measurement invariance may or may not hold for Chi-nese and non-Chinese firms (i.e., foreign firms from theUnited States, Europe, Japan, and Hong Kong) exportingfrom China. Thus, our research aim is twofold. First, weexamine whether the EMO and EP scales have measurementinvariance between Chinese and non-Chinese firms operat-ing in mainland China. Second, we investigate whether theeffect of EMO on EP is significantly different between thesetwo groups of firms.
Because no secondary data are available at the export ven-ture level, we collected primary data from both domestic(i.e., Chinese) and foreign (i.e., non-Chinese) firms operatingin China that had export ventures; all foreign firms had amajority ownership and control in their subsidiaries. Anational market research firm was commissioned for the datacollection. A sample of 1314 firms located in Beijing, Shang-hai, Jiangsu, and Guangdong was drawn from the 2002 Direc-tory of Exporters in China. Respondents were key informantswho had knowledge of and access to the type of data neededfor the study. We developed the questionnaire using theback-translation process. Then, we pilot-tested the question-naire to determine the face validity, clarity, and relevance ofthe measures. We requested the market research firm toscreen firms carefully in light of our study objectives and toidentify the key informants through telephone calls beforescheduling on-site interviews. Using on-site interviews, atrained interviewer scheduled appointments, presented thekey informants with the questionnaire, answered generalquestions, and collected the completed questionnaire. Wefollowed the strategy used in previous studies (see Stumpand Heide 1996) to minimize the potential for retrospectivebiases. We asked informants to concentrate on one majorproduct their firms currently exported when responding tothe survey.
We obtained usable responses from 491 export ventures,which consisted of 240 Chinese firms (i.e., 100%-ownedmainland Chinese firms) and 250 non-Chinese firms (i.e., 65U.S., 64 European, 61 Japanese, and 61 Hong Kong firms). Ofthe 491 firms surveyed, we randomly selected 48 firms and
METHOD
Study Context and Sample

46 Janet Y. Murray, Gerald Yong Gao, Masaaki Kotabe, and Nan Zhou
interviewed two executives from each firm to reduce randomerrors of measurement by using the multi-informant tech-nique (Van Bruggen, Lilien, and Kacker 2002). Atuahene-Gima and Murray (2004) also use this approach in attempt-ing to control for common method bias by encouragingrespondents to seek multiple responses to the questionnaire.Then, we computed the rWG(J) index to test the interrespon-dent reliability of measures (James, Demaree, and Gerrit1984; LeBreton, James, and Lindell 2005). The rWG(J) valuesranged from .77 to .93, well above the .70 benchmark (George1990). Therefore, we used the mean scores of the two respon-dents to measure the aggregate perceptions for these 48export ventures in our analysis. In our sample, non-Chinesefirms were all majority owned and/or controlled by foreignfirms; specifically, 61.4% of the foreign firms had 100%ownership, and the breakdown of the remaining foreignfirms’ ownership was 5.2% with 90%–99% or more owner-ship, 8.8% with 70%–89% ownership, 17.2% with 51%–69% ownership, and 7.6 with 50% ownership. We assessedpotential nonresponse bias by comparing responding andnonresponding firms on firm characteristics, includingexport experience, export sales revenue, total sales revenue,export sales revenues percentage, and number of exportcountries. The results show that responding firms did notdiffer significantly from nonresponding firms (t-valuesranged from –.37 to .78), which suggests that nonresponsebias is unlikely to exist for this study.
We adopted the measure of EMO developed in previousstudies (Cadogan, Diamantopoulos, and De Mortanges 1999;Cadogan, Diamantopoulos, and Siguaw 2002; Cadogan et al.2001). The three components of EMO are export intelligencegeneration, export intelligence dissemination, and exportintelligence responsiveness. Export intelligence generationis measured by five items, including a firm’s activities in cre-ating intelligence about customers, competitors, technology,and other environmental changes; we dropped one item dur-ing item purification because of low factor loading (for thedropped item, see the Appendix). Export intelligence dis-semination has five items that assess a firm’s activities insharing export market intelligence among export staff andthe entire firm; we dropped one item during item purifica-tion because of low factor loading (for the dropped item, seethe Appendix). Export intelligence responsiveness consistsof three items that represent a firm’s ability to design andrespond to the generated intelligence. As Jarvis, MacKenzie,and Podsakoff (2003) suggest, EMO can be treated as first-order reflective factors and a second-order formative factor.In this study, we test measurement invariance of EMO andexamine the effects of different components of EMO. There-fore, we used the three-independent-factor structure.
Measures

47Measurement Invariance of Export Market Orientation
We adopted measures of EP from Zou, Taylor, and Osland’s(1998) study. We measured financial performance with threeitems: profit level, sales volume, and growth rate. Satisfac-tion with export venture consists of three items that reflectthe satisfaction level of a firm’s management team. High lev-els of perceived success and satisfaction can enhance firms’commitment to the export market and increase firms’ exportpropensity (Zou, Taylor, and Osland 1998). We present theitems of EMO and EP in the Appendix.
We refined the measures and assessed the construct reliabil-ity and validity for both Chinese and non-Chinese samples,following a two-step approach that Anderson and Gerbing(1988) recommend. We ran exploratory factor analyses foreach of the samples, followed by confirmatory factor analy-ses. The results show that our measurement models fit thedata satisfactorily.
To assess the validity of the measures, we estimated a confir-matory factor analysis measurement model with three inde-pendent EMO factors and two EP factors. Researchers havecautioned that chi-square tests (and chi-square differencetests) should not be relied on exclusively to evaluate modelfit (Anderson and Gerbing 1988; Steenkamp and Baumgart-ner 1998). Therefore, we used the following fit indexes: chi-square statistic (χ2), incremental fit index (IFI), Tucker–Lewis index (TLI), comparative fit index (CFI), and rootmean square error of approximation (RMSEA). The chi-square statistic can be regarded as a “badness-of-fit” measurein that a small, nonsignificant chi-square corresponds to agood fit (Jöreskog and Sörbom 1993). The IFI and CFI bothrepresent comparisons between the estimated model and anull or independence model; values lie between 0 and 1, andlarger values indicate better goodness of fit (Hair et al. 1998).Unlike the CFI, the TLI considers degrees of freedom; a scorehigher than .90 is considered an indication of a good fit.Similar to the chi-square statistic, the RMSEA is a badness-of-fit measure; the lower the RMSEA score, the better is themodel fit. Values ranging from .05 to .08 are consideredacceptable (Hair et al. 1998).
For the Chinese sample, the model provided acceptable fit tothe data: χ2(109) = 141.82, p < .00; IFI = .98; TLI = .98; CFI =.98; and RMSEA = .04. We obtained similar results for thenon-Chinese firms: χ2(109) = 202.03, p < .00; IFI = .96; TLI =.94; CFI = .96; and RMSEA = .06. For both Chinese and non-Chinese samples, the factor loadings for each individualindicator on its respective constructs are also statisticallysignificant (p < .001), in support of the dimensionality of theconstructs. The composite reliabilities of each constructrange from .78 to .87, exceeding the usual .70 benchmark(Bagozzi and Yi 1988). Thus, the measure of EMO demon-
ANALYSIS AND RESULTS
Reliability and Validity
48 Janet Y. Murray, Gerald Yong Gao, Masaaki Kotabe, and Nan Zhou
strates adequate convergent validity and reliability for Chi-nese and non-Chinese samples.
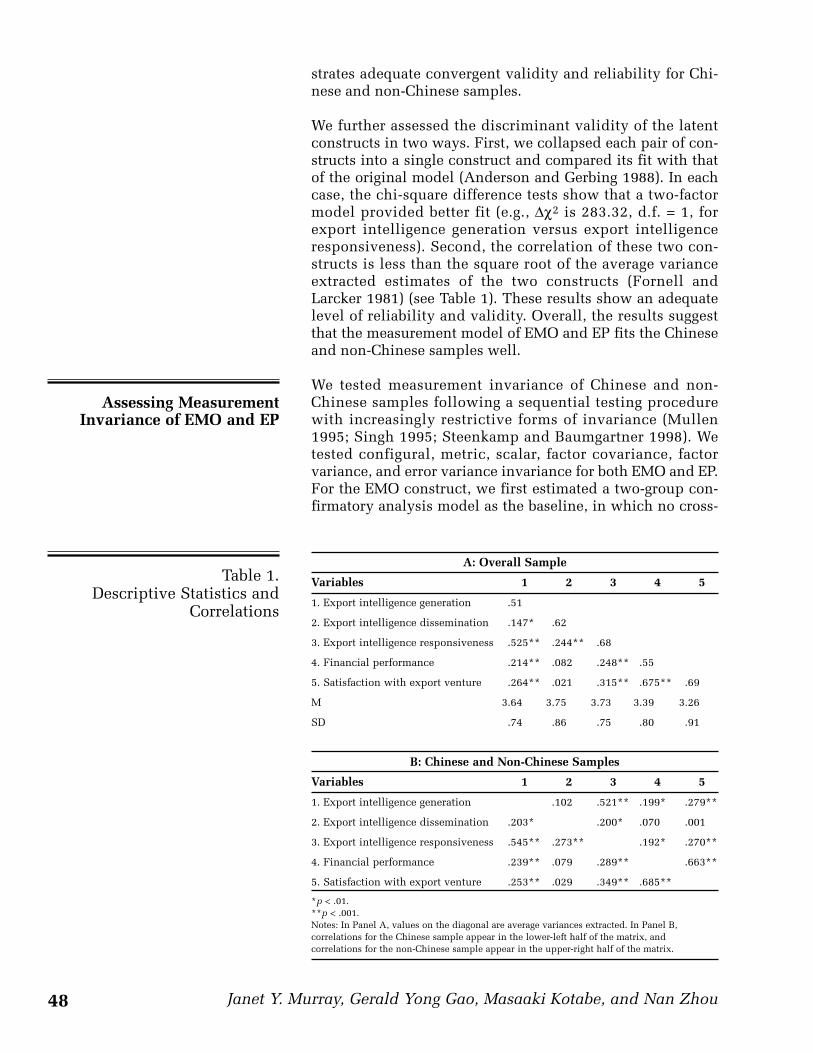
We further assessed the discriminant validity of the latentconstructs in two ways. First, we collapsed each pair of con-structs into a single construct and compared its fit with thatof the original model (Anderson and Gerbing 1988). In eachcase, the chi-square difference tests show that a two-factormodel provided better fit (e.g., Δχ2 is 283.32, d.f. = 1, forexport intelligence generation versus export intelligenceresponsiveness). Second, the correlation of these two con-structs is less than the square root of the average varianceextracted estimates of the two constructs (Fornell andLarcker 1981) (see Table 1). These results show an adequatelevel of reliability and validity. Overall, the results suggestthat the measurement model of EMO and EP fits the Chineseand non-Chinese samples well.
We tested measurement invariance of Chinese and non-Chinese samples following a sequential testing procedurewith increasingly restrictive forms of invariance (Mullen1995; Singh 1995; Steenkamp and Baumgartner 1998). Wetested configural, metric, scalar, factor covariance, factorvariance, and error variance invariance for both EMO and EP.For the EMO construct, we first estimated a two-group con-firmatory analysis model as the baseline, in which no cross-
Assessing MeasurementInvariance of EMO and EP
Table 1.Descriptive Statistics and
Correlations
A: Overall Sample
Variables 1 2 3 4 5
1. Export intelligence generation .51
2. Export intelligence dissemination .147* .62
3. Export intelligence responsiveness .525** .244** .68
4. Financial performance .214** .082 .248** .55
5. Satisfaction with export venture .264** .021 .315** .675** .69
M 3.64 3.75 3.73 3.39 3.26
SD .74 .86 .75 .80 .91
B: Chinese and Non-Chinese Samples
Variables 1 2 3 4 5
1. Export intelligence generation .102 .521** .199* .279**
2. Export intelligence dissemination .203* .200* .070 .001
3. Export intelligence responsiveness .545** .273** .192* .270**
4. Financial performance .239** .079 .289** .663**
5. Satisfaction with export venture .253** .029 .349** .685**
*p < .01.**p < .001.Notes: In Panel A, values on the diagonal are average variances extracted. In Panel B,correlations for the Chinese sample appear in the lower-left half of the matrix, andcorrelations for the non-Chinese sample appear in the upper-right half of the matrix.

49Measurement Invariance of Export Market Orientation
group factor constraint was imposed. As Table 2 reports, theresults show that the two-group model with free factor load-ings fit the data well: χ2(82) = 165.78, p < .00; IFI = .97; TLI =.96; CFI = .97; and RMSEA = .05. The results show that theEMO construct exhibits configural invariance between thetwo samples.
We then analyzed a two-group model to test metric invari-ance to examine whether the factor loadings are identical foreach scale item between the samples. We constrained all thefactor loadings to be equal between the Chinese and the non-Chinese samples. The estimation results suggest that thistwo-group model also fits the data well: χ2(90) = 169.94, p <.00; IFI = .97; TLI = .96; CFI = .97; and RMSEA = .04. Thecondition of metric equivalence represents an increasingdegree of measurement invariance compared with configuralequivalence, and this model is hierarchically nested on thebaseline model. Therefore, we conducted a chi-square differ-ence test to compare which model fits the data better (Δχ2 =4.16, d.f. = 8). The result was not significant. Thus, we con-clude that this two-group model of factor loading constraintsfits the data equally as well as the baseline model, and it sup-ports the metric equivalence of the EMO construct.
Next, we tested for the scalar invariance. In this model, weconstrained all factor loadings and intercepts to be equalbetween the Chinese and the non-Chinese samples. As Table2 shows, this two-group model fits the data well: χ2(98) =178.29, p < .00; IFI = .97; TLI = .96; CFI = .97; and RMSEA =.04. We conducted a chi-square difference test to determinewhether this model fits the data better than the second modelwith only factor loading constraints (Δχ2 = 8.35, d.f. = 8).Again, the result was not significant. Therefore, scalar invari-ance is supported.
The two-group model fits the data well after we added con-straints of factor covariance invariance: χ2(101) = 180.70, p <.00; IFI = .97; TLI = .97; CFI = .97; and RMSEA = .04. A chi-
Table 2.Model Comparisons forMeasurement of EMO
χ2 Value d.f.χ2
Difference RMSEA IFI TLI CFI
Configuralinvariance 165.78 82 — .05 .97 .96 .97
Metric invariance 169.94 90 4.16 .04 .97 .96 .97
Scalar invariance 178.29 98 8.35 .04 .97 .96 .97
Factor covarianceinvariance 180.70 101 2.41 .04 .97 .97 .97
Factor varianceinvariance 184.71 104 4.01 .04 .97 .97 .97
Error varianceinvariance 201.14 115 16.43 .04 .97 .97 .97
50 Janet Y. Murray, Gerald Yong Gao, Masaaki Kotabe, and Nan Zhou
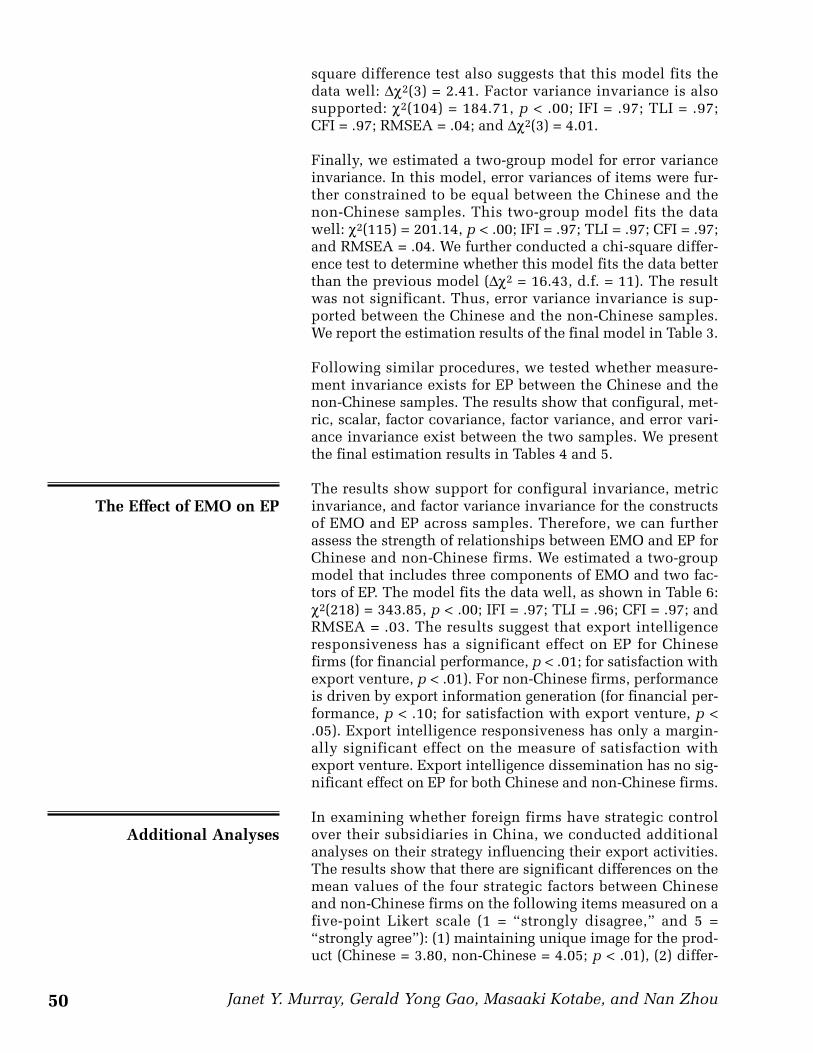
square difference test also suggests that this model fits thedata well: Δχ2(3) = 2.41. Factor variance invariance is alsosupported: χ2(104) = 184.71, p < .00; IFI = .97; TLI = .97;CFI = .97; RMSEA = .04; and Δχ2(3) = 4.01.
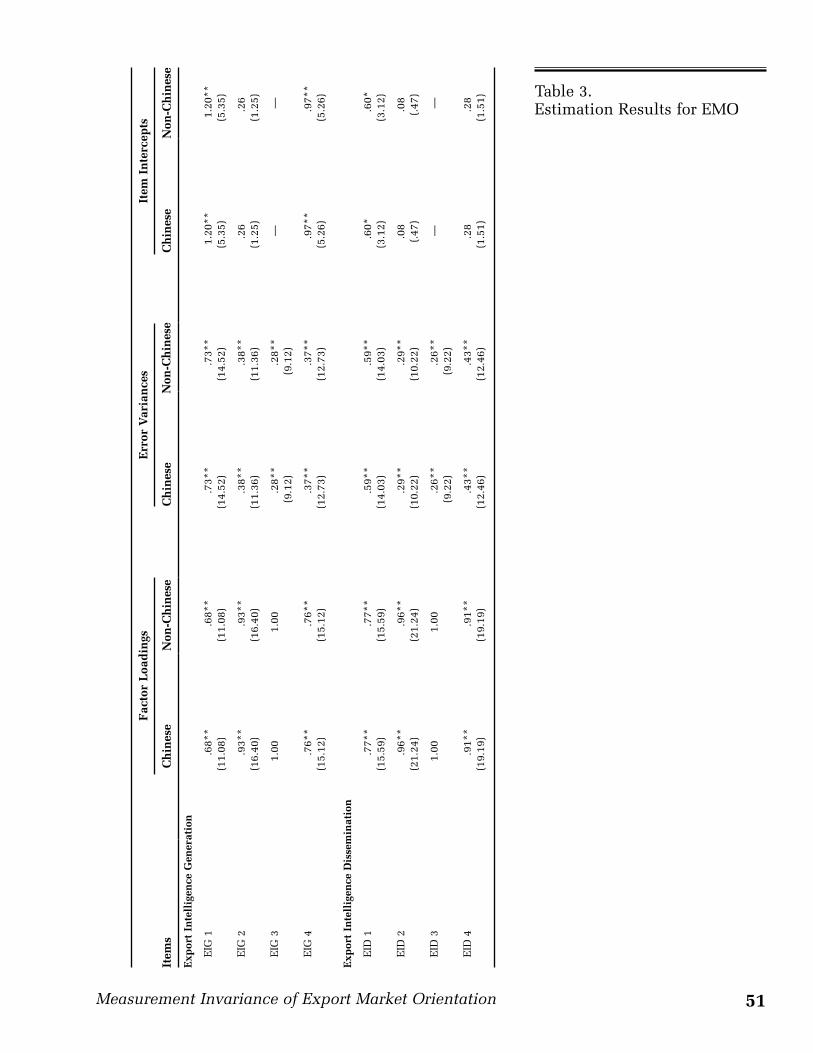
Finally, we estimated a two-group model for error varianceinvariance. In this model, error variances of items were fur-ther constrained to be equal between the Chinese and thenon-Chinese samples. This two-group model fits the datawell: χ2(115) = 201.14, p < .00; IFI = .97; TLI = .97; CFI = .97;and RMSEA = .04. We further conducted a chi-square differ-ence test to determine whether this model fits the data betterthan the previous model (Δχ2 = 16.43, d.f. = 11). The resultwas not significant. Thus, error variance invariance is sup-ported between the Chinese and the non-Chinese samples.We report the estimation results of the final model in Table 3.
Following similar procedures, we tested whether measure-ment invariance exists for EP between the Chinese and thenon-Chinese samples. The results show that configural, met-ric, scalar, factor covariance, factor variance, and error vari-ance invariance exist between the two samples. We presentthe final estimation results in Tables 4 and 5.
The results show support for configural invariance, metricinvariance, and factor variance invariance for the constructsof EMO and EP across samples. Therefore, we can furtherassess the strength of relationships between EMO and EP forChinese and non-Chinese firms. We estimated a two-groupmodel that includes three components of EMO and two fac-tors of EP. The model fits the data well, as shown in Table 6:χ2(218) = 343.85, p < .00; IFI = .97; TLI = .96; CFI = .97; andRMSEA = .03. The results suggest that export intelligenceresponsiveness has a significant effect on EP for Chinesefirms (for financial performance, p < .01; for satisfaction withexport venture, p < .01). For non-Chinese firms, performanceis driven by export information generation (for financial per-formance, p < .10; for satisfaction with export venture, p <.05). Export intelligence responsiveness has only a margin-ally significant effect on the measure of satisfaction withexport venture. Export intelligence dissemination has no sig-nificant effect on EP for both Chinese and non-Chinese firms.
In examining whether foreign firms have strategic controlover their subsidiaries in China, we conducted additionalanalyses on their strategy influencing their export activities.The results show that there are significant differences on themean values of the four strategic factors between Chineseand non-Chinese firms on the following items measured on afive-point Likert scale (1 = “strongly disagree,” and 5 =“strongly agree”): (1) maintaining unique image for the prod-uct (Chinese = 3.80, non-Chinese = 4.05; p < .01), (2) differ-
The Effect of EMO on EP
Additional Analyses
51Measurement Invariance of Export Market Orientation
Table 3.Estimation Results for EMO
Fac
tor
Loa
din
gsE
rror
Var
ian
ces
Item
In
terc
epts
Item
sC
hin
ese
Non
-Ch
ines
eC
hin
ese
Non
-loc
alC
hin
ese
Non
-Ch
ines
e
Exp
ort
Inte
llig
ence
Gen
erat
ion
EIG
1.6
8**
(11.
08)
.68*
*(1
1.08
).7
3**
(14.
52)
.73*
*(1
4.52
)1.
20**
(5.3
5)1.
20**
(5.3
5)
EIG
2.9
3**
(16.
40)
.93*
*(1
6.40
).3
8**
(11.
36)
.38*
*(1
1.36
).2
6(1
.25)
.26
(1.2
5)
EIG
31.
001.
00.2
8**
(9.1
2).2
8**
(9.1
2)—
—
EIG
4.7
6**
(15.
12)
.76*
*(1
5.12
).3
7**
(12.
73)
.37*
*(1
2.73
).9
7**
(5.2
6).9
7**
(5.2
6)
Exp
ort
Inte
llig
ence
Dis
sem
inat
ion
EID
1.7
7**
(15.
59)
.77*
*(1
5.59
).5
9**
(14.
03)
.59*
*(1
4.03
).6
0*(3
.12)
.60*
(3.1
2)
EID
2.9
6**
(21.
24)
.96*
*(2
1.24
).2
9**
(10.
22)
.29*
*(1
0.22
).0
8(.
47)
.08
(.47
)
EID
31.
001.
00.2
6**
(9.2
2).2
6**
(9.2
2)—
—
EID
4.9
1**
(19.
19)
.91*
*(1
9.19
).4
3**
(12.
46)
.43*
*(1
2.46
).2
8(1
.51)
.28
(1.5
1)
Non
-Ch
ines
e

52 Janet Y. Murray, Gerald Yong Gao, Masaaki Kotabe, and Nan Zhou
Exp
ort
Inte
llig
ence
Res
pon
sive
nes
s
EIR
1.9
1**
(18.
12)
.91*
*(1
8.12
).3
6**
(13.
09)
.36*
*(1
3.09
).3
1(1
.64)
.31
(1.6
4)
EIR
21.
001.
00.1
8**
(8.7
5).1
8**
(8.7
5)—
—
EIR
3.9
5**
(21.
55)
.95*
*(2
1.55
).1
7**
(8.9
5).1
7**
(8.9
5).2
4(1
.41)
.24
(1.4
1)
*p<
.01.
**p
< .0
01.
Not
es:t
-val
ues
are
in
par
enth
eses
.
Fac
tor
Loa
din
gsE
rror
Var
ian
ces
Item
In
terc
epts
Item
sC
hin
ese
Non
-Ch
ines
eC
hin
ese
Non
-loc
alC
hin
ese
Non
-Ch
ines
e
Table 3.Continued
Non
-Ch
ines
e

53Measurement Invariance of Export Market Orientation
entiating the product from other competitors (Chinese =3.50, non-Chinese = 3.81; p < .01), (3) acquiring internationalexperience for our firm (Chinese = 3.89, non-Chinese = 3.77;p < .10), and (4) compensating for increasing research-and-development costs (Chinese = 2.81, non-Chinese = 3.04; p <.05).
Market orientation has received a resurgent research interestsince the 1990s because of its pivotal role in the marketingfield (for a review, see Kirca, Jayachandran, and Bearden2005). However, research on market orientation has mainlybeen conducted in domestic settings, leaving the applicationof market orientation in international markets and the con-struct of EMO not fully researched. Since China formallyreopened its market in the late 1970s, numerous foreignfirms have set up manufacturing operations in China becauseof the high economic growth, huge market size, and lowlabor cost. Furthermore, China has become a worldwidesourcing and exporting platform for many multinationalfirms; therefore, the Chinese market provides an excellentresearch context to capture the complexity of the exportenvironment and to test the measurement invariance of EMOand EP. Our results suggest that the construct of EMO withthree components (export intelligence generation, exportintelligence dissemination, and export intelligence respon-siveness) has high levels of reliability and validity and there-fore offers a valid and reliable tool to investigate the effec-tiveness of EMO in transitional economies.
There are few studies examining the EMO–EP relationship intransitional economies (e.g., Akyol and Akehurst 2003). Inthe Chinese market, export ventures from different countriesof origin are competing among one another and also withlocal Chinese firms; therefore, whether EMO is a viable strat-egy represents an important question. Before we can test theEMO–EP relationship, we need to establish the measurementinvariance across firms from different countries. In thisstudy, we tested the cross-cultural measurement invariance
DISCUSSION
Table 4.Model Comparisons forMeasurement of EP
χ2 Value d.f.χ2
Difference RMSEA IFI TLI CFI
Configuralinvariance 26.11 16 — .04 .99 .99 .99
Metric invariance 28.76 20 2.65 .03 .99 .99 .99
Scalar invariance 32.10 24 3.34 .03 .99 .99 .99
Factor covarianceinvariance 32.50 25 .40 .03 .99 .99 .99
Factor varianceinvariance 33.89 27 1.39 .02 .99 .99 .99
Error varianceinvariance 41.37 33 7.49 .03 .99 .99 .99

54 Janet Y. Murray, Gerald Yong Gao, Masaaki Kotabe, and Nan Zhou
Fin
anci
al P
erfo
rman
ce
FP
1.6
6*(1
1.87
).6
6*(1
1.87
).7
1*(1
4.57
).7
1*(1
4.57
)1.
09*
(5.7
7)1.
09*
(5.7
7)
FP
2.8
8*(1
8.37
).8
8*(1
8.37
).3
0*(1
0.59
).3
0*(1
0.59
).5
7*(3
.46)
.57*
(3.4
6)
FP
31.
001.
00.2
7*(8
.71)
.27*
(8.7
1)—
—
Sat
isfa
ctio
n w
ith
Exp
ort
Ven
ture
SA
1.9
2*(2
1.16
).9
2*(2
1.16
).4
0*(1
2.36
).4
0*(1
2.36
).5
7*(4
.07)
.57*
(4.0
7)
SA
21.
001.
00.2
1*(8
.17)
.21*
(8.1
7)—
—
SA
3.9
0*(2
1.79
).9
0*(2
1.79
).3
4*(1
1.91
).3
4*(1
1.91
).4
8*(3
.66)
.48*
(3.6
6)
*p<
.001
.N
otes
:t-v
alu
es a
re i
n p
aren
thes
es.
Fac
tor
Loa
din
gsE
rror
Var
ian
ces
Item
In
terc
epts
Item
sC
hin
ese
Non
-Ch
ines
eC
hin
ese
Non
-loc
alC
hin
ese
Non
-Ch
ines
e
Table 5.Estimation Results for EP
Non
-Ch
ines
e

55Measurement Invariance of Export Market Orientation
of the EMO scale using a sample of Chinese and non-Chinese(i.e., foreign firms from the United States, Europe, Japan, andHong Kong) firms. We obtained support for measurementinvariance for both EMO and EP between Chinese and non-Chinese firms. Our findings indicate that the EMO constructmay represent the same management strategy for export ven-tures from different countries, and it can facilitate compari-son studies using cross-cultural samples.
Using the three-independent-factor structure of EMO, weshow that there are significant differences in the EMO–EPrelationship between Chinese and non-Chinese firms. Exportintelligence generation is positively related to financial per-formance and satisfaction with export venture for non-Chinese firms but not for Chinese firms. Export intelligencedissemination is not significantly related to either type ofperformance for both Chinese and non-Chinese firms.Finally, export intelligence responsiveness is positivelyrelated to financial performance for Chinese firms, but therelationship is not significant for non-Chinese firms.Although the relationship between export intelligenceresponsiveness is positively related to satisfaction withexport venture for Chinese firms, it is only marginally sig-nificant for non-Chinese firms. In the marketing literature,EMO has been treated as a second-order reflective measurewith three indicators: export intelligence generation, exportintelligence dissemination, and export responsiveness.Using a summated construct of EMO, we show that EMO hassignificant effects on EP for both Chinese and non-Chinesefirms. However, export intelligence generation and exportintelligence responsiveness exhibit different effects on EP forChinese and non-Chinese firms. This suggests that the threecomponents of EMO are not interchangeable and can have
Table 6.The Effects of EMO on EP
Financial Performance
Satisfaction with Export Venture
Variables Chinese Non-Chinese Chinese Non-Chinese
Exportintelligencegeneration
.09(1.14)
.16†
(1.92).10
(.70).25*
(2.22)
Exportintelligencedissemination
–.05(–1.28)
.04(.67)
–.11(–1.45)
–.09(–1.11)
Exportintelligenceresponsiveness
.22**(2.77)
.10(1.05)
.50***(3.56)
.27†
(1.90)
Overall model fit: χ2(218) = 343.85, p < .00; IFI = .97; TLI = .96; CFI = .97; andRMSEA = .03
†p < .10.*p < .05.**p < .01.***p < .001.Notes: t-values are in parentheses.

56 Janet Y. Murray, Gerald Yong Gao, Masaaki Kotabe, and Nan Zhou
differential effects on performance consequences (Jarvis,MacKenzie, and Podsakoff 2003). Therefore, without usingthe three-independent-factor structure, we cannot differenti-ate the influences of the components of EMO on EP directlyand precisely.
We believe that we have made a significant contribution tothe EMO literature in that, to the best of our knowledge, weare the first to examine the measurement invariance of EMOand EP using Chinese and non-Chinese firms in China. Afterestablishing measurement invariance of EMO and EPbetween these two types of firms, we can make reliable com-parisons on the EMO–EP relationship between Chinese andnon-Chinese firms. On the basis of the findings, we are alsoable to identify the components of EMO that drive EP in theChinese and non-Chinese firm context. It appears that theeffect of export intelligence dissemination is not as critical asthose of export intelligence generation and export intelli-gence responsiveness on EP. The insignificant results of theexport intelligence dissemination–performance relationshipis consistent with Rose and Shoham’s (2002) findings thatexport sales, export profits, and change in export profits arepositively related to intelligence generation and responsive-ness, but not intelligence dissemination. Although Rose andShoham examine market orientation rather than EMO, therespondents in their study were Israeli exporters, and thefocus of their study was similar to ours.
Our findings have important managerial implications forboth Chinese and non-Chinese firms exporting from China.Our results suggest that to achieve greater EP, non-Chinesefirms should focus on export intelligence generation. Since1979, China has undergone economic reform, resulting inmassive institutional change that has dismantled many barri-ers to business operations and leading to multiple systems ofbusiness ownership and governance (Child and Tse 2001).By 1986–1987, China had established two separate tradingregimes. One is an export promotion regime in which mostforeign firms can participate but from which domestic firmsare excluded. The export promotion regime involves (1) thedevelopment of an approval procedure, a legal framework,and concessionary taxation policies that encourage foreignfirms to establish export-oriented firms in China and (2) theestablishment of a program of export processing underwhich inputs and components needs for producing productsfor export are imported duty free, with little administrativeinterference. Moreover, these firms are allowed to use directexporting when they serve markets outside China (Naughtonand Lardy 1996). Because China has been modifying its poli-cies on a continuous basis, it is imperative for foreign firmsexporting from China to monitor their export intelligencegeneration continuously.

57Measurement Invariance of Export Market Orientation
As for Chinese firms, it is crucial to devote their efforts onexport intelligence responsiveness because it has a positiveeffect on EP. Unlike non-Chinese firms, Chinese firms oper-ate under the ordinary trade regime, which is a heavily pro-tected import substitution regime. The most important fea-ture of the ordinary trade regime is that virtually all ordinarytrade must be channeled through foreign trade companiesthat are state-owned companies. In contrast, non-Chinesefirms are not required to go through state-run foreign tradecompanies for importing and exporting activities (Naughtonand Lardy 1996). Because of the unique dual system for con-ducting foreign trade faced by Chinese and non-Chinesefirms, the efforts in monitoring competitors’ actions, asreflected in export intelligence responsiveness, appear to bemore important in affecting EP for Chinese firms.
Previous cross-cultural validation of measurement invari-ance mainly used firms from different countries of originlocated in their home country. However, Samiee andAthanassiou (1998) stress that cross-cultural considerationsare necessary even in single-country studies. FollowingSamiee and Athanassiou’s (1998) recommendation, weexamined whether measurement invariance exists beforemaking conclusions about cross-cultural comparisons byusing firms (i.e., Chinese and non-Chinese firms) located inthe same country (i.e., China). We believe that we have madea valuable contribution to the international marketing litera-ture because failure to evaluate whether measurement invari-ance exists may lead to erroneous conclusions when makingcross-cultural comparisons, even when a single country isused as the research context.
There are several fertile avenues for further research in thisdomain. First, our study examines the construct of EMO inthe largest transitional economy, China. Research in othertransitional economies is needed to test the generalizabilityof this construct. Second, future studies examining theantecedents (e.g., coordinating mechanism) of EMO in Chinacan provide a more comprehensive understanding of theEMO–EP relationship. In examining the interplay amongmarket knowledge, its integration, and performance, De Lucaand Autahene-Gima (2007) find that firms that focus on mar-ket knowledge as an end in itself, but neglect formal knowl-edge integration processes, may not achieve their intendedperformance objectives. Furthermore, in an era of globaliza-tion, as information-processing requirements that arise frominterdependence among functional units increase, itdemands corresponding increases in information-processingcapacity through the design of coordinating mechanisms(De Luca and Atuahene-Gima 2007; Galbraith 1973). Thisimplies that managers who encourage the behavioral compo-nents of EMO without developing effective coordinating

58 Janet Y. Murray, Gerald Yong Gao, Masaaki Kotabe, and Nan Zhou
mechanisms may not achieve their desired export marketperformance. Finally, because of the complex nature pertain-ing to the exporting environment, future studies might exam-ine the mediation process between EMO and EP. It wouldalso be worthwhile to investigate whether some dimensionsof exporting environments can moderate the effects of EMOon firm performance.
Export Intelligence Generation (EIG)
EIG 1: We periodically review the likely effect of changes inour export environment (e.g., technology andregulation).
EIG 2: In this company, we generate a lot of information con-cerning trends (e.g., regulation, technological devel-opments, politics, and economy) in our exportmarkets.
EIG 3: We generate a lot of information in order to under-stand the forces which influence our overseas cus-tomers’ need and preferences.
EIG 4: We constantly monitor our level of commitment andorientation to serving export customer needs.
We are slow to detect fundamental shifts in our exportenvironment (e.g., technology, regulatory, economy).(dropped)
Export Intelligence Dissemination (EID)
EID 1: Information about our export competitors’ activitiesoften reaches relevant personnel too late to be of anyuse. (reverse coded)
EID 2: Important information concerning export markettrends (regulatory, technology) is often discardedbefore it reaches decision makers. (reverse coded)
EID 3: Too much information concerning our export com-petitors is discarded before it reaches decision mak-ers. (reverse coded)
EID 4: Information which can influence the way we serve ourexport customers takes forever to reach export person-nel. (reverse coded)
Important information concerning our major exportcustomers is disseminated right down to the shopfloor. (dropped)
APPENDIX:MEASUREMENT ITEMS
EMO

59Measurement Invariance of Export Market Orientation
Export Intelligence Responsiveness (EIR)
EIR 1: If a major competitor were to launch an intensive cam-paign targeted at our foreign customers, we wouldimplement a response immediately.
EIR 2: We are quick to respond to significant changes in ourcompetitors’ price structures in foreign markets.
EIR 3: We rapidly respond to competitive actions thatthreaten us in our export markets.
Financial Performance (FP)
Product A’s EP:
FP 1: Has been very profitable.
FP 2: Has generated a high volume of sales.
FP 3: Has achieved rapid growth.
Satisfaction with Export Venture (SA)
Product A’s EP:
SA 1: Has very satisfactory export performance.
SA 2: Has been very successful.
SA 3: Has fully met our expectations.
Akyol, Ayse and Gary Akehurst (2003), “An Investigation of ExportPerformance Variations Related to Corporate Export Market Ori-entation,” European Business Review, 15 (1), 5–19.
Anderson, James C. and David W. Gerbing (1988), “StructuralEquation Modeling in Practice: A Review and RecommendedTwo Step Approach,” Psychological Bulletin, 103 (3), 411–23.
Atuahene-Gima, Kwaku and Janet Y. Murray (2004), “Antecedentsand Outcomes of Marketing Strategy Comprehensiveness,” Jour-nal of Marketing, 68 (October), 33–46.
Bagozzi, Richard P. and Youjae Yi (1988), “On the Evaluation ofStructural Equation Models,” Journal of the Academy of Market-ing Science, 16 (1), 74–94.
Cadogan, John W. and Adamantios Diamantopoulos (1995),“Narver and Slater, Kohli and Jaworski and the Market Orienta-tion Construct: Integration and Internationalization,” Journal ofStrategic Marketing, 3 (4), 41–60.
———, ———, and Charles Pahud de Mortanges (1999), “A Mea-sure of Export Market Orientation: Scale Development andCross-Cultural Validation,” Journal of International BusinessStudies, 30 (4), 689–707.
EP
REFERENCES

60 Janet Y. Murray, Gerald Yong Gao, Masaaki Kotabe, and Nan Zhou
———, ———, and Judy A. Siguaw (2002), “Export Market-Oriented Activities: Their Antecedents and Performance Conse-quences,” Journal of International Business Studies, 33 (3), 615–26.
———, Nicola J. Paul, Risto T. Salminen, Kaisu Puumalainen, andSanna Sundqvist (2001), “Key Antecedents to ‘Export’ Market-Oriented Behaviors: A Cross-National Empirical Examination,”International Journal of Research in Marketing, 18 (3), 261–82.
Cavusgil, S. Tamer and Shaoming Zou (1994), “MarketingStrategy–Performance Relationship: An Investigation of theEmpirical Link in Export Market Ventures,” Journal of Market-ing, 58 (January), 1–21.
Child, John and David K. Tse (2001), “China’s Transition and ItsImplications for International Business,” Journal of InternationalBusiness Studies, 32 (1), 5–21.
De Luca, Luigi M. and Kwaku Atuehene-Gima (2007), “MarketKnowledge Dimensions and Cross-Functional Collaboration:Examining the Different Routes to Product Innovation Perfor-mance,” Journal of Marketing, 71 (January), 95–112.
Diamantopoulos, A., J.A. Siguaw, and J.W. Cadogan (2000), “ExportPerformance: The Impact of Cross-Country Export Market Orien-tation,” in Marketing Theory and Applications: Proceedings ofthe American Marketing Association Winter Conference, Vol. 11,J.P. Workman Jr. and W.D. Perreault Jr., eds. Chicago AmericanMarketing Association, 177–78.
Fornell, Claes and David F. Larcker (1981), “Evaluating StructuralEquation Models with Unobservable Variables and MeasurementError,” Journal of Marketing Research, 18 (February), 39–50.
Galbraith, J. (1973), Designing Complex Organization. Reading,MA: Addison-Wesley.
George, Jennifer M. (1990), “Personality, Affect, and Behavior inGroups,” Journal of Applied Psychology, 75 (2), 107–116.
Hair, Joseph F., Jr., Rolph E. Anderson, Ronald L. Tatham, andWilliam C. Black (1998), Multivariate Data Analysis, 5th ed.Upple Saddle River, NJ: Prentice Hall.
Horn, John L. and J. Jack McArdle (1992), “A Practical and Theo-retical Guide to Measurement Invariance in Aging Research,”Experimental Aging Research, 18 (Fall–Winter), 117–44.
Hui, C. Harry and Harry C. Triandis (1985), “Measurement inCross-Cultural Psychology: A Review and Comparison of Strate-gies,” Journal of Cross-Cultural Psychology, 16 (June), 131–52.
Hurley, Robert F. and G. Tomas M. Hult (1998), “Innovation, Mar-ket Orientation, and Organizational Learning: An Integration andEmpirical Examination,” Journal of Marketing, 62 (July), 42–54.
James, Lawrence R., Robert G. Demaree, and Wolf Gerrit (1984),“Within-Group Interrater Reliability With and Without ResponseBias,” Journal of Applied Psychology, 69 (1), 85–98.
Jarvis, Cheryl B., Scott B. MacKenzie, and Philip M. Podsakoff(2003), “A Critical Review of Construct Indicators and Measure-ment Model Misspecification in Marketing and Consumer
THE AUTHORS
Janet Y. Murray is E. DesmondLee Professor for Developing
Women Leaders andEntrepreneurs in InternationalBusiness (e-mail: murrayjan@
umsl.edu), and Gerald Yong Gaois an assistant professor (e-mail:[email protected]), Department of
Marketing, University ofMissouri–St. Louis.
Masaaki Kotabe is WashburnChair of International Business
and Marketing, Institute of GlobalManagement Studies, TempleUniversity (e-mail: mkotabe@
temple.edu).
Nan Zhou is a professor,Department of Marketing, CityUniversity of Hong Kong, and
Wuhan University, China (e-mail:[email protected]).
ACKNOWLEDGMENT
Janet Y. Murray, Masaaki Kotabe, andNan Zhou gratefully acknowledge the
financial support provided by theCity University of Hong Kong(Strategic Research Grant No.
7001168).
61Measurement Invariance of Export Market Orientation
Research,” Journal of Consumer Research, 30 (September), 199–218.
Jöreskog, Karl G. and Dag Sörbom (1993), LISREL #8: StructuralEquation Modeling with SIMPLIS Command Language. Chicago:Scientific Software International.
Kirca, Ahmet H., Satish Jayachandran, and William O. Bearden(2005), “Market Orientation: A Meta-Analytic Review andAssessment of Its Antecedents and Impact on Performance,”Journal of Marketing, 69 (April), 24–41.
Kohli, Ajay K. and Bernard J. Jaworski (1990), “Market Orientation:The Construct, Research Propositions, and Managerial Implica-tions,” Journal of Marketing, 54 (April), 1–18.
Kwon, Yung-C. and Michael Y. Hu (2000), “Market OrientationAmong Small Korean Exporters,” International Business Review,9 (1), 61–75.
LeBreton, J.M., L.R. James, and M.K. Lindell (2005), “Recent IssuesRegarding RWG, R*WG, RWG(J), and R*WG(J),” OrganizationalResearch Methods, 8 (1), 128–38.
Matsuno, Ken, John T. Mentzer, and Joseph O. Rentz (2000), “ARefinement and Validation of the MARKOR Scale,” Journal ofthe Academy of Marketing Science, 28 (4), 527–39.
Mullen, Michael R. (1995), “Diagnosing Measurement Equivalencein Cross-National Research,” Journal of International BusinessStudies, 26 (3), 573–96.
Narver, John C. and Stanley F. Slater (1990), “The Effect of a MarketOrientation on Business Profitability,” Journal of Marketing, 64(October), 21–35.
Naughton, Barry and Nicholas R. Lardy (1996), “China’s Emer-gence and Prospects as a Trading Nation,” Brookings Papers onEconomic Activity, 2, 273–344.
Netemeyer, Richard G., Srinivas Durvasula, and Donald R. Lichten-stein (1991), “A Cross-National Assessment of the Reliability andValidity of CETSCALE,” Journal of Marketing Research, 28(August), 320–27.
Oczkowski, Edward and Mark A. Farrell (1998), “DiscriminatingBetween Measurement Scales Using Non-Nested Tests and Two-Stage Least Squares Estimators: The Case of Market Orientation,”International Journal of Research in Marketing, 15 (4), 349–66.
Rose, Gregory M. and Aviv Shoham (2002), “Export Performanceand Market Orientation: Establishing an Empirical Link,” Jour-nal of Business Research, 55 (3), 217–25.
Samiee, Saeed and Nicholas Athanassiou (1998), “InternationalStrategy Research: Cross-Cultural Methodology Implications,”Journal of Business Research, 43 (2), 79–96.
Singh, Jagdip (1995), “Measurement Issues in Cross-NationalResearch,” Journal of International Business Studies, 26 (3),597–619.
Steenkamp, Jan-Benedict E.M. and Hans Baumgartner (1998),“Assessing Measurement Invariance in Cross-National Con-sumer Research,” Journal of Consumer Research, 25 (June), 78–90.

62 Janet Y. Murray, Gerald Yong Gao, Masaaki Kotabe, and Nan Zhou
Stump, R.L. and Jan B. Heide (1996), “Controlling Supplier Oppor-tunism in Industrial Relationship,” Journal of MarketingResearch, 23 (November), 431–41.
Van Bruggen, G.H., G.L. Lilien, and M. Kacker (2002), “Informantsin Organizational Marketing Research: Why Use Multiple Infor-mants and How to Aggregate Responses,” Journal of MarketingResearch, 34 (November), 469–78.
Zou, Shaoming, Charles R. Taylor, and Gregory E. Osland (1998),“The EXPERF Scale: A Cross-National Generalized Export Per-formance Measure,” Journal of International Marketing, 6 (3),37–58.