Assessing aortic valve area in aortic stenosis by continuity equation: a novel approach using...
10
..................................................................................................................................................................................... ..................................................................................................................................................................................... CLINICAL RESEARCH Imaging Assessing aortic valve area in aortic stenosis by continuity equation: a novel approach using real-time three-dimensional echocardiography Kian Keong Poh 1,2 , Robert A. Levine 1 , Jorge Solis 1 , Liang Shen 3 , Mary Flaherty 1 , Yue-Jian Kang 1 , J. Luis Guerrero, and Judy Hung 1 * 1 Cardiac Ultrasound Laboratory, Division of Cardiology, Blake 256, Massachusetts General Hospital, Harvard Medical School, 55 Fruit Street, Boston, MA 02114, USA; 2 Cardiac Department, National University Hospital, Singapore; and 3 Biostatistics Unit, Yong Loo Lin School of Medicine, National University of Singapore, Singapore Received 5 July 2007; revised 17 December 2007; accepted 10 January 2008; online publish-ahead-of-print 9 February 2008 Aims Two-dimensional echocardiographic (2DE) continuity-equation derived aortic valve area (AVA) in aortic stenosis (AS) relies on non-simultaneous measurement of left ventricular outflow tract (LVOT) velocity and geometric assumptions of LVOT area, which can amplify error, especially in upper septal hypertrophy (USH). We hypothesized that real-time three-dimensional echocardiography (RT3DE) can improve accuracy of AVA by directly measuring LVOT stroke volume (SV) in one window. Methods and results RT3DE colour Doppler and 2DE were acquired in 68 AS patients (74 + 12 yrs) prospectively. SV was derived from flow obtained from a sampling curve placed orthogonal to LVOT (Tomtec Imaging). Agreement between continuity- equation derived AVA by RT3DE (AVA 3D-SV ) and 2DE (AVA 2D ) and predictors of discrepancies were analysed. Validation of LVOT SV was performed by aortic flow probe in a sheep model with balloon inflation of septum to mimic USH. There was only modest correlation between AVA 2D and AVA 3D-SV (r ¼ 0.71, difference 0.11 + 0.23 cm 2 ). The degree of USH was significantly associated with difference in AVA calculation (r ¼ 0.4, P ¼ 0.005). In experimentally distorted LVOT geometry in sheep, RT3DE correlated better with flow probe assessment (r ¼ 0.96, P , 0.001) than 2DE (r ¼ 0.71, P ¼ 0.006). Conclusion RT3DE colour Doppler-derived LVOT SV in the calculation of AVA by continuity equation is more accurate than 2D, including in situations such as USH, common in the elderly, which modify LVOT geometry. ----------------------------------------------------------------------------------------------------------------------------------------------------------- Keywords Aortic stenosis † Real-time three-dimensional echocardiography † Colour Doppler † Valvular heart disease † Continuity equation Introduction Aortic stenosis is assessed routinely using the continuity equation which, based on the principle of conservation of mass, equates stroke volume (SV) proximal to the aortic valve (left ventricular outflow tract, LVOT) to SV through the stenotic aortic valve orifice. 1 Using conventional two-dimensional echocardiography (2DE), 2–4 the SV at the LVOT is obtained by measuring the dia- meter across the LVOT (to calculate its cross-sectional area, assum- ing it is circular) and stroke distance (from time velocity integral by pulse-wave Doppler). The validation and accuracy of LVOT SV calculation of aortic valve area (AVA) using continuity equation is most subjected to assumptions on geometry and uniform velocity, unlike the relatively simple continuous wave Doppler measure- ment used for the SV measurement at the level of the aortic valve. Hence, LVOT SV calculation is also most susceptible to error. 2D continuity method makes two important assumptions regarding flow across the LVOT. One, it assumes that flow is of uniform velocity in the LVOT and second, the LVOT geometry is assumed to be circular. These assumptions may not be valid where LVOT geometry is irregular secondary to upper septal hypertrophy (USH) or prominent annular calcification, which * Corresponding author. Tel: þ1 617 726 0995, Fax: þ1 617 726 8383, Email: [email protected]. Published on behalf of the European Society of Cardiology. All rights reserved. & The Author 2008. For permissions please email: [email protected] European Heart Journal (2008) 29, 2526–2535 doi:10.1093/eurheartj/ehn022 by guest on May 27, 2014 http://eurheartj.oxfordjournals.org/ Downloaded from
-
Upload
independent -
Category
Documents
-
view
4 -
download
0
Transcript of Assessing aortic valve area in aortic stenosis by continuity equation: a novel approach using...
. . . . . . . . . . . . . . . . . . . . . . . . . . . . . . . . . . . . . . . . . . . . . . . . . . . . . . . . . . . . . . . . . . . . . . . . . . . . . . . . . . . . . . . . . . . . . . . . . . . . . . . . . . . . . . . . . . . . . . . . . . . . . . . . . . . . . . . . . . . . . . . . . . . . . . . . . . . . . . . . . . . . . . . . . . . . . . . . . . . . .
. . . . . . . . . . . . . . . . . . . . . . . . . . . . . . . . . . . . . . . . . . . . . . . . . . . . . . . . . . . . . . . . . . . . . . . . . . . . . . . . . . . . . . . . . . . . . . . . . . . . . . . . . . . . . . . . . . . . . . . . . . . . . . . . . . . . . . . . . . . . . . . . . . . . . . . . . . . . . . . . . . . . . . . . . . . . . . . . . . . . .
CLINICAL RESEARCHImaging
Assessing aortic valve area in aortic stenosis bycontinuity equation: a novel approach usingreal-time three-dimensional echocardiographyKian Keong Poh1,2, Robert A. Levine1, Jorge Solis1, Liang Shen3, Mary Flaherty1,Yue-Jian Kang1, J. Luis Guerrero, and Judy Hung1*
1Cardiac Ultrasound Laboratory, Division of Cardiology, Blake 256, Massachusetts General Hospital, Harvard Medical School, 55 Fruit Street, Boston, MA 02114, USA; 2CardiacDepartment, National University Hospital, Singapore; and 3Biostatistics Unit, Yong Loo Lin School of Medicine, National University of Singapore, Singapore
Received 5 July 2007; revised 17 December 2007; accepted 10 January 2008; online publish-ahead-of-print 9 February 2008
Aims Two-dimensional echocardiographic (2DE) continuity-equation derived aortic valve area (AVA) in aortic stenosis(AS) relies on non-simultaneous measurement of left ventricular outflow tract (LVOT) velocity and geometricassumptions of LVOT area, which can amplify error, especially in upper septal hypertrophy (USH). We hypothesizedthat real-time three-dimensional echocardiography (RT3DE) can improve accuracy of AVA by directly measuringLVOT stroke volume (SV) in one window.
Methodsand results
RT3DE colour Doppler and 2DE were acquired in 68 AS patients (74+12 yrs) prospectively. SV was derived fromflow obtained from a sampling curve placed orthogonal to LVOT (Tomtec Imaging). Agreement between continuity-equation derived AVA by RT3DE (AVA3D-SV) and 2DE (AVA2D) and predictors of discrepancies were analysed.Validation of LVOT SV was performed by aortic flow probe in a sheep model with balloon inflation of septum tomimic USH. There was only modest correlation between AVA2D and AVA3D-SV (r ¼ 0.71, difference 0.11+0.23 cm2).The degree of USH was significantly associated with difference in AVA calculation (r ¼ 0.4, P ¼ 0.005). In experimentallydistorted LVOT geometry in sheep, RT3DE correlated better with flow probe assessment (r ¼ 0.96, P , 0.001) than 2DE(r ¼ 0.71, P ¼ 0.006).
Conclusion RT3DE colour Doppler-derived LVOT SV in the calculation of AVA by continuity equation is more accurate than 2D,including in situations such as USH, common in the elderly, which modify LVOT geometry.
- - - - - - - - - - - - - - - - - - - - - - - - - - - - - - - - - - - - - - - - - - - - - - - - - - - - - - - - - - - - - - - - - - - - - - - - - - - - - - - - - - - - - - - - - - - - - - - - - - - - - - - - - - - - - - - - - - - - - - - - - - - - - - - - - - - - - - - - - - - - - - - - - - - - - - - - - - -Keywords Aortic stenosis † Real-time three-dimensional echocardiography † Colour Doppler † Valvular heart disease †
Continuity equation
IntroductionAortic stenosis is assessed routinely using the continuity equationwhich, based on the principle of conservation of mass, equatesstroke volume (SV) proximal to the aortic valve (left ventricularoutflow tract, LVOT) to SV through the stenotic aortic valveorifice.1 Using conventional two-dimensional echocardiography(2DE),2 –4 the SV at the LVOT is obtained by measuring the dia-meter across the LVOT (to calculate its cross-sectional area, assum-ing it is circular) and stroke distance (from time velocity integral bypulse-wave Doppler). The validation and accuracy of LVOT SV
calculation of aortic valve area (AVA) using continuity equation ismost subjected to assumptions on geometry and uniform velocity,unlike the relatively simple continuous wave Doppler measure-ment used for the SV measurement at the level of the aorticvalve. Hence, LVOT SV calculation is also most susceptible toerror. 2D continuity method makes two important assumptionsregarding flow across the LVOT. One, it assumes that flow is ofuniform velocity in the LVOT and second, the LVOT geometryis assumed to be circular. These assumptions may not be validwhere LVOT geometry is irregular secondary to upper septalhypertrophy (USH) or prominent annular calcification, which
* Corresponding author. Tel: þ1 617 726 0995, Fax: þ1 617 726 8383, Email: [email protected].
Published on behalf of the European Society of Cardiology. All rights reserved. & The Author 2008. For permissions please email: [email protected]
European Heart Journal (2008) 29, 2526–2535doi:10.1093/eurheartj/ehn022
by guest on May 27, 2014
http://eurheartj.oxfordjournals.org/D
ownloaded from
extends into the LVOT. In addition, uniform flow velocities are notpresent in settings of increased and non-laminar velocities such asmight occur with hyperdynamic function or anatomic obstructionin the LVOT. Because the diameter of the LVOT is squared todetermine area, small errors in measuring this linear dimensionare amplified and are an important source of inaccuracy. Factorscontributing to errors include image quality, annular calcification,non-circular annulus, failure to measure true diameter and the pre-sence of USH. Furthermore, simultaneous measurements, in timeand sometimes in location, of the LVOT flow and its area arenot obtained by 2DE method.
The development of real-time three-dimensional echocardiogra-phy (RT3DE) can circumvent the limitations of 2DE by directlymeasuring LVOT SV in one imaging window without the needfor geometric assumptions.5,6 We hypothesized that RT3DEimproves accuracy of the AVA calculation in AS by directly measur-ing LVOT SV in one window.
Methods
Study populationWe prospectively recruited adult patients with varying degrees of ASand USH. Exclusion criteria included poor echocardiographic imagingwindows and presence of subvalvular or supravalvular aortic stenosis.The protocol was approved by the hospital Institutional Review Board.
EchocardiographyTransthoracic echocardiography was performed by experienced sono-graphers using Sonos IE33 machines (Philips Medical Systems, Andover,MA, USA). 2DE was done using an s3 probe and 3DE was done usingx3 probe.
In addition to 2DE examination, peak and mean aortic velocitieswere obtained by continuous-wave Doppler echocardiography froma multiwindow approach and corresponding pressure gradients calcu-lated using the modified Bernoulli equation. AVA was determined bycontinuity equation (AVA2D). Concomitant significant pathologiesincluding aortic or mitral regurgitation (categorized into grades I– IV)and left ventricular systolic dysfunction were documented. The ratioof upper septal wall thickness to posterior wall thickness in diastolewas measured to determine degree of USH. USH was consideredpresent if the ratio was � 1.3.
Apical 3DE colour Doppler volumes incorporating the LVOT andaortic valve were acquired with electrocardiographic gating and sus-pended respiration (over four beats). Nyquist limit and frame ratewere maximized and depth setting adjusted to a minimum butkeeping the aortic valve in view.
In addition, RT3D full volume datasets of the aortic valve in theparasternal window was obtained in a subgroup of patients and thepyramidal dataset cropped to determine the anatomical orifice.
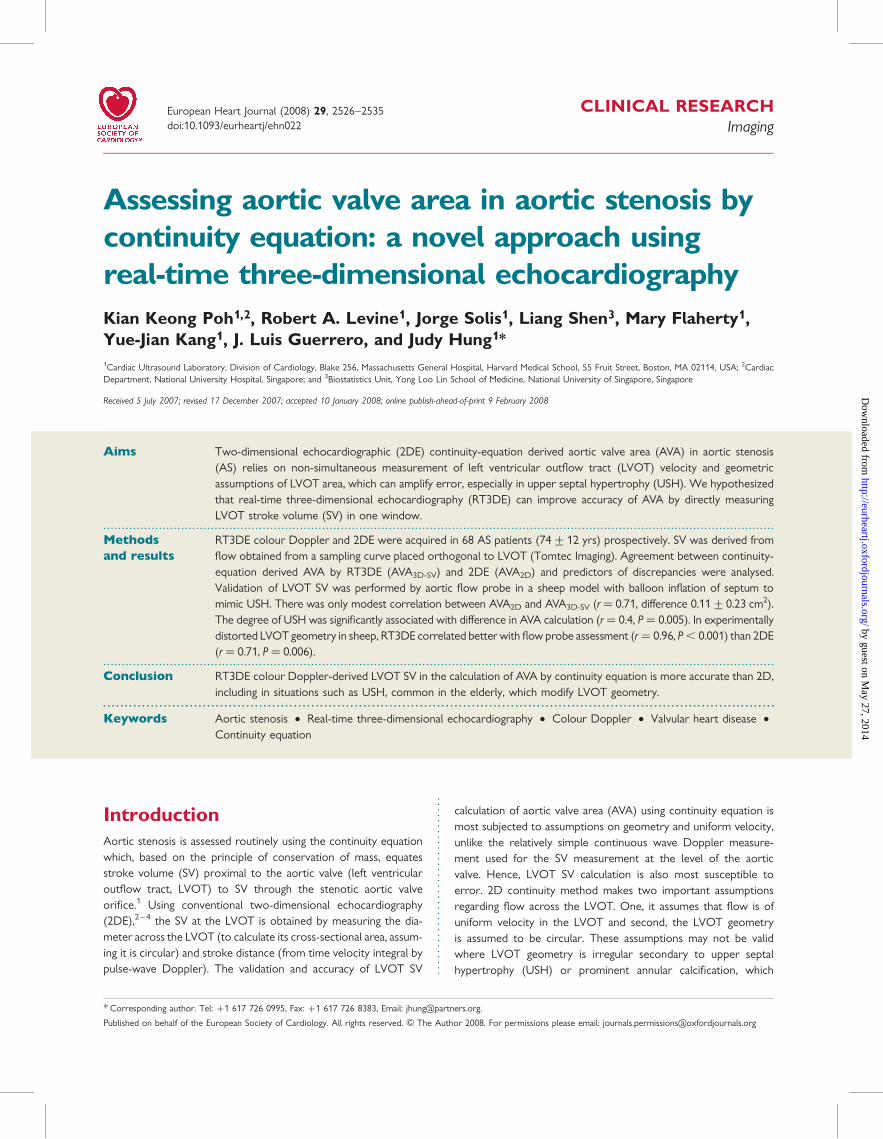
Animal model validationThree Dorsett sheep were intubated, ventilated, and studied underopen-chested conditions. Anaesthesia was maintained with 2%isofluorane and oxygen. A custom-made balloon attached to syringeand inflatable to different size with saline was surgically insertedthrough the epicardium into the myocardium of the upper ventricularseptum, as guided by echocardiography.7 This was performed to varythe LVOT geometry, mimicking the clinical spectrum of USH (Figure 1).Cardiac output (CO) was measured by placing an electromagnetic
flow probe around the aortic root5 to provide mean flow rate on abeat-to-beat basis. A CO value (L/min) was recorded for each 2DEand 3DE acquisition. Echocardiographic windows at apical long axiswere acquired with epicardial probes. Different CO was achievedwith changing preload (by intravenous fluid challenges and inferiorvena cava clamping) and pharmacologically. The institutional animalcare and use committee approved all procedures.
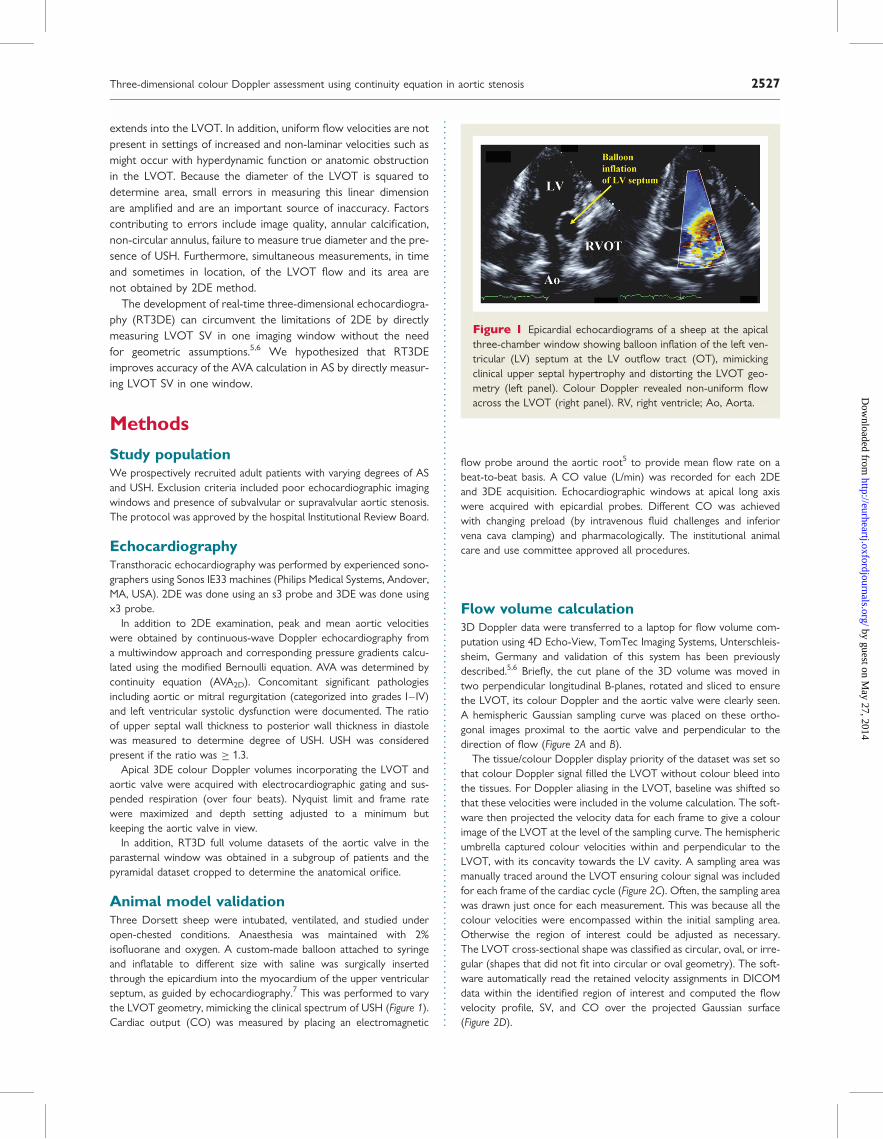
Flow volume calculation3D Doppler data were transferred to a laptop for flow volume com-putation using 4D Echo-View, TomTec Imaging Systems, Unterschleis-sheim, Germany and validation of this system has been previouslydescribed.5,6 Briefly, the cut plane of the 3D volume was moved intwo perpendicular longitudinal B-planes, rotated and sliced to ensurethe LVOT, its colour Doppler and the aortic valve were clearly seen.A hemispheric Gaussian sampling curve was placed on these ortho-gonal images proximal to the aortic valve and perpendicular to thedirection of flow (Figure 2A and B).
The tissue/colour Doppler display priority of the dataset was set sothat colour Doppler signal filled the LVOT without colour bleed intothe tissues. For Doppler aliasing in the LVOT, baseline was shifted sothat these velocities were included in the volume calculation. The soft-ware then projected the velocity data for each frame to give a colourimage of the LVOT at the level of the sampling curve. The hemisphericumbrella captured colour velocities within and perpendicular to theLVOT, with its concavity towards the LV cavity. A sampling area wasmanually traced around the LVOT ensuring colour signal was includedfor each frame of the cardiac cycle (Figure 2C). Often, the sampling areawas drawn just once for each measurement. This was because all thecolour velocities were encompassed within the initial sampling area.Otherwise the region of interest could be adjusted as necessary.The LVOT cross-sectional shape was classified as circular, oval, or irre-gular (shapes that did not fit into circular or oval geometry). The soft-ware automatically read the retained velocity assignments in DICOMdata within the identified region of interest and computed the flowvelocity profile, SV, and CO over the projected Gaussian surface(Figure 2D).
Figure 1 Epicardial echocardiograms of a sheep at the apicalthree-chamber window showing balloon inflation of the left ven-tricular (LV) septum at the LV outflow tract (OT), mimickingclinical upper septal hypertrophy and distorting the LVOT geo-metry (left panel). Colour Doppler revealed non-uniform flowacross the LVOT (right panel). RV, right ventricle; Ao, Aorta.
Three-dimensional colour Doppler assessment using continuity equation in aortic stenosis 2527
by guest on May 27, 2014
http://eurheartj.oxfordjournals.org/D
ownloaded from
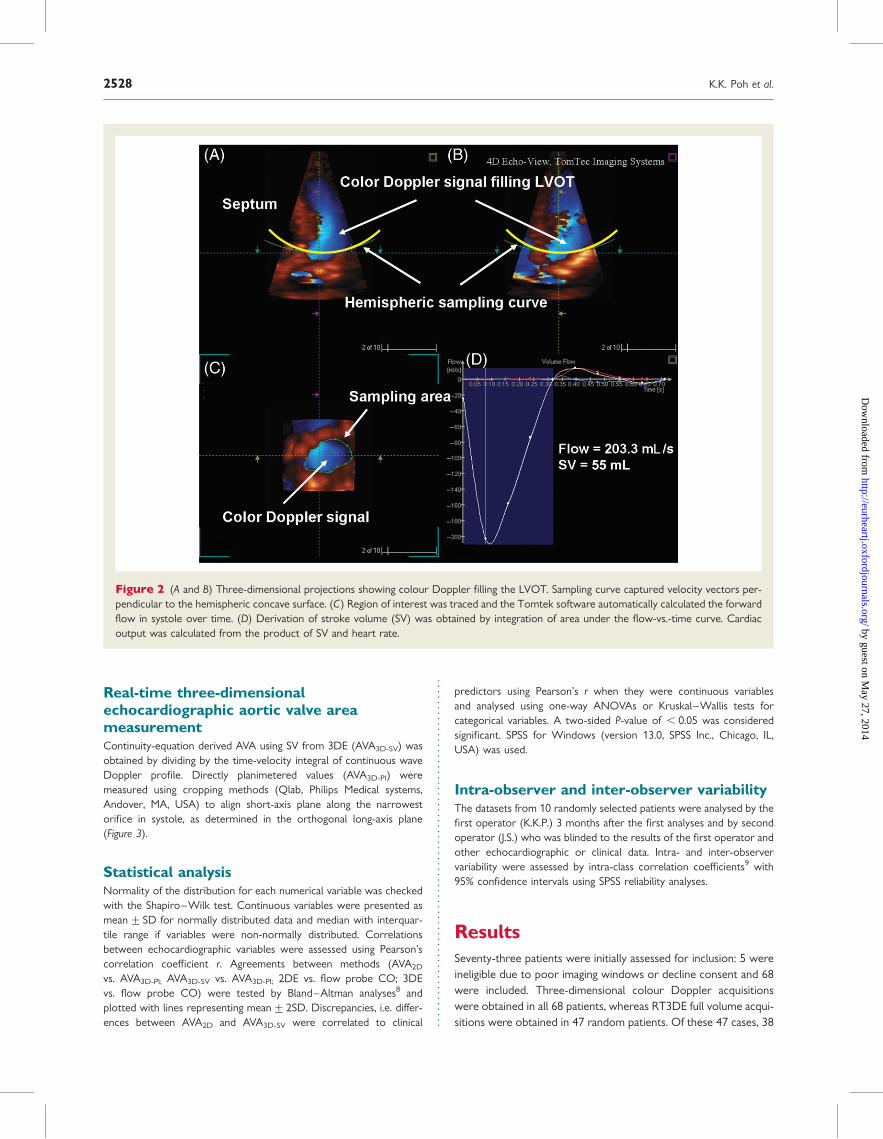
Real-time three-dimensionalechocardiographic aortic valve areameasurementContinuity-equation derived AVA using SV from 3DE (AVA3D-SV) wasobtained by dividing by the time-velocity integral of continuous waveDoppler profile. Directly planimetered values (AVA3D-Pl) weremeasured using cropping methods (Qlab, Philips Medical systems,Andover, MA, USA) to align short-axis plane along the narrowestorifice in systole, as determined in the orthogonal long-axis plane(Figure 3).
Statistical analysisNormality of the distribution for each numerical variable was checkedwith the Shapiro–Wilk test. Continuous variables were presented asmean+ SD for normally distributed data and median with interquar-tile range if variables were non-normally distributed. Correlationsbetween echocardiographic variables were assessed using Pearson’scorrelation coefficient r. Agreements between methods (AVA2D
vs. AVA3D-Pl; AVA3D-SV vs. AVA3D-Pl; 2DE vs. flow probe CO; 3DEvs. flow probe CO) were tested by Bland–Altman analyses8 andplotted with lines representing mean+2SD. Discrepancies, i.e. differ-ences between AVA2D and AVA3D-SV were correlated to clinical
predictors using Pearson’s r when they were continuous variablesand analysed using one-way ANOVAs or Kruskal–Wallis tests forcategorical variables. A two-sided P-value of , 0.05 was consideredsignificant. SPSS for Windows (version 13.0, SPSS Inc., Chicago, IL,USA) was used.
Intra-observer and inter-observer variabilityThe datasets from 10 randomly selected patients were analysed by thefirst operator (K.K.P.) 3 months after the first analyses and by secondoperator (J.S.) who was blinded to the results of the first operator andother echocardiographic or clinical data. Intra- and inter-observervariability were assessed by intra-class correlation coefficients9 with95% confidence intervals using SPSS reliability analyses.
ResultsSeventy-three patients were initially assessed for inclusion: 5 wereineligible due to poor imaging windows or decline consent and 68were included. Three-dimensional colour Doppler acquisitionswere obtained in all 68 patients, whereas RT3DE full volume acqui-sitions were obtained in 47 random patients. Of these 47 cases, 38
Figure 2 (A and B) Three-dimensional projections showing colour Doppler filling the LVOT. Sampling curve captured velocity vectors per-pendicular to the hemispheric concave surface. (C) Region of interest was traced and the Tomtek software automatically calculated the forwardflow in systole over time. (D) Derivation of stroke volume (SV) was obtained by integration of area under the flow-vs.-time curve. Cardiacoutput was calculated from the product of SV and heart rate.
K.K. Poh et al.2528
by guest on May 27, 2014
http://eurheartj.oxfordjournals.org/D
ownloaded from
were technically adequate for 3D cropping. Baseline demographicsand selected echocardiographic characteristics were listed inTable 1. The mean LVOT SV by RT3DE was 68+21 mL whilethe mean AVA3D-SV and AVA2D was 0.88+0.30 and 0.99+0.30 cm2, respectively. The cross-sectional shape of LVOT asviewed enface (obtained by cropping the RT3DE dataset),appeared circular, oval, and irregular in 29 (43%), 26 (38%), and13 (19%) of the cases, respectively.
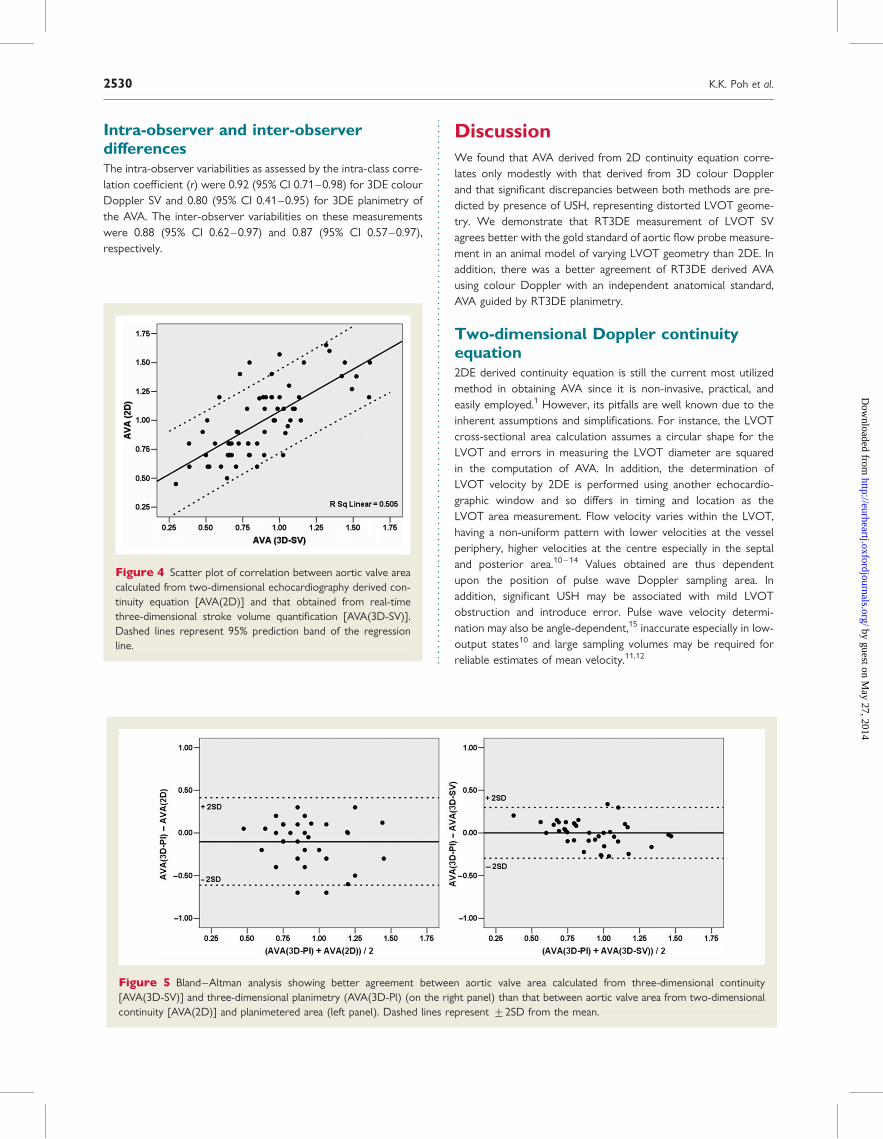
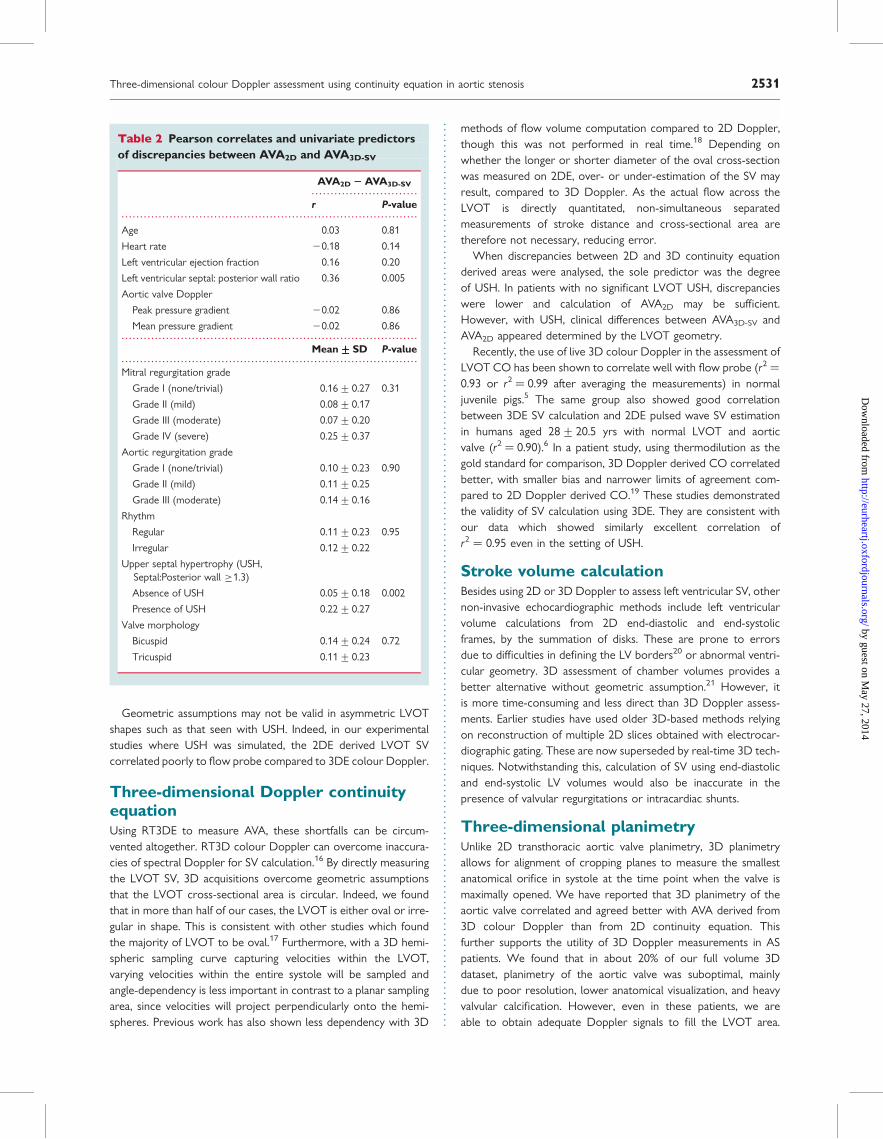
Correlations between AVA3D-SV,AVA3D-Pl, and AVA2DCorrelation between AVA2D and AVA3D-SV for the entire cohortwas modest (r ¼ 0.71, P , 0.001, Figure 4; mean difference0.11+0.23 cm2). In a subgroup of 38 cases, AVA3D-Pl was com-pared to AVA2D and AVA3D-SV. AVA3D-SV correlated better withAVA3D-Pl than AVA2D (r ¼ 0.81 vs. 0.51, z ¼ 22.4, P ¼ 0.018). Inaddition, AVA3D-SV agreed better with AVA3D-Pl than AVA2D
(Figure 5; mean difference ¼ 20.001+0.15 vs. 20.10+0.26 cm2, P ¼ 0.038).
Discrepancies between AVA3D-SVand AVA2DThere was mild but significant correlation of the differencesbetween AVA2D and AVA3D-SV with the ratio of upper septalwall thickness to posterior wall thickness in diastole (r ¼ 0.36,P ¼ 0.005) but not with age, heart rate, LV ejection fraction, andindices of aortic valve severity (all P . 0.14) (Table 2). Figure 6illustrated an example of how USH may affect measurement ofLVOT diameter resulting in erroneous calculation of AVA2D.
We found significant association between the absolutedifferences of AVA3D-SV and AVA2D and LVOT shape (P ¼ 0.008,Kruskal–Wallis test), being less in circular LVOT shapes [median(interquartile range) 0.07 (0.04–0.23) cm2] than in oval[0.15 (0.09–0.24) cm2] and irregular shapes [0.26 (0.15–0.43) cm2].In the presence of USH, mean difference of AVA2D andAVA3D-SV was 0.22+0.27 compared to 0.05+0.18 cm2 whenseptal:posterior wall ,1.3 (P ¼ 0.002). Mean difference betweenAVA2D and AVA3D-SV did not appear to be predicted by concomi-tant mitral regurgitation grade, aortic regurgitant grade; presenceof bicuspid vs. tricuspid aortic stenosis or regular vs. irregularrhythm (Table 2).
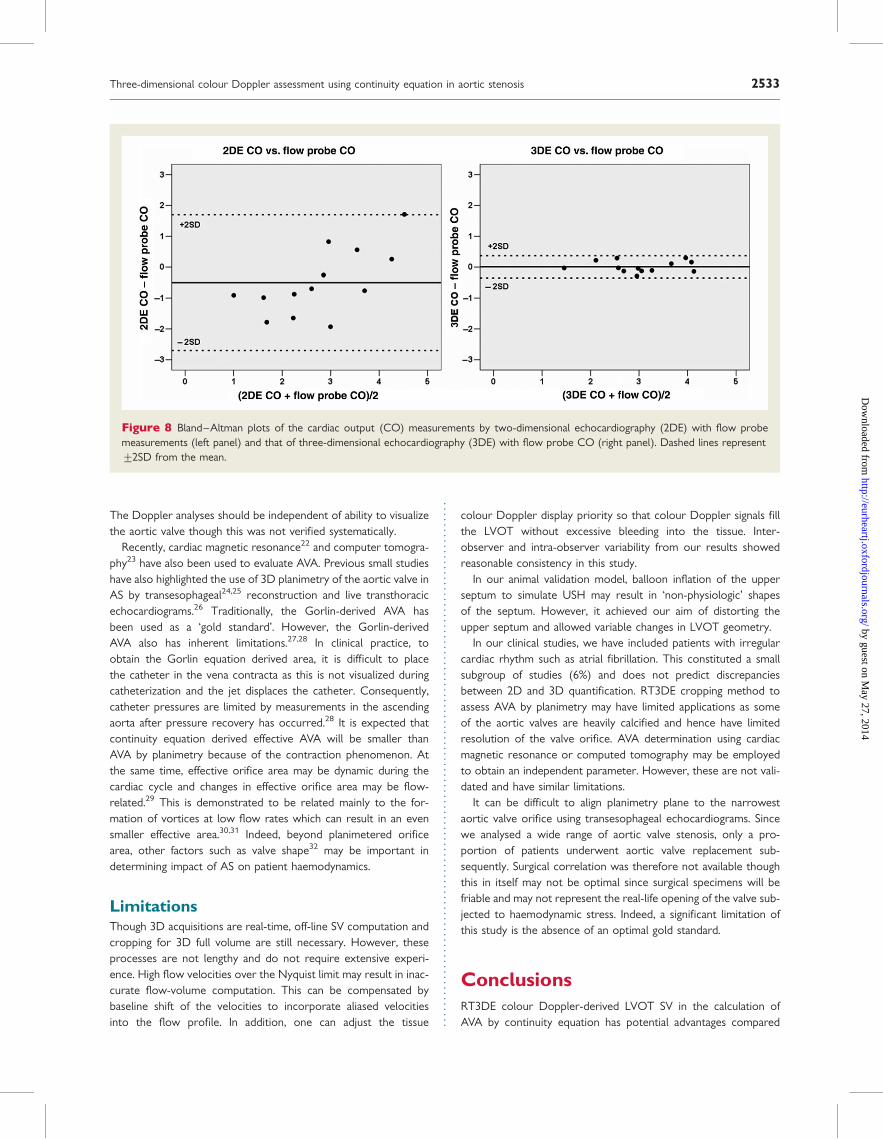
Validation of measurement of 3DEcolour Doppler derived SV/CO in settingof experimentally distorted LVOTgeometryUsing flow probe assessment as the referenced standard in sheepwith experimentally produced variation in LVOT geometry, COfrom colour Doppler RT3DE correlated better with flow probeCO (r ¼ 0.96, P , 0.001) than 2DE derived CO with flow probemeasurements (r ¼ 0.71, P ¼ 0.006) (Figure 7). The differences offlow probe data with 2DE and 3DE were 20.50+ 1.1 and0.01+ 0.18 L/min, respectively (Figure 8).
Figure 3 Real-time three-dimensional echocardiographicaortic valve area (AVA) by planimetry. Cropping allows alignmentof short-axis plane (B and C) at the narrowest orifice as visualizedin long axis plane (A). Arrows point to the aortic valve leaflets insystole. Cropping planes are shown in 3D set for reference (D).LV, left ventricle; Ao, Ascending Aorta.
. . . . . . . . . . . . . . . . . . . . . . . . . . . . . . . . . . . . . . . . . . . . . . . . . . . . . . . . . . . . . . . . . . . . . . . . . . . . . . . .
. . . . . . . . . . . . . . . . . . . . . . . . . . . . . . . . . . . . . . . . . . . . . . . . . . . . . . . . . . . . . . . . . . . . . . . . . . . . . . . .
. . . . . . . . . . . . . . . . . . . . . . . . . . . . . . . . . . . . . . . . . . . . . . . . . . . . . . . . . . . . . . . . . . . . . . . . . . . . . . . .
Table 1 Clinical and selected echocardiographicvariables in 68 patients with variable degrees of aorticvalve stenosis
Variable n (%) ormean+++++SD
Age (years) 74+12
Male gender 47 (69%)
Regular heart rhythm 57 (84%)
Heart rate (b.p.m.) 69+16
Left ventricular ejection fraction (%) 60+17
Degenerative aortic valve stenosis (tri-leaflet) 60 (88%)
Aortic valve area by 2D echocardiography (cm2) 0.99+0.30
Peak pressure gradient across aortic valve (mmHg) 53+27
Mean pressure gradient across aortic valve (mmHg) 31+16
Septal wall: posterior wall ratio 1.2+0.2
Concomitant aortic regurgitation
Grade I (none/trivial) 38 (56%)
Grade II (mild) 20 (44%)
Grade III (moderate) 10 (15%)
Grade IV (severe) 0 (0%)
Concomitant mitral regurgitation
Grade I (none/trivial) 24 (35%)
Grade II (mild) 24 (35%)
Grade III (moderate) 17 (25%)
Grade IV (severe) 3 (5%)
Three-dimensional colour Doppler assessment using continuity equation in aortic stenosis 2529
by guest on May 27, 2014
http://eurheartj.oxfordjournals.org/D
ownloaded from
Intra-observer and inter-observerdifferencesThe intra-observer variabilities as assessed by the intra-class corre-lation coefficient (r) were 0.92 (95% CI 0.71–0.98) for 3DE colourDoppler SV and 0.80 (95% CI 0.41–0.95) for 3DE planimetry ofthe AVA. The inter-observer variabilities on these measurementswere 0.88 (95% CI 0.62–0.97) and 0.87 (95% CI 0.57–0.97),respectively.
DiscussionWe found that AVA derived from 2D continuity equation corre-lates only modestly with that derived from 3D colour Dopplerand that significant discrepancies between both methods are pre-dicted by presence of USH, representing distorted LVOT geome-try. We demonstrate that RT3DE measurement of LVOT SVagrees better with the gold standard of aortic flow probe measure-ment in an animal model of varying LVOT geometry than 2DE. Inaddition, there was a better agreement of RT3DE derived AVAusing colour Doppler with an independent anatomical standard,AVA guided by RT3DE planimetry.
Two-dimensional Doppler continuityequation2DE derived continuity equation is still the current most utilizedmethod in obtaining AVA since it is non-invasive, practical, andeasily employed.1 However, its pitfalls are well known due to theinherent assumptions and simplifications. For instance, the LVOTcross-sectional area calculation assumes a circular shape for theLVOT and errors in measuring the LVOT diameter are squaredin the computation of AVA. In addition, the determination ofLVOT velocity by 2DE is performed using another echocardio-graphic window and so differs in timing and location as theLVOT area measurement. Flow velocity varies within the LVOT,having a non-uniform pattern with lower velocities at the vesselperiphery, higher velocities at the centre especially in the septaland posterior area.10–14 Values obtained are thus dependentupon the position of pulse wave Doppler sampling area. Inaddition, significant USH may be associated with mild LVOTobstruction and introduce error. Pulse wave velocity determi-nation may also be angle-dependent,15 inaccurate especially in low-output states10 and large sampling volumes may be required forreliable estimates of mean velocity.11,12
Figure 4 Scatter plot of correlation between aortic valve areacalculated from two-dimensional echocardiography derived con-tinuity equation [AVA(2D)] and that obtained from real-timethree-dimensional stroke volume quantification [AVA(3D-SV)].Dashed lines represent 95% prediction band of the regressionline.
Figure 5 Bland–Altman analysis showing better agreement between aortic valve area calculated from three-dimensional continuity[AVA(3D-SV)] and three-dimensional planimetry (AVA(3D-Pl) (on the right panel) than that between aortic valve area from two-dimensionalcontinuity [AVA(2D)] and planimetered area (left panel). Dashed lines represent +2SD from the mean.
K.K. Poh et al.2530
by guest on May 27, 2014
http://eurheartj.oxfordjournals.org/D
ownloaded from
Geometric assumptions may not be valid in asymmetric LVOTshapes such as that seen with USH. Indeed, in our experimentalstudies where USH was simulated, the 2DE derived LVOT SVcorrelated poorly to flow probe compared to 3DE colour Doppler.
Three-dimensional Doppler continuityequationUsing RT3DE to measure AVA, these shortfalls can be circum-vented altogether. RT3D colour Doppler can overcome inaccura-cies of spectral Doppler for SV calculation.16 By directly measuringthe LVOT SV, 3D acquisitions overcome geometric assumptionsthat the LVOT cross-sectional area is circular. Indeed, we foundthat in more than half of our cases, the LVOT is either oval or irre-gular in shape. This is consistent with other studies which foundthe majority of LVOT to be oval.17 Furthermore, with a 3D hemi-spheric sampling curve capturing velocities within the LVOT,varying velocities within the entire systole will be sampled andangle-dependency is less important in contrast to a planar samplingarea, since velocities will project perpendicularly onto the hemi-spheres. Previous work has also shown less dependency with 3D
methods of flow volume computation compared to 2D Doppler,though this was not performed in real time.18 Depending onwhether the longer or shorter diameter of the oval cross-sectionwas measured on 2DE, over- or under-estimation of the SV mayresult, compared to 3D Doppler. As the actual flow across theLVOT is directly quantitated, non-simultaneous separatedmeasurements of stroke distance and cross-sectional area aretherefore not necessary, reducing error.
When discrepancies between 2D and 3D continuity equationderived areas were analysed, the sole predictor was the degreeof USH. In patients with no significant LVOT USH, discrepancieswere lower and calculation of AVA2D may be sufficient.However, with USH, clinical differences between AVA3D-SV andAVA2D appeared determined by the LVOT geometry.
Recently, the use of live 3D colour Doppler in the assessment ofLVOT CO has been shown to correlate well with flow probe (r2 ¼
0.93 or r2 ¼ 0.99 after averaging the measurements) in normaljuvenile pigs.5 The same group also showed good correlationbetween 3DE SV calculation and 2DE pulsed wave SV estimationin humans aged 28+ 20.5 yrs with normal LVOT and aorticvalve (r2 ¼ 0.90).6 In a patient study, using thermodilution as thegold standard for comparison, 3D Doppler derived CO correlatedbetter, with smaller bias and narrower limits of agreement com-pared to 2D Doppler derived CO.19 These studies demonstratedthe validity of SV calculation using 3DE. They are consistent withour data which showed similarly excellent correlation ofr2 ¼ 0.95 even in the setting of USH.
Stroke volume calculationBesides using 2D or 3D Doppler to assess left ventricular SV, othernon-invasive echocardiographic methods include left ventricularvolume calculations from 2D end-diastolic and end-systolicframes, by the summation of disks. These are prone to errorsdue to difficulties in defining the LV borders20 or abnormal ventri-cular geometry. 3D assessment of chamber volumes provides abetter alternative without geometric assumption.21 However, itis more time-consuming and less direct than 3D Doppler assess-ments. Earlier studies have used older 3D-based methods relyingon reconstruction of multiple 2D slices obtained with electrocar-diographic gating. These are now superseded by real-time 3D tech-niques. Notwithstanding this, calculation of SV using end-diastolicand end-systolic LV volumes would also be inaccurate in thepresence of valvular regurgitations or intracardiac shunts.
Three-dimensional planimetryUnlike 2D transthoracic aortic valve planimetry, 3D planimetryallows for alignment of cropping planes to measure the smallestanatomical orifice in systole at the time point when the valve ismaximally opened. We have reported that 3D planimetry of theaortic valve correlated and agreed better with AVA derived from3D colour Doppler than from 2D continuity equation. Thisfurther supports the utility of 3D Doppler measurements in ASpatients. We found that in about 20% of our full volume 3Ddataset, planimetry of the aortic valve was suboptimal, mainlydue to poor resolution, lower anatomical visualization, and heavyvalvular calcification. However, even in these patients, we areable to obtain adequate Doppler signals to fill the LVOT area.
. . . . . . . . . . . . . . . . . . . . . . . . . . . .
. . . . . . . . . . . . . . . . . . . . . . . . . . . . . . . . . . . . . . . . . . . . . . . . . . . . . . . . . . . . . . . . . . . . . . . . . . . . . . . .
. . . . . . . . . . . . . . . . . . . . . . . . . . . . . . . . . . . . . . . . . . . . . . . . . . . . . . . . . . . . . . . . . . . . . . . . . . . . . . . .
. . . . . . . . . . . . . . . . . . . . . . . . . . . . . . . . . . . . . . . . . . . . . . . . . . . . . . . . . . . . . . . . . . . . . . . . . . . . . . . .
Table 2 Pearson correlates and univariate predictorsof discrepancies between AVA2D and AVA3D-SV
AVA2D 2 AVA3D-SV
r P-value
Age 0.03 0.81
Heart rate 20.18 0.14
Left ventricular ejection fraction 0.16 0.20
Left ventricular septal: posterior wall ratio 0.36 0.005
Aortic valve Doppler
Peak pressure gradient 20.02 0.86
Mean pressure gradient 20.02 0.86
Mean+++++SD P-value
Mitral regurgitation grade
Grade I (none/trivial) 0.16+0.27 0.31
Grade II (mild) 0.08+0.17
Grade III (moderate) 0.07+0.20
Grade IV (severe) 0.25+0.37
Aortic regurgitation grade
Grade I (none/trivial) 0.10+0.23 0.90
Grade II (mild) 0.11+0.25
Grade III (moderate) 0.14+0.16
Rhythm
Regular 0.11+0.23 0.95
Irregular 0.12+0.22
Upper septal hypertrophy (USH,Septal:Posterior wall �1.3)
Absence of USH 0.05+0.18 0.002
Presence of USH 0.22+0.27
Valve morphology
Bicuspid 0.14+0.24 0.72
Tricuspid 0.11+0.23
Three-dimensional colour Doppler assessment using continuity equation in aortic stenosis 2531
by guest on May 27, 2014
http://eurheartj.oxfordjournals.org/D
ownloaded from
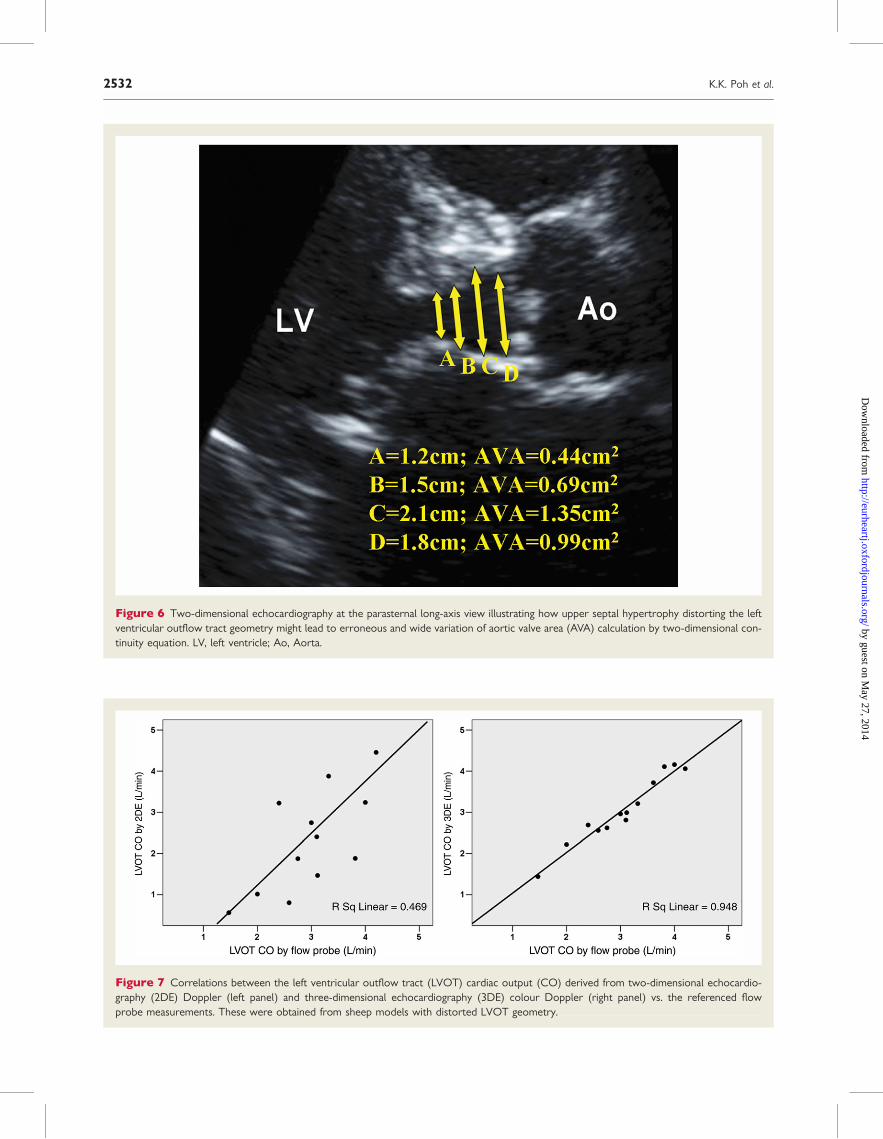
Figure 7 Correlations between the left ventricular outflow tract (LVOT) cardiac output (CO) derived from two-dimensional echocardio-graphy (2DE) Doppler (left panel) and three-dimensional echocardiography (3DE) colour Doppler (right panel) vs. the referenced flowprobe measurements. These were obtained from sheep models with distorted LVOT geometry.
Figure 6 Two-dimensional echocardiography at the parasternal long-axis view illustrating how upper septal hypertrophy distorting the leftventricular outflow tract geometry might lead to erroneous and wide variation of aortic valve area (AVA) calculation by two-dimensional con-tinuity equation. LV, left ventricle; Ao, Aorta.
K.K. Poh et al.2532
by guest on May 27, 2014
http://eurheartj.oxfordjournals.org/D
ownloaded from
The Doppler analyses should be independent of ability to visualizethe aortic valve though this was not verified systematically.
Recently, cardiac magnetic resonance22 and computer tomogra-phy23 have also been used to evaluate AVA. Previous small studieshave also highlighted the use of 3D planimetry of the aortic valve inAS by transesophageal24,25 reconstruction and live transthoracicechocardiograms.26 Traditionally, the Gorlin-derived AVA hasbeen used as a ‘gold standard’. However, the Gorlin-derivedAVA also has inherent limitations.27,28 In clinical practice, toobtain the Gorlin equation derived area, it is difficult to placethe catheter in the vena contracta as this is not visualized duringcatheterization and the jet displaces the catheter. Consequently,catheter pressures are limited by measurements in the ascendingaorta after pressure recovery has occurred.28 It is expected thatcontinuity equation derived effective AVA will be smaller thanAVA by planimetry because of the contraction phenomenon. Atthe same time, effective orifice area may be dynamic during thecardiac cycle and changes in effective orifice area may be flow-related.29 This is demonstrated to be related mainly to the for-mation of vortices at low flow rates which can result in an evensmaller effective area.30,31 Indeed, beyond planimetered orificearea, other factors such as valve shape32 may be important indetermining impact of AS on patient haemodynamics.
LimitationsThough 3D acquisitions are real-time, off-line SV computation andcropping for 3D full volume are still necessary. However, theseprocesses are not lengthy and do not require extensive experi-ence. High flow velocities over the Nyquist limit may result in inac-curate flow-volume computation. This can be compensated bybaseline shift of the velocities to incorporate aliased velocitiesinto the flow profile. In addition, one can adjust the tissue
colour Doppler display priority so that colour Doppler signals fillthe LVOT without excessive bleeding into the tissue. Inter-observer and intra-observer variability from our results showedreasonable consistency in this study.
In our animal validation model, balloon inflation of the upperseptum to simulate USH may result in ‘non-physiologic’ shapesof the septum. However, it achieved our aim of distorting theupper septum and allowed variable changes in LVOT geometry.
In our clinical studies, we have included patients with irregularcardiac rhythm such as atrial fibrillation. This constituted a smallsubgroup of studies (6%) and does not predict discrepanciesbetween 2D and 3D quantification. RT3DE cropping method toassess AVA by planimetry may have limited applications as someof the aortic valves are heavily calcified and hence have limitedresolution of the valve orifice. AVA determination using cardiacmagnetic resonance or computed tomography may be employedto obtain an independent parameter. However, these are not vali-dated and have similar limitations.
It can be difficult to align planimetry plane to the narrowestaortic valve orifice using transesophageal echocardiograms. Sincewe analysed a wide range of aortic valve stenosis, only a pro-portion of patients underwent aortic valve replacement sub-sequently. Surgical correlation was therefore not available thoughthis in itself may not be optimal since surgical specimens will befriable and may not represent the real-life opening of the valve sub-jected to haemodynamic stress. Indeed, a significant limitation ofthis study is the absence of an optimal gold standard.
ConclusionsRT3DE colour Doppler-derived LVOT SV in the calculation ofAVA by continuity equation has potential advantages compared
Figure 8 Bland–Altman plots of the cardiac output (CO) measurements by two-dimensional echocardiography (2DE) with flow probemeasurements (left panel) and that of three-dimensional echocardiography (3DE) with flow probe CO (right panel). Dashed lines represent+2SD from the mean.
Three-dimensional colour Doppler assessment using continuity equation in aortic stenosis 2533
by guest on May 27, 2014
http://eurheartj.oxfordjournals.org/D
ownloaded from
to 2D continuity. We demonstrated improved correlation andagreement with planimetry in AS patients and with in vivo flowprobe. This is especially important in irregular LVOT geometrysuch as USH. RT3DE colour Doppler measurement is less variableand may be a better method for serial evaluation of AS.
Conflict of interest: none declared.
FundingThis work was supported in part by NIH NIBIB R21 EB005294 (J.H.)and NIH NHLBI RO1 038176 (R.A.L.) and a fellowship award fromthe National Medical Research Council, Singapore (K.K.P.).
References1. Bonow RO, Carabello B, de Leon AC, Edmunds LH Jr, Fedderly BJ,
Freed MD, Gaasch WH, McKay CR, Nishimura RA, O’Gara PT,O’Rourke RA, Rahimtoola SH, Ritchie JL, Cheitlin MD, Eagle KA,Gardner TJ, Garson A Jr, Gibbons RJ, Russell RO, Ryan TJ,Smith SC Jr. ACC/AHA Guidelines for the Management of PatientsWith Valvular Heart Disease. Executive Summary. A report of theAmerican College of Cardiology/American Heart Association TaskForce on Practice Guidelines (Committee on Management ofPatients With Valvular Heart Disease). J Heart Valve Dis 1998;7:672–707.
2. Skjaerpe T, Hegrenaes L, Hatle L. Noninvasive estimation of valvearea in patients with aortic stenosis by Doppler ultrasound andtwo-dimensional echocardiography. Circulation 1985;72:810–818.
3. Otto CM, Pearlman AS, Comess KA, Reamer RP, Janko CL,Huntsman LL. Determination of the stenotic aortic valve area inadults using Doppler echocardiography. J Am Coll Cardiol 1986;7:509–517.
4. Zoghbi WA, Farmer KL, Soto JG, Nelson JG, Quinones MA. Accu-rate noninvasive quantification of stenotic aortic valve area byDoppler echocardiography. Circulation 1986;73:452–459.
5. Pemberton J, Li X, Karamlou T, Sandquist CA, Thiele K, Shen I,Ungerleider RM, Kenny A, Sahn DJ. The use of live three-dimensional Doppler echocardiography in the measurement ofcardiac output: an in vivo animal study. J Am Coll Cardiol 2005;45:433–438.
6. Pemberton J, Li X, Kenny A, Davies CH, Minette MS, Sahn DJ.Real-time 3-dimensional Doppler echocardiography for the assess-ment of stroke volume: an in vivo human study compared withstandard 2-dimensional echocardiography. J Am Soc Echocardiogr2005;18:1030–1036.
7. Levine RA, Lefebvre X, Guerrero JL, Vlahakes GJ, Cape EG,He S, Yoganathan AP, Weyman AE. Unifying concepts of mitralvalve function and disease: SAM, prolapse and ischemic mitralregurgitation. J Cardiol 1994;24(Suppl. 38):15–27.
8. Bland JM, Altman DG. Statistical methods for assessing agreementbetween two methods of clinical measurement. Lancet 1986;1:307–310.
9. Shrout PE, Fleiss JL. Intraclass correlations: uses in assessing raterreliability. Psychol Bull 1979;2:420–428.
10. Marshall SA, Weyman AE. Doppler estimation of volumetric flow.Principles and Practice of Echocardiography. Lippincott Williams &Wilkins, Philadelphia; 1994. p955–978.
11. Kvitting P, Hessevik I, Matre K, Segadal L. Three-dimensional cross-sectional velocity distribution in the ascending aorta in cardiacpatients. Clin Physiol 1996;16:239–258.
12. Haugen BO, Berg S, Brecke KM, Torp H, Slordahl SA, Skaerpe Tet al. Blood flow velocity profiles in the aortic annulus: a 3-
dimensional freehand color flow Doppler imaging study. J AmSoc Echocardiogr 2002;15:328–333.
13. Wiseth R, Samstad S, Rossvoll O, Torp HG, Skjaerpe T, Hatle L.Cross-sectional left ventricular outflow tract velocities beforeand after aortic valve replacement: a comparative study with two-dimensional Doppler ultrasound. J Am Soc Echocardiogr 1993;6:279–285.
14. Rossvoll O, Samstad S, Torp HG, Linker DT, Skjaerpe T,Angelsen BA, Hatle L. The velocity distribution in the aorticanulus in normal subjects: a quantitative analysis of two-dimensional Doppler flow maps. J Am Soc Echocardiogr 1991;4:367–378.
15. Quinones MA, Otto CM, Stoddard M, Waggoner A, Zoghbi WA.Recommendations for quantification of Doppler echocardiogra-phy: a report from the Doppler Quantification Task Force ofthe Nomenclature and Standards Committee of the AmericanSociety of Echocardiography. J Am Soc Echocardiogr 2002;15:167–184.
16. Pemberton J, Ge S, Thiele K, Jerosch-Herold M, Sahn DJ. Real-timethree-dimensional color Doppler echocardiography overcomesthe inaccuracies of spectral Doppler for stroke volume calculation.J Am Soc Echocardiogr 2006;19:1403–1410.
17. Baumgartner H, Kratzer H, Helmreich G, Kuehn P. Determinationof aortic valve area by Doppler echocardiography using the conti-nuity equation: a critical evaluation. Cardiology 1990;77:101–111.
18. Rusk RA, Li XN, Irvine T, Mori Y, Wanitkun S, Li XK, Kenny A,Sahn DJ. Surface integration of velocity vectors from 3D digitalcolour Doppler: an angle independent method for laminar flowmeasurements. Eur J Echocardiogr 2002;3:177–184.
19. Lodato JA, Weinert L, Baumann R, Coon P, Anderson A, Kim A,Fedson S, Sugeng L, Lang RM. Use of 3-dimensional colorDoppler echocardiography to measure stroke volume in humanbeings: comparison with thermodilution. J Am Soc Echocardiogr2007;20:103–112.
20. Axler O, Megarbane B, Lentschener C, Fernandez H. Comparisonof cardiac output measured with echocardiographic volumes andaortic Doppler methods during mechanical ventilation. IntensiveCare Med 2003;29:208–217.
21. Schmidt MA, Ohazama CJ, Agyeman KO, Freidlin RZ, Jones M,Laurienzo JM, Brenneman CL, Arai AE, von Ramm OT, Panza JA.Real-time three-dimensional echocardiography for measurementof left ventricular volumes. Am J Cardiol 1999;84:1434–1439.
22. Reant P, Lederlin M, Lafitte S, Serri K, Montaudon M,Corneloup O, Roudaut R, Laurent F. Absolute assessment ofaortic valve stenosis by planimetry using cardiovascular magneticresonance imaging: comparison with transesophageal echocardio-graphy, transthoracic echocardiography, and cardiac catheterisa-tion. Eur J Radiol 2006;59:276–283.
23. Bouvier E, Logeart D, Sablayrolles JL, Feignoux J, Scheuble C,Touche T, Thabut G, Cohen-Solal A. Diagnosis of aortic valvularstenosis by multislice cardiac computed tomography. Eur Heart J2006;27:3033–3038.
24. Ge S, Warner JG Jr, Abraham TP, Kon ND, Brooker RF,Nomeir AM, Fowle KM, Burgess P, Kitzman DW. Three-dimensional surface area of the aortic valve orifice by three-dimensional echocardiography: clinical validation of a novel indexfor assessment of aortic stenosis. Am Heart J 1998;136:1042–1050.
25. Menzel T, Mohr-Kahaly S, Kolsch B, Kupferwasser I, Kopp H,Spiecker M, Wagner S, Meinert R, Pagnia F, Meyer J. Quantitativeassessment of aortic stenosis by three-dimensional echocardio-graphy. J Am Soc Echocardiogr 1997;10:215–223.
K.K. Poh et al.2534
by guest on May 27, 2014
http://eurheartj.oxfordjournals.org/D
ownloaded from
26. Vengala S, Nanda NC, S H, Singh V, Agrawal G, Sinha A, Khanna D,Upendram SK, Chockalingam A, McGiffin DC, Kirklin JK,Pacifico AD. Images in geriatric cardiology. Usefulness of livethree-dimensional transthoracic echocardiography in aortic valvestenosis evaluation. Am J Geriatr Cardiol 2004;13:279–284.
27. Garcia D, Kadem L. What do you mean by aortic valve area: geo-metric orifice area, effective orifice area, or gorlin area? J HeartValve Dis 2006;15:601–608.
28. Weyman AE, Scherrer-Crosbie M. Aortic stenosis: physics andphysiology—what do the numbers really mean? Rev CardiovascMed 2005;6:23–32.
29. DeGroff CG, Shandas R, Valdes-Cruz L. Analysis of the effect offlow rate on the Doppler continuity equation for stenotic orifice
area calculations: a numerical study. Circulation 1998;97:1597–1605.
30. Kadem L, Rieu R, Dumesnil JG, Durand LG, Pibarot P. Flow-dependent changes in Doppler-derived aortic valve effectiveorifice area are real and not due to artifact. J Am Coll Cardiol2006;47:131–137.
31. Baumgartner H. Hemodynamic assessment of aortic stenosis: arethere still lessons to learn? J Am Coll Cardiol 2006;47:138–140.
32. Gilon D, Cape EG, Handschumacher MD, Song JK, Solheim J,VanAuker M, King ME, Levine RA. Effect of three-dimensionalvalve shape on the hemodynamics of aortic stenosis: three-dimensional echocardiographic stereolithography and patientstudies. J Am Coll Cardiol 2002;40:1479–1486.
Three-dimensional colour Doppler assessment using continuity equation in aortic stenosis 2535
by guest on May 27, 2014
http://eurheartj.oxfordjournals.org/D
ownloaded from