Asian American Student Engagement on College Campuses
76
ASIAN AMERICAN STUDENT ENGAGEMENT IN COLLEGE 228 Asian American Student Engagement on College Campuses Cassie Kao, EdD Salem State University Abstract Based on the detrimental effects of stereotypes such as the model minority myth, the purpose of this study was to examine the engagement rates of first-generation and non-first-generation Asian American students at various types of institutions compared to their peers and to explore whether the engagement rate differs depending upon institution type. The presumption of the model minority myth dismisses the fact that Asian Americans are not only extremely heterogenous in terms of race and ethnicity but also the significant variation in terms of academic achievement (Lee & Kumashiro, 2005). Although researchers have explored how racism impacts higher education attainment of Black/African American and Hispanic/Latinx students (Flores & Park, 2013; Naylor et al., 2015; Owens & Lynch, 2012; Wodtke, 2012), limited research exists on noninternational Asian American students on college campuses. The lack of research on Asian American college students contributes to the perpetual misconceptions of Asian Americans. This study identified areas where these students need support and served to validate those needs. Using descriptive and inferential statistics, I analyzed data from the Spring 2015 administration of the National Survey of Student Engagement (NSSE). Findings suggest Asian American students who participated in this study are not as engaged as their peers, there is a difference in the rates of engagement between first-generation Asian American students and non-first-generation Asian American students, and Asian American students who attend baccalaureate colleges report higher engagement levels than other types of institutions. Keywords: Asian American, diversity, first-generation, model minority myth, NSSE, persistence, retention, student engagement
-
Upload
khangminh22 -
Category
Documents
-
view
0 -
download
0
Transcript of Asian American Student Engagement on College Campuses
ASIAN AMERICAN STUDENT ENGAGEMENT IN COLLEGE
228
Asian American Student Engagement on College Campuses
Cassie Kao, EdD
Salem State University
Abstract
Based on the detrimental effects of stereotypes such as the model minority myth, the purpose of
this study was to examine the engagement rates of first-generation and non-first-generation
Asian American students at various types of institutions compared to their peers and to explore
whether the engagement rate differs depending upon institution type. The presumption of the
model minority myth dismisses the fact that Asian Americans are not only extremely
heterogenous in terms of race and ethnicity but also the significant variation in terms of
academic achievement (Lee & Kumashiro, 2005). Although researchers have explored how
racism impacts higher education attainment of Black/African American and Hispanic/Latinx
students (Flores & Park, 2013; Naylor et al., 2015; Owens & Lynch, 2012; Wodtke, 2012),
limited research exists on noninternational Asian American students on college campuses. The
lack of research on Asian American college students contributes to the perpetual
misconceptions of Asian Americans. This study identified areas where these students need
support and served to validate those needs. Using descriptive and inferential statistics, I
analyzed data from the Spring 2015 administration of the National Survey of Student
Engagement (NSSE). Findings suggest Asian American students who participated in this study
are not as engaged as their peers, there is a difference in the rates of engagement between
first-generation Asian American students and non-first-generation Asian American students, and
Asian American students who attend baccalaureate colleges report higher engagement levels
than other types of institutions.
Keywords: Asian American, diversity, first-generation, model minority myth, NSSE,
persistence, retention, student engagement
ASIAN AMERICAN STUDENT ENGAGEMENT IN COLLEGE
229
ASIAN AMERICAN STUDENT ENGAGEMENT ON COLLEGE CAMPUSES
Institutions of higher education in the United States have not been as effective in
promoting academic success for students of color as they have for White students (National
Center for Education Statistics [NCES], 2016). In 2013, 63% of White students attending college
for the first time and pursuing their bachelor’s degree full-time graduated from the same
institution within 6 years, compared to 41% of Black students, 53% of Hispanic students, and
71% of Asian students (NCES, 2016). It is important to note data were for students who started
and ended at the same institution; data did not account for students who started at one
institution and then graduated from another, which highlight the topics of retention and
persistence.
Retention focuses on the institution and is a measure of how well an institution is
meeting the needs of and supporting its students (Kuh et al., 2006). These efforts can include
providing remedial courses to support students academically to the amount of financial
assistance available for students in need (Kuh et al., 2006). Persistence, on the other hand,
focuses on the student (Renn & Reason, 2013), the activities in which they engage, and the
friendships they develop during their time at school (Kuh et al., 2006). The key distinction is
colleges and universities measure retention by whether students graduate from the institutions
where they began, whereas students may measure their persistence based on whether they
reached the goals they set out for themselves. Where students’ goals do not include graduating
from the institution is where retention and persistence deviate from each other. However, one
strategy to increase retention is student engagement (Hu, 2010), which is integral to students’
persistence (Tinto, 2000); those who are engaged in student engagement activities are more
likely to persist and graduate from college (Harper, 2009; Quaye & Harper, 2015).
There are two components to student engagement: (a) the time and effort students put
into educational activities, and (b) the resources and efforts colleges and universities invest to
create educational opportunities for students (Kuh, 2001; Kuh et al., 2007). These educational

ASIAN AMERICAN STUDENT ENGAGEMENT IN COLLEGE
230
activities are intentional interactions institutions create for the benefit of the student and can
come in the form of high-impact practices (Kuh et al., 2006). Such high-impact practices allow
students to engage in their studies and develop personally, and these practices motivate
students to continue their time at the institution (Kuh, 2016). Students who engage in high-
impact practices on their college campuses benefit greatly (Kuh, 2009; Pascarella & Terenzini,
2005), particularly students of color, first-generation students, and students who are
academically underprepared (Kuh, 2009). In fact, Kuh et al. (2008) concluded engagement
positively affects academic performance and persistence, and “the effects are even greater for
lower ability students and students of color compared with White students” (p. 555). Such
findings are critical, as the demographic landscape of higher education has shifted and schools
have become increasingly diverse with a burgeoning population of students of color and more
students in need of greater support (Harper & Quaye, 2009).
Furthermore, many Asian American students arrive on college campuses without the
needed preparation, skills, or resources to succeed in college because the unique challenges
they face in society are overlooked (Museus, 2008; Yeh, 2005). Quaye et al. (2009) posited the
reason for this disparity is partly due to obstacles racial and ethnic minority students face,
including: (a) racial identity development, (b) being one of few racial/ethnic minority students, (c)
lack of same-race/ethnicity faculty, (d) curricular content, and (e) lack of culturally responsive
pedagogy. These obstacles impact their learning, particularly where stereotypes around race
and ethnicity intersect with perceived academic ability (Museus, 2008). When the Asian
American population is small on college campuses compared to the rest of the student
population, Asian Americans may feel undue attention and may feel they represent the entire
Asian race when they speak (Iwamoto & Liu, 2010). This tremendous pressure can create a
situation that may cause Asian American students to shut down (Wei et al., 2011) and not
participate in class. In addition, the prevailing belief all Asians do well in school can cause fear
and insecurities for those who struggle academically or who are unable to grasp a concept in
ASIAN AMERICAN STUDENT ENGAGEMENT IN COLLEGE
231
class. The internal battle between the ability of the individual student and expectations of others
hinders a student’s willingness to seek help from others and causes them to struggle silently
(Museus, 2008). In other words, the model minority stereotype has a detrimental effect on the
desires of Asian American students to engage on campus (Museus, 2008), particularly in co-
curricular activities (Museus & Park, 2015). It may not be surprising that researchers in at least
one study found Asian Americans the least engaged student population on college campuses
(Hu & McCormick, 2012). This lack of engagement is problematic, particularly as the issue
relates to retention and persistence. The more students are engaged on their campus, the more
they will persist in their goals, which translates to institutions retaining their students. For a
population forecasted to grow in the coming decades (Ortman & Guarneri, n.d.), coupled with
competing with other institutions to enroll enough students to stay operational, how institutions
provide opportunities to its Asian students is critical. Certainly, the cost to recruit students is
greater than the cost to retain students (Ruffalo Noel Levitz, 2016).
For Asian American students, the model minority myth presumes Asian Americans not
only have a strong work ethic but also that they are innately intelligent and motivated and
therefore not in need of student support services (Maramba & Palmer, 2014; Wells & Horn,
2015). This presumption attempts to dismiss systemic racism and instead focuses on individual
shortcomings as the reason why people of color are unable to match their White counterparts in
terms of academic achievement (Museus, 2008; Museus & Park, 2015; Wong et al., 1998). This
myth also advances the notion Asian Americans do not experience racism and therefore appear
to be as successful as White Americans, all the while dismissing the effort Asian American
students apply to their academics (Museus & Park, 2015). However, Asian Americans are
regularly subjected to subtle racism, “including members of society rejecting their interethnic
differences (‘all Asians look alike’), ascribing them intelligence (‘you people always do well in
school’), and denying their racial realities (‘Asians are the new Whites and do not face
discrimination’)” (Museus & Park, 2015, p. 552).
ASIAN AMERICAN STUDENT ENGAGEMENT IN COLLEGE
232
Besides contending with stereotypical myths, students who are also first-generation
students have an additional layer of obstacles to overcome; in the context of higher education,
“first-generation status” refers to the educational attainment (or lack thereof) of the students’
parents. Specifically, the status refers to students whose parents either have less than a
bachelor’s degree or less than a high school diploma (NSSE, 2018). First-generation students
are less likely to persist and graduate and less engaged overall (Pike & Kuh, 2005). For first-
generation Asian American students, there may be additional distinct challenges (e.g., a
language barrier, their cultural upbringing) because the growth of the Asian population in the
United States has two main sources—immigration and refugee resettlement (Iwamoto & Liu,
2010; Lee & Kumashiro, 2005). In both cases, English is not the primary spoken language (Lee
& Kumashiro, 2005; Redondo, 2008). Therefore, language barriers are a unique challenge for
Asian American students, and even more so for first-generation Asian American students
because mastering the English language is added to learning the “language” of higher
education (Pak et al., 2014; Yeh, 2005).
On the institutional level, this study highlights the need for colleges and universities to
commit resources to support Asian Americans, along with other students of color. Asian
Americans experience subtle racism on a regular basis (Museus & Park, 2015). From being
viewed as a perpetual foreigner and never being established as a “true American” (Iwamoto &
Liu, 2010; Museus & Park, 2015) to being regarded as high achieving, academically successful,
and naturally intelligent and motivated (Maramba & Palmer, 2014), much of what Asian
Americans on college campuses experience is overlooked, and their needs are not addressed.
The model minority myth places Asian Americans in an unrealistic utopic state in which it is
believed Asian American students are self-sufficient and able to succeed in college with minimal
support. Unfortunately, such a stereotype masks the undue pressure and feelings of inferiority
(Museus & Park, 2015) when the student’s reality diverges from society’s expectations. When
these two perspectives collide, Asian American students typically keep their struggles to
ASIAN AMERICAN STUDENT ENGAGEMENT IN COLLEGE
233
themselves, which could be due to the fear of bringing disappointment to their parents or
families, fear of not meeting society’s expectations, and/or fear of playing into the negative
stigma of counseling (Iwamoto & Liu, 2010; Yeh, 2005). As such, the needs of Asian Americans
are unique and require further understanding of their personal experiences.
By identifying such needs and exploring their rate of engagement, this study adds to the
limited research on Asian American students and their levels of student engagement.
Researchers have studied other students of color (Flores & Park, 2013; Naylor et al., 2015;
Owens & Lynch, 2012; Wodtke, 2012), and this study serves to validate whether student
engagement is a predictor of success for all students, including Asian American students.
Additionally, this research is significant to extant literature on Asian American students as it
further conveys how the model minority myth is detrimental to student success.
Personally, the research is significant because I have first-hand experience of being a
first-generation Asian American woman in U.S. higher education. Too often, I have encountered
situations in which my needs were overlooked, and I was unable to access resources, and this
was also true for other Asian Americans in my community. Likely, situations like these occur
because of the prevailing belief Asian Americans have already attained a high level of
achievement compared to other students of color. As a result, I see the struggle of Asian
American students and desire to do my part in highlighting unique challenges Asian American
students face so their needs can be met.
The purpose of this study was to examine engagement rates of first-generation and non-
first-generation Asian American students at various types of institutions compared to their peers.
Specifically, the questions I proposed to examine were as follows:
1. How do Asian American students compare with their peers on their rate of student
engagement on college campuses?
2. Is there a difference in the rates of engagement between first-generation Asian
American students and non-first-generation Asian American students?
ASIAN AMERICAN STUDENT ENGAGEMENT IN COLLEGE
234
To answer these questions, I employed a quantitative research inquiry for this study with
the following null hypotheses:
1. There is no significant difference in the rate of student engagement between Asian
American students and their peers at different types of institutions.
2. There is no significant difference in the rate of student engagement between first-
generation Asian American students and non-first-generation Asian American
students.
Literature Review
The purpose of this study was to examine engagement rates of first-generation and non-
first-generation Asian American students at various types of institutions compared to their peers.
To effectively conduct this study, I explored extant literature on student engagement theory and
Asian American students.
Student Engagement Theory
Student engagement in and of itself is a complex area of study because of the various
approaches to understanding what engagement is (Kahu, 2013). Axelson and Flick (2011)
reported a lack of understanding of the relationship between engagement and student learning
because the “current definitions of engagement are too abstract, the relationship between
engagement and learning too poorly understood, to fully guide us” (p. 43). Thankfully, additional
researchers have defined student engagement (Harper & Quaye, 2009; Hu & McCormick, 2012;
Kahu, 2013; Kuh, 1995, 2001; Quaye & Harper, 2015). To define student engagement, one first
must start with and acknowledge the work of Astin’s (1984) student involvement theory.
Student involvement theory focuses on what students do and how they spend their time
in college, or “the amount of physical and psychological energy that the student devotes to the
academic experience” (Astin, 1984, p. 297). The premise has been Astin’s (1993) input-
environment-output (IEO) model, with the belief what students do and how they spend their time
(i.e., inputs) within institutional constructs and campus opportunities (i.e., environment) will
ASIAN AMERICAN STUDENT ENGAGEMENT IN COLLEGE
235
affect their outcome (i.e., outputs; Quaye & Harper, 2015; Renn & Reason, 2013). Since the
initial conception of student involvement theory, researchers have conducted additional studies
and distinguished between student involvement and student engagement. In this sense, the
focus of engagement is not only on the output but also on student learning and the responsibility
of both the students and the institutions to create these opportunities for student learning (Kuh
et al., 2007; Quaye & Harper, 2015). Hayek (2001, as cited in Pike et al., 2006) found a positive
correlation between retention, persistence, and graduation and the “expenditures for instruction,
research, academic support, and institutional support” (p. 849). Instead of focusing solely on
what students do and how they spend their time, the inputs also include who students are and
experiences they bring with them to a college campus.
The environment includes the college campus, the campus culture, and educational
opportunities institutions have created to enhance the student experience. These opportunities
come in the form of high-impact programs and initiatives (Kuh, 2008). High-impact practices
“typically demand considerable time and effort, facilitate learning outside of the classroom,
require meaningful interactions with faculty and other students, encourage collaboration with
diverse others, and provide frequent and substantive feedback” (National Survey of Student
Engagement [NSSE], 2015a, p. 1). The outputs are student learning, student development, and
persistence to graduation (Kuh, 2016; Kuh et al., 2006). Kuh (2008) identified 10 high-impact
practices effective in deepening the student experience: (a) first-year seminars and
experiences, (b) common intellectual experiences, (c) learning communities, (d) writing-
intensive courses, (e) collaborative assignments and projects, (f) undergraduate research, (g)
diversity/global learning, (h) service learning and community-based learning, (i) internships, and
(j) capstone courses and projects.
National Survey of Student Engagement
The NSSE (2017a), developed in 1998 through a grant from the Pew Charitable Trusts,
is an instrument used to measure student engagement in the curricular and cocurricular
ASIAN AMERICAN STUDENT ENGAGEMENT IN COLLEGE
236
activities “linked to student learning” (para. 1). The survey is given to first-year and senior
students and the data collected serve several purposes: (a) provide information to schools so
they can focus on areas to improve when it comes to the undergraduate experience, (b) present
information that can be easily understood by parents and prospective students, and (c) allow
institutions to compare with other like schools to see how they fare (Kuh, 2001). To provide this
information effectively, NSSE (2017b) developed five benchmarks: (a) level of academic
challenge, (b) active and collaborative learning, (c) student interactions with faculty members,
(d) enriching educational experiences, and (e) supportive campus environment. Researchers
have concluded NSSE benchmarks of student engagement are important in contributing to
student learning and development (Hu & McCormick, 2012; Kuh, 2001; Pike et al., 2011).
However, in 2013, NSSE made significant changes to these benchmarks and instead created
engagement indicators grouped under the following four engagement themes: (a) Academic
Challenge, (b) Learning With Peers, (c) Experiences With Faculty, and (d) Campus Environment
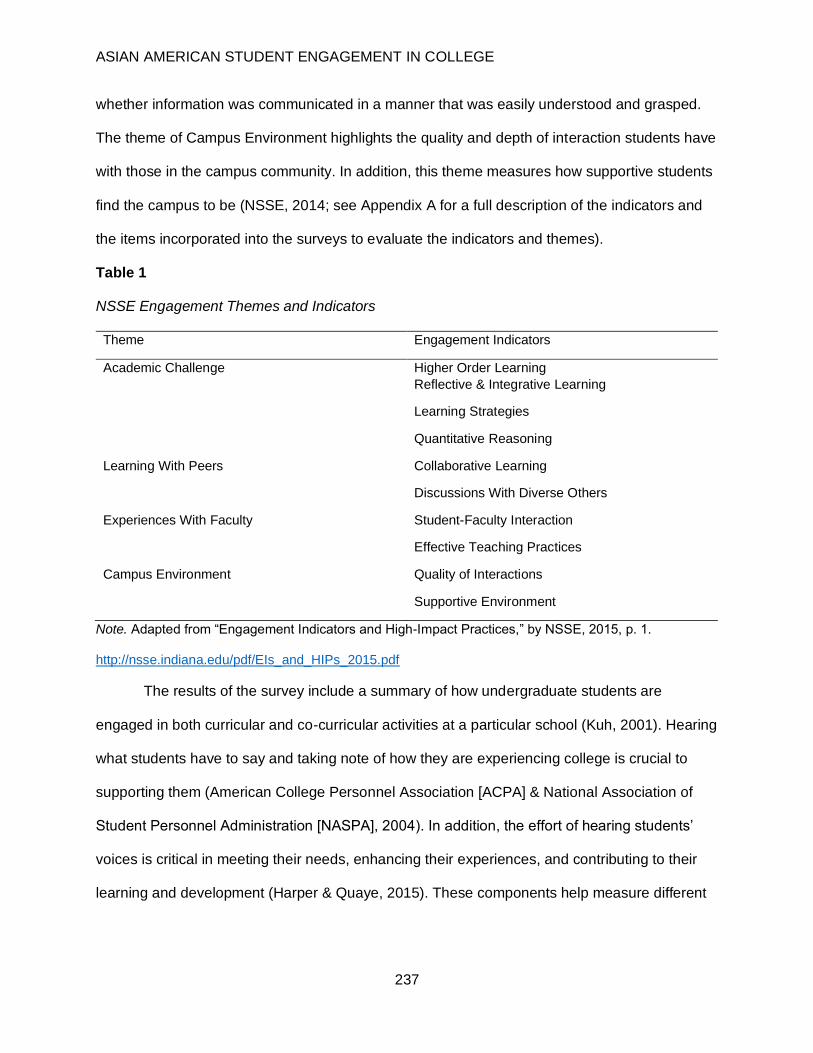
(NSSE, 2014, 2017c). Table 1 shows the engagement themes and their associated indicators.
The different questions asked in surveys connect to these engagement themes and
indicators. The theme of Academic Challenge measures the amount of effort students put into
their studies (i.e., how much time they spend reading, writing, and studying). The survey
includes questions about the rigor of their coursework, such as the degree to which they applied
theories or facts to solve problems, the opportunities they had to reflect on the impact of topics
covered in class on their own lives, what their study habits are, and the frequency of analyzing
numerical information from which to draw conclusions. The theme of Learning With Peers
measures how students learn. The survey includes questions on whether students have worked
with their peers on assignments and how often they have interacted with peers from a different
background. The theme of Experiences With Faculty includes questions about conversations
students have had with faculty on their career path and/or academic performance. Under this
theme, students can also evaluate professors on their teaching effectiveness and evaluate
ASIAN AMERICAN STUDENT ENGAGEMENT IN COLLEGE
237
whether information was communicated in a manner that was easily understood and grasped.
The theme of Campus Environment highlights the quality and depth of interaction students have
with those in the campus community. In addition, this theme measures how supportive students
find the campus to be (NSSE, 2014; see Appendix A for a full description of the indicators and
the items incorporated into the surveys to evaluate the indicators and themes).
Table 1
NSSE Engagement Themes and Indicators
Theme Engagement Indicators
Academic Challenge Higher Order Learning
Reflective & Integrative Learning
Learning Strategies
Quantitative Reasoning
Learning With Peers Collaborative Learning
Discussions With Diverse Others
Experiences With Faculty Student-Faculty Interaction
Effective Teaching Practices
Campus Environment Quality of Interactions
Supportive Environment
Note. Adapted from “Engagement Indicators and High-Impact Practices,” by NSSE, 2015, p. 1.
http://nsse.indiana.edu/pdf/EIs_and_HIPs_2015.pdf
The results of the survey include a summary of how undergraduate students are
engaged in both curricular and co-curricular activities at a particular school (Kuh, 2001). Hearing
what students have to say and taking note of how they are experiencing college is crucial to
supporting them (American College Personnel Association [ACPA] & National Association of
Student Personnel Administration [NASPA], 2004). In addition, the effort of hearing students’
voices is critical in meeting their needs, enhancing their experiences, and contributing to their
learning and development (Harper & Quaye, 2015). These components help measure different
ASIAN AMERICAN STUDENT ENGAGEMENT IN COLLEGE
238
aspects of student engagement, which is important particularly as more and more diverse
students are attending higher education.
Asian Americans
In the United States, Asian Americans are the fastest growing racial group and
represented the fastest growing population between 1990 and 2000 (U.S. Census Bureau,
2002). By 2050, the population of Asian Americans in this country is estimated to almost double,
from almost 17.5 million to almost 34 million (Ortman & Guarneri, n.d.). Furthermore, the
projected fall enrollment of Asian Americans in postsecondary institutions is expected to
increase by 8.3%, from 1,284,000 in 2017 to 1,391,000 in 2023 (Snyder & Dillow, 2015). With
more than 50 ethnic, language, religious groups within this racial category, Asian Americans are
quite heterogeneous (Lee & Kumashiro, 2005). There are also categorizations of Asian
American ethnic identities (e.g., East Asians, South Asians, Southeast Asians) that have been
identified.
It is important to note, however, that racial groups are socially constructed, which means
racial categories is a concept that people and society have created (Oxford Dictionary, 2017).
The Asian American race is no exception, particularly as the term Asian has implications (i.e.,
geographical origin, physical characteristics, or cultural practices; Jo, 2004). In 1977, there were
four main racial categories on which the federal government sought to collect data (i.e., White,
Black, American Indian or Alaskan Native, and Asian or Pacific Islanders). Without explanation,
the “or” in “Asian or Pacific Islanders” began being replaced by “and,” or the two conjunctions
would be used interchangeably (Hall, 2015). Because federal agencies sought to place people
in concise, mutually exclusive boxes by having them self-identify as White, Black, American
Indian or Alaskan Native, and Asian or Pacific Islander, “Asian” and “Pacific Islander” were
placed together as a category. However, the population of Pacific Islanders is quite small and
“exist[s] as only 3 percent of the imagined ‘AAPI’ grouping” (Hall, 2015, p. 745). This distinction
in racial categorization is important to bring up because some extant literature still combine
ASIAN AMERICAN STUDENT ENGAGEMENT IN COLLEGE
239
these two racial categories (Dugan & Komives, 2010; National Education Association, 2017;
Pang et al., 2011; Teranishi & Nguyen, 2012). Asians and Pacific Islanders confront different
challenges and stereotypes. In fact, whereas Asians are considered the model minority, Pacific
Islanders are believed to be savages and uneducated (Hall, 2015). Moreover, Pacific Islanders
“are not Asian American at all [emphasis in original]” (Hall, 2015, p. 741). Therefore,
aggregating these two identities together further masks the individual needs of the subgroups
under each.
The two main sources for the growth of the Asian population in the United States are
immigration and refugee resettlement (Iwamoto & Liu, 2010; Lee & Kumashiro, 2005), which
underscore challenges with language and cultural differences for many within this group.
Because English may not be the primary language spoken at home, proficiency in English is a
challenge, not only for immigrants and refugees but also for their children (Yeh, 2005). As much
as parents may value education as a means for an eventual better life for their children
(Museus, 2013), these parents may have a difficult time supporting their children in school for
several reasons: (a) they are working multiple jobs to provide for their families, (b) they have
little education themselves, or (c) the language barrier prevents them from communicating with
teachers or navigate the school system (Yeh, 2005). For refugees, the U.S. school system may
be unfamiliar territory and, coupled with a language barrier, can translate into little support for
the student (Museus, 2013). In addition, often, the expectation is for students to do well in
school and then adhere to their Asian culture when they are home (Park, 2008). Being exposed
to U.S. culture in school can conflict with family and cultural values at home. This conflict is a
form of cognitive dissonance because there is a level of discomfort that motivates students to
find a means to resolve inconsistencies they experience (Desai, 2015; Hoshino-Browne, 2012;
Luttrell, 2016). Cognitive dissonance theory (Festinger, 1957; Festinger & Carlsmith, 1959)
pertains to the idea humans value consistency and will do what they need to do to ensure their
behavior matches what they believe. When these two elements do not match, a tension
ASIAN AMERICAN STUDENT ENGAGEMENT IN COLLEGE
240
presents itself and motivates a change in attitude so the attitude and behavior line up (Hoshino-
Browne, 2012). For Asian American students in particular, the clash in culture (i.e., culture
cognitive dissonance) “impedes learning and success in U.S. educational settings, especially
given that the setting refuses to adapt to the diversity of its student body” (S. Spears, personal
communication, August 8, 2018).
Asian Americans extremely heterogeneous in terms of race and ethnicity, and there is
also significant variation regarding academic achievement. Asian Americans make up 5.5% of
the U.S. population, and about 20% of that population attends Ivy League schools (Zhou & Lee,
2017). On the other hand, according to census data reported by Reeves and Bennett (2004),
13.3% of Asian Indians, 12.7% of Filipinos, 8.9% of Japanese, 13.7% of Koreans, 53.3% of
Cambodians, 59.6% of Hmong, 49.6% of Laos, and 38.1% of Vietnamese over 25 years of age
have less than a high school education (p. 12). Many factors can influence such a low
educational attainment; however, an important factor is stereotypes. Often, students of color
must combat these presumptions to prove their academic capabilities (Quaye et al., 2015).
Some Asian American students are regularly subjected to more subtle racism (Museus &
Park, 2015), while others may experience overt racism. Perhaps as a result of the model
minority myth, Asian Americans have encountered barriers to accessing and receiving student
support services (Maramba & Palmer, 2014; Wells & Horn, 2015). Museus and Park (2015)
conveyed the following:
[The] model minority myth negatively influences the experiences of Asian American
undergraduates by fueling assumptions that they are socially inept, are naturally geared
toward math and science, are genetically predisposed to excel academically, and
therefore should not need or ask for help. (pp. 565–566)
Not only do Asian Americans struggle with navigating challenges of school and their families,
but they also face the assumptions that come with the model minority myth. When the
overarching belief is all Asians are academically inclined, but Asian American students do not

ASIAN AMERICAN STUDENT ENGAGEMENT IN COLLEGE
241
view themselves living up to that standard, they can internalize the stereotype (Shen, 2015) and
feel embarrassed or inadequate (Wei et al., 2011). The subtle racism Asian Americans
experience creates unique challenges for these students of color, particularly as they
experience higher levels of psychological distress (Liang et al., 2007; Witkow et al., 2015). They
may be counted as people of color and used to help promote diversity on campus; at the same
time, they may intentionally be excluded from services geared toward minority students, such as
programming efforts and academic support (Pak et al., 2014). Other times, they are viewed as
nonracial or not “real” minorities (Cabrera, 2014).
On the one hand, the message to Asian Americans is they matter on campus in terms of
being added to the diversity count, but on the other hand, they are simply receivers of hollow
words because of the lack of effort to validate them and their needs. These presumptions are
problematic and impact the leadership development and self-identity of Asian American
students (Chung, 2014; Kodama & Abreo, 2009; Li et al., 2014; Museus & Park, 2015). As a
result, Asian American students report lower rates of satisfaction in their college experience
(Ancis et al., 2000), have negative racial experiences at college (Johnston & Yeung, 2014), and
are found to be the most disengaged on college campuses in at least one study related to
student engagement (Hu & McCormick, 2012).
First-Generation Status
Another population in higher education that seems to be less engaged overall and less
likely to persist and graduate are first-generation students (Pike & Kuh, 2005). There are unique
challenges first-generation students face. First of all, first-generation status refers to the
educational attainment of the student’s parents. The NSSE (2018) defined first-generation as
either of the following:
• Highest level of education for either parent is less than a bachelor’s degree (parents
may have some postsecondary education)
ASIAN AMERICAN STUDENT ENGAGEMENT IN COLLEGE
242
• Highest level of education for either parent is a high school diploma or less (parents
have no experience in postsecondary education)
Because first-generation students may be the first in their families to go to college, they have
less knowledge about every aspect of college (i.e., from enrollment to life on a college campus)
and receive little to no guidance from their parents (Pascarella & Terenzini, 2005). Cultural
capital, which refers to “the symbols, ideas, tastes, and preferences that can be strategically
used as resources in social action” (Oxford Reference, 2018, para. 1), is, therefore, at a lower
rate. They also arrive to campus with more self-doubt and lower degree aspirations, which
results in lower retention rates, and they are less likely to complete a bachelor’s degree within 4
years (Ishitani, 2006). Furthermore, first-generation students may feel academically
underprepared, and many choose to focus entirely on academic endeavors and do not
participate in co-curricular activities (Hawkins & Larabee, 2009). The implication of this lack of
engagement results in first-generation students “making less progress in their learning and
intellectual development” (Pike & Kuh, 2005, p. 289).
First-Generation Asian American Students
What happens when a student is first-generation and Asian American? The challenges
of intersectionality between first-generation status and race can create even more complex
hardships for students. As first-generation students, they may seemingly face challenges due to
low cultural capital received from their parents. As first-generation students, they may feel self-
doubt in their ability to navigate a college campus—much less navigate college courses—
because no other family member can tell them what to expect or provide advice about course
selection, financial aid, and offices on campus that can serve as resources. This challenge is
compounded if this same person is Asian American because language may be a barrier that
prevents them from asking for help. For those who do not have well-educated parents, the
factors that may deter first-generation Asian Americans from engaging with faculty are a lack of
understanding of the school system and having other responsibilities outside of school (Chang,
ASIAN AMERICAN STUDENT ENGAGEMENT IN COLLEGE
243
2005). In addition, experiencing subtle racism and a lack of support from the campus community
and having to maneuver a campus culture that is different than their upbringing as Asian
Americans adds to the complexities of these two intersecting identities. First-generation
immigration status can also be arduous.
Although some families immigrated to the United States, this fact does not necessarily
mean the parents have not gone to college; they could have attended college in their home
countries. Therefore, these students may not identify as first-generation students according to
the definition of first-generation students in higher education. However, the effect of not being
familiar with postsecondary education in the United States may be very similar to the effect of
being a first-generation student. This study explored whether first-generation Asian American
students were less likely to participate in curricular and co-curricular activities than their non-
first-generation Asian American peers.
Conclusions
To adequately serve the current student body, institutions have an obligation to increase
support systems for varying sets of needs and experiences these students bring with them
(Quaye & Harper, 2015). Part of this effort is also because institutions recognize a diverse
student body will help prepare all students to be global citizens and improve educational
outcomes for all students. This effort to “uncover inequities in student success, identify effective
educational practices, and build such practices organically for sustained institutional change”
(Association of American Colleges & Universities, 2017, para. 2) is inclusive excellence. One
way colleges initially attempted to increase the diversity on their campuses was through
affirmative action practices, which favored admitting minorities or underrepresented students of
color to their institution. Initially, this practice was seen as simply denying White students to
make room for minorities who were less qualified to atone for past injustices (Bok, 2013). In fact,
Gratz v. Bollinger, 539 U.S. 244 was a high-profile lawsuit against University of Michigan in
2003 that “put an end to [their] point-based undergraduate admission system that automatically

ASIAN AMERICAN STUDENT ENGAGEMENT IN COLLEGE
244
gave Black students points based on their race” (Allen, 2014, para. 3). However, recent
practices favor minorities who are qualified, and the Supreme Court has made it clear that the
use of race cannot be the sole consideration of a student’s admission to an institution.
Furthermore, Bok (2013) referenced what Supreme Court Justice Sandra Day O’Connor wrote
about a court case, outlining advantages of admitting minorities or underrepresented students of
color:
Minority preferences benefit the society in two important ways. They contribute to the
diversity of the student body by bringing different perspectives and experiences to the
campus that broaden the understanding of all students and help them learn to live and
work effectively with persons different from themselves. (p. 130)
College is certainly the place to live and work effectively with others who are different. In fact,
“college attendance, independent of numerous other factors, promotes racial understanding and
openness to diversity as well as the belief that racism remains a societal problem” (Pascarella &
Terenzini, 2005, p. 581). In a global world, exposure to different viewpoints and different people
is extremely important, especially given people are naturally diverse (Robinson, 2013) in race
and ethnicity, cultural upbringing, religion, sexual identity, age, and so on. Exposure to people
from different backgrounds is inevitable as the demographic landscape of higher education
shifts and changes.
Increasingly, students are being encouraged to apply to college because of the
prevailing belief one needs more than a high school diploma to succeed in the workplace (Baum
et al., 2013; The Pell Institute & Penn AHEAD, 2015). Gone are the days when higher education
was reserved solely for White men to be trained (Renn & Reason, 2013). Higher education in
the United States broadened the demographics of eligible students when it created what are
known today as historically Black colleges and universities (HBCUs). Minority-serving
institutions do not simply stop with HBCUs—they also include tribal colleges and universities ,
Hispanic-serving institutions, and Asian American and Native American Pacific Islander-serving

ASIAN AMERICAN STUDENT ENGAGEMENT IN COLLEGE
245
institutions (AANAPISIs; Renn & Reason, 2013). At the same time, however, more and more
students of color and students from underserved communities are arriving on campus without
the needed preparation “to succeed in college-level courses, creating difficult problems for those
who must try to remedy their academic deficiencies” (Bok, 2013, p. 79). As a result, institutions
are finding they need to be creative in supporting all the needs these populations present during
their journey to degree completion to close the equity gap present in higher education.
Methodology
Purpose
The purpose of this study was to examine the engagement rates of first-generation and
non-first-generation Asian American students at various types of institutions compared to their
peers. To examine the rates of engagement, this study sought to answer the following
questions:
1. How do Asian American students compare with their peers on their rate of student
engagement on college campuses?
2. Is there a difference in the rates of engagement between first-generation Asian
American students and non-first-generation Asian American students?
To answer these questions, this study relied on existing data from a nationally administered
survey, which allowed findings from the data analysis to be generalized to the population. In
addition, I used descriptive statistics and statistical inference. Descriptive statistics are an
approach to formulate and present numerical data in an easy-to-read format. A descriptive
design reveals measures of central tendency, which were important in answering the research
questions. The use of statistical inference allowed findings from the sample to be applied to the
defined population (i.e., Asian American students) to draw conclusions.
Research Design
This study was both a descriptive and inferential statistical study. For this survey design,
the unit of analysis was undergraduate, first-year, and senior students at varying institutions.
ASIAN AMERICAN STUDENT ENGAGEMENT IN COLLEGE
246
The data source was the Spring 2015 NSSE administration as reported in The College Student
Report (NSSE, 2015b).
The NSSE is a survey that allows a sample of students at participating institutions in the
United State and Canada to self-report activities in which they are engaged, how they are
learning, and the quality of their experiences at school. Responses from survey questions on
curricular and co-curricular activities align with NSSE’s 10 engagement indicators (see
Appendix A for a description of indicators).
Each survey consisted of at least 111 questions (more, if an institution chose), and these
questions gathered data in the following five categories: (a) participation in dozens of
educationally purposeful activities, (b) institutional requirements and the challenging nature of
coursework, (c) perceptions of the college environment, (d) estimates of educational and
personal growth since starting college, and (e) background and demographic information
(NSSE, 2017d).
There were 47 questions asked in the 2015 NSSE administration that were tied to the 10
engagement indicators—(a) Collaborative Learning, (b) Reflective and Integrative Learning, (c)
Student-Faculty Interaction, (d) Higher Order Learning, (e) Effective Teaching Practices, (f)
Quantitative Reasoning, (g) Discussions With Diverse Others, (h) Learning Strategies, (i)
Quality of Interactions, and (j) Supportive Environments. See Appendix A for the full list of
questions tied to the specific engagement indicator.
Methods
In 1998, the thought of creating a survey tool to measure undergraduate education was
conceived and supported by a grant from The Pew Charitable Trusts. This survey,
The College Student Report, was launched in 2000 after a successful pilot the year prior with
about 175 schools participating (NSSE, 2017a). Since that time, NSSE has been successful at
measuring the quality of the undergraduate experience, specifically “the investment that
institutions make to foster proven instructional practices and the kinds of activities, experiences,
ASIAN AMERICAN STUDENT ENGAGEMENT IN COLLEGE
247
and outcomes that their students receive as a result” (NSSE, 2017d, para. 2). Those who
helped draft the survey instrument were Alexander Astin, Gary Barnes, Arthur Chickering, Peter
Ewell, John Gardner, George Kuh, Richard Light, Ted Marchese, and C. Robert Pace. They
were successful in creating a survey that:
• consists principally of items that are known to be related to important college
outcomes (NSSE, 2017d, para. 8),
• is administered to students at both public and private 4-year colleges and universities
(NSSE, 2017d, para. 11),
• is administered to freshman- and senior-level students who have attended the
institution for at least two terms (NSSE, 2017d, para. 12),
• is administered to adequate samples at participating institutions (NSSE, 2017d, para.
13),
• is flexible (NSSE, 2017d, para. 14), and
• is administered by a credible third-party survey organization (NSSE, 2017d, para.
15).
The engagement indicators the NSSE uses have undergone rigorous testing—both
quantitatively and qualitatively—through focus groups, interviews with students, and multiple
years of testing and analysis. Furthermore, the NSSE has administered statistical tests to
determine the validity, reliability, and stability of the surveys used.
Participants and Setting
There were 564 institutions in the United States that participated in the 2015 NSSE
survey administration, which was the data used for this study. The NSSE’s sampling
methodology required institutions to either provide a roster of all first-year and senior students or
provide a random selection of equal proportions from these two categories of students based on
the total undergraduate enrollment number. In 2015, all but four participating institutions
ASIAN AMERICAN STUDENT ENGAGEMENT IN COLLEGE
248
recruited all of their first-year and senior students via email, while the other four participating
institutions recruited students via standard mail. Institutions had the option of using their
learning management systems or student portals to recruit students for the survey. Across all
participating institutions, nearly 1.4 million students were invited to complete the survey via
email with a series of reminders.
Ultimately, a total of 300,543 students accepted the invitation and responded; 43% were
first-year students and 57% were seniors. The average response rate was shy of 30%. The
student characteristics based on race/ethnicity for those who participated in the 2015 NSSE
were as follows: African American/Black (9%), American Indian/Alaska native (1%), Asian (5%),
Native Hawaiian/other Pacific Islanders (< 1%), Caucasian/White (65%), Hispanic/Latino (13%),
Multiracial/Multiethnic (3%), and Foreign/Nonresident Alien (4%; NSSE, 2017d). Furthermore,
46% of the students who participated in the 2015 NSSE survey administration self-identified as
first-generation college students (NSSE, 2015c).
The Center for Postsecondary Research at Indiana University’s School of Education
provided a dataset of core NSSE survey items and scales, institution-provided variables (i.e.,
sex, race/ethnicity, enrollment status, class level), and institution-level variables (i.e., Basic 2010
Carnegie type, control, enrollment size in categories). This dataset was a 20% random selection
of all eligible first-year and senior U.S. students who completed NSSE in 2015, which equaled
47,306 participants. Of these participants, 36.4% (n = 17,096) were first-year students, while
52.2% (n = 24,520) were senior students. In addition, 86.7% of the survey participants (n =
41,003) indicated they were full-time students.
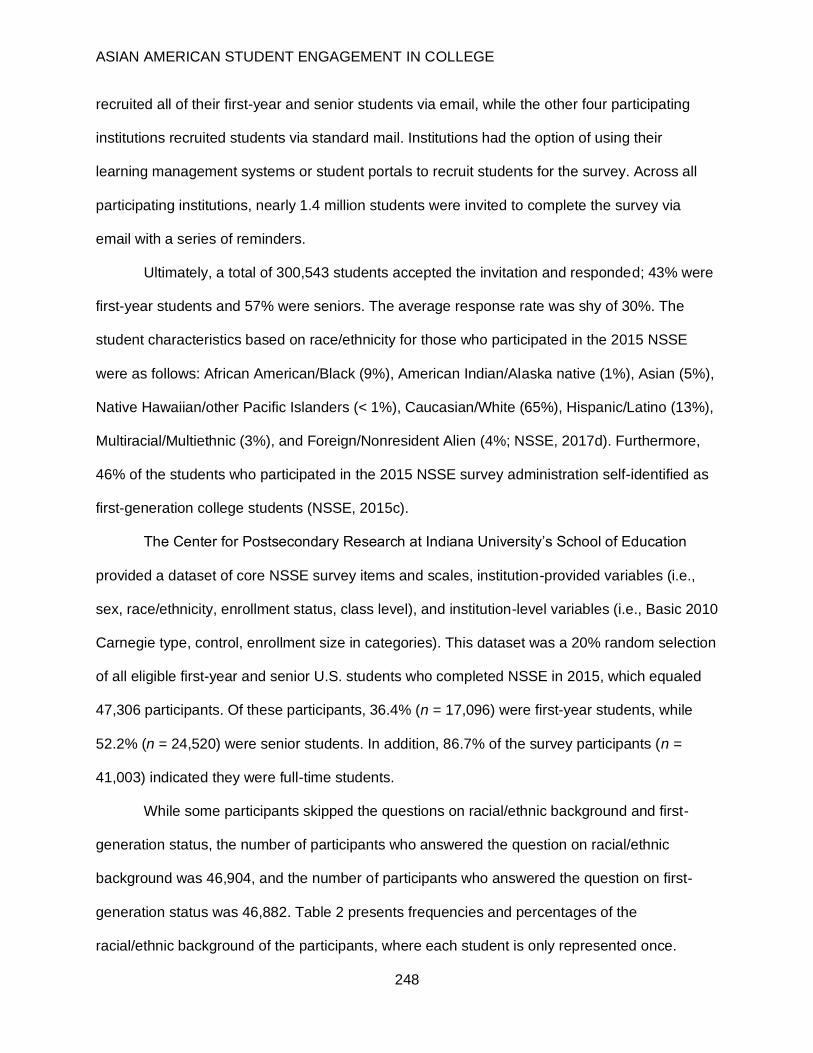
While some participants skipped the questions on racial/ethnic background and first-
generation status, the number of participants who answered the question on racial/ethnic
background was 46,904, and the number of participants who answered the question on first-
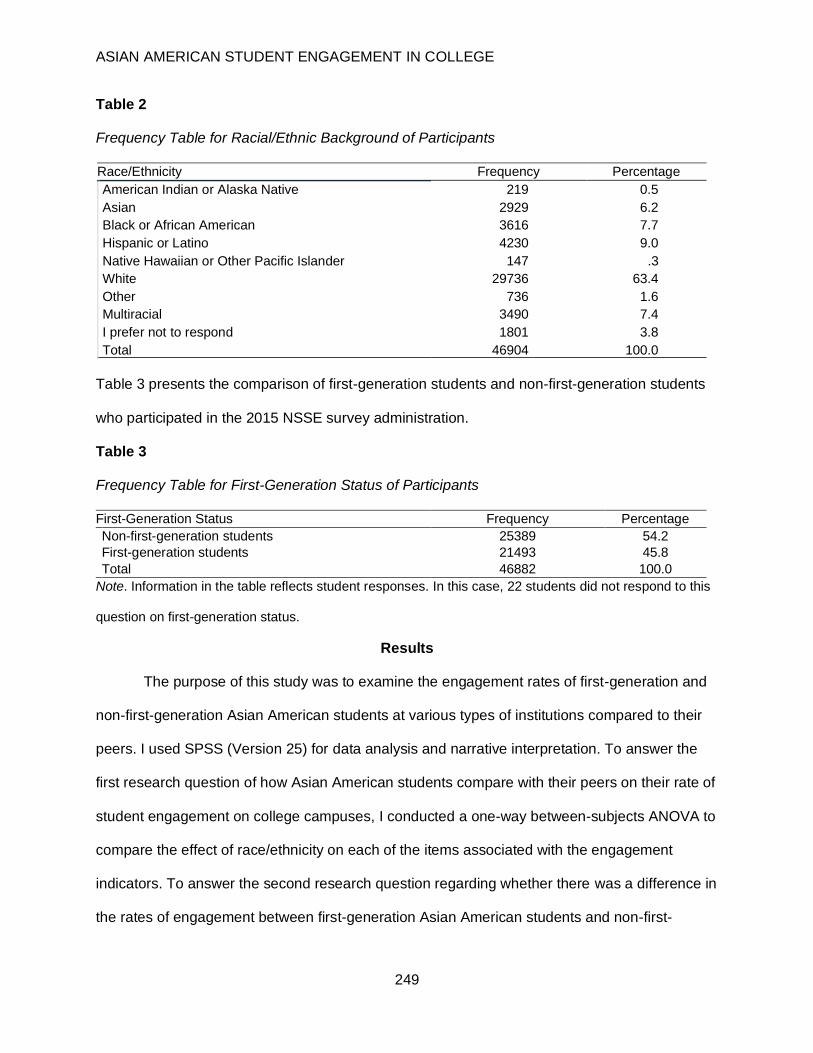
generation status was 46,882. Table 2 presents frequencies and percentages of the
racial/ethnic background of the participants, where each student is only represented once.
ASIAN AMERICAN STUDENT ENGAGEMENT IN COLLEGE
249
Table 2
Frequency Table for Racial/Ethnic Background of Participants
Race/Ethnicity Frequency Percentage
American Indian or Alaska Native 219 0.5
Asian 2929 6.2
Black or African American 3616 7.7
Hispanic or Latino 4230 9.0
Native Hawaiian or Other Pacific Islander 147 .3
White 29736 63.4
Other 736 1.6
Multiracial 3490 7.4
I prefer not to respond 1801 3.8
Total 46904 100.0
Table 3 presents the comparison of first-generation students and non-first-generation students
who participated in the 2015 NSSE survey administration.
Table 3
Frequency Table for First-Generation Status of Participants
First-Generation Status Frequency Percentage
Non-first-generation students 25389 54.2
First-generation students 21493 45.8
Total 46882 100.0
Note. Information in the table reflects student responses. In this case, 22 students did not respond to this
question on first-generation status.
Results
The purpose of this study was to examine the engagement rates of first-generation and
non-first-generation Asian American students at various types of institutions compared to their
peers. I used SPSS (Version 25) for data analysis and narrative interpretation. To answer the
first research question of how Asian American students compare with their peers on their rate of
student engagement on college campuses, I conducted a one-way between-subjects ANOVA to
compare the effect of race/ethnicity on each of the items associated with the engagement
indicators. To answer the second research question regarding whether there was a difference in
the rates of engagement between first-generation Asian American students and non-first-
ASIAN AMERICAN STUDENT ENGAGEMENT IN COLLEGE
250
generation Asian American students, I conducted independent samples t-tests to compare each
of the engagement indicators for first-generation Asian American students with non-first-
generation Asian American students. Of all 47 engagement indicators and their corresponding
items, nine variables showed statistically significant differences.
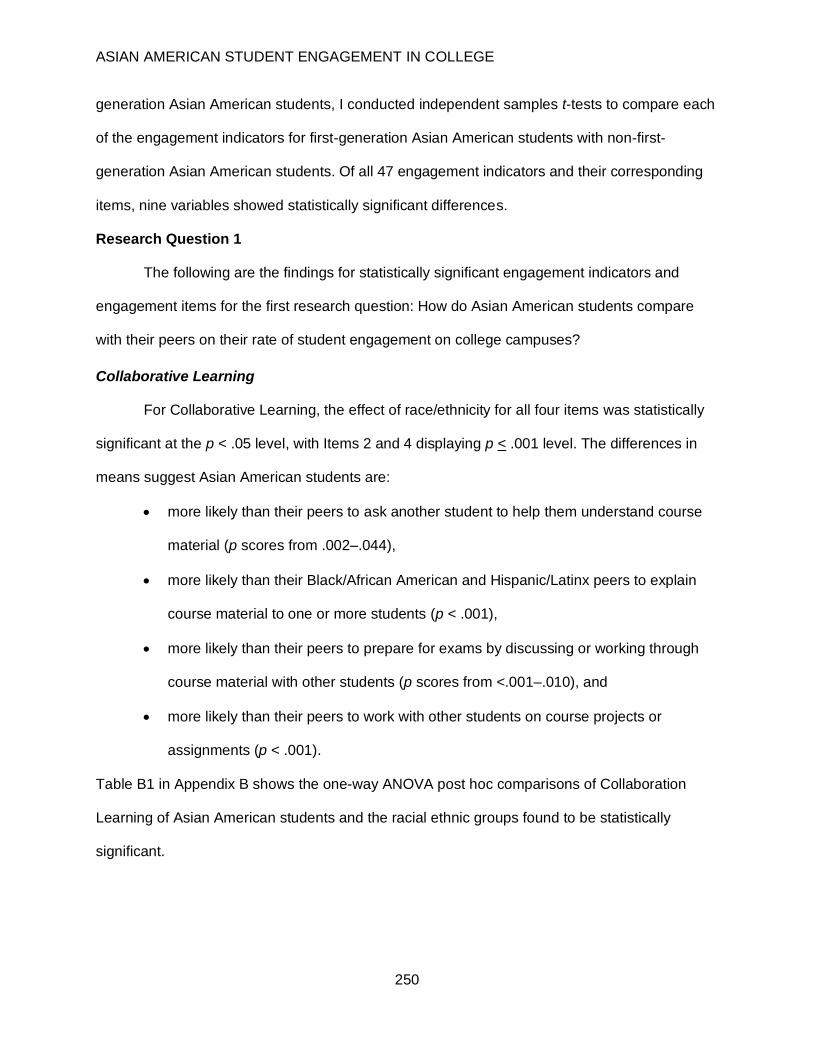
Research Question 1
The following are the findings for statistically significant engagement indicators and
engagement items for the first research question: How do Asian American students compare
with their peers on their rate of student engagement on college campuses?
Collaborative Learning
For Collaborative Learning, the effect of race/ethnicity for all four items was statistically
significant at the p < .05 level, with Items 2 and 4 displaying p < .001 level. The differences in
means suggest Asian American students are:
• more likely than their peers to ask another student to help them understand course
material (p scores from .002–.044),
• more likely than their Black/African American and Hispanic/Latinx peers to explain
course material to one or more students (p < .001),
• more likely than their peers to prepare for exams by discussing or working through
course material with other students (p scores from <.001–.010), and
• more likely than their peers to work with other students on course projects or
assignments (p < .001).
Table B1 in Appendix B shows the one-way ANOVA post hoc comparisons of Collaboration
Learning of Asian American students and the racial ethnic groups found to be statistically
significant.
ASIAN AMERICAN STUDENT ENGAGEMENT IN COLLEGE
251
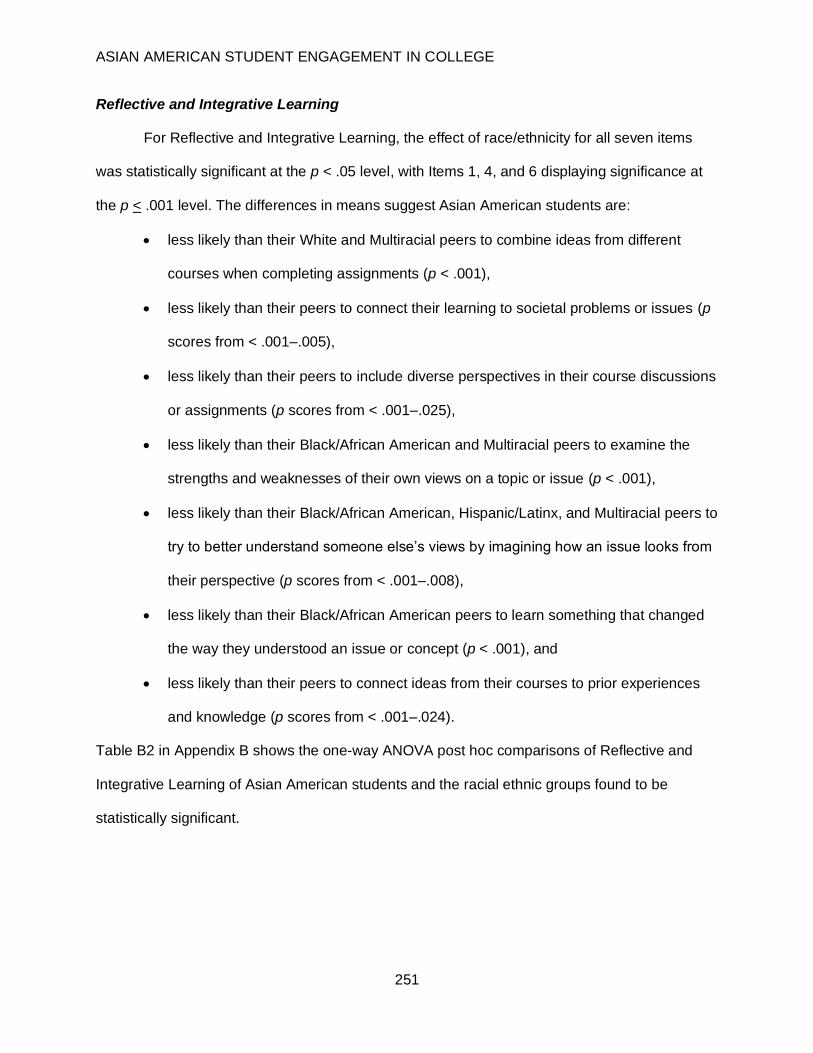
Reflective and Integrative Learning
For Reflective and Integrative Learning, the effect of race/ethnicity for all seven items
was statistically significant at the p < .05 level, with Items 1, 4, and 6 displaying significance at
the p < .001 level. The differences in means suggest Asian American students are:
• less likely than their White and Multiracial peers to combine ideas from different
courses when completing assignments (p < .001),
• less likely than their peers to connect their learning to societal problems or issues (p
scores from < .001–.005),
• less likely than their peers to include diverse perspectives in their course discussions
or assignments (p scores from < .001–.025),
• less likely than their Black/African American and Multiracial peers to examine the
strengths and weaknesses of their own views on a topic or issue (p < .001),
• less likely than their Black/African American, Hispanic/Latinx, and Multiracial peers to
try to better understand someone else’s views by imagining how an issue looks from
their perspective (p scores from < .001–.008),
• less likely than their Black/African American peers to learn something that changed
the way they understood an issue or concept (p < .001), and
• less likely than their peers to connect ideas from their courses to prior experiences
and knowledge (p scores from < .001–.024).
Table B2 in Appendix B shows the one-way ANOVA post hoc comparisons of Reflective and
Integrative Learning of Asian American students and the racial ethnic groups found to be
statistically significant.
ASIAN AMERICAN STUDENT ENGAGEMENT IN COLLEGE
252
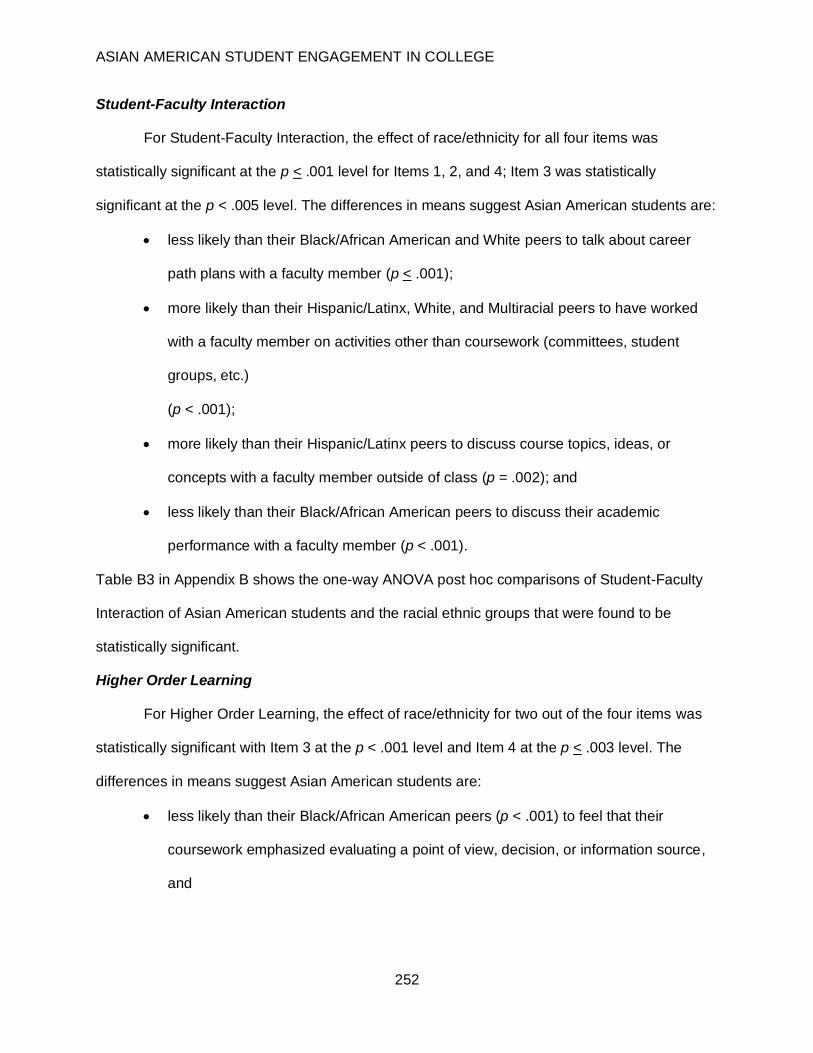
Student-Faculty Interaction
For Student-Faculty Interaction, the effect of race/ethnicity for all four items was
statistically significant at the p < .001 level for Items 1, 2, and 4; Item 3 was statistically
significant at the p < .005 level. The differences in means suggest Asian American students are:
• less likely than their Black/African American and White peers to talk about career
path plans with a faculty member (p < .001);
• more likely than their Hispanic/Latinx, White, and Multiracial peers to have worked
with a faculty member on activities other than coursework (committees, student
groups, etc.)
(p < .001);
• more likely than their Hispanic/Latinx peers to discuss course topics, ideas, or
concepts with a faculty member outside of class (p = .002); and
• less likely than their Black/African American peers to discuss their academic
performance with a faculty member (p < .001).
Table B3 in Appendix B shows the one-way ANOVA post hoc comparisons of Student-Faculty
Interaction of Asian American students and the racial ethnic groups that were found to be
statistically significant.
Higher Order Learning
For Higher Order Learning, the effect of race/ethnicity for two out of the four items was
statistically significant with Item 3 at the p < .001 level and Item 4 at the p < .003 level. The
differences in means suggest Asian American students are:
• less likely than their Black/African American peers (p < .001) to feel that their
coursework emphasized evaluating a point of view, decision, or information source,
and
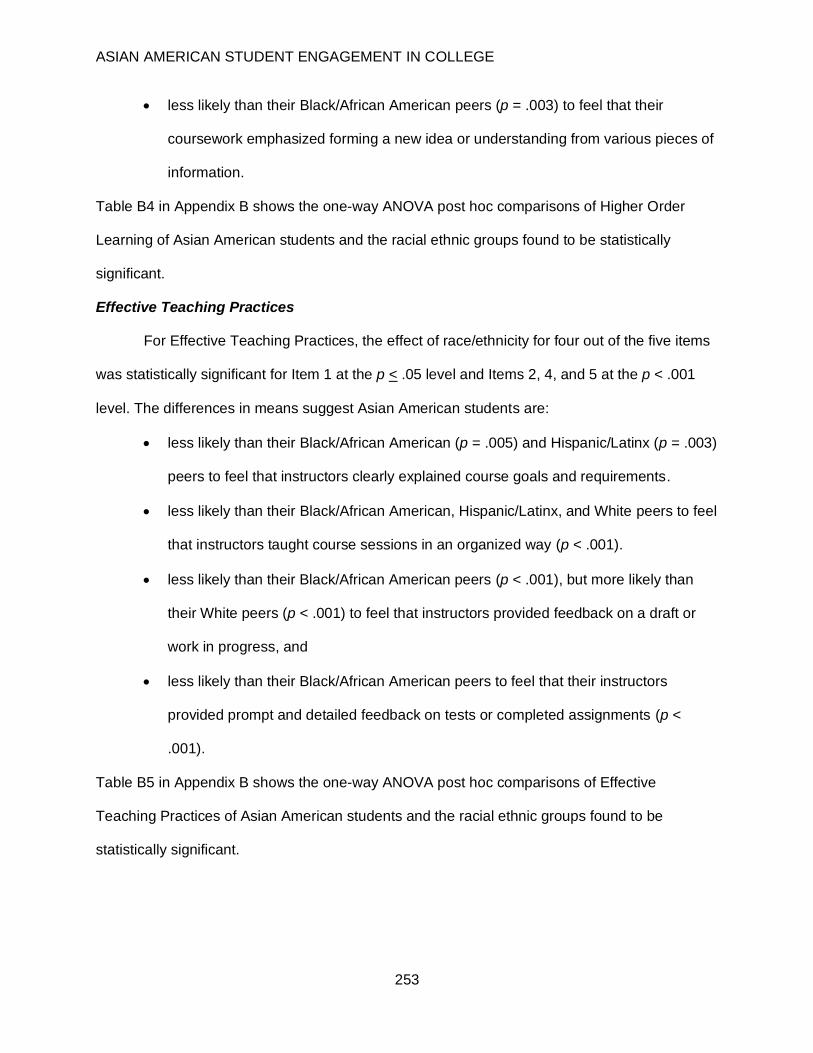
ASIAN AMERICAN STUDENT ENGAGEMENT IN COLLEGE
253
• less likely than their Black/African American peers (p = .003) to feel that their
coursework emphasized forming a new idea or understanding from various pieces of
information.
Table B4 in Appendix B shows the one-way ANOVA post hoc comparisons of Higher Order
Learning of Asian American students and the racial ethnic groups found to be statistically
significant.
Effective Teaching Practices
For Effective Teaching Practices, the effect of race/ethnicity for four out of the five items
was statistically significant for Item 1 at the p < .05 level and Items 2, 4, and 5 at the p < .001
level. The differences in means suggest Asian American students are:
• less likely than their Black/African American (p = .005) and Hispanic/Latinx (p = .003)
peers to feel that instructors clearly explained course goals and requirements.
• less likely than their Black/African American, Hispanic/Latinx, and White peers to feel
that instructors taught course sessions in an organized way (p < .001).
• less likely than their Black/African American peers (p < .001), but more likely than
their White peers (p < .001) to feel that instructors provided feedback on a draft or
work in progress, and
• less likely than their Black/African American peers to feel that their instructors
provided prompt and detailed feedback on tests or completed assignments (p <
.001).
Table B5 in Appendix B shows the one-way ANOVA post hoc comparisons of Effective
Teaching Practices of Asian American students and the racial ethnic groups found to be
statistically significant.
ASIAN AMERICAN STUDENT ENGAGEMENT IN COLLEGE
254
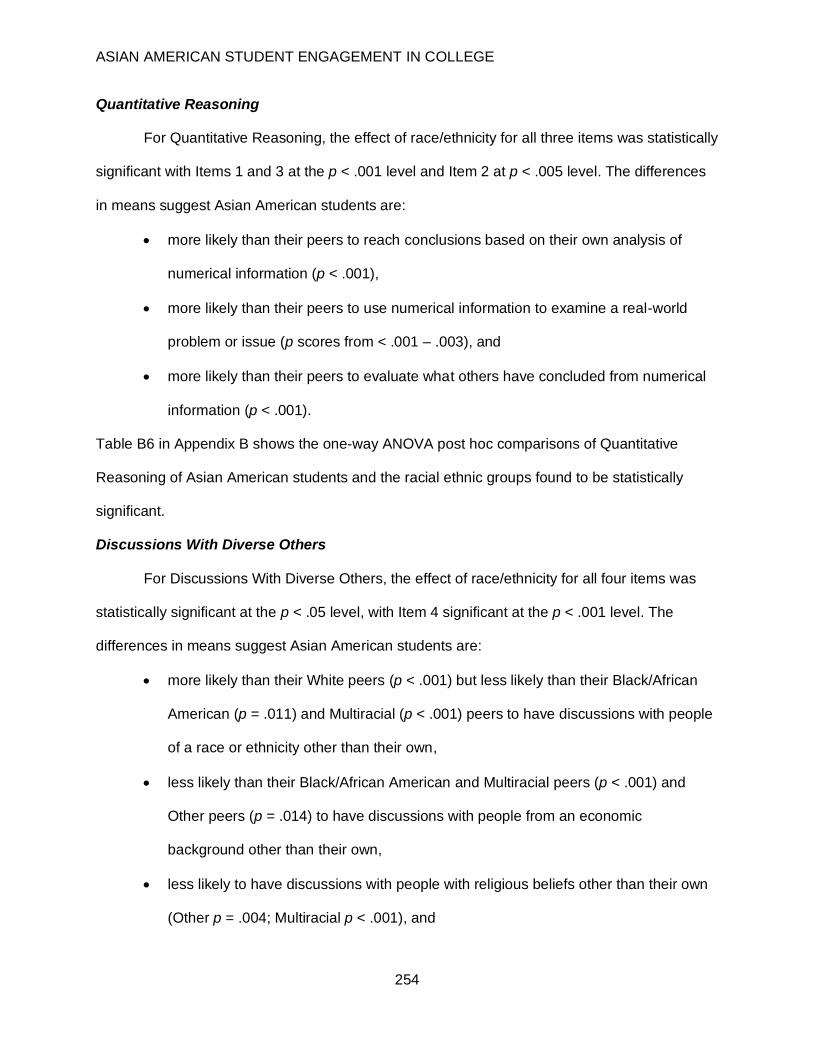
Quantitative Reasoning
For Quantitative Reasoning, the effect of race/ethnicity for all three items was statistically
significant with Items 1 and 3 at the p < .001 level and Item 2 at p < .005 level. The differences
in means suggest Asian American students are:
• more likely than their peers to reach conclusions based on their own analysis of
numerical information (p < .001),
• more likely than their peers to use numerical information to examine a real-world
problem or issue (p scores from < .001 – .003), and
• more likely than their peers to evaluate what others have concluded from numerical
information (p < .001).
Table B6 in Appendix B shows the one-way ANOVA post hoc comparisons of Quantitative
Reasoning of Asian American students and the racial ethnic groups found to be statistically
significant.
Discussions With Diverse Others
For Discussions With Diverse Others, the effect of race/ethnicity for all four items was
statistically significant at the p < .05 level, with Item 4 significant at the p < .001 level. The
differences in means suggest Asian American students are:
• more likely than their White peers (p < .001) but less likely than their Black/African
American (p = .011) and Multiracial (p < .001) peers to have discussions with people
of a race or ethnicity other than their own,
• less likely than their Black/African American and Multiracial peers (p < .001) and
Other peers (p = .014) to have discussions with people from an economic
background other than their own,
• less likely to have discussions with people with religious beliefs other than their own
(Other p = .004; Multiracial p < .001), and
ASIAN AMERICAN STUDENT ENGAGEMENT IN COLLEGE
255
• less likely than their peers to have discussions with people with political views other
than their own (p < .001).
Table B7 in Appendix B shows the one-way ANOVA post hoc comparisons of Discussions with
Diverse Others of Asian American students and the racial ethnic groups found to be statistically
significant.
Learning Strategies
For Learning Strategies, the effect of race/ethnicity for all three items was statistically
significant at the p < .05 level. The differences in means suggest Asian American students are:
• less likely than their peers to identify key information from reading assignments (p
scores from < .001–.011),
• less likely than their American Indian/Alaska Native (p = .004) and Black/African
American (p < .001) peers to review their notes after class, and
• less likely than their American Indian/Alaska Native = .005) and Black/African
American (p < .001) peers to summarize what they learned in class or from course
materials.
Table B8 in Appendix B shows the one-way ANOVA post hoc comparisons of Learning
Strategies of Asian American students and the racial ethnic groups found to be statistically
significant.
Quality of Interactions
For Quality of Interactions, the effect of race/ethnicity for all five items was statistically
significant at the p < .05 level, with Items 2, 3, and 5 significant at the p < .001 The differences
in means suggest Asian American students are:
• less likely than their Hispanic/Latinx (p = .019), and White (p = .002) peers to have
quality interactions with other students,
ASIAN AMERICAN STUDENT ENGAGEMENT IN COLLEGE
256
• less likely than their Black/African American (p < .001) and White (p = .001) peers to
have quality interactions with academic advisors,
• less likely than their White and Multiracial peers (p < .001) to have quality
interactions with faculty,
• less likely than their White peers (p = .020) to have quality interactions with student
services staff, and
• less likely than their Black/African American, Hispanic/Latinx, and White peers (p <
.001) to have quality interaction with other administrative staff and offices.
Table B9 in Appendix B shows the one-way ANOVA post hoc comparisons of Quality of
Interactions of Asian American students and the racial ethnic groups found to be statistically
significant.
Supportive Environment
For Supportive Environment, the effect of race/ethnicity for all eight items was
statistically significant at the p < .05 level, with Items 1, 2, 3, and 6 being significant at the
p < .001 level. The differences in means suggest Asian American students are:
• less likely than their Black/African American, Hispanic/Latinx, and White peers to feel
institutional emphasis on providing support to help students succeed academically
(p < .001);
• less likely than their Black/African American and Hispanic/Latinx peers to feel
institutional emphasis on using learning support services (p < .001);
• less likely than their Hispanic/Latinx peers to feel institutional emphasis on
encouraging contact among students from different backgrounds (p < .001);
• less likely than their peers to feel institutional emphasis on providing opportunities to
be involved socially (p scores from < .001–.002);
ASIAN AMERICAN STUDENT ENGAGEMENT IN COLLEGE
257
• less likely than their White (p = .002) and Multiracial (p = .025) peers to feel
institutional emphasis on providing support for their overall well-being;
• more likely than their White and Multiracial peers to feel institutional emphasis on
helping them manage their nonacademic responsibilities (p < .001);
• less likely than their Multiracial peers (p = .012) to feel institutional emphasis to
attend campus activities and events; and
• less likely than their Black/African American (p = .034) and Hispanic/Latin (p = .043)
peers to feel institutional emphasis to attend events that address important social,
economic, or political issues.
Table B10 in Appendix B shows the one-way ANOVA post hoc comparisons of Support
Environment of Asian American students and the racial ethnic groups found to be statistically
significant.
Research Question 2
The second research question was: Is there a difference in the rates of engagement
between first-generation Asian American students and non-first-generation Asian American
students? The following were significant differences in the scores for each of the engagement
items.
Collaborative Learning
There was a significant difference in the scores for Collaborative Learning Item 2 (i.e.,
explained course material to one or more students) in first-generation Asian American students
(M = 2.70, SD = .814) and non-first-generation Asian American students (M = 2.84, SD = .833);
[t(2877) = 4.371, p < .001; d = .111]. The difference in means suggests first-generation Asian
American students are less likely than non-first-generation Asian American students to explain
course material to one or more students. There was a significant difference in the scores for
Collaborative Learning Item 3 (i.e., prepared for exams by discussing or working through course
ASIAN AMERICAN STUDENT ENGAGEMENT IN COLLEGE
258
material with other students) in first-generation Asian American students (M = 2.57, SD = .960)
and non-first-generation Asian American students (M = 2.67, SD = .919); [t(2654) = 2.907, p =
.004; d = .107]. The difference in means suggests first-generation Asian American students are
less likely than non-first-generation Asian American students to prepare for exams by
discussing or working through course material with other students.
Reflective and Integrative Learning
There was significant difference in the scores for Reflective and Integrative Learning
Item 7 (i.e., connected ideas from your courses to your prior experiences and knowledge) in
first-generation Asian American students (M = 3.05, SD = .769) and non-first-generation Asian
American students (M = 3.13, SD = .766); [t(2860) = 2.672, p = .008; d = .104]. The difference in
means suggests first-generation Asian American students are less likely than non-first-
generation Asian American students to connect ideas from their courses to their prior
experiences and knowledge.
Student-Faculty Interaction
There was significant difference in the scores for Student-Faculty Interaction Item 1 (i.e.,
talked about career plans with a faculty member) in first-generation Asian American students (M
= 2.28, SD = .932) and non-first-generation Asian American students (M = 2.35, SD = .921);
[t(2895) = 2.064, p = .039; d = .076]. The difference in means suggests first-generation Asian
American students are less likely than non-first-generation Asian American students to talk
about their career plans with a faculty member. However, effect size analysis indicated there
was no practical significance comparing first-generation Asian American students to non-first-
generation Asian American students on this engagement indicator item.
There was significant difference in the scores for Student-Faculty Interaction Item 3 (i.e.,
discussed course topics, ideas, or concepts with a faculty member outside of class) in first-
generation Asian American students (M = 2.13, SD = .939) and non-first-generation Asian
American students (M = 2.24, SD = .928); [t(2886) = 3.223, p = .001; d = .118]. The difference in
ASIAN AMERICAN STUDENT ENGAGEMENT IN COLLEGE
259
means suggests first-generation Asian American students are less likely than non-first-
generation Asian American students to discuss course topics, ideas, or concepts with a faculty
member outside of class. Furthermore, effect size analysis indicated there was small practical
significance comparing first-generation Asian American students to non-first-generation Asian
American students on this engagement indicator item.
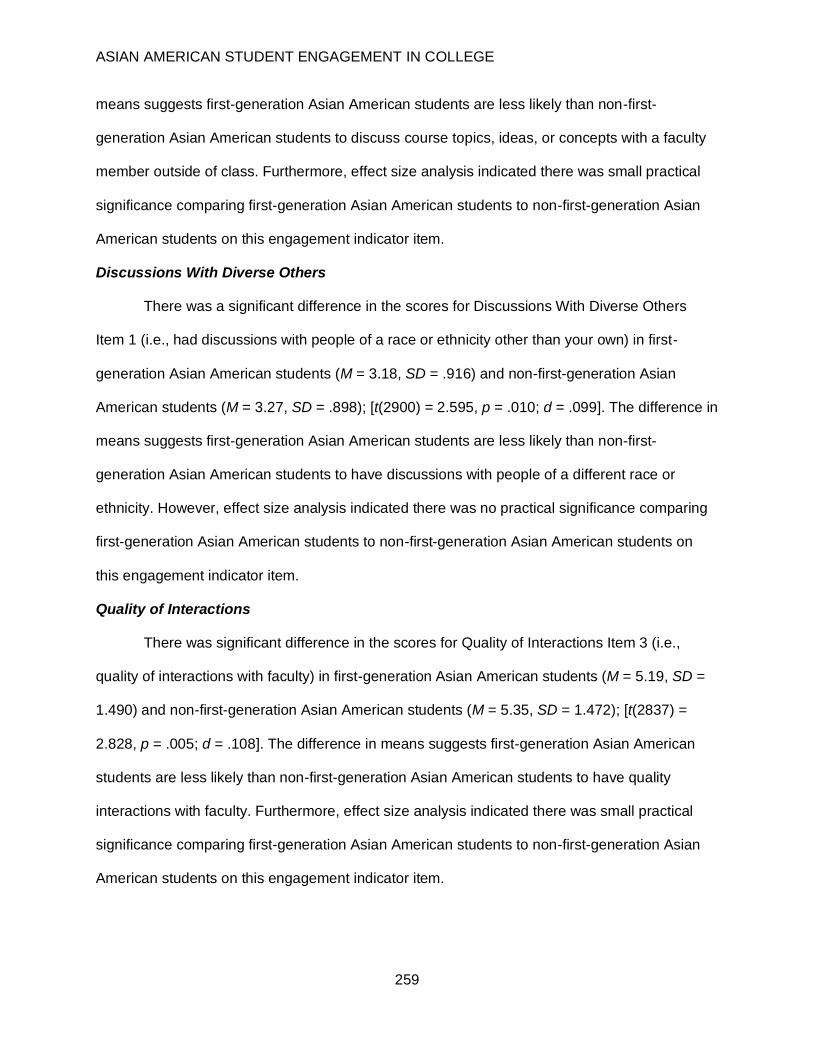
Discussions With Diverse Others
There was a significant difference in the scores for Discussions With Diverse Others
Item 1 (i.e., had discussions with people of a race or ethnicity other than your own) in first-
generation Asian American students (M = 3.18, SD = .916) and non-first-generation Asian
American students (M = 3.27, SD = .898); [t(2900) = 2.595, p = .010; d = .099]. The difference in
means suggests first-generation Asian American students are less likely than non-first-
generation Asian American students to have discussions with people of a different race or
ethnicity. However, effect size analysis indicated there was no practical significance comparing
first-generation Asian American students to non-first-generation Asian American students on
this engagement indicator item.
Quality of Interactions
There was significant difference in the scores for Quality of Interactions Item 3 (i.e.,
quality of interactions with faculty) in first-generation Asian American students (M = 5.19, SD =
1.490) and non-first-generation Asian American students (M = 5.35, SD = 1.472); [t(2837) =
2.828, p = .005; d = .108]. The difference in means suggests first-generation Asian American
students are less likely than non-first-generation Asian American students to have quality
interactions with faculty. Furthermore, effect size analysis indicated there was small practical
significance comparing first-generation Asian American students to non-first-generation Asian
American students on this engagement indicator item.
ASIAN AMERICAN STUDENT ENGAGEMENT IN COLLEGE
260
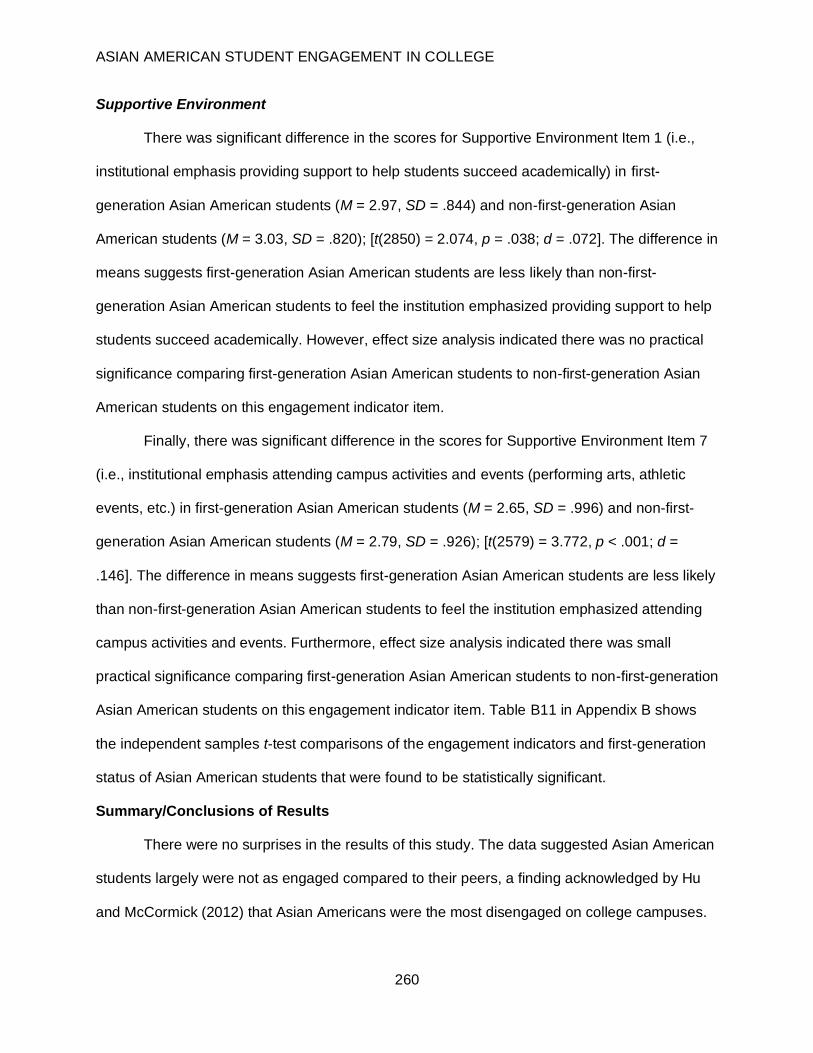
Supportive Environment
There was significant difference in the scores for Supportive Environment Item 1 (i.e.,
institutional emphasis providing support to help students succeed academically) in first-
generation Asian American students (M = 2.97, SD = .844) and non-first-generation Asian
American students (M = 3.03, SD = .820); [t(2850) = 2.074, p = .038; d = .072]. The difference in
means suggests first-generation Asian American students are less likely than non-first-
generation Asian American students to feel the institution emphasized providing support to help
students succeed academically. However, effect size analysis indicated there was no practical
significance comparing first-generation Asian American students to non-first-generation Asian
American students on this engagement indicator item.
Finally, there was significant difference in the scores for Supportive Environment Item 7
(i.e., institutional emphasis attending campus activities and events (performing arts, athletic
events, etc.) in first-generation Asian American students (M = 2.65, SD = .996) and non-first-
generation Asian American students (M = 2.79, SD = .926); [t(2579) = 3.772, p < .001; d =
.146]. The difference in means suggests first-generation Asian American students are less likely
than non-first-generation Asian American students to feel the institution emphasized attending
campus activities and events. Furthermore, effect size analysis indicated there was small
practical significance comparing first-generation Asian American students to non-first-generation
Asian American students on this engagement indicator item. Table B11 in Appendix B shows
the independent samples t-test comparisons of the engagement indicators and first-generation
status of Asian American students that were found to be statistically significant.
Summary/Conclusions of Results
There were no surprises in the results of this study. The data suggested Asian American
students largely were not as engaged compared to their peers, a finding acknowledged by Hu
and McCormick (2012) that Asian Americans were the most disengaged on college campuses.
ASIAN AMERICAN STUDENT ENGAGEMENT IN COLLEGE
261
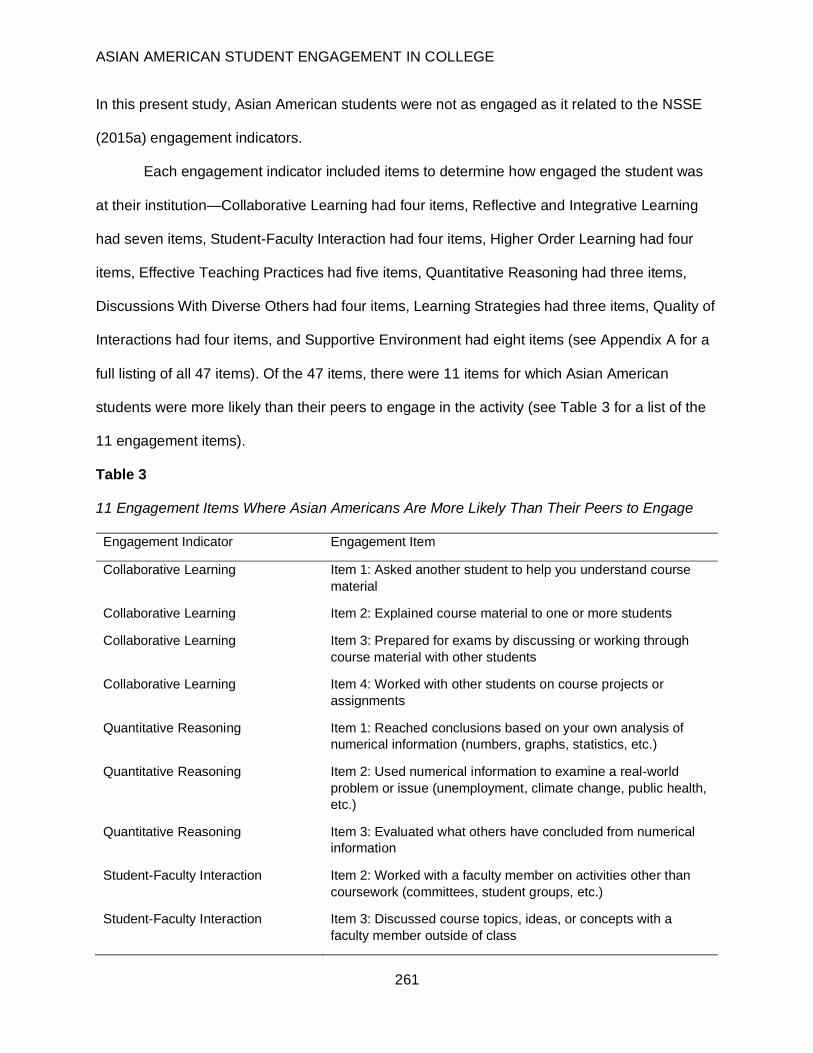
In this present study, Asian American students were not as engaged as it related to the NSSE
(2015a) engagement indicators.
Each engagement indicator included items to determine how engaged the student was
at their institution—Collaborative Learning had four items, Reflective and Integrative Learning
had seven items, Student-Faculty Interaction had four items, Higher Order Learning had four
items, Effective Teaching Practices had five items, Quantitative Reasoning had three items,
Discussions With Diverse Others had four items, Learning Strategies had three items, Quality of
Interactions had four items, and Supportive Environment had eight items (see Appendix A for a
full listing of all 47 items). Of the 47 items, there were 11 items for which Asian American
students were more likely than their peers to engage in the activity (see Table 3 for a list of the
11 engagement items).
Table 3
11 Engagement Items Where Asian Americans Are More Likely Than Their Peers to Engage
Engagement Indicator Engagement Item
Collaborative Learning Item 1: Asked another student to help you understand course
material
Collaborative Learning Item 2: Explained course material to one or more students
Collaborative Learning Item 3: Prepared for exams by discussing or working through
course material with other students
Collaborative Learning Item 4: Worked with other students on course projects or
assignments
Quantitative Reasoning Item 1: Reached conclusions based on your own analysis of
numerical information (numbers, graphs, statistics, etc.)
Quantitative Reasoning Item 2: Used numerical information to examine a real-world
problem or issue (unemployment, climate change, public health,
etc.)
Quantitative Reasoning Item 3: Evaluated what others have concluded from numerical
information
Student-Faculty Interaction Item 2: Worked with a faculty member on activities other than
coursework (committees, student groups, etc.)
Student-Faculty Interaction Item 3: Discussed course topics, ideas, or concepts with a
faculty member outside of class
ASIAN AMERICAN STUDENT ENGAGEMENT IN COLLEGE
262
Engagement Indicator Engagement Item
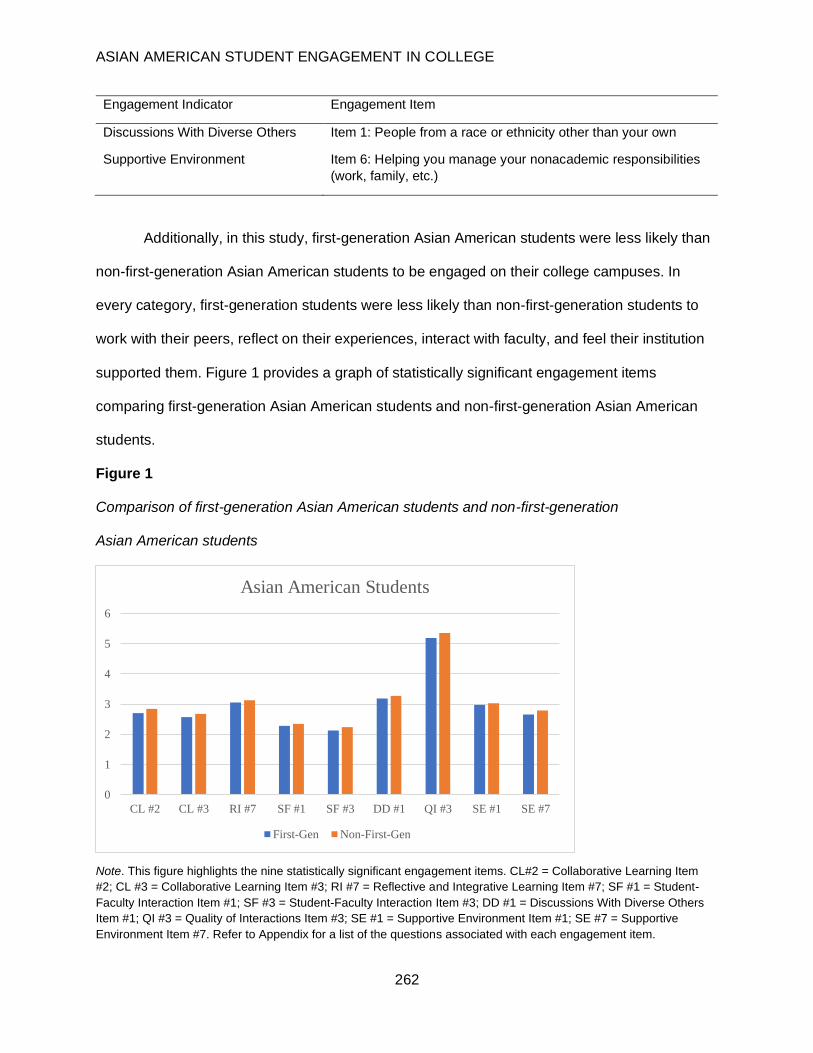
Discussions With Diverse Others Item 1: People from a race or ethnicity other than your own
Supportive Environment Item 6: Helping you manage your nonacademic responsibilities
(work, family, etc.)
Additionally, in this study, first-generation Asian American students were less likely than
non-first-generation Asian American students to be engaged on their college campuses. In
every category, first-generation students were less likely than non-first-generation students to
work with their peers, reflect on their experiences, interact with faculty, and feel their institution
supported them. Figure 1 provides a graph of statistically significant engagement items
comparing first-generation Asian American students and non-first-generation Asian American
students.
Figure 1
Comparison of first-generation Asian American students and non-first-generation
Asian American students
Note. This figure highlights the nine statistically significant engagement items. CL#2 = Collaborative Learning Item
#2; CL #3 = Collaborative Learning Item #3; RI #7 = Reflective and Integrative Learning Item #7; SF #1 = Student-
Faculty Interaction Item #1; SF #3 = Student-Faculty Interaction Item #3; DD #1 = Discussions With Diverse Others
Item #1; QI #3 = Quality of Interactions Item #3; SE #1 = Supportive Environment Item #1; SE #7 = Supportive
Environment Item #7. Refer to Appendix for a list of the questions associated with each engagement item.
0
1
2
3
4
5
6
CL #2 CL #3 RI #7 SF #1 SF #3 DD #1 QI #3 SE #1 SE #7
Asian American Students
First-Gen Non-First-Gen

ASIAN AMERICAN STUDENT ENGAGEMENT IN COLLEGE
263
Discussion
The results and findings from the data analysis have significant implications. The
following sections provide a synthesis and implications of the findings as they relate to each of
the research questions as well as to extant literature.
Asian Americans and Their Peers
Student engagement is a predictor of student success (Harper & Quaye, 2009; Kuh,
2001; Pascarella & Terenzini, 2005; Quaye & Harper, 2015). In addition, a combination of the
educational activities offered by the institution and the intentional interactions students engage
in motivate them to persist and graduate (Kuh, 2001; Kuh et al., 2007). Unfortunately, in this
study, the data suggested Asian Americans, compared to their peers, were not as engaged,
which corroborates a finding acknowledged by Hu and McCormick (2012) that Asian Americans
were the most disengaged on college campuses. In this present study, Asian American students
were not as engaged related to the NSSE (2015a) engagement indicators. Of the 47 items,
there were 11 items for which Asian American students were more likely than their peers to
engage in the activity. Seven of these 11 engagement items made up the Collaborative
Learning and Quantitative Reasoning engagement indicators.
Collaborative Learning involved four engagement indicators, and the data suggested
Asian American students were more likely than their peers to engage in all of these activities,
which implied that reliance on and collaboration with peers were key components for them. Not
only did they ask other students to help them understand course material, but their peers also
relied on them to explain course material. This reliance on each other was also used to prepare
for exams. This finding implied that collaborating with other peers was their mode of academic
survival for many of the Asian American students and supported the cultural value of
collectivism to which many Asian American groups adhere (Yeh, 2005). Collectivism refers to
putting group interests before individual interests (Fu, 2010) and, in this sense, collaborating
with peers was an effort toward continued academic progress.
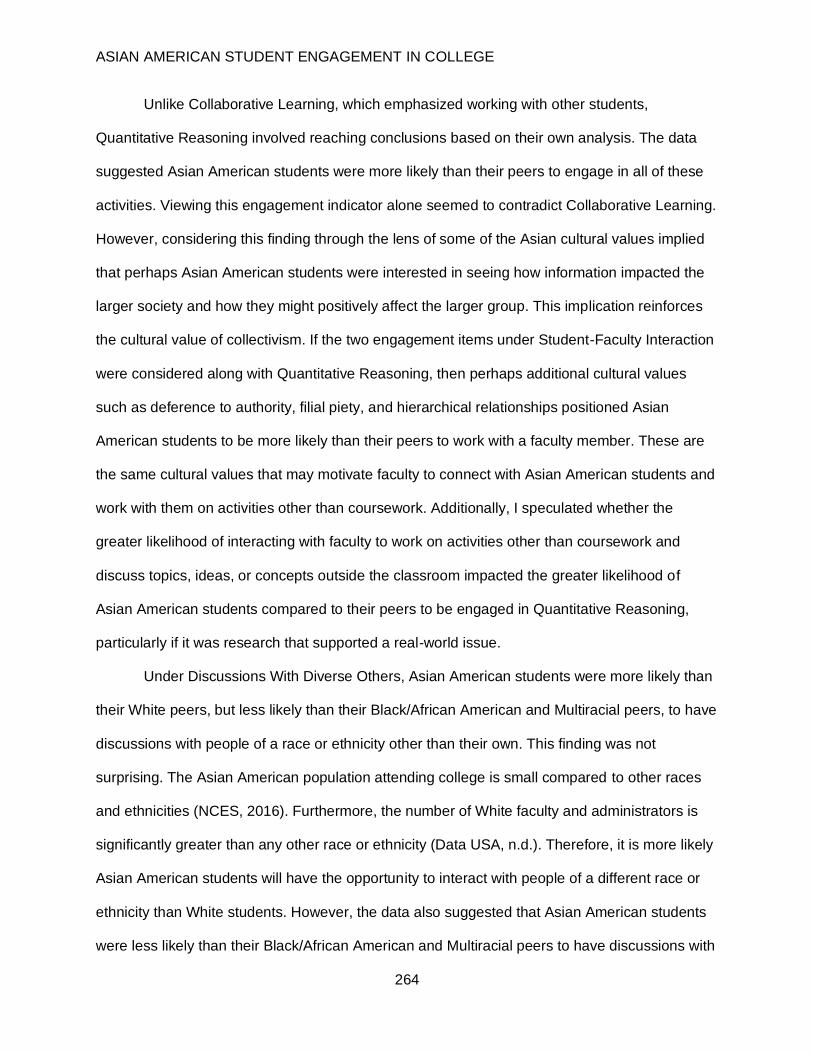
ASIAN AMERICAN STUDENT ENGAGEMENT IN COLLEGE
264
Unlike Collaborative Learning, which emphasized working with other students,
Quantitative Reasoning involved reaching conclusions based on their own analysis. The data
suggested Asian American students were more likely than their peers to engage in all of these
activities. Viewing this engagement indicator alone seemed to contradict Collaborative Learning.
However, considering this finding through the lens of some of the Asian cultural values implied
that perhaps Asian American students were interested in seeing how information impacted the
larger society and how they might positively affect the larger group. This implication reinforces
the cultural value of collectivism. If the two engagement items under Student-Faculty Interaction
were considered along with Quantitative Reasoning, then perhaps additional cultural values
such as deference to authority, filial piety, and hierarchical relationships positioned Asian
American students to be more likely than their peers to work with a faculty member. These are
the same cultural values that may motivate faculty to connect with Asian American students and
work with them on activities other than coursework. Additionally, I speculated whether the
greater likelihood of interacting with faculty to work on activities other than coursework and
discuss topics, ideas, or concepts outside the classroom impacted the greater likelihood of
Asian American students compared to their peers to be engaged in Quantitative Reasoning,
particularly if it was research that supported a real-world issue.
Under Discussions With Diverse Others, Asian American students were more likely than
their White peers, but less likely than their Black/African American and Multiracial peers, to have
discussions with people of a race or ethnicity other than their own. This finding was not
surprising. The Asian American population attending college is small compared to other races
and ethnicities (NCES, 2016). Furthermore, the number of White faculty and administrators is
significantly greater than any other race or ethnicity (Data USA, n.d.). Therefore, it is more likely
Asian American students will have the opportunity to interact with people of a different race or
ethnicity than White students. However, the data also suggested that Asian American students
were less likely than their Black/African American and Multiracial peers to have discussions with

ASIAN AMERICAN STUDENT ENGAGEMENT IN COLLEGE
265
people of another race or ethnicity than their own. This would imply that Asian American
students perhaps do not or prefer not to have discussions with people of a different race or
ethnicity. There can be several reasons for not engaging in discussions with others. For
example, language can be a barrier for those whose primary language is not English. The way
others view Asian American students can be another reason. The perpetual foreigner myth is
the belief that Asian Americans will always be seen as the “other” regardless of how long they
have been in this country (Murjani, 2014). Much of this stereotype comes from the belief that
Asians speak poor English (Iwamoto & Liu, 2010) regardless of where they were born.
Therefore, if other students perceive that Asian American students may be “foreign,” then Asian
American students could be limited in their opportunity to have discussions with people of a
different race or ethnicity. Another potential reason is this idea of ethnic matching that seems to
have only been studied in the context of counseling (Presley & Day, 2018; Zane & Ku, 2014).
Presley and Day (2018) found that ethnic matching seemed to provide a level of comfort
between therapists and clients. Future research may explore the impact of ethnic matching in
the context of higher education, particularly as the finding from this study implied that Asian
Americans are more likely to collaborate and work with other Asian Americans.
Finally, under Supportive Environment, Asian American students were more likely than
their White and Multiracial peers to perceive their institution emphasized helping them manage
their nonacademic responsibilities such as work and family. This finding implies that the peer-to-
peer connections and collaborations, much like Collaborative Learning, allowed Asian American
students to manage their nonacademic responsibilities. In other words, Asian American
students relied on each other to take notes if they could not be in class due to work, and/or they
relied on each other when they had to go to class and childcare was needed or if they had other
family responsibilities to tend to. Another possible implication of this finding comes in the context
of thinking about how students perceive faculty, staff, and administrators. Though these are
three separate employment categories, students tend not to understand the distinctions.
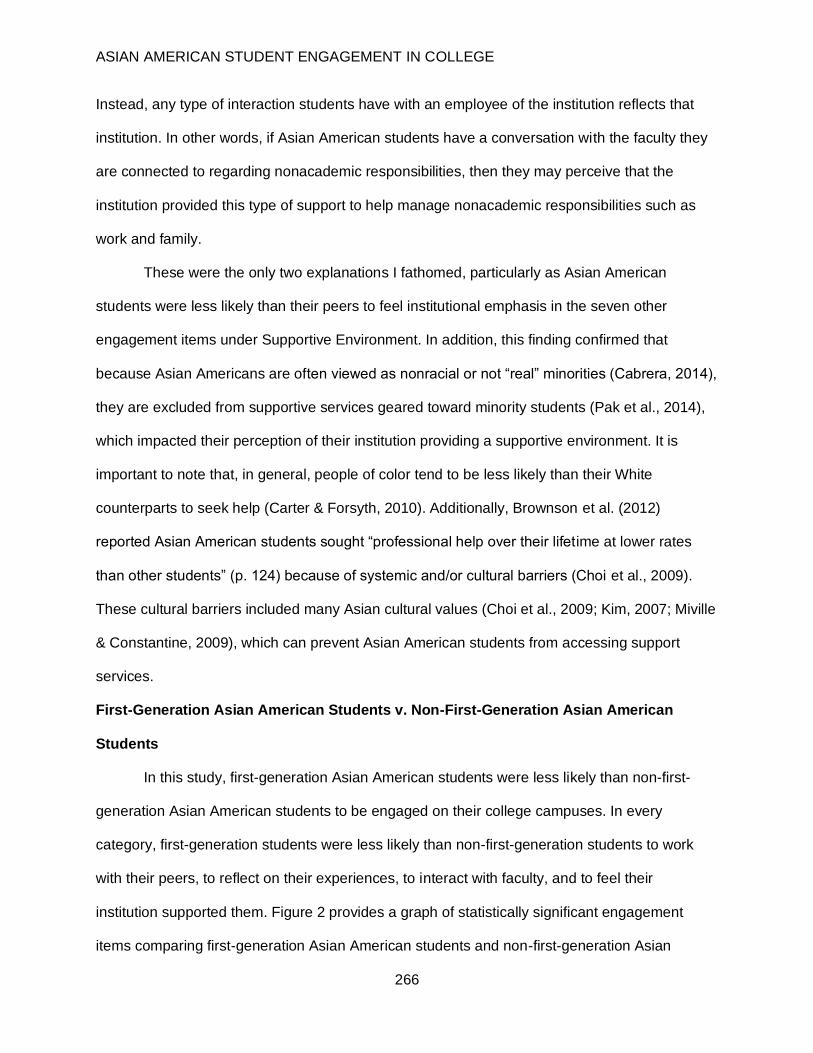
ASIAN AMERICAN STUDENT ENGAGEMENT IN COLLEGE
266
Instead, any type of interaction students have with an employee of the institution reflects that
institution. In other words, if Asian American students have a conversation with the faculty they
are connected to regarding nonacademic responsibilities, then they may perceive that the
institution provided this type of support to help manage nonacademic responsibilities such as
work and family.
These were the only two explanations I fathomed, particularly as Asian American
students were less likely than their peers to feel institutional emphasis in the seven other
engagement items under Supportive Environment. In addition, this finding confirmed that
because Asian Americans are often viewed as nonracial or not “real” minorities (Cabrera, 2014),
they are excluded from supportive services geared toward minority students (Pak et al., 2014),
which impacted their perception of their institution providing a supportive environment. It is
important to note that, in general, people of color tend to be less likely than their White
counterparts to seek help (Carter & Forsyth, 2010). Additionally, Brownson et al. (2012)
reported Asian American students sought “professional help over their lifetime at lower rates
than other students” (p. 124) because of systemic and/or cultural barriers (Choi et al., 2009).
These cultural barriers included many Asian cultural values (Choi et al., 2009; Kim, 2007; Miville
& Constantine, 2009), which can prevent Asian American students from accessing support
services.
First-Generation Asian American Students v. Non-First-Generation Asian American
Students
In this study, first-generation Asian American students were less likely than non-first-
generation Asian American students to be engaged on their college campuses. In every
category, first-generation students were less likely than non-first-generation students to work
with their peers, to reflect on their experiences, to interact with faculty, and to feel their
institution supported them. Figure 2 provides a graph of statistically significant engagement
items comparing first-generation Asian American students and non-first-generation Asian

ASIAN AMERICAN STUDENT ENGAGEMENT IN COLLEGE
267
American students. The data confirmed what extant literature has suggested—that first-
generation students are less likely to be engaged overall than non-first-generation students
(Hawkins & Larabee, 2009; Pascarella & Terenzini, 2005; Pike & Kuh, 2005). Since many first-
generation students feel academically underprepared, they focus entirely on academic
endeavors and make it a point to participate only in academic activities (Hawkins & Larabee,
2009). This singular focus by first-generation students on their academic life may pull students
away from engaging in activities that are believed to help them find a sense of belonging on
their campus (Kuh et al., 2008; Wells & Horn, 2015) and deepen their experience on campus
(Kuh, 2008; 2016), which in turn affects the retention, persistence, and graduation (Hayek,
2001; Kuh et al., 2008; Kuh, 2016).
Figure 2
Comparison of First-Generation Asian American Students and Non-First-Generation Asian
American Students
Note. This figure highlights the nine statistically significant engagement items. CL#2 = Collaborative Learning Item
#2; CL #3 = Collaborative Learning Item #3; RI #7 = Reflective and Integrative Learning Item #7; SF #1 = Student-
Faculty Interaction Item #1; SF #3 = Student-Faculty Interaction Item #3; DD #1 = Discussions With Diverse Others
Item #1; QI #3 = Quality of Interactions Item #3; SE #1 = Supportive Environment Item #1; SE #7 = Supportive
Environment Item #7. Refer to Appendix A for a list of the questions associated with each engagement item.
0
1
2
3
4
5
6
CL #2 CL #3 RI #7 SF #1 SF #3 DD #1 QI #3 SE #1 SE #7
Asian American Students
First-Gen Non-First-Gen
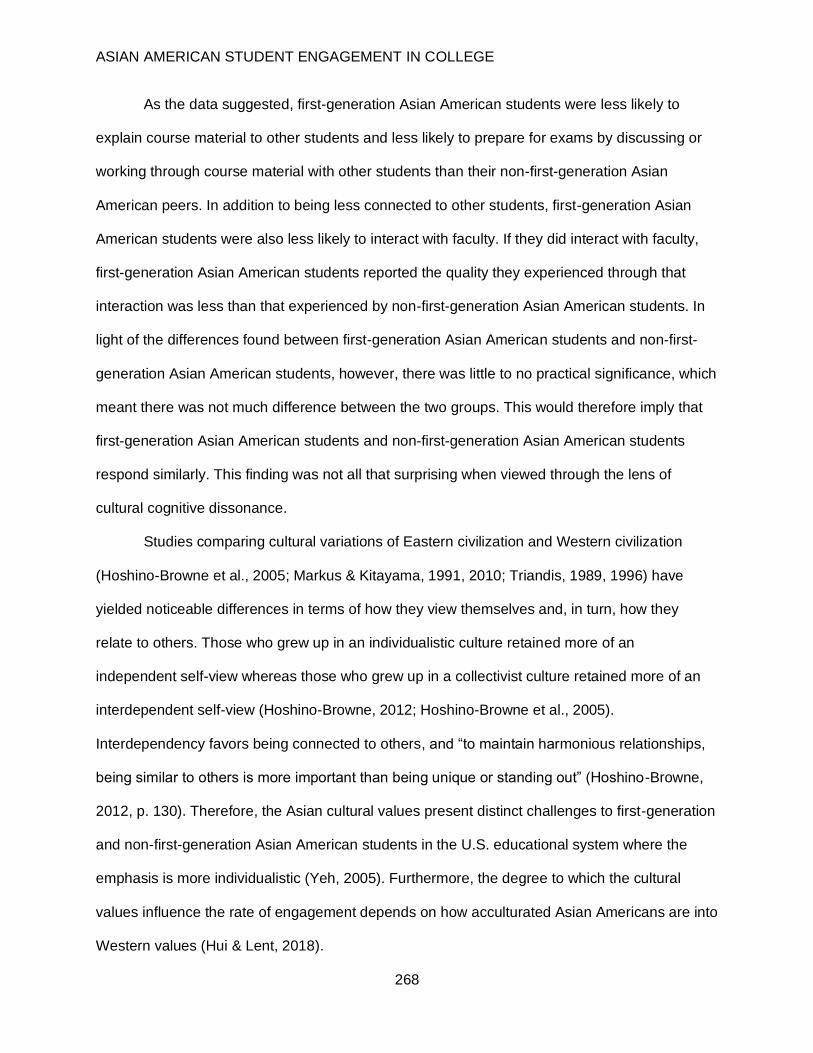
ASIAN AMERICAN STUDENT ENGAGEMENT IN COLLEGE
268
As the data suggested, first-generation Asian American students were less likely to
explain course material to other students and less likely to prepare for exams by discussing or
working through course material with other students than their non-first-generation Asian
American peers. In addition to being less connected to other students, first-generation Asian
American students were also less likely to interact with faculty. If they did interact with faculty,
first-generation Asian American students reported the quality they experienced through that
interaction was less than that experienced by non-first-generation Asian American students. In
light of the differences found between first-generation Asian American students and non-first-
generation Asian American students, however, there was little to no practical significance, which
meant there was not much difference between the two groups. This would therefore imply that
first-generation Asian American students and non-first-generation Asian American students
respond similarly. This finding was not all that surprising when viewed through the lens of
cultural cognitive dissonance.
Studies comparing cultural variations of Eastern civilization and Western civilization
(Hoshino-Browne et al., 2005; Markus & Kitayama, 1991, 2010; Triandis, 1989, 1996) have
yielded noticeable differences in terms of how they view themselves and, in turn, how they
relate to others. Those who grew up in an individualistic culture retained more of an
independent self-view whereas those who grew up in a collectivist culture retained more of an
interdependent self-view (Hoshino-Browne, 2012; Hoshino-Browne et al., 2005).
Interdependency favors being connected to others, and “to maintain harmonious relationships,
being similar to others is more important than being unique or standing out” (Hoshino-Browne,
2012, p. 130). Therefore, the Asian cultural values present distinct challenges to first-generation
and non-first-generation Asian American students in the U.S. educational system where the
emphasis is more individualistic (Yeh, 2005). Furthermore, the degree to which the cultural
values influence the rate of engagement depends on how acculturated Asian Americans are into
Western values (Hui & Lent, 2018).
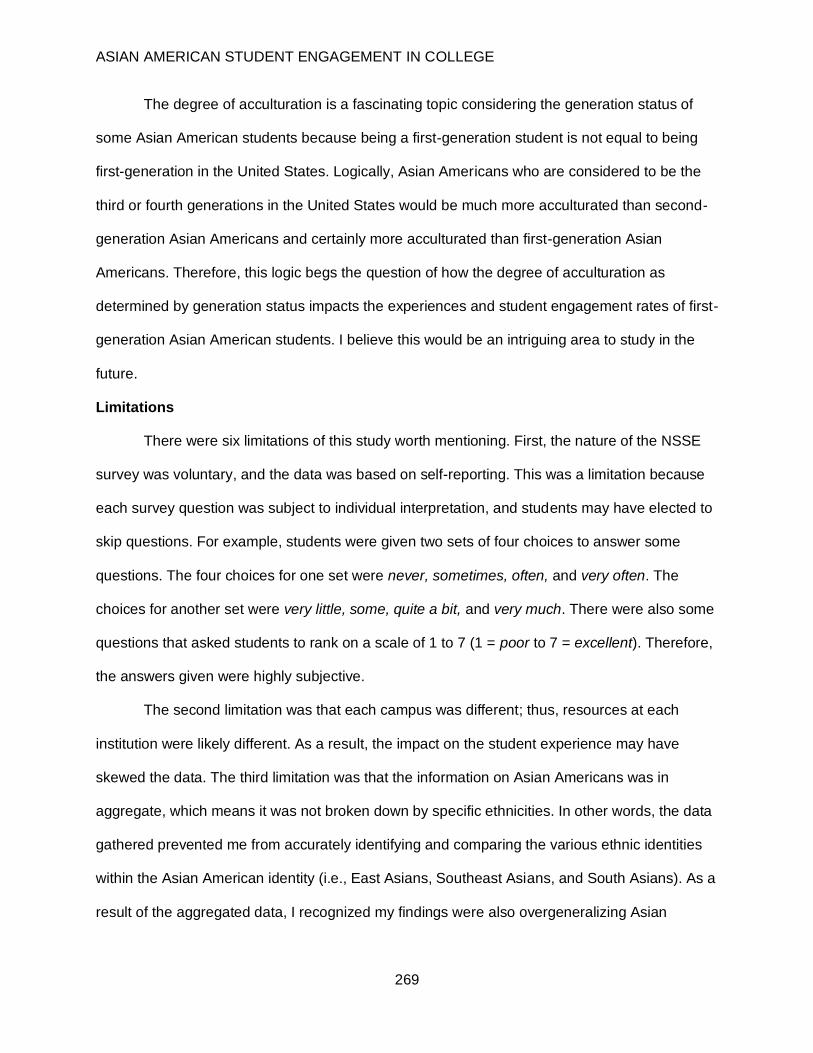
ASIAN AMERICAN STUDENT ENGAGEMENT IN COLLEGE
269
The degree of acculturation is a fascinating topic considering the generation status of
some Asian American students because being a first-generation student is not equal to being
first-generation in the United States. Logically, Asian Americans who are considered to be the
third or fourth generations in the United States would be much more acculturated than second-
generation Asian Americans and certainly more acculturated than first-generation Asian
Americans. Therefore, this logic begs the question of how the degree of acculturation as
determined by generation status impacts the experiences and student engagement rates of first-
generation Asian American students. I believe this would be an intriguing area to study in the
future.
Limitations
There were six limitations of this study worth mentioning. First, the nature of the NSSE
survey was voluntary, and the data was based on self-reporting. This was a limitation because
each survey question was subject to individual interpretation, and students may have elected to
skip questions. For example, students were given two sets of four choices to answer some
questions. The four choices for one set were never, sometimes, often, and very often. The
choices for another set were very little, some, quite a bit, and very much. There were also some
questions that asked students to rank on a scale of 1 to 7 (1 = poor to 7 = excellent). Therefore,
the answers given were highly subjective.
The second limitation was that each campus was different; thus, resources at each
institution were likely different. As a result, the impact on the student experience may have
skewed the data. The third limitation was that the information on Asian Americans was in
aggregate, which means it was not broken down by specific ethnicities. In other words, the data
gathered prevented me from accurately identifying and comparing the various ethnic identities
within the Asian American identity (i.e., East Asians, Southeast Asians, and South Asians). As a
result of the aggregated data, I recognized my findings were also overgeneralizing Asian
ASIAN AMERICAN STUDENT ENGAGEMENT IN COLLEGE
270
American students as one group, which did not allow me to see differences between various
ethnic groups, including differences in cultural values, beliefs, or mores.
The fourth limitation was the nuance of first-generation versus non-first-generation in
terms of immigration status. Asian Americans who are the first generation in their families to
grow up in this country may not actually be first-generation students in postsecondary
education. However, their experiences may be similar if their parents went to school in their
home countries, which may skew some of the survey results. The fifth limitation was that this
study used NSSE data. Therefore, it took a sample of a sample, which again may have limited
its generalizability because of nonresponses in the sample depending on the data provided.
Finally, the sixth limitation was that there were different response rates from the 564
institutions that participated. The average response rate was 29%, and the highest response
rate was 89% (NSSE, 2015c). Furthermore, higher response rates came from smaller
institutions and those that offered incentives (NSSE, 2015c). As each institution is different,
varying response rates may have skewed the data. In spite of these limitations, this quantitative
study confirmed extant literature and highlighted additional areas for future research.
Recommendations for Future Research
The intent of this study was to address the dearth of research and expand on what was
currently available on Asian American college students. The biggest challenge has been that
data often are gathered and presented in aggregate. Aggregated data mask the needs of the
individuals within the group while, at the same time, overgeneralize the needs of the group.
Stemming from this study in particular, there are several recommendations I have for future
areas of focus for research. The first recommendation is an exploration by future researchers
into Asian American cultural values and the impact those values have on rates of student
engagement.
While the findings of this study implied that Asian American students relied on their
peers for academic survival, the influential extents of the belief in the model minority myth and
ASIAN AMERICAN STUDENT ENGAGEMENT IN COLLEGE
271
the adherence to cultural values raised additional questions. Were Asian American students
more likely than their peers to ask another student to help them understand course material
because of the cultural value of deference to authority or avoidance of perceived shame if they
asked their faculty? For the engagement items of explaining course material to one or more
students and preparing for exams by working with other students, did the assumption of the
model minority myth influence their peers to approach the Asian American students and, in turn,
cause the Asian American students to be more engaged than their peers in these engagement
items? The data also suggested Asian American students were more likely to work with other
students on course projects or assignments than their peers. This could be connected to the
cultural value of collectivism, which refers to putting group interests before individual interests
(Fu, 2010). According to Hui and Lent (2018), the degree to which cultural values influence the
rate of engagement depends on how acculturated and encultured Asian Americans are into
Western values. This leads to the second recommendation for future research, which is to
explore generation status and when Asian American students immigrated to the United States
to determine if this impacts engagement and in what ways.
Many researchers have studied first-generation students and non-first-generation
students (Hawkins & Larabee, 2009; Ishitani, 2006; Pascarella & Terenzini, 2005; Pike & Kuh,
2005). In this study, I was not surprised the data suggested first-generation students were less
likely than their non-first-generation peers to be engaged on campus. However, the main source
of the Asian American population in the United States is largely from people who have entered
this country either as immigrants or as refugees. Of note, there are areas in which there are
many third- and fourth-generation Asian Americans, particularly as Endo (1980) noted the
Chinese and Japanese immigrated to the United States during the mid- to late-1800s. Likewise,
Murjani (2014) has also reported that Japanese Americans were placed in internment camps
during World War II because they were seen as a threat to the security of the nation. In light of
this, the Pew Research Center (2012) stated, “It is not yet possible to make any full
ASIAN AMERICAN STUDENT ENGAGEMENT IN COLLEGE
272
intergenerational accounting of the modern Asian American immigration wave; the immigrants
themselves are still by far the dominant group and the second generation has only recently
begun to come into adulthood in significant numbers” (para. 34). Therefore, future research
could explore when these first-generation students entered the U.S. school system and how that
might influence rates of student engagement.
Another recommendation is to use NSSE data to explore whether engagement in one
activity impacts engagement in another activity. For example, in my study, I speculated that
interacting with faculty outside the classroom may impact the finding that Asian American
students are more likely than their peers to engage in the items that make up Quantitative
Reasoning. In other words, because Asian American students were more likely than their peers
to interact with faculty, I speculated that faculty encouraged the students to consider
Quantitative Reasoning. On their own, the students may not have engaged in Quantitative
Reasoning. Therefore, this could imply a correlation between Student-Faculty Interaction and
Quantitative Reasoning.
Outside of recommendations for future research, I also offer three recommendations for
practical application based on the implications of my findings. First, related to first-generation
status, I do not believe there is any harm in providing additional support to all Asian American
students as if they were all first-generation students. Given there was little to no practical
significance found between first-generation Asian American students and non-first-generation
Asian American students, the approach for all Asian American students can be the same. In
general, first-generation students receive little guidance from their parents (Pascarella &
Terenzini, 2005) and may feel academically underprepared (Hawkins & Larabee, 2009).
Therefore, hosting workshops geared specifically for Asian Americans to cover topics such as
financial literacy, course selections, and the importance of networking with others who are
different from them would be highly beneficial.
ASIAN AMERICAN STUDENT ENGAGEMENT IN COLLEGE
273
Second, faculty and administrators could consider incorporating and encouraging more
group work and peer-to-peer collaboration since data from this study suggested that Asian
American students were more likely to collaborate with their peers academically. This likelihood
to work with one another is already a strength among Asian American students, and it would
take little effort to capitalize on this opportunity for Asian American students to be engaged.
While much extant literature has pushed and will continue to push collecting disaggregated data
to identify the specific needs of the Asian American student population, I do not recommend
creating separate smaller work groups based on disaggregated data for institutions where the
Asian American student population is quite small. According to the last U.S. census in 2010,
Asian Americans make up only 5.6% of the U.S. population (U.S. Census Bureau, 2012).
Therefore, it would be suitable at institutions to create Asian American peer groups for small
Asian American populations for the purposes of collaboration. For institutions that have been
designated as an Asian American Native American Pacific Islander-serving institution
(AANAPISI), I recommend creating work groups based on disaggregated data. The AANAPISI
program is a federally funded program, much like historically Black colleges and universities and
Hispanic-serving institutions. For any school to be eligible for AANAPISI designation, it has to
enroll at least 10% of students who identify as Asian American, Native American, or Pacific
Islander. In addition, at least 50% of the students must receive federal financial assistance
(AANAPISI, 2016). The areas in which these peer groups would be appropriate are living-
learning communities in the residence halls, experiential or social cohorts based on interest
and/or identity, and peer-to-peer mentoring specifically for Asian American students.
Third, while Asian American students are more likely to work with a faculty member on
activities other than coursework and to discuss course topics, ideas, or concepts with a faculty
member outside of class but less likely to talk about career plans or discuss academic
performance with a faculty member, I recommend faculty members or student services
professionals more purposefully develop programming in the latter two activities as Asian
ASIAN AMERICAN STUDENT ENGAGEMENT IN COLLEGE
274
American students are connecting with them about course topics and ideas or working with
them on activities other than coursework. The first step I suggest for faculty is to seek out
professional development opportunities to learn how to use culturally relevant pedagogy. Doing
so will help frame the context for faculty to begin such conversations with Asian American
students. The second step I suggest to engage Asian American students is to actively listen to
the course topics and ideas or activities the students are bringing up in conversation when
talking with them about their career plans and academic performance. Voicing observations
based on the conversations and simply asking students how those interests are connected to
their career plans is a straightforward strategy to engage Asian American students in this
manner and thereby increase student-faculty interaction.
Final Thoughts
Overall, this quantitative study found that Asian American students do not engage at the
same rates as their peers and first-generation Asian American students are less likely than non-
first-generation Asian American students to be engaged on their campuses. While they do not
engage at the same rates, there are two engagement indicators on which Asian American
students are more likely to participate—Collaborative Learning (i.e., asking another student to
help you understand course materials, explaining course material to one or more students,
preparing for exams by discussing or working through course material with other students, and
working with other students on course projects or assignments) and Quantitative Reasoning
(i.e., reaching conclusions based on your own analysis of numerical information, using
numerical information to examine a real-world problem or issue, and evaluating what others
have concluded from numerical information). Additionally, Asian American students are more
likely to work with a faculty member on activities other than coursework, such as on committees
and in student groups and discuss course topics, ideas, or concepts with a faculty member
outside of class. Therefore, to better support Asian American students, institutions, faculty, and
practitioners ought to meet them where their strengths lie. As the population of Asian Americans
ASIAN AMERICAN STUDENT ENGAGEMENT IN COLLEGE
275
is predicted to grow in the coming years (Ortman & Guarneri, n.d.), finding ways to support
Asian American students is crucial. In addition, as enrollment numbers are slated to decline in
the coming years for all racial groups except for Asian Americans (Bransberger & Michelau,
2016), it is in the interest of institutions to determine how best to support their Asian American
students and, in turn, attract more Asian American students to help with enrollment numbers.
For comments or questions for the author contact Dr. Cassie Kao at

ASIAN AMERICAN STUDENT ENGAGEMENT IN COLLEGE
276
References
Allen, J. (2014, July 11). University of Michigan reaches settlement with student group following
discrimination lawsuit. MLive Media Group. http://www.mlive.com/news/ann-
arbor/index.ssf/2014/07/university_of_michigan_reaches_1.html
American College Personnel Association (ACPA) & National Association of Student Personnel
Administration (NASPA). (2004). Learning reconsidered: A campus-wide focus on the
student experience.
Ancis, J. R., Sedlacek, W. E., & Mohr, J. J. (2000). Student perceptions of campus cultural
climate by race. Journal of Counseling & Development, 78(2), 180–185.
https://doi.org/10.1002/j.1556-6676.2000.tb02576.x
Astin, A. W. (1984). Student involvement: A developmental theory for higher education. Journal
of College Student Personnel, 25, 297–308. http://muse.jhu.edu/journal/238
Astin, A. W. (1993). Assessment for excellence: The philosophy and practice of assessment
and evaluation in higher education. American Council on Education/Oryx Press Series
on Higher Education.
Axelson, R. D., & Flick, A. (2011). Defining student engagement. Change: The Magazine of
Higher Learning, 43(1), 38–43. https://doi.org/10.1080/00091383.2011.533096
Baum, S., Kurose, C., & McPherson, M. (2013). An overview of American higher education.
Future of Children, 23(1), 17–39. http://www.jstor.org/stable/23409487
Bok, D. (2013). Higher education in America (Rev. ed.). Princeton University Press.
Bransberger, P., & Michelau, D. K. (2016). Knocking as the college door: Projections of high
(9th ed.). Western Interstate Commission for Higher Education.
Cabrera, N. L. (2014). Beyond Black and White: How White, male, college students see their
Asian American peers. Equity & Excellence in Education, 47(2), 133–151.
https://doi.org/10.1080/10665684.2014.900427
ASIAN AMERICAN STUDENT ENGAGEMENT IN COLLEGE
277
Chang, J. C. (2005). Faculty-student interaction at the community college: A focus on students
of color. Research in Higher Education, 46(7), 769–802. https://doi.org/10.1007/s11162-
004-6225-7
Chung, J. Y. (2014). Racism and Asian American student leadership. Equity & Excellence in
Education, 47(2), 117–132. https://doi.org/10.1080/10665684.2014.900392
Cultural capital. (2018). In Oxford reference.
http://www.oxfordreference.com/view/10.1093/oi/authority.20110803095652799
Desai, S. (2015, July). Cognitive dissonance [Video file]. https://www.khanacademy.org/test-
prep/mcat/processing-the-environment/cognition/v/cognitive-dissonance
Dugan, J. P., & Komives, S. R. (2010). Influences on college students’ capacities for socially
responsible leadership. Journal of College Student Development, 51(5), 525–549.
https://doi.org/10.1353.csd.2010.0009
Festinger, L. (1957). A theory of cognitive dissonance. Stanford University Press.
Festinger, L., & Carlsmith, J. M. (1959). Cognitive consequences of forced compliance. Journal
of Abnormal and Social Psychology, 58, 203–210.
http://web.mit.edu/curhan/www/docs/Articles/15341_Readings/Motivation/Festinger_Carl
smith_1959_Cognitive_consequences_of_forced_compliance.pdf
Flores, S. M., & Park, T. J. (2013). Race, ethnicity, and college success: Examining the
continued significance of the minority-serving institution. Educational Researcher, 42(3),
115–128. https://doi.org/10.3102/0013189X13478978
Fu, M. (2010, May 18). Collectivism vs. individualism [Web log post].
http://asianamericanpsych.blogspot.com/2010/05/collectivism-vs-individualism.html
Hall, L. K. (2015). Which of these things is not like the other: Hawaiians and other Pacific
Islanders are not Asian Americans, and all Pacific Islanders are not Hawaiian. American
Quarterly, 67(3), 727–747. https://doi.org/10.1353/aq.2015.0050
ASIAN AMERICAN STUDENT ENGAGEMENT IN COLLEGE
278
Harper, S. R. (2009). Race-conscious student engagement practices and the equitable
distribution of enriching educational experiences. Liberal Education, 95(4), 38–45.
http://repository.upenn.edu/gse_pubs/208
Harper, S. R., & Quaye, S. J. (2009). Student engagement in higher education. Routledge.
Harper, S. R., & Quaye, S. J. (2015). Making engagement equitable for students in U.S. higher
education. In S. J. Quaye & S. R. Harper (Eds.), Student engagement in higher
education (2nd ed., pp. ix–xiii). Routledge.
Hawkins, V. M., & Larabee, H. J. (2009). Engaging racial/ethnic minority students in out-of-class
activities on predominantly White campuses. In S. R. Harper & S. J. Quaye (Eds.),
Student engagement in higher education (pp. 179–197). Routledge.
Hoshino-Browne, E. (2012). Cultural variations in motivation for cognitive consistency:
Influences of self-systems on cognitive dissonance. Social and Personality Psychology
Compass, 6(2), 126–141. https://doi.org/10.1111/j.1751-9004.2011.00419.x
Hu, S. (2010). Reconsidering the relationship between student engagement and persistence in
college. Innovative Higher Education, 36(2), 97–106. https://doi.org10.1007/s10755-010-
9158-4
Hu, S., & McCormick, A. C. (2012). An engagement-based student typology and its relationship
to college outcomes. Research in Higher Education, 53(7), 738–754.
https://doi.org/10.1007/s11162-012-9254-7
Hui, K., & Lent, R. W. (2018). The roles of family, culture, and social cognitive variables in the
career interests and goals of Asian American college students. Journal of Counseling
Psychology, 65(1), 98–109. https://doi.org/10.1037/cou0000235
Ishitani, T. T. (2006). Studying attrition and degree completion behavior among first-generation
college students in the United States. Journal of Higher Education, 77(5), 861–885.
http://www.jstor.org/stable/3838790
ASIAN AMERICAN STUDENT ENGAGEMENT IN COLLEGE
279
Iwamoto, D. K., & Liu, W. M. (2010). The impact of racial identity, ethnic identity, Asian values,
and race-related stress on Asian Americans and Asian international college students’
psychological well-being. Journal of Counseling Psychology, 57(1), 79–91.
https://doi.org/10.1037/a0017393
Jo, J. (2004). Neglected voices in the multicultural America: Asian American racial politics and
its implications for multicultural education. Multicultural Perspectives, 6(1), 19–25.
https://doi.org/10.1207/s15327892mcp0601_4
Johnston, M. P., & Yeung, F. P. F. (2014). Asian Americans and campus climate: Investigating
group differences around a racial incident. Journal of Student Affairs Research and
Practice, 51(2), 143–156. https://doi.org/10.1515/jsarp-2014.0015
Kahu, E. R. (2013). Framing student engagement in higher education. Studies in Higher
Education, 38(5), 758–773. https://doi.org/10.1080/03075079.2011.598505
Kodama, C. M., & Abreo, A. (2009). Do labels matter? Attitudinal and behavioral correlates of
ethnic and racial identity choices among Asian American undergraduates (EJ882661).
ERIC. http://files.eric.ed.gov/fulltext/EJ882661.pdf
Kuh, G. D. (1995). Cultivating “high-stakes” student culture research. Research in Higher
Education, 36(5), 563–576. http://www.jstor.org/stable/40196254
Kuh, G. D. (2001). Assessing what really matters in student learning: Inside the National Survey
of Student Engagement. Change: The Magazine of Higher Learning, 33(3), 10–66.
https://doi.org/10.1080/00091380109601795
Kuh, G. D. (2008). High-impact educational practices: What they are, who has access to them,
and why they matter. Association of American Colleges & Universities.
Kuh, G. D. (2009). What student affairs professionals need to know about student engagement.
Journal of College Student Development, 50(6), 683–706.
https://doi.org/10.1353/csd.0.0099
ASIAN AMERICAN STUDENT ENGAGEMENT IN COLLEGE
280
Kuh, G. D. (2016). Making learning meaningful: Engaging students in ways that matter to them.
New Directions for Teaching and Learning, 2016(145), 49–56.
https://doi.org/10.1002/tl.20174
Kuh, G. D., Cruce, T. M., Shoup, R., Kinzie, J., & Gonyea, R. M. (2008). Unmasking the effects
of student engagement on first-year college grades and persistence. Journal of Higher
Education, 79(5), 540–563. http://www.jstor.org/stable/25144692
Kuh, G. D., Kinzie, J., Buckley, J. A., Bridges, B. L., & Hayek, J. C. (2006). What matters to
student success: A review of the literature. Commissioned Report for the National
Symposium on Postsecondary Student Success: Spearheading a Dialog on Student
Success. https://nces.ed.gov/npec/pdf/kuh_team_report.pdf
Kuh, G. D., Kinzie, J., Buckley, J. A., Bridges, B. L., & Hayek, J. C. (2007). Piecing together the
student success puzzle: Research, propositions, and recommendations. ASHE Higher
Education Report, 32(5). Jossey-Bass.
Lee, R. M., & Yoo, H. C. (2004). Structure and measurement of ethnic identity for Asian
American college students. Journal of Counseling Psychology, 51(2), 263–269.
https://doi.org/10.1037/0022-0167.51.2.263
Lee, S. J., & Kumashiro, K. (2005). A report on the status of Asian Americans and Pacific
Islanders in education: Beyond the “model minority” stereotype. National
Education Association. http://friendsofpubliced.org/wp-
content/uploads/2014/02/Status-Asian-American.pdf
Li, G., Lin, J., & Wang, H. (2014). Rethinking identity and agency in minority education:
Preparing Asian American leaders for a global future. New Waves-Education Research
& Development, 17, 50–65.
http://www.viethconsulting.com/members/publication/new_waves_home.php
ASIAN AMERICAN STUDENT ENGAGEMENT IN COLLEGE
281
Liang, C. T. H., Alvarez, A. N., Juang, L. P., & Liang, M. X. (2007). The role of coping in the
relationship between perceived racism and racism-related stress for Asian Americans:
Gender differences. Journal of Counseling Psychology, 54(2), 132–141.
https://doi.org/10.1037/0022-0167.54.2.132
Luttrell, A. (2016, July). Cognitive dissonance theory: A crash course [Video file]. YouTube.
https://www.youtube.com/watch?v=9Y17YaZRRvY
Maramba, D. C., & Palmer, R. T. (2014). The impact of cultural validation on the college
experiences of Southeast Asian American students. Journal of College Student
Development, 55(6), 515–530. https://doi.org/10.1353/csd.2014.0054
Murjani, M. (2014). Breaking apart the model minority and perpetual foreigner stereotypes:
Asian Americans and cultural capital. The Vermont Connection, 35, 79–90.
http://scholarworks.uvm.edu/tvc/vol35/iss1/10
Museus, S. D. (2008). The model minority and inferior minority myths: Understanding
stereotypes and their implications for student learning. About Campus, 13(3), 2–8.
https://doi.org/10.1002/abc.252
Museus, S. D. (2013). Unpacking the complex and multifaceted nature of parental influences on
Southeast Asian American college students’ educational trajectories. Journal of Higher
Education, 84(5), 708–738. https://doi.org/10.1353/jhe.2013.0031
Museus, S. D., & Park, J. J. (2015). The continuing significance of racism in the lives of Asian
American college students. Journal of College Student Development, 56(6), 551–569.
https://muse.jhu.edu/article/595556
National Center for Education Statistics (NCES). (2016). IPEDS Data Center. http://nces.ed.gov/
National Education Association. (2017). Asians/Pacific Islanders: Education issues.
http://www.nea.org/home/15571.htm

ASIAN AMERICAN STUDENT ENGAGEMENT IN COLLEGE
282
National Survey of Student Engagement (NSSE). (2014). From benchmarks to engagement
indicators and high-impact practices.
http://nsse.indiana.edu/pdf/Benchmarks%20to%20Indicators.pdf
National Survey of Student Engagement (NSSE). (2015a). Engagement indicators and high-
impact practices. http://nsse.indiana.edu/pdf/EIs_and_HIPs_2015.pdf
National Survey of Student Engagement (NSSE). (2015b). Engagement insights: Survey
findings on the quality of undergraduate education—annual results 2016. Indiana
University Center for Postsecondary Research.
National Survey of Student Engagement (NSSE). (2015c). NSSE 2015 overview.
http://nsse.indiana.edu/2015_Institutional_Report/pdf/NSSE%202015%20Overview.pdf
National Survey of Student Engagement (NSSE). (2017a). About NSSE.
http://nsse.indiana.edu/html/about.cfm
National Survey of Student Engagement (NSSE). (2017b). Construction of the NSSE
benchmarks. http://nsse.indiana.edu/html/benchmark_construction.cfm
National Survey of Student Engagement (NSSE). (2017c). NSSE engagement indicators.
http://nsse.indiana.edu/html/engagement_indicators.cfm
National Survey of Student Engagement (NSSE). (2017d). Our origins and potential.
http://nsse.indiana.edu/html/origins.cfm
National Survey of Student Engagement (NSSE). (2018). Common data recodes, original NSSE
(2000-2012). http://nsse.indiana.edu/html/common_data_recodes_original.cfm
Naylor, L. A., Wyatt-Nichol, H., & Brown, S. L. (2015). Inequality: Underrepresentation of African
American males in U.S. higher education. Journal of Public Affairs Education, 21, 523–
538. http://www.naspaa.org/jpaemessenger/Article/VOL21-4/07Naylor082015.pdf
ASIAN AMERICAN STUDENT ENGAGEMENT IN COLLEGE
283
Ortman, J. M., & Guarneri, C. E. (n.d.). United States population projections: 2000 to 2050.
https://www.census.gov/library/working-papers/2009/demo/us-pop-proj-2000-2050.html
Owens, J., & Lynch, S. M. (2012). Black and Hispanic immigrants’ resilience against negative-
ability racial stereotypes at selective colleges and universities in the United States.
Sociology of Education, 85(4), 303–325. https://doi.org/10.1177/0038040711435856
Pak, Y. K., Maramba, D. C., & Hernandez, X. J. (2014). Asian Americans in higher education.
ASHE Higher Education Report, 40(1). https://doi.org/10.1002/aehe.20013
Pang, V. O., Han, P. P., & Pang, J. M. (2011). Asian American and Pacific Islander students:
Equity and the achievement gap. Educational Researcher, 40(8), 378–389.
http://www.jstor.org/stable/41302978
Park, J. Z. (2008). Second-generation Asian American pan-ethnic identity: Pluralized meanings
of a racial label. Sociological Perspectives, 51(3), 541–561.
https://doi.org/10.1525/sop.2008.51.3.541
Pascarella, E. T., & Terenzini, P. T. (2005). How college affects students: A third decade of
Research (2nd ed.). Jossey-Bass.
Pew Research Center. (2012). The rise of Asian Americans.
http://www.pewsocialtrends.org/2012/06/19/the-rise-of-asian-americans/
Pike, G. R., & Kuh, G. D. (2005). First- and second-generation college students: A comparison
of their engagement and intellectual development. Journal of Higher Education, 76(3),
276–300. http://www.jstor.org/stable/3838799
Pike, G. R., Kuh, G. D., McCormick, A. C., Ethington, C. A., & Smart, J. C. (2011). If and when
money matters: The relationships among educational expenditures, student engagement
and students’ learning outcomes. Research in Higher Education, 52(1), 81–106.
https://doi.org/10.1007/s11162-010-9183-2
ASIAN AMERICAN STUDENT ENGAGEMENT IN COLLEGE
284
Pike, G. R., Smart, J. C., Kuh, G. D., & Hayek, J. C. (2006). Educational expenditures and
student engagement: When does money matter? Research in Higher Education, 47(7),
847–872. https://doi.org/10.1007/s11162-006-9018-3
Quaye, S. J., Griffin, K. A., & Museus, S. D. (2015). Engaging students of color. In S. J. Quaye
& S. R. Harper (Eds.), Student engagement in higher education (2nd ed., pp. 15–35).
Routledge.
Quaye, S. J., & Harper, S. R. (2015). Student engagement in higher education (Rev. ed.).
Routledge.
Quaye, S. J., Tambascia, T. P., & Talesh, R. A. (2009). Engaging racial/ethnic minority students
in predominantly White classroom environments. In S. R. Harper & S. J. Quaye (Eds.),
Student engagement in higher education (pp. 157–178). Routledge.
Redondo, B. (2008). Left in the margins: Asian American students and the No Child Left Behind
Act. Asian American Legal Defense and Education Fund.
http://www.aaldef.org/docs/AALDEF_LeftintheMargins_NCLB.pdf
Reeves, T., & Bennett, C. (2004). We the people: Asians in the United States. The Asian
American and Pacific Islander population in the United States. U.S. Census Bureau.
https://www.census.gov/prod/2004pubs/censr-17.pdf
Renn, K. A., & Reason, R. D. (2013). College students in the United States: Characteristics,
experiences, and outcomes. Jossey-Bass.
Robinson, K. (2013, April). How to escape education’s Death Valley [Video file].
http://www.ted.com/talks/ken_robinson_how_to_escape_education_s_death_valley
Ruffalo Noel Levitz. (2016). 2016 marketing and student recruitment practices benchmark report
for four-year colleges and universities. http://www.RuffaloNL.com/BenchmarkReports
Shen, F. C. (2015). The role of internalized stereotyping, parental pressure, and parental
support on Asian Americans’ choice of college major. Journal of Multicultural Counseling
and Development, 43(1), 58-73. https://doi.org/10.1002/j.2161-1912.2015.00064.x

ASIAN AMERICAN STUDENT ENGAGEMENT IN COLLEGE
285
Snyder, T. D., & Dillow, S. A. (2015). Digest of education statistics 2013 (NCES Report No.
2015-011). National Center for Education Statistics.
https://nces.ed.gov/pubs2015/2015011.pdf
Teranishi, R. T., & Nguyen, T. K. (2012). Asian Americans and Pacific Islanders: The changing
demography of the United States and implications for education policy. Harvard Journal
of Asian American Policy Review, 22, 17–27.
https://www.fresnostate.edu/president/pchre/documents/teranishi-changing-
demography.pdf
The Pell Institute & Penn AHEAD. (2015). Indicators of higher education equity in the United
States (Rev. ed.). http://www.pellinstitute.org/downloads/publications-
Indicators_of_Higher_Education_Equity_in_the_US_45_Year_Trend_Report.pdf
Tinto, V. (2000). Taking retention seriously: Rethinking the first year of college. NACADA
Journal, 19(2), 5–10. https://doi.org/10.12930/0271-9517-19.2.5
U.S. Census Bureau. (2002). The Asian population: Census 2000 brief.
https://www.census.gov/prod/2002pubs/c2kbr01-16.pdf
U.S. Census Bureau. (2012). The Asian population: Census 2010 brief.
https://www.census.gov/prod/cen2010/briefs/c2010br-11.pdf
Wei, M., Ku, T., Liao, K. Y. (2011). Minority stress and college persistence attitudes among
African American, Asian American, and Latino students: Perception of university
environment as a mediator. Cultural Diversity and Ethnic Minority Psychology, 17(2),
195–203. https://doi.org/10.1037/a0023359
Wells, A. V., & Horn, C. (2015). The Asian American college experience at a diverse institution:
Campus climate as a predictor of sense of belonging. Journal of Student Affairs
Research and Practice, 52(2), 149–163. https://doi.org/10.1080/19496591.2015.1041867
ASIAN AMERICAN STUDENT ENGAGEMENT IN COLLEGE
286
Witkow, M. R., Huynh, V., & Fuligni, A. J. (2015). Understanding differences in college
persistence: A longitudinal examination of financial circumstances, family obligations,
and discrimination in an ethnically diverse sample. Applied Developmental Science,
19(1), 4–18. https://doi.org/10.1080/10888691.2014.946030
Wodtke, G. T. (2012). The impact of education on intergroup attitudes: A multiracial analysis.
Social Psychology Quarterly, 75(1), 80–106. https://doi.org/10.1177/0190272511430234
Wong, P., Lai, C. F., Nagasawa, R., & Lin, T. (1998). Asian Americans as a model minority:
Self-perceptions and perceptions of other racial groups. Sociological Perspectives,
41(2), 95–118. http://www.jstor.org/stable/1389355
Yeh, T. L. (2005). Issues of college persistence between Asian and Asian Pacific American
students. Journal of College Student Retention, 6(1), 81–96.
https://doi.org/10.2190/MG9G-76UR-7BUK-5JUW
Zhou, M., & Lee, J. (2017). Hyper-selectivity and the remaking of culture: Understanding the
Asian American achievement paradox. Asian American Journal of Psychology, 8(1), 7–
15. https://doi.org/10.1037/aap0000069
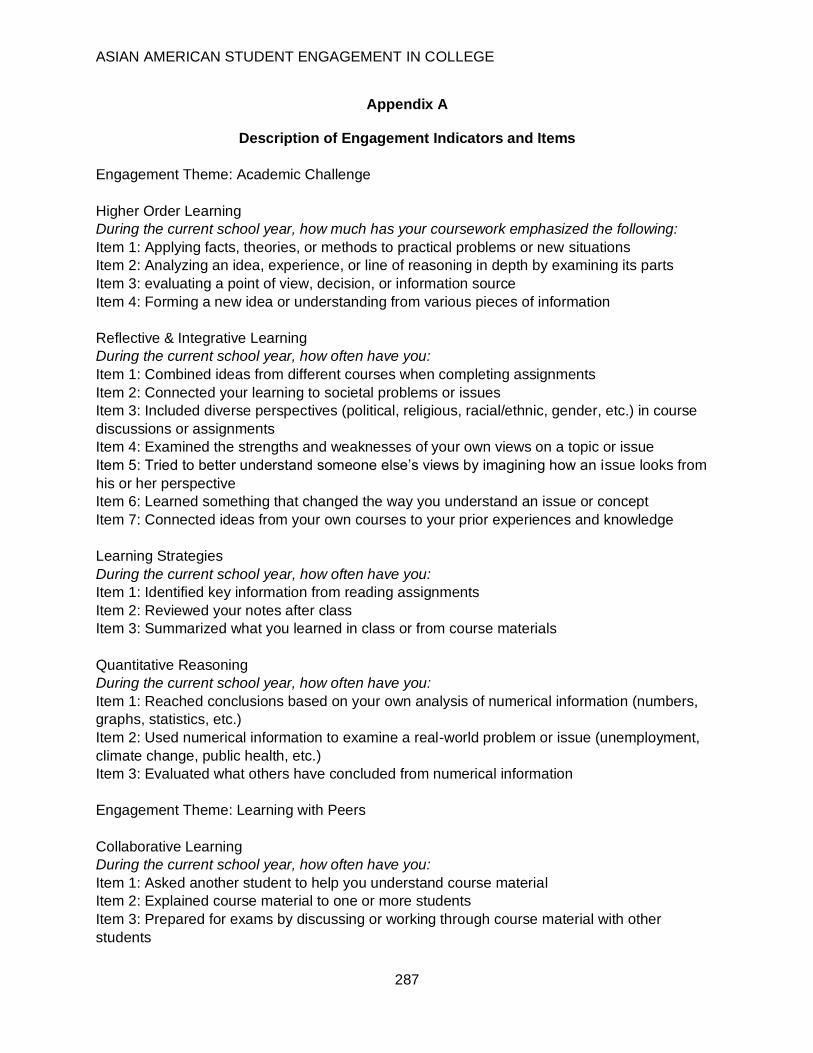
ASIAN AMERICAN STUDENT ENGAGEMENT IN COLLEGE
287
Appendix A
Description of Engagement Indicators and Items
Engagement Theme: Academic Challenge
Higher Order Learning
During the current school year, how much has your coursework emphasized the following:
Item 1: Applying facts, theories, or methods to practical problems or new situations
Item 2: Analyzing an idea, experience, or line of reasoning in depth by examining its parts
Item 3: evaluating a point of view, decision, or information source
Item 4: Forming a new idea or understanding from various pieces of information
Reflective & Integrative Learning
During the current school year, how often have you:
Item 1: Combined ideas from different courses when completing assignments
Item 2: Connected your learning to societal problems or issues
Item 3: Included diverse perspectives (political, religious, racial/ethnic, gender, etc.) in course
discussions or assignments
Item 4: Examined the strengths and weaknesses of your own views on a topic or issue
Item 5: Tried to better understand someone else’s views by imagining how an issue looks from
his or her perspective
Item 6: Learned something that changed the way you understand an issue or concept
Item 7: Connected ideas from your own courses to your prior experiences and knowledge
Learning Strategies
During the current school year, how often have you:
Item 1: Identified key information from reading assignments
Item 2: Reviewed your notes after class
Item 3: Summarized what you learned in class or from course materials
Quantitative Reasoning
During the current school year, how often have you:
Item 1: Reached conclusions based on your own analysis of numerical information (numbers,
graphs, statistics, etc.)
Item 2: Used numerical information to examine a real-world problem or issue (unemployment,
climate change, public health, etc.)
Item 3: Evaluated what others have concluded from numerical information
Engagement Theme: Learning with Peers
Collaborative Learning
During the current school year, how often have you:
Item 1: Asked another student to help you understand course material
Item 2: Explained course material to one or more students
Item 3: Prepared for exams by discussing or working through course material with other
students

ASIAN AMERICAN STUDENT ENGAGEMENT IN COLLEGE
288
Item 4: Worked with other students on course projects or assignments
Discussions With Diverse Others
During the current school year, how often have you had discussions with people from the
following groups:
Item 1: People from a race or ethnicity other than your own
Item 2: People from an economic background other than your own
Item 3: People with religious beliefs other than your own
Item 4: People with political views other than your own
Engagement Theme: Experiences With Faculty
Student-Faculty Interaction
During the current school year, how often have you:
Item 1: Talked about career plans with a faculty member
Item 2: Worked with a faculty member on activities other than coursework (committees, student
groups, etc.)
Item 3: Discussed course topics, ideas, or concepts with a faculty member outside of class
Item 4: Discussed your academic performance with a faculty member
Effective Teaching Practices
During the current school year, to what extent have your instructors done the following:
Item 1: Clearly explained course goals and requirements
Item 2: Taught course sessions in an organized way
Item 3: Used examples or illustrations to explain difficult points
Item 4: Provided feedback on a draft or work in progress
Item 5: Provided prompt and detailed feedback on tests or completed assignments
Engagement Theme: Campus Environment
Quality of Interactions
Indicate the quality of your interactions with the following people at your institution:
Item 1: Students
Item 2: Academic advisors
Item 3: Faculty
Item 4: Student services staff (career services, student activities, housing, etc.)
Item 5: Other administrative staff and offices (registrar, financial aid, etc.)
Supportive Environment
How much does your institution emphasize the following?
Item 1: Providing support to help students succeed academically
Item 2: Using learning support services (tutoring services, writing center, etc.)
Item 3: Encouraging contact among students from different backgrounds (social, racial/ethnic,
religious, etc.)
Item 4: Providing opportunities to be involved socially
Item 5: Providing support for your overall well-being (recreation, health care, counseling, etc.)
Item 6: Helping you manage your nonacademic responsibilities (work, family, etc.)

ASIAN AMERICAN STUDENT ENGAGEMENT IN COLLEGE
289
Item 7: Attending campus activities and events (performing arts, athletic events, etc.)
Item 8: Attending events that address important social, economic, or political issues
Note. Adapted from “Engagement Indicators and High-Impact Practices,” by NSSE, 2015a.
Retrieved from http://nsse.indiana.edu/pdf/EIs_and_HIPs_2015.pdf

ASIAN AMERICAN STUDENT ENGAGEMENT IN COLLEGE
290
Appendix B
Tables Associated with Research Questions
Table B1
One-Way ANOVA Post Hoc Comparisons of Collaborative Learning of Asian American Students
Compared to Statistically Significant Racial Ethnic Groups
Variable p M SD d
Item 1 – Asked another student to help you understand
course material
Asian American (n = 2896) 2.89 .858
Black/African American (n = 3558) .007 2.80 .930 .100
Hispanic/Latino (n = 4190) .044 2.82 .895 .080
White (n = 29537) .002 2.82 .887 .079
Multiracial (n = 3462) .002 2.80 .905 .102
Item 2 – Explained course materials to one or more
students
Asian American (n = 2887) 2.78 .827
Black/African American (n = 3552) < .001 2.64 .884 .163
Hispanic/Latino (n = 4179) < .001 2.67 .828 .133
Item 3 – Prepared for exams by discussing or working
through course material with other students
Asian American (n = 2895) 2.63 .938
Black/African American (n = 3561) < .001 2.47 1.020 .163
Hispanic/Latino (n = 4198) .010 2.54 .991 .093
White (n = 29550) < .001 2.53 .988 .102
Item 4 – Worked with other students on course projects or
assignments
Asian American (n = 2900) 2.76 .871
Black/African American (n = 3558) < .001 2.47 .932 .221
Hispanic or Latino (n = 4177) < .001 2.54 .871 .149
White (n = 29526) < .001 2.50 .879 .194
Other (n = 728) < .001 2.50 .929 .193
Multiracial (n = 3450) < .001 2.55 .898 .135

ASIAN AMERICAN STUDENT ENGAGEMENT IN COLLEGE
291
Table B2
One-Way ANOVA Post Hoc Comparisons of Reflective and Integrative Learning of Asian
American Students Compared to Statistically Significant Racial Ethnic Groups
Variable p M SD d
Item 1 – Combined ideas from different courses when
completing assignments
Asian American (n = 2905) 2.84 .834
White (n = 29570) < .001 2.93 .840 .107
Multiracial (n = 3454) < .001 2.97 .855 .154
Item 2 – Connected your learning to societal problems or
issues
Asian American (n = 2877) 2.73 .864
Black/African American (n = 3538) < .001 2.89 .903 .181
Hispanic/Latino (n = 4171) .005 2.81 .895 .091
White (n = 29422) .002 2.80 .878 .080
Multiracial (n = 3440) < .001 2.89 .891 .182
Item 3 – Included diverse perspectives (political, religious,
racial/ethnic, gender, etc.) in course discussions or
assignments
Asian American (n = 2892) 2.62 .902
Black/African Americans (n = 3555) < .001 2.81 .932 .207
Hispanic/Latino (n = 4182) .002 2.70 .935 .087
White (n = 29462) .025 2.68 .907 .066
Other (n = 727) .003 2.76 .944 .154
Multiracial (n = 3452) < .001 2.80 .935 .196
Item 4 – Examined the strengths and weaknesses of your
own views on a topic or issue
Asian American (n = 2884) 2.82 .802
Black/African Americans (n = 3551) < .001 2.96 .845 .169
Multiracial (n = 3444) < .001 2.95 .838 .158
Item 5 – Tried to better understand someone else’s views
by imagining how an issue looks from his or her
perspective
Asian American (n = 2888) 2.92 .810
Black/African American (n = 3544) < .001 3.06 .803 .174
Hispanic/Latino (n = 4186) .008 3.00 .824 .098
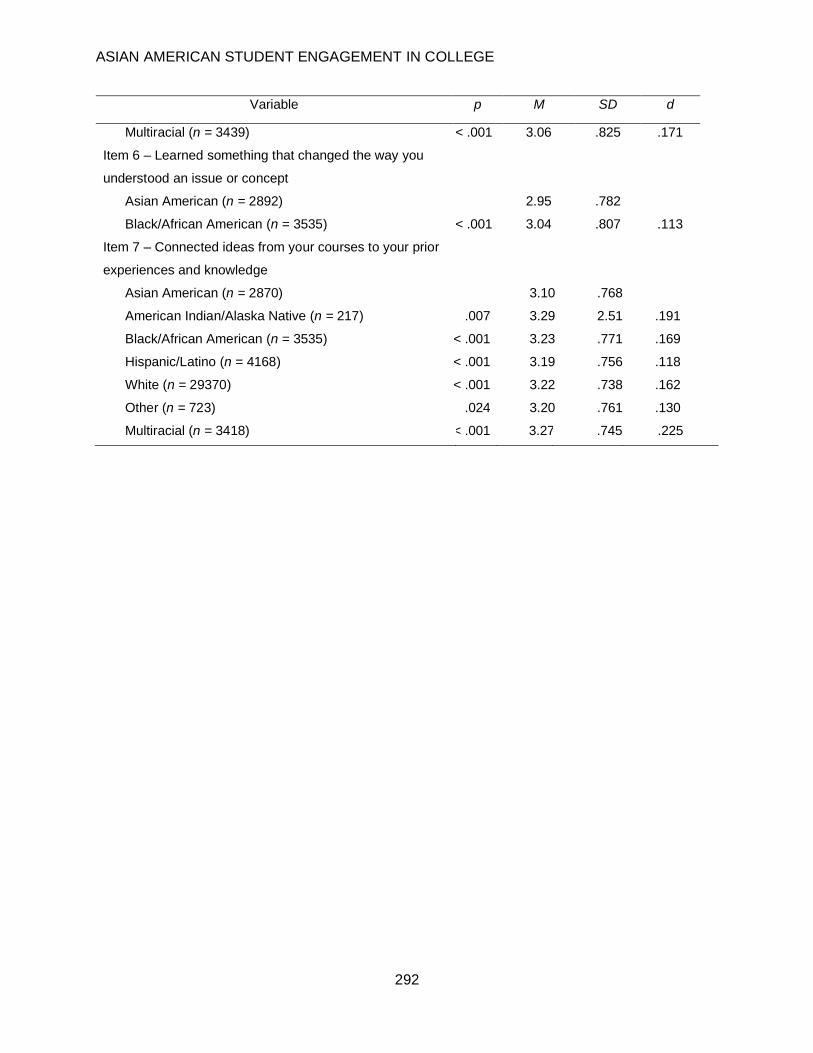
ASIAN AMERICAN STUDENT ENGAGEMENT IN COLLEGE
292
Variable p M SD d
Multiracial (n = 3439) < .001 3.06 .825 .171
Item 6 – Learned something that changed the way you
understood an issue or concept
Asian American (n = 2892) 2.95 .782
Black/African American (n = 3535) < .001 3.04 .807 .113
Item 7 – Connected ideas from your courses to your prior
experiences and knowledge
Asian American (n = 2870) 3.10 .768
American Indian/Alaska Native (n = 217) .007 3.29 2.51 .191
Black/African American (n = 3535) < .001 3.23 .771 .169
Hispanic/Latino (n = 4168) < .001 3.19 .756 .118
White (n = 29370) < .001 3.22 .738 .162
Other (n = 723) .024 3.20 .761 .130
Multiracial (n = 3418) < .001 3.27 .745 .225
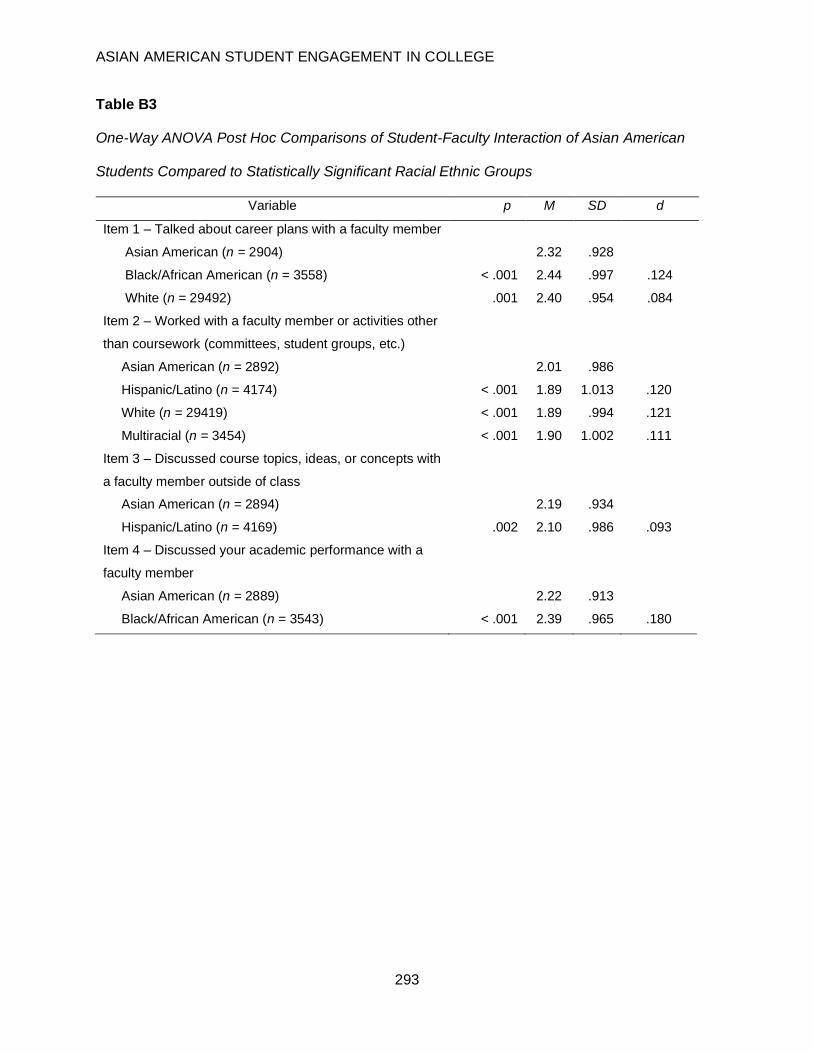
ASIAN AMERICAN STUDENT ENGAGEMENT IN COLLEGE
293
Table B3
One-Way ANOVA Post Hoc Comparisons of Student-Faculty Interaction of Asian American
Students Compared to Statistically Significant Racial Ethnic Groups
Variable p M SD d
Item 1 – Talked about career plans with a faculty member
Asian American (n = 2904) 2.32 .928
Black/African American (n = 3558) < .001 2.44 .997 .124
White (n = 29492) .001 2.40 .954 .084
Item 2 – Worked with a faculty member or activities other
than coursework (committees, student groups, etc.)
Asian American (n = 2892) 2.01 .986
Hispanic/Latino (n = 4174) < .001 1.89 1.013 .120
White (n = 29419) < .001 1.89 .994 .121
Multiracial (n = 3454) < .001 1.90 1.002 .111
Item 3 – Discussed course topics, ideas, or concepts with
a faculty member outside of class
Asian American (n = 2894) 2.19 .934
Hispanic/Latino (n = 4169) .002 2.10 .986 .093
Item 4 – Discussed your academic performance with a
faculty member
Asian American (n = 2889) 2.22 .913
Black/African American (n = 3543) < .001 2.39 .965 .180
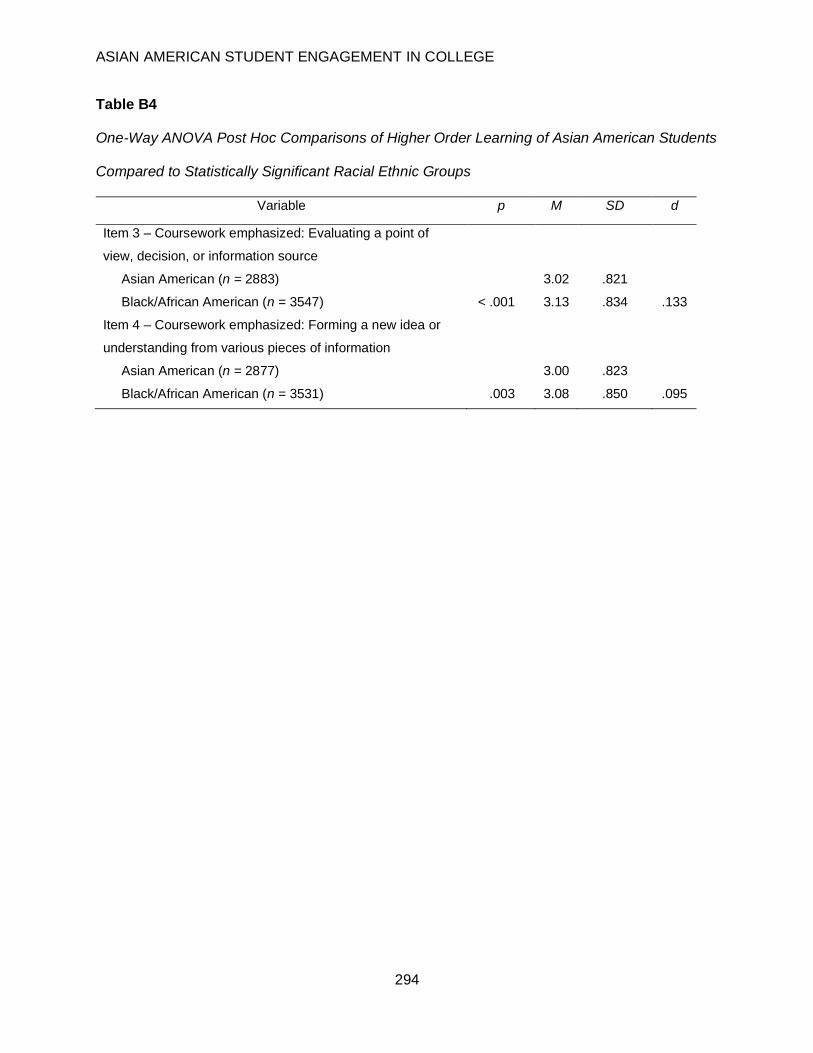
ASIAN AMERICAN STUDENT ENGAGEMENT IN COLLEGE
294
Table B4
One-Way ANOVA Post Hoc Comparisons of Higher Order Learning of Asian American Students
Compared to Statistically Significant Racial Ethnic Groups
Variable p M SD d
Item 3 – Coursework emphasized: Evaluating a point of
view, decision, or information source
Asian American (n = 2883) 3.02 .821
Black/African American (n = 3547) < .001 3.13 .834 .133
Item 4 – Coursework emphasized: Forming a new idea or
understanding from various pieces of information
Asian American (n = 2877) 3.00 .823
Black/African American (n = 3531) .003 3.08 .850 .095
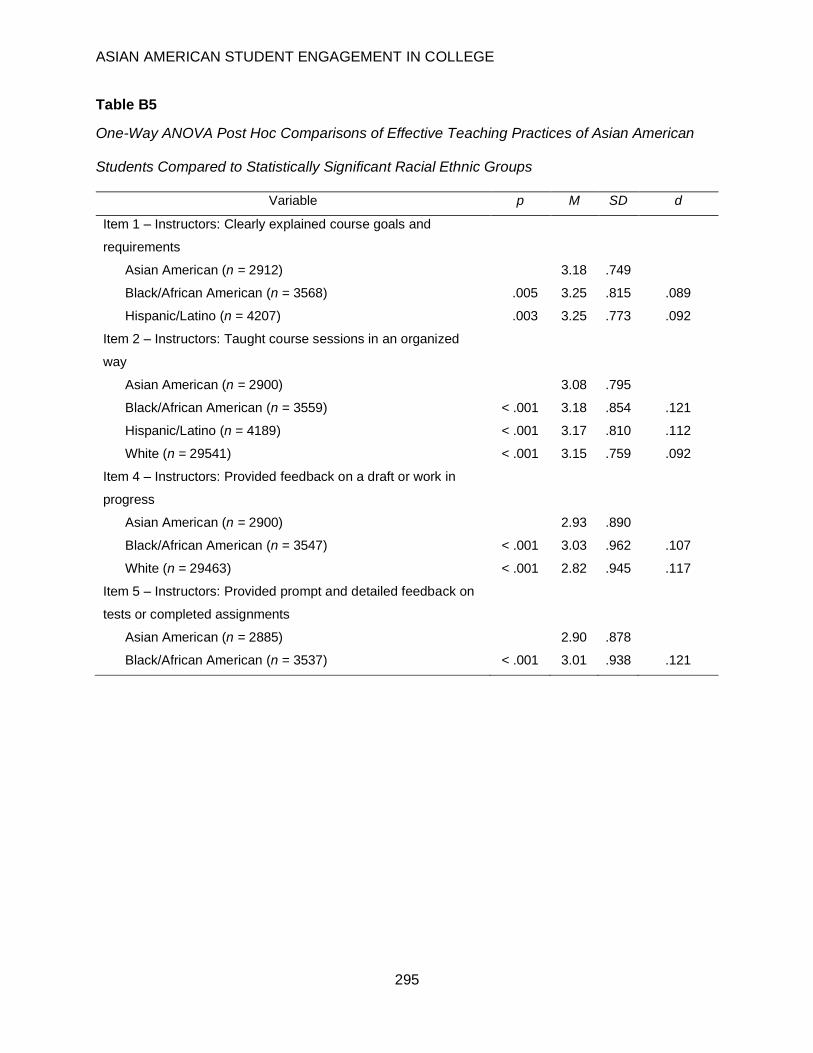
ASIAN AMERICAN STUDENT ENGAGEMENT IN COLLEGE
295
Table B5
One-Way ANOVA Post Hoc Comparisons of Effective Teaching Practices of Asian American
Students Compared to Statistically Significant Racial Ethnic Groups
Variable p M SD d
Item 1 – Instructors: Clearly explained course goals and
requirements
Asian American (n = 2912) 3.18 .749
Black/African American (n = 3568) .005 3.25 .815 .089
Hispanic/Latino (n = 4207) .003 3.25 .773 .092
Item 2 – Instructors: Taught course sessions in an organized
way
Asian American (n = 2900) 3.08 .795
Black/African American (n = 3559) < .001 3.18 .854 .121
Hispanic/Latino (n = 4189) < .001 3.17 .810 .112
White (n = 29541) < .001 3.15 .759 .092
Item 4 – Instructors: Provided feedback on a draft or work in
progress
Asian American (n = 2900) 2.93 .890
Black/African American (n = 3547) < .001 3.03 .962 .107
White (n = 29463) < .001 2.82 .945 .117
Item 5 – Instructors: Provided prompt and detailed feedback on
tests or completed assignments
Asian American (n = 2885) 2.90 .878
Black/African American (n = 3537) < .001 3.01 .938 .121

ASIAN AMERICAN STUDENT ENGAGEMENT IN COLLEGE
296
Table B6
One-Way ANOVA Post Hoc Comparisons of Quantitative Reasoning of Asian American
Students Compared to Statistically Significant Racial Ethnic Groups
Variable p M SD d
Item 1 – Reached conclusions based on your own analysis of
numerical information (numbers, graphs, statistics, etc.)
Asian American (n = 2915) 2.75 .892
Black/African American (n = 3580) < .001 2.63 .976 .128
Hispanic/Latino (n = 4202) < .001 2.64 .964 .118
White (n = 29613) < .001 2.60 .956 .158
Multiracial (n = 3475) < .001 2.63 .972 .128
Item 2 – Used numerical information to examine a real-world
problem or issue (unemployment, climate change, public
health, etc.)
Asian American (n = 2912) 2.53 .936
Black/African American (n = 3577) .003 2.43 1.002 .103
Hispanic/Latino (n = 4199) .001 2.43 .995 .103
White (n = 29553) < .001 2.36 .966 .176
Multiracial (n = 3472) < .001 2.40 .991 .135
Item 3 – Evaluated what others have concluded from numerical
information
Asian American (n = 2899) 2.52 .901
Black/African American (n = 3563) < .001 2.38 .992 .147
Hispanic/Latino (n = 4182) < .001 2.36 .983 .168
White (n = 29476) < .001 2.37 .941 .160
Multiracial (n = 3459) < .001 2.41 .966 .117
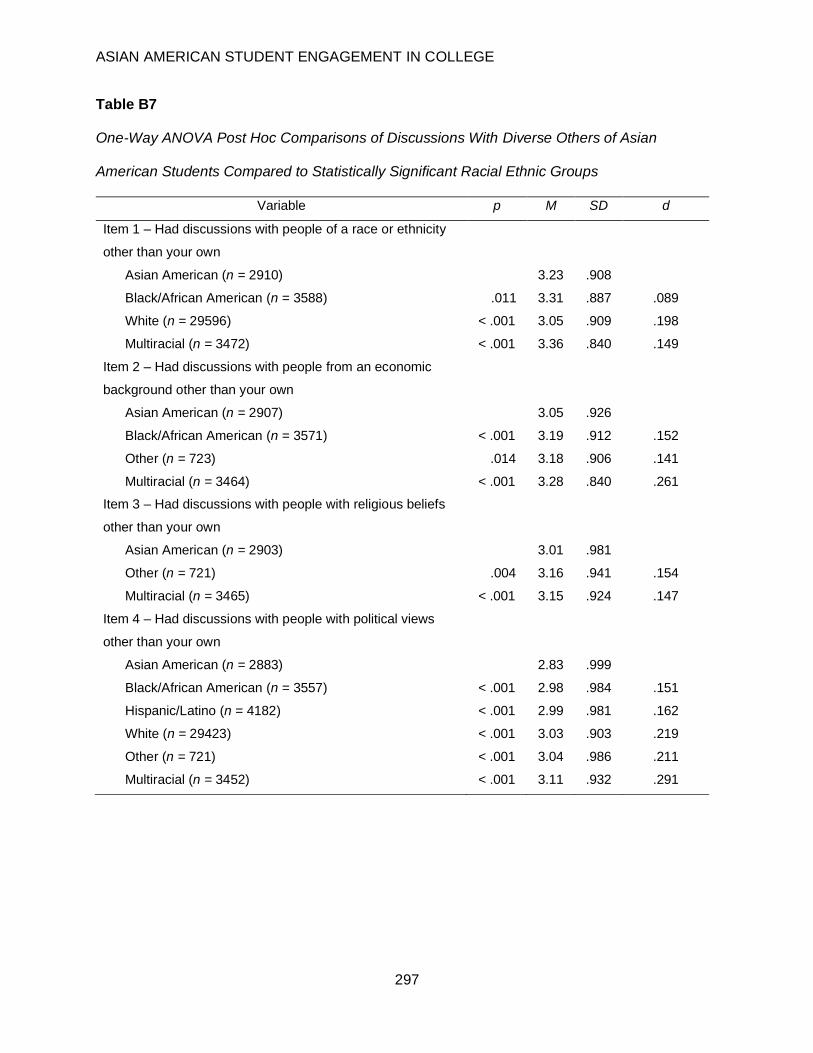
ASIAN AMERICAN STUDENT ENGAGEMENT IN COLLEGE
297
Table B7
One-Way ANOVA Post Hoc Comparisons of Discussions With Diverse Others of Asian
American Students Compared to Statistically Significant Racial Ethnic Groups
Variable p M SD d
Item 1 – Had discussions with people of a race or ethnicity
other than your own
Asian American (n = 2910) 3.23 .908
Black/African American (n = 3588) .011 3.31 .887 .089
White (n = 29596) < .001 3.05 .909 .198
Multiracial (n = 3472) < .001 3.36 .840 .149
Item 2 – Had discussions with people from an economic
background other than your own
Asian American (n = 2907) 3.05 .926
Black/African American (n = 3571) < .001 3.19 .912 .152
Other (n = 723) .014 3.18 .906 .141
Multiracial (n = 3464) < .001 3.28 .840 .261
Item 3 – Had discussions with people with religious beliefs
other than your own
Asian American (n = 2903) 3.01 .981
Other (n = 721) .004 3.16 .941 .154
Multiracial (n = 3465) < .001 3.15 .924 .147
Item 4 – Had discussions with people with political views
other than your own
Asian American (n = 2883) 2.83 .999
Black/African American (n = 3557) < .001 2.98 .984 .151
Hispanic/Latino (n = 4182) < .001 2.99 .981 .162
White (n = 29423) < .001 3.03 .903 .219
Other (n = 721) < .001 3.04 .986 .211
Multiracial (n = 3452) < .001 3.11 .932 .291

ASIAN AMERICAN STUDENT ENGAGEMENT IN COLLEGE
298
Table B8
One-Way ANOVA Post Hoc Comparisons of Learning Strategies of Asian American Students
Compared to Statistically Significant Racial Ethnic Groups
Variable p M SD d
Item 1 – Identified key information from reading assignments
Asian American (n = 2893) 3.17 .754
Black/African American (n = 3579) < .001 3.34 .735 .229
Hispanic/Latino (n = 4201) .011 3.24 .768 .092
White (n = 29557) .006 3.23 .775 .078
Multiracial (n = 3461) .011 3.24 .783 .091
Item 2 – Reviewed your notes after class
Asian American (n = 2885) 2.91 .896
American Indian/Alaska Native (n = 218) .004 3.16 .841 .280
Black/African American (n = 3554) < .001 3.07 .890 .179
Item 3 – Summarized what you learned in class or from
course materials
Asian American (n = 2865) 2.88 .885
American Indian/Alaska Native (n = 213) .005 3.13 .889 .282
Black/African American (n = 3519) < .001 3.04 .891 .180
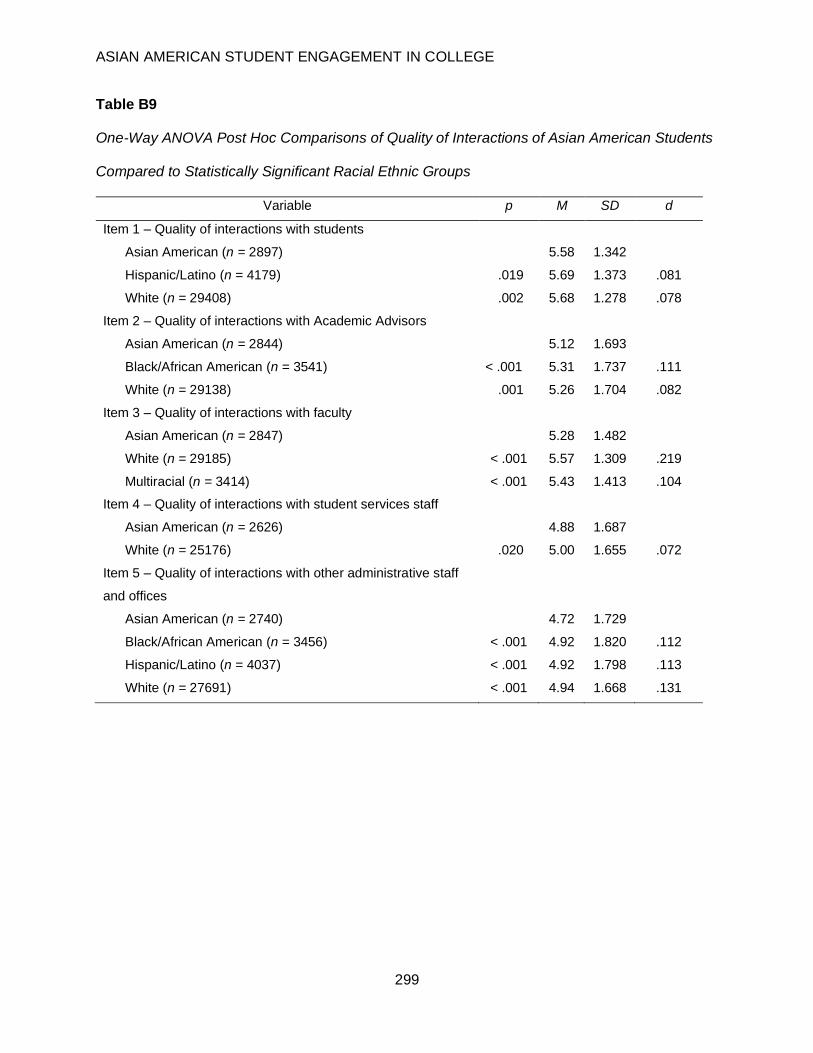
ASIAN AMERICAN STUDENT ENGAGEMENT IN COLLEGE
299
Table B9
One-Way ANOVA Post Hoc Comparisons of Quality of Interactions of Asian American Students
Compared to Statistically Significant Racial Ethnic Groups
Variable p M SD d
Item 1 – Quality of interactions with students
Asian American (n = 2897) 5.58 1.342
Hispanic/Latino (n = 4179) .019 5.69 1.373 .081
White (n = 29408) .002 5.68 1.278 .078
Item 2 – Quality of interactions with Academic Advisors
Asian American (n = 2844) 5.12 1.693
Black/African American (n = 3541) < .001 5.31 1.737 .111
White (n = 29138) .001 5.26 1.704 .082
Item 3 – Quality of interactions with faculty
Asian American (n = 2847) 5.28 1.482
White (n = 29185) < .001 5.57 1.309 .219
Multiracial (n = 3414) < .001 5.43 1.413 .104
Item 4 – Quality of interactions with student services staff
Asian American (n = 2626) 4.88 1.687
White (n = 25176) .020 5.00 1.655 .072
Item 5 – Quality of interactions with other administrative staff
and offices
Asian American (n = 2740) 4.72 1.729
Black/African American (n = 3456) < .001 4.92 1.820 .112
Hispanic/Latino (n = 4037) < .001 4.92 1.798 .113
White (n = 27691) < .001 4.94 1.668 .131
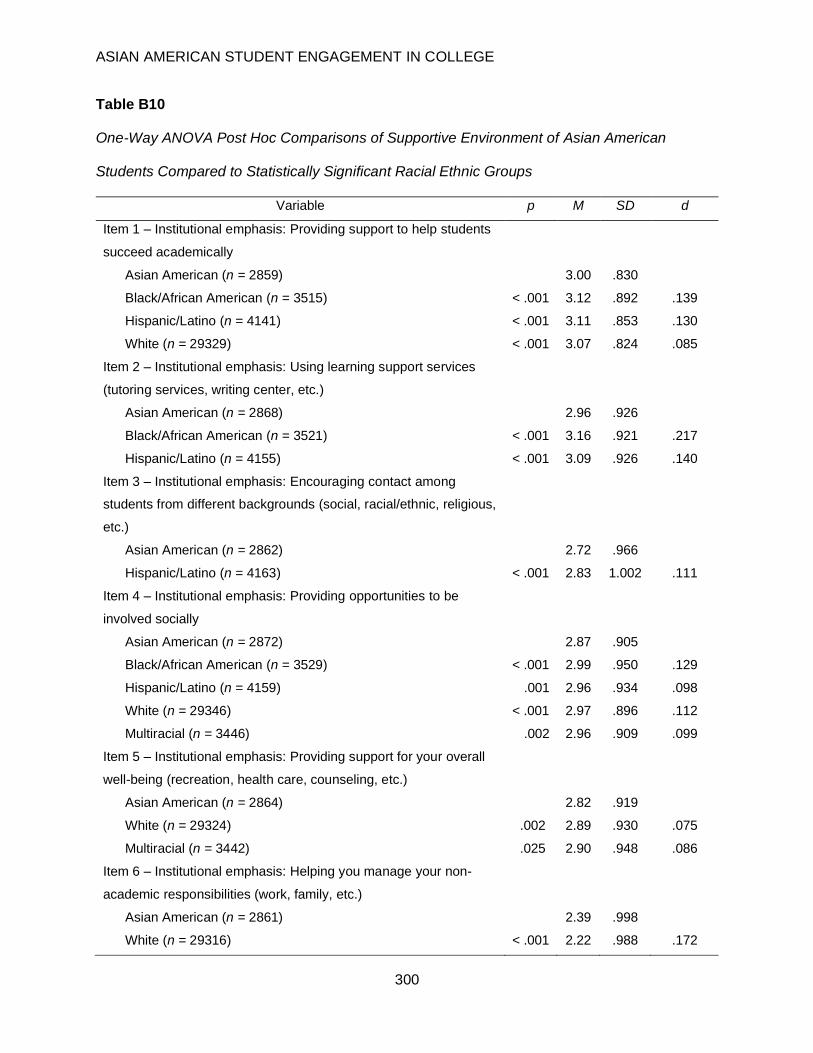
ASIAN AMERICAN STUDENT ENGAGEMENT IN COLLEGE
300
Table B10
One-Way ANOVA Post Hoc Comparisons of Supportive Environment of Asian American
Students Compared to Statistically Significant Racial Ethnic Groups
Variable p M SD d
Item 1 – Institutional emphasis: Providing support to help students
succeed academically
Asian American (n = 2859) 3.00 .830
Black/African American (n = 3515) < .001 3.12 .892 .139
Hispanic/Latino (n = 4141) < .001 3.11 .853 .130
White (n = 29329) < .001 3.07 .824 .085
Item 2 – Institutional emphasis: Using learning support services
(tutoring services, writing center, etc.)
Asian American (n = 2868) 2.96 .926
Black/African American (n = 3521) < .001 3.16 .921 .217
Hispanic/Latino (n = 4155) < .001 3.09 .926 .140
Item 3 – Institutional emphasis: Encouraging contact among
students from different backgrounds (social, racial/ethnic, religious,
etc.)
Asian American (n = 2862) 2.72 .966
Hispanic/Latino (n = 4163) < .001 2.83 1.002 .111
Item 4 – Institutional emphasis: Providing opportunities to be
involved socially
Asian American (n = 2872) 2.87 .905
Black/African American (n = 3529) < .001 2.99 .950 .129
Hispanic/Latino (n = 4159) .001 2.96 .934 .098
White (n = 29346) < .001 2.97 .896 .112
Multiracial (n = 3446) .002 2.96 .909 .099
Item 5 – Institutional emphasis: Providing support for your overall
well-being (recreation, health care, counseling, etc.)
Asian American (n = 2864) 2.82 .919
White (n = 29324) .002 2.89 .930 .075
Multiracial (n = 3442) .025 2.90 .948 .086
Item 6 – Institutional emphasis: Helping you manage your non-
academic responsibilities (work, family, etc.)
Asian American (n = 2861) 2.39 .998
White (n = 29316) < .001 2.22 .988 .172
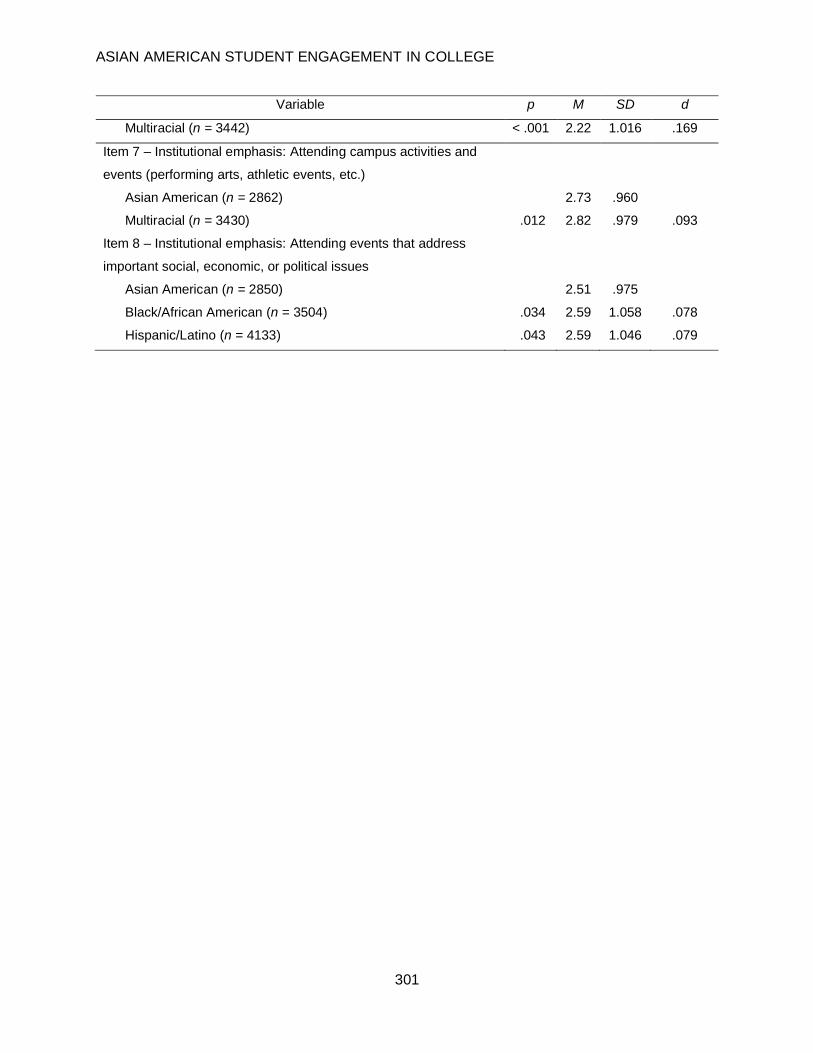
ASIAN AMERICAN STUDENT ENGAGEMENT IN COLLEGE
301
Variable p M SD d
Multiracial (n = 3442) < .001 2.22 1.016 .169
Item 7 – Institutional emphasis: Attending campus activities and
events (performing arts, athletic events, etc.)
Asian American (n = 2862) 2.73 .960
Multiracial (n = 3430) .012 2.82 .979 .093
Item 8 – Institutional emphasis: Attending events that address
important social, economic, or political issues
Asian American (n = 2850) 2.51 .975
Black/African American (n = 3504) .034 2.59 1.058 .078
Hispanic/Latino (n = 4133) .043 2.59 1.046 .079
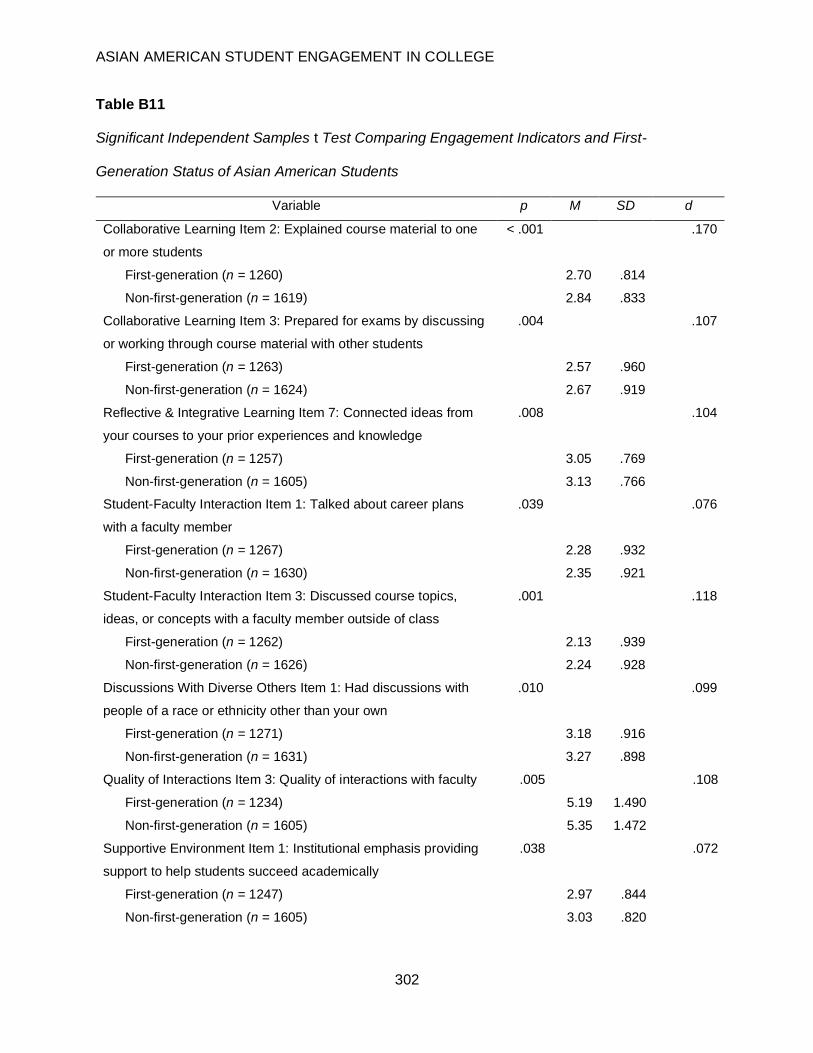
ASIAN AMERICAN STUDENT ENGAGEMENT IN COLLEGE
302
Table B11
Significant Independent Samples t Test Comparing Engagement Indicators and First-
Generation Status of Asian American Students
Variable p M SD d
Collaborative Learning Item 2: Explained course material to one
or more students
< .001 .170
First-generation (n = 1260) 2.70 .814
Non-first-generation (n = 1619) 2.84 .833
Collaborative Learning Item 3: Prepared for exams by discussing
or working through course material with other students
.004 .107
First-generation (n = 1263) 2.57 .960
Non-first-generation (n = 1624) 2.67 .919
Reflective & Integrative Learning Item 7: Connected ideas from
your courses to your prior experiences and knowledge
.008 .104
First-generation (n = 1257) 3.05 .769
Non-first-generation (n = 1605) 3.13 .766
Student-Faculty Interaction Item 1: Talked about career plans
with a faculty member
.039 .076
First-generation (n = 1267) 2.28 .932
Non-first-generation (n = 1630) 2.35 .921
Student-Faculty Interaction Item 3: Discussed course topics,
ideas, or concepts with a faculty member outside of class
.001 .118
First-generation (n = 1262) 2.13 .939
Non-first-generation (n = 1626) 2.24 .928
Discussions With Diverse Others Item 1: Had discussions with
people of a race or ethnicity other than your own
.010 .099
First-generation (n = 1271) 3.18 .916
Non-first-generation (n = 1631) 3.27 .898
Quality of Interactions Item 3: Quality of interactions with faculty .005 .108
First-generation (n = 1234) 5.19 1.490
Non-first-generation (n = 1605) 5.35 1.472
Supportive Environment Item 1: Institutional emphasis providing
support to help students succeed academically
.038 .072
First-generation (n = 1247) 2.97 .844
Non-first-generation (n = 1605) 3.03 .820
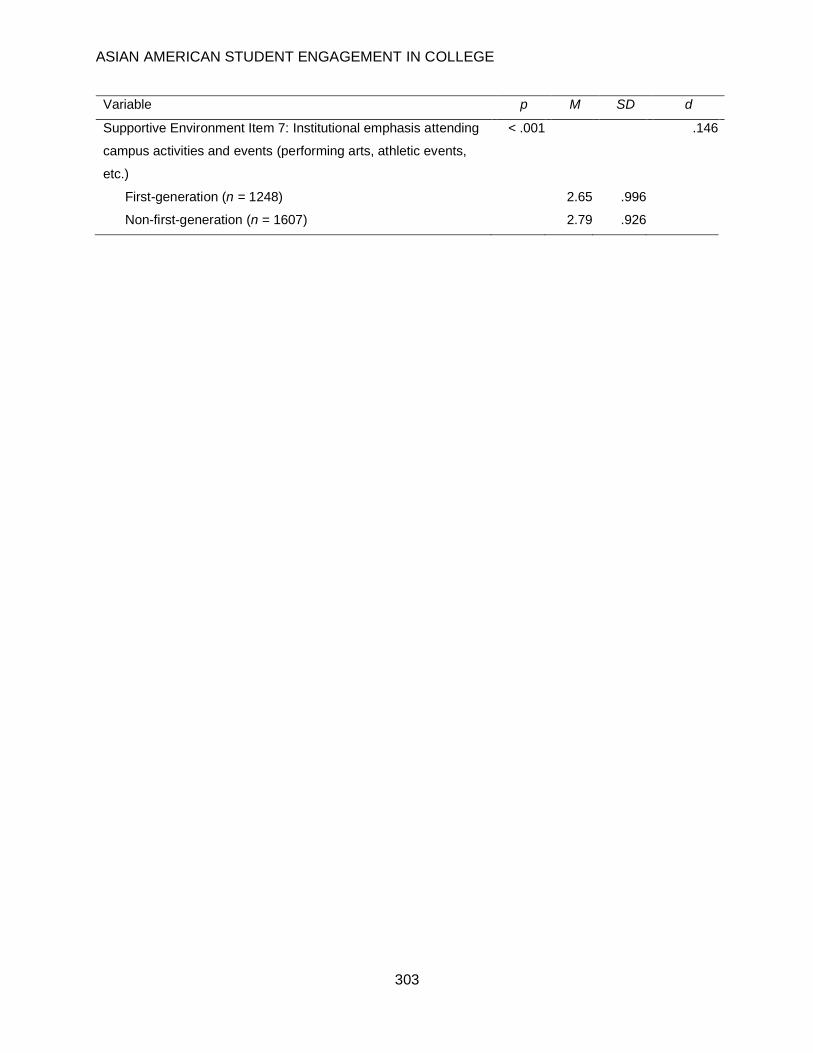
ASIAN AMERICAN STUDENT ENGAGEMENT IN COLLEGE
303
Variable p M SD d
Supportive Environment Item 7: Institutional emphasis attending
campus activities and events (performing arts, athletic events,
etc.)
< .001 .146
First-generation (n = 1248) 2.65 .996
Non-first-generation (n = 1607) 2.79 .926