Coconut Christ: Augustine’s Christology in the Symbolism of Oceania
Upload
khangminh22Category
view
1download
0
World Small Hydropower Development Report 2019
AsiaOceania

Disclaimer
Copyright © 2019 by the United Nations Industrial Development Organization and the International Center on Small Hydro Power.
The World Small Hydropower Development Report 2019 is jointly produced by the United Nations Industrial Development Organization (UNIDO) and the International Center on Small Hydro Power (ICSHP) to provide development information about small hydropower.
The opinions, statistical data and estimates contained in signed articles are the responsibility of the authors and should not necessarily be considered as reflecting the views or bearing the endorsement of UNIDO or ICSHP. Although great care has been taken to maintain the accuracy of information herein, neither UNIDO, its Member States nor ICSHP assume any responsibility for consequences that may arise from the use of the material.
This document has been produced without formal United Nations editing. The designations employed and the presentation of the material in this document do not imply the expression of any opinion whatsoever on the part of the Secretariat of the United Nations Industrial Development Organization (UNIDO) concerning the legal status of any country, territory, city or area or of its authorities, or concerning the delimitation of its frontiers or boundaries, or its economic system or degree of development. Designations such as ‘developed’, ‘industrialized’ and ‘developing’ are intended for statistical convenience and do not necessarily express a judgment about the stage reached by a particular country or area in the development process. Mention of firm names or commercial products does not constitute an endorsement by UNIDO.
This document may be freely quoted or reprinted but acknowledgement is requested.
Suggested citation:
LIU, D., LIU, H., WANG, X., and Kremere, E., eds. (2019). World Small Hydropower Development Report 2019. United Nations Industrial Development Organization; International Center on Small Hydro Power. Available from www. smallhydroworld.org.
ISSN: 2406-4580 (print)ISSN: 2706-7599 (online)
The digital copy is available on www.smallhydroworld.org.
Design: red not 'n' coolCover Picture: gregbrave / 123rf.com
3
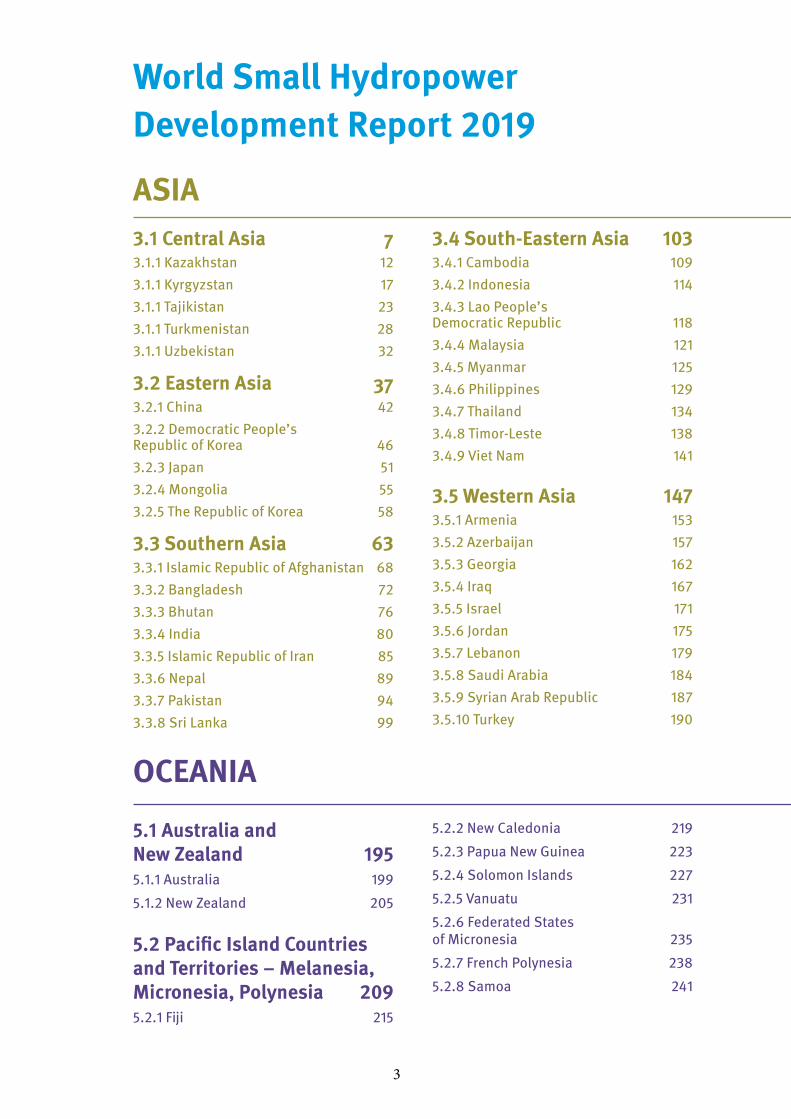
3.1 Central Asia 73.1.1 Kazakhstan 123.1.1 Kyrgyzstan 173.1.1 Tajikistan 233.1.1 Turkmenistan 283.1.1 Uzbekistan 32
3.2 Eastern Asia 373.2.1 China 42 3.2.2 Democratic People’s Republic of Korea 463.2.3 Japan 513.2.4 Mongolia 553.2.5 The Republic of Korea 58
3.3 Southern Asia 633.3.1 Islamic Republic of Afghanistan 683.3.2 Bangladesh 723.3.3 Bhutan 763.3.4 India 803.3.5 Islamic Republic of Iran 853.3.6 Nepal 893.3.7 Pakistan 943.3.8 Sri Lanka 99
3.4 South-Eastern Asia 1033.4.1 Cambodia 1093.4.2 Indonesia 1143.4.3 Lao People’s Democratic Republic 1183.4.4 Malaysia 1213.4.5 Myanmar 1253.4.6 Philippines 1293.4.7 Thailand 1343.4.8 Timor-Leste 1383.4.9 Viet Nam 141
3.5 Western Asia 1473.5.1 Armenia 1533.5.2 Azerbaijan 1573.5.3 Georgia 1623.5.4 Iraq 1673.5.5 Israel 1713.5.6 Jordan 1753.5.7 Lebanon 1793.5.8 Saudi Arabia 1843.5.9 Syrian Arab Republic 1873.5.10 Turkey 190
5.1 Australia and New Zealand 1955.1.1 Australia 1995.1.2 New Zealand 205
5.2 Pacific Island Countries and Territories – Melanesia, Micronesia, Polynesia 2095.2.1 Fiji 215
5.2.2 New Caledonia 2195.2.3 Papua New Guinea 2235.2.4 Solomon Islands 2275.2.5 Vanuatu 2315.2.6 Federated States of Micronesia 2355.2.7 French Polynesia 2385.2.8 Samoa 241
World Small Hydropower Development Report 2019
ASIA
OCEANIA

4
World Small HydropoWer development report 2019
AcknowledgementsThe World Small Hydropower Development Report 2019 was prepared under the overall guidance of Tareq Emtairah, Director of the Department of Energy at the United Nations Industrial Development Organization (UNIDO) and LIU Deyou, Director General of the International Center on Small Hydro Power (ICSHP).
The Report was headed by LIU Heng, Senior Technical Expert at UNIDO and consulted by HU Xiaobo, Chief of the Division of Multilateral Development at ICSHP. This lengthy, and at times, arduous endeavour was coordinated by Eva Krēmere at UNIDO and WANG Xianlai at ICSHP. The Report is the result of three years of intense research efforts and was backed by a talented and indispensable team of researchers at ICSHP and a vast number of experts in the field of small hydropower.
WSHPDR 2019 team:
Head LIU Heng - Senior Technical Advisor, United Nations Industrial Development Organization (UNIDO)
Coordinators Eva Krēmere - United Nations Industrial Development Organization (UNIDO)WANG Xianlai - International Center on Small Hydro Power (ICSHP)
Communications Eva Krēmere - United Nations Industrial Development Organization (UNIDO) Oxana Lopatina - International Center on Small Hydro Power (ICSHP)
Team UNIDO: Eva Krēmere, Sanja Komadina. Interns: Eleanor Vickery, Steven Moser ICSHP: HU Xiaobo, WANG Xianlai, Oxana Lopatina, Ofelia Raluca Stroe, Alicia Chen Luo, Clara Longhi, Georgii Nikolaenko, Riona Lesslar
The invaluable contributions and insightful comments received greatly enhanced the overall quality of the Report:
Advisory Board Alfonso Blanco Bonilla, Latin American Energy Organization (OLADE); Linda Church-Ciocci, National Hydropower Association (NHA); Dirk Hendricks; European Renewable Energies Federation (EREF); Eddy Moors, IHE Delft Institute for Water Education; Richard Taylor, International Hydropower Association (IHA); Adrian Whiteman, International Renewable Energy Agency (IRENA).
Peer Reviewers Andrew Blakers, Johannes Geert Grijsen, Sergio Armando Trelles Jasso, Furkat Kadyrov, Wim Jonker Klunne, Galina Livingstone, Miroslav Marence, Niels Nielsen, Michael Panagiotopoulos, Mathis Rogner, Wilson Sierra.
Regional Authors Engku Ahmad Azrulhisham, Guillaume Binet, Edilbek Bogombaev, Paulo Alexandre Diogo, Pirran Driver, José Fábrega, Cleber Romao Grisi, Richard Hendriks, Michela Izzo, Bryan Karney, Egidijus Kasiulis, Wim Jonker Klunne, Arun Kumar, Miroslav Marence, Niels Nielsen, Daniel Paco, Alberto Sánchez, Mohamedain E. Seif Elnasr, Stafford W. Sheehan, Janusz Steller, Phillip Stovold.
Authors and Contributors Fagan Abdurahmanov, Donald Adgidzi, Leonardo Aburto, Clément Bill Akouèdénoudjè, Loboso Cosmas Manase Akwenya, Sameer Sadoon Algburi, Mohammad Hassan AlZoubi, Gabrial Anandarajah, Viktor Andonov, Darlene Arguelles, Vicky Ariyanti, Fredrik Arnesen, John Kobbina Arthur, Aleksandra Aubreht, Engku Ahmad Azrulhisham, Betsy Bandy, Bohuslav Barta, Batdelger Batsuuri, Alexis Baúles, Madhu Prasad Bhetuwal, Sow Aissatou Billy, Andrew Blakers, Alaeddin Bobat, Thomas Buchsbaum-Regner, Nebiyu Bogale, Alfredo Samaniego Burneo, Ejaz Hussain Butt, Abou Kawass Camara, Sonya Chaoui, Marco Antonio Jimenez Chavez, Piseth Chea, Chi Chen, Gift Chiwayula, Brenda Chizinga, Nouri Chtourou, Edchilson Cravid, Manana Dadiani, Denise Delvalle, Jovan Despotović, Johanna D’Hernoncourt, Sinalou Diawiara, Camille Augustin Kabasele Dikangala, Fikru Gebre Dikumbab, Paulo Alexandre Diogo, Jonas Dobias, Aurélie Dousset, Choten Duba, Khalil Elahee, Azubike Emechebe, Lambert Engwanda, Haider Khalil Essa, José Fábrega, Giovanna Fantin, Nimashi Fernando, Soukaina Fersi, Geraldo Lúcio Tiago Filho, Sione Foliaki, , Danilo Fras, Fombong Matty Fru, Tokihiko Fujimoto, Patrick Furrer, Garaio Gafiye, Camila Galhardo, Morella Carolina Gilarias, Gaelle Gilboire, Florence Gimbo, Carlos González, Cleber Romao

5
Grisi, Leo Guerrero, Mathias Gustavsson, Mohammad Hajilari, Nihad Harbas, Eoin Heaney, Samira Heidari, Richard Hendriks, Sven Homscheid-Carstens, Arian Hoxha, Maria Ibragimova, Helvi Ileka, Michela Izzo, Frantisek Janicek, Sergio Armando Trelles Jasso, Rim Jemli, Kurt Johnson, Morsha Johnson-Francis, Furkat Kadyrov, J.K. Kaldellis, Rachel Kalebbo, Papias Karanganwa, Bryan Karney, Raúl Pablo Karpowicz, Egidijus Kasiulis, Shorai Kavu, Fredrick Kazungu, Sahib Khalilov, Eva, Kremere, Maris Klavins, Daniel Klinck, Juliet F. Khosrowabadi Kotyk, Don Hyun Kim, Wim Jonker Klunne, John Korinihona, Arun Kumar, Sarah Acholla Kwach, Mohamed-Yahya Ould Lafdal, Gianluca Lazzaro, Seung Oh Lee, Disashi Nyama Lemba, Jean-Marc Levy, Patricia Lewin, Robert Limoko, Galina Livingstone, Frank Lucas, Esménio Isabel João Macassa, Manuel Mahler-Hutter, Sarmad Nozad Mahmood, Ewa Malicka, Igor Malidzan, Pedro Manso, Ghulam Mohd Malikyar, Sharon Mandair, Luis Manzano, Miroslav Marence, Cayetano Espejo Marín, Ramón Garcia Marín, Rupeni Mario, Anare Matakiviti, Juan José García Méndez, Sierra Method, Luiza Fortes Miranda, Ditiro Benson Moalafhi, Conrado Moreno, Bastian Morvan, Carine Mukashyaka, Reynolds Mukuka, Jaime Muñoz, Wakati Ramadhani Mwaruka, Sandar Myo, Thet Myo, Anna Nadolny, Bilal Abdullah Nasir, N’guessan Pacôme N’Cho, Jami Nelson-Nuñez, Leonel Wagner Neto, Desire Florentin Ngaibona, Peter Norville, Robert Nyamvumba, Abdeen Mustafa Omer, Emna Omri, Karim Osseiran, Sok Oudam, Victor Owuor, Daniel Paco, Domingos Mosquito Patrício, Cláudio Moisés Paulo, Elsia Paz, Henrik Personn, Pihla Pietilainen, Vlad Florin Pîrăianu, Adelino Sousa Pontes, Nuwan Premadasa, Thoeung Puthearum, Peeter Raesaar, Carlos Fernando Moros Ramirez, Laura Lizano Ramon, Karin Reiss, Jorge Reyes, Tsiky Harivelo Robison, António Carmona Rodrigues, Mathis Rogner, João Russo, Vladimir Russo, Jorge Saaverda, Soussou Sambou, Alberto Sánchez, Saso Santl, Karine Sargsyan, Vahan Sargsyan, Martin Scarone, Öztürk Selvitop, Jorge Servert, Shamsuddin Shahid, Davit Sharikadze, Mahender Sharma, Stafford W. Sheehan, M. Hady Sherif, Manish Shrestha, Sangam Shrestha, Mundia Simainga, Martin Sinjala, Jeremie Sinzinkayo, Seming Skau, Nicolae Soloviov, Paradis Someth, Amine Boudghene Stambouli, Phillip Stovold, Samiha Tahseen, Ibrahim Ragab Mohamed Teaima, Pierre Kenol Thys, Anastasiya Timashenok, Mikael Togeby, Ernesto Torres, Philbert Tuyisenge, Alexander Urbanovich, Katalin Varga, Petro Vas’ko, Akhomdeth Vongsay, Harsha Wickramasinghe, Horace Williams, Mark Williams, Kassius Klei Ximenes, Rabiou Hassane Yari.
Ac
kn
ow
ledg
emen
ts

6
World Small HydropoWer development report 2019
7
SRI LANKA
TIMOR-LESTE
UZBEKISTAN
TURKMENISTAN
KAZAKHSTAN
KYRGYZSTAN
TAJIKISTAN
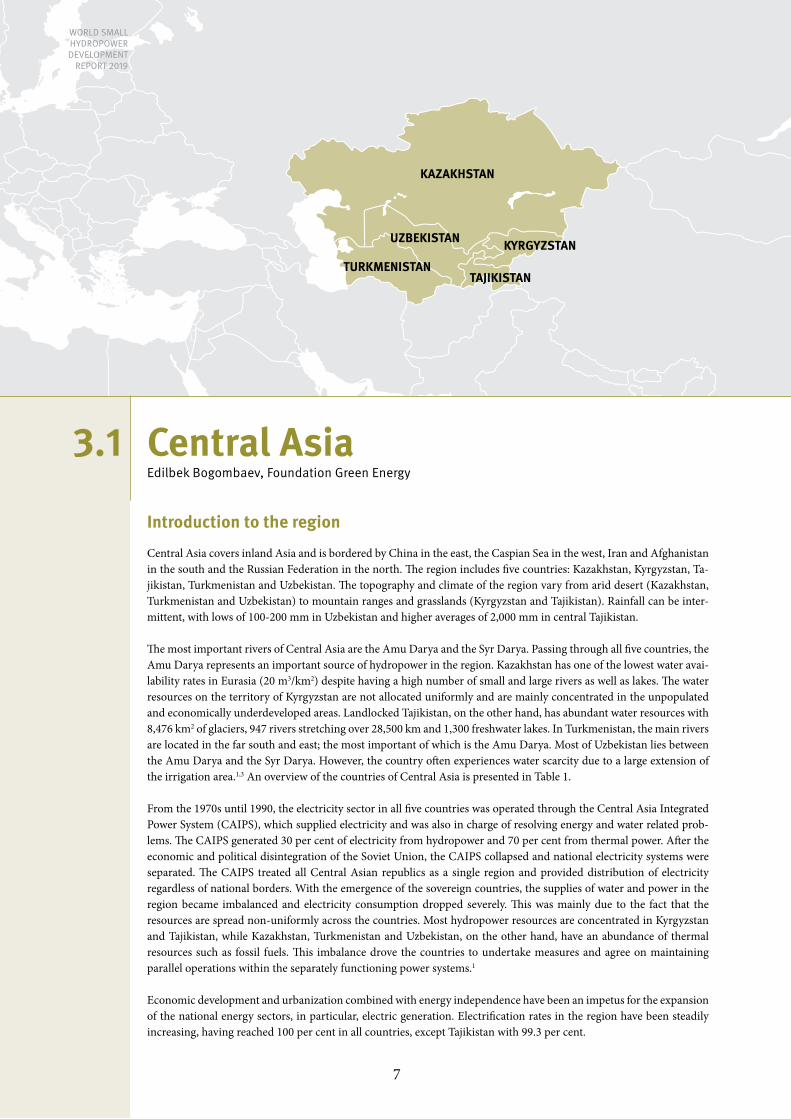
Central AsiaEdilbek Bogombaev, Foundation Green Energy
Introduction to the region
Central Asia covers inland Asia and is bordered by China in the east, the Caspian Sea in the west, Iran and Afghanistan in the south and the Russian Federation in the north. The region includes five countries: Kazakhstan, Kyrgyzstan, Ta-jikistan, Turkmenistan and Uzbekistan. The topography and climate of the region vary from arid desert (Kazakhstan, Turkmenistan and Uzbekistan) to mountain ranges and grasslands (Kyrgyzstan and Tajikistan). Rainfall can be inter-mittent, with lows of 100-200 mm in Uzbekistan and higher averages of 2,000 mm in central Tajikistan.
The most important rivers of Central Asia are the Amu Darya and the Syr Darya. Passing through all five countries, the Amu Darya represents an important source of hydropower in the region. Kazakhstan has one of the lowest water avai-lability rates in Eurasia (20 m3/km2) despite having a high number of small and large rivers as well as lakes. The water resources on the territory of Kyrgyzstan are not allocated uniformly and are mainly concentrated in the unpopulated and economically underdeveloped areas. Landlocked Tajikistan, on the other hand, has abundant water resources with 8,476 km2 of glaciers, 947 rivers stretching over 28,500 km and 1,300 freshwater lakes. In Turkmenistan, the main rivers are located in the far south and east; the most important of which is the Amu Darya. Most of Uzbekistan lies between the Amu Darya and the Syr Darya. However, the country often experiences water scarcity due to a large extension of the irrigation area.1,3 An overview of the countries of Central Asia is presented in Table 1.
From the 1970s until 1990, the electricity sector in all five countries was operated through the Central Asia Integrated Power System (CAIPS), which supplied electricity and was also in charge of resolving energy and water related prob-lems. The CAIPS generated 30 per cent of electricity from hydropower and 70 per cent from thermal power. After the economic and political disintegration of the Soviet Union, the CAIPS collapsed and national electricity systems were separated. The CAIPS treated all Central Asian republics as a single region and provided distribution of electricity regardless of national borders. With the emergence of the sovereign countries, the supplies of water and power in the region became imbalanced and electricity consumption dropped severely. This was mainly due to the fact that the resources are spread non-uniformly across the countries. Most hydropower resources are concentrated in Kyrgyzstan and Tajikistan, while Kazakhstan, Turkmenistan and Uzbekistan, on the other hand, have an abundance of thermal resources such as fossil fuels. This imbalance drove the countries to undertake measures and agree on maintaining parallel operations within the separately functioning power systems.1
Economic development and urbanization combined with energy independence have been an impetus for the expansion of the national energy sectors, in particular, electric generation. Electrification rates in the region have been steadily increasing, having reached 100 per cent in all countries, except Tajikistan with 99.3 per cent.
3.1
World Small HydropoWEr dEvElopmEnt
rEport 2019
8
World Small HydropoWer development report 2019
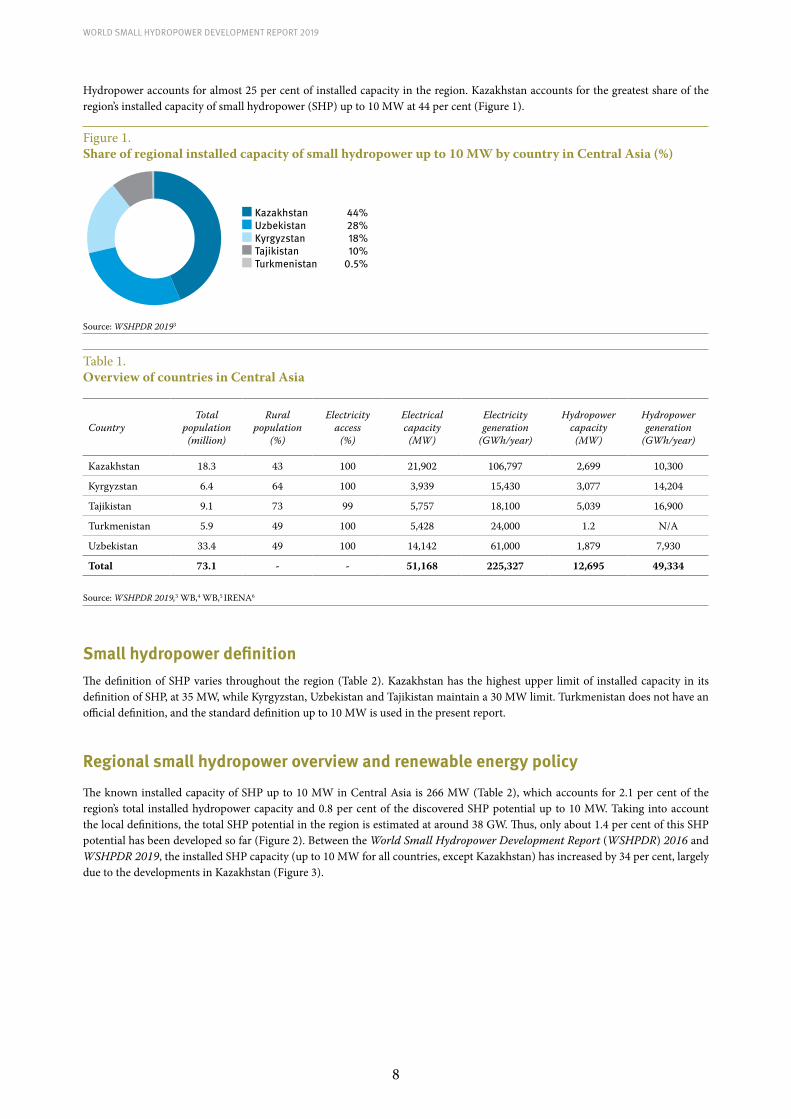
Hydropower accounts for almost 25 per cent of installed capacity in the region. Kazakhstan accounts for the greatest share of the region’s installed capacity of small hydropower (SHP) up to 10 MW at 44 per cent (Figure 1).
Figure 1. Share of regional installed capacity of small hydropower up to 10 MW by country in Central Asia (%)
Kazakhstan 44%Uzbekistan 28%Kyrgyzstan 18%Tajikistan 10%Turkmenistan 0.5%
Source: WSHPDR 20193
Table 1.Overview of countries in Central Asia
CountryTotal
population (million)
Rural population
(%)
Electricity access
(%)
Electrical capacity
(MW)
Electricity generation
(GWh/year)
Hydropower capacity
(MW)
Hydropower generation
(GWh/year)
Kazakhstan 18.3 43 100 21,902 106,797 2,699 10,300
Kyrgyzstan 6.4 64 100 3,939 15,430 3,077 14,204
Tajikistan 9.1 73 99 5,757 18,100 5,039 16,900
Turkmenistan 5.9 49 100 5,428 24,000 1.2 N/A
Uzbekistan 33.4 49 100 14,142 61,000 1,879 7,930
Total 73.1 - - 51,168 225,327 12,695 49,334
Source: WSHPDR 2019,3 WB,4 WB,5 IRENA6
Small hydropower definitionThe definition of SHP varies throughout the region (Table 2). Kazakhstan has the highest upper limit of installed capacity in its definition of SHP, at 35 MW, while Kyrgyzstan, Uzbekistan and Tajikistan maintain a 30 MW limit. Turkmenistan does not have an official definition, and the standard definition up to 10 MW is used in the present report.
Regional small hydropower overview and renewable energy policy
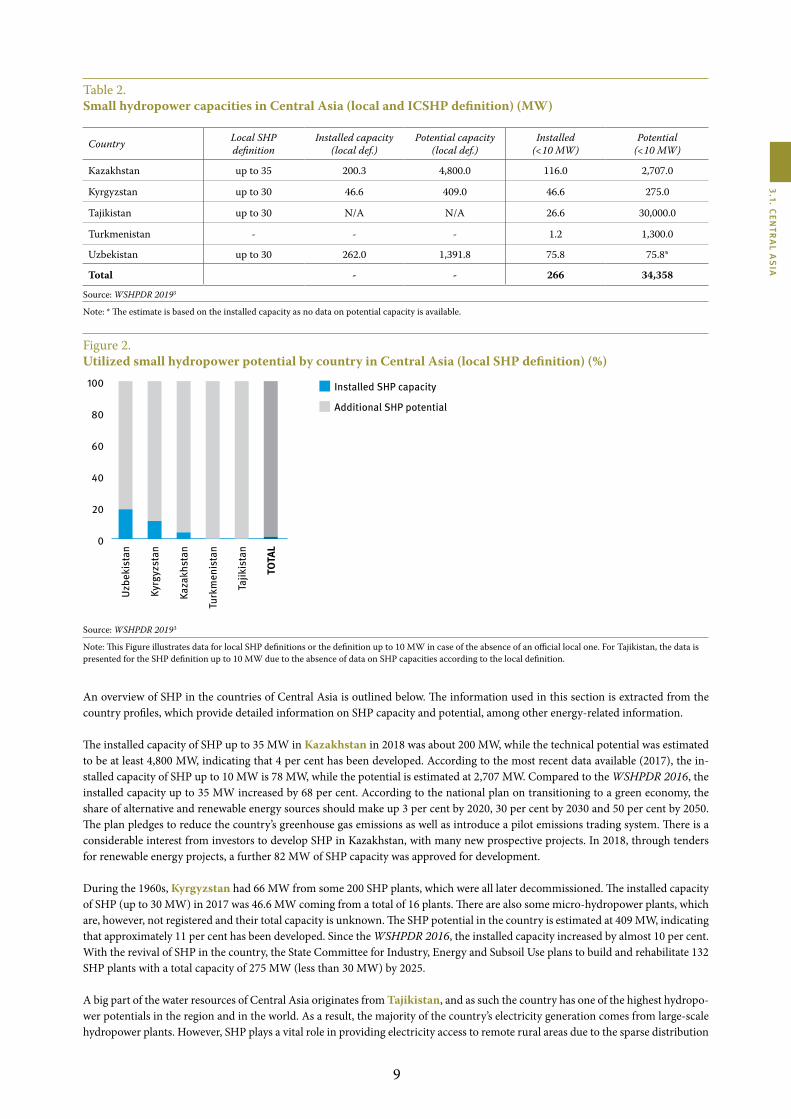
The known installed capacity of SHP up to 10 MW in Central Asia is 266 MW (Table 2), which accounts for 2.1 per cent of the region’s total installed hydropower capacity and 0.8 per cent of the discovered SHP potential up to 10 MW. Taking into account the local definitions, the total SHP potential in the region is estimated at around 38 GW. Thus, only about 1.4 per cent of this SHP potential has been developed so far (Figure 2). Between the World Small Hydropower Development Report (WSHPDR) 2016 and WSHPDR 2019, the installed SHP capacity (up to 10 MW for all countries, except Kazakhstan) has increased by 34 per cent, largely due to the developments in Kazakhstan (Figure 3).
9
3.1. CEN
TRA
L As
iA
Table 2.Small hydropower capacities in Central Asia (local and ICSHP definition) (MW)
Country Local SHP definition
Installed capacity (local def.)
Potential capacity (local def.)
Installed (<10 MW)
Potential (<10 MW)
Kazakhstan up to 35 200.3 4,800.0 116.0 2,707.0
Kyrgyzstan up to 30 46.6 409.0 46.6 275.0
Tajikistan up to 30 N/A N/A 26.6 30,000.0
Turkmenistan - - - 1.2 1,300.0
Uzbekistan up to 30 262.0 1,391.8 75.8 75.8*
Total - - 266 34,358
Source: WSHPDR 20193
Note: * The estimate is based on the installed capacity as no data on potential capacity is available.
Figure 2. Utilized small hydropower potential by country in Central Asia (local SHP definition) (%)
Additional SHP potential
Installed SHP capacity
0
20
40
60
80
100
Uzbe
kist
an
Kyrg
yzst
an
Kaza
khst
an
Turk
men
ista
n
Tajik
ista
n
TOTA
L
Source: WSHPDR 20193
Note: This Figure illustrates data for local SHP definitions or the definition up to 10 MW in case of the absence of an official local one. For Tajikistan, the data is presented for the SHP definition up to 10 MW due to the absence of data on SHP capacities according to the local definition.
An overview of SHP in the countries of Central Asia is outlined below. The information used in this section is extracted from the country profiles, which provide detailed information on SHP capacity and potential, among other energy-related information.
The installed capacity of SHP up to 35 MW in Kazakhstan in 2018 was about 200 MW, while the technical potential was estimated to be at least 4,800 MW, indicating that 4 per cent has been developed. According to the most recent data available (2017), the in-stalled capacity of SHP up to 10 MW is 78 MW, while the potential is estimated at 2,707 MW. Compared to the WSHPDR 2016, the installed capacity up to 35 MW increased by 68 per cent. According to the national plan on transitioning to a green economy, the share of alternative and renewable energy sources should make up 3 per cent by 2020, 30 per cent by 2030 and 50 per cent by 2050. The plan pledges to reduce the country’s greenhouse gas emissions as well as introduce a pilot emissions trading system. There is a considerable interest from investors to develop SHP in Kazakhstan, with many new prospective projects. In 2018, through tenders for renewable energy projects, a further 82 MW of SHP capacity was approved for development.
During the 1960s, Kyrgyzstan had 66 MW from some 200 SHP plants, which were all later decommissioned. The installed capacity of SHP (up to 30 MW) in 2017 was 46.6 MW coming from a total of 16 plants. There are also some micro-hydropower plants, which are, however, not registered and their total capacity is unknown. The SHP potential in the country is estimated at 409 MW, indicating that approximately 11 per cent has been developed. Since the WSHPDR 2016, the installed capacity increased by almost 10 per cent. With the revival of SHP in the country, the State Committee for Industry, Energy and Subsoil Use plans to build and rehabilitate 132 SHP plants with a total capacity of 275 MW (less than 30 MW) by 2025.
A big part of the water resources of Central Asia originates from Tajikistan, and as such the country has one of the highest hydropo-wer potentials in the region and in the world. As a result, the majority of the country’s electricity generation comes from large-scale hydropower plants. However, SHP plays a vital role in providing electricity access to remote rural areas due to the sparse distribution

10
World Small HydropoWer development report 2019
of the population. The SHP potential up to 10 MW is estimated at 30 GW and the installed capacity is reported to stand at 26.6 MW, i.e. there was an increase of 2 MW in comparison with the WSHPDR 2016. More recent restoration initiatives of certain SHP plants, such as the substation Rudaki in the Sughd region, also contributed to the increase. A number of other reconstruction and rehabili-tation projects in the SHP sector are underway. Furthermore, an action plan for investment in SHP was developed, which focuses on the commercialization of SHP, feed-in tariffs and grid access systems, SHP tax regime and accessible investment procedures.
Turkmenistan is located on the world’s fourth largest natural gas reserve and has vast quantities of oil resources. Its abundance of fossil fuels has resulted in an energy sector dominated by thermal generation. Although hydropower potential, including SHP, is high (1,300 MW for SHP up to 10 MW), there are few incentives at the moment for the development of hydropower projects. There is only one hydropower plant in operation in Turkmenistan, which has a capacity of 1.2 MW and was commissioned in 1913. No other SHP plants have been constructed, however, a potential for the development of SHP on existing irrigation dams has been studied, In particular with the support of the European Bank for Reconstruction and Development (EBRD).
Both the Amu Darya and Syr Darya rivers flow through Uzbekistan, providing ample hydropower potential. However, due to previously built canals, which altered the river flows and have affected the Aral Sea, hydropower in general has not been widely pursued. In 2017, there were 15 SHP plants with capacities up to 10 MW and a combined installed capacity of 75.8 MW. The total installed capacity of SHP plants up to 30 MW was about 262 MW. The technical SHP potential of all water resources in the country including the small rivers, canals and reservoirs (up to 30 MW) was estimated to be about 1,392 MW. Thus, about 19 per cent of the potential has been developed. Since the WSHPDR 2016, the installed capacity up to 10 MW increased by 8 per cent. Construction of several new SHP plants with a combined capacity of 23.5 MW as well as refurbishment of the existing ones is planned by 2020.
All countries in the region are currently going through a period of political and economic reforms, which strongly influences the situation on the domestic and international scales. International organizations are supporting the development of renewable energy sources, including SHP plants, in Central Asia. Such projects have assisted the Governments to attract investments through enabling legal and regulatory frameworks, capacity building and developing sustainable delivery models. They are expected to eventually aid in decreasing the use of conventional biomass and fossil fuels for electricity generation and other energy needs.
Additionally, the region demonstrates a growing interest in energy efficiency measures. Kazakhstan, Uzbekistan and Turkmenistan see it as a way of increasing their fossil fuel exports, whereas Tajikistan and Kyrgyzstan hope to reduce their dependence on energy imports.
All countries of the region, except Turkmenistan, have adopted primary legislation on renewable energy and energy efficiency. The legislation framework includes introducing incentives such as grid-access, tax exemptions and feed-in tariffs (FITs). FITs have been introduced in Kazakhstan, Kyrgyzstan and Tajikistan. However, starting from 2018, Kazakhstan switched from the FIT system to an auction system.
Figure 3. Change in installed capacity of small hydropower from WSHPDR 2013 to 2019 by country in Central Asia (MW)
0
50
100
150
200
250
300
350
400
WSHPDR 2019
WSHPDR 2016
WSHPDR 2013
200.3
75.846.6
26.61.2
350.5
Kaza
khst
an
Uzbe
kist
an
Kyrg
yzst
an
Tajik
ista
n
Turk
men
ista
n
TOTA
L
Source: WSHPDR 2013,1 WSHPDR 2016,2 WSHPDR 2019 3
Note: WSHPDR stands for World Small Hydropower Development Report. For Kazakhstan, data are for SHP up to 35 MW; for other countries data are for SHP up to 10 MW.
11
3.1. CEN
TRA
L As
iA
Barriers to small hydropower development
While there is a significant potential for SHP in Central Asian countries, the widespread implementation of SHP is hampered by a number of barriers, including:• Market barriers: There is currently a lack of awareness and information on the potential and possible application of SHP;• Institutional and regulatory barriers: The existing institutional and regulatory frameworks in the energy sector are not fully
taking into account the peculiarities of SHP; • Technical barriers: Technical and market conditions are not supportive of the implementation and operation of SHP;• Financing barriers: There is a lack of functioning and affordable financing mechanisms (loans) available for developers of
SHP projects.
In particular, Kazakhstan experiences problems with the collection of data on the use of conventional and unconventional renewable energy and off-grid developments, a lack of RE experts, a lack of regulation of technical specifications, particularly in regards to power grid connection. The availability of significant fossil fuel resources in the country makes renewable energy projects less viable.
Seasonal changes in hydropower production, hydrocarbon import and high losses due to the aged infrastructure remain important challenges for the future SHP development in Kyrgyzstan. While the large hydropower potential is being developed, there is not sufficient interest among private investors to develop smaller projects. The main obstacle is the legal and regulatory framework, including low tariffs and obtaining licences for construction and operation. In addition, distribution companies refuse to buy expensive green energy and cover losses at their own expense, since the tariff for final consumers does not include all costs for the purchase of green energy. There is no specific explanation in the law on RE sources who should cover these additional costs.
In Tajikistan, SHP development is hindered by very low electricity tariffs in comparison to the generation costs, the lack of reliable SHP potential data, the necessity to improve the functionality of already existent plants, the lack of trained local experts in the management, operation and maintenance of SHP plants, the lack of social awareness with regards to the benefits of SHP as well as the legal uncertainty.
For Turkmenistan, the main barriers to SHP development are low energy prices and the lack of a regulatory framework and policies for the promotion of RE technologies.
Key challenges for the development of SHP in Uzbekistan are aging energy infrastructure, the lack of financing and investment in the energy sector, low electricity prices, the lack of clear support mechanisms for SHP development as well as of feasibility studies and available data on potential sites.
References
1. LIU, H., Masera, D. and Esser, L., eds. (2013). World Small Hydropower Development Report 2013. United Nations Industrial Development Organization; International Center on Small Hydro Power. Available from www.smallhydroworld.org.
2. Xialei, C., Singh, P. R., Xianlai, W., and Kremere, E., eds. (2016). World Small Hydropower Development Report 2016. United Nations Industrial Development Organization; International Center on Small Hydro Power. Available from www.smallhydroworld.org.
3. LIU, D., LIU, H., WANG, X., and Kremere, E., eds. (2019). World Small Hydropower Development Report 2019. United Nations Industrial Development Organization; International Center on Small Hydro Power. Available from www.smallhydroworld.org.
4. World Bank (2017). Rural population (% of total population). Available from https://data.worldbank.org/indicator/SP.RUR.TOTL.ZS
5. World Bank (2016). Access the electricity (% of population). Available from https://data.worldbank.org/indicator/EG.ELC.ACCS.ZS
6. International Renewable Energy Association (IRENA) (2017). Renewable Capacity Statistics 2017. Available from https://www.irena.org/publications/2017/Mar/Renewable-Capacity-Statistics-2017

12
KazakhstanEva Kremere, University of latvia (lU)
Key facts
Population 18,292,700 1
Area 2,724,900 km2 2
Climate Continental, cold winters and hot summers, approximately 90 per cent of land has arid and semiarid climate. The average temperature in January ranges from -18 °C in the north to -3 °C in the south, and in July from 19 °C in the north to 29 °C in the south.3
Topography Most of the country lies between 200 and 300 metres above sea level. Just over 70 per cent of the country is a desert, semi-desert or steppe. The vast flat steppe extending from the Volga River in the west to the Altai Mountains in the east and from the plains of Western Siberia in the north to oases and deserts of Central Asia in the south. Kazakhstan is mountainous along its far eastern and south-eastern borders, where much of the forested Altai and Tian Shan ranges remain snowcapped throughout the year and with many elevated peaks exceeding 6,500 metres. The highest point is Mount Khan Tengri at 7,010 metres above sea level.4
Rain pattern Precipitation in the form of rain is insignificant, except for mountainous regions. The foothill areas receive 500-1,600 mm precipitation per year; the steppe, 200-500 mm; and the desert, 100-200 mm. In winter, most of Kazakhstan experiences an increase in daily maximum amount of rain.3
Hydrology In terms of hydrology, four major regions can be distinguished: the Ob River Basin draining to the Arctic Ocean, the Caspian Sea Basin, the Aral Sea Basin, and internal lakes, depressions or deserts. Kazakhstan has 8,500 small and large rivers, and has approximately 48,000 lakes. The main water basins are Chu-Talas, Aral-Syr Darya, Balkhash-Alacol, Ural-Caspian, Nura-Sarysu, Tobol-Turgai, Irtysh and Ishim. Surface water resources are extremely unevenly distributed within the country and are marked by significant perennial and seasonal dynamics. Central Kazakhstan has only 3 per cent of total water resources in the country. The western and south-western regions (Atyrau, Kyzylorda and in particular Mangystau region) are significantly water-deficient, with hardly any fresh water. The Balkhash-Alakol and Irtysh (Ertix) river basins in the east and north-east account for almost 75 per cent of surface water resources generated within the country. About 90 per cent of the runoff occurs in spring, exceeding reservoir storage capacity.5
Electricity sector overview
In Kazakhstan, installed electricity generation capacity in 2018 was 21.9 GW, available installed capacity was about 18.9 GW, and maximum load was 14.8 GW.6 The disparity is mainly due to the aging equipment. There were in total 138 power stations of various forms of ownership. 6 In 2018, the total net electricity generation was reported to be 106.8 TWh, which is slightly higher than the 94.6 TWh reported in 2016.6,7 Given that Kazakhstan has rich gas, oil and coal reserves, electricity was mostly generated by thermal power plants, with coal and gas generating about 90 per cent of the total (Figure 1).6 The changes in electricity generation in Kazakhstan between 2011 and 2018 are shown in Figure 2.
According to the World Bank Data, the country’s electrification rate is 100 per cent.8 The national grid in the country is divided into three major electric power zones: Northern, Western, and Southern. A vast portion of the country’s power generation is located in the north-west region of Ekibastuz, where coal is produced and hydroelectric facilities are located.9 The Northern zone accounts for about 80 per cent of the electric power
production in the country. It is also the most power consuming zone, with a consumption rate of 66 per cent of the total electric power in the country. The Western zone accounts for 13 per cent of the electricity consumption, and it depends mostly on the thermal power production utilizing gas and other hydrocarbon fuels produced in the region. The Southern zone consumes about 21 per cent of the total electricity consumption and experiences shortages of the electric power supply.10 These shortages are met by electricity imports from the northern regions of Kazakhstan and also from the neighbouring countries.10,11 The total electricity consumption in the country in 2018 was 103.2 TWh. The growth in electricity consumption in 2018 in comparison with 2017 was the highest in the Western Zone of the National grid increasing by 8.1 per cent, while the lowest increase by 4.6 per cent was in the Northern Zone.10
The Northern and Western zones of the national power grid are connected to Russia, and the Southern zone is connected to the Unified Energy System of Central Asia, through Uzbekistan and Kyrgyzstan. There is a shortage of the generating capacity
3.1.1
World Small HydropoWEr dEvElopmEnt
rEport 2019

13
3.1. CEN
TRA
L As
iA
in Kazakhstan. For example, the power deficiency in 2017 amounted to 268 MW, which was compensated by 108 MW imported from Russia and 160 MW from Central Asia.10 Therefore, it is necessary to develop new installed capacity particularly in the Southern zone. It is expected that the country will require construction of new electricity capacity, 11-12 GW by 2030 and 32-36 GW by 2050, excluding the installed capacity of renewable energy (RE) sources.12
Figure 1. Annual electricity generation by source in Kazakhstan (TWh)
Coal
Hydropower
Gas
Other RE
86.8
10.3
9.1
0.5
Source: KEGOC6
Figure 2. Electricity generation development in Kazakhstan in 2011 – 2018 (TWh)
2011
2012
2013
2014
2015
2016
2017
2018
75
80
85
90
95
100
105
110
86.690.6
92.694.6
91.694.6
103.1106.8
Source: KEGOC,6 EnergyProm7
The electricity market was privatized after the country achieved statehood in 1991. The National Welfare Fund, JSC Samruk-Kazyna, is the main shareholder in the JSC Kazakhstan Electricity Grid Operating Company (KEGOC) with 90 per cent of the state ownership. It also owns 100 per cent of shares in JSC Samruk-Energy, which operates most of the major electric power stations in the country, including thermal power plants (e.g., GRES-1 and GRES-2 in Ekibastuz with a total installed capacity of about 5 GW) and hydropower plants (e.g., Shulbinskaya HPP, 702 MW; Bukhtarninskaya HPP, 675 MW, etc.).13 In 2014, 86.5 per cent of electric power generation was within the private sector, and there were plans for further privatization of the energy industry by 2020.14 The country’s transmission system is owned and operated by KEGOC with its regional power grid companies.6 In 2017, there were 21 regional power grid companies and about 135 small transmission companies that manage electrical networks of 0.4 - 220 kV in power distribution in Kazakhstan.15 The electric power is traded in the country at the wholesale and consumer markets.16 Consumers have the flexibility to choose between over 300 licensed providers of the electric power.17 The
aging electricity transmission infrastructure requires upgrading, as transmission and distribution lines are spread across very long distances and are inefficient, causing losses of around 6.2 per cent in 2017.18
It has been difficult to develop small hydropower (SHP) projects in the remote areas due to insufficient electricity grid connec-tions. Furthermore, electricity transmission lines connecting the regions did not have necessary capacity, resulting in great variations in electricity prices as well as electricity outages in the winter. However, the situation has steadily improved. Several big electricity grid modernization projects were developed with support from the World Bank: Kazakhstan Electricity Transmis-sion Rehabilitation Project (2000-2019), North-South Electrici-ty Transmission Project (2011), Kazakhstan Moinak Electricity Transmission Project (2013) and Alma Transmission Project (2015).19,20,21,22,23 Many new projects are also underway.24,25,26
The Government regulates transmission and distribution tariffs.27 As of March 2018, households using electric stoves pay 1,216 KZT (US$ 2.9), 1,566 KZT (US$ 3.7) and 1,903 KZT (US$ 4.5) for 100 kilowatts per hour for consumption levels one, two and three respectively. Tariffs are differentiated into three levels according to the quantity consumed and geographical location. There are also discounts provided for the pensioners, people with disabilities and World War II veterans. Electricity prices for households are 1,237 KZT (US$ 2.9), 1,563 KZT (US$ 3.7) and 1,904 KZT (US$ 4.5) for 100 kilowatts per hour for levels one, two and three.28 The Government has ruled that the tariffs will not rise in 2019-2025.29
Problems with the electricity sector have been inherited from the Soviet era when Central Asia was regarded as one region and electricity infrastructure was built accordingly. Currently both the Government and international institutions are investing money in the adjustment of the electricity sector according to the country’s current needs.
Small hydropower sector overview
The classification for SHP plants is units with a total capacity of no more than 35 MW and without reservoirs.30 In 2018, the installed capacity of SHPs less than 35 MW was 200.25 MW, while the technical potential was estimated to be about 4,800 MW, indicating that only 4 per cent has been developed (Figure 3).31,32 Concerning SHP up to 10 MW, the installed capacity in 2018 was about 116 MW.33
In 2018, hydropower contributed about 10 per cent of the total electricity generated.6 Approximately 65 per cent of hydropower resources of the country are concentrated on the rivers located in the mountainous southern and south-eastern regions. There are three major areas in Kazakhstan for hydropower development: the Irtysh River basin and its main tributaries (the Bukhtarma, Uba, Ulba, Kurchum and Kardzhil), the south-eastern zone with the Ili River basin, and the southern zone with basins of the Syr Darya, Talas and Chu rivers. The gross hydropower potential of the Republic of Kazakhstan is estimated to be about 170 TWh, while its technical capacity is about 62 TWh annually.30

14
World Small HydropoWer development report 2019
Figure 3. Small hydropower capacities 2013/2016/2019 in Kazakhstan (MW)
0 1000 2000 3000 4000 5000
PotentialCapacity
Installed Capacity
4,800 4,800 2,707
200 119 115
WSHPDR 2019WSHPDR 2016WSHPDR 2013
Source: Ministry of Energy,31 UNDP,32 WSHPDR 2016,34 WSHPDR 201335
Note: Data for SHP up to 35 MW.
Note: The comparison is between data from WSHPDR 2013, WSHPDR 2016 and WSHPDR 2019.
The Ministry of Industry and New Technologies of Kazakhstan announced in 2013 (with amendments of 2014) plans for 106 renewable energy projects by 2020 with a total capacity of 3,054.6 MW, including 41 SHP plants (539 MW).36 The Almaty region would rely extensively on hydropower. There is considerable interest from investors to develop SHP plants in Kazakhstan, and many new prospective projects. Between 2014 and 2019, nine new SHP plants were built, totalling 56.5 MW. Another 10 SHP projects were in construction stages by the end of 2018, with a planned combined capacity of 131 MW.37 In 2019, auctions were to be held for a range of renewable energy projects, including 65 MW of hydropower capacity from two small-scale and one large-scale projects.38 The remote rural areas and south-eastern regions are particularly interested in SHP projects because of the energy shortages.
Renewable energy policy
In 2012, the Government identified the environment as a key priority, and planned to spend about 2 per cent of the country’s GDP on green energy projects.39 In line with the declared long-term economic development plan under the Kazakhstan 2050 Strategy, the country adopted the Green Energy Concept (Energy Efficiency 2020) in 2013.12 The Strategy aims to reach an alternative and renewable energy share in the country’s energy mix of 30 per cent by 2030, and 50 per cent by 2050 by modernizing ageing infrastructure, increasing the use of alternative fuels and installing efficient and environmentally friendly energy technologies.40 In addition, it aims to reduce the level of carbon dioxide emissions in the power industry by 40 per cent by 2050.12
In 2009, the Parliament of Kazakhstan passed the Law on Use of Renewable Energy Sources, thus establishing a regulatory framework for renewable energies. Feed-in-tariffs (FITs) were introduced in 2013 under the Law on Supporting the Use of Renewable Energy Sources.41 The Government regulation No. 645 of 12 June 2014, approved the fixed tariffs for 2014 with a valid period of 15 years for wind, solar, SHP and biogas plants.30 In 2014, the fixed price of one kWh of energy produced by SHP plants was set at KZT 16 (approximately US$ 0.04), which was
34 per cent higher than the average price for electricity (KZT 11, approximately US$ 0.03).42,43 For wind power plants the set price was KZT 22.68 (approximately US$ 0.06) and for biogas plants it was KZT 32.23 (approximately US$ 0.09).42
Starting from 2018, Kazakhstan switched from the FIT system to an auction system. The Kazakhstan Operator of the Electric Power and Capacity Market (KOREM) held tenders in 2018, and selected 36 renewable energy projects with an installed capacity of approximately 858 MW for construction, of them wind power plants account for 501 MW, solar power stations for 270 MW, SHP plants for 82 MW and biogas for 5 MW.44 Also, Kazakhstan was the first in the region to start the Green Bridges Partnership Programme 2011-2020, improving access to green technology and investment.45
The introduction of FITs and auctions, new legislation, and the Government’s vision for a greener future provided new opportunities for renewable energy development. As a result, renewable power generation has been steadily increasing. In 2018, it increased by 19 per cent in comparison with 2017. The total installed capacity based on renewable energy sources in 2018 was 531 MW, including 200.25 MW of SHP, 121.45 MW of wind power, 209 MW of solar power and 0.3 MW of biogas plants.31 In general, recent developments could indicate a change away from the thermal energy dominated sector.
Barriers to small hydropower developmentKazakhstan is rich in renewable energy resources, in particular solar power, hydropower, biomass, and wind power. However, only a small fraction of this potential is currently being exploited. The power sector has been characterized by a significant deterioration of its generation and network equipment, the dominant position of coal generation, and the absence of necessary reserves to cover peak demand. Imperfection of both tariff and pricing policies for energy resources compounds the issue in Kazakhstan further. However, recent changes in legislation promote new projects to modernize the power industry and enable a greener energy future.
The development of SHP in Kazakhstan is hampered by a num-ber of barriers:• Problems with data collection. This is related to the
inability to collect information on the use of conventional and unconventional renewable energy and off-grid developments. This information is needed for developing energy policies which would take into account all current and prospective developments in the energy sector and help design a sustainable strategy with various energy mix options.46
• Lack of an effective project plan and delivery, as well as lack of experts in RE sector; projects tend to end up much more expensive than initially planned.47
• Lack of regulation of technical specifications, particularly in regards to the power grid connection.
• The challenge of transporting renewable energy generated electricity through the transmission system and to the

15
3.1. CEN
TRA
L As
iA
consumption centres of the country.48
• There have been seven different ministries in charge of power sector of Kazakhstan since 1991, often with poor knowledge handover. This has created confusion and inefficient fulfilment of plans.47
References
1. Ministry of National Economy of the Republic of Kazakhstan Committee on Statistics (2018). Population 1.08.2018. Available from http://stat.gov.kz/faces/homePage?_adf.ctrl-state=17f4pm07eg_37&_afrLoop=2171947606364807
2. Kazakhstan Legislation Database (2019). Available from http://kz.spinform.ru/terra.html
3. World Bank (2013). Kazakhstan – Overview of climate change activities. Available from http://documents.worldbank.org/curated/en/2013/10/19185591/kazakhstan-overview-climate-change-activities.
4. World Atlas (n.d.). Kazakhstan Geography. Available from https://www.worldatlas.com/webimage/countrys/asia/kazakhstan/kzland.htm
5. Food and Agriculture Organization of the United Nations (FAO) (2016). Aquastat. Available from http://www.fao.org/nr/water/aquastat/countries_regions/kaz/index.stm
6. Kazakhstan Electricity Grid Operating Company (KEGOC) (n.d.). Structure of the National Energy system. Available from https://www.kegoc.kz/ru/o-kompanii/nacionalnaya-energosistema
7. EnergyProm (2018). Electricity production increased by 11%. Available from http://www.energyprom.kz/ru/a/reviews/tarify-na-elektroenergiyu-dlya-naseleniya-rk-podnyalis-na-6-s-nachala-goda-za-god-ceny-dlya-kazahstancev-ne-ispolzuyushih-elektroplity-podskochili-na-10-dlya-ispolzuyushih-na-15
8. World Bank (2017). Kazakhstan. Access to electricity (% of population). Available from https://data.worldbank.org/indicator/EG.ELC.ACCS.ZS?locations=KZ.
9. World Bank (2012). In Kazakhstan: Connecting the North and South, North-South Electricity Transmission Project. Available from http://www.worldbank.org/en/results/2012/05/02/in-kazakhstan-connecting-the-north-and-south.
10. Kazakhstan Electricity Grid Operating Company (n.d.). National power system. Available from https://www.kegoc.kz/en/company/national-power-system.
11. EnergyProm (2016). The production of “clean” electricity for the same period showed a 2.3-fold increase. Available from www.energyprom.kz/ru/a/reviews/oschnost_obektov_vozobnovljaemoj_energetiki_v_kazahstane_vozrosla_v_14_ra.
12. Decree of the President of the Republic of Kazakhstan, № 577 (2013). The Concept on Transition of Kazakhstan to a ‘Green Economy’. Available from http://strategy2050.kz/static/files/Concept_Rus.pdf.
13. Samruk-Energy (n.d.). About. Available from https://www.samruk-energy.kz/en/company/samruk-energo-today.
14. Samruk -Kazyna (n.d.). Privatization. Available from https://sk.kz/investors/privatization/.
15. Ministry of Energy of the Republic of Kazakhstan (2017). Power industry. Available from http://energo.gov.kz/index.php?id=3756.
16. Kazakhstan Electricity Grid Operating Company (KEGOC) (n.d.). Electricity of Kazakhstan, key facts. Available from
https://www.kegoc.kz/ru/elektroenergetika/elektroenergetika-kazahstana-klyuchevye-fakty.
17. Committee on Regulation of Natural Monopolies and Protection (2019.). Register of power supply companies. Available from http://www.kremzk.gov.kz/rus/menu2/gosudarstvennye_uslugi/licenz/reestr_energo/.
18. Renewable Market Watch (2018). Kazakhstan to Focus on Renewable Energy for Power Generation Mix. Available from http://renewablemarketwatch.com/news-analysis/260-kazakhstan-to-focus-on-renewable-energy-for-power-generation-mix-diversification-and-improvement.
19. World Bank (2011). North-South Electricity Transmission Project, results. Available from http://www.worldbank.org/projects/P095155/north-south-electricity-transmission-project?lang=en&tab=details.
20. World Bank (2013). Kazakhstan Moinak Electricity Transmission Project. Available from http://www.worldbank.org/projects/P114766/kazakhstan-moinak-electricity-transmission-project?lang=en.
21. World Bank (2014). Alma Transmission Project. Available from http://www.worldbank.org/projects/P116919/alma-transmission-project?lang=en&tab=overview.
22. Kazakhstan Electricity Grid Operating Company (KEGOC) (n.d.). Kazakhstan Electricity Transmission Rehabilitation Project. Available from https://www.kegoc.kz/en/company/investment-projects/kazakhstan-electricity-transmission-rehabilitation-project.
23. Kazakhstan Electricity Grid Operating Company (KEGOC) (n.d.). Kazakhstan Electricity Transmission Rehabilitation Project, Phase II. Available from https://www.kegoc.kz/en/company/investment-projects/kazakhstan-electricity-transmission-rehabilitation-project-phase-ii.
24. Kosolapova, E. (2014). “Two electricity lines to be built in Kazakhstan’s Aktau”, Trend News Agency, 27 November 2014.’ Available from http://en.trend.az/casia/kazakhstan/2337872.html.
25. World Bank (2014). World Bank to Promote Energy Efficiency in Kazakhstan. Available from http://www.worldbank.org/en/news/press-release/2014/06/18/world-bank-to-promote-energy-efficiency-in-kazakhstan.
26. Inogate (2014). INOGATE & Kazakhstan. Available from http://inogate-tag.org/inogate/country.php?lang=en&id=5.
27. Kazakhstan Electricity Grid Operating Company (KEGOC) (n.d.). Tariffs. Available from https://www.kegoc.kz/en/company/activity/tariffs.
28. EnergyProm (2018). Electricity production increased by 11%. Available from http://www.energyprom.kz/ru/a/reviews/tarify-na-elektroenergiyu-dlya-naseleniya-rk-podnyalis-na-6-s-nachala-goda-za-god-ceny-dlya-kazahstancev-ne-ispolzuyushih-elektroplity-podskochili-na-10-dlya-ispolzuyushih-na-15.
29. Sputnik (2018). Electricity tariffs in Kazakhstan will not change until 2025. Available from https://ru.sputniknews.kz/society/20181219/8542507/tarif-ehlektrichestvo-uroven-sohranenie-minehnergo.html.
30. Sakipova, K. (2014). Renewable Energy Department, the Ministry of Environment and Water Resources of the Republic of Kazakhstan.
31. Ministry of Energy of the Republic of Kazakhstan (2018). Information on the electric power generation in 2018 by the renewable energy plants. Available from http://energo.gov.kz/

16
index.php?id=2390632. United Nations Development Programme (UNDP) (2012).
Renewable energy snapshot: Kazakhstan. Available from www.eurasia.undp.org/content/dam/rbec/docs/Kazakhstan.pdf.
33. CIS Energy Council (n.d.), Electric power industry in Kazakhstan. Available from http://energo-cis.ru/kazahstan/
34. Xialei, C., Singh, P. R., Xianlai, W., and Kremere, E., eds. (2016). World Small Hydropower Development Report 2016. United Nations Industrial Development Organization; International Center on Small Hydro Power. Available from www.smallhydroworld.org.
35. LIU, H., Masera, D. and Esser, L., eds. (2013). World Small Hydropower Development Report 2013. United Nations Industrial Development Organization; International Center on Small Hydro Power. Available from www.smallhydroworld.org
36. Government of the Republic of Kazakhstan (2013). Plan of Action for the Development of Alternative and Renewable Energy for 2013-2020. Available from https://policy.asiapacificenergy.org/sites/default/files/Plan%20of%20Action%20for%20the%20Development%20of%20Alternative%20and%20Renewable%20Energy%20for%202013%20-%202020%20%28RU%29.pdf
37. Ministry of Energy of the Republic of Kazakhstan (2019). List of energy producing organizations that use renewable energy sources. Available from http://en.energo.gov.kz/index.php?id=4619
38. Ministry of Energy of the Republic of Kazakhstan (2019). Auctions. Available from http://energo.gov.kz/index.php?id=18005
39. The European Bank for Reconstruction and Development (2013). EBRD welcomes green economy drive in Kazakhstan. Available from http://www.ebrd.com/news/2013/ebrd-welcomes-green-economy-drive-in-kazakhstan.html.
40. The decree of the President of the Republic of Kazakhstan № 449 (2012). ‘Kazakhstan-2050’ new political course for the established state. Astana, December 2012. Available from http://www.inform.kz/eng/article/2346141.
41. Parliament of Kazakhstan (2013). Law on Supporting the Use of Renewable Energy Sources.
42. Gizitdinov, N. (2014). “Kazakhstan Sets Prices for Energy From Renewable Sources”. Bloomberg BusinessWeek, 13 July 2014. Available from http://www.bloomberg.com/news/articles/2014-06-13/kazakhstan-sets-prices-for-energy-from-renewable-sources.
43. Ranking.kz (2014). Analytical service of Kazakhstan’s economy. Available from http://www.ranking.kz/infopovody/a_god_elektroenergija_podorozhala/?mcode=industry.
44. Kazakhstan Operator of the Electric Power and Capacity Market (KOREM) (n.d.). AO “KAREM”. Available from http://ptfcar.org/wp-content/uploads/2018/11/%D0%91%D0%B8%D0%B1%D0%B8%D1%81%D0%B0%D1%80%D0%B0-%D0%9C%D0%B0%D0%BA%D0%B8%D0%BD%D0%B0-%D0%9A%D0%9E%D0%A0%D0%AD%D0%9C.pdf [Russian]
45. United Nations, Division for Sustainable Development (2014). Green Bridge Programme. Astana, 2011. Available from http://sustainabledevelopment.un.org/www.GreenBridgePartnership.net.
46. International Energy Agency (2014). Eastern Europe, Caucasus and Central Asia. Available from http://www.iea.org/publications/freepublications/publication/eastern-europe-
caucasus-and-central-asia-highlights.html.47. Kursiv.kz (2014). Kazakhstan’s green energy in 21st century:
myths, reality and potential. Available from http://www.kursiv.kz/news/details/kompanii/Zelenaya-energetika-Kazahstana-v-21-veke-mify-realnost/.
48. Review of European Bank for Reconstruction and Development (EBRD), Clean Technology Fund (CTF), (2012). Private Sector Proposal: Kazakhstan Renewable Energy Framework (KazREFF). Available from www.cif.climateinvestmentfunds.org/sites/default/files/meeting-documents/independent_review_kazakhstan_renewable_energy_finance_facility_kazreff_0.pdf.

17
3.1. CEN
TRA
L As
iA
Kyrgyzstan Eva Kremere, University of latvia (lU)
Key factsPopulation 6,389,500 1
Area 199,900 km2 2
Climate Continental climate with cold winters and hot summers. Weather patterns are widely affected by the cyclones coming from Central Asia and anticyclones arriving from Siberia. Absolute temperatures vary greatly, from -57 °С in winter to 43 °С in summer. Temperatures vary also with altitude: there is a vertical temperature reduction of about 0.06 °С for each 100 metres of altitude.3,4
Topography Kyrgyzstan is a landlocked, largely mountainous country with the Tian-Shan mountain range covering approximately 95 per cent of the territory. About 94 per cent of the land rises above 1,000 metres above sea level and 40 per cent is at more than 3,000 metres above sea level. The highest point is Pik Pobedi at 7,439 metres above sea level. Glaciers cover about 4 per cent of the territory. The Fergana mountain range separates the country into the mountain area in the east and centre and the Fergana valley in the west and south-west. There are also lowland areas near the border with Kazakhstan in the north.3
Rain pattern The highest annual rainfall is on the western slope of the Fergana ridge (over 1,000 mm), the lowest on the western side of the Issyk-Kul basin (150 mm). Average rainfall ranges from 533 mm. Most of the precipitation falls as snow during the period from October to April.3
Hydrology The country can be divided into two hydrological zones: the flow generation zone in the mountains, which covers 87 per cent of the territory, and the flow dissipation zone. With most rivers being fed by glaciers or snow, the peak flow occurs in the months of April to July. The melting glaciers together with the precipitation provide about 50 billion m3 of the surface water runoff in the mountains. There are over 2,000 rivers over 10 km long in the country, thousands of minor rivers, numerous lakes and reservoirs. The largest of the lakes (and 30th largest in the world), Issyk-Kul is a basinal saltwater lake located in the Northern Tien Shan mountains holding estimated 1,738 km3 of water. The Syr Darya River basin is the largest in the country, covering 55.3 per cent of the territory, with its major tributaries Naryn, Karadarya, Chirchik and the Fergana Valley rivers. Other important rivers include the Chu, Talas, Assa, Aksu, Aksay, Kek Suu and Amu Darya. The water resources are unevenly located as most are concentrated in the unpopulated and economically underdeveloped areas. A vast network of irrigation canals with the total length 5,786.7 km directs water to the water deprived areas of the country.3,4
Electricity sector overview
The total installed electricity generating capacity of the power plants in 2017 was approximately 3.9 GW including 23 hydropower plants (HPPs) with about 3.1 GW, and two thermal power plants with 0.8 GW of installed capacity (Figure 1).5,6
The largest hydropower plants were the Toktogul HPP, with an installed capacity of about 1,200 MW, and Kurpsai HPP with an installed capacity of about 800 MW.7 The thermal power plants in Kyrgyzstan are fuelled by gas, fuel oil and coal.
Electricity generation in the country varies from 12 TWh to 15 TWh per year, depending on the yearly volume of water in the Toktogul reservoir since the Toktogul cascade of major HPPs provides about 80-90 per cent of hydropower generation in the country.8,9 In 2017, total electricity generation was 15,430 GWh, while hydropower plants generated 14,204 GWh (Figure 2).10
Figure 1. Installed electricity capacity by source in Kyrgyzstan (MW)
3,077
862
Hydropower
Thermal power
Source: EPP,5 State Committee for Industry, Energy and Subsoil Use6
The distribution system has a relatively high technical loss and low construction quality, mostly due to the fact that the generating capacity was built 30 to 50 years ago.11,12 As a result, about 30 per cent of the network needs to be repaired or replaced.13 In 2018, the electric power transmission and distribution losses were 12.7 per cent.14 The loss was partly due
3.1.2
World Small HydropoWEr dEvElopmEnt
rEport 2019

18
World Small HydropoWer development report 2019
to inefficient book keeping systems which made corruption and power theft relatively easy and risk free.11 The rehabilitation of the Toktogul HPP is ongoing and several other hydropower projects are on the way.15
Figure 2. Electricity generation in Kyrgyzstan in 1999 – 2017 (GWh)
02,0004,0006,0008,000
10,00012,00014,00016,000
1999
2000
2001
2002
2003
2004
2005
2006
2007
2008
2009
2010
2011
2012
2013
2014
2015
2016
2017
Hydropower (GWh)Thermal power (GWh)
Source: National Statistical Committee10
The political situation in the Kyrgyz Republic has not been stable, and for long periods there was social resistance to the disproportionate distribution of resources and impoverishment, mainly in rural areas.16 In 2017, the economic situation has been improving with annual GDP increase reaching 4.6 per cent. In previous years, the slowdown was seen due to the impact of the 2014 economic slowdown in Russia, slower growth of gold mining and the fragilities of the banking sector.17 Kyrgyzstan remains largely dependent on imports of fossil fuels from Russia and Kazakhstan, creating energy security concerns.19
Regulation of the energy sector is implemented by the Government through the State Property Fund and also from 2016 through the State Committee for Industry, Energy and Subsoil Use. In 2016, the State Property Fund founded the Open JSC “National Energy Holding Company”, which acts as the owner and manager of state-owned power companies. The State Committee for Industry, Energy and Subsoil Use is responsible for industry development, including strategic planning, policy development and forecasting. There are seven state-owned electricity companies within the National Energy Holding Company, which are successors of the national electric company Kyrgyzenergo unbundled in 2001: • JSC Electric Power Plants (EPP) — national generation
company;• JSC Chakan GES – SHPs operating company;• JSC National Grid (NESK) — national transmission
company;• JSC SeverElectro (SE) — distribution company for Bishkek,
Chui and Talas oblasts;• JSC VostokElectro (VE) — distribution company for Issyk-
Kul and Naryn oblasts;• OshElectro (OE) — distribution company for Osh oblast;• Jalal-AbadElectro (JE) — distribution company for Jalal-
Abad oblast.19
There were also 16 wholesale buyers and resellers of electricity, 21 private companies which operate portions of the distributi-on network in certain areas of Bishkek and one district heating company (JSC Bishkekteploset). The Kyrgyz Government owns nearly 95 per cent of the shares of the energy sector companies.20 The electrification rate in the Kyrgyz Republic is 100 per cent.21
With fast economic growth, increasing demand for electricity and aging infrastructure, the country must seek to add to its ca-pacity. Kyrgyzstan is highly depending on variations in hydropo-wer generation, and there are periods when electricity demand is exceeding the level of power generation in the country. For example, electricity demand in 2016 characterized by lower wa-ter resources was 13.3 TWh, which was approximately 400 GWh higher than the domestic generation for that year.22 According to the National Energy Programme, the electricity production must be doubled by 2025 and increased to 30 TWh.23 The Go-vernment has made plans to implement additional capacity of 640, which includes: construction of Kambarata-2 HPP, reconst-ruction of Bishkek thermal power plant (TPP) and construction of the Upper Naryn cascade.12 The master plan to develop large HPP on the Naryn river dates back to the Soviet period, and has created worries in downstream countries.11,24
The electricity infrastructure in the Kyrgyz Republic was built in the Soviet era, when Central Asia was treated as one region. Current infrastructure is aged and inefficient, and needs mo-dernization. Seasonal variation of the electricity load has a ratio of 3:1 between the month of the highest demand (January) and the lowest demand (May). Overloading the systems in order to meet the high winter demand has accelerated the deteriorati-on process and increased the number of service interruptions.13 Electricity and heat tariff levels did not cover the cost of provi-ding services, leading to poor investment in the sector.25 Outa-ges have been especially troubling for the poor, as one third of them use electricity for heating and over three quarters use it for cooking.11,26 Poverty has been more evident in rural areas, whe-re most of the poor live.16 Farmers living in mountainous areas were still not grid-connected, therefore mini- and micro-hydro-power projects are run by individual efforts in rural areas.13,27
The electricity price remained relatively constant at KGS 0.7 (approximately 0.01 US$/KWh) from 2001 to 2014; it carried out a social security function, similar to the Soviet practice. Tariff increases had not been implemented in the past due to the fear of social unrest (as in 2010).28 However, in November 2014 after a public discussion, Resolution No. 660 came into force which approved the Medium-Term Tariff Policy of the Kyrgyz Repu-blic for Electric and Thermal Energy, 2014-2017.29 This intro-duced the first electricity price increase, valid as of 11 December 2014.30 It set the price of KGS 0.7 per kWh (approximately 0.01 US$/kWh) for the consumption up to 700 kWh/month; above this limit the price is calculated as taking into account the actual cost of electricity of KGS 1.2 per kWh (approximately 0.02 US$/kWh) and the cost of imported electricity of KGS 5.13 per kWh (approximately 0.087 US$/kWh).12 According to the Resolution, it was planned to increase the price on 1 April 2015, 2016 and 2017: the price would increase by 20 per cent annually, resulting in the rate of KGS 1.21 per kWh (approximately 0.02 US$/kWh) in 2017.29 However, as of December 2017, the price for electri-

19
3.1. CEN
TRA
L As
iA
city was still KGS 0.77 (approximately 0.01 US$/KWh) when consuming up to 700 kWh/month, and KGS 2.16 per kWh (0.05 US$/KWh) when consuming above the limit, indicating that the planned price increase has happened only to a lesser extent. Ta-riffs are differentiated for six customer classes.31
The power sector needs great financial investment, but so far it has been losing money and has accumulated large amounts of debt due to low electricity tariffs and high electricity losses. It has been difficult for electricity companies to obtain financial help from any sector, whether commercial or public. However, there are some ongoing projects to modernize transmission lines.9 The State remains the owner of all the major energy com-panies and has created a situation where it lends money to itself. Therefore, cancelling at least some of debt as part of prospective restructuring solution could be considered.11
Small hydropower sector overview
The definition of SHP in Kyrgyzstan is up to 30 MW.32,33 The installed capacity in 2017 was 46.6 MW, while the economic potential was estimated to be 409 MW, indicating that approximately 11 per cent has been developed.6,34 Between the World Small Hydropower Development Report (WSHPDR) 2016 and WSHPDR 2019, the installed capacity increased by almost 12 per cent (5.1 MW), the estimated potential has decreased due to an updated study (see Figure 3).
Figure 3. Small hydropower capacities 2013/2016/2019 in Kyrgyzstan (MW)
0 200 400 600 800 1000
PotentialCapacity
Installed Capacity
409 900 900
46.6 41.5 32.0
WSHPDR 2019WSHPDR 2016WSHPDR 2013
Source: State Committee for Industry, Energy and Subsoil Use,6 WB,34 WSHPDR 2013,35 WSHPDR 201636
Note: The comparison is between data from WSHPDR 2013, WSHPDR 2016 and WSHPDR 2019.
In 2017, there were 16 SHP plants with yearly electricity generation of about 125 GW; these plants are of installed capacity below 10 MW each. There were also some micro-hydropower plants but due to their small size and isolated mode of operation they were not registered with the Energy Regulator.32,34,37 Theoretical potential for SHP up to 10 MW was estimated to be 275 MW, but for plants up to 30 MW it was 409 MW. Previous studies of the potential estimates from the Ministry of Energy and Industry, now transformed into the State Committee for Industry, Energy and Subsoil Use of the Kyrgyz Republic, indicated that there was 5 to 8 TWh of potential (900 to 1,450 MW).32,34,38,39 However, this estimate was based on high-level hydrological (not site-specific) studies which are now generally viewed as unreliable. More recent site-specific studies
showed potential of 409 MW, which at an average capacity factor of 63 per cent would produce 2.1 TWh per year.34
In the 1960s there were 200 SHP plants with a total capacity of 66.3 MW, unfortunately they were decommissioned or replaced by large ones according to the Soviet Union strategy. The current Government plans to redevelop SHP in the country. The concept of SHP development in Kyrgyzstan in 2015-2017 was approved on 20 July 2015 by the Kyrgyz Republic Government Decree No. 507.40 It was however cancelled by another decree in 2018. Many locations suitable for SHP have maintained dams, channels and other facilities from SHP plants previously located there.11 The largest SHP potential is concentrated in the north-eastern, western and south-western areas of the country.41
According to the Ministry of Energy of the Kyrgyz Republic, there was a plan to build and rehabilitate 132 SHP plants with a total capacity of 275 MW (Table 1) between 2010 and 2025.42 In line with the project Strategic Planning for Small Hydropower Development in the Kyrgyz Republic, which will last until 2017, four SHP plants will be built. Feasibility studies were already carried out in 2014 and the projects were proposed to investors for implementation:
• Orto-Tokoiskaya HPP in the Issyk-Kul region – 20 MW; US$ 25 million
• Oi-Alma HPP in the Osh region – 17.7 MW; US$ 18.4 million
• Sokulukskaya HPP in the Chui region – 1.5 MW; US$ 3.3 million
• Toktogulskaya HPP in the Batken region – 3 MW; US$ 2.6 million.32,36
Table 1.Planned development of SHP (2010–2025)
Number Capacity (MW) Generation (TWh)
Rehabilitation of existing SHP 33 22 100
Construction of new SHP:
SHP located at water reservoirs 7 75 220
At river stations 92 178 1,200
Source: Ministry of Energy of the Kyrgyz Republic 32,42
In the economic analysis provided by the Ministry of Energy, the estimated payback period for the four SHP plants mentioned above, based on the current and planned electricity tariffs, was as follows:• With the tariff rate of KGS 0.7 (US$ 0.012) the payback
period over 50 years;• With the tariff rate of KGS 1.26 (US$ 0.021) the payback
period from 17 to 21 years;• With the tariff rate of KGS 1.32 (US$ 0.022) the payback
period from 15 to 20 years;• With the tariff rate of KGS 2.25 (US$ 0.038) the payback
period from 6 to 9 years.32
The Law on Renewable Energy Sources states that the

20
World Small HydropoWer development report 2019
Government should set renewable energy (RE) tariffs, ensuring return on investment for projects within eight years.33 However, the current electricity tariffs and low feed-in tariff (FIT) demonstrate that the law is not being implemented. As a result, the implementation of all related resolutions is ineffective. For example, in 2017 the electricity price was only KGS 1.21 (US$ 0.02), while it should be KGS 2.25 (US$ 0.038) to reach the eight-year payback period target.29,32
The acceptance of renewable energy and SHP were the highest in the areas without electricity supply, or with an unreliable electricity supply. Rural preference is to be connected to the grid rather than to an isolated SHP; connecting an isolated SHP can be problematic due to distribution companies placing obstacles for interconnection, unless their potential customers are directly connected to the generator.34 Nevertheless, with the further deterioration of the grid, the acceptance of isolated SHP could increase.13 Kyrgyzstan officially promotes development of RE and has signed most of the relevant international treaties. The obstacles caused by missing legal frameworks are difficult to manage for potential small independent power producers; therefore, the small-scale potential remains currently untapped.13,43,44,45
Renewable energy policy
The country’s key long-term policies for the energy sector were The National Energy Programme and the Strategy for the Fuel and Energy Sector Development for 2008-2010, with an outlook to 2025.46,47 In January 2013, the National Sustainable Development Strategy for 2013-2017 was adopted.48 Afterwards, the Energy Sector Reform Action Plan for 2013-2014 was approved on 24 July 2013, with plans to reform and ensure better regulation of the energy sector.49 In the Kyrgyz Republic, the development of SHP and other renewable energy resources has been of high importance for many years, but so far hardly any national plans have been consistently fulfilled.43
The main laws of primary energy sector legislation affecting the electricity sub-sector and RE sources are:• Law on Energy of the Kyrgyz Republic, adopted on 30
October 1996, No. 56, since then amended three times, the most recent being on May 16, 2008. It contains a delegation of norms which allows the Government and the Authorized Government Body in the Energy Sector to exercise significant powers.11
• Law on Electricity, adopted on January 28, 1997, No. 8, since then amended nine times.11
• Resolution No. 660. Adopted on November 20, 2014 of the Medium-term tariff policy of the Kyrgyz Republic for electric and thermal energy, 2014-2017 sets new electricity tariffs.29
• Law of Kyrgyz Republic on renewable energy sources as of 31 December 2008, No. 283, supports RE development and includes main RE definitions.33 Amendments were made in terms of tariff surcharges for each type of RE source.
The feed-in tariff (FIT) system has been revised by the regulator in 2016 (Order No. 3 of 11 April 2016), resulting in higher FITs
for SHP. The methodology calculates tariffs for newly commissi-oned facilities that generate electricity from renewable sources. The formula for determining the tariffs is linked to end user ta-riffs as follows: T = T1k0 where:• T is the calculated tariff, in KGS/kWh (equal to 4.70 KGS/
kWh, 0.067 US$/kWh for 2016)• T1 is the maximum end-user tariff currently in effect (2.24
KGS/kWh, 0.032 US$/kWh)• k0 is a coefficient that differs depending on the renewable
source being used to generate energy; for hydropower, the coefficient is equal to 2.1.34
There is still long way to go before favourable terms for SHP development will be created. The Ministries are institutionally weak due to both economic and political difficulties, and coordination of joint activities is difficult due to high staff rotation. After multiple on-going reforms, the form of public administration has changed, but the methods used by authorities in their work, decision-making and implementation have largely remained unchanged.50 However, reforms have resulted in electricity sector improvements, including higher tariff revenues, a lower sector deficit, and lower reported losses.20
Barriers to small hydropower developmentSeasonal changes in hydropower production, hydrocarbon import and high losses due to the aged infrastructure remain important challenges for the future SHP development.46 While the large hydropower potential is being developed, there is not sufficient interest among private investors to develop smaller projects. The main obstacle is the legal and regulatory framework, including low tariffs and obtaining licences for construction and operation. Initiatives of the Government towards the tariff increase, privatization of some energy facilities and climatic changes might improve the situation.11,13
The key barriers to SHP development are manifold:• Due to seasonality, streams are more likely (than larger
rivers) to freeze in winter. As a result, facilities may be inoperable during the winter, when power and heat are greatest in demand and central grids are unable to compensate. Many communities are connected to the grid during the summer, when power is relatively abundant; therefore, the demand for off-grid power is not high. This leads to unfavourable economic conditions for commercial SHP plants.51
• Lack of clear framework conditions for investors and clear regulations on licensing; difficulties with obtaining permissions to join the electrical grid and approval of water usage schemes; complicated procedures for land usage. Regulatory documents often lack enforcement mechanisms.32,44
• Lack of financial resources and low financial support from the State.44,52
• Low prices for traditional energy.52
• The current FITs are not sufficiently high for making the SHP projects economically viable.
• Old electricity infrastructure due to the lack of maintenance

21
3.1. CEN
TRA
L As
iA
and investment. High technical and commercial losses caused by theft, fraud and non-payment of bills.53
• The technical capacity of local companies in terms of SHP construction and maintenance (including spare parts) needs to be improved. Also, there is a lack of qualified specialists in the field of RE.32,51
• Poor information support for renewable energy, outdated information.38
• Low awareness of people, governmental agencies, organizations and institutions about the benefits of renewable energy. Due to energy shortages, the Government is more likely to promote larger projects to resolve the problem faster.13,32
References
1. National Statistical Committee of the Kyrgyz Republic (2019). Population stock and flow. Available from http://www.stat.kg/en/opendata/category/316/
2. Embassy of Kyrgyz Republic in the Russian Federation (n.d.). Kyrgyz Republic (Kyrgyzstan). Available from https://kyrgyzem-bassy.ru/?page_id=428
3. Food and Agriculture Organization (2012). Kyrgyzstan. Available from http://www.fao.org/nr/water/aquastat/countries_regions/kgz/index.stm
4. Department of Water Management and Melioration, Ministry of the Food Industry and Melioration of the Kyrgyz Republic (n.d.). Water resources and water management infrastructure in Kyrgyzstan. Available from https://water.gov.kg/index.php?op-tion=com_content&view=article&id=228&Itemid=1274&lang=-ru
5. JSC Electric Power Plants (EPP) (n.d.). About the company. Available from http://www.energo-es.kg/ru/o-kompanii/
6. State Committee for Industry, Energy and Subsoil Use of the Kyrgyz Republic (n.d.). Small hydropower of Kyrgyzstan. Avail-able from http://www.gkpen.kg/index.php/2018-01-09-06-46-22
7. World Bank (2014). Kyrgyz Republic – Emergency Recovery Project. Available from documents.worldbank.org/curated/en/2014/05/19882403/yrgyz-republic-emergency-recovery-proj-ect.
8. National Statistical Committee of the Kyrgyz Republic (n.d.). Electricity, gas, and water production and distribution. Available from http://www.stat.kg/ru/opendata/category/2514/
9. State Committee for Industry, Energy and Subsoil Use (2018). Kyrgyzstan’s approach to the sustainable energy: key targets and tasks. Available from http://www.gkpen.kg/index.php/2018-01-09-06-46-22
10. National Statistical Committee of the Kyrgys Republic (n.d.). Dynamic tables. 1.05.01.03 Production of electric power at power stations. Available from http://www.stat.kg/en/statistics/pro-myshlennost/
11. Asian Development Bank (2013). Power Sector Improvement Project, Study on the Wholesale Electricity Transaction Settle-ment System, Volume 2 – International Experiences. Draft final Report-Version 2. June, 2013. Available from https://www.adb.org/projects/43456-023/main.
12. Kabar, Kyrgyz National News Agency (2014). Djoomart Otor-baev: Problems and potential for the development of electric power industry in Kyrgyzstan. Available from http://www.kabar.
kg/rus/analytics/full/82578.13. Jorde, K. and Terenteva, O. (2009). Regional Reports on Renew-
able Energies-8 Country Analyses on Potentials and Markets in Central Asia. Kyrgyzstan. Eschborn. Available from www.giz.de/expertise/downloads/gtz2009-en-regionalreport-zentralasien-ge-samtpublikation.pdf.
14. National Energy Holding (2019). Energetik. March 2019. Avail-able from http://www.energo.gov.kg/content/articles_view/817
15. National Energy Holding (n.d.). Projects. Available from http://www.energo.gov.kg/
16. National Committee for Statistics of the Kyrgyz Republic (2018). Level of poverty in the Kyrgyz Republic. Available from http://www.stat.kg/ru/publications/uroven-bednosti-v-kyrgyzskoj-re-spublike/
17. European Bank for Reconstruction and Development (2015). Strategy for the Kyrgyz Republic as approved by the Board of Directors at its Meeting on 25 February 2015. Available from
http://www.ebrd.com/where-we-are/kyrgyz-republic/overview.html.18. RG.RU (2018). Common “black gold”. Available from https://
rg.ru/2018/01/10/obshchij-rynok-nefti-eaes-chrezvychaj-no-vazhen-dlia-kirgizii.html
19. National Energy Holding (n.d.). Electric companies. Available from http://energyholding.kg/content/article/18-energokom-panii
20. World Bank (2017). Analysis of the Kyrgyz Republic’s Energy Sector. Available from http://documents.worldbank.org/curated/en/370411513356783137/pdf/122080-WP-PUBLIC-TheStateoft-heKyrgyzRepublicsEnergySectorFinalMay.pdf
21. World Bank (2017). Access to electricity (% of population). Avail-able from https://data.worldbank.org/indicator/eg.elc.accs.zs
22. National Statistical Committee of the Kyrgyz Republic (n.d.). Dynamic tables. 1.05.01.02 Electro-balance of industries econo-mies. Available from http://www.stat.kg/en/statistics/promysh-lennost/.
23. Decree of the Government of the Kyrgyz Republic (2008). Proj-ect of the National Energy Programme of the Kyrgyz Republic for 2008-2010 and Development Strategy of Fuel and Energy Sector until 2025. Available from http://cbd.minjust.gov.kg/
24. Reuters, “Uzbek leader sounds warning over Central Asia water disputes”, 7 September 2012. Available from http://www.reuters.com/article/centralasia-water-idUSL6E8K793I20120907.
25. The Kyrgyz Investment Group (2014). About Kyrgyzstan. Available from http://www.kig.kg/index.php?option=com_con-tent&view=article&id=88&Itemid=97&lang=en.
26. Kabar, Kyrgyz National News Agency (2014). The energy crisis in Kyrgyzstan and measures of the Government. Available from http://www.kabar.kg/rus/kabar/full/83113.
27. Yasinsky, V., Mironenkov, A. and Sarsembekov, T. (2011). Small Hydropower in the CIS: Current Status and Development Prospects. Sector report no. 14. Eurasian Development Bank. Available from http://eabr.org/general/upload/reports/full%20version_14.pdf.
28. Alymbekov, M. (2014). “State Agency for Regulation of Energy: In Kyrgyzstan, the electricity tariff did not increase over the 13 years”. Kabar, Kyrgyz National News Agency, 23 September 2014. Available from http://www.kabar.kg/rus/society/full/87929.
29. Government of the Kyrgyz Republic (2014). Resolution No. 660 from 20 November 2014. Available from http://www.gov.kg/?p=46402.
30. Turusbekov, A. (2014). “Today, new tariffs for electricity and heat

22
World Small HydropoWer development report 2019
energy come into force”. Kabar, Kyrgyz National News Agency, 11 December 2014. Available from http://www.kabar.kg/rus/society/full/87612.
31. Asian Development Bank (ADB) (2012). Sector assessment (Summary): Energy. Available from http://www.adb.org/projects/documents/power-sector-rehabilitation-project-rrp.
32. Stomaliev, A. (2013). Development of renewable energy sector in the Kyrgyz Republic. Ministry of Energy of the Kyrgyz Re-public. Presentation at the 16th CAREC Energy Sector Coordi-nating Committee Meeting, 10-12 September 2013. Available from http://www.carecprogram.org/uploads/events/2013/ESCC-Meeting-KAZ/005_104_209_Development-of-Renew-able-Energy-Sector-in-the-Kyrgyz-Republic.pdf.
33. Ministry of Energy and Industry of the Kyrgyz Republic (2008). Law of the Kyrgyz Republic on December 31, 2008 No.283 ‘On renewable energy source’. Available from http://nature.gov.kg/lawbase/laws/25_ls_renewable_energy_sources.xml
34. World Bank (2017). Small Hydro Power Plant in the Kyrgyz Republic: Assessment of Potential and Development Challeng-es. Available from http://documents.worldbank.org/curated/en/274331513353253592/pdf/116656-REVISED-WP-PUB-LIC-FinalreportSHPPDevelopmentinKYREngSept.pdf
35. LIU, H., Masera, D. and Esser, L., eds. (2013). World Small Hy-dropower Development Report 2013. United Nations Industrial Development Organization; International Center on Small Hy-dro Power. Available from www.smallhydroworld.org.
36. Xialei, C., Singh, P. R., Xianlai, W., and Kremere, E., eds. (2016). World Small Hydropower Development Report 2016. United Nations Industrial Development Organization; Interna-tional Center on Small Hydro Power. Available from www.small-hydroworld.org.
37. Information portal about Kyrgyzstan, Welcome.kg (n.d). Electric Power. Available from www.welcome.kg/ru/economics/industry/erth/.
38. Monique, B. (2009). Project title: Small Hydro Power Develop-ment in Kyrgyzstan. Project ID 3931. Request for CEO endorse-ment/ approval project type: medium-sized project from the GEF Trust Fund. Washington, D.C., 17 December 2014. Avail-able from www.thegef.org/gef/sites/thegef.org/files/repository/Kyrgyzstan-MS-project-12-17-09(2).pdf.
39. State Agency on Environment Protection and Forestry under the Government of the Kyrgyz Republic (2013). Report of the UNDP/GEF, ‘Small Hydro Power Development’ and the project compo-nent ‘Sustainable energy supply’. Available from http://nature.gov.kg/index.php/en/component/ecolist/?project=38.
40. The Kyrgyz Republic Government Decree № 507 of 20 July 2015. Available from http://cbd.minjust.gov.kg/act/view/ru-ru/97764?-cl=ru-ru.
41. State Committee for Industry, Energy and Subsoil Use of the Kyrgyz Republic (n.d.). Map of SHP. Available from http://www.gkpen.kg/index.php/2018-01-09-06-46-22
42. Kalmambetov, A. (2010). Energy Sector of the Kyrgyz Republic. Ministry of Energy of the Kyrgyz Republic. Presentation at the CAREC Energy Sector Coordinating Committee Meeting, 22 September 2010. Kyrgyzstan, Bishkek. Available from http://www.carecprogram.org/uploads/events/2010/ESCC-Sep/Day1-KGZ-Energy-Sector.pdf.
43. Asian Development Bank, Ministry of Energy and Industry of the Kyrgyz Republic (2014). Energy Sector Development, First Ecologic Assessment. Available from www.energo.gov.kg/ru/nor-
mativnaja_baza/proekty/159.44. United Nations Development Programme (n.d). Kyrgyzstan:
Setting ground rules for investment in hydropower. Available from http://www.undp.org/content/rbec/en/home/ourwork/environmentandenergy/successstories/kyrgyzstan--set-ting-ground-rules-for-investment-in-hydropower/.
45. State Agency on Environment Protection and Forestry under the Government of the Kyrgyz Republic (2011). Experts and special-ists in the field of hydropower discussed the development of small hydropower plants.
Available from http://nature.gov.kg/index.php?option=com_content&view=article&id=438%3A2011-11-18-06-09-16&catid=32%3Alatest-news&Itemid=59&lang=ru.
46. International Energy Agency (IEA) (2014). Eastern Europe, Caucasus and Central Asia. Available from http://www.iea.org/publications/freepublications/publication/eastern-europe-cauca-sus-and-central-asia-highlights.html.
47. Kyrgyz Republic (n.d.) NATIONAL ENERGY PROGRAMME of the Kyrgyz Republic for 2008-2010 and the fuel and energy com-plex development until 2025. Approved by the Resolution of the Jogorku Kenesh of the Kyrgyz Republic dated April 24, 2008 N 346 –IV. Available from http://www.carecprogram.org/uploads/pages/countries/KGZ-National-Energy-Program-2008-2010-en.pdf.
48. United Nations Development Programme in Kyrgyzstan (n.d). In-Depth. Available from http://www.kg.undp.org/content/kyr-gyzstan/ru/home/ourwork/environmentandenergy/in_depth/.
49. Kaliev, A. R. (2014). Cooperation in the Energy Sector. Ministry of Energy and Industry of the Kyrgyz Republic. Presentation at the 17th CAREC Energy Sector Coordinating Committee (ESCC) Meeting, 2-3 April 2014. Available from http://www.carecprogram.org/uploads/events/2014/ESCC-Meeting-KGZ/Presentation-Materials/Day-2/005_104_209_Session-V-Coun-try-Presentation-KGZ.pdf.
50. HELVETAS Swiss Intercooperation Kyrgyzstan (2012). Country Programme Kyrgyzstan 2013-2017. Bishkek, December 2012. Available from http://assets.helvetas.org/downloads/130719_hsi_kr___cp_2013_2017___final.pdf.
51. Rafkat, H. and Ismailov, K. (2011). Kyrgyzstan’s Energy Sector: A Poverty and Social Impact Assessment. Commissioned by UN-DP’s Regional Bureau for Europe and CIS. Available from
http://docplayer.net/12436615-Kyrgyzstan-s-energy-sector-a-pover-ty-and-social-impact-assessment.html.
52. Ministry of Industry, Energy and Fuel Resources of the Kyrgyz Republic (2009). Development of the Renewable Energy Sector in the Russian Federation and in CIS countries by Azamat Omorov. 3-5 June, 2009 Geneva. Available from http://www.unece.org/fileadmin/DAM/energy/se/pp/ee21_sc/20scJune09/4_june_morn/12_omorov_e.pdf.
53. The Government of the Kyrgyz Republic (2012). The decree from 28 May 2012 № 330 On the Mid-term Energy Development Strategy for the period of 2012-2017. Available from http://cbd.minjust.gov.kg/act/view/ru-ru/93854.

23
3.1. CEN
TRA
L As
iA
TajikistanFurkat t. Kadyrov, tajHydro; and International Center on Small Hydro power (ICSHp)
Key factsPopulation 9,107,2111
Area 143,000 km2
Climate The climate of the country is continental, subtropical and semiarid, with some desert areas. Moun-tains shield Fergana Valley and other lowlands from Arctic air masses. However, temperature in the region is below 0 °С more than 100 days per year. Average temperature in winter is 7 °С and in summer 18 °С.2,3
Topography More than 50 per cent of Tajikistan is at an elevation above 3,000 metres. The country is landlocked, with 93 per cent of its territory covered by mountains. The highest point is Ismoili Somoni peak, reaching 7,495 metres. A few valleys in the centre and the Fergana Valley in the north represent the lower lands. However, even these lowlands are well above sea level, Fergana Valley lowest elevation being 320 metres, in Khujand.2,3
Rain pattern Annual precipitation in Tajikistan ranges between 700 and 1,600 mm. Fedchenko Glacier is known as the region where it rains the most, with precipitation averages reaching 2,236 mm per year. Lightest rainfall observed is in the eastern Pamirs, with an estimated average of less than 100 mm per year.3
Hydrology Tajikistan possesses about 60 per cent of the water resources in Central Asia. The hydrographic net-work of the country consists of over 25,000 rivers with the total length of about 69,200 km, and numerous minor streams. The country is divided into the following major river basins: Zaravshon, Surhandarya (Karatag & Sherkent rivers), Kofarnihon, Vakhsh, and Panji, (Gunt, Bartang, Yazgulem, Vanj, Southern Kizilsu). The largest rivers in the country are the Pyanj (521 km), Vakhsh (524 km) and Bartang (528 km). The main source of surface water is seasonal melting of snow and mountain glaciers. The average annual river flow is 56.2 km3. Tajikistan has about two hundred irrigation canals with a total length of 28,000 km. The largest are the Vakhsh and Big Hissor canals. There are also wa-ter reservoirs at the hydropower plants, including Nurek, Kairakum, Farhad, Kattasay, Muminabad and Selburin, which contain more than 15,000 m3 of water. 4
Electricity sector overview
Total electricity generation reached 18.1 TWh in 2017, including 17.0 TWh of hydropower generation (94 per cent of the total) at the end of 2017 (Figure 1).5,6 Electricity consumption was 13.5 TWh.7 Most of the electric power is consumed by the public utilities and by the industrial consumers.8
Figure 1. Annual electricity generation by source in Tajikistan (TWh)
17.0
1.1
Hydropower
Thermal power
Source: Agency of Statistics,5 MEWR6
The total installed capacity of electric power plants in Tajikistan was 5,757 MW in 2017, with thermal power accounting for 12.4 per cent and hydropower for 87.6 per cent (Figure 2).6 There was a significant increase in the thermal power capacity due to the 300 MW Dushanbe-2 CHP, which commenced its operation at the end of 2016.9
Figure 2. Installed electricity capacity by source in Tajikistan (MW)
5,039
718
Hydropower
Thermal power
Source: MEWR6
The electrification rate reached 99.3 per cent in 2017.10 However, there are still severe power shortages, especially in the rural areas. About 2.5 percent of population, i.e. almost 200,000 people, currently do not have access to electricity due to either relatively rapid growth of settlements (primarily Khatlon region) or at the remote mountainous sites (e.g., Gorno-Badakhshan Autonomous Oblast).11
Tajikistan possesses a very high theoretical hydropower potenti-al of 528 TWh/year. The technical hydropower potential estima-ted at 317.82 TWh/year, but only about 5 per cent of this poten-tial is currently used.6 There is about 29 GW of unused technical
3.1.3
World Small HydropoWEr dEvElopmEnt
rEport 2019

24
World Small HydropoWer development report 2019
hydropower potential proved to be feasible for new projects in the future, including:• About 4,450 MW in the River Vakhsh catchment;• About 1,800 MW in the River Surhob catchment;• About 1,750 MW in the River Obihingou catchment;• About 1,450 MW in the River Kafarnigan catchment;• About 1,260 MW in the River Zerafshan catchment; and• About 17,900 MW in the River Pyanj catchment.12,13
The Ministry of Energy and Water Resources is responsible for licensing, approval of investment plans and technical and safety standards.14 Regulation of the energy sector is the responsibility of the Antimonopoly Service (AMS) under the Government of the Republic of Tajikistan. The AMS is responsible for the tariff methodology and tariff level proposals. Final approval and amendment of tariffs for the end-users is within the competency of the President. Electricity prices are raised on an annual basis in Tajikistan.15 Electricity tariffs in Tajikistan vary by customer type. The variation in voltage or time of day does not have any effect on these tariffs. Table 1 details the tariffs by customer category in 2018.16 Although the electricity tariffs have been rising, they are still among the lowest in the world. The current prices are still below the supply costs.
Table 1.Electricity tariffs in Tajikistan in 2018
Consumer category Period of the year Electricity tariff (US$/kWh)
Consumers without the State budget funding All year 0.05
Residential;Consumers with the State budget funding; Sports facilities;Communal services, facilities and utilities;Public transport
All year 0.02
Electric power used for the agricultural water pumps
1 April – 31 October
1 November – 31 March
0.010.02
Tajik metallurgical works (Aluminium smelting plant)
1 October – 30 April1 May –
30 September
0.05
Other metal works All year 0.00
Social entities with-out the State budget funding
All year 0.05
Source: Barki Tojik16
Barki Tojik is a vertically integrated state-owned national power utility. The company is continuously running at a loss while accumulating debt and requires restructuring in order to improve efficiency.17,18 Electricity tariffs are never raised sufficiently due to a high poverty rate in the country. There is no sufficient funding to fully cover the operation and maintenance costs of the power plants. Barki Tojik is using external funding from the international landers for this purpose.
CASA-1000 is a new electricity transmission system that will connect the Kyrgyz Republic, Tajikistan, Afghanistan and Pakistan and ensure more efficient use of hydropower resources in electricity generation.19 The newly implemented system will enable aforementioned countries to sell electricity surplus to the Southern Asian countries, which experience a deficiency during the summer months. The CASA-1000 project will also assist with national improvements of electricity access, as well as with integrating and expanding the energy market, promoting sustainable development solutions. On 11 December 2017, CASA-1000 project entered the construction phase. Contracts between Tajikistan and Afghanistan were signed, with plans to construct an over 550 km high voltage direct current (HVDC) transmission line in Afghanistan. In January 2018, the bid opening of financial proposals for the HVDC transmission line and converter stations was held in Kazakhstan.20
In 2016, work began on the Rogun project, which will be considered the world’s tallest dam, according to Tajikistan officials. The dam is estimated at 335 metres height and the installed capacity of the hydroelectric plant is roughly 3,600 MW. A contract for the construction of the plant was signed with an Italian company, Salini Impregilo. The cost of the agreement was US$ 3.9 billion. In July 2016, a second agreement was signed with Siemens AG, company that will provide high-insulated high-voltage switchgear (GIS) for the Rogun plant. Expected duration of the project is estimated at 138 months by the constructing company Salini Impregilo. The Rogun plant will have six turbines, with 600 MW of installed capacity each.21 The first power block of this plant was commissioned in November 2018.22
More recent projects are focused on strengthening energy links in the region and on capacity building to enhance climate resilience of hydropower assets. One of the examples of such projects is the Tajikistan–Qairokkum Climate Resilience Upgrade Associated Technical Cooperation project funded by the European Bank of Reconstruction and Development.23
The Kyrgyz Republic and Tajikistan are considered the most energy insecure countries in the region and therefore, stronger links with the countries in the region will improve their ability to provide year-round access to power for their citizens. Both these nations have the potential to provide major exports of hydropower in the summer and therefore are important partners in the energy sector. In addition, changes in weather patterns and extreme conditions negatively affect energy supply and power distribution. Severe land-slides could permanently affect small hydropower plants, as well as other renewable energy facilities. Most Central Asian countries deal with extreme weather conditions, however, Tajikistan is more vulnerable and is already dealing with low agricultural productivity and high losses from disasters.
Small hydropower sector overview
Tajikistan’s small hydropower (SHP) definition refers to plants up to 30 MW as stated in Law No. 1254 ‘On the use of renewable energy sources’ from 23 November 2015.24,25 In order to facilitate
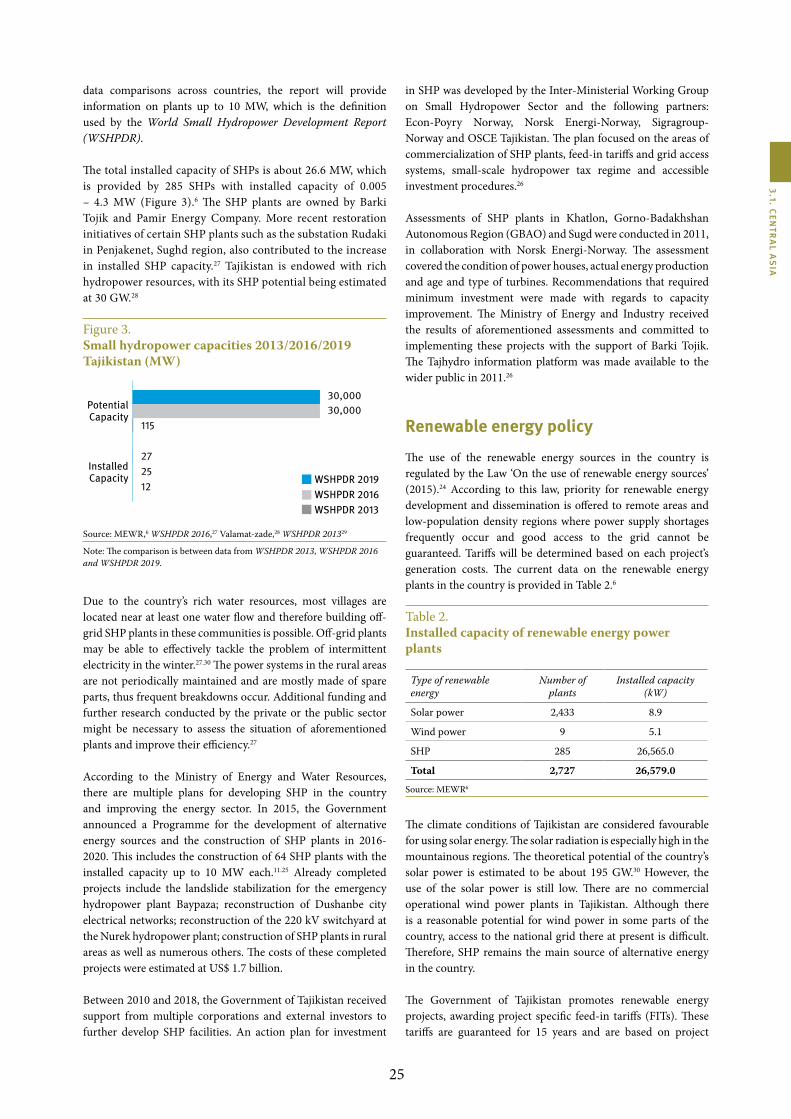
25
3.1. CEN
TRA
L As
iA
data comparisons across countries, the report will provide information on plants up to 10 MW, which is the definition used by the World Small Hydropower Development Report (WSHPDR).
The total installed capacity of SHPs is about 26.6 MW, which is provided by 285 SHPs with installed capacity of 0.005 – 4.3 MW (Figure 3).6 The SHP plants are owned by Barki Tojik and Pamir Energy Company. More recent restoration initiatives of certain SHP plants such as the substation Rudaki in Penjakenet, Sughd region, also contributed to the increase in installed SHP capacity.27 Tajikistan is endowed with rich hydropower resources, with its SHP potential being estimated at 30 GW.28
Figure 3. Small hydropower capacities 2013/2016/2019 Tajikistan (MW)
0 5000 10000 15000 20000 25000 30000
PotentialCapacity
Installed Capacity
30,000 30,000115
272512
WSHPDR 2019WSHPDR 2016WSHPDR 2013
Source: MEWR,6 WSHPDR 2016,27 Valamat-zade,28 WSHPDR 201329
Note: The comparison is between data from WSHPDR 2013, WSHPDR 2016 and WSHPDR 2019.
Due to the country’s rich water resources, most villages are located near at least one water flow and therefore building off-grid SHP plants in these communities is possible. Off-grid plants may be able to effectively tackle the problem of intermittent electricity in the winter.27.30 The power systems in the rural areas are not periodically maintained and are mostly made of spare parts, thus frequent breakdowns occur. Additional funding and further research conducted by the private or the public sector might be necessary to assess the situation of aforementioned plants and improve their efficiency.27
According to the Ministry of Energy and Water Resources, there are multiple plans for developing SHP in the country and improving the energy sector. In 2015, the Government announced a Programme for the development of alternative energy sources and the construction of SHP plants in 2016-2020. This includes the construction of 64 SHP plants with the installed capacity up to 10 MW each.11.25 Already completed projects include the landslide stabilization for the emergency hydropower plant Baypaza; reconstruction of Dushanbe city electrical networks; reconstruction of the 220 kV switchyard at the Nurek hydropower plant; construction of SHP plants in rural areas as well as numerous others. The costs of these completed projects were estimated at US$ 1.7 billion.
Between 2010 and 2018, the Government of Tajikistan received support from multiple corporations and external investors to further develop SHP facilities. An action plan for investment
in SHP was developed by the Inter-Ministerial Working Group on Small Hydropower Sector and the following partners: Econ-Poyry Norway, Norsk Energi-Norway, Sigragroup-Norway and OSCE Tajikistan. The plan focused on the areas of commercialization of SHP plants, feed-in tariffs and grid access systems, small-scale hydropower tax regime and accessible investment procedures.26
Assessments of SHP plants in Khatlon, Gorno-Badakhshan Autonomous Region (GBAO) and Sugd were conducted in 2011, in collaboration with Norsk Energi-Norway. The assessment covered the condition of power houses, actual energy production and age and type of turbines. Recommendations that required minimum investment were made with regards to capacity improvement. The Ministry of Energy and Industry received the results of aforementioned assessments and committed to implementing these projects with the support of Barki Tojik. The Tajhydro information platform was made available to the wider public in 2011.26
Renewable energy policy
The use of the renewable energy sources in the country is regulated by the Law ‘On the use of renewable energy sources’ (2015).24 According to this law, priority for renewable energy development and dissemination is offered to remote areas and low-population density regions where power supply shortages frequently occur and good access to the grid cannot be guaranteed. Tariffs will be determined based on each project’s generation costs. The current data on the renewable energy plants in the country is provided in Table 2.6
Table 2. Installed capacity of renewable energy power plants
Type of renewable energy
Number of plants
Installed capacity (kW)
Solar power 2,433 8.9
Wind power 9 5.1
SHP 285 26,565.0
Total 2,727 26,579.0
Source: MEWR6
The climate conditions of Tajikistan are considered favourable for using solar energy. The solar radiation is especially high in the mountainous regions. The theoretical potential of the country’s solar power is estimated to be about 195 GW.30 However, the use of the solar power is still low. There are no commercial operational wind power plants in Tajikistan. Although there is a reasonable potential for wind power in some parts of the country, access to the national grid there at present is difficult. Therefore, SHP remains the main source of alternative energy in the country.
The Government of Tajikistan promotes renewable energy projects, awarding project specific feed-in tariffs (FITs). These tariffs are guaranteed for 15 years and are based on project

26
World Small HydropoWer development report 2019
estimated costs. Investment costs in SHP are between US$ 2,500 and US$ 3,000 per kW of installed capacity, therefore implementing FITs is necessary.31
The Long-term Programme for building SHP plants represents the basic strategic framework for renewable energy in Tajikistan. According to the programme, between 2009 and 2020, roughly 190 SHP plants will be constructed, with a total capacity of 100 MW. This plan might explain the increasing initiatives of the Government to promote SHP in the region and the feasibility studies conducted in 2011-2012. The guidelines and laws exis-tent at present aim to offer substantial motivation to investors in the sector.14
Barriers to small hydropower development There are multiple barriers to small hydropower development in Tajikistan; however it is believed off-grid plants have fewer. Some of the most important ones include:• Very low electricity tariffs in comparison to the generation
costs;• Lack of reliable SHP potential data, as well as the necessity
to conduct further feasibility studies in the country and improve the functionality of already existent plants, ensuring less breakouts occur;
• Lack of trained local experts in the management, operation and maintenance of SHP plants and facilities;
• Lack of social awareness with regards to the importance of small hydropower for the region and its multiple benefits;
• Legal uncertainty about private sector involvement and the lack of well-defined laws and guidelines with regards to foreign/external investment.9,30
References
1. Agency of Statistics under President of the Republic of Tajikistan (n.d.). Population. Available from http://www.stat.tj/en/
2. United Nations Food and Agriculture Organization (n.d.). Tajikistan. Available from http://www.fao.org/nr/water/aquastat/countries_regions/tjk/index.stm.
3. U.S. Library of Congress (2015). Country Studies: Ta-jikistan. Available from http://countrystudies.us/tajiki-stan/15.htm
4. Tajikwater (2017). Rivers of Tajikistan. Available from http://tajikwater.net/docs/tajik_rivers_080620.htm
5. Agency of Statistics under President of the Republic of Tajikistan (n.d.). REAL SECTOR. Available from https://www.stat.tj/ru/database-real-sector
6. Ministry of Energy and Water Resources of the Republic of Tajikistan (n.d.). Electric power system. Available from https://www.mewr.tj/?page_id=552
7. Ministry of Energy and Water Resources of the Republic of Tajikistan (n.d.). Production and consumption. Avail-able from https://www.mewr.tj/?page_id=563
8. CIS Energy Council (n.d.). Electric energy in Tajikistan. Available from http://energo-cis.ru/tadjikistan/
9. Official Platform of the Presidency of Tajikistan (2016). Chronicle of the Nation‘s Leader 2016. Available from http://www.president.tj/ru/node/13909
10. World Bank (n.d.). Access to electricity (% of population). Available from https://data.worldbank.org/indicator/EG.ELC.ACCS.ZS?view=chart
11. Sputnik Tajikistan (2019). About 200,000 of people do not have access to electricity. Available from https://tj.sputniknews.ru/country/20190417/1028694119/tajiki-stan-dostup-elektrichestvo.html
12. Ministry for Energy and Water Resources of the Republic of Tajikistan (n.d.). Hydroelectric resources of Tajikistan. Available from https://www.mewr.tj/?page_id=614
13. Asian Development Bank (2017). Tajikistan. The general plan of the energy sector development. Available from https://www.mewr.tj/?page_id=585
14. Ministry for Energy and Water Resources of the Republic of Tajikistan (n.d.). Directions of activity. Available from https://www.mewr.tj/?page_id=483
15. Avesta Information Agency (2018). A rise in the elec-tric power tariffs is expected in Tajikistan. Available from http://avesta.tj/2018/08/02/v-tadzhikistane-gry-adet-povyshenie-tarifov-na-elektroeneriyu/
16. Barki Tojik (2018). Tariffs for the electrical and thermal energy introduced from 1 November 2018. Available from http://www.barqitojik.tj/feedback/otvety-na-obrash-cheniya/197311/?sphrase_id=5398
17. Asia-Plus Media Group (2019). Barki Tochik. Restructur-ing continues, debts grow. Available from https://news.tj/ru/news/tajikistan/economic/20190129/barki-tochik-re-strukturizatsiya-prodolzhaetsya-dolgi-rastut-i-prib-lizhayutsya-k-25-mlrd
19. Ministry for Energy and Water Resources of the Republic of Tajikistan (n.d.). Restructuring of the electric power industry of Tajikistan. Available from https://www.mewr.tj/?page_id=542
20. CASA-1000 Organisation (2018). Electricity. It’s essential for development, economic growth, job creation, and modern life. Without it, poverty endures. Available from http://casa-1000.org/
21. Salini Impregilo (2017). Rogun Hydropower Project. Ongoing projects. Available from https://www.salini-impregilo.com/en/projects/in-progress/rogun-dam.html
22. Ministry for Energy and Water Resources of the Republic of Tajikistan (n.d.). The ceremony of putting the first block of the Ragu hydropower plant into operation. Available from https://www.mewr.tj/?p=532
23. TajHydro Consulting Company (2018). Our Projects. Available from http://tajhydro.tj/en/our-projects/
24. Parliament (Madgilis) of the Republic of Tajikistan (2015). Law of the Republic of Tajikistan №1254 from 23.11.2015 ‘On the use of renewable energy sources’. Available from http://mewr.tj/wp-content/uploads/files/Konun_manbahoi_enereg.pdf
25. Government of the Republic of Tajikistan (2015). Resolution №795 from 30 December 2015 ‘On the Programme for devel-oping alternative energy sources and construction of SHPs in 2016-2010. Available from http://base.spinform.ru/show_doc.fwx?rgn=82011
26. Tajhydro (2017). For partners: project information. Available from http://www.tajhydro.tj

27
3.1. CEN
TRA
L As
iA
27. Xialei, C., Singh, P. R., Xianlai, W., and Kremere, E., eds. (2016). World Small Hydropower Development Report 2016. United Nations Industrial Development Organization; Inter-national Center on Small Hydro Power. Available from www.smallhydroworld.org
28. Valamat-zade, T. (2008). Energy of Tajikistan: Present and near future. Central Asia and Caucuses, No.1(55). Available from https://cyberleninka.ru/article/v/energetika-tadzhikistana-nas-toyaschee-i-blizhayshee-buduschee
29. LIU, H., Masera, D. and Esser, L., eds. (2013). World Small Hy-dropower Development Report 2013. United Nations Industrial Development Organization; International Center on Small Hy-dro Power. Available from www.smallhydroworld.org
30. Olimbekov, K. (n.d). Tajikistan: Energy Production and Con-sumption Sector. United Nations Economic Commission for Europe. Available from https://www.unece.org/fileadmin/DAM/energy/se/pdfs/gee21/projects/others/Tajikistan.pdf
31. United Nations Development Programme (UNDP) (2014). Re-newable Energy Snapshot: Tajikistan. Available from http://www.undp.org/content/dam/rbec/docs

28
TurkmenistanJorge Servert and Carlos González, Solar technology advisors
Key factsPopulation 5,850,0001
Area 491,200 km2 2
Climate Turkmenistan has a continental and very dry climate. Summers are extremely hot and dry, whereas winters are moderate with frequent rain and rare snow. Daytime temperatures can be extreme from May to September, higher than 40 °C. Temperatures in January are between -6 °C and 4 °C.3
Topography More than 80 per cent of the area is occupied by the Kara Kum desert, being bounded by the Amu Darya, Murgab, Tejen, and Atrek rivers. The highest mountain is Ayrybaba (3,139 metres above sea level), located near the border with Uzbekistan. Approximately, 4 per cent of the territory is arable with approximately 2.5 per cent being under irrigation.4
Rain pattern Average yearly rainfall is 227 mm. Rainfall peaks in April with 44 mm and reaches the lowest point in August with an average of 1 mm.5
Hydrology Main rivers are in the east and the south of the country. The Amu Darya has a length of 2,540 kilometres making it the longest river in Central Asia. It has an average annual flow of 1,940 m3/sec and heights between 500 to 120 metres. The damming and irrigation uses of the Amu Darya have had severe environmental effects on the Aral Sea that it flows into. Other important rivers are the Heray Rud (length 1,124 kilometres, heights between 500 and 190 metres), Morghab (length 852 kilometres, heights between 400 and 200 metres) and Atrek (length 660 kilometres, heights between 200 and 0 metres). The country’s most important waterway is the Kara Kum Canal. It brings water from the Amu Darya, Morghab and Heray Rud to the southern region allowing the irrigation of more than 1 million hectares of land with a total Irrigation potential of 2,353,00 hectares.6-8 The Kara Kum Canal is one of the largest irrigation and water supply canals in the world.
Electricity sector overview
As of April 2017, the total installed capacity of Turkmenistan was 5,428 MW, with gas-powered plants accounting for 99.8 per cent and hydropower for just 0.02 per cent (Figure 1).9 In 2017, there were thirteen power stations in operation equipped with a total of fourteen steam turbine and thirty-two gas turbine units, and one hydropower plant equipped with three turbines (Table 1).9
Figure 1. Installed electricity capacity by source in Turkmenistan (MW)
5,427
1.2
Natural gas
Hydropower
Source: Turkmenportal.com9
The electrification rate in Turkmenistan is 100 per cent. In 2016, the country produced 24 TWh of electricity compared to 22 TWh in 2015, and exported 3.2 TWh.32 Electricity consumption by sector splits as follows: commercial and public services 40 per cent, transport 24 per cent, industry 8 per cent, residential 2 per cent, agriculture and forestry 2 per cent, and other 24 per cent.12 In 2016, the hydropower sector produced approximately 3 MWh.13
Table 1. Major power plants in operation in Turkmenistan
Plant Type Installed capacity (MW)
Mary Steam and gas 1,831.7
Ahal Gas 648.1
Derweze Gas 504.4
Turkmenbashy Steam 420.0
Balkanabat Gas 380.2
Abadan Steam and gas 321.0
Awaza Gas 254.2
Ashgabat Gas 254.2
Dashoguz Gas 254.2
Seydi Steam 160.0
Lebap Gas 149.2
Gindukush Hydropower 1.2
Total 5,178.4
Source: Turkmenportal.com,9 IEEJ,10 Ministry of Energy31
Turkmenistan has 82.2 million tons of proved recoverable oil reserves and an oil production of over 12 million tons per year.
3.1.4
World Small HydropoWEr dEvElopmEnt
rEport 2019

29
3.1. CEN
TRA
L As
iA
The country has one of the largest proved natural gas reserves in the world of over 15 thousand Mtoe with a production of 65 Mtoe per year, making it the eleventh largest gas producer in the world. However, domestic consumption of gas is not significant, which allows Turkmenistan to be one of the most important gas exporters in the world. In 2018, the total volume of gas export amounted to about 39 billion cubic meters (bcm), with a vast majority of this natural gas exported to China, Russia and Iran.14
The electricity market is managed by the vertically integrated and state-owned company Turkmenenergo, which owns and operates the grid. Turkmenenergo also generates and distributes electricity to the end consumers.15 Electricity tariffs are valid from November 1, 2017 and shown in Table 2.
Table 2. Electricity tariffs in Turkmenistan
Consumer type Rates per 100 kwh
Legal entities financed from the state budget and their equivalents
TMT 3.31 (US$ 0.95)
State owned self-supporting legal entities, non-state-owned legal entities engaged in business, individual entrepreneurs
TMT 6.28 (US$ 1.80)
Foreign citizens, stateless persons and refugees TMT 2.17 (US$ 0.62)
Foreign legal entities US$ 3.58
Diplomatic missions, international and intergovernmental organizations
TMT 3.31 (US$ 0.95)
Citizens of Turkmenistan who do not engage in entrepreneurial activity
TMT 2.50 (US$ 0.71)*
* for consumption above the free-of-charge limit of 35 kWh
Source: News Central Asia30
An extensive programme for the development of the installed capacity in the country was introduced in the ‘Concept of the energy industry development for 2013-2020’.32 The Government plans to invest US$ 5 billion by 2020 into the development of the power sector of the country. The objective is to increase annual electricity generation to 27 TWh in 2020 and to 35.5 TWh in 2030, and export to 12.6 TWh in 2020. The plan includes the upgrade of old plants and construction of new ones, as well as construction of high voltage power transmission lines. The Government has also planned to build 14 new gas-powered stations with a total installed capacity of 4,000 MW by 2020.16,17,18,32 For the 2017-2020 period, the plan includes construction of six new combined cycle power plants, conversion of open cycle gas power plants into combined cycle plants and construction of high voltage power transmission lines.9
In March 2018, the Minister of Energy of Turkmenistan, the Minister of Foreign Affairs of Afghanistan and the Minister of State for Petroleum of Pakistan announced an inter-countries power transmission project that will transfer up to 4 GW from Turkmenistan to the other countries. The power line will be
the way for the delivery of long-term power supply, supporting the energy needs of Afghanistan and enabling power trade and exchange among the three countries. The project will include the construction of around 500 kilometres of a 500 kV transmission line between Turkmenistan, Afghanistan and Pakistan.19
Small hydropower sector overview
There is no official definition of small hydropower (SHP) in Turkmenistan, but for the purposes of this report the standard definition up to 10 MW will be used.
Historically, there has been no significant hydropower development in Turkmenistan. Built in 1913, the Gindukush hydropower plant with an installed capacity of 1.2 MW is the only operational hydropower plant in the country. To date, the Government has refused any significant hydropower projects. Due to the extreme cheapness of natural gas in the country, new capacity is being built around gas thermal power plants.
Thus, the installed capacity of SHP in the country is 1.2 MW, while the potential is estimated at 1,300 MW, indicating that less than 0.1 per cent of the total potential has been developed to date (Figure 2).15 The installed capacity has decreased compared to the World Small Hydropower Development (WSHPDR) 2016, which is due to a more precise data becoming available. There has been just one hydropower plant in operation throughout these years without any changes in its installed capacity of 1.2 MW. The hydropower potential is mainly located in the Murgab and Amu-Daria river basins. The largest SHP is concentrated in the southern part of the Republic on the Murgab and Tejen rivers and Karakumy canal.15
Figure 2. Small hydropower capacities 2013/2016/2019 Turkmenistan (MW)
0 300 600 900 1200 1500
PotentialCapacity
Installed Capacity
1,300 1,30023.0
1.25.05.0
WSHPDR 2019WSHPDR 2016WSHPDR 2013
Source: UNDP,15 WSHPDR 2016,20 WSHPDR 2013,29 CIS Energy Council33
Note: The comparison is between data from WSHPDR 2013, WSHPDR 2016 and WSHPDR 2019.
Currently, the Gindukush plant with three hydraulic turbines and a total capacity of 1.2 MW is the only operating SHP plant in the country. Two other plants, Kaushut-Bent of 0.6 MW and Kolkhoz-Bent of 3.2 MW, have been reported to be developed by the European Bank for Reconstruction and Development (EBRD) under the Renewable Energy Initiative, however, no progress has been made as of 2018.21,29 Furthermore, there are several hydropower projects proposed in Turkmenistan for development, as shown in Table 3 and Table 4.

30
World Small HydropoWer development report 2019
Table 3. Proposed programme for small hydropower development in Turkmenistan
Type of construction Quantity
Potential capacity
(MW)Note Region
Construc-tion and rehabilitation of existing hydropower plants
3 4.7
Mostly former rural hydropower
plants of capacity between
0.8 MW and 2.7 MW
Lolontan region on Murgab
River
Addition of hydropower plants to water management projects
6 52.3
Hydropower plants of capacity
between 2.6 MW and 15
MW
South Turkmenistan,
Karakumy Canal, Murgab
and Tenjen Rivers
Total 9 57
Source: WSHPDR 201620
As part of technical cooperation with the European Commission, Turkmenistan signed a financial agreement under the Efficient Energy Programme for Central Asia (CASEP): Renewable Energy Sources – Programme of Energy Efficiency.22 The program carried out between 2014 and 2015 included three main components:• Support with policy design and formulation to promote
energy efficiency seminars and renewable energy sources promotion at national and regional levels;
• Professional development of local partners in energy efficiency and renewable energy policies and instruments;
• Ensure the implementation of sustainable pilot projects in the fields of energy efficiency and renewable energy.
Table 4. Priority hydropower projects in Turkmenistan
Project Potential capacity (MW) Location
Hauznan reservoir HPP 11.7 Karakumy Canal,
Mary
Kopetdag reservoir HPP 15 Karakumy Canal,
Ashkhabad
Saryyazin reservoir HPP 12 Murgab River, Mary
Tashkeprin HPP 7 Murgab River, Mary
Source: WSHPDR 201620
The Kara Kum Canal is an important source of water for Turkmenistan. Water flows through the canal into the desert, where high temperatures lead to high evaporation rates. In similar environments, the use of photovoltaic panels has been proposed to reduce evaporation while producing energy.23 This energy can be input into the grid or fed to pumping stations either for irrigation or for energy storage, in combination with small reservoirs and water turbines.
Renewable energy policy
Turkmenistan has abundant natural gas reserves and its gas-fuelled power production capacities are growing. Conversely, the deployment of renewable energy has remained rather slow. It is foreseen, that by 2030 renewable energy sources will be contributing less than 1 per cent to the country’s energy mix. Despite the local low energy prices, the Government has shown interest in the improvement of energy efficiency and the integration of new technologies.24 However, only some minor renewable energy projects have been carried out despite a significant technical potential of renewable energy resources (Table 5).9,25
Table 5.Estimated potential of renewable energy resources in Turkmenistan
Resource Technical potential (MW)
Solar power 655,000
Wind power 10,000
SHP (up to 10 MW) 1,300
Biomass -
Total 666,300
Source: CIS Energy Council (2018)33
There is no specific policy or programme for the promotion of renewable energy solutions in the country. However, the Law on Energy Saving, which is currently being drafted, covers measu-res to reduce greenhouse gas emissions and partly covers rene-wable energy solutions.
A 2014 decree by the President of Turkmenistan called for the creation of the Solar Energy Institute within the Academy of Sciences of Turkmenistan, which is intended to explore the potential of renewable energy sources in the country, improve scientific and technological research and introduce relevant scientific innovations in the industries. The Organization for Se-curity and Cooperation in Europe (OSCE) aims to foster solar power generation in the country through cooperation with the Institute and knowledge sharing in order to implement a road map for solar energy development.27,28
Barriers to small hydropower developmentThe main barriers to hydropower development are low energy prices and the lack of a regulatory framework and policies for the promotion of renewable energy.15
References
1. World Bank (2018). Country profile. Available from https://databank.worldbank.org/views/reports/reportwidget.aspx?Re-port_Name=CountryProfile&Id=b450fd57&tbar=y&dd=y&in-f=n&zm=n&country=TKM

31
3.1. CEN
TRA
L As
iA
2. Academy of Sciences of Turkmenistan (n.d.). Turkmenistan. Available from http://www.science.gov.tm/turkmenistan/
3. Weather Online (n.d.) Turkmenistan. Available from http://www.weatheronline.co.uk/reports/climate/Turkmenistan.htm
4. Nations Encyclopedia (n.d.). Turkmenistan – Topography. Avail-able from http://www.nationsencyclopedia.com/Asia-and-Ocea-nia/Turkmenistan-LOCATION-SIZE-AND-EXTENT.html
5. Climatemps.com (2012). Turkmenistan. Available From http://www.turkmenistan.climatemps.com/
6. U.S. Library of Congress (n.d). Rivers. Available from http://coun-trystudies.us/turkmenistan/8.htm
7. United Nations Food and Agriculture Organization (2014). Turk-menistan. Available from http://www.fao.org/nr/water/aquastat/countries_regions/tkm/index.stm
8. Elevation map for rivers. Turkmenistan. Available from https://elevationmap.net/turkmenistan
9. Turkmenportal.com (2017). Electricity sector of Turkmenistan: achievements and prospects of development. Available from https://turkmenportal.com/blog/11652/elektroenergetika-turk-menistana-dostizheniya-i-perspektivy-razvitiya
10. IEEJ (2017). Turkmenistan Country Report. Available from https://eneken.ieej.or.jp/data/6877.pdf
11. BP Statistical Review of World Energy 2016. Available from https://www.bp.com/content/dam/bp/pdf/energy-economics/statistical-review-2016/bp-statistical-review-of-world-energy-2016-full-report.pdf
12. Energy Information Agency (2015). Balances Statistics. Available from http://www.iea.org/statistics/statisticssearch/report/?-year=2015&country=TURKMENIST&product=Balances
13. World Energy Council (2016). Energy Resources. Available from https://www.worldenergy.org/data/resources/country/turkmen-istan/hydropower/
14. CEIC (2018). Turkmenistan natural gas: exports. Available from https://www.ceicdata.com/en/indicator/turkmenistan/natu-ral-gas-exports
15. UNDP Eurasia Report (n.d.). Turkmenistan. Available from http://www.eurasia.undp.org/content/dam/rbec/docs/Turkmen-istan.pdf
16. Energy Information Agency, Beta database (2014). Total Pe-troleum and Other Liquids Production - 2014. Available from https://www.eia.gov/beta/international/country.cfm?iso=TKM
17. Enerdata (2013). Turkmenistan unveils power sector strategy to 2030. Available from https://www.enerdata.net/publications/daily-energy-news/turkmenistan-unveils-power-sector-strate-gy-2030.html
18. State News Agency of Turkmenistan (2015) President of Turk-menistan reviews the project of a combined-cycle power plant. 24 June 2015. Available from http://www.turkmenistan.gov.tm/_eng/?id=4925
19. IPP Journal Report (2018). Available from http://www.ippjour-nal.com/news/agreement-signed-for-4000-mw-turkmenistan-af-ghanistan-pakistan-transmission-project
20. Xialei, C., Singh, P. R., Xianlai, W., and Kremere, E., eds. (2016). World Small Hydropower Development Report 2016. United Nations Industrial Development Organization; Interna-tional Center on Small Hydro Power. Available from www.small-hydroworld.org.
21. Ebrdrenewables (2011). Projects. Available from ebrdrenewables.com/sites/renew/Lists/Projects/Public%20View.aspx
22. CASEP Program financed by the European Union (2014). Avail-able from http://www.inogate.org/documents/INFO_about_CASEP_for_INOGATE.pdf
23. Manipadma Jena Report (2015). India builds solar plants atop canals to save land, water. Available from https://in.reuters.com/article/india-solar/india-builds-solar-plants-atop-canals-to-save-land-water-idINKBN0KP0ZO20150116
24. Zoi Environment Network (2015). Turkmenistan Climate Facts and Policy. Available from https://wedocs.unep.org/bitstream/handle/20.500.11822/9864/-Turkmenistan_climate_facts_and_policy_policies_and_processes-2015country_scorecards_for_cli-mate_policy_Turkmenistan.pdf.pdf?sequence=3&isAllowed=y
25. Clover, I. (2014). Turkmenistan plans solar energy institute, PV Magazine, 17 June 2014. Available from http://www.pv-maga-zine.com/news/details/beitrag/turkmenistan-plans-solar-ener-gy-institute-_100015441/#ixzz3Qq2w2ZQS
26. UNDP Turkmenistan (2017). Annual Work Plan. Available from https://info.undp.org/docs/pdc/Documents/TKM/EERB%20AWP%202017%20signed%20Eng.pdf
27. Turkmenistan.ru (2017). New research institutes created in Turkmenistan. Available from http://www.turkmenistan.ru/en/articles/17733.html
28. OSCE Report (2014). Available from https://www.osce.org/cen-tre-in-ashgabat/312586
29. LIU, H., Masera, D. and Esser, L., eds. (2013). World Small Hy-dropower Development Report 2013, United Nations Industrial Development Organization; International Center on Small Hy-dro Power.
30. News Central Asia, Turkmenistan steps forward with cou-rageous avant-garde policies – Social contract redefined, 11 October 2017. Available from http://www.newscentralasia.net/2017/10/11/turkmenistan-steps-forward-with-coura-geous-avant-garde-policies-social-contract-redefined/
31. Ministry of Energy (2016). About the Ministry. Available from http://minenergo.gov.tm/ru/node/3
Export.gov (2016). Power Generation. Available from https://www.export.gov/article?id=Turkmenistan-Power-Generation
32. Shumskaya, E. (2013). Electric energy of Trukmenistan – direc-tion of development. Available from http://turkmenistan.gov.tm/?id=3941
33. CIS Energy Council (2017). Analytical review of renewable ener-gy development roadmap in CIS countries. Available from http://energo-cis.ru/wyswyg/file/rgos/RGOS_20170516-18/%D0%9F%D1%80%D0%B8%D0%BB%D0%BE%D0%B6%D0%B5%D0%B-D%D0%B8%D0%B5_4.pdf
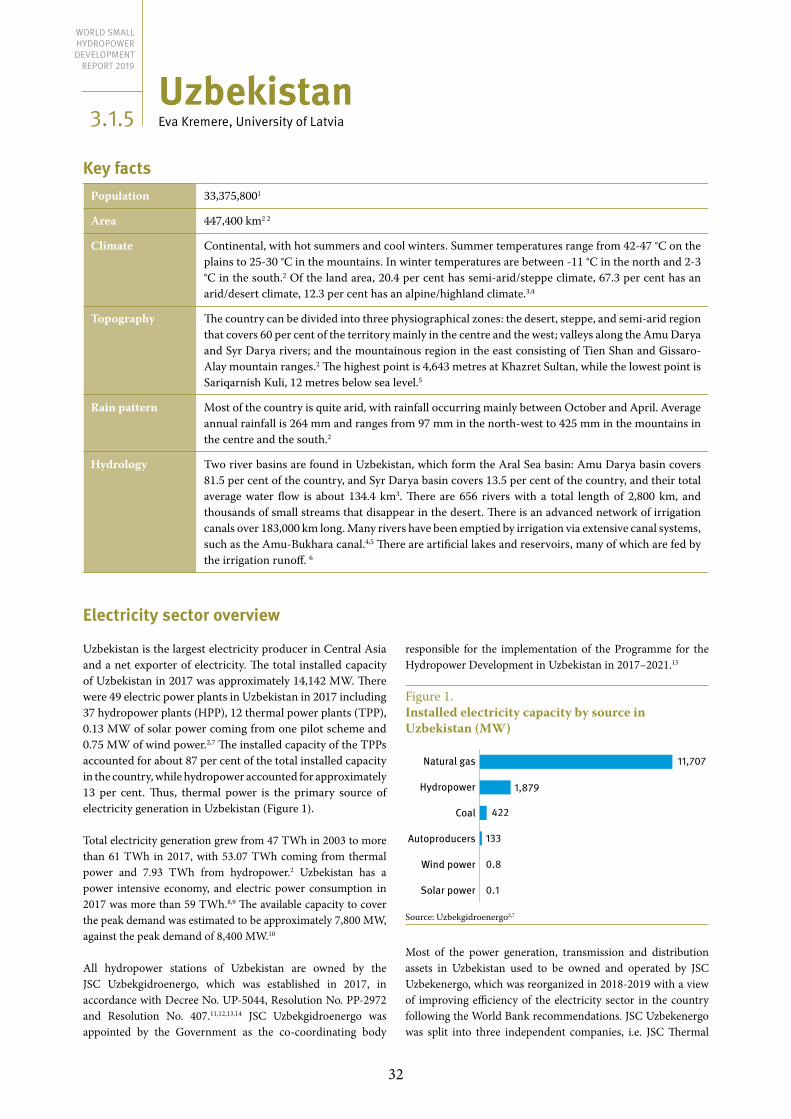
32
UzbekistanEva Kremere, University of latvia
Key factsPopulation 33,375,8001
Area 447,400 km2 2
Climate Continental, with hot summers and cool winters. Summer temperatures range from 42-47 °C on the plains to 25-30 °C in the mountains. In winter temperatures are between -11 °C in the north and 2-3 °C in the south.2 Of the land area, 20.4 per cent has semi-arid/steppe climate, 67.3 per cent has an arid/desert climate, 12.3 per cent has an alpine/highland climate.3,4
Topography The country can be divided into three physiographical zones: the desert, steppe, and semi-arid region that covers 60 per cent of the territory mainly in the centre and the west; valleys along the Amu Darya and Syr Darya rivers; and the mountainous region in the east consisting of Tien Shan and Gissaro-Alay mountain ranges.2 The highest point is 4,643 metres at Khazret Sultan, while the lowest point is Sariqarnish Kuli, 12 metres below sea level.5
Rain pattern Most of the country is quite arid, with rainfall occurring mainly between October and April. Average annual rainfall is 264 mm and ranges from 97 mm in the north-west to 425 mm in the mountains in the centre and the south.2
Hydrology Two river basins are found in Uzbekistan, which form the Aral Sea basin: Amu Darya basin covers 81.5 per cent of the country, and Syr Darya basin covers 13.5 per cent of the country, and their total average water flow is about 134.4 km3. There are 656 rivers with a total length of 2,800 km, and thousands of small streams that disappear in the desert. There is an advanced network of irrigation canals over 183,000 km long. Many rivers have been emptied by irrigation via extensive canal systems, such as the Amu-Bukhara canal.4,5 There are artificial lakes and reservoirs, many of which are fed by the irrigation runoff. 6
Electricity sector overview
Uzbekistan is the largest electricity producer in Central Asia and a net exporter of electricity. The total installed capacity of Uzbekistan in 2017 was approximately 14,142 MW. There were 49 electric power plants in Uzbekistan in 2017 including 37 hydropower plants (HPP), 12 thermal power plants (TPP), 0.13 MW of solar power coming from one pilot scheme and 0.75 MW of wind power.2,7 The installed capacity of the TPPs accounted for about 87 per cent of the total installed capacity in the country, while hydropower accounted for approximately 13 per cent. Thus, thermal power is the primary source of electricity generation in Uzbekistan (Figure 1).
Total electricity generation grew from 47 TWh in 2003 to more than 61 TWh in 2017, with 53.07 TWh coming from thermal power and 7.93 TWh from hydropower.2 Uzbekistan has a power intensive economy, and electric power consumption in 2017 was more than 59 TWh.8,9 The available capacity to cover the peak demand was estimated to be approximately 7,800 MW, against the peak demand of 8,400 MW.10
All hydropower stations of Uzbekistan are owned by the JSC Uzbekgidroenergo, which was established in 2017, in accordance with Decree No. UP-5044, Resolution No. PP-2972 and Resolution No. 407.11,12,13,14 JSC Uzbekgidroenergo was appointed by the Government as the co-coordinating body
responsible for the implementation of the Programme for the Hydropower Development in Uzbekistan in 2017–2021.15
Figure 1. Installed electricity capacity by source in Uzbekistan (MW)
11,707
1,879
422
133
0.8
0.1
Natural gas
Hydropower
Coal
Autoproducers
Wind power
Solar power
Source: Uzbekgidroenergo2,7
Most of the power generation, transmission and distribution assets in Uzbekistan used to be owned and operated by JSC Uzbekenergo, which was reorganized in 2018-2019 with a view of improving efficiency of the electricity sector in the country following the World Bank recommendations. JSC Uzbekenergo was split into three independent companies, i.e. JSC Thermal
3.1.5
World Small HydropoWEr dEvElopmEnt
rEport 2019

33
3.1. CEN
TRA
L As
iA
Power Plants, JSC Uzbekistan National Electric Power Networks and JSC Regional Electric Power Networks.16 The hydropower assets of JSC Uzbekenergo were transferred to Uzbekgidroenergo in 2017. All these companies are also state-owned, but there are plans for the privatization of the energy sector in the country.16
Uzbekistan used to be a part of the Central Asia Integrated Power System (CAIPS), which was established for a mutual power trade of the Central Asian republics of the Soviet Union. In 2009 Uzbekistan stopped participating in it, although the strong interconnections between Uzbekistan and other Central Asian countries remained functional. Currently, Uzbekistan only receives some power from the Kyrgyz Republic and also exports a small amount of electricity to Afghanistan.8
All consumers in Uzbekistan are connected to the centralized power supply system, except for some remote rural areas that rely mostly on off-grid power generation.17 The power transmission and distribution lines at all voltages extend over 235,000 km and are of an average age of 30 years.8,18 Transmission and distribution losses are high at more than 20 per cent of net generation.18 Aging infrastructure and insufficient investments have increasingly resulted in the power supply reliability problems. Periodic failures of old transmission and distribution infrastructure and transmission capacity bottlenecks are frequently resulting in electricity supply disruptions.8,19
The Government of Uzbekistan recognizes these challenges. Therefore, among its high priority goals are reforms in the energy sector, with the aim of attracting foreign investment funds for the joint stock companies to carry out reconstruction, modernization and further development of power generating facilities and power grids.20 The new Roadmap for the sector was approved in 2018 to increase generating capacity, modernize electrical networks, improve metering and control of electricity consumption in 2018-2020. The roadmap provides for the implementation of seven investment projects for the modernization of existing and commissioning of new generating capacities of 1,984 MW and a project cost of US$ 2.6 billion.9 The long-term plans include significantly increasing the capacities of TPPs, HPPs and other renewable energy sources, and building the first nuclear generation plant.21,22
In November 2018, the average tariff for household end customers increased from 228.6 UZS/kWh (0.027 US$/kWh) to 250 UZS/kWh (0.03 US$/kWh) and from June 2019 it will be 280 UZS/kWh (0.034 US$/kWh).23 The Government introduced a long-term tariff policy for the electric power industry up to 2030 which provides for the financial stability and investment potential of the industry.24
Small hydropower sector overview
The definition of small hydropower (SHP) in Uzbekistan is up to 30 MW as stated in the Law of the Republic of Uzbekistan ‘On the Use of Renewable Energy Sources’ and the ‘Programme of actions for further development of renewable energy and increase of energy efficiency in 2017-2020’.25,26
There were over 250 SHP plants up to 30 MW at the beginning of the 1960s operating without a connection to the national grid. However, most of the old SHP plants are out of operation now.27,28 In 2017, there were 27 SHP plants with installed capacities up to 30 MW and a total installed capacity of about 262 MW (Table 1). This included 15 SHP plants with installed capacities up to 10 MW, whose combined installed capacity was 75.8 MW. The technical potential of SHP up to 30 MW was estimated to be about 1,392 MW, indicating that 18.8 per cent has been developed (Figure 2).8,29 No data on the potential of SHP up to 10 MW is currently available.
Figure 2. Small hydropower capacities up to 30 MW in 2019 in Uzbekistan (MW)
1,392
262
Potential Capacity
Installed CapacityWSHPDR 2019
Source: CIS Electric Power Council,8 CER & UNDP29
Between the World Small Hydropower Development Report (WSHPDR) 2016 and WSHPDR 2019, installed capacity up to 10 MW has increased by 8 per cent (Figure 3).
Figure 3. Small hydropower capacities 2013/2016/2019 in Uzbekistan (MW)
0 500 1000 1500 2000
PotentialCapacity
Installed Capacity
N/A 1,180 1,760
76 71 56
WSHPDR 2019WSHPDR 2016WSHPDR 2013
Source: CIS Electric Power Council,8 CER & UNDP,29 WSHPDR 2016,30 WSHPDR 201331
Note: The comparison is between data from WSHPDR 2013, WSHPDR 2016 and WSHPDR 2019.
Table 1.Installed capacities of small hydropower in Uzbekistan
Capacity (MW) Number of SHP plants
SHP up to 30 MW
Irrigation canals 194.5 22
Minor rivers 67.1 5
Reservoirs - -
Total 261.6 27
SHP up to 10 MW
Irrigation canals 71.1 13
Minor rivers 4.7 2
Reservoirs - -
Total 75.8 15
Source: CIS Electric Power Council,8 CER & UNDP29
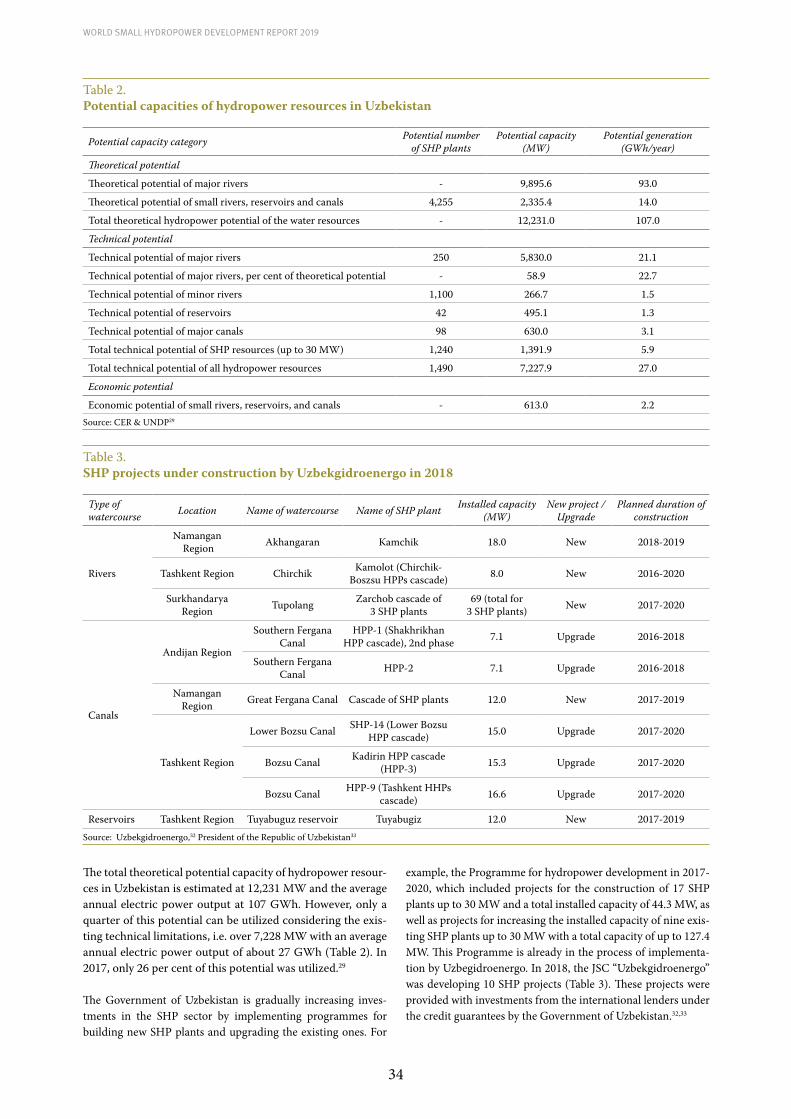
34
World Small HydropoWer development report 2019
Table 2.Potential capacities of hydropower resources in Uzbekistan
Potential capacity category Potential number of SHP plants
Potential capacity (MW)
Potential generation (GWh/year)
Theoretical potential
Theoretical potential of major rivers - 9,895.6 93.0
Theoretical potential of small rivers, reservoirs and canals 4,255 2,335.4 14.0
Total theoretical hydropower potential of the water resources - 12,231.0 107.0
Technical potential
Technical potential of major rivers 250 5,830.0 21.1
Technical potential of major rivers, per cent of theoretical potential - 58.9 22.7
Technical potential of minor rivers 1,100 266.7 1.5
Technical potential of reservoirs 42 495.1 1.3
Technical potential of major canals 98 630.0 3.1
Total technical potential of SHP resources (up to 30 MW) 1,240 1,391.9 5.9
Total technical potential of all hydropower resources 1,490 7,227.9 27.0
Economic potential
Economic potential of small rivers, reservoirs, and canals - 613.0 2.2Source: CER & UNDP29
Table 3.SHP projects under construction by Uzbekgidroenergo in 2018
Type of watercourse Location Name of watercourse Name of SHP plant Installed capacity
(MW)New project /
UpgradePlanned duration of
construction
Rivers
Namangan Region Akhangaran Kamchik 18.0 New 2018-2019
Tashkent Region Chirchik Kamolot (Chirchik- Boszsu HPPs cascade) 8.0 New 2016-2020
Surkhandarya Region Tupolang Zarchob cascade of
3 SHP plants69 (total for
3 SHP plants) New 2017-2020
Canals
Andijan Region
Southern Fergana Canal
HPP-1 (Shakhrikhan HPP cascade), 2nd phase 7.1 Upgrade 2016-2018
Southern Fergana Canal HPP-2 7.1 Upgrade 2016-2018
Namangan Region Great Fergana Canal Cascade of SHP plants 12.0 New 2017-2019
Tashkent Region
Lower Bozsu Canal SHP-14 (Lower Bozsu HPP cascade) 15.0 Upgrade 2017-2020
Bozsu Canal Kadirin HPP cascade (HPP-3) 15.3 Upgrade 2017-2020
Bozsu Canal HPP-9 (Tashkent HHPs cascade) 16.6 Upgrade 2017-2020
Reservoirs Tashkent Region Tuyabuguz reservoir Tuyabugiz 12.0 New 2017-2019
Source: Uzbekgidroenergo,32 President of the Republic of Uzbekistan33
The total theoretical potential capacity of hydropower resour-ces in Uzbekistan is estimated at 12,231 MW and the average annual electric power output at 107 GWh. However, only a quarter of this potential can be utilized considering the exis-ting technical limitations, i.e. over 7,228 MW with an average annual electric power output of about 27 GWh (Table 2). In 2017, only 26 per cent of this potential was utilized.29
The Government of Uzbekistan is gradually increasing inves-tments in the SHP sector by implementing programmes for building new SHP plants and upgrading the existing ones. For
example, the Programme for hydropower development in 2017-2020, which included projects for the construction of 17 SHP plants up to 30 MW and a total installed capacity of 44.3 MW, as well as projects for increasing the installed capacity of nine exis-ting SHP plants up to 30 MW with a total capacity of up to 127.4 MW. This Programme is already in the process of implementa-tion by Uzbegidroenergo. In 2018, the JSC “Uzbekgidroenergo” was developing 10 SHP projects (Table 3). These projects were provided with investments from the international lenders under the credit guarantees by the Government of Uzbekistan.32,33

35
3.1. CEN
TRA
L As
iA
Additionally, the Government announced a programme for the expansion of the country’s hydropower capacity through the construction of 37 pilot micro-hydropower plants with a com-bined installed capacity of 6.1 MW.34
Renewable energy policy
The country has a legal framework created in line with inter-national standards aimed at the rational use of natural resour-ces.35 In particular, in 2019 the Parliament of the Republic of Uzbekistan approved Law of the Republic of Uzbekistan ‘On the Use of Renewable Energy Sources’.25 This law introduced some financial and tax privileges for renewable energy projects. Se-veral state programmes and national action plans are also being implemented in this area.26,36 Uzbekistan has ratified major UN conventions and other international instruments in the field of environmental protection and sustainable development.
To expand the use of renewable energy resources, reduce energy intensity of production and implement the Strategy of Actions on Five Priority Directions of Development of the Republic of Uzbekistan, Presidential Decree No. PP-3012 of 26 May 2017 ‘On the Programme of Actions for the Further Development of Renewable Energy and Energy Efficiency in Sectors of the Economy and Social Services in 2017-2021’ was adopted.26 This programme is currently under implementation. In particular, in 2018 the Government signed a contract with a Canadian com-pany SkyPower Global for the development of a number of solar power plants with a total installed capacity of 1 GW.37
Uzbekistan has a significant renewable energy potential that in-cludes hydropower, solar and wind power (Table 4), but these fi-gures require an update based on a comprehensive study. Studies of renewable energy potential are included in the relevant state programmes and are already under way.26,37
Table 4.Estimated technical potential of renewable energy sources in Uzbekistan
Resource Technical potential (MW)
Solar power 593,000
Hydropower 7,228
Wind power 1,600
Biomass 800
Total 602,628
Source: CER & UNDP,29 CIS Electric Power Council8
A selective review of the current use of alternative energy sour-ces in Uzbekistan carried out in April 2018 by the Uzbekistan State Committee for Statistics found that about 3.9 per cent of enterprises in the country had installed one of the types of rene-wable energy power plants, with biogas installations being most popular (2.7 per cent). There was a small increase in the use of alternative sources of energy in comparison with 3.7 per cent in 2017.35
Barriers to small hydropower developmentThe key challenges for the development of SHP are:• High availability of thermal power sources such as natural
gas and coal;• Aging energy infrastructure;• Lack of financing and investment in the renewable energy
sector;• Low electricity prices;• Lack of clear support mechanisms for SHP development;• Lack of feasibility studies and available data.
References
1. State Committee of the Republic of Uzbekistan on Statistics (2019). Demographic Situation. Available from https://stat.uz/ru/press-tsentr/novosti-komiteta/5646-22042019-2
2. Uzbekgidroenergo (2018). Uzbekistan Country Report. Available from http://www.hrcshp.org/en/image/2018/Uzbekistan.pdf
3. United Nations Food and Agriculture Organization (2014). Uz-bekistan. Available from http://www.fao.org/nr/water/aquastat/countries_regions/uzb/index.stm.
4. ClimaTemps.com (n.d). Climate, Average Weather of Uzbekistan. Available from http://www.uzbekistan.climatemps.com/.
5. Oriental Express Central Asia (n.d.). Water resources of Uzbeki-stan. Available from http://www.orexca.com/rivers_lakes_uz-bekistan.shtml.
6. Food and Agriculture Organization of the United Nations, AQUASTAT (2014). Uzbekistan. Available from http://www.fao.org/nr/water/aquastat/countries_regions/UZB/
7. Uzbekenergo (n.d.). The current state and development pros-pects of the electricity sector of the Republic of Uzbekistan. Available from https://energycharter.org/fileadmin/Documents-Media/Events/Uzbekenergo__Uzbekistan_-_Abdurashid_Mir-zaev.pdf
8. CIS Electric Power Council (2018). Electric Power in Uzbekistan. Available from http://energo-cis.ru/uzbekistan/
9. AzerNews (2018). Uzbek leader instructs to modernize power industry. Available from https://www.azernews.az/re-gion/139692.html
10. Asian Development Bank (2017). Uzbekistan: Power Generation Efficiency
Improvement Project. Available from https://www.adb.org/sites/de-fault/files/project-documents/49253/49253-003-pam-en.pdf
11. President of Republic of Uzbekistan (2018). Decree from 18 May 2017 ‘On Establishing JSC Uzbekenergo’. Available from http://lex.uz/ru/docs/3210104?query=%D1%83%D0%B7%D0%B1%D0%B5%D0%BA%D0%B3%D0%B8%D0%B4%D1%80%D0%BE%D1%8D%D0%BD%D0%B5%D1%80%D0%B3%D0%BE
12. Kommersant.uz (2017). Uzbekgidroenergo is established in Uzbekistan. Available from http://kommersant.uz/v-uzbekis-tane-sozdana-kompaniya-uzbekenergo/
13. Uzbekgidroenergo (2018). Activity. Available from http://www.uzgidro.uz/web/site/operation.html
14. Norma.uz (2017). Hydropower plants are transferred to JSC Uzbekgidroenergo. Available from https://www.norma.uz/novoe_v_zakonodatelstve/gidroelektrostancii_pereshli_k_ao_uz-bekgidroenergo

36
World Small HydropoWer development report 2019
15. Government of Republic Uzbekistan (2019). Resolution from 28 March 2019 №PP-4249 ‘On the strategy of further development and reform of the electric power industry’. Available from http://lex.uz/ru/docs/4257085?query=%D1%83%D0%B7%D0%B1%D0%B5%D0%BA%D0%B3%D0%B8%D0%B4%D1%80%D0%BE%D1%8D%D0%BD%D0%B5%D1%80%D0%B3%D0%BE
16. KUN.UZ (2018). Vafayev announced preparations for a large-scale privatization in Uzbekistan. Available from https://kun.uz/ru/27961593
17. Asian Development Bank (2017). Proposed Loan and Adminis-tration of Technical Assistance Grant. Republic of Uzbekistan: Power Generation Efficiency Improvement Project. Report and Recommendation of the President
to the Board of Directors. Available from https://www.adb.org/proj-ects/49253-003/main#project-documents
18. The World Bank (2013). Uzbekistan Energy/Power Sector Is-sues Note. Available from https://www.ekonomi.gov.tr/portal/content/conn/UCM/uuid/dDocName:EK-203124;jsessionid=o-qbzAKYEhBLm-J6UI04yPblsMIyl4f0R6tcNR43eoORy01G_vp68!1579184086
19. KUN.UZ (2019). Uzbekenergo announced reasons for power cuts in the remote regions. Available from https://kun.uz/ru/news/2018/12/27/uzbekenergo-ozvuchilo-prichiny-otklyucheni-ya-sveta-v-otdalennyx-rayonax
20. President of Republic of Uzbekistan (2018). Decree from from 23 October 2018 №PP-3981 ‘About measures to accelerate develop-ment and provision of the financial stability of the electric power industry’. Available from http://xs.uz/ru/post/developenergy
21. NCA (2018). Russian company to build first nuclear power plant of Uzbekistan – some aspects. Available from http://www.newscentralasia.net/2018/10/14/russian-company-to-build-first-nuclear-power-plant-of-uzbekistan-some-aspects/
22. Energy Charter (2018). Uzbekistan’s energy sector. Opportunities for international cooperation. Available from https://energychar-ter.org/fileadmin/DocumentsMedia/News/20181004_Uzbeki-stan_s_energy_sector.pdf
23. UzDaily (2018). Uzbekistan to hike electricity prices from 16 November. Available from https://www.uzdaily.com/arti-cles-id-46412.htm
24. Government of the Republic of Uzbekistan (2019). Resolution from 13 April 2019 №310 ‘Main directions of the tariff policy in the electric power industry’. Available from http://lex.uz/ru/docs/4289882?query=%D1%83%D0%B7%D0%B1%D0%B5%D0%BA%D0%B3%D0%B8%D0%B4%D1%80%D0%BE%D1%8D%D0%BD%D0%B5%D1%80%D0%B3%D0%BE
25. Parliament of the Republic of Uzbekistan (2019). Law of the Republic of Uzbekistan ‘On the Use of Renew-able Energy Sources. Approved in May 2019. Available from https://nrm.uz/contentf?doc=589176_zakon_res-publiki_uzbekistan_ot_21_05_2019_g_n_zru-539_ob_is-polzovanii_vozobnovlyaemyh_istochnikov_energii_(prin-yat_zakonodatelnoy_palatoy_16_04_2019_g_odobren_sen-atom_03_05_2019_g_)&products=1_vse_zakonodatelstvo_uz-bekistana
26. President of Republic of Uzbekistan (2017). Decree from 26 May 2017 №PP-3012 ‘On the Program of actions for further development of the renewable energy, and increase of the energy efficiency in the industry sectors and social areas in 2017-2021’. Available from http://www.lex.uz/docs/3221897?ON-DATE=06.04.2018
27. Uzbekhydroenergo (2018). Hydropower plants. Available from: http://www.gidroproekt.uz/index.php/ru/ob-ekty?limitstart=0
28. UN Sustainable Development Goals Department (2011). Uz-bekistan on the Way to Sustainable Development. Available from https://sustainabledevelopment.un.org/content/docu-ments/1034uzbekistan.pdf
29. Center for Economic Research and the United Nations Develop-ment Programme (2011). Alternative energy sources: opportuni-ties of use in Uzbekistan (Analytical report).
30. Xialei, C., Singh, P. R., Xianlai, W., and Kremere, E., eds. (2016). World Small Hydropower Development Report 2016. United Nations Industrial Development Organization; Interna-tional Center on Small Hydro Power. Available from www.small-hydroworld.org.
31. LIU, H., Masera, D. and Esser, L., eds. (2013). World Small Hy-dropower Development Report 2013, United Nations Industrial Development Organization; International Center on Small Hydro Power.
32. Uzbekgidroenergo (n.d.). Meetings, press conferences, seminars, round tables, and briefings. Available from http://uzgidro.uz/web/site/meetings.html
33. President of the Republic of Uzbekistan (2018). Addendum №8 to the Decree of the President of the Republic of Uzbekistan from 03.02.2018 №PP-3507 ‘Targeted program of the investment projects carried out in the Republic of Uzbekistan in 2018 un-der the State Guarantee for the foreign credits’. Available from https://nrm.uz/contentf?doc=551604_adresnaya_program-ma_investicionnyh_proektov_realizuemyh_s_privlecheniem_in-ostrannyh_kreditov_pod_gosudarstvennuyu_garantiyu_respub-liki_uzbekistan_v_2018_godu_(prilojenie_n_8_k_postanovleni-yu_prezidenta_ruz_ot_03_02_2018_g_n_pp-3507)&products=1_vse_zakonodatelstvo_uzbekistana
34. The Government of the Republic of Uzbekistan (2017). Resolu-tion №724 from 14 September 2017 ‘On the additional actions for increasing use of the hydropower potential of the Republic by implementation of the pilot micro hydropower plants’. Available from http://lex.uz/ru/docs/3340808?query=%D1%83%D0%B7%D0%B1%D0%B5%D0%BA%D0%B3%D0%B8%D0%B4%D1%80%D0%BE%D1%8D%D0%BD%D0%B5%D1%80%D0%B3%D0%BE
35. LexUZ Online (2019) List of the environmental laws and regula-tions of the Republic of Uzbekistan. Available from http://lex.uz/ru/search/nat?query=%D0%BF%D1%80%D0%B8%D1%80%D0%BE%D0%B4%D0%BD%D1%8B%D0%B5%20%D1%80%D0%B5%D1%81%D1%83%D1%80%D1%81%D1%8B
36. Gazeta.uz (2013). The president signed a decree on the develop-ment of alternative energy sources. 1 March 2013. Available from http://www.gazeta.uz/2013/03/01/energy/.
37. Uzbekenergo (n.d.). Alternative energy sources. Available from http://www.uzbekenergo.uz/ru/activities/alternative-ener-gy-sources/
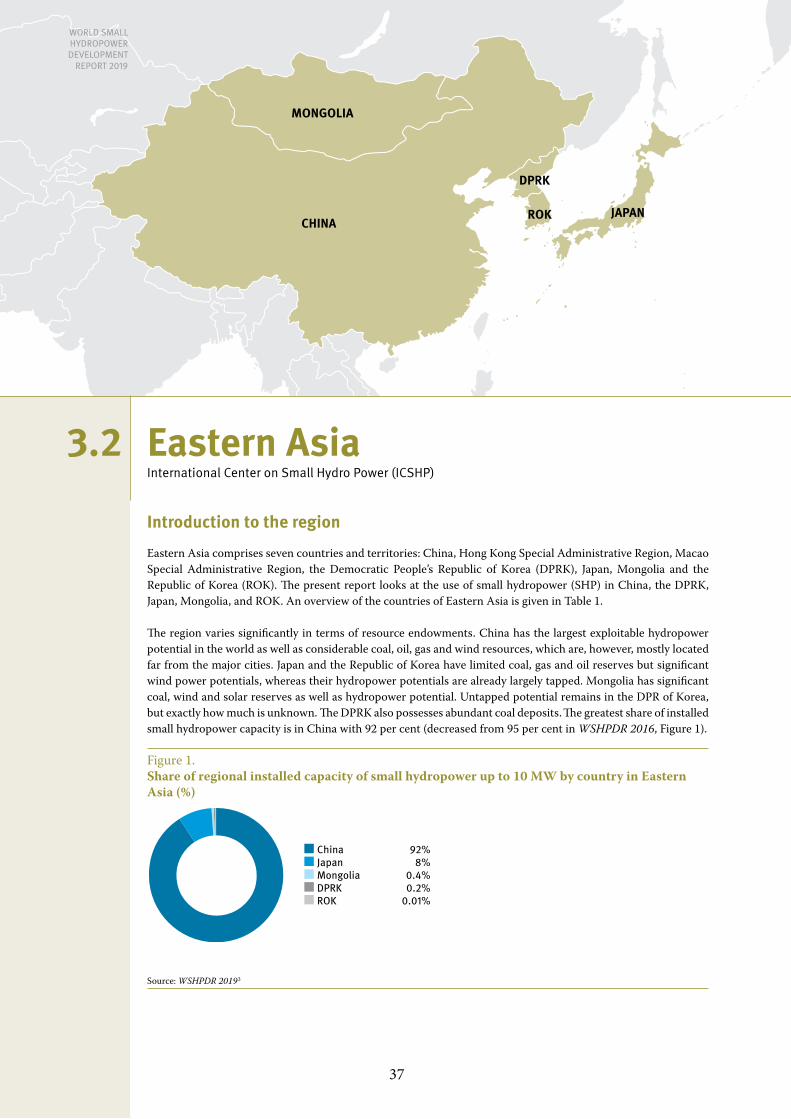
37
MONGOLIA
CHINA
DPRK
ROK JAPAN
Eastern AsiaInternational Center on Small Hydro power (ICSHp)
Introduction to the region
Eastern Asia comprises seven countries and territories: China, Hong Kong Special Administrative Region, Macao Special Administrative Region, the Democratic People’s Republic of Korea (DPRK), Japan, Mongolia and the Republic of Korea (ROK). The present report looks at the use of small hydropower (SHP) in China, the DPRK, Japan, Mongolia, and ROK. An overview of the countries of Eastern Asia is given in Table 1.
The region varies significantly in terms of resource endowments. China has the largest exploitable hydropower potential in the world as well as considerable coal, oil, gas and wind resources, which are, however, mostly located far from the major cities. Japan and the Republic of Korea have limited coal, gas and oil reserves but significant wind power potentials, whereas their hydropower potentials are already largely tapped. Mongolia has significant coal, wind and solar reserves as well as hydropower potential. Untapped potential remains in the DPR of Korea, but exactly how much is unknown. The DPRK also possesses abundant coal deposits. The greatest share of installed small hydropower capacity is in China with 92 per cent (decreased from 95 per cent in WSHPDR 2016, Figure 1).
Figure 1. Share of regional installed capacity of small hydropower up to 10 MW by country in Eastern Asia (%)
China 92%Japan 8%Mongolia 0.4%DPRK 0.2%ROK 0.01%
Source: WSHPDR 20193
3.2
World Small HydropoWEr dEvElopmEnt
rEport 2019
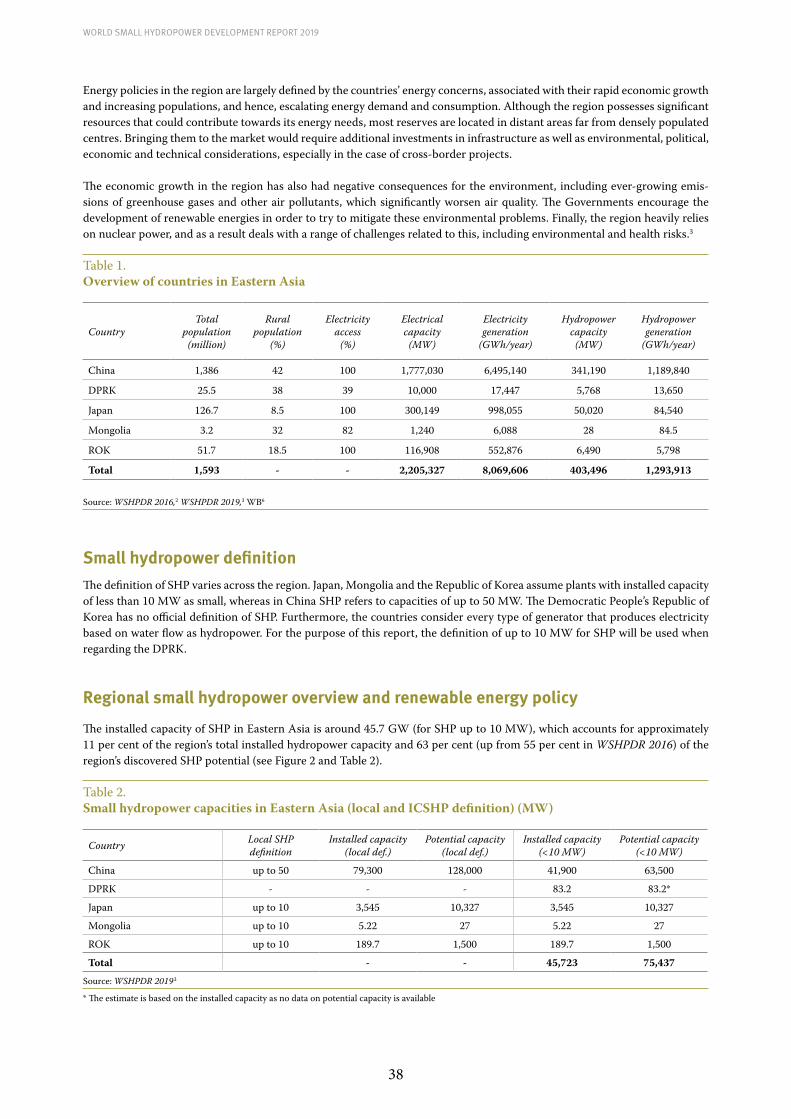
38
World Small HydropoWer development report 2019
Energy policies in the region are largely defined by the countries’ energy concerns, associated with their rapid economic growth and increasing populations, and hence, escalating energy demand and consumption. Although the region possesses significant resources that could contribute towards its energy needs, most reserves are located in distant areas far from densely populated centres. Bringing them to the market would require additional investments in infrastructure as well as environmental, political, economic and technical considerations, especially in the case of cross-border projects.
The economic growth in the region has also had negative consequences for the environment, including ever-growing emis-sions of greenhouse gases and other air pollutants, which significantly worsen air quality. The Governments encourage the development of renewable energies in order to try to mitigate these environmental problems. Finally, the region heavily relies on nuclear power, and as a result deals with a range of challenges related to this, including environmental and health risks.3
Table 1. Overview of countries in Eastern Asia
CountryTotal
population (million)
Rural population
(%)
Electricity access
(%)
Electrical capacity
(MW)
Electricity generation
(GWh/year)
Hydropower capacity
(MW)
Hydropower generation
(GWh/year)
China 1,386 42 100 1,777,030 6,495,140 341,190 1,189,840
DPRK 25.5 38 39 10,000 17,447 5,768 13,650
Japan 126.7 8.5 100 300,149 998,055 50,020 84,540
Mongolia 3.2 32 82 1,240 6,088 28 84.5
ROK 51.7 18.5 100 116,908 552,876 6,490 5,798
Total 1,593 - - 2,205,327 8,069,606 403,496 1,293,913
Source: WSHPDR 2016,2 WSHPDR 2019,3 WB6
Small hydropower definitionThe definition of SHP varies across the region. Japan, Mongolia and the Republic of Korea assume plants with installed capacity of less than 10 MW as small, whereas in China SHP refers to capacities of up to 50 MW. The Democratic People’s Republic of Korea has no official definition of SHP. Furthermore, the countries consider every type of generator that produces electricity based on water flow as hydropower. For the purpose of this report, the definition of up to 10 MW for SHP will be used when regarding the DPRK.
Regional small hydropower overview and renewable energy policy
The installed capacity of SHP in Eastern Asia is around 45.7 GW (for SHP up to 10 MW), which accounts for approximately 11 per cent of the region’s total installed hydropower capacity and 63 per cent (up from 55 per cent in WSHPDR 2016) of the region’s discovered SHP potential (see Figure 2 and Table 2).
Table 2.Small hydropower capacities in Eastern Asia (local and ICSHP definition) (MW)
Country Local SHP definition
Installed capacity (local def.)
Potential capacity (local def.)
Installed capacity (<10 MW)
Potential capacity (<10 MW)
China up to 50 79,300 128,000 41,900 63,500
DPRK - - - 83.2 83.2*
Japan up to 10 3,545 10,327 3,545 10,327
Mongolia up to 10 5.22 27 5.22 27
ROK up to 10 189.7 1,500 189.7 1,500
Total - - 45,723 75,437 Source: WSHPDR 20193
* The estimate is based on the installed capacity as no data on potential capacity is available

39
3.2. EAS
TERN
AS
IA
Figure 2. Utilized small hydropower potential by country in Eastern Asia (local SHP definition) (%)
Additional SHP potential
Installed SHP capacity
TOTA
L
ROK
Mon
golia
Japa
n
Chin
a
DPRK
0
20
40
60
80
100
Source: WSHPDR 20193
Note: This Figure illustrates data for local SHP definitions or the definition up to 10 MW in case of the absence of an official local one.
Note: For the DPRK, SHP additional potential is not known.
China is the regional leader in terms of both installed and potential SHP capacity (for both: up to 10 MW and 50 MW). Due to the support of the Government and the technological maturity of the domestic hydropower sector, SHP has developed rapidly in the country, with 47,498 SHP plants (up to 50 MW) widely distributed across the country as of 2017 (425 SHP plants more than in 2014). The total installed capacity of SHP up to 10 MW is 42 GW and of SHP up to 50 MW is 79.3 GW, of which approximately 60 per cent has been developed (see Figure 2). According to the national programme of SHP development, by 2030 it is expected to exceed 93 GW of total installed SHP capacity or 77.5 per cent of the potential; and by 2050, it is expected to reach 100 GW or 83 per cent of the potential. According to the Ministry of Water Resources, during the Thirteenth Five-Year Plan (2016-2020), the national plan for refurbishing China’s rural SHP projects, will aim to refurbish 2,333 old SHPs and complete an ecological mitigation plan for 2,110 SHPs.
The Democratic People’s Republic of Korea has an installed capacity of 83 MW for SHP up to 10 MW (see Figure 2). The country’s potential for SHP development is speculated to be significant due to its numerous rivers. However, no comprehensive data is available. The Government has encouraged the development of micro-hydropower as part of the national programme of rural energy development. In general, the Government’s energy policy focuses on the development of non-fossil fuel energy sources and aims to solve the issue of ageing infrastructure and transmission and distribution networks, as well as to improve rural energy supply.
Japan has a total SHP installed capacity of 3,545 MW, which is about 34 per cent of its potential (see Figure 3). The country has a long history of hydropower development. For a while, SHP has been considered inefficient, and thus had not been developed. In the 2000s, SHP again attracted attention as a solution to climate change and reduction of greenhouse gas emissions, and is now gaining new positions as a natural energy resource to be developed.
Mongolia has eleven SHP plants with capacities of up to 2 MW. Their combined installed capacity is 5 MW (19 per cent of its potential) (see Figure 2). As opposed to the two large hydropower plants existing in the country, SHP plants only serve isolated areas of the country and operate in the summer. Hydropower development in the country is mainly focused on large hydropo-wer, which is seen as a solution towards a better national energy security and energy independence. The Government aims to increase the use of renewable energy sources, particularly in remote areas, as well as to perform research and development in the field of renewable energy. However, there are no known plans for the further development of SHP.
The Republic of Korea has 190 MW of installed SHP capacity with 240 plants nationwide (see Figure 3). The technical potential of SHP from rivers and other water-related facilities (such as sewage treatment plants, water treatment systems, irrigation reservoirs, multi-purpose dams and irrigation dams) is estimated at 1,500 MW, of which 660 MW is economically feasible. Since the two oil crises in the 1970s, the Government has actively encouraged the development of renewable energy sources, including SHP. The goal is to replace 11 per cent of the primary energy supply with a new and renewable energy supply by 2035. There are a range of financial support mechanisms for the renewable energy industry. The Government provided KRW 35 billion (US$ 0.030 billion) of financial support between 2008 and 2015. The Government’s main focus is on automation and unmanned technology, small-scale turbine development and electricity technology.

40
World Small HydropoWer development report 2019
Three countries of the region introduced feed-in-tariffs (FITs). In Japan FITs were introduced in 2012. These are set for each renewable energy category, and are revised each year based on a degree of circulation and market conditions. Mongolia created a FIT system applicable to renewable energy generators in 2007. The tariffs are set by the Energy Regulatory Authority (ERA) within set limits for grid-connected and off-grid generators, according to energy type. China has FITs for solar, hydropower, wind and biomass. However, there is no unified FIT for SHP – each province establishes the benchmark price for SHP projects based on the average purchasing price of the provincial grid company.
Figure 3. Change in installed capacity of small hydropower from WSHPDR 2013 to 2019 by country in Eastern Asia (MW)
05,000
10,00015,00020,00025,00030,00035,00040,00045,00050,000
41,900
3,545189.7 83.2 5.22
45,723WSHPDR 2019WSHPDR 2016WSHPDR 2013
China Japan ROK DPRK Mongolia TOTAL
Source: WSHPDR 2013,1 WSHPDR 2016,2 WSHPDR 20193
Note: WSHPDR stands for World Small Hydropower Development Report.
Barriers to small hydropower developmentCountries in the region face various difficulties that might hinder SHP development.
China experiences technical and environmental difficulties as well as constraints associated with land compensation, labour costs and resettlement. For some rivers in the country, the environment has been damaged due to violations of land and water conservation rules by hydropower developers. Some rivers have been overexploited, causing the dehydration of some sections, which negatively impacts the drinking water supply downstream and the ecology of the whole river.
For the Democratic People’s Republic of Korea, a lack of financial resources is the main barrier to developing its SHP potential. The country also lacks locally produced hydropower generation equipment and automation.
Due to a 50-year break in SHP development, Japan lacks the skilled personnel and technology required for SHP’s successful development. This leads to insufficient capacity in site assessment, planning and design. Other constraints include the limited profitability of SHP projects, lack of sufficient facilities and conflicts over the water ownership.
The development of SHP in Mongolia is, first of all, hindered by the lack of interest in small-scale projects on the part of the Government, and its focus on large hydropower instead. Developers also experience difficulties due to the ambiguity of the licensing process and a lack of financial resources.
For the Republic of Korea, the major barriers are its topography, which does not allow high head turbine installation, the low level of development of the local SHP industry and the Government’s focus on photovoltaic and wind energy, which can lead to a reduction of financial support for SHP.

41
3.2. EAS
TERN
AS
IA
References
1. LIU, H., Masera, D. and Esser, L., eds. (2013). World Small Hydropower Development Report 2013. United Nations Industrial Development Organization; International Center on Small Hydro Power. Available from www.smallhydroworld.org.
2. Xialei, C., Singh, P. R., Xianlai, W., and Kremere, E., eds. (2016). World Small Hydropower Development Report 2016. United Nations Industrial Development Organization; International Center on Small Hydro Power. Available from www.smallhydroworld.org.
3. LIU, D., LIU, H., WANG, X., and Kremere, E., eds. (2019). World Small Hydropower Development Report 2019. United Nations Industrial Development Organization; International Center on Small Hydro Power. Available from www.smallhydroworld.org.
4. The International Journal on Hydropower & Dams (IJHD) (2015). World Atlas & Industry Guide, 2015. Aqua-Media International, Surrey, UK. Available from www.hydropower-dams.com.
5. Knoema (2015). Global Energy Statistical yearbook 2015. Available from https://knoema.com/GESY2015/global-energy-statistical-yearbook-2015.
6. World Bank (2017). Rural population (% of total population). Available from https://data.worldbank.org/indicator/SP.RUR.TOTL.ZS
7. Winston & Strawn (2014). Feed-In Tariff Handbook for Asian Renewable Energy Systems. Available from http://cdn2.winston.com/images/content/9/1/v2/91697/Feed-In-Tariff-Handbook-for-Asian-Renewable-Energy-Systems.pdf.

42
ChinaInternational Center on Small Hydro power (ICSHp)
Key facts Population 1,386,395,0001
Area 9,600,000 km2
Climate Extremely diverse, ranging from tropical in the southern parts to subarctic in the north. Minimum temperatures in winter (between December and February) range between –27 °C in northern Manchuria, –1 °C in the North China Plain and southern Manchuria, 4 °C along the middle and lower valleys of the Yangtze, and 16 °C farther south. Summer temperatures in southern and central China have a mean of approximately 27 °C in July. Northern China has a shorter hot period and much cooler nights.2
Topography China is roughly divided into two parts: lowlands in the east, which account for about 20 per cent of the total territory, and mountains and plateaus in the west, which constitute the remaining portion of the country. The highest mountain, and tallest in the world, is Mount Everest, situated in the Himalayas in the Tibet Autonomous Region, on the border with Nepal. Its summit is 8,848 metres above sea level. The lowest point in China is Ayding Lake, located in Xinjiang Uyghur Autonomous Region, situated at 154 metres below sea level.2
Rain pattern Given the country’s vastness, many degrees of latitude, and complex terrain, it has a variety of precipitation levels, including continental monsoon areas. Annual mean rainfall varies greatly across the country, from 0 mm in desert regions to 1,500 mm on the east coast, with precipitation levels usually peaking in the summer months between June and August.
Hydrology There over 1,500 rivers, each with a drainage area of over 1,000 km2. The great rivers of China gene-rally flow from west to east, flowing out into the Pacific. The largest river in China, the Yangtze, is approximately 5,525 km in length and drains an area of approximately 1.8 million km2. The main river in northern China and the second largest in the country is the Yellow River, at approximately 4,671 km in length. The valley of the Yellow River covers an area of 1.5 million km2.2
Electricity sector overview
By the end of 2017, total installed capacity in China had reached 1,777.03 GW. This consisted of 1,106.04 GW of thermal power, 341.19 GW of hydropower, 163.67 GW of wind power, 130.25 GW of grid-connected solar power and 35.82 GW of nuclear power. China has the largest installed capacity of hydropower in the world (see Figure 1).3
Figure 1. Installed electricity capacity by source in China (GW)
0 200 400 600 800 1000 1200
Thermal power
Hydro power
Wind power
Solar power
Nuclear power
1,106.0
341.2
163.7
130.3
35.8
Source: National Bureau of Statistics3
In 2017, total electricity generation was 6,495.14 TWh. Hydropower generation, at 1,189.84 TWh, accounts for 18.3 per cent of the total generation.3 Renewable energy generation
amounted to 1,697.9 TWh (26 per cent). Hydropower was still the main source of China’s renewable energy, which accounts for 70 per cent of total renewable energy generation.3
China has two grid-operating companies, the State Grid Corporation and the South China Grid Corporation. The national grid is divided into six parts. The Northeast China Grid, North China Grid, East China Grid, Central China Grid, and Northwest China Grid are managed by the State Grid Corporation, while the South China Grid is managed by the South China Grid Corporation. Provincial and municipal grid utilities are typically the sole buyers of power from generators, and they re-sell to customers and distribution companies in their service areas.4
The National Development and Reform Commission (NDRC) and the State Electricity Regulatory Commission (SERC) sha-re the responsibility for the regulation of the power sector of China. The NDRC’s responsibilities include investment, pri-cing and power plant approvals, while the SERC is respon-sible for the design and oversight of generation markets, and implementation of power sector reforms. The SERC also gives input to the NDRC on pricing and market reforms.4
3.2.1
World Small HydropoWEr dEvElopmEnt
rEport 2019

43
3.2. EAS
TERN
AS
IA
In July 2012, China adopted a Multistep Electricity Price Mechanism, which increased the consumer tariff in multiple steps as consumption level rose. Peak and valley time tariffs were also implemented. According to the National Energy Bureau, consumer tariffs vary between provinces. In 2017, the average national residence consumer tariff was approximately 0.53 CNY/kWh (US$ 0.07), and the average industrial tariff between approximately 0.59 CNY/kWh and 0.769 CNY/kWh (0.08-0.11 US$/kWh).5
Small hydropower sector overview
In China, small hydropower (SHP) refers to capacities of up to 50 MW (see Table 1). In 2017, there was a total installed SHP capacity of 79.3 GW and a total potential of approximately 128 GW, indicating that 62 per cent has already been developed. For SHP up to 10 MW there was an installed capacity of 41.87 GW, with an estimated total potential of 63.5 GW, indicating that 66 per cent has already been developed (Figure 2 and 3).6
Table 1 Classification of small hydropower in China
Definition Installed capacity (MW)
Small ≤ 50
Mini ≤ 2
Micro ≤ 0.1 Source: WSHPDR 20137
In comparison to data from the 2016 World Small Hydropower Development Report, the total potential for plants up to 50 MW has remained the same, while installed capacity has increased by approximately 8.3 per cent (see Figure 2).17 For plants up to 10 MW, the total potential has also remained the same while installed capacity has increased by approximately 5.2 per cent (see Figure 3).6
Hydropower in China is a mature technology, and SHP an abundant resource. In 2017, there were approximately 47,498 SHP plants, accounting for 23.2 per cent of total installed hydropower capacity. Annual generation between years 2011 and 2015 was 24.8 TWh, or 2.1 per cent of the total electricity generation of the country.6 Plants are widely distributed across more than 1,700 counties and in over 30 provinces, regions and municipalities.
During the Twelfth Five-Year Plan period (2011-2015), more than 4,400 old small hydropower stations have been refurbished nationwide, with the installed capacity increasing from 7.5 GW to 9.1 GW, and the annual power generation increasing from 24.05 TWh to 35.11 TWh. The Central Government has provided 36 per cent of total financing for the projects.16
According to the Ministry of Water Resources, the Thirteenth
Five-Year Plan (2016-2020), the national plan for refurbishing China’s rural SHP projects, will aim to refurbish 2,333 old
SHPs and complete ecological mitigation plans for 2,110 SHPs.6
Figure 2. Small hydropower capacities up to 50 MW in 2013/2016/2019 in China (GW)
0 30 60 90 120 150
PotentialCapacity
Installed Capacity
128 128 128
79.3 73.2 65.7
WSHPDR 2019WSHPDR 2016WSHPDR 2013
Source: China Ministry of Water Resources,6 WSHPDR 2013,7 WSHPDR 201617
Note: The comparison is between data from WSHPDR 2013, WSHPDR 2016 and WSHPDR 2019.
Figure 3. Small hydropower capacities up to 10 MW in 2013/2016/2019 in China (GW)
0 10 20 30 40 50 60 70 80
PotentialCapacity
Installed Capacity
63.5 63.5 63.5
41.9 39.8 36.9
WSHPDR 2019WSHPDR 2016WSHPDR 2013
Source: China Ministry of Water Resources,6 WSHPDR 2013,7 WSHPDR 201617
Note: The comparison is between data from WSHPDR 2013 and WSHPDR 2016 and WSHPDR 2019.
In the past few decades, the development, investment and asset management of Chinese SHP has changed. Before 1990, Chinese SHP plants were mainly funded by the central and local governments. However, after the late 1990s the rapid development of the Chinese economy meant that the gap between power supply and demand rose dramatically, causing power supply shortages in most provinces. During this period, the Chinese investment system started to be reformed through a combination of government guidance and market mechanisms. A variety of economic entities were encouraged to invest in and develop SHP, with the aim of narrowing the gap between power supply and demand, and the shortfall in government funds.
In addition to investments made by the Chinese Government, many private investors have become increasingly involved in hydropower development. Over a 10-year period beginning in 1990, SHP investment experienced a gradual transition away from the central and local government, shifting towards corporate enterprises (including foreign ones), with joint ventures and private hydropower plants accounting for an increasing proportion of newly installed capacity. Moreover, a set of technical standard systems, including an SHP programme encompassing design, construction, installation,
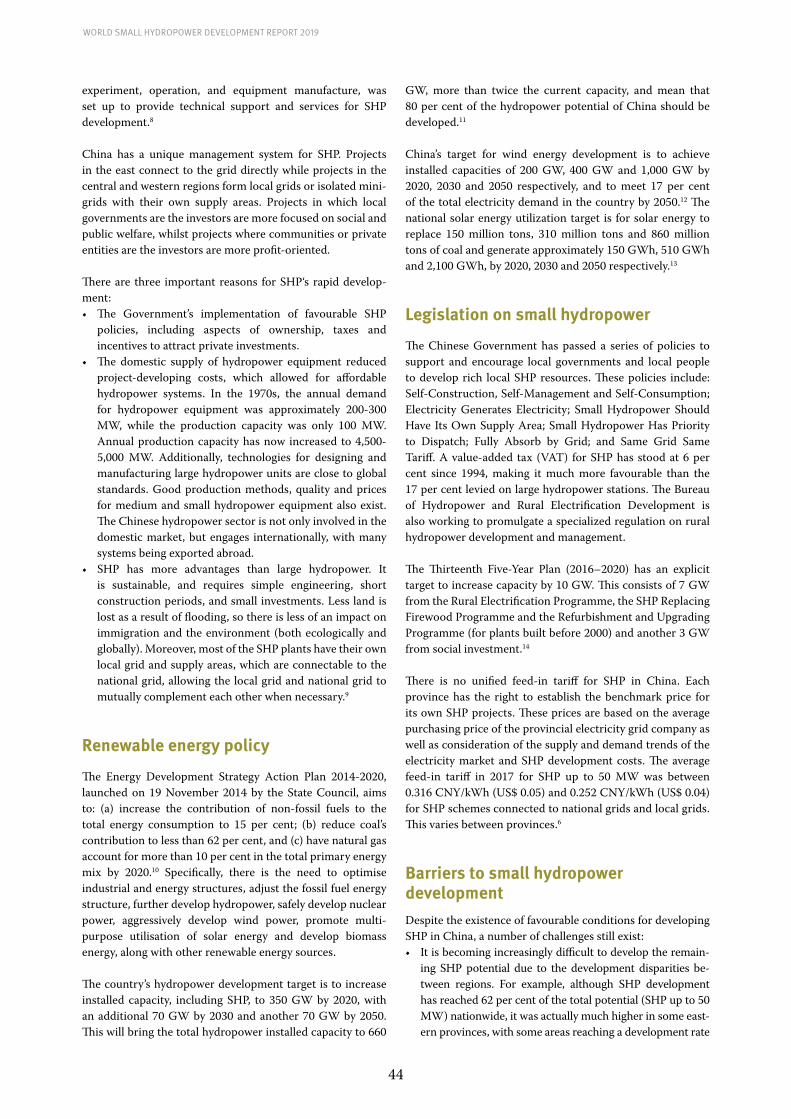
44
World Small HydropoWer development report 2019
experiment, operation, and equipment manufacture, was set up to provide technical support and services for SHP development.8
China has a unique management system for SHP. Projects in the east connect to the grid directly while projects in the central and western regions form local grids or isolated mini-grids with their own supply areas. Projects in which local governments are the investors are more focused on social and public welfare, whilst projects where communities or private entities are the investors are more profit-oriented.
There are three important reasons for SHP‘s rapid develop-ment:• The Government’s implementation of favourable SHP
policies, including aspects of ownership, taxes and incentives to attract private investments.
• The domestic supply of hydropower equipment reduced project-developing costs, which allowed for affordable hydropower systems. In the 1970s, the annual demand for hydropower equipment was approximately 200-300 MW, while the production capacity was only 100 MW. Annual production capacity has now increased to 4,500-5,000 MW. Additionally, technologies for designing and manufacturing large hydropower units are close to global standards. Good production methods, quality and prices for medium and small hydropower equipment also exist. The Chinese hydropower sector is not only involved in the domestic market, but engages internationally, with many systems being exported abroad.
• SHP has more advantages than large hydropower. It is sustainable, and requires simple engineering, short construction periods, and small investments. Less land is lost as a result of flooding, so there is less of an impact on immigration and the environment (both ecologically and globally). Moreover, most of the SHP plants have their own local grid and supply areas, which are connectable to the national grid, allowing the local grid and national grid to mutually complement each other when necessary.9
Renewable energy policy
The Energy Development Strategy Action Plan 2014-2020, launched on 19 November 2014 by the State Council, aims to: (a) increase the contribution of non-fossil fuels to the total energy consumption to 15 per cent; (b) reduce coal’s contribution to less than 62 per cent, and (c) have natural gas account for more than 10 per cent in the total primary energy mix by 2020.10 Specifically, there is the need to optimise industrial and energy structures, adjust the fossil fuel energy structure, further develop hydropower, safely develop nuclear power, aggressively develop wind power, promote multi-purpose utilisation of solar energy and develop biomass energy, along with other renewable energy sources.
The country’s hydropower development target is to increase installed capacity, including SHP, to 350 GW by 2020, with an additional 70 GW by 2030 and another 70 GW by 2050. This will bring the total hydropower installed capacity to 660
GW, more than twice the current capacity, and mean that 80 per cent of the hydropower potential of China should be developed.11
China’s target for wind energy development is to achieve installed capacities of 200 GW, 400 GW and 1,000 GW by 2020, 2030 and 2050 respectively, and to meet 17 per cent of the total electricity demand in the country by 2050.12 The national solar energy utilization target is for solar energy to replace 150 million tons, 310 million tons and 860 million tons of coal and generate approximately 150 GWh, 510 GWh and 2,100 GWh, by 2020, 2030 and 2050 respectively.13
Legislation on small hydropower
The Chinese Government has passed a series of policies to support and encourage local governments and local people to develop rich local SHP resources. These policies include: Self-Construction, Self-Management and Self-Consumption; Electricity Generates Electricity; Small Hydropower Should Have Its Own Supply Area; Small Hydropower Has Priority to Dispatch; Fully Absorb by Grid; and Same Grid Same Tariff. A value-added tax (VAT) for SHP has stood at 6 per cent since 1994, making it much more favourable than the 17 per cent levied on large hydropower stations. The Bureau of Hydropower and Rural Electrification Development is also working to promulgate a specialized regulation on rural hydropower development and management.
The Thirteenth Five-Year Plan (2016–2020) has an explicit target to increase capacity by 10 GW. This consists of 7 GW from the Rural Electrification Programme, the SHP Replacing Firewood Programme and the Refurbishment and Upgrading Programme (for plants built before 2000) and another 3 GW from social investment.14
There is no unified feed-in tariff for SHP in China. Each province has the right to establish the benchmark price for its own SHP projects. These prices are based on the average purchasing price of the provincial electricity grid company as well as consideration of the supply and demand trends of the electricity market and SHP development costs. The average feed-in tariff in 2017 for SHP up to 50 MW was between 0.316 CNY/kWh (US$ 0.05) and 0.252 CNY/kWh (US$ 0.04) for SHP schemes connected to national grids and local grids. This varies between provinces.6
Barriers to small hydropower developmentDespite the existence of favourable conditions for developing SHP in China, a number of challenges still exist:• It is becoming increasingly difficult to develop the remain-
ing SHP potential due to the development disparities be-tween regions. For example, although SHP development has reached 62 per cent of the total potential (SHP up to 50 MW) nationwide, it was actually much higher in some east-ern provinces, with some areas reaching a development rate

45
3.2. EAS
TERN
AS
IA
of 80 per cent. Aside from technical difficulties, constraints caused by land compensation, labour cost, eco-environ-ment and resettlement issues are more serious.
• For some rivers, the environment has been damaged by projects that did not strictly carry out measures for soil and water conservation and environmental protection. Some rivers were overexploited, and sections of them de-hydrated, affecting the drinking water downstream and the ecology of the whole river.
• The allocation of hydropower resources in some river ba-sins is unreasonable, due to past limitations in technology, funding and layout. Some medium and small rivers lack a combined dispatching system.
• Some of the existing plants are already ageing and in a state of disrepair. Although the Twelfth Five Year Plan has refurbished 4,400 plants, there are still a large number of plants not included in the plan.15
References
1. World Bank (2017). World Development Indicators. Population of China. Available from https://data.worldbank.org/indicator/SP.POP.TOTL?locations=CN&view=chart
2. Nations Encyclopedia (n.d.). Asia and Oceania, China. Available from http://www.nationsencyclopedia.com/Asia-and-Oceania/China.html.
3. National Energy Bureau (2017). National Power Industry Statistics Data. Available from http://www.nea.gov.cn/2018-01/22/c_136914154.htm
4. The Regulatory Assistance Project (2008). China’s Power sector: A Backgrounder for International Regulators and Policy Advisors.
5. National Energy Bureau (2017). 2017 National Electricity Price Regulatory Circular. Available from http://www.nea.gov.cn/137519800_15391333051221n.pdf
6. China, Ministry of Water Resources, Rural Hydropower and Electrification Bureau (2018). The 2017 Rural Hydropower Statistics Yearbook.
7. LIU, H., Masera, D. and Esser, L., eds. (2013). World Small Hydropower Development Report 2013. United Nations Industrial Development Organization; International Center on Small Hydro Power. Available from http://www.smallhydroworld.org
8. Tian Zhongxing (2010). Analysis Report on the Development and Status of Small Hydropower in China: P10 Rural Hydropower and Electrification China Ministry of Water Resources (2010, n.p.).
9. Xinhua Net (2007). Analysis on China’s SHP Industry Status and Potential. 16 October 2007, Available from http://www.gd.xinhuanet.com/newscenter/ztbd/2007-10/16/content_11415456.htm.
10. State Council of China (2014). The Energy Development Strategy Action Plan 2014-2020. Available from http://www.gov.cn/zhengce/content/2014-11/19/content_9222.htm.
11. China Reform Daily (2015). China’s Hydropower Opens Sustainable Development in the New Century. 29 June 2015. Available from http://www.cec.org.cn/yaowenkuaidi/2015-05-29/138470.html.
12. China Renewable Energy Center (2012). China’s Wind Power Development, the Road Map of 2050. 10 February 2012. Available
from http://www.cnrec.org.cn/yjcg/fn/2012-02-10-54.html.13. China Renewable Energy Center (2014). China Renewable
Energy Road Map 2050. 25 December 2014. Available from www.cnrec.org.cn/cbw/zh/2014-12-25-456.html.
14. Tian Zhongxing (2015). Rural Hydropower Conference. Statement to the Ministry of Water Resources and Hydropower Bureau 10 April 2015. Available from http://www.shp.com.cn/ldjh/sdjldjh/201504/t20150420_630498.html.
15.Zhou Xuewen (2015). Rural Hydropower Conference. Statement to the Ministry of Water Resources. 9 April 2015. Available from http://www.shp.com.cn/ldjh/bldjh/201504/t20150420_630501.html.
16. Ministry of Water Resources, Report on Rural SHP Refurbishment Status. Available from http://www.xinhuanet.com//politics/2015-09/14/c_128226580.htm
17. Liu H., Wang X. (2016). China country report. World Small Hydropower Development Report 2016. United Nations Industrial Development Organization; International Center on Small Hydro Power. Available from http://www.smallhydroworld.org

46
Democratic People’s Republic of KoreaInternational Center on Small Hydro power (ICSHp)
Key factsPopulation 25,491,000 1
Area 120,540 km2 2
Climate The Democratic People’s Republic of Korea is located in the northern part of the Korean peninsula. Its climate is influenced by the Asian continental landmass and oceans to its east and west. It has a mild temperate climate with four distinct seasons. It is hot and humid in the summer (June to August), with average temperatures of 24 oC, and dry and cold during spring-winter months, with average temperatures in winter (November to February) of –5.5 oC. The annual average temperature is 9 oC to 10 oC.3 In January, daily average minimum and maximum temperatures in the capital, Pyongyang, are –13 oC and –3 oC. In August, average minimum and maximum temperatures for Pyongyang are 20 oC and 29 oC.4
Topography Approximately 80 per cent of the country is mountainous and rugged.3 The north and east of the country are comprised mainly of high mountains and along the south and west coastlines there are some small plains.5 The largest ones are the Pyongyang and Chaeryng plains, each covering approximately 500 km2.6 The highest point is Mount Paektu at 2,744 metres.7
Rain pattern Precipitation of the country ranges from 810 mm to 1,520 mm and average annual precipitation is 1,054 mm. More than 60 per cent of all rainfall takes place between June and September.8
Hydrology The Yalu River, also known as Amnok River, is the longest river in the DPR of Korea, with 790 km.6,9 It is located on the border between the DPR of Korea and China.9 The Yalu River flows from Mount Paektu and continues in a westerly direction into the Yellow Sea (Korean Bay).6 The second longest river is the Tumen River.6,9 It is 521 km long and also begins at Mount Paektu.9 It passes through the DPR of Korea-China border, the DPR of Korea-Russian border and finally drains into the Sea of Japan.6,9 The Taedong River is the third longest at 397 km.6 It originates in the Rangrim Mountains and also drains into the Yellow Sea (Korean Bay). Lakes have a tendency to be small.6 There are approximately 1,000 artificial lakes, most of which were formed when irrigation projects took place and hydropower plants were constructed.5
Electricity sector overview
The estimated net installed capacity of electricity plants in the Democratic People’s Republic (DPR) of Korea was approximately 10,000 MW in 2015.7,10,11 Estimated net installed capacity from fossil fuels was 4,500 MW and estimated net installed capacity from hydropower plants was 5,768 MW.7,10,12 There is also an additional 0.2 MW of estimated off-grid installed capacity from on-shore wind farms.12 Electricity generation in 2015 was estimated at 17,447.35 GWh.7,10,11 Approximately 13,650 GWh of electricity was generated from hydropower plants (78 per cent of total energy mix), 2,924 GWh from coal-fired power plants (17 per cent), 813 GWh from oil-fired power plants (almost 5 per cent) and 0.35 GWh from off-grid on-shore wind farms (Figure 1).7,10,11,12 Off-grid solar panels for personal use are also becoming more common, but no data on the contribution of solar power to electricity generation are available.13
Figure 1. Annual electricity generation by source in the Democratic People’s Republic of Korea (GWh)
Hydropower
Coal
Oil
Wind power
13,650.0
2,984.0
813.0
0.4
Source: IEA,11 IRENA12
Note: The figure uses maximum estimated values .
Electricity generation in the DPRK has been affected by climate change and the sanctions of the United Nations Security Council. Climate change has had a major impact on the DPR of Korea, leading to severe weather conditions. Droughts, floods or both have occurred yearly since 2014.
3.2.2
World Small HydropoWEr dEvElopmEnt
rEport 2019

47
3.2. EAS
TERN
AS
IA
At the end of August 2016, there was an extensive rainfall in the province of North Hamyong, causing the Tumen River to flood.15 Between January and July of 2017, there was a 30 to 80 per cent decrease in rainfall (compared to the average).16 In the past, this type of severe weather affected hydropower plants negatively, rendering them inoperable.17,18 In addition to this, the current sanctions imposed by the Security Council have made it difficult for the country to trade, and in particular to import oil, a resource that is not available domestically. These sanctions have adversely affected all of the country’s economic activities, and not only its military sector.19
Currently, the country’s electricity demand is not being met, with Pak Pong-ju, former Prime Minister, acknowledging that the country has “an acute shortage of electricity”.20 Many areas outside of Pyongyang receive a modest amount of power and power outages are a regular occurrence throughout the coun-try.21 Electricity rationing is also common. For example, in ru-ral areas electricity is only available for a few hours per day.22 Electricity and coal that are supplied by the state are provided at zero cost to the end user.22 In 2016, the estimated natio-nal electrification rate was 27 per cent, with urban electrifi-cation at 36 per cent and rural electrification at 11 per cent (Figure 2).14
Figure 2. Electrification rate in the Democratic People’s Republic of Korea (%)
Rural 11%Total 27%
Source: IEA14
The United Nations Development Programme (UNDP) has ongoing projects in the DPR of Korea, one of which is the Sustainable Energy Solutions for Rural Livelihoods in DPRK (SES) project. Among its targets is meeting the energy demand of rural households. Wind generators and solar photovoltaic (PV) systems will be provided at a household level, with wind generators, small hydropower and gasifier power also being provided at a community level.22 There have also been multiple Global Environmental Fund (GEF) projects in the DPRK, which have helped increase the electrification rate in rural areas of the country, such as the Project on Small Wind Energy Development and Promotion in Rural Areas (SWEDPRA) in particular.23
The electricity infrastructure of the country is outdated, inefficient and in need of refurbishment, with some of the generation and transmission equipment dating back several decades.21 However, in 2018 one of the official national news outlets announced that the DPRK was going to “give definite priority to [the] electric power industry over all other
sectors of the national economy.”24 It was also mentioned that generating and transmission equipment had been upgraded in order to increase the efficiency of power generation and minimize transmission losses.24 The DPR of Korea has made a commitment to reduce power transmission and distribution losses by 6 per cent by 2030.25 In 2015, electricity consumed by the energy industry and losses were estimated at 3,475 GWh. The Government also announced plans in 2017 for the construction of the new large-scale Tanchon Power Station, which might solve the electricity supply problem.26
Key government ministries involved with the energy sector, whether it be electricity distribution or infrastructure construction, include the Ministry of Electric Power Industry, the Ministry of Atomic Energy and the Ministry of Coal Industry. The County People’s Committees (CPC) is the lowest administrative level that provides supporting services and facilities to the rural population.22 Finally, there is the Ministry of State Construction Control, which is responsible for approving construction projects (such as hydropower plants) and their locations.27
Small hydropower sector overview
For the purposes of this report, small hydropower (SHP) will be defined as hydropower plants with a capacity of 10 MW or less. The SHP installed capacity in DPR of Korea based on this definition has been estimated to be at 32 MW.12 However, based on official project documents from the UNDP and UNFCCC, SHP installed capacity should be greater (Table 1). Due to challenges in data access and availability for the DPRK, the installed SHP capacity used in this report is only an estimate. It is estimated that total installed capacity could be at least 83.2 MW.12,28,29,30,36 Data on SHP potential are not available. Compared to the World Small Hydropower Development Report (WSHPDR) 2016, installed capacity has almost tripled (Figure 3). Although data on the country’s energy sector are very limited, we can be sure of this increase as the projects listed in Table 1 were only completed after the publication of the WHSPDR 2016.
Figure 3. Small hydropower capacities 2013/2016/2019 in the Democratic People’s Republic of Korea (MW)
0 20 40 60 80 100
PotentialCapacity
Installed Capacity
N/A 52.2N/A
83.2 33.0N/A
WSHPDR 2019WSHPDR 2016WSHPDR 2013
Source: IRENA,12 UNFCCC,29 UNDP DPRK,30 WHSPDR 2013,37 WHSPDR 201636
Note: The comparison is between data from WSHPDR 2013, WSHPDR 2016 and WSHPDR 2019.
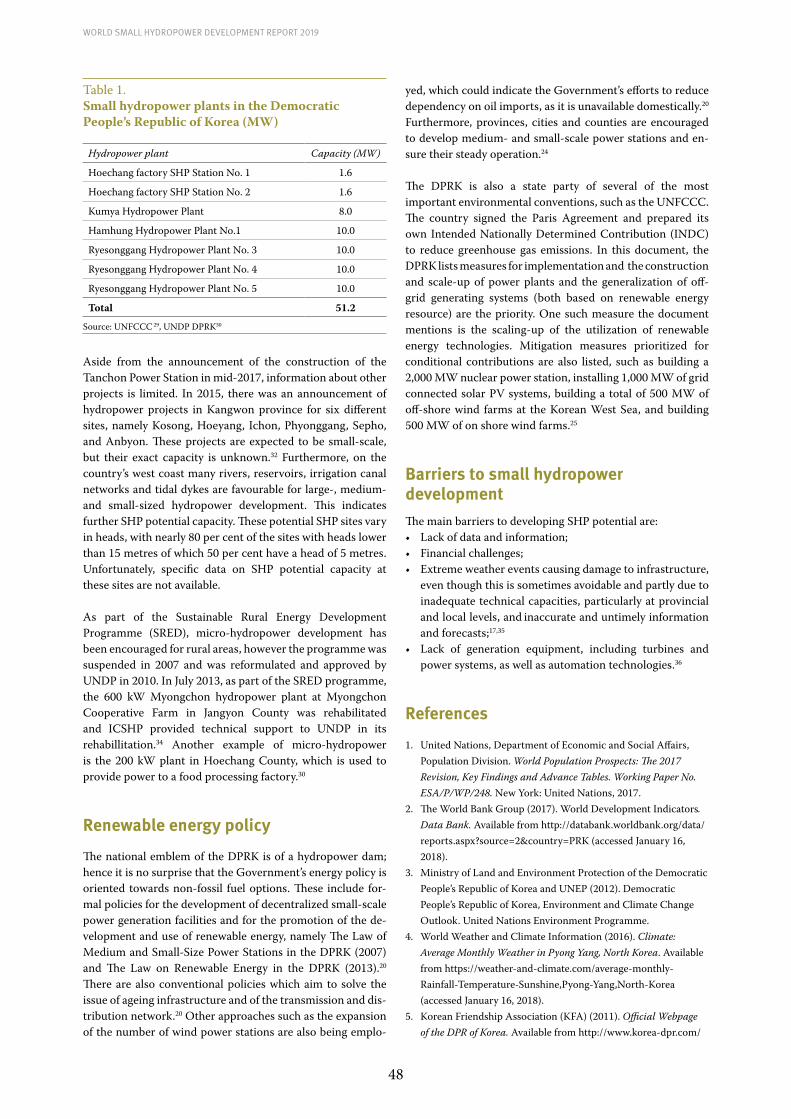
48
World Small HydropoWer development report 2019
Table 1.Small hydropower plants in the Democratic People’s Republic of Korea (MW)
Hydropower plant Capacity (MW)
Hoechang factory SHP Station No. 1 1.6
Hoechang factory SHP Station No. 2 1.6
Kumya Hydropower Plant 8.0
Hamhung Hydropower Plant No.1 10.0
Ryesonggang Hydropower Plant No. 3 10.0
Ryesonggang Hydropower Plant No. 4 10.0
Ryesonggang Hydropower Plant No. 5 10.0
Total 51.2 Source: UNFCCC 29, UNDP DPRK30
Aside from the announcement of the construction of the Tanchon Power Station in mid-2017, information about other projects is limited. In 2015, there was an announcement of hydropower projects in Kangwon province for six different sites, namely Kosong, Hoeyang, Ichon, Phyonggang, Sepho, and Anbyon. These projects are expected to be small-scale, but their exact capacity is unknown.32 Furthermore, on the country’s west coast many rivers, reservoirs, irrigation canal networks and tidal dykes are favourable for large-, medium- and small-sized hydropower development. This indicates further SHP potential capacity. These potential SHP sites vary in heads, with nearly 80 per cent of the sites with heads lower than 15 metres of which 50 per cent have a head of 5 metres. Unfortunately, specific data on SHP potential capacity at these sites are not available.
As part of the Sustainable Rural Energy Development Programme (SRED), micro-hydropower development has been encouraged for rural areas, however the programme was suspended in 2007 and was reformulated and approved by UNDP in 2010. In July 2013, as part of the SRED programme, the 600 kW Myongchon hydropower plant at Myongchon Cooperative Farm in Jangyon County was rehabilitated and ICSHP provided technical support to UNDP in its rehabillitation.34 Another example of micro-hydropower is the 200 kW plant in Hoechang County, which is used to provide power to a food processing factory.30
Renewable energy policy
The national emblem of the DPRK is of a hydropower dam; hence it is no surprise that the Government’s energy policy is oriented towards non-fossil fuel options. These include for-mal policies for the development of decentralized small-scale power generation facilities and for the promotion of the de-velopment and use of renewable energy, namely The Law of Medium and Small-Size Power Stations in the DPRK (2007) and The Law on Renewable Energy in the DPRK (2013).20 There are also conventional policies which aim to solve the issue of ageing infrastructure and of the transmission and dis-tribution network.20 Other approaches such as the expansion of the number of wind power stations are also being emplo-
yed, which could indicate the Government’s efforts to reduce dependency on oil imports, as it is unavailable domestically.20 Furthermore, provinces, cities and counties are encouraged to develop medium- and small-scale power stations and en-sure their steady operation.24
The DPRK is also a state party of several of the most important environmental conventions, such as the UNFCCC. The country signed the Paris Agreement and prepared its own Intended Nationally Determined Contribution (INDC) to reduce greenhouse gas emissions. In this document, the DPRK lists measures for implementation and the construction and scale-up of power plants and the generalization of off-grid generating systems (both based on renewable energy resource) are the priority. One such measure the document mentions is the scaling-up of the utilization of renewable energy technologies. Mitigation measures prioritized for conditional contributions are also listed, such as building a 2,000 MW nuclear power station, installing 1,000 MW of grid connected solar PV systems, building a total of 500 MW of off-shore wind farms at the Korean West Sea, and building 500 MW of on shore wind farms.25
Barriers to small hydropower developmentThe main barriers to developing SHP potential are:• Lack of data and information;• Financial challenges; • Extreme weather events causing damage to infrastructure,
even though this is sometimes avoidable and partly due to inadequate technical capacities, particularly at provincial and local levels, and inaccurate and untimely information and forecasts;17,35
• Lack of generation equipment, including turbines and power systems, as well as automation technologies.36
References
1. United Nations, Department of Economic and Social Affairs, Population Division. World Population Prospects: The 2017 Revision, Key Findings and Advance Tables. Working Paper No. ESA/P/WP/248. New York: United Nations, 2017.
2. The World Bank Group (2017). World Development Indicators. Data Bank. Available from http://databank.worldbank.org/data/reports.aspx?source=2&country=PRK (accessed January 16, 2018).
3. Ministry of Land and Environment Protection of the Democratic People’s Republic of Korea and UNEP (2012). Democratic People’s Republic of Korea, Environment and Climate Change Outlook. United Nations Environment Programme.
4. World Weather and Climate Information (2016). Climate: Average Monthly Weather in Pyong Yang, North Korea. Available from https://weather-and-climate.com/average-monthly-Rainfall-Temperature-Sunshine,Pyong-Yang,North-Korea (accessed January 16, 2018).
5. Korean Friendship Association (KFA) (2011). Official Webpage of the DPR of Korea. Available from http://www.korea-dpr.com/
49
3.2. EAS
TERN
AS
IA
location.html (accessed January 19, 2018).6. Savada, A. M., ed. (1993). North Korea: A Country Study.
Washington: GPO for the Library of Congress.7. Central Intelligence Agency (2018). “The World Factbook.” East
& Southeast Asia: Korea, North. 17 January 2018. Available from https://www.cia.gov/library/publications/the-world-factbook/geos/kn.html (accessed January 24, 2018).
8. Food and Agriculture Organization of the United Nations (FAO) (2016). “AQUASTAT.” Democratic People’s Republic of Korea, Geography, climate and population. Available from http://www.fao.org/nr/water/aquastat/countries_regions/Profile_segments/PRK-GeoPop_eng.stm (accessed January 31, 2018).
9. Kimutai, K. (2017). World Atlas. 25 April 2017. Available from https://www.worldatlas.com/articles/major-rivers-of-north-korea.html (accessed January 22, 2018).
10. United Nations (2017). The 2015 Energy Statistics Yearbook. The Department of Economic and Social Affairs, United Nations Statistical Division, New York: United Nations.
11. International Energy Agency (IEA) (2017). Statistics: Korea, Democratic People’s Republic of: Indicators for 2015. Available from http://www.iea.org/statistics/statisticssearch/report/?year=2015&country=KOREADPR&product=Indicators (accessed January 24, 2018).
12. International Renewable Energy Agency (IRENA) (2017). Capacity and Generation. Available from http://resourceirena.irena.org/gateway/dashboard/?topic=4&subTopic=16 (accessed February 11, 2018).
13. Berger, S. (2017). Yahoo Finance: Dark Nights in Power-Starved North Korea. 4 October 2017. Available from https://finance.yahoo.com/news/dark-nights-power-starved-north-korea-052749632.html (accessed January 30, 2018).
14. International Energy Agency (IEA) (2017). “Energy Access Outlook 2017.” Energy Access Database. Available from https://www.iea.org/energyaccess/database/ (accessed January 18, 2018).
15. International Federation of Red Cross and Red Crescent Societies (2016). DPR Korea: Floods- Aug 2016. Reliefweb, 3 September 2016. Available from https://reliefweb.int/sites/reliefweb.int/files/resources/IBDPRKfl030916.pdf (accessed January 30, 2018).
16. UN Office for the Coordination of Humanitarian Affairs (2017). Asia and the Pacific: Weekly Regional Humanitarian Snapshot (27 June - 3 July 2017). Reliefweb, 3 July 2017. Available from https://reliefweb.int/report/philippines/asia-and-pacific-weekly-regional-humanitarian-snapshot-27-june-3-july-2017 (accessed January 30, 2018).
17. United Nations Development Programme Democratic People’s Republic of Korea (UNDP DPRK) (2015). “Strengthening the Resilience of Communities through Community-Based Disaster Risk Management (CBDRM).” Project Document. Pyongyang: United Nations Development Programme, 08 October 2015.
18. Fifield, A. (2015). North Korean drought is hobbling the power supply, and the economy with it. Washington Post, 21 June 2015. Available from https://www.washingtonpost.com/world/asia_pacific/north-korean-drought-is-hobbling-the-power-supply-and-the-economy-with-it/2015/06/21/65e51c02-14ff-11e5-8457-4b431bf7ed4c_story.html?utm_term=.8b725cf3d6ba (accessed January 30, 2018).
19. Frank, R. (2018). Kim Jong un’s 2018 New Year’s Speech: Self-Confidence After a Tough Year. 38 North, 3 January 2018. Available from http://www.38north.org/2018/01/rfrank010318/
(accessed January 30, 2018).20. Frank, R. (2018). The North Korean Parliamentary Session and
Budget Report for 2017. 38 North, 28 April 2017. Available from http://www.38north.org/2017/04/rfrank042817/ (accessed January 30, 2018).
21. U.S. Energy Information Administration (2017). Korea, North, Analysis. Available from https://www.eia.gov/beta/international/analysis.cfm?iso=PRK (accessed January 26, 2018).
22. United Nations Development Programme Democratic People’s Republic of Korea (UNDP DPRK) (2015). “Sustainable Energy Solutions for Rural Livelihoods in DPRK (SES).” Democratic People’s Republic of Korea (DPRK) Project Doucument. Pyongyang: UN, 26 August 2015.
23. Global Environment Facility (GEF) (2005). Small Wind Energy Development and Promotion in Rural Areas (SWEDPRA). Available from https://www.thegef.org/project/small-wind-energy-development-and-promotion-rural-areas-swedpra (accessed February 1, 2018).
24. Naenara (2018). Electric-Power Industry. Available from http://naenara.com.kp/en/news/?0+103439 (accessed January 30, 2018).
25. United Nations Framework Convention on Climate Change (UNFCCC) (2016). “Intended Nationally Determeoined Contribution of Democratic People’s Republic of Korea.” Pyongyang: UNFCCC, September 2016.
26. Macdonald, H. (2017). North Korea begins work on major power station in Tanchon. NK*NEWS.ORG, 19 May 2017. Available from https://www.nknews.org/2017/05/north-korea-begins-work-on-major-power-station-in-tanchon/ (accessed January 31, 2018).
27. Clean Development Mechanism (CDM) Executive Board (2006). Project Design Document Form (CDM- SSC- PDD) Version 03. UNFCCC, 22 December 2006.
28. United Nations Country Team and DPRK Ministry of Foreign Affairs (2016). “The Strategic Framework for Cooperation between the United Nations and the Governement of the Democratic People’s Republic of Korea 2017-2021.” Pyongyang: United Nations, September 2016.
29. United Nations Framework Convention on Climate Change (UNFCCC) (2018). Project Search: Database for PAs and PoAs. Available from http://cdm.unfccc.int/Projects/projsearch.html (accessed February 1, 2018).
30. United Nations Development Programme Democratic People’s Republic of Korea (UNDP DPRK) (2013). “Pilot project to support socio-economic development of rural areas in DPRK (SED).” Project Document. Pyongyang: UNDP, 28 June 2013.
31. Food and Agriculture Organization (FAO) (2016). “AQUASTAT.” Available from http://www.fao.org/nr/water/aquastat/dams/country/PRK-dams_eng.xlsx (accessed February 1, 2018).
32. Byrne, L. (2015). North Korea announces more hydroelectric plants. NK*NEWS.ORG, 3 March 2015. Available from https://www.nknews.org/2015/03/north-korea-announces-more-hydroelectric-plants/ (accessed February 1, 2018).
33. Jin, R.Y., and Chol. R.S. (2010). The Trend of Small Hydropower Research and Development in DPR of Korea. Presentation at Hangzhou Regional Centre for Small Hydropower, Hangzhou.
34. Zhang, M., ed. (2013). “UNDP-Aid Rehabilitation of 600kW Myongchon Hydropower Plant in DPRK Put-in Operation.” IN-SHP Newsletter (International Center on Small Hydro Power), 2013: 1-2.

50
World Small HydropoWer development report 2019
35. United Nations Development Programme Democratic People’s Republic of Korea (UNDP DPRK) (2013). “Strengthening Ecosystem Resilience and Community Adaptive Capacity in Climate Affected River Basins in DPRK (SERCARB).” Project Document. Pyongyang: UNDP, June 2013.
36. The World Small Hydropower Development Report 2016. United Nations Industrial Development Organization, Vienna; International Center on Small Hydro Power, Hangzhou. Available from ww.smallhdyropower.org
37. LIU, H., Masera, D. and Esser, L., eds. (2013). World Small Hydropower Development Report 2013. United Nations Industrial Development Organization; International Center on Small Hydro Power. Available from www.smallhydroworld.org.

51
3.2. EAS
TERN
AS
IA
Japantokihiko Fujimoto, Shizuoka University and Kyushu University
Key factsPopulation 126,678,000 1
Area 377,962 km2 2
Climate The climate in Japan varies from south to north. While the south of the country lies in a tropical zone, the north has a subarctic climate. The average annual temperatures range from 23.6°C in the southernmost city of Naha, Okinawa, to 9.1 °C in the northernmost city of Sapporo, Hokkaido. The capital city, Tokyo, has an average temperature of 15.8 °C in 2017.3
Topography The country consists of 6,852 islands lying in a volcanic zone. Sixty-seven per cent of the country‘s land area is mountainous. The highest point is Mount Fuji, at 3,776 metres above sea level. The coastline is 29,751 km long.2
Rain pattern Japan experiences the East Asian monsoon. The average annual precipitation is 1,907 mm in Naha, 1,430 mm in Tokyo, and 1,158 mm in Sapporo.3
Hydrology The rivers in Japan are short and fast-flowing, with steep gradients. Waterfalls are not uncommon in the mountainous landscape of the country. The longest rivers are the Shinano, Tone, and Ishikhari Rivers.4
Electricity sector overview
According to the Statistics Bureau of Natural Resources and Energy, the country’s total installed electrical capacity was 300,149 MW in 2017. Thermal plants accounted for 193,354 MW of this capacity, hydropower, including pumped storage, for 50,020 MW, nuclear power for 41,482 MW, solar power for 11,399 MW, wind power for 3,350 MW, geothermal energy for 480 MW, and other resources (excluding fuel cells) for 64 MW (Figure 1).5
Figure 1. Installed electricity capacity by source in Japan (MW)
193,354
50,020
41,482
11,399
3,350
480
64.0
Thermal power
Hydropower
Nuclear power
Solar power
Wind power
Geothermal
Other
Source: METI5
In 2016, electricity generation in Japan totalled 998,055 GWh. Thermal power accounted for 877,203 GWh of this total electricity generation, hydropower for 84,540 GWh, nuclear power for 17,300 GWh, solar power for 11,074 GWh, wind power for 5,457 GWh, geothermal energy for 2,212 GWh, and other resources (excluding fuel cells) for 269 GWh (Figure 2).5
Figure 2. Annual electricity generation by source in Japan (GWh)
877,203
84,540
17,300
11,074
5,457
2,212
269
Thermal power
Hydropower
Nuclear power
Solar power
Wind power
Geothermal
Other
Source: METI5
The energy mix of Japan is dominated by thermal power, which accounts for 64 per cent of the country’s total installed capacity and almost 90 per cent of electricity generation. Coal remains an important source of thermal power as it is relatively inexpensive compared to petroleum and liquefied natural gas (LNG). Due to rich reserves of coal in countries with a relatively high political stability, such as Indonesia and Australia, supplies to Japan are stable. In 2016, approximately 314 TWh of electricity was generated from coal.5
The use of oil has been on a downward trend since the 1970s. However immediately after the Great East Japan Earthquake in 2011, the consumption of crude oil and heavy oil tempo-rarily increased to balance the supply and demand of energy, which was supported by the restarting of old oil thermal po-
3.2.3
World Small HydropoWEr dEvElopmEnt
rEport 2019

52
World Small HydropoWer development report 2019
wer plants. Nonetheless, since then the use of oil has been decreasing again. In 2016, oil accounted for approximately 50 TWh of electricity generated in Japan.5
The LNG sector has seen a significant rise annually since imports from Alaska started in 1969. The share of LNG in the energy mix has increased even further since the Great East Japan Earthquake. Thus, in 2016 LNG accounted for approximately 410 TWh, i.e. over 40 per cent, of electricity generated in Japan.5
There was a proliferation of nuclear power plants in Japan from the latter half of the 1970s to the 1990s. Prior to the earthquake, the country had 54 reactors, which generated 31 per cent of the country’s electricity and 10 per cent of the world’s nuclear power in 2010.6 However after the earthquake, nuclear power plants, which had been regularly inspected, continued to be inoperative. Therefore the amount of the nuclear power was temporarily recorded as zero in the year 2014. By the end of 2017, decisions had been taken to decommission 17 units, including units 1 to 6 of Fukushima Daiichi Nuclear Power Plant, where accidents occurred after the tsunami in 2011.7
With the focus on renewable energy resources, solar power, wind power, geothermal energy, biomass and small hydropower have also been progressively strengthened in recent years. Furthermore, technological developments and the social testing of new energy facilities, such as fuel cells and hydrogen, are underway.8
The institutions regulating the energy market in Japan inclu-de:• Ministry of Economy, Trade and Industry (METI), which
has the overall responsibility for energy policy in Japan;• Agency for Natural Resources and Energy (ANRE) within
METI, which is in charge of comprehensive energy poli-cies to ensure strategic energy security, realize an efficient energy supply and promote environment-friendly energy policies;
• Ministry of the Environment, in charge of climate change and air pollution mitigation;
• Ministry of Land, Infrastructure, Transport and Tourism, in charge of energy efficiency and water resource manage-ment;
• Ministry of Education, Culture, Sports, Science and Tech-nology, which is in charge of certain areas of energy re-search and development;
• Electricity and Gas Market Surveillance Commission (EGC), which monitors the electricity, gas and heat mar-kets;
• Japan Fair Trade Commission (JFTC), responsible for monitoring competition in all sectors of the economy, in-cluding the electricity and natural gas industries
• Nuclear Regulation Authority.9
In 1995, the Government of Japan started the process of liberalizing the electricity sector, culminating in its full liberalisation in April 2016. Although today there are
multiple newly established power producers, the Japanese electricity market is still dominated by ten major privately-owned regional utilities, which form the Federation of Electric Power Companies (FEPC). They include: Hokkaido Electric Power, Tohoku Electric Power, Tokyo Electric Power Company, Chubu Electric Power, Kansai Electric Power, Hokuriku Electric Power Company, Chugoku Electric Power, Shikoku Electric Power, Kyushu Electric Power and Okinawa Electric Power. However, in 2020 ten utilities were forced to unbundle their power generation and retail functions from their transmission and distribution functions.10
Small hydropower sector overview
The definition of small hydropower (SHP) generally used in Japan is hydropower plants with an installed capacity of less than 10 MW. However, there is no clear definition, and classification is dependent on policy and association.
The total installed capacity of small hydropower plants in Japan as of March 2017 was 3,545 MW. A further undeveloped potential of 6,782 MW was recognized, of which 66 MW was under construction.13 Thus, approximately 34 per cent of available small hydropower potential has been developed so far. As compared to the World Small Hydropower Development Report (WSHPDR) 2016, the installed capacity of small hydropower in Japan remained unchanged, whereas the potential increased by approximately 0.6 per cent (Figure 3). The increase in small hydropower potential observed since the WSHPDR 2013 can be attributed to activities undertaken by electricity companies to use the superfluous water from constructed reservoirs and undeveloped river flow, national and local policies leading to the installation of small hydropower plants at a local level, and activities of non-governmental organizations such as the Japanese Association for Water Energy Recovery and the Core Projects for Research and Development SHP at Kyushu University.
Figure 3. Small hydropower capacities in 2013/2016/2019 in Japan (MW)
0 2 4 6 8 10 12
PotentialCapacity
Installed Capacity
10,327 10,270 10,267
3,545 3,545 3,518
WSHPDR 2019WSHPDR 2016WSHPDR 2013
Source: WSHPDR 2013,11 WSHPDR 2016,12 METI13
Note: The comparison is between data from WSHPDR 2013, WSHPDR 2016 and WSHPDR 2019.
Hydropower was a naturally available power source for Japan as its booming industries and cities demanded more electricity in the 1890s. Kyoto Keage hydropower plant,

53
3.2. EAS
TERN
AS
IA
launched in 1891, became the first Japanese hydropower plant for commercial operation. After several facility enhancements, the plant still remains in operation to date in the centre of Kyoto.15 From 1910 to 1925, nearly 100 hydroelectric power plants were built.12 Hydropower plants were utilized for electricity generation all over Japan. Since the 1990s, hydropower (especially on a small-scale) has again attracted attention as a possible solution to the problems of climate change and greenhouse gas (GHG) emissions. The small hydropower sector, together with the woody biomass sector, was reassessed, gaining new eminence as a natural and local resource that can be developed in Japan.13
According to the feed-in tariff (FIT) mechanism of Japan, the purchase price of hydropower varies depending on the scale: less than 200 kW, from 200 kW to 1 MW, and from 1 MW to 30 MW. Furthermore, in the amendment of 2017 small and medium hydropower of 1 MW or more was subdivided into the categories: from 1 MW to 5 MW and from 5 MW to 30 MW, with different purchase prices set for each category. Therefore, as of January 2018, the price of medium and small hydropower in the FIT system was divided into four levels.14
The 2017 tariffs for hydropower were as follows: • 20 JPY/kWh (0.19 US$/kWh) for 5 MW to 30 MW;• 27 JPY/kWh (0.25 US$/kWh) for 1 MW to 5 MW; • 29 JPY/kWh (0.27 US$/kWh) for 200 kW to 1 MW; • 34 JPY/kWh (0.32 US$/kWh) for plants under 200 kW.14
After the introduction of the FIT mechanism in 2012, the total capacity of medium and small hydropower generation certified by March 2017 was 239 MW. The cumulative amount of purchased electricity was 5,613 GWh, and the total purchase price was JPY 147.4 billion (approximately US$ 1.38 billion).23
Renewable energy policy
Since the 1970s and 1980s, the national energy and energy security policies have been aiming to reduce the dependency of Japan on petroleum. This has prompted the development of alternative energy resources and technologies. Alternative energy resources, by definition, include new energy resources such as LNG, nuclear and improved coal technologies, as well as renewable energy resources.17
In 2008, the New Energy Law was put into effect in order to establish special measures for promoting the use of new energy. The concept of new energy was also redefined. Renewable energy is now defined as solar energy generation, solar energy utilization, wind power generation, biomass generation, biomass thermal utilization, biomass fuel production, thermal energy conversion, geothermal power generation (binary system) and small hydropower (under 1 MW).17
The Great East Japan Earthquake of 11 March 2011 and the accident at Tokyo Electric Power Fukushima Daiichi Nuclear Power Plant became a major turning point in the energy policy
of Japan. The “Fourth Version of the Strategic Energy Plan” approved by the Cabinet in April 2014 claimed to “Review the energy strategy that was drawn before the Great East Japan Earthquake from a blank sheet and reduce the dependence on nuclear power generation as much as possible, this is the starting point for rebuilding the energy policy.”18
The “Fourth Energy Basic Plan” aims to reduce reliance on nuclear power as much as possible. The following three points were stated as concrete strategies: 1) promotion and introduction of renewable energy at the maximum level, 2) energy saving, 3) high efficiency of thermal power generation. The attainment targets of the plan are as follows: 1) to promote the energy self-sufficiency rate from about 6 per cent at the time of planning to about 25 per cent, 2) to reduce power generation costs, 3) to reduce energy-derived CO2 emissions by 25 per cent from the 2013 level.18
In July 2015, the “Long-Term Energy Supply and Demand Outlook” was formulated. Discussions are ongoing on how to aim for stable supply, economic efficiency, and environmental adaptation, whilst also strengthening energy security. As of 2015, renewable energy accounted for 12.3 per cent of the power supply composition in Japan. In this Outlook, the power supply composition target for 2030 was set as follows: 22–24 per cent for renewable energy, 20–22 per cent for nuclear power and approximately 53 per cent for thermal power. 19
In order to achieve this goal, an FIT framework was developed and introduced in 2012. Tariffs are set for each renewable ener-gy category (wind, solar, geothermal, hydropower, biomass) and are revised annually based on the degree of circulation and market conditions of generation for each renewable energy source. The FIT framework requires electric utility companies to purchase electricity produced from renewable energy sour-ces at a higher price than that of conventional fossil fuel-based energy. The purchase period set for tariffs is 20 years. Thus, an additional cost was added to consumers’ electricity bills. The FIT is designed so that authorities at all levels have a mandate to promote renewable energy.
Barriers to small hydropower developmentThe general situation with barriers to small hydropower de-velopment in Japan has not changed dramatically compared to the WSHDPR 2016.12 The barriers are complex, and include legal, social, technical and human resources problems. They are outlined below:• A need for discussion on details of electricity market
liberalization, including who will bear the costs of system connection and wide-area maintenance and how to formulate disclosure rules for related information
• Difficulties with building a wholesale electricity market• The power system reform is a critical issue for the
promotion of renewable energy in Japan. In April 2013, the Cabinet approved the “Basic Idea of Electric
54
World Small HydropoWer development report 2019
Power System Reform”, which laid out three goals: to ensure a stable supply of electricity, to minimize electricity charges, and to expand customer options and business opportunities for supply and business operators.20
• A need for consensus building and the realignment of water rights with water users, since the development of rules in relation to water resource management based on public interest is vital.
• A lack of skilled workers in the small hydropower field. Japanese companies developed high-quality technologies for large-scale hydropower, such as reservoir construction, big turbines and generators, electrical control systems, but in the field of small-scale hydropower there is an insufficient capacity to make accurate assessments regarding site selection, planning and design, independent grid control, and turbine and generator systems for a small discharge and a low head.12,21,22
• Insufficient human resources in coordinating production and planning of sustainable small hydropower at the local level. Sustainable planning for small hydropower requires that not only technical, social and legal aspects but also economic and environmental aspects be unified in one single plan for a sustainable community in the future.
• Small hydropower in Japan is mainly a community-based resource. Therefore, each community needs to be the controlling and operating actor in order to circulate expertise as well as to control and utilize water and other natural resources.
References
1. Statistics Bureau, Ministry of Internal Affairs and Communication (2017). Statistics. Available from http://www.stat.go.jp/data/jinsui/new.htm
2. Japan Institute of Country-ology and Engineering (n.d.). Statistics. Available from http://www.jice.or.jp/knowledge/japan
3. Japan Meteorological Agency (n.d.). Statistics. Available from http://www.data.jma.go.jp/obd/stats/etrn/index.php
4. Ministry of Land, Infrastructure, Transport and Tourism (2017). The Data Book of the River in Japan. Available from http://www.mlit.go.jp/river/toukei_chousa/kasen_DB_2017.pdf
5. Ministry of Economy, Trade and Industry, Agency for Natural Resources and Energy (n.d.). Statistics. Available from http://www.enecho.meti.go.jp/statistics/electric_power/ep002/results_archive.html
6. Orcutt, M. (2017). The Numbers Behind Japan’s Renewed Embrace of Nuclear. MIT Technology Review. 11 March 2014. Available from https://www.technologyreview.com/s/525421/the-numbers-behind-japans-renewed-embrace-of-nuclear/
7. Sasai, T. (2018). All utilities lack disposal sites dor low-level waste from reactors. Asahi. 16 February 2018. Available from http://www.asahi.com/ajw/articles/AJ201802160049.html
8. Klippenstein, M. (2018). In Hydrogen, Japan Sees the Next Liquefied Natural Gas. Greentech Media. 6 April 2018. Available from https://www.greentechmedia.com/articles/read/in-hydrogen-japan-sees-the-next-lng#gs.7yklWjg
9. International Energy Agency (2016). Energy Policies of IEA Countries: Japan. Available from https://www.iea.org/publications/freepublications/publication/
EnergyPoliciesofIEACountriesJapan2016.pdf10. Kobayashi, T. & Okatani, Sh. (2017). Electricity regulation
in Japan: overview. Thompson Reuters Practical Law. 1 June 2017. Available from https://uk.practicallaw.thomsonreuters.com/5-630-3729?transitionType=Default&contextData=(sc.Default)&firstPage=true&bhcp=1
11. Liu, H., Masera, D. and Esser, L., eds. World Small Hydropower Development Report 2013, United Nations Industrial Development Organization; International Center on Small Hydro Power (2013)
12. The World Small Hydropower Development Report 2016: United Nations Industrial Development Organization, Vienna, and International Center on Small Hydro Power, Hangzhou (2016). Available from www.smallhydroworld.org
13. Ministry of Economy, Trade and Industry, Agency for Natural Resources and Energy (n.d.) Statistics. Available from http://www.enecho.meti.go.jp/category/electricity_and_gas/electric/hydroelectric/database/energy_japan006/
14. Kanagawa, H. (n.d.). Energy 2018| Japan. Global Legal Insights. Available from https://www.globallegalinsights.com/practice-areas/energy-laws-and-regulations/japan
15. Kyoto City Water Supply and Sewage Bureau (n.d.). Available from http://www.city.kyoto.lg.jp/suido/page/0000072016.html
16. Murota T., Kurasaka H., Kobayashi H., Shimatani Y., Yamashita T., Fujimoto T., Miura S., Morotomi T. (2013) Community Energy. Nobunkyou, Tokyo, Japan. Japan,
17. New Energy Foundation (n.d.). Available from www.nef.or.jp/english/index.html
18. Ministry of Economy, Trade and industry (2014). Strategic Energy Plan the Fourth Version. Available from http://www.enecho.meti.go.jp/category/others/basic_plan/pdf/140411.pdf
19. Ministry of Economy, Trade and Industry (2015). Long-Term Energy Supply and Demand Outlook. Available from http://www.enecho.meti.go.jp/committee/council/basic_policy_subcommittee/mitoshi/pdf/report_01.pdf
20. Ministry of Economy, Trade and Industry (2013). Basic Idea of Electric Power System Reform Available from http://www.enecho.meti.go.jp/category/electricity_and_gas/electric/system_reform002/pdf/20130515-2-2.pdf
21. Takagi M., Watanabe Y., Ikematsu S., Hayashi T., Fujimoto T., Shimatani Y. (2014). 3D-Printed Pelton Turbine: How to Produce Effective Technology Linked with Global Knowledge. Energy Procedia, 61, 1593-1596. Available from https://www.sciencedirect.com/science/article/pii/S1876610214032081?via%3Dihub
22. Watanabe Y., Alam Z., Rusmiputro R., Sato T., Kumar A., Fujimoto T. (2018). Combined Small Hydropower Technologies in Asia: Indonesian Turbine, Japanese Electrical Control and Indian Calculating Model. Proceedings of the International Conference on Grand Renewable Energy 2018 in Yokohama, Japan
23. Agency for Natural Resources and Energy (2018). Statistics of Feed-in Tariff. Available from https://www.fit-portal.go.jp/PublicInfoSummary
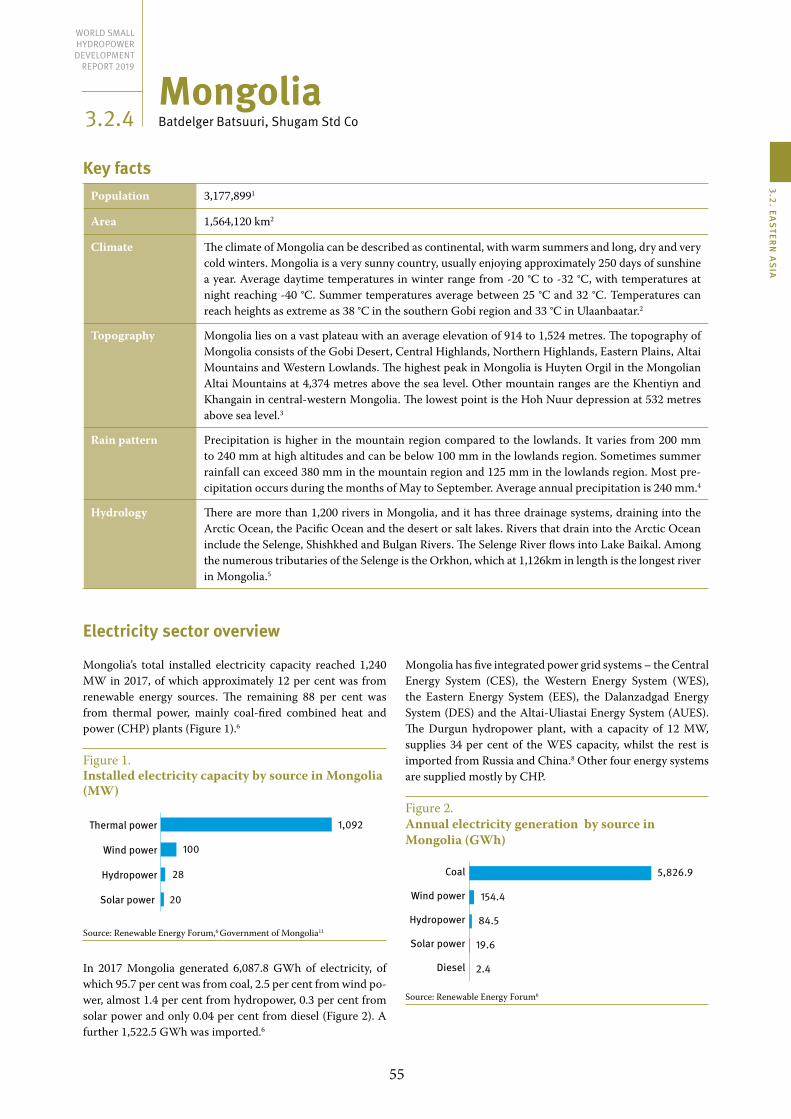
55
3.2. EAS
TERN
AS
IA
MongoliaBatdelger Batsuuri, Shugam Std Co
Key factsPopulation 3,177,8991
Area 1,564,120 km2
Climate The climate of Mongolia can be described as continental, with warm summers and long, dry and very cold winters. Mongolia is a very sunny country, usually enjoying approximately 250 days of sunshine a year. Average daytime temperatures in winter range from -20 °C to -32 °C, with temperatures at night reaching -40 °C. Summer temperatures average between 25 °C and 32 °C. Temperatures can reach heights as extreme as 38 °C in the southern Gobi region and 33 °C in Ulaanbaatar.2
Topography Mongolia lies on a vast plateau with an average elevation of 914 to 1,524 metres. The topography of Mongolia consists of the Gobi Desert, Central Highlands, Northern Highlands, Eastern Plains, Altai Mountains and Western Lowlands. The highest peak in Mongolia is Huyten Orgil in the Mongolian Altai Mountains at 4,374 metres above the sea level. Other mountain ranges are the Khentiyn and Khangain in central-western Mongolia. The lowest point is the Hoh Nuur depression at 532 metres above sea level.3
Rain pattern Precipitation is higher in the mountain region compared to the lowlands. It varies from 200 mm to 240 mm at high altitudes and can be below 100 mm in the lowlands region. Sometimes summer rainfall can exceed 380 mm in the mountain region and 125 mm in the lowlands region. Most pre-cipitation occurs during the months of May to September. Average annual precipitation is 240 mm.4
Hydrology There are more than 1,200 rivers in Mongolia, and it has three drainage systems, draining into the Arctic Ocean, the Pacific Ocean and the desert or salt lakes. Rivers that drain into the Arctic Ocean include the Selenge, Shishkhed and Bulgan Rivers. The Selenge River flows into Lake Baikal. Among the numerous tributaries of the Selenge is the Orkhon, which at 1,126km in length is the longest river in Mongolia.5
Electricity sector overview
Mongolia’s total installed electricity capacity reached 1,240 MW in 2017, of which approximately 12 per cent was from renewable energy sources. The remaining 88 per cent was from thermal power, mainly coal-fired combined heat and power (CHP) plants (Figure 1).6
Figure 1. Installed electricity capacity by source in Mongolia (MW)
Thermal power
Wind power
Hydropower
Solar power
1,092
100
28
20
Source: Renewable Energy Forum,6 Government of Mongolia11
In 2017 Mongolia generated 6,087.8 GWh of electricity, of which 95.7 per cent was from coal, 2.5 per cent from wind po-wer, almost 1.4 per cent from hydropower, 0.3 per cent from solar power and only 0.04 per cent from diesel (Figure 2). A further 1,522.5 GWh was imported.6
Mongolia has five integrated power grid systems – the Central Energy System (CES), the Western Energy System (WES), the Eastern Energy System (EES), the Dalanzadgad Energy System (DES) and the Altai-Uliastai Energy System (AUES). The Durgun hydropower plant, with a capacity of 12 MW, supplies 34 per cent of the WES capacity, whilst the rest is imported from Russia and China.8 Other four energy systems are supplied mostly by CHP.
Figure 2. Annual electricity generation by source in Mongolia (GWh)
0 1000 2000 3000 4000 5000 6000
Coal
Wind power
Hydropower
Solar power
Diesel
5,826.9
154.4
84.5
19.6
2.4
Source: Renewable Energy Forum6
3.2.4
World Small HydropoWEr dEvElopmEnt
rEport 2019

56
World Small HydropoWer development report 2019
In 2016, almost 82 per cent of the population had access to electricity, including 96 per cent in urban areas and 44 per cent in rural areas.9 Out of 330 districts (soums), 319 are connected to the grid. Two soums are connected to the Russian grid and eight soums are connected to the Chinese grid. One soum is fully supplied by renewable energy sources. In 2015, demand in the WES stood at 32 MW, while installed capacity was 12 MW. The AUES had 14 MW of electricity demand and 23 MW of installed capacity, the DES had 166 MW of demand and 27 MW of installed capacity, the EES had 33 MW of demand and 36 MW of installed capacity, and the CES had 979 MW of demand and 1,050 MW of installed capacity.7
The Energy Regulatory Commission (ERC) is an independent authority responsible for the regulation of the energy sector, including electricity generation, transmission, distribution, dispatching and supply, as well as licensing and electricity tariffs. The Ministry of Energy (MOE) is in charge of the country’s policies on the development of energy resources, including renewable energy sources, energy use, import and export, the construction of power plants and networks, energy conservation, the monitoring of the sector, the approval of regulations and international cooperation. The development of the renewable energy sector is managed by the state-owned National Renewable Energy Corporation (NREC), which is in charge of research, construction, the trade and production of equipment, and efficiency of renewable energy use. The electricity market works based on the single-buyer model (SBM), according to which the Central Regional Electricity Transmission Network buys the electricity produced by power plants in the central region, and imported electricity, and sells both to distribution companies.10
Electricity tariffs in Mongolia vary according to location and consumer type. The tariff for residential consumers in the Western Energy System and the Altai-Uliastai Energy System is 163.48 MNT/kWh (0.067 US$/kWh), whilst tariffs are set at 155.90 MNT/kWh (0.064 US$/kWh) for the Eastern Energy System and 167.78 MNT/kWh (0.068 US$/kWh) for the Central and Dalanzadgad Energy Systems.11
Small hydropower sector overview
Small hydropower (SHP) is defined in Mongolia as hydropower plants with installed capacity of up to 10 MW. Hydropower plants are further subdivided into mini- (0.1 MW – 1 MW) and micro-hydropower (0.05 MW – 0.1 MW).
Mongolia has 11 small hydropower plants with a combined capacity of 5.22 MW.12 The total potential of SHP is unknown. However based on projects that have already been planned, it is possible to conclude that there exists at least 27 MW of available potential.12,13 Compared to the World Small Hydropower Development Report (WSHPDR) 2016, installed capacity did not change (Figure 3).
Figure 3. Small hydropower capacities 2013/2016/2019 in Mongolia (MW)
0 5 10 15 20 25 30
PotentialCapacity
Installed Capacity
27 13 30
5 5 5
WSHPDR 2019WSHPDR 2016WSHPDR 2013
Source: WSHPDR 2016,10 Government of Mongolia,12 WSHPDR 201313
Note: The comparison is between data from WSHPDR 2013, WSHPDR 2016 and WSHPDR 2019.
In Mongolia, hydropower development started in the 1950s under the technical and economic assistance of the Soviet Union. The first developed hydropower project was the Kharkhorin plant with an installed capacity of 528 kW, which was built in 1959. As of July 2018, there were 13 hydropower plants with a combined installed capacity of approximately 28 MW (Table 2).12 Two of these are large hydropower plants, the 12 MW Durgun SHP and 11 MW Taishir SHP. There are also plans to build some small and large-scale hydropower plants in the near future, such as Yoroo SHP (9 MW), Zeergenet SHP (5-6 MW), Maikhan Tolgoi SHP (8-12 MW), Egiin gol HP (220 MW), Artsatiin HP (118 MW), Orkhon HP (100 MW) and Shuren HP (244 MW).12,13
Table 2.Hydropower plants in Mongolia
Name River Year commissioned
Capacity (kW)
Durgun Chono- Kharaikh 2008 12,000
Taishir Zavkhan 2008 11,000
Bogdiin Gol Gogdiin Gol 1997 2,000
Uench Uench 2006 960
Kharkhorin Orkhon 1959 528
Guulin Gogdiin Gol 1998 400
Tosontsengel Ider 2006 375
Erdenbulgan Eg 2006 200
Jigi Jigi 1989 200
Mankhan North Tsenker 1998 150
Munkh-khairkhan Tsenker 2003 150
Tsetsen Uul Khungui 2009 150
Zavkhan Mandal Galuutai 2009 110
Total 28,223 Source: Government of Mongolia12
Mongolia possesses a significant hydropower potential, with most of its hydropower resources being concentrated in the northern mountainous part of the country. The study carried out by the Institute of Water Policy of Mongolia in 1994

57
3.2. EAS
TERN
AS
IA
identified a gross theoretical potential of all rivers with a runoff of more than 1 m3/sec to be 6,400 MW, corresponding to the annual electricity generation of some 56 TWh. According to the 2013 Water Management Report by the Ministry of Green Development, the actual potential is between 20 and 60 per cent of this estimate, i.e. between 1,280 MW and 3,840 MW.12
Renewable energy policy
In 2007, Mongolia adopted the Law on Renewable Energy, which was again updated in 2015. The Government aims to create a national database of renewable energy resources and increase the share of renewable energy sources in the energy mix to 20 per cent by 2020 and to 30 per cent by 2030.6 The law also defines the feed-in tariffs (FIT) for renewable energy generators. According to the law, the tariff limits for on-grid and off-grid generation are set by the Energy Regulatory Commission (ERC). Changes in the FIT scheme are planned to be introduced in autumn 2018.
Table 3.Feed-in tariffs for renewable energy sources in Mongolia
HydropowerWind power
Solar power< 0.5
MW0.5 MW - 2 MW
2 MW - 5 MW
Grid- connected
0.045-0.06
0.045-0.06
0.045-0.06
0.08-0.095
0.15-0.18
Stand alone 0.08-0.10
0.05-0.06
0.045-0.05
0.10-0.15 0.2-0.3
Source: Government of Mongolia14
Note: Prices are given in US$ per kWh.
Barriers to small hydropower developmentMongolia needs both large and small-scale hydropower to stabilize its energy sector and reduce its dependency on energy imports from Russia. However, planned large-scale hydropower projects have not yet been started because of a dispute with the Russian Federation over construction on the rivers feeding Lake Baikal.
There are a number of barriers to the further development of SHP in Mongolia:• The Government does not put much emphasis on hydro-
power projects compared to solar and wind power in its plans to develop the renewable energy sector, improve the country’s energy security and reduce the dependency on imports.
• There is a lack of low-interest loans that could support in-vestment by local companies in renewable energy projects.
• There have been some cases of SHP plants being aban-doned due to a lack of proper maintenance and skilled em-ployees (e.g. the Mankhan and Munkhkhairkhan plants).
• The majority of the population tend to believe that small-scale hydropower plants have the same highly adverse
impact on the environment as medium- and large-scale hydropower plants do, and therefore oppose the construc-tion of all hydropower plants.9
References
1. Mongolian Statistical Information Service (2018). Population. Available from http://www.1212.mn/stat.aspx?LIST_ID=976_L03
2. Weather (n.d.). Water and Climate information. Available from http://tsag-agaar.mn/
3. Mongolia Travel Advice (n.d.). Mongolia Topography: An overview. Available from http://www.mongolia-travel-advice.com/mongolia-topography.html
4. Information and Research Institute of Meteorology, Hydrology and Environment (2018). Official website. Available from http://www.icc.mn/index.php?&lang=en
5. Encyclopedia of the Nations (n.d.). Mongolia. Available from http://www.nationsencyclopedia.com/geography/Indonesia-to-Mongolia/Mongolia.html
6. The 9th National Renewable Energy Forum Journal (2018). Renewable energy current situation and grid and investment framework. Ulaanbaatar, Mongolia, 24 May 2018, pp 70-80
7. Ministry of Energy (2017). The status of the power energy sector. Ulaanbaatar, 2017. Available from http://www.jcm-mongolia.com/wp-content/uploads/2015/10/%D0%AD%D0%A5%D0%AF-NDC-forum.pdf
8. Ministry of Energy (2017). Energy Sector of Mongolia, Policy and Challenges. Available from https://eneken.ieej.or.jp/data/7391.pdf
9. World Bank (2016). Mongolia. Available from https://data.worldbank.org/country/mongolia
10. The World Small Hydropower Development Report 2016. United Nations Industrial Development Organization, Vienna; International Center on Small Hydro Power, Hangzhou. Available from www.smallhydroworld.org
11. Energy Regulatory Commission (2017). Energy tariffs. Available from http://erc.gov.mn/erchim-huchnii-une-tarif
12. Government of Mongolia (2015). Scaling up Renewable Energy Programme (SREP). Investment Plan for Mongolia. Available from https://www.climateinvestmentfunds.org/sites/cif_enc/files/srep_ip_mongolia_final_14_dec_2015-latest.pdf
13. LIU, H., Masera, D. and Esser, L., eds. (2013). World Small Hydropower Development Report 2013, United Nations Industrial Development Organization; International Center on Small Hydro Power. Available from www.smallhydroworld.org
14. Government of Mongolia (2012). Law of Mongolia on Renewable Energy. Available from https://policy.asiapacificenergy.org/sites/default/files/Law%20of%20Mongolia%20on%20Renewable%20Energy.pdf

58
The Republic of KoreaSeung oh lee and don Hyun Kim, School of Urban and Civil Engineering, Hongik University
Key factsPopulation 51,696,0001
Area 100,284 km2
Climate The Republic of Korea is located in the mid-latitude climate zone and has four distinct seasons. Winters are cold and dry due to the influence of the cold and dry continental high-pressure front, while summers are hot and humid due to the North Pacific high-pressure front. In spring and autumn, weather is predominantly clear and dry due to migratory anticyclones. The annual mean temperature is between 10 °C and 15 °C in most parts of the country, excluding the island and middle mountainous regions. The hottest month is August, when average temperatures range between 23 °C and 26 °C, and the coldest month is January, when average temperatures range between -6 °C and 3 °C.2
Topography The territory of the country lies between 0 and 1,950 metres in altitude. Approximately 28 per cent of the territory lies below 100 metres above sea level. Fifty-two per cent of the territory lies below 300 metres above sea level, and only 5 per cent lies above 1,600 metres. Low-altitude areas lying below 300 metres stretch along coastal and plain areas. The terrain is predominantly mountainous. Low mountains occupy 26 per cent of the area, middle mountains 22 per cent and the high-slope area 11 per cent, while lowlands cover approximately 19 per cent. The highest peak is Mount Halla, located on Jeju Island.3
Rain pattern Average annual precipitation is 1,277 mm. There is a large variation of precipitation across regions. Thus, annual precipitation ranges between 1,200 and 1,500 mm in the central region, between 1,000 and 1,800 mm in the southern region, between 1,000 and 1,300 mm in Gyeongbuk, between 1,500 and 1,900 mm in Jeju island and is approximately 1,800 mm in some parts of the Gyeongnam coast. Between 50 and 60 per cent of annual precipitation happens in summer, from June to September, i.e. during the flood season, which complicates the multi-purpose use of water and flood control.2
Hydrology The Republic of Korea is divided into five river basins: the Hangang River basin, the Geumgang River basin and the Youngsangang river basin in the west, and the Seomjingang River basin and the Nak-donggang River basin in the south and the east. Due to the predominantly mountainous terrain of the country, rivers have steep slopes. As a result, sudden floods occur rather frequently. The coefficient of flow rate fluctuation is between 90 and 270 because of the small runoff in the dry season. The annual average water resources of the country are estimated at 129.7 billion m3, however, available water resources are estimated at only 75.3 billion m3 (58 per cent). The rest is lost due to evaporation.4
Electricity sector overview
In December 2017, the installed capacity of power plants in the Republic of Korea was 116,908 MW (Figure 1). The installed capacity of hydropower plants was 6,490 MW, accounting for 5.6 per cent of the total installed capacity. The total installed capacity of hydropower plants comprised 4,700 MW of pumped-storage plants, 1,582 MW of large hydropower and 208 MW of small hydropower.5
In 2015, electricity generation the Republic of Korea reached 552,876 GWh. Coal, nuclear power, gas and oil combined accounted for 97 per cent of electricity generation, while hydropower accounted for only 1 per cent (Figure 2). The country has a 97 per cent dependence on energy imports due to its limited domestic energy sources.7
Figure 1. Installed electricity capacity by source in the Republic of Korea (MW)
Gas
Coal
Nuclear power
Hydropower
Solar PV
Oil
Other
Wind power
37,832.7
36,697.8
22,528.7
6,489.5
5,062.3
4,150.6
2,931.3
1,214.8
Source: EPSIS5
2.3.5
World Small HydropoWEr dEvElopmEnt
rEport 2019

59
3.2. EAS
TERN
AS
IA
Figure 2. Annual electricity generation by source in the Republic of Korea (GWh)
164,762
122,856
12,518
5,796
3,880
2,487
1,631
1,201
663
496
CoalNuclear
powerGas
Oil
Hydropower
Solar PV
Biofuels
Other
Wind
Waste
Tide
236,586
Source: IEA7
One hundred per cent of the population in the Republic of Korea have access to electricity.6 In 2016, domestic electricity consumption amounted to 497.1 TWh, including 270.0 TWh for industrial use, 160.9 TWh for commercial use and 66.2 TWh for residential use. This represented increases of 1.6 per cent, 4.3 per cent and 3.7 per cent respectively compared to 2015. The peak power in 2016 was recorded at 85.2 GW in August, which corresponded to a 10.7 per cent increase compared to the same period in 2015. Such an increase was due to an abnormally high temperature. Usually the maximum power generation point of the year falls on the winter season.8 In the years 2012-2016, a significant reduction of the average annual growth rate of electricity consumption was achieved as a result of measures such as an electricity saving operation and increased electricity rates. However, electricity consumption started accelerating again in 2015, reaching an annual growth rate of 2.8 per cent in 2016 (Figure 3).8
Figure 3. Annual electricity consumption 2007-2016
Growth rate (%)Electricity consumption (TWh)
2007
2008
2009
2010
2011
2012
2013
2014
2015
2016
350
400
450
500
550
600
-30-25-20-15-10-5051015
5.7
369
4.5
385395
2.4
10.1
434
4.8
455
2.5
467
1.8
475
0.6
478
1.3
484
2.8
497
Source: Ministry of Trade, Industry and Energy8
Competition in the electricity market was introduced following the restructuring of the state-owned utility Korea Electric Power Corporation (KEPCO), which used to have a monopoly. KEPCO remained responsible for power transmission, distribution and sales but was banned from direct production of electricity. It was also divided into six subsidiaries: the Korea Hydro & Nuclear Power Company, the Korea South-East Power Company, the Korea Midland Power Company, the Korea Western Power Company, the Korea Southern Power Company and the Korea East-West Power Company. They are now competing with a large number of other electricity companies, including other public corporations such as the Korea District Heating Corporation, the Korea Water Resources Corporation, and private companies, as well as a large number of private groups with business operators. However, the six subsidiaries of KEPCO retain control over 70.1 per cent of the country’s total installed capacity.5
After the blackout in September 2011, the Government faced the need to thoroughly inspect the power supply and power system operations. Supplementary measures were provided to ensure a stable supply and demand of electricity. In parti-cular, the country shifted from a traditional electricity supply policy focused on expanding supply to a creative and environ-mentally friendly policy based on demand management.15
In line with the Government Plan for Electricity Supply and Demand, the Electrical Industry Law was amended in March 2017 to emphasize the harmonization of electricity supply policies with environmental and public safety objectives, and a demand plan focused on stability and economy.8 As a result of the growing public concern regarding the safety of domestic nuclear power plants, with a large number of plants having been investigated after the Gyeongju earthquake (12 September 2016) and the Pohang earthquake (15 December 2017), the Government announced a plan to gradually reduce the number of nuclear power plants and instead increase the share of renewable energy to 20 per cent of total electricity generation by 2030.8 In addition, as high concentrations of fine dust have become a big social issue, the Government promised to reduce emissions by more than 30 per cent as a countermeasure against fine dust sources. The Government also promoted the abolition of old coal and conversion of coal power plants to liquefied natural gas (LNG).8
Electricity tariffs in the Republic of Korea have been increasing since 2007. They were raised 1 or 2 times every year from 2007 to 2013, and were not adjusted in 2014 and 2015. There was no significant change in the electricity tariff system in 2016. However, in December 2016 various opinions were considered to revise the electricity tariff system, including easing the progressive electricity rates system for residential use, and increasing discounts for disadvantaged groups of the population, education use and eco-friendly investment rates. The structure of progressive electricity rates was changed from the six stages to three stages, and the subdivided sections were expanded from 100 kWh to 200 kWh.17 The price of domestic electricity sales is determined by the Korea Power Exchange (KPX) based on demand and

60
World Small HydropoWer development report 2019
supply. Electricity sale prices are classified into industrial, general, residential, educational, and agricultural use (Table 1). KPX is also in charge of such functions as the operation of the electricity market, operation of the power system, real-time dispatch operations, and the basic plan of power supply and demand in the domestic electricity sector to ensure fair and transparent electricity trading between power generation companies and sales companies.
Table 1.Electricity sales prices by use
Year
Industrial use
(KRW/ kWh
(US$/kWh))
General use
(KRW/kWh
(US$/kWh))
Residential use
(KRW/kWh
(US$/kWh))
Educational use
(KRW/kWh
(US$/kWh))
Agricultural use
(KRW/kWh
(US$/kWh))
2006 61.92 (0.057)
97.91 (0.091)
114.33 (0.110)
77.48 (0.072)
42.96 (0.040)
2011 81.23 (0.075)
101.69 (0.094)
119.99 (0.111)
94.18 (0.087)
42.72 (0.039)
2016 107.11 (0.099)
130.41 (0.121)
121.52 (0.112)
111.51 (0.103)
47.41 (0.044)
Source: Ministry of Trade, Industry and Energy8
Small hydropower sector overview
In the Republic of Korea, hydropower with a capacity of less than 10 MW is classified as small hydropower. Previously, in accordance with the Alternative Energy Development and Utilization Promotion Act (1987), hydropower plants with a capacity of less than 3 MW were classified as small hydropower. However in 2003 the law was amended to define hydropower plants with a capacity of less than 10 MW as small hydropower.9 In 2005 the New Energy and Renewable Energy Development, Use, and Spread Promotion Law was amended to remove the legal range for small hydropower capacity and unify all hydropower facilities regardless of their installed capacity, excluding pumped-storage plants.
Figure 4. Small hydropower capacities 2013/2016/2019 in the Republic of Korea (MW)
0 300 600 900 1200 1500
PotentialCapacity
Installed Capacity
1,500.0 1,500.0 1,500.0
189.7 159.4 65.0
WSHPDR 2019WSHPDR 2016WSHPDR 2013
Source: EPSIS,5 KNREC,10 WSHPDR 2013,11 WSHPDR 201612
Note: The comparison is between data from WSHPDR 2013, WSHPDR 2016
and WSHPDR 2019.
As of December 2015, there were 240 small hydropower plants with a capacity of 189.7 MW (Table 2) and an annual output of 606,422 MWh in 2015.10 Thus, in the year 2015,
small hydropower accounted for 10.5 per cent of electricity generated by all hydropower plants in the country including pumped-storage plants. The potential of small hydropower in the Republic of Korea is estimated at 1,500 MW.10 Thus compared to the World Small Hydropower Development Report (WSHPDR) 2016, with the introduction of 132 new plants, the installed capacity of small hydropower in the country increased by 19 per cent, whereas potential remained unchanged (Figure 4).
Table 2.Installed small hydropower capacities in the Republic of Korea
Owner Number of SHP plants
Capacity(MW)
Share of total SHP
capacity (%)
KEPCO subsidiaries 37 48.9 25.8
K-Water 81 85.1 44.9
Private power generation companies
122 55.7 29.4
Total 240 189.7 100.0 Source: EPSIS5
The theoretical potential of hydropower in the Republic of Korea is 36,000 MW, the geographical potential is 19,000 MW and the technical potential is 15,000 MW (Table 3).9 Besides the potential on small rivers, small hydropower turbines can also be installed at agricultural reservoirs, agricultural weirs, sewage waste treatment plants, water treatment plants and multi-purpose dams.10
Table 3.Hydropower potential in the Republic of Korea
Potential Potential capacity (GW)
Potential generation (TWh/yr)
Theoretical potential 36 313
Geographical potential 19 164
Technical potential 15 53 Source: EPSIS5
The Government defines a plan for the implementation of renewable energy projects, including small hydropower, for each year. Since 2001, the development of small hydropower has been stimulated by the financial support scheme of Renewable Energy Certificates (REC), electricity sales, and a steady decline in development prices. As a result, the conditions for participation in the development of small hydropower have improved greatly. In 2014-2016, 132 new small hydropower plants with a combined installed capacity of approximately 30 MW were commissioned, most of them being privately owned.10,18 At present, the Renewable Energy Portfolio Standard (RPS), which enforces power producers to supply a certain amount of electricity from new or renewable energy sources, is limited to hydropower plants with an

61
3.2. EAS
TERN
AS
IA
installed capacity of 5 MW or less. According to the RPS implemented in January 2012, hydropower below 5 MW can be sold in the REC trading market by issuing a Renewable Energy Certificate (REC).10
From 2008 to 2015, financial support provided by the Government reached KRW 35 billion (US$ 0.03 billion) and was mainly focused on automation and unmanned technology, small-scale turbine development and electricity technology. Technology development in the domestic hydropower sector has been fostered through the Government-led research and development. Initially, research projects were carried out mainly by the Korea Institute of Energy Research and Daeyang Electric. In recent years, research and development of 10 MW and 50 MW power plants have been carried out to study small hydropower and to modernize large-scale hydropower.10
Renewable energy policy
In 2015, the Government adopted the “2030 Energy New Industry Diffusion Strategy” to create new energy markets such as energy prosumers, low carbon power generation, electric vehicles, and eco-friendly processes. In addition, the strategy emphasizes the role of the Government in establis-hing new markets estimated at KRW 100 trillion (US$ 0.09 trillion), creating 500,000 new jobs and reducing greenhouse gas emissions by 55 million tons.13 The Fourth Basic Plan for Renewable Energy (2014) set the targets for the share of rene-wable energy in primary energy supply. These targets envision renewable energies accounting for 5.0 per cent of the total primary energy supply in 2020, 7.7 per cent in 2025, 9.7 per cent in 2030, and 11.0 per cent in 2035. The plan also outlined the following six strategies for improving the renewable ener-gy supply and supporting business environment:• Promotion of a customized diffusion policy;• Operation of a market-friendly system;• Expansion of renewable energy in foreign markets;• Creation of a New Renewable Energy Market;• Strengthening R&D competency in the renewable energy
field;• Expansion of the institutional support base.14
In the field of small hydropower, three directions of develop-ment have been set out: research and exploitation of the hydro-power resources, localization and standardization of the power generation technologies, and the development of the perfor-mance evaluation technology of water turbine generators.
The Government has been providing support to renewable energy projects, including support to households installing renewable energy plants and support with the installation of power plants. The Government has also been developing certification criteria and standards for renewable energy. The Government estimates that it is necessary to continue to invest in R&D to comply with advanced technologies in the field of renewable energy and promote technology commercialization. To support R&D in the field, a special fund for energy and resources projects and a fund for the electric power industry were established. From 1988 to 2015,
the total amount of investment in the field reached KRW 5,208 billion (US$ 4.8 billion), of which government subsidies amounted to KRW 2,388 billion (US$ 2.2 billion), and private investment amounted to KRW 2,636 billion (US$ 2.4 billion), accounting for 47 per cent and 53 per cent of total investment respectively.10
Barriers to small hydropower developmentThe major barriers hindering the development of small hy-dropower in the Republic of Korea include:• Seasonal variability of rainfall, as a result of which hydro-
power is considered to be economically inferior to other energy sources;
• Complaints of local residents and environmental groups in the areas of plant development;
• A need for local technology development and standard-ization;
• A need to revise relevant laws and regulations for un-manned automation systems to reduce labour costs and improve reliability of small power plants.10
Therefore, it is necessary to develop a strategy for providing support to the sector through continuous technology development, strengthened financial support, the promotion of understanding and cooperation among local residents around development sites and the encouragement of the development of small hydropower at existing facilities.
References
1. Korea Statistical Information Service (n.d.). Available from http://kosis.kr/search/search.do
2. Korea Meteorological Administration (n.d.). Weather. Available from http://www.weather.go.kr/weather/climate/average_south.jsp
3. Korea National Geographic Information Institute (n.d.). Reports. Available from http://www.ngii.go.kr/kor/board/list.do?rbsIdx=107&page=1
4. Ministry of Land, Infrastructure, and Transport (2013). Long-term Water Resources Comprehensive Plans (2011-2020). Available from http://www.molit.go.kr/USR/BORD0201/m_34879/DTL.jsp?mode=view&idx=30064
5. Electric Power Statistics Information System (EPSIS) (2017). Power System. Available from http://epsis.kpx.or.kr/epsisnew/selectEkifBoardList.do?menuId=090120&boardId=003120, 2017
6. Korea Electric Power Corporation (KEPCO) (n.d.). Overview of Korea’s Electric Power Industry. Available from http://home.kepco.co.kr/kepco/EN/B/htmlView/ENBAHP001.do?menuCd=EN020101
7. International Energy Agency (2015). Korea: Electricity and heat 2015. Available from http://www.iea.org/statistics/statistics-search/report/?country=KOREA=&product=electricityand-geat&year=Select
8. Ministry of Trade, Industry and Energy (2017). The 8th Basic Plan for Long-term Electricity Supply and Demand (2017-2031). Available from http://www.kpx.or.kr/www/contents.do?key=92
62
9. Korea New Renewable Energy Center (KNREC) (n.d.). Hydro-power. Available from http://www.knrec.or.kr/energy/waterpow-er_intro.aspx
10. Korea New Renewable Energy Center (KNREC) (2017). New & Renewable energy White Paper, Ministry of Trade, Industry and Energy, Available from http://www.knrec.or.kr/knrec/13/KNREC130110.asp?idx=2456&page=1&num=1195&Search=&-SearchString=
11. LIU, H., Masera, D. and Esser, L., eds. (2013). World Small Hy-dropower Development Report 2013. United Nations Industrial Development Organization; International Center on Small Hy-dro Power (2013) Available from www.smallhydroworld.org
12. The World Small Hydropower Development Report 2016. United Nations Industrial Development Organization, Vienna; Interna-tional Center on Small Hydro Power, Hangzhou. Available from www.smallhydroworld.org
13. Kim, K.H. (2016). 2030 Energy New Industry Diffusion Strategy for dealing with the new climate system. The World of Electricity 65, no.1, January 2016, pp. 31-38
14. Ministry of Trade, Industry and Energy (2014). The 4th Basic Plan for Renewable Energy. Available from http://www.eaa.or.kr/top_menu/gov_policy/index.php?fidx=342
15. Kim, J. W. & Sim, W. B. (2006). Evaluation Framework for Water Demand Management. Korea Research Institute for Human Settlements
16. GSCaltex (2017). Reorganization of electricity rate progres-sive system, Oil and Energy Magazine. Available from https://gscaltexmediahub.com/energy/electricity-cost-reform-mean-ing-and-future-direction/
17. Lee, G. B. & Lee, E. W. (2005). Overview and Trend of Small Hy-dropower Development in Korea. International Journal of fluid machinery and systems, pp. 735-741, 2005
18. Korea New Renewable Energy Center (n.d.). Statistics. Available from http://www.knrec.or.kr/pds/statistics.aspx
19. Central Intelligence Agency(n.d.). The world Fact Book. available from https://www.cia.gov/library/publications/the-world-fact-book/geos/ks.html

63
NEPAL
IRAN
PAKISTAN
INDIA
BHUTAN
SRI LANKA
TIMOR-LESTE
AFGHANISTAN
BANGLADESH
Southern Asiaarun Kumar, Indian Institute of technology roorkee
Introduction to the region
The region of Southern Asia comprises nine countries – Afghanistan, Bangladesh, Bhutan, India, Iran, the Maldives, Nepal, Pakistan and Sri Lanka. This report covers eight countries of the region that have hydropower potential, i.e. all of these countries except the Maldives.
The region boasts a diverse array of natural resources. India, Iran, Pakistan and Bangladesh account for the major natural gas and coal reserves, whereas Bhutan and Nepal have large hydropower resources. All of these countries have vast renewable energy potential.
However, there is a wide variation in energy resource endowments and energy demand among the countries. Thus, in India, Pakistan and Bangladesh, the pace of domestic electricity generation development is not able to cater to the growing demand. On the contrary, Bhutan and Nepal have hydropower potential in excess of their demand for electricity. This creates opportunities for intraregional energy cooperation and pushes the countries to search for optimal energy supply solutions for the entire region.
Energy sector cooperation in the region is focused on such issues as developing a regional power market, energy supply availability, energy trade infrastructure and harmonizing legal and regulatory frameworks. Moreover, there is also potential for inter-regional cooperation with neighbouring regions, in particular, Central Asia and Western Asia.10
An overview of the countries of Southern Asia is presented in Table 1. Access to electricity has been steadily increasing in the region, with all countries now having electrification rates above 75 per cent. In particular, Afghanistan has seen the most outstanding growth in electricity access, having reached 84 per cent compared with 15.5 per cent reported in the World Small Hydropower Development Report (WSHPDR) 2013.
The greatest share of the known small hydropower (SHP) installed capacity up to 10 MW in the region is located in Sri Lanka, with 51 per cent of the total (estimated at 697 MW) (Figure 1). However, this total estimate does not include the installed capacity of India and Pakistan, for which data up to 10 MW is not available (Table 2). Between the WSHPDR 2016 and WSHPDR 2019, the installed SHP capacity has increased mainly due to the new capacities introduced in India, Pakistan, Sri Lanka and Nepal (Figure 3).
3.3
World Small HydropoWEr dEvElopmEnt
rEport 2019

64
World Small HydropoWer development report 2019
Figure 1. Share of regional installed capacity of small hydropower up to 10 MW by country in Southern Asia (%)
Sri Lanka 51%Nepal 34%Afghanistan 11%Iran 3%Bhutan 1%Bangladesh 0.01%
Source: WSHPDR 20193
Note: Does not include India and Pakistan as data on capacity up to 10 MW is not available.
Table 1. Overview of countries in Southern Asia
CountryTotal
population (million)
Rural population
(%)
Electricity access
(%)
Electrical capacity
(MW)
Electricity generation
(GWh/year)
Hydropower capacity
(MW)
Hydropower generation
(GWh/year)
Afghanistan 35.5 75 84 623 1,098 308 930
Bangladesh 164.7 60 76 17,115 57,276 230 982
Bhutan 0.8 60 100 1,622 7,960 1,614 7,959
India 1,324.2 66 84 344,002 1,175,000 49,779 135,539
Iran 80.3 26 99 74,103 280,689 11,278 14,087
Nepal 29.0 81 91 1,077 4,082 1,021 3,635
Pakistan 207.8 64 99 35,372 133,836 8,689 28,562
Sri Lanka 21.4 82 99 4,018 14,341 1,726 4,221
Total 1,863.7 - - 477,932 1,674,282 74,645 195,915 Source: WSHPDR 2016,2 WSHPDR 2019,3 WB,4 WB,5 BPDB,6 IHA,7 IBN,8 CEB9
Small hydropower definitionThe classification of small hydropower (SHP) varies from country to country, with the upper limit ranging from 10 MW in Afg-hanistan, Iran and Sri Lanka to 50 MW in Pakistan (Table 2). Bangladesh has no official definition or classification of SHP. Nepal generally adheres to the 25 MW limit for SHP, however, it is not clearly defined in Government policy or legal documents.
Regional small hydropower overview and renewable energy policy
The region‘s climatic and physiographic settings create favourable conditions for hydropower development. Hence, all coun-tries of the region except Maldives have developed SHP. The known installed capacity of SHP up to 10 MW in Southern Asia is 697 MW (Table 2), which accounts for 16.6 per cent of the known SHP potential up to 10 MW (4,203 MW). However, this estimate does not include the installed capacities of India and Pakistan, as no data for SHP up to 10 MW is available for these countries. Also, the total potential of SHP up to 10 MW for Bhutan is not known.
The total SHP potential in the region according to the local definitions is estimated at approximately 48.5 GW. Thus, only 12 per cent of the known SHP potential according to the local definitions has been developed so far (Figure 2).
An overview of small hydropower in the countries of Southern Asia is outlined below. The information used in this section is extracted from the country profiles, which provide detailed information on small hydropower capacity and potential, among other energy-related information.
In Afghanistan, with the support of international institutions, the Government has developed 75.7 MW of SHP (up to 10 MW), which is approximately 6 per cent of the country‘s total SHP potential. Several more SHP projects are underway. Increa-sing access to electricity remains an important task for the Government. With the limited reach of regional grids, smaller scale off-grid units, including SHP plants, can play a significant role in the provision of electricity.

65
3.5. SO
UTH
ERN
AS
iA
Bangladesh has an SHP potential estimated to be at least 59.5 MW (for SHP up to 10 MW). The current installed capacity is 0.06 MW with two operating SHP plants.
Bhutan has four small and 20 mini/micro-hydropower plants (up to 25 MW) with the total installed capacity of 32.11 MW. The theoretical potential for SHP less than 25 MW, as was announced in 2016 as a part of the Renewable Energy Master Plan formulation, reaches 17,792 MW, indicating that SHP potential is largely untapped.
Table 2.Small hydropower capacities in Southern Asia (local and ICSHP definition) (MW)
Country Local SHP definition
Installed capacity (local def.)
Potential capacity (local def.)
Installed (<10 MW)
Potential (<10 MW)
Afghanistan up to 10 75.7 1,200.0 75.7 1,200.0
Bangladesh - - - 0.06 59.5
Bhutan up to 25 32.1 17,792.0 8.1 8.1*
India up to 25 4,485 21,134.0 N/A N/A
Iran up to 10 19.5 102.5 19.5 102.5
Nepal up to 25 446.8 4,196.2 236.2 1,959.5
Pakistan up to 50 410.0 3,100.0 N/A N/A
Sri Lanka up to 10 357.0 873.0 357.0 873.0
Total - - 697 4,203 Source: WSHPDR 20193
Note: * The estimate is based on the installed capacity as no data on potential capacity is available.
Figure 2. Utilized small hydropower potential by country in Southern Asia (local SHP definition) (%)
Additional SHP potential
Installed SHP capacity
0
20
40
60
80
100
Sri L
anka
Indi
a
Iran
Paki
stan
Nepa
l
Afgh
anis
tan
Bang
lade
sh
Bhut
an
TOTA
L
Source: WSHPDR 20193
Note: This Figure illustrates data for local SHP definitions or the definition up to 10 MW in case of the absence of an official local one.
The regional leader in terms of SHP is India with an estimated SHP potential (up to 25 MW) of 21,134 MW, of which 21 per cent (4,485 MW) has been developed. The country‘s SHP programme, administrated by the Ministry of New and Renewable Energy at the national level and the state electricity departments at the state level, receives major contributions from private investments. As a result, the major focus of the programme is to make SHP projects cost-effective and reliable. For this purpose, a range of documents have been issued covering various aspects of SHP activities for the use of developers, manufacturers, consultants and regulators. India has a strong equipment manufacturing base for development, including for export to other regions especially to Southern and Eastern Asia.
For Iran, the main source of electricity generation is fossil fuels, and hydropower accounts for only 5 per cent of the generated electricity. However, the Government aims to increase the share of renewable energy sources. The total installed capacity of SHP plants (up to 10 MW) has increased by 19 per cent compared with the WSHPDR 2016, having reached 19.5 MW. There is no clear information on the country‘s SHP potential capacity, however, based on the planned and ongoing projects, it can be estimated to be at least 102.48 MW with 82.98 MW of yet undeveloped potential.

66
World Small HydropoWer development report 2019
Nepal has an appreciable SHP potential (1,960 MW for SHP up to 10 MW and 4,196 MW for SHP up to 25 MW) and has extremely successful instances of implementing SHP programmes, especially micro-hydropower plants in isolated rural areas. This makes SHP crucial for the country‘s rural development. The total installed capacity of SHP plants up to 10 MW in Nepal is 236 MW. Almost all hydropower projects damaged in the earthquake in April 2015 have been restored. Nepal has well-structu-red institutions to facilitate the micro-hydropower development, including local manufacturing and skills for implementation.
Pakistan has a small hydropower potential (up to 50 MW) of 3,100 MW. So far, 13 per cent of this potential has been developed with 410 MW of installed capacity. The Government aims to boost the renewable energy sector through incentives, such as partial risk coverage, premium tariffs and guaranteed purchase. SHP projects in Pakistan are developed by provincial governments, in cooperation with the public sector, individuals and communities as well as other organizations.
Sri Lanka has 183 SHP plants (up to 10 MW) with a total installed capacity of 357 MW, which accounts for less than 41 per cent of the country’s total SHP potential. The development of SHP in the country is supported by the Sustainable Energy Authority (SEA), which aims to increase the share of renewable energy sources in electricity generation and promotes the participation of the private sector in renewable energy projects, including SHP. Sri Lanka has well-defined institutions to regulate and support SHP development.
Figure 3. Change in installed capacity of small hydropower from WSHPDR 2013 to 2019 by country in Southern Asia (MW)
0
1,000
2,000
3,000
4,000
5,000
6,000
4,485.0
410.0 357.0 236.2 75.7 32.1 19.5 0.06
5,615.6
Indi
a
Paki
stan
Sri L
anka
Nepa
l
Afgh
anis
tan
Bhut
an Iran
Bang
lade
sh
TOTA
L
WSHPDR 2019WSHPDR 2016WSHPDR 2013
Source: WSHPDR 2013,1 WSHPDR 2016,2 WSHPDR 20193
Note: WSHPDR stands for World Small Hydropower Development Report. For Bhutan and India, data is for SHP up to 25 MW; for Pakistan up to 50 MW; for other countries up to 10 MW.
Most countries in the region do not offer feed-in tariffs (FITs) for renewable energy, with India and Iran being the exceptions. However, in India there are no national FITs, but these can be introduced by the governments of the states. In order to boost the confidence among investors, the Bangladesh Electricity Regulatory Commission has prepared draft regulations for the implementation of FITs.
Barriers to small hydropower development
Most countries of the region have developed regulatory frameworks to facilitate SHP development, which has resulted in a significant increase in installed SHP capacity. However, countries still face a range of issues that hinder SHP development.
The barriers to SHP development in Afghanistan should be seen in the wider context of barriers to rural renewable energy expansion, since micro- to small hydropower is mostly used in rural areas. There is a significant lack of important data for the electricity sector, a limited technical human resources capacity and limitations of the grid in terms of geographic coverage and operational synchronization. Coupled with the lack of funding from both domestic and international sources as well as the instable political situation, these factors significantly complicate SHP development.
In Bangladesh, high installation costs, the lack of quality control, limited knowledge on renewable energy potential, limited

67
3.5. SO
UTH
ERN
AS
iA
availability of land and extreme weather events are the major barriers to renewable energy development. Specifically, SHP development is hampered by the lack of interest from the private sector due to the state subsidies for the electricity sector, a lack of interest in hydropower technologies and the flat terrain.
In Bhutan, SHP projects are viewed as costly compared to larger hydropower projects and, hence, have not been prioritized. The lack of an enabling environment, including the Renewable Energy Development Fund (REDF) to serve as the source of funding, feed-in tariffs and other mechanisms, does not allow SHP to be sustained alongside large hydropower projects.
The barriers for SHP development in India vary from state to state, depending on the availability of discharge data, site, feasibility reports and clearances. These barriers include the long process of obtaining project licences, clearances, permissions and finances; state governments’ lack of awareness and legal tools with which to regulate minimum flows in the streams; a lack of power evacuation infrastructure; lack of clarity regarding the ownership of SHP projects by state governments; lack of awareness among local populations and activists of the limited negative impacts of SHP; and the continuous increase in capital costs of SHP projects.
In Iran, due to limited water resources, a greater focus is being made on the development of medium and large hydropower plants, rather than SHP. Also, the sector faces a lack of investment, which delays the realization of some projects.
Nepal lacks clear and supportive policies and a regulatory framework that would facilitate SHP development. There are also certain barriers related to funding, such as limitations on bank financing and the lack of equity and mezzanine financing for project developers. Potential projects often have poor or no access to infrastructure or power evacuation lines. Also, young geology and high sedimentation rate increase the costs of construction and maintenance of SHP plants.
Although the future of SHP development in Pakistan is promising, some barriers still exist. In particular, due to the limited interest from local manufacturers to develop low cost electrical and mechanical equipment for SHP there is a dependence on foreign components, which increases the cost of projects, while the availability of financing remains limited. Additionally, a large number of institutions and departments are involved in the regulation and oversight of SHP, as a result of which projects might take much longer to approve. A significant hydropower potential is concentrated in the parts of the country that are not very densely populated and are quite remotely located to be connected to the national grid.
Although Sri Lanka is rich in hydropower resources, the country’s small hydropower sector has reached its maturity. The industry is still experiencing certain barriers, including legal issues in relation to the signing of power purchase agreements; the absence of a dedicated transmission solution for the uptake of power from SHP plants as well as limitations for adding more SHP to the grid; and the absence of a well-equipped monitoring system to ensure environmental compliance by operational plants. Due to the conflicting uses of water and land resources, there is public opposition to SHP projects, and the value generated from the projects has not always been equally shared with the affected local communities.
References
1. LIU, H., Masera, D. and Esser, L., eds. (2013). World Small Hydropower Development Report 2013. United Nations Industrial Development Organization; International Center on Small Hydro Power. Available from www.smallhydroworld.org.
2. Xialei, C., Singh, P. R., Xianlai, W., and Kremere, E., eds. (2016). World Small Hydropower Development Report 2016. United Nations Industrial Development Organization; International Center on Small Hydro Power. Available from www.smallhydroworld.org.
3. LIU, D., LIU, H., WANG, X., and Kremere, E., eds. (2019). World Small Hydropower Development Report 2019. United Nations Industrial Development Organization; International Center on Small Hydro Power. Available from www.smallhydroworld.org.
4. World Bank (2017). Rural population (% of total population). Available from https://data.worldbank.org/indicator/SP.RUR.TOTL.ZS
5. World Bank (2016). Access the electricity (% of population). Available from https://data.worldbank.org/indicator/EG.ELC.ACCS.ZS
6. Bangladesh Power Development Board (BPDB) (2017). Annual Report 2016-2017. Available from http://www.bpdb.gov.bd/bpdb_new/index.php/site/annual_reports
7. International Hydropower Association (IHA) (2018). 2018 hydropower status report: sector trends and insights. Available from https://www.hydropower.org/sites/default/files/publications-docs/2018_hydropower_status_report_0.pdf
8. Investment Board Nepal (IBN) (n.d.). Energy. Available from www.ibn.gov.np/energy
9. Ceylon Electricity Board (CEB) (2018). Statistical Digest 2016. Available from http://www.ceb.lk/index.php?aam_media=25917
10. Wijayatunga, P. & Fernando, P.N. (2013). South Asia Working Paper Series. An Overview of Energy Cooperation in South Asia. Available from http://www.adb.org/sites/default/files/publication/30262/overview-energy-cooperation-south-asia.pdf.

68
Islamic Republic of Afghanistan Ghulam mohd malikyar, national Environmental protection agency of the Islamic republic of afghanistan; and International Center on Small Hydro power (ICSHp)*
Key factsPopulation 35,530,0811
Area 652,230 km2
Climate Afghanistan is a mountainous and very dry country located in the arid sub-tropics at 29° to 37° north of the Equator. Afghanistan has an arid and semi-arid continental climate with cold winters and hot summers. The average temperature in summer (June to August) exceeds 33 °C and in winter (December to February) is around 10 °C. Much of the country lies at very high altitudes and experiences lower temperatures all year round, with average summer temperatures not exceeding 15 °C and winter temperatures below 0 °C in the highest regions.2
Topography Afghanistan is split east to west by the Hindu Kush mountain range, rising to 7,492 metres at Mount Noshaq. With the exception of the south-west, most of the country is covered by high mountains and traversed by deep valleys. Most of the land (some 63 per cent) is mountainous, using formal criteria based on slope and elevation, and more than a quarter (27 per cent) lies above 2,500 metres.2
Rain pattern More than 50 per cent of the country receives between 100 and 300 mm of rainfall per year. The remaining 50 per cent, except Ghore and Bamyan, receive 300-800 mm per year.2 On average, the wettest month is March (53 mm) and the driest is September (5.3 mm).3
Hydrology During the dry season, most rivers in Afghanistan become little rivulets. The rivers are mostly supported by mountain streams. These rivers have decent flows in spring, when snow on the mountains melts. An exception among Afghan rivers, the Kabul River, maintains a steady flow year-round. It flows east into Pakistan to merge into the Indus River. The longest river in Afghanistan, the Helmand River, originates in the Central Hindu Kush mountains. The river flows past the south-west region of the country, ending in Iran. Rising in central Afghanistan, the Harirud River moves west and north-west to the border with Iran. The water of the Harirud River is used extensively for irrigation purposes in the Herat region.4
Electricity sector overview
Electricity generation in 2017-2018 was 1,098 GWh, of which 85 per cent was from hydropower, 13 per cent from thermal power and 2 per cent from diesel (Figure 1).5 An additional 4,611 GWh was imported from Uzbekistan, Tajikistan, Iran, and Turkmenistan.5 Electricity consumption stood at 2,920 GWh.5 Imports satisfy a significant portion of the natio-nal energy consumption, which is expected to grow further. Power is imported via the North-East Power System.6,7 The electrification rate in Afghanistan in 2016 was 84 per cent, including 79 per cent in rural areas.8 1
Figure 1. Annual electricity generation by source in Afghanistan (GWh)
142.7
929.9
25.6
Hydropower
Thermal power
Diesel
Source: NSIA5
* WSHPDR 2016 updated by ICSHP
In 2016, total installed capacity was 623 MW. Thermal power accounted for 50 per cent, hydropower for almost 50 per cent as well, while solar power and wind power accounted for 0.3 and 0.03 per cent, respectively (Figure 2).9,10 However, according to the national capacity expansion plan, some 640 MW of new capacity is to be added between 2016 and 2020, and approximately 1,700 MW between 2020 and 2025. The majority of additional capacity is anticipated from large-scale natural gas and hydropower plants – 650 MW and 1,152 MW, respectively. However, the expansion of other sources of renewable energy (RE) is also expected to be significant – 171 MW of solar power, 120 MW of solar/hydropower, 100 MW of micro-hydropower, 100 MW of wind power, 20 MW of biomass, 20 MW of geothermal power, and 10 of solar/wind power plants.11
Da Afghanistan Breshna Sherkat (DABS) is a limited liability company with all its equity shares owned by the Government of Afghanistan. The company was incorporated on May 4, 2008 and replaced Da Afghanistan Breshna Moassassa (DABM) as the national power utility. DABS operates and manages electric power generation, import, transmission,
3.3.1
World Small HydropoWEr dEvElopmEnt
rEport 2019

69
3.5. SO
UTH
ERN
AS
iA
and distribution throughout Afghanistan on a commercial basis.7,12 Other key stakeholders of the energy sector of Afghanistan include:• The Energy Steering Committee (ESC), the highest
decision-making body in the energy sector;• Ministry of Energy and Water (MEW), which among other
things implements projects above 1 MW;• Ministry of Rural Rehabilitation and Development
(MRRD), which among other things directs rural RE and rural electrification promotion for projects up to 1 MW;
• Inter-ministerial Commission for Energy (ICE) and Renewable Energy Coordination Committee (RECC), which aim to improve coordination between MEW and MRRD.13
Figure 2. Installed electricity capacity by source in Afghanistan (MW)
Thermal power
Hydropower
Solar power
Wind power
312.5
308.4
1.9
0.2
Source: ICE9,10
Seven regional electricity grids exist with supply coming from domestic hydropower and thermal generation and imported power. The regional power systems are isolated and not synchronized with each other. Sections of the network can be operated at differing speeds and frequencies in order to interconnect with the neighbouring systems, which limits the opportunities for the interconnection of these regional grids and the improvement of security of supply. The electricity infrastructure has suffered considerable damage due to decades of war and operational neglect. Blackouts are frequent because power plants are not fully functional and the transmission and distribution networks have been depleted. High electrical losses in distribution and transmission networks contribute to further inefficiencies in the energy supply chain.7,13
Despite Afghanistan having the lowest per capita energy consumption in the South Asia region, demand continues to outstrip supply in every fuel category.7 Peak demand is fo-recasted to increase to 3,502 MW in 2032.13 The average price for electricity is approximately 0.17 US$/kWh.7
Recent government and donor initiatives have been focused on the expansion and rehabilitation of the electricity sector in the major economic hubs of Afghanistan as well as the pro-vision of basic services in rural areas. Efforts have also been made to:• Improve the supply of natural gas;• Increase availability of hydropower generation;• Rehabilitate the electricity transmission and distribution
systems;• Develop RE in rural and remote areas;
• Increase low-cost power imports;• Improve the capability of energy sector institutions.6,7
Small hydropower sector overview
The definition of small hydropower (SHP) in Afghanistan is up to 10 MW. As of March 2016, the installed capacity of SHP plants in Afghanistan was approximately 75.7 MW (Table 1).11,14 The SHP potential is estimated to be 1,200 MW.7 Compared to the World Small Hydropower Development Report (WSHPDR) 2016, installed capacity has decreased by approximately 6 per cent, which is due to access to more accurate data (Figure 3).
Figure 3. Small hydropower capacities 2013/2016/2019 in Afghanistan (MW)
0 200 400 600 800 1000 1200
PotentialCapacity
Installed Capacity
1,200.0 1,200.0 1,200.0
75.7 80.0 75.0
WSHPDR 2019WSHPDR 2016WSHPDR 2013
Source: WSHPDR 2016,7 ICE,10,14 WSHPDR 201315
Note: The comparison is between data from WSHPDR 2013, WSHPDR 2016 and WSHPDR 2019.
Table 1.Hydropower plants in Afghanistan
Name of the plant Installed capacity (MW)
Naghlu 100.00
Mahiper 66.00
Kajaki 33.00
Sorubi 22.00
Daronta 11.60
Pul-e-Khumri II 9.00
Chak-e-Wardak 3.30
Jabul-u-Saraj 2.72
Grishk 2.40
Charikar 2.40
Kunar (Asadabad) 0.70
Warsaj 0.50
Ghorband 0.40
Baharak 0.38
Baba Wali 0.32
Faghmbol 0.28
Istalif 0.20
Faizabad 0.18
Micro-hydropower plants 52.9 Source: ICE10,14
Note: Data as of 2016.
The total recoverable hydropower potential is estimated to

70
World Small HydropoWer development report 2019
exceed 23,000 MW, with the vast majority of it (approximately 20,000 MW) being located in the north-east on the Amu Darya, Panj and Kokcha Rivers. A further 1,900 MW is located to the east of Kabul, with over half of this on the Kunar River near the border with Pakistan. Balkh and Jowzan regions in the north-west have some 800 MW of potential, while the remaining resources of approximately 500 MW lie in the west-central part of Afghanistan.13
The SHP installed capacity of Afghanistan includes 13 hydropower plants with capacities between 100 kW and 10 MW, as well as numerous micro-hydropower plants of less than 100 kW.10,14 According to the World Bank, over 5,000 mini- and micro-hydropower plants feeding mini-grids in areas not yet connected to the national grid have been developed in the country under several support programmes.13 Some of the hydropower plants are operating below their rated capacities. However, a rehabilitation programme is underway and many plants have already been upgraded.13
Renewable energy policy
The limited reach of regional grids means that smaller scale off-grid renewable energy (RE) technologies, such as small hydropower, solar PV, solar thermal and wind, can play a significant role in the provision of energy. Afghanistan has significant renewable resources, primarily in the form of hydropower. In mountainous areas, there is sufficient head to make even very low flow streams effective, and glacier-fed streams provide year-round minimum water flow. Solar resources are also good given the high altitudes and approximately 300 days of sunshine a year, which could provide approximately 6.5 kWh/m2/day. The wind power potential is high in Herat province but less so in other regions. Geothermal resources may also be feasible in the longer term.7,16
Much progress has been made in recent years in relation to the introduction of the legal and regulatory framework to support the development of RE resources. The 2013 Power Sector Master Plan emphasizes the development of RE, specifically large-scale hydropower, as a source of supply. The Plan also stresses that the growing demand will be increasingly served through grid-based solutions and thus focuses on the extension and integration of the national grid. However, it also notes that as costs change over time, other grid-based renewable energy solutions such as large-scale wind and solar may find a place in the generation expansion plan.13
The specific objectives of the Afghanistan Rural Renewable Energy Policy (ARREP) of 2013 are to increase households’ income generation by increasing energy access, providing affordable, clean and sustainable lighting, heating and cooking devices, and reducing the health and environmental impacts of energy use. The ARREP is limited to RE and rural electrification through RE off-grid systems to supply energy needs for rural population.13
In line with the Government’s plan to meet 10 per cent
of national demand with RE by 2032 (350-450 MW), the Afghanistan National Renewable Energy Policy and Strategy focus on stimulating privately-financed projects, both small- and large-scale. According to the Policy, projects up to 200 kW can be implemented under the auspices of the MRRD, while projects of less than 15 kW that are implemented by parties other than the Government do not require licensing.13
The Environment Law of Afghanistan promulgated in 2007 requires planning for sustainable use, rehabilitation and conservation of biologic diversity. Environmental Impact Assessment (EIA), promulgated in 2008, established the process of conducting environmental assessments for development acitivities.7
Barriers to small hydropower developmentThe barriers to SHP in Afghanistan should be seen in the wi-der context of barriers to rural RE expansion, since micro- to small hydropower is mostly used in rural areas: • Weakness of the private sector for investment in rural
energy, despite an increase in the number of companies and entrepreneurs in recent years.
• The lack of important data for the electricity sector.• The lack of involvement of international financial
institutions with regard to support for the private sector.• A lack of concessionary loans (with sovereign guarantees)
provided for rural electrification projects and major organizations with international involvement in infrastructure development, environmental protection and support for private sector development.
• A deficit in cash-flow finance. Retail tariffs for electricity supply need to cover all operation and maintenance costs, but in reality, consumers are either unwilling or unable to pay for the full cost of supply, resulting in cash-flow deficits, and often a critical financial position of the utility or operator of an isolated mini-grid.
• Instability in the country is a constraint to the timely implementation of the Power Sector Strategy in some places.
• Limited technical human resources capacity, i.e. there is not enough trained personnel able to produce improved units from standard technical drawings.
• The grid is limited in terms of geographic coverage and operational synchronization.
• There are gaps in the legal and regulatory framework.• A lack of coordination among the agencies responsible for
the planning and management of RE development can lead to long lead times of projects.7,13,15
References
1. World Bank (2017). Population, total. Available form https://data.worldbank.org/indicator/SP.POP.TOTL
2. United Nations Food and Agriculture Organization (FAO) (2012). Afghanistan. Aquastat database. Available from www.fao.org/nr/water/aquastat/countries_regions

71
3.5. SO
UTH
ERN
AS
iA
3. World Bank (2016). Average Monthly Temperature and Rainfall for COUNTRY, 1990-2012, Climate Change Knowledge Portal database. Available from http://sdwebx.worldbank.org/climate-portal
4. Afghan online (n.d.). Afghanistan rivers & lakes. Available from http://www.afghanonline.com/majorrivers/
5. National Statistics and Information Authority (NSIA) (2018). Afghanistan Statistical Yearbook 2017-2018.Avail-able from http://cso.gov.af/Content/files/%D8%B3%D8%A7%D9%84%D9%86%D8%A7%D9%85%D9%87%20%D8%A7%D8%AD%D8%B5%D8%A7%D8%A6%D-B%8C%D9%88%DB%8C/%D8%B3%D8%A7%D9%84%2096/En-glish%20Yearbook%201396-min%20(1).pdf
6. REEEP (2012). Afghanistan. Available from https://www.reeep.org/afghanistan-2012
7. Xialei, C., Singh, P. R., Xianlai, W., and Kremere, E., eds. (2016). World Small Hydropower Development Report 2016. United Nations Industrial Development Organization; Inter-national Center on Small Hydro Power. Available from www.smallhydroworld.org
8. World Bank (2016). Access to electricity (% of population). Avail-able from https://data.worldbank.org/indicator/EG.ELC.ACCS.ZS
9. Afghanistan Inter-Ministerial Commission for Energy (ICE) (2016). Domestic Generation. Available from https://sites.google.com/site/iceafghanistan/electricity-supply/domestic-genera-tion-1
10. Afghanistan Inter-Ministerial Commission for Energy (ICE) (2016). Renewable Energy Summary. Available from https://sites.google.com/site/iceafghanistan/renewable-energy-summary
11. Ministry of Energy and Water (MEW) (2017). Afghanistan En-ergy Sector Self-Sufficiency Development Plan. Available from https://energycharter.org/fileadmin/DocumentsMedia/Events/Afghanistan_-_Mahmoody_Ahmad_Farhad.pdf
12. Da Afghanistan Brishna Sherkat (DABS) (n.d.). Official website. Available from https://main.dabs.af/Home
13. World Bank (2018). Afghanistan. Renewable Energy Develop-ment. Issues and Options. Available from http://documents.worldbank.org/curated/en/352991530527393098/pdf/Afghani-stan-Renewable-Energy-Development-Issues-and-Options.pdf
14. Afghanistan Inter-Ministerial Commission for Energy (ICE) (2016). Domestic Hydro Generation. Available from https://sites.google.com/site/iceafghanistan/electricity-supply/domestic-gen-eration-1/domestic-hydro-generation
15. LIU, H., Masera, D. and Esser, L., eds. (2013). World Small Hy-dropower Development Report 2013.United Nations Industrial Development Organization; International Center on Small Hy-dro Power. Available from www.smallhydroworld.org
16. The World Bank (2014). World Bank Group Invests in Energy Trade between Tajikistan and South Asia. Available from http://www.worldbank.org/en/news/press-release/2014/03/27/world-bank-group-invests-in-energy-trade-between-tajikistan-and-south-asia

72
BangladeshShamsuddin Shahid, Universiti teknologi malaysia
Key factsPopulation 164,669,7511
Area 147,570 km2
Climate Bangladesh has a tropical monsoon climate characterized by wide seasonal variations in rainfall, high temperatures and high humidity. The average temperature varies between 11 °C and 20 °C in the winter months (December to February) and between 24 °C and 31 °C in the pre-monsoon summer months (March to May). Average humidity varies between 36 per cent in January and 99 per cent in July.3
Topography Situated on the deltas of large rivers flowing from the Himalayas, the topography of most parts of Bangladesh is extremely flat. Approximately 50 per cent of the country lies below 10 metres and 90 per cent below 60 metres above sea level. Approximately 10 per cent of the land, mostly located in the south-east and north-east, is considered hilly. At 1,052 metres, the highest peak in Bangladesh, Saka Haphong, is located in the extreme south-east corner of the country.4
Rain pattern The annual average rainfall is 2,666 mm. Rainfall varies from 1,400 mm in the north-west to approximately 4,400 mm in the north-east. More than 78 per cent of the total annual rainfall occurs during the monsoon from June to October. Only 3 per cent occurs during the winter months of December to February.3
Hydrology Most of Bangladesh lies in the delta formed by the convergence of the Ganges, Brahmaputra and Meghna Rivers and their tributaries. The country is crisscrossed by numerous rivers, streams and brooks all generally running north to south as they meet up with the Ganges to flow into the Bay of Bengal. In the dry season the numerous tributaries that lace the terrain may be several kilometres wide as they near the Bay of Bengal, whereas at the height of the summer monsoon season they coa-lesce into an extremely broad expanse of silt-laden water.5
Electricity sector overview
As of November 2018, the total installed electricity generating capacity in Bangladesh was 17,115 MW and the available capacity was 16,477 MW.6 The total capacity consisted of natural gas accounting for 60 per cent, heavy fuel oil (HFO) 22 per cent, high-speed diesel (HSD) 12 per cent, coal 3 per cent, other sources (not connected to the national grid) 2 per cent and hydropower 1 per cent (Figure 1). In addition, the equivalent of 1,160 MW was imported from India.6 Total electricity generation in the year 2016-2017 stood at 57,276 GWh.7
As of 2016, the national electrification rate was 75.9 per cent. The electrification rate in rural areas, where more than 60 per cent of the population lives, was 68.8 per cent.8 According to the Bangladesh Power Development Board (BPDB), in 2018 the nationwide electrification rate reached 90 per cent.7 Per capita generation of electricity in Bangladesh was 464 kWh in 2018.9 As of June 2018, system losses were estimated at 11.9 per cent and distribution losses at 9.6 per cent.9 Limited access to electricity, supply-demand imbalance, high dependency on natural gas as an energy source and poor grid reliability are the major problems facing the power sector in Bangladesh. The major challenges are to provide universal access to
reliable power supply, ensure availability of energy sources for power generation and long-term energy security.10,11
Figure 1. Installed electricity capacity by source in Bangladesh (MW)
10,283
3,722
2,076
524
280
230
Gas
HFO
HSD
Coal
Other
Hydropower
Source: BPDB6
Electric power consumption in Bangladesh is rising by 9.6 per cent each year due to the rapid increase in the number of consumers and GDP growth.11 The country’s available power generating capacity has also risen markedly between
3.3.2
World Small HydropoWEr dEvElopmEnt
rEport 2019

73
3.5. SO
UTH
ERN
AS
iA
2010 and 2018. Increasing generation is a major agenda for the Government, which aims to provide 100 per cent access to affordable and reliable electricity by 2021 and stable, high quality electricity by 2030.12 The forecast of energy demand, based upon a 7 per cent GDP growth rate, estimates peak demand in Bangladesh at 17,304 MW by 2020 and 33,708 MW by 2030 (Figure 2).13
BPDB is the largest single organization in the energy sector of Bangladesh, together with its subsidiaries accounting for 52 per cent of the country’s power generating capacity.14 As a single buyer, the BPDB compensates the independent power producers (IPPs) with cost-driven prices. In 2016-2017 BPDB paid up to BDT 11.23 (US$0.13) per kWh for HFO-powered electricity and up to BDT 2.53 (US$0.03) per kWh for gas-powered electricity.7 There is no feed-in-tariff (FIT) and no regular tendering scheme in place yet for power from renewable energy, however, the Government is working on a FIT policy. The Power Grid Company of Bangladesh Ltd (PGCB) is responsible for transmission, and BPDB, along with some Government-owned companies, are responsible for distribution. BPDB charges BDT 1.49 to BDT 8.20 (US$0.018 to US$0.098) per kWh to end users depending on the type of consumer.15
Figure 2. Demand forecast in Bangladesh in 2010-2030 (MW)
0
10,000
20,000
30,000
40,000
2010 2015 2020 2025 2030
Source: BPDB13
Small hydropower sector overviewThere is no official definition of small hydropower (SHP) in Bangladesh. However, this report assumes a definition of plants with an installed capacity of less than 10 MW. Current SHP installed capacity is 60 kW with a total identified potential of at least 59.5 MW.16,17 This indicates that approximately only 0.1 per cent has been developed. Between the World Small Hydropower Development Report (WSHPDR) 2016 and WSHPDR 2019, installed capacity increased by 20 per cent based on a more accurate estimate (Figure 3).
The first SHP plant was installed for demonstration purposes at a hilly region of Chittagong with a capacity of 10 kW.11 Another SHP plant operating in Barkal Upazila of the Rangamati district has a capacity of 50 kW. An additional plant with a capacity of 50-70 kW is under development as
part of the irrigation system at Mirersorai, Chittagong. A number of other projects on streams in the south-east hilly regions are also under consideration for development.16
Figure 3. Small hydropower capacities 2013/2016/2019 in Bangladesh (MW)
0 10 20 30 40 50 60
PotentialCapacity
Installed Capacity
59.5 1.410.15
0.060.050.01
WSHPDR 2019WSHPDR 2016WSHPDR 2013
Source: WSHPDR 2016,11 BPDB,16 MREMR,17 WSHPDR 201318
Note: The comparison is between data from WSHPDR 2013, WSHPDR 2016 and WSHPDR 2019.
Potential for SHP in Bangladesh has been explored by different organizations over the last three decades. In 1981, the National Rural Electric Cooperative Association identified 20 prospective sites for installation of SHP plants with a combined capacity of 13.6 MW. The study was carried out in the whole country except Chittagong Hilly areas. A study of the potential of that area was carried out by the Ministry of Power, Energy and Mineral Resources (MPEMR) in 2014 and identified 45.9 MW of SHP potential from 12 sites.17. Combined, these sites suggest a potential of 59.5 MW. However, based on carried out studies, Japan International Cooperation Agency (JICA) concluded that hydropower development in Bangladesh might not have high priority in comparison to electricity import from the neighbouring countries. The main reason for that is the potential environmental and social impact of hydropower development, including small-scale projects.17
SHP installed capacity represents a small fraction of the current total hydropower capacity. The 230 MW hydropower plant located at Karnafuli currently provides the major share of total renewable energy in Bangladesh. BPDB identified two other sites at Sangu (140 MW) and Matamuhuri (75 MW) for large hydropower plants.19
Renewable energy policy
Development of renewable energy is considered an important part of the Government’s fuel diversification programme and a scheme to provide clean power to communities with no access to the grid. The Government has set targets to increase the share of renewable energy in the energy mix to 10 per cent (2,000 MW) in 2021 and maintain the share at 10 per cent (4,000 MW) until 2030.12 The Government has adopted the Renewable Energy Policy of Bangladesh in order to achieve this goal (2009). National plans such as the Five-Year Plan and the Power System Master Plan as well as policy documents including the National Energy Policy and Industrial Policy
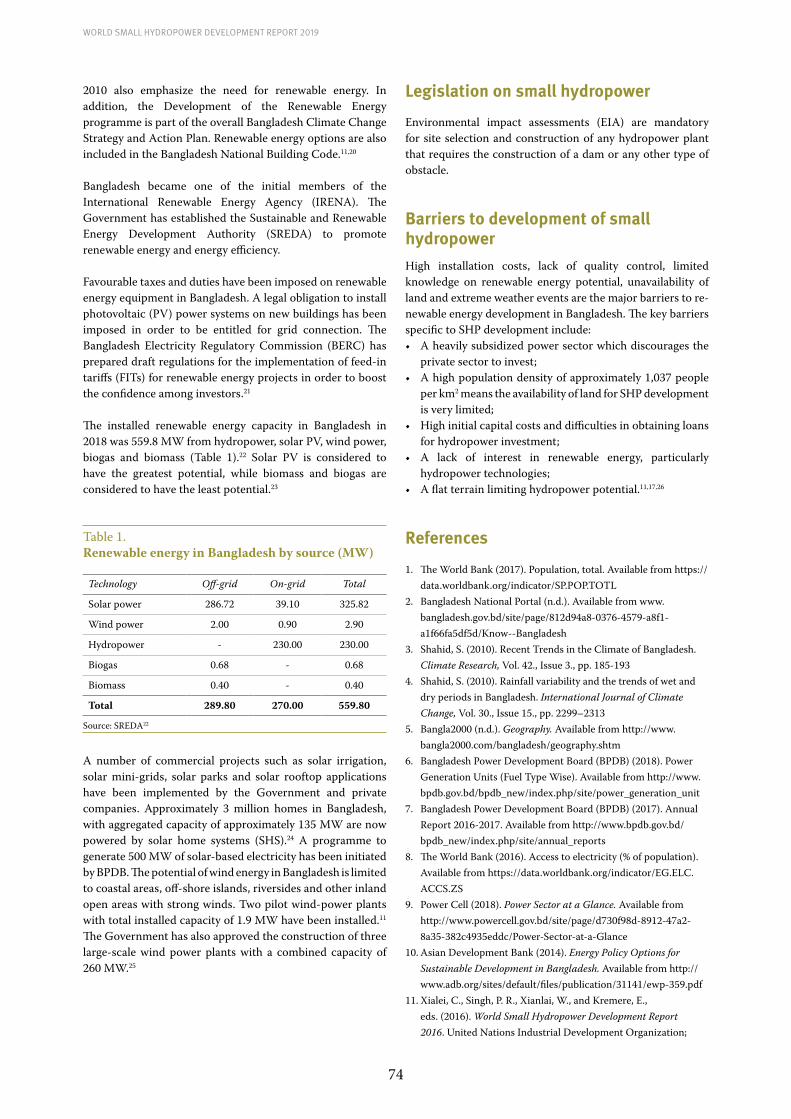
74
World Small HydropoWer development report 2019
2010 also emphasize the need for renewable energy. In addition, the Development of the Renewable Energy programme is part of the overall Bangladesh Climate Change Strategy and Action Plan. Renewable energy options are also included in the Bangladesh National Building Code.11,20
Bangladesh became one of the initial members of the International Renewable Energy Agency (IRENA). The Government has established the Sustainable and Renewable Energy Development Authority (SREDA) to promote renewable energy and energy efficiency.
Favourable taxes and duties have been imposed on renewable energy equipment in Bangladesh. A legal obligation to install photovoltaic (PV) power systems on new buildings has been imposed in order to be entitled for grid connection. The Bangladesh Electricity Regulatory Commission (BERC) has prepared draft regulations for the implementation of feed-in tariffs (FITs) for renewable energy projects in order to boost the confidence among investors.21
The installed renewable energy capacity in Bangladesh in 2018 was 559.8 MW from hydropower, solar PV, wind power, biogas and biomass (Table 1).22 Solar PV is considered to have the greatest potential, while biomass and biogas are considered to have the least potential.23
Table 1. Renewable energy in Bangladesh by source (MW)
Technology Off-grid On-grid Total
Solar power 286.72 39.10 325.82
Wind power 2.00 0.90 2.90
Hydropower - 230.00 230.00
Biogas 0.68 - 0.68
Biomass 0.40 - 0.40
Total 289.80 270.00 559.80 Source: SREDA22
A number of commercial projects such as solar irrigation, solar mini-grids, solar parks and solar rooftop applications have been implemented by the Government and private companies. Approximately 3 million homes in Bangladesh, with aggregated capacity of approximately 135 MW are now powered by solar home systems (SHS).24 A programme to generate 500 MW of solar-based electricity has been initiated by BPDB. The potential of wind energy in Bangladesh is limited to coastal areas, off-shore islands, riversides and other inland open areas with strong winds. Two pilot wind-power plants with total installed capacity of 1.9 MW have been installed.11
The Government has also approved the construction of three large-scale wind power plants with a combined capacity of 260 MW.25
Legislation on small hydropower
Environmental impact assessments (EIA) are mandatory for site selection and construction of any hydropower plant that requires the construction of a dam or any other type of obstacle.
Barriers to development of small hydropower High installation costs, lack of quality control, limited knowledge on renewable energy potential, unavailability of land and extreme weather events are the major barriers to re-newable energy development in Bangladesh. The key barriers specific to SHP development include:• A heavily subsidized power sector which discourages the
private sector to invest;• A high population density of approximately 1,037 people
per km2 means the availability of land for SHP development is very limited;
• High initial capital costs and difficulties in obtaining loans for hydropower investment;
• A lack of interest in renewable energy, particularly hydropower technologies;
• A flat terrain limiting hydropower potential.11,17,26
References
1. The World Bank (2017). Population, total. Available from https://data.worldbank.org/indicator/SP.POP.TOTL
2. Bangladesh National Portal (n.d.). Available from www.bangladesh.gov.bd/site/page/812d94a8-0376-4579-a8f1-a1f66fa5df5d/Know--Bangladesh
3. Shahid, S. (2010). Recent Trends in the Climate of Bangladesh. Climate Research, Vol. 42., Issue 3., pp. 185-193
4. Shahid, S. (2010). Rainfall variability and the trends of wet and dry periods in Bangladesh. International Journal of Climate Change, Vol. 30., Issue 15., pp. 2299–2313
5. Bangla2000 (n.d.). Geography. Available from http://www.bangla2000.com/bangladesh/geography.shtm
6. Bangladesh Power Development Board (BPDB) (2018). Power Generation Units (Fuel Type Wise). Available from http://www.bpdb.gov.bd/bpdb_new/index.php/site/power_generation_unit
7. Bangladesh Power Development Board (BPDB) (2017). Annual Report 2016-2017. Available from http://www.bpdb.gov.bd/bpdb_new/index.php/site/annual_reports
8. The World Bank (2016). Access to electricity (% of population). Available from https://data.worldbank.org/indicator/EG.ELC.ACCS.ZS
9. Power Cell (2018). Power Sector at a Glance. Available from http://www.powercell.gov.bd/site/page/d730f98d-8912-47a2-8a35-382c4935eddc/Power-Sector-at-a-Glance
10. Asian Development Bank (2014). Energy Policy Options for Sustainable Development in Bangladesh. Available from http://www.adb.org/sites/default/files/publication/31141/ewp-359.pdf
11. Xialei, C., Singh, P. R., Xianlai, W., and Kremere, E., eds. (2016). World Small Hydropower Development Report 2016. United Nations Industrial Development Organization;

75
3.5. SO
UTH
ERN
AS
iA
International Center on Small Hydro Power. Available from www.smallhydroworld.org
12. Saleque, K. A. (2015). Challenges of Vision 2021. Energy & Power. Available from http:// ep-bd.com/online/details.php?cid=32 &id=17537
13. Bangladesh Power Development Board (BPDB) (n.d.). Master Plan. Available from http://www.bpdb.gov.bd/bpdb_new/index.php/site/page/2cd8-9540-95fe-d2c3-23bc-fc84-3475-2c9d-3acc-a10a
14. Bangladesh Power Development Board (BPDB) (2018). Key statistics. Available from http://www.bpdb.gov.bd/bpdb_new/index.php/site/page/13e9-2cc0-ce41-9c09-088d-94d5-f546-04a6-b4fa-1d18
15. Bangladesh Power Development Board (BPDB) (n.d.). Tariff Description. Available from http://www.bpdb.gov.bd/bpdb_new/index.php/site/page/a314-7810-6938-4894-c527-3510-fdfb-f93c-2023-4459
16. Bangladesh Power Development Board (BPDB) (n.d.). Development of Renewable Energy Technologies by BPDB. Available from http://www.bpdb.gov.bd/bpdb/index.php?option=com_content&view=article&id=26
17. Ministry of Power, Energy and Mineral Resources (MREMR) (2016). Power System Master Plan 2016. Available from https://mpemr.gov.bd/assets/media/pdffiles/FR_PSMP_revised.pdf
18. LIU, H., Masera, D. and Esser, L., eds. (2013). World Small Hydropower Development Report 2013.United Nations Industrial Development Organization; International Center on Small Hydro Power. Available from www.smallhydroworld.org.
19. Kader, M.G. et al. (2016). A Future Development Proposal for Micro Hydropower Plant in Bangladesh. International Conference on Mechanical, Industrial and Energy Engineering 2016, 26-27 December, Khulna
20. Alauddin, M. (2014). Development of renewable energy in Bangladesh. Daily Star, Nov. 11, 2014. Available from http://www.thedailystar.net/development-of-renewable-energy-in-bangladesh-49670
21. Climate Parliament (2015). Bangladesh Policy Road Map for Renewable Energy. Available from http://www.rechsteiner-basel.ch/uploads/media/bd_roadmap_bangladesh_1505-2.pdf
22. Sustainable and Renewable Energy Development Authority (SREDA) (2018). RE to Electricity Installed (MW). Available from http://www.sreda.gov.bd/index.php/site/re_present_status
23. Sustainable and Renewable Energy Development Authority (SREDA) (n.d.). Renewable Energy Potential. Available from http://www.sreda.gov.bd/index.php/site/page/6a40-6e1f-2734-750f-b8e5-a6e0-4ba2-d411-f1eb-6df7
24. Ayre, J. (2014). “Bangladesh Installed 3 Million+ New Residential Solar Systems”. Clean Technica, 19 November 2014. Available from http://cleantechnica.com/2014/11/19/bangladesh-installed-3-million-new-residential-solar-systems-since-may/
25. Rasel, A.R. (2017). Wind power fails to take off in Bangladesh. Dhaka Tribune, 7 October 2017. Available from https://www.dhakatribune.com/bangladesh/power-energy/2017/10/03/wind-power-fails-take-off-bangladesh
26. Islam, M. S. et al. (2013). Potentiality of Small-Scale Hydro Power Plant: An Energy Odyssey. International Journal of Renewable Energy. Vol. 3, No. 1

76
BhutanChoten duba, ministry of Economic affairs
Key factsPopulation 779,6661
Area 38,394 km2 1
Climate The climate of Bhutan falls into three distinct climatic zones – Alpine in the northern region, tem-perate in the inner region and subtropical zone in the southern plains and foothills of the country. The region which falls under the Alpine zone remains cold with year-round snow and temperatures fluctuating between 0 °C in the winter to 10 °C in the summer. The temperate zone is associated with temperate climate and that of subtropical has hot and humid climatic conditions with temperature ranging from 15 °C to 30 °C.2
Topography The country has elevations ranging from as low as 160 metres in the southern foothills to more than 7,000 metres above the mean average sea level and such huge range is attributed to its most rugged mountain terrains of the Himalaya range. The snowcapped Great Himalayan Range located in the north has its peak touching over 7,500 metres above sea level. The northern region is characterized by arc of glaciated mountain peaks with an arctic climate at the highest elevations while the central region has fast flowing rivers curving out majestic gorges. The thick forest in the region provides most of the Bhutan’s valuable forest production.2
Rain pattern Due to huge variations in the elevation, the average annual precipitation in the country widely vari-es from 40 mm (primarily snow) in the severe climate of the north to as high as 7,800 mm at some locations in the subtropical region. The temperate central region has average annual precipitation of about 1,000 mm. The country receives maximum rainfall in the summer monsoon which commences from late June through late September.2
Hydrology The main rivers of Bhutan, fed by snow melting and flowing from north to south, are augmented with numerous east-west flowing tributaries as they flow towards the Himalayan plains foothills and join the Brahmaputra Rivers in India further south. The country has four major river systems: the Drangme Chhu, the Puna Tshang Chhu, the Wang Chhu, and the Amo Chhu. Therefore, glaciers in the northern part of the Bhutan, which covers about 10 per cent of the total surface area, are an important renewable source of water for Bhutan’s rivers.2
Electricity sector overview
As of 2015, Bhutan has achieved 99.95 per cent electrification with combination of on-grid through grid extension and off-grid supplied with solar rooftop in places where grid extension is not feasible.3 Bhutan is almost 100 per cent dependent on hydropower electricity generation.
As provisioned under Bhutan Sustainable Hydropower Development Policy-2008, Bhutan intended to harness 10,000 MW in by 2020. However, the target was reduced to 5,000 MW to be developed by 2022.4 As per the recent studies, it was estimated that Bhutan has theoretical hydropower potential of 41,088 MW, a revised version of what was claimed before (30,000 MW). The capacity of 26,683 MW is considered to be economically feasible for development.5 Bhutan has currently harnessed a total installed hydropower capacity of 1,614 MW (6 per cent of the potential), inclusive of small, mini- and micro-hydropower projects. A further 3,658 MW of hydropower projects is under construction and is due to be completed within a few years. The total electricity generation in 2016 was 7,959.53 GWh, including 11.45 GWh
from mini/micro-hydropower plants, 0.00027 GWh from diesel generators (installed capacity of 7.1 MW) and) and 0.71 GWh from wind power (0.6 MW).3,6 The Figure 1 below shows the annual electricity generation by source in Bhutan, indicating that approximately 99.99 percent of the electricity is generated from hydropower. The installed capacity and generation data for solar power is not available at this point of time.
Figure 1. Annual electricity generation by source in Bhutan (GWh)
0.71
7,958.82
0.0003
Hydropower
Wind power
Diesel
Source: Bhutan Power Corporation Limited/Bhutan Electricity Authority7,3
3.3.3
World Small HydropoWEr dEvElopmEnt
rEport 2019

77
3.5. SO
UTH
ERN
AS
iA
Table 1.Electricity tariffs in Bhutan (Nu/kWh (US$/kWh))
Tariff 1 January 2017 to 30 June 2017
1 July 2017 to 30 June 2018
1 July 2018 to 30 June 2019
Wheeling (Nu/kWh (US$/kWh)) 0.195 (0.003) 0.195 (0.003) 0.195 (0.003)Block kWh/month Energy Charges (Nu/kWh (US$/kWh))
Low VoltageI (Rural) 0 - 100 - - -
I (Others) 0 - 100 1.28 (0.020) 1.28 (0.02)0 1.28 (0.020)II (All) 101 - 300 2.52 (0.038) 2.60 (0.039) 2.68 (0.040)III (All) Above 300 3.33 (0.050) 3.43 (0.051) 3.53 (0.053)
Low Bulk Voltage 3.79 (0.057) 3.90 (0.058) 4.02 (0.060)Medium Voltage (6.6 kV/11 kV/33 kV)
Energy Charges (Nu/kWh) 2.00 (0.030) 2.07 (0.031) 2.16 (0.032)Demand Charges (Nu/kVA/Month) 250 (3.740) 275 (4.110) 300 (4.490)
High Voltage (600 kV and above)Energy Charges (Nu/kWh) 1.59 (0.024) 1.59 (0.024) 1.59 (0.024)
Demand Charges (Nu/kVA/Month) 262 (3.920) 262 (3.920) 262 (3.920) Source: Bhutan Electricity Authority 8,11
The Department of Hydropower and Power Systems is mandated under the umbrella of Ministry of Economic Affairs for the development of medium (between 25 and 150 MW), large (between 150 and 1,000 MW), and mega (above 1,000 MW) hydropower projects while Department of Renewable Energy is responsible for development of small hydropower projects of installed capacity below 25 MW, apart from other source of renewable energy projects. The Government owned utility body Druk Green Power Corporation Limited (DGPC) supervises generation, while Bhutan Power Corporation Limited (BPC) is responsible for the transmission and distribution of electricity in the country. The electricity sector is regulated by Bhutan Electricity Authority (BEA).8 The Figure 2 shows the electricity sector in the country.
Figure 2. The electricity sector in Bhutan
ElectricitySectorinBhutan
Department of Hydropower& Power Systems
Department of RenewableEnergy
Bhutan Electricity Authority
Generation Druk Green PowerCorporation &Dagachhu HydroPower CorporationTransmition
DistributionSystem Operator
Bhutan PowerCorporation
PolicyandPlanning
Regulator
Licensees
Source: Bhutan Electricity Authority8
There is considerable variation on water discharge in the rivers depending on the seasons. Since all existing hydropower plants are run-of-river scheme, plants are able to generate only about 20 per cent of the total installed capacity in the lean period, during which the generated electricity is barely sufficient for domestic consumptions and the shortage is met by importing electricity from the neighbouring India.9
Nevertheless, Bhutan is the net exporter of electricity. In 2016, majority of surplus electricity (72.7 per cent) was exported to India, which has become one of the main sources of revenue generation for Bhutan.3
However, the demand for the electricity has been rising over the years. The peak load demand was recorded at 335.9 MW in 2016, it has increased for 21.6 per cent since 2011.3 Increasing power demand occurs during the winter months (December-March) attributed to cold weather and people using electricity for heating.9 Moreover, improved electrification and connection of rural households to the central grid have further added to the electricity demand.10 The Figure 3 shows the rapid electricity demand increase over the years 2007 – 2016.
The electricity tariffs in Bhutan are determined in the Tariff Determination Regulation 2016.14 As per its provision, electricity tariffs shall be approved by Bhutan Electricity Authority (BEA) after reviewing proposals submitted by country’s utility bodies, Druk Green Power Corporation Limited (DGPC) and Bhutan Power Corporation Limited (BPC).9 The tariffs are subject to revision every three years.8 Table 1 shows the existing electricity tariffs in Bhutan.
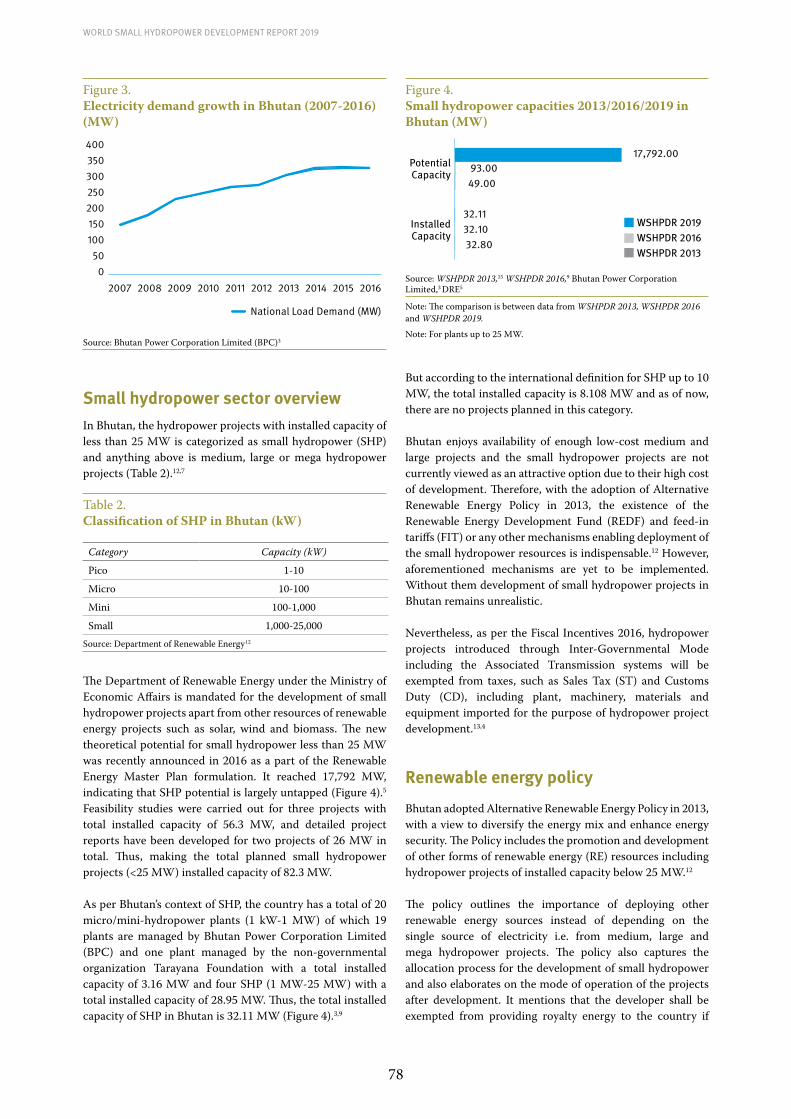
78
World Small HydropoWer development report 2019
Figure 3. Electricity demand growth in Bhutan (2007-2016) (MW)
050
100150200250300350400
200920082007 2010 2011 2012 2013 2014 2015 2016
National Load Demand (MW)
Source: Bhutan Power Corporation Limited (BPC)3
Small hydropower sector overviewIn Bhutan, the hydropower projects with installed capacity of less than 25 MW is categorized as small hydropower (SHP) and anything above is medium, large or mega hydropower projects (Table 2).12,7
Table 2.Classification of SHP in Bhutan (kW)
Category Capacity (kW)
Pico 1-10
Micro 10-100
Mini 100-1,000
Small 1,000-25,000 Source: Department of Renewable Energy12
The Department of Renewable Energy under the Ministry of Economic Affairs is mandated for the development of small hydropower projects apart from other resources of renewable energy projects such as solar, wind and biomass. The new theoretical potential for small hydropower less than 25 MW was recently announced in 2016 as a part of the Renewable Energy Master Plan formulation. It reached 17,792 MW, indicating that SHP potential is largely untapped (Figure 4).5 Feasibility studies were carried out for three projects with total installed capacity of 56.3 MW, and detailed project reports have been developed for two projects of 26 MW in total. Thus, making the total planned small hydropower projects (<25 MW) installed capacity of 82.3 MW.
As per Bhutan’s context of SHP, the country has a total of 20 micro/mini-hydropower plants (1 kW-1 MW) of which 19 plants are managed by Bhutan Power Corporation Limited (BPC) and one plant managed by the non-governmental organization Tarayana Foundation with a total installed capacity of 3.16 MW and four SHP (1 MW-25 MW) with a total installed capacity of 28.95 MW. Thus, the total installed capacity of SHP in Bhutan is 32.11 MW (Figure 4).3,9
Figure 4. Small hydropower capacities 2013/2016/2019 in Bhutan (MW)
0 5000 10000 15000 20000
PotentialCapacity
Installed Capacity
17,792.00 93.00 49.00
32.1132.10 32.80
WSHPDR 2019WSHPDR 2016WSHPDR 2013
Source: WSHPDR 2013,15 WSHPDR 2016,9 Bhutan Power Corporation Limited,3 DRE5
Note: The comparison is between data from WSHPDR 2013, WSHPDR 2016 and WSHPDR 2019.
Note: For plants up to 25 MW.
But according to the international definition for SHP up to 10 MW, the total installed capacity is 8.108 MW and as of now, there are no projects planned in this category.
Bhutan enjoys availability of enough low-cost medium and large projects and the small hydropower projects are not currently viewed as an attractive option due to their high cost of development. Therefore, with the adoption of Alternative Renewable Energy Policy in 2013, the existence of the Renewable Energy Development Fund (REDF) and feed-in tariffs (FIT) or any other mechanisms enabling deployment of the small hydropower resources is indispensable.12 However, aforementioned mechanisms are yet to be implemented. Without them development of small hydropower projects in Bhutan remains unrealistic.
Nevertheless, as per the Fiscal Incentives 2016, hydropower projects introduced through Inter-Governmental Mode including the Associated Transmission systems will be exempted from taxes, such as Sales Tax (ST) and Customs Duty (CD), including plant, machinery, materials and equipment imported for the purpose of hydropower project development.13,4
Renewable energy policy
Bhutan adopted Alternative Renewable Energy Policy in 2013, with a view to diversify the energy mix and enhance energy security. The Policy includes the promotion and development of other forms of renewable energy (RE) resources including hydropower projects of installed capacity below 25 MW.12
The policy outlines the importance of deploying other renewable energy sources instead of depending on the single source of electricity i.e. from medium, large and mega hydropower projects. The policy also captures the allocation process for the development of small hydropower and also elaborates on the mode of operation of the projects after development. It mentions that the developer shall be exempted from providing royalty energy to the country if

79
3.5. SO
UTH
ERN
AS
iA
the small hydropower project is developed for domestic purposes, in order to enable them to compete with the larger hydropower projects which are comparatively cheaper and mostly meant for the electricity export purpose.
Barriers to small hydropower developmentMentioned below are some of the key barriers to SHP de-velopment: • Small hydropower projects are viewed as costly compared
to the existing medium, large and mega hydropower projects in the country and therefore, to this date, the country has focused only on the development of the larger hydropower projects.
• The Renewable Energy Development Fund (REDF) serving as the source of funding for small hydropower project development and feed-in tariffs or other mechanisms are yet to be introduced so that SHP can be sustained alongside large hydropower projects. Without these in place, the development of small hydropower projects in the country would remain problematic.
To date, Bhutan has seen the development of medium, large and mega hydropower projects through the inter-governmental mode and one medium plant recently developed through a Public-Private Partnership (PPP), where Bhutanese people have not been able to take part during the construction period owing to their sheer techno-economic size. With numerous small hydropower projects in the pipeline, there is a hope that the citizens of Bhutan will be able to develop projects themselves, provided FIT or any other relevant mechanism, fiscal incentives and tax exemption mechanisms are introduced.
References
1. National Statistics Bureau (NSB). Bhutan at a Glance. Thimphu : National Statistics Bureau, 2017. Available from http://www.nsb.gov.bt/publication/publications.php?id=5
2. National Statistics Bureau (NSB). Statistical Year Book. Thimphu : National Statistics Bureau, 2017. Available from http://www.nsb.gov.bt/publication/publications.php?id=3
3. Bhutan Power Corporation Limited (BPC). Power Data Book. Thimphu : Bhutan Power Corporation Limited, Bhutan, 2016. Available from http://www.bpc.bt/download/ (N.B.: Access is restricted)
4. Royal Government of Bhutan (RGOB). Economic Development Policy. Thimphu: Royal Government of Bhutan, 2017. Available from https://www.gnhc.gov.bt/en/wp-content/uploads/2017/05/EDP-2016.pdf
5. Ministry of Economic Affairs (DRE). Renewable Energy Master Plan. s.l. : DRE, Ministry of Economic Affairs, Bhutan, 2016.
6. Department of Hydropower and Power Systems (DHPS). Power Data. Thimphu: Department of Hydropower and Power Systems, MoEA, 2017.
7. Department of Hydropower and Power Systems (DHPS). Bhutan Sustainable Hydropower Development Policy. Thimphu :
Department of Hydropower & Power Systems, MoEA, Thimphu, Bhutan, 2008.
8. Bhutan Electricity Auhority (BEA). Electricity Tariff in Bhutan. Thimphu : Bhutan Electricity Auhority, 2017. Available from http://www.bea.gov.bt/wp-content/uploads/2017/12/Electricity_Tariff_in_Bhutan_2017.pdf
9. LIU, H., Masera, D. and Esser, L., eds. (2013). World Small Hydropower Development Report 2013, United Nations Industrial Development Organisation; International Center on Small Hydro Power. Available from www.smallhydroworld.org
10. Bhutan Power Corporation Limited (BPC). Annual Report. Thimphu : Bhutan Power Corporation Limited, 2016.
11. Bhutan Electricity Auhority (BEA). Bhutan Electricity Authority, 2017. Available from http://www.bea.gov.bt/approved-tariff/. [Cited: February 20, 2017.]
12. Royal Government of Bhutan (RGoB). Alternative Renewable Energy Policy. Thimphu : Royal Government of Bhutan, 2013. Available from http://img.teebweb.org/wp-content/uploads/2015/06/alternative-renewable-energy-policy-2013.pdf
13. Department of Revenue & Customs, Ministry of Finance (DRC). Fiscal Incentives 2016. Thimphu : Department of Revenue & Customs, Ministry of Finance, 2016.
14. Bhutan Electricity Auhority (BEA). Tariff Determination Regulation . Thimphu : Bhutan Electricty Authority, 2016. Available from http://www.bea.gov.bt/wp-content/uploads/2016/12/Tariff%20Determination%20Regulation%202016%20_July.pdf
15. Xialei, C., Singh, P. R., Xianlai, W., and Kremere, E., eds. (2016). World Small Hydropower Development Report 2016. United Nations Industrial Development Organization; International Center on Small Hydro Power. Available from www.smallhydroworld.org
16. National Statistics Bureau (NSB). Bhutan Living Standard Survey. Thimphu : National Statistics Bureau, 2017. Available from http://www.nsb.gov.bt/publication/files/pub2yo10667rb.pdf
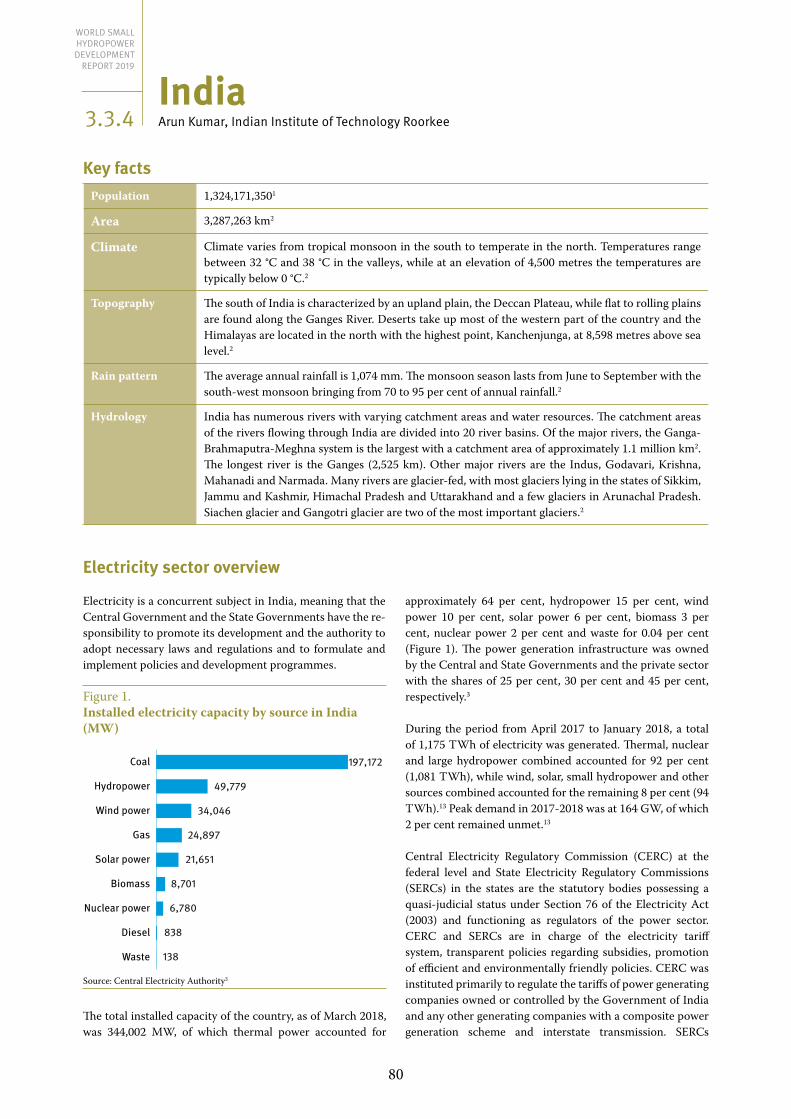
80
Indiaarun Kumar, Indian Institute of technology roorkee
Key factsPopulation 1,324,171,3501
Area 3,287,263 km2
Climate Climate varies from tropical monsoon in the south to temperate in the north. Temperatures range between 32 °C and 38 °C in the valleys, while at an elevation of 4,500 metres the temperatures are typically below 0 °C.2
Topography The south of India is characterized by an upland plain, the Deccan Plateau, while flat to rolling plains are found along the Ganges River. Deserts take up most of the western part of the country and the Himalayas are located in the north with the highest point, Kanchenjunga, at 8,598 metres above sea level.2
Rain pattern The average annual rainfall is 1,074 mm. The monsoon season lasts from June to September with the south-west monsoon bringing from 70 to 95 per cent of annual rainfall.2
Hydrology India has numerous rivers with varying catchment areas and water resources. The catchment areas of the rivers flowing through India are divided into 20 river basins. Of the major rivers, the Ganga-Brahmaputra-Meghna system is the largest with a catchment area of approximately 1.1 million km2. The longest river is the Ganges (2,525 km). Other major rivers are the Indus, Godavari, Krishna, Mahanadi and Narmada. Many rivers are glacier-fed, with most glaciers lying in the states of Sikkim, Jammu and Kashmir, Himachal Pradesh and Uttarakhand and a few glaciers in Arunachal Pradesh. Siachen glacier and Gangotri glacier are two of the most important glaciers.2
Electricity sector overview
Electricity is a concurrent subject in India, meaning that the Central Government and the State Governments have the re-sponsibility to promote its development and the authority to adopt necessary laws and regulations and to formulate and implement policies and development programmes.
Figure 1. Installed electricity capacity by source in India (MW)
49,779
34,046
24,897
21,651
8,701
6,780
838
138
Coal
Hydropower
Wind power
Gas
Solar power
Biomass
Nuclear power
Diesel
Waste
197,172
Source: Central Electricity Authority3
The total installed capacity of the country, as of March 2018, was 344,002 MW, of which thermal power accounted for
approximately 64 per cent, hydropower 15 per cent, wind power 10 per cent, solar power 6 per cent, biomass 3 per cent, nuclear power 2 per cent and waste for 0.04 per cent (Figure 1). The power generation infrastructure was owned by the Central and State Governments and the private sector with the shares of 25 per cent, 30 per cent and 45 per cent, respectively.3
During the period from April 2017 to January 2018, a total of 1,175 TWh of electricity was generated. Thermal, nuclear and large hydropower combined accounted for 92 per cent (1,081 TWh), while wind, solar, small hydropower and other sources combined accounted for the remaining 8 per cent (94 TWh).13 Peak demand in 2017-2018 was at 164 GW, of which 2 per cent remained unmet.13
Central Electricity Regulatory Commission (CERC) at the federal level and State Electricity Regulatory Commissions (SERCs) in the states are the statutory bodies possessing a quasi-judicial status under Section 76 of the Electricity Act (2003) and functioning as regulators of the power sector. CERC and SERCs are in charge of the electricity tariff system, transparent policies regarding subsidies, promotion of efficient and environmentally friendly policies. CERC was instituted primarily to regulate the tariffs of power generating companies owned or controlled by the Government of India and any other generating companies with a composite power generation scheme and interstate transmission. SERCs
3.3.4
World Small HydropoWEr dEvElopmEnt
rEport 2019

81
3.5. SO
UTH
ERN
AS
iA
have similar functions but with jurisdiction limited to the respective state.
All villages in the country (657,009) were electrified by April 2018.3 Furthermore, approximately 147,000 solar-powered water pumps were installed by December 2017, with 41,000 installations only in the state of Rajasthan. Light-emitting diode (LED) lamps have an appreciable share of 17 per cent in the lighting sector.12
Although all cities, towns and villages in India have access to electricity, only 86 per cent of households out of the total of 224 million have access to electricity.6 Efforts are being made to electrify every household. Among all the states, Andhra Pradesh, Tamil Nadu, Kerala, Pondicherry and Punjab, have a 100 per cent household electrification rate, whereas in the states of Jharkhand, Uttar Pradesh, Bihar and Assam household electrification rate varies between 58 and 75 per cent.6 To improve electricity access, the construction of new power plants as well renovation of existing plants is underway. The main steps are to promote investment in renewable energy technologies using the feed-in tariff, tariffs based on bids, renewable energy purchase obligation, subsidies and tax benefits, as well as promotion of renewable energy. Average electricity price in India in May 2018 was approximately US$ 0.06 (INR 4.00) per kWh.7
Small hydropower sector overview
The definition of small hydropower (SHP) in India is up to 25 MW. The installed capacity of small hydropower connected to the grid in India, as of March 2018, was 4,485 MW, while the potential was estimated to be 21,134 MW, indicating that 21 per cent has been developed.8 Compared to the World Small Hydropower Development Report (WSHPDR) 2016, installed capacity has increased by approximately 8 per cent, while estimated potential decreased by less than 1.5 per cent due to a reassessment of the potential (Figure 2).
Figure 2. Small hydropower capacities 2013/2016/2019 in India (MW)
0 5000 10000 15000 20000 25000
PotentialCapacity
Installed Capacity
21,134 21,426 20,000
4,485 4,148 3,496
WSHPDR 2019WSHPDR 2016WSHPDR 2013
Source: MNRE,8 WSHPDR 2016,11 WSHPDR 201319
Note: The comparison is between data from WSHPDR 2013, WSHPDR 2016 and WSHPDR 2019.
The details on the potential and installed small hydropower capacity in India are provided in Table 2. Moreover, there are also off-grid hydropower plants. There is no data available on these. However, based on the author’s estimate, their com-
bined installed capacity may be in the order of 200 MW, or 4 per cent of total small hydropower installed capacity.
Table 1. Classification of small hydropower in India
Category Capacity (kW)
Pico/watermill Up to 5
Micro Up to 100
Mini 101 – 2,000
Small 2,001 – 25,000 Source: Ministry of Power3
Table 2. Status of small hydropower development in India
State
Identified potential Commissioned
Under implemen-
tation
Num-ber of sites
Total capacity (MW)
Number of
plants
Capacity (MW)
Num-ber of
projects
Total capacity (MW)
Andhra Pradesh 359 409.32 44 162.11 0 0
Arunachal Pradesh 800 2,064.92 152 104.61 14 33.55
Assam 106 201.99 6 34.11 1 2
Bihar 139 526.98 29 70.7 0 0
Chhattis-garh 199 1,098.2 10 76 0 0
Goa 7 4.7 1 0.05 0 0
Gujarat 292 201.97 7 28.6 12 80.31
Haryana 33 107.4 9 73.5 1 0.1
Himachal Pradesh 1,049 3,460.34 187 855.61 26 259.1
J&K 302 1,707.45 43 170.03 19 44.2
Jharkhand 121 227.96 6 4.05 0 0
Karnataka 618 3,726.49 167 1,230.73 4 53
Kerala 238 647.15 33 219.02 9 76
Madhya Pradesh 299 820.44 11 86.16 1 9.75
Maharash-tra 270 786.46 67 373.175 11 15.8
Manipur 110 99.95 8 5.45 0 0
Meghalaya 97 230.05 4 31.03 2 24
Mizoram 72 168.9 18 36.47 4 8.7
Nagaland 98 182.18 12 30.67 0 0
Odisha 220 286.22 10 64.625 5 60.5
Punjab 375 578.28 54 170.9 9 7.55
Rajasthan 64 51.67 10 23.85 0 0
Sikkim 88 266.64 17 52.11 0 0
Tamil Nadu 191 604.46 21 123.05 0 0
Telangana 94 102.25 30 90.87 0 0
Tripura 13 46.86 3 16.01 0 0
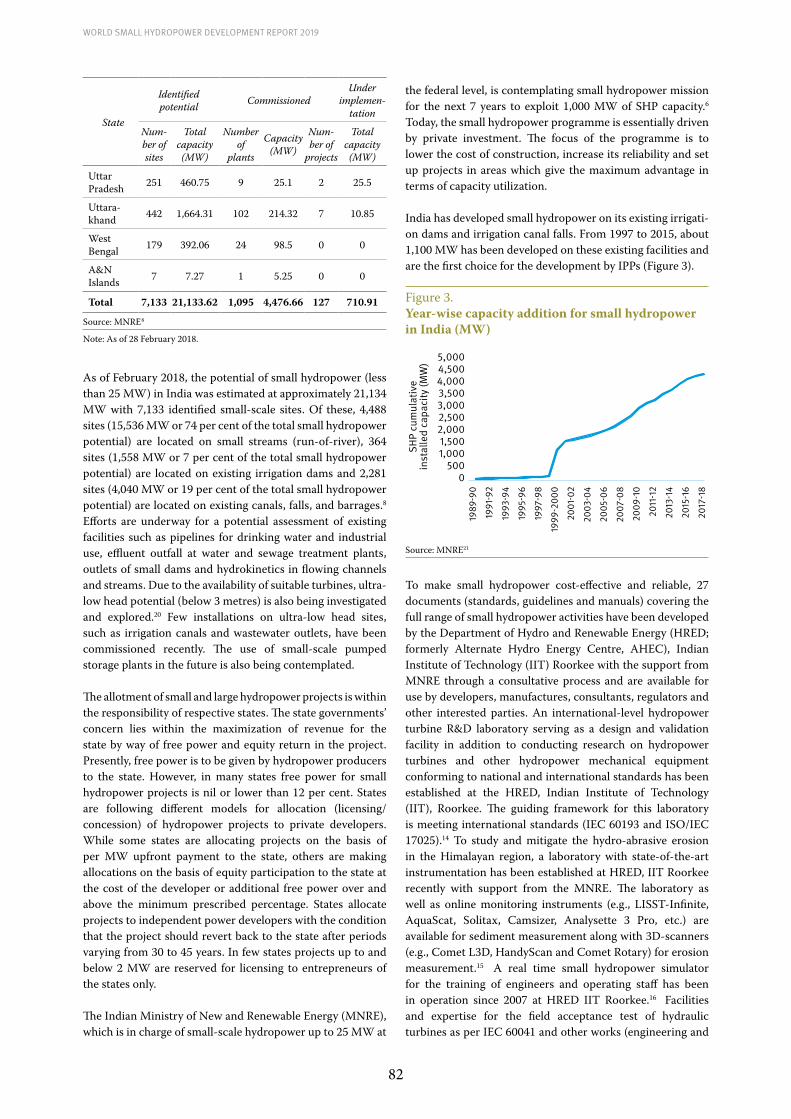
82
World Small HydropoWer development report 2019
State
Identified potential Commissioned
Under implemen-
tation
Num-ber of sites
Total capacity (MW)
Number of
plants
Capacity (MW)
Num-ber of
projects
Total capacity (MW)
Uttar Pradesh 251 460.75 9 25.1 2 25.5
Uttara-khand 442 1,664.31 102 214.32 7 10.85
West Bengal 179 392.06 24 98.5 0 0
A&N Islands 7 7.27 1 5.25 0 0
Total 7,133 21,133.62 1,095 4,476.66 127 710.91 Source: MNRE8
Note: As of 28 February 2018.
As of February 2018, the potential of small hydropower (less than 25 MW) in India was estimated at approximately 21,134 MW with 7,133 identified small-scale sites. Of these, 4,488 sites (15,536 MW or 74 per cent of the total small hydropower potential) are located on small streams (run-of-river), 364 sites (1,558 MW or 7 per cent of the total small hydropower potential) are located on existing irrigation dams and 2,281 sites (4,040 MW or 19 per cent of the total small hydropower potential) are located on existing canals, falls, and barrages.8 Efforts are underway for a potential assessment of existing facilities such as pipelines for drinking water and industrial use, effluent outfall at water and sewage treatment plants, outlets of small dams and hydrokinetics in flowing channels and streams. Due to the availability of suitable turbines, ultra-low head potential (below 3 metres) is also being investigated and explored.20 Few installations on ultra-low head sites, such as irrigation canals and wastewater outlets, have been commissioned recently. The use of small-scale pumped storage plants in the future is also being contemplated.
The allotment of small and large hydropower projects is within the responsibility of respective states. The state governments’ concern lies within the maximization of revenue for the state by way of free power and equity return in the project. Presently, free power is to be given by hydropower producers to the state. However, in many states free power for small hydropower projects is nil or lower than 12 per cent. States are following different models for allocation (licensing/concession) of hydropower projects to private developers. While some states are allocating projects on the basis of per MW upfront payment to the state, others are making allocations on the basis of equity participation to the state at the cost of the developer or additional free power over and above the minimum prescribed percentage. States allocate projects to independent power developers with the condition that the project should revert back to the state after periods varying from 30 to 45 years. In few states projects up to and below 2 MW are reserved for licensing to entrepreneurs of the states only. The Indian Ministry of New and Renewable Energy (MNRE), which is in charge of small-scale hydropower up to 25 MW at
the federal level, is contemplating small hydropower mission for the next 7 years to exploit 1,000 MW of SHP capacity.6 Today, the small hydropower programme is essentially driven by private investment. The focus of the programme is to lower the cost of construction, increase its reliability and set up projects in areas which give the maximum advantage in terms of capacity utilization.
India has developed small hydropower on its existing irrigati-on dams and irrigation canal falls. From 1997 to 2015, about 1,100 MW has been developed on these existing facilities and are the first choice for the development by IPPs (Figure 3).
Figure 3. Year-wise capacity addition for small hydropower in India (MW)
0500
1,0001,500
2,0002,5003,0003,5004,0004,5005,000
1989
-90
1991
-92
1993
-94
1995
-96
1997
-98
1999
-200
0
2001
-02
2003
-04
2005
-06
2007
-08
2009
-10
2011
-12
2013
-14
2015
-16
2017
-18
SHP
cum
ulat
ive
inst
alle
d ca
paci
ty (M
W)
Source: MNRE21
To make small hydropower cost-effective and reliable, 27 documents (standards, guidelines and manuals) covering the full range of small hydropower activities have been developed by the Department of Hydro and Renewable Energy (HRED; formerly Alternate Hydro Energy Centre, AHEC), Indian Institute of Technology (IIT) Roorkee with the support from MNRE through a consultative process and are available for use by developers, manufactures, consultants, regulators and other interested parties. An international-level hydropower turbine R&D laboratory serving as a design and validation facility in addition to conducting research on hydropower turbines and other hydropower mechanical equipment conforming to national and international standards has been established at the HRED, Indian Institute of Technology (IIT), Roorkee. The guiding framework for this laboratory is meeting international standards (IEC 60193 and ISO/IEC 17025).14 To study and mitigate the hydro-abrasive erosion in the Himalayan region, a laboratory with state-of-the-art instrumentation has been established at HRED, IIT Roorkee recently with support from the MNRE. The laboratory as well as online monitoring instruments (e.g., LISST-Infinite, AquaScat, Solitax, Camsizer, Analysette 3 Pro, etc.) are available for sediment measurement along with 3D-scanners (e.g., Comet L3D, HandyScan and Comet Rotary) for erosion measurement.15 A real time small hydropower simulator for the training of engineers and operating staff has been in operation since 2007 at HRED IIT Roorkee.16 Facilities and expertise for the field acceptance test of hydraulic turbines as per IEC 60041 and other works (engineering and

83
3.5. SO
UTH
ERN
AS
iA
maintenance) for efficiency measurement and performance evaluation are available at HRED, IITR.17
The costs of SHP projects commissioned during the last years in India have been recently compiled and analysed. The ca-pital costs of the projects have gone up from INR 50 million (US$ 0.74 million) per MW to INR 100 million (US$ 1.48 mil-lion) per MW from 2005 to 2015, respectively.9
Renewable energy policy
In August 1998 and thereafter in November 2008, the Government of India announced a Policy on Hydro Power Development (Ministry of Power 2018). The Government has also prepared a policy amendment for hydropower projects, which is currently undergoing Government approval. Under this amendment, special funding, cost sharing on infrastructure with other ministries and users is being planned. People adversely affected by hydropower projects have been made long-term beneficiary stakeholders in these projects by way of 1 per cent of free power on a recurring basis with a matching 1 per cent support from state Government for local area development, as well as annual cash benefits, ensuring a regular stream of benefits. To enable the project developer in the hydropower sector to achieve a reasonable and quick return on investment, merchant sales of up to a maximum of 40 per cent of the saleable electricity have been allowed.4 The Government of India provides a subsidy for the development of small hydropower for public, society and private sector in different proportions depending on the location, degree of difficulty and installed capacity. The Government of India provides financial and other fiscal support for the development of other renewable energy sources, such as solar power (photovoltaic as well as thermal), biomass, waste to energy, wind power and other new energy sources.
Water is a subject of the state governments in India, thus hydropower development is their responsibility. The Central Government advises on the hydropower matters and plays the role of an overall river basin planner and arbitrator. The MNRE issued guidelines for the state governments regarding the development of policies on renewable energy development and especially for small hydropower. The Indian Electricity Act 2003 has special provisions for the encouragement of the development of renewable energy and rural electrification. A new Renewable Energy Act 2015 has been drafted by the MNRE and as of the moment of writing of this report was under the consideration of the Indian Parliament.7
The main points characterizing small hydropower and rene-wable energy policies (varying among states) of state Gover-nments include:• 24 States, namely Arunachal Pradesh, Andhra Pradesh,
Assam, Bihar, Chhattisgarh, Gujarat, Haryana, Himachal Pradesh, Jammu and Kashmir, Karnataka, Kerala, Madhya Pradesh, Maharashtra, Meghalaya, Mizoram, Orissa, Punjab, Rajasthan, Sikkim, Tamil Nadu, Tripura, Uttarakhand, Uttar Pradesh and West Bengal, announced
policies for setting up commercial small hydropower projects through private sector participation. The facilities available in the states include wheeling of power produced, banking, buy-back of power and facilities for third party sale.
• Small hydropower sites with a combined capacity of over 7,000 MW have been allotted to the private sector for development.
• Many states permit power banking, i.e., supply to the grid of electricity surplus generated by an Independent Power Producer in the rainy season in exchange of the receipt of the same amount of electricity from the grid in the dry season, for a period of a few months to one year.
• The buy-back of small hydropower is generally based on the guidelines issued by the Central Electricity Regulatory Commission (CERC), with variations given by the respective State Electricity Regulatory Commissions (SERCs).
• Some states provide other concessions such as lease of land, exemption from electricity duty and entry tax on power generation equipment.
• Some states do not levy any water use charges, known as water cess, on the quantity of water or head used by the power plant, while some levy it as a percentage of electricity tariffs.
• Some states have prescribed the minimum quantum of power produced from renewable sources, renewable purchase obligation (RPO) to be purchased by State Distribution Licensee up to 10 per cent in incremental manners. Renewable energy certificate (REC) trading is not very successful.
• Some states have imposed minimum environmental flow during lean season, and monitoring is preformed using automatic devices with real-time data being published online. Some states have not implemented environmental flow regulations and thus are attracting protests of activist.11
The Indian Renewable Energy Development Agency (IREDA) under the Ministry of New and Renewable Energy is a dedicated financial institution that provides loans and carries out other activities for the promotion of renewable energy sources, including small hydropower. Other financial institutions involved in the sector include Power Finance Corporation limited, Rural Electrification Corporation Limited, the Industrial Development Bank of India and all commercial public and private banks. Multinational financial institutions, such as the World Bank and the Asian Development Bank, have started providing funds for specific projects aiming to promote clean energy in India, normally through the above-mentioned financial institutions.
Under the United Nations Framework Convention on Climate Change (UNFCCC), the Intended Nationally Determined Contribution (INDC) of India is to reduce the emissions intensity of its GDP by 33 to 35 per cent by 2030 from the 2005 level by achieving approximately 40 per cent of cumulative installed capacity from non-fossil fuel-based energy resources by 2030. This shall create an additional carbon sink of 2.5-3 billion tonnes of CO2 equivalent. Out

84
of 843 GW of planned installed capacity in 2030, 75 GW is expected to be from hydropower.18
Barriers to small hydropower developmentThere are several barriers for small hydropower development in India that vary from state to state, depending on the availa-bility of discharge data, site, feasibility reports and clearances. These barriers may be summarized as follows:• The long processes for obtaining project licences,
clearances, permissions and finances;• The lack of involvement and engagement of local people;• State governments’ lack of awareness and legal tools to
regulate minimum flows in the streams;• The lack of power evacuation infrastructure;• A lack of clarity regarding the ownership of SHP projects
by state governments as each project receives support of the state Government in the form of water royalty, local area development, assistance, etc.;
• Local populations and activists consider SHP the same as large hydropower in terms of environmental, rehabilitation and resettlement implications, and thus protest without realising the very low impacts of SHP;
• Due to a continuous increase in capital costs of SHP projects, the increasing burden of various financial loading such as water use tax, load tax, transmission charges, right of way charges, environmental flow, difficult and the time-consuming process of obtaining forest land on lease, the private sector does not find SHP attractive for investment. The SHP-based tariff is being compared with solar energy, which otherwise receives several concessions;
• A lack of Government initiative and will to fight legal matters in courts, which causes a delay in implementation, thus increasing the costs and making tariffs non-competitive;
• Mismatch between the announced policy and its application on the level of field offices, resulting in delays in clearances and execution;
• Lack of available discharge data;• Lack of available suitable spare parts.
References
1. World Bank (2016). India. Available from https://data.worldbank.org/country/india
2. United Nations Food and Agriculture Organization (FAO) (2015). India. Aquastat database. Available from http://www.fao.org/nr/water/aquastat/countries_regions/IND/index.stm
3. Central Electricity Authority (CEA) (2018). Monthly Installed Capacity Reports. Available from http://cea.nic.in/reports/monthly/installedcapacity/2018/installed_capacity-03.pdf
4. Ministry of Power (2018). Government of India. Available from https://powermin.nic.in/sites/default/files/uploads/new_hydro_policy.pdf
5. Central Electricity Authority (CEA). (2018). Grid Operation and Distribution Wing, Generation overview report, March 31, 2018. Available from https://npp.gov.in/public-reports/cea/daily/dgr/31-03-2018/dgr1-2018-03-31.pdf
6. Saubhagya, Pradhan Mantri Sahaj Bijli Har Ghar Yojna (2018). Official website. Available from http://saubhagya.gov.in/
7. Powerline Magazine (2018). Power Trading. New Delhi, May 2018, p. 100. Available from https://powerline.net.in/magazines/
8. Ministry of New and Renewable Energy (MNRE) (2018). Annual Report 2017-2018. Available from https://mnre.gov.in/file-manager/annual-report/2017-2018/EN/index.html
9. Kumar, A. (2015). Benchmark cost for small and large hydropower projects. AHEC IIT Roorkee, August 2015.
10. Ministry of New and Renewable Energy (MNRE) (2018). Annual Report 2017-18. Small Hydropower development. Available from https://mnre.gov.in/file-manager/annual-report/2017-2018/EN/pdf/chapter-3.pdf, pp – 25
11. Xialei, C., Singh, P. R., Xianlai, W., and Kremere, E., eds. (2016). World Small Hydropower Development Report 2016. United Nations Industrial Development Organization; International Center on Small Hydro Power. Available from www.smallhydroworld.org
12. Renewable Watch New Delhi (2018). Solar Pump Installations. Vol 8 No. 6, April 2018, p. 62. Available from https://renewablewatch.in/2018/04/23/solar-pump-installations/
13. Central Electricity Authority (CEA). (2018). Power Sector. March-2018. Available from http://cea.nic.in/reports/monthly/executivesummary/2018/exe_summary-03.pdf
14. Indian Institute of Technology Roorkee (n.d.). International Level Hydraulic Turbine Lab. Available from https://www.iitr.ac.in/departments/HRE/pages/Labs+Sediment_Monitoring_and_Abrasion_Testing_Laboratory.html
15. Indian Institute of Technology Roorkee (n.d.). Sediment Monitoring and Impact Analysis Lab. Available from https://www.iitr.ac.in/departments/HRE/pages/Labs+Hydraulic_Turbine_R_and_D_Lab.html
16. Indian Institute of Technology Roorkee (n.d.). Real time digital simulator for SHP. Available from https://www.iitr.ac.in/departments/HRE/pages/Labs+Real_Time_Digital_Simulator_Lab.html
17. Indian Institute of Technology Roorkee (n.d.). Performance Testing and Evaluation at site. Available from https://www.iitr.ac.in/departments/HRE/pages/Publications+Special_Publications.html
18. Ministry of Environment, Forest and Climate Change (2015). India’s Intended Nationally Determined Contribution: Working Towards Climate Justice. Available from http://www4.unfccc.int/Submissions/INDC/Published%20Documents/India/1/INDIA%20INDC%20TO%20UNFCCC.pdf
19. LIU, H., Masera, D. and Esser, L., eds. (2013). World Small Hydropower Development Report 2013, United Nations Industrial Development Organization; International Center on Small Hydro Power. Available from www.smallhydroworld.org
20. Vajpai, K. (n.d.). Project „Promoting Ultra Low-Head Micro Hydropower Technology to Increase Access to Renewable Energy for Productive Uses in Rural India“. United Nations Industrial Development Oragnization. Available from http://www.ahec.org.in/ICHSD_2015/Presentations/Exhibitors_Presentation_in_PDF/UNIDO.pdf
21. Ministry of New and Renewable Energy (MNRE) (2018). Internal data.

85
3.5. SO
UTH
ERN
AS
iA
Islamic Republic of Iranmohammad Hajilari and Samira Heidari, pöyry Switzerland ltd., tehran Branch
Key factsPopulation 80,277,4281
Area 1,745,150 km2 1
Climate The climate is mostly arid or semi-arid, and subtropical along the Caspian coast. January is the coldest month, with temperatures ranging from 5 °C to 10 °C. August is the hottest month with aver-age temperatures between 20 °C and 30 °C. Daily temperatures can be very high, sometimes reaching 40 °C or more, especially along the Persian Gulf and the Oman Sea.2
Topography Most of the country’s area consists of a central desert plateau lying at 1,200 metres above sea level, which is surrounded by mountains, with small discontinuous plains along both costs. The highest point is Mount Damavand at 5,610 metres above sea level, and the lowest point is the Caspian Sea at -28 metres.3
Rain pattern Annual average rainfall is 300 mm in the plains but only 130 mm in the desert areas.2
Hydrology There are no major rivers in the country. The only navigable river is the Karun. Several other perma-nent rivers flow to the Persian Gulf, while a number of small rivers originating in the north-western Zagros or Alborz flow to the Caspian Sea. On the Central Plateau, numerous rivers form from the snow melting in the mountains in spring and flow through permanent channels, draining eventually into saline lakes. There is a permanent saline lake, Lake Urmia, in the north-west. There are also several connected saline lakes along the border with Afghanistan in the province of Baluchestan va Sistan.3
Electricity sector overview
At the end of 2015, the total installed capacity of the Islamic Republic of Iran was 74,103 MW, of which gas turbines accounted for 36 per cent, combined cycle power plants 25 per cent, steam turbines 21 per cent, hydropower 15 per cent, nuclear power and renewable energy sources (excluding hydropower) combined 2 per cent and diesel 1 per cent. (Figure 1).4 Compared to the year 2013, the country’s total installed capacity increased by 5 per cent.5
Figure 1. Installed electricity capacity by source in Iran (MW)
26,870
18,494
15,830
11,278
1,193
439
Gas
Combined cycle
Steam
Hydropower
Nuclear and RE
Diesel
Source: Ministry of Energy4
Total gross electricity generation in the year 2015 reached 280,689 GWh. The combined cycle power plants accounted for 36 per cent, steam-fired plants 31 per cent, gas-fired
plants 27 per cent, hydropower 5 per cent, nuclear power and renewable energy sources (excluding hydropower) 1 per cent, and diesel 0.02 per cent (Figure 2).4 Thus, electricity generation in 2015 was predominantly (approximately 94 per cent) from fossil fuels. Compared to 2013, electricity generation increased by 7 per cent.5
Figure 2. Annual electricity generation by source in Iran (GWh)
100,936
86,968
75,423
14,087
3,209
65
Combined cycle
Steam
Gas
Hydropower
Nuclear and RE
Diesel
Source: Ministry of Energy4
In 2016/2017 (Iranian year lasting from March 2016 to March 2017), electricity generation grew by 3.1 per cent compared to the year 2015/16 and reached 289.2 TWh, whereas electricity consumption increased by 4.5 per cent reaching 237.4 TWh.6 In 2016/17, Iran exported 6.6 TWh of electricity, which was
3.3.5
World Small HydropoWEr dEvElopmEnt
rEport 2019
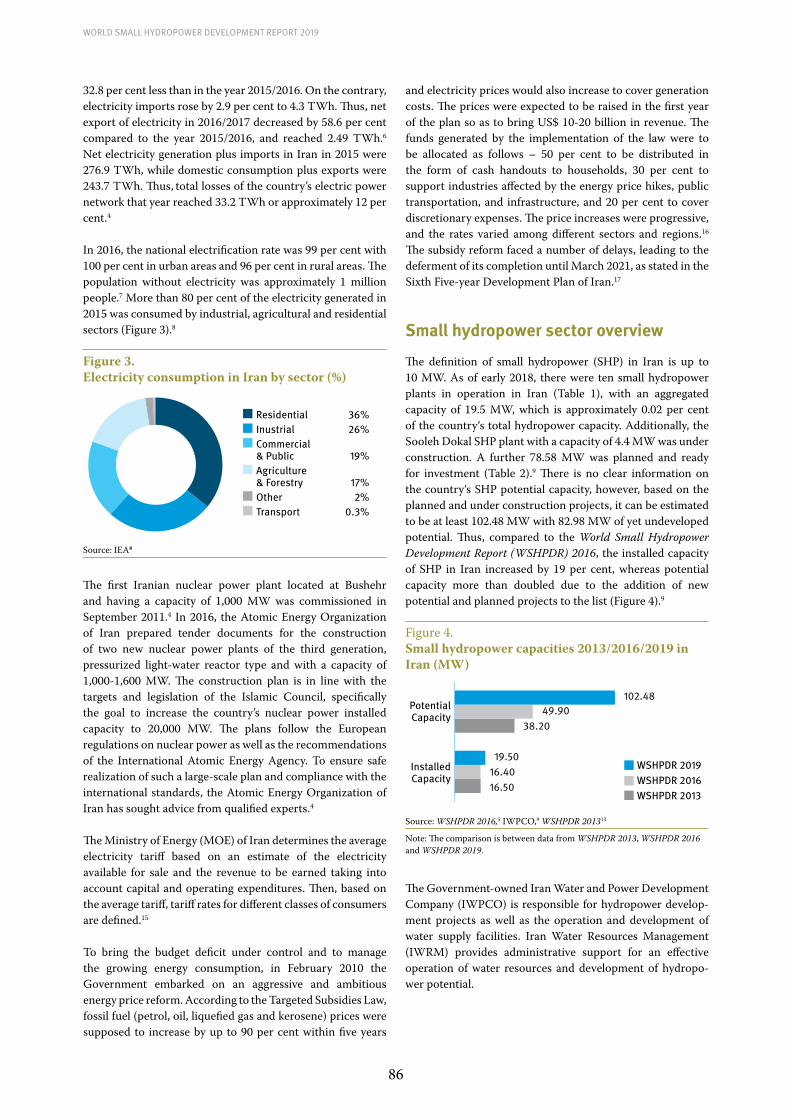
86
World Small HydropoWer development report 2019
32.8 per cent less than in the year 2015/2016. On the contrary, electricity imports rose by 2.9 per cent to 4.3 TWh. Thus, net export of electricity in 2016/2017 decreased by 58.6 per cent compared to the year 2015/2016, and reached 2.49 TWh.6 Net electricity generation plus imports in Iran in 2015 were 276.9 TWh, while domestic consumption plus exports were 243.7 TWh. Thus, total losses of the country’s electric power network that year reached 33.2 TWh or approximately 12 per cent.4
In 2016, the national electrification rate was 99 per cent with 100 per cent in urban areas and 96 per cent in rural areas. The population without electricity was approximately 1 million people.7 More than 80 per cent of the electricity generated in 2015 was consumed by industrial, agricultural and residential sectors (Figure 3).8
Figure 3. Electricity consumption in Iran by sector (%)
Residential 36%Inustrial 26%Commercial& Public 19%Agriculture & Forestry 17%Other 2%Transport 0.3%
Source: IEA8
The first Iranian nuclear power plant located at Bushehr and having a capacity of 1,000 MW was commissioned in September 2011.4 In 2016, the Atomic Energy Organization of Iran prepared tender documents for the construction of two new nuclear power plants of the third generation, pressurized light-water reactor type and with a capacity of 1,000-1,600 MW. The construction plan is in line with the targets and legislation of the Islamic Council, specifically the goal to increase the country’s nuclear power installed capacity to 20,000 MW. The plans follow the European regulations on nuclear power as well as the recommendations of the International Atomic Energy Agency. To ensure safe realization of such a large-scale plan and compliance with the international standards, the Atomic Energy Organization of Iran has sought advice from qualified experts.4
The Ministry of Energy (MOE) of Iran determines the average electricity tariff based on an estimate of the electricity available for sale and the revenue to be earned taking into account capital and operating expenditures. Then, based on the average tariff, tariff rates for different classes of consumers are defined.15
To bring the budget deficit under control and to manage the growing energy consumption, in February 2010 the Government embarked on an aggressive and ambitious energy price reform. According to the Targeted Subsidies Law, fossil fuel (petrol, oil, liquefied gas and kerosene) prices were supposed to increase by up to 90 per cent within five years
and electricity prices would also increase to cover generation costs. The prices were expected to be raised in the first year of the plan so as to bring US$ 10-20 billion in revenue. The funds generated by the implementation of the law were to be allocated as follows – 50 per cent to be distributed in the form of cash handouts to households, 30 per cent to support industries affected by the energy price hikes, public transportation, and infrastructure, and 20 per cent to cover discretionary expenses. The price increases were progressive, and the rates varied among different sectors and regions.16 The subsidy reform faced a number of delays, leading to the deferment of its completion until March 2021, as stated in the Sixth Five-year Development Plan of Iran.17
Small hydropower sector overview
The definition of small hydropower (SHP) in Iran is up to 10 MW. As of early 2018, there were ten small hydropower plants in operation in Iran (Table 1), with an aggregated capacity of 19.5 MW, which is approximately 0.02 per cent of the country‘s total hydropower capacity. Additionally, the Sooleh Dokal SHP plant with a capacity of 4.4 MW was under construction. A further 78.58 MW was planned and ready for investment (Table 2).9 There is no clear information on the country‘s SHP potential capacity, however, based on the planned and under construction projects, it can be estimated to be at least 102.48 MW with 82.98 MW of yet undeveloped potential. Thus, compared to the World Small Hydropower Development Report (WSHPDR) 2016, the installed capacity of SHP in Iran increased by 19 per cent, whereas potential capacity more than doubled due to the addition of new potential and planned projects to the list (Figure 4).9
Figure 4. Small hydropower capacities 2013/2016/2019 in Iran (MW)
0 20 40 60 80 100 120
PotentialCapacity
Installed Capacity
102.48 49.90 38.20
19.50 16.40 16.50
WSHPDR 2019WSHPDR 2016WSHPDR 2013
Source: WSHPDR 2016,5 IWPCO,9 WSHPDR 201313
Note: The comparison is between data from WSHPDR 2013, WSHPDR 2016 and WSHPDR 2019.
The Government-owned Iran Water and Power Development Company (IWPCO) is responsible for hydropower develop-ment projects as well as the operation and development of water supply facilities. Iran Water Resources Management (IWRM) provides administrative support for an effective operation of water resources and development of hydropo-wer potential.
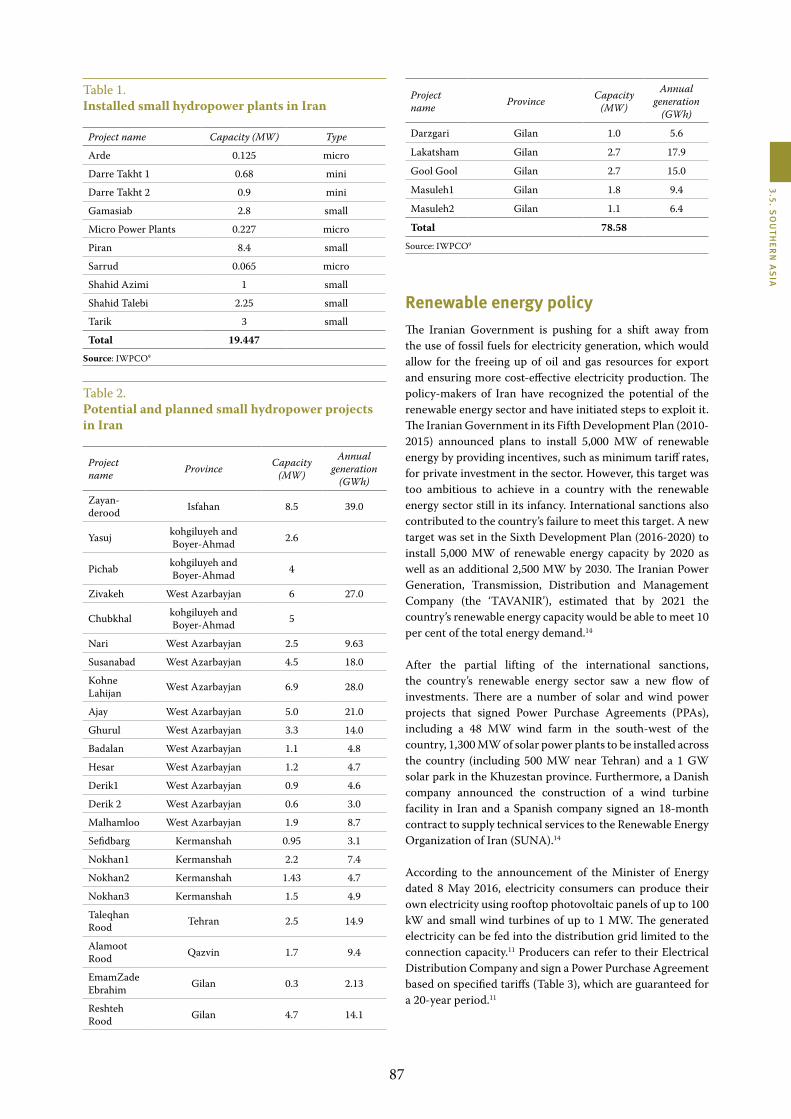
87
3.5. SO
UTH
ERN
AS
iA
Table 1. Installed small hydropower plants in Iran
Project name Capacity (MW) Type
Arde 0.125 micro
Darre Takht 1 0.68 mini
Darre Takht 2 0.9 mini
Gamasiab 2.8 small
Micro Power Plants 0.227 micro
Piran 8.4 small
Sarrud 0.065 micro
Shahid Azimi 1 small
Shahid Talebi 2.25 small
Tarik 3 small
Total 19.447 Source: IWPCO9
Table 2. Potential and planned small hydropower projects in Iran
Project name Province Capacity
(MW)
Annual generation
(GWh)
Zayan-derood Isfahan 8.5 39.0
Yasuj kohgiluyeh and Boyer-Ahmad 2.6
Pichab kohgiluyeh and Boyer-Ahmad 4
Zivakeh West Azarbayjan 6 27.0
Chubkhal kohgiluyeh and Boyer-Ahmad 5
Nari West Azarbayjan 2.5 9.63
Susanabad West Azarbayjan 4.5 18.0
Kohne Lahijan West Azarbayjan 6.9 28.0
Ajay West Azarbayjan 5.0 21.0
Ghurul West Azarbayjan 3.3 14.0
Badalan West Azarbayjan 1.1 4.8
Hesar West Azarbayjan 1.2 4.7
Derik1 West Azarbayjan 0.9 4.6
Derik 2 West Azarbayjan 0.6 3.0
Malhamloo West Azarbayjan 1.9 8.7
Sefidbarg Kermanshah 0.95 3.1
Nokhan1 Kermanshah 2.2 7.4
Nokhan2 Kermanshah 1.43 4.7
Nokhan3 Kermanshah 1.5 4.9
Taleqhan Rood Tehran 2.5 14.9
Alamoot Rood Qazvin 1.7 9.4
EmamZade Ebrahim Gilan 0.3 2.13
Reshteh Rood Gilan 4.7 14.1
Project name Province Capacity
(MW)
Annual generation
(GWh)
Darzgari Gilan 1.0 5.6
Lakatsham Gilan 2.7 17.9
Gool Gool Gilan 2.7 15.0
Masuleh1 Gilan 1.8 9.4
Masuleh2 Gilan 1.1 6.4
Total 78.58 Source: IWPCO9
Renewable energy policyThe Iranian Government is pushing for a shift away from the use of fossil fuels for electricity generation, which would allow for the freeing up of oil and gas resources for export and ensuring more cost-effective electricity production. The policy-makers of Iran have recognized the potential of the renewable energy sector and have initiated steps to exploit it. The Iranian Government in its Fifth Development Plan (2010-2015) announced plans to install 5,000 MW of renewable energy by providing incentives, such as minimum tariff rates, for private investment in the sector. However, this target was too ambitious to achieve in a country with the renewable energy sector still in its infancy. International sanctions also contributed to the country’s failure to meet this target. A new target was set in the Sixth Development Plan (2016-2020) to install 5,000 MW of renewable energy capacity by 2020 as well as an additional 2,500 MW by 2030. The Iranian Power Generation, Transmission, Distribution and Management Company (the ‘TAVANIR’), estimated that by 2021 the country’s renewable energy capacity would be able to meet 10 per cent of the total energy demand.14
After the partial lifting of the international sanctions, the country’s renewable energy sector saw a new flow of investments. There are a number of solar and wind power projects that signed Power Purchase Agreements (PPAs), including a 48 MW wind farm in the south-west of the country, 1,300 MW of solar power plants to be installed across the country (including 500 MW near Tehran) and a 1 GW solar park in the Khuzestan province. Furthermore, a Danish company announced the construction of a wind turbine facility in Iran and a Spanish company signed an 18-month contract to supply technical services to the Renewable Energy Organization of Iran (SUNA).14
According to the announcement of the Minister of Energy dated 8 May 2016, electricity consumers can produce their own electricity using rooftop photovoltaic panels of up to 100 kW and small wind turbines of up to 1 MW. The generated electricity can be fed into the distribution grid limited to the connection capacity.11 Producers can refer to their Electrical Distribution Company and sign a Power Purchase Agreement based on specified tariffs (Table 3), which are guaranteed for a 20-year period.11

88
Table 3. Guaranteed renewable energy purchase tariffs
Capacity Tariff (IRR/kWh (US$/kWh))
Wind ≤1 MW 5,700 (0.14)
Solar ≤100 kW 7,000 (0.17)
Solar ≤ 20 kW 8,000 (0.19) Source: SUNA11
Legislation on small hydropower
The 1968 Iran Water Law and the Manner of Water Nationalization provided a framework for the utilization of water resources in the country. Provisions are included for licensing, duties, water charges and dues, water rights and use permits. More specifically, the Law provides for the nationalization of river basins and other water resources, the public use of water resources, the concession of permits for the use of water resources and relative prescriptions.12
Barriers to small hydropower development The barriers to the development of small hydropower as men-tioned in the WSHPDR 2016 still persist and include:• Limited water resources;• A greater focus on the development of medium and large
hydropower plants;• Lack of investment delaying the realization of some
projects.
References
1. World Bank (2016). Iran, Islamic Rep. Available from http://data.worldbank.org/country/iran-islamic-republic
2. Encyclopedia of the Nations (n.d.). Iran Climate. Asia and Oceania. Available from www.nationsencyclopedia.com/Asia-and- Oceania/Iran-CLIMATE.html
3. Encyclopaedia Brittanica (2018). Iran. Available from https://www.britannica.com/place/Iran
4. Ministry of Energy (MOE), Tavanir holding company (2016). Electric Power Industry in Iran (2015-2016). Available from http://amar.tavanir.org.ir/pages/report/stat94/sanatebargh/sanatebargh%20l/sanatl.pdf
5. Xialei, C., Singh, P. R., Xianlai, W., and Kremere, E., eds. (2016). World Small Hydropower Development Report 2016. United Nations Industrial Development Organization; International Center on Small Hydro Power. Available from www.smallhydroworld.org
6. Central bank of the Islamic Republic of Iran (2017). Annual Review 1395 (2016/17). Available from http://www.cbi.ir/SimpleList/AnnualReview_en.aspx
7. International Energy Agency (IEA) (2017). Energy Access Outlook. Available from http://www.worldenergyoutlook.org/resources/energydevelopment/energyaccessdatabase/
8. International Energy Agency (IEA) (2015). World Energy Outlook. Available from http://www.iea.org/
statistics/statisticssearch/report/?country=Iran%20&product=electricityandheat
9. Iran Water and Power Development Company (IWPCO) (2015). Medium and Small Project Section. Available from http://en.iwpco.ir/PMS/default.aspx
10. World Energy Council (2016). World Energy Resources: Hydropower 2016. Available from https://www.worldenergy.org/wp-content/uploads/2017/03/WEResources_Hydropower_2016.pdf
11. Renewable energy organization of Iran (SUNA) (2016). Statement. Available from http://www.satba.gov.ir/suna_content/media/image/2016/09/4798_orig.pdf
12. The Islamic Republic of Iran (1968). Iran Water Law and the Manner of Water Nationalization. Chapters I, II, IV, VI, VII, VIII, IX. Available from http://faolex.fao.org/
13. Liu, H., Masera, D. and Esser, L., eds. (2016). World Small Hydropower Development Report 2016. United Nations Industrial Development Organization; International Center on Small Hydro Power. Available from www.smallhydroworld.org.
14. CMS Cameron McKenna LLP (2016). Renewable Energy in Iran. Available from http://www.satba.gov.ir/suna_content/media/image/2017/02/5196_orig.pdf?t=636219021775330000
15. Manzoor, D. (n.d.). Energy pricing policy in Iran, Ministry of Energy, Teheran, Iran. Available from http://www.iaea.org/inis/collection/NCLCollectionStore/_Public/28/009/28009191.pdf
16. Moshiri, S. (n.d.). Energy Price Reform and Energy Efficiency in Iran, International Association for Energy Economics. Available from https://www.iaee.org/en/publications/newsletterdl.aspx?id=197
17. Tehran Times (2016). Rouhani presents $262b budget bill to Majlis. 18 January 2016. Available from http://www.tehrantimes.com/news/252294/Rouhani-presents-262b-budget-bill-to-Majlis
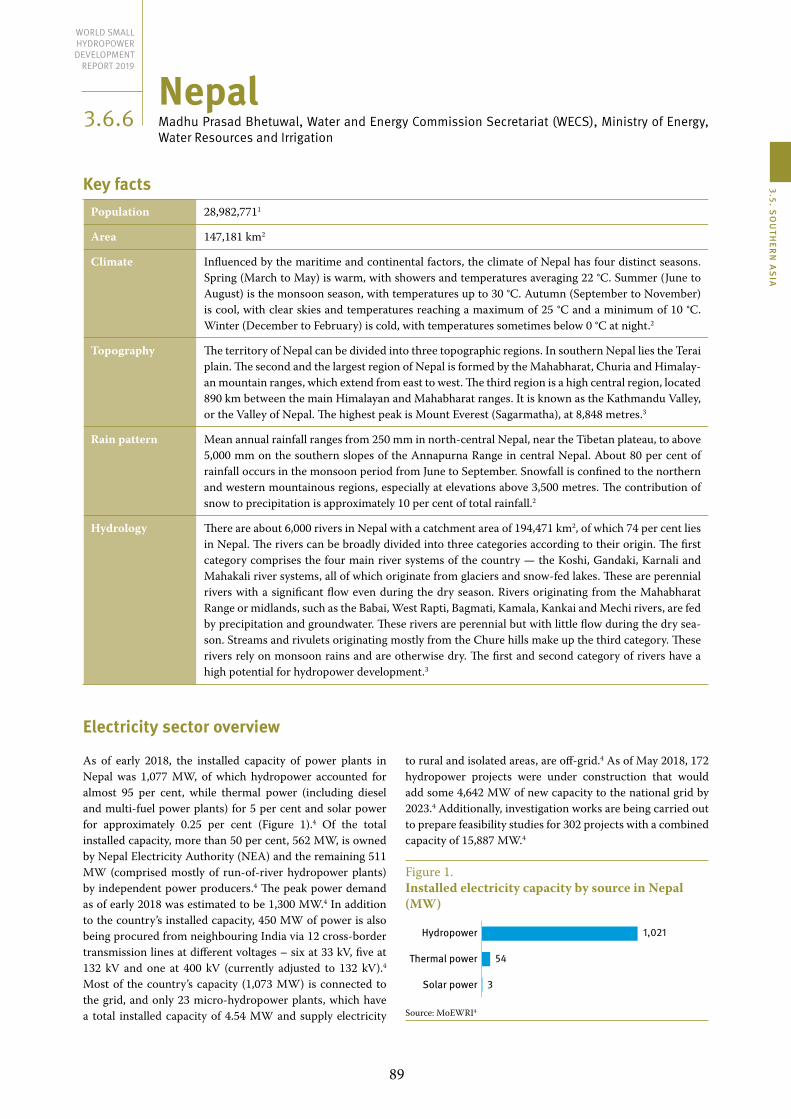
89
3.5. SO
UTH
ERN
AS
iA
Nepal madhu prasad Bhetuwal, Water and Energy Commission Secretariat (WECS), ministry of Energy, Water resources and Irrigation
Key factsPopulation 28,982,7711
Area 147,181 km2
Climate Influenced by the maritime and continental factors, the climate of Nepal has four distinct seasons. Spring (March to May) is warm, with showers and temperatures averaging 22 °C. Summer (June to August) is the monsoon season, with temperatures up to 30 °C. Autumn (September to November) is cool, with clear skies and temperatures reaching a maximum of 25 °C and a minimum of 10 °C. Winter (December to February) is cold, with temperatures sometimes below 0 °C at night.2
Topography The territory of Nepal can be divided into three topographic regions. In southern Nepal lies the Terai plain. The second and the largest region of Nepal is formed by the Mahabharat, Churia and Himalay-an mountain ranges, which extend from east to west. The third region is a high central region, located 890 km between the main Himalayan and Mahabharat ranges. It is known as the Kathmandu Valley, or the Valley of Nepal. The highest peak is Mount Everest (Sagarmatha), at 8,848 metres.3
Rain pattern Mean annual rainfall ranges from 250 mm in north-central Nepal, near the Tibetan plateau, to above 5,000 mm on the southern slopes of the Annapurna Range in central Nepal. About 80 per cent of rainfall occurs in the monsoon period from June to September. Snowfall is confined to the northern and western mountainous regions, especially at elevations above 3,500 metres. The contribution of snow to precipitation is approximately 10 per cent of total rainfall.2
Hydrology There are about 6,000 rivers in Nepal with a catchment area of 194,471 km2, of which 74 per cent lies in Nepal. The rivers can be broadly divided into three categories according to their origin. The first category comprises the four main river systems of the country — the Koshi, Gandaki, Karnali and Mahakali river systems, all of which originate from glaciers and snow-fed lakes. These are perennial rivers with a significant flow even during the dry season. Rivers originating from the Mahabharat Range or midlands, such as the Babai, West Rapti, Bagmati, Kamala, Kankai and Mechi rivers, are fed by precipitation and groundwater. These rivers are perennial but with little flow during the dry sea-son. Streams and rivulets originating mostly from the Chure hills make up the third category. These rivers rely on monsoon rains and are otherwise dry. The first and second category of rivers have a high potential for hydropower development.3
Electricity sector overview
As of early 2018, the installed capacity of power plants in Nepal was 1,077 MW, of which hydropower accounted for almost 95 per cent, while thermal power (including diesel and multi-fuel power plants) for 5 per cent and solar power for approximately 0.25 per cent (Figure 1).4 Of the total installed capacity, more than 50 per cent, 562 MW, is owned by Nepal Electricity Authority (NEA) and the remaining 511 MW (comprised mostly of run-of-river hydropower plants) by independent power producers.4 The peak power demand as of early 2018 was estimated to be 1,300 MW.4 In addition to the country’s installed capacity, 450 MW of power is also being procured from neighbouring India via 12 cross-border transmission lines at different voltages – six at 33 kV, five at 132 kV and one at 400 kV (currently adjusted to 132 kV).4 Most of the country’s capacity (1,073 MW) is connected to the grid, and only 23 micro-hydropower plants, which have a total installed capacity of 4.54 MW and supply electricity
to rural and isolated areas, are off-grid.4 As of May 2018, 172 hydropower projects were under construction that would add some 4,642 MW of new capacity to the national grid by 2023.4 Additionally, investigation works are being carried out to prepare feasibility studies for 302 projects with a combined capacity of 15,887 MW.4
Figure 1. Installed electricity capacity by source in Nepal (MW)
54
1,021
3
Hydropower
Thermal power
Solar power
Source: MoEWRI4
3.6.6
World Small HydropoWEr dEvElopmEnt
rEport 2019

90
World Small HydropoWer development report 2019
Overall electricity generation in Nepal in 2017 was at 4,082 GWh, including 2,305 GWh from NEA’s hydropower plants and 1,777 GWh from independent power producers.5 An additional 2,175 GWh of electricity was imported from India.5
As of May 2018, the power system consisted of 78 km of 400 kV lines, 75 km of 220 kV lines and 2,819 km of 132 kV lines.4 To enhance and expand transmission capacity, the Government launched several initiatives, including study and construction of transmission lines of different voltages and substations. As of May 2018, 1,357 km of 220 kV and 1,108 km of 132 kV transmission lines was under-construction.4 In July 2015, the Government of Nepal established the Rastriya Prasaran Grid Company for the development and operation of transmission lines.6 Following the signing of a Power Trade Agreement with India, the Integrated Transmission Master Plan is being prepared regarding projects that will be implemented by 2035 by the Joint Technical Team of Nepal and India. In 2017, transmission and distribution losses in the power system were at approximately 23 per cent.5
Ten years of internal conflict left their mark on the electricity sector of the country. Nepal faced a severe power crisis as planned projects could not come out on time. Despite having a huge hydropower potential (84 GW of theoretical and 43 GW of economic potential), Nepal has been importing electricity from India to meet its growing demand. The annual per capita power consumption is very low at approximately 132 kWh, although 74 per cent of the population have access to the grid.7,8,16 The earthquake in April 2015, which claimed more than 4,000 lives, also gravely affected the electricity system of the country. Hydropower plants with at least 150 MW of installed capacity were damaged. Due to the nature of the earthquake and the landslides it caused, it particularly affected mini- and micro-hydropower plants located in the mountainous regions resulting in at least 45 MW of damaged capcity.12 As of 2018, most of these plants were back in operation after having been non-functional for approximately 1-2 years.
To expedite the development of the power sector in the country, on 18 February 2016 the Government of Nepal approved “The National Energy Crisis Management and Concept Paper for the Electricity Development Decade”, which included a SWOT (Strength, Weaknesses, Opportunities and Threats) analysis of the power sector. Various reforms of the sector have been proposed, covering such aspects as the organisational, legal and administrative system, power purchase, electricity distribution, theft control and investment procedure, in order to accelerate private investments as well as to enhance efficiency and effectiveness of public entities engaged in the power sector.7 Altogether, there are 99 actions to be taken to develop 10,000 MW of power generation capacity in the next decade. The proposals include simplifying working procedures in awarding licences, procuring private land or leasing Government land including forest land, establishment of Rastriya Grid Company, Generation Company, steering committees at different levels to resolve disputes that may arise while implementing projects, setting electricity tariff rates for different types of projects (run-of-river, peaking run-
of-river, storage and solar plants) and mitigating the foreign currency exchange risk.
Several institutions have been engaged in the power sector of Nepal, such as the Ministry of Energy, Water Resources and Irrigation (MoEWRI), the Department of Electricity Development (DoED), the Alternate Energy promotion Centre (AEPC), the Investment Board of Nepal (IBN), Nepal Electricity Authority (NEA) and independent power producers (IPPs). MoEWRI, DoED, AEPC and IBN play facilitating as well as regulating roles in the power sector of Nepal. NEA and IPPs are the key players in the power generation sector. NEA, a wholly state-owned corporation, dominates the power sector. It is responsible for most of the country’s electricity generation, scheduling, dispatch, transmission, distribution and sales. It operates major hydropower plants in Nepal, two diesel plants, and two small solar power facilities. As of the moment of writing of this report, NEA and its subsidiary companies were constructing more than ten hydropower projects. Extension of the transmission grid and the distribution network are also NEA’s responsibilities. NEA distributes electricity to 3.46 million customers.4 The private sector has participated in the Nepalese electricity market since 1992, under the Hydropower Development Policy of the same year. One large privately-owned distribution company, Butwal Power Company, supplies electricity to 50,000 consumers. Besides, there are many community-managed distribution schemes scattered across the country.4
Small hydropower sector overview
Nepal generally adheres to the definition of small hydropower (SHP) as hydropower plants with a capacity of up to 25 MW. However, it is not clearly defined in government policy or le-gal documents.
As of May 2018, the installed capacity of SHP up to 25 MW in Nepal was 446.8 MW from 79 plants, whereas the installed capacity of SHP up to 10 MW was 236.2 MW from 66 plants (Table 1).9 Based on the projects that received or applied for licences and those on the Government’s reserve list, the po-tential capacity of SHP up to 25 MW is at least 4,196 MW, while the potential capacity of SHP up to 10 MW is at least 1,960 MW.9 Compared to the results of the World Small Hy-dropower Development Report (WSHPDR) 2016, the installed capacity up to 10 MW increased by 80 per cent and potential capacity up to 10 MW increased by 37 per cent (Figure 2). Such a significant increase is both due to the Government’s strategy of supporting SHP development and access to more accurate data.
As of May 2018, in addition to the operating plants, 91 SHP projects up to 10 MW and 124 projects of capacity up to 25 MW received generation licences. Similarly, 156 SHP projects up to 10 MW and 215 projects up to 25 MW were granted licences to prepare feasibility and environmental study re-ports. In addition, 31 SHP projects up to 10 MW and 35 pro-jects up to 25 MW applied for survey or generation licences. Finally, 96 SHP projects up to 10 MW and 110 projects up to

91
3.5. SO
UTH
ERN
AS
iA
25 MW were on the Government’s list of reserved projects (Table 1).9 In general, Nepal views hydropower development as a key opportunity for economic growth and human de-velopment, overcoming the supply-demand imbalance, as well keeping pace with the growth of annual demand.
Figure 2. Small hydropower capacities up to 10 MW 2013/2016/2019 in Nepal (MW)
0 500 1000 1500 2000
PotentialCapacity
Installed Capacity
1,960 1,430 1,430
236 131 70
WSHPDR 2019WSHPDR 2016WSHPDR 2013
Source: MoEWRI,9 WSHPDR 2016,13 WSHPDR 201314
Note: The comparison is between data from WSHPDR 2013, WSHPDR 2016 and WSHPDR 2019.
Table 1.Small hydropower plants in Nepal by scale
Stage Category ≤1MW* >1 MW ≤ 10 MW
> 10 MW ≤ 25 MW
OperatingNumber of plants 15 51 13
Capacity (MW) 11.2 225.0 210.6
Generation licence issued
Number of plants 17 74 33
Capacity (MW) 13.6 404.7 550.2Survey licence issued
Number of plants 18 138 59
Capacity (MW) 14.4 780.2 1,138. 2Survey licence applied for
Number of plants 1 13 3
Capacity (MW) 0.7 68.8 74.0
Generation licence applied for
Number of plants 10 7 1
Capacity (MW) 7.9 33. 5 24.8
On holdNumber of plants 1 82 4Capacity (MW) 1.0 335.3 69.7
Under study
Number of plants - 10 9Capacity (MW) - 51.5 156.8
StudiedNumber of plants 1 2 1Capacity (MW) 0.5 11.3 12.5
Source: MoEWRI9
Note: * Licences are not required for projects <1 MW. Projects with installed capacity of 100 kW to less than 1 MW, need to inform about the proposal before the survey or construction of the project.
Most of the small hydropower projects in Nepal are owned by the domestic private sector. Capacity and confidence levels of domestic developers, investors, contractors and consulting firms have been raised due to a number of factors:• Local financial institutions have been providing loans to
SHP projects;• The Government’s announcement of power purchase
agreements on a take-or-pay basis;• Tariff rates have been fixed for the base year at the time
of commercial operation date of the power plant, and the
escalation rate and escalation period were set;• On-going reforms in the power sector;• Commitment to provide 17 per cent return in equity;• Assurance to provide VAT on civil works (approximately 5
million US$/100 MW after the commercial operation date of the project);
• 100 per cent income tax exemption for 10 years from the commercial operation date and 50 per cent income tax exemption for five years; etc.7,10
For rural communities, the development of small off-grid hydropower plants is a key priority. Supported by the United Nations Development Programme (UNDP), the Rural Energy Development Programme is seeking to promote renewable energy sources by building SHP and solar heating (cooking stoves) systems to provide reliable, low-cost electricity to a large number of isolated, rural communities. Launched in 1996 as a small pilot initiative in five remote hill districts, the programme was subsequently scaled up via the national Hydropower Development Policy of 2001, which focused on rural development via low-cost hydropower systems. The lessons learned from this programme helped formulate the National Rural Energy Policy in 2006 and subsequent national five-year plans. In partnership with the Government of Nepal and Australian Aid, UNDP’s Microenterprise Development Program (MEDEP) helped over 11,965 households gain access to electricity through 37 micro-hydropower plants (MHPPs) in 2013.11
Renewable energy policy
In 2011, the Government launched the National Rural and Renewable Energy Programme (NRREP), which aimed to scale up energy access in rural areas through renewable ener-gy sources. The first phase of the initiative was planned for a five-year period and finished in July 2017. Currently, the Government is developing a successor initiative to NRREP. In 2016, the Government adopted the Renewable Energy Subsidy Policy, which aims to foster the development of the renewable energy sector and support low-income households in using renewable energy technologies through subsidies. In particular, subsidies for micro- and mini-hydropower facili-ties range from NRP 20,000 to NRP 125,000 (US$ 186 to US$ 1,161) per kW for generation and from NRP 28,000 to NRP 35,500 (US$ 260 to US$ 330) per household for distribution.15
Legislation on small hydropower
The Electricity Act (1992), Electricity Regulation (1993), and Water Resources Act (1992) and its regulation are the key le-gal documents that pave the entry of the private sector in the development of power projects. A licence is required even to proceed to investigation works for a project of 1 MW of capa-city or more. There is a two-stage licensing system. The first stage is a survey licence issued for a maximum of five years to carry out a feasibility and environmental study. The second stage is a generation licence granted for a maximum period of 50 years for construction and operation of a power plant. At

92
World Small HydropoWer development report 2019
the end of the term of the construction licence, the licensee has to hand over the project in a good operating condition free of cost. The Hydropower Development Policy (2001) up-dated the duration of generation licences to 35 years for do-mestic projects and 30 years for export-oriented projects. The long-awaited National Electricity Regulatory Commission Act was promulgated in 2017 to regulate the electricity sec-tor in Nepal. The Electricity Act (1992) waives the licensing requirement for hydropower projects of less than 1 MW of capacity, provided the project is registered with the District Water Resources Committee and forwarded to the Depart-ment of Electricity Development (DoED).18,19
The Hydropower Development Policy (2001) aims to provide rural and countrywide electricity access through affordab-le and efficient hydropower. Rural development is seen as a two-pronged objective including electrification and local eco-nomy stimulation via installing SHP plants at the local level to boost agricultural and industrial production.
Barriers to small hydropower developmentWhile there has been extensive growth of SHP in Nepal over the past 50 years, there remain several limiting factors to SHP development. Some of the principal barriers include: • Lack of clear and supportive policies and a regulatory
framework;• Political instability;• Limitations on bank financing: unattractive loan duration
and interest rates as banks are unable to raise long-term borrowings, inability to hedge the exchange risk as lending is in US$ but the income stream is in Nepalese Rupee (NPR);
• Ineffective licensing procedure;• No single agency fully empowered to serve the SHP sector;• Poor or no access to infrastructure or power evacuation
lines;• The burdensome procedure of carrying out an
environmental impact assessment can delay implementation of projects;
• Additional financial burden on NEA during certain periods of the year resulting from underutilization of its own power plants while being forced to absorb power from SHP plants due to take-or-pay PPAs;
• Non-availability of equity and mezzanine financing for project developers;
• Legal enforcement of contracts;• Inconsistent policies;• Low load factors of SHP plants and their inability to deliver
energy during the periods of dry/lean season;• Absence of integrated river basin plans;• Growing expectations of local people towards hydropower
projects due to the compensation amount for the land acquired by the developers being four to ten times higher than the market price;
• Young geology requiring more investment in the excavation at the project site;
• High sedimentation rate requiring large-size de-sanders or more maintenance to repair turbines.13,17
References
1. World Bank (2016). Nepal. Population, total. Available from https://data.worldbank.org/indicator/SP.POP.TOTL?locations=NP
2. United Nations Food and Agriculture Organization (FAO) (2011). Nepal. Aquastat database. Available from www.fao.org/nr/water/aquastat/countries_regions
3. United States Library of Congress (1991). Nepal: A Country Study. Available from www.countrystudies.us
4. Ministry of Energy, Water Resources and Irrigation (MoEWRI) (2018). Present facts of Energy, Water Resources and Irrigation sector (2018) and future roadmap. Available from http://moen.gov.np/pdf_files/White-Paper-2075-with-Annex01.pdf
5. Nepal Electricity Authority (2017). Annual report 2017. Available from http://nea.org.np/annual_report
6. Rastriya Prasaran Grid Company Limited (n.d.). Official website. Available from http://rpgcl.com/page/2/company/about_us
7. Ministry of Energy, Water Resources and Irrigation (MoEWRI) (2016). National Energy Crisis Management and Concept Paper for the Electricity Development Decade, 2072. Available from http://moen.gov.np/pdf_files/Rastriya-Urja-Sankat-Niwaran-2072.pdf
8. National Planning Commission of the Government of Nepal (2016). Fourteenth periodic plan (Fiscal year 2073/74-2075/76). Available from https://www.npc.gov.np/images/category/14th-plan-full-document.pdf
9. Department of Electricity Development of Ministry of Energy, Water Resources and Irrigation (n.d.). Official website. Available from http://www.doed.gov.np/
10. Nepal Electricity Authority (NEA) (2017). NEA Board Decisions On The Power Purchase Rates And Associated Rules For PPA Of ROR/PROR/Storage Projects Effective From 2074/01/14 (April 27, 2017). Available from http://nea.org.np/publications
11. United Nations Development Programme (UNDP) (2014). Annual report 2013. Available from http://www.undp.org/content/dam/nepal/docs/reports/annual_reports/UNDP_NP_UNDP%20Nepal%20Annual%20Report%202013.pdf
12. Nepal Energy Forum (2015). Earthquake damages over a dozen hydropower projects. Available from http://www.nepalenergyforum.com/earthquake-damages-over-dozen-hydropower-projects/
13. Xialei, C., Singh, P. R., Xianlai, W., and Kremere, E., eds. (2016). World Small Hydropower Development Report 2016. United Nations Industrial Development Organization; International Center on Small Hydro Power. Available from www.smallhydroworld.org
14. LIU, H., Masera, D. and Esser, L., eds. (2013). World Small Hydropower Development Report 2013, United Nations Industrial Development Organization; International Center on Small Hydro Power. Available from www.smallhydroworld.org
15. Ministry of Population and Environment (2016). Renewable Energy Subsidy Policy, 2073 BS. Available from http://www.aepc.gov.np/files/20160606165013_RE%20Subsidy%20Policy%202016%20(2073%20BS)_Unofficial%20Translation_English.pdf

93
3.5. SO
UTH
ERN
AS
iA
16. International Hydropower Association (2016). Nepal. Available from https://www.hydropower.org/country-profiles/nepal
17. Government of Nepal (2011). Scaling-up renewable energy program investment plan for Nepal. Available from https://www.mope.gov.np/download/SREPclean.pdf.75fc6c5d52e2914e1f675fab66a52371
18. Ministry of Energy, Water Resources and Irrigation (MoEWRI) (n.d.). Act & Regulations. Available from http://www.moen.gov.np/act_and_regulations.php
19. Rijal, P. (2018). Nepal Electricity Regulatory Commission to take shape soon: Energy Ministry. The Himalayan Times, 30 January 2018. Available from https://thehimalayantimes.com/kathmandu/government-set-electricity-regulatory-commission/

94
PakistanEjaz Hussain Butt, SmEC-EGC
Key factsPopulation 207,770,001
Area 803,940 km2
Climate The climate is dry and hot near the coast, becoming progressively cooler towards the north-eastern highlands. In Islamabad, the hot season begins in March and by June temperatures may reach up to 46 °C, while the cold season lasts from December to February, when the temperature may drop below -3 °C. In the northernmost parts of the country winter temperatures may fall below -10 °C.2
Topography Pakistan exhibits a blend of landscapes varying from plains to deserts, forests, hills, plateaus, coastal areas of the Arabian Sea in the south and the mountains of Karakoram and Himalayan ranges in the north. The world’s second and ninth highest peaks, K-2 (8,611 metres) and Nanga Parbat (8,126 met-res) are located in the northernmost parts of Pakistan.3
Rain pattern The distribution of rainfall in Pakistan varies greatly, mostly associated with monsoon winds and the western disturbances. Precipitation is not continuous throughout the year and also varies year to year.3 Between June and September, the monsoon provides an average rainfall of approximately 38 mm in the river basins and up to approximately 150 mm in the north. In some areas, high volumes of rainfall can cause floods, while in desert areas low rainfall can cause droughts.4
Hydrology The main surface water resources of Pakistan are represented by the Indus River and its tributaries. The Indus River has a total length of 2,900 km, with a drainage basin of approximately 966,000 km2. Its main tributaries are the Jhelum, Chenab, Ravi, Beas and Sutlej. The majority of groundwater re-sources exist in the Indus Plain, extending from the Himalayan foothills to the Arabian Sea, and are stored in alluvial deposits. The plain is approximately 1,600 km long, covers 210,000 km2 and has an extensive unconfined aquifer, which is fast becoming the supplemental source of water for irrigation. Mean annual availability of surface and groundwater is approximately 170,000 million m3 and 71,000 million m3, respectively.5
Electricity sector overview
In mid-2018, the total installed capacity of Pakistan under the control of the National Transmission and Distribution Company (NTDC) was 35,372 MW. The annual electricity sales over the year 2017-2018 stood at over 111 TWh.6
Figure 1. Installed electricity capacity by source in Pakistan (MW)
23,510
8,689
1,482
985
400
306
Thermal power
Hydropower
Nuclear power
Wind power
Solar power
Bagasse
Source: NTDC6
Electricity in Pakistan comes from a variety of sources, inclu-ding hydropower, thermal, nuclear, agricultural biomass and
biodiesel, solar and wind power. Hydropower and thermal sources have been used for much of the country’s history, with plants being mainly located in the northern parts of the coun-try and a few in the plains. The generation of electricity from nuclear, solar, wind and other alternate sources has begun rather recently. As a result, the number and capacities of the-se plants are smaller than those of thermal and hydropower plants. In mid-2018, thermal power accounted for 66 per cent of total installed capacity, hydropower for 25 per cent, nuclear power for 4 per cent, wind power for almost 3 per cent, solar power for slightly more than 1 per cent and biomass for less than 1 per cent (Figure 1).
In terms of electricity generation, out of the total of 133,826 GWh generated in 2017-2018, 69 per cent came from thermal power, 21 per cent from hydropower, 7 per cent from nuclear power, almost 2 per cent from wind power and less than 1 per cent from bagasse and solar power each (Figure 2). An additi-onal 555 GWh was imported from Iran.6
According to the NTDC report from June 2018, there was over 531,000 km of transmission lines and 873 grid stations of various capacities in service. The total number of electricity
3.3.7
World Small HydropoWEr dEvElopmEnt
rEport 2019

95
3.5. SO
UTH
ERN
AS
iA
consumers was 29.6 million and the total number of villages electrified was 225,333.6 In 2016, approximately 99 per cent of the population of Pakistan had access to electricity.7
Figure 2. Annual electricity generation by source in Pakistan (GWh)
92,312
28,562
9,131
2,118
1,039
664
Thermal power
Hydropower
Nuclear power
Wind power
Bagasse
Solar power
Source: NTDC6
Prior to 1998, there were two vertically integrated utilities, the Karachi Electric Supply Company (KESC), which served the Karachi area, and the Pakistan Water and Power Development Authority (WAPDA), which served the rest of the country and was the largest public power generating company owning more than 59 per cent of the country’s generating capacity and serving the majority of consumers. The power sector was restructured in 1998 with the creation of PEPCO (Pakistan Electric Power Company). WAPDA’s power division was restructured into distinct corporate entities comprising four generation companies (GENCOs), ten distribution companies (DISCOs) and the National Transmission and Distribution Company (NTDC). A small share of power distribution has been undertaken by K-Electric (formerly KESC) serving electric power in Karachi, the biggest city of Pakistan.8
The National Electric Power Regulatory Authority (NEPRA) is the country’s sole authority that determines and fixes the tariffs for all types of generating plants and the electricity consumers (domestic, commercial and industrial). Peak and off-peak tariffs are charged to industrial consumers and now to domestic consumers as well. The average household electricity tariff paid in Pakistan in 2018 was approximately 0.11 US$/kWh.8
In the past, due to the insufficient additions to the power pool, there was a rising power shortfall reaching 5,000-6,000 MW during the hot season. In order to address the gap between the demand and supply, NTDC carried out a study for the National Power Expansion Plan (2011-2030), which included plans and projects for generation, transmission, distribution, and financing.8
Small hydropower sector overview
In Pakistan, small hydropower (SHP) is defined as 50 MW or less. The installed capacity of small, mini- and micro-hydro-power plants, is currently 410 MW, while additional estima-ted hydropower potential is approximately 2,690 MW, indica-
ting that some 13 per cent of the country’s small hydropower potential has been developed.10,11,12,13 Compared to the results of the World Small Hydropower Development Report (WSH-PDR) 2016, installed and potential capacities increased by 43 and 37 per cent respectively (Figure 3). This substantial in-crease was due to the development and identification of many more small hydropower sites in the Khyber Pakhtunkhwa and Gilgit-Baltistan areas.
Figure 3. Small hydropower capacities 2013/2016/2019 in Pakistan (MW)
0 500 1000 1500 2000 2500 3000 3500
PotentialCapacity
Installed Capacity
3,100 2,265 2,265
410 287 281
WSHPDR 2019WSHPDR 2016WSHPDR 2013
Source: WAPDA,10 Qureshi & Akıntuğ,11 SMEC-EGC,12 PPIB,13 WSHPDR 2016,14 WSHPDR 201315
Note: The comparison is between data from WSHPDR 2013, WSHPDR 2016 and WSHPDR 2019.
Compared with the total installed hydropower capacity of Pakistan, small hydropower accounts for approximately 6 per cent, while small hydropower potential is approxima-tely 5 per cent of the total hydropower potential estimated at 60,000 MW.11 The north of Pakistan is rich in hydropower resources. Numerous small hydropower projects have been developed and many are under implementation or have been identified with preliminary hydropower potential studies of various river basins. The province of Gilgit-Baltistan has the greatest installed capacity and the largest potential, while in Baluchistan the potential is negligible due to the region’s very low rainfall (Table 1).
Table 1. Small hydropower plants, projects and studied sites (< 50 MW) in Pakistan by region
Province/Region
Constructed and operational
Under construction Studied sites
No. of SHP
plants
Total installed capacity
No. of SHP
plants
Total capacity
(MW)
No. of SHP sites
Total capacity
(MW)
Gilgit- Baltistan (GB) 110 176 3 62 131 382
Khyber Pakhtunkhwa (KPK) & Federally Administered Tribal Areas (FATA)
297 138 105 45 69 367
Azad Jammu & Kashmir (AJK)
12 41 25 52 41 204
Punjab (PUN) 7 55 7 53 36 189
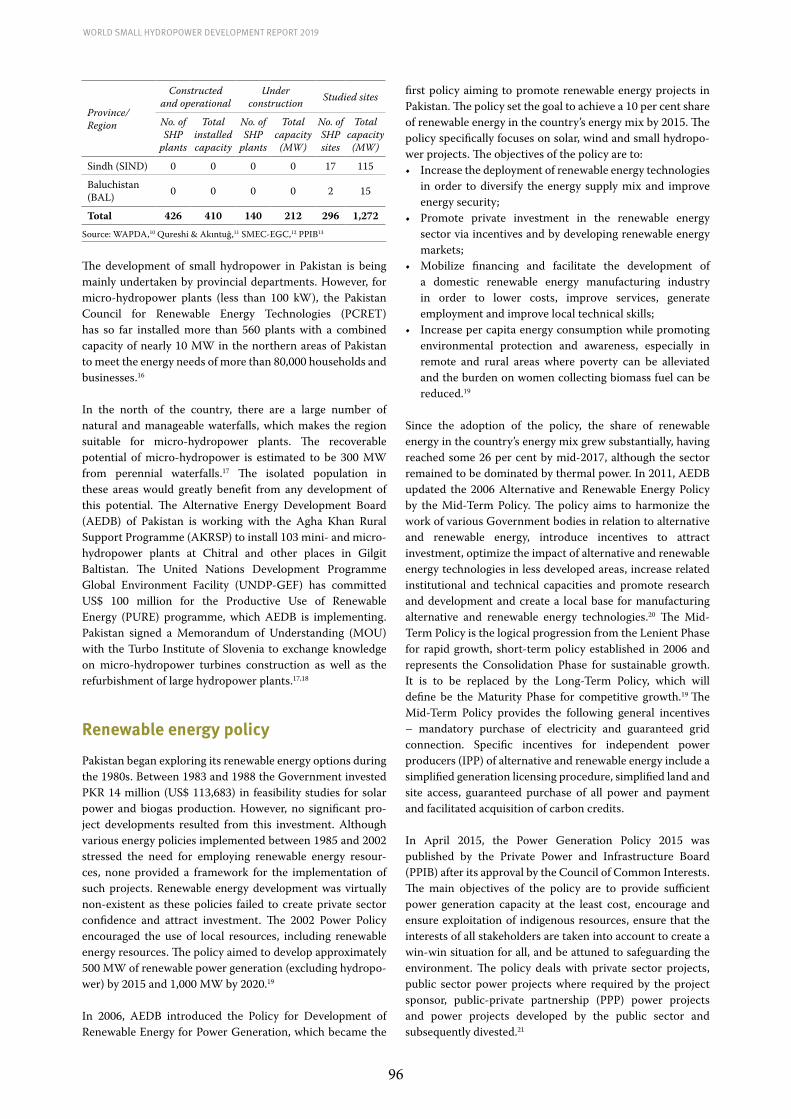
96
World Small HydropoWer development report 2019
Province/Region
Constructed and operational
Under construction Studied sites
No. of SHP
plants
Total installed capacity
No. of SHP
plants
Total capacity
(MW)
No. of SHP sites
Total capacity
(MW)
Sindh (SIND) 0 0 0 0 17 115
Baluchistan (BAL) 0 0 0 0 2 15
Total 426 410 140 212 296 1,272 Source: WAPDA,10 Qureshi & Akıntuğ,11 SMEC-EGC,12 PPIB13
The development of small hydropower in Pakistan is being mainly undertaken by provincial departments. However, for micro-hydropower plants (less than 100 kW), the Pakistan Council for Renewable Energy Technologies (PCRET) has so far installed more than 560 plants with a combined capacity of nearly 10 MW in the northern areas of Pakistan to meet the energy needs of more than 80,000 households and businesses.16
In the north of the country, there are a large number of natural and manageable waterfalls, which makes the region suitable for micro-hydropower plants. The recoverable potential of micro-hydropower is estimated to be 300 MW from perennial waterfalls.17 The isolated population in these areas would greatly benefit from any development of this potential. The Alternative Energy Development Board (AEDB) of Pakistan is working with the Agha Khan Rural Support Programme (AKRSP) to install 103 mini- and micro-hydropower plants at Chitral and other places in Gilgit Baltistan. The United Nations Development Programme Global Environment Facility (UNDP-GEF) has committed US$ 100 million for the Productive Use of Renewable Energy (PURE) programme, which AEDB is implementing. Pakistan signed a Memorandum of Understanding (MOU) with the Turbo Institute of Slovenia to exchange knowledge on micro-hydropower turbines construction as well as the refurbishment of large hydropower plants.17,18
Renewable energy policy
Pakistan began exploring its renewable energy options during the 1980s. Between 1983 and 1988 the Government invested PKR 14 million (US$ 113,683) in feasibility studies for solar power and biogas production. However, no significant pro-ject developments resulted from this investment. Although various energy policies implemented between 1985 and 2002 stressed the need for employing renewable energy resour-ces, none provided a framework for the implementation of such projects. Renewable energy development was virtually non-existent as these policies failed to create private sector confidence and attract investment. The 2002 Power Policy encouraged the use of local resources, including renewable energy resources. The policy aimed to develop approximately 500 MW of renewable power generation (excluding hydropo-wer) by 2015 and 1,000 MW by 2020.19
In 2006, AEDB introduced the Policy for Development of Renewable Energy for Power Generation, which became the
first policy aiming to promote renewable energy projects in Pakistan. The policy set the goal to achieve a 10 per cent share of renewable energy in the country’s energy mix by 2015. The policy specifically focuses on solar, wind and small hydropo-wer projects. The objectives of the policy are to:• Increase the deployment of renewable energy technologies
in order to diversify the energy supply mix and improve energy security;
• Promote private investment in the renewable energy sector via incentives and by developing renewable energy markets;
• Mobilize financing and facilitate the development of a domestic renewable energy manufacturing industry in order to lower costs, improve services, generate employment and improve local technical skills;
• Increase per capita energy consumption while promoting environmental protection and awareness, especially in remote and rural areas where poverty can be alleviated and the burden on women collecting biomass fuel can be reduced.19
Since the adoption of the policy, the share of renewable energy in the country’s energy mix grew substantially, having reached some 26 per cent by mid-2017, although the sector remained to be dominated by thermal power. In 2011, AEDB updated the 2006 Alternative and Renewable Energy Policy by the Mid-Term Policy. The policy aims to harmonize the work of various Government bodies in relation to alternative and renewable energy, introduce incentives to attract investment, optimize the impact of alternative and renewable energy technologies in less developed areas, increase related institutional and technical capacities and promote research and development and create a local base for manufacturing alternative and renewable energy technologies.20 The Mid-Term Policy is the logical progression from the Lenient Phase for rapid growth, short-term policy established in 2006 and represents the Consolidation Phase for sustainable growth. It is to be replaced by the Long-Term Policy, which will define be the Maturity Phase for competitive growth.19 The Mid-Term Policy provides the following general incentives – mandatory purchase of electricity and guaranteed grid connection. Specific incentives for independent power producers (IPP) of alternative and renewable energy include a simplified generation licensing procedure, simplified land and site access, guaranteed purchase of all power and payment and facilitated acquisition of carbon credits.
In April 2015, the Power Generation Policy 2015 was published by the Private Power and Infrastructure Board (PPIB) after its approval by the Council of Common Interests. The main objectives of the policy are to provide sufficient power generation capacity at the least cost, encourage and ensure exploitation of indigenous resources, ensure that the interests of all stakeholders are taken into account to create a win-win situation for all, and be attuned to safeguarding the environment. The policy deals with private sector projects, public sector power projects where required by the project sponsor, public-private partnership (PPP) power projects and power projects developed by the public sector and subsequently divested.21

97
3.5. SO
UTH
ERN
AS
iA
Other relevant recent regulations are the Framework for Power Cogeneration 2013 (Bagasse and Biomass) and the Revised SBP Financing Scheme for Renewable Energy of 2016.
Legislation on small hydropower
The National Electric Power Regulatory Authority (NEPRA) approved a maximum of PKR 8.32 (US$ 0.068) per unit for the upfront tariff for small hydropower projects up to 25 MW under Section 31 (4) of the Regulation of Generation, Transmission and Distribution of Electric Power Act 1997. According to the NEPRA, comparatively small capital investment and short gestation periods are required to complete these projects. That is why it undertook measures to simplify the investment process for small investors, including the introduction of an upfront tariff. The tariff provides certainty to the potential investors, allows fast-tracking the development of commercially attractive small hydropower sites and material risk coverage to the investor. The economic attractiveness of the upfront tariff was further enhanced with the tariff being adjusted for each site depending upon the plant factor.22
In September 2017, a Facilitation Agreement (FA) was signed by PPIB and the Government of Azad Jammu & Kashmir (GoAJ&K). The parties agreed for cooperation and facilitation in setting up private hydropower power projects of under 50 MW and related infrastructure. Through this arrangement, a Tripartite Letter of Support will be issued to project sponsors and developers and PPIB will facilitate them in establishing private power projects and related infrastructure through signing an Implementation Agreement and issuing the Government of Pakistan (GOP) Guarantee under the provisions of the Power Generation Policy 2015. This initiative is expected to attract and encourage potential investors in developing small to medium-size hydropower projects in the provinces and further augment generation capacities. Earlier, PPIB had already signed Facilitation Agreements with the Energy Department of the Government of Khyber Pakhtunkhwa and the Energy Department of the Government of Punjab.23
Barriers to small hydropower developmentThe future of SHP development in Pakistan is promising as abundant potential is available in the northern hilly areas, on canal falls and barrages in the plains. The Government has devised policies for the development of renewable energy sources including small hydropower, which is the cheapest source of renewable energy.
Nonetheless, some barriers to SHP development in Pakistan exist, including:• The limited availability of financing and continuity of
supply of funds;• The involvement of a large number of institutions and
departments, as a result of which projects might take much longer to approve;
• Higher costs of projects due to some foreign components;• Little interest from local manufacturers to develop low
cost electrical and mechanical equipment for small hydropower;
• The settlement of water rights issues for some projects;• Risks involved in small hydropower projects (including
hydrology-related risks) can deter developers;• Gilgit-Baltistan province (northern areas) has a significant
large, medium and small hydropower potential, however its population density and power demand are very low. Moreover, connecting it to the national grid requires very long transmission lines, which makes the development of the available potential unfeasible.
References
1. Ministry of Finance (2017). Economic Survey of Pakistan 2016-17, Chapter-12. Population, Labour Force and Employ-ment. Available from http://www.finance.gov.pk/survey/chap-ters_17/12-Population.pdf
2. Encyclopedia of Nations (n.d.). Asia and Oceania, Pakistan Cli-mate. Available from http://www.nationsencyclopedia.com/
3. Pakistan, Project to Improve Financial Reporting and Auditing (2010). Environmental Assessment Report of Civil Works of the Project to Improve Financial Reporting & Auditing. Available from www.pifra.gov.pk
4. Salma, S., Rehman, S. and Shah, M. A. (2012). Rainfall Trends in Different Climatic Zones of Pakistan. Pakistan Journal of Mete-orology, Vol.9 Issue 17, July 2012. Available from www.pmd.gov.pk/rnd/rnd_files/vol8_issue17/4.pdf
5. Kahlown, M. A. & Majeed, A. (2002). Water Resources Situation in Pakistan: Challenges and Future Strategies. Science Vision, Vol. 7, No. 3-4. Available from www.sciencevision.org.pk/Back-Issues/Vol7/Vol7No3-4/Vol7No3&4_2_Water_Resources_Situa-tion_MAkramKahlown.pdf
6. National Transmission and Despatch Company (NTDC) (2018). Power System Statistics 2017-18, 43rd Edition Planning Power NTDC. Available from http://www.ntdc.com.pk/Files/PSS%2043rd%20Edition.pdf
7. World Bank (2016). Pakistan. Access to electricity (% of popu-lation). Available from https://data.worldbank.org/indicator/EG.ELC.ACCS.ZS?locations=PK
8. Islamabad Chamber of Commerce & Industry (n.d.). An Over-view of Electricity Sector in Pakistan. Available from http://icci.com.pk/data/downloads/63/1293619048_1.pdf
9. National Transmission and Despatch Company (NTDC) (2012). National Power System Expansion Plan 2011-30, Final Report, Main Report 504760-01-MR 2011. Available from www.ntdc.com.pk/publications/PSEP%2001%20Main%20Report.pdf
10. Water and Power Development Authority, Ministry of Water and Power (n.d.). WAPDA On-going and Future Projects. Available from www.wapda.gov.pk/.
11. Qureshi, F.U. & Akıntuğ, B. (2014). Hydropower Potential in Pakistan. Conference paper. 11th International Congress in Advances in Civil Engineering-ACE, 2014, Istanbul. Available from https://www.researchgate.net/profile/Fassahat_Qureshi/publication/268224059_Hydropower_Potential_in_Pakistan/
98
World Small HydropoWer development report 2019
links/546659570cf2f5eb18016d8f/Hydropower-Potential-in-Pa-kistan.pdf?origin=publication_detail
12. SMEC-EGC (2014). Strategic Sectoral Environmental and Social Assessment of Indus Basin Volumes I & 2. Prepared for the Wa-ter Sector Capacity Building Advisory Services Project.
13. Pakistan, Private Power and Infrastructure Board (PPIB), Minis-try of Water & Power (n.d.). Hydropower Resources of Pakistan. Available from www.ppib.gov.pk/HYDRO.pdf
14. Xialei, C., Singh, P. R., Xianlai, W., and Kremere, E., eds. (2016). World Small Hydropower Development Report 2016. United Nations Industrial Development Organization; Inter-national Center on Small Hydro Power. Available from www.smallhydroworld.org
15. LIU, H., Masera, D. and Esser, L., eds. (2013). World Small Hy-dropower Development Report 2013, United Nations Industrial Development Organization; International Center on Small Hy-dro Power. Available from www.smallhydroworld.org
16. Pakistan Council of Renewable Technologies (PCRET), Ministry of Science and Technology (2015). PCRET Vision. Available from http://www.pcret.gov.pk/Services.html
17. Shahid Khalil, M., Khan, N. & Afzail Mirza, I. (n.d.). Renewable Energy in Pakistan: Status and Trend. Ministry of Power and Wa-ter. Available from http://atrc.net.pk/resources/pakistan/renew-able_energy/renewable_energy_pakistan_status_and_trends.pdf
18. Pakistan, Ministry of Water and Power, Alternative Energy De-velopment Board (n.d.). Alternative Energies AE - Micro Hydro. Available fromhttp://www.aedb.org/Microhydel.htm
19. Yazdanie, M. (2010). Renewable Energy in Pakistan: Policy Strengths, Challenges & the Path Forward. Available from http://www.cepe.ethz.ch/content/dam/ethz/special-interest/mtec/cepe/cepe-dam/documents/education/selected-term-papers/Yazdanie.pdf
20. Alternative Energy Development Board (AEDB), Ministry of Water and Power (2011). Mid-Term Policy. Available from www.aedb.org./midtermpolicy.htm
21. Ministry of Water and Power (2015). Power Generation Policy 2015. Available from www.ppib.gov.pk/Power%20Policy%202015.pdf
22. The National Electric Power Regulatory Authority (NEPRA) (2015). Determination of National Electric Power Regulatory Authority in the Matter of Upfront Tariff for Small Hydro Power Generation Projects Up to 25 MW Installed Capacity. Available from http://www.nepra.org.pk/Tariff/Upfront/2015/Determi-nation%20in%20the%20Matter%20of%20Upfront%20Tariff%20for%20Small%20Hydr%20Power%20Generation.pdf
23. Private Power and Infrastructure Board (PPIB) (2017). PPIB Sign Facilitation Agreement with Government of Azad Jammu & Kashmir, 08 September 2017. Available from http://www.ppib.gov.pk/facilitaion_ajk_080917.htm

99
3.5. SO
UTH
ERN
AS
iA
Sri Lanka Harsha Wickramasinghe, nuwan premadasa, nimashi Fernando, Sri lanka Sustainable Energy authority
Key facts
Population 21,444,00012
Area 65,610 km2 1
Climate Sri Lanka has a tropical monsoon climate, with the north-east monsoon from December to March and the south-west monsoon from June to October. Temperatures do not vary widely, averaging 27 °C.1
Topography The terrain is mostly low, with flat to rolling plains. Coastal areas reach as low as 0 metres above sea level. The country is mountainous in the south-central interior, with the highest peak, Pidurutalagala, at 2,524 metres.1
Rain pattern Rainfall in Sri Lanka has multiple origins. Monsoonal, convectional and expressional rain accounts for a major share of the annual rainfall. The mean annual rainfall varies from under 900 mm in the driest parts (south-eastern and north-western) to over 5,000 mm in the wettest parts (western slopes of the central highlands).1
Hydrology Sri Lanka has 103 distinct river basins with a total catchment area of 59,245 km2, which accounts for 90 per cent of the total land area. Most of the river basins originate from the central highlands and flow to the Indian Ocean, passing through the lowlands.3 Among them, the Mahaweli, Kalu and Kelani Rivers have 722 MW of small hydropower potential while the rest of the rivers have 151 MW.6
Electricity sector overview
The installed electricity generation capacity in Sri Lanka was 4,018 MW in 2016 while the maximum demand reported was 2,453 MW. Net electricity generation of Sri Lanka was 14,341 GWh in 2016 and 76.5 per cent of gross generation was supplied by the state owned power plants having 2,891 MW of installed capacity, while 23.5 per cent was supplied by the independent power producers (IPP) having 1,127 MW total installed capacity.2 The share of new renewable energy (NRE) in the generation mix was 8.6 per cent, and 33 per cent including large hydropower in 2016. Figure 1 shows the electrical energy mix of Sri Lanka in 2016. Sri Lanka, compared to other countries in the region, has a very high electrification rate, which is 99.3 per cent at present. The rest of households are supplied with off-grid electrification options.
Electricity market prices have been determined by the Public Utilities Commission which is the economic, safety and technical regulator of electricity sector in Sri Lanka.4 It has introduced different tariff structures for domestic and religious and charitable institutions and non-domestic sector which includes industrial tariff and general-purpose tariff structures. Domestic sector tariffs range from 2.50 LKR/kWh (approximately 0.015 US$/kWh) to 45.00 LKR/kWh (approximately 0.286 US$/kWh) while non-domestic sector tariffs vary 10.80 LKR/kWh (approximately 0.068 US$/kWh) to 23.50 LKR/kWh (approximately 0.149 US$/kWh) depending on the time of use and supply voltage levels.5
Figure 1. Annual electricity generation by source in Sri Lanka (GWh)
5,067
4,563
4,221
343
75
72
Coal
Oil
Hydropower
Wind power
Solar power
Biomass
Source: Sri Lanka Sustainable Energy Authority3
Note: data from 2016.
Small hydropower sector overview The definition of small hydropower in Sri Lanka is up to 10 MW. The installed capacity of small hydropower is 357 MW, while small hydropower projects having a capacity of 146 MW are under construction. Sri Lanka Sustainable Energy Authority (SEA) has approved the development of several further small hydropower projects having a total capacity of 127 MW. This will bring the total capacity of small hydropower to 630 MW. This indicates that about 40 per cent has been already developed and more than 70 per cent of the 873
3.3.8
World Small HydropoWEr dEvElopmEnt
rEport 2019
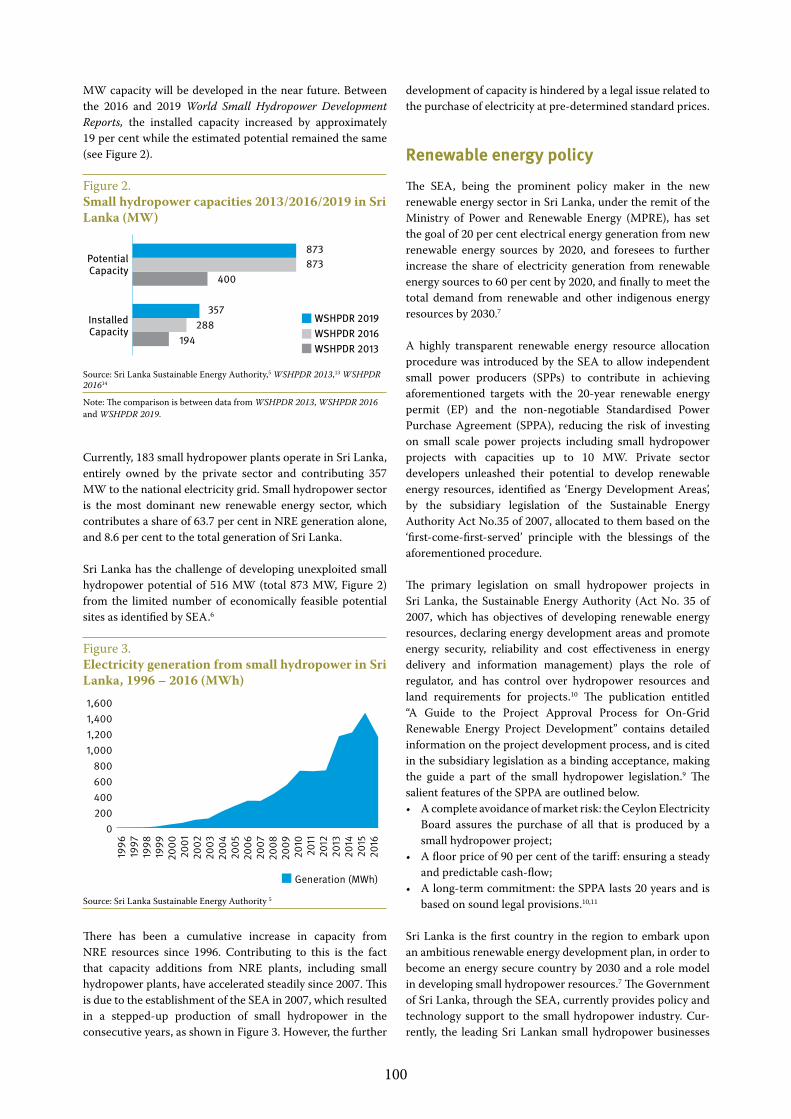
100
MW capacity will be developed in the near future. Between the 2016 and 2019 World Small Hydropower Development Reports, the installed capacity increased by approximately 19 per cent while the estimated potential remained the same (see Figure 2).
Figure 2. Small hydropower capacities 2013/2016/2019 in Sri Lanka (MW)
0 200 400 600 800 1000
PotentialCapacity
Installed Capacity
873 873 400
357 288 194
WSHPDR 2019WSHPDR 2016WSHPDR 2013
Source: Sri Lanka Sustainable Energy Authority,5 WSHPDR 2013,13 WSHPDR 201614
Note: The comparison is between data from WSHPDR 2013, WSHPDR 2016 and WSHPDR 2019.
Currently, 183 small hydropower plants operate in Sri Lanka, entirely owned by the private sector and contributing 357 MW to the national electricity grid. Small hydropower sector is the most dominant new renewable energy sector, which contributes a share of 63.7 per cent in NRE generation alone, and 8.6 per cent to the total generation of Sri Lanka.
Sri Lanka has the challenge of developing unexploited small hydropower potential of 516 MW (total 873 MW, Figure 2) from the limited number of economically feasible potential sites as identified by SEA.6
Figure 3. Electricity generation from small hydropower in Sri Lanka, 1996 – 2016 (MWh)
0200400600800
1,0001,2001,4001,600
1996
1997
1998
1999
2000
2001
2002
2003
2004
2005
2006
2007
2008
2009
2010
2011
2012
2013
2014
2015
2016
Generation (MWh)
Source: Sri Lanka Sustainable Energy Authority 5
There has been a cumulative increase in capacity from NRE resources since 1996. Contributing to this is the fact that capacity additions from NRE plants, including small hydropower plants, have accelerated steadily since 2007. This is due to the establishment of the SEA in 2007, which resulted in a stepped-up production of small hydropower in the consecutive years, as shown in Figure 3. However, the further
development of capacity is hindered by a legal issue related to the purchase of electricity at pre-determined standard prices.
Renewable energy policy
The SEA, being the prominent policy maker in the new renewable energy sector in Sri Lanka, under the remit of the Ministry of Power and Renewable Energy (MPRE), has set the goal of 20 per cent electrical energy generation from new renewable energy sources by 2020, and foresees to further increase the share of electricity generation from renewable energy sources to 60 per cent by 2020, and finally to meet the total demand from renewable and other indigenous energy resources by 2030.7
A highly transparent renewable energy resource allocation procedure was introduced by the SEA to allow independent small power producers (SPPs) to contribute in achieving aforementioned targets with the 20-year renewable energy permit (EP) and the non-negotiable Standardised Power Purchase Agreement (SPPA), reducing the risk of investing on small scale power projects including small hydropower projects with capacities up to 10 MW. Private sector developers unleashed their potential to develop renewable energy resources, identified as ‘Energy Development Areas’, by the subsidiary legislation of the Sustainable Energy Authority Act No.35 of 2007, allocated to them based on the ‘first-come-first-served’ principle with the blessings of the aforementioned procedure.
The primary legislation on small hydropower projects in Sri Lanka, the Sustainable Energy Authority (Act No. 35 of 2007, which has objectives of developing renewable energy resources, declaring energy development areas and promote energy security, reliability and cost effectiveness in energy delivery and information management) plays the role of regulator, and has control over hydropower resources and land requirements for projects.10 The publication entitled “A Guide to the Project Approval Process for On-Grid Renewable Energy Project Development” contains detailed information on the project development process, and is cited in the subsidiary legislation as a binding acceptance, making the guide a part of the small hydropower legislation.9 The salient features of the SPPA are outlined below.• A complete avoidance of market risk: the Ceylon Electricity
Board assures the purchase of all that is produced by a small hydropower project;
• A floor price of 90 per cent of the tariff: ensuring a steady and predictable cash-flow;
• A long-term commitment: the SPPA lasts 20 years and is based on sound legal provisions.10,11
Sri Lanka is the first country in the region to embark upon an ambitious renewable energy development plan, in order to become an energy secure country by 2030 and a role model in developing small hydropower resources.7 The Government of Sri Lanka, through the SEA, currently provides policy and technology support to the small hydropower industry. Cur-rently, the leading Sri Lankan small hydropower businesses

101
3.5. SO
UTH
ERN
AS
iA
are active on the African continent in consulting and project development. The country has a well-developed small hydro-power value chain.
Barriers to small hydropower developmentAlthough Sri Lanka is rich in hydropower resources, the country’s small hydropower sector has reached its maturity state. The industry is still experiencing barriers to implemen-tation in the following areas:• A current legal barrier preventing the signing of more
power purchase agreements between utility and developers;
• The absence of a dedicated transmission solution for the uptake of power from small hydropower plants;
• Limitations at local grid sub-station level and at national power system level for adding more small hydropower to the grid;
• Public opposition at regional level arising out of conflicting use of water and land resources and opposition by environmental lobbyists;
• Lack of community involvement in planning, operational phase and project financing in small hydropower development;
• Inequalities in sharing value generated from the project with the affected local communities;
• The absence of a well-equipped monitoring system to ensure environmental compliance by operational small hydropower projects.
References
1. Department of meteorology (n.d). Sri Lanka. Available from http://www.meteo.gov.lk/index.php?option=com_content&view=article&id=94&Itemid=310&lang=en
2. Ceylon Electricity Board (2018). Statistical Digest 2016. Available from http://www.ceb.lk/index.php?aam_media=25917
3. Sustainable Energy Authority (2016). Sri Lanka. Sri Lanka Energy Balance 2016. Available from http://www.info.energy.gov.lk
4. Public Utilities commission of Sri Lanka (2014) Available from www.pucsl.gov.lk/english/about-us/.
5. Sustainable Energy Authority (n.d). Sri Lanka. Unpublished data6. Ministry of Power and Energy, Sri Lanka (2014). Renewable
Energy Master Plan – 20147. Ministry of Power and Energy, Sri Lanka (2014). Sri Lanka
Energy Sector Development Plan for a Knowledge-based Economy 2015-2025. Available from http://powermin.gov.lk/sinhala/wp-content/uploads/2015/03/ENERGY_EMPOWERED_NATION_2015_2025.pdf
8. Wickramasinghe, H. (2009). Sri Lanka country report on energy efficiency improvement & conservation.
9. Sri Lanka, Sustainable Energy Authority (2011). Ongrid renewable energy development: A guide to the project approval process for on-grid renewable energy project development. Policies and procedures to secure approvals to develop a renewable energy project to supply electricity to the national grid. Version V2.0/2011. Available from www.energy.gov.lk/pdf/
guideline/Grid_Renewable.pdf.10. Wickramasinghe, H. (2007). Policy Framework and Initiatives
for the Promotion of Small Hydro Power: Proceedings of the Regional Seminar on Small Hydro Power Development in Sri Lanka: Lessons for Developing Countries.Nuwara-Eliya, Sri Lanka.
11. Deheragoda, C.K.M (2009). Renewable energy development in Sri Lanka with special reference to small hydropower. Available from http://www.techmonitor.net/tm/images/e/ee/09nov_dec_sf6.pdf
12. The World Bank (2017). Population, total. Available from: https://data.worldbank.org/indicator/SP.POP.TOTL?locations=LK
13. LIU, H., Masera, D. and Esser, L., eds. (2013). World Small Hydropower Development Report 2013. United Nations Industrial Development Organization; International Center on Small Hydro Power. Available from www.smallhydroworld.org.
14. Xialei, C., Singh, P. R., Xianlai, W., and Kremere, E., eds. (2016). World Small Hydropower Development Report 2016. United Nations Industrial Development Organization; International Center on Small Hydro Power. Available from www.smallhydroworld.org.

102
World Small HydropoWer development report 2019

103
VIET NAM
PHILIPPINES
MYANMAR
CAMBODIA
MALAYSIA
THAILAND
LAO PDR
INDONESIA
TIMOR-LESTE
South-Eastern AsiaEngku ahmad azrulhisham, University of Kuala lumpur
Introduction to the region
According to the United Nations definition, the South-Eastern Asia region consists of 11 countries: Brunei Darussalam, Cambodia, Indonesia, Lao People’s Democratic Republic (PDR), Malaysia, Myanmar, Philippines, Singapore, Timor-Leste, Thailand and Viet Nam. The current report covers nine countries: Cambodia, Indonesia, Lao PDR, Malaysia, Myanmar, Philippines, Thailand, Timor-Leste and Viet Nam. An overview of countries of South-Eastern Asia is given in Table 1.
The countries of the region vary greatly in terms of economic, political and cultural conditions, as well as their energy profiles. Some countries in the region have vast energy resources. For example, Indonesia and Malaysia are rich in fossil fuels. Contrastingly, other countries such as Myanmar and Cambodia have relatively limited domestic energy resources and rely on energy imports. All of these countries are located at low latitudes and have consistently high levels of solar energy resources, which are relatively uniform throughout the year.
South-Eastern Asia is one of the most dynamic regions in the world. Ten countries in the region, united in the Association of the Southeast Asian Nations (ASEAN), have seen rapid economic and demographic growth in the last 25 years, as demonstrated by large increases in the electricity generation capacities of several countries (Table 1). The only country that is yet to join the regional organization is Timor-Leste.
One of the ASEAN countries’ main concerns is energy security. The countries are struggling to meet the escalating energy demand of their growing populations and economies. In recent years, the countries of the region have made major efforts to meet the rising demand. This includes improving policy frameworks, reforming fossil fuel consumption subsidies, increasing regional cooperation and supporting greater investment in renewable energy technologies.
Another concern is the need to develop energy infrastructure, particularly in the power sector, since there is a rather low electrification rate in some countries, especially in rural areas, where a high share of the population still relies on solid biomass for cooking. Of all the countries in the region, Cambodia and Myanmar have the lowest electrification rates.
3.4
World Small HydropoWEr dEvElopmEnt
rEport 2019
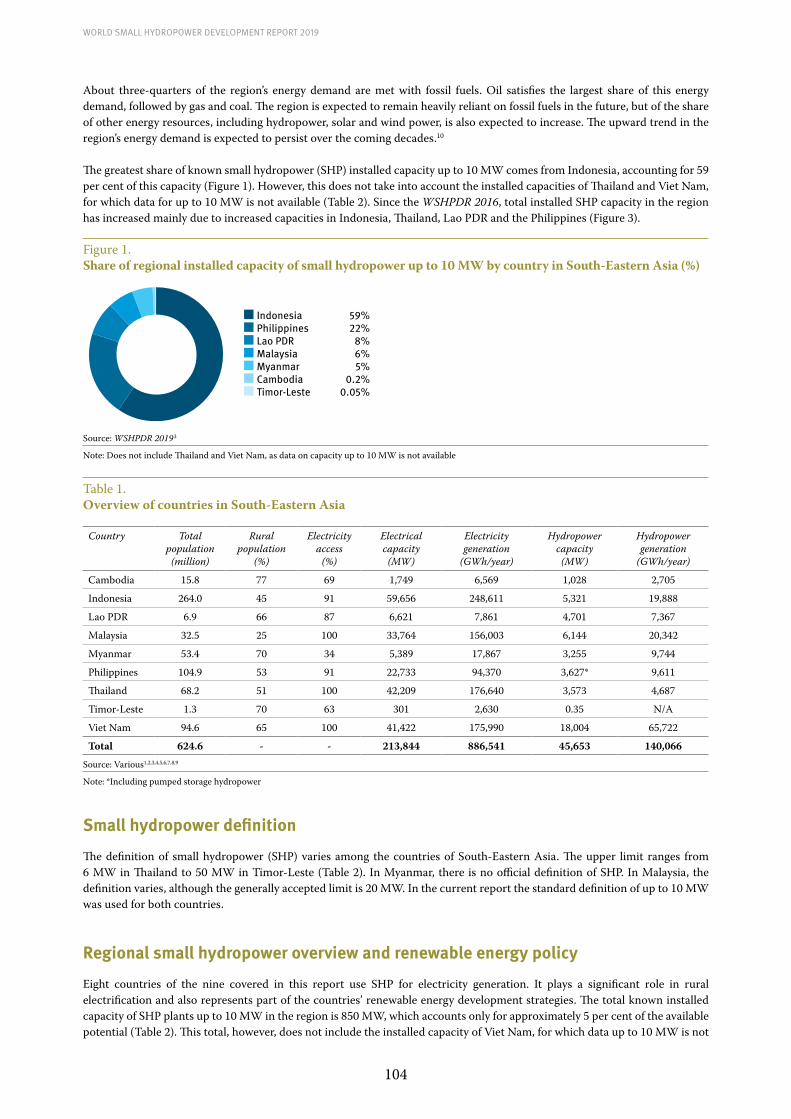
104
World Small HydropoWer development report 2019
About three-quarters of the region’s energy demand are met with fossil fuels. Oil satisfies the largest share of this energy demand, followed by gas and coal. The region is expected to remain heavily reliant on fossil fuels in the future, but of the share of other energy resources, including hydropower, solar and wind power, is also expected to increase. The upward trend in the region’s energy demand is expected to persist over the coming decades.10
The greatest share of known small hydropower (SHP) installed capacity up to 10 MW comes from Indonesia, accounting for 59 per cent of this capacity (Figure 1). However, this does not take into account the installed capacities of Thailand and Viet Nam, for which data for up to 10 MW is not available (Table 2). Since the WSHPDR 2016, total installed SHP capacity in the region has increased mainly due to increased capacities in Indonesia, Thailand, Lao PDR and the Philippines (Figure 3).
Figure 1. Share of regional installed capacity of small hydropower up to 10 MW by country in South-Eastern Asia (%)
Indonesia 59%Philippines 22%Lao PDR 8%Malaysia 6%Myanmar 5%Cambodia 0.2%Timor-Leste 0.05%
Source: WSHPDR 20193
Note: Does not include Thailand and Viet Nam, as data on capacity up to 10 MW is not available
Table 1. Overview of countries in South-Eastern Asia
Country Total population
(million)
Rural population
(%)
Electricity access
(%)
Electrical capacity
(MW)
Electricity generation
(GWh/year)
Hydropower capacity
(MW)
Hydropower generation
(GWh/year)
Cambodia 15.8 77 69 1,749 6,569 1,028 2,705
Indonesia 264.0 45 91 59,656 248,611 5,321 19,888
Lao PDR 6.9 66 87 6,621 7,861 4,701 7,367
Malaysia 32.5 25 100 33,764 156,003 6,144 20,342
Myanmar 53.4 70 34 5,389 17,867 3,255 9,744
Philippines 104.9 53 91 22,733 94,370 3,627* 9,611
Thailand 68.2 51 100 42,209 176,640 3,573 4,687
Timor-Leste 1.3 70 63 301 2,630 0.35 N/A
Viet Nam 94.6 65 100 41,422 175,990 18,004 65,722
Total 624.6 - - 213,844 886,541 45,653 140,066 Source: Various1,2,3,4,5,6,7,8,9
Note: *Including pumped storage hydropower
Small hydropower definition
The definition of small hydropower (SHP) varies among the countries of South-Eastern Asia. The upper limit ranges from 6 MW in Thailand to 50 MW in Timor-Leste (Table 2). In Myanmar, there is no official definition of SHP. In Malaysia, the definition varies, although the generally accepted limit is 20 MW. In the current report the standard definition of up to 10 MW was used for both countries.
Regional small hydropower overview and renewable energy policy
Eight countries of the nine covered in this report use SHP for electricity generation. It plays a significant role in rural electrification and also represents part of the countries’ renewable energy development strategies. The total known installed capacity of SHP plants up to 10 MW in the region is 850 MW, which accounts only for approximately 5 per cent of the available potential (Table 2). This total, however, does not include the installed capacity of Viet Nam, for which data up to 10 MW is not
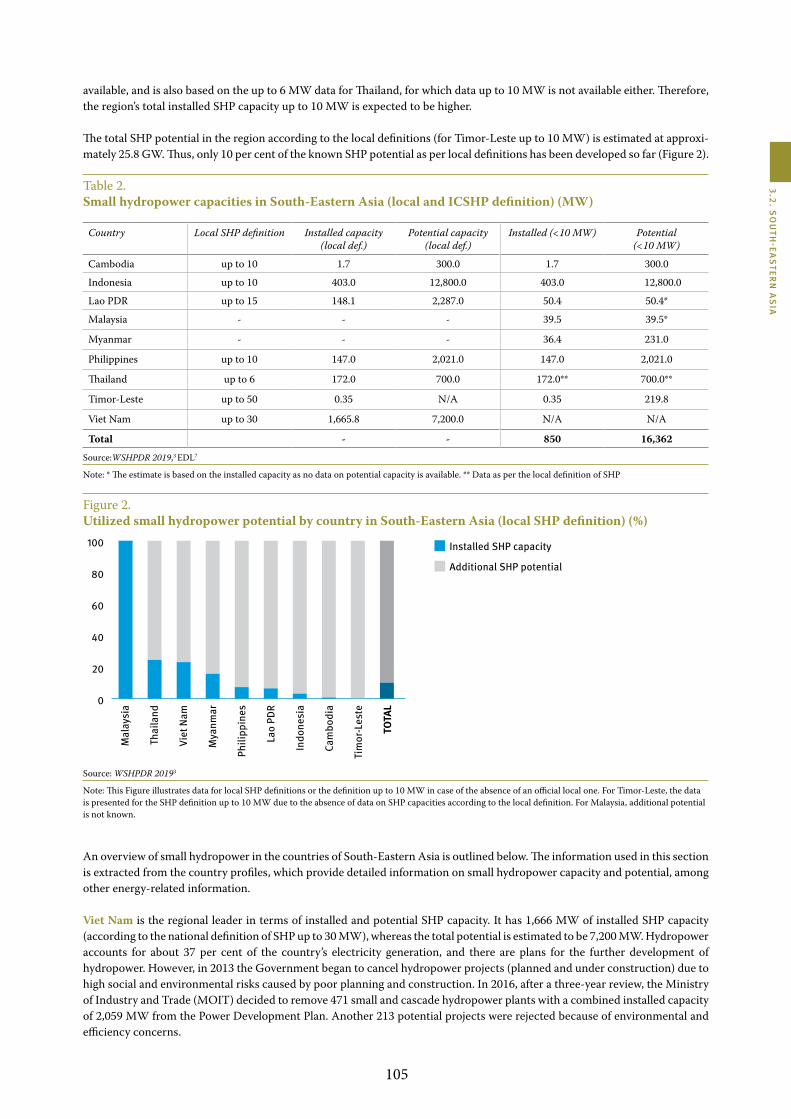
105
3.2. So
uth
-EaS
tErn
aS
ia
available, and is also based on the up to 6 MW data for Thailand, for which data up to 10 MW is not available either. Therefore, the region’s total installed SHP capacity up to 10 MW is expected to be higher.
The total SHP potential in the region according to the local definitions (for Timor-Leste up to 10 MW) is estimated at approxi-mately 25.8 GW. Thus, only 10 per cent of the known SHP potential as per local definitions has been developed so far (Figure 2).
Table 2.Small hydropower capacities in South-Eastern Asia (local and ICSHP definition) (MW)
Country Local SHP definition Installed capacity (local def.)
Potential capacity (local def.)
Installed (<10 MW) Potential (<10 MW)
Cambodia up to 10 1.7 300.0 1.7 300.0
Indonesia up to 10 403.0 12,800.0 403.0 12,800.0
Lao PDR up to 15 148.1 2,287.0 50.4 50.4*
Malaysia - - - 39.5 39.5*
Myanmar - - - 36.4 231.0
Philippines up to 10 147.0 2,021.0 147.0 2,021.0
Thailand up to 6 172.0 700.0 172.0** 700.0**
Timor-Leste up to 50 0.35 N/A 0.35 219.8
Viet Nam up to 30 1,665.8 7,200.0 N/A N/A
Total - - 850 16,362 Source:WSHPDR 2019,3 EDL7
Note: * The estimate is based on the installed capacity as no data on potential capacity is available. ** Data as per the local definition of SHP
Figure 2. Utilized small hydropower potential by country in South-Eastern Asia (local SHP definition) (%)
Additional SHP potential
Installed SHP capacity
TOTA
L
Tim
or-L
este
Cam
bodi
a
Indo
nesi
a
Lao
PDR
Phili
ppin
es
Mya
nmar
Viet
Nam
Thai
land
Mal
aysi
a0
20
40
60
80
100
Source: WSHPDR 20193
Note: This Figure illustrates data for local SHP definitions or the definition up to 10 MW in case of the absence of an official local one. For Timor-Leste, the data is presented for the SHP definition up to 10 MW due to the absence of data on SHP capacities according to the local definition. For Malaysia, additional potential is not known.
An overview of small hydropower in the countries of South-Eastern Asia is outlined below. The information used in this section is extracted from the country profiles, which provide detailed information on small hydropower capacity and potential, among other energy-related information.
Viet Nam is the regional leader in terms of installed and potential SHP capacity. It has 1,666 MW of installed SHP capacity (according to the national definition of SHP up to 30 MW), whereas the total potential is estimated to be 7,200 MW. Hydropower accounts for about 37 per cent of the country’s electricity generation, and there are plans for the further development of hydropower. However, in 2013 the Government began to cancel hydropower projects (planned and under construction) due to high social and environmental risks caused by poor planning and construction. In 2016, after a three-year review, the Ministry of Industry and Trade (MOIT) decided to remove 471 small and cascade hydropower plants with a combined installed capacity of 2,059 MW from the Power Development Plan. Another 213 potential projects were rejected because of environmental and efficiency concerns.

106
World Small HydropoWer development report 2019
Cambodia has a total installed SHP capacity (up to 10 MW) of 1.66 MW, which consists of four plants constructed under grant aid. There are also several privately-owned micro- and pico-hydropower plants. An additional 48 sites with a combined capacity of 50 MW have been identified as potential for development or are under development. Cambodia has a total hydropower potential of approximately 10,000 MW. However, many of the large hydropower sites identified are highly controversial and unlikely to be developed due to factors such as resettlements, land issues, negative impacts on fisheries, community consultations and limited environmental and social impact assessments. The potential of SHP up to 10 MW is estimated at approximately 300 MW, indicating that a mere 0.55 per cent of the country’s potential has been harnessed.
Indonesia has an installed SHP capacity of 403 MW and a substantial potential of at least 12.8 GW (for SHP up to 10 MW). SHP development is perceived as a key means of achieving increased electrification, particularly in rural areas. New SHP plants were installed in Bengkulu, Semendo and Sumatera, with a combined capacity of approximately 162.2 MW. Due to the promising progress that SHP has made in Indonesia, multiple feasibility studies have been conducted in recent years, resulting in the discovery of new SHP sites.
Hydropower is the most important source of electricity for Lao PDR. The total technical hydropower potential of the country is estimated at 26,000 MW, of which SHP up to 15 MW accounts for 2,287 MW. In 2017, there were 30 small hydropower plants in operation in Lao PDR, with capacities ranging from 0.06 MW to 15 MW and a combined capacity of 148.14 MW. In addition, there were 273 projects in different stages of development, with a combined capacity of 2,139 MW. Most of the existing and planned SHP plants are operated or planned by independent power producers (IPPs). The development of SHP could play an important role in rural electrification and provide a solution with minimum production costs for remote areas, which currently rely on imported electricity.
As of 2018, the installed capacity of SHP plants up to 10 MW in Malaysia was 39.5 MW, indicating a more than two-fold increase since the WSHPDR 2016. The installed capacity of SHP up to 20 MW was 71 MW, and installed capacity of SHP up to 30 MW was 113 MW. The potential capacity for SHP up to 30 MW was 490 MW, whereas the potential for the 10 MW threshold is unknown. The development of SHP in the country has been stimulated by both the Renewable Energy Act 2011 and introduction of a FIT scheme in 2011.
The current installed SHP capacity of Myanmar is 36.4 MW. The total potential is 231 MW for SHP plants up to 10 MW with more than 300 potential sites identified. Myanmar has abundant hydropower resources, which account for about 60 per cent of total installed electricity capacity in the country. Nevertheless, policies and legislation for the hydropower sector, including SHP, are limited. Although Myanmar adopted a new Electricity Law in 2014 to replace the previous Electricity Law (1984), there is no specific bylaw or regulation for hydropower.
The SHP potential (up to 10 MW) of the Philippines is estimated to be 2,021 MW, and its current installed capacity of 147 MW accounts for only 7 per cent of this potential. Compared to the results of the WSHPDR 2016, the installed capacity has increased by more than 45 per cent. As of the end of 2017, 89 SHP projects with a combined capacity of approximately 400 MW were confirmed for development. These projects are to be completed between 2018 and 2025 and vary in size from 0.5 MW to 10 MW.
Figure 3. Change in installed capacity of small hydropower from WSHPDR 2013 to 2019 by country in South-Eastern Asia (MW)
0
500
1,000
1,500
2,000
2,500
3,000
WSHPDR 2019
WSHPDR 2016
WSHPDR 2013
1,665.8
403.0172.0 148.0 147.0 39.5 36.4 1.7 0.35
2,613.8
TOTA
L
Tim
ore-
Lest
e
Cam
bodi
a
Mya
nmar
Mal
aysi
a
Phili
ppin
es
Lao
PDR
Thai
land
Indo
nesi
a
Viet
Nam
Source: WSHPDR 2013,1 WSHPDR 2016,2 WSHPDR 20193
Note: WSHPDR stands for World Small Hydropower Development Report. For Lao PDR, data is for SHP up to 30 MW; for Thailand up to 6 MW; for Viet Nam up to 30 MW; for other countries up to 10 MW.

107
3.2. So
uth
-EaS
tErn
aS
ia
The installed capacity of SHP up to 20 MW in Thailand as of September 2015 was 172 MW, indicating a 59 per cent increase compared with the WSHPDR 2016. Potential capacity is estimated at 700 MW. The development of SHP in the country has been fostered through the national Alternative Energy Development Plan (AEDP2015), which set the goal of increasing the installed capacity of SHP to 376 MW by 2036.
The hydropower potential of Timor-Leste is estimated to be 220 MW for SHP plants up to 10 MW, with a potential annual production of 812.8 GWh. The total installed capacity of SHP is 0.353 MW, which comes from one mini- and two micro-hydro-power plants. However, the three plants are not in operation due to technical issues. In 2016, public consultations on the basic law on renewable energy were held throughout the country and as of 2018 were awaiting promulgation in the Parliament. The Government plans to provide for half of the country’s energy needs from renewable energy sources by 2025.
Feed-in tariffs (FITs) for SHP are covered in the regulatory frameworks of Indonesia, Malaysia, Myanmar, the Philippines, Thailand and Viet Nam.
Barriers to small hydropower development
The development of SHP in South-Eastern Asia is complicated by a range of factors. The major barriers present in the region are the limited access to financing for SHP investment, the lack of or insufficient subsidies or other financial incentives, and policy and institutional frameworks that are non-conducive to SHP development.
Furthermore potential SHP sites in Cambodia are usually located in remote areas with limited access that are far away from load centres, which means additional investment in infrastructure is often needed. There is also insufficient information on the characteristics of the energy market, including its scope, potential and consumer characteristics. In addition, few systematic studies on SHP potential have been carried out. The technical knowledge and operational skills also remain limited.
In Indonesia, the procedure for obtaining SHP development permits is unclear. A limit on foreign ownership of SHP projects makes the sector less attractive for foreign investors. Awareness about SHP potential is low and availability of equipment is limited. Infrastructure for SHP is insufficient, particularly in rural areas, and off-grid electricity generation is not yet common.
For Lao PDR, the key barriers to SHP development are complex regulations requiring case-by-case negotiation for power purchase agreements (PPA) and limited clarity in relation to PPA off-take tariffs, taxes, royalties and duties.
In Malaysia, hydropower generation is threatened by heavy rains that can cause flooding and overflow. As with other countries of the region, Malaysia lacks the cutting-edge technology needed to successfully develop SHP. There is also a risk of water pollution, soil erosion and increased sediment loads in rivers during construction works, resulting from land clearing activities.
In Myanmar, it is difficult to develop community-based business schemes due to low levels of income in rural areas. Institutional barriers to SHP development include long and complicated procedures for acquiring government endorsement and approval as well as an unclear regulatory procedure for connecting SHP plants to the grid. Furthermore, local technical knowledge, skills and operational experience are limited and technical data on topography, annual rain fall, dissipation of water resources and potential area are insufficient.
Some communities in the Philippines can be sensitive to or totally reject the utilization of their rivers for electricity generation. Some SHP projects require the construction of long transmission lines to be connected to the grid. These are vulnerable to the elements, pilferage and sabotage, which all contribute to line losses. The project approval process can be disproportionately expensive due to highly time-consuming bureaucracy.
Most of the potential hydropower sites in the northern region of Thailand are located in the protected forested areas, hence legal provisions represent the main obstacle for SHP development.
In Timor-Leste, SHP development is hindered by a lack of cooperation between the Government, universities, research institutes and NGOs, lack of efficient monitoring and evaluation mechanisms, lack of technical knowledge, management and other skills, as well as abundant electricity production from diesel. Furthermore, property rights are unclear and customary laws that deal with marine and natural resources are not defined. In addition, the mountainous topography creates technical difficulties for SHP projects.
In Viet Nam, the key barriers to SHP development are a lack of expertise, violation of agreements with subsequent high environmental and social risks, poor quality and safety control with subsequent low return of investment, as well as efficiency concerns due to the bad management of power plants.
108
References
1. LIU, H., Masera, D. and Esser, L., eds. (2013). World Small Hydropower Development Report 2013. United Nations Industrial Development Organization; International Center on Small Hydro Power. Available from www.smallhydroworld.org.
2. Xialei, C., Singh, P. R., Xianlai, W., and Kremere, E., eds. (2016). World Small Hydropower Development Report 2016. United Nations Industrial Development Organization; International Center on Small Hydro Power. Available from www.smallhydroworld.org.
3. LIU, D., LIU, H., WANG, X., and Kremere, E., eds. (2019). World Small Hydropower Development Report 2019. United Nations Industrial Development Organization; International Center on Small Hydro Power. Available from www.smallhydroworld.org.
4. World Bank (2017). Rural population (% of total population). Available from https://data.worldbank.org/indicator/SP.RUR.TOTL.ZS
5. World Bank (2016). Access the electricity (% of population). Available from https://data.worldbank.org/indicator/EG.ELC.ACCS.ZS
6. International Renewable Energy Association (IRENA) (2017). Renewable Capacity Statistics 2017. Available from https://www.irena.org/publications/2017/Mar/Renewable-Capacity-Statistics-2017
7. Electricité du Laos (EDL) (2018). Electricity statistics 2017. Available from http://edl.com.la/ckfinder/userfiles/files/Statistic/Statistic%20Report%202017_n_JP.pdf
8. Energy Commission (2017). 2017 Malaysia Energy Statistics Handbook. Available from https://www.st.gov.my/contents/files/download/116/Malaysia_Energy_Statistics_Handbook_2017.pdf
9. Department of Energy (DOE) (2017). 2017 Power Supply and Demand Highlights (January-December 2017). Available from https://www.doe.gov.ph/electric-power/2017-power-supply-and-demand-highlights-january-december-2017
10. International Energy Agency (2017). Southeast Asia Energy Outlook 2017.Available from https://www.iea.org/publications/freepublications/publication/WEO2017SpecialReport_SoutheastAsiaEnergyOutlook.pdf

109
3.2. So
uth
-EaS
tErn
aS
ia
Cambodia piseth Chea, thoeung puthearum and Sok oudam, Electricité du Cambodge; paradis Someth, mekong river Commission Secretariat
Key factsPopulation 15,762,370 1
Area 181,035 km2 1
Climate Tropical monsoon climate which gives two distinct seasons: six months of the dry season from December to May followed by six months of the rainy season from June to November. Temperatures are the hottest in April with a monthly average of 29 °C (maximum 36 °C) and the coolest in December to January (25.6 °C).2,3
Topography Cambodia is physiographically characterized by four distinct topographical features. The north is formed by an escarpment of the sandstone Dangrek Mountains. The south-west is dominated by the granite Cardamom Mountains, with the highest peak being the range of Phnom Aural at 1,813 metres above sea level, forming a watershed boundary between the rivers flowing down into Tonle Sap Lake and those to the coastal area. The central flat lowland of Tonle Sap Lake is bounded by isolated hills. The east is dominated by mountain ranges.3
Rain pattern The rainfall pattern of Cambodia is bimodal, with two rainy seasons in June/July and September/October. Average annual precipitation is 1,400 mm, but varies from 1,000 mm in the west to 4,700 in the south.3
Hydrology The territory of Cambodia consists of three major watersheds: the Tonle Sap Lake/River, the Mekong River and the coastal area. Those represent 44, 42 and 14 per cent of the country’s land area respectively. The Cambodian section of the Mekong River has a length of 486 km with the drainage area of about 155,000 km2. Phnom Penh is located at the confluence of the Mekong River and the Tonle Sap River, and marks the beginning of the Mekong Delta. Downstream of Phnom Penh, the Mekong River splits into two, into the mainstream Mekong River and the Bassac River tributary.3
Electricity sector overview
As of December 2017, the total installed capacity in operation in Cambodia was 1,749.3 MW. Hydropower, coal plants and diesel/heavy fuel oil (HFO) contributed 58.8, 28.6 and 11.2 per cent respectively. The installed capacity of biomass and solar power was 14.5 MW and 10 MW, accounting for just 0.8 and 0.6 per cent of the total capacity respectively (Figure 1). 4
Figure 1. Installed electricity capacity by source in Cambodia (MW)
0 200 400 600 800 1000 1200
Hydropower
Coal
Diesel/HFO
Biomass
Solar power
1,028.1
500.0
196.7
14.5
10.0
Source: EDC 4
In 2017, total domestic generation was 6,569.3 GWh with 54.3 per cent supplied by coal, 41.2 per cent by hydropower, 3.8 per cent by diesel/HFO, 0.6 per cent by biomass and 0.1 per cent by solar power (Figure 2).4
Figure 2. Electricity generation by source in Cambodia (GWh)
0 500 1000 1500 2000 2500 3000 3500 4000
Coal
Hydropower
Diesel/HFO
Biomass
Solar power
3,569.2
2,705.4
247.8
42.4
4.6
Source: EDC 4
In order to meet demand, Cambodia imported approximately 796.3 GWh (10.8 per cent of total consumption) from neighbouring countries such as Thailand and Viet Nam in 2017 (Figure 3).4
3.4.1
World Small HydropoWEr dEvElopmEnt
rEport 2019
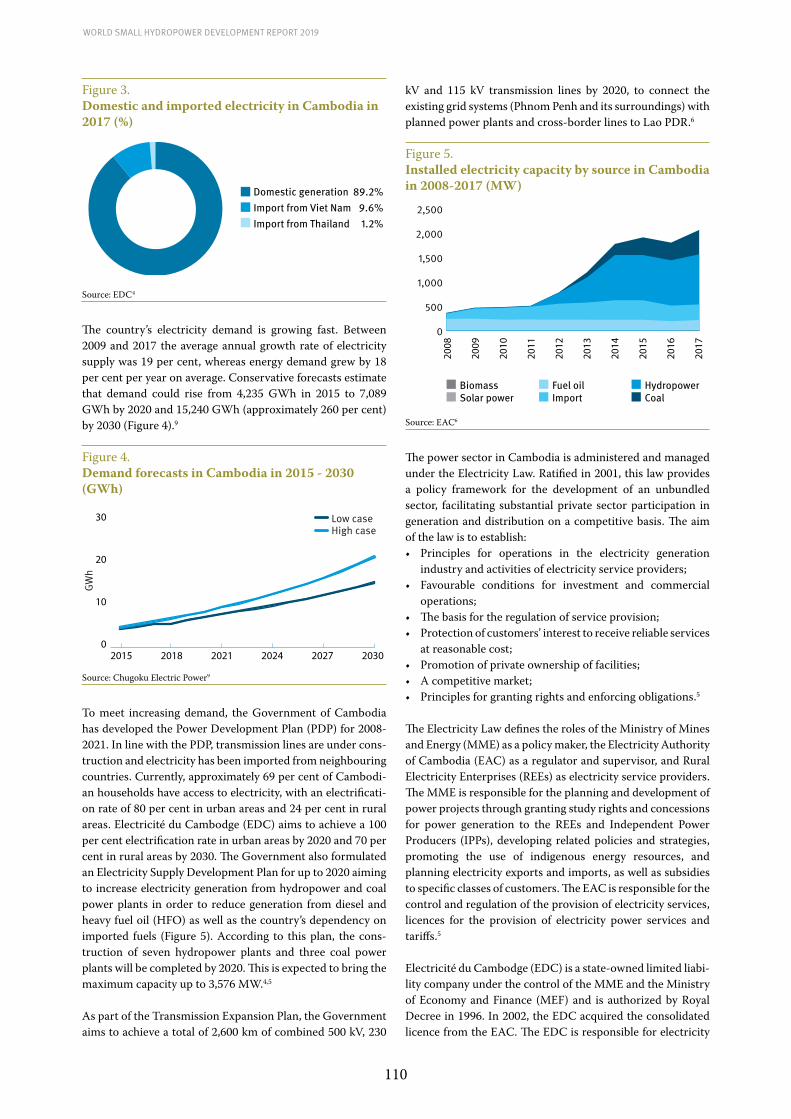
110
World Small HydropoWer development report 2019
Figure 3. Domestic and imported electricity in Cambodia in 2017 (%)
Domestic generation 89.2%Import from Viet Nam 9.6%Import from Thailand 1.2%
Source: EDC4
The country’s electricity demand is growing fast. Between 2009 and 2017 the average annual growth rate of electricity supply was 19 per cent, whereas energy demand grew by 18 per cent per year on average. Conservative forecasts estimate that demand could rise from 4,235 GWh in 2015 to 7,089 GWh by 2020 and 15,240 GWh (approximately 260 per cent) by 2030 (Figure 4).9
Figure 4. Demand forecasts in Cambodia in 2015 - 2030 (GWh)
0
10
20
30
2015 2018 2021 2024 2027 2030
Low case High case
GWh
Source: Chugoku Electric Power9
To meet increasing demand, the Government of Cambodia has developed the Power Development Plan (PDP) for 2008-2021. In line with the PDP, transmission lines are under cons-truction and electricity has been imported from neighbouring countries. Currently, approximately 69 per cent of Cambodi-an households have access to electricity, with an electrificati-on rate of 80 per cent in urban areas and 24 per cent in rural areas. Electricité du Cambodge (EDC) aims to achieve a 100 per cent electrification rate in urban areas by 2020 and 70 per cent in rural areas by 2030. The Government also formulated an Electricity Supply Development Plan for up to 2020 aiming to increase electricity generation from hydropower and coal power plants in order to reduce generation from diesel and heavy fuel oil (HFO) as well as the country’s dependency on imported fuels (Figure 5). According to this plan, the cons-truction of seven hydropower plants and three coal power plants will be completed by 2020. This is expected to bring the maximum capacity up to 3,576 MW.4,5
As part of the Transmission Expansion Plan, the Government aims to achieve a total of 2,600 km of combined 500 kV, 230
kV and 115 kV transmission lines by 2020, to connect the existing grid systems (Phnom Penh and its surroundings) with planned power plants and cross-border lines to Lao PDR.6
Figure 5. Installed electricity capacity by source in Cambodia in 2008-2017 (MW)
2008
2009
2010
2011
2012
2013
2014
2015
2016
2017
0
500
1,000
1,500
2,000
2,500
BiomassSolar power
Fuel oilImport
HydropowerCoal
Source: EAC6
The power sector in Cambodia is administered and managed under the Electricity Law. Ratified in 2001, this law provides a policy framework for the development of an unbundled sector, facilitating substantial private sector participation in generation and distribution on a competitive basis. The aim of the law is to establish:• Principles for operations in the electricity generation
industry and activities of electricity service providers;• Favourable conditions for investment and commercial
operations;• The basis for the regulation of service provision;• Protection of customers’ interest to receive reliable services
at reasonable cost;• Promotion of private ownership of facilities;• A competitive market;• Principles for granting rights and enforcing obligations.5
The Electricity Law defines the roles of the Ministry of Mines and Energy (MME) as a policy maker, the Electricity Authority of Cambodia (EAC) as a regulator and supervisor, and Rural Electricity Enterprises (REEs) as electricity service providers. The MME is responsible for the planning and development of power projects through granting study rights and concessions for power generation to the REEs and Independent Power Producers (IPPs), developing related policies and strategies, promoting the use of indigenous energy resources, and planning electricity exports and imports, as well as subsidies to specific classes of customers. The EAC is responsible for the control and regulation of the provision of electricity services, licences for the provision of electricity power services and tariffs.5
Electricité du Cambodge (EDC) is a state-owned limited liabi-lity company under the control of the MME and the Ministry of Economy and Finance (MEF) and is authorized by Royal Decree in 1996. In 2002, the EDC acquired the consolidated licence from the EAC. The EDC is responsible for electricity

111
3.2. So
uth
-EaS
tErn
aS
ia
generation, transmission and distribution as well as electrici-ty imports from and exports to neighbouring countries.5
EDC is the largest REE. Other private REEs, such as Commu-nity Electricity Cambodia (CEC), are allowed to provide elec-tricity to the national grid. By harnessing large hydropower potentials and developing additional coal power plants, tariffs are expected to decline in the future (Table 1). However, with the on-going national power grid upgrade works, the tariffs will also have to compensate for the related costs. Besides the regular rates, the Government also provides tariff reductions and subsidies (Table 2).
Table 1. Tariff rates in Cambodia in 2010 - 2020
Tariff typeTariff (US$ per kWh)
2010 2015 2016 2017 2018 2019 2020
Industrial and commercial customers
Purchase from grid sub-sta-tion
0.122 0.127 0.124 0.124 0.124 0.124 0.124
Purchase from national grid
0.179 -
0.2290.177 0.170 0.167 0.165 0.163 0.162
Purchase from provincial grid 0.172 0.170 0.170 0.165 0.164 0.163 0.162
Residential
Covered by EDC
0.205 -
0.3050.205 0.198 0.198 0.193 0.190 0.188
Covered by IPP
0.600 -
0.925
0.250 -
0.7500.200 0.197 0.192 0.190 0.187
Subsidy tariffs
Poor house-holds in rural areas below 10 kWh per month
0.000 0.250
- 0.750
0.120 0.120 0.120 0.120 0.120
Poor house-holds in Phnom Penh below 50 kWh per month
0.000 0.250
- 0.750
0.200 0.153 0.153 0.153 0.153
Poor pumping in agriculture sector from 21:00 to 7:00
0.000 0.205 0.120 0.120 0.120 0.120 0.120
Source: EAC6
Table 2. Dry season tariffs in Cambodia in 2017
Rate (US$ per kW)
Phnom Penh (households) 0.180
Phnom Penh (businesses) 0.193
Grid-connected towns and urban areas 0.193
Rural areas 0.198
Source: EAC6
Small hydropower sector overview
Hydropower plants with installed capacity of up to 10 MW are defined as small-scale. The current installed capacity is 1.655 MW with an estimated potential of approximately 300 MW, indicating that only 0.55 per cent of the country’s small hydropower (SHP) potential has been harnessed.4 In comparison to data from the World Small Hydropower Development Report (WSHPDR) 2016, SHP potential has remained the same, whilst installed capacity has increased marginally (Figure 6).5 This change is due to a more accurate assessment of the country’s current installed capacity.
Figure 6. Small hydropower capacities 2013/2016/2019 in Cambodia (MW)
0 50 100 150 200 250 300
PotentialCapacity
Installed Capacity
300 300 300
1.661.261.90
WSHPDR 2019WSHPDR 2016WSHPDR 2013
Source: EDC,4 WSHPDR 2016,5 WSHPDR 201311
Note: The comparison is between data from WSHPDR 2013, WSHPDR 2016 and WSHPDR 2019.
The installed capacity as of 2017 consisted of four projects constructed under grant aid from the Government of Japan and managed and operated by the EDC (Table 3). There are also several privately-owned micro- and pico-hydropower plants in the northern part of the country, with individual installed capacities ranging between 1 kW and 30 kW supported technically from Viet Nam and China.7
Table 3.Operational small hydropower plants in Cambodia
Project name Capacity (MW) Location
O’Chum 1 0.265 Rattanakiri
O’Chum 2 0.960 Rattanakiri
O’Mleng 0.215 Mondulkiri
O’Romis 0.215 Mondulkiri
Total 1.655
Source: MME 7
There are an additional nine projects at an advanced study stage with a combined installed capacity estimated at 20 MW (Table 4).7 A further 39 sites with a potential of 30 MW have also been identified and are in the reconnaissance stage (Table 5).7 Cambodia has a total hydropower potential of approximately 10,000 MW, with seven hydropower plants of 1,328 MW in total that are either operational or expected to be completed by 2018.4,10 Thus, only a small fraction of the total hydropower installed and potential capacity is from small hydropower. However, many large hydropower sites identified are highly controversial and unlikely to be

112
World Small HydropoWer development report 2019
developed due to factors such as resettlements, land issues, negative impacts on fisheries, community consultations and limited environmental and social impact assessments.
Table 4.Small hydropower sites in Cambodia at advanced study stage
Project name Capacity (MW) Location
Prek Por 4.800 Mondulkiri
Stung Kep 4.100 Kep City
O’ Phlai 3.400 Mondulkiri
O’ Sla Up Stream 1.900 Koh Kong
Stung Siem Reap 3 1.700 Siem Reap
O’ Turou Trao 1.122 Kampot
O’ Katieng 0.100 Ratanakiri
Stung Chikreng 0.800 Siem Reap
Prek Teuk Chhu 0.762 Kampot
Total 18.684 Source: MME7
Table 5.Potential small hydropower sites in Cambodia at site reconnaissance stage
Project name Capacity (MW) Location
O Sla Downstream 4.483 Koh Kong
Phnom Batau Down Stream 4.197 Koh Kong
Stung Sva Slab 3.804 Kampong Speu
Phnom Tunsang Upstream 3.143 Koh Kong
Phnom Tunsang Down Stream 3.002 Koh Kong
Phoum Kulen 1.561 Siem Reap
Tum Nup Garaing 1.500 Siem Reap
Stung Prey Klong 0.886 Pursat
Preak Antap 0.844 Kampong Cham
Stung Boribour 0.813 Kampong Chhang
Prek Toeuk Chhu 0.762 Kampot
Upper Stung SiemReap 0.656 Siem Reap
Preak Thum 0.506 Siem Reap
Stung Bannak 0.403 Kampong Chhang
Stung Moung 1 0.400 Battambang
Stung Moung 2 0.400 Battambang
O Sam Kaong 0.334 Siem Reap
Pteak Kaoh Touch 0.317 Kampot
Kball Chay 0.312 Sihanoukville
Stung Tras 0.243 Kampot, Kampong Speu
Stung Kraing Ponley 0.221 Kampong Chhang
Prek Dak Seur 0.201 Mondulkiri
O Sam Raong 0.149 Siem Reap
Chruroh Rokar 0.119 Kampot, Takeo
Snam Prampir 0.101 Kampot
Stung Pursat 1 0.100 Pursat
Project name Capacity (MW) Location
Stung Prey Klong 0.100 Pursat
Tomnup Kuon Sat 0.100 Kampot
O Kachanh 0.100 Rattanakiri
Stung Touch 0.079 Siem Reap
Bay Srok 0.078 Rattanakiri
O Chum 3 0.074 Rattanakiri
O Yong Ngol 0.068 Mondulkiri
Busra 0.054 Mondulkiri
O Pramoie 0.036 Pursat
Takeo Waterfall 0.030 Takeo
Ochhleung 0.030 Takeo
Phoum Kbal Spean 0.018 Siem Reap
Ta Ang 0.010 Rattanakiri
Total 30.234 Source: MME7
Renewable energy policy
According to the Power Development Plan, renewable energy is expected to account for more than half of Cambodia’s total energy production by 2020. In general, renewable energy policy in Cambodia is directly related to rural electrification. In 2004, the Government issued a Royal Decree for the establishment of the Rural Electrification Fund (REF) to accelerate the development of electric power and renewable energy supply in rural areas. Among other objectives, the REF aims to promote and encourage private sector participation in providing sustainable rural electrification services, such as the exploitation and economic application of technically and commercially well proven new and renewable energy technologies.5,8
In 2006, the Government approved the Rural Electrification by Renewable Energy Policy with the main objective of creating an enabling framework for renewable energy technologies to increase access to electricity in rural areas. The Rural Electrification Master Plan (REMP) is the guiding document for the implementation of projects and programmes. In addition to the electrification rate targets outlined above, the REMP aimed to have 15 per cent of rural electricity supply coming from solar and small hydropower by the end of 2015.5,8
The Government of Cambodia has not set any feed-in tariffs (FITs) for renewable energy plants connected to the grid. For off-grid plants, the selling tariffs are determined between the investors and consumers. However, there are other fiscal and investment incentives in place supporting developers of renewable energy projects.12 By 2013, import taxes on solar PV components and biomass and solar water heating components were substantially reduced from 30 per cent to 7 per cent and from 15 per cent to 0 per cent respectively.8 The Government has provided guaranteed payments to several hydropower projects, however such incentives are not available for other types of renewable energy such as biomass and solar power. The solar power market has been predominantly driven by the electricity needs of people who are unable to access on-grid

113
3.2. So
uth
-EaS
tErn
aS
ia
electricity. Increased solar PV installation is also stimulated by two programmes implemented by the REF and the MME, which are the Solar Home Systems (SHS) Programme and the Power to the Poor (P2P) Programme funded by the World Bank and AFD respectively.5,8
In 2012, the Government issued another Royal Decree to integrate the REF with the EDC. Part of this integration requires that the EDC, through the REF, facilitates rural access to electricity under the Solar Home System programme. In 2013, the REF also received US$4 million from the EDC for its rural electrification programme, contributing to the Solar Home Systems Programme, Power to the Poor Programme and a programme aimed at improving existing and developing new electricity infrastructure in rural areas.5,8 Following the National Strategic Development Plan 2014-2018, the REF was transferred to EDC to promote equity in access to electricity supply and encourage the participation of the private sector in the development of sustainable power supply services in rural areas and, in particular, encourage the use of renewable energy.12
Barriers to small hydropower developmentTo attract more investors and reduce risks in small hydropower investments there is a need to refine investment costs, collect hydrological data, and mitigate social and environmental impacts, in order to make projects more technically and economically sustainable. To promote a decentralized, demand-driven approach in electrification and facilitate private sector involvement in small hydropower development, a number of barriers have to be overcome, which are summarized below:• High project costs. Small hydropower is usually located in
remote areas with limited access and far away from load centres, which implies additional investment in infrastruc-ture.
• Lack of a policy and legal framework. A policy and a legal framework need to be created, e.g. concessionary duties and taxes concerning imports of small hydropower equip-ment.
• Access to financing for small hydropower investment. Banking and financial institutions operating in Cambodia provide credit for short periods with high interest rates ranging from 10 to 20 per cent per year, which impacts the financial viability of projects.
• Lack of energy market data. There is insufficient informa-tion on the characteristics of the energy market including the scope, potential and consumer characteristics. Few systematic studies on the potential of small hydropow-er resources exist in the country. There is also a need to conduct a more detailed financial analysis for investment purposes.
• Institutional capacity for planning, implementation and operation. There is a great lack of technical knowledge and operational skills. A lack of experience in operation and management as well as limited training possibilities are some of the factors causing institutional roadblocks.
A lack of coordination among stakeholders (governmental agencies, development partners, non-governmental orga-nizations, private investors and financial institutions) is another difficulty in the absence of a comprehensive policy on small hydropower development.5
References
1. World Bank (n.d.). Cambodia. Available from https://data.world-bank.org/country/cambodia
2. World Bank (n.d.). Average Monthly Temperature and Rainfall for Cambodia, 1990-2012. Climate Change Knowledge Portal database. Available from http://sdwebx.worldbank.org/clima-teportal
3. United Nations Food and Agriculture Organization (FAO) (2011). Cambodia. Aquastat database. Available from http://www.fao.org/nr/water/aquastat/countries_regions
4. Electricité du Cambodge (EDC) (2016). Annual Report 2016. Available from http://edc.com.kh/publication.php?lvl=0&&ty-pe=annual_report
5. Xialei, C., Singh, P. R., Xianlai, W., and Kremere, E., eds. (2016). World Small Hydropower Development Report 2016. United Nations Industrial Development Organization; Inter-national Center on Small Hydro Power. Available from www.smallhydroworld.org.
6. Electricity Authority of Cambodia (2017). Report on the Power Sector of the Kingdom of Cambodia, 2017 Edition. Available from https://eac.gov.kh/site/annualreport?lang=en
7. Ministry of Mines and Energy (MME) (2015). List of identified sites of small hydropower projects in Cambodia, 2015, Phnom Penh.
8. Poch, K. (2013). Renewable Energy Development in Cambodia: Status, Prospects and Policies, in Kimura, S., H. Phoumin and B. Jacobs (eds.), Energy Market Integration in East Asia: Renewable Energy and its Deployment into the Power System, ERIA Research Project Report 2012-26, August 2013, Jakarta: ERIA. PP 227-266. Available from http://www.eria.org/RPR_FY2012_No.26_chapter_7.pdf
9. Chugoku Electric Power (2014). Power Development Master Plan in the Kingdom of Cambodia, 2014.
10. Nippon Koei Co., Ltd & Ministry of Mines and Energy (2019). The Master Plan Study of Hydropower Development in Cam-bodia, January 2009. Available from http://open_jicareport.jica.go.jp/pdf/11925773_01.pdf
11. Liu, H., Masera, D. and Esser, L., eds. World Small Hydropower Development Report 2013, United Nations Industrial Develop-ment Organization; International Center on Small Hydro Power (2013)
12. ASEAN Centre for Energy (2016). ASEAN Renewable Energy Policies. Available from http://www.eepmekong.org/index.php/resources/country-reports/256-asean-renewable-energy-poli-cies-august-2016/file
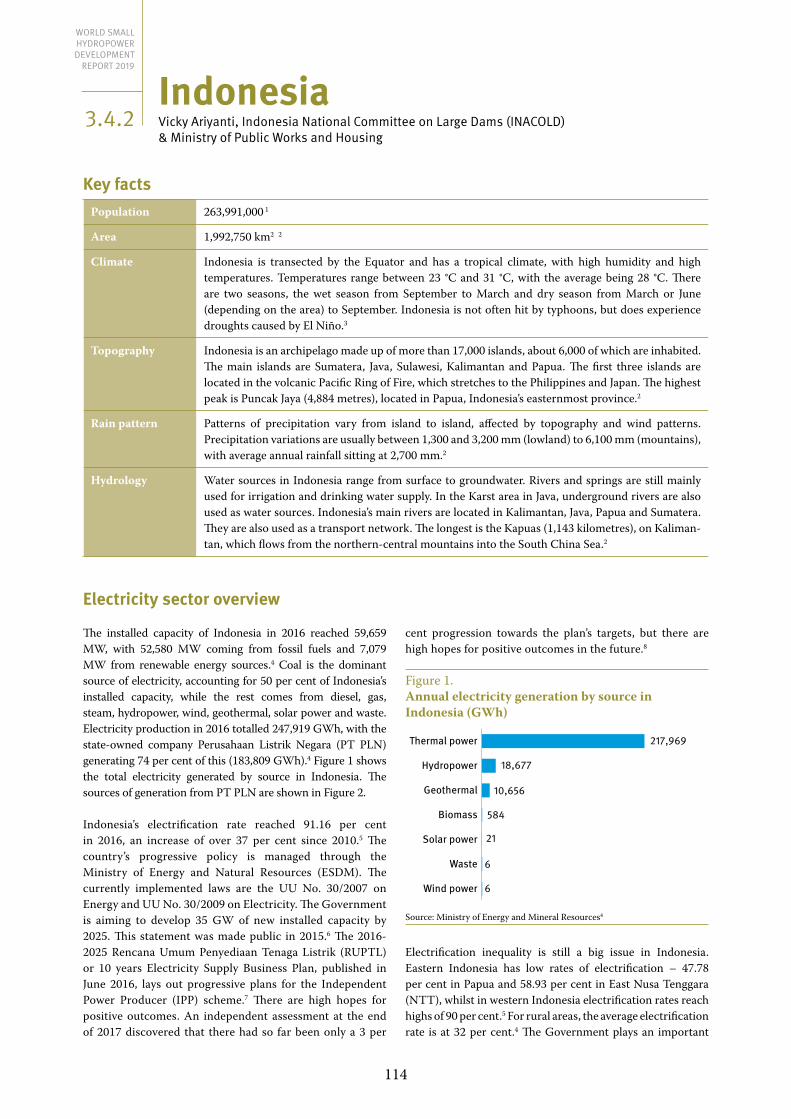
114
Indonesia vicky ariyanti, Indonesia national Committee on large dams (InaCold) & ministry of public Works and Housing
Key factsPopulation 263,991,000 1
Area 1,992,750 km2 2
Climate Indonesia is transected by the Equator and has a tropical climate, with high humidity and high temperatures. Temperatures range between 23 °C and 31 °C, with the average being 28 °C. There are two seasons, the wet season from September to March and dry season from March or June (depending on the area) to September. Indonesia is not often hit by typhoons, but does experience droughts caused by El Niño.3
Topography Indonesia is an archipelago made up of more than 17,000 islands, about 6,000 of which are inhabited. The main islands are Sumatera, Java, Sulawesi, Kalimantan and Papua. The first three islands are located in the volcanic Pacific Ring of Fire, which stretches to the Philippines and Japan. The highest peak is Puncak Jaya (4,884 metres), located in Papua, Indonesia’s easternmost province.2
Rain pattern Patterns of precipitation vary from island to island, affected by topography and wind patterns. Precipitation variations are usually between 1,300 and 3,200 mm (lowland) to 6,100 mm (mountains), with average annual rainfall sitting at 2,700 mm.2
Hydrology Water sources in Indonesia range from surface to groundwater. Rivers and springs are still mainly used for irrigation and drinking water supply. In the Karst area in Java, underground rivers are also used as water sources. Indonesia’s main rivers are located in Kalimantan, Java, Papua and Sumatera. They are also used as a transport network. The longest is the Kapuas (1,143 kilometres), on Kaliman-tan, which flows from the northern-central mountains into the South China Sea.2
Electricity sector overview
The installed capacity of Indonesia in 2016 reached 59,659 MW, with 52,580 MW coming from fossil fuels and 7,079 MW from renewable energy sources.4 Coal is the dominant source of electricity, accounting for 50 per cent of Indonesia’s installed capacity, while the rest comes from diesel, gas, steam, hydropower, wind, geothermal, solar power and waste. Electricity production in 2016 totalled 247,919 GWh, with the state-owned company Perusahaan Listrik Negara (PT PLN) generating 74 per cent of this (183,809 GWh).4 Figure 1 shows the total electricity generated by source in Indonesia. The sources of generation from PT PLN are shown in Figure 2.
Indonesia’s electrification rate reached 91.16 per cent in 2016, an increase of over 37 per cent since 2010.5 The country’s progressive policy is managed through the Ministry of Energy and Natural Resources (ESDM). The currently implemented laws are the UU No. 30/2007 on Energy and UU No. 30/2009 on Electricity. The Government is aiming to develop 35 GW of new installed capacity by 2025. This statement was made public in 2015.6 The 2016-2025 Rencana Umum Penyediaan Tenaga Listrik (RUPTL) or 10 years Electricity Supply Business Plan, published in June 2016, lays out progressive plans for the Independent Power Producer (IPP) scheme.7 There are high hopes for positive outcomes. An independent assessment at the end of 2017 discovered that there had so far been only a 3 per
cent progression towards the plan’s targets, but there are high hopes for positive outcomes in the future.8
Figure 1. Annual electricity generation by source in Indonesia (GWh)
217,969
18,677
10,656
584
21
6
6
Thermal power
Hydropower
Geothermal
Biomass
Solar power
Waste
Wind power
Source: Ministry of Energy and Mineral Resources4
Electrification inequality is still a big issue in Indonesia. Eastern Indonesia has low rates of electrification – 47.78 per cent in Papua and 58.93 per cent in East Nusa Tenggara (NTT), whilst in western Indonesia electrification rates reach highs of 90 per cent.5 For rural areas, the average electrification rate is at 32 per cent.4 The Government plays an important
3.4.2
World Small HydropoWEr dEvElopmEnt
rEport 2019
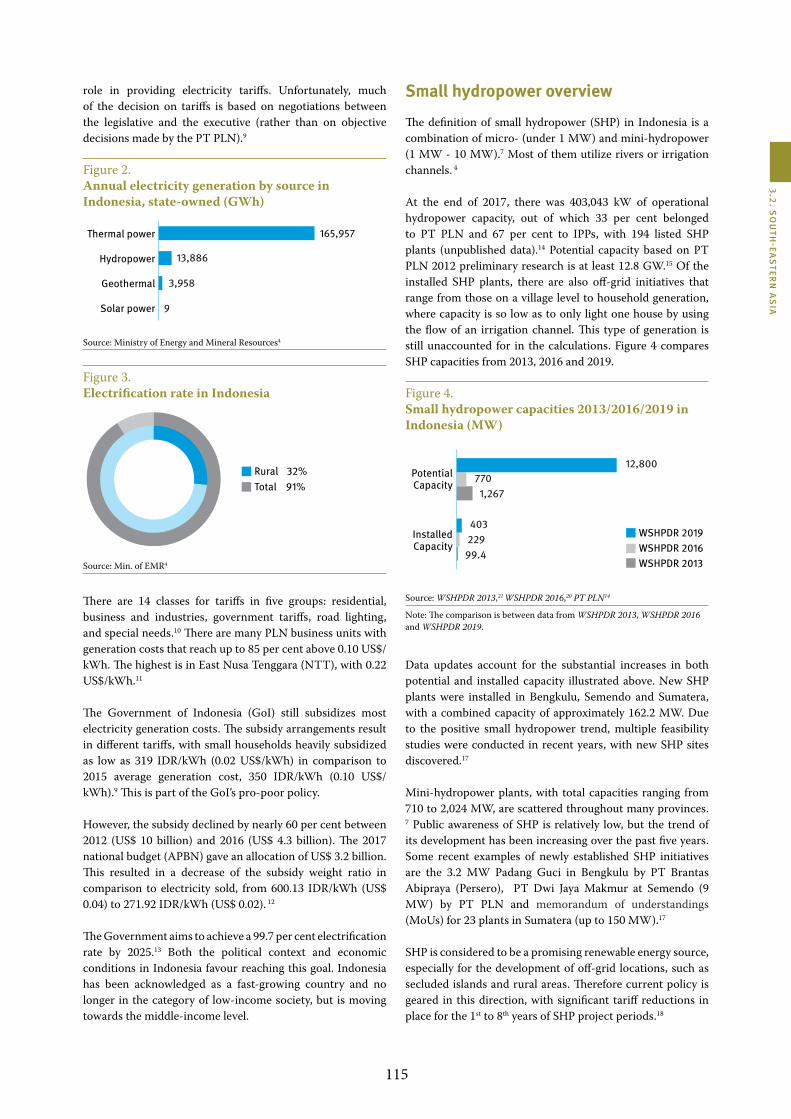
115
3.2. So
uth
-EaS
tErn
aS
ia
role in providing electricity tariffs. Unfortunately, much of the decision on tariffs is based on negotiations between the legislative and the executive (rather than on objective decisions made by the PT PLN).9
Figure 2. Annual electricity generation by source in Indonesia, state-owned (GWh)
Thermal power
Hydropower
Geothermal
Solar power
165,957
13,886
3,958
9
Source: Ministry of Energy and Mineral Resources4
Figure 3. Electrification rate in Indonesia
Rural 32%Total 91%
Source: Min. of EMR4
There are 14 classes for tariffs in five groups: residential, business and industries, government tariffs, road lighting, and special needs.10 There are many PLN business units with generation costs that reach up to 85 per cent above 0.10 US$/kWh. The highest is in East Nusa Tenggara (NTT), with 0.22 US$/kWh.11
The Government of Indonesia (GoI) still subsidizes most electricity generation costs. The subsidy arrangements result in different tariffs, with small households heavily subsidized as low as 319 IDR/kWh (0.02 US$/kWh) in comparison to 2015 average generation cost, 350 IDR/kWh (0.10 US$/kWh).9 This is part of the GoI’s pro-poor policy.
However, the subsidy declined by nearly 60 per cent between 2012 (US$ 10 billion) and 2016 (US$ 4.3 billion). The 2017 national budget (APBN) gave an allocation of US$ 3.2 billion. This resulted in a decrease of the subsidy weight ratio in comparison to electricity sold, from 600.13 IDR/kWh (US$ 0.04) to 271.92 IDR/kWh (US$ 0.02). 12
The Government aims to achieve a 99.7 per cent electrification rate by 2025.13 Both the political context and economic conditions in Indonesia favour reaching this goal. Indonesia has been acknowledged as a fast-growing country and no longer in the category of low-income society, but is moving towards the middle-income level.
Small hydropower overview
The definition of small hydropower (SHP) in Indonesia is a combination of micro- (under 1 MW) and mini-hydropower (1 MW - 10 MW).7 Most of them utilize rivers or irrigation channels. 4
At the end of 2017, there was 403,043 kW of operational hydropower capacity, out of which 33 per cent belonged to PT PLN and 67 per cent to IPPs, with 194 listed SHP plants (unpublished data).14 Potential capacity based on PT PLN 2012 preliminary research is at least 12.8 GW.15 Of the installed SHP plants, there are also off-grid initiatives that range from those on a village level to household generation, where capacity is so low as to only light one house by using the flow of an irrigation channel. This type of generation is still unaccounted for in the calculations. Figure 4 compares SHP capacities from 2013, 2016 and 2019.
Figure 4. Small hydropower capacities 2013/2016/2019 in Indonesia (MW)
0 3000 6000 9000 12000 15000
PotentialCapacity
Installed Capacity
12,800 770 1,267
403 22999.4
WSHPDR 2019WSHPDR 2016WSHPDR 2013
Source: WSHPDR 2013,21 WSHPDR 2016,20 PT PLN14
Note: The comparison is between data from WSHPDR 2013, WSHPDR 2016 and WSHPDR 2019.
Data updates account for the substantial increases in both potential and installed capacity illustrated above. New SHP plants were installed in Bengkulu, Semendo and Sumatera, with a combined capacity of approximately 162.2 MW. Due to the positive small hydropower trend, multiple feasibility studies were conducted in recent years, with new SHP sites discovered.17
Mini-hydropower plants, with total capacities ranging from 710 to 2,024 MW, are scattered throughout many provinces. 7 Public awareness of SHP is relatively low, but the trend of its development has been increasing over the past five years. Some recent examples of newly established SHP initiatives are the 3.2 MW Padang Guci in Bengkulu by PT Brantas Abipraya (Persero), PT Dwi Jaya Makmur at Semendo (9 MW) by PT PLN and memorandum of understandings (MoUs) for 23 plants in Sumatera (up to 150 MW).17
SHP is considered to be a promising renewable energy source, especially for the development of off-grid locations, such as secluded islands and rural areas. Therefore current policy is geared in this direction, with significant tariff reductions in place for the 1st to 8th years of SHP project periods.18
116
World Small HydropoWer development report 2019
Renewable energy policy
The Indonesian Nationally Determined Contribution (NDC) for climate change in 2016 outlined the country’s target of reducing 26 per cent of greenhouse emission by 2020,19 later changed in 2017 to 29 per cent by 2020 and to 41 per cent by 2030.20 The country has increased its budget for tackling climate adaptation and mitigation efforts, including fiscal policies to reduce emissions in energy and land-use. A 2017 study found that these efforts are not enough to meet Indonesia’s climate commitments. 20 There is however mitigation potential in the country’s forest moratorium policy. Above all, the country needs to prioritize implementing renewable energy policies and improving business and society collaboration in this sector.
Renewable Energy (RE) policy plots are based on Minister of EMR Regulation No. 12/2017 concerning the Utilization of Renewable Energy for Electricity Provisioning for a better allocation for the electrification rate in the upcoming 10 years. With the help of the IPP scheme, it is estimated that 210 GW can be utilized from the overall RE potential. The potential consists of solar PV, biogas, large hydropower, waste, wind, geothermal, biomass, biogas, and micro-hydropower. RE investment opportunities in Indonesia are largely dominated by solar PV potential. Large hydro came second, but SHP is not seen as a major contributor.5 Incentives to support investment in renewables include financial loan interests below market rates, and fiscal incentives such as tax holidays, tax allowances, import duties, and VAT exemptions.
At the moment, there is no special regulation of SHP, although the aforementioned regulation supports the feed-in tariffs (FITs) of SHP up to 10 MW by the PT PLN, with the IPP scheme.5 The Government also made open calls for these types of investment.13 The prospect of the IPP scheme for SHP opened possibilities for direct foreign investment in Indonesia. At present, funding comes from both the government and private investors. Purchase obligation through direct selection for SHP produced electricity is determined and uses a minimum capacity factor of 65 per cent.
Barriers to small hydropower developmentAlthough, supporting policies for SHP development in Indonesia are in place, there are still significant barriers to implementation:16 • Institutional frameworks that are still too general and
institutional capacities that are not yet developed. In practice, the management of institutions is vulnerable to changes in politics. Meanwhile, the provided frameworks are not strong enough to put forward an agenda to support SHP initiatives.
• Unclear procedures for SHP development permits for private companies, which might be explained by permit overlaps in the river basin management. For example, if the surface water resource is from irrigation channel or weirs, it is complicated to determine which level of
government will offer a mandate and release a permit for technical recommendations.
• The quality of efforts in implementing the financial mechanism is also rather discouraging. The fiscal and incentives mechanisms are not yet implemented effectively. The lack of these mechanisms is basically due to the inflexibilities of budgeting schemes in the Government sectors. The investment of US$ 2.0-2.5 million per MW is required.17 However, this amount is too low for the project financing and too high for most actors in the private sector.
• Limited foreign ownership (49 per cent for SHP of 1-10 MW) makes investment less attractive.17
• Power purchase agreements and procurement processes are not yet established in a standardized way, although the policy setting already indicates a mechanism for this. Investors are still unsure on current conditions, making this a priority for the PT PLN to resolve.
• Off-grid electricity generation is not yet common in the Indonesian power scheme, and the development of remote SHP plants lack public support.
• Grid system interconnection points are still insufficient. • There is a low incentive to develop SHP due to low
awareness of SHP potential, limited equipment providers and limited infrastructures in rural areas.
Basic data (hydro-meteorology, topography and geology) are not yet publicly available in Indonesia. The data quality is also poor, especially in remote areas. As most of the data on precipitation are manually recorded and can only go back to the last 20 years, their reliability is low.
SHP in Indonesia is developing positively, with an installed capacity of 403.043 MW in 2017. However, a lack of awareness of existent SHP potential is the main barrier to its development, as well as limited mechanisms for the further development of SHP projects. Yet the future prospects of SHP in Indonesia remain positive, and ever more attention is being given to the renewable power generation initiatives in the country.
References
1. World Bank. Population Indonesia. https://data.worldbank.org/indicator/SP.POP.TOTL. 2017.
2. Frederick, WH, Worden RL. A country study: Indonesia. http://countrystudies.us/indonesia/28.htm. 2013.
3. Hays, J. Weather and climate in Indonesia. http://factsanddetails.com/indonesia/Nature_Science_Animals/sub6_8a/entry-4079.html. 2015.
4. DG of Electricity, Min. of EMR. Statistik ketenagalistrikan 2016.2017; Edisi No.30 TA 2017.
5. Tapparan, Ezrom M.D. Indonesian Renewable Energy Policy and Investment Opportunities. Indonesia’s New Regulation and Its Impact of Renewable Development. http://www.irena.org/-/media/Files/IRENA/Agency/Events/2017/Jun/5/3-MEMR--Indonesia-RE--ACEF-6-June-2017--online.pdf?la=en&hash=-C85A5107CA9D85E456558A6DBD083592F3D06A38. Updated 20172018.
6. Ferial. Proyek 35.000 MW Serap 65.000 Tenaga Kerja. http://

117
3.2. So
uth
-EaS
tErn
aS
ia
ebtke.esdm.go.id/post/2015/05/05/847/proyek.35.000.mw.serap.65.000.tenaga.kerja. 2015.
7. PT.PLN. Rencana usaha penyediaan tenaga listrik PT perusa-haan listrik negara (persero) tahun 2016 s.d. 2025. 2016.
8. Amelia, Anggita R. Hingga November 2017, Hanya 3% Proyek 35 GW yang Beroperasi. https://katadata.co.id/berita/2018/01/10/hingga-november-2017-hanya-3-proyek-35-gw-yang-beroperasi. Updated 20182018.
9. PWC Indonesia. Powering the nation: Indonesian power indus-try survey 2017. 2017; May 2017.
10. Min. of EMR regulation no.41/2017 on electricity tariffs provid-ed by PT PLN. 2017.
11. Susanto, Andre E. Indonesia’s second renewables regulation alle-viates PLN’s tariff dilemma. https://www.pv-tech.org/guest-blog/indonesias-second-renewables-regulation-alleviates-plns-tar-iff-dilemma.
12. Pranadi, Aloysius D. The Status of Electricity Subsidy Reform in Indonesia. http://www.aseanenergy.org/blog/status-of-electrici-ty-subsidy-reform-in-indonesia/. Updated 20172018.
13. PWC Indonesia. PwC Indonesia energy, utilities & mining News-Flash Release of Long-awaited 2016 - 2025 RUPTL – a Positive Sign for IPP Investors. https://www.iea.org/media/pams/indo-nesia/20162025_IndonesiaElecSupplyPlanRUPTL_PwCIndone-sianewsflash.pdf. 2016
14. PT PLN. PLTM PLN yang Sudah Beroperasi. 2018.15. Patel, Sonal. Indonesia: Energy Rich and Electricity Poor. http://
www.powermag.com/indonesia-energy-rich-and-electrici-ty-poor/?printmode=1. 2013
16. PWC Indonesia. Power in Indonesia, Investment and taxation guide november 2017. 2017. 5th edition.
17. Wulandari M. Renewable energy power pricing in indonesia. http://www.aseanenergy.org/blog/renewable-energy-power-pric-ing-in-indonesia/. 2017
18. Government of Indonesia. First NDC Indonesia. http://www4.unfccc.int/ndcregistry/PublishedDocuments/Indonesia%20First/First%20NDC%20Indonesia_submitted%20to%20UNFCCC%20Set_November%20%202016.pdf. 2016
19. Chrysolite, Hanny, Juliane, Reidinar, Chitra, Josephine, Ge, Mengpin. Evaluating Indonesia’s Progress on its Climate Com-mitments. http://www.wri.org/blog/2017/10/evaluating-indone-sias-progress-its-climate-commitments. 2017.
20. Xialei, C., Singh, P. R., Xianlai, W., and Kremere, E., eds. (2016). World Small Hydropower Development Report 2016. United Nations Industrial Development Organization; Interna-tional Center on Small Hydro Power. Available from www.small-hydroworld.org.
21. LIU, H., Masera, D. and Esser, L., eds. (2013). World Small Hy-dropower Development Report 2013. United Nations Industrial Development Organization; International Center on Small Hy-dro Power. Available from www.smallhydroworld.org.

118
Lao People’s Democratic Republic akhomdeth vongsay, ministry of Energy and mines; International Center on Small Hydro power (ICSHp)*
Key factsPopulation 6,858,1601
Area 236,800 km2
Climate The climate of Lao PDR is mainly tropical, with a seasonal monsoon with warm, humid weather and heavy rainfall during the wet season. The average yearly temperature is approximately 29 °C. Tem-peratures can reach highs of 40 °C, whilst during the cooler months they drop to 15-20 °C at night in low-lying areas such as in the capital city Vientiane, and even below freezing in mountainous areas.2
Topography Lao PDR is largely mountainous, typically over 500 metres above sea level in altitude, with narrow river valleys and low agricultural potential. This mountainous landscape extends across most of the north of the country, except for the Plain of Vientiane and the Plain of Jars in the Xiangkhoang Plateau. The lowest point is on the Mekong River (70 metres), while the highest point is Phou Bia (2,817 metres).3
Rain pattern Rainfall varies regionally, with the highest rainfall on the Bolovens Plateau in Champasak Province, averaging 3,700 mm per year. Rainfall stations located in the main cities recorded mean yearly rainfall of 1,440 mm in Savannakhét, 1,700 mm in Vientiane and approximately 1,360 mm in Louang Phrabang.3
Hydrology The Mekong River is the largest in the country, comprising some 90 per cent of the country’s territory within its basin. There are 39 main tributaries in the Mekong River basin, such as the Ou, Suang and Khan Rivers in the northern region, the Ngum and the Nhiep in the northern-central region, the San, Theun-Kading and Bangfay in the central region, the Banghiang in the Savannakhet plain in the central-southern region, the Done in the southern region and the Kong in the south-eastern region.2
Electricity sector overview
The electricity sector in Lao PDR has developed rapidly over the past decade. In 2008, the installed capacity was less than 700 MW, yet by 2014 it exceeded 3,000 MW. The total installed capacity of Lao PDR in 2017 was 6,621 MW, of which hydropower accounted for 71 per cent, thermal power for 28.4 per cent, biomass for 0.5 per cent and solar power for 0.1 per cent (Figure 1).4,5 In addition to 56 hydropower plants, there is one coal-fired power plant with a capacity of 1,878 MW as well as two power plants fired by biomass.4 As of July 2017, there was also 7 MW of solar power capacity connected to the grid. Solar power installations are also operated off-grid in rural areas, however their total capacity is unknown.5 Electricity generation in 2017 from thermal and hydropower was approximately 7,861 GWh.4 1
Electricity generation is predicted to increase by 11 per cent per year between 2005 and 2025.6,7 In 2017, Lao PDR exported a total of 1,837 GWh.4 Thailand is currently the largest buyer of electricity from Lao PDR. Part of the electricity Thailand purchases is exported to Viet Nam and Cambodia. At the same time, Lao PDR has to import electricity from Thailand, China
* WSHPDR 2016 updated by ICSHP
and Viet Nam for remote northern areas of the country that are not connected to the national grid.6,7 In 2017, electricity imports stood at almost 431 GWh.4
Figure 1. Installed electricity capacity by source in Lao PDR (MW)
Hydropower
Thermal power
Biomass
Solar power
4,701
1,878
35
7
Source: EDL,4 MEM5
Note: The comparison is between data from WSHPDR 2013, WSHPDR 2016 and WSHPDR 2019.
Domestic peak electricity demand is estimated to increase to 2,863 MW in 2025, compared with 928 MW in 2017.4,8
This increase will be covered mainly by hydropower and coal. Electricity consumption reached almost 5,000 GWh in 2017, compared to less than 3,000 GWh in 2012.4 The largest
3.4.3
World Small HydropoWEr dEvElopmEnt
rEport 2019

119
3.2. So
uth
-EaS
tErn
aS
ia
consumer of electricity is the industrial sector, followed by the residential and commercial sectors.4 Since electrification is one of the major objectives of the Government of Lao PDR, the electrification rate has been increasing quickly. In 2017, 100 per cent of districts, 90 per cent of villages and 94 per cent of households were electrified.4
The main regulator of the electricity market of Lao PDR is the state-owned company Électricité du Laos (EDL). Electricity tariffs in Lao PDR used to be subsidized by the Government and did not compensate for the real cost of electricity generation and distribution. That is why the Government undertook a reform of electricity tariffs, aiming to ensure the financial sustainability of the sector. A gradual increase in electricity tariffs was scheduled for the period 2006-2017.9 Between 2011 and 2017, average electricity tariffs increased by 26 per cent from 0.695 US$/kWh to 0.875 US$/kWh.4
Small hydropower sector overview
In Lao PDR, hydropower plants with capacities below 15 MW are classified as small hydropower (SHP). Total installed capacity of SHP in 2017 was 148.14 MW, while potential is estimated to be at least 2,287 MW, indicating that approximately 6 per cent has been developed.4,10 Between the World Small Hydropower Development Report (WSHPDR) 2016 and WSHPDR 2019, installed capacity has increased more than tenfold, while potential has increased by 14 per cent (Figure 2).
Figure 2. Small hydropower capacities 2013/2016/2019 in Lao PDR (MW)
0 500 1000 1500 2000 2500
PotentialCapacity
Installed Capacity
2,287 2,000 800
148 1211
WSHPDR 2019WSHPDR 2016WSHPDR 2013
Source: EDL,4 WSHPDR 2016,7 MEM,10 WSHPDR 201311
Note: The comparison is between data from WSHPDR 2013, WSHPDR 2016 and WSHPDR 2019.
In 2017, there were 30 small hydropower plants in operation in Lao PDR, with capacities ranging from 0.06 MW to 15 MW and a combined capacity of 148.14 MW.4 In addition, there were 273 projects in different stages of development, with a combined capacity of 2,139 MW.10 Most of the existing and planned SHP plants are operated or planned by independent power producers (IPPs).
Hydropower is the most important energy resource in Lao PDR, with its total potential estimated at some 26,000 MW. Of this, 23,000 MW is estimated to be technically feasible. However, only 15,000 MW of this potential belongs to Lao PDR – the remaining 8,000 MW corresponds to the potential
of the Mekong shared with the other countries the river flows through.12 The development of SHP in Lao PDR could play an important role in increasing rural electrification and providing a solution with minimum production costs for remote areas that currently rely on imported electricity.7,8
Pico-hydropower plants have contributed to rural electrification in areas where grid connection has not been established. As per the estimates of the Lao Institute for Renewable Energy, approximately 60,000 units of pico-hydropower equipment were installed in the country by 2008, providing electricity supply to approximately 90,000 households. Those were sourced from China and Viet Nam and had capacities ranging from 300 W to 1,000 W.7,13 Spare parts for pico-units are sold in small shops in remote areas. Units range in price from US$35 to US$200 and may last up to five years if properly serviced.7,13
In the past, SHP development was not sustainable due to recurrent natural disasters, a lack of proper management and lack budget control for maintenance. To promote the development of SHP resources, the Government will implement measures to address and mitigate the existing technical, financial, procedural and institutional barriers that SHP developers are experiencing. Currently, hydropower technologies are relatively popular in remote villages as a primary source of electricity.7,13
Renewable energy policy
The Renewable Energy Strategy lays out the strategy and po-licy framework for renewable energy (RE) deployment in the country by 2025. The 2025 goal is to reach a 30 per cent share of RE sources in total energy consumption, including the spheres of production, agriculture, forestry, processing and industry, as well as a 10 per cent share in total transport energy consumpti-on. The strategy focuses on the development of RE on the local (village) level and small-scale power projects for self-sufficien-cy and grid connection as well as large-scale projects.7,14
The Government defines the priorities for development as follows:• Promote sustainable RE development to ensure the supply
of energy for social and economic development;• Facilitate financial aspects such as tax exemptions and
incentives for investors;• Prepare and improve laws and regulations related to the
facilitation of RE development.7,14
The Government of Lao PDR aims to develop various RE resources such as biofuels, solar, biomass, biogas, wind and other alternative fuels for transportation. The objectives of the Government include:• Reducing fossil fuel import;• Promoting public, private, local and foreign investment in
the energy sector;• Developing 50 MW of wind power;• Increasing residential use of solar energy in 331 villages
within 11 provinces between 2010 and 2020.7,14

120
World Small HydropoWer development report 2019
In 2015, the Government adopted the National Policy on Sustainable Hydropower Development, which offers policy guidance to agencies overseeing investment projects in the hydropower sector. The policy applies to all hydropower plants with capacity above 15 MW and requires an assessment of the technical, economic, environmental and social impact of each project as well as information disclosure, public consultations, compliance monitoring and benefit sharing throughout the project development stages.
Legislation on small hydropower
The 1996 Water and Water Resource Law (Law No. 106) governs the management, exploitation, development, and use of water and water resources, of which ownership is vested in the people of Lao PDR as a whole. As per Article 8, the Ministry of Agriculture and Forestry is responsible for the survey of water resources and river basins. The right to utilize water resources is determined by classification, and as per Article 16, hydropower generation is considered medium-scale or large-scale use. Medium- and large-scale use must obtain permits, conduct feasibility studies, including environmental impact assessments (EIAs), conduct sociological studies and have an overall plan before the right to use water resources is granted (Article 19).7,15
The Water and Water Resource Law also has special provisions for hydropower, included in Article 25, entitled Promotion of Watershed and Water Resource Protection for Hydropower Development, which states that the Government will encourage the development of hydropower projects in line with existing legislation, in order to properly and fully utilize the natural resource.7,15
Barriers to small hydropower developmentThe most important barriers to the development of small and mini-hydropower in Lao PDR are:• Complex regulations requiring case-by-case negotiation
for power purchase agreements;• Limited clarity in relation to power purchase agreement
off-take tariffs, taxes, royalties and duties;• Inadequate institutional capacity at the level of provincial
authorities, which are empowered to approve only proj-ects of up to 5 MW of small and mini-hydropower capac-ity, whereas projects from 5 MW to 50 MW have to be approved by the national Government;
• The need for developers to apply for longer-term loans than commercial banks normally offer.7,13
References
1. World Bank (2017). Population, total. Available from http://data.worldbank.org/indicator/SP.POP.TOTL
2. United Nations Food and Agriculture Organization (FAO) (2011). Laos. Aquastat database. Available from www.fao.org/nr/water/aquastat/countries_regions
3. Savada, A. M. ed. (1994). Laos: A Country Study. Washington: GPO for the US Library of Congress, 1994.
4. Electricite du Laos (EDL) (2018). Electricity statistics 2017. Available from http://edl.com.la/ckfinder/userfiles/files/Statistic/Statistic%20Report%202017_n_JP.pdf
5. Ministry of Energy and Mines (MEM) (2017). National Energy Data Lao PDR. Presentation, 21-23 November 2017, Kuala Lumpur. Available from https://unstats.un.org/unsd/energy/meetings/2017a/5.2meml.pdf
6. Reuters (2014). Interview-Laos’ hydropower capacity to jump almost four-fold by 2020. Available from https://uk.reuters.com/article/laos-energy-minister/interview-laos-hydropower-generation-capacity-to-jump-almost-four-fold-by-2020-idUKL4N0SL0EG20141028
7. Xialei, C., Singh, P. R., Xianlai, W., and Kremere, E., eds. (2016). World Small Hydropower Development Report 2016. United Nations Industrial Development Organization; International Center on Small Hydro Power. Available from www.smallhydroworld.org.
8. Vongchanh, K. (2009). The Need for Sustainable Renewable Energy in Lao PDR. Available from http://www.seeforum.net/countryreport/laopdr.html
9. Nanthavong, K. (2015). Electricity pricing in the residential sector of Lao PDR. Available from http://www.meconproject.com/wp-content/uploads/report/[Task%206-Electricity%20pricing%20in%20the%20residential%20sector]%20Lao%20PDR%20country%20report.pdf.
10. Ministry of Energy and Mines (MEM) (2017). Internal data11. LIU, H., Masera, D. and Esser, L., eds. (2013). World Small
Hydropower Development Report 2013. United Nations Industrial Development Organization; International Center on Small Hydro Power. Available from www.smallhydroworld.org
12. Mottet, E. and Lasserre, F. (2014). Géopolitique des aménagements hydroélectriques des affluents du Mékong en RDP Lao: développement et intégration régionale. Canadian Journal of Development Studies, 35(4). DOI: 10.1080/02255189.2014.966807
13. Asian Development Bank, Independent Evaluation Department (2010). Energy Sector in the Lao People’s Democratic Republic. Available from http://www.oecd.org/countries/laopeoplesdemocraticrepublic/47180387.pdf
14. Vongsay, A. (2013). Energy Sector Development in Lao PDR. Available from http://eneken.ieej.or.jp/data/5021.pdf
15. Lao PDR, Water and Water Resources Law No. 106 of 2 November 1996. Available from faolex.fao.org
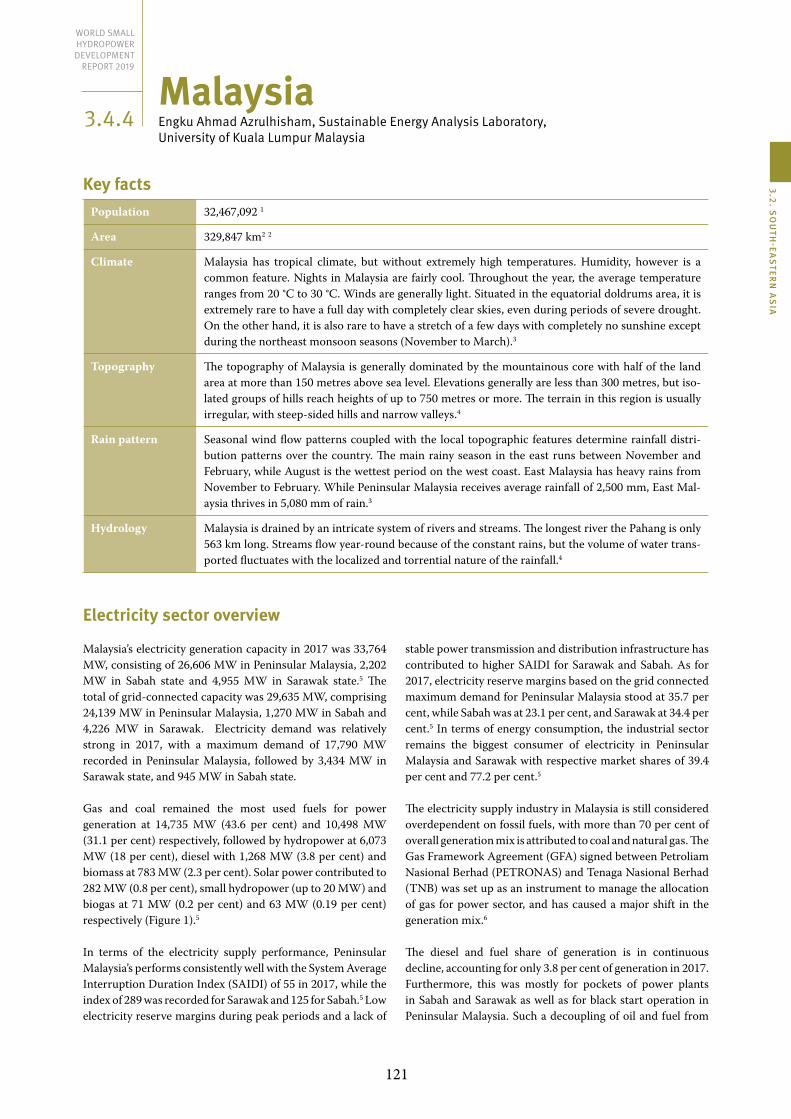
121
3.2. So
uth
-EaS
tErn
aS
ia
Malaysia Engku ahmad azrulhisham, Sustainable Energy analysis laboratory, University of Kuala lumpur malaysia
Key factsPopulation 32,467,092 1
Area 329,847 km2 2
Climate Malaysia has tropical climate, but without extremely high temperatures. Humidity, however is a common feature. Nights in Malaysia are fairly cool. Throughout the year, the average temperature ranges from 20 °C to 30 °C. Winds are generally light. Situated in the equatorial doldrums area, it is extremely rare to have a full day with completely clear skies, even during periods of severe drought. On the other hand, it is also rare to have a stretch of a few days with completely no sunshine except during the northeast monsoon seasons (November to March).3
Topography The topography of Malaysia is generally dominated by the mountainous core with half of the land area at more than 150 metres above sea level. Elevations generally are less than 300 metres, but iso-lated groups of hills reach heights of up to 750 metres or more. The terrain in this region is usually irregular, with steep-sided hills and narrow valleys.4
Rain pattern Seasonal wind flow patterns coupled with the local topographic features determine rainfall distri-bution patterns over the country. The main rainy season in the east runs between November and February, while August is the wettest period on the west coast. East Malaysia has heavy rains from November to February. While Peninsular Malaysia receives average rainfall of 2,500 mm, East Mal-aysia thrives in 5,080 mm of rain.3
Hydrology Malaysia is drained by an intricate system of rivers and streams. The longest river the Pahang is only 563 km long. Streams flow year-round because of the constant rains, but the volume of water trans-ported fluctuates with the localized and torrential nature of the rainfall.4
Electricity sector overview
Malaysia’s electricity generation capacity in 2017 was 33,764 MW, consisting of 26,606 MW in Peninsular Malaysia, 2,202 MW in Sabah state and 4,955 MW in Sarawak state.5 The total of grid-connected capacity was 29,635 MW, comprising 24,139 MW in Peninsular Malaysia, 1,270 MW in Sabah and 4,226 MW in Sarawak. Electricity demand was relatively strong in 2017, with a maximum demand of 17,790 MW recorded in Peninsular Malaysia, followed by 3,434 MW in Sarawak state, and 945 MW in Sabah state.
Gas and coal remained the most used fuels for power generation at 14,735 MW (43.6 per cent) and 10,498 MW (31.1 per cent) respectively, followed by hydropower at 6,073 MW (18 per cent), diesel with 1,268 MW (3.8 per cent) and biomass at 783 MW (2.3 per cent). Solar power contributed to 282 MW (0.8 per cent), small hydropower (up to 20 MW) and biogas at 71 MW (0.2 per cent) and 63 MW (0.19 per cent) respectively (Figure 1).5
In terms of the electricity supply performance, Peninsular Malaysia’s performs consistently well with the System Average Interruption Duration Index (SAIDI) of 55 in 2017, while the index of 289 was recorded for Sarawak and 125 for Sabah.5 Low electricity reserve margins during peak periods and a lack of
stable power transmission and distribution infrastructure has contributed to higher SAIDI for Sarawak and Sabah. As for 2017, electricity reserve margins based on the grid connected maximum demand for Peninsular Malaysia stood at 35.7 per cent, while Sabah was at 23.1 per cent, and Sarawak at 34.4 per cent.5 In terms of energy consumption, the industrial sector remains the biggest consumer of electricity in Peninsular Malaysia and Sarawak with respective market shares of 39.4 per cent and 77.2 per cent.5
The electricity supply industry in Malaysia is still considered overdependent on fossil fuels, with more than 70 per cent of overall generation mix is attributed to coal and natural gas. The Gas Framework Agreement (GFA) signed between Petroliam Nasional Berhad (PETRONAS) and Tenaga Nasional Berhad (TNB) was set up as an instrument to manage the allocation of gas for power sector, and has caused a major shift in the generation mix.6
The diesel and fuel share of generation is in continuous decline, accounting for only 3.8 per cent of generation in 2017. Furthermore, this was mostly for pockets of power plants in Sabah and Sarawak as well as for black start operation in Peninsular Malaysia. Such a decoupling of oil and fuel from
3.4.4
World Small HydropoWEr dEvElopmEnt
rEport 2019

122
World Small HydropoWer development report 2019
the generation mix was clearly in line with governmental strategy in its emphasis on the use of non-oil indigenous energy sources in the power sector.7
Figure 1. Installed electricity capacity by source in Malaysia (MW)
Gas
Coal
Largehydropower
Diesel
Biomass
Solar power
Smallhydropower
Biogas
14,735
10,489
6,073
1,268
783
282
71
63
Source: The Ministry of Energy, Green Technology and Water Malaysia5
Note: Data from January 2018.
Generation from renewable energy (RE) sources accounted for close to 21.5 per cent of total energy generation in 2017. Large and small hydropower contributed 18.2 per cent of this, whilst the remaining 3.3 per cent came from non-hydropower renewables.5
In the medium-term, the use of coal-fired power plants is expected to continue. Coal is mainly utilized as a more economically attractive source and for base load to ensure the electricity prices are affordable without compromising security aspects. Coal’s prominence in Malaysia’s energy mix is poised to continue, as an additional 5,000 MW of coal-fired capacity will be commissioned in 2015-2019 period.7 Coal-fired generation represents 31.1 per cent of the electricity produced in 2017.5 Nevertheless, for coal-fired power plants that are earmarked to come in the period covered by the Eleventh Malaysia Plan (RMK-11, 2016-2020), the Government has indicated that new advanced, more environmentally-friendly thermal power generation is required.7 As a result, efforts to improve the efficiency of new coal-fired power plants has been undertaken. For example, a 1,000 MW ultra-supercritical technology (USC) power generation project was commissioned in March 2017.6
RE resources in Malaysia are diverse and include large hydropower, solar power, biogas, biomass and small hydropower. Large hydropower has the largest capacity installed of these sources, with a total of 622 MW new power generation projects entering the grid system in 2017.5 Besides large hydropower, other RE sources also showed good progress, with the enforcement of the RE Act 2011 and the establishment of the Sustainable Energy Development Authority (SEDA) paving the way for the implementation of a feed-in tariff (FIT) mechanism in Malaysia in 2011. FIT tariffs will be discussed further in the following sections. As of February 2017, SEDA has approved in total 11,650 FIT
applications, with a cumulative RE capacity of 1,403.19 MW.8 As of October 2017, a cumulative installed RE capacity of 522.92 MW has achieved commercial operation under the FIT mechanism.8
Such gradual expansion of RE is ideal, but with improved technologies and greater efficiency a bigger take-off could be anticipated. A Large Scale Solar (LSS) bidding exercise for the year 2017-2018 was implemented in March 2017, in which a total large scale solar capacity of 434 MW in Peninsular Ma-laysia and 16.9 MW in Sabah was expected to be commissi-oned in 2017 and 2018.6 Initiatives to harvest energy from the sun, with the installation of 200 MW per year under the LSS programme, will integrate solar into the grid system, with a share of 0.14 per cent anticipated during its first year in 2017 and an increase up to 0.5 per cent expected by the year 2020.8
Small hydropower sector overview
In Malaysia, the definition of a small hydropower plant varies, but a generating capacity of 1 MW to 20 MW is generally accepted, which aligns to the concept of distributed generation. However, the definition of small hydropower even may be stretched for plants up to 50 MW. Small hydropower can be further subdivided into mini-hydropower, usually defined as 100 kW to 1,000 kW, and micro-hydropower, which is between 5 kW and 100 kW.9 As of 2018, the installed capacity of SHP plants up to 10 MW was 39.5 MW,17 which has more than doubled compared to the data reported in the WSHPDR 2016. The potential for SHP up to 10 MW is unknown (Figure 2).
Figure 2. Small hydropower capacities 2013/2016/2019 in Malaysia (MW)
0 100 200 300 400 500
PotentialCapacity
Installed Capacity
N/A 500.0 116.6
39.5 18.3 16.0
WSHPDR 2019WSHPDR 2016WSHPDR 2013
Source: WSHPDR 2013,15 WSHPDR 2016,16 SEDA17
Note: The comparison is between data from WSHPDR 2013, WSHPDR 2016 and WSHPDR 2019.
As of 2018, small hydropower of up to 20 MW had an installed capacity of 71 MW and SHP of up to 30 MW had an installed capacity of 113 MW, while the potential capacity set by Malaysia’s renewable energy development plan was 490 MW for SHP up to 30 MW (Figure 2).7 As of December 2016, 30.3 MW of SHP installed capacity was under the FIT mechanism, as not all SHP plants fall within the category. These consisted of 23.8 MW in four sites located in Peninsular Malaysia and 6.5 MW in two locations in Sabah.8, 18, 19
Hydropower as an RE source is suitable in Malaysia because of the country’s high annual rainfall. If these projects are
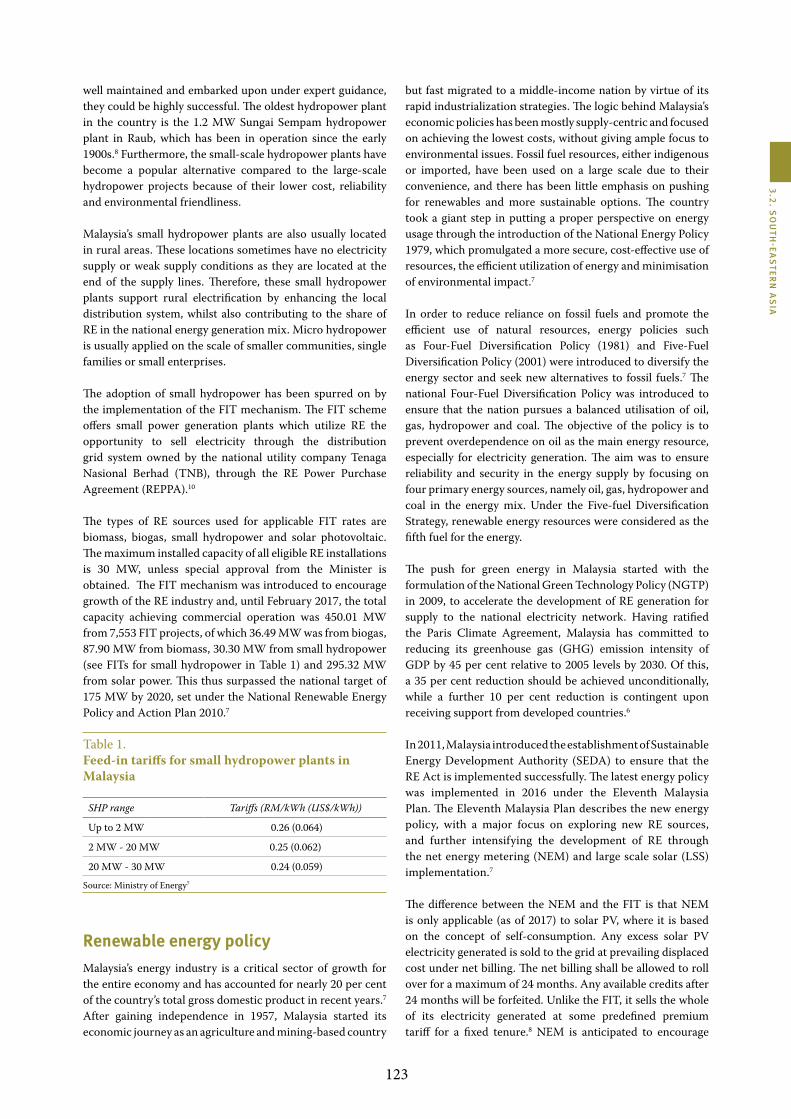
123
3.2. So
uth
-EaS
tErn
aS
ia
well maintained and embarked upon under expert guidance, they could be highly successful. The oldest hydropower plant in the country is the 1.2 MW Sungai Sempam hydropower plant in Raub, which has been in operation since the early 1900s.8 Furthermore, the small-scale hydropower plants have become a popular alternative compared to the large-scale hydropower projects because of their lower cost, reliability and environmental friendliness.
Malaysia’s small hydropower plants are also usually located in rural areas. These locations sometimes have no electricity supply or weak supply conditions as they are located at the end of the supply lines. Therefore, these small hydropower plants support rural electrification by enhancing the local distribution system, whilst also contributing to the share of RE in the national energy generation mix. Micro hydropower is usually applied on the scale of smaller communities, single families or small enterprises.
The adoption of small hydropower has been spurred on by the implementation of the FIT mechanism. The FIT scheme offers small power generation plants which utilize RE the opportunity to sell electricity through the distribution grid system owned by the national utility company Tenaga Nasional Berhad (TNB), through the RE Power Purchase Agreement (REPPA).10
The types of RE sources used for applicable FIT rates are biomass, biogas, small hydropower and solar photovoltaic. The maximum installed capacity of all eligible RE installations is 30 MW, unless special approval from the Minister is obtained. The FIT mechanism was introduced to encourage growth of the RE industry and, until February 2017, the total capacity achieving commercial operation was 450.01 MW from 7,553 FIT projects, of which 36.49 MW was from biogas, 87.90 MW from biomass, 30.30 MW from small hydropower (see FITs for small hydropower in Table 1) and 295.32 MW from solar power. This thus surpassed the national target of 175 MW by 2020, set under the National Renewable Energy Policy and Action Plan 2010.7
Table 1.Feed-in tariffs for small hydropower plants in Malaysia
SHP range Tariffs (RM/kWh (US$/kWh))
Up to 2 MW 0.26 (0.064)
2 MW - 20 MW 0.25 (0.062)
20 MW - 30 MW 0.24 (0.059) Source: Ministry of Energy7
Renewable energy policyMalaysia’s energy industry is a critical sector of growth for the entire economy and has accounted for nearly 20 per cent of the country’s total gross domestic product in recent years.7 After gaining independence in 1957, Malaysia started its economic journey as an agriculture and mining-based country
but fast migrated to a middle‐income nation by virtue of its rapid industrialization strategies. The logic behind Malaysia’s economic policies has been mostly supply-centric and focused on achieving the lowest costs, without giving ample focus to environmental issues. Fossil fuel resources, either indigenous or imported, have been used on a large scale due to their convenience, and there has been little emphasis on pushing for renewables and more sustainable options. The country took a giant step in putting a proper perspective on energy usage through the introduction of the National Energy Policy 1979, which promulgated a more secure, cost-effective use of resources, the efficient utilization of energy and minimisation of environmental impact.7
In order to reduce reliance on fossil fuels and promote the efficient use of natural resources, energy policies such as Four-Fuel Diversification Policy (1981) and Five-Fuel Diversification Policy (2001) were introduced to diversify the energy sector and seek new alternatives to fossil fuels.7 The national Four-Fuel Diversification Policy was introduced to ensure that the nation pursues a balanced utilisation of oil, gas, hydropower and coal. The objective of the policy is to prevent overdependence on oil as the main energy resource, especially for electricity generation. The aim was to ensure reliability and security in the energy supply by focusing on four primary energy sources, namely oil, gas, hydropower and coal in the energy mix. Under the Five-fuel Diversification Strategy, renewable energy resources were considered as the fifth fuel for the energy.
The push for green energy in Malaysia started with the formulation of the National Green Technology Policy (NGTP) in 2009, to accelerate the development of RE generation for supply to the national electricity network. Having ratified the Paris Climate Agreement, Malaysia has committed to reducing its greenhouse gas (GHG) emission intensity of GDP by 45 per cent relative to 2005 levels by 2030. Of this, a 35 per cent reduction should be achieved unconditionally, while a further 10 per cent reduction is contingent upon receiving support from developed countries.6
In 2011, Malaysia introduced the establishment of Sustainable Energy Development Authority (SEDA) to ensure that the RE Act is implemented successfully. The latest energy policy was implemented in 2016 under the Eleventh Malaysia Plan. The Eleventh Malaysia Plan describes the new energy policy, with a major focus on exploring new RE sources, and further intensifying the development of RE through the net energy metering (NEM) and large scale solar (LSS) implementation.7
The difference between the NEM and the FIT is that NEM is only applicable (as of 2017) to solar PV, where it is based on the concept of self-consumption. Any excess solar PV electricity generated is sold to the grid at prevailing displaced cost under net billing. The net billing shall be allowed to roll over for a maximum of 24 months. Any available credits after 24 months will be forfeited. Unlike the FIT, it sells the whole of its electricity generated at some predefined premium tariff for a fixed tenure.8 NEM is anticipated to encourage

124
manufacturing facilities and the public to generate electricity. This will further assist the Government’s effort to increase the contribution of RE in the generation mix.
Barriers to small hydropower developmentDespite the many initiatives introduced under the National Green Technology Policy (NGTP), there has been little consideration made in relation to what can actually incite private companies to invest in RE technologies in general. On top of that, the FIT system remains largely unbalanced as it is dominated by solar PV.10
Malaysia also appears to be facing a number of specific chal-lenges in developing small hydropower, including:• Heavy rainfall causing flooding and overflow hence
reducing the generation;• A lack of cutting-edge technology leading to inefficient
filter design to filter out sand, debris and dirt before it enters the turbine;
• Complicated regulatory requirements in terms of land acquisition and environmental impact assessments;
• The risk of water pollution, soil erosion and increased sediment load of the river during construction works resulting from land clearing activities;
• Absence of knowledge and skill among the professionals and technicians.13
Although hydropower technology is highly developed, sustained and more innovative, research is always needed. Research on siltation, such as how to solve rivers’ serious sedimentation problems, should be carried out. Other important aspects, such as the effects of small hydropower system on rivers, underground tunnels and discharge, also still need to be researched in Malaysia.
References
1. Department of Statistics Malaysia (2017). Population. Available from: www.dosm.gov.my (accessed July 5, 2018)
2. Central Intelligence Agency (2014). Malaysia. Available from: https://www.cia.gov/library/publications/resources/the-world-factbook/geos/my.html (accessed July 5, 2018)
3. World Weather and Climate Information (2016). Malaysia. Available from: https://weather-and-climate.com/average-monthly-Rainfall-Temperature-Sunshine-in-Malaysia (accessed July 5, 2018)
4. Encyclopaedia Britannica (2018). Malaysia Facts, Geography, History and Points of Interest. Available from: https://www.britannica.com/place/Malaysia (accessed July 5, 2018)
5. The Ministry of Energy, Green Technology and Water Malaysia (2018). Data Pocket Book (Energy). Available from: www.kettha.gov.my (accessed July 5, 2018)
6. Energy Commission Malaysia (2017). Peninsular Malaysia Electricity Supply Industry Outlook 2017. Available from: http://www.st.gov.my/en/contents/publications/outlook/Peninsular%20Malaysia%20Electricity%20Supply%20Outlook%202017.pdf
(accessed July 5, 2018)7. The Ministry of Energy, Green Technology and Water Malaysia
(2016). Green Technology Master Plan Malaysia 2017-2030. Available from: www.kettha.gov.my (accessed July 5, 2018)
8. Sustainable Energy Development Authority Malaysia (2017). Sustainable Energy Malaysia vol. 1 issue 1. Available from: www.seda.gov.my (accessed July 5, 2018)
9. TNB Energy Services (2018). What is Mini/Micro Hydro Power Plant? Available from: http://tnbes.com.my/minimicro-hydro-power-plant/ (accessed July 5, 2018)
10. N. Mat Husin and B. Alrazi (2017). Renewable Energy Investment in Malaysia: An Integrated Model in Evaluating Public Decision-Making Process. https://pdfs.semanticscholar.org/7ae1/d28d5cd2ec522d72ef4480ec364efbf7cf4d.pdf (accessed July 5, 2018)
11. SEDA (n.d.). Sustainable Energy Development Authority of Malaysia. Available from: www.seda.gov.my (accessed July 5, 2018)
12. Martin Anyi et al. (2010). Remote Community Electrification in Sarawak, Malaysia. Available from: http://www.sciencedirect.com/science/article/pii/S0960148110000091 (accessed July 5, 2018)
13. The World Small Hydropower Development Report 2016. United Nations Industrial Development Organization, Vienna; International Center on Small Hydro Power, Hangzhou. Available from www.smallhydroworld.org
14. SEDA (2016). FiT Dashboard. http://www.seda.gov.my/ (accessed July 5, 2018)
15. LIU, H., Masera, D. and Esser, L., eds. (2013). World Small Hydropower Development Report 2013.United Nations Industrial Development Organization; International Center on Small Hydro Power. Available from www.smallhydroworld.org.
16. Xialei, C., Singh, P. R., Xianlai, W., and Kremere, E., eds. (2016). World Small Hydropower Development Report 2016. United Nations Industrial Development Organization; International Center on Small Hydro Power. Available from www.smallhydroworld.org. (accessed April 16, 2018)
17. SEDA (2018). RE capacities. http://www.seda.gov.my/ (accessed July 24, 2018)
18. Energy Commission Malaysia (MEIH) (n.d.).IPP SHP station http://meih.st.gov.my/ (accessed July 24, 2018)
19. SEDA (2018). RE installed capacities. Available from http://www.seda.gov.my/?omaneg=00010100000001010101000100001000000000000000000000&s=538 (accessed July 24, 2018)

125
3.2. So
uth
-EaS
tErn
aS
ia
Myanmarthet myo and Sandar myo, UnIdo myanmar
Key factsPopulation 53,370,6101
Area 676,577.2 km2
Climate The climate has tropical-monsoon traits. Climatic conditions vary widely from place to place due to differing topographical situations. Myanmar has three seasons – the hot season from March to May, the wet season from June to October and the cool season from November to February. On average, temperatures in central Myanmar during the hot season can reach highs of over 40 °C, with highs of less than 30 °C in the north.2
Topography Myanmar’s topography can be divided mainly into four parts – the eastern highland region, the central valley region, the western hills region and the south western costal region. The eastern highland region is the Shan Plateau, which reaches from 900 to 1,200 metres high. The central valley region consists of the broadest valley of the Ayeyawady. The western hills region is an extension of the Himalayan range and is known as the Anout Yoma (western range). Khakabo Razi mountain is a part of Anout Yoma andis 5,881 metres high. The south western coastal region, consisting of the Rakhine, Ayeyawady and Taninthayi regions, is 1930 km long.2,3
Rain pattern The rainfall varies widely from season to season and region to region. Annual rainfall is influenced by both the South Asian and East Asian monsoons. Average annual rainfall nationally is estimated at 2,000 mm, whilst the annual average in the south western coastal region (Raknine coast) is 3,200 mm and in the eastern highland region is 1,400 mm.2,3
Hydrology Myanmar has a more or less favourable situation with respect to water resources. There are only a few transboundary rivers and virtually all water resources are within the national borders. The Ayeyawady river is the longest (2,063 km) and flows from north to south through the country. The other major rivers are Thanlwin river (1,660 km), Chindwin river (1,151 km) and Sittaung river (310 km). Moreover, there are nearly 200 large-scale dams across the country.2,3
Electricity sector overview
Myanmar has abundant sources for energy, particularly hydropower and natural gas. The demand for electricity in Myanmar has been increasing rapidly because of economic development in recent years. However, Myanmar’s domestic energy consumption is one of the lowest in the Association of South-East Asian Nations (ASEAN) region. Only 34 per cent of the total population had access to the electricity in 2016.4
The total electric power generation in 2016 was 17,867 GWh and the hydropower is the main source of electricity. Out of this total, 9,744 GWh (approximately 54.5 per cent) came from hydropower plants, 8,052 GWh (45 per cent) from natural gas power plants, 61 GWh (0.4 per cent) from diesel power plants and 10 GWh (under 0.1 per cent) from coal power plants (Figure 1).5
The total installed electricity capacity of Myanmar in 2016 was 5,389 MW, consisting of 60.4 per cent or 3,255 MW from hydropower plants, 35.6 per cent or 1,920 MW from natural gas power plants, 2.23 per cent or 120 MW from coal power plants, and 1.75 per cent or 94 MW from diesel power plants (Figure 2).5 New and renewable energy sources such biomass power, solar photovoltaic power, geothermal and wind power
are not much developed in the country and their capacity is negligible.
Figure 1. Annual electricity generation by source in Myanmar (GWh)
Hydropower
Natural gas
Diesel
Coal
9,744
8,052
61
10
Source: Ministry of Electricity and Energy5
The new Government assumed power in Myanmar in April 2016, and restructured its organizations in order to strengt-hen the coordination and cooperation between the minis-tries. This included the merging of the Ministry of Electric Power and Ministry of Energy into the one ministry, namely Ministry of Electricity and Energy (MOEE), which is respon-sible for the electricity, oil and gas sectors of the country.
3.4.5
World Small HydropoWEr dEvElopmEnt
rEport 2019

126
World Small HydropoWer development report 2019
Figure 2. Installed electricity capacity by source in Myanmar (MW)
Hydropower
Natural gas
Coal
Diesel
3,255
1,920
120
94
Source: Ministry of Electricity and Energy5
According to the MOEE, the electrification rate of Myanmar was only 34 per cent in 2016. This implies that around 34 million people remain without access to electricity. The highest electrification rate is in Yangon, at approximately 78 per cent, followed by Kayar at 46 per cent, Mandalay at 40 per cent, and Nay Pyi Taw at 39 per cent respectively. Rates of electrification in the remaining rural areas are much lower, and average less than 20 per cent.5,6
Figure 3. Electrification rate in Myanmar (%)
Rural 20%Total 34%
Source: Ministry of Electricity and Energy,5 ADB6
Since the previous Government had endeavoured to electrify the country, the National Electrification Plan (NEP) was approved in 2014 and aims to achieve electrification rate of 47 per cent by 2020, 76 per cent by 2025 and 100 per cent by 2030 respectively.7 As part of this initiative, the Government formulated Myanmar National Electrification Project (NEP) in September 2015, a plan which aims to achieve electricity supply to every household in Myanmar through the establishment of a nationwide power distribution grid, with the funding from the World Bank.
Although the total installed electricity capacity is approximately 5,400 MW, the available capacity is approximately 50 per cent of the total installed capacity, at around 3,000 MW. According to projections for the next two years, it will need to reach at least 6,000 MW. Therefore the country aims to generate additional 3,000 MW within the next two years. MOEE has planned to utilize liquefied natural gas (LNG) to generate power and meet the target. Currently two LNG-powered plants have been developed and those plants will generate an additional 1,230 MW and 1,390 MW.8
In addition, new plants, renewable and non-renewable, have been scheduled to generate additional power over the
next three years. In 2018-2019, 4 MW from the Yarzagyo hydropower plant, 40 MW from the Minbu solar power plant, 118.9 MW from the Thaton natural gas power plant, 106 MW from the Thaketa natural gas power plant and 225 MW from the Myingyan natural gas power plant will be fed into the national grid. Another ten power projects will be completed at various stages during the period from 2019-2020 to 2021-2022, to generate an additional 3,117 MW of power.
The new projects comprise natural gas and hydropower across the country namely, Kengtawng, Upper Yeywa, Kyaukphyu, Kanbauk, Ywama, Patolon, Myanaung, Thilawa, and Mee Luang Chiang. Various other state owned and privately owned power plant projects have been under development in recent years.9 Furthermore, the Myanmar Government is also negotiating the purchase of electricity from neighbouring countries such as Lao PDR. In January 2018, the two countries agreed that Myanmar would purchase about 100-200 MW of power from Lao PDR, subject to the results of a feasibility study.9
Retail tariffs are set at 0.026 - 0.037 US$/kWh for households and 0.056 - 0.11 US$/kWh for industry, depending on consumption level. These were raised in April 2014 by an average of 40 per cent from the previous tariff. However, this is still lower than the actual cost of supply and one of the lowest tariffs in ASEAN. The Government subsidizes the cost of electricity and was estimated to subsidize US$ 284 million (MMK 378 billion) in the 2017-2018 financial year.10
Small hydropower sector overview
There is no specific definition for small hydropower in Myanmar. However, SHP could be considered as plants less than 10 MW, according to the Myanmar Electricity Law. In this category, there is a total of 32 SHP plants (off-grid) currently operated by MOEE and the total installed capacity is 33.1 MW. In 2017, the Ministry of Electricity and Energy stated that 210 mini-hydropower and SHP sites (< 10 MW), with the total potential installed capacity of 231 MW, have been identified across the country.15 By combining the lists from the Department of Rural Development, the Department of Research and Innovation and the Department of Irrigation and Water Utilization, the total number of SHP plants operating in Myanmar is approximately 300, with a total installed capacity of nearly 3.3 MW. However there are also several SHP plants that have been developed by local private developers and are not registered or listed by any agencies and government departments. According to the 2017 data of Renewable Energy Association of Myanmar (REAM) and Small Hydropower Association of Myanmar (SHPAM), over 2,000 small hydropower plants ranging from 5 kW to 3 MW have been developed by individuals. These SHP plants are mostly in Shan State, Kachin State and Chin State and providing nearly 50 per cent of electricity for lighting in some townships in Shan State and Kachin State.12

127
3.2. So
uth
-EaS
tErn
aS
ia
Figure 4. Small hydropower capacities 2013/2016/2019 in Myanmar (MW)
0 50 100 150 200 250
PotentialCapacity
Installed Capacity
231.0 196.7 167.4
36.4 34.2 36.0
WSHPDR 2019WSHPDR 2016WSHPDR 2013
Source: SSDKN,12 WSHPDR 2013,13 WSHPDR 201614
Note: The comparison is between data from WSHPDR 2013, WSHPDR 2016 and WSHPDR 2019.
As mentioned above, Myanmar has abundant sources of hydropower, which thus accounts for over 50 per cent of total installed capacity in the country. Nevertheless, there are limited policies and legislation concerning the hydropower sector, including small hydropower (SHP) as of yet. Although the Myanmar Electricity Law was adopted in 2014 to replace the previous Electricity Law from 1984, there is no specific bylaw or regulation for hydropower.
Given the increase in the demand for electricity in the country, there is a need to develop a revised framework for hydropower development. Table 1 explains the responsibilities of various Ministries in Myanmar regarding the development of policies and legislation in the energy sector.11
Table 1.Responsibilities of Myanmar Ministries in the energy sector
Ministry Responsibility
Ministry of Electricity and Energy
Hydropower (>1 MW), thermal power plants, electricity transmis-sion and distribution, oil and gas.
Ministry of Agriculture, Livestock and Irrigation
Biofuels and mini, micro and small hydropower (<1 MW)
Rural electrification by renewable energy sources
Ministry of Education Research and development of renewable energy technologies
Ministry of Natural Re-sources and Environmental Conservation
Biomass energy environmental and climate change issues, Coal
extraction Source: Eurocham11
Several hundreds of SHP plants could be developed in rural areas in Myanmar, providing that there are available water resources and that electricity is required. However, there is no financing mechanism for SHP development, such as bank loans and other funding sources. Until now almost no foreign investors or developers of SHP plants in Myanmar were able to easily implement such projects. For the development of SHP plants, initiative from the Government, local and foreign investment and attractive business plans would be needed. The sustainability of SHP plants is also a very crucial issue.
Renewable energy policy
There are limited policies and legislation concerning the renewable energy sector, including hydropower, in Myanmar. The National Energy Policy was promulgated in 2014 and included sector restructuring, investment planning, a pricing and fuel subsidy review, renewable energy and energy efficiency development, the promotion of the private sector and international investment, and a national electrification plan. According to the action plan enclosed in the National Energy Policy, programs utilizing renewable energy resources such as wind, solar, hydropower, geothermal and bioenergy will be implemented to ensure sustainable energy development in Myanmar. A feed-in tariff scheme for renewable energy has been implemented in Myanmar. It is valid for a period of 20 years. The Government of Myanmar proposes a uniform tariff of 0.156 US$/kWh to further encourage planning of renewable energy projects. The Government decides whether variations in feed-in tariffs are offered, depending on the size of the generators and type of technology.16
Although there is no specific policy for renewable energy in Myanmar, the data collected in the 2014 population and housing census provided critical information to guide the design of a policy for renewable energy in Myanmar.12 The findings and data collected underlined the needs for different approaches in urban and rural area. Particularly in many remote rural areas, providing access to the national grid will represent a lengthy process. A strong focus on decentralized energy solutions such as small hydropower and solar power are therefore suggested as most appropriate in these areas. The renewable energy policy should promote SHP in areas with suitable resources as well as upgrades to existing small hydropower plants in Myanmar.
Barriers to small hydropower developmentMyanmar has abundant sources of hydropower. The Government has made considerable efforts to ensure effective development of the renewable energy sector by collaborating with international communities, including foreign countries, United Nations agencies and international non-governmental organizations (NGOs). However, small hydropower has not been developing well so far and there are still a lot of challenges to overcome: • Lack of governmental policies related to the development
of the SHP sector;• Limited financial resources and a lack of green funding
schemes in the banking system;• Difficulty in developing community-based business
schemes due to the low-income levels in rural areas;• Long and complicated procedures to acquire endorsement
and approval from the Union Government and from local/regional governments;
• Unclear regulatory procedure for connecting SHP plants to the grid;
128
• Limited technical knowledge, skills and operational experience;
• Insufficient technical data on topography, annual rainfall, dissipation of water resources and potential area.6,12
References
1. World Bank (2017). Population, total. United Nations Population Division. World Population Prospects. 2017 Revision. Available from https://data.worldbank.org/indicator/SP.POP.TOTL
2. World Wildlife Fund (n.d.). Assessing Climate Risk in Myanmar: Technical Report. WWF Website. Available from https://www.worldwildlife.org/publications/assesasse-climate-risk-in-myanmar-technical-report (accessed February 18, 2018)
3. Myanmar Online Data Information Network Solutions (2002). Facts about Myanmar, MODiNS Website. Available from http://www.modins.net/myanmarinfo/facts/land.htm (accessed February 12, 2018)
4. Thet Myo, Kyaw Kyaw and Sandar Myo (2016). The Potential of Micro Hydropower for the Rural Electrification of Myanmar. International Conference on Science and Engineering. Yangon. Myanmar (ICSE 2016)
5. Ministry of Electricity and Energy Myanmar (2017). Power Development Opportunities in Myanmar. Myanmar Investment Forum 2017. Presenter: Maung Maung Kyaw Presentation available from http://docplayer.net/54205994-Power-development-opportunities-in-myanmar.html
6. Asian Development Bank (ADB) (2016). Myanmar Energy Sector Assessment, Strategy, and Roadmap. December 2016. Available from https://www.adb.org/documents/myanmar-energy-assessment-strategy-road-map
7. Tint Lwin Oo (2017). The Role of Renewable Energy in Myanmar’s Future Energy Mix. Ministry of Electricity and Energy. Myanmar Investment Forum 2017
8. Myanmar Times (2018). Thaketa gas plant commences supplying power in Yangon, Myanmar Times Web. Available from https://www.mmtimes.com/news/thaketa-gas-plant-commences-supplying-power-yangon.html (accessed February 18, 2018)
9. Ministry of Electricity and Energy (2018). News, MOEE Web. Available from http://www.moee.gov.mm/en/(accessed February 20, 2018)
10. Myanmar Times (2018). Government currently subsidizing electricity bill. Myanmar Times Web. Available from https://www.mmtimes.com/business/25318-government-currently-subsidising-electricity-bill.html (accessed February 18, 2018)
11. Eurocham Energy Guide (2018). Eurocham Myanmar Web. Available from https://www.eurocham-myanmar.org/publications (accessed March 25, 2018)
12. Spectrum Sustainable Development Knowledge Network (SSDKN) (2017). Developing a renewable energy policy for Myanmar: Insights from the 2014 census. October 2017. Available from https://themimu.info/sites/themimu.info/files/documents/Report_Energy_Briefing_Paper_Spectrum_Oct2017.pdf (accessed June 29, 2018)
13. LIU, H., Masera, D. and Esser, L., eds. (2013). World Small Hydropower Development Report 2013. United Nations Industrial Development Organization; International Center on Small Hydro Power. Available from www.smallhydroworld.org.
14. Xialei, C., Singh, P. R., Xianlai, W., and Kremere, E.,
eds. (2016). World Small Hydropower Development Report 2016. United Nations Industrial Development Organization; International Center on Small Hydro Power. Available from www.smallhydroworld.org.
15. Ministry of Electricity and Energy (2017). The Role of Renewable Energy in Myanmar’s Future Energy Mix. Presentation by Tint Lwin Oo: Deputy Director Hydro and Renewable Energy Planning Branch. Available from https://mm.boell.org/sites/default/files/uploads/2017/07/re12.7.pdf
16. Asian Development Bank Capacity Development Technical Assistance (ADB-CDTA) (2014). Myanmar Renewable Energy Policy. September 2014. Available from http://www.technosol.de/Down/1408MYA-RE_PolicyD.pdf
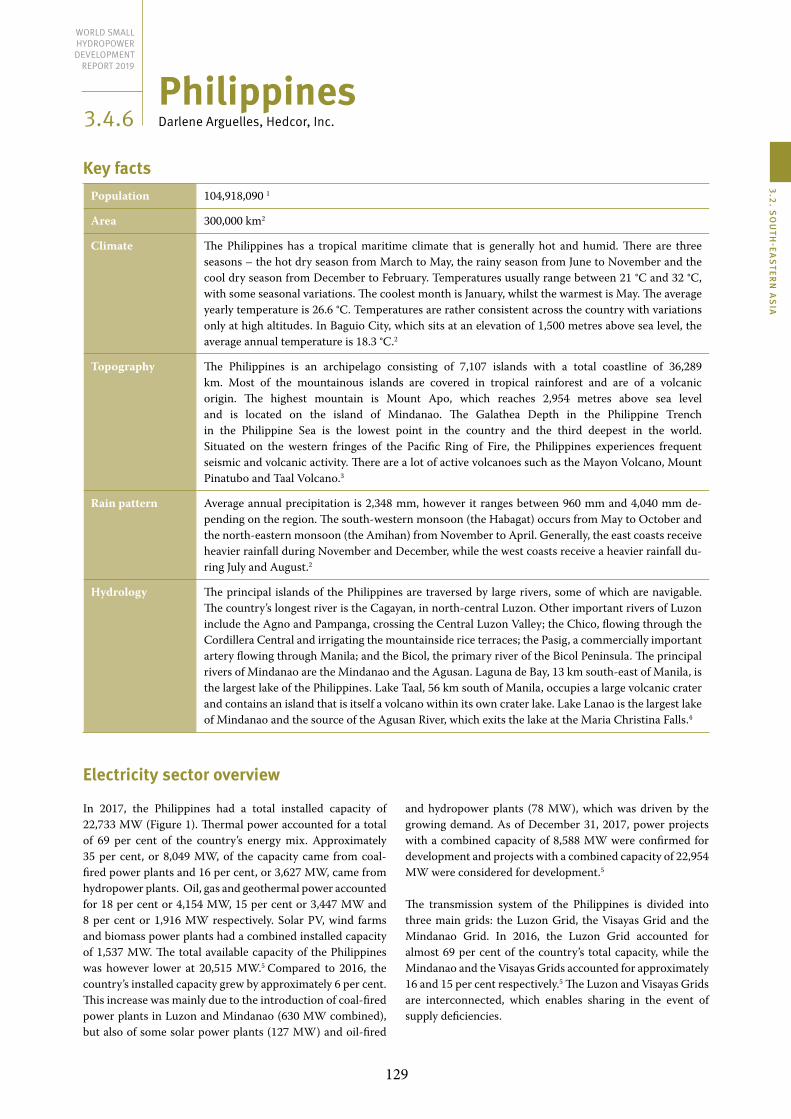
129
3.2. So
uth
-EaS
tErn
aS
ia
Philippinesdarlene arguelles, Hedcor, Inc.
Key factsPopulation 104,918,090 1
Area 300,000 km2
Climate The Philippines has a tropical maritime climate that is generally hot and humid. There are three seasons – the hot dry season from March to May, the rainy season from June to November and the cool dry season from December to February. Temperatures usually range between 21 °C and 32 °C, with some seasonal variations. The coolest month is January, whilst the warmest is May. The average yearly temperature is 26.6 °C. Temperatures are rather consistent across the country with variations only at high altitudes. In Baguio City, which sits at an elevation of 1,500 metres above sea level, the average annual temperature is 18.3 °C.2
Topography The Philippines is an archipelago consisting of 7,107 islands with a total coastline of 36,289 km. Most of the mountainous islands are covered in tropical rainforest and are of a volcanic origin. The highest mountain is Mount Apo, which reaches 2,954 metres above sea level and is located on the island of Mindanao. The Galathea Depth in the Philippine Trench in the Philippine Sea is the lowest point in the country and the third deepest in the world. Situated on the western fringes of the Pacific Ring of Fire, the Philippines experiences frequent seismic and volcanic activity. There are a lot of active volcanoes such as the Mayon Volcano, Mount Pinatubo and Taal Volcano.3
Rain pattern Average annual precipitation is 2,348 mm, however it ranges between 960 mm and 4,040 mm de-pending on the region. The south-western monsoon (the Habagat) occurs from May to October and the north-eastern monsoon (the Amihan) from November to April. Generally, the east coasts receive heavier rainfall during November and December, while the west coasts receive a heavier rainfall du-ring July and August.2
Hydrology The principal islands of the Philippines are traversed by large rivers, some of which are navigable. The country’s longest river is the Cagayan, in north-central Luzon. Other important rivers of Luzon include the Agno and Pampanga, crossing the Central Luzon Valley; the Chico, flowing through the Cordillera Central and irrigating the mountainside rice terraces; the Pasig, a commercially important artery flowing through Manila; and the Bicol, the primary river of the Bicol Peninsula. The principal rivers of Mindanao are the Mindanao and the Agusan. Laguna de Bay, 13 km south-east of Manila, is the largest lake of the Philippines. Lake Taal, 56 km south of Manila, occupies a large volcanic crater and contains an island that is itself a volcano within its own crater lake. Lake Lanao is the largest lake of Mindanao and the source of the Agusan River, which exits the lake at the Maria Christina Falls.4
Electricity sector overview
In 2017, the Philippines had a total installed capacity of 22,733 MW (Figure 1). Thermal power accounted for a total of 69 per cent of the country’s energy mix. Approximately 35 per cent, or 8,049 MW, of the capacity came from coal-fired power plants and 16 per cent, or 3,627 MW, came from hydropower plants. Oil, gas and geothermal power accounted for 18 per cent or 4,154 MW, 15 per cent or 3,447 MW and 8 per cent or 1,916 MW respectively. Solar PV, wind farms and biomass power plants had a combined installed capacity of 1,537 MW. The total available capacity of the Philippines was however lower at 20,515 MW.5 Compared to 2016, the country’s installed capacity grew by approximately 6 per cent. This increase was mainly due to the introduction of coal-fired power plants in Luzon and Mindanao (630 MW combined), but also of some solar power plants (127 MW) and oil-fired
and hydropower plants (78 MW), which was driven by the growing demand. As of December 31, 2017, power projects with a combined capacity of 8,588 MW were confirmed for development and projects with a combined capacity of 22,954 MW were considered for development.5
The transmission system of the Philippines is divided into three main grids: the Luzon Grid, the Visayas Grid and the Mindanao Grid. In 2016, the Luzon Grid accounted for almost 69 per cent of the country’s total capacity, while the Mindanao and the Visayas Grids accounted for approximately 16 and 15 per cent respectively.5 The Luzon and Visayas Grids are interconnected, which enables sharing in the event of supply deficiencies.
3.4.6
World Small HydropoWEr dEvElopmEnt
rEport 2019

130
World Small HydropoWer development report 2019
Figure 1. Installed electricity capacity by source in the Philippines (MW)
Coal
Oil
Hydropower
Natural gas
Geothermalpower
Solar power
Wind power
Biomass
8,049
4,154
3,627
3,447
1,916
886
427
224
Source: DOE5
Electricity generation in 2017 reached 94,370 GWh, of which thermal power accounted for 76 per cent and renewable energy sources for the remaining 24 per cent. Electricity consumption in 2017 stood at 94,370 GWh (Figure 2).5 In 2016, 91 per cent of the population of the Philippines had access to electricity. The urban electrification rate was 97 per cent and rural electrification rate was 86 per cent.6 The national electrification rate is planned to reach 100 per cent by 2020 through the Rural Electrification Programme of the Department of Energy, in coordination with the National Electrification Administration (NEA).
Figure 2. Electricity consumption by sector (%)
Residential 28%Industrial 27%Commercial 24%Own use 9%Losses 9%Other 3%
Source: DOE5
As one of the world’s fastest growing economies, having re-corded a GDP growth of 7 per cent in 2017, the Philippines is seeking to rapidly expand its power generating capacity while minimizing costs for consumers, particularly the rising ma-nufacturing industry.7 The country’s hydropower sector has experienced limited capacity growth in recent years, however there are significant projects currently under development. The combined capacity of hydropower projects confirmed for development as of the end of 2017 was 1,133.5 MW.5
The Government is juggling with the energy trilemma of balancing energy security, affordability and sustainability. Over the past 15 years it has introduced several initiatives including feed-in tariffs (FIT) to support the growth of
renewable energy sources. Nonetheless, the electricity mix remains dominated by fossil fuels. Furthermore, coal is expected to remain the major source for the foreseeable future with 12,550 MW confirmed to be added to the grid by 2021, as it is still considered to be the cheapest option in many provinces.5
The development of the country’s power sector up to 2040 is guided by the ‘Philippine Energy Plan’, which was published in 2017. The plan outlines that the country’s installed capacity will need to increase by some 40 GW to over 60 GW to meet the growing demand.8 The share of renewable energy sources is likely to remain more or less constant until 2040 (30-35 per cent) as the plan includes the goal to expand the installed capacity of renewable energy sources to at least 20,000 MW. Hydropower is expected to make up a significant share of this growth.
One of the examples of the recent hydropower development is the 8.5 MW run-of-river Maris Canal plant, which was developed by SN Aboitiz Power-Magat Inc. (SNAP-Magat), a joint venture of the locally based AboitizPower and the Norwegian SN Power AS, which was commissioned in 2017. Located in Ambatali village within the province of Isabella, the project took two years to complete and in addition to bolstering the grid will improve irrigation for the surrounding communities.9 AboitizPower is also set to commence operations on the 69 MW Manolo Fortich cascade project in 2018. Located in Bukidnon province, the project includes two run-of-river plants – 43.4 MW Manolo Fortich 1 and 25.4 MW Manolo Fortich 2.5
While much of the hydropower developed over the past decade has been relatively small-scale run-of-river projects aided by FITs, there are a number of large projects under development, including the 350 MW Alimit project. Situated in Ifugao province, it comprises three plants including a 240 MW pumped-storage facility.5 Another large project under development is the 500 MW Wawa pumped-storage project in Rizal province. In July 2017, the Philippine developer Olympia Violago Water & Power signed an agreement with PowerChina for the design, procurement and construction of the project. Expected to cost US$ 1 billion, it will greatly contribute to the country’s renewable energy ambitions with the commissioning planned for 2022.10
Finally, the Philippine Government is seeking Official Development Assistance (ODA) financing from China for the rehabilitation of the state-owned 983 MW Agus-Pulangi cascade project, which is currently operating at only 60 per cent of its capacity due to ageing infrastructure. The works would cost up to US$ 1 billion and once completed would extend the plant’s service life by an additional 30 years, and also increase its total capacity by an average of 10 per cent for each of its six powerhouses.11 The Government has also expressed a desire to privatize the project once the rehabilitation is completed.12
The development of the Philippine electricity sector began with the establishment of the National Power Corporation

131
3.2. So
uth
-EaS
tErn
aS
ia
(NPC) in 1936 to construct, operate and maintain facilities for the production and transmission of electricity. In 2001, the Electric Power Industry Reform Act (EPIRA) was enacted to privatize NPC assets and sign contracts with Independent Power Producers (IPPs) to encourage an influx of private investments into the sector. This enabled the separation of the generation and transmission functions in the electricity sector. Through the EPIRA, the Wholesale Electricity Spot Market (WESM) was established in Luzon and Visayas for energy trading, with generation tariffs being dictated by transparent and competitive market forces. The privatization of the electricity sector as well as the establishment of a spot market triggered improvements in the country’s electricity infrastructure paving the way for retail competition and open access.
The Energy Regulatory Commission (ERC) ensures the com-pliance of electricity sector participants with rules, resolu-tions and decisions. The ERC also decides on the electricity tariffs to be implemented between an electricity generation company and an electricity distribution utility through a bi-lateral supply contract. For renewable energy projects regis-tered through the Renewable Energy Law and connected to the grid, electricity tariffs termed as Feed-In Tariffs (FIT) are pre-determined and approved by the ERC. The FIT-All is a uniform charge billed to all on-grid electricity consumers to cover payments to renewable energy developers under the FIT system. As of the end of 2016, the Philippines had ones of the highest average electricity tariffs in south-eastern Asia – 5.84 PHP/kWh (0.11 US$/kWh) for industrial consumers, 7.49 PHP/kWh (0.14 US$/kWh) for commercial consumers, and 8.90 PHP/kWh (0.17 US$/kWh) for households.13
Small hydropower sector overview
Hydropower plants with an installed capacity of 10 MW or less are defined as mini-hydropower, whilst micro-hydropo-wer is defined as plants with a capacity between 1 kW and 100 kW.14 For the purposes of this report all hydropower up to 10 MW is defined as small.
In 2017, the Philippines had a total of 147 MW of small hy-dropower, while the potential was estimated at 2,021 MW.14,15 Compared to the results of the World Small Hydropower Development Report (WSHPDR) 2016, the installed capacity increased by more than 45 per cent, whereas the potential ca-pacity increased by 2 per cent (Figure 3).
As of the end of 2017, 89 small hydropower projects with a combined capacity of approximately 400 MW were confir-med for development, including 47 projects with a combined capacity of 201 MW in Luzon, 19 projects of 60 MW in Vi-sayas and 26 projects of 136 MW in Mindanao. These pro-jects are to be completed between 2018 and 2025 and vary in size from 0.5 MW to 10 MW. There are a further 13 potential projects with a combined capacity of approximately 80 MW, including 52 MW in Luzon and 28 MW in Mindanao.5
Figure 3. Small hydropower capacities 2013/2016/2019 in the Philippines (MW)
0 500 1000 1500 2000 2500
PotentialCapacity
Installed Capacity
2,021 1,975 1,876
147 101 248
WSHPDR 2019WSHPDR 2016WSHPDR 2013
Source: DOE,14 IRENA,15 WSHPDR 2016,16 WSHPDR 201317
Note: The comparison is between data from WSHPDR 2013, WSHPDR 2016 and WSHPDR 2019
The country’s total untapped hydropower potential is estima-ted at 13,097 MW, including 11,223 MW of large hydropower (above 10 MW), 1,847 MW of mini-hydropower (101 kW to 10 MW) and 27 MW of micro-hydropower.14
Renewable energy policy
In 2008, the Philippines passed Republic Act No. 9513, otherwise known as the Renewable Energy Law (RE Law). The law aims to accelerate the exploration and development of renewable energy resources to achieve energy self-reliance, and to reduce the country’s dependence on fossil fuels, thus minimizing exposure to price fluctuations in the international markets.
Through the RE Law, the National Renewable Energy Programme (NREP) was established in order to outline the country’s long-term path to developing its renewable energy potential. It set the aim of increasing the installed capacity of renewable energy sources to 15,304 MW by 2030. The following objectives are laid out under the NREP on a per technology basis:• Increase geothermal power capacity by 75 per cent;• Increase hydropower capacity by 160 per cent;• Increase biomass power capacity by 277 MW;• Increase wind power capacity by 2,345 MW;• Increase solar power capacity by 1,528 MW.18
As of the end of 2017, the Department of Energy had approved a total of 869 renewable energy projects (solar, wind, hydropower, geothermal, ocean and biomass) with a total capacity of 23,780.69 MW. These projects are situated all over the Philippines and are expected to be commissioned by 2018-2025.19
In order to support such ambitious objectives, incentives are provided to qualified renewable energy developers through the FIT. The FIT is a fixed tariff received by qualified renewable energy projects for a period of not less than 12 years. The following FIT rates were approved in 2012 for a period of 20 years:
132
World Small HydropoWer development report 2019
• Run-of-river hydropower – 5.90 PHP/kWh (0.11 US$/kWh);
• Biomass – 6.63 PHP/kWh (0.12 US$/kWh);• Wind power – 8.53 PHP/kWh (0.16 US$/kWh);• Solar power – 8.69 PHP/kWh (0.16 US$/kWh).20
The Department of Energy has closed the FIT subscription for solar and wind power and is due to close the subscription for hydropower and biomass by 2019 or until the installation targets have been fully subscribed for, whichever comes earlier. This is driven by the need to decrease electricity prices, which are currently the highest in the region.21 Private investments in the renewable energy sector are highly encouraged by the Government of the Philippines. That is why, on top of the FIT, the RE Law provides the following fiscal incentives to developers:• Seven-year income tax holiday (ITH);• 10 per cent corporate tax rate after ITH;• Ten-year duty-free importation of RE machinery,
equipment and materials;• 1.5 per cent special tax rates on equipment and machinery• Seven-year net operating loss carry-over;• Accelerated depreciation;• 0 per cent VAT;• Tax exemption on carbon credits;• 100 per cent tax credit on domestic capital equipment and
services;• Exemption from the Universal Charge;• Government share at 1 per cent of the gross income of RE
developers.16
Other regulations related to the renewable energy sector in-clude:• The Geothermal Act of 1978, which established the Service
Contract System for geothermal power development and provides incentives for contractors;
• The Mini-Hydroelectric Power Incentives Act of 1991, which provides tax incentives to small hydropower developers;
• The Executive Order 462 of 1997, which provides guidelines for private sector participation in ocean, solar and wind power development.22
Besides the support provided by the Government through the fiscal incentives put in place by the RE Law, lending banks are becoming more receptive of renewable energy project financing due to the good reputation and social acceptance it brings. Some banks that offer financing for renewable energy projects are Banco de Oro (BDO), the Bank of the Philippine Islands (BPI), Philippine National Bank (PNB) and the Development Bank of the Philippines (DBP).
Barriers to small hydropower developmentThere are various barriers to the development of small hydro-power in the Philippines, as outlined below.• Some communities, including indigenous people, can be
sensitive to the utilization of their rivers for electricity gen-eration. Some of them can reject any form of utilization of the rivers within their area or demand compensation or royalties, which may significantly impact the project’s fi-nancial viability;
• The acquisition of Government endorsements, approvals and certificates is complicated by the approvals coming from different Government agencies (i.e., DOE, NWRB, NCIP, ERC, DENR) and uncoordinated processes for is-suing approvals among these agencies, resulting in project development delays;
• Run-of-river hydropower projects are location-specific and are not necessarily accessible to an immediate grid fa-cility. In some cases, a small run-of-river hydropower proj-ect may need to string more than 20 km of transmission lines in order to connect to the nearest grid facility, the cost of which makes the project financially unattractive. Such a transmission line is also vulnerable to natural el-ements, pilferage and sabotage, which contribute to line losses;
• The Government approval process can be disproportion-ately expensive for small hydropower development due to the bureaucracy that is highly time consuming and directly impacts costs;
• As prescribed by Bangko Sentral, lending institutions im-pose single borrower’s limit on loans, which limits project financing opportunities for investors;
• Run-of-river hydropower plants are susceptible to the impact of natural forces, including extreme drought and typhoons, both of which occur in the Philippines and are further exacerbated by climate change.16
References
1. World Bank (2017). Philippines. Population. Available from https://data.worldbank.org/indicator/SP.POP.TOTL?loca-tions=PH
2. Philippine Atmospheric, Geophysical and Astronomical Ser-vices Administration (PAGASA) (2015). Official website. Avail-able from https://web.pagasa.dost.gov.ph
3. Philippine Information Agency (PIA) (2008). Official website. Available from http://news.pia.gov.ph/ .
4. Encyclopaedia of Earth (2008). Philippines. Available from www.eoearth.org/view/article/156982/.
5. Department of Energy (DOE) (2017). 2017 Power Supply and Demand Highlights (January-December 2017). Available from https://www.doe.gov.ph/electric-power/2017-power-sup-ply-and-demand-highlights-january-december-2017
6. World Bank (2016). Philippines. Access to electricity. Available from https://data.worldbank.org/indicator/EG.ELC.ACCS.ZS?locations=PH
7. Schnabel, C. (2017). ADB upgrades GDP growth forecast for 2017-2018. Rappler, 13 December 2017. Available from https://www.rappler.com/business/191245-adb-upgrade-philip-pines-gdp-outlook-2017-2018
8. Aquino, P. (2017). Philippine Energy Plan 2017-2040 and Ex-ecutive Order (EO) No. 30. PEP Public Consultation / IEC, 19 December 2017, Taguig City. Available from https://www.doe.gov.ph/sites/default/files/pdf/downloads/2017-2040_pep_and_
133
3.2. So
uth
-EaS
tErn
aS
ia
eo_30.pdf9. Visaya, V. (2018). 8.5MW hydro power plant switched on in Isa-
bela. INQUIRER.NET, 25 January 2018. Available from https://newsinfo.inquirer.net/963607/8-5mw-hydro-power-plant-switched-on-in-isabela
10. Equis Energy (2017). OVPI selects POWERCHINA as Construc-tion Partner for 500MW Wawa Pumped-Storage Hydropower Project. Available from http://equisenergy.com/wp-content/uploads/2017/05/OVPI-selects-POWERCHINA-as-Construc-tion-Partner-for-500MW-Wawa-Pumped-Storage-Hydropow-er-Project_Eng-SG.pdf
11. Poidexter, G. (2017). Philippines seeks China financing to rehab Agus-Pulangi hydropower complex. HydroWorld, 27 Decem-ber 2017. Available from https://www.hydroworld.com/arti-cles/2017/12/philippines-seeking-china-financing-for-agus-pu-langi-hydropower-complex-rehabilitation.html
12. Leyco, C. (2017). Agus-Pulangi hydropower plant rehab includ-ed in China’s second infra basket. Manila Bulletin, 9 October 2017. Available from https://business.mb.com.ph/2017/10/09/agus-pulangi-hydropower-plant-rehab-included-in-chinas-sec-ond-infra-basket/
13. Atienza, J. P. (2017). Gov’t subsidies, transparency are gateway to lowering PH expensive electricity prices. Power Philippines, 30 August 2017. Available from http://powerphilippines.com/2017/08/30/doe-govt-subsidies-transparency-ph-electric-ity-rates/
14. Department of Energy (DOE) (n.d.). Hydropower. Available from https://www.doe.gov.ph/hydropower
15. International Renewable Energy Agency (IRENA) (2017). Re-newable Capacity Statistics 2017. Abu Dhabi
16. Xialei, C., Singh, P. R., Xianlai, W., and Kremere, E., eds. (2016). World Small Hydropower Development Report 2016. United Nations Industrial Development Organization; Inter-national Center on Small Hydro Power. Available from www.smallhydroworld.org.
17. LIU, H., Masera, D. and Esser, L., eds. (2013). World Small Hy-dropower Development Report 2013, United Nations Industrial Development Organization; International Center on Small Hydro Power. Available from www.smallhydroworld.org
18. Department of Energy (DOE) (n.d.). National Renewable Energy Program. Available from https://www.doe.gov.ph/national-re-newable-energy-program
19. Department of Energy (DOE) (2017). Summary of renewable energy (RE) projects as of December 31, 2017. Available from https://www.doe.gov.ph/renewable-energy?q=renewable-ener-gy/Summary-of-Projects
20. Dizon, D. (2017). 2018 Feed-in Tariff Allowance Rate Applica-tion. ERC Case No. 2017-079 RC, Expository Presentation, Pasig City, 6 December 2017. Available from https://www.transco.ph/downloads/fitall/2018FITAllExpositoryPresentationERCPasigC-ityDec62017.pdf
21. Velasco, M. (2017). Cusi scraps next round of FIT for solar, rules no subsidy for stranded capacity. Manila Bulletin, 29 May 2017. Available from https://business.mb.com.ph/2017/05/29/cusi-scraps-next-round-of-fit-for-solar-rules-no-subsidy-for-stranded-capacity/
22. Caponcol, M. (2017). Renewable Energy Development. Depart-ment of Energy. Available from https://www.doe.gov.ph/sites/default/files/pdf/announcements/epower_03_01_renewable_en-ergy_sector_development.pdf

134
Thailand Sangam Shrestha, asian Institute of technology; and manish Shrestha, Stockholm Environment Institute
Key factsPopulation 69,183,1731
Area 513,120 km2
Climate Thailand has a tropical monsoon climate. It is generally hot and humid across the country most of the year. The climate of Thailand can be classified into three seasons – the hot season (March – May), the rainy season (May – October) and the cold season (November – February). The temperature ranges from 24 °C to 30 °C.2
Topography Mountains cover most of the northern Thailand and extend along the border with Myanmar down through the Kra Isthumus and the Malay Peninsula. The highest point is Doi Inthanon mountain, at 2,565 metres above sea level. The central area is characterized by lowlands dominated by the Chao Phraya River Basin.
Rain pattern Average annual rainfall ranges from 1,020 mm in the north-east to 3,800 mm in the peninsula. Eighty per cent of total annual rainfall occurs from May to October.2
Hydrology Thailand is divided into 25 major river basins. Four major rivers that originate from the north are the Wang, Ping, Yom and Nan, which converge to become the Chao Phraya River. Water from rivers such as the Chi, Mun and Songkhram drain into the Mekong River.3
Electricity sector overview
The state enterprise Electricity Generation Authority of Thailand (EGAT), under the Ministry of Energy, is the main authority responsible for production and transmission of electric power throughout the country. As of January 2018, the total electricity generating capacity of Thailand was 42,209.25 MW, of which 37.33 per cent was from EGAT’s power plants, whereas the remaining 62.67 per cent were purchased from other domestic power plants including Independent Power Producers (IPPs), Small Power Producers (SPPs), Very Small Power Producers (VSPPs) and imported from neighbouring countries.4 The total installed capacity of EGAT’s power plants was 15,757.13 MW, including 8,582 MW from combined cycle plants, 3,647 MW from thermal power plants, 2,997.73 from renewable energy plants, 30.40 MW from diesel-fired plants, and 500 MW from other sources.4
As of September 2015, the total installed capacity of renewable energy was 7,793.80 MW, including 2,906.40 MW from large hydropower, 2,676.50 MW from biomass, 1,313.65 from solar power, 365.10 MW from biogas, 225.37 MW from wind power, 172.06 MW from small hydropower, and 134.72 MW from community waste.14
The main source of electricity in Thailand is natural gas, followed by lignite. In 2016, Thailand generated 176,640 GWh of electricity, and an additional 24,427 GWh was imported. Hydropower contributed only 3 per cent of the total power produced in the country (Figure 1). 5
Figure 1. Annual electricity generation by source in Thailand (TWh)
121,044.2
35,732.5
14,846.1
4,687.2
197.8
132.5
Natural gas
Coal & lignite
Other RE
Hydropower
Diesel
Fuel oil
Source: EGAT5
EGAT has the total transformer capacity of 106,889 MVA, with a total transmission length of 33,393 circuit-km.5 This brings the electrification rate of the country to 99 per cent, with a 100 per cent rate of the urban electrification and a 99 per cent rate of the rural electrification.6
EGAT has the sole right to buy electricity from private power producers and neighbouring countries, and sells wholesale electricity energy to two distributors, the Metropolitan Electricity Authority (MEA), which supplies electricity to Bangkok, Nonthaburi and Samut Prakran, and Provincial Electricity Authority (PEA), which supplies electricity to the rest of the country.7
3.4.7
World Small HydropoWEr dEvElopmEnt
rEport 2019

135
3.2. So
uth
-EaS
tErn
aS
ia
Most of the hydropower plants are operated in rural and re-mote areas of Thailand. Approximately 75 micro hydropow-er plants with a combined capacity of 2.49 MW are installed to directly cater for communities that are not connected to the grid.8,15 In addition, 32 small hydropower plants (up to 10 MW) are planned to be installed by the year 2030.9,15
Due to a rising gross domestic product (GDP) and growing population, electricity demand in Thailand goes up year on year. With an annual growth of 2.67 per cent in peak demand, it is forecasted that the peak energy demand in the year 2036 will be at 49,655 MW.10 The Government assumes that total installed capacity will be at 70,335 MW by 2036, comprising the existing capacity of 37,612 MW (as of December 2014), a new capacity of 57,459 MW, and a capacity retired during 2015-2036 of 24,736 MW.10 It is projected that by 2036, 30-40 per cent of power will be generated from natural gas, 15-20 per cent from the renewable energy sources (including hydropower), 20-25 per cent from coal and lignite and up to 5 per cent from nuclear power. It is also estimated that 15-20 per cent of electricity will be imported from neighbouring countries.10
The Energy Regulatory Commission (ERC) is responsible for adjusting tariffs, which are uniform across the country, in both the MEA and PEA distribution territories.7 The electricity tariffs valid from November 2015 are shown in Table 1. The electricity tariff rate comprises two parts: a) a base tariff which reflects the construction costs of power plants, the transmission and distribution system, fuel and operation and maintenance costs, and b) automatic tariff adjustment (Ft) to compensate for inflation and exchange rate fluctuations at international fuel and power markets. Ft is adjusted every four months. In addition, a VAT of 7 per cent is added to the base tariff and Ft.7,11,15 The electricity tariff rate varies for different sectors with an increasing block rate method. The tariff also varies according to the voltage levels and time of consumption (peak and off-peak hours).11,15
Table 1. Residential electricity tariff rates in Thailand
Normal tariff with consumption not exceeding 150 kWh/month
Energy charge Rate per kWh
First 15 kWh (1st – 15th) THB 2.35 (US$ 0.08)
Next 10 kWh (16th – 25th) THB 2.99 (US$ 0.10)
Next 10 kWh (26th – 35th) THB 3.24 (US$ 0.10)
Next 65 kWh (36th – 100th) THB 3.62 (US$ 0.12)
Next 50 kWh (101st – 150th) THB 3.72 (US$ 0.12)
Next 250 kWh (151st – 400th) THB 4.22 (US$ 0.14)
Over 400 kWh (up from 401st) THB 4.42 (US$ 0.14)
Service charge per month: TBH 8.19 (US$ 0.26)
Since January 2016, customers under tariff No. 1.1 who are not legal entities and used less than 50 units of electricity per month over three consecutive months can use electricity free of charge
in the third month. Source: MEA11
Small hydropower sector overview
Based on the installed capacity, hydropower in Thailand can be classified as micro-hydropower (less than 200 kW), small/mini (200-6,000 kW), medium (6,000-20,000 kW) and large (above 20,000 kW).8,15 The installed capacity of small hydropower in the country as of September 2015 was 172 MW, indicating a 59 per cent increase compared with the World Small Hydropower Development Report (WSHPDR) 2016.14,15 The development of small hydropower in the country was fostered through the national Alternative Energy Development Plan (AEDP2015), which set the goal of increasing the installed capacity of small hydropower to 376 MW by 2036.14 The potential capacity of small hydropower is estimated at 700 MW (Figure 2).12
Figure 2. Small hydropower capacities up to 6 MW 2013/2016/2019 in Thailand (MW)
0 100 200 300 400 500 600 700 800
PotentialCapacity
Installed Capacity
700 700 700
172 1080
WSHPDR 2019WSHPDR 2016WSHPDR 2013
Source: Ministry of Energy,12 IEA,14 WSHPDR 2016,15 WSHPDR 201316
Note: The comparison is between data from WSHPDR 2013, WSHPDR 2016 and WSHPDR 2019.
The northern part of Thailand has most of the potential for developing small hydropower. An additional 256 sites in the northern part of Thailand have been identified for the development of small and medium hydropower plants.8 Around 2.25 per cent of the total electricity produced by hydropower is generated by small hydropower plants.8
Renewable energy policy
At the end of 2014, the Sub-Committee on Load Forecast and Power Development Plan Formulation considered developing a new Power Development Plan to respond to changes in economic and infrastructure development and in the ASEAN Economic Community (AEC). The Ministry of Energy of Thailand, therefore, developed five integration master plans – the Thailand Power Development Plan (PDP2015), Energy Efficiency Development Plan (EEDP), Alternative Energy Development Plan (AEDP), Natural Gas Supply Plan, and Petroleum Management Plan.10
According to Government policies on electricity, the frame-work of the Thailand Power Development Plan 2015,2036 for-mulated in line with the Energy Efficiency Development Plan and the Alternative Energy Development Plan, was approved by the National Energy Policy Council (NEPC) on December 17, 2014. The framework is laid out as follows:• Energy Security: dealing with an increase in power de-

136
World Small HydropoWer development report 2019
mand taking into account fuel diversification to lessen the dependency on one particular fuel;
• Economy: maintaining an appropriate cost of power gen-eration and implementing energy efficiency;
• Ecology: reducing environmental and social impacts by lessening carbon dioxide intensity of power generation.
The Energy Efficiency Development Plan seeks to reduce greenhouse gas (GHG) emissions according to the pledge submitted to the UNFCCC at COP21, aiming to reduce emissions from the Thai transport and energy sectors in 2020 by 7 per cent compared to 2005. The Alternative Energy Development Plan aims to increase the share of renewable energy in the total power demand to 20 per cent in 2036. This accounts for 19,634.4 MW, out of which small hydropower accounts for 1.9 per cent.12 The Alternative Energy Development Plan promotes renewable energy schemes designed to strengthen communities, lessen the dependence on fossil fuels and address social problems such as municipal solid waste (MSW) and agricultural waste. The development strategies to reach this goal include:• Promotion of power generation from MSW (500 MW),
biomass and biogas (2,500 MW), to benefit both farmers and communities;
• Set up targets of provincial renewable energy development by zoning electricity demand and renewable energy poten-tial;
• Power generation from solar and wind if the investment costs can compete with power generation using liquefied natural gas (LNG);
• Incentives using competitive bidding, and promoting en-ergy consumption reduction.
Government policy supports private sector participation in electricity generation. The Small and Very Small Power Purchase Agreements (2002), Strategic Plan for Renewable Energy Development (2004), Feed-in Premium for Renewable Power (2009), National Renewable Energies Development Plan 2008-2022 (2012), Alternative Energy Development Plan: AEDP (2015) and Thailand Power Development Plan 2015-2036 (PDP2015) are just some of the policies that support investment by private companies in the energy sector.15
To promote and support alternative energy, the Ministry of Energy will provide feed-in tariffs (FIT) to VSPPs.12,15 The FITs are provided on a 20-year term to all forms of renewable energy except for energy from landfill waste, which is eligible for 10 years. For some projects this will provide financial certainty over a period twice as long as under the adder rate payment scheme.12,15 The rates are determined based on the type of renewable energy, installation location and installed capacity. The highest rates are provided to MSW and wind energy. For hydropower projects, the FIT rate is 4.9 THB/kWh (0.16 US$/kWh) for a 20-year period. Projects located in Yala, Pattani, Narathiwat and four subdistricts of Songkla (Jana, Tepha, Sabayoi and Natawee) will receive 0.50 THB/kWh (0.02 US$/kWh) for the lifetime of the project.12
Barriers to small hydropower developmentMost potential hydropower sites in the northern region of Thailand are located in the protected forested areas, hence legal provisions pose the main obstacle to small hydropower development. The regulations restricting the construction of small hydropower plants include: • The Forest Act (1941);• The National Park Act (1955);• The National Reservation and Protection Act (1992);• The National Reserved Forest Act (1964);• The cabinet resolution of 15 May 1990, restricting the use
of conservation areas by private agencies.13
These kinds of policies undermine the growth of the small hydropower sector. If the policies were reformed with provi-sions for the right of ownership and selling of excess electri-city, this would attract private investors and contribute to the development of small hydropower, as well as of the national grid.14
References
1. Worldometer (2018). Available from http://www.worldometers.info/world-population/thailand-population/
2. Thai meteorological department (2015). Available from http://www.tmd.go.th/en/
3. Water environment partnership in Asia (2015). Available from http://www.wepa-db.net/policies/ state/thailand/thailand.htm
4. Electricity Generating Authority of Thailand (2017). System Installed Generating Capacity. Available from https://www.egat.co.th/en/index.php?option=com_content&view=article&id=80&Itemid=116
5. Energy Policy and Planning Office, Ministry of Energy (2017). Available from http://www.eppo.go.th/index.php/en/en-energystatistics/electricity-statistic?orders[publishUp]=publishUp&issearch=1
6. Renewable 2015 Global status report (2015). Annual report on Renewables. Available from http://www.ren21.net/wp-content/uploads/2015/06/REN12-GSR2015_Onlinebook_low1.pdf
7. Woradej S. (2014). The impact on electricity price caused by FiT in Thailand. AORC Technical meeting. Available from http://www.cigre-thailand.org/tncf/ events/aorc2014/full_paper/1033R.pdf
8. Aroonrat K. and Wongwises S. (2015). Current status and potential of hydro energy in Thailand: a review. Renwe Sustain Energy Rev 48 (2015) 70-78.
9. Summary of Thailand power development plan 2012-2030: Revision 3. (2012). Available from http://www.egat.co.th/en/images/about-egat/ PDP2010-Rev3-Eng.pdf
10. Thailand power development plan 2015-2036 (2015). Available from https://www.egat.co.th/en/images/about-egat/PDP2015_Eng.pdf
11. Metropolitan Electricity Authority. (2015). Available from http://www.mea.or.th/en/profile/109/111

137
3.2. So
uth
-EaS
tErn
aS
ia
12. Alternative Energy Development Plan: AEDP2015 (2015). Available from http://www.eppo.go.th/images/POLICY/ENG/AEDP2015ENG.pdf
13. Supriyasilp T., Pongput K., Robkob C. (2011). Small hydropower development and legal limitation in Thailand. World renewable energy congress. Available from http://www.ep.liu.se/ecp/057/vol10/052/ecp57 vol10_052.pdf
14. International Energy Agency (2016). Thailand Electricity Security Assessment 2016. Available from https://www.iea.org/publications/freepublications/publication/Partner_Country_Series_Thailand_Electricity_Security_2016_.pdf
15. Xialei, C., Singh, P. R., Xianlai, W., and Kremere, E., eds. (2016). World Small Hydropower Development Report 2016. United Nations Industrial Development Organization; International Center on Small Hydro Power. Available from www.smallhydroworld.org.
16. Liu, H., Masera, D. and Esser, L., eds. World Small Hydropower Development Report 2013, United Nations Industrial Development Organization; International Center on Small Hydro Power (2013)

138
Timor-LesteKassius Klei Ximenes, the national Electrification project
Key factsPopulation 1,268,671 1
Area 15,410 km2
Climate Timor-Leste has a tropical, hot and humid climate. The wet season is from December to April, with temperatures of 29 oC to 35 oC, whereas the dry season lasts from May to November and has average temperatures of 20 oC to 33 oC. Temperatures in areas with higher altitude can fall to 14 oC (at 2,000 metres).2
Topography Inland Timor-Leste is mountainous, with its highest peak being Foho Tatamailau at 2,963 metres. Both the northern and southern parts of the country are characterized by highlands, while the north also has lowlands. The coastal areas are at sea level.3
Rain pattern Average annual rainfall across the country is 1,500 mm. Whilst the central mountainous region can receive up to 2,837 mm, in the northern part of the country almost no rain falls during the dry season.3
Hydrology The largest river system is the Loes River basin, which has a total area of 2,184 km2, covering almost 15 per cent of the country’s territory. It is also the longest river (80 km long). It is followed by the Laclo River system and the Clere and Belulic River system with total areas 2,024 km2 and 1,917 km2 respectively. Given temporal variations in rainfall and the low capacity of upland areas to hold water, very few rivers flow all year round.3
Electricity sector overview
As of 2017, total available capacity in Timor-Leste was approximately 301 MW, including 300.2 MW from diesel-powered plants, 750 kW from solar power plants and 350 kW from hydropower plants (Figure 1). The country’s installed capacity increased due to the construction of planned power plants completed gradually between 2010 and 2015. In 2017, peak demand was 73.6 MW. In the same year, annual electricity production was 2,630 GWh.4
Figure 1. Installed electricity capacity by source in Timor-Leste (MW)
0.8
300.2
0.4
Diesel
Solar power
Hydropower
Source: NDoRDE4
The public utility Electricidade de Timor-Leste (EdTL), under the Ministry of Development and Institutional Reforms, is the agency responsible for generation and distribution of electri-city. The national grid is comprised of 150kV transmission lines with nine substations, as well as a 20kV medium-voltage line supplying the electricity produced by the Hera and Beta-no power plants. The National Strategic Development Plan (NSDP) 2011-2030 states that all Timorese should have a re-liable access to electricity by 2015.5 Currently, the electrifica-
tion rate in Timor-Leste is 85 per cent, indicating that 43,965 households have access to electricity 24 hours per day.4
The isolated systems in Oecusse Island became an integrated system through the construction of a 17.3 MW fossil fuel (high-speed diesel) or dual fuel plant, which was commissioned in November 2015 and might be later converted to natural gas.6 A new transmission line has also been extended to distribute power from the Sakato power plant, reaching 3,787 households. According to the electrification plan, the electricity system of Atauro Island will combine a 1 MW hybrid solar power system with the existing 500 kW diesel power plant.7
The Government plans to diversify the country’s energy mix through the use of solar power, hydropower, wind power and biomass.6 The plans include to drastically overhaul the energy sector by switching to natural gas and hydropower as the base load, while the existing conventional energy plants will serve for both peak and base loads. It is also planned to introduce the private-public partnership model (PPP) in the electricity sector.7
As of 2018, tariffs for electric consumption ranged from US$ 0.12 to US$ 0.22 per kWh. The lower prices are for the residential and social sectors, and the rates have not changed since 2002. The price of electricity is uniform across the country.7 The main challenge for Timor Leste’s electricity sector is the lack of a comprehensive energy framework, which should include policies and economic incentives.
3.4.8
World Small HydropoWEr dEvElopmEnt
rEport 2019

139
3.2. So
uth
-EaS
tErn
aS
ia
Small hydropower sector overview
In Timor-Leste, small hydropower (SHP) is defined as hydropower plants with an installed capacity up to 50 MW. The total installed capacity of small hydropower is 0.353 MW, which comes from one mini- and two micro-hydropower plants: Gariuai SHP in Baucau Municipality (326 kW), Loe Huno-Ossu SHP in Viqueque Municipality (15 kW) and a micro-hydropower plant in the Ainaro Municipality (12 kW).4 However, the three plants are not in operation due to technical issues. Compared to the World Small Hydropower Development Report (WSHPDR) 2016, installed capacity did not change (Figure 2).
Figure 2. Small hydropower capacities up to 10 MW 2013/2016/2019 in Timor-Leste (MW)
0 50 100 150 200 250
PotentialCapacity
Installed Capacity
219.8N/AN/A
0.350.350.30
WSHPDR 2019WSHPDR 2016WSHPDR 2013
Source: NDoRDE,4 WSHPDR 2016,7 WSHPDR 20138
Note: The comparison is between data from WSHPDR 2013, WSHPDR 2016 and WSHPDR 2019.
The potential of hydropower resources of Timor-Leste was explored between 2003 and 2006 through the institutional cooperation between the Government of Timor-Leste and Norway.9 The State Secretary of Timor-Leste for Energy Policy and the Norwegian Water Resources and Energy Directorate developed a Hydropower Master Plan for Timor-Leste. The total small hydropower potential up to 10 MW of Timor-Leste was found to be approximately 219.8 MW, with a potential annual production of 812.8 GWh. From an economic point of view, at least 15 locations of the 23 that were identified are viable. These have a potential capacity of 187.6 MW and annual electricity generation of 670.6 GWh.10 There is no known figure for potential capacity up to 50 MW.
Renewable energy policy
In 2009, the Secretariat of State for Energy Policy launched a renewable energy (RE) programme covering biogas, solar power, biodiesel, hydropower and wind power. No investments in wind power have been made yet, however, this sector is also to be developed according to the plan. By 2030, the Government expects to meet half of the country’s energy needs from renewable energy sources as per the NSDP 2011-2030.5
According to a comprehensive estimate of the country’s renewable energy resources, other than hydropower, by the Portuguese company Martifer, Timor-Leste has 72 MW of wind power potential, 22 MW of solar power potential
and 6 MW of biomass and solid waste potential.11 The Government also predicts the establishment of wind power and hydropower hybrid systems with hydropower to be used in the rainy season and fuel or biogas during the drier period.
In 2016, public consultations on the basic law on renewable energy were held throughout the country and, as of 2018, were awaiting promulgation in the Parliament. The law foresees the creation of a fund and mechanisms for the development of renewable energy as well human resources training. It also establishes a limit of 2 kW for electricity generation by community power plants, so that the generated electricity would be used for the community’s consumption only with the excess being sold to the national grid.
To date, most of the renewable energy projects are being implemented by international donors as well as local and international non-governmental organizations (NGOs), however, these projects are very small-scale compared with the national energetic programme. Meanwhile, the Government for the time being is waiting for investments into the country’s renewable energy sector.
Barriers to small hydropower development The main barriers to hydropower development in Timor-Leste are:• A lack of cooperation between the Government, universi-
ties, research institutes and NGOs that could help secure the country’s sustainable development;
• A lack of efficient monitoring and evaluation mechanisms that could help identify best practices and replicate or scale up successful case;
• Abundant electricity production from diesel;• A lack of a legal and regulatory framework;• A lack of financial incentives;• A lack of technical knowledge, management and other
skills, which are needed to provide capacity building at the community level;
• Unclear property rights;• Undefined customary laws dealing with marine and natu-
ral resources;• Technical difficulties due to the mountainous topography
of the country;• High costs of developing renewable energy technologies;• Installed electricity meters in cities are often bypassed,
leading to low revenues, which are not sufficient to cover project investment costs.
References
1. Timor-Leste, population total (2016). World Bank. http://data.worldbank.org/ (accessed April 18, 2018)
2. Nations Encyclopedia (2018). Climate East Timor. http://www.nationsencyclopedia.com/Asia-and-Oceania/East-Timor-CLI-MATE.html (accessed June 25, 2018)
3. United Nations Food and Agriculture Organization (FAO)

140
World Small HydropoWer development report 2019
(n.d.) Timor-Leste, Aquastat database. www.fao.org/nr/water/aquastat/countries_regions
4. National Directorate of Research and Development for Electrici-ty (NDoRDE) (2017). Internal data.
5. Timor-Leste Government (n.d.). Timor-Leste Strategic Develop-ment Plant 2011-2030. http://timor-leste.gov.tl/ (accessed April 17, 2018).
6. Wärtsilä (2016). Wärtsilä to optimise power plant performance in Timor-Leste. Available from https://www.wartsila.com/media/news/26-01-2016-wartsila-to-optimise-power-plant-perfor-mance-in-timor-leste (accessed July 23, 2018)
7. Xialei, C., Singh, P. R., Xianlai, W., and Kremere, E., eds. (2016). World Small Hydropower Development Report 2016. United Nations Industrial Development Organization; Interna-tional Center on Small Hydro Power. Available from www.small-hydroworld.org. (accessed April 23, 2018)
8. LIU, H., Masera, D. and Esser, L., eds. (2013). World Small Hy-dropower Development Report 2013. United Nations Industrial Development Organization; International Centre on Small Hydro Power. www.smallhydroworld.org. (accessed April 18, 2018).
9. The Norwegian Agency for Development Cooperation (NORAD) (2017). Official website. Available from https://www.norad.no (accessed April 18, 2018).
10. The Government of Timor-Leste Secretary of State for Energy Policy in Timor-Leste Cooperation with Norwegian Water Re-sources and Energy Directorate (2012). Final Hydropower Master Plan, 2012.
11. Ministry of Economy and Development (2012). Sustainable De-velopment in Timor-Leste. National Report to the United Nations Conference on Sustainable Development (UNCSD). Available from https://www.laohamutuk.org/econ/Rio20/TLReportRio20.pdf
12. The International Journal on Hydropower and Dams (IJHD) (2015). World Atlas and Industry Guide, 2015. Aqua-Media International, Wallington, UK.
13. General Directorate of Statistics, Timor-Leste (2015). Quarterly Statistical Indicators 2015. Available from http://www.statistics.gov.tl/wp-content/uploads/2015/06/QSI_I_-2015.pdf (accessed April 18, 2018).

141
3.2. So
uth
-EaS
tErn
aS
ia
Viet NamInternational Centre on Small Hydro power (ICSHp)
Key factsPopulation 94,569,072 1
Area 330,972 km2 1
Climate Viet Nam’s climate is tropical in the south. The north is characterized by hot rainy season from May to September and by a dry season from October to March.14 Average temperatures vary greatly. For example, in Hanoi they can range from 17 °C in January to 29 °C in June.34
Topography Viet Nam has low flat delta in the south, central midlands and mountains area in the north-west. About 75 per cent of the territory is covered by mountains, however mean elevation is about 398 metres. Fan Si Pan (3,144 metres above the sea level), in the north-west of the country, is its highest point.14
Rain pattern Most rainfall is caused by monsoon, with heavy rains from May to October in the north and the south and from September to January in the central parts of the country. Average annual precipitation is around 1,763 mm in Hanoi, 2,867 mm in Hue and 1,910 mm in Ho Chi Minh city. The average air humidity is over 80 per cent.5
Hydrology The two major rivers in Viet Nam are the Red River in the North and the Mekong River in the South, with a length of 510 km and 220 km respectively. The overall length of all of Viet Nam’s rivers is 41,000 km with around 300 billion m3 of water flow per year and 3,100 km of canals.5
Electricity sector overview
Viet Nam mainly uses coal, oil, hydropower and natural gas to generate electricity. Coal, in particular, has increased its share as it is a cheap and abundant local source. In 2016, in order to meet the country growing electricity demand, total electricity generation was 175,990 GWh. Hydropower dominates the generation mix with 65,722 GWh (37.3 per cent), 63,974 GWh come from coal (36.4 per cent), 45,113 GWh are from gas (25.6 per cent), and 1,181 GWh are generated from oil-fired plants (0.7 per cent). Imported electricity, mainly from China and Lao PDR, accounted for about 1,489 GWh (Figure 1).23
Figure 1. Annual electricity generation by source in Viet Nam (GWh)
0 1000020000300004000050000600007000080000
Hydropower
Coal
Gas
Oil
Wind power& biomass
65,722
63,974
45,113
1,181
N/A
Source: Viet Nam’s Power Development Plan23
According to the latest Government power plan for Viet Nam, power demand is estimated to double from 160 TWh to 330 TWh in the period between 2015 and 2020, and to reach 516 TWh by 2030 (Figure 2).23
Figure 2. Power demand estimation in Viet Nam (TWh)
330
516
160
2030
2020
2015
Source: Viet Nam’s Power Development Plan23
As of 2016, according to the Power Development Plan VII (PDP 7) of the Ministry of Industry and Trade General Directorate of Energy of Viet Nam, the total installed capacity was 41,422 MW. Hydropower accounted for 18,004 MW, coal thermal for 14,595 MW, oil-fired thermal for 1,242 MW, gas for 7,446 MW and other renewable sources (wind and biomass) for 135 MW, while imported capacity amount was 1,340 MW (Figure 3).23 Compared to 2014, hydropower has slightly decreased its installed share from 46 per cent in 2014 to 43 per cent in 2016.
Indeed, according to the PDP 7 (approved by the Government in July 2011 and revised in March 2016) the share of hydropower is expected to decrease to 28.7 per cent by 2020 and to 17.8 per cent by 2030. The country is shifting towards more coal-fired thermal plants.23 The share of coal is expected to grow up to 50 per cent by 2030.3 This shift is due to three main reasons. Firstly, the utilisation of river systems for hydropower is close to reach its limit as many projects have been deleted from the Government plan. Secondly, past
3.4.9
World Small HydropoWEr dEvElopmEnt
rEport 2019
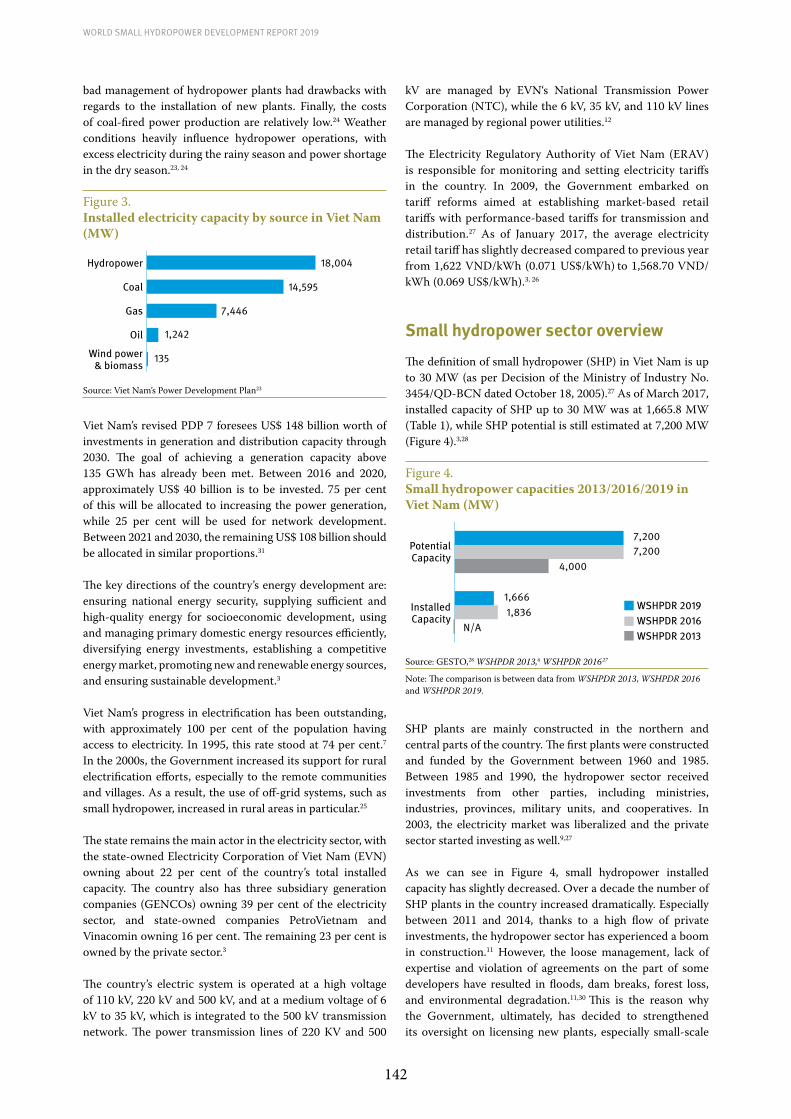
142
World Small HydropoWer development report 2019
bad management of hydropower plants had drawbacks with regards to the installation of new plants. Finally, the costs of coal-fired power production are relatively low.24 Weather conditions heavily influence hydropower operations, with excess electricity during the rainy season and power shortage in the dry season.23, 24
Figure 3. Installed electricity capacity by source in Viet Nam (MW)
0 5000 10000 15000 20000
Hydropower
Coal
Gas
Oil
Wind power& biomass
18,004
14,595
7,446
1,242
135
Source: Viet Nam’s Power Development Plan23
Viet Nam’s revised PDP 7 foresees US$ 148 billion worth of investments in generation and distribution capacity through 2030. The goal of achieving a generation capacity above 135 GWh has already been met. Between 2016 and 2020, approximately US$ 40 billion is to be invested. 75 per cent of this will be allocated to increasing the power generation, while 25 per cent will be used for network development. Between 2021 and 2030, the remaining US$ 108 billion should be allocated in similar proportions.31
The key directions of the country’s energy development are: ensuring national energy security, supplying sufficient and high-quality energy for socioeconomic development, using and managing primary domestic energy resources efficiently, diversifying energy investments, establishing a competitive energy market, promoting new and renewable energy sources, and ensuring sustainable development.3
Viet Nam’s progress in electrification has been outstanding, with approximately 100 per cent of the population having access to electricity. In 1995, this rate stood at 74 per cent.7
In the 2000s, the Government increased its support for rural electrification efforts, especially to the remote communities and villages. As a result, the use of off-grid systems, such as small hydropower, increased in rural areas in particular.25
The state remains the main actor in the electricity sector, with the state-owned Electricity Corporation of Viet Nam (EVN) owning about 22 per cent of the country’s total installed capacity. The country also has three subsidiary generation companies (GENCOs) owning 39 per cent of the electricity sector, and state-owned companies PetroVietnam and Vinacomin owning 16 per cent. The remaining 23 per cent is owned by the private sector.3
The country’s electric system is operated at a high voltage of 110 kV, 220 kV and 500 kV, and at a medium voltage of 6 kV to 35 kV, which is integrated to the 500 kV transmission network. The power transmission lines of 220 KV and 500
kV are managed by EVN‘s National Transmission Power Corporation (NTC), while the 6 kV, 35 kV, and 110 kV lines are managed by regional power utilities.12
The Electricity Regulatory Authority of Viet Nam (ERAV) is responsible for monitoring and setting electricity tariffs in the country. In 2009, the Government embarked on tariff reforms aimed at establishing market-based retail tariffs with performance-based tariffs for transmission and distribution.27 As of January 2017, the average electricity retail tariff has slightly decreased compared to previous year from 1,622 VND/kWh (0.071 US$/kWh) to 1,568.70 VND/kWh (0.069 US$/kWh).3, 26
Small hydropower sector overview
The definition of small hydropower (SHP) in Viet Nam is up to 30 MW (as per Decision of the Ministry of Industry No. 3454/QD-BCN dated October 18, 2005).27 As of March 2017, installed capacity of SHP up to 30 MW was at 1,665.8 MW (Table 1), while SHP potential is still estimated at 7,200 MW (Figure 4).3,28
Figure 4. Small hydropower capacities 2013/2016/2019 in Viet Nam (MW)
0 1000 2000 3000 4000 5000 6000 7000 8000
PotentialCapacity
Installed Capacity
7,200 7,200 4,000
1,666 1,836N/A
WSHPDR 2019WSHPDR 2016WSHPDR 2013
Source: GESTO,28 WSHPDR 2013,6 WSHPDR 201627
Note: The comparison is between data from WSHPDR 2013, WSHPDR 2016 and WSHPDR 2019.
SHP plants are mainly constructed in the northern and central parts of the country. The first plants were constructed and funded by the Government between 1960 and 1985. Between 1985 and 1990, the hydropower sector received investments from other parties, including ministries, industries, provinces, military units, and cooperatives. In 2003, the electricity market was liberalized and the private sector started investing as well.9,27
As we can see in Figure 4, small hydropower installed capacity has slightly decreased. Over a decade the number of SHP plants in the country increased dramatically. Especially between 2011 and 2014, thanks to a high flow of private investments, the hydropower sector has experienced a boom in construction.11 However, the loose management, lack of expertise and violation of agreements on the part of some developers have resulted in floods, dam breaks, forest loss, and environmental degradation.11,30 This is the reason why the Government, ultimately, has decided to strengthened its oversight on licensing new plants, especially small-scale
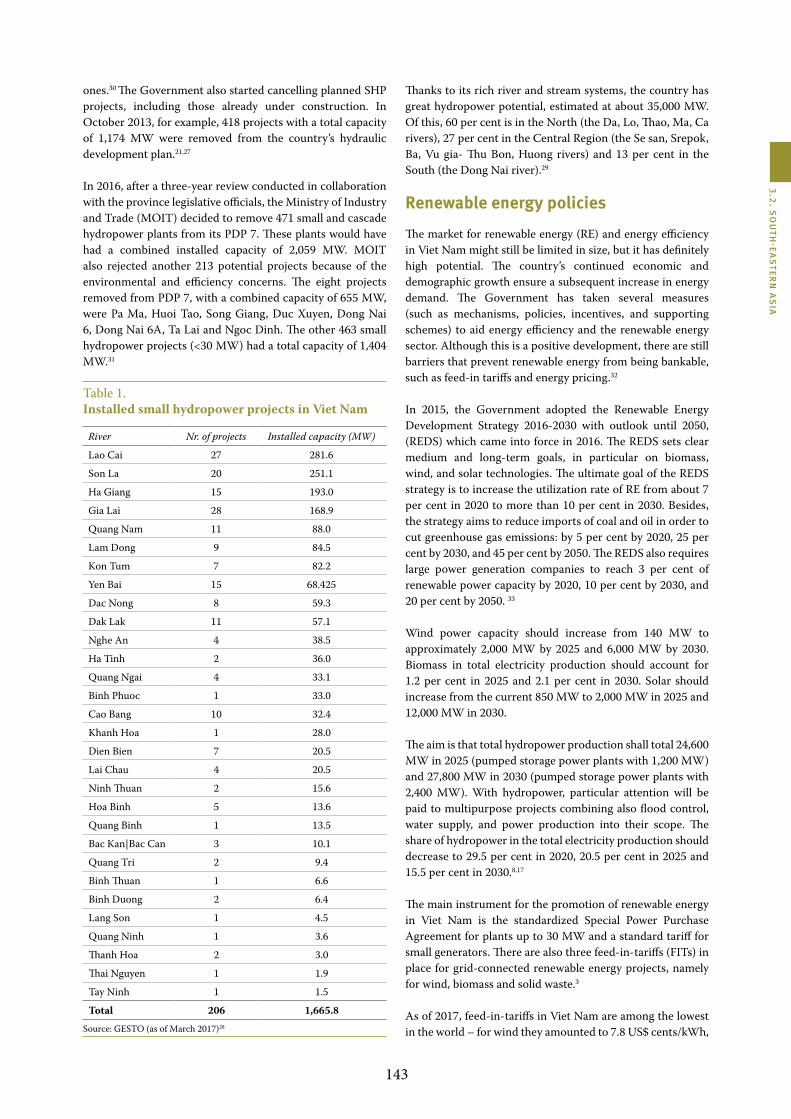
143
3.2. So
uth
-EaS
tErn
aS
ia
ones.30 The Government also started cancelling planned SHP projects, including those already under construction. In October 2013, for example, 418 projects with a total capacity of 1,174 MW were removed from the country’s hydraulic development plan.21,27
In 2016, after a three-year review conducted in collaboration with the province legislative officials, the Ministry of Industry and Trade (MOIT) decided to remove 471 small and cascade hydropower plants from its PDP 7. These plants would have had a combined installed capacity of 2,059 MW. MOIT also rejected another 213 potential projects because of the environmental and efficiency concerns. The eight projects removed from PDP 7, with a combined capacity of 655 MW, were Pa Ma, Huoi Tao, Song Giang, Duc Xuyen, Dong Nai 6, Dong Nai 6A, Ta Lai and Ngoc Dinh. The other 463 small hydropower projects (<30 MW) had a total capacity of 1,404 MW.31
Table 1.Installed small hydropower projects in Viet Nam
River Nr. of projects Installed capacity (MW)
Lao Cai 27 281.6
Son La 20 251.1
Ha Giang 15 193.0
Gia Lai 28 168.9
Quang Nam 11 88.0
Lam Dong 9 84.5
Kon Tum 7 82.2
Yen Bai 15 68.425
Dac Nong 8 59.3
Dak Lak 11 57.1
Nghe An 4 38.5
Ha Tinh 2 36.0
Quang Ngai 4 33.1
Binh Phuoc 1 33.0
Cao Bang 10 32.4
Khanh Hoa 1 28.0
Dien Bien 7 20.5
Lai Chau 4 20.5
Ninh Thuan 2 15.6
Hoa Binh 5 13.6
Quang Binh 1 13.5
Bac Kan|Bac Can 3 10.1
Quang Tri 2 9.4
Binh Thuan 1 6.6
Binh Duong 2 6.4
Lang Son 1 4.5
Quang Ninh 1 3.6
Thanh Hoa 2 3.0
Thai Nguyen 1 1.9
Tay Ninh 1 1.5
Total 206 1,665.8
Source: GESTO (as of March 2017)28
Thanks to its rich river and stream systems, the country has great hydropower potential, estimated at about 35,000 MW. Of this, 60 per cent is in the North (the Da, Lo, Thao, Ma, Ca rivers), 27 per cent in the Central Region (the Se san, Srepok, Ba, Vu gia- Thu Bon, Huong rivers) and 13 per cent in the South (the Dong Nai river).29
Renewable energy policies
The market for renewable energy (RE) and energy efficiency in Viet Nam might still be limited in size, but it has definitely high potential. The country’s continued economic and demographic growth ensure a subsequent increase in energy demand. The Government has taken several measures (such as mechanisms, policies, incentives, and supporting schemes) to aid energy efficiency and the renewable energy sector. Although this is a positive development, there are still barriers that prevent renewable energy from being bankable, such as feed-in tariffs and energy pricing.32
In 2015, the Government adopted the Renewable Energy Development Strategy 2016-2030 with outlook until 2050, (REDS) which came into force in 2016. The REDS sets clear medium and long-term goals, in particular on biomass, wind, and solar technologies. The ultimate goal of the REDS strategy is to increase the utilization rate of RE from about 7 per cent in 2020 to more than 10 per cent in 2030. Besides, the strategy aims to reduce imports of coal and oil in order to cut greenhouse gas emissions: by 5 per cent by 2020, 25 per cent by 2030, and 45 per cent by 2050. The REDS also requires large power generation companies to reach 3 per cent of renewable power capacity by 2020, 10 per cent by 2030, and 20 per cent by 2050. 33
Wind power capacity should increase from 140 MW to approximately 2,000 MW by 2025 and 6,000 MW by 2030. Biomass in total electricity production should account for 1.2 per cent in 2025 and 2.1 per cent in 2030. Solar should increase from the current 850 MW to 2,000 MW in 2025 and 12,000 MW in 2030.
The aim is that total hydropower production shall total 24,600 MW in 2025 (pumped storage power plants with 1,200 MW) and 27,800 MW in 2030 (pumped storage power plants with 2,400 MW). With hydropower, particular attention will be paid to multipurpose projects combining also flood control, water supply, and power production into their scope. The share of hydropower in the total electricity production should decrease to 29.5 per cent in 2020, 20.5 per cent in 2025 and 15.5 per cent in 2030.8,17
The main instrument for the promotion of renewable energy in Viet Nam is the standardized Special Power Purchase Agreement for plants up to 30 MW and a standard tariff for small generators. There are also three feed-in-tariffs (FITs) in place for grid-connected renewable energy projects, namely for wind, biomass and solid waste.3
As of 2017, feed-in-tariffs in Viet Nam are among the lowest in the world – for wind they amounted to 7.8 US$ cents/kWh,

144
World Small HydropoWer development report 2019
for solid waste-to-energy 7.28 US$ cents/kWh to 10.05 US$ cents/kWh, for biomass to 7.34 US$ cents/kWh to 7.55 US$ cents/kWh, and for solar to 9.35 US$ cents/kWh. For small hydropower (below 30 MW) the avoided cost tariff is set at around 5 US$ cents/kWh, depending on the season and daily peaks.15,16
Relevant laws and regulations for renewable energy are:• The Law on Electricity, dated December 14, 2004;• Decision No. 1208/QD-TTg The National Power Devel-
opment Plan 2011-2020 with aims to reach development goals by 2030 (Master Plan VII), dated 21 July 2011;
• Decision No. 1855/QD-TTg Development Strategy of En-ergy’s National Renewable Viet Nam 2020 vision in 2050 dated December 27, 2007;
• The Renewable Energy Development Strategy 2016-2030 with outlook until 2050 (REDS), which came into force in 2016.
Barriers to small hydropower developmentAs it has been illustrated in this section, there are several barriers to the development of SHP in Viet Nam, mainly: • A lack of a strong institutional and regulatory framework;• A lack of expertise and violation of agreements with
subsequent high environmental and social risks;• Poor quality and safety control, with subsequent low
return of investment;• Feed-in-tariffs that remain unattractive to the investors;• Efficiency concerns due to the bad management of power
plants. 27,15
References
1. World Bank (n.d.). World Development Indicators: Vietnam. Available from http://databank.worldbank.org/data/reports.aspx?source=2&country=VNM&series=&period=.
2. International Energy Agency (n.d.). Viet Nam Electricity and heat for 2015. Available from http://www.iea.org/statistics/statistics-search/report/?country=Vietnam&product=electricityandheat.
3. Asian Development Bank (2015). Viet Nam: Energy Sector Assess-ment, Strategy and Road Map. Available from http://www.adb.org/sites/default/files/institutional-document/178616/vie-ener-gy-road-map.pdf.
4. McSweeney, C., New, M. &Lizcano, G. (2010). UNDP Climate Change Country Profiles: Vietnam. Available from http://coun-try-profiles.geog.ox.ac.uk/.
5. Socialist Republic of Viet Nam Government Portal (n.d.). Over-view on Vietnam geography. Available from www.chinhphu.vn/portal/page/portal/English/TheSocialistRepublicOfVietnam/AboutVietnam/AboutVietnamDetail?categoryId=10000103&ar-ticleId=10000505.
6. LIU, H., Masera, D. and Esser, L., eds. (2013). World Small Hy-dropower Development Report 2013.United Nations Industrial Development Organization; International Center on Small Hydro Power. Available from www.smallhydroworld.org.
7. World Bank Data (2016). Access to Electricity. https://data.world-
bank.org/indicator/EG.ELC.ACCS.ZS (accessed June 22, 2018)8. The Prime Minister (2011). Development plan of national elec
tricity in the period 2011-2020 and outlook to 2030 (Master Plan VII). Decision No. 1208/QDTT. Available from http://www.nti.org/media/pdfs/VietnamPowerDevelopmentPlan2030.pdf?_=1333146022.
9. Renewable Energy Project (n.d.). Renewable Energy in Vietnam, GIZ Wind Energy Project. Available from http://www.renew-ableenergy.org.vn/index.php?page=renewable-energy-in-viet-nam.
10. International Renewable Energy Agency (2015). Renewable Ener-gy Capacity Statistics 2015.Available from http://www.irena.org/DocumentDownloads/Publications/IRENA_RE_Capacity_Statis-tics_2015.pdf.
11. Thanhnien News (2014). Vietnam scraps a dozen planned hy-dropower projects. Available from www.thanhniennews.com/business/vietnam-scraps-a-dozen-planned-hydropower-proj-ects-29891.html.
12. Dao TrongTu, Le ThiThuyQuynh, Pham QuangTu and Bach Tan Sinh (2011). Sustainability assessment of Vietnam’s electric-ity planning. Available from http://www.mpowernetwork.org/Knowledge_Bank/Key_Reports/PDF/Research_Reports/HSAP_Rapid_Assessment_Vietnam.pdf.
13. Energy Alliance (2012). Case study power sector reform in Viet-nam. Technical report. Available from http://www.undp.org/content/dam/vietnam/docs/Publications/Power%20Sector%20Case%20Study_Energy%20Alliance_2012.pdf.
14. CIA The World Factbook (2018) Vietnam. https://www.cia.gov/library/publications/the-world-factbook/geos/vm.html
15. Das, Koushan (2017). Renewables in Vietnam: Current Opportu-nities and Future Outlook
http://www.vietnam-briefing.com/news/vietnams-push-for-renew-able-energy.html/ (accessed May 24, 2018)
16. Climatescope (2017). Vietnam Avoided Costs Tariffs for Re-newable Energy. http://global-climatescope.org/en/policies/#/policy/2472
17. Trong Thuc, Pham (n.d.). Director, Department of Renew-able Energy The General Directorate of Energy Ministry of Industry and Trade. Vietnam Renewable Energy devel-opment project to 2030 with outlook to 2050. https://www.google.com/url?sa=t&rct=j&q=&esrc=s&source=web&c-d=3&ved=0ahUKEwj2-eiBsv_bAhXMxrwKHVxEDqgQFgg-8MAI&url=http%3A%2F%2Fwww.vn.undp.org%2Fcontent%2F-dam%2Fvietnam%2Fdocs%2FPublications%2FMr%2520Thuc.pdf&usg=AOvVaw1YnqfG9nxNkWpREgKzrGvR (accessed July 2, 2018)
18. Electricity of Vietnam (2015). Vietnam Electricity Annual Report 2015. Available from http://cms.evn.com.vn/Portals/0/userfiles/tcdl/BCTN%202015_Fi_Final.pdf.
19. World Bank (2014). Cumulative Impacts and Joint Operation of Small-Scale Hydropower Cascades: Case Studies for Selected River Basins in Northwest Vietnam. Available from https://www.astae.net/sites/astae/files/publication/ASTAE_Vietnam%20SHP.pdf.
20. World Bank, ESMAP (2014). Small Hydro Resource Mapping in Vietnam Inception Report. Available from http://www-wds.worldbank.org/external/default/WDSContentServer/WDSP/IB/2015/04/20/000442464_20150420153158/Rendered/PD-F/958250ESM0P1450ption0Report02014012.pdf.
21. Industrial Decisions, Inc (2014). Study on the small hydro pow-

145
3.2. So
uth
-EaS
tErn
aS
ia
er project in the province of Lam Dong in Socialist Republic of Vietnam, Final Report. Prepared for the Ministry of Economy, Industry and Trade. Available from new Renewable Energy De-velopment Strategy to 2030 with an outlook to 2050
22. EIA (2017). Vietnam International Analysis. https://www.eia.gov/beta/international/analysis.cfm?iso=VNM (accessed May 24, 2018).
23. Ministry of Industry and Trade, General Directorate of Energy (2017). Viet Nam’s Power Development.
24. Dam, Duc (2016). Vietnam Power Industry. VCBS Vietcombank Securities. https://www.google.com/url?sa=t&rct=j&q=&esrc=s&source=web&cd=1&cad=r-ja&uact=8&ved=0ahUKEwiXx5idtP_bAhUKvrwKHeN-NClIQFggpMAA&url=https%3A%2F%2Fvcbs.com.vn%2Fvn%2FCommunication%2FGetReport%3Frepor-tId%3D4793&usg=AOvVaw3FpzWYBNSgYHse_nTvyM9W (accessed July 2, 2018)
25. Asia Development Bank (2011). Viet Nam’s Success in Increas-ing Access to Energy through Rural Electrification.https://www.google.com/url?sa=t&rct=j&q=&esrc=s&source=web&c-d=2&cad=rja&uact=8&ved=0ahUKEwj84d6vtP_bAhUF7r-wKHY-SBqgQFggwMAE&url=https%3A%2F%2Fthink-asia.org%2Fbitstream%2Fhandle%2F11540%2F963%2Fru-ral-electrification-vie.pdf%3Fsequence%3D1&usg=AOvVaw-3gh_-dlXF-gS2TkkottxfS (accessed July 2, 2018)
26. Vietnam Energy Online (n.d.). Beginning publicity and transpar-ency in electricity prices. http://nangluongvietnam.vn/news/en/electricity/beginning-publicity-and-transparency-in-electrici-ty-prices.html (accessed May 24, 2018).
27. Xialei, C., Singh, P. R., Xianlai, W., and Kremere, E., eds. (2016). World Small Hydropower Development Report 2016. United Nations Industrial Development Organization; Interna-tional Center on Small Hydro Power. Available from www.small-hydroworld.org.
28. GESTO (March 2017). Small Hydro Resource Mapping in Vietnam, Final Report. https://www.google.com/url?sa=t&rct=j&q=&esrc=s&source=web&cd=3&ved=0a-hUKEwiUtePMtP_bAhWDE7wKHUdWCMgQFgg-7MAI&url=http%3A%2F%2Fdocuments.worldbank.org%2F-curated%2Fen%2F246471504701826323%2Fpdf%2F119400-V1-ESMAP-P145513-PUBLIC-VietnamHydropowerMapping.pdf&usg=AOvVaw0QslFkbAlM_NZXcZVUWCQv (accessed July 2, 2018)
29. Vietnam National Mekong River Committee (2016). https://www.google.com/url?sa=t&rct=j&q=&esrc=s&source=web&c-d=1&cad=rja&uact=8&ved=0ahUKEwjw0rGktf_bAhULU-7wKHVQIAv4QFggpMAA&url=http%3A%2F%2Fwww.mrcmekong.org%2Fassets%2FPublications%2Fstrategies-work-prog%2FMRC-Stratigic-Plan-2016-2020.pdf&usg=AOv-Vaw1sv-st_GzZ2OS_yahoo_7H (accessed July 2, 2018)
30. Thanh Nguyen, Nhung Nguyen. Confessions of a hydropower calamity in Vietnam (2017). https://e.vnexpress.net/projects/confessions-of-a-hydropower-calamity-in-vietnam-3655314/index.html (accessed May 24, 2018)
31. Poindexter, Gregory B (2016). Vietnam reduces number of hydropower plants in its Power Development Plan 7. https://www.hydroworld.com/articles/2016/11/vietnam-reduces-num-ber-of-hydropower-plants-in-its-power-development-plan-7.html (accessed May 24, 2018)
32. Embassy of the Netherlands in Hanoi and Consulate General in
Ho Chi Minh City (2017). Renewable Energy in Vietnam, 2017. https://www.rvo.nl/sites/default/files/2017/11/factsheet-renew-able-energy-vietnam.pdf (accessed July 2, 2018)
33. IEA. Vietnam Renewable Energy Development Strategy 2016-2030 with outlook until 2050 (REDS) (n.d.). http://www.iea.org/policiesandmeasures/pams/vietnam/name-157135-en.php?return=PG5hdiBpZD0iYnJlYWRjcnVtYiI-PGEgaHJlZj0i-LyI-SG9tZTwvYT4gJnJhcXVvOyA8YSBocmVmPSIvcG9saWN-pZXNhbmRtZWFzdXJlcy8iPlBvbGljaWVzIGFuZCBNZWFzdX-JlczwvYT4gJnJhcXVvOyA8YSBocmVmPSIvcG9saWNpZXNhb-mRtZWFzdXJlcy9yZW5ld2FibGVlbmVyZ3kvIj5SZW5ld2FibG-UgRW5lcmd5PC9hPjwvbmF2Pg,,&s=dHlwZT1yZSZzdGF0dX-M9T2s (accessed May 24, 2018)
34. World weather and climate information (n.d.). Climate and av-erage monthly weather in Vietnam. https://weather-and-climate.com/average-monthly-Rainfall-Temperature-Sunshine-in-Viet-nam

146
World Small HydropoWer development report 2019

147
VIET NAM
PHILIPPINES
MYANMAR
CAMBODIA
MALAYSIA
THAILAND
LAO PDR
INDONESIA
TIMOR-LESTE
ARMENIA AZERBAIJANGEORGIA
TURKEY
SYRIAN ARAB REPUBLIC
JORDAN
LEBANON
ISRAELIRAQ
SAUDI ARABIA
Western AsiaStafford W. Sheehan, Catalytic Innovations
Introduction to the region
Western Asia is comprised of 18 countries with over 300,000,000 inhabitants. Within Western Asia there are five subregions with distinct climates: Anatolia (Turkey), the Arabian Peninsula (Bahrain, Kuwait, Oman, Qatar, Saudi Arabia, United Arab Emirates and Yemen), South Caucasus (Armenia, Azerbaijan and Georgia), the Fertile Crescent (Iraq, Israel, Jordan, Lebanon, the State of Palestine and the Syrian Arab Republic) and Mediterranean Islands (Cyprus). Some of these subregions are more conducive to hydropower deployment than others due to higher rainfall and natural water flows. For this reason, 10 countries among these have been identified to have significant hydropower potential and are covered in this report, these being Armenia, Azerbaijan, Georgia, Iraq, Israel, Jordan, Lebanon, Saudi Arabia, the Syrian Arab Republic and Turkey. An overview of these countries is given in Table 1.
Israel was not included in the World Small Hydropower Development Report (WSHPDR) 2016 and is a new addi-tion in the present issue. Saudi Arabia has been included and reported on since the WSHPDR 2016 but does not have any installed hydropower capacity due to its arid climate and large proven oil reserves.
Figure 1. Share of regional installed capacity of small hydropower up to 10 MW by country in Western Asia (%)
Turkey 84%Armenia 9%Georgia 4%Lebanon 1%Azerbaijan 1%Syrian Arab Republic 1%Jordan 0.4%Iraq 0.2%Israel 0.2%Saudi Arabia 0%
Source: WSHPDR 2019 3
The installed capacity of small hydropower (SHP) up to 10 MW in the Western Asian countries included in the present issue is reported to exceed 3.5 GW (Table 2). Most SHP deployed in the region is in Turkey, which has
3.5
World Small HydropoWEr dEvElopmEnt
rEport 2019
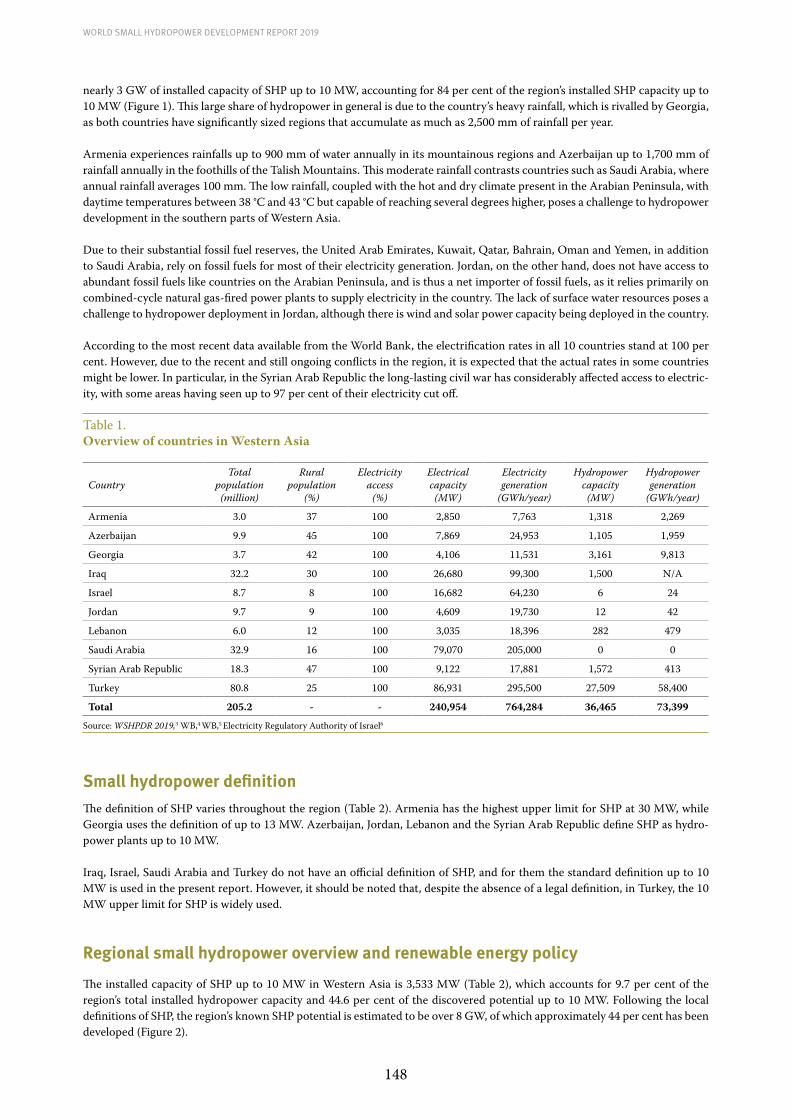
148
World Small HydropoWer development report 2019
nearly 3 GW of installed capacity of SHP up to 10 MW, accounting for 84 per cent of the region’s installed SHP capacity up to 10 MW (Figure 1). This large share of hydropower in general is due to the country’s heavy rainfall, which is rivalled by Georgia, as both countries have significantly sized regions that accumulate as much as 2,500 mm of rainfall per year.
Armenia experiences rainfalls up to 900 mm of water annually in its mountainous regions and Azerbaijan up to 1,700 mm of rainfall annually in the foothills of the Talish Mountains. This moderate rainfall contrasts countries such as Saudi Arabia, where annual rainfall averages 100 mm. The low rainfall, coupled with the hot and dry climate present in the Arabian Peninsula, with daytime temperatures between 38 °C and 43 °C but capable of reaching several degrees higher, poses a challenge to hydropower development in the southern parts of Western Asia.
Due to their substantial fossil fuel reserves, the United Arab Emirates, Kuwait, Qatar, Bahrain, Oman and Yemen, in addition to Saudi Arabia, rely on fossil fuels for most of their electricity generation. Jordan, on the other hand, does not have access to abundant fossil fuels like countries on the Arabian Peninsula, and is thus a net importer of fossil fuels, as it relies primarily on combined-cycle natural gas-fired power plants to supply electricity in the country. The lack of surface water resources poses a challenge to hydropower deployment in Jordan, although there is wind and solar power capacity being deployed in the country.
According to the most recent data available from the World Bank, the electrification rates in all 10 countries stand at 100 per cent. However, due to the recent and still ongoing conflicts in the region, it is expected that the actual rates in some countries might be lower. In particular, in the Syrian Arab Republic the long-lasting civil war has considerably affected access to electric-ity, with some areas having seen up to 97 per cent of their electricity cut off.
Table 1.Overview of countries in Western Asia
CountryTotal
population (million)
Rural population
(%)
Electricity access
(%)
Electrical capacity
(MW)
Electricity generation
(GWh/year)
Hydropower capacity
(MW)
Hydropower generation
(GWh/year)
Armenia 3.0 37 100 2,850 7,763 1,318 2,269
Azerbaijan 9.9 45 100 7,869 24,953 1,105 1,959
Georgia 3.7 42 100 4,106 11,531 3,161 9,813
Iraq 32.2 30 100 26,680 99,300 1,500 N/A
Israel 8.7 8 100 16,682 64,230 6 24
Jordan 9.7 9 100 4,609 19,730 12 42
Lebanon 6.0 12 100 3,035 18,396 282 479
Saudi Arabia 32.9 16 100 79,070 205,000 0 0
Syrian Arab Republic 18.3 47 100 9,122 17,881 1,572 413
Turkey 80.8 25 100 86,931 295,500 27,509 58,400
Total 205.2 - - 240,954 764,284 36,465 73,399 Source: WSHPDR 2019,3 WB,4 WB,5 Electricity Regulatory Authority of Israel6
Small hydropower definitionThe definition of SHP varies throughout the region (Table 2). Armenia has the highest upper limit for SHP at 30 MW, while Georgia uses the definition of up to 13 MW. Azerbaijan, Jordan, Lebanon and the Syrian Arab Republic define SHP as hydro-power plants up to 10 MW.
Iraq, Israel, Saudi Arabia and Turkey do not have an official definition of SHP, and for them the standard definition up to 10 MW is used in the present report. However, it should be noted that, despite the absence of a legal definition, in Turkey, the 10 MW upper limit for SHP is widely used.
Regional small hydropower overview and renewable energy policy
The installed capacity of SHP up to 10 MW in Western Asia is 3,533 MW (Table 2), which accounts for 9.7 per cent of the region’s total installed hydropower capacity and 44.6 per cent of the discovered potential up to 10 MW. Following the local definitions of SHP, the region’s known SHP potential is estimated to be over 8 GW, of which approximately 44 per cent has been developed (Figure 2).

149
3.5. WES
TERN
AS
iA
Between the WSHPDR 2016 and WSHPDR 2019, the installed SHP capacity (up to 10 MW for all countries, except Armenia) has more than doubled, largely due to developments in Turkey (Figure 3).
Table 2.Small hydropower capacities in Western Asia (local and ICSHP definition) (MW)
Country Local SHP definition
Installed capacity (local def.)
Potential capacity (local def.)
Installed (<10 MW)
Potential (<10 MW)
Armenia up to 30 353.0 422.0 327.8 327.8*
Azerbaijan up to 10 26.0 520.0 26.0 520.0
Georgia up to 13 178.0 335.5 142.3 187.4
Iraq - - - 6.0 26.4
Israel - - - 6.0 6.0*
Jordan up to 10 12.0 58.2 12.0 58.2
Lebanon up to 10 31.0 140.0 31.0 140.0
Saudi Arabia - - - 0 130.0
Syrian Arab Republic up to 10 20.8 20.8* 20.8 20.8*
Turkey up to 10** 2,961.3 6,500.0 2,961.3 6,500.0
Total - - 3,533 7,917 Source: WSHPDR 20193
Note:* The estimate is based on the installed capacity as no data on potential capacity is available. ** The threshold is generally used, but has not been defined in local legislation.
Figure 2. Utilized small hydropower potential by country in Western Asia (local SHP definition) (%)
Additional SHP potential
Installed SHP capacity
0
20
40
60
80
100
Isra
el
Syria
n Ar
abRe
publ
ic
Arm
enia
Geor
gia
Turk
ey
Iraq
Leba
non
Jord
an
Azer
baija
n
Saud
i Ara
bia
TOTA
L
Source: WSHPDR 20193
Note: This Figure illustrates data for local SHP definitions or the definition of up to 10 MW in the absence of an official local one. For Israel and Syria, additional potential capacities are not known.
An overview of SHP in the countries of Western Asia is outlined below. The information used in this section is extracted from the country profiles below, which provide detailed information on SHP capacity and potential, among other energy-related information.
As of early 2018, there was a total of 183 SHP plants in Armenia with a combined installed capacity of 353 MW, which gener-ated approximately 964 GWh in 2017. A further 36 SHP plants with an additional estimated potential capacity of 69 MW had received licences for construction, thus, indicating that approximately 84 per cent of the country’s known SHP potential has been developed. Between the WSHPDR 2016 and WSHPDR 2019, Armenia deployed 71 MW of SHP capacity. In general, the country’s energy strategy prioritizes the use of renewable energy sources, including geothermal and solar power.
In Azerbaijan, as of the end of 2017, there were 11 SHP plants with a combined capacity of approximately 26 MW. The economic potential of SHP is estimated to be at least 520 MW, indicating that approximately 5 per cent has been developed.

150
World Small HydropoWer development report 2019
Compared to the results of the WSHPDR 2016, installed capacity doubled. In 2016 and 2017, three new SHP plants were commissioned, another plant was commissioned in 2018 and three other plants were to be put into operation by the end of 2018. Azerbaijan possesses substantial renewable energy resources, and between 2016 and 2020 it has planned to introduce 420 MW of new renewable energy capacity (including wind power, solar power and biomass).
The total installed capacity of SHP plants in Georgia less than 13 MW is 177.98 MW, 142.34 MW of which is from plants of up to 10 MW. Currently there are 51 SHP plants (less than 10 MW) in operation, all of which are privately owned and most of them in need of refurbishment. Since the WSHPDR 2016, Georgia reports an additional 10 MW of SHP deployment. The SHP potential for plants below 13 MW is estimated at 335.5 MW, of which 187.4 MW is for plants up to 10 MW. Thus, approximately 53 per cent of SHP potential for plants up to 13 MW and approximately 76 per cent of plants up to 10 MW has been developed. Optimal utilization of water resources is one of the priorities of the Government of Georgia towards realizing the country’s national energy strategy and energy security.
The installed and potential capacities of SHP up to 10 MW in Iraq have shown no changes since the WSHPDR 2016, stand-ing at 6 MW and 26 MW, respectively. Thus, 23 per cent of the known potential for SHP up to 10 MW has been developed. Although there is no official definition, a capacity up to 80 MW is generally considered as SHP in the country. Following this definition, there are six SHP plants with a combined capacity of 251 MW, of which only one is below 10 MW. According to the National Water Development Strategy, hydropower should be developed as a by-product of any new reservoir. However, since 2013, no new hydropower capacities have been added or announced. In general, the development of renewable energy has been progressing rather slowly, hindered by the conflict with the Islamic State in Iraq and the Levant (Da’esh) and other systemic factors. The Ministry of Energy announced grid power losses of over 8 GW since the Islamic State intervention in 2014. The Government of Iraq is attempting to revitalize investment in energy resources with tax exemptions and support during the licensing, approval, implementation and operation processes. Decentralized electricity generation that does not rely on fossil fuel transportation, such as SHP, wind and solar power, could be ideal sources of energy for conflict regions in Iraq.
Israel is the newest addition in the WSHPDR 2019. In 2014, there were reported to be seven hydropower facilities that con-tributed a combined 6 MW to the country’s electrical grid. Several pumped storage hydropower facilities and new technologies were under development as of 2019, which may contribute to the potential for SHP in northern parts of the country. There are limited surveys on the potential capacity for SHP in the country, which represents a potential area for growth.
There are three SHP plants (up to 10 MW) in Jordan with a combined capacity of 12 MW. The potential of SHP is estimated at 58.15 MW, indicating that almost 21 per cent has been developed so far. Compared to the results of the WSHPDR 2016, installed and potential capacities remained unchanged. Thus, the contribution of hydropower to the country’s energy mix re-mains very small. At the same time, there are plans to develop SHP by utilizing the water flow of the Zarqa River, with a number of projects proposed to be installed at water treatment plants. By 2020, the Government aims to achieve a 10 per cent share of renewable energy in the country’s energy mix, with a particular focus being made on wind and solar power.
Lebanon has seven small, mini- and micro-hydropower plants with a total capacity of 31.2 MW. However, one of them is currently out of service. The potential capacity for SHP in Lebanon is estimated to be 139.8 MW, indicating that slightly more than 22 per cent has been developed. Compared to the WSHPDR 2016, installed and potential capacities remained the same. Hydropower is a major contributor to the renewable energy mix in the country, with Lebanon enjoying relatively better access to water than its neighbouring countries. Lebanon also has a significant wind power potential, especially in the north.
Currently, there is no installed hydropower capacity in Saudi Arabia. However, there is potential for installing SHP plants at existing dams, which is estimated to be at least 130 MW. Even though Saudi Arabia does not effectively use its renewable en-ergy resources (almost all its electricity is produced from the combustion of fossil fuels), the country is beginning to realize the benefits of curbing domestic oil consumption. The country has set a goal of producing almost half of its power from renewable energy sources by 2020.
The Syrian Arab Republic has four SHP plants with an overall installed capacity of 20.84 MW. There is no known SHP poten-tial for further development. While the country relies on local oil and gas, there is a significant potential for the exploitation of renewable resources, such as wind and solar power. However, the geopolitical upheaval in the Syrian Arab Republic has led to instability in electricity generation and challenges to further deployment. Notably, prior to the outbreak of the civil war, the Syrian Arab Republic produced 50 TWh of electricity in 2011. However, in 2017 this number decreased to below 20 TWh.
The leading country in the region in terms of SHP installed and potential capacity is Turkey. The potential of SHP up to 10 MW capacity of Turkey is 6.5 GW, with nearly half installed. As of April 2018, there were 300 hydropower plants with capacity up to 10 MW. SHP installed capacity has more than doubled compared to the WSHPDR 2016, which has been achieved thanks to SHP incentives and increased investment in the area. The Ministry of Energy and Natural Resources aims to have 30 per cent of the total electricity mix covered by renewable energy sources by 2023.

151
3.5. WES
TERN
AS
iA
Four countries in the region have introduced feed-in tariff (FIT) schemes: Armenia, Israel, the Syrian Arab Republic and Tur-key. As opposed to the other three countries, FITs in Israel only apply to solar and wind power and do not cover SHP. Turkey also uses an auction system, which has led to record-low prices for deployment. Azerbaijan, Iraq and Lebanon do not have FITs but offer other financial mechanisms to support renewable energy projects.
Figure 3.Change in installed capacity of small hydropower from WSHPDR 2013 to 2019 by country in Western Asia (MW)
0
500
1,000
1,500
2,000
2,500
3,000
3,500
4,000
WSHPDR 2019
WSHPDR 2016
WSHPDR 2013
2,961.3
353.0142.3 31.0 26.0 20.8 12.0 6.0 6.0 0
3,558.4
Turk
ey
Arm
enia
Geor
gia
Leba
non
Azer
baija
n
Syria
n Ar
abRe
publ
ic
Jord
an Iraq
Isra
el
Saud
i Ara
bia
TOTA
L
Source: WSHPDR 2013,1 WSHPDR 2016,2 WSHPDR 20193
Note: WSHPDR stands for World Small Hydropower Development Report. For Armenia, the data shown is for SHP up to 30 MW; for other countries, the data shown is for SHP up to 10 MW.
Barriers to small hydropower development
The barriers to SHP development vary across the region. In Armenia, the sector faces technical challenges; in particular a lack of access to automation and modern control technologies. Many of the SHP plants are technologically lacking due to poor equipment performance and failure, pipe and material/civil work problems and substandard engineering and/or construction. Another barrier is the lack of transparency in the regulatory process, which allows for delays in obtaining approvals and other problems.
The development of SHP in Azerbaijan is hindered by the absence of regular updates of hydrological data, problems with connecting to the national grid, the mountainous terrain and low electricity tariffs.
Georgia also lacks up-to-date hydrological information, which complicates SHP development. Furthermore, the initial costs of SHP projects are high due to the absence of financial incentives and the limited local capacity to manufacture SHP equipment.
In Iraq, the development of SHP, as well as renewable energy technologies in general, has been significantly impeded by the conflict with the Islamic. There is also a lack of financial resources, and the condition of the existing electrical infrastructure is poor. Another important barrier is inconsistent governmental policies.
One of the biggest barriers to SHP development in Israel is the unequal distribution of precipitation in the country, both temporally and geographically. Furthermore, recent inexpensive natural gas market prices, the near-monopoly the state has on the electricity sector and an emphasis on solar power rather than hydropower also contribute to the slow development of SHP.
In Jordan, the major barriers to SHP development are the limited availability of surface water resources, the lack of local technical SHP capabilities, the lack of incentives for the private sector and the limited access to funding, compounded by an unstable political situation in the region.
The electricity sector of Lebanon remains controlled by the state, while the decision-making process and administrative requirements in the hydropower sector are complex due to multiple stakeholders involved. In addition, the geology of Lebanon is such that, in many cases, high costs of dam construction and limited water resources make the development of hydropower

152
facilities not feasible. Moreover, water has become increasingly scarce over the years, with needs for potable water and irrigation increasing, all of which complicates SHP development.
The lack of water resources is the major barrier for SHP in Saudi Arabia. Similarly, in the Syrian Arab Republic, hydropower resources of all sizes are limited by low precipitation and river flows. Further studies have to be carried out in the Syrian Arab Republic to analyse the scope for small and micro-hydropower. Furthermore, the ongoing civil war has put almost all develop-ment plans in the electricity sector on halt.
Turkey is among the countries most affected by climate change and variability, which has led to a decrease in surface waters. Also, the legal framework in Turkey encourages the private sector to move toward investment in large hydropower for poten-tially higher profits. Lastly, as a result of inappropriate site selection, exclusion of key stakeholders and unplanned basin man-agement the public perception of hydropower facilities may affect investors.
References
1. LIU, H., Masera, D. and Esser, L., eds. (2013). World Small Hydropower Development Report 2013. United Nations Industrial Development Organization; International Center on Small Hydro Power. Available from www.smallhydroworld.org.
2. Xialei, C., Singh, P. R., Xianlai, W., and Kremere, E., eds. (2016). World Small Hydropower Development Report 2016. United Nations Industrial Development Organization; International Center on Small Hydro Power. Available from www.smallhydroworld.org.
3. LIU, D., LIU, H., WANG, X., and Kremere, E., eds. (2019). World Small Hydropower Development Report 2019. United Nations Industrial Development Organization; International Center on Small Hydro Power. Available from www.smallhydroworld.org.
4. World Bank (2017). Rural population (% of total population). Available from https://data.worldbank.org/indicator/SP.RUR.TOTL.ZS
5. World Bank (2016). Access the electricity (% of population). Available from https://data.worldbank.org/indicator/EG.ELC.ACCS.ZS
6. Electricity Regulatory Authority of Israel (2017). Electricity Market Report for 2017. Available from https://pua.gov.il/publications/pressreleases/documents/%D7%93%D7%95’’%D7%97%20%D7%9E%D7%A6%D7%91%20%D7%9E%D7%A9%D7%A7%20%D7%94%D7%97%D7%A9%D7%9E%D7%9C%20%D7%9C%D7%A9%D7%A0%D7%AA%202017%20-%20%D7%90%D7%A0%D7%92%D7%9C%D7%99%D7%AA.pdf

153
3.5. WES
TERN
AS
iA
Armeniavahan Sargsyan and Karine Sargsyan, Scientific research Institute of Energy
Key factsPopulation 2,986,1001
Area 29,743 km2 1
Climate In Armenia, the climate varies from subtropical to continental. In the southern plain regions, the climate is arid and extremely continental. The climate in the northern mountainous regions is mil-der and wetter. Summers are dry and sunny, lasting from June to mid-September. The temperature varies between 22 °C and 36 °C. Winters last from December to February with temperatures ranging between -5 °C and -10 °C.1
Topography Armenia is a mountainous country with the lowest point near the Debed River in the north at 375 metres above sea level. The highest point is the northern peak of Mount Aragats at 4,095 metres. The average altitude is 1,850 metres, but the variations in altitude (up to 3,700 metres, but more generally 1,500-2,000 metres) have important effects on the climatic and landscape zones within the country.1
Rain pattern Average annual precipitation is 570 mm, ranging from 114 mm in the semi-desert zone to approximately 900 mm in the high mountains. The mountain ranges of the Armenian territory receive heavy rainfall throughout the year. There are two rainy seasons in Armenia: the first lasts from April to June and the second from October to November.1
Hydrology Armenia is a landlocked country; however, it features one of the largest alpine and freshwater lakes in the world. Lake Sevan has an area of 940 km2, covering approximately one sixth of the country’s territory, and is located at 1,900 metres above sea level. The largest river in Armenia is the Araks, which flows along the border with Iran and Turkey, however, only a portion flows through Armenian territory. There are no other major rivers in Armenia, but the country’s river network is fairly dense, with 215 rivers longer than 10 km at a total length of 13,000 km. The majority of these rivers do not have a permanent flow and dry up in the summer months. The spatial and seasonal distribution of water resources in Armenia is extremely uneven. In particular, water is scarce in the densely popu-lated watershed basin of the Hrazdan River. During the dry seasons, the flow is less than 65 per cent of the annual average, and the maximum and minimum flow ratio can be in the range of 10 to 1.1,12
Electricity sector overview
The installed capacity in 2017 was 2,850 MW, while the available capacity was approximately 2,766 MW. Approximately 46 per cent of total installed capacity (1,318 MW) was from hydropower; 40 per cent (1,122 MW) was from thermal power plants; and 14 per cent (407.5 MW) was from nuclear power. Wind power accounted for less than 0.1 per cent (Figure 1).7 There is also a further 1,268 MW of thermal power capacity, which is, however, from plants and units that are presently out of operation or partly dismantled and, hence, not included in the total installed capacity.7
In 2017, total electricity generation was 7,762.9 GWh. Approximately 37 per cent (2,871.7 GWh) was provided by thermal power; 34 per cent (2,619.6 GWh) was provided by nuclear power; and 29 per cent (2,269.1 GWh) was provided by hydropower. The contribution of wind and solar power was negligible at approximately 0.033 per cent (Figure 2).6 The electrification rate is 100 per cent. Customers have full access to the electrical network and grid connection is available to any new user.
Figure 1. Installed electricity capacity by source in Armenia (MW)
Hydropower
Thermal power
Nuclear power
Wind &solar power
1,318.0
1,122.0
407.5
2.9
Source: National Statistical Service,7 PSRC,15 Scientific Research Institute of Energy
Armenia possesses rather scarce natural resources. Thermal power plants are fuelled mainly by natural gas. The country possesses no oil reserves, no oil production and no refineries. There are no oil pipelines, and refined products arrive through rail or truck shipments.2,13
3.5.1
World Small HydropoWEr dEvElopmEnt
rEport 2019

154
World Small HydropoWer development report 2019
Figure 2. Annual electricity generation by source in Armenia (GWh)
Thermal power
Nuclear power
Hydropower
Wind &solar power
2,871.7
2,619.6
2,269.1
2.5
Source: PSRC6
The country has a single nuclear power plant which meets between 30 and 50 per cent of the electricity needs depending on plant uptime.13 However, the Government faces international pressure to decommission this plant as it is considered unsafe, though the Government is reluctant to do so until alternative generating capacity is online, and the plant is scheduled to operate until 2026.13
Hydropower plants meet between 20 and 40 per cent of the country’s needs depending on rainfall, which exhibits significant annual variation. Power generation from the Sevan-Hrazdan Cascade has had to be reduced because of the drop in the water level of Lake Sevan it was causing. This reduction in generation has been compensated for by thermal plants.13 Armenia has renewable energy plants that can already compete with conventional sources in terms of electricity generation. Alongside hydropower, potential wind power projects (WPPs) with a total potential capacity of 195 MW and generation of 0.55 GWh per year have been identified.8
Operation of the power market is based on the Law of the Republic of Armenia on Energy. The Ministry of Energy and Natural Resources of Armenia is responsible for the implementation of the state policy on energy and natural resources. The market regulation for the setting of tariffs and issuing of operational licences is under the authority of the Public Services Regulatory Commission (PSRC).3,13 The power market is split into three functional areas: generation, transmission and distribution. Table 1 provides details of the principle generating plants including tariffs set by the PSRC for these plants. These tariffs were effective from 2017 and were intended to cover all expenses. In addition, there are privately owned small hydropower (SHP) plants and a state-owned wind farm.
High Voltage Electric Networks Closed Joint-Stock Company (CJSC) is responsible for transmitting power produced by generating companies to the distribution company, as well as transporting both electricity imports and exports from and to neighbouring countries. High Voltage Electric Networks CJSC is responsible for distribution and is the sole buyer of power from all generating companies, as well as the sole seller of power to all customers at tariffs set by the PSRC.13
Table 1 Capacity, ownership and wholesale tariffs for main power plants in Armenia
Power plant OwnershipInstalled capacity
(MW)
Tariff for electricity
(AMD (US$) per
kWh)*
Tariff for capacity
(AMD (US$) per kW)*
Armenian nuclear power plant
State 407.5 6.78 (0.014)
4,318.14 (8.94)
Yerevan combined cycle gas turbine
State 242 18.55 (0.038)
6,122.76 (12.7)
Hrazdan unit 5 (thermal)
Private 480 30.47 (0.063)
805.42 (1.67)
Hrazdan thermal power plant
Private 400 37.2 (0.077)
1,127.41 (2.34)
Sevan- Hrazdan hydropower plants cascade
Private 561 10.09 (0.02)
711.07 (1.47)
Vorotan hydropower plants cascade
Private 404 7.99 (0.017)
1,913.63 (3.96)
Source: PSRC5,6
Note: * Includes 20 per cent VAT
Table 2. Electricity tariffs for consumers in Armenia
Consumer typeDay time
(AMD (US$) per kWh incl. VAT)
Night time (AMD (US$) per kWh incl. VAT)
110 kV and above voltage consumers
29.48 (0.061) 33.48 (0.070)
35 kV voltage consumers 31.98 (0.067) 35.98 (0.075)
6 (10) kV voltage consumers
31.98 (0.067) 41.98 (0.087)
0.38 kV voltage consum-ers & Residential Sector
34.98 (0.073) 44.98 (0.094)
Residential sector low income
30.00 (0.062) 40.00 (0.083)
Source: PSRC5
Note: Night time tariffs are from 22:00 pm to 06:00 am, starting from 02:00 am of the last Sunday of March until 03:00 am of last Sunday of October; and from 23:00 pm to 07:00 am, starting from 03:00 am of last Sunday of October until 02:00 am of the last Sunday of March.
In addition, the National Dispatch Centre is responsible for the maintenance of technically admissible steady-state operations of the system. It also manages the system in power emergencies and the restoration of the system to acceptable operating conditions in the event of system emergencies. The Settlement Centre, by means of the automated data acquisition and metering system, collects and processes data on power flows in the electric network and on technical parameters of the regime, as well as provides the processed data to other

155
3.5. WES
TERN
AS
iA
market participants.4,13 The tariffs for final consumers set by PSRC depend on the level of the feeding voltage and on the hour of usage.5,13 The consumer tariffs effective from 1 January 2017 are presented in Table 2.
Small hydropower sector overviewAccording to the Ministry of Energy Infrastructures and Natural Resources of Armenia, small hydropower plants are defined as hydropower plants with a total installed capacity of up to 30 MW.
As of 1 January 2018, there was a total of 183 small hydropower plants with a total installed capacity of 353 MW, which generated approximately 964 GWh in 2017.6,8 Therefore, in 2017 the small hydropower industry represented approximately 27 per cent of total hydropower installed capacity and supplied approximately 12 per cent of the total annual electricity generation in Armenia.6,8
A further 36 small hydropower plants with an additional estimated potential capacity of 69 MW and estimated annual generation of 250.6 GWh have received licences for construction.8 These data indicate that approximately 84 per cent of the total small hydropower potential in the country has been developed.8,9
Compared to the results of the World Small Hydropower Development Report (WSHPDR) 2016, small hydropower capacity has increased by approximately 25 per cent, while potential capacity has increased by approximately 7 per cent (Figure 3).
Figure 3. Small hydropower capacities 2013/2016/2019 in Armenia (MW)
0 100 200 300 400 500
PotentialCapacity
Installed Capacity
422 396 430
353 282 158
WSHPDR 2019WSHPDR 2016WSHPDR 2013
Source: PSRC,8 WSHPDR 2016,13 WSHPDR 201314
Note: The comparison is between data from WSHPDR 2013, WSHPDR 2016 and WSHPDR 2019.
The majority of the small hydropower plants, either under construction or operational, are run-of-river type plants. There are 49 small hydropower sites and plants on irrigation systems with 247 GWh of electricity generation and 86,374 kW of installed capacity, 160 on natural water flows (1,700 GWh and 332,188 kW), and 10 on drinking water systems (24 GWh and 4,183 kW).8 Approximately 73 per cent are on natural water flows, 22 per cent are part of irrigation systems and 5 per cent are part of drinking water systems (Figure 4).
Figure 4. Small hydropower sites and plants by water source (%)
Natural water flows 73%Irrigation system 22%Drinking water systems 5%
Source: PSRC8
Renewable energy policyThe Government’s renewable energy strategy is driven by the overarching goals of improving energy security, ensuring affordable energy supply and maximizing the use of the country’s indigenous energy resources. The 2013 Decree of the President of Armenia approved the Energy Security Concept for the country, which prioritizes the use of renewable energy resources, while the Government’s Development Strategy for 2012-2025 specifically calls for the development of indigenous renewable energy resources. The targets include developing geothermal power installed capacity to 28.5 MW and utility-scale solar photovoltaic power capacity to between 40 MW and 50 MW.10,13 Following this target, in 2018 the Government approved a 55 MW solar power project.16
In 2007, the PSRC set renewable energy feed-in tariffs (FITs) for small hydropower plants, wind, and biomass to stimulate private investment. The FIT regime guarantees purchase of all the power generated by renewable energy plants for 15 years. Tariffs are adjusted annually in line with changes in inflation and exchange rates. More recently, the Government took steps to streamline the process of developing renewable energy projects, including relaxing tax obligations for some investments.13
As of 1 January 2018, the FIT for small hydropower plants built on natural water streams was AMD 23.805 (US$ 0.049) per kWh, VAT excluded; for small hydropower plants built on irrigation systems it was AMD 15.867 (US$ 0.033) per kWh, VAT excluded; and for small hydropower plants built on natural drinking sources was AMD 10.579 (US$ 0.022) per kWh, VAT excluded. The FIT for wind farms was AMD 42.739 (US$ 0.12) per kWh, VAT excluded.11
Barriers to small hydropower developmentConstruction of small hydropower plants in Armenia is a leading course of action towards the development of the renewable energy sector in the country. However, the main technical challenge for small hydropower development in Armenia has been the lack of access to automation and

156
World Small HydropoWer development report 2019
modern control technologies. There is a consensus that many of the small hydropower plants are technologically substandard due to several factors:• Poor equipment performance and failure;• Pipe and materials/civil works problems;• Substandard or incorrect engineering and/or
construction.13
Additional barriers include:• Problems with Power Purchase Agreements (PPA);• Concurrent term, licence and water use permits;• Construction versus operational licence;• Ownership rights;• Land classification reform;• Uniform and effective environmental enforcement.13
A common theme among all these barriers is a lack of trans-parency, which allows for delays in the approval processes or other problems.13
References
1. National Statistical Service of the Republic of Armenia (2017). Statistical Yearbook of Armenia. Available from http://armstat.am/file/doc/99504338.pdf
2. Eurasian Coal Portal, Armenia, (n.d.) Available from http://www.eurasiancoal.com/countries/armenia.html
3. Public Services Regulatory Commission of the Republic of Armenia, Official website, (n.d.) Available from http://www.psrc.am/
4. United States Agency International Development (USAID) (2015). Final Report: Armenia Least-Cost Energy Development Plan. Available from http://leds.am/lr/task1/Armenia%20Least-%20Cost%20Energy%20Development%20Plan_Final/ALCEDP_Final%20report_English.pdf
5. Public Services Regulatory Commission of the Republic of Armenia (n.d.). Consumers Tariffs. Available from http://psrc.am/images/docs/monitoring/electric/Texekanq_Sakagner_Sayt.pdf
6. Public Services Regulatory Commission of the Republic of Armenia (2017). The Electricity Reports. Available from http://psrc.am/images/docs/reports/electric/2017/4-er/Himnakan_bnutagrer_2017-4.pdf
7. National Statistical Service of the Republic of Armenia (2017). Industry. Available from http://armstat.am/file/doc/99504393.pdf
8. Public Services Regulatory Commission of the Republic of Armenia (n.d.). Licensed Electricity Companies. Available from http://psrc.am/am/sectors/electric/license-companies
9. EcoTeam Energy and Environmental consulting (2017). Assessment of renewable energy potential in Armenia, Available from http://users.freenet.am/~ecoteam/Aug3_Final_Renewable%20%20energy%20potential%20in%20Armenia.pdf
10. Scaling Up Renewable Energy Program (SREP), The Role of Renewable Energy in Armenia, Government Strategy for the Renewable Energy Sector (2014).
11. Armenia Renewable Resources And Energy Efficiency Fund (2011). Renewable Energy Tariffs. Available from http://r2e2.am/en/2011/06/tariffs/
12. Ministry of Nature Protection (2015). Third National Communication on Climate Change. Available from http://www.nature-ic.am/wp-content/uploads/2013/10/1.Armenias-TNC_2015_ENG.pdf
13. Xialei, C., Singh, P. R., Xianlai, W., and Kremere, E., eds. (2016). World Small Hydropower Development Report 2016. United Nations Industrial Development Organization; International Center on Small Hydro Power. Available from www.smallhydroworld.org.
14. Liu, H., Masera, D. and Esser, L., eds. World Small Hydropower Development Report 2013, United Nations Industrial Development Organization; International Center on Small Hydro Power (2013)
15. Public Services Regulatory Commission of the Republic of Armenia (n.d.). Electric Energy Reports. Available from http://psrc.am/en/sectors/electric/reports
16. Renewable Energy World (2018). 55 MW Masrik-1 Project Paunches Utility-Scale Solar for Armenia. Renewable Energy World, 14 May 2018. Available from https://www.renewableenergyworld.com/articles/2018/05/55-mw-masrik-1-project-launches-utility-scale-solar-for-armenia.html

157
3.5. WES
TERN
AS
iA
Azerbaijan Sahib Khalilov and Fagan abdurahmanov, State agency for alternative and renewable Energy Sources of the republic of azerbaijan (SaarES)
Key factsPopulation 9,862,4291
Area 86,900 km2
Climate Azerbaijan is situated at the crossroads of the temperate and subtropical climate zones, with 33 per cent of the territory being located in the temperate zone and 65 per cent in the subtropical zone. Since Azerbaijan is predominantly a mountainous country, the temperature changes depending on altitude. There are snow-covered mountain peaks, but the Aran region can also witness severe heat. The average annual temperature is 14.5 °C in the Kura-Araz lowland and below 0 °C on mountain peaks. The lowest temperature was recorded in the higher mountainous area, at -45 °C, which is considered an absolute minimum. The Araz River valley also recorded -32 °C. The absolute maximum temperature of 44 °C was observed in the town of Julfa.2
Topography Azerbaijan is situated in the eastern part of the southern Caucasus Mountains, on the west coast of the Caspian Sea. The average elevation throughout the country is 657 metres above sea level. The highest point is Mount Bazarduzu at 4,466 metres and the lowest point is the Caspian coastal lowland at 28 metres below sea level.3
Rain pattern Precipitation is distributed very unevenly over the territory. The Absheron peninsula and the Araz riverside areas of the Nakhchivan Autonomous Republic receive less rainfall (below 200 mm). Annual precipitation is typically 200-300 mm in the Kura-Araz lowland and 600-800 mm per year in the Lower Caucasus and on the north-eastern slopes of the Upper Caucasus. On the southern slopes of the Upper Caucasus, which rise above 2,000-2,500 metres, annual precipitation amounts to 1,200-1,300 mm. The highest value of rainfall was recorded in the southern part of the Lankaran lowland and at the foothills of the Talish Mountains (1,200-1,700 mm).4
Hydrology A very dense river network covers the territory of Azerbaijan, with approximately 8,400 small and large rivers, of which 850 stretch for more than 5 km. There are only 24 rivers with a length of more than 100 km. The Kura and Araz Rivers, which are the longest rivers of the Caucasus, serve as the main irrigation and hydropower generation sources in Azerbaijan.4
Electricity sector overview
The net capacity of all power stations in Azerbaijan as of the end of 2016 amounted to 7,869 MW, of which 1,105 MW was from hydropower.5 In 2016, electricity generation was at 24,953 GWh, of which thermal power accounted for 91 per cent, hydropower for almost 8 per cent, electricity generation from waste incineration for less than 1 per cent and wind and solar power for approximately 0.1 per cent each (Figure 1).6 Almost 91 per cent of electricity was generated by state-owned power plants and the remaining 9 per cent by autoproducers.5 The electrification rate in Azerbaijan is 100 per cent, both in rural and urban areas.7
Over the past 10 years the electricity generating capacity of Azerbaijan increased by 40 per cent, which has allowed it not only to meet the domestic demand but also to export excess electricity. In 2016, Azerbaijan exported 1,096 GWh of electricity, compared to 265 GWh in 2015, and 489 GWh in 2014.5 The Government aims to further increase its electricity exporting capacity, in particular to the European markets.
Figure 1. Annual electricity generation by source in Azerbaijan (GWh)
0 5000 10000 15000 20000 25000
Thermal power
Hydropower
Waste
Solar power
Wind power
22,761.0
1,959.3
174.5
35.3
22.8
Source: State Statistical Committee 6
Another objective of the Government has been to diversify the country’s energy mix and develop the non-oil sector.8 In 2009, the State Agency for Alternative and Renewable Energy Sources (SAARES) was established to serve as the central executive authority responsible for pursuing
3.5.2
World Small HydropoWEr dEvElopmEnt
rEport 2019
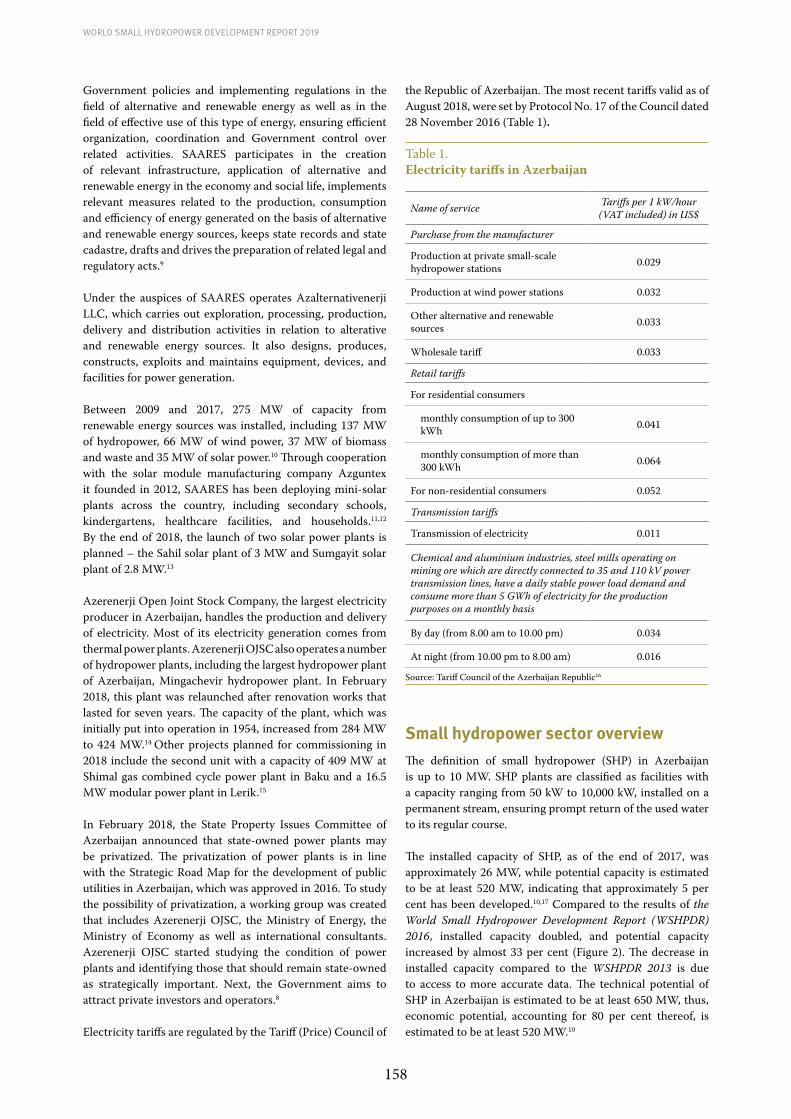
158
World Small HydropoWer development report 2019
Government policies and implementing regulations in the field of alternative and renewable energy as well as in the field of effective use of this type of energy, ensuring efficient organization, coordination and Government control over related activities. SAARES participates in the creation of relevant infrastructure, application of alternative and renewable energy in the economy and social life, implements relevant measures related to the production, consumption and efficiency of energy generated on the basis of alternative and renewable energy sources, keeps state records and state cadastre, drafts and drives the preparation of related legal and regulatory acts.9
Under the auspices of SAARES operates Azalternativenerji LLC, which carries out exploration, processing, production, delivery and distribution activities in relation to alterative and renewable energy sources. It also designs, produces, constructs, exploits and maintains equipment, devices, and facilities for power generation.
Between 2009 and 2017, 275 MW of capacity from renewable energy sources was installed, including 137 MW of hydropower, 66 MW of wind power, 37 MW of biomass and waste and 35 MW of solar power.10 Through cooperation with the solar module manufacturing company Azguntex it founded in 2012, SAARES has been deploying mini-solar plants across the country, including secondary schools, kindergartens, healthcare facilities, and households.11,12 By the end of 2018, the launch of two solar power plants is planned – the Sahil solar plant of 3 MW and Sumgayit solar plant of 2.8 MW.13
Azerenerji Open Joint Stock Company, the largest electricity producer in Azerbaijan, handles the production and delivery of electricity. Most of its electricity generation comes from thermal power plants. Azerenerji OJSC also operates a number of hydropower plants, including the largest hydropower plant of Azerbaijan, Mingachevir hydropower plant. In February 2018, this plant was relaunched after renovation works that lasted for seven years. The capacity of the plant, which was initially put into operation in 1954, increased from 284 MW to 424 MW.14 Other projects planned for commissioning in 2018 include the second unit with a capacity of 409 MW at Shimal gas combined cycle power plant in Baku and a 16.5 MW modular power plant in Lerik.15
In February 2018, the State Property Issues Committee of Azerbaijan announced that state-owned power plants may be privatized. The privatization of power plants is in line with the Strategic Road Map for the development of public utilities in Azerbaijan, which was approved in 2016. To study the possibility of privatization, a working group was created that includes Azerenerji OJSC, the Ministry of Energy, the Ministry of Economy as well as international consultants. Azerenerji OJSC started studying the condition of power plants and identifying those that should remain state-owned as strategically important. Next, the Government aims to attract private investors and operators.8
Electricity tariffs are regulated by the Tariff (Price) Council of
the Republic of Azerbaijan. The most recent tariffs valid as of August 2018, were set by Protocol No. 17 of the Council dated 28 November 2016 (Table 1).
Table 1.Electricity tariffs in Azerbaijan
Name of service Tariffs per 1 kW/hour(VAT included) in US$
Purchase from the manufacturer
Production at private small-scale hydropower stations 0.029
Production at wind power stations 0.032
Other alternative and renewable sources 0.033
Wholesale tariff 0.033
Retail tariffs
For residential consumers
monthly consumption of up to 300 kWh 0.041
monthly consumption of more than 300 kWh 0.064
For non-residential consumers 0.052
Transmission tariffs
Transmission of electricity 0.011
Chemical and aluminium industries, steel mills operating on mining ore which are directly connected to 35 and 110 kV power transmission lines, have a daily stable power load demand and consume more than 5 GWh of electricity for the production purposes on a monthly basis
By day (from 8.00 am to 10.00 pm) 0.034
At night (from 10.00 pm to 8.00 am) 0.016 Source: Tariff Council of the Azerbaijan Republic16
Small hydropower sector overviewThe definition of small hydropower (SHP) in Azerbaijan is up to 10 MW. SHP plants are classified as facilities with a capacity ranging from 50 kW to 10,000 kW, installed on a permanent stream, ensuring prompt return of the used water to its regular course.
The installed capacity of SHP, as of the end of 2017, was approximately 26 MW, while potential capacity is estimated to be at least 520 MW, indicating that approximately 5 per cent has been developed.10,17 Compared to the results of the World Small Hydropower Development Report (WSHPDR) 2016, installed capacity doubled, and potential capacity increased by almost 33 per cent (Figure 2). The decrease in installed capacity compared to the WSHPDR 2013 is due to access to more accurate data. The technical potential of SHP in Azerbaijan is estimated to be at least 650 MW, thus, economic potential, accounting for 80 per cent thereof, is estimated to be at least 520 MW.10

159
3.5. WES
TERN
AS
iA
Figure 2. Small hydropower capacities 2013/2016/2019 in Azerbaijan (MW)
0 100 200 300 400 500 600
PotentialCapacity
Installed Capacity
520 392 392
26 13 42
WSHPDR 2019WSHPDR 2016WSHPDR 2013
Source: SAARES,10 SAARES,17 WSHPDR 2016,18 WSHPDR 201319
Note: The comparison is between data from WSHPDR 2013, WSHPDR 2016 and WSHPDR 2019.
As of the end of 2017, there were 11 small hydropower plants (Table 2).17 In 2016 and 2017, three new plants were commissioned – Balakan SHP (1.5 MW), Chichakli SHP (3 MW) and Ismayilli-2 SHP (1.6 MW).20,21 At the time of writing of this report, another small hydropower plant had been commissioned in 2018 – Astara-1 with a capacity of 1.7 MW. Furthermore three other plants, Oguz-1, Oguz-2 and Oguz-3, with a combined capacity of 3.6 MW, were to be put in operation by the end of the year.15
Table 2.Small hydropower plants in Azerbaijan
Name of the plant Installed capacity (MW)
Vayxir 5.00
Mughan 4.05
Goychay 3.10
Chichakli 3.00
Shekii 1.88
Astara 1.70
Ismayilli-1 1.60
Ismayilli-2 1.60
Balakan-1 1.50
Arpachay-2 1.40
Qusar 1.00
Total 25.83 Source: SAARES17
Renewable energy policy
Azerbaijan possesses substantial renewable energy resources. With average annual wind speed ranging between 7 and 8.5 m/sec at elevations above 80 metres, the theoretical wind power potential of Azerbaijan exceeds 15,000 MW, whereas economic potential is estimated at 3,000 MW. The regions considered most favourable for wind power development are on the coast of the Caspian Sea, from northern Shabran to Sumgait, the Gobustan district, the Absheron peninsula and the Nakhchivan Autonomous republic. The Kur-Araz lowland area, the Absheron peninsula, Gobustan district and Nakhchivan are considered to have the best potential for solar
power production. With the mean annual duration of solar radiation of 2,000 to 3,000 hours, the theoretical potential of solar power is estimated at 115,200 MW, whereas economic potential is at 23,040 MW.8,18
The “Strategic Roadmap on the development of utility services (electricity, heating, water and natural gas supply) in the republic of Azerbaijan,” adopted on 6 December 2016, foresees the introduction of renewable energy projects with a combined capacity of 420 MW (including 350 MW of wind power, 50 MW solar power and 20 MW of biomass) by 2020.10
A number of important legal and regulatory changes have been adopted in the Republic of Azerbaijan, in addition to those aimed at boosting the development of SAARES. Relevant Presidential Decrees, and orders and decisions of the Cabinet of Ministers have been signed, and implementation tools have been defined for those legal and regulatory acts. Currently, work is underway to draft other legal and regulatory changes. The key legal and regulatory acts pertaining to alternative and renewable energy sources include:• Law of the Republic of Azerbaijan on the Use of Energy
Resources (30 May 1996 94-IQ);• Law of the Republic of Azerbaijan on Electrical Energy (3
April 1998 459-IQ);• Law of the Republic of Azerbaijan on Energy (24 Novem-
ber 1998 541-IQ);• Law of the Republic of Azerbaijan on Power and Thermal
Stations (28 December 1999 784-IQ);• Decree 512 of the President of the Republic of Azerbaijan
dated 17 November 1996 on the Application of the Law of the Republic of Azerbaijan on “Use of Energy Resources”;
• Decree 462 of the President of the Republic of Azerbaijan dated 21 October 2004 on the approval of the State Pro-gramme on the Use of Alterative and Renewable Energy Sources in the Republic of Azerbaijan;
• Decree 635 of the President of the Republic of Azerbaijan dated 14 February 2005 on the approval of the State Pro-gramme on the Development of Fuel Energy Facilities in the Republic of Azerbaijan (for 2005-2015);
• Decree 594 of the President of the Republic of Azerbaijan dated 16 November 2009 on Additional Measures for the Application of Alterative and Renewable Energy Sources in the Republic of Azerbaijan;
• Decree 32 of the President of the Republic of Azerbaijan dated 4 May 2011 on the approval of the State Programme on the Socio-economic Development of Baku City and its Settlements for 2011-2013;
• Decree 1958 of the President of the Republic of Azerbaijan dated December 29, 2011 on the preparation of the State Strategy for the Use of Alterative and Renewable Energy Sources in the Republic of Azerbaijan for 2012-2020;
• Decree 810 of the President of the Republic of Azerbaijan dated 1 February 2013 on the “Establishment of the State Agency for Alternative and Renewable Energy Sources of the Republic of Azerbaijan”;
• Decree of the President of the Republic of Azerbaijan dated 17 January 2014 on the approval of the State Programme on the Socio-economic Development of Baku City and its Settlements for 2014-2016;
160
World Small HydropoWer development report 2019
• Decree 125 of the President of the Republic of Azerbai-jan dated 24 November 2016 on the “Establishment of the State Agency for Alternative and Renewable Energy Sources of the Republic of Azerbaijan” Public Legal Entity;
• Decree 1138 of the President of the Republic of Azerbaijan dated 6 December 2016 on the approval of the “Strategic Roadmap on the development of utility services (electric-ity, heating, water and natural gas supply) in the republic of Azerbaijan”;
• Order 18 of the Cabinet of Ministers of the Republic of Azerbaijan dated 2 February 2005 on the approval of the Rules on the use of electrical power;
• Order 95 of the Cabinet of Ministers of the Republic of Azerbaijan dated 20 May 2010 on the approval of the Rules of granting a special permission for activities related to al-terative and renewable energy sources;
• Order 217 of the Cabinet of Ministers of the Republic of Azerbaijan dated 16 August 2013 on making amendments to the Rules of granting a special permission for activi-ties related to alterative and renewable energy sources approved by Order 95 of the Cabinet of Ministers of the Republic of Azerbaijan dated May 20, 2010.
As of mid-2018, the Government was developing laws “On the use of alternative and renewable energy sources” and “On energy efficiency”.10
In addition to the above-mentioned legislation, in particular the 1996 Energy Resources Law, the 1998 Electrical Energy Law and the 1999 Law on Energy, there is legislation specifically focusing on hydropower. Order 216 of the Cabinet of Ministers of the Republic of Azerbaijan, dated 6 December 2000, on the approval of rules on the use of water facilities for hydropower needs.
Financial support mechanisms for renewable energy market development include:• Tax exemption for technology parks for seven years;• Tax exemption for investors for seven years;• Exemption from customs duties and VAT on the import
of equipment and technology used for renewable energy projects;
• Azerbaijan Investment Company providing up to 25 per cent of investment capital;
• Entrepreneurship Support Fund with a long-term credit line (6 per cent per annum).10
Barriers to small hydropower developmentThere are specific challenges pertinent to SHP development, including the following:• A lack of regular updates of hydrological data;• Problems with connecting SHP to the general electric grid;• The construction of SHP plants in areas with difficult
mountainous conditions;• The low level of electricity tariffs.
References
1. World Bank (2017). Azerbaijan. Population, total. Available from https://data.worldbank.org/indicator/SP.POP.TOTL?loca-tions=AZ
2. Azerbaijans.com (2015). Climate. Available from www.azerbai-jans.com/content_457_az.html.
3. Elektron Hokumet Portali (n.d.). Azerbaijan. Available from https://www.e-gov.az/az/content/read/21.
4. Azerbaijan, Ministry of Culture and Tourism (n.d.). Azerbaijan fact sheet. Available from http://mct.gov.az/about-tourism.
5. The State Statistical Committee of the Republic of Azerbaijan (2017). Energy of Azerbaijan. Official publication. Statistical yearbook. Baku 2017. Available from https://www.stat.gov.az/menu/6/statistical_yearbooks/
6. The State Statistical Committee of the Republic of Azerbaijan (2017). Production of energy products. Available from www.stat.gov.az/source/balance_fuel/en/002_11-13en.xls
7. World Bank (2016). Azerbaijan. Access to electricity (% of pop-ulation). Available from https://data.worldbank.org/indicator/EG.ELC.ACCS.ZS?locations=AZ
8. Salmanova, A. (2018). Power plants to be privatized in Azerbai-jan. Azernews, 7 February 2018. Available from https://www.azernews.az/business/126771.html
9. Azerbaijan, State Agency on Alternative and Renewable Energy Sources (2014). Strategic plan (2015-2018). Available from http://area.gov.az/strateji-plan-2015-2018/#_Toc399862150.
10. Yusifov, J. (2018). Overview of the renewable energy devel-opments in Azerbaijan. The State Agency on Alternative and Renewable Energy Sources of the Republic of Azerbaijan. Baku 2018. Available from http://www.irena.org/-/media/Files/IRENA/Agency/Events/2018/May/Azerbaijan-RRA-work-shop/2--Mr-Jabir-Yusifov-SAARES--Overview-of-the-energy-sector-and-renewa.pdf?la=en&hash=EF0FFCB2B8F1CB61B92F-5528C5A22B54E1B0D16C
11. Azguntex (n.d.). Projects. Available from http://www.azguntex.az/en/content/25
12. Azguntex (n.d.). Society and we. Available from http://www.azguntex.az/en/content/4
13. Aliyeva, K. (2018). Azerbaijan eager to use all opportunities of al-ternative energy. Azernews, 25 July 2018. Available from https://www.azernews.az/business/135261.html
14. Poindexter, G. (2018). Modernization work completed at 424 MW Mingachevir hydro station in Azerbaijan. Hydroworld.com, 27 February 2018. Available from https://www.hydroworld.com/articles/2018/02/modernization-work-complet-ed-at-424-mw-mingachevir-hydro-station-in-azerbaijan.html
15. Aliyeva, K. (2018). Azerbaijan to increase generating capacities in 2018. Azernews, 26 April 2018. Available from https://www.azernews.az/business/131080.html
16. Tariff Council of Azerbaijan Republic (2007). About Regulation of the electricity tariffs within the Republic. Available from www.tariffcouncil.gov.az/?/az/content/70/
17. State Agency on Alternative and Renewable Energy Sources of the Republic of Azerbaijan (SAARES) (2018). Internal data.
18. Xialei, C., Singh, P. R., Xianlai, W., and Kremere, E., eds. (2016). World Small Hydropower Development Report 2016. United Nations Industrial Development Organization; Interna-

161
3.5. WES
TERN
AS
iA
tional Center on Small Hydro Power. Available from www.small-hydroworld.org.
19. LIU, H., Masera, D. and Esser, L., eds. (2013). World Small Hy-dropower Development Report 2013.United Nations Industrial Development Organization; International Center on Small Hy-dro Power. Available from www.smallhydroworld.org
20. Ingram, E. (2016). 1.6-MW Ismayilli-2 small hydroelectric plant opened in Azerbaijan. Hydroworld, 12 August 2016. Available from https://www.hydroworld.com/articles/2016/08/1-6-mw-is-mayilli-2-small-hydroelectric-plant-opened-in-azerbaijan.html
21. Ingram, E. (2017). Azerbaijan: A significant focus on small hy-dropower. Hydroworld, 21 August 2017. Available from https://www.hydroworld.com/articles/2017/08/azerbaijan-a-signifi-cant-focus-on-small-hydropower.html
22. State Agency on Alternative and Renewable Energy Sourc-es of the Republic of Azerbaijan (SAARES) (2014). Strategic plan (2015-2018). Available from http://area.gov.az/strate-ji-plan-2015-2018/#_Toc399862150
23. Huseynova, H. (2015). Policy Paper - Alternative and Renewable Energy Outlook for Azerbaijan 2014. Konrad Adenauer Stiftung. Tbilisi, Georgia. Available from http://www.kas.de/wf/doc/kas_40177-1522-35-30.pdf?150123132359

162
Georgia manana dadiani, Energy Efficiency Centre Georgia; davit Sharikadze, ministry of Economy and Sustainable development
Key factsPopulation 3, 718,200 1
Area 69,700 km2 1
Climate Western Georgia has a humid subtropical, maritime climate, while eastern Georgia has a range of climate varying from moderately humid to a dry subtropical type. Average annual temperatures are between 14 °C and 15 °C with extremes ranging between 45 °C and -15 °C. The Black Sea influences the climate of west Georgia resulting in mild winters between December and February, and hot summers between June and August. In the mountainous and high mountainous areas temperatures range from between 6 °C and 10 °C to between 2 °C and 4 °C. The highest lowland temperatures occur in July and are approximately 25 °C, while average January temperatures over the most of the region are between 0 °C and 3 °C.2
Topography A mountainous landscape, 54 per cent of Georgia is located at an altitude of 1,000 metres or above. The country lies mostly in the Caucasus Mountains,4 and its northern boundary is partly defined by the Greater Caucasus range. The highest point is Mount Shkhara which reaches 5,201 metres while the lowest point is on the coast of the Black Sea, between Poti and Kulevi, reaching 1.5-2.3 metres below sea level. In addition to the Great Caucasus, other mountain ranges include the Lesser Caucasus range, which runs parallel to the Turkish and Armenian borders, and the Likhi Range, which runs north to south dividing the country into its eastern and western regions.3
Rain pattern Western Georgia has heavy rainfall throughout the year totalling between 1,000 mm and 2,500 mm and reaching a maximum between September and February. The Southern Kolkhida region in the south-east of the country receives the most rain. In eastern Georgia, precipitation decreases with distance from the sea, reaching between 400 mm and 700 mm in the plains and foothills but increa-sing to double this in the mountains. The south-eastern regions are the driest in the country, with the driest period in winter between December and February and the wettest at the end of spring in May.3
Hydrology There are 26,000 rivers in Georgia, 99.4 per cent of which have a length less than 25 km. More than 70 per cent of water power sources are concentrated in the main five rivers basins – the Rioni (22 per cent), Mtkvari (16 per cent), Inguri (15 per cent), Kodori (9 per cent) and Bzibi (8 per cent). There are also approximately 860 freshwater lakes in Georgia with total surface area 170 km2.
Electricity sector overview
Total installed capacity in 2017 was approximately 4,106.03 MW. This is comprised of large hydropower (2,983.16 MW), thermal power plants (924.4 MW), wind power plant (20.7 MW) and deregulated small hydropower plants (177.98 MW) (see Figure 1). 5
Figure 1. Installed electricity capacity by source in Georgia (MW)
Largehydropower
Thermal powerSmall
hdyropower
Wind power
2,983.16
924.40
177.98
20.70
Source: Electricity Market Operator (ESCO)5
In 2017 total generation reached 11,531.2 GWh, approximately 80 per cent of which was provided by 76 hydropower plants (see Figure 2).10 Seven of these plants were regulatory, providing approximately 58 per cent of all generation from hydropower and 46 per cent of total generation. Fifteen hydropower plants operate on a seasonal basis contributing approximately 28 per cent of total generation while 54 deregulated hydropower plants contributed 5.2 per cent. The remaining 19.3 per cent of total generation came from four thermal power plants and one gas turbine. However in 2017 consumption reached 11,875.3 GWh, exceeding generation. Due to fluctuations in precipitation, Georgia is both an importer and exporter of energy. From May to July 2017, hydropower alone not only satisfied domestic demand but also supported the export of 685.7 GWh. Outside of this time period however, the available capacity has not been able to meet peak demand, and nearly half of the total production is generated by the thermal power plants and imports (see Figure 3). Currently Georgia is a
3.5.3
World Small HydropoWEr dEvElopmEnt
rEport 2019

163
3.5. WES
TERN
AS
iA
net importer of natural gas and petroleum products, which are, together with hydropower and biomass for residential heating, the main energy sources.
Figure 2. Annual electricity generation by source in Georgia (GWh)
Largehydropower
Thermal powerSmall
hdyropower
Wind power
9,210.4
2,233.0
602.9
98.7
Source: Electricity Market Operator (ESCO)10
Figure 3. Electricity balance of Georgia in 2017 (GWh)
1,200
1,000
800
600
400
200
0
Janu
ary
Febr
uary
Mar
ch
April
May
June July
Augu
st
Sept
embe
r
Oct
ober
Nove
mbe
r
Dece
mbe
r
Hydropower (seasonal)
Hydropower (regulatory)
Small hdyropower
Thermal power
Wind power
consumptionSource: Electricity Market Operator (ESCO)10
Georgia has succeeded in significantly liberalizing the electricity market and implementing legislative revisions that have allowed the private sector to largely take over operations via privatisation. Four key state institutions operate in the Georgian electricity sector.
The Ministry of Energy of Georgia is the policymaker responsible for the development and implementation of energy policy, environmental safety, the creation of a competitive environment through efficient market regulation, approval of the annual energy balances and participation in approval of the strategic projects.7 In December 2017 the Ministry of Energy was officially merged with Ministry of Economy and Sustainable Development of Georgia. Therefore, Ministry of Economy and Sustainable Development of Georgia became its legal successor.
The Georgian National Energy and Water Supply Regulatory Commission (GNEWSRC) is the independent regulatory body whose main functions include licensing in the energy sector, setting and regulating tariffs (including ones for generation, transmission, dispatch, and distribution), the monitoring of
the quality of services provided by license holders and dispute resolution. The GNEWSRC is also authorised to impose sanctions for regulatory breaches.9
The Electricity System Commercial Operator (ESCO) is the commercial operator responsible for balancing the market and ensuring grid stability, conducting export/import operations to meet systemic needs and for emergency purposes, and creating and managing an integrated database on the wholesale purchase and sale of energy (including the creation and management of a unified reporting registry). According to the Electricity Market Rules, licensed suppliers of electricity and any direct (eligible) consumers of electric power (currently some of the largest wholesale consumers) may enter into short or long-term direct contracts for the sale and purchase of electricity. ESCO, as a balancing market (thus taking away surplus and filling the deficit at any particular moment), is eligible to trade non-contracted electricity and guaranteed capacity based on market-defined pricing mechanisms. It supplies dispatch licensees with information required to carry out supply and plan consumption.10
The Georgian State Electro system (GSE) is the transmission system owner and operator and the sole dispatch licensee. Its main function is technical control and supervision over the entire power system to ensure an uninterrupted and reliable power supply. It only has the right to purchase electricity to cover transmission losses. GSE also owns and operates part of the high-voltage transmission grid and interconnection lines with neighbouring countries.11
Two distribution companies provide most of the retail sales. • Telasi Distribution Company, JSC, covering the region in
and near Tbilisi;12
• Energo-Pro Distribution Company, covering Central and Western Georgia and Eastern part of Georgia, excluding the regions of South Ossetia and Abkhazia.13
Georgian legislation allows retail consumers that purchase above 7 GWh annually to negotiate power agreements with power producers and importers. There are six qualified retail consumers and each purchases power from power producers. The average generation tariff in Georgia is approximately 0.028 US$/kWh, although this fluctuates widely between US$0.007 for older power HPP plants, and US$0.068 for newer power plants. The tariff increased to 0.006US$/kWh (from 0.0047 tetri) for Enguri, and to 0.012US$/kWh (from 0.0047 tetri) for Vardnili. Enguri and Vardnili are the largest state-owned HPPs, generating 38.9 per cent of the total and 51.7 per cent of the hydro generation on average (Table 1). Tariffs were revised for 10 other HPPs (all owned by Energo-Pro), which together accounted for 18.1 per cent of total generation in 11,534.2 GWh. Only one of them got a tariff increase, while tariffs were lowered by 12.5 per cent, on average, for the remainder. Tariffs were revised upward for all TPPs for the year 2017. Revisions varied from a 13.5 per cent increase for the Gardabani CCGT to a 66.9 per cent increase for GPower. The highest tariff (0.057 US$/kWh) was received by Blocks 3 and 4, owned by Georgian International Energy Corporation Ltd (GIEC). According to Market Rules, this

164
World Small HydropoWer development report 2019
tariff is the new balancing electricity price that deregulated power plants will receive for electricity sold to ESCO without a contract September to April. The guaranteed capacity payments are collected by ESCO from all consumers and exporters in proportion to their consumption or export.9
Table 1.Consumer tariffs for electricity
a) Customers Tariffs Limits for Purchase of Electricity ac-cording to Levels of Voltage (without VAT)
Voltage stage From January 1, 2017 till December 31, 2025 inclusive, (1$=2.4 GEL, April 2018)
Telasi Distribution Company12 US$/KWh
Energo-Pro Distribution Company13
US$/KWh110-35 kV
(non-residential customers)
0.057 0.052
10 -6 -3.3 kV 0.059 0.057 0.4 kV 0.075 0.074
b) Tariff according to the consumed amount of electricity, are as follows:
Consumption stage From January 1, 2017 till December 31, 2025 inclusive
Telasi Distribution
Company US$/KWh
Energo-Pro Distribution
Company US$/KWh
0 - 101 kWh 0.051 0.050 From 101 kWh
to 301 kWh0.065 0.064
301 kW/h and more 0.081 0.08 Source: Georgian National Energy and Water supply Regulatory Commission6
The main objective of the Government’s energy policy is to raise the country’s energy security. Other objectives include:• The diversification of supply sources, and optimal
utilization of local resources and reserves;• The utilization of the renewable energy resources;• The gradual approximation of Georgia’s legislative and
regulatory framework with the European Union’s energy acquis;
• Energy market development and the improvement of energy trading mechanisms;
• The strengthening of Georgia’s role as a transit route in the region;
• The transformation of Georgia into a regional platform for the generation and trade of clean energy;
• The development and implementation of an integrated approach to energy efficiency in Georgia;
• The consideration of environmental components in the implementation of energy projects;
• The improvement of service quality and protection of consumer interests.
The main objective of the long-term energy policy is the attraction of foreign investments for the construction of the new power plants. According to the potential of high-
capacity power generation and the increasing demand, other key objectives of the energy policy include: • The rehabilitation of the infrastructure that connects to
the energy systems of the neighbouring countries;• The construction of the new transmission lines and
substations;• The export of the surplus power generated in new and
existing power plants.16
Small hydropower sector overview
Small hydropower (SHP) is defined as plants with an installed capacity less than 13 MW. These are termed deregulated on the basis that plants with an installed capacity of less than 13 MW have the right to operate without a licence and sell generated power directly to consumers. Newly constructed small hydropower plants with installed capacity of less than 13 MW will not require an operating licence, only a construction permit and an environmental permit.7
The total installed capacity of small hydropower plants less than 13 MW is 177.98 MW, 142.34 MW of which is from plants of up to 10 MW. SHP potential for plants below 13 MW is estimated at 335.5 MW, of which 187.4 MW is for plants up to 10 MW. These data suggest that approximately 53 per cent of SHP potential for plants up to 13 MW and approximately 76 per cent of plants up to 10 MW have been developed (see Figure 4).22,26
Figure 4. Small hydropower capacities 2013/2016/2019 in Georgia (MW)
0 50 100 150 200 250 300
PotentialCapacity
Installed Capacity
187.4 187.4 286.0
142.3 132.0 67.0
WSHPDR 2019WSHPDR 2016WSHPDR 2013
Source: Electricity Market Operator,22 WSHPDR 2013,23 WSHPDR 201624
Note: The comparison is between data from WSHPDR 2013, WSHPDR 2016 and WSHPDR 2019.
Currently there are 51 small hydropower plants (less than 10 MW) in operation, all of which are privately owned and most of which need refurbishment. In total, they generate approximately 602.9 GWh, equivalent to approximately 6.3 per cent of total hydropower generation.
There are 26,000 rivers in Georgia, with an estimated total potential 150 TWh.11 Small hydropower technical potential (less than 13 MW) is estimated at 19,471 TWh.14 An over-view of the potential small hydropower sites up for tendering is available on the website of the Ministry of Energy.15 Thir-ty-eight SHP have already signed memorandums with Ministry of Energy and are at the licensing and construction stage. Esti-mated annual power generation is 1,016 GWh and investment

165
3.5. WES
TERN
AS
iA
US$287 million. Thirty-two new SHP sites have completed fea-sibility studies. Expected annual generation is 755 GWh and estimated investment approximately US$191 million.16
The regulation of the hydropower sector offers potential investors many advantages. Newly built hydropower plants remain the exclusive property of the investors through a Build-Operate-Own (BOO) scheme. Newly constructed small hydropower plants with an installed capacity of less than 13 MW do not require an operating license. They do, however, require a construction and environmental permit. The electricity generated by small hydropower plants of less than 13 MW may be used by the developer for their own needs. It is nearly always financially advantageous to consume as much of the power as possible on site and only export the surplus into the network. If it is possible to connect to the local grid, the produced electricity may be exported via the local distribution network through an agreement with ESCO or with the local distribution companies that deliver electricity directly to the client. From 1 September to 1 May, within the scope of the direct agreement made in compliance with standard conditions, the highest tariff is based on the thermal power plant electricity sold to ESCO. In this same period the adjustable tariff based on hydropower is the lowest tariff established by GNERC. Small capacity power plants may purchase electricity for the purpose of ensuring relevant execution of the agreement on electricity generated by these plants however the volumes should not exceed the framework of the forecasted electricity volumes proposed (capacity).9
If the small hydropower plants produce power for export to the local network, early discussions with the local distribution companies are needed to specify the system protection, metering equipment and the technical requirements. They will also provide an estimate of connection costs and the best location to connect into their system.
Renewable energy policy
The main objective of the Government’s overall energy policy is to raise the country’s energy security. This explicitly includes the utilization of Georgia’s renewable energy sources, the optimal utilization of local resources and reserves, and consideration of environmental components in the implementation of energy projects.19
Four key state institutions operate in the Georgian electricity sector: • The Ministry of Economy and Sustainable Development
of Georgia is an entity which implements energy policy, monitors the sector and facilitates investment projects.
• Georgian National Energy and Water Supply Regulatory Commission is an independent regulator of the sector, which sets the tariffs and their methodology, establishes rules on licensing and standards and resolves relations between customer and companies.
• Electricity System Commercial Operator is an energy market operator, which is in charge of balancing the market and emergency imports and exports, and is a
reserve capacity trader. Other key players in the sector include companies in the fields of generation, transmission and distribution.
Since 2010, 16 Georgian municipalities joined the European Union initiative and signed a Covenant of Mayors commit-ting to reduce CO2 emissions by 20 per cent by 2020. Some 23 Georgian signatories (including Tbilisi City, Rustavi City, Batumi City, Kutaisi City, and the Telavi, Zugdidi, Akhaltsikhe, Mtskheta and Gori municipalities) elaborated on the Sustain-able Energy and Climate Action Plans (SE(C)AP), which en-visages the implementation of energy efficiency and renewable energy measures in various sectors. In this sense, the SEAPs are the only real political documents on energy efficiency and renewable energy policy at a local municipal level.
In 2013, the Government set forth a legislative initiative (Resolution of Government of Georgia No. 214, 21 August 2013) in order to facilitate the sustainable development of the country’s renewable energy potential.19,20 This initiative regulates procedures and rules of expression of interest (EOI) for the construction, ownership, and operation of power plants in Georgia.8 The maximum utilization of water resources is one of the priorities of the State. In 2013, the Ministry of Energy of Georgia (currently Ministry of Economy and Sustainable Development of Georgia) also established the division of Energy Efficiency and Alternative Sources. In 2016, the National Action Plan for the Implementation of the Association Agreement between Georgia on the one hand and the European Union and the European Atomic Energy Community and their Member States on the other hand, and the Association Agenda between Georgia and the European Union were approved by the Decree No. 382 of the Government of Georgia on 7 March 2016.21
According to the Decision of the Ministerial Council of the Energy Community (Decision 2016/18/MC-EnC) in October 2016, Georgia accessed to the Energy Community as a Contracting Party. The Treaty means that by joining the Energy Community, the Parties have committed to implement the relevant EU rules on energy, environment and competition. The Energy Community extends the EU internal energy market to Contracting Parties in South East Europe and beyond. This creates a stable investment environment based on the rule of law and ties the Contracting Parties together with the European Union” and its “acquis communautaire”.
The Treaty foresees the implementation of the acquis within a fixed time-frame and defines as follows: Directive 2009/28/EC on the promotion of the use of energy from renewable sources and amending and subsequently repealing Directives 2001/77/EC and 2003/30/EC by 31 December 2018. Recently the 1st NEEAP draft was published and includes Georgia’s indicative national energy efficiency targets for 2020, 2025, and 2030.
It is expected that official governmental consultations on NEEAP approval will be launched in the first half of 2018. Un-der the EU-Georgia AA/DCFTA, Georgia has the obligation to implement the core of the EU energy efficiency legislation. The Government of Georgia plans to establish a new Renew-

166
World Small HydropoWer development report 2019
able Energy & Energy Efficiency Agency or an Energy Effi-ciency Agency to support faster implementation of successful energy efficiency programmes and promotion of investments.
The Government of Georgia starts to prepare a Law on Energy Efficiency in according with EU obligations until the year 2019 to implement the EU’s Energy Efficiency Directive (EED - 2012/27/EU) and help Georgia to meet its commitments under the Energy Community Treaty and the EU Association Agreement and achieve the goals set out in the National Energy Efficiency Action Plan (NEEAP). According to the provisions of the Directive 2009/28/EC on the Promotion of the Use of Energy from Renewable Sources, Georgia has to draw up and promote a National Renewable Energy Action Plan (NREAP) to present to the European Commission (EC) with a view to comply with the binding targets stated within the Directive. The Government of Georgia has started to prepare a Law on Renewable Energy.
The last amendments of the Law on Electricity and Natural Gas of Georgia stipulate encouragement of purchase and construction of micro (up to 100 kW) electrical plants. The customers will have possibility to generate electricity, use it and provide and sell to the grid the surplus electricity at the cost established by the Georgian National Energy and Water Regulatory Commission (GNERC). The procedure and rules for the connection to the grid of micro electrical plants is described in GNERC Resolution #11 of May 3, 2016.
Barriers to small hydropower developmentKey barriers to small hydropower development include:• High initial costs;• Lack of continually renewed hydrological information;• The absence of local manufacturing capacity in Georgia,
with the exception of a few workshops producing the cross flow (Banki) type turbine;
• No financial incentives from international organizations and local banks;
• No tax initiatives or feed-in tariff regimes;• The decreased potential for development opportunities
due to the cancellation of promising policies, such as concluding long-term power purchase agreements (PPAs) with renewable energy producers.
References
1. National Statistics Office of Georgia (n.d.). Key Indicators. Available from: http://www.geostat.ge/index.php?action=0&lang=eng
2. Encyclopedia Britannica (n.d.). Georgia. Available from: http://www.britannica.com/EBchecked/topic/230186/Georgia/44304/Climate
3. Wikipedia (n.d.). Geography of Georgia. Available from: http://en.wikipedia.org/wiki/Geography_of_Georgia_%28country%29#Topography
4. Country Studies (n.d.). Georgia. Available from: http://
countrystudies.us/georgia/21.htm 5. Electricity Market Operator (ESCO) (n.d.). Official Website.
Available from: http://www.esco.ge 6. Georgian National Energy and Water supply Regulatory
Commission (n.d).7. Available from: http://gnerc.org/ge/el-energy/users1/tarifs8. Ministry of Energy of Georgia (n.d.). Official Website. Available
from: http://www.energy.gov.ge 9. Ministry of Energy of Georgia (n.d.). http://www.energy.gov.ge/
legislation.php?lang=eng&id_pages=3310. Georgian National Energy and Water Supply Regulatory
Commission (n.d.). Official Website.http://www.gnerc.org/11. Electricity Market Operator (ESCO) (n.d.) Official Website.
Available from: http://www.esco.ge12. http://esco.ge/en/energobalansi/by-year-113. Georgian State Electrosystem (n.d.). Official Website. Available
from: http://www.gse.com.ge/new/14. Telasi Distribution Company (n.d). Available from http://www.
telasi.ge/en15. Energo-Pro Distribution Company (n.d ) http://www.energo-pro.
ge/16. Dzidziguri, A.A., (1992). Energy Resources Of Georgia And
Problem Of Their Rational Using. 17. Ministry of Energy of Georgia (n.d.). Cadastre of small Hydro
Power Technical Potential of Georgian’s Rivers Available from: http://www.energy.gov.ge
18. Ministry of Energy of Georgia (n.d.). List Of Potential Power Plants In Georgia. Available from: http://www.energy.gov.ge/projects/pdf/pages/Potential%20Renewable%20Projects%20List%20984%20eng.pdf
19. Gvilava, E &Garibashvili, L, (2014). Country Report: Georgia, Energy Efficiency Centre Georgia (EEC) &Energy Research to Innovation. Available from: http://ener2i.eu/page/34/attach/0_Georgia_Country_Report.pdf
20. United States Agency for International Development (USAID) (n.d.). Hydropower and Energy Planning Project (HPEP). Available from: http://www.hydropower.ge
21. Ministry of Energy of Georgia (n.d.. Main Direction Of The State Policy In Energy Sector In Georgia. Available from: http://www.energy.gov.ge/ministry.php?id_pages=12&lang=eng
22. Resolution of Government of Georgia No214 (2013). August 21 2013, Rules Of Expression Of Interest For Feasibility Study, Construction, Ownership And Operation Of Power Plants In Georgia, (2013) Available from: http://www.energy.gov.ge/projects/pdf/pages/GOG%20Decree%20214%201027%20eng.pdf
23. Delegation of the European Union to Georgia (2016).EU/Georgia Association Agreement.https://eeas.europa.eu/delegations/georgia/9740/ EU/Georgia%20Association%20Agreement
24. Electricity Market Operator (ESCO) (n.d). Small power plants. Available from http://esco.ge/en/kvalifitsiuri-satsarmoebi/small-power-plants
25. LIU, H., Masera, D. and Esser, L., eds. (2013). World Small Hydropower Development Report 2013. United Nations Industrial Development Organization; International Center on Small Hydro Power. Available from www.smallhydroworld.org.
26. Xialei, C., Singh, P. R., Xianlai, W., and Kremere, E., eds. (2016). World Small Hydropower Development Report 2016. United Nations Industrial Development Organization; International Center on Small Hydro Power. Available from www.smallhydroworld.org.

167
3.5. WES
TERN
AS
iA
IraqSameer Saadoon algburi and Sarmad nozad mahmood, al-Kitab University College
Key factsPopulation 37,202,5721
Area 435,000 km2
Climate There are two climatic zones in Iraq – the hot, arid lowlands and the cooler, damper highlands in the north-east. In the lowlands, summers last from May to October and are dry and hot. July and August are the hottest months with the mean temperature of 35 °C and the maximum temperature of 51 °C. Winters in the lowlands last from December to February and are characterized by mild temperatures ranging between 2 °C and 15 °C. In the north-east, summers last from June to September and are generally dry and hot with temperatures on average 5 °C cooler than those in lowland Iraq. Winters are cold because of the high elevations and the north-easterly winds bringing continental air from Central Asia. Temperatures range between -4 °C and 17 °C.2
Topography Iraq has four topographical regions – the alluvial plains in the centre and south-east covering almost one-third of the country and characterized by low elevation (below 100 metres), an upland region in the north between the Tigris and Euphrates rivers with the highest peak reaching 1,356 metres, deserts in the west rising to elevations above 490 metres and in the south with elevations averaging 100 to 400 metres, and the highlands in the north-east occupying approximately one-fifth of the country and with an average elevation of 2,400 metres. The highest point, Ghundah Zhur, lies near the Iran-Iraq border and reaches 3,607 metres.3
Rain pattern Average annual precipitation in the lowlands ranges between 100 and 180 mm, with most of the rain-fall occurring between November and April. In the foothills of the north-east, annual precipitation is from 300 to 560 mm. In the mountains annual precipitation can exceed 1,000 mm, mainly in the form of snow.2
Hydrology Iraq lies in the Tigris-Euphrates basin. The Tigris flows 1,417 km and the Euphrates 1,212 km through Iraq before joining to form the Shatt al-Arab, which flows into the Persian Gulf. Due to numerous mountainous tributaries, the Tigris can be subject to devastating floods, with maximum flow occur-ring between March and May.3
Electricity sector overview
As of April 2017, the installed capacity of Iraq was 26,680 MW, of which gas-fired power plants accounted for 66.7 per cent, steam-fired power plants for 27.7 per cent and hydropower plants for 5.6 per cent (Figure 1).4 However, after the intervention of the Islamic State in June 2014, which resulted in the take-over of several areas in the north and west of the country, the Ministry of Electricity announced grid losses of more than 8,000 MW.5 As of April 2017, one steam-fired, four gas-fired and almost all hydropower plants with a combined capacity of 5,680 MW were considered as lost generating capacity.4 Therefore, the remaining capacity of the country amounted to 21,000 MW.
However, due to the inefficiency of the power sector, average daily power in 2017 was at just 11,300 MW, while demand reached 17,000 MW.6 In 2016, average daily power was at 10,510 MW, while demand was at 15,000 MW.4 Total elec-tricity generation in 2017 amounted to 99.3 TWh, compared to 92.1 TWh in 2016.6 The exponential growth of demand, which is estimated to reach 35,000 MW by 2030, represents the key problem for the country’s electricity sector.7
Figure 1. Installed electricity capacity by source in Iraq (MW)
7,380
17,800
1,500
Gas
Steam
Hydropower
Source: Jafar4
Electricity shortages entail major costs for the economy in the form of lost production time, damage to capital assets from power interruption, and disruption of commercial processes. It is estimated that the shortages of electricity cost the country’s economy some US$ 3-4 billion per year.7 Furthermore, due to cold winters and extremely hot summers, power shortages also impose significant hardship on individuals.
Electricity in Iraq is mainly provided by two types of provi-ders – the Ministry of Electricity (MOE) and private owners
3.5.4
World Small HydropoWEr dEvElopmEnt
rEport 2019

168
World Small HydropoWer development report 2019
of generators scattered across the country. The MOE is the principal policy maker, power producer, service provider, regu-lator and operator of the electricity sector in Iraq. As a result of inefficient policies, a lack of security, the burden of the military campaign against the Islamic State and the decline of oil prices, the electricity sector has been falling into decay, leading to the failure of the MOE to supply electricity 24 hours a day across the country. The unreliable power supply from the grid has led to the widespread installation of private diesel generators and creation of neighbourhood grids. These are not regulated by the Government, and their constant operation implies signifi-cant costs, as well as noise, air pollution and carbon emissions. In addition, international oil companies operating in the coun-try constitute a third limited producer of electricity, but they produce electricity for their own use only. Generally, they are not subject to Government regulations either.7
In addition to the issues on the supply side of the electricity sector, challenges also exist on the demand side. These include the widespread theft of electricity resulting, from high levels of unmetered consumers and widespread non- or under-collection of bills due to the absence of an effective billing system.7 In recognition of the need to reform, the Government began the privatization of the electricity sector in early 2016. A multi-phase strategy was developed in consultation with the World Bank, which aims to reform the distribution sector, reduce electricity consumption by 20 per cent, curb losses and end the exploitation of consumers by the owners of neighbourhood grids. Based on the recommendations of the World Bank, the country was divided into 180 zones. Private companies will take over responsibility for distribution in each zone and ensure around-the-clock electricity supply in return for a percentage of electricity tariffs. The first projects were launched in 2016 and 2017 in Baghdad neighbourhoods and have produced positive initial results.7
While the shortage of power is due to a variety of system deficiencies, the necessary first step towards addressing it is to increase generation capacity. Thus, under the Integrated National Energy Strategy, 40 new plants, adding 22 GW to the effective capacity were due to be commissioned in 2016. These however have not yet been completed.8 As of March 2018, six projects with a combined capacity of 17,900 MW were under construction, awaiting investment or were projects implying conversion from open cycle to combined cycle, with all of them being thermal power projects.6
Table 1. Electricity prices based on 24-hour supply in Iraq
Consumption (kWh) 1,000 1,500 2,000 3,000 4,000 5,000
Price (IQD (US$))
11,120(9.33)
20,826(17.47)
42,202(35.40)
119,923(100.59)
242,560(203.45)
445,120(373.34)
Source: Al-Rikabi7
The cost of production of one kilowatt (kW) is 108 Iraqi di-nars (IQD) (US$ 0.091). However, electricity is subsidized based on consumption, with subsidies reaching up to 94 per cent (Table 1).7
Small hydropower sector overview
There is no official definition of small hydropower (SHP) in Iraq. Therefore in this report SHP is classified as hydropower plants from 10 MW and below. The installed and potential ca-pacities of small hydropower in Iraq have not changed com-pared to the World Small Hydropower Development Report (WSHPDR) 2016 (Figure 2). The current capacity of SHP in Iraq is 6 MW, whereas the hydropower potential is estimated to be 26.38 MW, therefore, approximately 23 per cent of the known potential has been developed.9,10
Figure 2. Small hydropower capacities 2013/2016/2019 in Iraq (MW)
0 5 10 15 20 25 30
PotentialCapacity
Installed Capacity
26.38 26.38 26.38
6.00 6.00 6.00
WSHPDR 2019WSHPDR 2016WSHPDR 2013
Source: Ameen,9 WSHPDR 2016,10 WSHPDR 201311
Note: The comparison is between data from WSHPDR 2013, WSHPDR 2016 and WSHPDR 2019.
Although there is no official definition of SHP, a capacity of up to 80 MW is generally considered as small hydropower. Fol-lowing this definition, there are six small hydropower plants, of which only one is below 10 MW (Table 2). The combined capacity of hydropower plants up to 80 MW is 251 MW.9
Table 2.Installed small hydropower plants up to 80 MW in Iraq (MW)
Plant Capacity (MW)
Samaraa Dam 80
Mosul Regulating Dam 60
Hemrin Dam 50
Adhaim Dam 40
Al-Hindiyah Dam 15
Shatt Al-Kuffa Regulator 6
Total 251 Source: Ameen9
Total hydropower potential in Iraq is estimated to be 80,000 GWh.10 The study “Strategy for Water and Land Resources of Iraq” is being carried out by the Ministry of Water Resources.12 Its aim is to define an integrated strategy for developing and managing water and land resources throughout the country ensuring their sustainable use. The utilization of hydropower potential is an integral part of the study. In Phase I of the study, the Ministry of Water Resources of Iraq in 2006 issued a guidance note listing 78 potential hydropower sites. Within Phase II, the list of potential sites was updated and reduced to

169
3.5. WES
TERN
AS
iA
49 sites with capacities from 5 MW to 261 MW (Table 3).9,10 Of these, only six sites have a capacity of 5 MW to 10 MW.
Table 3.Potential hydropower sites under study in Iraq
Installed capacity (MW) Number of sites
5 – 10 6
11 – 20 7
21 – 30 5
31 – 50 12
51 – 100 12
101 – 150 6
261 1 Source: Ameen9
Besides the identified potential sites, there are also 30 barrages and water regulators that can be used for electricity generation. Of these, at least 12 can be used for the development of small hydropower. Their combined capacity is 26.38 MW (Table 4).9,10
Table 4.Potential small hydropower sites in Iraq
Site Units Discharge (m3/sec)
Potential capacity
(MW)
Al-Btera Regulator 2 118 3.016
Al-Dagara Regulator 2 31 0.508
Tarthar Water 4 171 5.662
Al-Abbasiya Regulator 2 168 4.683
Al-Hilla Head Regulator 8 189 2.634
Al-Khalis Regulator 1 49 0.760
Al-Sader Al-Mushtarak 3 60 1.300
Qal’at Salih Regulator 2 25 0.416
Al-Diwaniya Regulator 3 49 0.755
Al-Garraf Head Regu-lator
4 158 3.650
Al-Kassara Regulator 1 24 0.601
Al-Kahla Regulator 2 67 2.394 Source: Ameen9
According to the Iraqi National Water Development Strategy, hydropower should be developed as a by-product of any new reservoir. The target for the share of hydropower in the country’s energy mix is 5 per cent. In Kurdistan this rises to 19 per cent.10 Since 2013, Iraq neither added nor announced additional new hydropower capacities. As such, the development of hydropower, including SHP, currently does not represent a major priority for the country’s energy sector development, and it is not expected that many hydropower plants will be built in the future. The only recent hydropower-related project is the reconstruction of the Mosul dam, which alas is facing some potentially devastating structural problems. The project is financed by the World Bank.13
Renewable energy policy
Iraq is one of the world’s most important oil producers and is among the countries with the largest proven oil reserves. Over the past years, the energy sector of Iraq has suffered due to the war, and energy demand is now outpacing capacity expansion. Renewable energy could be used to both supply electricity to remote locations not connected to the grid and to feed into the grid. This aim was outlined in the Integrated National Energy Strategy of Iraq of 2012, which remains the country’s sole policy document targeting renewable energy development.
However, the development of renewable energy sources has been progressing rather slowly, hindered by the conflict with the Islamic State and other systemic factors.8 Thus it was only in 2016 that the Ministry of Electricity opened the first renewable energy tender for the 50 MW Sawa solar power project in Al-Salman District.14 The installation of solar photovoltaic panels by households has not been readily taken up in Iraq either, in spite of the severe energy shortage in the past decade. This is due to high installation costs compared to diesel generators, whose cost is just 5 per cent of that of a solar PV system of a comparable capacity.15
There are no further policies on renewable energy or energy efficiency. The Government is aiming to attract new foreign investors for solar and wind power projects, offering various tax exemptions and support during the licensing, approval, implementation and operation processes.16 However, there are no universal incentives in place applicable to all renewable energy projects.
Barriers to small hydropower developmentThe following factors entail major barriers to the develop-ment of small hydropower in Iraq:• Conflict with the Islamic State and the resulting occupation
of some territories;• Lack of financial resources;• The poor condition of electricity infrastructure;• Constantly changing plans of the Government, including
frequently cancelled tenders;• Risks associated with payments and security.10
References
1. World Bank (2016). Iraq. Available from https://data.worldbank.org/country/iraq
2. Woods, J. E. et al. (2018). Iraq. Climate. Encylopaedia Britannica. Available from https://www.britannica.com/place/Iraq/Climate
3. Woods, J. E. et al. (2018). Iraq. Encylopaedia Britannica. Available from https://www.britannica.com/place/Iraq#ref22922
4. Jafar, J. (2017). The gas challenge for Iraq’s electricity generation. Presentation at Iraq Energy Forum, 2-3 April 2017. Available from https://www.iraqenergy.org/~iraqener/sites/default/files/iei_files/URUK%20-%20Dhiaa%20Jafar.pdf

170
World Small HydropoWer development report 2019
5. Al Khatteeb, L. & Istepanian, H. (2015). Turn a Light on: Electricity Sector Reform in Iraq. Brookings Doha Center. Available from https://www.brookings.edu/wp-content/uploads/2016/06/Alkhatteeb-Istepanian-English-PDF.pdf
6. Jafar, J. (2018). The Power & Gas Challenge for Iraq. Presentation at 4th Iraq Energy Forum, 29 March 2018. Available from http://www.iraqenergy.org/~iraqener/sites/default/files/ief_2018/Jafar%20Dhia%20Jafar%20-%20URUK.pdf
7. Al-Rikabi, H. (2017). An Assessment of Electricity Sector Reforms in Iraq. Al-Bayan Center for Planning and Studies. Available from http://www.bayancenter.org/en/wp-content/uploads/2017/09/909865676600.pdf
8. Iraq Prime Minister Advisory Commission (2012). Integrated National Energy Strategy (INES): Final Report. Baghdad, 25 September 2012. Available from http://documents.worldbank.org/curated/en/406941467995791680/pdf/105893-WP-PUBLIC-INES-Summary-Final-Report-VF.pdf
9. Ameen, M. S. A. (2007). Hydropower Development in Iraq. M.Sc. thesis presented to the Department of Water Resources Engineering, College of Engineering, Baghdad University.
10. Xialei, C., Singh, P. R., Xianlai, W., and Kremere, E., eds. (2016). World Small Hydropower Development Report 2016. United Nations Industrial Development Organization; International Center on Small Hydro Power. Available from www.smallhydroworld.org.
11. LIU, H., Masera, D. and Esser, L., eds. (2013). World Small Hydropower Development Report 2013. United Nations Industrial Development Organization; International Center on Small Hydro Power (2013) Available from www.smallhydroworld.org
12. Ministry of Water Resources, General Directorate for Water Resources Management (2006). Strategy for Water and Land Resources in Iraq, Phase I, Hydropower Spreadsheet, GN08. Baghdad.
13. McKernan, B. (2017). Mosul Dam could collapse at any minute ‘killing 1.5 million people’. Independent. 5 January 2017.
Available from https://www.independent.co.uk/news/world/middle-east/mosul-dam-breach-fail-northern-iraq-isis-kill-million-nuclear-catastrophe-engineers-risk-a7510686.html
14. National Investment Commission (2016). Announcement by the Ministry of Electricity of the Republic of Iraq for Development of Renewable Energy of 50 MW PV Power Plant on a (BOO) Basis. Available from http://investpromo.gov.iq/newsticker/investment-opportunity-electricity/
15. Iraq science, technology, and innovation (2014). Reforming Energy Policies to Promote Renewable Energy in Iraq. Available from https://stiiraqdev.wordpress.com/2014/05/11/renewable-energy-policies-iraq/
16. Ayre, J. (2015). Iraq Looking For New Solar & Wind Energy Investors. Clean Technica, 24 April 2015. Available from https://cleantechnica.com/2015/04/24/iraq-looking-new-solar-wind-energy-investors/
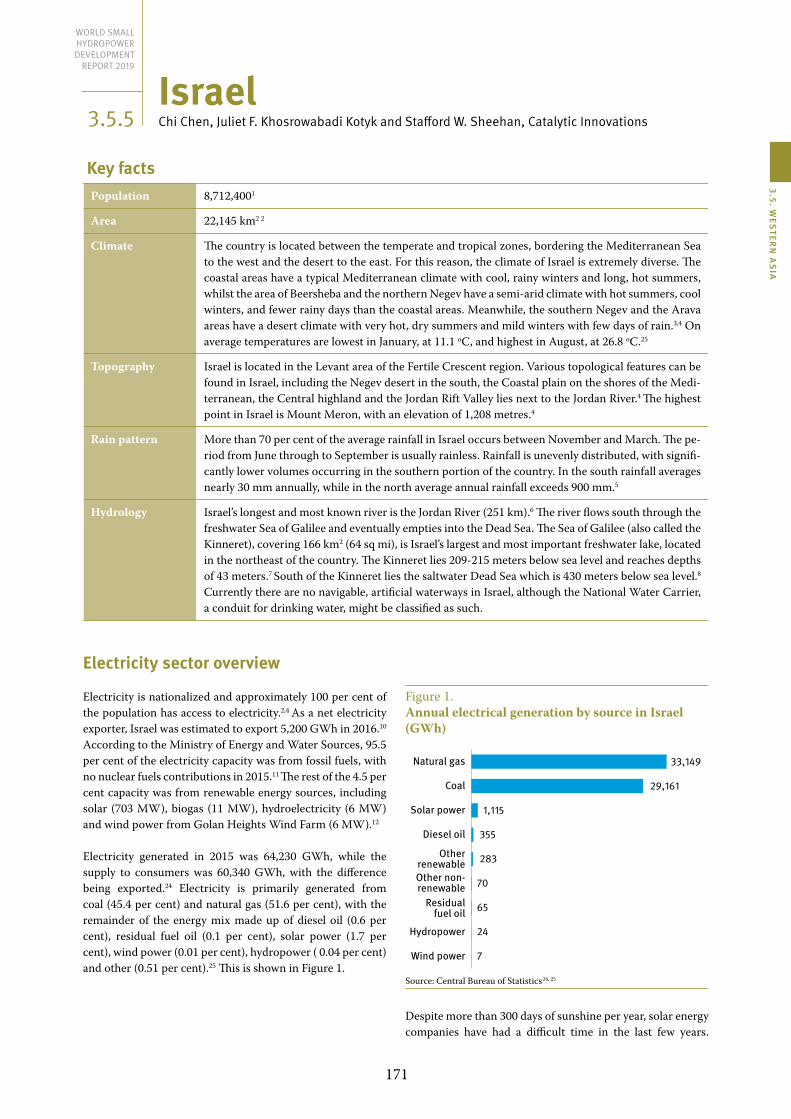
171
3.5. WES
TERN
AS
iA
IsraelChi Chen, Juliet F. Khosrowabadi Kotyk and Stafford W. Sheehan, Catalytic Innovations
Key factsPopulation 8,712,4001
Area 22,145 km2 2
Climate The country is located between the temperate and tropical zones, bordering the Mediterranean Sea to the west and the desert to the east. For this reason, the climate of Israel is extremely diverse. The coastal areas have a typical Mediterranean climate with cool, rainy winters and long, hot summers, whilst the area of Beersheba and the northern Negev have a semi-arid climate with hot summers, cool winters, and fewer rainy days than the coastal areas. Meanwhile, the southern Negev and the Arava areas have a desert climate with very hot, dry summers and mild winters with few days of rain.3,4 On average temperatures are lowest in January, at 11.1 oC, and highest in August, at 26.8 oC.25
Topography Israel is located in the Levant area of the Fertile Crescent region. Various topological features can be found in Israel, including the Negev desert in the south, the Coastal plain on the shores of the Medi-terranean, the Central highland and the Jordan Rift Valley lies next to the Jordan River.4 The highest point in Israel is Mount Meron, with an elevation of 1,208 metres.4
Rain pattern More than 70 per cent of the average rainfall in Israel occurs between November and March. The pe-riod from June through to September is usually rainless. Rainfall is unevenly distributed, with signifi-cantly lower volumes occurring in the southern portion of the country. In the south rainfall averages nearly 30 mm annually, while in the north average annual rainfall exceeds 900 mm.5
Hydrology Israel’s longest and most known river is the Jordan River (251 km).6 The river flows south through the freshwater Sea of Galilee and eventually empties into the Dead Sea. The Sea of Galilee (also called the Kinneret), covering 166 km2 (64 sq mi), is Israel’s largest and most important freshwater lake, located in the northeast of the country. The Kinneret lies 209-215 meters below sea level and reaches depths of 43 meters.7 South of the Kinneret lies the saltwater Dead Sea which is 430 meters below sea level.8 Currently there are no navigable, artificial waterways in Israel, although the National Water Carrier, a conduit for drinking water, might be classified as such.
Electricity sector overview
Electricity is nationalized and approximately 100 per cent of the population has access to electricity.2,4 As a net electricity exporter, Israel was estimated to export 5,200 GWh in 2016.10
According to the Ministry of Energy and Water Sources, 95.5 per cent of the electricity capacity was from fossil fuels, with no nuclear fuels contributions in 2015.11 The rest of the 4.5 per cent capacity was from renewable energy sources, including solar (703 MW), biogas (11 MW), hydroelectricity (6 MW) and wind power from Golan Heights Wind Farm (6 MW).12
Electricity generated in 2015 was 64,230 GWh, while the supply to consumers was 60,340 GWh, with the difference being exported.24 Electricity is primarily generated from coal (45.4 per cent) and natural gas (51.6 per cent), with the remainder of the energy mix made up of diesel oil (0.6 per cent), residual fuel oil (0.1 per cent), solar power (1.7 per cent), wind power (0.01 per cent), hydropower ( 0.04 per cent) and other (0.51 per cent).25 This is shown in Figure 1.
Figure 1. Annual electrical generation by source in Israel (GWh)
29,161
1,115
355
283
70
65
24
7
Natural gas
Coal
Solar power
Diesel oil
OtherrenewableOther non-renewable
Residualfuel oil
Hydropower
Wind power
33,149
Source: Central Bureau of Statistics24, 25
Despite more than 300 days of sunshine per year, solar energy companies have had a difficult time in the last few years.
3.5.5
World Small HydropoWEr dEvElopmEnt
rEport 2019

172
World Small HydropoWer development report 2019
Almost 50 per cent of the companies in the field have been shut down due to the recent discoveries of large amount of natural gas off the coast. Additionally, supply deals between Israel and Egypt have become prevalent. The abundant supply of natural gas also changed the structure of fossil fuel consumption significantly – in 2009, the electricity sector was dependent on coal (65 per cent) and natural gas (33 per cent), while in 2011 natural gas consumption rose to 45 per cent, and is expected to reach over 65 per cent by 2020.13
Israel is often portrayed as an “electricity island” because it is not interconnected to any other electricity grid. To take advantage of the surplus electricity capacity at off-peak periods, pumped storage hydropower facilities are being designed and built at several locations in Israel. The Israeli Public Utilities Authority commissioned Gilboa PSPP which is the first Israeli hydroelectric pumped storage power plant with capacity of 300 MW.17 The commissioning of the pump-turbines is scheduled for 2018. SDE Sea Wave Power Plant is a tidal wave power plant in Jaffa Port near Tel Aviv, Israel, that is producing 40 kW per year.18 As of 2016, a second hydroelectric pumped storage power plant was planned with a capacity of 340 MW.19 Additionally, the Dead Sea Water Project (2,400 MW) is planned for 2018.19
The Israel Electric Corporation (IEC) supplies the majority of the electricity in the country. In 2017, IEC’s total installed capacity was 13,617 MW, with 4,840 MW from coal and 1,622 MW from natural gas and oil combined. The remaining electricity was generated from various gas turbine units.9 As one of the largest industrial companies in Israel, Israel Electric Corporation (IEC) is the sole integrated electric utility in the State of Israel and generates, transmits and distributes electricity used in the State. In 2009, IEC’s market share in the electricity market was over 99 per cent. As of the end of 2011, the company maintains and operates 17 power stations (including 5 major thermal power stations). In addition to the electricity generated at its power stations, IEC also purchases small amounts of electricity from private electricity producers, which count towards 0.5 per cent of the total supply. In the preceding few years, Government policy has been pushing the competition in electricity sector, and as of 2017, the IEC’s market share has hence dropped to 71 per cent.12
Small hydropower sector overview
Israel does not have a definition for small hydropower. For the purposes of this report SHP will be defined as any hydropower plant with a capacity below 10 MW. According to the Israeli Ministry of Environmental Protection report, there were seven hydroelectric power facilities contributing 6 MW of capacity to the national grid in 2014. However, no detailed information was revealed on these facilities.12 There was also limited information on potential capacity. As the State of Israel is a new addition to the World Small Hydropower Development Report (WSHPDR), we do not have data from previous years to show the evolution of small hydropower utilization in the country (Figure 2).
Figure 2. Small hydropower capacities 2013/2016/2019 in Israel (MW)
N/A
6
Potential Capacity
Installed Capacity
WSHPDR 2019
Source: Ministry of Environmental Protection12
Note: Israel is a new country introduced in the WSHPDR 2019.
Israel has sought to diversify its energy access by using hydropower technologies since 2012.15 One of which includes the Benkatina Turbine, a novel technology invented by engineers from Leviathan Energy. It is often referred to as dam-less hydropower as it generates hydroelectric power from municipal pipes in Israel.16 This small turbine is enclosed in a pipe, so that it fits into existing piped-water systems and generates electricity from water flowing downhill through said turbine. The turbines range in size and power from 5 kW to hundreds of kilowatts. This technology uses only excess pressure in the piping systems so that the integrity of the piping can be maintained. The technology can tolerate variable flow conditions and does not require large infrastructural support. It has been installed in several locations in Israel since 2013. Other than the Benkatina Turbine, other hydroelectric technologies have also been introduced to Israel in the last decade.
Renewable energy policy
Since the establishment of the State of Israel, policies promoting renewable energy research have been made with the aim of making the State less dependent on foreign oil. Throughout the 1970s and 1980s, the Government supported various types of solar energy research. In 1980, the country passed its first solar energy legislation. First-of-its-kind in the world, this legislation required new residential buildings up to 27 meters high to install solar water heaters. In March 1996, the Electricity Sector Law came into effect allowing independent power producers to enter the market and produce up to 20 per cent of the overall installed capacity. It encouraged small and clean electricity producers to sell their electricity to the distribution system and thus accelerate Israel’s move to clean energy. As of 2017, electricity supplied to customers from the national State of Israel electricity company that was produced from private companies and sold to the grid was 14.5 per cent. Approximately, 7,516 GWh were purchased. Over 3,000 MW is now produced from independent power producers, with 1 MW coming from renewable resources.9
In May 1996, Israel became a party to the UN Framework Convention on Climate Change, signing the Kyoto Protocol two years later. In August 1998, the Government declared a decision to encourage the development and application of alternative-energy technologies, with the idea that these technologies would result in pollution abatement and reduce Israeli dependence on foreign fossil fuels. However, despite all
173
3.5. WES
TERN
AS
iA
Government policies related to renewable energies in Israel, the country was still nearly completely reliant on fossil fuels for its energy supply up until 2002.13
In November 2002, the Government reached Decision No. 2664 to encourage the construction and operation by private electricity producers of power plants that operate on renewables. Several solar-thermal units and photovoltaic power plants were built and began operating between 2002 and 2007. In 2007, the National Infrastructures Ministry (today the Energy and Water Resources Ministry) prepared a new plan, which set a 20 per cent reduction of energy consumption goal by 2020. In 2008, the Government initiated a five-year research and development plan aiming at the promotion of the renewable energy sector, including abundant funding, international collaboration, professional training programs and tax benefits, etc. In 2009, the Finance Ministry set a new target for renewable energy production in Israel. Government Decision No. 4450 declared that 10 per cent of Israeli electricity should come from renewable sources by 2020. The plan calls for the construction of three solar power stations between 2010 and 2020. In January 2010, the Infrastructures Ministry’s National Planning and Building Council approved the Solar Energy Planning Strategy supporting rooftop photovoltaic panels and medium/large solar fields. In February 2010, the National Infrastructure Ministry (today the Energy and Water Resources Ministry) published a new renewable-energy policy. The document was written to ensure implementation of Government Decision No. 4450, calling for 10 per cent of electricity to be produced by renewable energies by 2020.13
One major point of progress for the energy independence of Israel was in the 1990s, when all new construction of residential buildings was required to include installation of solar water-heating systems. Currently, over 90 per cent of homes use this technology to meet around 4 per cent of the country’s total energy demand.21,22 In 1996 the Israeli Public Utility Authority (PUA) was created to monitor the tariffs and costs of the Israel Electricity Company. In 2009, there were feed-in-tariffs for solar photovoltaic and wind-powered technology. For small-medium wind installations, the rate is up to 1.60 Israeli Shekels (ILS) per kWh (0.45 US$/kWh) for up to 50 MW of production. Tariffs for residential and industrial solar installations (up to 60 MW) were between 1.07-2.01 ILS/kWh (0.30-0.56 US$/kWh) depending on type. These tariffs were closed to applications in 2013 and now use a net metering system.23
Barriers to small hydropower development• One of the biggest barriers to small hydropower develop-
ment in Israel is the unequal distribution of precipitation in the country, both temporally and geographically.
• Recent inexpensive natural gas market prices and the near-monopoly the State (IEC) has on the electricity sec-tor also contribute to the slow development of small or distributed hydropower.
• Pumped hydroelectric energy storage does have signifi-cant opportunities to store intermittent solar and wind energy during off-peak times. However, the costs of solar and wind farms are currently high compared to natural gas prices in Israel.
• In terms of policy, though the Government encourages the development of renewable energy, there is more emphasis on solar rather than hydropower for the aforementioned geographic and distribution of precipitation. As solar and wind energy utilization increases in Israel, due to their in-termittency, pumped hydro energy storage is becoming increasingly viable, as evidenced by the construction of new plants in 2018. Government policies in the State of Israel that incentivize renewable energy adoption may, in this manner, help to lower the barriers to SHP.
• Further utilization of unconventional small-scale hydro-power sources, such as those leveraged by the Benkatina Turbine and in agricultural waterways, may also have an impact. The impact of the legislation that adopted solar water heaters, toward reducing energy consumption from non-renewable sources, has demonstrated that highly dis-tributed energy generation approaches can be successful in Israel.
References
1. The World Bank (2016). Population, total. World Development Indicators. Available from www.data.worldbank.org. Accessed on 19 June 2018.
2. State of Israel, Ministry of Foreign Affairs. THE LAND: Geog-raphy and Climate. Israel Ministry of Foreign Affairs. Available from http://www.mfa.gov.il/mfa/aboutisrael/land/pages/the%20land-%20geography%20and%20climate.aspx. Accessed on 19 June 2018.
3. Israel-Britain Chamber of Commerce (n.d.). Useful Information about Israel. Available at http://www.ibcc.org.il/useful-informa-tion. Accessed on 1 June 2018.
4. Elath, E., R. Stone, H. Sicherman and W. Ochsenwald (2018). Israel. Encyclopaedia Britannica, Inc, 2 May. Available at https://www.britannica.com/place/Israel. Accessed on 1 June 2018.
5. Weather Online (2018). Israel and Palestine. Weather Online. Available at https://www.weatheronline.co.uk/reports/climate/Israel-and-Palestine.htm. Accessed on 28 May 2018
6. Editors of Encyclopaedia (2016) Britannica. Jordan River. Ency-clopaedia Britannica, Inc, 7 December. Available at https://www.britannica.com/place/Jordan-River. Accessed 1 June 2018.
7. Editors of Encyclopædia Britannica (2017). Sea of Galilee. En-cyclopaedia Britannica, Inc, 7 March. Available at https://www.britannica.com/place/Sea-of-Galilee. Accessed on 1 June 2018.
8. Pletcher, K. (2018). Dead Sea. Encyclopaedia Britannica, Inc, 5 January. Available at https://www.britannica.com/place/Dead-Sea. Accessed on 1 June 2018.
9. The Israel Electric Corporation Ltd. Financial Reports for the year ended December 31, 2017. Tel Aviv, 2018. Available at https://www.iec.co.il/EN/IR/Documents/The_Israel_Elec-tric_Co-Financial_Reports_December_2017b.pdf. Accessed on 1 June 2018.
10. Index Mundi (n.d.). Israel vs. West Bank. Index Mundi. Available at https://www.indexmundi.com/factbook/compare/israel.west-

174
World Small HydropoWer development report 2019
bank/energy. Accessed on 28 May 2018.11. Index Mundi (2018) Israel Electricity – from fossil fuels. Index
Mundi, 20 January. Available at https://www.indexmundi.com/israel/electricity_from_fossil_fuels.html. Accessed on 28 May 2018.
12. The State of Israel, Ministry of Environmental Protection (2013). Renewable Energy Implementation in Israel: Facts and Figures, 1 July. Available at http://www.sviva.gov.il/English/env_topics/climatechange/renewable-energy/Pages/Renewable-Energy-Im-plementation-in-Israel.aspx. Accessed on 1 June 2018.
13. Lipstein, N. and A. Tal (n.d.). Israeli Renewable Energy Policy: Past and Present. Aytzim. Available at http://aytzim.org/resourc-es/jeg/318. Accessed on 29 May 2018.
14. Shkedi, D. (2015). The Electricity Sector in Israel. Embassy of India. Tel-Aviv, 2015. Available at http://www.indembassy.co.il/pdf/Report-on%20the-National-Electricity-Sector-Reis-sued-June-2015.pdf. Accessed on 28 May 2018.
15. S. Willner, E. (2014). Hydropower and pumped-storage in Is-rael – The energy security aspect of the Med-Dead Project. Negev, Dead Sea and Arava Studies, 6: 1–9. Available at http://arava.org/wp-content/uploads/2013/04/Willner-Hydropow-er-and-Pumped-Storage-in-Israel-2014.pdf
16. HIRSCH (2013). Dam-less Hydropower! Energy Technology, & Policy, 7 April. Available at https://webberenergyblog.wordpress.com/2013/04/07/dam-less-hydropower. Accessed on 29 May 2018.
17. Maruzewski, P., T. Sautereau, Y. Sapir, H. Barak, F. Hénard and J.-C. Blaix (2016). The First Israeli Hydro-Electric Pumped Storage Power Plant Gilboa PSPPIOP Conf. Ser.: Earth En-viron. Sci. 49. Available at http://iopscience.iop.org/arti-cle/10.1088/1755-1315/49/11/112003/meta
18. SDE Ltd. (2010) SDE has Finalized the Construction of the First Sea Wave Power Plant in Jaffa Port, Israel. PRNewswire, 27 July. Available at https://www.prnewswire.com/news-releases/sde-has-finalized-the-construction-of-the-first-sea-wave-power-plant-in-jaffa-port-israel-99299954.html. Accessed on 25 May 2018.
19. Harris, M. (2016). Consortium signs deal for 340 MW pumped-storage plant in Israel. Hydroworld, 14 April. Available at https://www.hydroworld.com/articles/2016/04/consortium-signs-deal-for-340-mw-pumped-storage-plant-in-israel.html. Accessed on 25 May 2018.
20. Kraemer, S. (2012). First Sea Water Pumped Hydro Proposed – Staggering 2,400 MW Potential. Green Prophet, 5 January. Available at https://www.greenprophet.com/2012/01/first-sea-water-pumped-hydro-proposed-staggering-2400-mw-potential. Accessed on 28 May 2018.
21. Sandler, N. (2008). At the Zenith of Solar Energy. BusinessWeek, March 26. Available at https://www.bloomberg.com/news/articles/2008-03-26/at-the-zenith-of-solar-energybusiness-week-business-news-stock-market-and-financial-advice. Ac-cessed on 1 June 2018.
22. Del Chiaro B. and Timothy Telleen-Lawton (2007). Solar Water Heating – How California Can Reduce Its Depen-dence on Natural Gas. Environment California Research and Policy Center (April). Available at https://web.archive.org/web/20070927082332/http://www.environmentcalifornia.org/uploads/at/56/at563bKwmfrtJI6fKl9U_w/Solar-Water-Heating.pdf. Accessed on 1 June 2018.
23. International Energy Agency (2017). Israel: Feed-in-Tariffs for Solar PV and Wind Sourced Power. International Energy Agency, 25 August. Available at http://www.iea.org/policiesandmeasures/pams/israel/name-24774-en.php. Accessed on 1 June 2018.
24. The State of Israel, Central Bureau of Statistics (2017) Electricity Generation and Electricity Supply. Energy, 13 September. Avail-able at http://www.cbs.gov.il/shnaton68/st21_03.pdf. Accessed on 5 June 2018.
25. The State of Israel, Central Bureau of Statistics (2017) Electricity Generation by Type of Energy and Producer. Energy, 7 Septem-ber. Available at http://www.cbs.gov.il/reader/?MIval=cw_usr_view_SHTML&ID=564. Accessed on 5 June 2018.
26. The World Bank Group (2018). Average Monthly Tempera-ture and Rainfall for Israel from 1901-2015. Climate Change Knowledge Portal. Available from http://sdwebx.worldbank.org/climateportal/index.cfm?page=country_historical_climate&This-Region=Middle%20East&ThisCCode=ISR. Accessed on 19 June 2018.

175
3.5. WES
TERN
AS
iA
Jordanmohammad Hassan alZoubi, yarmouk University
Key factsPopulation 9,702,3531
Area 89,342 km²
Climate Jordan is characterized by long, hot, dry summers and short, cool winters. The climate is influenced by its location between the subtropical aridity of the Arabian Desert and the subtropical humidity of the eastern Mediterranean region. January is the coldest month, with temperatures ranging bet-ween 5 °C and 10 °C, and August is the hottest month with average temperatures between 20 °C and 35 °C. Daytime temperatures can be very high, especially during the summer months, sometimes reaching 40 °C or higher. Summer winds are strong and hot, causing sandstorms in desert and se-mi-desert areas.3
Topography Jordan is landlocked except for a short stretch of coast along the Gulf of Aqaba in the south. The main topographical feature of Jordan is a dry plateau running from north to south. It rises steeply from the eastern shores of the Jordan River and the Dead Sea, reaching heights of between 610 and 915 metres. In the west of the country runs the Great Rift Valley, a deep depression, which includes the Jordan Valley, the Wadi Araba and the Dead Sea. In the area of Lake Tiberias, the valley reaches 213 metres below sea level, whereas the Dead Sea marks the world’s lowest point, at 395 metres below sea level. In the easternmost part of the country, the land slopes downwards from the plateau to the semi-arid steppe zone of the Syrian Desert. The Desert, located in the south and east of Jordan, occupies appro-ximately 80 per cent of the country’s territory. Bordered to the east by steep highlands, the Jordan River Valley lies in the west. Jabal Ramm in the south, is the highest point, reaching 1,753 metres.4
Rain pattern Approximately 70 per cent of the rainfall in the country falls between November and March. The annual rainfall is less than 200 mm on average, with most of it evaporating back to the atmosphere. Over 70 per cent of the country receives less than 100 mm of rainfall a year, while only 2 per cent of the land area, located in the north-western highlands, receive over 300 mm a year. The northern-most highlands sometimes receive as much as 600 mm. Precipitation varies from season to season and from year to year. It is often concentrated in violent storms, causing erosion and local flooding, especially in winter.3
Hydrology High evaporation and infiltration result in a relatively small annual flow of approximately 878 million m3, excluding the Jordan River flow.5 The valley streams in the north, the Jordan River and the Yar-mouk River on Jordan plateaus drain into the Dead Sea. The Dead Sea, located in the central area of the valley, consists of salt marches that do not support vegetation. To the north, there are valleys that contain perennial streams running west. Around the Al-Karak area, they begin to flow west, east and north.6 In the last few years, due to the absence of control on flow scheme and due to the conflict in the Syrian Arab Republic, the amount of available water has been significantly reduced.
Electricity sector overview
The total installed capacity of Jordan, as of the end of 2016, reached 4,609 MW, of which thermal power accounted for almost 90 per cent and renewable energy sources for the remaining 10 per cent (Figure 1). Most of the installed capacity (4,419 MW) was part of the Jordanian Power System, while the remaining 190 MW belonged to the industrial sector.7
In 2016, electricity generation in Jordan was at 19,730 GWh, of which 96 per cent came from thermal power and the remaining 4 per cent from renewable energy sources (Figure 2). A further 334 GWh was imported from Egypt.7
The installed capacity of Jordan has been growing in the last few years at a rapid rate to meet the increasing demand and to keep a sufficient reserve (Table 1). Thus between 2013 and 2016 the installed capacity increased by almost 40 per cent. The production of electricity over the same period increased by 14 per cent.7 The system’s peak load in 2016 was approximately 3,250 MW in winter months and 3,165 MW in summer months. Average per capita consumption of electricity in 2016 amounted to 1,719 kWh, indicating a 1.6 per cent growth compared to consumption in 2015 (1,692 kWh).7 In Jordan, almost 100 per cent of the population are supplied with electricity, both in rural and urban areas.1
3.5.6
World Small HydropoWEr dEvElopmEnt
rEport 2019

176
World Small HydropoWer development report 2019
Figure 1. Installed electricity capacity by source in Jordan (MW)
Combined cycle
Diesel
Steam
Gas
Solar power
Wind power
Hydropower
Biogas
2,167.0
860.8
740.0
341.5
285.5
198.4
12.0
3.5
Source: NEPCO7
Figure 2. Annual electricity generation by source in Jordan (MW)
Combined cycle
Steeam
Diesel
Solar power
Wind power
Gas
Hydropower
Biogas
15,108.2
2,523.0
841.1
491.0
390.7
330.5
41.6
4.1
Source: NEPCO7
Table 1.Development of installed capacity in Jordan
Installed capacity (MW)*
2013 2014 2015 2016
Combined cycle 1,737.0 1,737.0 2,167.0 2,167.0
Diesel 46.8 860.8 860.8 860.8
Steam 872.0 922.0 922.0 740.0
Gas 652.5 652.5 366.5 341.5
Solar power - - 5.0 285.5
Wind power 1.4 1.4 118.4 198.4
Hydropower 12.0 12.0 12.0 12.0
Biogas 3.5 3.5 3.5 3.5
Total 3,325.2 4,189.2 4,455.2 4,609.7 Source: NEPCO7
Note: * Including the electricity generating capacity of the industrial sector.
The National Electric Power Company of Jordan (NEPCO) used to provide almost all the bulk power to the national grid. In 1997, as part of the broader reform of the energy
sector aiming to provide a competitive environment and attract private investment, NEPCO was unbundled into three separate shareholding companies – NEPCO, the Central Electricity Generating Company (CEGCO) and the Electricity Distribution Company (EDCO).8 Other power companies operating in Jordan include the Jordanian Electric Power Company, Central Electricity Generating Company, Electricity Distribution Company, Irbid District Electricity Company, Samra Electric Power Generating Company, Amman Company to Generate Electricity and Qatraneh Electric Power Company.8 In addition to the power stations operated by the utilities, there are also a number of industrial enterprises that generate electricity at their own plants. Some of these also feed excess electricity into the Jordanian interconnected grid. NEPCO operates the transmission network of Jordan, which is composed principally of 400 kV (904 km) and 132 kV (3,200 km) circuits. The transmission system is structured along the north-south axis of Jordan. It represents a radial system with no looping except for a small ring around the main load centre of Amman. The distribution grids are served from this system at 132 kV. The direct service bulk customers are also served from this system. Moreover, the Jordanian power system is interconnected with the power system of Egypt through a 400 kV submarine cable crossing the Gulf of Aqaba in the southern part of Jordan. The northern part of Jordan is interconnected with the Syrian power system.6,7,9 The increased number of renewable energy plants in the southern part of Jordan has forced the transmission system operators to implement the Green Corridor project to enhance the existing transmission lines and transfer electricity generated in the south to the load centre.10
Despite being adjacent to several oil-rich countries, Jordan has limited oil resources and struggles to meet its energy needs, especially when oil prices increase. As a result, a large portion of the country’s budget is spent on oil imports. Besides, although most thermal power plants in Jordan can burn both diesel and gas fuels, between 80 and 90 per cent (83 per cent in 2016) of the currently generated electricity comes from burning imported gas, which supplies a load capacity of approximately 2,500 MW.7 The problem is aggravated year after year due to the population growth and increasing electricity demand.11 Furthermore, the development of the country’s industrial sector requires higher fuel consumption and a continuous operation of power plants.
Therefore, the search for alternative energy sources has become an imminent issue for Jordan.9 The generation system is being developed continuously and the Government aims to benefit from solar and wind power generation during the daytime as much as possible. Another alternative for Jordan is oil shale. Jordan is considered to have significant reserves of oil shale, which can be utilized commercially by direct incineration to produce electricity. The Government has decided to market oil shale, aiming to attract international companies to utilize it. The current plan is to achieve a 15 per cent share of oil shale in the country’s energy mix by 2020.12 Plans for nuclear power are also under discussion.

177
3.5. WES
TERN
AS
iA
The cost of importing energy to Jordan decreased to 10.1 per cent of GDP in 2015 compared to 17.3 per cent in 2014, in addition to the decrease in the cost of generating electricity, which was approximately 0.11 JD/kWh (0.16 US$/kWh) in 2015. All of this resulted in decreasing NEPCO’s losses in 2015 by 79 per cent as the company recorded JD 232 million (US$ 327 million) of losses in comparison to JD 1,179 million (US$ 1,662 million) in 2014.13 Although these figures fluctuate with oil prices and growth of the renewable energy sector, they still cause some financial problems for the energy sector in Jordan.
The electricity market of Jordan was partially privatized at the end of the 1990s and relies on the single buyer scheme. This policy however did not affect the electricity tariffs, the structure of which takes into account the social aspects as well as the economic capacities of the consumers. In 2016, the electricity prices for the end consumer ranged from JD 0.033 per kWh (0.047 US$/kWh) for small residential consumers using less than 160 kWh per month to JD 0.285 per kWh for the banking sector (0.40 US$/kWh). In order to reduce the losses of the electricity sector, the Government developed a National Strategic Plan 2007-2020, which foresees the adjustment of electricity tariffs and other measures to enhance efficiency. A plan prescribing electricity price development for different consumer categories was stopped by the end of 2015 and was replaced by a new one, which linked monthly electricity prices to oil prices. Electricity remains subsidized for many categories of users, for example, for consumers with low electricity consumption.14
Small hydropower sector overview
The definition of small hydropower (SHP) in Jordan is up to 10 MW. The installed capacity of SHP plants as of the end of 2016 was 12 MW.7 The potential of SHP, according to the studies by the Ministry of Water and Irrigation, is at 58.15 MW.15 Compared to the results of the World Small Hydropower Development Report (WSHPDR) 2016, installed and potential capacities remained unchanged (Figure 3).
Figure 3. Small hydropower capacities 2013/2016/2019 in Jordan (MW)
0 10 20 30 40 50 60
PotentialCapacity
Installed Capacity
58.2 58.2 58.2
12.0 12.0 10.0
WSHPDR 2019WSHPDR 2016WSHPDR 2013
Source: WSHPDR 2016,6 NEPCO,7 Jabera,15 WSHPDR 201316
Note: The comparison is between data from WSHPDR 2013, WSHPDR 2016 and WSHPDR 2019.
There are three small hydropower plants in Jordan. One of them is located at the Aqaba thermal power station, and
utilizes the returning cooling seawater to generate electricity and has a capacity of 5 MW. The other plant, King Talal Dam, is located on the Zarqa River, has a capacity of 5 MW and generates 25 GWh annually.7 The third hydropower plant is installed on the Khirbet Al-Samra water treatment plant and uses the water flow from the plant to generate more than 10 GWh of electricity annually.
The contribution of hydropower to the country’s energy mix remains very small. On the other hand, there is a great possibility to generate electricity using the elevation difference between the Red Sea and the Dead Sea. A preliminary pre-feasibility study showed that the potential capacity of hydropower station built in this region could be 800 MW.17,18 The main barrier for executing this project is the lack of funding, although several international investors have expressed interest in the project, but no effective steps have been taken yet.
At the same time, there are plans to develop small hydropower by utilizing the water flow of the Zarqa River. The studies of the SHP potential on the river are yet to be conducted. The Ministry of Water and Irrigation announced several hydropower projects, which could generate 7.4 GWh annually. These projects are planned to be built at water treatment plants across the country to increase the share renewable energy in the energy mix of Jordan. Each project is to be in full agreement with international standards and environmental requirements and be connected to the national electric grid. Such projects are expected to be successful after gaining enough experience from the Alsamra water treatment plant.6 The projects are planned to be gradually started within the next three years.
Renewable energy policy
The attempts to introduce renewable energy as a support or replacement to the conventional sources have been taken by the Government since the 1980s. Several remarkable achievements have been made in the last two decades, strengthening the role of renewable energy sources in the country’s energy mix. The participation of wind and solar power in supplying the daily loads has increased significantly.7
The electricity consumption pattern in Jordan was found to agree with the renewable energy generation mode. The hot summer months in general, and July and August in particular, are associated with a high rate of electricity consumption in Jordan (e.g., electric fans, water pumps and air conditioners).19,20 Luckily, the most suitable months for wind power production in Jordan are the summer months. Therefore, the agreement between the wind energy production and the monthly load behaviour increases the importance of existing and planned wind farms. The potential of wind power in Jordan is estimated to exceed 1 GW. As of the end of 2016, there were six wind power projects with a combined capacity of 420 MW expected to be completed in 2018-2019.7 Jordan also possesses significant solar power resources, and the growing awareness of the population about the benefits of

178
World Small HydropoWer development report 2019
solar power has resulted in the growth of small and medium-scale projects in the last three years.21
The strategy of the Government in relation to the renewable energy sector is outlined in the National Energy Strategy Plan 2007-2020, which, alongside the goals of maximizing the use of domestic resources and generating electricity from nuclear power, sets the goal to expand the development of renewable energy projects. The Government aims to achieve a 10 per cent share of renewable energy sources in the country’s energy mix by 2020. The particular focus is being made on wind power and solar power.12
Barriers to small hydropower developmentAlthough the potential capacity of SHP in Jordan exceeds 50 MW, the developed capacity remains rather low. There are a number of barriers limiting the development of small hydro-power in Jordan. Among these barriers are:• The limited availability of surface water resources;• A lack of local technical small hydropower capacities,
contributing to the high cost of imported services and goods;
• A lack of incentives for and investments from the private sector to operate and own small hydropower plants;
• Limited access to funding sources for small hydropower projects;
• Low confidence of investors in this source of power;• The instability of the political situation in the region,
which diverts the priorities of country investment from hydropower projects.
References
1. World Bank (2016). Jordan. Available https://data.worldbank.org/country/jordan
2. Though Co (2017). Geography of Jordan. Available from http://geography.about.com/od/jordanmaps/a/Geography-Of-Jordan.htm
3. Weatheronline (n.d.). Jordan. Available from http://www.weatheronline.co.uk/reports/climate/Jordan.htm
4. Middle East Arab (n.d.). Geography of Jordan: Topography Available from http://middleeastarab.com/jo/geography-jordan-topography.html
5. Raddad, K. (2005). Water supply and water use statistics in Jordan, IWG-Env, International Work Session on Water Statistics, Vienna, June 20-22 2005
6. Xialei, C., Singh, P. R., Xianlai, W., and Kremere, E., eds. (2016). World Small Hydropower Development Report 2016. United Nations Industrial Development Organization; International Center on Small Hydro Power. Available from www.smallhydroworld.org.
7. National Electric Power Company (NEPCO) (2017). Annual report 2016. Available from http://www.nepco.com.jo/store/docs/web/2014_en.pdf.
8. The Official Site of the Jordanian e-Government (n.d.). National
Electricity Company. Available from https://jordan.gov.jo/wps/portal/Home/GovernmentEntities/Agencies/Agency/National%20Electricity%20Company?nameEntity=National%20Electricity%20Company&entityType=otherEntity
9. AlZoubi, M. (2010). Renewable Energy Potential and Characteristics in Jordan. Journal of Mechanical and Industrial Engineering, Volume 4, Number 1, Jan.pp. 45 - 48
10. The Jordan Times (2017). NEPCO signs deals for two phases of Green Corridor project. The Jordan Times, 19 January 2017. Available from http://www.jordantimes.com/news/local/nepco-signs-deals-two-phases-green-corridor-project
11. Zoubi, M. (20014). Solar Energy Status in Jordan, Facts and Figures, SHAAMS Project, March 2014, Italy
12. Hashemite Kingdom of Jordan (2007). Updated Master Strategy of Energy Sector in Jordan for the period 2007-2020. Available from http://inform.gov.jo/Portals/0/Report%20PDFs/5.%20Management%20of%20Land%20&%20Resources/i.%20Energy%20Security/2007-2020%20Updated%20Master%20Strategy%20of%20Energy%20Sector%20in%20Jordan.pdf
13. Jordan Strategy Forum (2016). Position Paper on Alternatives to Increasing the Electricity Tariffs in Jordan July 2016. Available from http://jsf.org/sites/default/files/Electricity-P-EN.pdf
14. Deuthsche Gesellschaft für Internationale Zusammenarbeit (GIZ) (2014). Enabling PV in the MENA Region. The Emerging PV Market in Jordan. Available from https://www.solarwirtschaft.de/fileadmin/media/pdf/ENABLING_PV_Jordan_web.pdf
15. Jabera, J.O. (2012). Prospects and Challenges of Small Hydropower Development in Jordan. Jordan Journal of Mechanical and Industrial Engineering, vol.6, No.2 (April), pp. 110-118
16. LIU, H., Masera, D. and Esser, L., eds. (2013). World Small Hydropower Development Report 2013. United Nations Industrial Development Organization; International Center on Small Hydro Power (2013) Available from www.smallhydroworld.org
17. Jordan, Ministry of Energy and Mineral Resources (2011). Annual Report. Amman, available from http://www.memr.gov.jo/echobusv3.0/SystemAssets/333853a2-7d89-4021-80f3-449f89707679.pdf
18. Abu-Shikhah, N., Badran, O.O. & Jabera, J.O. (2003). Sustainable energy and environmental impact: role of renewables as clean and secure sources of energy for the 21st century in Jordan. Clean Technologies and Environmental Policy, vol. 6, No.3 (September), pp. 174-186.
19. AL-Shakarchi, M.R. & ABU-Zeid, N.SH. (2002). A Study of load management by direct control for Jordan’s Electrical Network. Power System, Journal of Science & Technology, vol. 7, No. 2, 2002, pp.25-30.
20. Abderrazzaq, M. (2004). Energy production assessment of small wind farms. International Journal of Renewable Energy. Elsevier, vol. 29, 2004, pp. 2261-227.
21. AlZoubi, M. & Radaideh, N. (2017). Assessment of Solar Energy Development in Irbid Area, Irbid International Engineering Conference, November, 2017
22. Rawashdeh, R. (2015). Water project to generate 7.4 GWh of electricity annually. Alrai newspaper, 05 July 2015, p. 8
23. Author’s personal communication with Senior Engineers from the National Electric Power Company.

179
3.5. WES
TERN
AS
iA
LebanonKarim osseiran, Senior Energy Consultant
Key factsPopulation 6,006,668 1
Area 10,452 km2
Climate The climate is Mediterranean, with mild to cool, wet winters and hot, dry summers. The moun-tainous regions of the country experience heavy winter snows. The coldest month is January with average temperatures ranging between 5 °C and 10 °C, and the hottest month is August at 18 °C to 38 °C.2
Topography Lebanon consists of four physiographic regions – the coastal plain, the Lebanon mountain range, the Beqaa Valley and the Eastern Lebanon mountains. Waterbodies account for 1.6 per cent of the country’s area. The highest point in Lebanon is Qurnat as Swada, at 3,088 metres above sea level, which lies in northern Lebanon and gradually slopes to the south before rising again to 2,695 metres as Mount Sannine.2
Rain pattern The rainy season is in the winter, with major precipitation falling after December. Rainfall is generous but is concentrated over only a few days of the rainy season, falling in heavy cloudbursts. Annual precipitation averages 823 mm with great variations from one year to the next as well as among the regions – between 600 and 1,000 mm in the coastal area, between 900 and 1,700 mm in the western mountain range, between 500 and 900 mm in the eastern mountain range, and between 200 and 900 mm in the Beqaa Valley. Much of this precipitation, however, is lost to evaporation, to neighbouring countries and to the Mediterranean Sea, while a relatively small percentage remains available as underground and surface water. Furthermore, analysis of annual precipitation based on 80 years of observation showed a decreasing tendency starting from the year 1970. Occasionally there are frosts during winter, and about once in every 15 years a light powdering of snow falls as far south as Beirut.2,10
Hydrology The mountains of Lebanon are drained by seasonal torrents and rivers. An important water source in southern Lebanon and in the country as a whole is the Litani River. The river originates from the Beqaa Valley, west of Baalbek, and flows into the Mediterranean Sea north of Tyre. Exceeding 140 km in length, the Litani is the longest river in Lebanon, and represents a major source for water supply, irrigation and hydroelectricity.2
Electricity sector overview
As of January 2017, the installed capacity of Lebanon, including temporary barges, was at 3,035 MW. However, available capacity was assumed to be significantly lower.9,13 The country’s energy mix has been dominated by fossil fuels, with thermal power plants accounting for more than 90 per cent of total installed capacity (Figure 1). At the same time, the share of hydropower has been decreasing since the installed capacity of hydropower plants has remained unchanged since the 1960s. The current peak demand in Lebanon significantly exceeds the available installed capacity and was estimated at 3,300 MW in early 2017.13 As a result of the gap between supply and demand, self-generation remains significant in Lebanon. It is estimated that the installed capacity of existing off-grid generation may even exceed the utility generation capacity. However, self-generation and unserved demand are not recorded systematically.
In 2015, the electricity sector of Lebanon generated 18,396 GWh of electricity, with 97 per cent coming from thermal
power plants and only 3 per cent from hydropower plants (Figure 2).14 An additional 268 GWh was imported.14 The share of hydropower generation fluctuates significantly depending on the yearly precipitation.4 Of the country’s total electricity supply of 16,603 GWh in 2015, 39 per cent was consumed by the residential sector, 26 per cent by industry and 17 per cent by the commercial and public sectors (Figure 3).14
Figure 1. Installed electricity capacity by source in Lebanon (MW)
2,753
282
Thermal power
Hydropower
Source: Osseiran,9 LCRP13
3.5.7
World Small HydropoWEr dEvElopmEnt
rEport 2019

180
World Small HydropoWer development report 2019
Figure 2.Annual electricity generation by source in Lebanon (GWh)
17,917
479
Thermal power
Hydropower
Source: IEA14
Figure 3. Electricity consumption by sector in Lebanon (%)
Residential 39%Industry 26%Other 19%Commercial &public servces 16%
Source: IEA14
Lebanon has a 100 per cent electrification rate, both in ur-ban and in rural areas.1 Electricity tariffs depend on the type of consumption, amount of consumed electricity and voltage (Table 1).
Table 1.Electricity tariffs in Lebanon
CategoryTariff rate (LBP/kWh
(US$/kWh))
Low-voltage residential and commercial
1-100 kWh 35 (0.023)
101-200 kWh 55 (0.036)
201-300 kWh 55 (0.036)
301-400 kWh 80 (0.053)
401-500 kWh 120 (0.079)
>500 kWh 200 (0.013)
Low-voltage public establishments and administrations, water establishments, schools, hotels, hospitals and street lighting
140 (0.092)
Low-voltage industry, agriculture and artisans 115 (0.076)
Medium-voltage public administration, public establishments, municipalities 140 (0.092)
Medium-voltage pumping 130 (0.086)
Medium-voltage agriculture and industry < 100 KVA 130 (0.086)
Medium-voltage lighting < 100 KVA 140 (0.092)
Medium-voltage private sector > 100 KVA Peak time 320 (0.21)
Medium-voltage private sector > 100 KVA Day time 112 (0.074)
Medium-voltage private sector > 100 KVA Night time 80 (0.053)
Source: EDL15
In 2010, Law 462 introduced a legal framework for the privatization, liberalization and unbundling of the electricity sector. However, it has not yet been applied. On the contrary, Decrees No. 16878/1964 and No. 4517/1972, which granted Electricité du Liban (EDL) exclusive authority in the generation, transmission, and distribution areas, were still being applied. To date, EDL controls over 90 per cent of the country’s electricity sector and remains state-owned.15 Underpinned by the lack of investment, the rising cost of fuel, the need for refurbishment of power plants, the high technical and commercial losses in transmission and distribution, the inefficient tariff structure, the deteriorating financial, administrative, technical and human resources of EDL and the convoluted legal and organizational frameworks, failure to reform the electricity sector has caused an annual deficit of US$ 1.5 billion. Losses to the national economy are estimated to be at least US$ 2.5 billion per year.5
Following the endorsement of the Electricity Policy Paper by the Government of Lebanon in 2010, several initiatives were launched to address that insufficient generation capacity. In 2012 the Government, represented by the Ministry of Energy and Water (MoEW), entered into a contract agreement for renting 270 MW of reciprocating engines mounted on floating barges. The first power barge, moored at the existing Zouk thermal station, started operation in the winter of 2013 and has supplies a total capacity of 188 MW. The second barge, moored at the Jieh thermal station, started operation in the summer of 2013 supplying a total capacity of 82 MW. In 2016 the barges rental contract was extended for a two-year period until late 2018 and the capacity of the Jiyeh barge was increased by 110 MW. Secondly, in late 2016 two reciprocating engine power plants were synchronized at the sites of Zouk and Jieh for a capacity of 194 MW and 78.2 MW, respectively. Finally, as part of an operation and maintenance contract, EDL implemented upgrade packages sequentially at Zahrani and Deir Amar thermal power plants. The upgrade was completed by the end of summer 2013 and added a capacity of at least 63 MW in total in addition to enhancements in efficiency and lifetime extensions.13
Starting from 2011, the Syrian crisis has caused an influx of refugees into Lebanon, which, as shown by a 2017 United Nations Development Programme (UNDP) assessment, has led to a surge in electricity demand and surpassed most efforts made by the Government to improve supply, leaving the country with a higher energy deficit than in 2012. The study revealed that the 1.5 million displaced Syrians require an additional 450 MW to 480 MW of power supply. It also showed that the percentage of illegal connections to the grid varied from 36 per cent in the north of Lebanon to 82 per cent in Beirut and Mount Lebanon, with an average of 45 per cent across the country. These facts result in a financial burden for the national economy exceeding US$ 330 million per year.6
In 2014, Law 288 sidelined Law 462 by indicating that from April 2014 to April 2016 the Council of Ministers (COM), upon joint recommendations from MoEW and the Ministry of Finance, could license Independent Power Producers (IPPs) pending the implementation of Law 462. Furthermore,

181
3.5. WES
TERN
AS
iA
in October 2015 the Lebanese Parliament approved Law 54 extending the duration of Law 288 until April 2018. Finally, in May 2018 the Lebanese Council of Ministers approved a draft law calling for the extension of Law 54 for a further two-year period.8
Based on the application of Law 288 (2014) and Law 54 (2015), in April 2018 MoEW published a call for expressions of interest from private investors and companies to participate in proposal submissions to build and operate hydropower plants, with the deadline being mid-June 2018. The Government’s objective is to procure hydropower using Power Purchase Agreements (PPA) with private sector entities being expected to finance, develop, acquire land, design, build, own, operate and maintain hydropower plants and deliver electricity to the EDL network. EDL will contract to purchase electricity for 20 years.8
Small hydropower sector overview
The definition of small hydropower (SHP) in Lebanon is up to 10 MW. Lebanon has seven small, mini- and micro-hydropower plants with a total capacity of 31.2 MW (Table 2).9 However one of them, Jeita hydropower plant, is currently out of service. SHP potential is estimated to be 139.8 MW, indicating that slightly more than 22 per cent has been developed. Compared to the World Small Hydropower Development Report (WSHPDR) 2016, installed and potential capacities remain the same (Figure 4).
Figure 4. Small hydropower capacities 2013/2016/2019 in Lebanon (MW)
0 30 60 90 120 150
PotentialCapacity
Installed Capacity
31 31 31
140 140 60
WSHPDR 2019WSHPDR 2016WSHPDR 2013
Source: LCEC,3 Osseiran,9 SOGREAH,12 WSHPDR 2016,16 WSHPDR 201317
Note: The comparison is between data from WSHPDR 2013, WSHPDR 2016 and WSHPDR 2019.
In 2012, MoEW, in collaboration with consultancy firm Sogreah-Artelia, prepared a master plan study of the country’s hydropower potential along the main river streams. The study identified 32 new sites that have a potential hydroelectric capacity of 263 MW (1,271 GWh/y) in run-of-river schemes and 368 MW (1,363 GWh/y) in peak schemes (i.e., with reservoir infrastructure). The Sogreah-Artelia study identified three levels of new hydropower sites. Approximately 125 MW of potential hydropower capacity is viable, in exceptionally favourable locations with low environmental impact and relatively low levelized costs. An additional 100 MW is also available and viable, although relatively less favourable than the first trench, while a final 25 MW exists with less favourable
conditions. In all three cases, special attention has to be attributed to the environmental impacts of installations. All three trenches (with the exception of one site) have levelized costs lower than the current average EDL generation costs (which is at least 0.17 US$/kWh).7
Table 2.Small hydropower plants in Lebanon
Plant name Owner Installed capacity
FitriSociété Phoeniciene Des Forces De Nahr Ibrahim Des Eaux Et Electricité
3 x 1.664 MW
Bechare
La Kadisha - Société Anonyme D’électricité Du Liban Nord S.A.L.
(EDL Owned)
2 x 0.82 MW
Mar Licha
La Kadisha - Société Anonyme D’électricité Du Liban Nord S.A.L.
(EDL Owned)
3 x 1.04 MW
Blaouza
La Kadisha - Société Anonyme D’électricité Du Liban Nord S.A.L.
(EDL Owned)
3 x 2.8 MW
Abu-Ali
La Kadisha - Société Ano-nyme D’électricité
Du Liban Nord S.A.L. (EDL Owned)
2 x 2.72 MW + 1 x 2.04 MW
Al Bared 2 Al Bared Concession 1 x 1.2 MW + 1 x 2.5 MW
Jeita Water Authority for Mount Lebanon
1 x 0.312 MW + 2 x 0.8 MW
Total 31.244 MW Source: MoEW19
Of the identified 32 sites, 23 are up to 10 MW adding up to 108.6 MW of potential capacity with an expected total annual generation of 533 GWh.12 Some of the planned SHP plants may be developed within the framework of the expression of interest launched by MoEW in April 2018. Micro- and mini-hydropower plants are likely to become relatively more important in Lebanon if the country is to preserve and increase its hydropower resources. A UNDP-CEDRO (2013) publication “Hydropower from Non-River Sources” focused on a selection of potential sites where hydropower could be utilized, namely cooling systems of nearshore power plants, irrigation channels, water networks, and sewage networks. This study identified 13 pilot sites with a capacity of approximately 5 MW. However, a bigger potential for non-river SHP development remains to be identified and tapped into.7
In 2016, MoEW, with the technical assistance of the World Bank, conducted a study aiming to analyse the current legal, regulatory and administrative status of the development and rehabilitation of hydropower plants in Lebanon, to identify potential barriers and delineate further steps towards making hydroelectricity a considerable part of the national energy mix. The study noted that although the hydropower sector has historically played a significant role in the electrification of Lebanon, it can hardly be a driver of the country’s energy

182
World Small HydropoWer development report 2019
sector development and a pillar for electricity generation, since demand for electricity is some 15 times the available hydropower potential. Nevertheless, the hydropower sector can play an important role for the initiation of an electricity market reform since significant experience in this field already exists. The key recommendations of the study for the development of the hydropower sector included:• Emphasis on adopting an overall strategy aiming at up-
grading the significance of hydropower and undertaking initiatives on legal, administrative, policy and financial is-sues;
• The establishment of a Hydroelectricity Development Unit to enhance the capacity for the development, management and monitoring of hydropower projects;
• The establishment of a Hydro Account for the transac-tions related to potential agreements in order to minimize the exposure of the hydropower sector to the liabilities of the overall energy market, reduce financial uncertainties and increase the prospects for a sustainable procedure of awarding future agreements;
• The promulgation of the required legal and regulatory amendments or ministerial decisions in the areas of the Water Code, hydropower agreements, establishment of Hydro Account, and Public Private Partnership/Indepen-dent Power Producers (PPP/IPP), in order to introduce a modernized tendering procedure, a sustainable remuner-ation/financing mechanism and the establishment of a proper regime for attracting investments;
• The enhancement of private sector participation both at the technical (i.e. engineering and environmental studies) as well as at the investment and financing level, and con-sideration and promotion of appropriate joint-venture and public-private partnership schemes, so long as fair compe-tition is not distorted;
• The implementation of an Action Plan aiming to more than double the total capacity of hydropower plants, for example from approximately 300 MW, as of the time of writing of this report, to more than 600 MW in 2026.9
Renewable energy policy
One major contributor to the renewable energy mix in the country is hydropower, with Lebanon enjoying relatively better access to water than its neighbouring countries. Lebanon also has a significant wind power potential, especially in the north. A national wind atlas has been produced providing only indicative estimates as well as aggregating the total potential wind power in the country. Furthermore, there are abundant solar resources with an average annual insolation of 1,800-2,000 kWh/m2.18
At the United Nations Framework Convention on Climate Change (UNFCCC) COP15 meeting in Copenhagen, the Lebanese Government made a pledge to reach a share of 12 per cent of renewable energy in the country’s energy mix.18 This political commitment was a major milestone of the Policy Paper for the Electricity Sector. Adopted as the national strategy for the electricity sector, the policy paper clarified the national target as being 12 per cent of total electricity and
thermal supply by 2020. In November 2016, the Lebanese Center for Energy Conservation launched the National Renewable Energy Action Plan (NREAP-2016-2020). To reach the overall target of 12 per cent, the NREAP set the following targets for renewable energy sources in the total energy demand in 2020 – 2.1 per cent for wind power, 4.2 per cent for solar power (including solar photovoltaics (PV), concentrated solar power (CSP) and solar water heaters), 3.2 per cent from hydropower and 2.5 per cent from biomass.7
In 2016, the Government announced the Second National Energy Efficiency Action Plan (NEEAP 2016-2020), which was considered as a strategic document for paving the way for the overall national objective of 12 per cent of renewable energy by 2020. The NEEAP 2016-2020 comes as a continuation of the NEEAP 2011-2015 and covers 14 independent but correlated activities in the energy efficiency and renewable energy sectors. The following progress towards the set targets was recorded during the period 2011-2015:• Banning the import of incandescent lamps to Lebanon –
45 per cent completed;• Adoption of Energy Conservation Law and institutional-
ization of LCEC as the energy agency – 40 per cent com-pleted;
• Promotion of decentralized power generation by PV and wind applications – 30 per cent completed;
• Solar water heaters for buildings and institutions – 53 per cent completed;
• Design and implementation of a National Strategy for Ef-ficient and Economic Public Street Lighting – 60 per cent completed;
• Electricity generation from wind power – 23 per cent completed;
• Electricity generation from solar energy – 42 per cent completed;
• Hydropower for electricity generation – 34 per cent com-pleted;
• Geothermal, waste to energy, and other technologies – 30 per cent completed;
• Building code for Lebanon – 0 per cent completed;• Financing mechanisms and incentives – 80 per cent com-
pleted;• Awareness and capacity building – 69 per cent completed;• Paving the way for energy audit and ESCO business – 20
per cent completed;• Promotion of energy efficient equipment – 8 per cent
completed.3
Barriers to small hydropower developmentThe development of hydropower in Lebanon is hindered by a number of factors, as outlined below. • Most of the existing hydropower concessions of Bared,
Kadisha, Nahr Ibrahim and Litani are close to expiration (by 2030) and are selling the electrical energy produced to EDL at low tariffs.
• The current legal framework gives the exclusive rights on the water resources to the General Directorate

183
3.5. WES
TERN
AS
iA
of Hydraulic and Electric Resources at MoEW, while electricity production is given to EDL.
• There are multiple stakeholders involved in the hydropower sector, such as the MOA for the storage basins and irrigation channels and CDR for funded projects, which makes decision making complex and administrative requirements heavy.
• The promulgation of the Water Code is necessary for the creation of a legal framework for public-private partnerships (PPPs).
• The geology of Lebanon is such that in many cases high costs of dam construction and limited water resources make the development of hydropower facilities unfeasible.
• Introducing a hydropower component to a dam, irrigation channel or other facility is difficult and sometimes not fea-sible at all if not done at the design stage.
• Water is becoming increasingly scarce, whereas demand for potable water and irrigation are increasing.7
References
1. World Bank (2016). Lebanon. Available from https://data.worldbank.org/country/lebanon
2. United Nations Food and Agriculture Organization (2008). Lebanon. Available from www.fao.org.
3. Lebanese Center for Energy Conservation (LCEC) (2016). The Second National Energy Efficiency Action Plan for the Republic of Lebanon. NEEAP-2016-2020. Available from http://climatechange.moe.gov.lb/viewfile.aspx?id=229
4. Lebanese Center for Energy Conservation (LCEC) (2018). First Energy Indicator Report of the Republic of Lebanon. Available from http://www.lcec.org.lb/en/LCEC/DownloadCenter/Others
5. Bassil, G. (2010). Policy paper for the Electricity Sector. Ministry of Energy and Water, Lebanon. Available from http://climatechange.moe.gov.lb/viewfile.aspx?id=121
6. United Nations Development Programme (UNDP) (2017). The Impact of the Syrian Crisis on the Lebanese Power Sector and Priority Recommendations. Available from http://www.lb.undp.org/content/lebanon/en/home/library/environment_energy/The-Impact-of-the-Syrian-Crisis-on-the-Lebanese-Power-Sector-and-Priority-Recommendations.html
7. Lebanese Center for Energy Conservation (LCEC) (2016). The National Renewable Energy Action Plan for the Republic of Lebanon 2016-2020. Available from http://lcec.org.lb/Content/uploads/LCECOther/161214021429307~NREAP_DEC14.pdf
8. Ministry of Energy and Water (MoEW) (2018). Call for Expression of Interest (EOI) to Participate in Proposal Submissions to Build and Operate Hydroelectric Plants in Lebanon. Available from http://www.energyandwater.gov.lb/mediafiles/articles/doc-100428-20180313013331.pdf
9. Osseiran, K. (2017). “Assessment of the Legal and Administrative Constraints to the Development of the National Hydropower Market for Lebanon”. Presentation at the International Beirut Energy Forum 2017 for Sustainable Development, September 18-20 2017. Available from http://beirutenergyforum.com/files/Final_AGENDA_IBEF_Online
10. Japan International Cooperation Agency (JICA) (2003). Annual Report 2003. Available from https://www.jica.go.jp/english/publications/reports/annual/2003/index.html
11. World Bank (2008). Republic of Lebanon Electricity Sector Public Expenditure Review. Available from http://siteresources.worldbank.org/INTMNAREGTOPENERGY/Resources/LebanonElectricityPER.pdf
12. SOGREAH (2012). Schema Directeur Hydroelectrique du Liban. June, 2012, Lebanon
13. Government of Lebanon and the United Nations (2017). Leba-non Crisis Response Plan (LCRP. Available from http://www.3rp-syriacrisis.org/wp-content/uploads/2017/01/Lebanon-Crisis-Re-sponse-Plan-2017-2020.pdf
14. International Energy Agency (IEA) (2015). Lebanon: Electricity and Heat for 2015. Available from https://www.iea.org/statistics/statisticssearch/report/?year=2015&country=Lebanon&pro-duct=ElectricityandHeat
15. http://www.edl.gov.lb/?=&lang=en16. Xialei, C., Singh, P. R., Xianlai, W., and Kremere, E.,
eds. (2016). World Small Hydropower Development Report 2016. United Nations Industrial Development Organization; International Center on Small Hydro Power. Available from www.smallhydroworld.org.
17. LIU, H., Masera, D. and Esser, L., eds. (2013). World Small Hydropower Development Report 2013, United Nations Industrial Development Organization; International Center on Small Hydro Power. Available from www.smallhydroworld.org
18. Ministry of Environment (2016). Lebanon’s Third National Communication to the UNFCCC. Available from http://climatechange.moe.gov.lb/viewfile.aspx?id=239
19. Ministry of Energy and Water (MoEW) (2018). Internal data.

184
Saudi Arabia Sameer Sadoon algburi, al-Kitab University College; and International Center on Small Hydro power (ICSHp)*
Key factsPopulation 32,938,210 1
Area 2,149,690 km2
Climate Saudi Arabia has a harsh, dry desert climate with great temperature extremes.2,3 The temperature distribution across the country is controlled mainly by altitude and, to a lesser extent, proximity to the sea. With the exception of the mountains, typical daytime temperatures from May to September are between 38 °C and 43 °C (several degrees higher on some days) in comparison to 30 -32 °C at 2,100 metres above sea level at Khamis Mushait. However, there is usually a sharp drop of temperature at night. The annual mean temperatures range from 30°C to 31°C at low lying Dhahran, Makkah and Jizan to 25 °C at the more elevated Riyadh, 22 °C at Tabuk (800 metres) in the north-west, and 20 °C at Khamis Mushait (2,100 metres) in the south-west.4,5,6
Topography The Kingdom of Saudi Arabia represents about 80 per cent of the territory of the Arabian Peninsula. It has a 2,410 km long sea coast, of which 1,760 km stretches along the Red Sea and 650 km represents the eastern coast of the Arabian Gulf. Forest lands in Saudi Arabia cover 2.7 million hectares and rangelands extend over 171 million hectares. The country is mostly a sandy desert, with the lowest point in the Arabian Gulf at 0 metres and the highest point at Jabal Sawda at 3,133 metres.7
Rain pattern Spring and winter have the highest rainfall.8 However, rainfall is unreliable and annual average totals are typically around 100 mm or, especially inland, less. For example, at Tabuk, inland in the north-west, average annual rainfall sits at 35 mm. The wettest area is the far south-west region where Saudi Arabia’s highest mountains sit. Most rainfall occurs in the spring and summer convection, raising annual totals to 199 mm at Khamis Mushait (about 2,100 metres above sea level) and 141 mm at Jizan on the adjacent coastline. In the northern half of the country, rain falls mainly during November to April due to weak weather systems moving eastwards from the Mediterranean or North Africa.5,6,9
Hydrology Saudi Arabia is a desert country with no permanent rivers or lakes and very little rainfall.
Electricity sector overview
In 2017, electricity generation was 204.6 (TWh) with an installed capacity of 79.07 GW; 100 per cent is generated by using fossil fuels (Figure 1).14, 1
Figure 1. Annual electricity generation by source in Saudi Arabia (GWh)
Steam
Combined
Gas
Diesel
95,367
54,959
54,022
249
Source: SEC14
Saudi Arabia is divided into five geographical regions – Eastern, Central, Western, Southern, and Northern. In each of the Eastern, Central, and Western regions, there is an interconnected grid that feeds the major load centres of
* WSHPDR 2016 updated by ICSHP
the region. In these three geographical regions, the isolated systems represent only a small percentage of the total load. In the Southern Region, there are four autonomous systems that are not presently interconnected with each other. There is a plan to link these four autonomous systems resulting in a grid for the Southern region’s major load centres. In the Northern region, there are a number of isolated systems.
Driven by population growth, a rapidly expanding industrial sector led by the development of petrochemical cities, high demand for air conditioning during the summer months and low electricity tariffs, electricity use in Saudi Arabia has risen by about 7-8 per cent annually over the last decade, with summer peak demand increasing by 93 per cent between 2004 and 2013 (from 28 to 54 GW). Between 2013 and 2020, Saudi electricity demand is expected to increase by over 6 per cent annually. This future electricity demand growth will require an increase in power generation capacity to 120 GW by 2032. Demand from the residential sector particularly remains strong, with the sector consuming 50 per cent of the country’s total electricity production, the remaining being split among industry, commercial sector and government agencies (18 per cent, 11 per cent and 12 per cent respectively). Climate is a
3.5.8
World Small HydropoWEr dEvElopmEnt
rEport 2019
185
3.5. WES
TERN
AS
iA
major factor in electricity consumption as 70 per cent of the electricity sold is attributed to air conditioning. This adds to the seasonality of demand, with summer peak demand nearly twice the winter average.11
In addition, integrating the electricity grids of the Gulf Cooperation Council (GCC) countries could provide the region with an additional potential for cross-border and intercontinental energy exports during off-peak season. Saudi Arabia and the neighbouring countries could benefit from the connection of their northern Gulf grid connection (linking Saudi Arabia, Kuwait and Qatar) with the Turkish and European grids to take advantage of the very large spare capacity the Saudi system has in the winter months. Saudi Arabia plans to set up a grid connection with Egypt to take advantage of differences in each national system’s daily demand peaks. The connection could operate at a level as high as 3 GW. An even more ambitious plan under consideration is to share power on a seasonal basis. Such a system could supply as much as 10 GW to help meet the European winter peak demand, while sending back power in the summer to reduce peak demand in the Gulf.11
The Eastern Operating Area (EOA) is the largest producer of electricity in the country. EOA is connected to the Central Operating Area (COA) by a 230 kV double circuit and two double circuit 380 kV lines.
Due to the steady growth of the national economy in the country, the Saudi Electricity Company aims to meet growing electricity demand by reaching the following by the end of 2021:14
• New generation capacities of about 5,612 MW will be added to the company’s stations.
• Within the private sector participation programme to increase generation capacity to meet future loads, about 11,895 MW capacity will be added.
• Transmission lines with a length of 13,151 km-circular and 166 transmission stations will be added.
• Electricity services will be delivered to about 1.8 million new customers by the end of 2021, bringing the total number of customers to 10.8 million.
• Distribution networks will be strengthened by adding 132,158 km of distribution lines.
Small hydropower sector overview
Water scarcity in Saudi Arabia has triggered the installation of massive seawater desalination facilities, making the country the world’s largest producer of desalinated water. Due to the county’s harsh dry climate, rainfall is sparse, with an annual average of about 100 mm per year compared to 1,123 mm annual average global precipitation. There is no installed hydropower capacity in the country.
In spite of the low rainfall, dams have been constructed to make use of the little rainfall to recharge subterranean water and control flooding. There are more than 200 dams in the country, with a cumulative reservoir capacity of 774
million cubic metres. The King Fahd Dam is the largest in the country and the second largest in the Middle East with a storage capacity of 325 million m3, a surface area of 18 km2 and 103 metres head. It has a theoretical potential energy of about 328,055 GJ or 91.2 MWh. However, the effectiveness of dams in Saudi Arabia in containing rainfall water is greatly undermined by the excessive evaporation and sedimentation.11,12
Thus, the potential from Wadi Baish Dam and King Fahd Dam comprises between 9 MW and 10 MW each, Wadi Hali Dam between 8 MW and 9 MW, Wadi Rabigh Dam and Al-Lith Dam between7 MW and 8 MW each, and Al-Madeeq Dam between 5 MW and 6 MW. Hence, the total estimated potential that could be installed at all six dams is between 45 MW and 51 MW. Assuming 50 per cent operation at peak installation, these plants would generate electricity at an average of 210 GWh per year. This is at least 15 times more than the average electricity generation of King Talal Dam in Jordan. In addition to the six dams mentioned above, there were also 51 other smaller dams with the estimated total power potential of 82 MW. Assuming 50 per cent operation at peak installation, the plants would generate electricity at an average of 360 GWh per year. Therefore, the total SHP potential of the country would be about 130 MW (570 GWh).16
Renewable energy policy
Saudi Arabia has the world’s largest proven oil reserves, the world’s fourth largest proven gas reserves, and abundant wind and solar renewable energy resources, and is the world’s 20th largest producer and consumer of electricity. Saudi Arabia makes negligible use of its renewable energy resources and almost all its electricity is produced from the combustion of fossil fuels.
Saudi Arabia has vast renewable energy resources, mainly in the form of solar energy. Unlike other countries exhibiting high population density, the country’s vast desert can host large solar installations and huge deposits of clear sand that can be used to manufacture silicon photovoltaic (PV) cells.
The country has set a goal of producing almost half of its power from renewable energy sources by 2020 in order to meet the domestic power needs, free up oil for export and drive natural gas consumption towards sectors with higher added value such as petrochemicals. In 2012, Saudi Arabia launched an ambitious plan, costing US$ 109 billion, to install 41 GW of solar energy (25 GW CSP and 16 GW PV), 9 GW of wind, 3 MW of waste-to-energy and 1 MW of geothermal by 2032, corresponding to 30 per cent of electricity generation. The alternative energy economic sector is expected to bring important returns, in particular in terms of employment. In addition to the diversification of the domestic energy mix, renewable energy will contribute to the reduction of emissions growth (NOx, SOx and CO2), effluents and water usage, and will provide an alternative means of serving remote areas in a more economic and clean manner.

186
World Small HydropoWer development report 2019
Barriers to small hydropower developmentSaudi Arabia is the largest country in the world that has no natural rivers running into the sea. Water bodies in the country constitute 0 per cent of its area, with total renewable water resources estimated at 2.4 km and nearly depleted underground water resources.3,13
References
1. World Bank (2017). Population, total. Available from http://data.worldbank.org.
2. United Nations Food and Agriculture Organization (2008). Saudi Arabia. Available from www.fao.org.
3. Darfaoui, E. M. and Al Assiri, A. (2011). Response to Climate Change in the Kingdom of Saudi Arabia. Report prepared for United Nations Food and Agriculture Organization, 2011.
4. World Atlas (n.d.). Saudi Arabia. Available from http://www.worldatlas.com/webimage/countrys /asia/saudiarabia/saland.htm.
5. Gosling, S. N. et al. (2011). Climate: Observations, projections and impacts, Saudi Arabia. Department of Energy and Climate Change, UK. Available from www.metoffice.gov.uk
6. LIU, H., Masera, D. and Esser, L., eds. (2013). World Small Hydropower Development Report 2013. United Nations Industrial Development Organization; International Center for Small Hydropower. Available from www.smallhydroworld.org.
7. Climate Zone (n.d.). Saudi Arabia. Available from http://www.climate-zone.com/climate/saudi-arabia/.
8. Hasanean, H. and Almazroui, M. (2015). Rainfall: Features and Variations over Saudi Arabia, A Review. Climate 2015, Vol. 3, Issue 3, pp. 578-626.
9. Subiani, A. M. (2004). Geostatistical study of annual and seasonal mean rainfall patterns in southwest Saudi Arabia. Hydrological Sciences–Journal–des Sciences Hydrologiques, Vol. 49, Issue 5 (October).
10. Center for Engineering Research (2006). Updated Generation Planning for the Saudi Electricity Sector. Prepared for Electricity & Cogeneration Regulatory Authority (ECRA), Riyadh, Saudi Arabia.
11. Nachet, S. and Aoun, M. C. (2015). The Saudi electricity sector: pressing issues and challenges. Institute Français des Relations Internationals, Energy Center, Paris, 2015.
12. Alyousef, Y. and Abu-ebid, M. (2012). Energy Efficiency Initiatives for Saudi Arabia on Supply and Demand Sides, Energy Efficiency - A Bridge to Low Carbon Economy. Dr. ZoranMorvaj (Ed.). InTech. Available from http://www.intechopen.com/books/energy-efficiency-a-bridge-to-low-carboneconomy/energy-efficiency-initiatives-for-saudi-arabia-on-supply-and-demand-sides.
13. Aljarboua, Z. (2009). The National Energy Strategy for Saudi Arabia. World Academy of Science, Engineering and Technology, Vol. 3.
14. Saudi Electricity Company (2018). Annual report 2017. Available from https://www.se.com.sa/en-us/Lists/AnnualReports/Attachments/11/AnnualReport2017En.pdf
15. Xialei, C., Singh, P. R., Xianlai, W., and Kremere, E., eds. (2016). World Small Hydropower Development Report 2016. United Nations Industrial Development Organization; International Center on Small Hydro Power. Available from www.smallhydroworld.org.
16. Ramzy R. Obaid (2015). Seasonal-Water Dams: A Great Potential for Hydropower Generation in Saudi Arabia. Int. J. of Sustainable Water and Environmental Systems Volume 7, No. 1 (2015) 1-7. Available from: http://iasks.org/wp-content/uploads/pdf/070101.pdf

187
3.5. WES
TERN
AS
iA
Syrian Arab Republic Bilal abdullah nasir, Hawijah technical Institute; Haider Khalil Essa, al-Kitab University College; International Center Small Hydropower (ICSHp)
Key factsPopulation 18,269,8701
Area 183,630 km2
Climate The climate in the Syrian Arab Republic is semi-continental, apart from the coastal areas. The coun-try experiences hot, dry and sunny summers (June to August) and mild, rainy winters (December to February) along the coast, with some cold weather and periodic snow or sleet in Damascus.3 West of the Jabal An Nusayreyah, there is a Mediterranean-influenced climate, characterized by long, hot and mostly dry summers and mild, wet winters. At Aleppo, in the north-west, the average August temperature is approximately 30 °C and the average January temperature is 4 °C. At Tudmur, in the central region and at the edge of the Syrian Desert, the corresponding temperatures are slightly hig-her – 31 °C in summer and 7 °C in winter. The differences between day and night temperatures can be quite significant, especially in the dryer inland areas, where the nights can be surprisingly cool.4,15
Topography The Syrian Arab Republic is located in the western part of Asia, on the eastern coast of the Mediter-ranean Sea. More than 90 per cent of its land is located approximately 400 metres above sea level. It consists of three morphological units. The coastal area is a narrow stretch which runs from north to south along the Mediterranean coast. The mountainous area consists of two coastal mountain ranges that stretch from north to south, with the highest peak being Haramoun Mountain at 2,800 metres. The flat area, comprised of a group of internal flats – theAl Omok, Al Rouj and Al Ghab flats, form most of the Syrian Arab Republic (Al Jazeera, Damascus, Homs and Hama, Aleppo, and Horan).5,15
Rain pattern In the Syrian Arab Republic it mainly rains during winter, with average rainfall varying between 1,600 mm in the coastal and mountainous areas, 300 mm in the internal and Al Jazeera areas, and 100 mm in Al Badia (the desert) and in the eastern area.15
Hydrology There are 16 main rivers and tributaries in the country, mainly located in the northern part of coun-try, with the Euphrates being the largest.15
Electricity sector overview
According to United Nations energy statistics database, the Syrian Arab Republic produced 17,881 GWh of electricity at the end of 2015 – 17,468 GWh from fossil fuels and thermal plants, and only 413 GWh from hydropower sources.6 Due to the lengthy war and instability, the country’s electricity production decreased significantly from approximately 50,000 GWh in 2011 to under 20,000 GWh in 2017. Official news mentioned that the country generated more electricity in the past few months, after the army regained control of the natural gas fields in 2017, which were initially captured by militants.7
The Euphrates Dam was bombed on March 2017, which aggravated the energy crisis in the country. Also known as the Tabqa Dam, the Euphrates Dam can generate 630 MW per day, but is out of service at present.8 The Figure below offers information on electricity generation by source.
According to the World Energy Council, the country has 1.51 GW of installed hydropower capacity and 1 MW of wind power. However, there is currently no updated data with regards to the generation of electricity from wind power in
the Syrian Arab Republic.10 At the end of 2015, the total net installed capacity of electric power plants was 9,122 MW.11 Figure 2 offers more information on 2015 installed electricity capacity by source.
Figure 1. Annual electricity generation by source in the Syrian Arab Republic (GWh)
17,468
413
Thermal power
Hydropower
Source: UN6
The two main operators in the Syrian electricity sector are the Public Establishment of Electricity for Generation and Transmission (PEEGT) and the Public Establishment for the Distribution and Exploitation of Electrical Energy (PEDEEE), under the supervision of Ministry of Electricity. Peaks demand occurs in the winter when electricity is widely used for heating, and to a lesser degree in the summer, when it is
3.5.9
World Small HydropoWEr dEvElopmEnt
rEport 2019

188
World Small HydropoWer development report 2019
needed for air conditioning. Load shedding is still common and standby generators are widely used.15
Figure 2. Installed electrical capacity by source in the Syrian Arab Republic (MW)
7,550
1,572
Thermal power
Hydropower
Source: UN11
Note: The 2015 data still includes the Euphrates Dam, which accounts for of 630 MW installed capacity.
Low electricity prices have contributed to rapid growth in electricity demand and to some extent to inefficient electricity use. Currently a block tariff system is being used, where price depends on the amount of electricity used. As of 2013 the Syrian Arab Republic had one of the cheapest electricity prices in the region, ranging from 0.003 US$/kWh to 0.036 US$/kWh.12,15 There are no updates with regards to electricity tariffs in the country, as the infrastructure and institutions are all affected by the existing military issues.
Because of the long-lasting civil war, the country’s electricity access has been considerably affected. In Aleppo province 97 per cent of the electricity has been cut off, while in Raqqa 96 per cent of households do not have access to electricity.9
Small hydropower sector overview
The definition of small hydropower (SHP) in the Syrian Arab Republic is up to 10 MW. Installed capacity of SHP remains 20.84 MW, while data on the potential capacity is still not available (Figure 3).
Figure 3. Small hydropower capacities 2013/2016/2019 in Syrian Arab Republic (MW)
0 5 10 15 20 25
PotentialCapacity
Installed Capacity
20.84 20.84N/A
N/AN/AN/A
WSHPDR 2019WSHPDR 2016WSHPDR 2013
Source: WSHPDR 2013,14 WSHPDR 2016,15 Almahmod and Ahmed5
Note: The comparison is between data from WSHPDR 2013, WSHPDR 2016 and WSHPDR 2019.
There are four SHP plants with an overall installed capacity of 20.84 MW. There is some potential for the further development of SHP, though further research is yet to be conducted.15 In 2017 only 413 GWh was produced, due to persisting political and economic instability.6
Table 1. Small hydropower installed capacity in the Syrian Arab Republic
Station River Installed Capacity
Commissioning year
Takkia Barada 1 MW 1906
Alasi Alasi 2.8 MW 1932
Barada Valley Barada 8 MW 1957
Alrastan Alasi 9 MW 1962
Total 20.84 MW Source: Muhamed Almahmod and Samer Ahmed5
Note: Data from 2011.
Renewable energy policy
Although the Syrian Arab Republic relies on locally produced traditional energy resources like oil and gas, other renewable resources exist such as wind and solar energy. There are hydropower resources available on the Euphrates River with an annual production capacity of 1.4-2.1 TW, in addition to other stations and dams available. Estimates of the main biomass resources for the year 1999 show that about 577,365 tons of dry animal dung, 360,000 tons of dry chicken droppings, 230,000 tons of dry human waste and 34,000 tons of dry kitchen residues are available every year. Annually, 357 million m3 of biogas could be produced in the Syrian Arab Republic.15
The Government has developed an updated Renewable Energy & Energy Efficiency Master Plan in collaboration with German Technical Cooperation Agency (GTZ). The plan runs until 2030 and comprises renewable expansion targets for each five years from 2010. The plan has been drafted and needs to be approved by the responsible government entities.15
The Syrian Arab Republic adopted progressive measures in 2011 to attract interest in renewable energy. It has opened its market for private developers, adopted feed-in tariffs (FITs) and a net metering policy, authorized the business-to-business sale of renewable electricity, and announced tenders for public competitive bidding to develop the first large-scale wind projects. However, due to the ongoing conflict, all activities have been paused and the Syrian Government has not had the chance to implement the newly introduced policies.13,15
Barriers to small hydropower developmentThe assessment of the hydropower resources shows there are several barriers to small hydropower. Some of the most im-portant are outlined below.• Syrian hydropower resources of all sizes are limited by the
low precipitation and river flows. Most of the available hy-dropower potential has already been utilized.

189
3.5. WES
TERN
AS
iA
• The current ongoing conflict has put almost all develop-ment plans on hold.
• Further studies have to be carried out to analyse the scope for small and micro-hydropower. These can be stand-alone power plants or linked together to form a mini-grid in the region, assuming that the period of water availability justifies the investment needed.15,16,17,18,19
References
1. World Bank (2018). Population, total: Syrian Arab Republic. World Population Prospects: 2017 Revision Available from https://data.worldbank.org/indicator/SP.POP.TOTL
2. Masri, A. (2006). Country Pasture/Forage Resource Profiles. Syrian Arab Republic. United Nations Food and Agriculture Organization. Available from http://www.fao.org/ag/agp/agpc/doc/counprof/PDF%20files/Syria.pdf.
3. Climate Zone (n.d.). Syria. Available from http://www.climate-zone.com/climate/syria/.
4. WeatherOnline (n.d.). Syria. Available from http://www.weatheronline.co.uk /reports/climate/Syria.htm.
5. Almahmod, M. and Ahmed, S. (2011). Country Report of Syria in Small Hydro Power. Source not available online. Internal data.
6. United Nations (2016). Electricity, total: Syrian Arab Republic. Energy Statistics Database. Available from http://data.un.org/Data.aspx?d=EDATA&f=cmID%3aEL.
7. Reuters (2017). Syria producing more energy after army recaptures gas fields- ministry. World News. Available from https://www.reuters.com/article/us-mideast-crisis-syria-electricity/syria-producing-more-energy-after-army-recaptures-gas-fields-ministry-idUSKCN1C12JY
8. South Front Analysis Intelligence (2017). Syrian Energy Crisis: What you need to know. Available from https://southfront.org/syrian-energy-crisis-what-you-need-to-know/
9. Khabieh, B. (2017). Plunge into darkness: 83% of Syrian electricity wiped out. Reuters. Available from https://www.rt.com/news/240297-syria-electricity-out-darkness/
10. World Energy Council (2016). Energy ReSource: Middle East and North Africa: Syria. World Energy Resources 2016. Available from https://www.worldenergy.org/data/resources/country/syria/hydropower/
11. United Nations (2016). Electricity, net installed capacity of electric power plants. Energy Statistics Database. Available from http://data.un.org/Data.aspx?q=electricity&d=EDATA&f=cmID%3aEC
12. The Regional Center for Renewable Energy and Energy Efficiency (RCREEE) (2013). Electricity Prices in RECREEE Member States. Available from http://www.rcreee.org/sites/default/files/rs_latest_-electricity_-prices_schemes_in_rcreee_-ms_6-2013_en.pdf
13. Samborsky, B., Myrsalieva, N. and Mahmoud, M. (2013). Arab Future Energy Index™ (AFEX).
Renewable Energy, Regional Center for Renewable Energy and Energy Efficiency (RCREEE). Available from http://www.rcreee.org/sites/default/files/reportsstudies_afex_re_report_2012_en.pdf
14. LIU, H., Masera, D. and Esser, L., eds. (2013). World Small Hydropower Development Report 2013. United Nations Industrial Development Organization; International Center on
Small Hydro Power. Available from www.smallhydroworld.org15. Xialei, C., Singh, P. R., Xianlai, W., and Kremere, E.,
eds. (2016). World Small Hydropower Development Report 2016. United Nations Industrial Development Organization; International Center on Small Hydro Power. Available from www.smallhydroworld.org.
16. Fadi-Aljawabra (2011). Large scale RE projects in Syria –An analysis of the institutional and legal framework in view of the Egyptian experience. Master Thesis, Cairo University.
17. Bilal Abdullah Nasir (2014). Design Considerations of Micro-Hydro-Electric Power Plant. The International Conference on Technologies and Materials for Renewable Energy, Environment and Sustainability, TMREES14.
18. Bilal Abdullah Nasir (2013). Design of Micro-Hydro-Electric power Station. IJEAT, Vol-2, Issue-2.
19. Bilal Abdullah Nasir (2018). Mat-lab Simulation Procedure for Design of Micro -Hydro- Electric Power Plant. IOSR,Journal of Electrical and Electronics Engineering. Vol.13, Issue.4, pp36-50.

190
Turkey alaeddin Bobat, Kocaeli University; Öztürk Selvitop, ministry of Energy and natural resources of the republic of turkey
Key factsPopulation 80,810,5251
Area 783,043 km2 1
Climate Turkey has a semi-arid climate, characterized by some extremities in temperature. Coastal areas have a Mediterranean climate with hot dry summers between June and August and temperatures reaching 35 °C. The higher interior Anatolian Plateau is characterised by winter months between December and February that can be very cold, with temperatures reaching -7 °C. In the period between 2008 and 2017, the mean temperature was 13.9 °C.2
Topography The central Anatolian Plateau dominates the territory, with the exception of narrow coastal plains on the Aegean and Black Seas. Turkey’s highest point is Mount Ağrı at 5,166 metres. Additionally, there are over one hundred peaks with altitudes of over 3,000 metres. Turkey lies within a seismically active area.3
Rain pattern Mean annual precipitation is 643 mm, ranging from 250 mm in Central Anatolia to over 2,500 mm in the coastal area on the north-eastern Black Sea. Approximately 70 per cent of the total precipitation occurs during between October and April.4
Hydrology The Euphrates and the Tigris have their sources in the high mountains of north-eastern Anatolia and flow through Turkey before entering the Syrian Arab Republic. These two rivers account for approxi-mately one third of Turkey’s water potential. Many rivers rise and discharge into seas within Turkey’s borders. The rivers discharging into the Black Sea are the Sakarya, Filyos, Kızılırmak, Yeşilırmak, and Çoruh. Meanwhile, the Asi, Seyhan, Ceyhan, Tarsus (Berdan), and Dalaman discharge into the Mediterranean Sea, the Büyük Menderes, Küçük Menderes, Gediz, and Meriç into the Aegean and the Susurluk/Simav, Biga, and Gönen into the Sea of Marmara.
Electricity sector overview
As of 30 April 2018, total installed capacity was 86,931 MW, compared to 69,516 MW in 0214. The installed capacity increased thanks to the installation of new natural gas, solar power, hydropower and wind power plants. Within the energy mix, hydropower has become the primary source of energy, accounting for 32 per cent of the installed capacity. As for the other energy sources, 30 per cent can be attributed to gas fired power plants, 21 per cent to coal, almost 7.7 per cent to wind, 5 per cent to solar power, 2.2 per cent to other renewable sources (geothermal and waste heat) and 1.2 per cent to other fuels (oil, diesel, naphtha) (Figure 1).5
As for electricity generation, the latest data available refer to 2017 when the total annual electricity generation was 295.5 TWh. Within power generation, natural gas had the dominant role contributing approximately by 37 per cent, coal by 33 per cent, hydropower by 20 per cent, wind and other renewable sources by 6 per cent and 3 per cent respectively, other sources almost 1 per cent (Figure 2).6 Electricity consumption in 2017 was approximately 292 TWh, of which 2.729 TWh were imported. 6 The electrification rate across the country is 100 per cent. The demand for energy has been growing on average around 5 per cent annually between 2003 and 2016.
Figure 1. Installed electricity capacity by source in Turkey (MW)
27,509
26,509
18,667
6,665
4,628
1,942
1,011
Hydropower
Gas
Coal
Wind power
Solar power
Other RE
Other
Source: TEIAS5
Note: Data as of 30 April 2018.
The share of the installed capacity and electricity generated from privately-owned plants has been rising steadily since 2006 when the private sector owned 39.7 per cent of the sector and the state-owned company Electricity Generation Corporation (EUAS) owned 60.3 per cent, up to 2017 when the private sector occupied a 76.6 per cent of the installed
3.5.10
World Small HydropoWEr dEvElopmEnt
rEport 2019

191
3.5. WES
TERN
AS
iA
capacity, and the state the remaining 23.4 per cent. At the end of 2017, the share of the electricity produced by the private sector reached 83.9 per cent, the remaining 16.1 per cent was produced by EUAS, while in 2009 the generation of electrici-ty of the private sector and EUAS were respectively 54.1 and 45.9 per cent.6
Figure 2. Annual electricity generation by source in Turkey (TWh)
108.8
97.6
58.4
17.9
8.1
2.9
2.0
Gas
Coal
Hydropower
Wind power
Other RE
Solar power
Other
Source: TEIAS6
Note: Data refer to 2017.
As of 30 April 2018, around 77.1 per cent of Turkey’s installed capacity was privately owned. EUAS had a share of 22.9 per cent. Within the private sector, companies represent 60.6 per cent (52,692.2 MW) of the mix, build own and operate (BO) power plants represent 7 per cent (6,101.8 MW), build-operate-transfer (BOT) power plants account for 1.6 per cent (1,368.3 MW), plants whose operation rights have been transferred (ToOR) and unlicensed account for 2.3 (2,028.4 MW) and 5.6 (4,891.8 MW) per cent respectively (Figure 3).5
The process of privatization of a significant number of state-owned plants has been ongoing since 2013, 21 distribution companies have been completely privatised since then.
Figure 3. Share of installed capacity by ownership (%)
IPP 60.6%EUAS 22.9%BO companies 7.0%Unlicensed 5.6%ToOR 2.3%BOT 1.6%
Source: TEIAS5
Note: Data as of April 2018.
The Electricity Market Law No. 6446 (EML) introduced on 30 March 2013 is still the main law applicable to the Turkish electricity market. The EML regulates the obligations of all real persons and legal entities directly involved in the generation, transmission, distribution, wholesale supply, retail supply, import, and export of electricity in the country.7 The implementation and interpretation of new
mechanisms introduced by this legislation are outlined by secondary legislation, among which the most notable piece is still the Electricity Market Licensing Regulation (Licensing Regulation) published in the Official Gazette on 2 November 2013. The Licensing Regulation introduced a new licensing regime, intended to reform and stimulated the market.8
In Turkey, there are two main governmental authorities regulating the electricity market, the Ministry of Energy and Natural Resources (MENR) and the Energy Market Regulatory Authority (EMRA). Turkish Electricity Transmission Corporation (TEIAS) owns and operates the electricity transmission system, while distribution is divided into 21 separate regions. Each region is controlled by private distribution companies each with distribution licences issued by EMRA. Besides private companies, electricity supply is undertaken also by the state-owned Turkish Electricity Trading and Contracting Company (TETAS). EMRA issues each license for all the suppliers.7
Before the introduction of the EML, TEIAS was both system and market operator. As of 2018 however, TEIAS operates solely as the transmission system operator (TSO) while a new company, the Energy Markets Operation Company (EXIST) was established as a market operator. EXIST’s shareholders are represented by 30 per cent each by TEIAS and by Istanbul Exchange Market (BIST) and 40 per cent by the private sector. EXIST is responsible for organising the energy exchange market operations (as a market operator) to operate the spot market and to allow the private sector to make forecasts much more easily in order to plan their investments. By the end of 2018, natural gas should also be traded in EXIST.9
Turkey has been experiencing a rapid growth of demand in all segments of the energy sector for decades. Forecasts indicated that this trend will continue in the forthcoming decades in parallel to the economic and social developments. The main target of the Turkish energy policy has been to provide timely, reliable and sufficient energy with affordable prices in an environmentally sound manner, in order to foster economic growth and social development.10
In the last 17 years, the private sector made sizeable investments trusting Turkey and played a significant role in the development of energy industry. In 2017, Turkey announced National Energy and Mining Strategy in order to clinch the confidence in the industry and update country’s goals. Ensuring energy supply security and predictable market conditions as well as localization are the three pillars of strategy in this matter.10,20
Small hydropower sector overview
Although there is no legal definition in Turkey, hydropower plants with an installed capacity of less than 10 MW (including 10 MW) are widely considered as small hydropower (SHP). As of April 2018 the installed capacity was approximately 2,961.3 MW.11 SHP installed capacity has more than doubled compared to the World Small Hydropower Development

192
World Small HydropoWer development report 2019
Report (WSHPDR) 2016 when it was reported at 1,156.4 MW (Figure 4). The increase has been achieved thanks to the SHP incentives and increased investments in the country.
Figure 4. Small hydropower capacities 2013/2016/2019 (MW) in Turkey
0 1000 2000 3000 4000 5000 6000 7000 8000
PotentialCapacity
Installed Capacity
6,500.0 6,500.0 6,500.0
2,961.3 1,156.4 175.0
WSHPDR 2019WSHPDR 2016WSHPDR 2013
Source: WSHPDR 2013,12 WSHPDR 2016,13 TEIAS6
Note: The comparison is between data from WSHPDR 2013, WSHPDR 2016 and WSHPDR 2019.
According to EMRA’s Progress Report of 2017, there were 66 small hydropower plants under construction with a total capacity of 343 MW, and there were 70 small hydropower plants at pre-licence stage with a total capacity of 300 MW.14
As of 30 April 2018, there were in total 626 hydropower plants of all sizes, according to the latest Government statistics their total installed capacity amounts to 27,509 MW.5 Among these hydropower plants, 300 of them are considered small hydropower plants. Total hydropower potential of Turkey amounts to 55,000 MW and should be reached gradually after the 2023, in 2019 the installed capacity should amount to 30,000 MW and by 2023 it should reach 40,000 MW.10,11
Renewable energy policy
The Ministry of Energy and Natural Resources aims at having 30 per cent of the total electricity mix covered by renewable energy (RE) sources by 2023. Priority of Turkey in the forthcoming period will be reducing the dependency on the imports by realizing domestic and renewable energy potential along with securing the energy supply security. Within the framework of ensuring source diversification, Turkey aims at bringing domestic and renewable sources in the economy to the maximum extent in an environment-friendly manner. 15
Looking at the renewable energy support mechanisms, there has been a trend across the world towards the auction system rather than the feed-in tariffs. Due to this trend, much more affordable prices for the system are being acquired all around the world. These prices are lower than the production costs of the gas and coal plants that are newly built and it is estimated that the prices will progressively go down and decrease to a record low levels with the new technologies.14 In 2017, two auctions were organized separately for the wind and solar energy each with 1 GW capacity by realizing the model of Renewable Energy Resource Zone (YEKA) in Turkey. Thanks to the wide participation from bidders in these auctions the record-low prices have been achieved. The solar energy
auction in Konya-Karapınar was set at 6.99 US$ cent/kWh, while for the wind auction the price was set at 3.48 US$ cent/kWh. Turkey arranged its model in a way that would facilitate the development of new technologies and domestic manufacturing and R&D. The country’s target is to develop 10,000 MW additional capacities in solar and wind energy each by 2026 compared to 2016.16
Moreover, Turkey has a significant potential for the energy efficiency. With the National Energy Efficiency Action Plan approved in 2018, it is expected to achieve savings of US$ 30.2 billion by 2033. Turkey will be investing approximately US$ 11 billion by 2023. This means, energy savings equal to 23 mtoe and 66.6 million tons of emissions reduction, equal to 14 per cent of the primary energy consumption. As a result of these efforts, it will be creating additional employment of 20,000 people by 2023 and remove the obligation to invest in new power generation plants that are worth US$ 4.2 billion.
Since 2010, the strategies followed by MENR for increasing the share of renewable energy within the energy mix include:• Measures taken for the completion of licensed projects
within the projected terms for renewable energy resources of economic value;
• Production planning prepared considering developments within the renewable energy field, in line with advances in technology and the arrangements within current legisla-tion;
• Measures taken for the maximum utilisation of Turkey’s hydropower potential, as is economically feasible, and for the integration of this potential into the national economy through the private sector;
• Increase cooperation with studies conducted for the de-velopment of water resources as economically feasible for electricity generation on the basis of integrated approach-es in view of meeting changing consumption demands;
• The criteria for the economic analysis of hydropower plants will be evaluated according to present day standards;
• Acceleration in the number of studies required for the growth of the electricity transmission system that would allow for the connection of a higher number of intermit-tent energy technologies such as solar and wind energy power plants;
• The protection of geothermal resources during utilisation, including their sustainability in terms of renewal and re-generation;
• Plans to open up areas for geothermal development, where suitable, for electricity production in order to accelerate the private sector participation;
• Emphasis given to technology development studies in the field of renewable energy resources.
Turkey has also joined the United Nations Framework Con-vention on Climate Change and ratified The Kyoto Protocol on 28 May 2009. Additionally, the Government has imple-mented several actions against any negative environmental impact since 2010, 17 including:• The promotion of the usage of renewable energy resources
and the effective use of energy and clean coal technologies;• The reduction of greenhouse gas emissions;

193
3.5. WES
TERN
AS
iA
• The utilization of biomass/biogas potential (in infrastruc-ture facilities for water, waste water and solid waste);
• Increase in the effectiveness of control and supervision for compliance with sustainable mining and sustainable envi-ronmental principles in mining operations;
• Training and public awareness of climate change and envi-ronmentally friendly energy technologies.
As of 2018, there are two main laws in Turkey promoting renewable energy, the Electricity Market Law No. 6446 (together with the related secondary legislation) and the Utilization of Renewable Energy Resources for the Purpose of Generating Electrical Energy Law No. 5346 (the Renewable Energy Law), which is the main promotion law.
Turkey’s Renewable Energy Support (RES) mechanism was established with the enactment of amendments to Law No. 5346. The Renewable Energy Law was enacted in 2005 (and amended in 2011) according to which all renewable energy-based power plants commissioned before December 31, 2020 are eligible to receive feed-in tariffs for the first 10 years of their operation. For small hydropower plants this feed-in tariff is set at 7.3 US$ cent/kWh. In addition, if the mechanical or electro-mechanical equipment of the power plant is being manufactured locally, a premium (maximum 3.5 US$ cent/kWh) will be added to the feed-in tariffs during the first five years of operation.
In order to encourage investments in RE sources within the framework of the EML, and related secondary legislation, electricity generation plants based on renewable energy are supported by the following mechanisms:• Payment of only 10 per cent of the total licensing fee;• Exemption from payment of annual license fees for the
first 8 years of operation;• Priority for system connection;• Exemption from being a balancing mechanism unit;• Exemption from licensing and establishing company
(only for power plants with a maximum 1 MW installed capacity);
• 5th region incentives for renewable based electro-mechanical equipment manufacturers.
Legislation on small hydropower
As of July 2008, environmental impact assessments (EIA) are required for any hydropower projects with an installed capacity of 0.5 MW to 25 MW. Additionally, according to the Renewable Energy Law No. 5346, Article 7, projects that establish an isolated electricity generation plant and grid supported electricity generation plant by utilizing hydraulic resources with a maximum installed capacity of 1,000 kW for meeting solely their own demands, shall not be claimed to pay the amounts of service for the projects, of which final designing, planning, master planning, preliminary surveying and first auditing were prepared by either General Directorate of State Water Works or General Directorate of Renewable Energy.
Barriers to small hydropower developmentOver the past years SHP installed capacity has steadily in-creased, as of 2018 it almost reached the installation of half of its potential. However, SHP still has to face barriers of dif-ferent types:• Legal: Renewable Energy Law No. 5346 applies to small
hydropower or hydropower production facilities having a reservoir area less than 15 km2 making no limitation regarding installed capacity. This guideline encourages the private sector to move towards investment in large hydropower systems for the potentially higher profits;
• Environmental: Turkey is among the countries most affected by climate change or variability. Therefore, SHP investments are adversely affected due to the decrease in surface waters;18
• Social: Additionally, environmental reactions of public opinion against hydropower facilities could affect the investors, due to wrong or inappropriate site selection, exclusion of stakeholders, and unplanned basin management.19
References
1 Turkish Statistical Institute, Official Website, (2018) Avail-able from: http://www.tuik.gov.tr/Start.do;jsessionid=Qfqd-bJrZgZ1jpBBb21nVGhlLLQhr20ty5v36jThVC9MvFv-5j5nV1!-1169576520 (accessed June 26, 2018)
2 Turkish State Meteorological Service Official Website (2018) Available from : https://www.mgm.gov.tr/FILES/resmi-istatistik-ler/parametreAnalizi/Turkiye-Ortalama-Sicaklik.pdf (accessed June 26, 2018)
3 Nations Encyclopedia. Turkey (n.d.) Available from: http://www.nationsencyclopedia.com/Asia-and-Oceania/Turkey-TOPOG-RAPHY.html (accessed June 26, 2018)
4 Turkish State Meteorological Service, Climate of Turkey, (n.d.) Available from: http://www.meteor.gov.tr/2006/english/eng-cli-mateofturkey.aspx
5 Turkish Electricity Transmission Corporation (TEIAS) (2018). Sector Reports. Available from: https://www.teias.gov.tr/sites/default/files/2018-05/kurulu_guc_nisan_2018.pdf (accessed June 26, 2018)
6. Turkish Electricity Transmission Corporation (TEIAS) (2018). Load Dispatch Reports. Available from: http://www.teias.gov.tr/Eng/DispatchReports.aspx
7. Mimovic, T. (2015). An analysis of the Turkish Electricity Market, Master’s Thesis. University of Ljubljana, Faculty of Economics, Slovenia. Available from: http://www.cek.ef.uni-lj.si/magister/mimovic1859-B.pdf (accessed June 26, 2018)
8. Fidan, E. C. (2014). Renewable Energy In Turkey, Flanders In-vestment & Trade. Flanders Investment & Trade. http://www.flandersinvestmentandtrade.com/export/sites/trade/files/mar-ket_Studies /624141229132036/624141229132036_1.pdf (ac-cessed June 26, 2018)
9. EPİAS (2016). EXIST-Energy Exchange Istanbul, electricity Market Report. https://www.epias.com.tr/wp-content/up-loads/2017/05/EPI%CC%87AS_2016_Electricity_Market_Re-port.pdf
194
World Small HydropoWer development report 2019
10. Ministry of Energy and Natural Resources (2015). Strategic Plan 2015-2019. http://www.enerji.gov.tr/File/?path=ROOT%2f1%2f-Documents%2fStrategic%20Plan%2fStrategicPlan2015-2019.pdf
11. General Directorate of State Hydraulic Works (2018) Unpub-lished Data.
12. LIU, H., Masera, D. and Esser, L., eds. (2013). World Small Hy-dropower Development Report 2013, United Nations Industrial Development Organization; International Center on Small Hy-dro Power
13. Xialei, C., Singh, P. R., Xianlai, W., and Kremere, E., eds. (2016). World Small Hydropower Development Report 2016. United Nations Industrial Development Organization; Interna-tional Center on Small Hydro Power. Available from www.small-hydroworld.org.
14. EMRA (2018). Progress Report January 2018. Available from: http://www.epdk.org.tr/Detay/Icerik/3-0-86/elektriklisans-is-lemleri
15. Gozen, M. (2014). Renewable Energy Support Mechanism in Turkey: Financial Analysis and Recommendations to Policymak-ers. International Journal of Energy Economics and Policy, Vol. 4, Issue 2, pp. 274-287.
16. Kaplan, E. (2015). Renewable energy Turkey. Opportunity? Em-bassy of the Kingdom of the Netherlands. https://www.rvo.nl/sites/default/files/2015/10/Renewable%20Energy%20Turkey.pdf
17. MoEU (Ministry of Environment and Urbanization) (2012). Na-tional Climate Change Action Plan 2011-2023, Matbuu Printing House, Ankara. Available from http://webdosya.csb.gov.tr/db/iklim/editordosya/iklim_degisikligi_eylem_plani_EN_2014.pdf
18. Bobat, A., Çakılcı, E. (2018). Drought and environment, Interna-tional Congress of Water and Environment, Proceedings, 354-363, March 22-24, 2018, Bursa, Turkey.
19. Bobat, A. (2016). Environmental management aspects in hydro projects, 9th International Conference on Sustainable Energy and Environmental Protection (SEEP2016), Proceedings, 478-489, 22-25 September 2016, Erciyes University, Turkey.
20. Ministry of Energy (2018). Butce Sunus Kitabi. Avail-able from http://www.enerji.gov.tr/File/?path=-ROOT%2f1%2fDocuments%2fB%C3%BCt%C3%A7e%20Konu%C5%9Fmas%C4%B1%2f2018_Butce_Sunus_Kitabi.pdf

195
AUSTRALIA
NEW ZEALAND
Australia and New Zealandniels nielsen, International Energy agency, Hydropower tCp
Introduction to the region
Australia and New Zealand are part of Oceania, which is located in the Southern Hemisphere. Australia comprises the mainland continent as well as the island of Tasmania and numerous smaller islands in the Indian and Pacific Oceans. Climactic variations range between temperate, sub-tropical and arid desert. New Zealand comprises the main North and South Islands, as well as numerous smaller islands. The climate varies from temperate to cool alpine in the mountainous regions. An overview of the two countries is presented in Table 1.
Both countries have mainly integrated power systems and electricity markets. The primary source of electricity generation for Australia is thermal power (coal) (37 per cent of total installed capacity), with hydropower providing the largest renewable energy component (13 per cent of total installed capacity). However, wind energy and solar power are expanding rapidly, with biomass also providing a significant contribution. In contrast, the primary source of electricity generation in New Zealand is hydropower (58 per cent of total installed capacity), with thermal power providing a smaller contribution. Wind and geothermal power are expanding rapidly, with biomass also providing a significant contribution.
Australia and New Zealand have almost equal shares of the regional installed small hydropower (SHP) capacity (Figure 1). Since the publication of the World Small Hydropower Development Report (WSHPDR) 2016, the installed SHP capacity in the region has decreased by 2 per cent from 335 MW to 327 MW (Figure 3). The decrease is due to the update on New Zealand capacity data.
Figure 1. Share of regional installed capacity of small hydropower by country (%)
Australia 53%New Zealand 47%
Source: WSHPDR 20193
5.1
World Small HydropoWEr dEvElopmEnt
rEport 2019
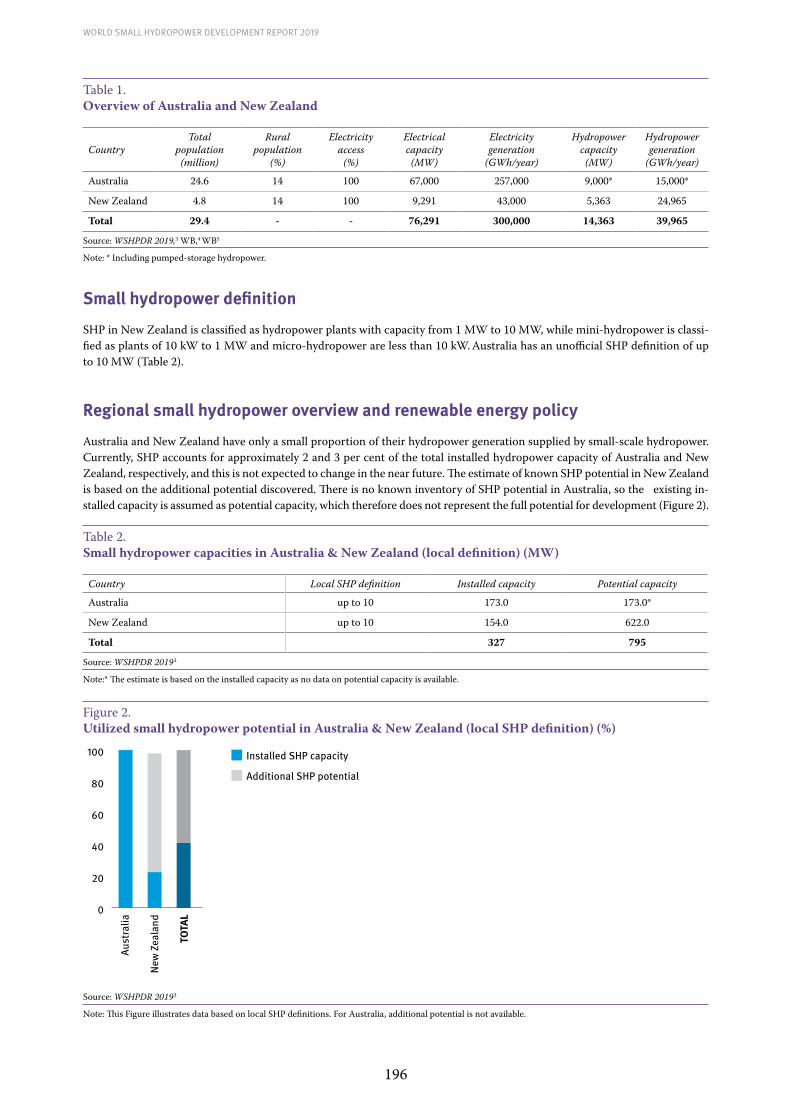
196
World Small HydropoWer development report 2019
Table 1. Overview of Australia and New Zealand
CountryTotal
population (million)
Rural population
(%)
Electricity access
(%)
Electrical capacity
(MW)
Electricity generation
(GWh/year)
Hydropower capacity
(MW)
Hydropower generation
(GWh/year)
Australia 24.6 14 100 67,000 257,000 9,000* 15,000*
New Zealand 4.8 14 100 9,291 43,000 5,363 24,965
Total 29.4 - - 76,291 300,000 14,363 39,965 Source: WSHPDR 2019,3 WB,4 WB5
Note: * Including pumped-storage hydropower.
Small hydropower definition
SHP in New Zealand is classified as hydropower plants with capacity from 1 MW to 10 MW, while mini-hydropower is classi-fied as plants of 10 kW to 1 MW and micro-hydropower are less than 10 kW. Australia has an unofficial SHP definition of up to 10 MW (Table 2).
Regional small hydropower overview and renewable energy policy
Australia and New Zealand have only a small proportion of their hydropower generation supplied by small-scale hydropower. Currently, SHP accounts for approximately 2 and 3 per cent of the total installed hydropower capacity of Australia and New Zealand, respectively, and this is not expected to change in the near future. The estimate of known SHP potential in New Zealand is based on the additional potential discovered. There is no known inventory of SHP potential in Australia, so the existing in-stalled capacity is assumed as potential capacity, which therefore does not represent the full potential for development (Figure 2).
Table 2.Small hydropower capacities in Australia & New Zealand (local definition) (MW)
Country Local SHP definition Installed capacity Potential capacity
Australia up to 10 173.0 173.0*
New Zealand up to 10 154.0 622.0
Total 327 795 Source: WSHPDR 20193
Note:* The estimate is based on the installed capacity as no data on potential capacity is available.
Figure 2. Utilized small hydropower potential in Australia & New Zealand (local SHP definition) (%)
Additional SHP potential
Installed SHP capacity
TOTA
L
New
Zea
land
Aust
ralia
0
20
40
60
80
100
Source: WSHPDR 20193
Note: This Figure illustrates data based on local SHP definitions. For Australia, additional potential is not available.
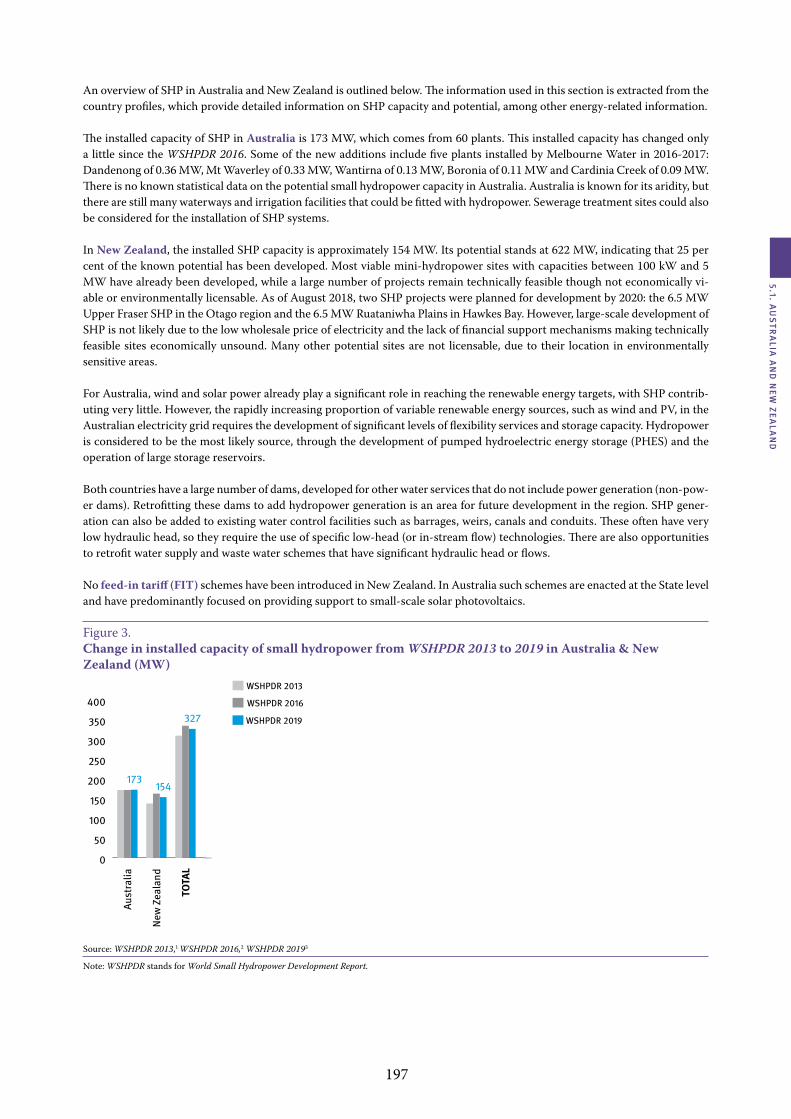
197
5.1. Au
str
AliA
An
d n
ew ZeA
lAn
d
An overview of SHP in Australia and New Zealand is outlined below. The information used in this section is extracted from the country profiles, which provide detailed information on SHP capacity and potential, among other energy-related information.
The installed capacity of SHP in Australia is 173 MW, which comes from 60 plants. This installed capacity has changed only a little since the WSHPDR 2016. Some of the new additions include five plants installed by Melbourne Water in 2016-2017: Dandenong of 0.36 MW, Mt Waverley of 0.33 MW, Wantirna of 0.13 MW, Boronia of 0.11 MW and Cardinia Creek of 0.09 MW. There is no known statistical data on the potential small hydropower capacity in Australia. Australia is known for its aridity, but there are still many waterways and irrigation facilities that could be fitted with hydropower. Sewerage treatment sites could also be considered for the installation of SHP systems.
In New Zealand, the installed SHP capacity is approximately 154 MW. Its potential stands at 622 MW, indicating that 25 per cent of the known potential has been developed. Most viable mini-hydropower sites with capacities between 100 kW and 5 MW have already been developed, while a large number of projects remain technically feasible though not economically vi-able or environmentally licensable. As of August 2018, two SHP projects were planned for development by 2020: the 6.5 MW Upper Fraser SHP in the Otago region and the 6.5 MW Ruataniwha Plains in Hawkes Bay. However, large-scale development of SHP is not likely due to the low wholesale price of electricity and the lack of financial support mechanisms making technically feasible sites economically unsound. Many other potential sites are not licensable, due to their location in environmentally sensitive areas.
For Australia, wind and solar power already play a significant role in reaching the renewable energy targets, with SHP contrib-uting very little. However, the rapidly increasing proportion of variable renewable energy sources, such as wind and PV, in the Australian electricity grid requires the development of significant levels of flexibility services and storage capacity. Hydropower is considered to be the most likely source, through the development of pumped hydroelectric energy storage (PHES) and the operation of large storage reservoirs.
Both countries have a large number of dams, developed for other water services that do not include power generation (non-pow-er dams). Retrofitting these dams to add hydropower generation is an area for future development in the region. SHP gener-ation can also be added to existing water control facilities such as barrages, weirs, canals and conduits. These often have very low hydraulic head, so they require the use of specific low-head (or in-stream flow) technologies. There are also opportunities to retrofit water supply and waste water schemes that have significant hydraulic head or flows.
No feed-in tariff (FIT) schemes have been introduced in New Zealand. In Australia such schemes are enacted at the State level and have predominantly focused on providing support to small-scale solar photovoltaics.
Figure 3. Change in installed capacity of small hydropower from WSHPDR 2013 to 2019 in Australia & New Zealand (MW)
0
50
100
150
200
250
300
350
400
WSHPDR 2019
WSHPDR 2016
WSHPDR 2013
173154
327
TOTA
L
New
Zea
land
Aust
ralia
Source: WSHPDR 2013,1 WSHPDR 2016,2 WSHPDR 20193
Note: WSHPDR stands for World Small Hydropower Development Report.

198
World Small HydropoWer development report 2019
Barriers to small hydropower development
While there are many greenfield sites in Australia and New Zealand that are physically suitable for small-scale hydropower development, many of these are in protected areas or are linked to significant potential environmental issues. These can include water quality, impact on aquatic flora and fauna and social issues as well as competing uses for water. Overall, even if achievable, these may require a long and expensive consenting process.
Another barrier to development is economic, with costs for new generation higher than market prices, even with renewable energy credits. In particular, the river systems in Australia are often characterized by low heads, which lead to high costs of power generation, which cannot compete with wind and solar power. Other challenges are environmental, in particular fish issues and resistance by owners of the original facilities to third-party encroachment.
Barriers for New Zealand generally are similar to Australia but include the lack of subsidies for SHP development. On the other hand, Australia is a generally arid country with limited water availability.
Notwithstanding many barriers to development, there are potential opportunities for an expansion of SHP projects. These include improvements to existing hydropower facilities, adding power to non-power dams and developing new, improved and low-cost technologies and approaches through research and development.6 Some barriers can be overcome as part of a multi-purpose development, such as irrigation or industrial or domestic water supply. Other enablers can include clear and open communications.
References
1. LIU, H., Masera, D. and Esser, L., eds. (2013). World Small Hydropower Development Report 2013. United Nations Industrial Development Organization; International Center on Small Hydro Power. Available from www.smallhydroworld.org.
2. Xialei, C., Singh, P. R., Xianlai, W., and Kremere, E., eds. (2016). World Small Hydropower Development Report 2016. United Nations Industrial Development Organization; International Center on Small Hydro Power. Available from www.smallhydroworld.org.
3. LIU, D., LIU, H., WANG, X., and Kremere, E., eds. (2019). World Small Hydropower Development Report 2019. United Nations Industrial Development Organization; International Center on Small Hydro Power. Available from www.smallhydroworld.org.
4. World Bank (2017). Rural population (% of total population). Available from https://data.worldbank.org/indicator/SP.RUR.TOTL.ZS
5. World Bank (2016). Access the electricity (% of population). Available from https://data.worldbank.org/indicator/EG.ELC.ACCS.ZS
6. Nielsen, N.M and Kalinaki, A (2019). Discovering Hidden Hydro Opportunities with Special Reference to Africa. AFRICA 2019, Windhoek, Namibia. April 2019.

199
5.1. Au
str
AliA
An
d n
ew ZeA
lAn
d
Australiaandrew Blakers & anna nadolny, australian national University
Key facts
Population 24,598,9001
Area 7,692,024 km2 (including islands)2
Climate The centre of Australia is arid, whilst its southern coastal regions are mild, the north is tropical, and some mountainous regions see cool winters and snow. The maximum average temperature range is 18 °C to 33 °C, with a mean of 12 °C to 27 °C and a minimum range of 3 °C to 21 °C.3
Topography There are few mountains, except for the Great Dividing Range, which reaches from Queensland to Victoria. The remainder is low lying. The highest point is Mt Kosciusko (2,228 metres) and the lowest is Lake Eyre (-15 metres).4
Rain patterns Rain patterns are monsoonal in the north and variable elsewhere.4 Annual rainfall ranges from more than 3,000 mm to less than 100 mm.5
Hydrology Australia’s largest water system is the Murray-Darling, which flows from Queensland through New South Wales, Victoria and South Australia. Hydroelectric plants have been built through the Snowy river system in New South Wales and Victoria, and Hydropower Tasmania has built many hydro-electric facilities in Tasmania. The remaining rivers are ill-suited for hydropower development.
Electricity sector overview
The Australian electricity sector is undergoing a paradigm shift. New wind and solar photovoltaic (PV) capacity in 2018 is being built at a rate of 5 GW per year, which is sufficient to exceed 70 per cent renewable electricity by 2030. Wind and PV comprise virtually 100 per cent of new generation capacity and is replacing retiring coal and gas power stations.6
PV and wind are now respectively the number one and number two generation technologies, in terms of net new capacity installed worldwide each year, followed by gas, coal, and hydropower. PV and wind are likely to accelerate away from other generation technologies because of their lower cost, large economies of scale, low greenhouse gas emissions and the vast availability of solar and wind resources.7, 8, 9
The generation mix is rapidly changing, and in 2015-2016 comprised coal (25 GW, 163 TWh), natural gas (20 GW, 51 TWh), hydropower (9 GW, 15 TWh), solar PV (7 GW, 7 TWh), wind (4 GW, 12 TWh), oil products (1 GW, 6 TWh) and biomass (1 GW, 4 TWh).10, 11, 12,13 Diesel generators are used occasionally for backup and in remote areas. Peak electricity demand in the National Electricity Market (NEM) is about 32 GW. The Australian Energy Market Operator (AEMO) reports that 17 GW and 13 GW of ground-mounted wind and solar PV respectively has been proposed in the NEM, much of which is already under construction. 14
Electricity generation in 2015-16 was 257 TWh. Total generation has been relatively constant since 2008.12 The Australian electrification rate is 100 per cent.15 Due to Australia’s large size, the electricity grid is divided into
regions. The NEM connects the states of Queensland (Qld), New South Wales (NSW), the Australia Capital Territory (ACT), Victoria (VIC), South Australia (SA), and Tasmania (TAS) and covers most of the population. The South West Interconnected System (SWIS) provides electricity to those in Western Australia. Population centres in the Pilbara mining precinct in north-western Australia, in the Northern Territory, and near Mount Isa in North Queensland, are served by separate generation and distribution networks.
Figure 1. Annual electricity generation by source in Australia (TWh)
0 50 100 150 200
Coal
Natural Gas
Hydropower
Wind power
Solar (PV)
163
51
15
12
7
Source: Commonwealth of Australia,10, 11, 12 Australian PV Institute13
Australia has 7.5 GW of roof mounted PV panels,16 located on about one quarter of Australian homes. About one third of all households in the states of South Australia and Queensland have installed rooftop solar PV.17 The reason for this high pen-etration is that Australia has excellent sunshine and the retail electricity tariff is now significantly higher than the price of electricity from a roof-mounted PV system.18 The annual mar-
5.1.1
World Small HydropoWEr dEvElopmEnt
rEport 2019

200
World Small HydropoWer development report 2019
ket for roof-mounted panels is about 1.6 GW per year, current-ly mostly on homes. However, the uptake in the commercial sector is rapidly increasing.13 Roof-mounted PV acts to reduce demand during the day, and in February 2017 was an important factor in keeping the state of NSW from experiencing a black-out when high temperatures inhibited the operation of thermal generation.19 The ground-mounted PV sector is experiencing explosive growth, rising in the space of a few years from a few megawatts per year to several gigawatts per year.
Electricity and gas prices have both increased sharply in recent years, caused by a large escalation in the cost of retail electricity distribution, by retirement of old, low-cost, “sunk-cost” coal plants, and by development of a massive east coast gas export industry that has made Australian gas prices fungible with those in Asian markets. Federal and State Governments have attempted to mitigate these problems.20,21 Energy has become politicised, and the national energy conversation is entangled with discussion of anthropomorphic climate change. Vigorous claims were made that renewable energy is to blame for increasing energy prices. However, it is widely acknowledged, on the basis of the current deployment boom, that wind and PV electricity costs less in Australia than electricity from new coal or gas generators.22,23
South Australia reached 57 per cent renewable electricity from PV and wind in 2016-17.24 South Australia has no hydropower or coal generators, and relies on wind, PV and gas generation, and is additionally connected to other states by a constrained transmission system. The minimum grid demand has changed from winter to summer as rooftop solar PV depresses grid demand. Midday minimum grid demand is expected to be negative by 2027-28.25
Catastrophic events have caused political controversy. In March 2016, the undersea High Voltage Direct Current (HVDC) cable linking Tasmania and the mainland failed, at a time when hydropower resources were also low.26 Hydropower is the principle power generation technology in Tasmania, and so expensive diesel generators had to be imported. The likely response is additional wind and PV in Tasmania, as well as pressure to duplicate the HVDC connector. South Australia experienced an extended blackout in September 2016 when cyclonic winds brought down many transmission towers and various mitigation mechanisms failed to operate properly. The South Australian Government responded with a range of measures including installation of a 100 MW Tesla battery, procuring emergency diesel generators and procuring 100 MW of demand management.27,28,29 Many coal-fired power stations are reaching their end of life, and at least two thirds are expected to retire within the next 20 years.11 The cheapest replacement is likely to be PV and wind, which means that the high current deployment rates of these technologies are likely to continue and to increase.14,30 There is little prospect for other technologies to catch PV and wind. Hydropower is inhibited by the absence of suitable rivers to dam, and the other fossil, nuclear and renewable energy technologies are inhibited by an inability to compete with PV and wind.
The NEM has 30-minute settlement windows, in which the price for the entire 30 minutes is determined by the highest paid generator during that time. Many industry players lobbied for this window to be shortened to five minutes. This will result in lower prices for wholesale electricity and will eventually lower prices for consumers which would favour new market entrants. This rule change will come into place in 2021. Batteries, hydropower and demand management can respond within 5 minutes, but coal and gas generators cannot.31
Small hydropower sector overview
Australia has more than 60 individual small hydropower plants, with a total combined capacity of more than 173 MW (Figure 2).32 There are many plants that have individual capac-ity ranging from 10 MW to 1,500 MW, and many businesses selling parts for micro-hydropower systems.33
Figure 2. Small hydropower capacities 2013/2016/2019 in Australia (MW)
0 50 100 150 200
PotentialCapacity
Installed Capacity
N/AN/AN/A
173.0 172.2 172.2
WSHPDR 2019WSHPDR 2016WSHPDR 2013
Source: Clean Energy Council,32 WSHPDR 2013,57 WSHPDR 201658
Note: The comparison is between data from WSHPDR2013, WSHPDR 2016 and WHSPDR2019.
The theoretical small hydropower capacity for Australia has not been quantified. Australia is well known for its aridity, but there are still many waterways that could be fitted with hydropower. For example, Sydney Water and Melbourne Water have 19 hydropower sites in total, and there are several other water supply authorities that have installed small hydropower.34 Melbourne Water installed five of these sites in 2016-2017, and is currently determining the feasibility of 11 additional small hydropower sites.35,36 Sewerage treatment sites are another example of a potential source of small hydropower.
Although the Murray Darling basin has many sites that could be suitable for small hydropower from a technical perspective, the environmental impact precludes them as sustainable sites. Fish are affected by changes in water pressure and at the junction between two streams of water.37 Off river systems mean existing fauna and flora are not disturbed, and hydropower can be generated sustainably. Sites must be individually assessed to determine suitability for hydropower installation, and so a theoretical capacity cannot be reported.
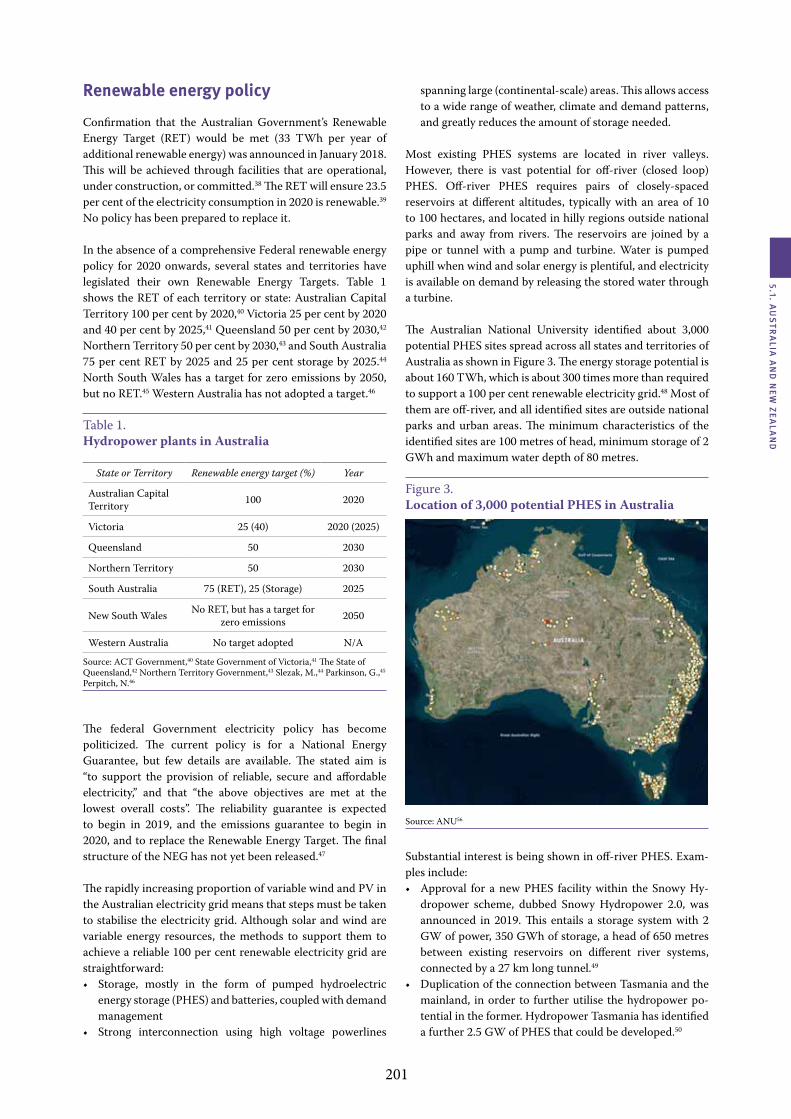
201
5.1. Au
str
AliA
An
d n
ew ZeA
lAn
d
Renewable energy policy
Confirmation that the Australian Government’s Renewable Energy Target (RET) would be met (33 TWh per year of additional renewable energy) was announced in January 2018. This will be achieved through facilities that are operational, under construction, or committed.38 The RET will ensure 23.5 per cent of the electricity consumption in 2020 is renewable.39 No policy has been prepared to replace it.
In the absence of a comprehensive Federal renewable energy policy for 2020 onwards, several states and territories have legislated their own Renewable Energy Targets. Table 1 shows the RET of each territory or state: Australian Capital Territory 100 per cent by 2020,40 Victoria 25 per cent by 2020 and 40 per cent by 2025,41 Queensland 50 per cent by 2030,42 Northern Territory 50 per cent by 2030,43 and South Australia 75 per cent RET by 2025 and 25 per cent storage by 2025.44 North South Wales has a target for zero emissions by 2050, but no RET.45 Western Australia has not adopted a target.46
Table 1.Hydropower plants in Australia
State or Territory Renewable energy target (%) Year
Australian Capital Territory 100 2020
Victoria 25 (40) 2020 (2025)
Queensland 50 2030
Northern Territory 50 2030
South Australia 75 (RET), 25 (Storage) 2025
New South Wales No RET, but has a target for zero emissions 2050
Western Australia No target adopted N/A Source: ACT Government,40 State Government of Victoria,41 The State of Queensland,42 Northern Territory Government,43 Slezak, M.,44 Parkinson, G.,45 Perpitch, N.46
The federal Government electricity policy has become politicized. The current policy is for a National Energy Guarantee, but few details are available. The stated aim is “to support the provision of reliable, secure and affordable electricity,” and that “the above objectives are met at the lowest overall costs”. The reliability guarantee is expected to begin in 2019, and the emissions guarantee to begin in 2020, and to replace the Renewable Energy Target. The final structure of the NEG has not yet been released.47
The rapidly increasing proportion of variable wind and PV in the Australian electricity grid means that steps must be taken to stabilise the electricity grid. Although solar and wind are variable energy resources, the methods to support them to achieve a reliable 100 per cent renewable electricity grid are straightforward: • Storage, mostly in the form of pumped hydroelectric
energy storage (PHES) and batteries, coupled with demand management
• Strong interconnection using high voltage powerlines
spanning large (continental-scale) areas. This allows access to a wide range of weather, climate and demand patterns, and greatly reduces the amount of storage needed.
Most existing PHES systems are located in river valleys. However, there is vast potential for off-river (closed loop) PHES. Off-river PHES requires pairs of closely-spaced reservoirs at different altitudes, typically with an area of 10 to 100 hectares, and located in hilly regions outside national parks and away from rivers. The reservoirs are joined by a pipe or tunnel with a pump and turbine. Water is pumped uphill when wind and solar energy is plentiful, and electricity is available on demand by releasing the stored water through a turbine.
The Australian National University identified about 3,000 potential PHES sites spread across all states and territories of Australia as shown in Figure 3. The energy storage potential is about 160 TWh, which is about 300 times more than required to support a 100 per cent renewable electricity grid.48 Most of them are off-river, and all identified sites are outside national parks and urban areas. The minimum characteristics of the identified sites are 100 metres of head, minimum storage of 2 GWh and maximum water depth of 80 metres.
Figure 3. Location of 3,000 potential PHES in Australia
Source: ANU56
Substantial interest is being shown in off-river PHES. Exam-ples include:• Approval for a new PHES facility within the Snowy Hy-
dropower scheme, dubbed Snowy Hydropower 2.0, was announced in 2019. This entails a storage system with 2 GW of power, 350 GWh of storage, a head of 650 metres between existing reservoirs on different river systems, connected by a 27 km long tunnel.49
• Duplication of the connection between Tasmania and the mainland, in order to further utilise the hydropower po-tential in the former. Hydropower Tasmania has identified a further 2.5 GW of PHES that could be developed.50

202
World Small HydropoWer development report 2019
• A retired goldmine in Northern Queensland could be used to construct a 250 MW PHES system, which will be com-plemented by a solar project.51
• A saltwater PHES near Cultana (SA).52
• Burdekin Falls Hydroelectric Power Station will be locat-ed in Far North Queensland with a capacity of at least 50 MW.53
• Oven Mountain Pumped Storage, to be located in Northern NSW with 600 MW and 6 hours storage.54
In February 2018, the South Australian Government an-nounced grants for four new feasibility studies for projects in that state, which would contribute 750 MW generating po-tential to the grid.55
Barriers to small hydropower developmentThe market for small-scale hydropower development on riv-ers and streams in Australia is limited. Barriers to the devel-opment of further small hydropower include:• Small heads, power and energy leading to expensive power
that is unable to complete with wind and solar PV.• Environmental impacts, such as the impact on aquatic flora
and fauna, restrict available sites for SHP development.• Insufficient reliable water availability in a generally arid
country.
However, there is substantial potential for large-scale development of PHES away from rivers.
References
1. Australian Bureau of Statistics. 3101.0 - Australian Demographic Statistics, Jun 2017. (2017). Available from: http://www.abs.gov.au/AUSSTATS/[email protected]/mf/3101.0.
2. Geoscience Australia. Area of Australia - States and Territories. Available from: http://www.ga.gov.au/scientific-topics/national-location-information/dimensions/area-of-australia-states-and-territories.
3. Australian Government Bureau of Meteorology. Average annual & monthly maximum, minimum, & mean temperature. (2005). Available from: http://www.bom.gov.au/jsp/ncc/climate_averages/temperature/index.jsp?maptype=3&period=an#maps.
4. Commonwealth of Australia. The Australian continent. Available from: https://www.australia.gov.au/about-australia/our-country/the-australian-continent.
5. Australian Government Bureau of Meteorology. Average annual, seasonal and monthly rainfall. (2010). Available from: http://www.bom.gov.au/jsp/ncc/climate_averages/rainfall/index.jsp.
6. Blakers, A. & Stocks, M. Solar PV and wind are on track to replace all coal, oil and gas within two decades. The Conversation (2018). Available from: https://theconversation.com/solar-pv-and-wind-are-on-track-to-replace-all-coal-oil-and-gas-within-two-decades-94033.
7. REN21. Renewables 2016 Global Status Report. (REN21 Secretariat, 2016).
8. Frankfurt School of Finance & Management, UNEP & Bloomberg New Energy Finance. Global Trends in Renewable Energy Investment 2015. (2015).
9. Whiteman, A., RInke, T., Esparrago, J. & Elsayed, S. Renewable Capacity Statistics 2016. (2016).
10. Commonwealth of Australia. Power Stations. (2017). Available from: https://data.gov.au/dataset/power-stations.
11. Commonwealth of Australia. Retirement of coal fired power stations Final report. (2017). Available from: https://www.aph.gov.au/Parliamentary_Business/Committees/Senate/Environment_and_Communications/Coal_fired_power_stations/Final_Report.
12. Commonwealth of Australia. Australian Energy Update. (2017). Available from: https://www.energy.gov.au/sites/g/files/net3411/f/energy-update-report-2017.pdf.
13. Australian PV Institute. Australian PV market since April 2001. (2017). Available from: http://pv-map.apvi.org.au/analyses.
14. Australian Energy Market Operator (AEMO). Generation Information Page. (2018). Available from: https://www.aemo.com.au/Electricity/National-Electricity-Market-NEM/Planning-and-forecasting/Generation-information.
15. The World Bank. Access to electricity (% of population). (2014). Available from: https://data.worldbank.org/indicator/EG.ELC.ACCS.ZS.
16. Australian Government Clean Energy Regulator. Postcode data for small-scale installations. (2018). Available from: http://www.cleanenergyregulator.gov.au/RET/Forms-and-resources/Postcode-data-for-small-scale-installations.
17. Australian PV Institute. Mapping Australian Photovoltaic installations. (2018). Available from: http://pv-map.apvi.org.au/historical#4/-26.67/134.12.
18. Mountain, B. Tesla battery + solar now ‘significantly cheaper’ than grid power. Renew Economy (2018).
19. Vorrath, S. NSW heatwave: Another catalogue of fossil fuel power failures. Renew Economy (2017).
20. Belot, H. Energy retailers to provide customers with information on saving money on bills, Malcolm Turnbull says. ABC (2017). Available from: http://www.abc.net.au/news/2017-08-30/power-bill-cutting-advice-to-be-sent-to-customers/8856498.
21. Belot, H. & Borys, S. Malcolm Turnbull defends energy market intervention, says wholesale gas prices could halve. ABC (2017). Available from: http://www.abc.net.au/news/2017-04-27/turnbull-says-gas-export-restrictions-to-halve-electricity-price/8475676.
22. Jotzo, F., Mazouz, S., McConnell, D. & Saddler, H. We must fix the foundation of our energy policy to get out of the current mess. The Guardian (2018). Available from: https://www.theguardian.com/commentisfree/2018/apr/11/we-must-fix-the-foundation-of-our-energy-policy-to-get-out-of-the-current-mess.
23. Parkinson, G. AEMC admits, reluctantly, that renewables will push prices down. Renew Economy (2017). Available from: https://reneweconomy.com.au/aemc-admits-reluctantly-that-renewables-will-push-prices-down-23555/.
24. Parkinson, G. South Australia already at 57% wind and solar in 2016/17. Renew Economy (2017). Available from: http://reneweconomy.com.au/south-australia-already-57-wind-solar-201617/.
25. Australian Energy Market Operator (AEMO). South Australian Demand Forecasts. (2017). Available from: https://www.

203
5.1. Au
str
AliA
An
d n
ew ZeA
lAn
d
aemo.com.au/-/media/Files/Electricity/NEM/Planning_and_Forecasting/SA_Advisory/2017/2017-South-Australia-Demand-Forecasts.pdf.
26. Bolger, R. Basslink pinpoints fault in undersea power cable linking Tasmania to mainland Australia. ABC (2016). Available from: http://www.abc.net.au/news/2016-03-29/basslink-pinpoints-fault-in-undersea-cable-tasmania/7280820.
27. McConnell, D. A month in, Tesla’s SA battery is surpassing expectations. The Conversation (2018). Available from: https://theconversation.com/a-month-in-teslas-sa-battery-is-surpassing-expectations-89770.
28. Novak, L. Diesel generators at Elizabeth and Lonsdale are ready to provide 276MW of extra power to South Australia this summer. The Advertiser (2017). Available from: http://www.adelaidenow.com.au/news/south-australia/diesel-generators-at-elizabeth-and-lonsdale-are-ready-to-provide-276mw-of-extra-power-to-south-australia-this-summer/news-story/b20bfc0eeb1ddf8a66d16e6c9218d3fb.
29. Parkinson, G. South Australia is going to need its battery storage this summer. Renew Economy (2017). Available from: http://reneweconomy.com.au/south-australia-is-going-to-need-its-battery-storage-this-summer-15731/.
30. Parkinson, G. Solar’s trillion-dollar market: Driven by EVs, microgrids and cost parity for storage. Renew Economy (2017). Available from: http://reneweconomy.com.au/solars-trillion-dollar-market-driven-evs-microgrids-cost-parity-storage-13315/.
31. Parkinson, G. AEMC confirms 5-minute settlement to begin in 2021. Renew Economy (2017). Available from: http://reneweconomy.com.au/aemc-confirms-5-minute-settlement-to-begin-in-2021-2021/.
32. Clean Energy Council. Renewable energy map. (2014). Available from: https://www.cleanenergycouncil.org.au/technologies/renewable-energy-map.html;jsessionid=E2857600FB58469198AD3CDB11F2112E.
33. Geoscience Australia & Australian Bureau of Resources and Energy Economics. Australian Energy Resource Assessment. (2014).
34. Sydney Water. Innovation & renewable energy. Available from: https://www.sydneywater.com.au/SW/education/Watermanagement/Innovationrenewableenergy/index.htm.
35. Melbourne Water. Energy. (2017). Available from: https://www.melbournewater.com.au/community-and-education/about-our-water/liveability-and-environment/energy.
36. Melbourne Water. Mini hydro electricity plants. (2018). Available from: https://www.melbournewater.com.au/what-we-are-doing/works-and-projects-near-me/all-projects/mini-hydro-electricity-plants.
37. Baumgartner, L. J., Boys, C. & Barton, R. Mini hydro development workshop: developing sustainable solutions for native fish. Ecol. Manag. Restor. 13, e14–e15 (2012).
38. Parkinson, G. RET is met, and Frydenberg concedes more wind and solar will lower prices, improve reliability. Renew Economy (2018). Available from: http://reneweconomy.com.au/ret-met-frydenberg-concedes-wind-solar-will-lower-prices-improve-reliability-47006/.
39. Baldwin, K. RET deal gives no renewables certainty over coming decades. Renew Economy (2015). Available from: http://reneweconomy.com.au/ret-deal-gives-no-renewables-certainty-over-coming-decades-53320/.
40. ACT Government Environment Planning and Sustainable
Development Directorate. Renewable energy target legislation and reporting. (2018). Available from: https://www.environment.act.gov.au/energy/cleaner-energy/renewable-energy-target-legislation-reporting.
41. State Government of Victoria. Victoria’s renewable energy targets. (2018). Available from: https://www.energy.vic.gov.au/renewable-energy/victorias-renewable-energy-targets.
42. The State of Queensland. Renewable Energy Expert Panel. (2017). Available from: https://www.dews.qld.gov.au/electricity/solar/solar-future/expert-panel.
43. Northern Territory Government. Roadmap to Renewables. (2016). Available from: https://roadmaptorenewables.nt.gov.au.
44. Slezak, M. All in on renewable energy: Jay Weatherill to ramp up SA target to 75%. The Guardian (2018). Available from: https://www.theguardian.com/australia-news/2018/feb/21/all-in-on-renewable-energy-jay-weatherill-to-ramp-up-sa-target-to-75.
45. Parkinson, G. NSW could be dark horse of Australia’s renewable energy boom. Renew Economy (2017).
46. Perpitch, N. National Energy Plan: Does WA need its own renewables target? ABC (2017). Available from: http://www.abc.net.au/news/2017-10-19/energy-reform-explainer-how-will-it-affect-wa/9065974.
47. COAG Energy Council. National Energy Guarantee. (2017). Available from: http://www.coagenergycouncil.gov.au/publications/energy-security-board-update.
48. Blakers, A., Lu, B. & Stocks, M. 100% renewable electricity in Australia. Energy 133, 471–482 (2017).
49. Frydenberg, J. Why we can’t do without the power of Snowy 2.0. Australian Financial Review (2018). Available from: http://www.joshfrydenberg.com.au/siteData/uploadedData/Why we cant do without the power of Snowy 2.0 _ afr_12b79b49-e46f-4bad-9102-53c9832142ec.pdf.
50. Hydro Tasmania. Battery of the Nation FAQs. (2018). Available from: https://www.hydro.com.au/clean-energy/battery-of-the-nation/battery-of-the-nation-FAQs.
51. Genex Power. 250MW Kidston Pumped Storage Hydro Project. (2015). Available from: http://www.genexpower.com.au/250mw-kidston-pumped-storage-hydro-project.html.
52. Energy Australia. Fact Sheet: Cultana Pumped Hydro Project. Available from: https://www.energyaustralia.com.au/sites/default/files/2017-08/Cultana Pumped Hydro Project Fact Sheet - August 2017.pdf.
53. Vorrath, S. Queensland looks to hydro power plans for Burdekin in state’s north. Renew Economy (2017). Available from: http://reneweconomy.com.au/queensland-looks-hydro-power-plans-burdekin-states-north-69658/.
54. Parkinson, G. 600MW pumped hydro project proposed for northern NSW. Renew Economy (2017). Available from: http://reneweconomy.com.au/600mw-pumped-hydro-project-proposed-for-northern-nsw-11244/.
55. Parkinson, G. ‘Future is storage:’ SA govt pumps for four more hydro projects. Renew Economy (2018). Available from: http://reneweconomy.com.au/future-is-storage-sa-govt-pumps-for-four-more-hydro-projects-41345/.
56. Australian National University (2019). Global pumped hydro energy storage atlas. Available from http://re100.eng.anu.edu.au/global/index.php
57. Liu, H., Masera, D. and Esser, L., eds.. World Small Hydropower Development Report 2013. United Nations Industrial Development Organization; International Center on Small

204
World Small HydropoWer development report 2019
Hydro Power (2013). Available from: www.smallhydroworld.org. 58. Xialei, C., Singh, P. R., Xianlai, W., and Kremere, E.,
eds. (2016). World Small Hydropower Development Report 2016. United Nations Industrial Development Organization; International Center on Small Hydro Power. Available from www.smallhydroworld.org.

205
5.1. Au
str
AliA
An
d n
ew ZeA
lAn
d
New ZealandInternational Center on Small Hydro power (ICSHp)
Key facts
Population 4,793,9001
Area 271,000 km2
Climate The weather is influenced by anticyclones separated by middle-latitude cyclones and fronts crossing the country from west to east throughout the year. The summer months (December through February) are predominantly sunny, while winter months (June through August) tend to be wet. Due to the mountain chains crossing the country, the contrast in climate between west and east is more striking than between north and south. In most parts of the country winter daytime high temperatures rarely decrease below 10 °C, while in summer time they are above 21 °C.2
Topography The country comprises two large islands, the North and the South Islands, and numerous small is-lands. Being located in the Ring of Fire, the circum-Pacific seismic belt, New Zealand experiences numerous earthquakes every year. The North and the South Islands are bisected by mountains, in-cluding the 480-kilometre-long chain of the Southern Alps in the South Island, which contain the country’s highest peak Mount Cook at 3,754 metres above sea level as well as some 20 other peaks rising above 3,000 metres.2
Rain pattern Annual precipitation ranges between 300 mm in Central Otago and 6,400 mm in the Southern Alps, and for most parts of the territory ranges between 635 and 1,520 mm. Precipitation is usually spread uniformly throughout the year. Snow is common only in mountainous areas.2
Hydrology The longest river is the Waikato flowing in the North Island, however, eight out of ten biggest rivers are located in the South Island. In addition, there are numerous swift and unnavigable rivers, many of which arise from or drain into lakes associated with an extensive system of glaciers, in particular in the South Island. A number of these lakes have been used for hydropower generation. The three main hydropower storage lakes, which hold 70 per cent of the water used for electricity generation in the country are Lake Pukaki, Lake Tekap and Lake Taupo.2,3
Electricity sector overview
In 2016, the total installed capacity of New Zealand stood at 9,291 MW and was dominated by hydropower, accounting for 58 per (Figure 1).4 Hydropower has been an important part of the energy system of New Zealand for over 100 years and is mainly concentrated in the South Island. The exploitation of geothermal power started in 1958 with the opening of the Wairakei power plant. Most of the installed capacity of geothermal power is located in the Taupo Volcanic Zone. The first wind power plant of New Zealand was commissioned in 1997 and since then the wind power generation has grown quickly – from 36 MW in 2000 to 690 MW in 2016. Most of the wind power farms, including the two largest ones (Tararua Wind Farm and West Wind Makara) are situated in the North Island. In total, renewable energy sources accounted for approximately 76 per cent of the country’s installed capacity in 2016. At the same time, generation from thermal power has been decreasing over the last 15 years, following the downgrading of Maui natural gas reserves, and has been gradually replaced by renewable energy. Today, thermal power serves as baseload, backup and peak electricity supply, with most of the thermal plants located in the North Island, in the vicinity of the country’s coal, oil and gas reserves.4,5,6
Figure 1. Installed electricity capacity by source in New Zealand (MW)
Hydropower
Gas
Geothermalpower
Wind power
Coal/gas
Cogeneration
Diesel
Biogas
5,363
1,151
978
690
500
407
155
37
Source: MBIE4
Note: Small-scale distribution generation, such as solar PV, is not included.
Although not included in the total installed capacity figure given above, solar photovoltaic (PV) power has been growing quickly having demonstrated an increase of 52 per cent in
5.1.2
World Small HydropoWEr dEvElopmEnt
rEport 2019

206
2016. In New Zealand, solar power is used for small-scale distributed generation and is not well recorded. However, it is estimated that in 2016 the capacity of these systems was at some 47 MW from 12,698 connections.6
Figure 2. Annual electricity generation by source in New Zealand (GWh)
7,453
6,578
2,178
1,132
331
278
72
55
4
HydropowerGeothermal
powerGas
Wind power
Coal
Wood
Biogas
Solar power
Waste heat
Oil
24,965
Source: MBIE4
In 2016, a total of 43 TWh of electricity was generated. Eighty-two per cent came from the renewable energy sourc-es, including 58 per cent from hydropower (Figure 2).4 In the same year approximately 39 TWh of electricity was consumed domestically, with the main consumers being the industrial, residential and commercial sectors (Figure 3).4 Electricity losses on transmission and distribution lines stood at approximately 3 and 4 per cent, respectively.4 Na-tionwide access to electricity is 100 per cent, both in rural and urban areas.7
Figure 3. Electricity consumption by sector (%)
Industrial 37%Residential 31%Commercial (incl. Transport) 24%Agriculture/Forestry/Fishing 7%UnallocatedOnsite Generation 0%
Source: MBIE4
The electricity industry of New Zealand is regulated by the Electricity Authority, which is an independent entity established in November 2010 under the Electricity Industry Act 2010. The Electricity Authority is authorized to make regulations for the sector and aims to promote a
competitive, reliable and efficient electricity industry. The Ministry of Business, Innovation and Employment (MBIE) provides policy advice to the Government in relation to energy, including supply and demand, efficiency and conservation, and renewable energy. The Energy Efficiency and Conservation Authority (EECA) promotes energy efficiency and conservation measures and supports the use of renewable energy sources.8
Electricity generation is dominated by five major companies – Contact Energy, TrustPower, Genesis Energy, Meridian Energy and Mercury NZ. As of 2017, they owned 98 power plants and operated 81 plants on behalf of the other owners. The transmission grid of New Zealand comprises 11,349 kilometres of high-voltage (220 kV, 110 kV and 66 kV) lines and is owned and operated by Transpower. The two major islands, the North and the South Islands, are connected via a 350 kV power line, the High Voltage Direct Current (HVDC). It operates in both directions but is mainly used to transport electricity from major hydropower plants in the South Island to the North Island, although during periods of low inflows into southern hydrological catchments, the flow is often reversed. Most electricity distribution networks are owned by 29 distribution companies, the largest of which is Vector. In 2017, there were 48 retail companies, five of which have the largest share of the market, however, the proportion of the market taken by small- and medium-scale retailers has been increasing.8
Electricity tariffs are set by retail companies. In March 2018, the average cost per kWh for residential users was NZD 0.2903 (US$ 0.190). Average annual expenditure for electricity per household was at NZD 2,301 (US$ 1,507), while average annual consumption per household stood at 6,997 kWh.9
Small hydropower sector overview
Small hydropower (SHP) in New Zealand is classified as hy-dropower plants with capacity from 1 MW to 10 MW, while mini-hydropower is classified as plants of 10 kW to 1 MW and micro-hydropower are less than 10 kW. 10
According to the most recent estimate of the Electricity Authority, in October 2015, there were around 60 small hydropower plants up to 10 MW with a combined installed capacity of 154 MW.10 The Electricity Authority is yet to provide more up-to-date data on the SHP generation fleet. The total potential of SHP in the country is estimated at 622 MW, indicating that approximately 25 per cent of potential capacity has been developed.11 Compared to the World Small Hydropower Development Report (WSHPDR) 2016, the potential of small hydropower plants has remained unchanged, whereas the installed capacity has decreased by 5.5 per cent (Figure 4).
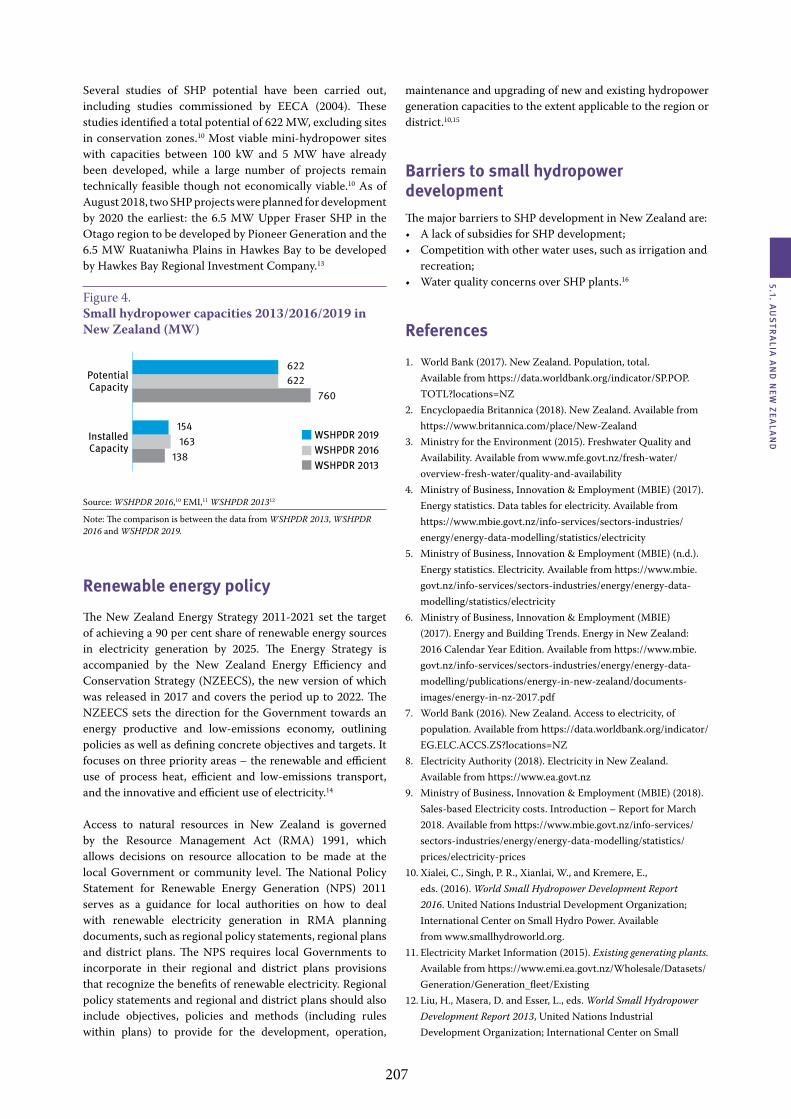
207
5.1. Au
str
AliA
An
d n
ew ZeA
lAn
d
Several studies of SHP potential have been carried out, including studies commissioned by EECA (2004). These studies identified a total potential of 622 MW, excluding sites in conservation zones.10 Most viable mini-hydropower sites with capacities between 100 kW and 5 MW have already been developed, while a large number of projects remain technically feasible though not economically viable.10 As of August 2018, two SHP projects were planned for development by 2020 the earliest: the 6.5 MW Upper Fraser SHP in the Otago region to be developed by Pioneer Generation and the 6.5 MW Ruataniwha Plains in Hawkes Bay to be developed by Hawkes Bay Regional Investment Company.13
Figure 4. Small hydropower capacities 2013/2016/2019 in New Zealand (MW)
0 100 200 300 400 500 600 700 800
PotentialCapacity
Installed Capacity
622 622 760
154 163 138
WSHPDR 2019WSHPDR 2016WSHPDR 2013
Source: WSHPDR 2016,10 EMI,11 WSHPDR 201312
Note: The comparison is between the data from WSHPDR 2013, WSHPDR 2016 and WSHPDR 2019.
Renewable energy policy
The New Zealand Energy Strategy 2011-2021 set the target of achieving a 90 per cent share of renewable energy sources in electricity generation by 2025. The Energy Strategy is accompanied by the New Zealand Energy Efficiency and Conservation Strategy (NZEECS), the new version of which was released in 2017 and covers the period up to 2022. The NZEECS sets the direction for the Government towards an energy productive and low-emissions economy, outlining policies as well as defining concrete objectives and targets. It focuses on three priority areas – the renewable and efficient use of process heat, efficient and low-emissions transport, and the innovative and efficient use of electricity.14
Access to natural resources in New Zealand is governed by the Resource Management Act (RMA) 1991, which allows decisions on resource allocation to be made at the local Government or community level. The National Policy Statement for Renewable Energy Generation (NPS) 2011 serves as a guidance for local authorities on how to deal with renewable electricity generation in RMA planning documents, such as regional policy statements, regional plans and district plans. The NPS requires local Governments to incorporate in their regional and district plans provisions that recognize the benefits of renewable electricity. Regional policy statements and regional and district plans should also include objectives, policies and methods (including rules within plans) to provide for the development, operation,
maintenance and upgrading of new and existing hydropower generation capacities to the extent applicable to the region or district.10,15
Barriers to small hydropower developmentThe major barriers to SHP development in New Zealand are: • A lack of subsidies for SHP development; • Competition with other water uses, such as irrigation and
recreation; • Water quality concerns over SHP plants.16
References
1. World Bank (2017). New Zealand. Population, total. Available from https://data.worldbank.org/indicator/SP.POP.TOTL?locations=NZ
2. Encyclopaedia Britannica (2018). New Zealand. Available from https://www.britannica.com/place/New-Zealand
3. Ministry for the Environment (2015). Freshwater Quality and Availability. Available from www.mfe.govt.nz/fresh-water/overview-fresh-water/quality-and-availability
4. Ministry of Business, Innovation & Employment (MBIE) (2017). Energy statistics. Data tables for electricity. Available from https://www.mbie.govt.nz/info-services/sectors-industries/energy/energy-data-modelling/statistics/electricity
5. Ministry of Business, Innovation & Employment (MBIE) (n.d.). Energy statistics. Electricity. Available from https://www.mbie.govt.nz/info-services/sectors-industries/energy/energy-data-modelling/statistics/electricity
6. Ministry of Business, Innovation & Employment (MBIE) (2017). Energy and Building Trends. Energy in New Zealand: 2016 Calendar Year Edition. Available from https://www.mbie.govt.nz/info-services/sectors-industries/energy/energy-data-modelling/publications/energy-in-new-zealand/documents-images/energy-in-nz-2017.pdf
7. World Bank (2016). New Zealand. Access to electricity, of population. Available from https://data.worldbank.org/indicator/EG.ELC.ACCS.ZS?locations=NZ
8. Electricity Authority (2018). Electricity in New Zealand. Available from https://www.ea.govt.nz
9. Ministry of Business, Innovation & Employment (MBIE) (2018). Sales-based Electricity costs. Introduction – Report for March 2018. Available from https://www.mbie.govt.nz/info-services/sectors-industries/energy/energy-data-modelling/statistics/prices/electricity-prices
10. Xialei, C., Singh, P. R., Xianlai, W., and Kremere, E., eds. (2016). World Small Hydropower Development Report 2016. United Nations Industrial Development Organization; International Center on Small Hydro Power. Available from www.smallhydroworld.org.
11. Electricity Market Information (2015). Existing generating plants. Available from https://www.emi.ea.govt.nz/Wholesale/Datasets/Generation/Generation_fleet/Existing
12. Liu, H., Masera, D. and Esser, L., eds. World Small Hydropower Development Report 2013, United Nations Industrial Development Organization; International Center on Small

208
World Small HydropoWer development report 2019
Hydro Power (2013)13. Electricity Market Information (2018). Proposed generating
plants. Available from https://www.emi.ea.govt.nz/Wholesale/Datasets/Generation/Generation_fleet/Proposed
14. Ministry of Business, Innovation & Employment (MBIE) (n.d.). Energy strategies. Available from https://www.mbie.govt.nz/info-services/sectors-industries/energy/energy-strategies
15. Ministry for the Environment (2016). About the National Policy Statement for Renewable Electricity Generation. Available from http://www.mfe.govt.nz/more/energy/national-policy-statement-renewable-electricity-generation/about-nps
16. New Zealand, Ministry of Environment (2014). National Pol-icy Statement for Water Refreshment. Available from www.mfe.govt.nz/publications/fresh-water/national-policy-state-ment-freshwater-management-2014

209
FRENCH POLYNESIA
FIJIVANUATU
NEW CALEDONIA
SAMOAPAPUA NEW GUINEA
SOLOMON ISLANDS
FEDERATED STATES OF MICRONESIA
Pacific Island Countries and Territories – Melanesia, Micronesia, PolynesiaGuillaume Binet, Engineering Consultant; and International Center on Small Hydro power (ICSHp)
Introduction to the region
The Pacific Island Countries and Territories (PICTs) include three United Nations designated regions: Melanesia, Micronesia and Polynesia. These regions comprise 23 island countries and self-governing/overseas territories. An overview of the PICTs is presented in Table 1.
The PICTs have diverse renewable energy resources (e.g. solar, wind, hydropower, geothermal, biomass, tidal, ocean thermal energy conversion) but still remain dependent on imported fossil fuels to meet their energy needs. The large rural populations of those countries face significant challenges when it comes to electrification. Due to the unique geography of the region, which comprises separate, sparsely populated islands separated by long distances, as well as the region’s economy nodes, it is difficult to achieve cost savings in the electricity sector, which in many cases endangers the viability of new electricity production projects.
Hydropower (large and small) plays an important role in energy mixes in this region. In particular, it accounts for 41 per cent of the total installed capacity of Fiji, 40 per cent of Papua New Guinea (PNG), 22 per cent of Samoa and 21 per cent of French Polynesia. Eight of the 23 countries/territories in the region have adopted small hydropower (SHP). These include Fiji, New Caledonia (a self-governing territory of France), PNG, the Solomon Islands, Vanuatu, the Federated States of Micronesia (FSM), French Polynesia (an overseas territory of France) and Samoa. Thus, all five countries/territories in Melanesia use SHP, while most countries/territories of Micronesia (Guam, Kiribati, the Marshall Islands, Nauru, the Northern Mariana Islands and Palau) and Polynesia (American Samoa, the Cook Islands, Niue, Pitcairn, Tokelau, Tonga, Tuvalu and the Wallis and Futuna Islands) do not.
Each of eight countries or territories that have developed SHP have a tropical climate, as well as mountainous areas that are suitable for SHP. While the weather in New Caledonia and Vanuatu is influenced by trade winds, PNG, Fiji and Solomon Islands are influenced by monsoons, and the FSM have year-round heavy rainfall and typhoons. Non-mountainous islands or low-lying atoll islands, such as the Cook Islands, Tuvalu, Kiribati and others, have very little or no hydropower. The hydropower potential of these countries has not been assessed and is not treated in this report.
5.2
World Small HydropoWEr dEvElopmEnt
rEport 2019
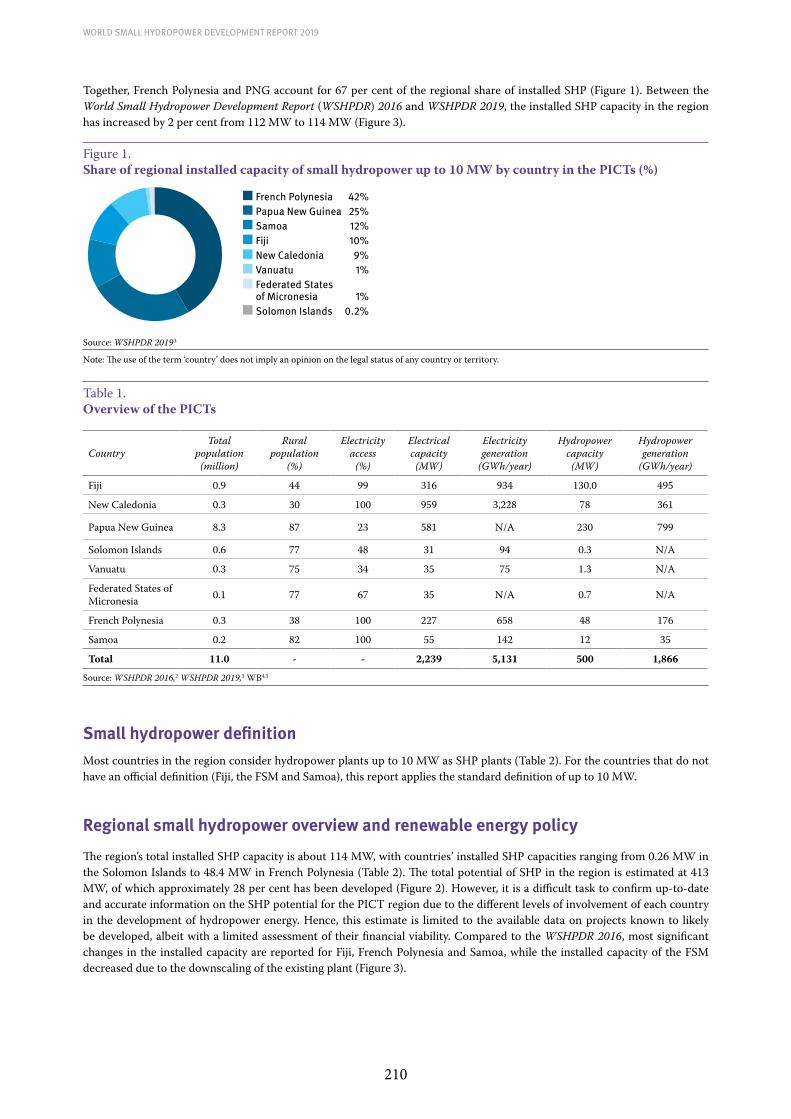
210
World Small HydropoWer development report 2019
Together, French Polynesia and PNG account for 67 per cent of the regional share of installed SHP (Figure 1). Between the World Small Hydropower Development Report (WSHPDR) 2016 and WSHPDR 2019, the installed SHP capacity in the region has increased by 2 per cent from 112 MW to 114 MW (Figure 3).
Figure 1. Share of regional installed capacity of small hydropower up to 10 MW by country in the PICTs (%)
French Polynesia 42%Papua New Guinea 25%Samoa 12%Fiji 10%New Caledonia 9%Vanuatu 1%Federated States of Micronesia 1%Solomon Islands 0.2%
Source: WSHPDR 20193
Note: The use of the term ‘country’ does not imply an opinion on the legal status of any country or territory.
Table 1. Overview of the PICTs
CountryTotal
population (million)
Rural population
(%)
Electricity access
(%)
Electrical capacity
(MW)
Electricity generation
(GWh/year)
Hydropower capacity
(MW)
Hydropower generation
(GWh/year)
Fiji 0.9 44 99 316 934 130.0 495
New Caledonia 0.3 30 100 959 3,228 78 361
Papua New Guinea 8.3 87 23 581 N/A 230 799
Solomon Islands 0.6 77 48 31 94 0.3 N/A
Vanuatu 0.3 75 34 35 75 1.3 N/A
Federated States of Micronesia 0.1 77 67 35 N/A 0.7 N/A
French Polynesia 0.3 38 100 227 658 48 176
Samoa 0.2 82 100 55 142 12 35
Total 11.0 - - 2,239 5,131 500 1,866 Source: WSHPDR 2016,2 WSHPDR 2019,3 WB4,5
Small hydropower definitionMost countries in the region consider hydropower plants up to 10 MW as SHP plants (Table 2). For the countries that do not have an official definition (Fiji, the FSM and Samoa), this report applies the standard definition of up to 10 MW.
Regional small hydropower overview and renewable energy policy
The region’s total installed SHP capacity is about 114 MW, with countries’ installed SHP capacities ranging from 0.26 MW in the Solomon Islands to 48.4 MW in French Polynesia (Table 2). The total potential of SHP in the region is estimated at 413 MW, of which approximately 28 per cent has been developed (Figure 2). However, it is a difficult task to confirm up-to-date and accurate information on the SHP potential for the PICT region due to the different levels of involvement of each country in the development of hydropower energy. Hence, this estimate is limited to the available data on projects known to likely be developed, albeit with a limited assessment of their financial viability. Compared to the WSHPDR 2016, most significant changes in the installed capacity are reported for Fiji, French Polynesia and Samoa, while the installed capacity of the FSM decreased due to the downscaling of the existing plant (Figure 3).

211
5.2. PIC
Ts
Table 2.Small hydropower capacities in the PICTs (local and ICSHP definition) (MW)
Country Local SHP definition Installed capacity Potential capacity
Fiji - 11.2 14.0
New Caledonia up to 10 9.9 100.0
Papua New Guinea up to 10 29.1 153.0
Solomon Islands up to 10 0.3 11.0
Vanuatu up to 10 1.3 6.0
Federated States of Micronesia - 0.7 9.0
French Polynesia up to 10 48.4 98.0
Samoa - 13.5 22.0
Total 114 413 Source: WSHPDR 2019 3
Figure 2. Utilized small hydropower potential by country in the PICTs (local SHP definition) (%)
Additional SHP potential
Installed SHP capacity
0
20
40
60
80
100
Fiji
Sam
oa
Fren
ch P
olyn
esia
Vanu
atu
Papu
a Ne
w G
uine
a
New
Cal
edon
ia
Fede
rate
d St
ates
of M
icro
nesi
a
Solo
mon
Isla
nds
TOTA
L
Source: WSHPDR 20193
Note: This Figure illustrates data for local SHP definitions or the definition up to 10 MW in case of the absence of an official local one.
An overview of SHP in the countries of the PICTs region is outlined below. The information below summarizes the content of each country report providing inputs on SHP development status of those countries.
The SHP installed capacity in Fiji is 11.2 MW, representing a 7 per cent increase compared to the WSHPDR 2016. There are ten SHP plants in operation with the most recent commissioned in 2017 (700 kW Somosomo SHP). The hydropower potential available is about 14 MW of which approximately 80 per cent has been developed. Small and micro-hydropower projects are also considered for development of rural electrification under the Rural Electrification Policy. The Government of Fiji supports renewable energy development as an alternative way to provide cost-effective energy supply. In addition to hydropower, solar, wind power and biomass projects have been developed, with one of the most recent projects being the Nabou 12 MW biomass plant commissioned in 2017.
Since the WSHPDR 2016, the installed SHP capacity of New Caledonia has remained unchanged at 9.9 MW, provided by 11 plants ranging from 26 kW to 7.2 MW. The Yaté dam is the major hydropower plant of New Caledonia and the only large hydropower plant with a total capacity of 68 MW. The total potential of SHP is estimated to be between 100 MW and 250 MW. SHP development is currently under consideration, with an ongoing project of a 3 MW SHP plant in Pouébo planned to be commissioned in September 2019. Future hydropower development is recommended to focus on reservoir rather than run-of-river type due to the relatively steep terrain and unsteady precipitation patterns. According to the Energy Transition Plan, the share of renewable energy in electricity generation in the country should reach 100 per cent by 2030. Among renewable energy sources, the efforts are focused on solar and wind power, with likely development of 95 MW and 20.4 MW respectively, by 2020.The installed capacity of SHP in Papua New Guinea stands at 29.1 MW, which indicates a small increase compared to the

212
World Small HydropoWer development report 2019
WSHPDR 2016, mainly due to availability of more accurate data. The SHP potential is estimated to be about 153 MW. This includes at least 6 MW of capacity in the capacity range of 1 MW to 10 MW as well as 500 micro-hydropower sites with an average capacity of 22 kW. The development of hydropower has been prioritized in the country’s energy sector strategy as an important energy source to replace thermal power generation and reduce dependence on fossil fuel imports. The 2010-2030 Development Strategic Plan of PNG set the target of achieving 1,020 MW of hydropower installed capacity by 2030 while only 500 MW for all other renewable energy sources combined and 390 MW for gas. Currently, there is an SHP project of 3 MW under development at Popondetta, Oro.
The installed capacity of SHP in the Solomon Islands has remained unchanged since the WSHPDR 2016 and stands at 285 kW. There are 14 hydropower plants with capacities up to 150 kW, six of which are currently in operation. The Government database of SHP sites comprises 100 potential locations of which 62 have an estimated overall capacity of 11 MW.
The installed capacity of SHP in Vanuatu has remained at 1.28 MW. The most significant plant in operation is the 1.2 MW Sarakata SHP. The estimated potential of the country is about 5.98 MW, showing that 21.4 per cent has been developed. At the time of writing of the present report, two hydropower projects were underway, the construction of a 600 kW Sakatra SHP extension and bidding for the construction of the Brenwe SHP (<1.2 MW). The energy system of Vanuatu is highly reliant on fossil fuel imports, exposing it to fuel price volatility and supply disruptions. However, the country is rich in renewable energy resources, including hydropower, wind, solar and geothermal power, which could help reduce the reliance on imported fuel.
The Federated States of Micronesia have one SHP plant in Pohnpei. The original installed capacity of this plant was 2.1 MW. However, during the rehabilitation in 2014, only 725 kW were reinstalled and are running to date. The potential of SHP in the country is estimated to be 9 MW, indicating that approximately 8 per cent has been developed. There is a plan to develop a 2.7 MW hydropower plant at Lehnmesi in Pohnpei by 2023.
The installed capacity of SHP in French Polynesia is 48 MW, indicating a slight increase compared to the WSHPDR 2016. The potential capacity is estimated at 98 MW, of which 49 per cent has been developed. Most of the installed capacity is located on the island of Tahiti (47.2 MW) and the capacity of the Marquesas Islands amounts to 1.2 MW. Studies have been carried out to expand the capacity of the existing ageing plants such as the Vaihiria and Vaite SHPs. In addition to hydropower, there is also a significant potential for solar power. The Government aims to achieve 50 per cent of electricity generation from renewable energy sources by 2020 and 100 per cent by 2030. However, the development of renewable energy projects has been modest due to the lack of power regulations.
Figure 3. Change in installed capacity of small hydropower from WSHPDR 2013 to 2019 by country in the PICTs (MW)
0.0
20.0
40.0
60.0
80.0
100.0
120.0
140.0
WSHPDR 2019
WSHPDR 2016
WSHPDR 2013
48.4
29.1
13.5 11.2 9.91.3 0.7 0.3
114.4
Fren
ch P
olyn
esia
Papu
a Ne
w G
uine
a
Sam
oa Fiji
New
Cal
edon
ia
Vanu
atu
Fede
rate
d St
ates
of M
icro
nesi
a
Solo
mon
Isla
nds
TOTA
L
Source: WSHPDR 2013,1 WSHPDR 2016,2 WSHPDR 20193
Note: WSHPDR stands for World Small Hydropower Development Report. For all countries, data is for SHP up to 10 MW.
213
5.2. PIC
Ts
There are seven small-scale hydropower plants in Samoa. Their total installed capacity is 13.5 MW while the potential is around 22 MW. Compared to the WSHPDR 2016, installed capacity increased by 13 per cent as a result of the commissioning of two new plants and availability of more accurate data. In 2017, rehabilitation of three plants damaged during Cyclone Evan of 2012 was completed. There are plans to continue the development of hydropower, including the installation of a third turbine at Taelefaga SHP increasing its capacity to 6 MW, the installation of 0.2 MW Faleata SHP and Afiamalu mixed generation plant with 10 MW of wind power and 10 MW of pumped-storage hydropower.
International finance plays an important role for the SHP development in the PICTs region. Feed-in tariffs (FITs) have been introduced only in Vanuatu, where the offered scheme is limited only to solar power. However, the National Energy Policy of PNG set the target to outline incentives for renewable energy development such as FITs.
Barriers to small hydropower development
Despite numerous developmental efforts, several challenges hinder the further development of SHP in the PICTs region. Finance is a major barrier to the implementation of projects in the region. Many of the countries have unreliable financing mechanisms, lack feed-in-tariff regulations, do not possess site-specific water data, lack land and water regulations and have unrealistic land compensation fees, as well as high upfront capital costs. Additionally, the region has topographical limitations, protected archaeological and ecological sites, climate destabilization due to climate change and issues over land ownership. The PICTs have also expressed a strong need to develop local skills during all phases of SHP project development, from reconnaissance surveys to concept design, feasibility studies, construction, commissioning and operation.
In addition to the above-mentioned limitations, hydropower development in Fiji is also hindered by the absence of an SHP industry in neighbour countries. Moreover, potential SHP sites are located in remote rural areas where local economy is fragile making SHP schemes unaffordable.
Other major barriers to SHP development in New Caledonia include environmental constraints and tribal land protection by law representing most of New Caledonian territory, where land acquisition and water rights are almost impossible.
SHP development in Papua New Guinea is hindered by the mountainous terrain, a small population and isolated communities, as well as a lack of funding either from the Government or from development programmes and donors in the region.
The barriers to the expansion of SHP in the Solomon Islands include the lack of a standardized process for land acquisition for electrical distribution extensions and mini-grids, an outdated regulatory framework and the need to strengthen the planning, management and institutional capacity.
In Vanuatu, SHP development is also hindered by the extreme weather conditions, lack of regulation of technical specifications in particular for the power grid connection as well as the challenge of transporting electricity from renewable energy to the communities living in more than 80 non-interconnected islands.
The development of hydropower in the Federated States of Micronesia, similar to other countries/territories of the region, requires assistance with data collection, funding and site-specific impact assessments. In addition, the reservoir used by the only existing hydropower plant is also used to supply water to the population. As a result, at certain times the plant has to cease operation to meet urban water demand.
In French Polynesia, policies and unclear strategy for the renewable energy implementation have slowed down the development of hydropower. Another challenge is to comply with the environmental and financial requirements for the projects. Certain valleys with hydropower potential are inhabited by protected species and contain archaeological sites.
The key barriers to SHP development in Samoa are the low accuracy and reliability of available data, lack of a defined framework for sector governance, planning, coordination, implementation and monitoring of projects and resistance of local communities. In addition, the load factors on existing hydropower plants are decreasing due to climate change and in part due to the removal of vegetation in the catchments.
On the technical side, PICTs have expressed their strong need in developing local skills during all phases of SHP projects development from reconnaissance survey towards concept design, feasibility studies, construction, commissioning and operation. This is to guarantee local capacity building and sustainable maintenance of existing and future plants. For micro-hydropower projects, which are mostly remote and off-grid, community approaches will ensure sustainable rural electricity access.

214
World Small HydropoWer development report 2019
Even though the general trend is to reduce dependence of fossil fuel imports and consumption, it is important that PICTs do not divert from their clean energy goals to reduce and annihilate energy production impacts on their fragile and unique ecosystems.
References
1. LIU, H., Masera, D. and Esser, L., eds. (2013). World Small Hydropower Development Report 2013. United Nations Industrial Development Organization; International Center on Small Hydro Power. Available from www.smallhydroworld.org.
2. Xialei, C., Singh, P. R., Xianlai, W., and Kremere, E., eds. (2016). World Small Hydropower Development Report 2016. United Nations Industrial Development Organization; International Center on Small Hydro Power. Available from www.smallhydroworld.org.
3. LIU, D., LIU, H., WANG, X., and Kremere, E., eds. (2019). World Small Hydropower Development Report 2019. United Nations Industrial Development Organization; International Center on Small Hydro Power. Available from www.smallhydroworld.org.
4. World Bank (2017). Rural population (% of total population). Available from https://data.worldbank.org/indicator/SP.RUR.TOTL.ZS
5. World Bank (2016). Access the electricity (% of population). Available from https://data.worldbank.org/indicator/EG.ELC.ACCS.ZS

215
5.2. PIC
Ts
Fijianare matakiviti, IUCn oceania Energy; and International Center on Small Hydro power (ICSHp)*
Key facts
Population 905,502 1
Area 18,333 km2
Climate
The climate is generally categorized as an oceanic tropical marine climate. It is usually hot and wet during the months of November to April and cool and dry from May to October. In the capital city of Suva, average summer temperatures fluctuate around 29 °C and winter temperatures normally do not fall below 20 °C. Inland areas lying at higher elevations experience lower temperatures.2
Topography Fiji is an archipelago consisting of 300 islands and 540 islets, of which approximately 100 are inhabited. The large islands are volcanic with high mountain ranges. The main island, Viti Levu, is crossed by a mountain range running from north to south with several peaks above 900 metres. The highest point is Mount Tomanivi at 1,324 metres above sea level. Although they account for less than one-fifth of the area of Viti Levu, coastal plains in the west, north-west and south-east are the main centres of settlement and agriculture.2
Rain pattern Most precipitation falls from November to April. Rain can be quite torrential and flooding usually occurs. Hurricanes are also experienced once every few years. Annual rainfall on the main islands ranges between 2,000 and 3,000 mm in low-lying areas to some 6,000 mm in the mountainous areas. Typically, the smaller islands receive less rainfall than the two main islands of Viti Levu and Vanua Levu. Rainfall in the smaller islands ranges between 1,500 and 3,500 mm.2,3
Hydrology On Viti Levu, the main river systems are the Rewa, Navua, Sigatoka and Ba. The Rewa is navigable for 113 km. The main river on Vanua Levu is the Dreketi.2,3
Electricity sector overview
In 2016, electricity generation was 934 GWh, of which hydropower accounted for 53 per cent, thermal power (diesel and heavy fuel oil) accounted for more than 45 per cent and wind power accounted for 0.4 per cent (Figure 1). In addition, some 10.6 GWh, or slightly more than 1 per cent, was generated by independent power producers (IPPs), namely the Tropik Wood Industries Limited (TWIL) and Fiji Sugar Corporation (FSC).4 1
Figure 1. Annual electricity generation by source in Fiji (GWh)
0 100 200 300 400 500
Hydropower
HFO
Diesel
IPP
Wind power
495.5
291.6
132.9
10.6
3.6
Source: EFL4
In 2016, installed capacity was 316 MW, with 52 per cent from diesel, 41 per cent form hydropower and 7 per cent from
* WSHPDR 2016 updated by ICSHP
biomass and wind power combined (Figure 2).5 Fiji is heavily reliant on imported petroleum products to meet its energy needs as well as annual rainfall for hydropower generation. In 2016, approximately 99 per cent of the population of Fiji had access to electricity, both in rural and urban areas.6 In December 2017, 182,439 customer accounts were connected to the grid, consisting of 147.2 km of 132kV transmission lines, 534.86 km of 33kV sub-transmission lines and 9,515.37 km of 11kV and 415V/240V distribution lines.5
Figure 2.Installed electricity capacity by source in Fiji (MW)
130.0
164.9
21.0
Diesel
Hydropower
Biomass &Wind power
Source: Parliament of the Republic of Fiji5
The Fiji Electricity Authority (FEA) is a state-owned electricity utility that was established under the Electricity Act 1966 to own and operate the electricity infrastructure, including generation and the transmission and distribution network. In 2018, it was renamed Energy Fiji Limited (EFL) following its conversion to a public company limited by shares. EFL will remain the sole retail seller of electricity and the only
5.2.1
World Small HydropoWEr dEvElopmEnt
rEport 2019

216
network company in Fiji. It is also authorized to generate electricity. However, in line with the Electricity Act 2017, new generation capacity projects are now subject to a competitive tender process, under which EFL will have to compete with individual power producers (IPPs).7
Given this monopoly status of EFL in the supply of electricity in Fiji, electricity tariff rates are subject to price control by the Commerce Commission under the Commerce (Control of Prices for the Supply of Electricity and Ancillary Services) Order 2012. These include:• Domestic tariff: Customers are charged a lifeline tariff. For
customers consuming less than 100 kWh per month and with a combined household income of less than or equal to FJD 30,000 (US$ 14,244) per year, it is 0.159 FJD/kWh (0.075 US$/kWh). For customers not qualifying for the subsidy, it is 0.331 FJD/kWh (0.160 US$/kWh);8
• Small business tariff: For business whose maximum demand is less than 75 kW. Customers are charged 0.399 FJD/kWh (0.190 US$/kWh) for the first 14,999 kWh and 0.418 FJD/kWh (0.200 US$/kWh) for each unit above this threshold;9
• Maximum demand tariff: For business whose demand ex-ceeds 75 kW. Customers are charged for the total amount of electricity consumed, plus a demand charge. The de-mand charge ranges from 34.39 FJD/kW (16.33 US$/kW) for those whose demand is less than 500 kW to 38.19 FJD/kW (18.13 US$/kW) for those whose demand exceeds 1,000 kW. For the total amount consumed, the charge ranges from 0.271 FJD/kWh (0.100 US$/kWh) to 0.318 FJD/kWh (0.150 US$/kWh);10
• Other tariffs: For institutions and street lights. Customers include places of worship, primary and secondary schools. Schools are charged 0.206 FJD/kWh (0.098 US$/kWh) for the first 200 kWh per month and 0.331 FJD/kWh (0.160 US$/kWh) for every kWh above 200 kWh. The charge for places of worship and street lights is 0.331 FJD/kWh (0.160 US$/kWh).,11
Small hydropower sector overview
There is no uniform definition of small hydropower (SHP) in Fiji. For the purpose of this report, SHP plants have been classified as those with a capacity of 10 MW and below. The installed capacity of SHP in Fiji is approximately 11 MW, while the hydropower potential is estimated to be 14 MW.12,13,14 This indicates that approximately 80 per cent of the potential has been developed. Compared to the World Small Hydropower Development Report (WSHPDR) 2016, installed capacity increased by approximately 7 per cent as a result of the commissioning of a new plant in 2017, while potential capacity remained unchanged (Figure 3).
There are 10 SHP operating in Fiji with a combined capacity of 11.2 MW (Table 1). The most recent plant, the 700 kW Somosomo SHP on Taveuni Island near Vanua Levu, was commissioned in 2017. The biggest of the SHP plants, Wanikasou SHP with a capacity of 6.5 MW, started operating in 2004.
Figure 3. Small hydropower capacities 2013/2016/2019 in Fiji (MW)
0 3 6 9 12 15
PotentialCapacity
Installed Capacity
14.0 14.0 14.0
11.2 10.5 10.0
WSHPDR 2019WSHPDR 2016WSHPDR 2013
Source: IRENA,12 FBC,13 WSHPDR 2016,14 WSHPDR 201315
Note: The comparison is between data from WSHPDR 2013, WSHPDR 2016 and WSHPDR 2019.
Table 1.Small hydropower plants in Fiji
Project Capacity (kW)
Location (Island)
Year installed
Wanikasou 6,500 Viti Levu 2004
Vaturu 3,000 Viti Levu 2004
Wainieqeu 800 Vanua Levu 1992
Somosomo 700 Taveuni 2017
Bukuya 100 Viti Levu 1982
Muana 30 Vanua Levu 1999
Buca 30 Vanua Levu 2012
Kaduva koro 20 Kadavu 1994
Nasoqo 4 Viti Levu 1984
Vatukarasa 3 Viti Levu 1993
Total 11,187 Source: IRENA,12 FBC13
Through the Department of Energy, over 100 potential hydropower sites have been identified and preliminary assessments have been carried out at a number of the sites. Small and micro-hydropower projects are included as options for rural electrification schemes under the Fiji Government’s Rural Electrification Policy. Rural electrification schemes are heavily subsidized by the Government, with communities being required to pay a 5 per-cent contribution, while the Government pays the balance. In the last 30 years, only eight SHP plants were built, which is attributed mainly to the high costs associated with the construction of hydropower plants. In most cases, the Government’s contribution for a hydropower installation is usually met by a donor agency.14
Renewable energy policy
Fiji has a number of renewable energy sources that have the potential to be developed into power projects. Solar energy is in abundance and a number of solar PV projects, both off- and on-grid, have been installed, with the former used mainly for rural electrification. There is a 10 MW wind farm connected to the national electricity grid and managed by

217
5.2. PIC
Ts
EFL. Biomass energy, in particular bagasse and woodchips, is also used to generate power and feed into the national electricity grid. Both plants are operated by independent power producers with the bagasse-fed plant operated by the Fiji Sugar Corporation and the woodchip-fired plant operated by Tropic Wood Fiji Ltd.14 In 2017, the 12 MW biomass plant was commissioned in Nabou, Sigatoka. It is operated by the first major IPP of Fiji, Nabou Green Energy Limited.16
The 2013 National Energy Policy (NEP) of Fiji provides guid-ance for the development of the country’s energy sector pro-moting affordable and sustainable energy. The policy focuses on seven key areas:• Governance and institutional strengthening;• Grid-based power supply;• Rural electrification;• Renewable energy;• Transport;• Petroleum and biofuels;• Energy efficiency.17
The Government sees renewable energy technologies as a solution for providing in many cases the most cost-effective energy services and supports the development of renewable energy sources. It aims to facilitate the sustainable production and management of solar power and off-grid electrification systems, including solar home systems, solar pump water supply systems, solar systems for schools and clinics and solar water heating systems for homes and institutions, with particular focus on rural communities.17
Investors in renewable energy projects can enjoy a number of incentives offered by the Government:• For biofuel producers – a ten-year tax holiday, the du-
ty-free importation of machinery and equipment for the initial establishment of the factory, and duty-free importa-tion of chemicals required for biofuel production;
• Renewable energy projects and power cogeneration – five-year tax holiday (paying only VAT);
• Energy efficient equipment – five-year tax incentive (pay-ing only VAT) for imported energy efficient equipment, in-cluding energy saving lights, bicycles and other electrical appliances and materials;
• Renewable energy equipment – a five-year tax incentive (paying only VAT) for imported renewable energy equip-ment, including solar, hydropower, biomass, biogas, wind, solar water heaters, solar water pumps and geothermal.17
Barriers to small hydropower developmentIn addition to the high costs of hydropower development in Fiji, other socioeconomic and environmental considerations also contribute to the slow uptake. The major barriers hindering the development of small and micro-hydropower projects are outlined below.• Limited resources to undertake full feasibility studies of
identified sites;• The absence of a viable financing mechanism;
• The absence of an SHP industry in neighbouring countries;• Extreme climatic events (heavy and intense rainfall, floods,
cyclone, landslides, etc.), which make monitoring and site assessment challenging as they are time and resource con-suming;
• A Lack of incentives for private sector participation in assessment and development of sites as well as a lack of interest in project implementation;
• Limited access to finance for private project developers, with loans being very difficult to obtain, high interest rates and minimal Government support;
• The Location of most potential SHP projects in unproduc-tive areas such as subsistence communities with limited and uncertain cash incomes, making schemes unafford-able;
• The absence of an appropriate economic policy to support SHP development;
• Land tenure issues, with landowners demanding unrealis-tic resource use compensations;
• Potential impacts on resources for cultural purposes sometimes act as a deterrent for the use of sites
• A lack of technical expertise and resources to handle new technologies;
• Insufficient incentives for a wider participation of the pop-ulation in renewable electricity generation.14
References
1. World Bank (2017). Fiji. Population, total. Available from https://data.worldbank.org/indicator/SP.POP.TOTL?locations=FJ
2. Encyclopaedia Britannica (2018). Fiji. Available from https://www.britannica.com/place/New-Zealand
3. Fiji Meteorological Service (2006). The Climate of Fiji. Available from http://www.met.gov.fj/ClimateofFiji.pdf
4. Energy Fiji Limited (EFL) (2017). Annual report 2016. Available from http://efl.com.fj/wp-content/uploads/2017/08/fea-annual-report-2016.pdf
5. Parliament of the Republic of Fiji (2018). Report on Fiji Electricity Authority Annual Report 2016. Parliamentary Paper No. 103 of 2017. Available from http://www.parliament.gov.fj/wp-content/uploads/2018/03/FEA-2016.pdf
6. World Bank (2017). Fiji. Access to electricity (% of population). Available from https://data.worldbank.org/indicator/EG.ELC.ACCS.ZS?locations=FJ
7. Energy Fiji Limited (EFL) (2018). Energy Fiji Limited (Previously, the Fiji Electricity Authority). Offer Document. An offer of Non-Voting Shares in the capital of Energy Fiji Limited. Available from http://efl.com.fj/wp-content/uploads/2018/04/offer-letter.pdf
8. Energy Fiji Limited (EFL) (n.d.). Electricity Tariffs and Rates. Domestic Tariff. Available from http://efl.com.fj/your-home/electricity-tariffs-and-rates/
9. Energy Fiji Limited (EFL) (n.d.). Electricity Tariffs and Rates. Small Business Tariffs. Available from http://efl.com.fj/your-business/electricity-tariffs-and-rates/small-business-tariffs/
10. Energy Fiji Limited (EFL) (n.d.). Electricity Tariffs and Rates. Maximum Demand Tariffs. Available from http://efl.com.fj/your-business/electricity-tariffs-and-rates/maximum-demand-tariffs/
11. Energy Fiji Limited (EFL) (n.d.). Electricity Tariffs and Rates.

218
World Small HydropoWer development report 2019
Other Tariffs. Available from http://efl.com.fj/your-business/electricity-tariffs-and-rates/other-tariffs/
12. International Renewable Energy Agency (2015). Renewable Readiness Assessment Report. Available from http://www.irena.org/DocumentDownloads//Publications/IRENA_RRA_Fiji_2015.pdf
13. Fiji Broadcasting Corporation (FBC) (2017). Somosomo hydro power station to save government millions. 3 March 2012. Available from http://www.fbc.com.fj/fiji/48680/sososomo-hydro-power-station-to-save-government-millions
14. Xialei, C., Singh, P. R., Xianlai, W., and Kremere, E., eds. (2016). World Small Hydropower Development Report 2016. United Nations Industrial Development Organization; International Center on Small Hydro Power. Available from www.smallhydroworld.org
15. Liu, H., Masera, D. and Esser, L., eds. World Small Hydropower Development Report 2013, United Nations Industrial Development Organization; International Center on Small Hydro Power
16. Nabou Green Energy (n.d.). Official website. Available from http://ngel.com.fj/
17. Investment Fiji (n.d.). Energy. Available from http://www.investmentfiji.org.fj/pages.cfm/for-investors/sector-industry-profiles/energy.html

219
5.2. PIC
Ts
New Caledonia Bastian morvan, department of Industry, mines and Energy; and International Center on Small Hydro power (ICSHp)
Key facts
Population 280,460 1
Area 19,103 km2
Climate The climate is subtropical and is influenced by the annual changes in the position of the subtropical high-pressure belt and bass intertropical pressures. There are two main seasons and two inter-sea-sons – a hot and humid hurricane season (November to April), a transitional season (April to May), a cold season with westerly winds (May to September) and a dry season with constant trade winds (September to November). Mean annual temperatures are between 22 °C and 24 °C. In the south of the island of New Caledonia, temperatures can exceed 30 °C. The lowest temperature registered in the capital city, Nouméa, is 13 °C, while in the north temperatures as low as 5 °C can occur.2,3
Topography New Caledonia consists of a group of islands – the island of New Caledonia, where the capital Nouméa is located, the Loyalty Islands, the Bélep Islands, the Île des Pins and a number of uninhabited islets. The island of New Caledonia is by far the largest island of the group and is 50 km wide and 500 km long. The island is divided into the eastern and western parts by rugged mountains running north-south. Most of the southern third of the island is characterized by a plateau, which rises to 1,617 metres at Mount Humboldt. The highest peak of New Caledonia, Mount Panié, reaches 1,628 metres and lies in the north-east of the main island.3
Rain pattern Precipitation happens throughout the year and ranges from less than 1,000 mm on the west coast to more than 3,000 mm on the east coast of the main island. Rainstorms are particularly common on the east coast. There are two particularly rainy periods, from December to March and from July through August. September through November are the driest months.3
Hydrology The longest river in the country is the Diahot River, which flows northwards on the main island for approximately 100 km along the western escarpment of the Mount Panié range. There are also nu-merous streams descending from the central mountain chain. They tend to flood rapidly after rainfall and dry out in dry weather.3
Electricity sector overview
In 2017, the total installed capacity of New Caledonia was 958.8 MW (Figure 1).4 The country’s energy mix has been dominated by thermal power, which in 2017 accounted for almost 85 per cent of total installed capacity. Hydropower is the most developed source of renewable energy, accounting for 8 per cent of total installed capacity, followed by wind power at 4 per cent, solar power at almost 3 per cent and biomass at 0.04 per cent. Between 2012 and 2015, the combined installed capacity of thermal power plants more than doubled, which was mainly due to the introduction of the Koniambo Nickel SAS (KNS) thermal plant with a capacity of 360 MW (270 MW of coal and 90 MW of diesel).5,6
Electricity generation in 2017 reached 3,228 GWh, with 86.5 per cent coming from thermal power plants, 11.2 per cent from hydropower plants, 1.4 per cent from wind farms, al-most 0.9 per cent from solar power plants and 0.01 per cent from biomass (Figure 2).4
In 2016, 100 per cent of the population, both in rural and urban areas, had access to electricity.7 Electricity
consumption in 2017 stood at 3,161 GWh, of which only 767 GWh (23 per cent) was for public consumption from the grid, whereas the remaining 2,394 GWh (76 per cent) was used by the metallurgical and mining industry.4 Thus, electricity generation in New Caledonia, is closely linked to the industry, particularly nickel extraction and processing, providing electricity to the three major nickel plants – Koniambo Nickel SAS, Doniambo of the Société Le Nickel (SLN) and Vale Nouvelle-Calédonie (VNC).
Apart from the metallurgical sector, the electricity sector is composed of La Société Néo-Calédonienne d’Energie (ENERCAL), which is the largest electricity producer in the country, owning the grid concession and most of hydropower plants. ENERCAL is mandated by the Government to manage the transmission network of the country. It purchases electricity from other electricity producers and transports it to the industrial consumers or to the distributing companies, which are EEC-Engie and ENERCAL itself.9 There are six grids in the country – one grid on the main island and five smaller island grids. The transmission network of the island
5.2.2
World Small HydropoWEr dEvElopmEnt
rEport 2019

220
World Small HydropoWer development report 2019
of New Caledonia consists of 560 km of 150 kV lines, 650 km of 33 kV lines and 16 substations.10
Figure 1. Installed electricity capacity by source in New Caledonia (MW)
0 200 400 600 800 1000
Thermal power
Hydropower
Wind power
Solar power
Biomass
814.8
78.1
37.6
27.9
0.4
Source: DIMENC4
Figure 2. Annual electricity generation by source in New Caledonia (GWh)
0 500 1000 1500 2000 2500 3000
Thernal power
Hydropower
Wind power
Solar power
Biomass
2,793.9
361.0
45.1
27.7
0.4
Source: DIMENC4
The Department of Industry, Mines and Energy of New Caledonia (Direction de l’Industrie, des Mines et de l’Energie de la Nouvelle-Calédonie, DIMENC) is the Government agency responsible for the development and enforcement of the regulatory framework for the electricity sector, overseeing electricity prices, ensuring the technical control of electricity lines in order to ensure a balance between the electricity demand and supply.11
Electricity tariffs are defined on a trimestral basis by the Government and are published in the Journal Officiel de la Nouvelle-Calédonie. The tariff system is uniform across the country, with prices varying depending on the type of consumption. The current electricity tariffs were established on 31 March 2015. They are 32.24 XPF/kWh (0.31 US$/kWh) for residential consumers and 22.01 XPF/kWh (0.21 US$/kWh) for industrial and commercial consumers.12
Small hydropower sector overview
In New Caledonia, small hydropower (SHP) is defined as hydropower plants with a capacity up to 10 MW. SHP plants are further classified into the categories of pico-hydropower (below 500 kW), micro-hydropower (500 kW to 2 MW) and small hydropower (2 MW to 10 MW).13
As of the end of 2017, the installed capacity of SHP in New Caledonia was 9.9 MW, while potential capacity is estimat-
ed at approximately 100 MW.4,13,14 Compared to the results of the World Small Hydropower Development Report (WSH-PDR) 2016, both installed and potential capacity remained unchanged (Figure 3).
Figure 3. Small hydropower capacities 2013/2016/2019 in New Caledonia (MW)
0 20 40 60 80 100
PotentialCapacity
Installed Capacity
100.0 100.0 27.1
9.9 9.9 9.4
WSHPDR 2019WSHPDR 2016WSHPDR 2013
Source: ISEE,4 WSHPDR 2016,13 ENERCAL,14 WSHPDR 201315
Note: The comparison is between data from WSHPDR 2013, WSHPDR 2016 and WSHPDR 2019.
There are 12 hydropower plants in New Caledonia, 11 out which are small-scale (Table 1). Three hydropower plants, Yaté, Néaoua and Thû, are connected to the grid, and two of which are of a reservoir type. The Yaté hydropower plant is the major hydropower plant of New Caledonia and the only large hydropower plant, with a capacity of 68 MW. It was commissioned in 1958, has four Francis turbines of 17 MW each and a 40 km2 reservoir with a storage capacity of 310 million m3. Approximately 90 per cent of electricity generated by this plant is consumed by the SLN metallurgic plant and only 10 per cent is used for public distribution. The Néaoua hydropower plant was introduced in 1983, has a reservoir with a capacity of 1.75 million m3 and two turbines of 3.6 MW each. Electricity generated by it is fed into the grid for public consumption. The Thû hydropower was commissioned in 1991 and is a run-of river plant with one Pelton turbine of 2.2 MW.16
Table 1.Small hydropower plants up to 10 MW in New Caledonia
Name Location Installed capacity (kW)
Néaoua Houaïlou 7,200
Thû Houaïlou 2,200
Ouégalé Pouébo 147
Gohapin Poya 62
Borendy Thio 60
Caavatch Hienghène 56
Pouébo Pouébo 56
Wadiana Yaté 49
Katricoin Moindou 30
Kouaré Thio 27
Wadding Pouembout 26
Total 9,913 Source: WSHPDR 2016,13 ENERCAL14

221
5.2. PIC
Ts
The remaining nine plants are classified as micro-hydropower plants and range in capacity from 26 kW to 147 kW. They are of a run-of-river type and are not connected to the grid, providing electricity to the isolated areas of the country. In 2016, these nine plants generated 316 kWh of electricity.17 The installed capacity of all small hydropower plants in New Caledonia has remained unchanged for a few decades, however further SHP development is currently under consideration. For example, there is a 3 MW SHP project in Pouébo, which is planned to be commissioned in September 2019.18 The total potential of SHP in New Caledonia is estimated to be between 100 MW and 250 MW.13 However, the Research and Development Institute (IRD) has recommended that the focus in hydropower development in New Caledonia should be made on reservoir plants rather than run-of-river plants due to the relatively steep relief and precipitation patterns of New Caledonia.13,19
Renewable energy policy
Renewable energy is seen as a way to reduce the country’s dependency on fossil fuel imports. In 2016, New Caledonia adopted the Energy Transition Plan (Schéma pour la transi-tion énergétique), which set the following three objectives to be achieved by 2030:• Decrease in energy consumption by 20 per cent for
primary energy consumption (including the mining and metallurgical sector) and by 25 per cent for final energy consumption (excluding the mining and metallurgical sector).
• Double the share of renewable energy in public consumption to 100 per cent and reach 100 per cent of electricity generation on the islands from renewable energy sources.
• Decrease in emissions by 35 per cent in the residential and tertiary sectors, by 10 per cent in the mining and metallurgical sector and by 15 per cent in the transportation sector.16
The transitional energy mix is expected to keep relying on thermal power for the base load, but also optimize stable renewable energy sources (hydropower, biomass) and develop intermittent renewable energy sources (solar and wind), as well as develop energy storage solutions. Thus, among renewable energy sources, the focus in terms of development is made on solar and wind power, planned to see 95 MW and 20.4 MW of additional capacity by 2020, respectively.16,20 The Plan recognizes that the development of renewable energy sources in New Caledonia requires improving the local technical and economic capacity to adopt renewable energy as well as developing services of support in order to stimulate demand and investment in the renewable energy sector. Another measure covered in the Plan is decentralization of electricity production and the promotion of self-generation.9
Since 2016, four Government orders have opened the scheme of self-generation from solar power to individuals (individual and collective habitats), professionals and communities. The objective is to favour self-consumption, with a possible resale
of the surplus at a price of 21 XPF/kWh (0.21 US$/kWh). Since 2006, 700 authorizations have been issued, which represents a total installed capacity of 6 MW.21
Barriers to small hydropower developmentThe major barriers to small hydropower development in New Caledonia include:• Environmental constraints;• Investment costs;• Protection by law of tribal lands, which represent most of
the land of New Caledonia, and where acquisition of land and water rights is not allowed.13,16
References
1. World Bank (2017). New Caledonia. Population, total. Available from https://data.worldbank.org/indicator/SP.POP.TOTL?locations=NP
2. Romieux, N. (2011). Synthèse et régionalisation des données pluviométriques de la Nouvelle Calédonie. Direction des Affaires Vétérinaires, Alimentaires et Rurales. Availble from https://davar.gouv.nc/sites/default/files/atoms/files/synthese_et_regionalisation_des_donnees_pluviometriques_de_la_nouvelle-caledonie.pdf
3. Encyclopaedia Britannica (2018). New Caledonia. Available from https://www.britannica.com/place/New-Caledonia-French-unique-collectivity-Pacific-Ocean#ref53927
4. Direction de l’Industrie, des Mines et de l’Energie de la Nouvelle-Calédonie (DIMENC) (2018). Rapport d’activité DIMENC – Service énergie – 2017. Available from http://www.observatoire-energie.gouv.nc/private/documents/RA-2017-stats.pdf
5. Institut de la statistique et des études économiques Nouvelle-Calédonie (ISEE) (2016). Energie – Envrionnement. La production d’électricité. Available from http://www.isee.nc/economie-entreprises/entreprises-secteurs-d-activites/energie-environnement
6. Maîtrise de l’Energie (2015). Production d’électricité en Nouvelle-Calédonie. Available from https://maitrise-energie.nc/sites/default/files/carte_prod_electricite_nc_2015.pdf
7. World Bank (2016). New Caledonia. Access to electricity (% of population). Available from https://data.worldbank.org/country/new-caledonia
8. Institut de la statistique et des études économiques Nouvelle-Calédonie (ISEE) (2016). Energie – Envrionnement. Le bilan énergétique. Available from http://www.isee.nc/economie-entreprises/entreprises-secteurs-d-activites/energie-environnement
9. La Société Néo-Calédonienne d’Energie (ENERCAL) (n.d.). Vision globale du système électrique. Available from https://www.enercal.nc/gestion-du-systeme-electrique/le-systeme-electrique-caledonien
10. La Société Néo-Calédonienne d’Energie (ENERCAL) (2018). Le Système Electrique Caledonien. Bilan 2017 Perspectives. Available from https://www.enercal.nc/gestion-du-systeme-electrique/bilans-annuels-du-systeme-electrique
11. Direction de l’Industrie, des Mines et de l’Energie de la Nouvelle-

222
World Small HydropoWer development report 2019
Calédonie (DIMENC) (n.d.). DIMENC. Présentation. Available from https://dimenc.gouv.nc/dimenc/presentation
12. La Société Néo-Calédonienne d’Energie (ENERCAL) (n.d.). Les tarifs Basse tension. Available from https://www.enercal.nc/les-tarifs/les-tarifs-basse-tension
13. Xialei, C., Singh, P. R., Xianlai, W., and Kremere, E., eds. (2016). World Small Hydropower Development Report 2016. United Nations Industrial Development Organization; International Center on Small Hydro Power. Available from www.smallhydroworld.org
14. La Société Néo-Calédonienne d’Energie (ENERCAL) (n.d.). ENERCAL, Gestionnaire du Système Electrique et transporteur. Available from https://www.enercal.nc/gestion-du-systeme-electrique/enercal-gestionnaire-du-systeme-electrique-et-transporteur
15. LIU, H., Masera, D. and Esser, L., eds. (2013). World Small Hydropower Development Report 2013, United Nations Industrial Development Organization; International Center on Small Hydro Power. Available from www.smallhydroworld.org
16. Government of New Caledonia (2015). Schéma pour la transition énergétique de la Nouvelle-Calédonie. Available from https://gouv.nc/sites/default/files/atoms/files/projet_de_schema_pour_la_transition_energetique_de_la_nouvelle-caledonie.pdf
17. Institut de la statistique et des études économiques Nouvelle-Calédonie (ISEE) (2016). Energie – Envrionnement. La production d’électricité. Available from http://www.isee.nc/economie-entreprises/entreprises-secteurs-d-activites/energie-environnement
18. La Société Néo-Calédonienne d’Energie (ENERCAL) (n.d.). Développer les énergies renouvelables. L’hydraulique. Available from https://www.enercal.nc/production-delectricite/developper-les-energies-renouvelables/lhydraulique
19. Le Bars, Y. et al. (2010). L’énergie dans le développement de la Nouvelle-Calédonie. Institut de Recherche pour le Développement
20. Government of New Caledonia (2018). Arrête portant modification de l’arrête n° 2016-1931/GNC du 13 septembre 2016 relatif à la programmation pluriannuelle des investissements de production électrique de la Nouvelle Calédonie sur la période 2016 à 2030. Available from https://dimenc.gouv.nc/sites/default/files/arrete_2018_1221.pdf
21. Direction de l’Industrie, des Mines et de l’Energie de la Nouvelle-Calédonie (DIMENC) (n.d.). Electricité. Available from https://dimenc.gouv.nc/energie/electricite
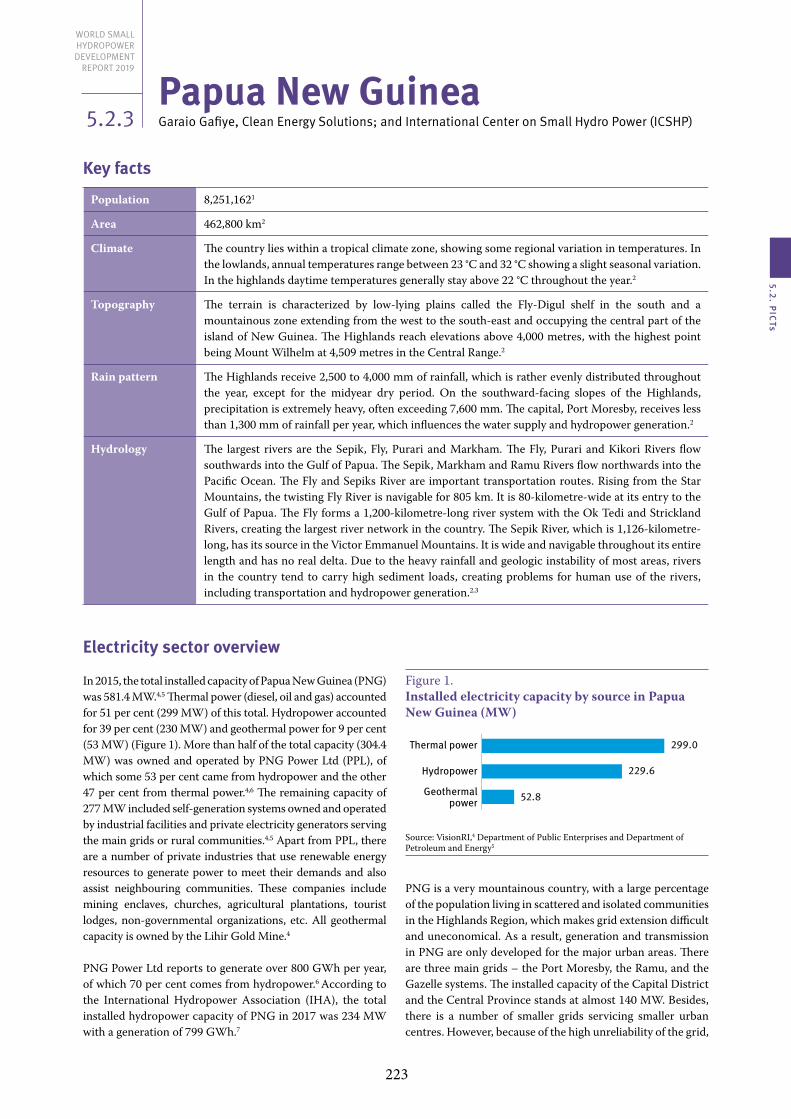
223
5.2. PIC
Ts
Papua New GuineaGaraio Gafiye, Clean Energy Solutions; and International Center on Small Hydro power (ICSHp)
Key facts
Population 8,251,1621
Area 462,800 km2
Climate The country lies within a tropical climate zone, showing some regional variation in temperatures. In the lowlands, annual temperatures range between 23 °C and 32 °C showing a slight seasonal variation. In the highlands daytime temperatures generally stay above 22 °C throughout the year.2
Topography The terrain is characterized by low-lying plains called the Fly-Digul shelf in the south and a mountainous zone extending from the west to the south-east and occupying the central part of the island of New Guinea. The Highlands reach elevations above 4,000 metres, with the highest point being Mount Wilhelm at 4,509 metres in the Central Range.2
Rain pattern The Highlands receive 2,500 to 4,000 mm of rainfall, which is rather evenly distributed throughout the year, except for the midyear dry period. On the southward-facing slopes of the Highlands, precipitation is extremely heavy, often exceeding 7,600 mm. The capital, Port Moresby, receives less than 1,300 mm of rainfall per year, which influences the water supply and hydropower generation.2
Hydrology The largest rivers are the Sepik, Fly, Purari and Markham. The Fly, Purari and Kikori Rivers flow southwards into the Gulf of Papua. The Sepik, Markham and Ramu Rivers flow northwards into the Pacific Ocean. The Fly and Sepiks River are important transportation routes. Rising from the Star Mountains, the twisting Fly River is navigable for 805 km. It is 80-kilometre-wide at its entry to the Gulf of Papua. The Fly forms a 1,200-kilometre-long river system with the Ok Tedi and Strickland Rivers, creating the largest river network in the country. The Sepik River, which is 1,126-kilometre-long, has its source in the Victor Emmanuel Mountains. It is wide and navigable throughout its entire length and has no real delta. Due to the heavy rainfall and geologic instability of most areas, rivers in the country tend to carry high sediment loads, creating problems for human use of the rivers, including transportation and hydropower generation.2,3
Electricity sector overview
In 2015, the total installed capacity of Papua New Guinea (PNG) was 581.4 MW.4,5 Thermal power (diesel, oil and gas) accounted for 51 per cent (299 MW) of this total. Hydropower accounted for 39 per cent (230 MW) and geothermal power for 9 per cent (53 MW) (Figure 1). More than half of the total capacity (304.4 MW) was owned and operated by PNG Power Ltd (PPL), of which some 53 per cent came from hydropower and the other 47 per cent from thermal power.4,6 The remaining capacity of 277 MW included self-generation systems owned and operated by industrial facilities and private electricity generators serving the main grids or rural communities.4,5 Apart from PPL, there are a number of private industries that use renewable energy resources to generate power to meet their demands and also assist neighbouring communities. These companies include mining enclaves, churches, agricultural plantations, tourist lodges, non-governmental organizations, etc. All geothermal capacity is owned by the Lihir Gold Mine.4
PNG Power Ltd reports to generate over 800 GWh per year, of which 70 per cent comes from hydropower.6 According to the International Hydropower Association (IHA), the total installed hydropower capacity of PNG in 2017 was 234 MW with a generation of 799 GWh.7
Figure 1. Installed electricity capacity by source in Papua New Guinea (MW)
229.6
299.0
52.8
Thermal power
Hydropower
Geothermalpower
Source: VisionRI,4 Department of Public Enterprises and Department of Petroleum and Energy5
PNG is a very mountainous country, with a large percentage of the population living in scattered and isolated communities in the Highlands Region, which makes grid extension difficult and uneconomical. As a result, generation and transmission in PNG are only developed for the major urban areas. There are three main grids – the Port Moresby, the Ramu, and the Gazelle systems. The installed capacity of the Capital District and the Central Province stands at almost 140 MW. Besides, there is a number of smaller grids servicing smaller urban centres. However, because of the high unreliability of the grid,
5.2.3
World Small HydropoWEr dEvElopmEnt
rEport 2019

224
World Small HydropoWer development report 2019
self-generation and backup generation play an important role in the country.4,5 Some communities (mostly Government and Mission institutions) have diesel systems, which have broken down or operate with rationed fuel. In total, approximately 77 per cent of the population have no access to electricity – in rural areas only 15 per cent have access to electricity, while in urban areas almost 73 per cent.7 The National Development Strategic Goals state that in 2030, the energy sector must cover 70 per cent of households and 100 per cent by 2050.5
Figure 2. Electrification rate in PNG (%)
Rural 15%Total 23%
Source: World Bank7
The electrification plans of PNG are supported by the Asian Development Bank through an active portfolio of US$ 240 million and proposed investments of US$ 493 million. The Town Electrification Programme aims to improve electricity supply in urban centres by extending the distribution network and adding renewable energy capacity. The first tranche of the planned funding covers the construction of 150-km 66 kV transmission lines connecting Bialla and Kimbe and the 3 MW Divune hydropower plant. The second tranche covers the construction of the 3 MW Ramazon hydropower plant in the Autonomous Region of Bougainville, the rehabilitation of the 18 MW Yonki Toe of Dam hydropower plant in Eastern Highlands Province and the 10 MW Warangi hydropower plant in East New Britain Province. In addition, the project is expected to support the development of the renewable energy policy framework and create an environment favourable for private investment in off-grid areas.8
The energy sector of PNG is regulated by the Department of Petroleum and Energy (DPE), which is in charge of legislation and policy framework for the implementation of the energy efficiency and energy conservation agendas. The Independent Consumer and Competition Commission (ICCC), under the ICCC Act and the PNG Electricity Act, is mandated to control, manage and monitor the enforcement of electrical safety and tariff setting requirements. PNG Power Ltd (PPL) is a state-owned power utility, which is responsible for electricity generation, transmission, distribution and retail. On behalf of the ICCC, PPL also undertakes a regulatory role, including approving licences for electrical contractors, providing certification for models of electrical equipment and appliances to be sold in the country and providing safety advise and checks for major installations.9
Acts of the Parliament that deal with energy issues include the following:
• The Electricity Supply Act, which outlines the powers of the Ministry for Energy in relation to generation, supply and extension of electricity from power facilities built with the Government funds;
• The Electricity Industry Act, which defines the functions and powers of PPL;
• The Independent Consumer and Competition Act, which regulates the electricity and petroleum sectors and pricing;
• The Independent Public Business Corporation Act, which states that the Government holds all shares of PPL;
• The Organic Law on Provincial Government and Local Level Government, which grants authority to 19 provin-cial and 299 local (district/sub-district) Governments to regulate the electricity sector;
• The Community Services Trust Act, which essentially re-quires PPL to supply services at subsidized rates to rural and low-income populations;
• The Environmental Act, which requires Environmental Impact Assessments (EIA) for certain energy investments.
In 2018, the electricity tariff, as set by the ICCC, stood at 0.70 PGK/kWh (0.22 US$/kWh) for general consumers and at 1.00 PGK/kWh (0.31 US$/kWh) for industrial consumers. How-ever, in March 2018, PPL called on the Government to reduce the tariffs by 50 per cent at least in order to make electricity affordable for a greater share of the population and reach the Government’s electrification targets.10
Small hydropower sector overview
The definition of small hydropower (SHP) in PNG is up to 10 MW. The installed capacity of SHP in PNG is 29.1 MW, while the potential is estimated to be 153 MW.4,5,11 This indicates that approximately 19 per cent has been developed. Since the World Small Hydropower Development Report (WSHPDR) 2016, no new SHP capacity was introduced (Figure 3).
Figure 3. Small hydropower capacities 2013/2016/2019 in Papua New Guinea (MW)
0 50 100 150 200
PotentialCapacity
Installed Capacity
153.0 153.0 153.0
29.1 29.0 20.2
WSHPDR 2019WSHPDR 2016WSHPDR 2013
Source: VisionRI,4 Department of Public Enterprises and Department of Petroleum and Energy,5 IJHD,11 WSHPDR 2016,12 WSHPDR 201313
Note: The comparison is between data from WSHPDR 2013, WSHPDR 2016 and WSHPDR 2019.
As of 2015, there were nine SHP plants operating in PGN (Table 1).4,5 The SHP potential is estimated at approximately 153 MW from more than 79 schemes.10 Thus, there remains a significant untapped potential for SHP development. In the capacity range of 1 MW to 10 MW, at least 6 MW of potential

225
5.2. PIC
Ts
capacity could be realized. Furthermore, 500 new micro-hy-dropower plants (<100 kW) with an average capacity of 22 kW could also be developed.12,13 The total hydropower poten-tial of PNG is estimated at some 15,000 MW, with consider-able potential concentrated on the Purari River in Western Province, the Brown River and the Vanapa River catchment in the Central Province, the Gumini potential in Milne Bay and Kimadan in New Ireland Province.5,14
Table 1.Small hydropower in Papua New Guinea (MW)
Plant name Capacity (MW) Owner Area supplied
Warongoi 10.00 PPL Gazelle Peninsula
Baiune/Bu-lolo 5.70 PNG Forest
ProductsPNGFP and town of Wau (Morobe)
Rouna 1 5.50 PPL National Capital District
Yuk Creek 2.40Ok Tedi Mining Limited
Ok Tedi Mine and communities in
North Fly District
Sinnumu Set 1.50 PPL National Capital District
Lake Hargy 1.50 PPL Bialla
Tolukuma 1.50 Tolukuma Mines Mine supply
Ru Creek 0.80 PPL Kimbe
Sohun 0.20 PG Namatanai
Total 29.10 Source: VisionRI,4 Department of Public Enterprises and Department of Petroleum and Energy5
The development of hydropower projects has been prioritized in the country’s energy sector development strategy as an important energy source to replace thermal power generation and reduce fossil fuel imports. The 2010-2030 Development Strategic Plan of PNG set the target of achieving 1,020 MW of hydropower installed capacity by 2030, while only 500 MW for all other renewable energy sources combined and 390 MW for gas. The new 800 MW was planned to come from the construction of new power plants or the upgrade of existing ones in five phases – 215 MW in 2010, 430 MW in 2015, 580 MW in 2020, 750 MW in 2025 and 1,020 MW in 2030.14 As of 2018, the 2015 target had not yet been achieved.
However, there are several hydropower projects under devel-opment, including:• 1,800 MW Karimui hydropower project in Chimbu, with
the completion date set for 2030;• 180 MW Ramu-2 hydropower project to be located near
Kainantu in Eastern Highlands Province;• 50 MW Edevu hydropower project in Kairuku-Hiri
District;• 3 MW Divune hydropower project at Popondetta, Oro.15
Renewable energy policy
There is currently no comprehensive renewable energy policy in place in PNG. However, the National Energy Policy 2016-2020, which is in line with Papua New Guinea’s Vision 2050, promotes the achievement of 100 per cent of electricity usage from renewable energy sources by 2050. The Policy sets out the national strategies for reforming the energy sector, opening up competition, setting new institutional and regulatory arrangements and restructuring of the sector including PPL, to be effective in serving the electricity needs of the majority of the population and the economy of PNG. The overall objective is to ensure an affordable, competitive, sustainable and reliable supply of energy to meet national and provincial development needs at least cost, while protecting and conserving the environment. The Policy aims to promote the development of abundant renewable energy resources available in the country and decrease its dependency on fossil fuel imports, which are making the country’s economy vulnerable to external shocks. The Policy identifies hydropower, including mini-hydropower, and solar power as appropriate options for the electrification of off-grid and rural areas. Other sources of renewable energy, such as biofuel, geothermal and wind power are also seen as important drivers of further economic growth.5
In order to support the development of SHP, the Policy fore-sees the following actions to be undertaken by the Govern-ment:• The promotion of investment in the infrastructure sector,
both new and existing;• The provision of adequate financial resources and technical
capacity to carry out feasibility studies and development of sites;
• The promotion of the collection and processing of a hydrological database;
• The mitigation and addressing of competing interests between the stakeholder’s sites (landowner issues);
• Promote participation in all power infrastructure projects.5
The National Energy Policy also sets the target for the Government to prepare a Renewable Energy Policy, which is to outline strategies for the development of each renewable energy source as well as incentives for their development, such as feed-in tariffs (FITs).5
The development and operation of SHP in PNG is affected by a number of regulations, including the Environment Act No. 64 of 2004, regulating any activities that may cause any impact on the environment. Under this Act, hydropower plants exceeding 2 MW and requiring any damming of a river or stream require permits and may require an EIA.12,16
Barriers to small hydropower developmentThe key barriers to SHP development in PNG are: • Small population and isolated communities;• Mountainous terrain;

226
World Small HydropoWer development report 2019
• High cost of dams, hydropower stations and transmission and distribution systems;
• A lack of local production of the hydropower equipment;• Land ownership issues, since; more than 90 per cent of the
land is privately owned, which restricts development;• The lack of a development plan;• The inability of communities to generate funds for SHP
projects;• Limited Government funding;• A lack of community awareness of existing funding pro-
grammes and donors in the region or outside of PNG.5,12
References
1. World Bank (2017). Papua New Guinea. Population, total. Available from https://data.worldbank.org/indicator/SP.POP.TOTL?locations=PG
2. Encyclopaedia Britannica (2018). Papua New Guinea. Available from https://www.britannica.com/place/Papua-New-Guinea
3. Nations Encyclopedia (n.d.). Papua New Guinea. Available from http://www.nationsencyclopedia.com/geography/Morocco-to-Slovakia/Papua-New-Guinea.html
4. VisionRI (2008). Papua New Guinea. Additional Power and Electricity Information. Available from https://dlca.logcluster.org/download/attachments/853888/3.6%20Additional%20Services%2C%20vDA.pdf?version=1&modificationDate=1454338751000&api=v2
5. Department of Public Enterprises and Department of Petroleum and Energy (2015). National Energy Policy 2016-2020. Available from http://prdrse4all.spc.int/system/files/national_energy_policy_19.07.2015v5_final_png.pdf
6. PNG Power Ltd (2017). Information Handbook 2017. Available from https://www.pngpower.com.pg/uploads/Information-Handbook-2017.pdf
7. World Bank (2016). Papua New Guinea. Access to electricity (% of population). Available from https://data.worldbank.org/indicator/EG.ELC.ACCS.ZS?locations=PG
8. Kapin, F. (2018). ADB’s Energy Support to PNG. Post-Courrier, 12 June 2018. Available from https://postcourier.com.pg/adbs-energy-support-png/
9. PNG POWER Ltd. (2012). About PPL. Available from http://www.pngpower.com.pg/about
10. Lavari, L. (2018). Cut rates, says PPL. The National, 22 March 2018. Available from https://www.thenational.com.pg/cut-rates-says-ppl/
11. The International Journal on Hydropower and Dams (2015). 2015 World Atlas & Industry Guide. Available from www.hydropower-dams.com
12. Xialei, C., Singh, P. R., Xianlai, W., and Kremere, E., eds. (2016). World Small Hydropower Development Report 2016. United Nations Industrial Development Organization; International Center on Small Hydro Power. Available from www.smallhydroworld.org
13. Liu, H., Masera, D. and Esser, L., eds. World Small Hydropower Development Report 2013, United Nations Industrial Development Organization; International Center on Small Hydro Power
14. Department of National Planning and Monitoring (2010). Papua New Guinea Development Strategic Plan 2010-2030. Available
from http://www.treasury.gov.pg/html/publications/files/pub_files/2011/png-development-strategic-plan.2010-2030.pdf
15. The National (2018). Hydro power to drive renewable energy. The National, 9 January 2018. Available from https://www.thenational.com.pg/hydro-power-drive-renewable-energy/
16. Secretariat of the Pacific Regional Environment Programme (2004). Regional Energy Assessment, Papua New Guinea National Report, Vol 10. Available from www.sprep.org

227
5.2. PIC
Ts
Solomon IslandsJohn Korinihona, ministry of mines, Energy & rural Electrification
Key facts
Population 611,3431
Area 28,896 km2
Climate The Solomon Islands have a tropical monsoon climate, with few extremes in temperature and weather. Average temperatures throughout the year range between 26 °C and 27 °C and rarely exceed 32 °C.2,3
Topography The country consists of an archipelago of 992 islands. The terrain is mostly dominated by rugged moun-tains, with some low coral atolls. The highest peak is Mount Makarakomburu, at 2,447 metres. The is-lands include the large high islands of Guadalcanal, Malaita, Santa Isabel, San Cristóbal, Choiseul, New Georgia and the Santa Cruz Group, as well as numerous smaller islands. The islands in the archipelago are of two types, volcanic origin and coral atolls. The six main islands in the group are volcanic and mountainous, blanketed with dense rainforests. Some volcanoes on the islands are considered active.3
Rain pattern Average annual rainfall is within the range of 3,000 to 5,000 mm. The southern side of the larger is-lands tends to receive maximum rainfall from June to September.4
Hydrology The islands’ rivers are narrow and impassable except by canoe. Extensive coral reefs and lagoons sur-round the islands’ coasts. The longest river is the Lungga River, located in Honiara on Guadalcanal. The Tina River, to the east of Honiara, has the most hydropower potential.4
Electricity sector overview The Solomon Islands are almost entirely dependent on imported refined petroleum fuels to meet the national energy needs for electricity generation, transport by land, sea and air and for lighting. As of the end of 2017, the installed generation capacity was 30.8 MW.5 Some of the recently introduced capacity includes four 250 kW diesel generators at the Lungga power plant, two new 1.6 MW diesel generators at the Honiara power plant, a 1 MW solar power plant at Henderson, a pilot solar project of 50 kW at Ranadi and several new generators installed at selected stations as part of the Outstation Generation Project.6
In 2017, 94.28 GWh of electricity was generated by thermal and solar plants (compared to 90.64 GWh in 2016), predominantly from diesel (Figure 1).5 More than 80 per cent of electricity was generated by two major power plants, Lungga (80.73 GWh) and Honiara (1.65 GWh). The Ranadi solar power plant generated 0.042 GWh, while the Henderson solar power plant generated 1.19 GWh. Outstations, including hydropower and hybrid power plants, and the Independent Power Producer (IPP) Solomon Tropical Products generated 9.73 GWh and 0.94 GWh, respectively.5
In 2016, less than 48 per cent of the population had access to electricity. Electricity is used by a higher proportion of households in urban areas (almost 70 per cent), compared to 42 per cent in rural areas.7 At the national level, solar (lamps) energy remains an important source of lighting for some 40 per cent of households. Forty-four per cent of rural households use solar lamps as their main source of lighting.
Of the households that have access to electricity, 20 per cent reported that the Solomon Islands Electricity Authority (SIEA) was their main supplier. In urban areas, the majority (98 per cent) of households that reported having access to electricity stated that SIEA was their main supplier.8
Figure 1. Annual electricity generation by source in Solomon Islands (GWh)
10.7
82.4
1.2
Diesel
Other
Solar power
Source: SIEA5
Note: The ‘Other’ category includes generation by outstations and IPP Solomon Tropical Products and includes sources such as hydropower, hybrid power and coconut oil biofuel.
The Energy Division within the Ministry of Mines, Energy and Rural Electrification (MMERE) is responsible for energy policy, renewable energy development and project implementation. The Electricity Act of 1969 (detailed in Chapter 128 of the Laws of the Solomon Islands), as well as associated regulations, provided a legal framework for the establishment of a state-owned, vertically integrated utility supplying electricity to urban and provincial centres via the national grid. Under this Act, SIEA is responsible for the generation, transmission, distribution and sale of electrical energy throughout the Solomon Islands. In 1982, the Act was
5.2.4
World Small HydropoWEr dEvElopmEnt
rEport 2019

228
World Small HydropoWer development report 2019
amended to ensure its alignment with the utility practices at the time and allow SIEA to expand its jurisdiction. Regulations focusing only on the utility functions of SIEA have been promulgated. Part III of the Electricity Act allows SIEA to issue licences to non-utility actors for providing electricity services. SIEA has developed distributed generation policies. Due to its climate and geography, the country is ideally suited for the development of independent power systems and multi-generator mini-grids.
In preparation for the proposed 15 MW Tina River hydropower project, a framework was defined for negotiation and contracting of an independent power producer (IPP) who will build and run the plant and sell power to SIEA under a power purchase agreement (PPA). A developer has been selected through a competitive international tender process to develop the project after the completion of feasibility studies in 2014. The PPA with the selected developer Korea Water Resources Corporation was signed in December 2018.9 According to the final feasibility study, the plant will have the following features:• 53-metre high roller compacted concrete dam;• A headrace tunnel of 3.3 metres in diameter and 3.3 km in
length leading to the power station;• The net head between intake and tailrace water level of 101
metres;• Four Francis turbines with a capacity of 5 MW each, pro-
viding a total potential output of 20 MW;• Expected average annual electricity production of 88
GWh.10
The Government has completed the process of securing land and has performed environmental and social impact assessment studies. It is currently working together with affected communities and tribal landowners on how to cope with the social changes anticipated from the project and is assisting the communities with preparing mechanisms to capture the benefits that the project will bring about.
Electricity tariffs for domestic consumers ranged from 5.83 SBD/kWh (0.74 US$/kWh) for consumption of less than 50 kWh to 6.40 SBD/kWh (0.81 US$/kWh) for consumption of more than 500 kWh (valid from 1 April 2018).11
Small hydropower sector overview
The predominantly mountainous nature of the country offers a significant small hydropower (SHP) potential. As of 2018, the installed capacity of SHP plants was at 258 kW, while po-tential stood at 11 MW. Thus, compared to the World Small Hydropower Development Report (WSHPDR) 2016, both in-stalled and potential capacity remained unchanged (Figure 2). The only recent development in the field of SHP was the refurbishment of the 150 kW Buala mini-hydropower plant, which was completed in May 2016.6
The Japan International Cooperation Agency (JICA) completed a study in 2001 of power development potentials in the Solomon Islands, including hydropower development.
A total of 130 potential hydropower sites were identified, with a total potential of 327 MW, including the Lungga and Komarindi hydropower projects (Table 1).16 The majority of the identified potential hydropower sites were assessed from desktop or map studies using area, contour and rainfall methods. However, it should be noted that the study seems to be based on theoretical potential and does not take into account technical obstacles, such as restricted areas or topographical limitations. The Government developed its own database of over 100 potential sites for SHP development, of which 62 had an estimated overall capacity of 11 MW.13
Figure 2. Small hydropower capacities 2013/2016/2019 in the Solomon Islands (MW)
0 2 4 6 8 10 12
PotentialCapacity
Installed Capacity
11.00 11.00 11.00
0.260.26 0.29
WSHPDR 2019WSHPDR 2016WSHPDR 2013
Source: SIEA,5 Silas,12 MMERE,13 WSHPDR 2016,14 WSHPDR 201315
Note: The comparison is between data from WSHPDR 2013, WSHPDR 2016 and WSHPDR 2019.
Note: Data do not include mini-hydropower plants under repair or suspended activity (Table 2).
Table 1.Total potential of hydropower sites in the Solomon Islands
Islands Number of sites
Micro(kW)
Mini(kW)
Small(kW)
Total(kW)
Guadalcanal 49 - 1,210 236,100 237,310
Malaita 23 90 2,700 28,000 30,790
Santa Isabel 6 - 610 4,100 4,710
New Geor-gia
23 320 4,840 - 5,160
San Cris-tobal
12 20 371 25,500 25,891
Choiseul 15 140 2,030 20,030 22,200
Santa Cruz 2 50 260 - 310
Total 130 620 12,021 313,730 326,501 Source: JICA16
Note: Overall theoretical potential; it is assumed that technical and economic potential is roughly the same as reported in WSHPDR 2016.
There are 14 hydropower plants with capacities up to 150 kW, of which five were implemented by an Australian environmental non-governmental organization (NGO), Appropriate Technology for Community and Environment (APACE). Six plants are currently operational and are all community-owned. One state-operated plant, in Malu’u, is currently suspended, primarily due to technical issues. The oldest remaining micro-hydropower plant, at the Atoifi Adventist Hospital, has experienced frequent technical
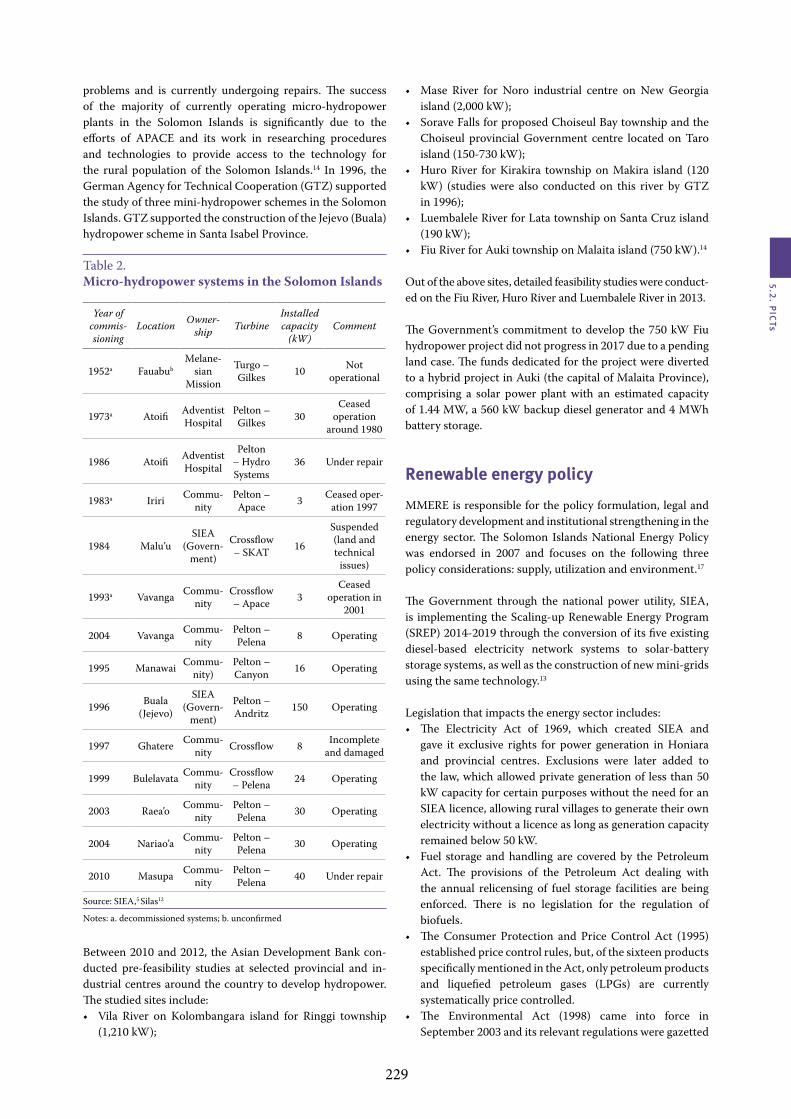
229
5.2. PIC
Ts
problems and is currently undergoing repairs. The success of the majority of currently operating micro-hydropower plants in the Solomon Islands is significantly due to the efforts of APACE and its work in researching procedures and technologies to provide access to the technology for the rural population of the Solomon Islands.14 In 1996, the German Agency for Technical Cooperation (GTZ) supported the study of three mini-hydropower schemes in the Solomon Islands. GTZ supported the construction of the Jejevo (Buala) hydropower scheme in Santa Isabel Province.
Table 2.Micro-hydropower systems in the Solomon Islands
Year of commis-sioning
Location Owner-ship Turbine
Installed capacity
(kW)Comment
1952a FauabubMelane-
sian Mission
Turgo – Gilkes 10 Not
operational
1973a Atoifi Adventist Hospital
Pelton – Gilkes 30
Ceased operation
around 1980
1986 Atoifi Adventist Hospital
Pelton – Hydro Systems
36 Under repair
1983a Iriri Commu-nity
Pelton – Apace 3 Ceased oper-
ation 1997
1984 Malu’uSIEA
(Govern-ment)
Crossflow – SKAT 16
Suspended (land and technical
issues)
1993a Vavanga Commu-nity
Crossflow – Apace 3
Ceased operation in
2001
2004 Vavanga Commu-nity
Pelton – Pelena 8 Operating
1995 Manawai Commu-nity)
Pelton – Canyon 16 Operating
1996 Buala (Jejevo)
SIEA (Govern-
ment)
Pelton – Andritz 150 Operating
1997 Ghatere Commu-nity Crossflow 8 Incomplete
and damaged
1999 Bulelavata Commu-nity
Crossflow – Pelena 24 Operating
2003 Raea’o Commu-nity
Pelton – Pelena 30 Operating
2004 Nariao’a Commu-nity
Pelton – Pelena 30 Operating
2010 Masupa Commu-nity
Pelton – Pelena 40 Under repair
Source: SIEA,5 Silas12
Notes: a. decommissioned systems; b. unconfirmed
Between 2010 and 2012, the Asian Development Bank con-ducted pre-feasibility studies at selected provincial and in-dustrial centres around the country to develop hydropower. The studied sites include:• Vila River on Kolombangara island for Ringgi township
(1,210 kW);
• Mase River for Noro industrial centre on New Georgia island (2,000 kW);
• Sorave Falls for proposed Choiseul Bay township and the Choiseul provincial Government centre located on Taro island (150-730 kW);
• Huro River for Kirakira township on Makira island (120 kW) (studies were also conducted on this river by GTZ in 1996);
• Luembalele River for Lata township on Santa Cruz island (190 kW);
• Fiu River for Auki township on Malaita island (750 kW).14
Out of the above sites, detailed feasibility studies were conduct-ed on the Fiu River, Huro River and Luembalele River in 2013.
The Government’s commitment to develop the 750 kW Fiu hydropower project did not progress in 2017 due to a pending land case. The funds dedicated for the project were diverted to a hybrid project in Auki (the capital of Malaita Province), comprising a solar power plant with an estimated capacity of 1.44 MW, a 560 kW backup diesel generator and 4 MWh battery storage.
Renewable energy policy
MMERE is responsible for the policy formulation, legal and regulatory development and institutional strengthening in the energy sector. The Solomon Islands National Energy Policy was endorsed in 2007 and focuses on the following three policy considerations: supply, utilization and environment.17
The Government through the national power utility, SIEA, is implementing the Scaling-up Renewable Energy Program (SREP) 2014-2019 through the conversion of its five existing diesel-based electricity network systems to solar-battery storage systems, as well as the construction of new mini-grids using the same technology.13
Legislation that impacts the energy sector includes:• The Electricity Act of 1969, which created SIEA and
gave it exclusive rights for power generation in Honiara and provincial centres. Exclusions were later added to the law, which allowed private generation of less than 50 kW capacity for certain purposes without the need for an SIEA licence, allowing rural villages to generate their own electricity without a licence as long as generation capacity remained below 50 kW.
• Fuel storage and handling are covered by the Petroleum Act. The provisions of the Petroleum Act dealing with the annual relicensing of fuel storage facilities are being enforced. There is no legislation for the regulation of biofuels.
• The Consumer Protection and Price Control Act (1995) established price control rules, but, of the sixteen products specifically mentioned in the Act, only petroleum products and liquefied petroleum gases (LPGs) are currently systematically price controlled.
• The Environmental Act (1998) came into force in September 2003 and its relevant regulations were gazetted

230
in 2008. Under the Act, there are formal requirements for environmental impact assessments and requirements for energy sector investments, such as power stations or oil storage.
• The Provincial Government Act of 1981 allows provincial governments to provide electrical services within their jurisdictions.
• The River Waters Act of 1981 is intended to prevent upstream water uses from adverse impact on downstream populations, which affects hydropower development.
• The Land Tenure Legislation attempts to sort out some of the many issues surrounding the use of land in the Solomon Islands. About 87 per cent of land rights are based on Customary Land terms, the traditional approach to land transfer and use, and the rest is based on Alienated Land, which was procured and given freehold title during the colonial era.18
Barriers to small hydropower developmentThere are a number of barriers identified that hinder the ex-pansion of SHP in the Solomon Islands. These include: • Lack of standardized and streamlined approaches for land
acquisition for the distribution extensions and mini-grids;• Outdated regulatory framework that requires revision;• Need to improve system planning and project management
capacity within SIEA;• Need to strengthen MMERE capacity to develop
appropriate policies and regulations;• High upfront capital costs for most renewable energy
projects;• Lack of financial incentives for investment.19
References
1. World Bank (2017). Solomon Islands. Population, total. Available from https://data.worldbank.org/indicator/SP.POP.TOTL?locations=SB
2. Solomon Islands Meteorological Service (2012). Climate Information. Available from www.met.gov.sb/
3. Encyclopaedia Britannica (2018). Solomon Islands. Available from https://www.britannica.com/place/Solomon-Islands#ref53966
4. World Meteorological Organization (2012). Catalogue of Rivers for Pacific Islands, Solomon Islands. Available from http://www.pacificwater.org/_resources/article/files/Solomon%20Is..pdf
5. Solomon Islands Electricity Authority (SIEA) (2018). Annual report 2017. Available from http://solomonpower.com.sb/about-us/annual-reports/
6. Solomon Islands Electricity Authority (SIEA) (n.d.). Solomon Power Projects and Capital Expansion Programme (2015-2019). Available from http://solomonpower.com.sb/projects/projects/
7. World Bank (2016). Solomon Islands. Access to electricity (% of population). Available from https://data.worldbank.org/indicator/EG.ELC.ACCS.ZS?locations=SB
8. Solomon Islands National Statistics Office (2015). Solomon Islands 2012/2013 Household Income and Expenditure Survey.
National Analytical Report. Available from http://www.statistics.gov.sb/statistics/demographic-statistics/household-income-and-expenditure-surveys
9. Water Power Magazine (2018). Key agreements signed for hydro in the Solomon Islands. Available from https://www.waterpowermagazine.com/news/newskey-agreements-signed-for-hydro-in-the-solomon-islands-6887997
10. Tina River Hydro Development Project (n.d.). Dam safety. Available from http://www.tina-hydro.com/the-project/dam-safety/
11. Solomon Islands Electricity Authority (SIEA) (2018). Tariff Adjustments for April 2018. Available from http://solomonpower.com.sb/wp-content/uploads/2018/04/April-Tariff-2018.pdf
12. Silas, N. (n.d.). Micro-Hydroelectricity in Solomon Islands. Pelena Rural Energy Solomon Islands. Available from http://prdrse4all.spc.int/sites/default/files/day_2_session_5_-_solomon_is_private_sector_experience_in_re_and_ee.pdf
13. Ministry of Mines, Energy and Rural Electrification (MMERE) (2014). SREP Investment Plan of the Government of Solomon Islands. Available from https://www.climateinvestmentfunds.org/sites/climateinvestmentfunds.org/files/Solomon_Islands_IP.pdf
14. Xialei, C., Singh, P. R., Xianlai, W., and Kremere, E., eds. (2016). World Small Hydropower Development Report 2016. United Nations Industrial Development Organization; International Center on Small Hydro Power. Available from www.smallhydroworld.org
15. LIU, H., Masera, D. and Esser, L., eds. (2013). World Small Hydropower Development Report 2013. United Nations Industrial Development Organization; International Center on Small Hydro Power (2013) Available from www.smallhydroworld.org
16. Japan International Cooperation Agency (JICA) (2001). Master Plan Study of Power Development in Solomon Islands. Available from http://prdrse4all.spc.int/sites/default/files/102-jica_energy_master_plan_study_of_power_development_solomon_islands_0.pdf
17. Solomon Islands Government (2007). National Energy Policy Framework. Policy Statements, Strategic Plan, Action Plan 2007-2009. Available from https://www.theprif.org/documents/solomon-islands/energy-power-generation/solomon-islands-government-national-energy-policy
18.International Renewable Energy Agency (IRENA) (2013). Renewable Energy Profile: Solomon Islands. Available from https://www.irena.org/DocumentDownloads/Publications/Solomon-Islands.pdf
19. Johnston, P., Vos, J. and Wade, H. (2004). Pacific Regional Energy Assessment 2004: An Assessment of the Key Energy Issues, Barriers to the Development of Renewable Energy to Mitigate Climate Change, and Capacity Development Needs for Removing the Barrier: Solomon Islands National Report. Apia, Samoa.

231
5.2. PIC
Ts
VanuatuInternational Center on Small Hydro power (ICSHp)
Key facts
Population 276,0001
Area 12,190 km2 2
Climate Vanuatu has a tropical and maritime climate, with an average temperature of 24 oC. The average mi-nimum is 22 oC and average maximum is 26 oC.3 The climate of Vanuatu ranges from north to south. It is very wet, hot and humid in the north and warm and less humid in the south. The wet season is from November to April. Temperatures are higher during this time and there is heavy rain, as well as occasional cyclones.4 There are southeast trade winds from May to October.5 The warmest month is February, while the coolest is July or August.3
Topography Vanuatu is comprised of 82 islands, of which 65 are inhabited.6 Many of these islands are volcanic, covered by tropical forest and are mountainous or have a rugged terrain. The highest point is Mount Tabuemasana on Santo island at 1,897 metres.4
Rain pattern Rainfall is heaviest in January at 343 mm in 2015.3 Average annual rainfall is estimated at about 2,500 mm using data from 1991 to 2015. 3 However, there is a variation in precipitation, with average preci-pitation 4,200 mm in the northern parts of the country and about 1,500 mm in the southern islands.4 Rainfall is variable on the smaller islands, depending on their location and size. The south-eastern (windward) side of most of the country’s islands tends to have more rainfall than the north-western (leeward) side.7
Hydrology The sizes of each of the Vanuatu islands limits the availability of water resources.7 The volcanic islands tend to have rivers and streams that drain from the mountains, including the Jourdain, Sarakana and Wamb rivers.4 River courses tend to be short, and flows are short-lived, particularly during the dry periods. However, nevertheless, there are substantial amounts of groundwater that can provide large amounts of water, even during droughts. These sources can be accessed through wells or boreholes.4
Electricity sector overview
Total installed electricity capacity for 2016 was 34.98 MW.8,9 This comprised 27 MW from fossil fuels, 3.025 MW from on-shore wind, 2.7 MW from bioenergy (liquid biofuels), 1.3 MW from hydropower and 0.952 MW from solar photovol-taics (PV), of which 0.055 MW was off-grid.8,9 Total genera-tion for 2015 was 74.83 GWh and was mainly from fossil fuels (67 per cent), while 24.83 GWh (34 per cent) was generated from renewable sources (Figure 1).8,9 Vanuatu does not have fossil fuel resources and is wholly reliant on imports. In 2013, the Vanuatu Department of Energy set a target to achieve 65 per cent renewable energy generation by 2020.10
The estimated electrification rate of the country for 2014 was 34 per cent, while the access for rural areas was 12 per cent (Figure 2).11 A 100 per cent electrification target has been set for 2030.10 Rural electrification has been challenging, partially because of the high cost of energy from diesel generation and the geographical dispersion of the 82 islands.12 The fact that the islands are spread out and are not interconnected means that there is a necessity for independent systems on each is-land, therefore, each system incurs a fixed cost and there are limited opportunities for economies of scale.13 The proportion of diesel power greatly impacts the price paid by consumers
for electricity services. The greater its proportion in the over-all generation mix, the higher the electricity bills customers must pay.13 Furthermore, extreme weather situations such as cyclones often have an adverse effect on the infrastructure.
Figure 1. Installed electricity capacity by source in Vanuatu (MW)
0 5 10 15 20 25 30
Fossil fuels
Wind power
Bioenergy
Hydropower
Solar PV
27.0
3.0
2.7
1.3
1.0
Source: UN Statistics, 8 IRENA9
There are two private companies that supply electricity in Vanuatu, Union Electrique de Vanuatu Limited (UNELCO) and Vanuatu Utilities and Infrastructure Limited (VUI). These companies supply electricity to the four main urban centres
5.2.5
World Small HydropoWEr dEvElopmEnt
rEport 2019

232
World Small HydropoWer development report 2019
through private-sector concessions. The four concessions areas are Port Vila (the capital) on Efate Island, Malekula, Tanna and Luganville. Figure 3 shows the energy mix of the concession areas. Apart from Luganville, where hydropower makes up the largest proportion of the energy mix, electricity generation from diesel makes up the largest proportion for these areas.14
Figure 2. Electrification rate in Vanuatu (%)
Rural 12%Total 34%
Source: United Nations Statistics Division11
There are two private companies that supply electricity in Vanuatu, Union Electrique de Vanuatu Limited (UNELCO) and Vanuatu Utilities and Infrastructure Limited (VUI). These companies supply electricity to the four main urban centres through private-sector concessions. The four conces-sions areas are Port Vila (the capital) on Efate Island, Maleku-la, Tanna and Luganville. Figure 3 shows the energy mix of the concession areas. Apart from Luganville, where hydropower makes up the largest proportion of the energy mix, electricity generation from diesel makes up the largest proportion for these areas.14
Figure 3. Energy mix in concession areas (MWh)
0
1,000
2,000
3,000
4,000
5,000
6,000 Solar powerWind powerHydropowerCopra oilDiesel
Port
Vila
Luga
nvill
e
Mal
ekul
a
Tann
a
Tota
l ele
ctric
ity p
rodu
ced
(MW
h)
Source: Utilities Regulatory Authority14
Note: Based on December 2016 data.
The electricity market was privatized after Vanuatu gained independence in 1980. The Utilities Regulatory Authority (URA) was established in 2009 to regulate tariffs on water and electricity services in Vanuatu. URA monitors the private
utilities operating in concession areas and may also regulate small utilities operating outside of them.15 In October 2014, the URA put in place new tariff structures to support variable renewable energy integration. The aim of this tariff is to encourage the implementation of small-scale solar energy connected to the grid with a feed-in and net-metering programme.16 The programme has two metering methods, as shown in Table 1.
Table 1. Tariffs for connecting to the grid with small-scale solar energy in Vanatu
Consumer type Domestic Commercial Industrial
Metering method Net- metering
Bi-directional metering
Bi-directional metering
Net consumption charge (US$/kWh) 0.67 0.49 0.38
Fixed charge (US$/kVA) 2.76 11.00 13.83
Access fee (US$/ kWp) 12.15 0.00 0.00
Feed-in-tariff (US$/kWh) 0.13 0.21 0.21
Source: IRENA16
An access fee was implemented to compensate for the network use. The fee only applies to domestic consumers and is based on the size of the domestic consumer’s solar home system (SHS). In the case that there is excess electricity fed to the grid, it will be used to off-set the fee and any fixed charges. The energy fed to the grid is valued according to the feed-in tariff based on the consumer type. However, if there is even more electricity fed to the grid than what is needed to off-set the access fee and the fixed charges, then the electricity will be fed for free. There will be no negative bills.16
It has also been part of a Government initiative to have cross-subsidies for electricity. Small domestic customers, with consumption levels of 0—60 kWh per month, are heavily subsidised by other consumer groups as an effort to encourage electricity access and consumption for low income earners. This programme aims to connect 4,300 low income households by 2018.17
The first phase of the Vanuatu Rural Electrification Project (VREP) will provide a 50 per cent subsidy to private sector suppliers to distribute solar home systems. The first phase will provide access to electricity to consumers where grid systems are unlikely to be economically feasible. The second phase of VREP will focus on increasing rural electrification through the use of mini- and micro-grids.17 The project aims to cover 17,500 households, 2,000 not-for profit community halls and 230 aid posts that are unable to access electricity and/or located outside or within concession areas that are not likely to have grid connection within the next four years. The project is expected to be completed in December 2019.18

233
5.2. PIC
Ts
Small hydropower sector overview
The installed capacity of small hydropower (SHP) in Vanu-atu is 1.28 MW and potential capacity is estimated at 5.98 MW. Between the World Small Hydropower Development Report (WSHPDR) 2016 and WSHPDR 2019, there has been no change in installed capacity.19 Potential has increased as indicated by plans for future development (Figure 4).
Figure 4. Small hydropower capacities 2013/2016/2019 in Vanuatu (MW)
0 1 2 3 4 5 6
PotentialCapacity
Installed Capacity
5.98 4.78 3.98
1.28 1.28 1.28
WSHPDR 2019WSHPDR 2016WSHPDR 2013
Source: IRENA9, WSHPDR 2013,23 WSHPDR 201619
Note: The comparison is between data from WSHPDR 2013, WSHPDR 2016 and WSHPDR 2019.
There is significant technical hydropower potential in Vanuatu and its topography makes run-of-the river type installations as the main option. The Loltong Hydropower Project, North Pentecost and the 75 kW Talise Hydropower Project on Maewo are good examples of this. The Talise Hydropower Project will provide electricity to 300 households, 11 schools, three clinics, six churches and a planned airport,17 while the Loltong Hydropower Project will provide electricity for 70 households.20 These are both micro-hydropower projects.20 Although these installations may be economically attractive for several locations in Vanuatu, the costs are very site-specific.21 Considering Vanuatu is prone to cyclones and that these small run-of-the river systems are highly vulnerable to destruction during periods of very high waterflow (which can exceed typical flows by a thousand times during the passage of a cyclone), the energy potential of a site, and the potential for flood damage, can only be accurately determined after the resource has been measured for at least several years.21
There have been 13 potential micro-hydropower sites, with a total of 1,500 kW of power, on six different islands that has been investigated by the European Union.21 In addition, the World Bank’s Energy Sector Management Assistance Programme (ESMAP) has agreed to support further investigation of sites with the potential to provide 100 kW to 5 MW of generation capacity.21 Although resources have been identified, only a few sites have been assessed and only a few hydropower systems have been developed, the most significant and largest being the 1.2 MW Sarakata installation on Espiritu Santo.21 A 600 kW extension project for Sakatra Hydropower Plant has been put in place and will begin in 2018. Brenwe Hydropower Project (<1.2 MW) is another project due to begin in 2018.20 Finally, there have been further
studies to suggest a technical potential on Efate (e.g. 1.2 MW at Teouma) but with high costs.21 This technical potential has been added to the potential capacity of the country.
Renewable energy policy
Since 2013, the proportion of renewable generation has risen from 16 per cent to 29 per cent.17 Ensuring that there is a secure and reliable supply of energy is a high priority for Vanuatu. Since Vanuatu is highly dependent on fuel imports (as shown by the proportion of energy mix it makes up and the fact that the country does not have their own resources of it), consumers are exposed to certain risks. These risks include oil price variability, price shocks and interruptions to fuel deliveries due to natural phenomena or international or domestic political turmoil.21 A key way to manage the country’s exposure to fuel price volatility and supply disruptions is to diversify energy supply. Vanuatu is rich in renewable energy resources to support hydro-, wind-, solar- and geothermal-based electricity generation, which could reduce reliance on imported diesel. This would not only improve energy supply but would also contribute to a more sustainable energy supply.21 It will also help to reduce electricity tariffs for consumers and help achieve the supply efficiency targets. The Government of Vanuatu is embarking on appropriate legislation in the energy sector to promote new projects to modernize Vanuatu’s power industry and enable a greener energy future.
The National Energy Road Map identifies five priority areas and targets for Vanuatu’s energy sector: 10,20 • Electricity access: Access to secure, reliable, and affordable
electricity for all citizens by 2030;• Petroleum supply: reliable, secure and affordable
petroleum supply throughout Vanuatu;• Affordability: lower cost energy services in Vanuatu;• Energy security: an energy secure Vanuatu at all times;• Climate change: mitigating climate change through
renewable energy and energy efficiency.19
Moreover, Vanuatu’s Intended Nationally Determined Con-tribution (INDC) has listed the following renewable energy plans to mitigate emissions: • Double installed wind capacity to 5.5 MW by 2025;• Install 10 MW grid connected solar PV by 2025;• Commission the proposed first stage of the 4 MW
geothermal plant by 2025;• Add 10 MW of grid connected solar PV by 2030;• Commission the second stage of the 4 MW geothermal
plant by 2030;• Substitute and/or replace fossil fuels with coconut oil-
based electricity generation.22
These proposed interventions would cost around US$ 180 million if they are to be completed within the suggested time frame.22

234
World Small HydropoWer development report 2019
Barriers to small hydropower developmentThere are a number of major barriers hindering the expansion of renewable energy and SHP developments, including:• Extreme weather leads to higher costs in feasibility studies,
as it takes longer to define;• High costs of feasibility studies, although a nationwide
feasibility study for hydropower did begin in 2016;• Poor technical expertise has made training and capacity
development in operations and management essential for hydropower development;19
• Lack of regulation on technical specifications, in particular for the power grid connection;19
• Complexity and challenge of transporting renewable energy generated electricity through the transmission system to communities and public institutions;19
• The geography of the country and the fact that Vanuatu is comprised of more than 80 islands that are not interconnected adds to economic challenges.
References
1. United Nations, Department of Economic and Social Affairs, Population Division. World Population Prospects: The 2017 Revision, Key Findings and Advance Tables. Working Paper No. ESA/P/WP/248. New York: United Nations, 2017.
2. The World Bank. DataBank, World Development Indicators. 2017. Available from https://data.worldbank.org/indicator/AG.SRF.TOTL.K2?locations=KP (accessed January 16, 2018).
3. The World Bank Group. “Climate Change Knowledge Portal For Development Practicioners and Policy Makers.” Download Data. 1991-2015. Available from http://sdwebx.worldbank.org/climate-portal/index.cfm?page=downscaled_data_download&menu=his-torical (accessed February 7, 2018).
4. Food and Agriculture Organization of the United Nations (FAO). AQUASTAT. 2016. Available from http://www.fao.org/nr/water/aquastat/countries_regions/VUT/index.stm (accessed February 2, 2018).
5. Central Intelligence Agency. “The World Factbook.” Austra-lia-Oceania: Vanuatu. 23 January 2018. Available from https://www.cia.gov/library/publications/the-world-factbook/geos/nh.html (accessed February 2, 2018).
6. Khelawan, Kamleshwar. “Microgrids-A Solution for Electricity Access in the Pacific Island Countries?” Microgrid Symposiums. Newcastle: World Bank Group, November 2017
7. Ministry of Lands and Natural Ressources. Ministry of Lands and Natural Resources. 14 November 2014. Available from https://mol.gov.vu/index.php/en/water/227-managing-vanuatu-s-wa-ter-resourceshttps://mol.gov.vu/index.php/en/water/227-manag-ing-vanuatu-s-water-resources (accessed February 8, 2018).
8. United Nations. The 2015 Energy Statistics Yearbook. The De-partment of Economic and Social Affairs, United Nations Statis-tical Division, New York: United Nations, 2017.
9. IRENA. “International Renewable Energy Agency.” Capacity and Generation. 2017. Available from http://resourceirena.irena.org/gateway/dashboard/?topic=4&subTopic=16 (accessed February 11, 2018).
10. Vanuatu Department of Energy. Vanuatu National Energy Road Map. Port Vila: Vanuatu Department of Energy, 2013.
11. United Nations Statistics Division (UNSD), a division of the Department of Economic and Social Affairs (DESA). “United Nations, Sustainable Development Goals.” SDG Indicators, Glob-al Database. 30 Novemeber 2017. Available from https://unstats.un.org/sdgs/indicators/database/?indicator=7.1.1 (accessed February 9, 2018).
12. IRENA. A Path to Prosperity:Renewable Energy for Islands. Abu Dhabi: IRENA, 2014.
13. Utilities Regulatory Authority, Vanuatu. Comparative Report: Pacific Region Electricity Bills. Port Vila: Utilities Regulatory Authority, 2017.
14. Utilities Regulatory Authority, Vanuatu. “Utilities Regulato-ry Authority.” Electricity Pricing. December 2016. Available from http://www.ura.gov.vu/index.php?option=com_con-tent&view=article&id=106&Itemid=98&lang=en (accessed February 12, 2018).
15. Utilities Regulatory Authority, Vanuatu. Utilities Regu-latory Authority. 2015. Available from http://www.ura.gov.vu/index.php?option=com_content&view=arti-cle&id=87&Itemid=66&lang=en (accessed February 12, 2018).
16. Malhotra, Abhishek, Ruud Kempener, and Gustavo De Vivero. The Age of Renewable Power: Designing National Roadmaps for a Successful Transformation. Abu Dhabi: IRENA, 2015.
17. Pacific Energy Conference 2016. Pacific Energy Country Profiles. New Zealand: New Zealand Ministry of Foreign Affairs and Trade 2016, 2016.
18. Vanuatu Department of Energy. Department of Energy: Vanu-atu Rural Electrification Program (VREP). 2014. Available from https://doe.gov.vu/index.php?r=vrep/ (accessed February 12, 2018).
19. Xialei, C., Singh, P. R., Xianlai, W., and Kremere, E., eds. (2016). World Small Hydropower Development Report 2016. United Nations Industrial Development Organization; Interna-tional Center on Small Hydro Power. Available from www.small-hydroworld.org.
20. Vanuatu Department of Energy. Updated Vanuatu National Energy Road Map 2016-2030. Port Vila: Government of Vanuatu, 2016.
21. Wade, Herbert, and Peter Johnston. Renewable Energy Resources and Prioritized Renewable Energy Projects and Technologies for the Islands of Emae, Makira, Mataso and Aneityum. Port Vila: Government of Vanuatu and GIZ, 2016.
22. Government of Vanuatu (GoV). Republic of Vanuatu Intended Nationally Determined Contribution (INDC). Port Villa: UNFC-CC and GoV, 2015.
23. LIU, H., Masera, D. and Esser, L., eds. (2013). World Small Hy-dropower Development Report 2013. United Nations Industrial Development Organization; International Center on Small Hy-dro Power. Available from www.smallhydroworld.org.

235
5.2. PIC
Ts
Federated States of Micronesiarupeni mario, the pacific Community (SpC)
Key facts
Population 104,9371
Area 702 km2
Climate The Federated States of Micronesia have a tropical climate with relatively even and warm temperatu-res throughout the year, averaging 27 oC to 32 oC.2
Topography The country’s terrain consists of large, mountainous islands of volcanic origin and coral atolls. Kos-rae is largely mountainous, with two peaks, Fenkol (634 metres) and Matanti (583 metres). Pohnpei contains a large volcanic island, with the highest elevation at Mount Totolom (791 metres). Chuuk contains 14 mountainous islands of volcanic origin. Yap contains four large and high islands, with the peak elevation at Mount Tabiwol (178 metres). The outer islands of all states are mostly coral atolls.2,3
Rain pattern Precipitation is generally plentiful, with heavy year-round rainfall. Rainfall averages approximately 3,000 mm per year. Pohnpei is one of the wettest places on earth, with average annual rainfall of 3,810 mm at the coast, approximately 7,874 mm in the upper part of the Nanpil River, towards the moun-tainous centre of the island, and maximum rainfall of up to 8,400 mm.2,3
Hydrology In Yap there are only a few rivers and streams, almost all of which are low-flow or dry out during the dry seasons. The islands of the Chuuk Lagoon have only a few permanent rivers, including the Wichon River, while most streams flow only during the rainy season. In contrast, in Pohnpei, there are 40 rivers and numerous smaller streams that, due to abundant precipitation, do not dry out. The Nanpil River, a tributary of the Kiepw River, has an average of 0.4 m3/sec. The peak discharge of the Kiepw River was determined to be 736 m3/sec from a 29 km2 drainage area. Similarly, almost all streams and rivers in Kosrae are permanent, the most significant of which are the Finkol, Innem and Okat rivers. Outer is-lands lack streams and rivers, with the only source of fresh water being rain and groundwater.4,5
Electricity sector overview
As of 2018, total installed capacity across the Federated States of Micronesia (FSM) was 34.8 MW, of which 29.2 MW was available for generating electricity.6 The FSM, like most of the Pacific island countries, generate electricity predominantly from diesel. Renewable energy sources accounted for approximately 12 per cent, with a combined installed capacity of 4.3 MW, including 2.8 MW of grid-connected solar photovoltaic (PV) systems in the main islands, 825 kW of wind power, 725 kW of hydropower, 322.58 kW of solar PV micro-grids in the outer islands and 133.3 kW of stand-alone solar PV systems for public facilities (schools and health centres) (Figure 1).
The country consists of four states: Kosrae, Pohnpei, Chuuk and Yap. Fuel to each state is supplied by the FSM Petroleum Corporation (FSMPC), a public corporation established under the FSMPC Act 2007. The electricity sector comprises four state-owned corporations: the Chuuk Public Utility Corporation (CPUC), the Kosrae Utilities Authority (KUA), the Pohnpei Utilities Corporation (PUC) and the Yap State Public Service Corporation (YSPSC). They are each governed by a board, with members appointed by the respective state governments. These corporations were established under state laws: Kosrae State Code Title 7; Pohnpei State Code Title 34; Chuuk State Code Title 30; and the Yap State
Code 1987 Title 14. These four utilities are also tasked with responsibilities in the water sector. Electricity tariffs for each utility are shown in Table 1 and Table 2.
Figure 1. Installed electricity capacity by source in the Federated States of Micronesia (MW)
Diesel
Solar power
Wind power
Hydropower
30.52
2.76
0.83
0.73
Source: Department of Resources and Development6
Average access to electricity across the FSM stood at 67 per cent in 2018. The 2018 FSM Energy Master Plan projects that the access rate will increase to 82 per cent in 2020 and set the aim of achieving 100 per cent by 2027.8 The major challenge to electrification is the fact that the islands are scattered in the ocean over a large area, with transportation to the islands being generally limited to one ship visiting some of the islands every three months.
5.2.6
World Small HydropoWEr dEvElopmEnt
rEport 2019

236
World Small HydropoWer development report 2019
Table 1. Electricity tariffs for residential consumers
Total cost for monthly consumption (US$)
Utility 50 kWh 100 kWh 200 kWh 500 kWh 1,000 kWh 2,000 kWh 3,000 kWh 10,000 kWh
CPUC 27.37 54.73 109.46 273.65 547.30 1,094.60 1,641.90 5,473.00
KUA 21.69 43.09 89.89 230.29 464.29 942.29 1,420.29 4,766.29
PUC 28.53 53.05 102.10 249.25 494.50 985.00 1,475.50 4,909.00
YSPSC 21.06 42.27 84.69 217.25 442.60 893.30 1,344.00 4,498.90 Source: Pacific Power Association7
Note: Prices include base charge, taxes, etc.
Table 2.Electricity tariffs for commercial consumers
Total cost for set kWh/month (US$)
Utility 1,000 3,000 10,000 50,000
CPUC 577.40 1,732.20 5,774.00 28,870.00
KUA 477.29 1,453.29 4,869.29 23,989.29
PUC 490.50 1,471.50 4,905.00 24,525.00
YSPSC 455.70 1,516.30 5,228.40 26,440.40 Source: Pacific Power Association7
Note: Cost includes base charge, taxes, etc.
Ageing electricity generation, distribution and transmission infrastructure has been undergoing upgrading in order to improve efficiency and minimize technical losses. The 2015 Benchmarking Report by the Pacific Power Association recorded and compared technical and non-technical losses of the four utilities, including remedial measures. These are further discussed with costs and remedial timelines in the 2018 FSM Energy Master Plan. On average, distribution losses range between 9 and 12 per cent.9
Small hydropower sector overview
There is no official definition of small hydropower (SHP) in the FSM, therefore, this report uses the standard definition up to 10 MW. The installed capacity of SHP in the country is currently limited to one plant in Pohnpei. This is a 725 kW run-of-river hydropower plant installed in Nanpil. In terms of general classification of hydropower plants by size, it is classified as a mini-hydropower plant. The original installed capacity of this plant in the 1980s was 2.1 MW. However, during its rehabilitation in 2014, only 725 kW was reinstalled, and this remains the capacity which is still available to date.10 The reason for the downsizing was to cater to increasing public demand for water, as the water supply and hydropower intake are from the same reservoir. The potential of SHP in the FSM stands at 9 MW, with potential limited to the states of Kosrae and Pohnpei.11,12 Compared to the results of the World Small Hydropower Development Report (WSHPDR) 2016, potential capacity remained unchanged, whereas installed capacity decreased by more than 65 per cent, which is the result of a more accurate capacity estimate (Figure 2).
Figure 2. Small hydropower capacities 2013/2016/2019 in the Federated States of Micronesia (MW)
0 2 4 6 8 10
PotentialCapacity
Installed Capacity
9.0 9.0 9.0
0.7 2.1 2.0
WSHPDR 2019WSHPDR 2016WSHPDR 2013
Source: WSHPDR 2016,3 SPC,10 WSHPDR 201311
Note: The comparison is between data from WSHPDR 2013, WSHPDR 2016 and WSHPDR 2019.
The 2018 FSM Energy Master Plan outlines intentions to de-velop a 2.7 MW hydropower plant at Lehnmesi in Pohnpei. The timeline for the development of this potential has been scheduled for 2019-2023.9
Renewable energy policy
A defined National Energy Policy (NEP-2012) is in place, with each of the four states having specific action plans. In April 2018, the country launched its Energy Master Plan. The NEP-2012 defined the national goal of improving the livelihoods of all FSM citizens with affordable, reliable and environmentally friendly energy. The policy specifically promotes sustainable, social and economic development of the FSM through the provision and utilization of cost-effective, safe, reliable and sustainable energy services.12,13
The NEP-2012 is in line with the objectives of Sustainable Energy for All Initiative (SE4ALL) and Agenda for Change in poverty reduction, sustainable growth, clean energy and improving resilience to natural disasters and climate change. All these development objectives can be achieved and accelerated through reinforced cooperation and partnership between the country and its development partners. Energy policies to encourage investment in the electricity sector, such as feed-in-tariffs, have yet to be developed. However, it is intended that they will be developed within the 2019-2021 timeframe.

237
5.2. PIC
Ts
Barriers to small hydropower developmentBarriers to the development of SHP include: • The reservoir used by the sole hydropower plant is also
used to supply water to the population. This is the case with the current 725 kW Nanpil hydropower plant providing electricity to the main centre of Pohnpei. Thus, at certain times, the plant has to cease operations so as to meet the water demand. There are plans to further develop alternative sources of water.
• For the development of hydropower, technical and financial assistance is needed, including site-specific hydrology data, funding and site-specific impact assessments covering river flow, land inundation and the general environment. This is the case for the planned development of the 2.7 MW Lehnmesi hydropower project.15
References
1. The World Bank (2016). Population, total. Available from www.data.worldbank.org. Accessed on 19 June 2018.
2. Encyclopaedia Britannica (2018). Micronesia. Available from https://www.britannica.com/place/Micronesia-republic-Pacific-Ocean
3. Xialei, C., Singh, P. R., Xianlai, W., and Kremere, E., eds. (2016). World Small Hydropower Development Report 2016. United Nations Industrial Development Organization; International Center on Small Hydro Power. Available from www.smallhydroworld.org
4. Water for Life (2013). Fresh Water in Micronesia. An Island-by-Island Overview Guide. Available from http://w4l.prel.org/wp-content/uploads/2015/01/wfl-island-overview-guide.pdf
5. Weinheimer, R. (2017). Freshwater Distribution on Pohnpei, Federated States of Micronesia. Available from http://www.ce.utexas.edu/prof/maidment/giswr2017/TermProject/FinalReports/weinheimerrachel_3953317_44217630_FSM_Final.pdf
6. Department of Resources and Development (2018). Sustainable Energy and Accompanying Measures (SEAM) - FSM submission to the European Union for EDF11, May 2018
7. Pacific Power Association (2017). Pacific Power Utilities. Benchmarking Report. 2015 Fiscal Year. Available from https://www.ppa.org.fj/wp-content/uploads/2018/06/2015-FY-Benchmarking-Report_Final_.pdf
8. Castalia Strategic Advisors & ITP Renewables (2018). Energy Master Plan for the Federated States of Micronesia. Final Report to the Department of Resources and Development. April 2018. Available from http://prdrse4all.spc.int/sites/default/files/fsm_energy_master_plans_final_report_-_april_2018a.pdf
9. Pacific Power Association (2018). Pacific Power Utilities. Benchmarking Report. 2016 Fiscal Year. Available from https://www.ppa.org.fj/wp-content/uploads/2018/02/2016-Fiscal-Year-Summay-Benchmarking-Report.pdf
10. Secretariat of the Pacific Community (SPC) (2014). Federated States of Micronesia. Country Programme. Available from https://www.spc.int/sites/default/files/wordpresscontent/wp-
content/uploads/2017/01/Federated-States-of-Micronesia-2014.pdf
11. LIU, H., Masera, D. and Esser, L., eds. (2013). World Small Hydropower Development Report 2013. United Nations Industrial Development Organization; International Center on Small Hydro Power. Available from www.smallhydroworld.org
12. National Renewable Energy Laboratory (NREL) (2015). Energy Snapshot: Federated States of Micronesia. Available from http://www.nrel.gov/docs/fy15osti/64294.pdf
13. Federated States of Micronesia, Department of Resources and Development (2011). FSM National Energy Policy, Vol. I
14. Federated States of Micronesia, Department of Resources and Development (2011). State Energy Action Plans, Vol. II
15. Johnston, P., Vos, J., Wade, H. (2004). Pacific Regional Energy Assessment 2004: An Assessment of, the Key Energy Issues, Barriers to the Development of Renewable Energy to Mitigate Climate Change, and Capacity Development Needs for Removing the Barrier: Federal States of Micronesia National Report. Apia, Samo

238
French PolynesiaFrank lucas, University of French polynesia; International Center on Small Hydro power (ICSHp)*
Key facts
Population 283,007 1
Area 4,167 km2 3
Climate The climate of French Polynesia is tropical and humid and mitigated by trade winds. The alternation between seasons is not very contrasting: the warm and humid season runs from November to April and the drier season from May to October. The average temperature is around 25.5 °C. Average hu-midity is 80 per cent.3
Topography The islands have high volcanic peaks and low-lying coral atolls. There are 118 islands in five archipel-agos that make up roughly 3,600 km2 of emerged land. The highest peak is Mount Orohena located on Thaiti Island, at 2,241 metres.3
Rain pattern The wet season occurs from December to February, with December being the wettest month of the year. Annual rainfall varies greatly depending on the topography and winds, from 1,350 mm in the west coast of Tahiti to 3,350 mm in the east coast. 3, 16
Hydrology Numerous rivers make up the torrential regime. The rivers descend from the mountains by waterfalls and in successive steps.2
Electricity sector overview
French Polynesia consists of 118 islands grouped in five archipelagos. The production and consumption of electricity varies per island depending on remoteness, population and the installation of plants. The Electricité de Tahiti (EDT), along with its subsidiary Marama Nui, is the largest electric utility. By the end of 2017, in Tahiti and the islands, EDT generated 658 GWh of electricity, of which approximately 207 GWh (31.5 per cent) was from renewable energy sources and 450.1 GWh (68.5 per cent) from thermal power. Among renewable energy sources, 175.2 GWh (26.7 per cent) was hydropower and 31.6 GWh (4.8 per cent) was solar power (Figure1).11 Other public utilities and independent power producers (IPPs) supply the remainder, often for the more remote islands.6 2
Figure 1. Electricity generation by source in French Polynesia (GWh)
175.7
450.7
31.6
Thermal power
Hydropower
Solar power
Source: EDT11
In Tahiti, fossil fuels contribute the most to the energy mix at 61 per cent, while renewable energy sources represent the remaining 39 per cent.5 Some islands still exclusively
* WSHPDR 2016 report updated by ICSHP
use fossil fuels, which is quite costly for the island nation, as 90 per cent of fossil fuels are imported. The islands have independent grids. In the energy mix, fossil fuels remain the dominant source of energy. Tuatmotus and Gambier islands have the highest number of solar photovoltaic (PV) units, and hydropower has a large share in both Tahiti and the Marquesas Islands.5
The potential capacity for the energy sector is an additional 140 MW, with 36 per cent from renewable energy, and potential generating capacity is an additional 662 GWh, with 26 per cent from renewable energy.4 Tariffs for electricity vary depending on the type and amount of consumption (e.g. residential or commercial, 200-280 kWh or 281-400 kWh). In 2016, tariffs for residential consumption were 32.6 F CFP/kWh (0.32 US$/kWh) on average.9,10
Small hydropower sector overview
French Polynesia defines small hydropower (SHP) plants as plants that have an installed capacity of up to 10 MW. Be-tween the World Small Hydropower Development Report (WSHPDR) 2016 and WSHPDR 2019, the installed capacity has slightly increased to 48 MW, producing 153 GWh, while the potential has remained unchanged (Figure 2). Installed SHP capacity is about 49 per cent of the potential.
The Papenoo River is the largest hydropower source on Tahiti, and it has a hydropower installation. The system includes five dams and three power stations, which utilize 4 MW Pelton
5.2.7
World Small HydropoWEr dEvElopmEnt
rEport 2019

239
5.2. PIC
Ts
turbines and a VLH DE 235 kW turbine. In Tahiti, hydro-power plants have a total installed capacity of 47.2 MW and generate 150 GWh of electricity per year. In the Marquesas Islands, the total installed capacity amounts to 1.2 MW and annual generation to 2.5 GWh, providing electricity to 1,200 households (Table 1).
Figure 2. Small hydropower capacities 2013/2016/2019 in French Polynesia (MW)
0 20 40 60 80 100
PotentialCapacity
Installed Capacity
98 98 65
48 47 47
WSHPDR 2019WSHPDR 2016WSHPDR 2013
Source: WSHPDR 2013,7 WSHPDR 2016,15 EDT12
Note: The comparison is between data from WSHPDR 2013, WSHPDR 2016 and WSHPDR 2019.
Table 1.Installed small hydropower in French Polynesia
Location Site Installed capacity (MW)
Tahiti
Papenoo (Tahinu, Vainavenave, Vaitapaa,
Vaitourou, Tevainohiro)28.2
Hiti’a (1,2,3,4,5) 7.5
Vaihiria (1,2,3) 4.9
Titaaviri (1,2) 4.1
Vaite (1,2) 2.5
Marquesas Islands Hiva Oa and Nuku Hiva 1.2
Total 48.4 Source: EDT12
The Government of French Polynesia, the Agence Française de Développement and the European Investment Bank have carried out studies to expand the capacity of the existing age-ing plants, such as for the increased capacity of the Vaihiria and Vaite power plants.
Renewable energy policy
The Government of French Polynesia aims at achieving 50 per cent of the electricity generation from renewable energy by 2020 and 100 per cent by 2030. Therefore, the Government has designed several programmes for this goal, including ones targeting at the reduction of electricity prices to make them affordable for the end users.5,13
Law No. 2015-992 of August 2015 promotes the development of green energy in French Polynesia and the transition to more
sustainable types of energy. This is a multi-year programme for the period of 2015-2020. The programme was signed between French Polynesia and Agence de l’Environnement et de la Maitrise de l’Energie (ADEME) and includes search and feasibility studies, as well as awareness campaigns. However, as of 2017, two thirds of the electricity production were still dependent on thermal power, similar to the situation in 2007. The development of renewable energy sources has been modest, largely due to poor adoption of the public policies.3,13
In 2009 and 2012, studies showed that renewable energy potential in French Polynesia is mainly available in two areas, hydropower and solar power. Hydropower is more suitable for islands with mountain areas. The study recommended developing two or three projects in Pepiha Valley, which has the best hydropower potential in Tahiti. Solar power is more suitable for atolls and the studies recommended developing solar PV, but waiting for stock prices to decrease and to develop it in a regulated way. Since these studies’ publication, solar power has grown the most, as it started from almost zero, while hydropower has increased its share by 1 per cent over the past ten years.13
The late arrival of new hydropower equipment was due to a public strategy to block hydropower for 10 years, a policy which lasted until 2008, contributing to why solar power has grown faster. However, in the energy transition programme, there are plans to revitalize dams at a cost of 3.8 billion F CFP (81.6 million US$). The first part of the programme was executed in 2016. In parallel, hydropower plants are also under a programme to increase their capacity and efficiency. The project of the dam started in 2007 in the Vaiiha Valley should strongly increase the production of hydropower electricity once it is finalized.13
According to the multi-yearly investment programme (PPI), by 2020 solar power should reach an installed capacity of 22 MW (residential, commercial and utility scale) with a total annual generation of 33 GWh. As a result, the Government has implemented an incentive programme to boost PV installations by covering part of the expenses which started to slow down in 2011.3,13,14
Since 2010, French Polynesia has developed some hybrid power plants using both solar and thermal power using European funds. In July 2016, the Government has relaunched a plan to equip hybrid power plants in 8 atolls (Manihi, Hikueru, Raroia, Tureia, Takapoto, Takaroa, Fakarava and Rapa) at the cost of about 1 billion F CFP (9.8 million US$). As of 2017, only the construction of Manihi has been validated.13
On the other hand, wind power, alone or in association with thermal plants, has been extremely undeveloped. In between 1998 and 2008, wind power was tested in the Austral Islands. However, winds were not strong and mean annual speed was quite low. In addition, the stocking and maintenance of the material were costly. For all these reasons, wind power seems to not be suitable.3
Alternative systems are being implemented, such as using

240
World Small HydropoWer development report 2019
deep-sea water as a cooling mechanism for the air condition-ing needs of hotels and Taaone hospital.5
Barriers to small hydropower developmentBarriers to the development of SHP include:• Past policies: policies in the past have slowed the
development of hydropower, as has a vague strategy on renewable energy implementation;13
• Environmental and financial requirements: as of now, the Government needs to develop projects that are satisfying both environmental and financial requisites, which has slowed hydropower development, as many of the valleys with hydropower potential are often inhabited by protected species and contain archaeological sites.3,12
References
1. The World Bank (2017). French Polynesia. https://data.worldbank.org/indicator/SP.POP.TOTL?locations=PF. (accessed July 24, 2018).
2. Statistics for Development Programme, Pacific Community (n.d.). French Polynesia. Available from www.spc.int.
3. Insittut D’emission d’Outremer (IEOM) (2018). Rapport annuel 2017. http://www.ieom.fr/polynesie-francaise/publications/rapports-annuels/ (accessed July 24, 2018).
4. Joao Neiva de Figueiredo and others (2014). Green Power: Perspectives on Sustainable Electricity Generation. CRC Press, Boca Raton, FL. 2014. ISBN 13: 978-1-4665-9049-6.
5. Agence Française de Développement (2014). Renewable Energy in the Pacific Islands: An overview and exemplary projects. www.afd.fr/webdav/site/afd/shared/PUBLICATIONS/RECHERCHE/Scientifiques/Serie-grise/Energies-renouv-VA.pdf. (accessed July 24, 2018).
6. Electricité de Tahiti (EDT) (n.d.). Energies renouvelables, programme de développement. Available from www.edt.pf. (accessed July 24, 2018).
7. LIU, H., Masera, D. and Esser, L., eds. (2013). World Small Hydropower Development Report 2013. United Nations Industrial Development Organization; International Center on Small Hydro Power. Available from www.smallhydroworld.org.
8. Undata (2015). French Polynesia. http://data.un.org/Data.aspx?d=EDATA&f=cmID%3AEC (accessed July 24, 2018).
9. Electricité de Tahiti (EDT) (2016). Guide EDT électricité. https://agence.edt.pf/documents/10156/6000f322-70e6-4fcb-954f-980c3612f84a (accessed July 24, 2018)
10. Pacific Power Association (2018). Benchmarking Summary Report 2016. https://www.ppa.org.fj/publications/ (accessed July 24, 2018)
11. Electricité de Tahiti (EDT) (2017). A propos d’EDT ENGIE. http://www.edt.pf/a-propos-dedt/ (accessed July 24, 2018)
12. Electricité de Tahiti (EDT) (2017). EDT ENGIE et les aménagements hydroélectriques. http://www.edt.pf/wp-content/uploads/2018/05/EDT-ENERGIE-RENOUVELABLE-2018.pdf (accessed July 24, 2018)
13. Chambre Territoriale des Comptes Polynesie Francaise (2017). Rapport d’observations definitives. https://www.ccomptes.fr/fr/
publications/collectivite-de-la-polynesie-francaise-politique-de-lenergie (accessed July 24, 2018)
14. Depeche (2017). Une aide du pays pour investor dans le solaire. http://www.ladepeche.pf/aide-pays-investir-solaire/ (accessed July 24, 2018).
15. Xialei, C., Singh, P. R., Xianlai, W., and Kremere, E., eds. (2016). World Small Hydropower Development Report 2016. United Nations Industrial Development Organization; International Center on Small Hydro Power. Available from www.smallhydroworld.org (accessed April 23, 2018)
16. Institut de la statistique de la Polynesie Francaise (ISPF) (2013). L’environnement en Polynésie française. http://www.ispf.pf/themes/Geographie/Environnement.aspx (accessed July 24, 2018).
17. The World Bank (2017). French Polynesia. https://data.worldbank.org/indicator/AG.SRF.TOTL.K2?locations=PF (accessed July 24, 2018).

241
5.2. PIC
Ts
SamoaSione Foliaki, ministry of Finance; and International Center on Small Hydro power (ICSHp)
Key facts
Population 196,440 1
Area 2,900 km2
Climate The climate of Samoa is tropical with abundant rainfall. Humidity averages 80 per cent. The average daily temperature ranges between 22 °C and 30 °C, with very little seasonal variation. There are two major distinguishable seasons: the wet season, which extends from November to April, and the dry season from May to October. During the dry season, the climate is pleasant because of fresh trade winds.2
Topography Samoa consists of nine islands. Four islands (Upolu, Savaii, Manono and Apolima) are inhabited, while the other five (Fanuatapu, Namu’a, Nu’utele, Nu’ulua and Nu’usafee) are uninhabited. Most islands have narrow coastal plains with volcanic, rocky and rugged mountains in the interior. The lar-gest island, Savaii, rises to a maximum elevation of 1,858 metres at Mount Silisili, which is a volcano located approximately at the centre of the island.2,3
Rain pattern The wet season lasts from November to April and the dry season from May to October. An average of 75 per cent of the total annual precipitation falls during the wet season. The northern and western shores receive approximately 2,500 mm of rainfall, while inland areas receive approximately 7,500 mm per year.2
Hydrology All the rivers in Samoa are shallow and limited in extent. The longest river is the Vaisigano. However, there is some potential for hydropower development on both the Upolu and Savaii rivers.2,3
Electricity sector overview
In May 2016, the installed capacity of Samoa was 54.8 MW. Sixty-three per cent of this capacity was from diesel-fired power plants, while renewable energy sources accounted for the remaining 37 per cent (Figure 1). It should be noted, however, that the available capacity of hydropower in 2016 was significantly lower due to the damage caused to three plants by Cyclone Evans in 2012.5 Over 90 per cent of the country’s electricity generating capacity is concentrated on Upolu Island.4 Apolima Island receives all of its electricity from a 13.5 kW solar power mini-grid.6
Figure 1. Installed electricity capacity by source in Samoa (MW)
Diesel
Hydropower
Solar power
Wind power
34.7
11.9
8.1
0.1
Source: EPC,4 EPC 5
Although more recent data on the country’s total installed capacity was not available as of the writing of the present report, based on the list of newly commissioned renewable
energy power plants and projects under development, it is possible to conclude that the installed capacity of renewable energy has increased since 2016. As of March 2018, 11 solar power plants with a combined capacity of 13.51 MW and one wind power plant with a capacity of 0.55 MW were in operation. A number of other projects were under consideration or development. The total capacity of renewable energy projects to be developed or renovated on Upolu and Savaii islands is expected to reach approximately 43.7 MW, which would provide for approximately 100 per cent of local electricity demand and help save over 33 million litres of diesel fuel annually.5
Electricity generation in the 2015/2016 financial year was 142 GWh, which was 6 per cent higher than in the previous financial year. The electricity generation mix was dominated by diesel (over 67 per cent), followed by hydropower (over 24 per cent), solar power (8 per cent) and wind power (0.2 per cent) (Figure 1). While diesel remained the major source of electricity generation, it contributed less than in the previous year. Conversely, the contribution of renewable energy sources grew by more than 30 per cent.7
In 2016, the electrification rate in Samoa was at 100 per cent, both in rural and urban areas.8 Electricity consumption in 2015/2016 stood at 123 GWh, which was 5 per cent higher than in the previous year.7
5.2.8
World Small HydropoWEr dEvElopmEnt
rEport 2019

242
Figure 2. Annual electricity generation by source in Samoa (GWh)
Diesel
Hydropower
Solar power
Wind power
95.4
34.5
11.3
0.3
Source: EPC7
The electricity sector of Samoa is managed by the state-owned utility the Electric Power Corporation (EPC), which was established in 1972 under the EPC Act and is mandated to generate, transmit, distribute and sell electricity. The EPC Act was later amended by the Electricity Act 2010, which established the Office of the Regulator and opened opportunities for independent power producers (IPPs) to generate and sell electricity to EPC. The opening of the electricity sector to private companies follows the Government’s agenda to reduce dependence on imported fossil fuel and increase the share of renewable energy sources in the energy mix. Under the Community Service Obligation programme, EPC is also obliged to provide rural electrification for all of Samoa and install streetlights on behalf of the Government.9 In the 2015/2016 financial year, approximately a quarter of the company’s funding under this obligation was allocated to the Rural Electrification Project.7
In line with the Electricity Act 2010, electricity tariffs are set by EPC and are liable to approval by the Office of the Regulator. The final cost per unit of electricity is comprised of a usage charge, debt charge and energy charge. The energy charge is subject to change on a monthly basis, depending on the variations in global fuel oil prices and the contribution of IPPs. The debt charge is collected to settle loans taken for the construction of the Afulilo Dam and the Power Sector Expansion Project. The electricity tariffs as of 1 September 2018 are shown in Table 1.10,11
Table 1.Electricity tariffs as of 1 September 2018
User type kWh/units
Usage charge (WST (US$))
Debt charge (WST (US$))
Energy charge (WST (US$))
Total cost per kWh
(WST (US$))
Induction meter users
Domestic All units 0.26 (0.10) 0.07 (0.03) 0.48 (0.18) 0.81 (0.31)
Non- domestic
All units 0.36 (0.14) 0.07 (0.03) 0.48 (0.18) 0.91 (0.34)
Prepayment meter users (prepaid power)
Domestic 1-100 0.12 (0.05) 0.07 (0.03) 0.48 (0.18) 0.67 (0.25)
>100 0.26 (0.10) 0.07 (0.03) 0.48 (0.18) 0.81 (0.31)
Non- domestic
All units 0.26 (0.10) 0.07 (0.03) 0.48 (0.18) 0.81 (0.31)
Source: EPC10
Small hydropower sector overview
There is no official definition of small hydropower (SHP) in Samoa. For the purposes of this report, the standard defini-tion up to 10 MW will be used.
In the mid-2018, the total installed capacity of all SHP plants in Samoa was 13.47 MW, which supplied over 45 GWh of electricity per year.5 The potential capacity is estimated at 22 MW.6 Compared to the results of the World Small Hydropower Development Report (WSHPDR) 2016, installed capacity increased by 13 per cent due to the commissioning of two new hydropower plants and access to more accurate data on the installed capacity of each operational plant. The potential remained unchanged (Figure 3).
Figure 3. Small hydropower capacities 2013/2016/2019 in Samoa (MW)
0 5 10 15 20 25
PotentialCapacity
Installed Capacity
22.0 22.0 22.0
13.5 11.9 11.9
WSHPDR 2019WSHPDR 2016WSHPDR 2013
Source: ECP,5 WSHPDR 2016,6 WSHPDR 201312
Note: The comparison is between data from WSHPDR 2013, WSHPDR 2016 and WSHPDR 2019.
All hydropower plants existing in Samoa are small-scale. The first hydropower plant constructed in the country was the 1.05 MW Alaoa hydropower plant completed in 1959. Later on, a further four hydropower plants were commissioned: Taelefaga on the Afulilo Dam (4 MW), Lalomauga (3.5 MW), Samasoni (1.9 MW) and Fale ole F’ee (1.75 MW). In the 1990s, these five hydropower plants were supplying over 85 per cent of the country’s electricity. However, due to the growing demand, the share later declined.5,13 In 2012, heavy flooding caused by Cyclone Evans damaged three of these plants (Fale ole F’ee, Alaoa and Samasoni). Their rehabilitation was completed only five years later in 2017 with the support of the Asian Development Bank, the European Union and the Government of New Zealand.14 In mid-2018 there were seven hydropower plants in Samoa, all of them located on the island of Upolu (Table 2). The Taelefaga hydropower plant is the only reservoir-type plant, while the rest are all run-of-river plants.
EPC has plans to continue the development of hydropower in the country. This includes the plan to install the third generator of 2 MW at the Taelefaga hydropower plant, which would bring the plant’s total capacity to 6 MW. The contract for the extension was awarded in February 2018 with the planned completion date in December 2018. Another planned project is the Faleata hydropower plant on Savaii Island with a capacity of 0.20 MW and an annual generation of 0.5 GWh, which was scheduled for commissioning in the

243
5.2. PIC
Ts
mid-2018. However, as of the writing of the present report, the plant had not yet been completed. Finally, as of March 2018, the Afiamalu power plant, with 10 MW of wind power and 10 MW of pumped-storage hydropower, was undergoing the permitting and design stage.5
Table 2.Hydropower plants in Samoa
Name of the plant Installed capacity (MW)
Annual electricity generation (GWh)
Taelefaga 2 x 2.00 22.6
Lalomauga 2 x 1.75 8.2
Samasoni 1.90 2.2
Fale ole F’ee 1.75 4.2
Alaoa 1.05 3.9
Fuluasou 0.73 2.6
Tafitoala/Fausaga 0.48 1.8
Total 13.47 45.5 Source: EPC5
Renewable energy policy
The objective of the Government of Samoa is to minimize the country’s dependence on fossil fuels. In 2007, the Government endorsed the Samoa National Energy Policy (SNEP), which encourages the use of renewable energy sources, such as solar power, wind power, coconut oil, hydropower and waste. The vision of the SNEP is “to enhance the quality of life for all through access to reliable, affordable and environmentally sound energy services and supply”. In support of this vision, the overarching goal is to increase the share and contribution of renewable energy in mass production and energy services and supply by 20 per cent by the year 2030.15
In the Strategy for the Development of Samoa (SDS) 2016/17-2019/20, quality energy supply based on renewable energy sources appears as a key strategic outcome. The specific areas to work on include:• Increasing renewable energy investment and generation to
reach 100 per cent capacity for renewable energy electric-ity by 2017;
• Sustaining electricity supply access and reliability;• Improving petroleum supply management and safety and
ensuring full compliance with professional standards• Integrating climate and disaster resilience management
into transport energy policy planning and implementation activities.16
In line with the SDS, the Samoa Energy Sector Plan (SESP) 2017-2022 outlines the framework for programmes and ac-tions in order to achieve improved access to quality energy supply for all. Specific strategies for achieving this objective in the renewable energy subsector include:• Develop an overarching energy sector legislation and
supporting regulations;• Encourage and facilitate partnerships amongst sector
stakeholders;• Promote private sector investments in renewable energy;• Monitor development and implementation of renewable
energy projects;• Integrate renewable energy education in school
curriculum;• Identify specific skills development needs;• Invest in training opportunities for local personnel;• Systemic collection and publication of data on renewable
energy resources and project;• Promote uptake of renewable energy technologies for both
off-grid and on-grid applications;• Share information on renewable energy and energy
efficiency through various information dissemination platforms;
• Increase and support public awareness and education on renewable energy.17
Barriers to small hydropower developmentThe key barriers to SHP development in Samoa are:• Lack of monitoring data on water resource potential;• Low accuracy and reliability of available data on projects;• Lack of a streamlined framework for sector governance,
planning, coordination, implementation and monitoring of projects;
• Decreasing load factors on existing hydropower plants due to climate change and, in part, the removal of vegetation in the catchments;
• Resistance of communities to allow hydropower develop-ment on local river systems;
• Communities remain unaware of small grants available for renewable energy project development.6,17
References1. World Bank (2017). Samoa. Population, total. Available
from https://data.worldbank.org/indicator/SP.POP.TOTL?locations=WS
2. Samoa Meteorology Division, Ministry of Natural Resources and Environment (2011). Current and Future Climate of Samoa. Pacific Climate Change Science Programme. Available from www.cawcr.gov.au
3. Encyclopaedia Britannica (2018). Samoa. Available from https://www.britannica.com/place/Samoa-island-nation-Pacific-Ocean
4. Electric Power Corporation (EPC) (n.d.). EPC infrastructure. Case study. Available from https://www.unescap.org/sites/default/files/Session%203%20-%20SOEs%20-%20EPC_0.pdf
5. Electric Power Corporation (EPC) (2018). Electric Power Corporation Renewable Energy Development Program Generation Mix. Available from https://www.ppa.org.fj/wp-content/uploads/2018/03/120318EPC-IFB-SAMEPC-GEF01-2018-Generation-Mix-in-March-2018.pdf
6. Xialei, C., Singh, P. R., Xianlai, W., and Kremere, E., eds. (2016). World Small Hydropower Development Report 2016. United Nations Industrial Development Organization; International Center on Small Hydro Power. Available from www.smallhydroworld.org

244
World Small HydropoWer development report 2019
7. Electric Power Corporation (EPC) (2017). Annual Report 2015/2016. Available from https://www.epc.ws/images/Publications/EPC%20Annual%20Report%202015_2016%20eng%20final.pdf
8. World Bank (2016). Samoa. Access to electricity (% of population). Available from https://data.worldbank.org/indicator/EG.ELC.ACCS.ZS?locations=WS
9. Electric Power Corporation (EPC) (2016). Statement of Corporate Objectives 2017-2020. Available from https://www.epc.ws/images/Publications/SCO%202017-2020%20Eng%20to%20Legislative.pdf
10. Electric Power Corporation (EPC) (2018). Electricity rates. Available from https://www.epc.ws/index.php/home/electricity-rates
11. Office of the Regulator (2017). Determination – Electric Power Corporation (“EPC”) Multi Year Tariff Review and Proposal 2017. Available from https://regulator.gov.ws/images/Final-Determination-9-11-2017-Attch-2_amended.pdf
12. Liu, H., Masera, D. and Esser, L., eds. World Small Hydropower Development Report 2013, United Nations Industrial Development Organization; International Center on Small Hydro Power (2013)
13. Water Power & Dam Construction (2014). Developing small hydro in Samoa. Available from http://www.waterpowermagazine.com/features/featuredeveloping-small-hydro-in-samoa-4209336/
14. Radio NZ (2017). Samoa reopens damaged hydropower stations five years after Cyclone Evans. Radio NZ, 20 December 2017. Available from https://www.radionz.co.nz/international/pacific-news/346648/samoa-reopens-damaged-hydropower-stations-five-years-after-cyclone-evans
15. Ministry of Finance (2007). Samoa National Energy Policy. Available from http://prdrse4all.spc.int/system/files/final_samoa_snep_english_version.pdf
16. Ministry of Finance (2016). Strategy for the Development of Samoa 2016/17-2019/20. Available from http://extwprlegs1.fao.org/docs/pdf/sao165879.pdf
17. Ministry of Finance (2017). Samoa Energy Sector Plan 2017-2022. Available from https://www.pacificclimatechange.net/sites/default/files/documents/Samoa%20Energy%20Sector%20Plan%20%28SESP%29%202017%20-%202022%20%28English%20version%29.pdf

245
Glo
ba
l ov
erv
iew
246
World Small HydropoWEr dEvElopmEnt rEport 2019
246
World Small HydropoWEr dEvElopmEnt rEport 2019
Laboratoire de Génie Électrique d’Oran (LGEO)
Université des sciences et de la technologie
d’Oran – Mohamed Boudiaf (USTO-MB)
Guakía Ambiente Scientific Research Institute of Energy (SRIE)
Kleinwasserkraft Österreich
Pöyry Jimma University France Hydro Électricité Ea Energy Analyses Guyana Energy Agency (GEA)
La Asociación Hondureña de Energía Renovable (AHER)
The International Energy Agency Technology
Cooperation Programme on Hydropower (IEA Hydro)
International Network on Small Hydro Power (INSHP)
Komite Nasional Indonesia untuk Bendungan Besar (KNI-BB) / National Committee on
Large Dams (INACOLD)
Catalytic Innovations
Ministère de l’Energie, de l’Eau et des Hydrocarbures (MEEH)
de Madagascar
Universiti Kuala Lumpur (UniKL)
University of Mauritius Agenția pentru Eficiență Energetică (AEE) / Agency for
Energy Efficiency, Moldova
Universidade Eduardo Mondlane
IHE Delft Institute for Water Education
Asociacion de Trabajadores de Desarrollo Rural – Benjamin
Linder (ATDER-BL)
The European Bank for Reconstruction and
Development (EBRD)
Energetyka Wodna Hangzhou Regional Center (Asia-Pacific) for Small Hydro
Power (HRC)
Der Wasserwirt Ping An Bank Sarhad Rural Support Programme (SRSP)
Smart Hydro Power
247247
• LAT
IN A
ME
RI
CA
N E N E R G Y O
RG
AN
IZ
AT
ION
LATIN AMERICAN ENERGY ORGANIZATION
ORGANIZACIÓNLATINOAMERICANA DE ENERGÍA
LATIN AMERICAN ENERGY ORGANIZATION
ORGANISATION LATINO-AMERICAINE D’ENERGIE
ORGANIZAÇĀO LATINO-AMERICANA DE ENERGIA
S L O V A K U N I V E R S I T Y O FT E C H N O L O G Y I N B R A T I S L A V AF A C U L T Y O F E L E C T R I C A L E N G I N E E R I N G A N D I N F O R M A T I O N T E C H N O L O G Y
La Organización Latinoamericana de Energía
(OLADE)
SMEC - Engineering General Consultants EGC (Pvt) Ltd.
Centro de Investigaciones Hidráulicas e Hidrotécnicas
(CIHH)
Universidad Tecnológica de Panamá (UTP)
Towarzystwo Rozwoju Małych Elektrowni Wodnych
(TRMEW)
Faculdade de Ciências e Tecnologia (FCT),
Universidade Nova de Lisboa
Programa de Pequeños Subsidios (SGP) del FMAM
República Dominicana
Université Cheikh Anta Diop de Dakar (UCAD)
Slovak University of Technology in Bratislava
(STU) - Faculty of Electrical Engineering and Information
Technology (FEI)
One Earth Future Foundation
Sri Lanka Sustainable Energy Authority (SLSEA)
Sudan Energy Research Institute (ERI)
École Polytechnique Fédérale de Lausanne (EPFL)
University of Dar es Salaam (UDSM)
Faculté des Sciences Economiques et de Gestion de
Sfax (FSEGS)
Kocaeli Üniversitesi NEWPLAN Group Ltd Institute of Renewable Energy of the National Academy the Sciences of
Ukraine
The Economic Community of West African States (ECOWAS) Centre for Renewable Energy and Energy
Efficiency (ECREEE)
Universidad de Murcia Platform of Hydraulic Constructions (PL-LCH)
Turbulent Virunga PowerZhaoheng Hydropower Group HYCON GmbH

248
World Small HydropoWer development report 2019

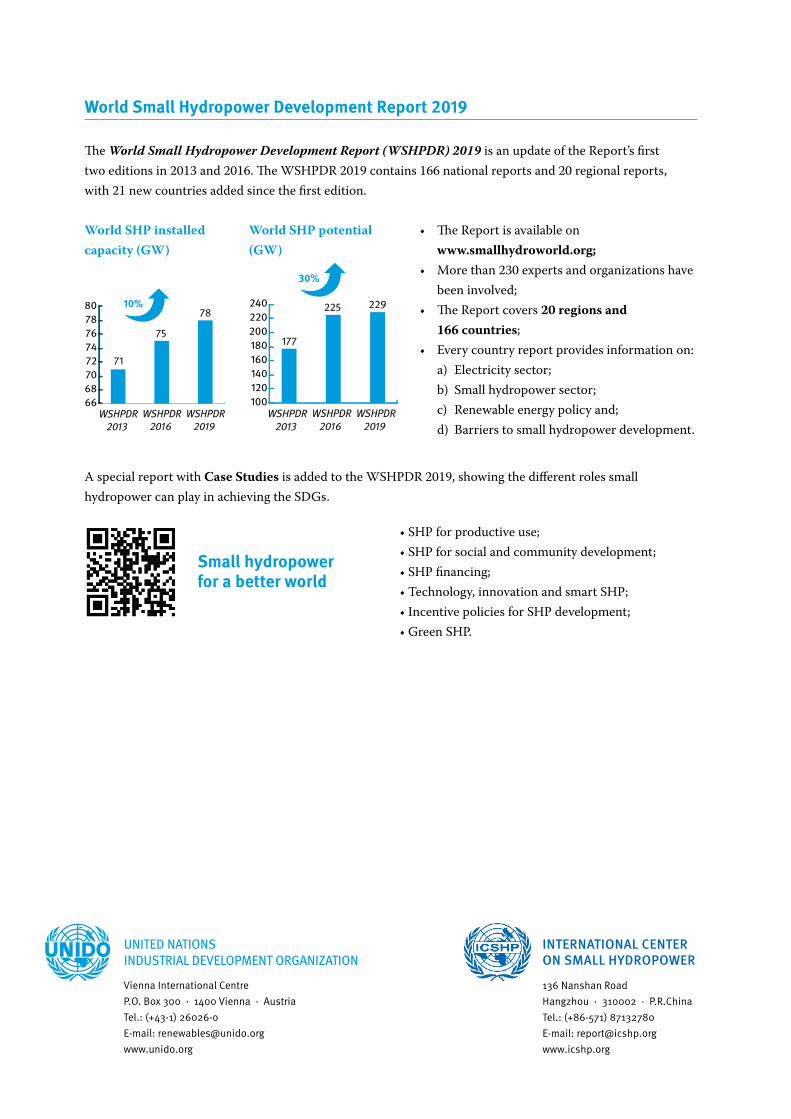
vienna International Centrep.o. Box 300 · 1400 vienna · austria tel.: (+43-1) 26026-oE-mail: [email protected]
InteRnAtIonAl centeR on smAll HYdRoPoweR
136 nanshan roadHangzhou · 310002 · p.r.Chinatel.: (+86-571) 87132780E-mail: [email protected]
World SHP installed capacity (GW)
World SHP potential (GW)
6668707274767880
71
75
7810%
WSHPDR2013
WSHPDR2016
WSHPDR2019
World Small Hydropower Development Report 2019
The World Small Hydropower Development Report (WSHPDR) 2019 is an update of the Report’s first two editions in 2013 and 2016. The WSHPDR 2019 contains 166 national reports and 20 regional reports, with 21 new countries added since the first edition.
Small hydropower for a better world
• TheReportisavailableon www.smallhydroworld.org;
• Morethan230expertsandorganizationshavebeen involved;
• TheReportcovers20 regions and 166 countries;
• Everycountryreportprovidesinformationon: a) Electricity sector; b) Small hydropower sector; c) Renewable energy policy and; d) Barriers to small hydropower development.
A special report with Case Studies is added to the WSHPDR 2019, showing the different roles small hydropower can play in achieving the SDGs.
•SHPforproductiveuse;•SHPforsocialandcommunitydevelopment;•SHPfinancing;•Technology,innovationandsmartSHP;•IncentivepoliciesforSHPdevelopment;•GreenSHP.
100120140160180200220240
177
225 229
30%
WSHPDR2013
WSHPDR2016
WSHPDR2019
Copyright © 2022 FDOKUMEN