Ashley's.pdf - Bindura University of Science Education
68
BINDURA UNIVERSITY OF SCIENCE EDUCATION FACULTY OF COMMERCE DEPARTMENT OF ACCOUNTANCY THE LEVEL OF EXPOSURE TO VAT BY SMES IN MARONDERA TOWN PRESENTED BY: ASHLEY S. CHEKERA B1542724 A DISSERTATION SUBMITTED IN PARTIAL FULFILMENT OF THE REQUIREMENTS OF THE BACHELOR OF ACCOUNTANCY HONORS DEGREE OF BINDURA UNIVERSITY OF SCIENCE EDUCATION. FACULTY OF COMMERCE APRIL 2019
-
Upload
khangminh22 -
Category
Documents
-
view
1 -
download
0
Transcript of Ashley's.pdf - Bindura University of Science Education

BINDURA UNIVERSITY OF SCIENCE EDUCATION
FACULTY OF COMMERCE
DEPARTMENT OF ACCOUNTANCY
THE LEVEL OF EXPOSURE TO VAT BY SMES IN MARONDERA TOWN
PRESENTED BY:
ASHLEY S. CHEKERA
B1542724
A DISSERTATION SUBMITTED IN PARTIAL FULFILMENT OF THE
REQUIREMENTS OF THE BACHELOR OF ACCOUNTANCY HONORS
DEGREE OF BINDURA UNIVERSITY OF SCIENCE EDUCATION.
FACULTY OF COMMERCE
APRIL 2019
i
RELEASE FORM
Name of Student : Ashley S. Chekera
Dissertation Title : The Level of exposure to VAT
by SMEs in
Marondera Town.
Degree Title : Bachelor of Accountancy
(Honours)
Degree
Year This Degree Granted : 2019
Permission is hereby granted to Bindura University of Science Education Library to
produce single copies of this dissertation and to lend or sell such copies for scholarly
or scientific research purpose only. The author reserves other publication rights and
neither non-extensive extracts from it may be printed or reproduced without the
author’s written permission.
SIGNED:
..............................................................
PERMANENT ADDRESS: 2520 Glen Norah A,
Glen Norah, Harare

ii
APPROVAL FORM
Title of Dissertation
The level exposure to VAT by SMEs in Marondera town.
To be completed by student.
I certify that this dissertation meets the preparation guidelines as presented in the
faculty guide and instructions for typing dissertations.
Signature of student.............................................. Date......................................
To be completed by the supervisor.
This dissertation is suitable for submission to the faculty. This dissertation should be
checked for conformity with the faculty guidelines.
Signature of Supervisor...................................................
Date................................
To be completed by chairperson of the department.
I certify to the best of my knowledge, that the required procedures have been followed
and the preparation criteria has been met for this dissertation.
Signature of chairperson....................................................
Date.....................................

iii
DEDICATION
I dedicate this research project to my family and friends. Thank you for your
unwavering support. To you the reader, this work is also dedicated.

iv
ABSTRACT
This study was carried out to determine the level of exposure to value added tax by
small-to-medium enterprises (SMEs) in Marondera town. The research objectives of
this research were to assess the level of awareness to VAT by SMEs, to assess the level
of VAT compliance by SMEs, to identify possible causes of VAT non-compliance
among SMEs and to determine the effect of VAT registration on the profitability of
SMEs. The descriptive research design was used with a sample size of 50 out of a target
population of 127 SMEs. Stratified random sampling was used to group the sample into
4 strata namely; hotel and catering, clothing, retail and furniture making industry. The
questionnaire with a seven-point Likert scale was used to gather data. SPSS version 25
and descriptive statistics were used to analyse data collected and it was presented with
the help of graphs, pie charts and tables. The research findings showed that there is a
significant negative (r=-0.036) correlation between the compliance level and level of
awareness to VAT. Liquidity problems and too much paper work associated with VAT
compliance were found to be major reasons for VAT non-compliance. It was also
revealed that SMEs lack knowledge and understanding on VAT issues. The findings
showed that VAT registration has an influence on the profitability of a firm. The
research therefore recommended that ZIMRA has to make awareness campaigns and
training schemes to impart knowledge among SMEs. The government has to also find
ways to reduce compliance costs on VAT compliance so as to improve the level of
compliance among SMEs.

v
ACKNOWLEDGEMENTS
I feel much honoured to have completed successfully this research project in partial
fulfilment of the requirements of my study in Bachelor of Accountancy Honours
degree.
First and foremost I would like to thank Almighty God for the spiritual guidance,
support and protection throughout my years of study, “For we are nothing but a speck
of dust in his hands.”
My heartfelt gratitude goes to my family especially my mom and younger brother for
their unwavering moral and financial support during my academic endeavours. I
would like to extend my utmost gratitude and appreciation to my beloved friends to
mention in particular, Clementine, Rumbidzai, Ruwarashe and Dolly for their
assistance throughout my years of study.
I am extremely indebted to my supervisor, who patiently guided me throughout this
project and for his factual review of the project. His comments, suggestions and useful
guidance have been invaluable inputs that improved the quality of my research; I
remain ever grateful and thankful to him.
MAY GOD BLESS YOU ALL!!!!
vi
Table of Contents
RELEASE FORM ........................................................................................................... i
APPROVAL FORM ...................................................................................................... ii
DEDICATION .............................................................................................................. iii
ABSTRACT .................................................................................................................. iv
ACKNOWLEDGEMENTS ........................................................................................... v
LIST OF ABBREVIATIONS ...................................................................................... xii
CHAPTER 1 .................................................................................................................. 1
INTRODUCTION ...................................................................................................... 1
1.0 Introduction .......................................................................................................... 1
1.1 Background of the study ................................................................................... 1
1.2 Statement of problem ........................................................................................... 2
1.3 Research objectives .............................................................................................. 2
1.4 Research Questions .............................................................................................. 3
1.5 Hypothesis ................................................................................................................ 3
1.6 Significance of the Study ..................................................................................... 3
1.7 Assumptions ......................................................................................................... 4
1.8 Delimitations of the study .................................................................................... 4
1.9 Limitations of the study ........................................................................................ 4
CHAPTER II .................................................................................................................. 5
LITERATURE REVIEW ........................................................................................... 5
2.0 Introduction .......................................................................................................... 6
2.1 Theoretical Literature ........................................................................................... 6
2.1.0 Definition of SMEs ........................................................................................ 6
2.1.1 Characteristics of SMEs. ............................................................................... 7
2.2 Taxation for SMEs ............................................................................................... 8
2.2.1 History of VAT .............................................................................................. 9
2.2.2 Advantages of VAT ....................................................................................... 9
2.2.3 Drawbacks of VAT ...................................................................................... 10
2.3 VAT registration in Zimbabwe. ......................................................................... 10
2.4 Zimbabwe’s VAT design ................................................................................... 11
2.4.1 Zimbabwe’s VAT system ................................................................................ 12
2.4.2 VAT calculation........................................................................................... 13
2.5 Level of VAT Compliance among SMEs .......................................................... 13
vii
2.5.1 Factors affecting VAT compliance in SMEs ............................................... 14
2.7 Theories of Tax Compliance .............................................................................. 18
2.7.1 Economic based theories ............................................................................. 18
2.7 Empirical Evidence ............................................................................................ 19
2.8 Gap Analysis ...................................................................................................... 22
CHAPTER III .............................................................................................................. 23
3.0 Introduction ........................................................................................................ 24
3.1 Research Design ................................................................................................. 24
3.1.1 Descriptive Research ................................................................................... 24
3.2 Population ........................................................................................................... 25
3.3 Sample and Sample size ..................................................................................... 25
3.4 Sampling Techniques ......................................................................................... 26
3.4.1 Justification of Stratified Sampling ............................................................. 27
3.5 Data Sources ....................................................................................................... 27
3.5.1Primary Source ............................................................................................. 27
3.6 Research Instruments ......................................................................................... 28
3.6.1 Questionnaires ............................................................................................. 28
3.7 Data Validity ................................................................................................... 29
3.8 Data Reliability ............................................................................................... 29
3.9 Data collection procedure ................................................................................... 30
3.10 Data presentation and analysis ......................................................................... 30
3.11 Summary .......................................................................................................... 30
CHAPTER IV .............................................................................................................. 30
DATA PRESENTATION AND ANALYSIS ............................................................. 30
4.0 Introduction ........................................................................................................ 31
4.1 Response rate of Questionnaires ........................................................................ 31
4.2 Business Type .................................................................................................... 32
4.3 Form of ownership ............................................................................................. 32
4.4 Business duration ............................................................................................... 33
4.5 The effectiveness of the VAT system in encouraging VAT compliance ........... 35
4.6 Causes of VAT non-compliance ........................................................................ 37
4.7 Level of Awareness to VAT ............................................................................... 38
4.8 The effect of VAT on firm’s profitability .......................................................... 40
viii
4.9 Relationship between VAT compliance and Level of awareness to VAT ......... 41
4.9.1 Hypothesis ................................................................................................... 41
CHAPTER V ............................................................................................................... 43
5.0Introduction ......................................................................................................... 43
5.2 Conclusions ............................................................................................................ 44
5.3Recommendations ............................................................................................... 45
5.4 Suggestions for further study ............................................................................ 46
REFERENCES ............................................................................................................ 46

ix
LIST OF FIGURES
Figure 1-Average annual turnover ............................................................................... 33
Figure 2-VAT registered firms .................................................................................... 34

x
LIST OF TABLES
Table 4. 1-Response Rate............................................................................................. 31
Table 4. 2-Type of Business ........................................................................................ 32
Table 4. 3-Business ownership .................................................................................... 32
Table 4. 4-Duration of Business Existence .................................................................. 33
Table 4. 5-Causes of VAT non-compliance................................................................. 37
Table 4. 6-Level of awareness ..................................................................................... 38
Table 4. 7-VAT registered firms and profitability ....................................................... 40
Table 4. 8-staff training costs on VAT calculation ...... Error! Bookmark not defined.
Table 4. 9-Correlation between VAT awareness and VAT compliance..................... 42

xi
LIST OF APPENDICES
APPENDIX 1-QUESTIONNAIRE ............................................................................. 51

xii
LIST OF ABBREVIATIONS
OECD The Organisation for Economic Co-operation and Development
SMEs Small and Medium Enterprises
ZIMRA Zimbabwe Revenue Authority
AFRODAD African Forum and Network on Debt and Development
VAT Value Added Tax

1

1
CHAPTER 1
INTRODUCTION
1.0 Introduction
This research gives an outline on the level of exposure to VAT by SMEs in Marondera
town. This chapter will provide an outline of the background of study, the statement of
the problem, the objectives of the study, research questions, significance of study,
assumptions, limitations of the study as well as delimitations
1.1 Background of the study
The Government of Zimbabwe largely relies on the funds collected by the Revenue
authority, through tax, that is from, import duties, corporate tax, income tax and value
added tax. It has become a major challenge to the Government, on the sources of funds,
since the greater part of the economy is dominated by informal businesses which
employ few employees. This therefore made VAT newsworthy in today’s economy,
since corporate and income tax are expected to produce less revenue than consumption-
based taxation. Value Added Tax refers to an indirect tax which is levied by government
on local and imported supplies of goods and, or services made by a registered operator,
collected at each stage of production, distribution and importation, (ZIMRA VAT Guide
(2007)2nd Edition).
In 2017 reports showed that, Zimbabwe had $5.7 billion circulating in the informal
sector following a Finscope Micro, SMEs survey, 2012, where there were 2.8million
SME owners employing 2.9 million people and contributing over 60% to the Gross
domestic Product. VAT compliance by SMEs therefore is the newsworthy issue as
Government is in quest of ways to improve efficiency in tax revenue collection. The
speedy expansion of informal sector businesses in Zimbabwe made ZIMRA, to consider
the SMEs crucial in achieving economic growth. According to Treasury, the thrust to
register SMEs for VAT is to enable the established companies to claim for input tax on
goods and services supplied by the SMEs.

2
Since Small and Medium Enterprises are the majority business tax payers in most
developing countries, their level of exposure to VAT directly impact on government tax
revenue collections since they are largely involved in trading of taxable goods and
services. In Zimbabwe, VAT was introduced in January 2004 replacing taxes such as
sales tax, betting tax, gaining tax and import tax (AFRODAD, 2011).The fact that most
SMEs are finding it difficult to get registered by ZIMRA, is somehow an indication lack
of knowledge of VAT, by tax payers.
ZIMRA could earn more tax from the SMEs through Value-added Tax (VAT), since
these businesses solely do not normally employ a large number of people. Therefore the
level of exposure to VAT by SMEs could result in their level of tax compliance.
1.2 Statement of problem
Zimbabwe Revenue Authority is failing to collect a sufficient amount of revenue to
support government’s activities despite the expectations that the VAT system will
counteract underperformance of sales tax and boost the revenue base for the
government. SME owners seem to have little or no knowledge on VAT because there
is minimum co-operation. Adesola(2012) and Glenday (2013) concurred that small
enterprises are allowed to register voluntarily by VAT systems but they are not willing
to register for VAT, hence affects revenue collection negatively. In 2017, government
of Zimbabwe issued a Value Added tax amnesty to allow SMEs to register with ZIMRA
but only 70% complied with a contribution to tax revenue of about 20%
(www.openparly.co.zw). The Government of Zimbabwe still lacks income for the
development of the country and stabilise the economy due to failure by SMEs to remit
VAT to ZIMRA. This in fact presents the need to determine the possible causes of non-
compliance of VAT by the SMEs. An understanding of whether the SME owners have
knowledge and exposure to VAT has not been determined and the gap needs to be filled.
1.3 Research objectives
This study is aimed to achieve the following objectives:
i. To assess the level of awareness to VAT by SMEs.
ii. To assess the level of VAT compliance by SMEs.
iii. To identify possible causes of VAT non-compliance among SMEs
iv. To determine the effect of VAT registration on the profitability of SMEs

3
1.4 Research Questions
i. How does level of awareness to VAT by SMEs affect their level of
compliance?
ii. How effective is the VAT system in encouraging VAT compliance
among SMEs?
iii. What are the possible causes of non-VAT compliance among SMEs?
iv. What are the implications of VAT registration on profitability of SMEs?
1.5 Hypothesis
Ho: there is no relationship between VAT compliance and level of awareness to VAT
H1: there is a relationship between VAT compliance and level of awareness to VAT
1.6 Significance of the Study
To Researcher
This study enabled the researcher to gain much relevant knowledge, invaluable
experience on VAT and greater understanding on SME operations. The research also
provides a future platform for further researches to improve Value Added Tax operation
systems among the SMEs.
To Bindura University of Science Education
This study will help Bindura University students to have a deeper and professional
understanding in VAT. It will also be used by other scholars as literature review and as
a path for further study.
To the Tax Administrators
This research will equip tax administrators on how best they can impart knowledge
about VAT to SME owners, so that there is an improvement in VAT compliance by
those business owners, as well as surpassing their targets. This study therefore will help
in developing and redesigning suitable VAT system and compliance challenges in the
economy.
To the Government

4
The findings of this research will give government a path to initiate and modify the
Revenue Acts to ensure their effectiveness in developing compliance among SMEs.
1.7 Assumptions
This study based on the following assumptions:
Sample selected is a representative of the perception of taxpayers and
their level of exposure.
Responses given by the respondents will be genuine and give all relevant
information.
Information to be provided by respondents is confidential.
1.8 Delimitations of the study
This research was limited on the views and opinions of SMEs in Marondera town; it did
not consider those of big, well established companies. This division is largely
dominated by SME operators than big companies. It focused mainly on the level of
knowledge of VAT by SMEs and their level of compliance as required by the VAT Act.
1.9 Limitations of the study
The subject under study was a bit sensitive; therefore the respondents could not honestly
express their opinions. In addition, because of fear by SME operators that they might
be exposed off for VAT non-compliance, there was no assurance that the respondents
will return all the questionnaires. The research was also limited to public available
information since some information relating to VAT issues cannot be readily available
from ZIMRA offices for confidentiality purposes.
However, to alleviate those limitations, the researcher guaranteed the respondents that
the data collected for this research will be kept with strictest confidentiality. The
researcher had a thorough explanation about the significance of this study to the
respondents and that it is solely for academic purposes and that the researcher was not
a representative of the tax officials.
Definition of terms
SMEs- these are informal business operators that employ a minimum number of five
employees and have an annual turnover less than $1 million (SMEAZ, 2012)
5
VAT- is a type of consumption tax that is placed on a product whenever value is added
at a stage of production and final sale. It is levied on transactions rather than person
(Investopedia, 2013).
Value added tax compliance: refers to the degree to which a tax payer complies or
fails to comply with the tax rules of his or her country (Stiglitz, 1985)
Tax compliance- this refers to the most neutral term to describe the taxpayer’s
willingness to pay their taxes (Kirchler, 2007).
Tax non-compliance - is the failure of the taxpayer to meet tax obligations, irrespective
of whether this is committed intentionally or not (James and Alley, 2002)
CHAPTER II
LITERATURE REVIEW

6
2.0 Introduction
This chapter reviews, explores and cites what other relevant studies of the same subject
matter have found as the researcher tried to find explanations to her findings. Literature
review enables the researcher to detect research gaps in the study at hand and compare
her findings with those of other researchers. Shuttleworth (2009), propounded that,
literature review is a summary and synopsis of a particular area of research, allowing
anybody reading the paper to establish why you are pursuing this particular research
program. To convey the research problem into centre of attention, the study is of two
folds, that is, the theoretical fold which deals with the conceptual elements leading to
the appropriate evaluation criterion and the empirical fold which deals with assessing
previous studies.
2.1 Theoretical Literature
2.1.0 Definition of SMEs
Definition of SMEs differs from one country to another. Advocates found that,
definitions of SMEs differ quite widely from nation to nation, depending on who is
providing the definition. Kim and Gallent, 2002 & Tevera 1998 also suggested that,
there is no commonly accepted definition of SMEs. Different variables are considered
in determining whether an entity is an SME or not, basing on factors such as, number
of employees, turnover levels, capital net assets and capital base, (Hisrich et al, 2004).
Description of SMEs and features were once based on non-current assets mainly but
this was not giving a clear definition, some other items were later on used such as
employment levels, annual turnover, annual balance sheet total and some jurisdictions
still use total assets in addition (Nkwe, 2013). SMEs are categorised into three, which
are, the Small, Micro and medium enterprises.
In Botswana, Small enterprises are defined as those that employ less than 25 workers
and earning an annual sales turnover between P60 000 and P1 500 000, medium
enterprises employ not more than 100 workers and their annual turnover is between P
1 500 000 and P5 000 000 (Nkwe, 2013). An SME in South Africa is defined as any
business with less than two hundred employees, annual turnover of less than ZAR5
million, capital assets of less than ZAR2 million, and with owners who are directly
involved in the management of the business.

7
According to the Small and medium Enterprise Act in Zimbabwe, the Ministry defined
small enterprise as a registered organisation employing 30 to 100 employees. In
addition, the Small Enterprises Development Corporation (SEDCO, 2010) went on to
define small and medium entity as that enterprise employing not more than 100 workers
and earning a maximum turnover of up to $800 000 per annum. Small-medium
enterprises are defined in terms of turnover and value of assets by Small-Medium
Enterprise Association of Zimbabwe (SMEAZ, 2012). The small enterprises are
categorized in a class of those with turnover of less than US$240 000 or assets less than
US$100 000 annually, medium enterprises are those with an annual turnover and assets
above those of small enterprises but less than US$1 million. However, definitions of an
SME vary from one nation to another, there is no collectively approved definition of an
SME therefore, for the purpose of this study, an SME is regarded as an entity that
employs less than 100 people, generating less than US$1 million in annual turnover,
registered or non-registered.
2.1.1 Characteristics of SMEs.
Masarirambi (2013), characterised SMEs in Zimbabwe as diverse collection from small
workshops making furniture, metal parts to medium-sized producers of machinery as
well as service providers such as restaurants, consulting hairdressing and computer
software firms. SME operators have different perspectives in the case of business
structure; some wants to remain small, while others are focused on expansion and
inventive. A number of SME characteristics are discussed below, according to
Matsebula (1996).
i. Ease of entrance
Small enterprises require a low start up capital as compared to bigger ones; therefore
this makes it easier for them to enter into the market. There are fewer barriers to entry
into the informal sector such that at any given time an individual can start venture and
compete in informal sector. (Ojeka, 2012)
ii. Sole or few individual ownership
Small business enterprises are usually run by a sole proprietor and due to lack of funds
to employ more individuals; they employ an average of four depending on the type of
the business, Yanksan (1989). Family labour tends to be the cheapest source of labour

8
to the business. Farell and Fleming, (2000) added that, the majority of the businesses in
the informal sector are dominated by family ownership.
iii. Highly dependent on indigenous resources
SMEs heavily depend or rely on locally sourced resources and usually serve as suppliers
of the local manufacturing companies and also they are usually labour intensive,
Hanefah, Ariff & Kasipillai (2002). Most SME operators lack knowledge of the
international market and exposure, some have a negative perception towards
international markets and has low risk appetite, and this limits them from growing and
earning more foreign currency (ZIMRA, 2015).
iv. Unregulated and competitive markets.
The economy of today is largely dominated with SMEs but they are omnipresent and
flexible hence it is difficult for local authorities and government to regulate the sector.
This therefore results in stiff completion and it is the survival of the fittest from both
the formal and informal competitors. A practical example can be observed at Glenview
area 8 wood complex for furniture manufacturing.
v. Narrow range of source of income
Most SME operators lack collateral security, hence they have a reduced income base
since financial institutions lack trust on them. They cannot borrow large sums of money
from some of the financial institutions hence reduced chances of growth and increased
financial problems.
2.2 Taxation for SMEs
Zimbabwean tax system comprises of different tax heads which are regulated by the
government through a revenue collection board called ZIMRA. Tax collected is
grouped into two categories or types, which are, indirect and direct taxes. Direct taxes
include the corporate tax, Pay As You Earn (PAYE), Investment income tax, capital
gains tax, Estate duty tax and Presumptive tax. On the other hand, indirect tax includes,
Value Added Tax (VAT), Sales tax, Customs and exercise duty. SMEs are therefore
subject to any or all of the mentioned tax obligations. However, this research dwelled
much on VAT in SMEs as they are dominating the Zimbabwean economy through
buying and selling goods.
9
2.2.1 History of VAT
Value Added Tax was first introduced by a German economist during the 18th century.
He devised a sales tax on goods that did not affect the cost of producing or distribution
but rather, it was collected on the absolute price charged to the end user (consumer).
This therefore means that, the tax was always fixed on the final price as it did not matter
how numerous transactions the goods went through.
In 1954, upon the development of the Common Market in Europe (European Union) it
came to a decision that one condition of joining was the imposition of a form of VAT.
Sales tax was later on replaced with VAT, by UK when it joined the European Union
in 1973. In most of the Western European nations, VAT has now become a major part
of the tax structure. www.encylopedia.com.
According to the research done by an economist at the International Monetary fund,
Jean Francois Ruhashynkiko and Richard Stern, the regional Coordinator for Africa at
the International Finance Corporation, World Bank Group, they referred to the incentive
structure of tax system in Africa. The colonial tax system remained the same until the
fiscal crisis of the 1980s in Africa. The introduction of VAT then lately emanate from
the tax recommendations involving flattening tax rates and broadening tax bases. Small
business taxpayers in Africa often pose extraordinary challenges, and they are referred
to as “hard to tax”.
2.2.2 Advantages of VAT
Easy to administer- VAT is collected in every stage of the production line,
therefore it makes it a practical benefit as compared to sales tax. Furthermore,
VAT allows the fiscal authority to evaluate accounted sales of each
intermediate good with reported purchases; hence gives an advantage of easier
enforcement.(J. Aizenman et al, 2005).
J. Aizenman et al, 2005 added that, increased VAT collection points due to
existence of registered traders at each state of production chain thereby
minimising the risk of substantial losses due to evasion and avoidance by single
trader.
Centralisation of the tax refunds as stated by the Zimbabwe Value Added Tax
Act [Chapter 23:12] section 44, that the approval only rests with the
Commissioner General after the provision of an acceptable proof of a
legitimate refund claim, increases revenue security.

10
Wider tax base- VAT is nonaligned as it does not discriminate between
industries or between capital and revenue expenses of the business. This
therefore increases the tax base to the government as compared to sales tax.
High level of tax compliance is expected from traders as the tax authority has
a higher visibility under the VAT system.
Competitive exports- direct exports are exposed at a special rate of 0%,
therefore the prices of goods exported does not include VAT which make them
more competitive internationally.
2.2.3 Drawbacks of VAT
Increase the aggregate tax burden to taxpayers- it is evidenced that VAT
increases the tax burden by 50% in Europe, M Keen et al (2007. He further
stated that, as firms try to keep their product prices competitive, they tend to cut
other factor costs such labour costs by shifting to capital intensive.
Advocates of VAT suggest that VAT has a number of disadvantages. It is
believed that it is inflationary, regressive, complex, costly to administer, comply
with and in practice discriminatory.
Inflationary- imposition of tax on consumption may raise prices of goods
indefinitely so that the traders maintain their profit margins.
Regressive- VAT lacks fairness, as the tax charged on consumption is the same,
whether on low-income earners and high –income earners. This is regressive in
the sense that the percentage of VAT charged to low-income persons tends to
be higher than that of the high-income earners.
Complexity- different rates and exemptions of VAT has been practically proved
to be complex in many different countries. This also increases the cost of
administering VAT by both the government and the business enterprises.
Accounting cost- the VAT system largely relies on the invoices and this
relatively requires the upkeep of detailed records of all tax invoices by the
registered operators. This increases the work and burden to the registered
operators.
2.3 VAT registration in Zimbabwe.
Value Added Tax (VAT) is an indirect tax on consumption, charged on the supply of
taxable goods and services and its effect is independent of the level of profits. VAT can

11
be charged by any person registered or required to be registered for VAT, carrying on
trade as defined in the legislation (www.zimra.co.zw). Input tax is the VAT paid on
purchases of taxable supplies made by the registered operator. Output tax is charged on
the sales made by the registered operator on taxable supplies. VAT refunded or payable
to ZIMRA is calculated by the registered operator, by deducting output tax from input
tax. VAT refund occurs when the output tax is less than the input tax and VAT payable,
when output tax is more than input tax.
VAT registration is compulsory to traders whose taxable supplies exceed or are likely
to exceed $60, 000.00 in a period of 12months. It is also voluntary to traders whose
taxable supplies do not meet or exceed the $60, 000.00 and have not in past failed to
comply with the legislation (ZIMRA 2004). In the case that the operator meets or
exceeds a turnover threshold level but fails to register, the Commissioner General of
ZIMRA will apply Section 23(4) (b) of VAT Act. The operator will therefore be
registered compulsorily by the Commissioner General and will be entitled to pay the
VAT due, interest and penalties on the computed debt (ZIMRA 2014).
ZIMRA (2014), clearly stated that, traders who will be solely dealing in exempt supplies
specified in terms of Section 11 (a-j) of VAT act, may be excluded from registration of
VAT. In addition, an employee providing service to his/her employer or conducting
private or recreational pursuit or hobby whose taxable turnover does not meet or exceed
$60 000,00 annually are not liable to be registered operators for VAT purposes
(ZIMRA, 2014).
2.4 Zimbabwe’s VAT design
The Zimbabwe’s VAT Act [Chapter 23:12] states that, the administering and
management of VAT rest with ZIMRA which is chiefly headed by the Commissioner
General of Revenues. The Minister of Finance appoints the Commissioner General with
the power vested in him/her by the Government of Zimbabwe. VAT is charged on local
and imported supplies of goods and or, services made by a registered operator. Taxable
supplies are defined in the ZIMRA VAT Guide (2007) as supplies that are chargeable
at a standard rate of 15%. Some goods are zero rated supplies, of which VAT is charged
at 0%. Zero rated supplies include foodstuffs such as; uncooked beef, uncooked fish,
milk and milk products, fresh birds, eggs, plain bread, mealie-meal etc. VAT Act also
states that, supplies of goods and services on which VAT is not chargeable and not form
12
part of the taxable turnover are exempt supplies. Examples of exempt supplies include
financial services, provision of electricity and piped water for domestic use, rates
charged by Local Authorities, educational services, medical services supplied by any
person on institution and fuel.
2.4.1 Zimbabwe’s VAT system
The filing, submission and payment processes of VAT differ from one country to
another. Most countries are said to have a single stated day on which they remit their
taxes as it is believed to be time consuming, Liam et al (2001). They further stated that,
this payment date, which is the due date, is characterised by long queues at banks for
deposits and at the offices where the returns are submitted.
In Zimbabwe, tax payers are arranged into four categories, that is, category A to D as
outlined in the VAT Act Chapter 23:12, Section 27. Submission of returns and payment
for VAT to the Commissioner is required to be done in accordance with the stated tax
periods.
Category A: Two-month period ending on the 1st day of January, March, May,
July, September and November.
Category B: A two-month period ending on the last day of; February, April,
June, August, October and December.
Category C: Monthly basis submission of VAT returns, (One month tax period)
Category D: This category is meant for registered traders in farming, with
turnover not more than or not likely to exceed the prescribed amount per annum.
Also registered tax payers will be allowed upon approval of a written application
to the Commissioner.
However, due to hyperinflation in Zimbabwe to date, all tax payers are to comply with
category C requirements. According to ZIMRA website www.zimra.co.zw, the
registered operator is obliged to calculate and remit VAT due to the Commissioner
General of ZIMRA on or before the 25th of every month.
VAT returns can be physically submitted to the authority offices, through post offices,
or electronically. Zimbabwean VAT system allows tax payers to submit returns online
and payments should be made through the banks, www.zimra.co.zw.

13
2.4.2 VAT calculation
Value added tax is charged on goods rather than persons’ income. There are two
recommended methods of calculating VAT which are: Subtractive procedure and
Addictive procedure.
i. Subtractive Procedure
This method of calculating VAT is the one used in Zimbabwe, where the taxpayer
simply has to subtract the input tax from the output tax and determine VAT payable
or refundable thereof (ZIMRA website, www.zimra.co.zw). VAT collected from
selling the products is the output tax and that incurred in acquiring taxable supplies
is the input tax. Subtractive method can be expressed as follows:
VAT Due/ Refundable = output tax – Input tax
Therefore, VAT liability under this method is the amount payable by a trader for
VAT, determined through subtracting VAT paid on purchases (input tax) from VAT
collected on sales (output tax), I.N Grand et al (2001).
ii. Addictive Procedure
The second method of calculating VAT has been stated by R.W Lindholm (1976) as the
Addictive procedure. This method determines taxable value added by finding the
difference between selling price and the purchase price. The tax base applied to VAT
under this procedure is the total payment of the factors of production, which are income
to the owners of production.
2.5 Level of VAT Compliance among SMEs
Tax compliance can be defined as the most neutral term to describe taxpayers’
willingness to pay their taxes, Kirchler (2007). Singh (2003) also defined tax
compliance as person’s act of filing returns, declaring all taxable income accurately and
disbursing all payable taxes within a stipulated time without waiting for any follow ups
from the authority. VAT compliance therefore simply means that, the firm is registered
as required by the law, file the returns on time, accurately reports complete information
to determine VAT due or refundable, keeps proper books of accounts and remit all
amounts due as and when required by the authority.
14
Most existing large or macro business enterprises were at one point small businesses;
therefore SMEs of today are future large companies. Thus, today’s SMEs have to be
nurtured to ensure highest level of compliance among them for a better tomorrow.
2.5.1 Factors affecting VAT compliance in SMEs
a) Income level
Income levels of taxpayers tend to play an important role in decision making upon
compliance. Income levels differ from one business to another depending on the
business activities involved in that business. Low-income earners tend to be less
compliant than those high-income earners since their income would be sufficient to
meet the organisational commitments (Torgler, 2007). VAT still stands as the most
important sources of revenue on which registered taxpayers invest before remitting to
the tax authorities. Ainsworth & Madhazhovaral, (2010) advocated that, increases in
VAT rates give rise to an advanced spread of fraudulent schemes due to availability of
significant amounts of VAT supposed to be payable to tax authorities. Financially
struggling firms have increased chances of evading from tax as an alternative source of
finance to the business operations and fail to remit VAT withheld from customers
(output tax), International Monetary Fund, 2009)
Furthermore, taxpayers can take advantage of inflation rates and make exaggerated
claims for credit for input tax because an inflated amount increases the net income and
fraudulently reducing the tax liability and minimise tax due to revenue authorities.
Businesses minimize VAT liability may be minimised by overstating purchase costs or
understate sales proceeds, (Slenmrod & Gillitzer, 2013). Keen & Smith (2007)
propounded that some business activities may be omitted from the company’s books
allowing them to understate the sales made and also understate their purchases thereby
reducing their tax liability.
In addition, with the aim to maximise income levels, taxpayers tends to exaggerate the
tax liability through misallocations of taxable supplies to lower-taxed categories, (GTZ,
2010; Keen & Smith 2007). The issue of underreporting is more likely in high-income
earners than low-income taxpayers since they contribute a considerable proportion to
VAT revenue, thereby giving them greater chances to misreport since it is more likely
to deter them from evading due to loss of potential revenue, (Franzoni, 1999).

15
Duverne, (1990) gave a practical example which happened in France whereby from the
audited VAT operators, 66% had understated the value of taxable sales having 25% of
them fraudulently reported and 40% had overstated the value of taxable inputs having
aim of income maximisation thus signifying the impact of income to level of
compliance.
To add on, Zimbabwean VAT system is based on the invoices, both the purchases and
sales. However, in the case that there are delays in the payment of goods by the credit
customer, VAT bill will burden the registered operator, which might result in VAT non-
compliance, (Ainsworth & Madzharova, 2012:12).
b) Administrative procedures
Administrative procedures are measures or aims designed by a tax authority to
effectively and efficiently manage the tax system at the same time discharging its
responsibilities. These actions influence the level of compliance of business operators.
i. Mode or method of remitting VAT
Complex and time consuming modes of payment reduce the level of compliance to VAT
by business enterprises. Countries with online payment for VAT tends to have less
compliance challenges as it takes less time on average to comply as compared to those
ones who do not, (PricewaterhouseCoopers, 2010). Manual and traditional ways of
remitting tax to tax authorities is prone to errors, therefore countries with electronic tax
systems reduces errors, improves efficiency, takes less processing time and reduces
administration costs, (Araki & Claus, 2014:42, Ernst & Young, 2014 &
PricewaterhouseCoopers, 2013).
ii. Frequency of VAT returns requirement.
The rate of recurrence and number of returns at which VAT returns are required affects
the length of time period taken by the taxpayer to comply. Depending on the category
taxpayer is in, the VAT returns in Zimbabwe are required on monthly basis or after two
months. As evidenced that time taken to comply is more than that of where returns are
required, either semi-annually or quarterly. PricewaterhouseCoopers confirmed this
through an analysis which proved that in economies where returns are filed in a monthly
basis compliance took more time than those filed quarterly or semi-annually,

16
(PricewaterhouseCoopers, 2010). The fact that the Zimbabwean taxpayers are required
to remit on or before 25th of the following month, implicates the compliance time.
iii. Details of Transactions
Contents required by the Tax Administrators on the VAT returns affect the rate of
compliance by SMEs. The more and complex the transactions required, the lesser the
rate of compliance because more time will be needed to compile the information. Ernst
& Young, (2014) propounded that, economies that requires taxpayers to submit any
additional information makes compliance obligations extremely onerous. Zimbabwean
VAT Act requires the taxpayers to submit the purchases made with the corresponding
list of supplies, their invoice numbers and VAT registration numbers which were made,
also the original invoices will be required when there is need for inspection at the
operator’s office, (ZIMRA, 2014). Evans et al as cited by Maseko (2014) agreed to the
fact that poor record keeping results in higher costs of compliance for SMEs in terms
of time that is considered to be scarce thereby encouraging SMEs to remain informal
and thereby not comply with tax legislature
iv. Number of tax Administrators
The number of tax administrators in an economy greatly affects the time taken to
comply by taxpayers, (PricewaterhouseCoopers, 2013). Specialisation in tax
administrators in different types of tax increases VAT compliance time, it is evidenced
that, for nations or economies where value added tax is administered by the same tax
authority as the one that deals with corporate income tax, compliance is easier,
(PricewaterhouseCoopers, 2010 & 2013).
c) VAT understanding by taxpayers
Value Added Tax compliance behaviour is greatly influenced by tax understanding in
taxpayers. VAT understanding is determined by the level of taxpayer to interpret
taxation laws and Acts, their willingness and ability to comply. Kasipillai (2003)
elaborated that, the tax understanding that relay to compliance is the general
understanding about taxation regulations and information pertaining to the opportunity
to evade tax. Informing taxpayers on how and where the money collected is spent by
the government, its role in national development and how VAT Act is applied is helpful
in public awareness to VAT, (Mohd, 2010). Hite and Hasseldine (2001) emphasised
17
that, it is the duty of the tax Authorities to have teachings on tax courses because it has
an impact of understanding on compliance.
d) Taxpayer’s Attitude
According to Ajzen’s (1991) Theory of Planned Behaviour, attitude is defined as an
individual’s own personal views about behaviour. To relate with VAT, taxpayers’
attitudes can be explained as either positive or negative views of tax compliance
behaviour. VAT compliance would mean positive views and non-compliance represents
negative views. Taxpayers’ attitude differs significantly, some comply, but some do not
even keep proper documentation required for VAT purposes. Bradley (1994) also
proposed that attitude on a person’s own tax avoidance, and attitude concerning other
persons’ elusive behaviours are considerable. For instance, utilizing state income to, for
example, primary amenities like health, electricity and public transport will increase the
propensity to comply on a voluntary basis.
2.6 Causes of VAT non-compliance
a) VAT compliance costs
Sandford, Godwin and Hardwick defined tax compliance costs as, “the costs incurred
by taxpayers and third parties in meeting the requirements laid upon them in complying
with a given structure and level of tax”. Research carried out by Eichfelder and
Vaillancourt, reviewed that tax compliance costs tend to be high internationally and it
is a problem not limited to a specific nation or specific country. These costs are also
believed to be much regressive and have a great impact on smaller enterprises relative
to their size.
Schmidt et al, (2007) propounded that, it is an overburden to the SME owners on top
of the existing workloads to go through all their paperwork and keep them updated on
legislation he went on to add that, unlike larger enterprises, SMEs has to go over manual
checks and filing which often is associated with higher variable costs.
b) Lack of knowledge of VAT by SMES
From the view of Schmidt et al (2007), stated that most SME owners lacks knowledge
and awareness of what needs to be done and also distorted individual perceptions of
potential costs and benefits of complying with VAT. They further suggested that
18
information from the authority on VAT issues usually is disseminated via the Internet,
which normally SMEs does not make use of, therefore increases the rate of unawareness
of tax regulations.
c) Complex VAT systems
In a research carried out by S. Smulders & C. Evans (2016), they stated that many
advocates found VAT system designs to be a contributing factor to VAT non-
compliance. The use of single against multiple rates, registration thresholds, numerous
exemptions and zero-rated items, invoicing, bookkeeping requirements and special
rules for small businesses; can all influence VAT compliance. In addition, Eichfelder
and Vaillancourt also concurred that, other factors that influence VAT compliance
includes frequency of reporting, documentation requirements and cost of audits, appeals
and litigation levels.
2.7 Theories of Tax Compliance
Tax compliance among tax payers can be classified in different tax theories depending
on the nature and basis of compliance behaviour of tax payers. One of these theories is
the economic based theory which emphasises on incentives (Trivedi and Shehata,
2005). This research is based on the economic based theories.
2.7.1 Economic based theories
This theory has a basic assumption that people are free-riders and voluntary contribution
to the government is quite a problem unless the threat of punishment makes it sensible.
According to Trivedi and Shehata (2005) as quoted by Omweri et al (2010), concurred
that taxpayers maximises moral utility by weighing economic consequences of various
compliant alternatives such as whether or not to evade tax, the chances of being detected
and the consequences thereof, then make a choice on the alternatives that gives the
highest after-tax profit. Economic based theory is therefore based on the idea that
taxpayers’ behaviour towards compliance is influenced by economic aims and
objectives such as profit maximization and the likelihood of detection. Therefore to
increase value added tax compliance level, audits and penalties for non compliance
should be increased as it increases the likelihood of detection.

19
2.7 Empirical Evidence
2.7.1 O. Zivanai, F. Chari & C. Nyakurimwa: Tax compliance challenges in
fulfilling tax obligations among SMEs in Zimbabwe: A survey of SMEs in Bindura
(2015)
The research was carried out to assess tax compliance issues in SMEs in fulfilling their
tax obligations. A survey of SMEs in Bindura town was used as a sample for the
investigation. The foremost objectives of the study were to verify on the causes of tax
compliance or non-compliance among SMEs and to assess the effectiveness of the
presumptive tax system in formalisation of informal sector. A sample size of 30 SMEs
was used with 5 strata. The findings of the study concluded that, the majority of informal
traders are not tax compliant due to apparent high tax rates, low chance of detection,
lack of confidence in revenue authority and the fact that most informal traders are
evading taxes. Recommendations made were; to give tax benefits to large companies
for trading with compliant SMEs, use tax agents, have tax audits, enforce tax laws and
launch awareness campaigns on presumptive tax, as this would help SMEs to be
compliant.
2.7.2 M. N. Thiga & W. Muturi (2015): Factors that influence compliance with tax
laws among Small and Medium Sized Enterprises in Kenya
The study aimed at analysing the factors influencing tax compliance among SMEs in
Kenya. A sample size of 400 SMEs, in Kiambu County, was drawn from a target
population of 2541 in Kenya. Results extracted from that research showed that tax rates
and tax compliance costs are the major contributing factors in tax compliance. It further
revealed that, low tax rates and low tax compliance are associated with high levels of
tax compliance. Furthermore, the study concluded that tax compliance cost have the
most momentous effect on tax compliance. The study recommended that the revenue
authority should, implement more tax incentives, improve tax awareness, set out
favourable tax rates, increase tax penalties and reduce tax compliance costs.
2.7.3 Akinboade O. A. (2015): Correlates of tax compliance of Small and Medium
Size Businesses in Cameroon.
The objective of the study was to assess tax compliance by small and medium size
businesses in Cameroon. A sample size of 575 SME operators was investigated, from

20
two different regions, Central and Littoral. The results of the study showed that, high
registration cost and time-consuming processes promote non-compliance of SME
operators. The perception that the taxpayer has to go through many departments in the
process reduces the probability of compliance. This study recommended that,
perceiving the tax system as easy to understand and consistent promotes tax compliance.
In addition, good response to enquiries by tax authorities during registration process is
believed to improve tax compliance.
2.7.4Amayi G C and Machogu B J (2013): The effects of taxpayer education on
voluntary tax compliance among SMEs in Mwanza City- Tanzania.
The researchers aimed at establishing the level of tax education, tax compliance level
and how tax education affects voluntary compliance among SMEs in Mwanza city-
Tanzania. Twenty-five questionnaires were used to collect data using descriptive survey
method. The research findings showed that the majority have basic tax education which
helped them to gain knowledge and awareness of their rights and obligations on taxation
issues and procedures for remitting taxes. The findings also showed that the level of
taxpayer education affect compliance and it was concluded that the two are positively
related. The researchers recommended that government should make efforts to impart
tax knowledge to individuals and to the business environment. They also suggested that
taxation should be educated at all levels of education, that is, from primary school
upwards with an aim to promote voluntary compliance.
2.7.5 Maseko N. (2014): the impact of personal tax knowledge and compliance costs
on tax compliance behaviour of SMEs in Zimbabwe, Harare, Bindura and
Chitungwiza.
The study was designed to investigate on how SMEs’ unique business conditions,
perceptions towards tax, levels of personal tax knowledge and compliance costs affect
their tax compliance behaviour. A sample size of 13 taxpayers was used, and a
qualitative research design was adopted. Primary research was used to collect data
through face-to-face interviews. Results from the study indicated that business
conditions encompassed by SMEs are different from those of bigger companies, and
this therefore makes them bear high tax compliance decisions. The study then concluded
that, to improve voluntary tax compliance by SMEs, ZIMRA is recommended to update
21
taxpayers with information on tax rates, tax credits and tax allowances through the print
media and press in order to improve the levels of personal tax knowledge.
2.7.6 Faridy, N, et al (2014): Complexity, Compliance costs and Non-Compliance
with VAT by Small and Medium Enterprises in Bangladesh: Is there a
Relationship?
The study aimed at investigating the nature and extent of the relationships between the
complexity of VAT legislation, the costs of compliance with VAT and non-compliance
with VAT legislation by SMEs in Bangladesh. It was gathered by way of focus groups
through interviews and survey through a purposive sample of SME taxpayers in
Bangladesh. The results of this research revealed that, the complexity in VAT law and
compliance costs are the most significant factors influencing VAT non-compliance in
SMEs. In addition, audits and penalties have been found to have less effect on VAT
non-compliance for non-compliant taxpayers. This therefore revealed that, to get rid of
VAT non-compliance through audits and penalties appeared to be complicated. The
study also revealed that, reduction in compliance cost would not essentially improve
compliance by non-compliant VAT payers, but it might for compliant VAT payers.
2.7.7 Nyamwanza T, et al (2014): An analysis of SME’s Attitudes and Practices
Towards Tax Compliance in Zimbabwe.
The study was carried out to assess the level of tax compliance among SMEs and impact
on business operations, to assess the communication methods used in informing SMEs
about regulatory developments and to assess the importance of regulatory compliance
for SMEs and its costs. A sample of fifty businesses in the retail sector in Gweru was
used to gather data about this research. The findings from this research revealed that,
least efforts are being put in place to impose compliance and also the tax collection
officials are corrupted, their level of corruption is high. Contrary to a research made by
Faridy et al (2014), penalties have been found to be the most effective in enforcing
compliance. The research also recommended that, publicity through radios, televisions
and pamphlets should be increased by authorities. Furthermore, ZIMRA is
recommended to give business people more formal tax education to enhance
understanding of tax obligations and compliance.
22
2.7.8Nungi Nkwe (2013): Tax Payers’ Attitude and Compliance Behaviour among
SMEs in Botswana.
The research sought to identify, the level of tax compliance of the taxpayers in relation
to their attitude and behaviour; to identify the factors that influence their attitudes; to
determine link between attitudes and tax compliance behaviour and then recommend
ways to improve compliance of tax through development of improved taxpayers’
attitudes among SMEs in Botswana. 200 taxpayers were randomly selected and sampled
with a total of 180 responses to questionnaires, that is, 90%. There was a moderate
gender distribution from the taxpayers who responded, with 99 being male counterparts
and 81 female. Descriptive statistics were used to analyze data collected and statistical
tools were used to present data. It was concluded that, the taxpayers’ attitude towards
tax affect their tax compliance behaviour.
2.7.9 Deshmukh’ M. S. (2012): The effect of value added tax (VAT) on the
profitability of manufacturing firms: a study of United Cement Company of
Nigeria Ltd (UNICEM).
The study aimed at obtaining information about the significance and implementation of
the value added tax on the profitability of manufacturing firms. A sample of 222 persons
was used to collect data through a descriptive research design. Questionnaires were used
to gather data and the results indicated that there is a significant relationship or effect
of VAT on the profitability and cost of production in firms. VAT is believed to cause a
reduction in the profitability of manufacturing firms and increases the cost of
production. Based on the research findings, it is suggested that value added tax should
be easy to comply with.
2.8 Gap Analysis
It has been noted that there is a gap in what literature says about VAT knowledge and
compliance in SMES. Although many authors have carried out similar researches
worldwide, the researcher considers the study of significance due to a number of
reasons. Through research, the author found that the economy of Zimbabwe is ever
changing and is facing a lot of challenges which are resulting in activities from small
scale operators. Secondly, several researchers focused more on income tax compliance
in SMES and less on VAT compliance, therefore the researcher dedicated her time to
study this so as to identity the level of VAT knowledge and compliance levels in SMES.
23
In addition, previous researches on VAT knowledge were carried out in developed
countries; however, this research was carried out in a developing nation, Zimbabwe so
as to surpass its revenue base through VAT compliance by SMES.
2.8 Summary
This chapter robustly discussed and re-examined on associated literature in relation to
the research study.
CHAPTER III
RESEARCH METHODOLOGY

24
3.0 Introduction
The credibility, reliability and appropriateness of research findings depend mainly on
the research methods used in collecting and analysing data. Research methodology
refers to a plan of action, strategies, processes or design behind the use of desired
outcomes. This chapter presents and gives justification on the research design, target
population, the sample and sampling designs, the designing and administration of data
collection instruments employed in the study. The research methodology focused on
Marondera small-medium business enterprises.
3.1 Research Design
A research design can be defined as a plan on how one goes about answering the
objectives of the research study (Bryman and Bell, 2007). Cooper and Schindler (2003;
146) viewed it as a plan and structure of investigation so conceived as to obtain answers
to research questions. In simpler terms research design gives a framework for plan of
action to the research plan. A research design can be categorised into various ways, for
instance, explanatory, descriptive or causal. The researcher used descriptive research
technique, which was found to be the most suitable in answering the research questions
on compliance of VAT. As elaborated by another scholar, research design has to provide
answers for questions like: what techniques were used to gather data? How were
constraints dealt with?
3.1.1 Descriptive Research
This type of research design is used when a researcher desire to know the characteristics
of a certain phenomena on a particular problem. Hashemi and Babaii (2013) pointed
out that descriptive research design describes the attitudes, feelings, views and
behaviours of a certain group of persons at a give place and time. Macdonald &
Headlam (2012) concurred that descriptive survey is one of the best method researchers
can use to collect data from the primary source for purpose of describing a population.
Descriptive research enabled the researcher to gather first hand data or original data as
she used questionnaires to collect information for the study. It seems to be the most
appropriate research design because Stangor (2014) highlighted that descriptive
research design allows the researcher to define and examine behaviour accurately and
also Macdonald & Headlam (2012) added that it enables the researcher to assess
attitudes and orientations in an outsized population.

25
This type is formally designed to gather simple data to investigate possible relationships
between two or more variables and in making predictions about future events. The
researcher opted for descriptive research because it is economic in terms of cost and
time and also, more data could be gathered through questionnaires increasing its
reliability. Moreover, the researcher could efficiently devote much of her time on a
selected regional area, or target group, that is, Marondera town.
However, descriptive research design has been argued by Creswell (2014) saying that,
there are high risks of asking unnecessary questions. Questions to be asked the public
has to be general questions, which accommodate the general public, hence this increases
the risk of asking unfitting questions. This research therefore tried to minimize that risk
through asking simple standard questions.
3.2 Population
There are two categories of population in research that exists, that is, the target
population and the study population, Rajasekat and Philominthan (2003). Flowler
(2013) alluded that, a study population is a group of individuals with one or more similar
physiognomies from which the researcher gather data about the problem. A target
population is described as a well-defined collection of individuals or objects known to
have the same features, Treece (2004). The target population in this study constituted
of SMEs in Marondera. The population in this study constitutes all SMEs in Zimbabwe
which recently were found to be 2.8million registered operators by a survey done by
FinScope in 2012 ( FinScope Zimbabwe, 2012). The target population in this study
constitutes of 127 SMEs.
3.3 Sample and Sample size
A sample refers to a subset of the population which represents typical features and main
characteristics of a population. The smaller the sample size, the more risky it is for
sampling error. For the purpose of this study, the researcher used a sample of 50 SMEs.
According to Jalil (2013), a reliable sample must be thirty percent and above of the
targeted population and in this research the sample size was 39%.
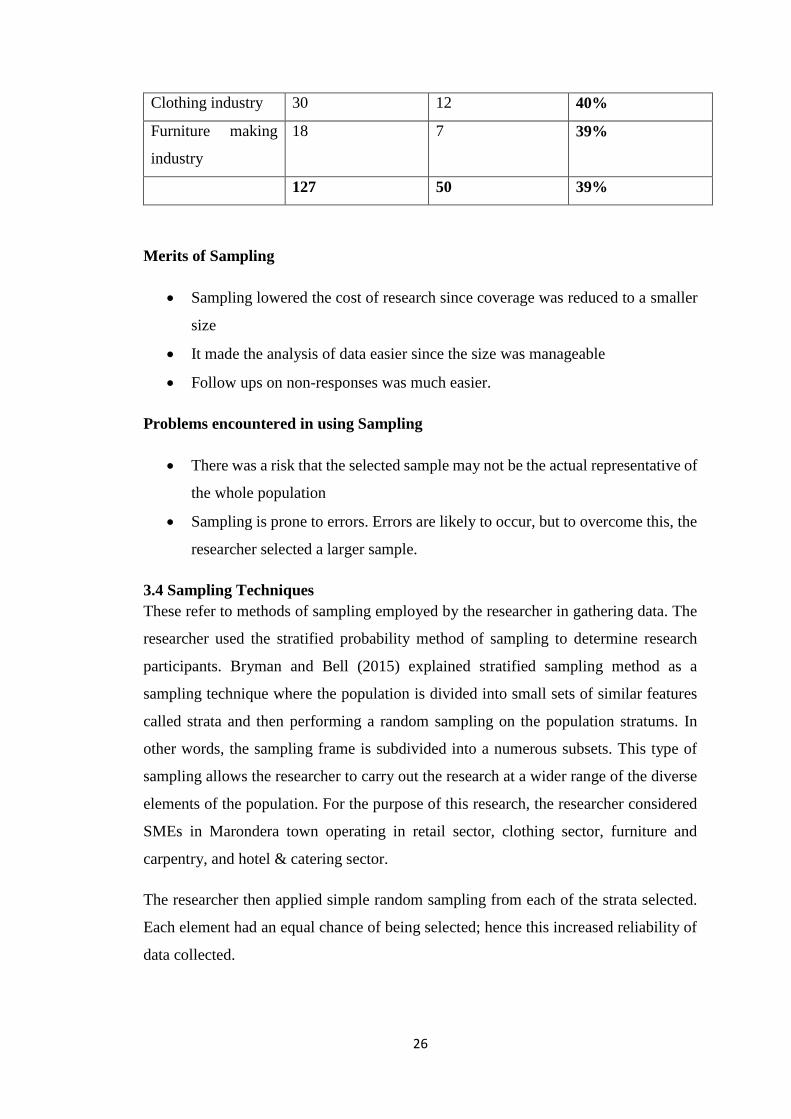
Table 3. 1 - Sample size
Stratum Total population Sample size Sample percentage
Retail 32 13 41%
Hotel & Catering 47 18 38%
26
Clothing industry 30 12 40%
Furniture making
industry
18 7 39%
127 50 39%
Merits of Sampling
Sampling lowered the cost of research since coverage was reduced to a smaller
size
It made the analysis of data easier since the size was manageable
Follow ups on non-responses was much easier.
Problems encountered in using Sampling
There was a risk that the selected sample may not be the actual representative of
the whole population
Sampling is prone to errors. Errors are likely to occur, but to overcome this, the
researcher selected a larger sample.
3.4 Sampling Techniques
These refer to methods of sampling employed by the researcher in gathering data. The
researcher used the stratified probability method of sampling to determine research
participants. Bryman and Bell (2015) explained stratified sampling method as a
sampling technique where the population is divided into small sets of similar features
called strata and then performing a random sampling on the population stratums. In
other words, the sampling frame is subdivided into a numerous subsets. This type of
sampling allows the researcher to carry out the research at a wider range of the diverse
elements of the population. For the purpose of this research, the researcher considered
SMEs in Marondera town operating in retail sector, clothing sector, furniture and
carpentry, and hotel & catering sector.
The researcher then applied simple random sampling from each of the strata selected.
Each element had an equal chance of being selected; hence this increased reliability of
data collected.

27
3.4.1 Justification of Stratified Sampling
Stratified sampling enables robust analysis of each stratum and reduces errors in the
overall sample. It also presents ample data for diverse sub-populations as well as giving
generally more dependable data that gives assurance of representative of the entire
population. Stratified sampling can guarantee that adequate sample points are obtained
to support separate analysis of any subgroup. In argument, Bryman and Bella (2015)
states that, stratified random sampling is difficult in situations where the study
population characteristics are not closely linked.
3.5 Data Sources
Data is useful in a research as it is used to draw up conclusions of the study. It can
however be obtained from two sources namely; primary and secondary data sources.
This research used the primary source only.
3.5.1Primary Source
Zohrabi (2013) defined primary data as data gathered for the first time about the
problem under study. According to Van Nederpelt (2009), primary source of data
consists of new sources of data that is extracted directly from the field work. Primary
data can be obtained through different ways or methods which include issuing out
questionnaires, carrying out interviews and direct observations in the physical ground.
The researcher accomplished primary data source from SMEs through questionnaires,
because this was the most convenient method.
Advantages of Primary data:
Data collected through primary source gave the researcher control over
selection of relevant aspects of the research.
Extraction of new data improved reliability and relevance of research data since
the information gathered was first hand information which is up to date and
collected for the problem at hand, that is VAT non-compliance in SMEs.
It also reduced the level of biased data since it was collected directly from the
SME owners who are currently in the business; they aired out their views as
they are.
Disadvantages of Primary data

28
Analysing primary data was time consuming. The researcher therefore had to
efficiently schedule her time to manage the time required.
Large volumes of data is collected through questionnaires which therefore
increased the burden for data analysis to the researcher, therefore the researcher
had to dedicate more time to analysis of data.
3.6 Research Instruments
Research instruments are referred to as dimensional tools used for collecting data, for
example questionnaires, intended to attain data on a topic of interest from a research
subject, Daas and Arends-Toth (2012). The research under study adopted questionnaires
as the research instrument.
3.6.1 Questionnaires
According to Saunders, Lewis & Thornhill (2012), a questionnaire is a research
instrument that consists of many various questions intended to collect data from the
respondent. Creswell (2014) viewed a questionnaire as a written series of questions the
respondent read, interpret and answer as provided. The researcher distributed the
questionnaires solely to SME operators, using the stratified random sampling. Every
small-medium business enterprise in Marondera had an equal chance of being selected
since they were picked randomly. The questionnaires distributed were self-structured
by the researcher with the help of the knowledge from literature on VAT compliance.
Questions set on questionnaires were closed ended type of questions as the researcher
aimed at quantitative data analysis.
Closed questions enabled the researcher to obtain quantitative type of data, which could
be statistically presented. These types of questions do not allow the respondent to
express his/her views since they only allow them to respond using the given rating scale.
Likert scale was adopted by the researcher in structuring the questionnaires, where the
respondents were required to indicate their degree of agreement through selection of
one of the given responses.
Advantages of Questionnaires
They met the research objectives of the study in question since the questionnaire
allowed the researcher to set a greater number of questions.
They are time saving, considering the time lag the researcher had in carrying out
the study, they were the most suitable research instrument for the research.
29
They are inexpensive or less costly due to the use of technological advancements
Questionnaires are more reliable and less biased since the respondents took their
spare time to answer the questions.
On the other hand, questionnaires can produce irrelevant material due to different
interpretations of a single question. There is also no room for further clarification by
the researcher. The researcher avoided ambiguous questions, set more clarified and
specific questions, and attended any questions from the respondents, to overcome the
limitations of questionnaires.
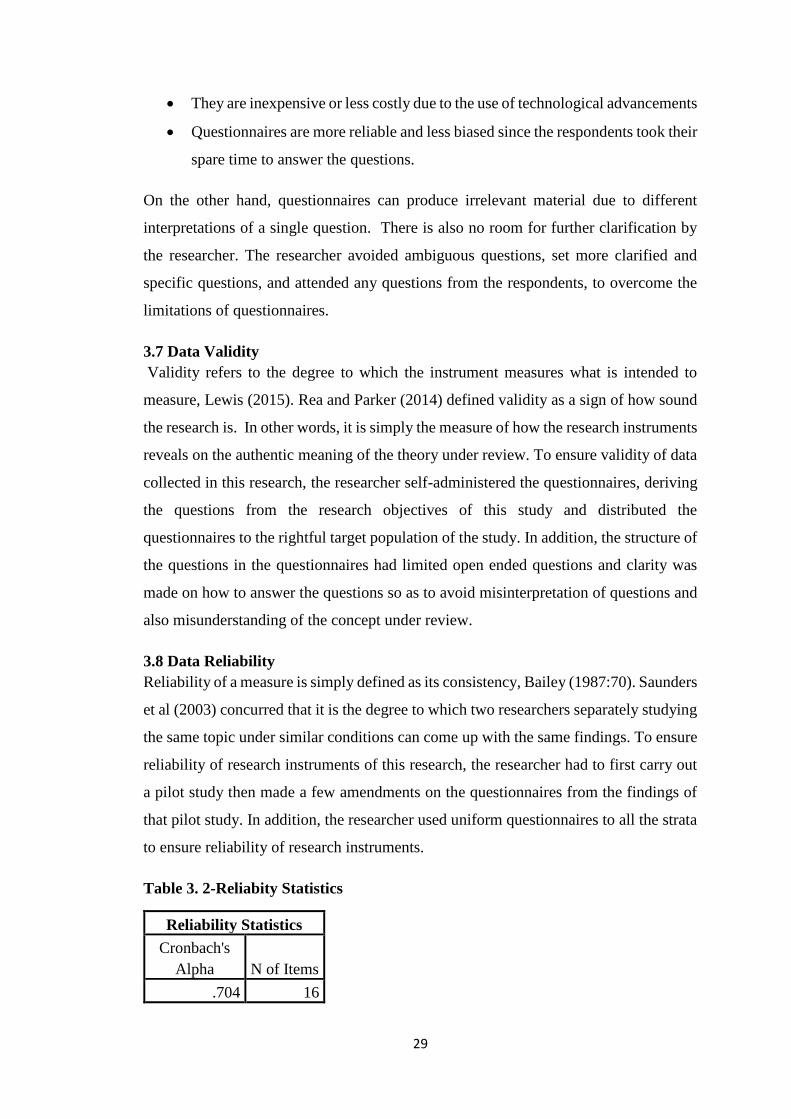
3.7 Data Validity
Validity refers to the degree to which the instrument measures what is intended to
measure, Lewis (2015). Rea and Parker (2014) defined validity as a sign of how sound
the research is. In other words, it is simply the measure of how the research instruments
reveals on the authentic meaning of the theory under review. To ensure validity of data
collected in this research, the researcher self-administered the questionnaires, deriving
the questions from the research objectives of this study and distributed the
questionnaires to the rightful target population of the study. In addition, the structure of
the questions in the questionnaires had limited open ended questions and clarity was
made on how to answer the questions so as to avoid misinterpretation of questions and
also misunderstanding of the concept under review.
3.8 Data Reliability
Reliability of a measure is simply defined as its consistency, Bailey (1987:70). Saunders
et al (2003) concurred that it is the degree to which two researchers separately studying
the same topic under similar conditions can come up with the same findings. To ensure
reliability of research instruments of this research, the researcher had to first carry out
a pilot study then made a few amendments on the questionnaires from the findings of
that pilot study. In addition, the researcher used uniform questionnaires to all the strata
to ensure reliability of research instruments.
Table 3. 2-Reliabity Statistics
Reliability Statistics
Cronbach's
Alpha N of Items
.704 16
30
Source: primary source (2019)
3.9 Data collection procedure
These are routes and processes adopted in administering research instruments and
collection of data from subjects understudy. The researcher extracted the research
sample from the SMEs database obtained from Municipality of Marondera. The
researcher self-administered the questionnaires, and then conducted a pilot study which
helped her correct mistakes on the questionnaires. Corrected questionnaires were then
distributed and collected to and from the respondents physically by the researcher, to
ensure validity of data. The researcher clearly introduced herself to the respondents and
explained the purpose of the research under study before handling the questionnaires to
the respondents to improve the response rate. The respondents were notified as of when
the questionnaires where to be returned, to ensure timely responses. Follow-ups were
made to all non-respondents and further explanations were made on the significance of
the study, to ensure participation.
3.10 Data presentation and analysis
Interpretation of raw data is difficult at face value; rather this can be achieved through
summarising and presenting data in an understandable and suitable manner. Inferential
data analysis was used. After collecting the questionnaires from the respondents, the
researcher then sorted the data findings using the statistics application, SPSS version
25, where percentages, averages, correlations and aggregates were computed. Tables,
charts and graphs were used to present quantitative data.
3.11 Summary
The chapter dwelt much on the research methodology used by the researcher to carry
out the whole research process, that is, the research design, the sampling issues, the
research instruments used in the collection, presentation and analysis of data. The next
chapter, chapter IV, will give the full and detailed presentation and analysis of data.
CHAPTER IV
DATA PRESENTATION AND ANALYSIS
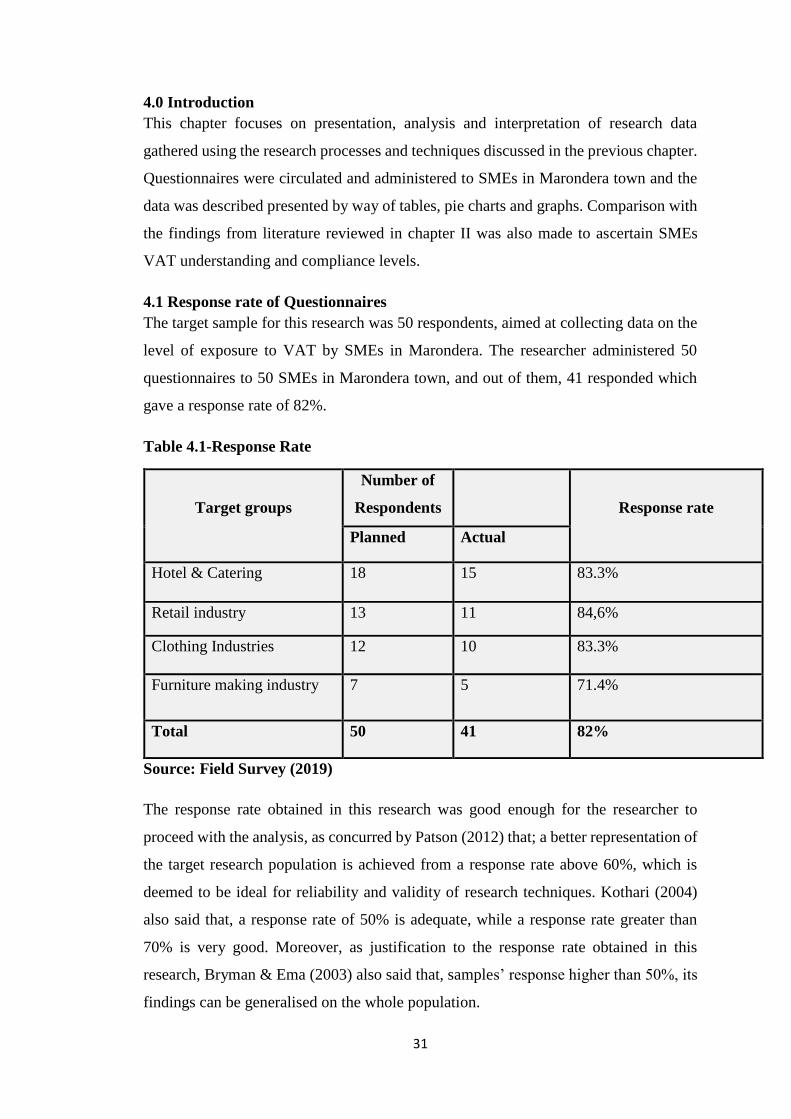
31
4.0 Introduction
This chapter focuses on presentation, analysis and interpretation of research data
gathered using the research processes and techniques discussed in the previous chapter.
Questionnaires were circulated and administered to SMEs in Marondera town and the
data was described presented by way of tables, pie charts and graphs. Comparison with
the findings from literature reviewed in chapter II was also made to ascertain SMEs
VAT understanding and compliance levels.
4.1 Response rate of Questionnaires
The target sample for this research was 50 respondents, aimed at collecting data on the
level of exposure to VAT by SMEs in Marondera. The researcher administered 50
questionnaires to 50 SMEs in Marondera town, and out of them, 41 responded which
gave a response rate of 82%.
Table 4.1-Response Rate
Target groups
Number of
Respondents
Response rate
Planned Actual
Hotel & Catering 18 15 83.3%
Retail industry 13 11 84,6%
Clothing Industries 12 10 83.3%
Furniture making industry 7 5 71.4%
Total 50 41 82%
Source: Field Survey (2019)
The response rate obtained in this research was good enough for the researcher to
proceed with the analysis, as concurred by Patson (2012) that; a better representation of
the target research population is achieved from a response rate above 60%, which is
deemed to be ideal for reliability and validity of research techniques. Kothari (2004)
also said that, a response rate of 50% is adequate, while a response rate greater than
70% is very good. Moreover, as justification to the response rate obtained in this
research, Bryman & Ema (2003) also said that, samples’ response higher than 50%, its
findings can be generalised on the whole population.

32
4.2 Business Type
The type of business in which the respondents operate in was significant, for the
researcher to know which category they belong to. Table 4.2 below shows the 5 business
types of which the respondents operates in.
Table 4.2-Type of Business
Type of business Frequency Percentages
Retail 11 26.8%
Furniture 5 12.2%
Hotel and Catering 15 36.6%
Clothing 10 24.4%
Total 41 100%
Source: Field survey (2019)
The data shows that the highest number of SME operators in Marondera operates in the
hotel and catering business sector, with a percentage of 36.6%; followed by the retail
sector with 26.8%, clothing constitutes 24.4% of the SMEs and furniture has a
percentage of 12.2%.
4.3 Form of ownership
The researcher found it to be of significance to ask the respondents on their business
ownership type. The findings shows that the population of SMEs in Marondera town is
dominated by sole trader businesses with 27/41 and constitutes a percentage of 65.9%,
partnership businesses are 10 with 24.4% and a few SMEs are Private Ltd companies
with 9.8%, no businesses are owned through cooperatives in the town of Marondera.
These results are illustrated on the table below.
Table 4.3-Business ownership
Type Frequency Percentages
Sole trader 27 65.9%
Partnership 10 24.4%
Private Ltd 4 9.8%
Total 41 100%
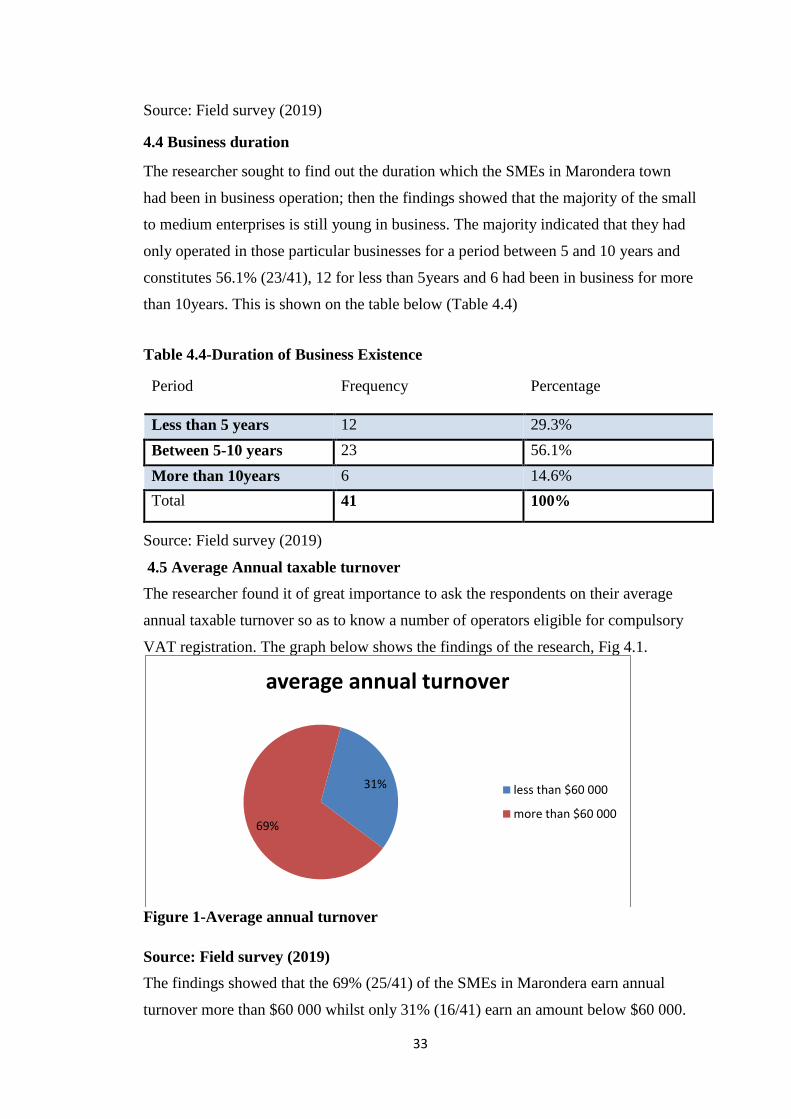
33
Source: Field survey (2019)
4.4 Business duration
The researcher sought to find out the duration which the SMEs in Marondera town
had been in business operation; then the findings showed that the majority of the small
to medium enterprises is still young in business. The majority indicated that they had
only operated in those particular businesses for a period between 5 and 10 years and
constitutes 56.1% (23/41), 12 for less than 5years and 6 had been in business for more
than 10years. This is shown on the table below (Table 4.4)
Table 4.4-Duration of Business Existence
Period
Frequency Percentage
Less than 5 years 12 29.3%
Between 5-10 years 23 56.1%
More than 10years 6 14.6%
Total 41 100%
Source: Field survey (2019)
4.5 Average Annual taxable turnover
The researcher found it of great importance to ask the respondents on their average
annual taxable turnover so as to know a number of operators eligible for compulsory
VAT registration. The graph below shows the findings of the research, Fig 4.1.
Figure 1-Average annual turnover
Source: Field survey (2019)
The findings showed that the 69% (25/41) of the SMEs in Marondera earn annual
turnover more than $60 000 whilst only 31% (16/41) earn an amount below $60 000.
31%
69%
average annual turnover
less than $60 000
more than $60 000

34
In practice, this means that 69% of the population is eligible for compulsory
registration for VAT, while 31% is not required for compulsory registration, but could
voluntarily register for VAT, since they do not meet the minimum threshold for
compulsory registration.
4.5 VAT registration
The researcher found it to be significant to further ask whether the respondents had
registered for VAT. This helped the researcher to deduce a percentage of registered
firms versus the eligible ones. From the findings, it indicated that only 11 (26.8%)
respondents had registered for VAT and the other 30 (73.2%) were not registered. In
actual fact, this means that a small proportion of SMEs eligible for compulsory VAT
registration is actually registered. This is in line with research carried out by Abay
(2015), which showed that businesses eligible for registration are not registered because
of the fact that VAT will make their prices less competitive. The graph below (Fig 2)
shows the percentage of respondents registered and not registered for Value Added Tax.
Figure 2-VAT registered firms
Source: Field survey (2019)
27%
73%
VAT registered firms
registered
not registered
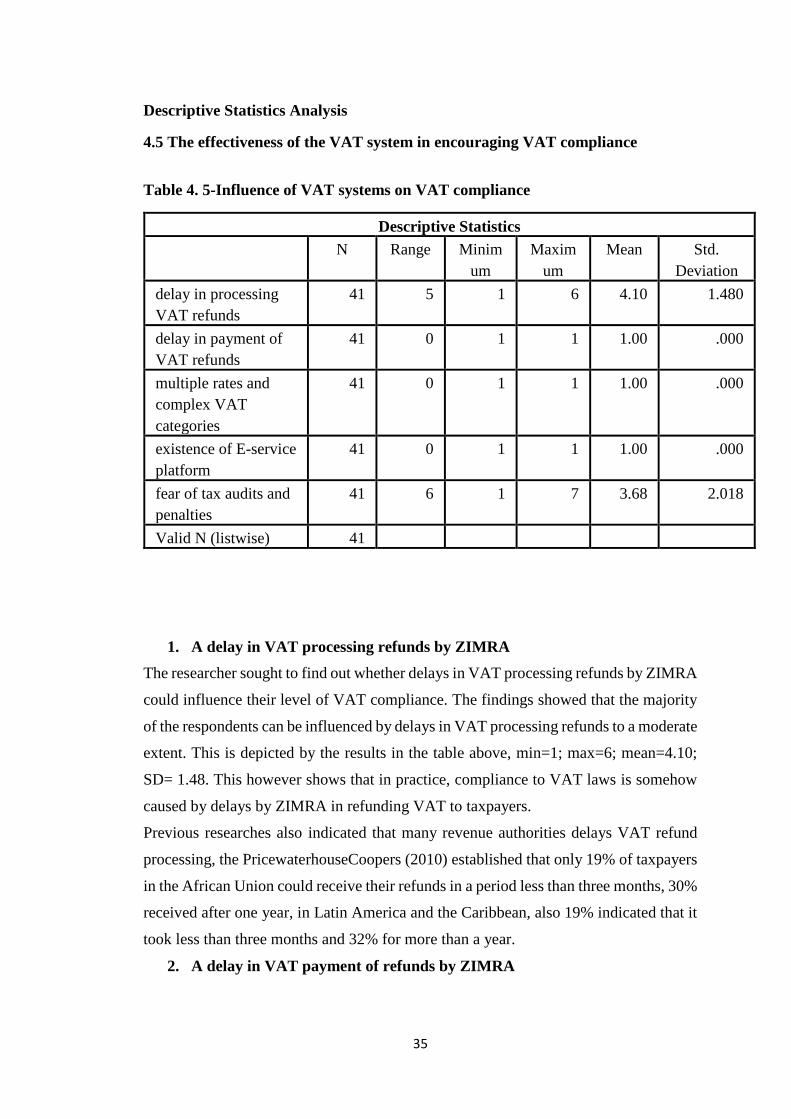
35
Descriptive Statistics Analysis
4.5 The effectiveness of the VAT system in encouraging VAT compliance
Table 4. 5-Influence of VAT systems on VAT compliance
Descriptive Statistics
N Range Minim
um
Maxim
um
Mean Std.
Deviation
delay in processing
VAT refunds
41 5 1 6 4.10 1.480
delay in payment of
VAT refunds
41 0 1 1 1.00 .000
multiple rates and
complex VAT
categories
41 0 1 1 1.00 .000
existence of E-service
platform
41 0 1 1 1.00 .000
fear of tax audits and
penalties
41 6 1 7 3.68 2.018
Valid N (listwise) 41
1. A delay in VAT processing refunds by ZIMRA
The researcher sought to find out whether delays in VAT processing refunds by ZIMRA
could influence their level of VAT compliance. The findings showed that the majority
of the respondents can be influenced by delays in VAT processing refunds to a moderate
extent. This is depicted by the results in the table above, min=1; max=6; mean=4.10;
SD= 1.48. This however shows that in practice, compliance to VAT laws is somehow
caused by delays by ZIMRA in refunding VAT to taxpayers.
Previous researches also indicated that many revenue authorities delays VAT refund
processing, the PricewaterhouseCoopers (2010) established that only 19% of taxpayers
in the African Union could receive their refunds in a period less than three months, 30%
received after one year, in Latin America and the Caribbean, also 19% indicated that it
took less than three months and 32% for more than a year.
2. A delay in VAT payment of refunds by ZIMRA
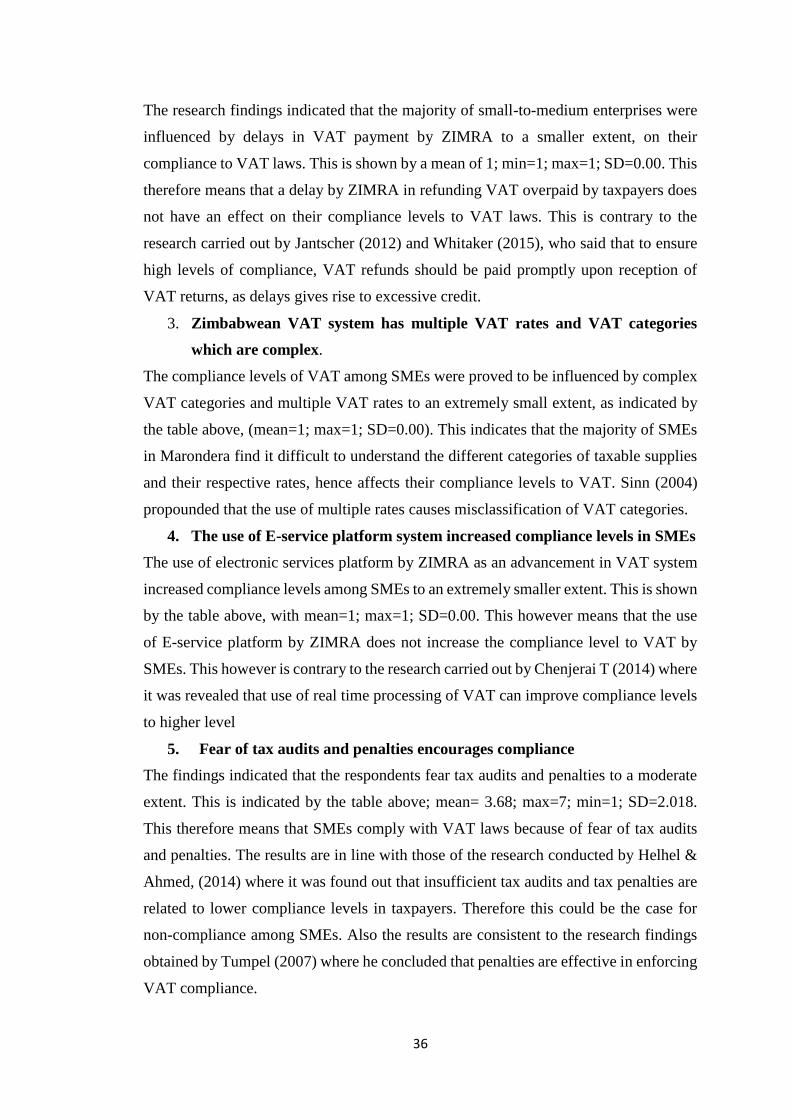
36
The research findings indicated that the majority of small-to-medium enterprises were
influenced by delays in VAT payment by ZIMRA to a smaller extent, on their
compliance to VAT laws. This is shown by a mean of 1; min=1; max=1; SD=0.00. This
therefore means that a delay by ZIMRA in refunding VAT overpaid by taxpayers does
not have an effect on their compliance levels to VAT laws. This is contrary to the
research carried out by Jantscher (2012) and Whitaker (2015), who said that to ensure
high levels of compliance, VAT refunds should be paid promptly upon reception of
VAT returns, as delays gives rise to excessive credit.
3. Zimbabwean VAT system has multiple VAT rates and VAT categories
which are complex.
The compliance levels of VAT among SMEs were proved to be influenced by complex
VAT categories and multiple VAT rates to an extremely small extent, as indicated by
the table above, (mean=1; max=1; SD=0.00). This indicates that the majority of SMEs
in Marondera find it difficult to understand the different categories of taxable supplies
and their respective rates, hence affects their compliance levels to VAT. Sinn (2004)
propounded that the use of multiple rates causes misclassification of VAT categories.
4. The use of E-service platform system increased compliance levels in SMEs
The use of electronic services platform by ZIMRA as an advancement in VAT system
increased compliance levels among SMEs to an extremely smaller extent. This is shown
by the table above, with mean=1; max=1; SD=0.00. This however means that the use
of E-service platform by ZIMRA does not increase the compliance level to VAT by
SMEs. This however is contrary to the research carried out by Chenjerai T (2014) where
it was revealed that use of real time processing of VAT can improve compliance levels
to higher level
5. Fear of tax audits and penalties encourages compliance
The findings indicated that the respondents fear tax audits and penalties to a moderate
extent. This is indicated by the table above; mean= 3.68; max=7; min=1; SD=2.018.
This therefore means that SMEs comply with VAT laws because of fear of tax audits
and penalties. The results are in line with those of the research conducted by Helhel &
Ahmed, (2014) where it was found out that insufficient tax audits and tax penalties are
related to lower compliance levels in taxpayers. Therefore this could be the case for
non-compliance among SMEs. Also the results are consistent to the research findings
obtained by Tumpel (2007) where he concluded that penalties are effective in enforcing
VAT compliance.
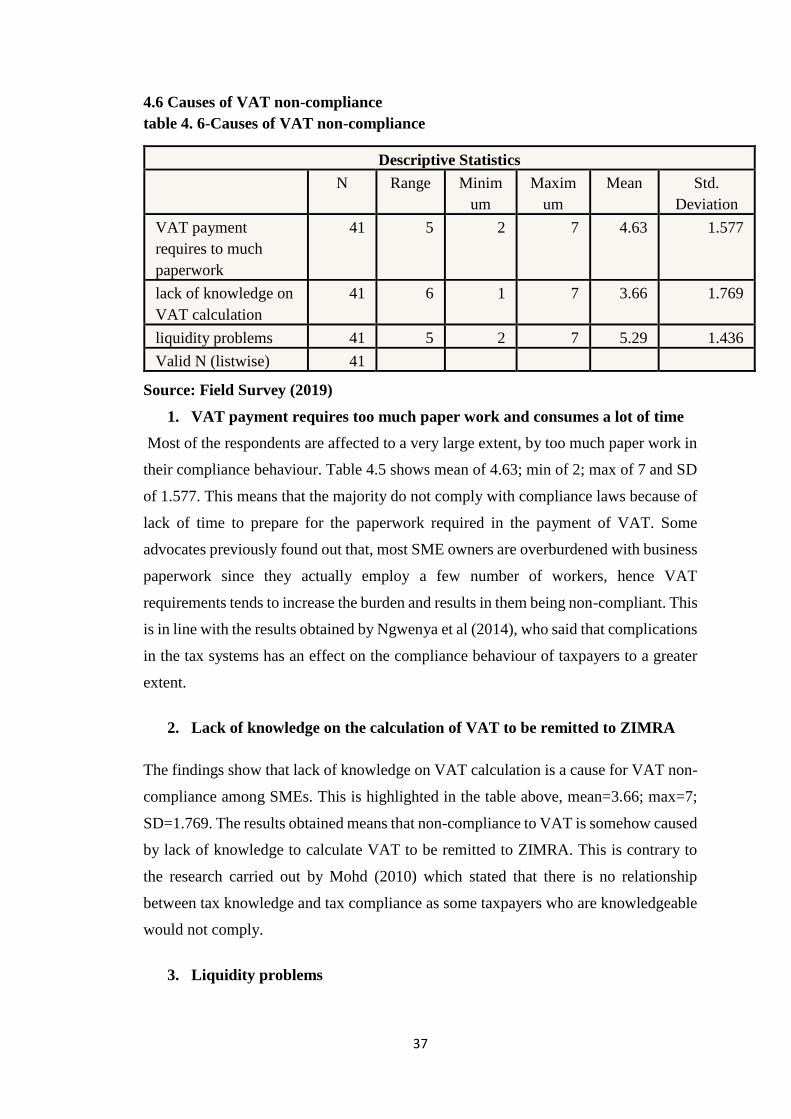
37
4.6 Causes of VAT non-compliance
table 4. 6-Causes of VAT non-compliance
Descriptive Statistics
N Range Minim
um
Maxim
um
Mean Std.
Deviation
VAT payment
requires to much
paperwork
41 5 2 7 4.63 1.577
lack of knowledge on
VAT calculation
41 6 1 7 3.66 1.769
liquidity problems 41 5 2 7 5.29 1.436
Valid N (listwise) 41
Source: Field Survey (2019)
1. VAT payment requires too much paper work and consumes a lot of time
Most of the respondents are affected to a very large extent, by too much paper work in
their compliance behaviour. Table 4.5 shows mean of 4.63; min of 2; max of 7 and SD
of 1.577. This means that the majority do not comply with compliance laws because of
lack of time to prepare for the paperwork required in the payment of VAT. Some
advocates previously found out that, most SME owners are overburdened with business
paperwork since they actually employ a few number of workers, hence VAT
requirements tends to increase the burden and results in them being non-compliant. This
is in line with the results obtained by Ngwenya et al (2014), who said that complications
in the tax systems has an effect on the compliance behaviour of taxpayers to a greater
extent.
2. Lack of knowledge on the calculation of VAT to be remitted to ZIMRA
The findings show that lack of knowledge on VAT calculation is a cause for VAT non-
compliance among SMEs. This is highlighted in the table above, mean=3.66; max=7;
SD=1.769. The results obtained means that non-compliance to VAT is somehow caused
by lack of knowledge to calculate VAT to be remitted to ZIMRA. This is contrary to
the research carried out by Mohd (2010) which stated that there is no relationship
between tax knowledge and tax compliance as some taxpayers who are knowledgeable
would not comply.
3. Liquidity problems
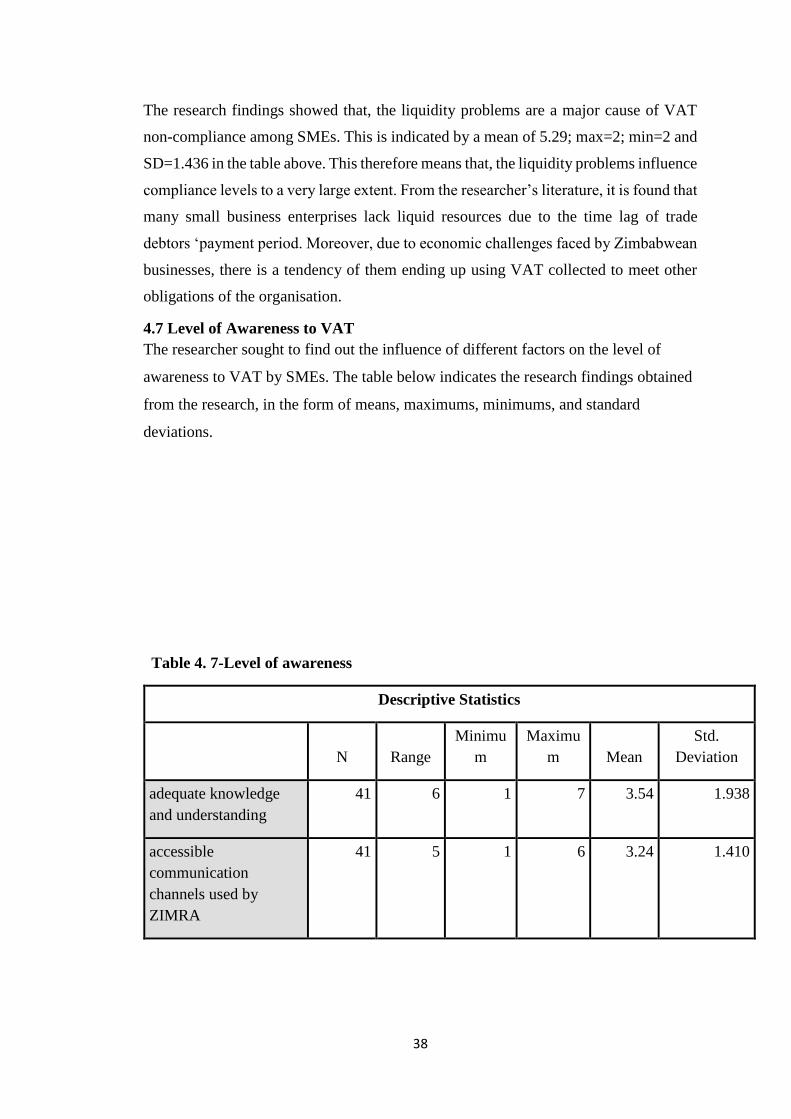
38
The research findings showed that, the liquidity problems are a major cause of VAT
non-compliance among SMEs. This is indicated by a mean of 5.29; max=2; min=2 and
SD=1.436 in the table above. This therefore means that, the liquidity problems influence
compliance levels to a very large extent. From the researcher’s literature, it is found that
many small business enterprises lack liquid resources due to the time lag of trade
debtors ‘payment period. Moreover, due to economic challenges faced by Zimbabwean
businesses, there is a tendency of them ending up using VAT collected to meet other
obligations of the organisation.
4.7 Level of Awareness to VAT
The researcher sought to find out the influence of different factors on the level of
awareness to VAT by SMEs. The table below indicates the research findings obtained
from the research, in the form of means, maximums, minimums, and standard
deviations.
Table 4. 7-Level of awareness
Descriptive Statistics
N Range
Minimu
m
Maximu
m Mean
Std.
Deviation
adequate knowledge
and understanding
41 6 1 7 3.54 1.938
accessible
communication
channels used by
ZIMRA
41 5 1 6 3.24 1.410
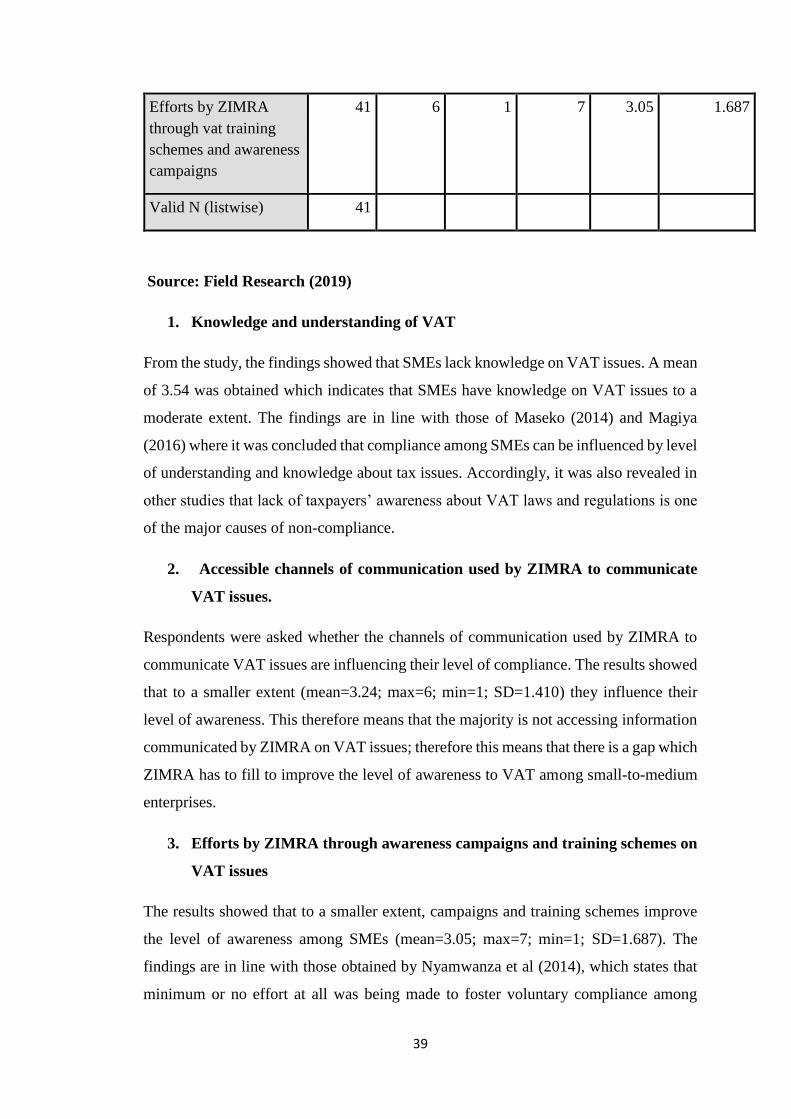
39
Efforts by ZIMRA
through vat training
schemes and awareness
campaigns
41 6 1 7 3.05 1.687
Valid N (listwise) 41
Source: Field Research (2019)
1. Knowledge and understanding of VAT
From the study, the findings showed that SMEs lack knowledge on VAT issues. A mean
of 3.54 was obtained which indicates that SMEs have knowledge on VAT issues to a
moderate extent. The findings are in line with those of Maseko (2014) and Magiya
(2016) where it was concluded that compliance among SMEs can be influenced by level
of understanding and knowledge about tax issues. Accordingly, it was also revealed in
other studies that lack of taxpayers’ awareness about VAT laws and regulations is one
of the major causes of non-compliance.
2. Accessible channels of communication used by ZIMRA to communicate
VAT issues.
Respondents were asked whether the channels of communication used by ZIMRA to
communicate VAT issues are influencing their level of compliance. The results showed
that to a smaller extent (mean=3.24; max=6; min=1; SD=1.410) they influence their
level of awareness. This therefore means that the majority is not accessing information
communicated by ZIMRA on VAT issues; therefore this means that there is a gap which
ZIMRA has to fill to improve the level of awareness to VAT among small-to-medium
enterprises.
3. Efforts by ZIMRA through awareness campaigns and training schemes on
VAT issues
The results showed that to a smaller extent, campaigns and training schemes improve
the level of awareness among SMEs (mean=3.05; max=7; min=1; SD=1.687). The
findings are in line with those obtained by Nyamwanza et al (2014), which states that
minimum or no effort at all was being made to foster voluntary compliance among

40
SMEs. However, findings of this research differs from those obtained in a research
carried out by Yalemtesfa (2011), the variation being caused by differences in target
population, as this study focused on taxpayers and not customers.
4.8 The effect of VAT on firm’s profitability
Table 4. 8-Infuence of VAT registration on profitability
Descriptive Statistics
N Range Minim
um
Maxim
um
Mean Std.
Deviation
VAT compliance
costs
41 6 1 7 4.15 1.931
trading with non-
registered operators
41 6 1 7 3.90 1.908
broader base of
exempted goods and
services
41 5 1 6 4.29 1.401
staff training costs on
vat calculation and
bookkeeping
41 6 1 7 4.63 1.785
short tax submission
periods
41 6 1 7 4.51 1.660
Valid N (listwise) 41
Source: Field Survey (2019)
1. VAT compliance costs
From the information in the table above, compliance costs influence their profitability
to a moderate extent (mean=4.15; max=7; min=1; SD=1.931). Therefore it means that
there is direct impact between VAT compliance costs and profitability. The empirical
studies on VAT compliance cost studies in developing countries found that VAT
compliance costs are high, and in most cases, aggressive.
2. Trading with unregistered operators or non-traders
The research findings indicate that trading with unregistered operators influence
profitability of a firm to a moderate extent. The table above shows that there is a mean
of 3.90; min=1; max=7 and SD=1.908. This practically means that trading with non-
registered firms has an impact on firm’s profitability.

41
3. Broader base of exempted supplies
The findings shown on the table above indicated that to a larger extent profitability can
be influenced by a broader base of exempted goods and services. Since the majority
said it influences to a greater extent, it can be concluded that broader base of exemptions
influences profitability of a firm. The findings of study carried out by Smulders and
Evans (2016) it was recommended that all exemptions should be unified into a single
law covering all fiscal incentives.
4. Staff training costs on VAT calculation and bookkeeping
A mean of 4.63 indicated on the table above shows that to a large extent staff training
costs has an influence on the firm’s profitability. This therefore means that it is costly
to train staff to calculate VAT to be remitted to ZIMRA and this increases operating
expenses of the firm, hence profitability is affected.
5. Short tax submission periods
From the responses given by respondents, it is revealed that short tax submission
periods influence profitability of a firm to a large extent (mean=4.51; min=1; max=7;
SD=1.660). This implies that profitability can be greatly affected by short tax periods
entitled by ZIMRA.
4.9 Relationship between VAT compliance and Level of awareness to VAT
4.9.1 Hypothesis
Ho: There is no relationship between level of awareness and compliance level
H1: There is a relationship between level of awareness and compliance level
Correlation between VAT awareness and VAT compliance
The researcher performed a Pearson correlation Coefficient to determine the
relationship between VAT awareness and VAT compliance. It can be defined as:
𝒓 =𝒏∑𝒙𝒚 − ∑𝒙∑𝒚
√(𝒏∑𝒙² − (∑𝒙)²(𝒏∑𝒚𝟐 − (∑𝒚)𝟐)
Where r= linear correlation between level of awareness and level of compliance
N=41

42
x=level of awareness
y= level of compliance
Table 4.9-Correlation between VAT awareness and VAT compliance
Correlations
Complia
nce
Awarene
ss
Complia
nce
Pearson
Correlation
1 -.036
Sig. (2-tailed) .823
N 41 41
Awarene
ss
Pearson
Correlation
-.036 1
Sig. (2-tailed) .823
N 41 41
Source: Primary Data
Table above indicated the computations of Pearson’s Correlation Coefficient run to
determine the relationship between Value Added Tax awareness level and the level of
compliance. The computed r value was -0.036 which indicates that there is a negative
and statistically significant relationship between the level of awareness to VAT and
level of compliance to VAT.
Ho is therefore accepted and it can be concluded that, there is no relationship between
VAT level of awareness and VAT compliance
4.10 Summary
The chapter focused on the presentation, analysis and interpretation of data gathered
from the research methodology. Data presentation was done using charts, graphs and
tables. Research findings were thoroughly explained and discussed to accomplish the
objectives of the study and answer the research questions. The next chapter gives
summaries of major research findings, recommendations and conclusions to the
research findings.

43
CHAPTER V
SUMMARY, CONCLUSIONS AND RECOMMENDATIONS
5.0Introduction
This chapter gives the summary of research findings, conclusions and recommendations
on the research carried out on the level of exposure to VAT by SMEs in Marondera.
Recommendations were given in accordance with the research findings obtained and
from literature review.
5.1Summary of findings
The research sought to find out the answers to research questions below:

44
i. How does level of awareness to VAT by SMEs affect their level of
compliance?
ii. How effective is the VAT system in encouraging VAT compliance among
SMEs?
iii. What are the possible causes of non-VAT compliance among SMEs?
iv. What are the implications of VAT registration on profitability of SMEs?
The research found out that the level of awareness to VAT does not affect their level of
compliance. It was revealed by a linear correlation analysis which showed a significant
negative correlation between the two.
It was also revealed that the VAT system has greater influence on VAT compliance
among SMEs. The majority indicated that to a greater extent, VAT system has an
influence on VAT compliance among SMEs.
VAT non-compliance among SMEs has been revealed to have been caused by liquidity
problems and the fact that VAT payments require too much paper work. Due to
economic challenges being faced by businesses in Zimbabwe, firms are failing to
comply with VAT laws due to liquidity problems.
Registering for VAT has been found to have much influence on the firm’s profitability.
Factors such as compliance costs, trading with non-VAT registered operators, number
of exemptions, staff training costs on VAT calculations, and short tax periods were
found to have influence on profitability of firms.
VAT penalties and audits have also influence on compliance levels among SMEs. The
research findings proved that SMEs does have fear on tax audits and penalties hence
their compliance level is not influenced by the two.
5.2 Conclusions
From the research findings, it can be concluded that there is no relationship
between the level of compliance and the level of awareness in VAT. Failure by
SMEs to comply with VAT laws is not closely related to awareness levels
.
SMEs fail to comply with VAT because of liquidity problems and the need for
proper book keeping which consumes time. The two were identified as the major

45
causes of VAT non-compliance. It can also be concluded that SMEs have
knowledge on the calculation of VAT; hence to a smaller extent it contributes
to non-compliance with VAT.
Efforts by ZIMRA to impart knowledge in SMEs have been found to be weak
as the SMEs lack knowledge on VAT. Awareness campaigns and training
schemes influence the level of knowledge among SMEs to a smaller extent.
It can also be concluded that VAT registration has an effect on the profitability
of an enterprises. Factors such as compliance costs, trading with non-VAT
registered operators, number of exemptions, staff training costs on VAT
calculations, and short tax periods were found to have influence on profitability
of firms.
Basing on the findings, it can be concluded that tax penalties and audits are weak
or ineffective as SMEs have no fear towards them. This therefore implies that
there is less deterrence risk among SMEs.
The Zimbabwean VAT system has broader base of exempted products and
services which greatly influence the profitability of a firm. For instance firms
dealing with charged raw materials and selling exempted products would have
higher costs; hence profitability affected.
It can also be concluded that Zimbabwean VAT rates and their respective
categories are complicated. This greatly influences the level of compliance
among SMEs.
5.3Recommendations
Basing on the research findings, the researcher suggests that ZIMRA has to
launch awareness campaigns and offer training schemes so as to improve
knowledge and understanding on value added tax among SMEs. The ZIMRA
website is not informative; therefore awareness campaigns and training schemes
could help SMEs to be aware of any changes in VAT system.
46
The taxpayers have to be encouraged to use e-service platform to reduce time
consumed in preparing VAT paperwork. Government should also improve the
system to the extent that it allows submission of VAT returns online so as to
encourage compliance among SMEs.
The VAT system should also be designed in such a way that it considers the fact
that the businesses are facing liquidity problems. The use of different payment
categories is recommended so as to encourage compliance among SMEs.
The VAT system should be designed in a way that is fair and not aggressive.
The base for exempted products and services should not be one-sided, that is,
fair to one business whilst aggressive to another trading business.
5.4 Suggestions for further study
A further study has to be undertaken to determine how VAT should be calculated to
simplify VAT calculations in relation to their different categories.
Studies similar to the level of exposure to VAT by SMEs in Marondera should be
carried out in other towns and cities to enable comparisons with this research’s findings.
REFERENCES
Abay, S.T. (2015) Assessment on the Implementation of Value-Added Tax (VAT) in
Mekelle City Administration. International Journal of Science and Research (IJSR),
Vol.4, (8), pp908-923
Adesola, S.M. (2012) Tax Laws and Administration in Nigeria, Third revised edition,
University Press: Obafemi Awolowo, Nigeria.
African Forum and Network on Debt and Development (AFRODAD) (2011). Debt,
Extractives ans Illicit Outflow. [Workshop].
Ainsworth, R.T. 2010. „Zappers – Retail Vat Fraud‟, Boston University School of
Law Working Paper No. 10-04
Aizenman J. and Jinjarak Y. (2005), The Collection efficiency of the Value Added
Tax; Theory and International Evidence
Akinboade O. A. (2015): Correlates of tax compliance of Small and Medium Size
Businesses in Cameroon, Gordon Institute of Business Science, South Africa

47
Amayi G C and Machogu B J (2013): The effects of taxpayer education on voluntary
tax compliance among SMEs in Mwanza City- Tanzania, International Journal of
Scientific and Research Publications, Volume 5
Bailey, K.D.1987, Methods of Social Research. New York: The Free Press
Cooper DR, Schindler PS (2003). Business research methods. Irwin: McGraw-Hill.
NY.
Creswell, J.W. (2014) Research Design, 4th edition, London: Sage Publications
Daas, P.J.H., Ossen, S.J.L. (2010). Quality Evaluation of Administrative Metadata.
Journal of Quality, submitted for publication.
Deshmukh’ M. S. (2012): The effect of value added tax (VAT) on the profitability of
manufacturing firms: a study of United Cement Company of Nigeria Ltd (UNICEM),
Indian Streams Research Journal Vol 1
Ebrill, Liam, Michael Keen, Jean-Paul Bodin, and Victoria Summers, 2001, The
Modern VAT (Washington: International Monetary Fund )
Eichfelder, S. and Schorn, M., 2009, Tax compliance costs and its determinants,
Evidence from German businesses, Institute of Accounting and Tax Management
Eichfelder S. and F Vaillancourt, “Tax Compliance Costs: A review of cost burdens
and cost structures”, (2014), 210-(3/2014) Review of Public Economics 111-148, at
137.
Faridy, N, Copp R, Freudenberg B, and Sarker T (2014): Complexity, Compliance
costs and Non-Compliance with VAT by Small and Medium Enterprises in Bangladesh:
Is there a Relationship?, Austrilian Tax Forum
Farrell, G., John R. & Fleming M., (2000). ‘Conceptualizing the Shadow Economy’.
Journal of International Affairs, Vol. 53, No. 2 p.38
Flowler, J.F., Lewis, J. and Elam, R. G. (2013) Survey research method, London: Sage
Publications
Franzoni, L. A. (1999).‟Tax Evasion and Tax Compliance.‟ University Of Bologna,
Italy

48
Glenday, G. (2013) Assessment of the Current Stated of VAT Implementation in
SADC Member Stateds, Duke Center: Washington DC, USA.
GTZ- German Technical Cooperation. 2010. „Addressing tax evasion and avoidance
in developing countries.‟
Hanefah, M., Ariff, M., & Kasipillai, J. (2002). Compliance costs of Small and
Medium Enterprises. Journal of Australian Taxation, 4(1), 73-97
Hashemi, M. and Babaii, E. (2013) Mixed methods research: Towards new research
designs in applied linguistic. The modern language Journal, 97, 828-852
Hisrich, R. D., Peters, M. and Shepherd, D. (2004): Entrepreneurship, Tata McGraw
Hill, New Delhi.
Hite P, Hasseldine J, Al-Khoury A, James S, Toms S, Toumi M, (2003) “Tax
practitioners and tax compliance”, in A. Lymer & D. Salter (Eds.) Contemporary
Issues in Taxation Research, Aldershot: Ashgate, pp. 17-43.
Jalil, M. M. (2013) Practical Guidelines for accounting summarizing good research
purchase in line with the DCED standard.
James, S., and C. Alley. 2000. ‘Tax Compliance, Self-Assessment and Tax
Administration.’ Journal of Finance and Management in Public Services 2 (2): 27–42.
Kastlunger, B.Kirchler, E., Muehlbacher, S and Wahl, I. (2009): Why pay taxes? A
review of tax compliance decisions, Working Paper 07-30 December, Georgia State
University-Andrew Young School of Policy Studies ISP.
Keen, M. and S. Smith (2007). „VAT Fraud and Evasion: What Do We Know, and
What Can be Done? IMF WP/07/31.‟Washington, D.C., International Monetary Fund
Kim, K and Gallent, N (2000) Industrial Land Planning and Development in South
Korea: Current Problems and Future Directions? Third World Planning Review, Vol
22 No 3, pp. 289-315
Kirchler, Erich, Stephan Muehlbacher, Barbara Kastlunger and Ingrid Wahl (2007),
Why Pay Taxes? A Review of Tax Compliance Decisions, International Studies
49
Program, Working Paper 07/30, Andrew Young School of Policy Studies Georgia
State University
MacDonald S. & Headlam N. (2011) Research Methods Handbook Centre for Local
Maseko, N. (2014). The Impact of Personl Knowledge and compliance costs on tax
compliance behaviour of SMEs in Zimbabwe. Elite Research Journal of accounting
and Business Management. Vol 2(3) p26-37, July 2014.
Masarirambi C. (2013). An investigation into factors associated with tax evasion in
the Zimbabwe informal sector: A survey of Mbare Magaba informal traders.
Matsebula M. S. (1996). The urban informal sector: A historical and structural
analysis with reference to Swaziland. Economic Policy Series. Harare: Southern
African Regional Institute for Policy Studies
Nkwe N (2013): Taxpayer’s attitude and compliance behaviour among SMEs in
Botswana. Journal of Business and Management Horizons, Volume 1, No. 1.
Nyamwanza T, Mavhiki S, Mapetere D and Nyamwanza L (2014): Analysis of SMEs
attitudes and practices towards tax compliance in Zimbabwe. SAGE Open
OECD (2010a), Promoting Transparency and Exchange of information for tax
purposes. Paris.
Ojeka A and Ojochugwu W, A (2012): Factors that affect tax compliance among
SMEs in North Central Nigeria. International Journal of Business and Management,
Volume 7, No. 12.
Onias, Z. Chari F. & Nyakurimwa C. (2014), The Effectiveness of Presumptive Tax
and Its Impact on Profitability of SMEs in Zimbabwe. Case Of Commuter Transport
Operators In Bindura
PricewaterhouseCoopers. 2011. Paying Taxes:The compliance burden
PricewaterhouseCoopers.2010. „Impact of VAT compliance on business, Paying
Taxes‟ PricewaterhouseCoopers.2010. Paying Taxes PricewaterhouseCoopers.2012.
Paying Taxes the Global Picture PricewaterhouseCoopers.2013. Paying Taxes

50
Rajasekat, S, P Philominathan, V Chinathi (2013) Research Methodology, AKGS Art,
India.
R.W. Lindholm, 1976. “Value Added Tax and Other Reforms” Nelson-Hall,
Sandford, C.T. 1973. Hidden Costs of Taxation. Bath, UK: Institute for Fiscal Studies
Saunders, M., Lewis, P. and Thornhill, A. (2003);Research Methods for Business
Students, 3rd Edition, Pearson Education Limited, England.
Shuttleworth, M., 2008http://www.experiment-resources.com/case-study-
researchdesign.html#ixzz1ZTrKejY5
Slemrod, J and Gillitzer, C.2013. „Insights from a Tax-Systems Perspective‟. Ross
School of Business Working Paper Series Working Paper No. 1206
Smulders S & C. Evans, (2016), VAT in Developing Countries: Policy, Law and
Practice, Symposium, Pretoria, South Africa
Stiglitz, JE. (1985), "The general theory of tax avoidance", National Tax Journal
38(3):325-337.
Stuart MacDonald & Nicola Headlam, (2011) Research Methods Handbook Centre
for Local Economic Strategies Express Networks 1 George Leigh Street Manchester
M4 5DL.
Tevera, D.S. (1998) Micro and Small- Scale Enterprises in Shamva District within the
Context of an adjusting National Economy in Masuko, L (Ed) (1998) Economic
Policy Reforms and Meso-Scale Rural market Changes in Zimbabwe: the Case of
Shamva District. IDS. UZ
Torgler, B. (2007). „Tax Compliance and Tax Morale: A Theoretical and Empirical
Analysis.‟ Cheltenham, UK: Edward Elgar
Value added tax Act (Chapter 23:12), Government Printers
Van Nederpelt, P.W.M. (2009a). Object Oriented Quality Management, a
management model for quality. Report 29 April 2009, Statistics Nederlands, The
Hague/Heerlen.

51
Yankson P.W.K (1989), Formation of Enterprises in the Urban Informal Sector in
Ghana, Journal of Management Studies, University of Ghana. 1991, Vol. 7. Zikmund
W.G., 2003. Business Research: Methods, 7th Edition Southern- Western
www.smeaz.org
Zimbabwe Revenue Authority (ZIMRA 2012): Revenue Performance Report 2011,
Harare.
www.openparly.co.zw
www.zimra.co.zw
APPENDIX 1-QUESTIONNAIRE
QUESTIONNAIRE
My name is Ashley S. Chekera, a student at Bindura University of Science Education,
currently pursuing a Bachelor of Accountancy Honours Degree. I am carrying out a
research on the LEVEL OF EXPOSURE TO VALUE ADDED TAX BY SMALL
TO MEDIUM ENTERPRISES IN MARONDERA TOWN. This is in partial
fulfilment of my studies. Information obtained will be used only for academic

52
purposes and will be kept at utmost confidentiality. I therefore kindly request you to
complete the questionnaire below as honestly as possible. Thank you.
Instructions
Do not write your name on the questionnaire.
Tick your options in the boxes provided and where spaces are given, explain.
SECTION A: General background Information
1. What type of business are you operating in?
i. Retail business [ ]
ii. Furniture making and repairing [ ]
iii. Hotel and Catering [ ]
iv. Clothing industry [ ]
v. Others specify......................................................
2. What form of ownership does your business operate in?
i. Sole trader [ ]
ii. Partnership [ ]
iii. Private Ltd company [ ]
iv. Cooperative [ ]
v. Others specify......................................................
SECTION B: Business succession
3. How long have you been in the business?
i. Less than 5 years [ ]
ii. Between 5-10 [ ]
iii. More than 10 years [ ]
4. What is your average annual turnover on taxable supplies?
Below $ 60 000,00 [ ] Above $ 60 000,00 [ ]
5. Is your business registered with ZIMRA?
Yes [ ] No [ ]
6. Did your firm register for Value Added Tax (VAT)?
Yes [ ] No [ ]

53
Use the seven-point Likert scale below to indicate the extent to which the
highlighted factors are influenced by the following statements:
Key: 1=To an extremely Small Extent; 2= To a very Small Extent; 3= To a small
extent; 4=To a moderate Extent; 5= To a large Extent; 6=To a very Large extent; 7=
To an Extremely Large extent
Statement 1 2 3 4 5 6 7
Compliance to VAT laws
7. A delay in VAT processing refunds by
ZIMRA
8. A delay in VAT payment of refunds by
ZIMRA
9. The extensive number of exemptions has
complicated the VAT system
10. Zimbabwean VAT system has multiple
VAT rates and VAT categories which are
complex.
11. The use of E-service platform system
12. Fear of tax audits and penalties encourages
compliance
13. VAT payment requires too much
paperwork and consumes a lot of time
14. Lack of knowledge on the calculation of
VAT to be remitted to ZIMRA
15. Liquidity problems
Profitability
16. VAT compliance costs
17. Trading with unregistered operators or non-
traders
18. Broader base of exempted supplies
19. Staff training costs on VAT calculations
and bookkeeping

54
Statement 1 2 3 4 5 6 7
20. Short tax submission periods
Level of awareness
21. Your adequate knowledge and
understanding of VAT
22. Accessible channels of communication
used by ZIMRA to communicate VAT
issues.
23. Efforts by ZIMRA through awareness
campaigns and training schemes on VAT
issues
***End of Questionnaire***
Thank you for your cooperation