SCIENCE EDUCATION FOR DIVERSITY: WP2 Synthesis Report
80
SCIENCE EDUCATION FOR DIVERSITY: WP2 Synthesis Report England India (Lead Participant–WP2) Dr. Alun Morgan Dr. Beena Choksi With acknowledgements to the Assoc. Prof. Sugra Chunawala SED team in Exeter: Prof. Chitra Natarajan Lindsay Hetherington Dr. Nasser Mansour Associate Professor Keith Postlethwaite Dr. Nigel Skinner Professor Rupert Wegerif Lebanon Malaysia Dr. Saouma BouJaoude Dr. Ng Swee Chin Dr. Rola Khishfe Dr. Choy Siew Chee Sahar Alameh Dr. Oo Pou San Nada Radwan Chin Fui Chung @ Johnny Chin Teh Lee Wah The Netherlands Turkey Ralf van Griethuijsen, M.Sc. Prof. Dr. Huseyin Bag Dr. Michiel van Eijck Asst. Prof. Dr. Ayse Savran Gencer Prof. Dr. Perry den Brok
-
Upload
khangminh22 -
Category
Documents
-
view
2 -
download
0
Transcript of SCIENCE EDUCATION FOR DIVERSITY: WP2 Synthesis Report
SCIENCE EDUCATION FOR DIVERSITY: WP2
Synthesis Report
England India (Lead Participant–WP2)
Dr. Alun Morgan Dr. Beena Choksi
With acknowledgements to the Assoc. Prof. Sugra Chunawala
SED team in Exeter: Prof. Chitra Natarajan
Lindsay Hetherington
Dr. Nasser Mansour
Associate Professor Keith Postlethwaite
Dr. Nigel Skinner
Professor Rupert Wegerif
Lebanon Malaysia
Dr. Saouma BouJaoude Dr. Ng Swee Chin
Dr. Rola Khishfe Dr. Choy Siew Chee
Sahar Alameh Dr. Oo Pou San
Nada Radwan Chin Fui Chung @ Johnny Chin
Teh Lee Wah
The Netherlands Turkey
Ralf van Griethuijsen, M.Sc. Prof. Dr. Huseyin Bag
Dr. Michiel van Eijck Asst. Prof. Dr. Ayse Savran Gencer
Prof. Dr. Perry den Brok
1
List of Abbreviations
BME Black Minority Ethnic
CITO Centraal instituut voor Toetsontwikkeling (Central Institute for Test Development)
CPD Continuous Professional Development
CTC City Technology College
EVS Environmental Studies
GER Gross Enrollment Ratio
GPI Gender Parity Index
HAVO Hoger Algemeen Voortgezet Onderwijs (Higher General Secondary Education)
HBO Hoger Beroepsonderwijs (Higher Vocational Education)
ICTAC ICT Across the Curriculum
MBO Middelbaar Beroepsonderwijs (Vocational Education)
NC National Curriculum
NCERT National Council of Educational Research and Training
NCF National Curriculum Framework
NER Net Enrollment Ratio
NOS National Open School
NPE National Policy on Education
PATS Positive Attitude Toward Science
PISA Programme for International Student Assessment
PRO Praktijkonderwijs (Practical Education)
ROSE Relevance of Science Education
SC Scheduled Caste
SOS State Open School
ST Scheduled Tribe
STEM Science, Technology, Engineering, and Mathematics
TIMSS Trends in International Mathematics and Science Study
UT Union Territory
VMBO Voortgezet Middelbaar Beroeps Onderwijs (Prevocational Secondary Education)
VWO Voorbereidend Wetenschappelijk Onderwijs (Pre-university Education)
WO Wetenschappelijk Onderwijs (University Education)
2
List of Boxes
Box 1. Science High Schools (Turkey). 17
Box 2. Changes in language policy (the Netherlands). 21
Box 3. Changes in multicultural policy (the Netherlands). 24
Box 4. Teacher qualification requirements (the Netherlands and England). 26
Box 5. Targets for Smart Schools (Malaysia). 33
Box 6. Campaigns to attract girls to science and technology education (the Netherlands). 54
Box 7. Government and private initiatives to promote science education for diversity. 55
Box 8. Actions and examples for the principle of inclusion (UK National Curriculum). 60
Box 9. Contribution of science to Learning across the National Curriculum (UK). 61

3
List of Figures
Figure 1. Framing of the primary level EVS syllabus (India). 28
Figure 2. The primary S&T curriculum in Turkish schools: Four content areas 30
supported by three supporting interwoven areas.
Figure 3. Data from the ROSE study showing students’ responses to the question 39
‘I like school science better than most other school subjects’.
Figure 4. Choice of subject clusters for 4th and 5th year HAVO student, data from 2004-2008 42
(the Netherlands).
Figure 5. Choice of subject clusters for 4th, 5th, and 6th year VWO students, data from 2004-2008 43
(the Netherlands).
List of Tables:
Table 1. Time allocation to science (Lebanon). 26

4
TABLE OF CONTENTS
Preamble 5
Introduction 7
1.1.1.1. General Education 11
1.1 STRUCTURE 11
1.2 TYPES OF SCHOOLS AND STUDENT DIVERSITY 14
1.3 SIZE AND DURATION OF CLASSES 17
1.4 STUDENT ENROLLMENT 18
1.5 EDUCATIONAL POLICIES FOR DIVERSITY 19
1.6 TEACHER EDUCATION 23
2. Science Education: Structure and Policies 25
2.1 SCIENCE IN THE SCHOOL CURRICULUM 25
2.2 SCIENCE CURRICULUM/SYLLABUS 27
2.3 POLICY BASED RESOURCES AND OPPORTUNITIES 32
2.4 FACTORS INFLUENCING CAREERS IN SCIENCE 35
3. Review of Literature 37
3.1 STUDENT ATTITUDES TO SCIENCE EDUCATION 37
3.2 GENDER AND SCIENCE 39
3.3 CULTURE AND SCIENCE EDUCATION 45
4. Science Curriculum Analysis 49
5. Barriers to and Factors facilitating Reform to Support Diversity 53
in Science Education
6. Science Education for Diversity in Teacher Education Programmes 59
Conclusion 62
References 64
Annexure A 69
Annexure B 75
Annexure C 76

5
This Synthesis Report organises the findings pertaining to science education and diversity, derived
from six Country Reports (England, India, Lebanon, Malaysia, the Netherlands, and Turkey) funded
by the European Commission, FP7. The focus of interest is understanding the complex
relationships between cultural diversity, gender and science education which affect the take up of
science education— in countries where science remains a popular career choice, and in countries
across Europe where there is a decreasing engagement of young people with science subjects at
school, as evidenced by the falling levels of recruitment in the study of science and technology
subjects at degree level. This is recognised as a significant problem both for the health of the
knowledge economy and for the health of democratic participation across Europe. In recent times
there has been a decrease in most western countries in the supply of highly educated STEM
(Science, Technology, Engineering and Math) personnel (van Langen & Dekkers, 2005).
Ensuring that industrial and economic development occurs in a socially and environmentally
sustainable way is a goal for all countries, and depends on the support of scientifically and
technologically informed citizens. Knowledge economies, heavily dependent on science and
technology, are in need of students with a positive attitude towards science and willing to pursue
the advanced study of physical sciences. Developing positive attitudes toward science or
developing a scientific attitude is an important goal of the science curriculum in many countries. A
growing body of research originating in Europe and North America has shown that most students
develop their interest in and attitudes towards school science before the age of 14 (Osborne and
Dillon, 2008). Preparation of students who will opt for careers in professional fields that directly
involve science and technology is vital to the economy of all countries. In some countries this
supply is falling seriously short and needs to be urgently addressed. The number of students
choosing to pursue the study of physical sciences, engineering and mathematics at university level,
has been declining in many European countries (European Commission, 2004; Osborne & Dillon,
2008).
Over the years, unique and catastrophic events across the world have resulted in movements of
people between countries. In the last fifty years, the entry of immigrants, refugees, and asylum
seekers into some European countries has been considerably high, and has contributed to
increasing ethnic diversity in these countries. The Netherlands and UK have witnessed an
especially large influx of immigrants, many of them Muslim. Many have come to the UK from
European countries and former colonies such as Canada, Australia, and New Zealand, while

6
immigration from India, Pakistan, Bangladesh, the Caribbean, and African countries has continued.
Recent asylum and refugee inflows have been from other parts of the world, notably Somalia,
Afghanistan, China, and Iraq (Somerville, Sriskandarajah & Latorre, 2009). In the Netherlands,
immigrants are primarily of Moroccan, Surinamese, Turkish and Antillean descent. According to the
United Nations report International Migration 2006, the percentage of immigrants in the national
population is 10.1 in the Netherlands and 9.1 in the UK.
Following a uniform framework and addressing a set of similar issues, each partner country
undertook a review and analysis of i) literature to assess evidence relevant to diversity and science
education, ii) educational policies in place to address diversity issues in science education, and iii)
school science curricula for content related to diversity. Five markers of diversity were considered
by each country in relation to education policies in general and science education policies in
particular: Ethnicity, Religion, Language (of instruction), Habitat (urban-rural), and Gender. The
target group focused on for the review and analysis was students between 10-15 years of age. The
Synthesis Report reviews the results of the Country Reports and presents the trends they reveal as
well as highlights features unique to the countries.

7
Introduction
Although varying vastly in their antecedents and size, all six countries are inhabited by peoples of
ethnic, religious, and linguistic diversity and are democratically governed. England is one of the
four ‘home nations’ of the nation state of the United Kingdom. India and Malaysia are federal
states, and the Netherlands, Lebanon and Turkey are unitary states.
ENGLAND:1 The most populous country of the UK, England’s population is about 52 million and is
categorised into primarily five ethnic groups: White; Asian or Asian British; Black or Black British;
Mixed2; and Chinese. Over 80 percent of the population is urban, with the remainder living in areas
such as the South West which is predominantly rural. The level of development, standards of living,
and accessibility to technology and other resources is broadly comparable between urban-rural
contexts; however, there are notable pockets of deprivation in both such as the ‘inner city’ and
places of ‘rural poverty.’ The distribution of ethnic minority communities is not even but rather
concentrated in the major metropolitan regions and, in particular, in the inner-city areas. In 2006,
21 percent of the maintained primary school population and 17 percent of the maintained
secondary school population in England were classified as belonging to an ethnic minority group
(DfES 2006a). Minority ethnic pupils are more likely to experience deprivation than White British
pupils, especially Pakistani, Bangladeshi, Black African and Black Caribbean pupils. “Indian,
Chinese, Irish and White and Asian pupils consistently have higher levels of attainment than other
ethnic groups across all the Key Stages3. In contrast, Gypsy/Roma, Traveller of Irish Heritage, Black,
Pakistani and Bangladeshi pupils consistently have lower levels of attainment than other ethnic
groups across all the Key Stages” (DfES 2006a). A little over 70 percent of the population is
Christian. The remaining are Muslim, Hindu, Jewish, Buddhist and Sikh. For as many as a quarter of
Pakistani and Black African school students, and 40 percent of Bangladeshi students, English is not
the main language. The language of instruction is English.
INDIA: Geopolitically divided into 28 States and 7 Union Territories (UTs), and with a population of
1.2 billion people, India’s diversity is spoken more in terms of caste, regional, linguistic, religious,
and habitat differences rather than ethnicity. Castes are ranked, endogamous groups, involving
1 Whilst there are some commonalities in terms of the education system across the Union state of UK, there are also
significant differences. For the purposes of the SED Project, all comments pertaining to the education system are with
reference to England unless specified as UK. 2 Mixed or Dual Background refers to White and any other ethnic group, or Asian and any other ethnic group etc.
3 The National Curriculum (NC) of UK is organised on the basis of four Key Stages: Key Stages 1&2 at the primary
school level and Key Stages 3&4 at the secondary school level.

8
occupational specialisation and in which membership is achieved by birth. Backward Classes is a
term used collectively for castes which are socially and economically disadvantaged and includes
the Dalits, the Scheduled Castes (SCs), and the Other Backward Classes (OBCs). There are
thousands of castes and sub-castes and 700 notified Scheduled Tribes (STs) in India. Scheduled
Castes and Scheduled Tribes together account for a quarter of the population. Tribal communities
live in about 15 percent of the country’s areas in various ecological and geo-climatic conditions
(Government of India, 2005). Of the country’s total population of 1+ billion, 29 percent is urban.
Hinduism is practiced by the majority of Indians (80 percent). Islam is the largest minority religion
(13.4 percent). Christianity, Sikhism, Buddhism and Jainism have a smaller presence. Twenty-two
languages are recognised as official, and at the primary level of schooling the first language is the
mother tongue or regional language. Teaching of English is compulsory in all UTs and States except
one, and the demand for English is rapidly increasing. However, English as medium of instruction is
used in only 12.98 percent of schools at the primary stage, 18.25 percent schools at the upper
primary stage, 25.84 percent schools at the secondary stage and 33.59 percent schools at the
higher secondary stage.
LEBANON: Of the country’s population of 4.1 million people, 95 percent are Arabs and the
remaining are Armenians and other ethnic groups. The two major religions are Islam and
Christianity, each with a number of sects. Lebanon recognises 18 religious sects. A very small
percentage of the population are followers of Judaism, a recognised religion in Lebanon. While all
schools teach Arabic as the first language, English/French are taught as second/third languages.
Armenian, Syriac, and German are taught in schools affiliated with different groups in Lebanon.
MALAYSIA: The country is geopolitically divided into 13 States and 3 federal territories. Eleven
states and two federal territories are located on the Malay Peninsula (West Malaysia) and the two
remaining states and one federal territory are on the island of Borneo (East Malaysia). The
Malaysian population consists of three main ethnic groups, Malay (53.3 percent), Chinese (26.0
percent), and Indian (7.7 percent). In addition, there are indigenous (11.8 percent) and other
groups (1.2 percent), concentrated especially in the rural areas of West Malaysia and the two
eastern States of Malaysia (Sabah and Sarawak). Those that live in West Malaysia are commonly
referred to as ‘Orang Asli’ meaning ‘the original people’ and they comprise of 19 culturally and
linguistically distinct groups (Wawrinec, 2010). These groups make up 0.5 percent of the total
population of Malaysia and many are in the lowest socioeconomic group. The population
9
distribution in Malaysia is uneven with some 20 million of the country’s total 28.31 million
residents inhabiting the Malay Peninsula (Malaysia Singapore Thailand, 2005; Department of
Statistics Malaysia 2009). All Malays are deemed Muslim by birth as defined in Article 160 of the
Malaysian Constitution. Islam is the official religion of the country and is observed by the majority
(60.4 percent) of the population. The other three major religions in Malaysia are Buddhism (19.2
percent), Christianity (9.1 percent) and Hinduism (6.3 percent). Christianity is the predominant
religion of the indigenous community. Almost all Malaysians are able to speak and write the Malay
language (Bahasa Melayu), the national language of the country, with at least one other language,
normally the mother-tongue of the ethnic group. English is widely spoken especially in the
commercial and business sectors. English is also a compulsory subject in primary and secondary
school. The medium of instruction in all national schools and public universities is Malay.
THE NETHERLANDS: The 16.6 million people of the Netherlands are distinguished by the use of
terms autochthonous and allochthonous which are a part of public discourse, and refer to the
native Dutch and non-native members of the population respectively.4 The autochthonous Dutch
population forms 80 percent of the Dutch population. The Western allochthonous group includes
all immigrants and their children coming from Western Europe, the United States, Canada,
Australia, New Zealand, Japan and Indonesia. The four largest non-Western allochthonous groups
in Dutch society tracked statistically are immigrants from Turkey, Morocco, Surinam, and the
Caribbean islands of Aruba and the Dutch Antilles. Ethnic minorities are not evenly spread over the
Netherlands. Most of them, especially Turks and Moroccans, live in the urbanised Western part of
the country. Ethnic minorities predominantly live in a number of low socio economic status (SES)
neighbourhoods in the four largest cities of the country, Amsterdam, Rotterdam, The Hague and
Utrecht. While 17.5 percent of all people in the Netherlands are registered as allochthonous, in
these cities around half of all children are allochthonous (Karsten, 2006). While 43.4 percent of the
Dutch population is Christian, an almost equal proportion (42.7 percent) adheres to no religion.
Ranging from 1 to 6 percent, the number of Hindus, Buddhists, and Muslims are on the increase.
Dutch and Frisian are the two official languages of the Netherlands. Dutch is the language of
instruction in all primary and secondary schools in the Netherlands, with the exception of primary
schools in the northern province of Friesland which allows instruction in Frisian and several
4 Allochthonous and autochthonous are words derived from old Greek meaning ‘from another country’ and ‘from this
country’. The terms create a dichotomy between those whose ancestors were born in the Netherlands and everyone
else. Outside the Netherlands, the use of these terms is mostly restricted to geography. It may seems strange for
foreigners to use these terms when referring to humans as their use is usually restricted to scientific discussions on
rocks or invasive species. However, both terms are regularly used in the Dutch language.

10
international schools which offer education in English. Bilingual education in Dutch and English is
offered in an increasing number of secondary and primary schools, and language courses in Arabic
and Turkish are offered by some schools.
TURKEY: The country’s population is 72.6 million, and 99 percent of it is Muslim. There are also
communities belonging to Christian denominations (Greek Orthodox, Armenian Apostolic, Syriac,
Chaldean), Judaism, Yezidism and various other religious beliefs. Regardless of religious or ethnic
origin, all Turkish citizens in Turkey are called "Turks". The country’s population may be
characterised as predominantly young and urban, with 52.8 percent between 0-29 years of age,
and 75 percent residing in urban areas. The country’s official language is Turkish. Article 42 of
Turkey’s Constitution stipulates teaching of Turkish to Turkish citizens as the sole mother tongue in
educational institutions (Turkish Eurydice Unit, 2010).

11
1. General Education
1.1 STRUCTURE
Across the six countries, school education consists of two or three phases, with further
demarcations within a phase in some countries (see Annexure A for each country’s structure of
education). Duration of compulsory school education ranges between 8 years (India and Turkey)
and 14 years (the Netherlands), with India enacting legislation as recently as 2009 to enforce free
and compulsory education for children between 6 and 14 years. Schooling in the Netherlands and
the UK begins at age 4 and 5 respectively, which is a year or two ahead of the other four countries.
Unlike the other five countries, placing students in different tracks according to their abilities takes
place in the Netherlands at around age 12 (as opposed to age 15/16 for a science track in the other
countries), and the years of pre-university education are a part of compulsory education.
School Education
In all six countries, children attending public schools up to the primary/elementary level receive
free education. Universalisation of elementary education (grades 1-8) is yet to be achieved in India,
and working towards it is a flagship programme of the central government in partnership with
state governments to cover the entire country and address the needs of 192 million children in 1.1
million habitations in a time-bound manner. Today, 180 million children are taught in more than
1.2 million elementary schools across the length and breadth of the country. In Malaysia and India,
promotion to the next class/grade is automatic during the years of primary/elementary education.
Repeating a school year is uncommon in the Netherlands, Turkey and the UK, especially during
primary years of schooling.
Secondary education is free in Turkey, the Netherlands, and UK; compulsory as well in the latter
two. India aims at universal access to secondary level education by 2017 and universal retention by
2020. There are about 44 thousand existing secondary schools in India and the target for 2011-
2012 is opening 11 thousand new secondary schools (Ministry of Human Resource Development,
2009). Secondary education in all six countries is broadly demarcated into two tracks: Academic
and Vocational and/or Technical. In the Netherlands, secondary education is also differentiated
into three main tracks: pre-vocational secondary education (VMBO), higher general secondary
education (HAVO), and pre-university education (VWO). The selection of students for any of these
tracks is based on advice given by the primary school and the outcomes of a centralised test, the

12
CITO test.5 The three tracks vary in duration between 4 and 6 years and allow mobility for over-
and underperforming students between the tracks. For students who find the VMBO track too
difficult6, there is the option of Practical education (PRO), a form of secondary education. About
half of the Dutch secondary education student population is in the pre-vocational VMBO track.
During the last decades, the number of students in the VMBO track has been steadily decreasing. A
similar scenario prevails in India, where less than 5 percent choose the vocational stream. In the
higher/upper secondary stage of education (ages 16-18 years/grades 11-12) in India, Lebanon,
Malaysia, and Turkey, the curricular choices in the academic track are generally Arts/Humanities
and Science. In the case of India, a third popular choice is Commerce.
University Education
University/Higher education commences at 18 years of age in most of the countries and in the case
of Turkey at 19 years of age. The types of courses (vocational/ technical/engineering, scientific,
professional), diploma and degree programmes offered, and the kinds of higher education
institutions (colleges, polytechnics, universities) vary from country to country. In the Netherlands,
higher education is divided into three tracks which are clearly linked to the tracks offered in
secondary education. General vocational education (MBO) may be pursued by those with a VMBO
degree, higher vocational education (HBO) by those with a HAVO degree, and university education
(WO) by those with a VWO degree. For enrolment in scientific studies at university, a student is
expected to have taken exams in a number of required science courses in secondary school.
Humanities and social science studies generally do not demand any required courses for
admission.
In its size and diversity, India has the third largest higher education system in the world with over
10 million students but the enrolment rate at 11 percent is relatively small (The World Bank report,
2009), with significant disparities in gross enrolment ratio (GER)7 between rural and urban areas—
GER in urban areas being four times higher compared to rural areas (Thorat, 2006). A quota system
5 The CITO test tests knowledge of language (writing, spelling, understanding of text and vocabulary), mathematics
(arithmetic, fractions, measuring), study capabilities (use of texts and information sources, understanding of maps and
schemes) and world orientation (history, geology and biology/science). Of the 290 questions in the test, 30 are about
biology/science. 6 PRO track that does not provide the students with a diploma and it is attended by a small number of students. In
addition, students with special needs who attended primary education (SO) also have the opportunity for secondary
education (SVO) where special attention is paid to students with learning problems. 7 Total enrolment in a specific level of education, regardless of age, expressed as a percentage of the eligible official
school-age population corresponding to the same level of education in a given school year.

13
operates in public universities in India and Malaysia based on socioeconomic status and ethnicity,
respectively. In India, 22.5 percent seats are reserved for scheduled caste and scheduled tribe
students in central government-funded institutions for higher education. In Malaysia, the entrance
ratio to university is set at 55:45 for Bumiputera (native) to non-Bumiputera students (Aitbach &
Umakoshi, 2004).
Ministries or Departments of Education oversee the education system in all six countries, usually
with a bifurcation in responsibility for primary and secondary education on the one hand and
higher education, on the other hand. In Turkey, the Ministry of National Education is the national
authority responsible for primary and secondary education and its institutions whereas the Council
of Higher Education is responsible for higher education and its institutions. There are two
government ministries to oversee the education system in Malaysia: the Ministry of Education
oversees the pre-primary, primary and secondary level, while the Ministry of Higher Education
oversees the tertiary and post-graduate education. Education in the UK is the responsibility of two
Government Departments – the Department for Education which is responsible for matters up to
the age of 19; and the Department for Business, Innovation and Skills which is concerned with
Further and Higher Education. In Lebanon, presently, the Ministry of Education and Higher
Education is the only ministry that deals with education and is in charge of higher education,
general education, and technical and professional education. Almost all schools, universities and
other institutes of learning in the Netherlands fall under the responsibility of the Dutch ministry of
Education, Culture and Science. An exception is made for agricultural education for which the
ministry of Agriculture, Nature and Food Safety is responsible. In India, the Departments of School
(Elementary and Secondary) Education and Higher Education are under the charge of the Ministry
of Human Resource Development of the Central Government. The organisation and structure of
education are largely the concern of the States/UTs. In some of the States, local self-government
bodies are also associated with school education in order to make the system of administration
sensitive to local conditions and also to facilitate community participation. While school education
in India is mainly a local-State partnership, higher education operates as an area of Centre-State
partnership.

14
1.2 TYPES OF SCHOOLS AND STUDENT DIVERSITY
The provision of compulsory and free primary education in all six countries is the basis for state-
funded schools, which in Malaysia, Lebanon, Turkey and India go by the nomenclature of ‘public
schools’. The public school system is larger than the private school system in all countries except
Lebanon where over 60 percent of the students are enrolled in private and semi-private schools.
Student diversity in Lebanese schools is minimal with 95 percent of the students being Arabs and
approximately 5 percent being Armenian and other groups. In England, the Netherlands and
Turkey, there are secondary schools which specialise in science.
In the Netherlands, 30 percent of schools are governed by a municipal council and referred to as
public schools. The majority 70 percent of the schools, although referred to as private schools, are
also funded by the state and end goals and quality standards are determined by the government.
These are differentiated on the basis of religion: 30 percent Protestant, 30 percent Catholic and 10
percent of other religions. Unlike public schools, private schools have in principle the right to
refuse to admit pupils whose parents do not subscribe to the belief or ideology on which the
school is based. Dutch primary schools can be also divided into ‘white’ and ‘black’ schools with the
latter having a population that consists of 80 percent or more of non-Western immigrant children
(Gijsberts & Dagevos, 2009). Segregation in secondary schools is less strong since these schools
draw their students from a larger number of neighbourhoods. Nonetheless, there are many ‘black’
VMBO schools and some other ‘black’ secondary schools in the Western part of the Netherlands.
This pattern of segregation in schools has not changed in recent years and the division between
white and black schools seems to become stronger and not weaker (Gijsberts & Dagevos, 2009).
The right to found religious schools and receive state funding has lead to the creation of several
Islamic primary schools and an Islamic secondary school which cater exclusively to ethnic minority
students with a Turkish or Moroccan background. Almost half of all secondary schools take part in
the Universum programme in which schools profile themselves as having a strong commitment to
science. Universum schools have a significantly higher number of pupils taking science courses
than comparable schools.
In the UK, schools belong to one of two broad categories determined by their relationship to the
State: state-maintained or independent (fee-paying). The state-maintained schools are run by local
authorities or charitable foundations and are known by a variety of names such as Community
schools or Foundation schools amongst others. There are other kinds of state schools as well which
15
focus on particular subject areas or follow a religious curriculum. Approximately 93 percent of the
students attend state-maintained schools. Nearly 90 percent of state-funded secondary schools are
specialist schools, receiving extra funding to develop one or more subjects in which the school
specialises; science is one of ten such subjects. There are 376 designated specialist science
colleges, including 40 colleges combining science with another specialism and 31 colleges that
have science as a second specialism. Each is at the forefront of innovation in science and
mathematics (Specialist Schools and Academies Trust, 2011). City technology colleges (CTCs) for
students aged 11 to 18 teach the national curriculum with a specific focus on science, mathematics
and technology. Although the vast majority of students fall into the White British category, there
are significant numbers of students who fall into the Ethnic Minority or Black and Minority Ethnic
(BME) aggregate category. BME is an umbrella term which is used in official and academic
discourse in the UK to refer to individuals or communities that are ethnically or culturally
distinguishable from the majority ‘host’ community. In 2006, 21 percent of the maintained primary
school population and 17 percent of the maintained secondary school population in England were
classified as belonging to a minority ethnic group (DfES 2006a). The proportion and absolute
numbers of BME pupils rises significantly in large metropolitan regions of England such as Greater
London which accounts for 44.6 percent of the total BME community of the UK, or in some areas
associated with particularly strong flows of immigration.
In Malaysia, post-independence in 1957, all public primary schools were converted to national and
national-type schools (The Educational Planning and Research Division, 1967). The differentiation
is on the basis of ethnicity, although not strictly—Malays tend to attend national schools whereas
the Chinese and Indian tend to attend national-type schools. National schools receive full funding
from the government, while national-type schools may receive full or partial funding. All students
from national and national-type schools are enrolled in the national secondary schools. Students
also have the option of enrolling in National Religious Secondary Schools or fully residential
schools. There are also private schools, independent schools, and religious schools in Malaysia
offering primary and secondary education. International schools offer education to children of
expatriates.
In India, there are about 1.5 million government schools and about 250 thousand private schools
(National University of Educational Planning and Administration, 2010). In the urban and rural
areas, schools may be Central or State government funded, or private with or without government
16
aid. In the tribal areas, schools are funded by the State government. Central government schools
in the urban areas cater to children of transferable central government employees (including
defence and para-military personnel), and in the rural areas they operate as residential schools for
talented rural children. In cities and towns, local government bodies such as the Municipal
Corporation also manage schools. There are also schools run by the Central Tibetan Schools
Administration and public sector companies for the children of their staff. In metropolises like
Delhi and Mumbai there are schools run by international embassies. A number of children are also
enrolled through correspondence courses to the National or State Open Schools (NOS or SOS).
Islamic religious institutions known as maktabs and madrassas also exist in different parts of the
country, some of which follow the general system of education. Schools in urban areas of States
which have a high proportion of immigrants from other States are likely to have a more diverse
student population in terms of regional diversity, in addition to religious and caste diversity.
The primary and secondary schools in Turkey are either public or privately established. Private
schools may be established by legal citizens of the Turkish Republic, foreign nationals and
corporate bodies, or non-Muslim communities. Private international schools may also be
established through a partnership between foreign and national entities or solely by one or the
other. Apart from State primary schools, there are Regional Boarding Primary Schools and Mobile
Education Schools to address geographical limitations. For students in rural areas and localities
with low or dispersed population, access to primary education is provided by regional boarding
schools. Mobile schools provide educational services for children who live in rural areas by
transporting them to the central primary education institute on a daily basis. Secondary schools
are categorised in two groups: General and Vocational-technical. Science High Schools (Fen Lisesi)
are one of five types of general secondary schools. They focus solely on science and mathematics
education (see box 1).

17
Box 1. Science High Schools in Turkey
The education system in the six countries also caters to students with special needs by way of
special schools for them and/or programmes to integrate them into mainstream schools.
1.3 SIZE AND DURATION OF CLASSES
The average student-classroom ratio in Lebanon is 20-25 students, and in the Netherlands 25-30.
In the UK it is around 30 students (with fewer students in science classes in the final years of
secondary education as not many students choose to take these classes). In Malaysia, India and
Turkey, the size of a class deviates from the norm or official size depending on the type of school or
region. For Malaysia, the average class size in a national primary school is 30-35, whereas in
national type primary school it is 50-55 students. The average class size in a national secondary
school is 35-42, whereas in national type school it is 50-55. The maximum number of students per
class in Turkey is officially specified to be 30; in different regions of the country it ranges from 20 to
40 students. In India, it varies between 40-50 students and can increase to as high as 98 in the
primary schools in Bihar, the second most densely populated state in the country (Government of
India, 2009). In the Netherlands, a secondary education class lasts for 45 minutes. In Turkey, a class
period is 40 minutes and in most schools in Lebanon, 50 minutes. In India, in most curricular
documents, a period has been presented as a basic unit of 45 minutes of teaching-learning in a
The first Science High School was established in 1964 to provide education to the
exceptionally gifted mathematics and science students with a funding from the Ford Foundation. The school is modelled after the American counterparts like the Bronx High
School of Science. Due to the considerable success of its alumni in all aspects of
professional life and academia, science high school concept is spread around the country and now there are 115 public and private science high schools in all major
cities.
The language of instruction in the Science High Schools is Turkish. Class size is limited
to twenty-six. These four-year schools emphasise research and laboratory activities.
The main foundation goals of Science High Schools are as follows:
- providing education to the exceptionally gifted mathematics and science students in progress to higher education
- providing education to cater for superior scientists who are needed in science
and mathematics - providing working environment and conditions to students who are interested in
scientific and technological developments as well as new innovations
- nurturing individuals who are able to use advanced technology, produce new knowledge and develop projects
- providing education in at least one foreign language to enable students to do
scientific research, and follow scientific and technological developments
Each student has to participate in a science or mathematics projects during their
education. The Science High Schools have the highest percentage in achievement in the university entrance exam. The achievement rate is about 99 percent for both public and
private science high schools. The teachers are selected through exams for Science High Schools.
18
timetable. Frequently, this is compromised into 30 or 35 minutes. A class period in a primary
school in Malaysia lasts for 30 minutes and in a secondary school for 35 minutes.
1.4 STUDENT ENROLMENT
Determined by the size of the population, the enrolment figures vary vastly across the countries. In
the school year 2008-09, 3.7 million people were enrolled in government funded education in the
Netherlands (Ministry of Education, Culture and Science, 2009). In Lebanon, the total number of K-
12 grade students is around 980,000. In the same year, in India, over 180 million (187,727,513)
were enrolled—only in elementary education. Gross Enrolment Ratio (GER)8 for primary education
(grades 1-5) was estimated to be 115.31 percent, and Net Enrolment Ratio (NER)9 was 98.59
percent. In upper primary classes (grades 6-8), GER was 73.74 percent and NER 56.22 percent
(NUEPA, 2010). Although gross enrolment ratios have increased significantly across all social
categories in India and the dropout rate is below 4 percent for primary age children, it accelerates
rapidly to 28 percent at age 15, and 63 percent at age 19 (Bhalotra, 2009). Malaysia recorded a
97.9 percent GER in primary education. This rate has been on the increase since the 1980s. In
terms of retention, an overwhelming percentage of students who did not finish primary level
education come from Sabah state, which is located in East Malaysia. These students may have
discontinued their education because of shifting to private schools or migrating to another state
(Ministry of Education, 2008). In Turkey, in the school year 2009-10, the GER for primary education
was 106.48 percent and NER 98.2 percent; GER for secondary education was 84.19 percent and
NER 64.95 percent (National Education Statistics, 2010). In Lebanon, NER dropped from 87 percent
in primary education to 74 percent in grade 9 (World Bank, 2010).
Gender Equity
Gender gap in enrolment at the primary and secondary education levels has been conspicuous in
many countries across the world, and efforts have been made in the last decade to reduce or
eliminate it. In Lebanon, primary school enrolment for females (as gross percent of school age
population) rose from 76.2 in 1990 to 89.4 in 2001, and secondary school enrolment for females
rose to 79 percent in 2002.10
India has recorded an improvement in Gender Parity Index (GPI)11
8 Total enrolment in a specific level of education, regardless of age, expressed as a percentage of the eligible official
school-age population corresponding to the same level of education in a given school year. 9 Total enrolment of the official age for a given educational level expressed as a percentage of the corresponding
population. 10
http://www.undp.org.lb/WhatWeDo/MDGs.cfm 11
An index designed to measure the relative access to education of males and females, calculated as the quotient of

19
and percentage of girls' enrolment in primary and upper primary classes. In 2008-09, GPI in
primary education was 0.94 and in the case of upper primary education it was 0.91. The
percentage of girls’ enrolment in primary education was 48.38 and in upper primary education it
was 46.99. At the elementary level of education, enrolment of SC, ST, OBC and Muslim girls is
similar, standing at 48.09 percent, 48.01 percent, 48.22 percent, and 49.2 percent, respectively
(NUEPA, 2010). In Malaysia there is a reverse gender gap with a higher retention rate of female
students compared to male students at all levels of education. The challenge for the country is to
increase the retention rate of male students (United Nations Country Team Malaysia, 2005). In
Turkey, in 2010, GER of girls in primary education was 105.88 percent and in secondary education
78.97 percent; NER in primary education was 97.84 percent and in secondary education, 62.21
percent (National Education Statistics, 2010).
Enrollment rates paint only a partially successful picture of gender equity. Drop out and retention
of girls in primary and secondary education continues to be a challenge in countries like India.
Gender as a category needs to be seen within the larger social and regional context. In countries
like India and Turkey, poverty, social inequalities and gender relations intersect in different regions
of countries in different ways, with one reinforcing or offsetting the other (Aydagül, 2007;
Ramachandran, 2009). Girls in southeast Turkey constitute the most disadvantaged group. In India,
rural-urban differences are greater than male-female differences, with females being at a greater
disadvantage in rural areas than urban. Gender inequity is further reinforced in some countries by
certain features of the prevailing education system such as teachers’ attitudes towards girls,
limited access to schools, no high schools for girls-only. Gender gap also exists in the area of
educational achievement for certain curriculum subjects. In the UK, a gender gap is perceived to
exist in STEM related subjects with girls being relatively underrepresented and/or under-
performing (Haste, 2004).
1.5 EDUCATIONAL POLICIES FOR DIVERSITY
The education of ethnic, minority and disadvantaged groups is beset by issues related to
deprivation, underachievement, and segregation/discrimination. In some of the countries, these
issues are addressed by specific government policies and schemes aimed at affirmative action.
Country responses to diversity have often been with a view to allowing ethnic/minority
populations to maintain their unique identity, sometimes with a concurrent emphasis on their
the number of females by the number of males enrolled in a given stage of education (primary, secondary, etc.).

20
assimilation with the majority society. In the UK, although BME pupils are more likely to
experience deprivation – and consequently educational underachievement—than White British
pupils, this deprivation stems less from distinct ethnic/cultural identities and more from inequities
(of income, housing, and education) between the most disadvantaged working-class people of
whatever ethnic group and the more prosperous majority (Gavron, 2009, p.2). This suggests that
the degree of commonality of experience and opportunity which exists across the most deprived
groups vis-a-vis the most privileged may have a greater bearing on educational underachievement
than the different ethnic/cultural identity groupings (Sveinsson, 2009). Several strategies and
initiatives have been introduced to address the issue of educational underachievement associated
with inner-city areas where many students, including ethnic minority students, face problems of
socio-economic deprivation.
A similar situation was observed in the Netherlands, where not only ethnic minority students, but
also students of low SES are educationally disadvantaged. Earlier policies which independently
targeted each group of students were replaced in 1985 by the Educational Priority Policy which
allocated additional resources for primary schools based on the number of ethnic minority and low
SES children attending the school (Driessen, 2000). Despite the aim to treat both groups on par,
the tendency was to allocate more resources towards minority children than native Dutch children.
The policy was overhauled in 2006 to solely provide additional resources for children with a low
SES irrespective of their ethnicity (Dutch Eurydice Unit, 2007). A supplemental policy, the
Educational Opportunity Policy (Onderwijskansenbeleid) was adopted in 2002 to deal with schools
with very large numbers of students with a low SES (Dutch Eurydice Unit, 2007). The position of
minorities in Dutch society, especially those from Turkey and Morocco, has shaped educational
policies regarding minorities in the Netherlands and been at the centre of its national integration
debate (see boxes 2 & 3).

21
Box 2. Changes in language policy in the Netherlands.
Box 3. Changes in multicultural policy in the Netherlands.
Ethnic minorities predominantly living in low SES neighbourhoods coupled with free school choice
led to a situation of segregation in primary and secondary schools along ethnic and socioeconomic
lines (Karsten et al., 2006). A few laws and policies by municipal governments encourage mixing of
ethnic groups at schools. In 2004, a law to counter segregation was adopted that disabled funding
LANGUAGE: In the Netherlands, the policy of providing instruction in the mother tongue
stemmed from the idea that immigrant children would stay only temporarily in the
Netherlands. Instruction in the language and culture of their parents would diminish the
cultural gap between home and school and prepare them for the eventual return to their
parents’ country of origin. Language instruction took place during regular school hours
so immigrant children had to miss other classes in order to take language classes.
Continuous debates were had on the need and merit of such a policy since it was found
that for most children the proficiency in their mother tongue was not very high and
because the Dutch government eventually abandoned the idea of temporary residence.
In 1998, a renewed policy ‘Education in Living Allochthonous Languages’ (Onderwijs in
Allochtone Levende Talen) was adopted in which the focus was more on language
acquisition and less on culture and which demanded that education in these languages
would not take place during regular school hours but afterwards (Berlet et al., 2008). In
2004, public funding for this policy stopped (Berlet et al., 2008).
INTERCULTURAL EDUCATION: In the 1980s, the Netherlands adopted a multicultural
policy in which the cultural identities of ethnic minorities were maintained while
combating educational disadvantages (Karsten, Felix, Ledoux, Meijnen, Roeleveld, & van
Schooten, 2006; Rijkschroeff, ten Dam, Duyvendak, de Gruijter & Pels, 2005). In 1984,
a policy note was published on ‘intercultural education’ (ICO) to “let pupils learn to
deal with similarities and differences related to ethnic and cultural background” (Berlet
et al., 2008). Intercultural education was a container concept for different ways of
teaching and learning about cultural differences. However, in the absence of clear
benchmarks or specification about the amount of time to be spent on it, schools
devoted very little or no time to ICO and rarely discussed cultural practices in depth
(Driessen, 2000). During the 1990s and the first decade of the 21st century,
multiculturalism came under severe public scrutiny (Rijkschroeff et al., 2005). In
February 2006, a new law, ‘Active citizenship and integration’ was adopted. It
resembles the ICO in its emphasis on learning about cultural differences but
maintaining cultural identities is not part of the policy; the focus is on citizenship,
learning about democratic values and knowledge that are necessary to take part in
society.

22
for new schools where more than 80 percent students were of a low social economic background
(Dutch Eurydice Unit, 2007).
India’s National Policy on Education 1968 and subsequent policies have addressed regional
imbalances in the provision of educational facilities by providing good educational facilities in rural
and other backward areas, emphasised education of girls to achieve social justice and accelerate
social transformation; intensified efforts to develop education among the backward classes and
the tribal people; promoted educational interests of minorities; and developed integrated
programmes to enable physically and mentally disabled children to study in regular schools. The
National Policy on Education 1986 laid special emphasis on education for women’s equality. The
removal of female illiteracy and obstacles inhibiting girls’ access to, and retention in, elementary
education received priority. The National Policy on Education 1986 and its revised plan of action
(POA 1992) paid greater attention to the education of the educationally backward minorities,
Scheduled Castes, and Scheduled Tribes. Two centrally-sponsored schemes were launched during
1993-94 which were merged a decade later to form the Area Intensive and Madrassa
Modernisation Programme which provide basic educational infrastructure in areas of
concentration of educationally backward minorities and resources for the modernisation of
Madrassa education.
In 1969, rioting amongst different ethnic groups due to socioeconomic disparities, led the
Malaysian government to reconsider its education policies to strengthen racial integration. The
usage of different mediums of instruction in schools was perceived as a hindrance to national
integration. With effect from January 1970, all English medium schools were directed to convert to
the Malay medium (Kalantzis & Pandian, 2001). By the end of the 1970s all schools used the Malay
language as the medium of instruction, with the exception of vernacular primary schools (as
provided in the Education Act 1961). In 1983, the Malay language also became the medium of
instruction in public universities.
The right to found religious schools is upheld by the six countries. In the Netherlands it has led to
the creation of Islamic schools which cater exclusively to ethnic minority students with a Turkish or
Moroccan background. The existence of these schools has led to a debate on whether or not such
schools add to the integration of Islamic minorities in Dutch society. A similar concern is
experienced in Lebanon where religious communities exercise their constitutional right to set up

23
their own schools thereby isolating groups from one another; religious and religious-sect identities
take precedence over the national identity. In Malaysia, the National Religious Secondary Schools
which were set up in the late 1970s and emphasise mastery of Arabic, Jawi and Quranic skills and
expertise in Islamic knowledge, have steadily declined. From as many as 327 in 2002 they have
decreased to as few as 55 in 2010 (MOE, 2010). In the UK, a third of all primary schools are
religious or faith schools.12
1.6 TEACHER TRAINING/ EDUCATION
Qualifications for recruiting school teachers vary considerably across the countries as does the
duration of the teacher education programmes. A Bachelor’s/University degree is the minimum
academic requirement for teaching in a secondary school in all six countries; additionally, a
Bachelor’s degree in Education (B.Ed.) is required by Turkey, India and Malaysia. In England, a B.Ed.
is an additional/alternative qualification for those interested in teaching at the higher education
level. Except for India and Malaysia, a degree qualification is a minimum requirement to teach in a
primary school as well in the other four countries. To teach Science in secondary school, teachers
in all countries are required to specialise in the subject. The Netherlands and England have more
rigorous requirements and eligibility criteria for teachers (see box 4).
12
http://www.telegraph.co.uk/education/8204399/Faith-schools-are-a-beacon-of excellence.html.

24
The Netherlands: There are two different qualifications that allow teachers to teach in
secondary education. A first degree qualification is obtained at a university (WO) and makes
the teacher eligible to teach at every type of secondary education track. A second degree
qualification is obtained at a higher vocational education track (HBO) and makes the teacher
eligible to teach at every type of secondary education track except the last two classes of
higher general secondary education (HAVO) and the last three classes of pre-university
education (VWO). Teachers who have obtained their second degree qualification at HBO may
continue their study and obtain a first degree qualification. For this they have to follow several
courses at a university.
UK: All those wishing to teach in a State-Maintained School must be graduates, and are
required to have Qualified Teacher Status (QTS). The route to achieve QTS is known as Initial
Teacher Training (ITT). Students either engage in academic study of education as part of their
initial degree (a B.Ed) or they study a subject for their first degree and then academic aspects
of education during a one year post graduate teacher training programme. Many of these
programmes lead to the award of a Post Graduate Certificate in Education (PGCE) in addition
to QTS. Such programmes involve study at Masters level. In recent years more alternatives to
the PGCE ITT route have become available to achieve QTS. Common to all routes is that they
involve a period of study with a recognised provider combined with substantial amounts of
practical teaching experience at a school placement (e.g. 26 weeks of school placement in a 1
year PGCE course for secondary teachers). Prospective teachers have to demonstrate during
their training that they have met the ‘Standards for the Award of QTS’ (commonly referred to
as the ‘Standards’) which address professional attributes, professional knowledge and
understanding, and professional skills. In addition, before achieving QTS all candidates have
to complete ‘Key Skills Tests’ in numeracy, literacy and information and communications
technology (ICT). These are administered as computerised tests through designated Test
Centres. Most qualified teachers working in the maintained or ‘state’ sector are required to be
registered with the General
Teaching Council for England (GTCE). All prospective teachers are subject to a number of
checks, designed to prevent unsuitable people from gaining access to children and to maintain
the integrity of the teaching profession. These checks usually include identity confirmation;
professional and character references; previous employment history; criminal record check
undertaken by the Criminal Records Bureau (and referred to as a CRB Check); and health
check.
Box 4. Teacher qualification requirements in the Netherlands and England.

25
2. Science Education: Structure and Policies
2.1 SCIENCE IN THE SCHOOL CURRICULUM
Over the last several decades, political changes in countries (and consequently ideologies which
influence educational policies and curricula frameworks), the challenges of industrial and
economic development—in environmentally sustainable ways—in the 20th
century, and the
demands of the globalised knowledge economy of the 21st century, have all contributed to
redefining the place of science in school curricula. Currently, in all six countries, science is accorded
the status of a “core” or compulsory subject during the primary years of schooling. In Turkey,
Malaysia, India, and the UK, it continues to hold that status during secondary years of schooling as
well. India’s first National Policy on Education in 1968 laid down that science should be “an integral
part of general education till the end of the school stage.” Science was included as a core subject in
the UK fairly recently, with the inception of the National Curriculum in 1989. It was a response to
the economic imperative of government policy since the 1950s and 1960s of providing future
scientists to support the national economy. In Malaysia, following the introduction of a new
curriculum in 1983, science was replaced with the subject ‘Man and his environment’ in the upper
primary school and it was not examined in the primary school achievement test (PSAT, or better
known as Ujian Peperiksaan Sekolah Rendah, UPSR). Coupled with this, at the secondary school
level, the several options provided to students for the study of science, downplayed the
importance of the subject. The replacement of science in the curriculum in 1983 resulted in a
decline in students’ interest in science and subsequent choice for the science stream in secondary
school. Students also showed difficulty learning abstract topics. Consequently, science was
reintroduced as a core subject in 1991 (Ministry of Education Malaysia, 1994). In Lebanon, science
has attracted increasing attention since the 1995 Educational Reform Plan. The number of hours
apportioned to science teaching increased, biology was introduced at the intermediate and
secondary levels, and an issues-oriented science curriculum was proposed for non-science majors.
The instructional time for science varies across the countries. In India, at the primary stage it is 15
percent for science; at the upper primary and secondary stages, 13 percent. A period can, in
general, serve as an organisational unit for many text- based lessons. The number of periods for
each theme is specified in the upper primary and secondary syllabus for science (e.g. 20 periods
for the theme Food, 26 periods for the theme Materials). In the UK, although there is no statutory
time allocation for teaching NC science, as a core subject it is generally given greater proportion of
26
curriculum time relative to foundation subjects. Typically science can expect around 10 percent
curriculum time at Key Stages 1and 2. At Key Stage 3, the typical amount of teaching time given to
science is about 3 hours a week, approximately 12 percent of the teaching week. In the
Netherlands, there is no prescribed length for science classes in primary education. On average,
pupils spend a little over 100 hours a year on social and environmental studies in the last two years
of primary education which is slightly more than the European average (Ministry of Education,
Culture and Science, 2007). Malaysia and Lebanon have statutory allocation of time for teaching
science. During the six years of primary education in Malaysia, the weekly class time spent on
science increases from 90 minutes to 150 minutes between the lower primary and upper primary
school years. During the five years of secondary school, the weekly class time on science teaching
is 200 minutes. In the two years of upper secondary school, the weekly class time on elective
science subjects Biology, Chemistry, Physics and Additional Science is 160 minutes each (students
who opt for the Arts stream have to take the core science subject, whereas those who opt for the
Science stream take a combination two or more of the science electives and are not required to
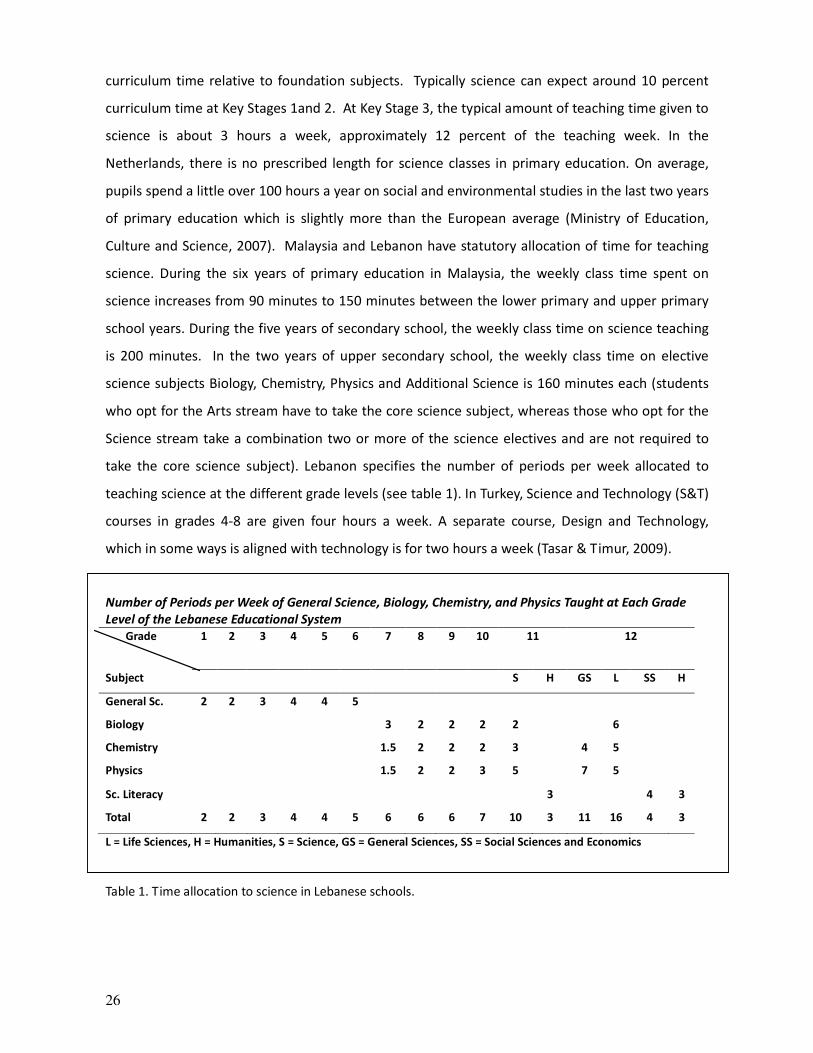
take the core science subject). Lebanon specifies the number of periods per week allocated to
teaching science at the different grade levels (see table 1). In Turkey, Science and Technology (S&T)
courses in grades 4-8 are given four hours a week. A separate course, Design and Technology,
which in some ways is aligned with technology is for two hours a week (Tasar & Timur, 2009).
Number of Periods per Week of General Science, Biology, Chemistry, and Physics Taught at Each Grade
Level of the Lebanese Educational System
Grade 1 2 3 4 5 6 7 8 9 10 11 12
Subject S H GS L SS H
General Sc. 2 2 3 4 4 5
Biology 3 2 2 2 2 6
Chemistry 1.5 2 2 2 3 4 5
Physics 1.5 2 2 3 5 7 5
Sc. Literacy 3 4 3
Total 2 2 3 4 4 5 6 6 6 7 10 3 11 16 4 3
L = Life Sciences, H = Humanities, S = Science, GS = General Sciences, SS = Social Sciences and Economics
Table 1. Time allocation to science in Lebanese schools.

27
Science instruction in a majority of the schools in Turkey, the Netherlands, and the UK is in their
respective first/national language. In Malaysia, the merit of a policy for science instruction in the
mother tongue has been debated since 1978. The policy adopted in 2003 of using English to teach
science and mathematics at the secondary level has been reversed and in 2012 Malay will be
reinstated as the language of instruction for science. In Lebanon, instruction of science is in the
second language adopted by the schools, which may be English or French. In India, instruction of
science is in the regional language or English.
2.2 SCIENCE CURRICULUM/SYLLABUS
At the primary level, science in most countries is offered as an integrated course and its teaching is
organised around themes drawn from the natural and social environment. In India, in the first five
grades of elementary education, science is taught as a single subject Environmental Studies (EVS)
with common themes drawn from issues in social studies, sciences and environmental education.
For grades 1 and 2, there is only a Teacher's Guide; no textbooks for the students. In grades 3-5,
EVS is divided into general science and social studies with separate textbooks for each. The syllabus
for Classes 3-5 is woven around six common themes: Family and Friends; Food; Shelter; Water;
Travel; and Things we Make and Do. The syllabus is framed within a social constructivist
perspective of learning and each theme is presented as a matrix consisting of leading questions,
key concepts, suggested resources and activities (see figure 1). In the latter three years of
elementary education (6-8) and two years of secondary education (grades 9 and 10), the syllabus is
organised around themes that are cross-disciplinary in nature: Food; Materials; The World of the
Living; How Things Work; Moving Things; People and Ideas; Natural Phenomena; and Natural
Resources. The majority of students are not likely to take up careers as scientists or technologists
and so the science curriculum is oriented towards developing awareness about the interface of
science, technology and society. However, in some states science at the secondary stage is taught
as a combination of physical science and biological science/life science while in some others as
physics, chemistry and biology/life science. At the higher secondary stage, science is taught as
separate disciplines (Biology, Chemistry, and Physics) and is expected to emphasise experiments,
technology, investigative projects, historical development of key concepts of science, and
awareness of conceptual pitfalls.

28
Figure 1. Framing of the primary level EVS syllabus (India).
Source: NCERT (2006).
In the UK, the National Curriculum is organised on the basis of four Key Stages13
. A programme of
study (POS) at each key stage sets out the ‘Knowledge, skills, and understanding’ students should
be taught and the ‘Breadth of study’ for each subject. Schools can choose how to organise the
13
Key Stages 1&2 at the primary school level and Key Stages 3&4 at the secondary school level.
29
school curriculum to include the programmes of study. At KS 1&2, four areas are identified for the
development of knowledge, skills and understanding in science: Scientific enquiry, Life processes
and living things, Materials and their properties, and Physical processes. Scientific enquiry is to be
taught through contexts taken from the other three areas. The breadth of study identifies contexts
in which science should be taught, the technological applications that should be studied, and
identifies what should be taught about communication and health and safety in science. The
revised National Curriculum 2000 marks a return to a more progressive orientation. Its vision of
science education for the four Key Stages includes statements about the importance of the cultural
significance of science and its development worldwide. Education for Sustainable Development is a
statutory part of the POS of Science. NC2000 is operative at the primary level.
At Key Stages 3 & 4, the new secondary NC (2008) is applicable. At Key Stage 3, the POS states the
importance of science, the key concepts and key processes, the four content areas on which
teachers should draw to teach the key concepts and processes, and curriculum opportunities that
should be offered to students to enhance their engagement with the concepts, processes and
content of the subject. Cultural understanding and Collaboration14
are two key concepts which
address diversity. Some of the curriculum opportunities also show sensitivity to the issue of
diversity and emphasise the “study of science in local, national and global contexts, and
appreciating the connections between these; recognising the importance of sustainability in
scientific and technological developments; and exploring contemporary and historical scientific
developments and how they have been communicated” (QCA, 2007, p.212). At Key Stage 4,
students have a choice to opt for biology, chemistry and physics as separate courses or a combined
science course incorporating dimensions of all three. The focus is on knowledge, skills and
understanding of how science works through the study of four broad content areas: Organisms and
health; Chemical and material behavior; Energy, electricity and radiations; and the Environment,
Earth and universe.
In Turkey, in grades 1-3, science is integrated with the course Knowledge of Life which comprises
environmental consciousness and effective use of resources. With the recent changes made in the
curriculum a course titled Science and Technology is offered in grades 4-8. The new primary S&T
curriculum consists of seven learning areas with four content strands supported by skills,
14
“Recognising that modern science has its roots in many different societies and cultures, and draws on a variety of
valid approaches to scientific practice”; “Sharing developments and common understanding across disciplines and
boundaries” (QCA, 2007, p.208)

30
understanding and attitudes (see figure 2). There is a spiral approach for each strand mainly based
on the constructivist approach, enriched with teaching activities and multiple assessment methods
and techniques.15
Figure 2. The primary S&T curriculum in Turkish schools: Four content areas supported by three supporting
interwoven areas.
(Science Curriculum, Grades 6-8, 2005; cited from Taşar and Timur, 2009).
During the period of secondary education, biology, chemistry, and physics are compulsory science
courses for all students in grade 9. In grades 10-12, science courses (which also include Astronomy
and Space Science) are mandatory for students who wish to specialise in them; for students
specialising in other areas, the science courses may be taken as electives.
The aims of the Malaysian primary science curriculum are to provide opportunities for students to
learn about themselves and the environment through everyday experiences and scientific
investigations, and to acquire knowledge and skills in science and technology. The lower primary
syllabus for grades 1-3 focuses on two topics: Learning about living things, and the World around
us. The focus of the upper primary syllabus for grades 4-6 is on investigating five areas: Living
things; Force and energy; Materials; the Earth and the Universe; and Technology. Elective science
subjects are offered at the upper secondary level and consist of biology, chemistry, physics and
Additional Science. When students reach Form 4 of the upper secondary level (16 years of age),
they opt for the Arts or Science stream. While students in the Arts stream are required to take one
compulsory science subject, students in the Science stream are required to take two or more
15
http://artofteachingscience.org/countries/turkey.html
31
science subjects, i.e. biology, chemistry, physics.
In Lebanon, General Science is taught to students during elementary school (grades 1-6). Biology,
chemistry and physics are taught during the intermediate stage of schooling (grades 7-9) and for
the first year of secondary schooling (grade 10). In grade 11, students have a choice between
Humanities and Science streams; those who opt for Science may pursue the General Sciences or
the Life Sciences stream in grade 12.
In the Netherlands, primary education is centred around six curriculum domains. Science and
technology is included in the curriculum domain named ‘Social and Environmental Studies’. In all
three tracks of secondary education (VMBO, HAVO and VWO), a programme of General Education
is offered in the first three years which consists of several courses. The science and technology
related courses in the General Education (basisvorming) programme are biology, mathematics,
technology, informatics and a combined course of physics/chemistry. In the latter years of the
VMBO track, students can opt to graduate in one of four different subject clusters: technology,
agriculture, care/welfare and economics. For technology students, a combined subject
chemistry/physics is mandatory and care/welfare students have to take a course in biology.
Agriculture students can choose between these two science courses. In the latter years of the
HAVO and WVO tracks, students have to choose from among four subject clusters: ‘Science and
Technology’(S&T), ‘Science and Health’(S&H), ‘Economics and Society’ (E&S) and ‘Culture and
Society’(C&S). Chemistry and mathematics are required for S&T and S&H; in addition, physics is
required for S&T and biology for S&H. The possibility to do a combined S&T and S&H cluster also
exists. Typically, science courses are taught two or three classes a week in the first few years of
secondary education and three, four or five hours a week in later years.
S&T/STS: The interface of Science with Technology has resulted in the two being coupled together,
explicitly or implicitly, as a subject/area of study; further, their interface with societal issues has
made the study of Science-Technology-Society (STS) a prominent part of the science curriculum
especially between grades 4-8 in all six countries. In the Netherlands, specific initiatives have been
introduced in secondary education as well. A new course ‘Science, Technology and Society’
(Algemene Natuurwetenschappen, literally ‘General Natural Sciences’) was introduced in 2000 that
is compulsory for all students in grade 10 (age 16/17) in VWO, including those who had decided not
to continue with the study of science. By 2011, a new course ‘Nature, Life and Technology’ (Natuur,
32
Leven en Techniek) will be offered in all Dutch schools; compulsory during the first few years and
optional for the later years of HAVO and VWO. Both courses offer instruction in subjects such as
astronomy, philosophy of science, forensic research, GPS technology—which have been previously
neglected in the more classical science disciplines. Technasium is a new form of education for
students talented in the sciences, offered by some secondary schools. Technasiums were
introduced in 2005 and currently 41 schools in the Netherlands offer this type of education.
2.3 POLICY BASED RESOURCES AND OPPORTUNITIES
Educational policies specify material and pedagogical resources and opportunities necessary to
transact the school curriculum effectively and to engage students in the study of science within
and outside the formal school system. Infrastructure consisting of libraries and computer
laboratories are considered basic resources in schools to aid learning and teaching of all subjects,
including science. For the teaching of science in particular, science laboratories are considered
essential. In the Netherlands, every secondary school is outfitted with special classrooms for doing
experimental work.
The CLASS 2000 programme was initiated by the Government of India with the aim of providing
computer literacy in 10,000 schools, computer-assisted learning in 1,000 schools, and computer-
based learning in 100 schools. These hundred schools were called SMART schools16
and were
designed to be agents of change seeking to promote the extensive use of computers in the
teaching-learning process. ICT @ Schools, a centrally sponsored scheme launched in 2004,
provides opportunities to secondary stage students to build their capacity in ICT skills. The scheme
serves as a major catalyst to bridge the digital divide amongst students of various socioeconomic
and geographical barriers. The scheme also aims to set up SMART schools in Navodaya Vidyalayas
(rural residential schools) to act as “Technology Demonstrators” and to lead in propagating ICT
skills among students of neighbourhood schools.
Malaysia launched the Smart School project in 1997, a partnership between the Government of
Malaysia and the private sector to use ICT as an enabler to Smart School practices in teaching-
learning, management, and communication with external constituencies. Eighty-seven schools
were involved in the pilot project phase (1999-2002) and by the year 2010, it was expected to be
introduced in ten thousand schools (see box 5). Teaching and learning materials in the form of
16
A school in which at least one section (of 40 students) in each of the grades 9-12 is fully computerised.
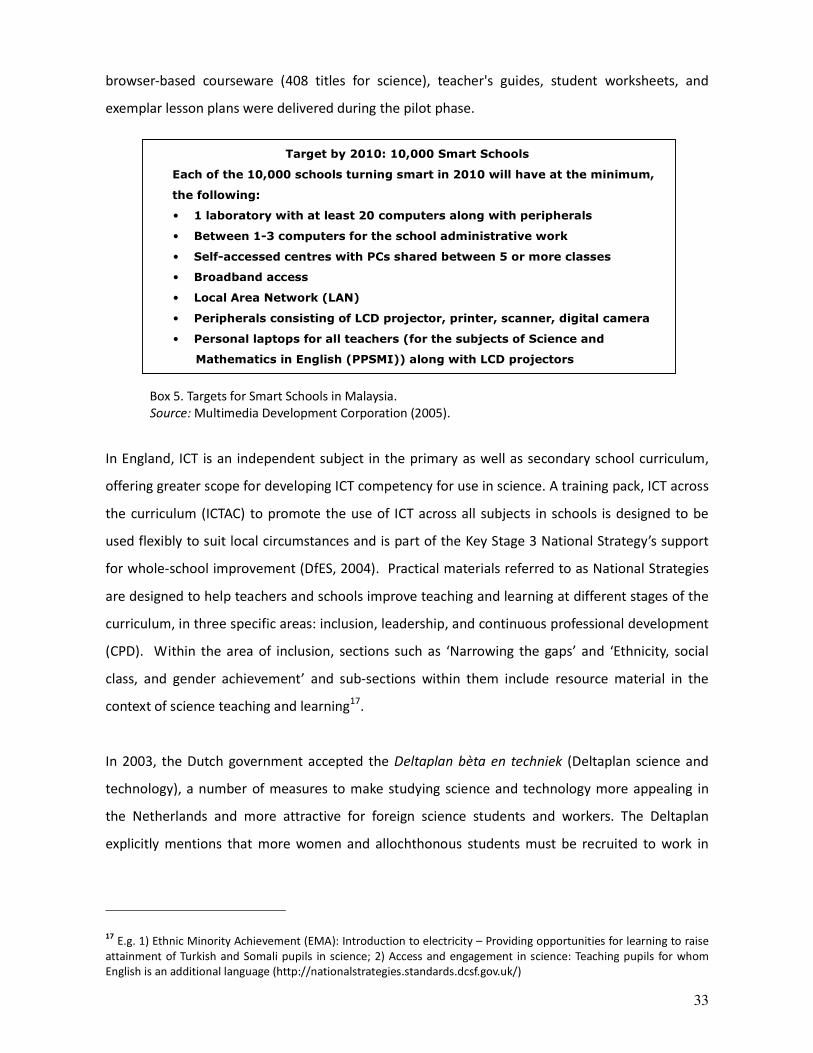
33
browser-based courseware (408 titles for science), teacher's guides, student worksheets, and
exemplar lesson plans were delivered during the pilot phase.
Target by 2010: 10,000 Smart Schools
Each of the 10,000 schools turning smart in 2010 will have at the minimum,
the following:
• 1 laboratory with at least 20 computers along with peripherals
• Between 1-3 computers for the school administrative work
• Self-accessed centres with PCs shared between 5 or more classes
• Broadband access
• Local Area Network (LAN)
• Peripherals consisting of LCD projector, printer, scanner, digital camera
• Personal laptops for all teachers (for the subjects of Science and
Mathematics in English (PPSMI)) along with LCD projectors
Box 5. Targets for Smart Schools in Malaysia.
Source: Multimedia Development Corporation (2005).
In England, ICT is an independent subject in the primary as well as secondary school curriculum,
offering greater scope for developing ICT competency for use in science. A training pack, ICT across
the curriculum (ICTAC) to promote the use of ICT across all subjects in schools is designed to be
used flexibly to suit local circumstances and is part of the Key Stage 3 National Strategy’s support
for whole-school improvement (DfES, 2004). Practical materials referred to as National Strategies
are designed to help teachers and schools improve teaching and learning at different stages of the
curriculum, in three specific areas: inclusion, leadership, and continuous professional development
(CPD). Within the area of inclusion, sections such as ‘Narrowing the gaps’ and ‘Ethnicity, social
class, and gender achievement’ and sub-sections within them include resource material in the
context of science teaching and learning17
.
In 2003, the Dutch government accepted the Deltaplan bèta en techniek (Deltaplan science and
technology), a number of measures to make studying science and technology more appealing in
the Netherlands and more attractive for foreign science students and workers. The Deltaplan
explicitly mentions that more women and allochthonous students must be recruited to work in
17 E.g. 1) Ethnic Minority Achievement (EMA): Introduction to electricity – Providing opportunities for learning to raise
attainment of Turkish and Somali pupils in science; 2) Access and engagement in science: Teaching pupils for whom
English is an additional language (http://nationalstrategies.standards.dcsf.gov.uk/)

34
science and technology. In 2004 the platform bèta techniek18
(science and technology platform )
was launched to carry out the educational tasks set out by the Deltaplan science and technology.
The platform aims to improve education at all levels from primary till university education and
better career guidance for graduates. For the youngest pupils, 3 to 5 year olds, a research
programme has been set up named Talentenkracht which investigates the technical abilities of
these children. Primary schools can participate in a project named VTB or Verbreding Techniek
Basisonderwijs (Broadening Technology in Primary Education) which increases the amount of time
spent on technology education in primary schools. The project includes an educational training
programme for primary school teachers called VTB-Pro.
Funds and grants have been awarded to schools or to students directly to encourage their
engagement in science. The Department of Science and Technology in India recently developed
INSPIRE, a programme to attract talent to the excitement and study of science at an early age. One
of its components is aimed at students in the age group 10-15 and awards Rs 5000 to one million
young learners in this age group for a duration of five years to study science. UK’s STEMNET offered
STEM Access Grants, designed to provide funding for secondary schools in England and Wales over
the period 2006-9 to raise engagement among Black and Minority Ethnic communities, in
particular Afro-Caribbean boys and Pakistani and Bangladeshi girls who are underrepresented in
the study of these subjects at higher levels of schooling. Forty six schools were supported through
this endeavour (STEMNET, 2010).
Interactive opportunities such as science learning centres, science museums, and science
exhibitions, to stimulate the teaching and learning of science outside the confines of school, are
encouraged in all the countries. However, in countries like India and Turkey, a large percentage of
the school student population may have never visited a museum. The UK Department of Education
and Wellcome Trust have created the national network of Science Learning Centres consisting of
nine regional centres and a national Centre, equipped with high-tech labs, cutting-edge ICT and
access to the latest scientific thinking in research and industry. Through the Science Learning
Centres, teachers of both science and citizenship are able to explore the ethics and issues behind
science in society to support them in leading student debates and investigations into modern
developments, from GM crops to IVF treatments. In India, the Jawaharlal Nehru National Science
Exhibition is an annual event and is the culmination of a series of exhibitions organised at school,
18
http://www.platformbetatechniek.nl/

35
district, regional and state level every year. With a view towards improving educational facilities in
rural areas and for economically weaker sections of the society, the main theme of national and
state-level science exhibitions reflect the felt needs of rural India. The social aspect of science and
relevance of science and technology for development also are criteria, which are given
consideration in determining the themes. The National Council of Science Museums (NCSM)
utilises a number of regional centres situated in different parts of the country to organise activities
like demonstration lectures, mobile science exhibitions for rural schools, science quiz shows,
science seminars, and science fairs. NCSM has set up 301 school science centres across several
states of India. Children’s Science Congress is also an annual event organised by the National
Council for Science and Technology Communication. Children in the age group of 10-17 years work
on scientific projects related to local issues, under the supervision of the teachers/science activists
and report their findings at school/block or district level Congresses (Rajput and Srivastava, 2005).
2.4 FACTORS INFLUENCING CAREERS IN SCIENCE
The percentage of high school students in most countries who reach a relatively high level of
education in science and pursue scientific careers is low. According to a longitudinal study by Tai,
Liu, Maltese, and Fan (2006), early elementary experiences (before eighth grade) may be critical in
shaping adolescents’ career expectations. By age 14, students with expectations of science-related
careers were 3.4 times more likely to gain a physical science and engineering degree, than students
without similar expectations. Quality of teaching, parental aspirations and support, and students’
sense of their own ability are some of the common factors influencing adolescent students’
interest in and desire to pursue a career in science. In the Netherlands, parental advice is seen to
be an important factor in choosing a secondary education track and many parents of immigrant
children are not as supportive of careers in technology as native Dutch parents. Also, a sense of
identity, which is often strongly gender-related, influences girls. Examples of successful women
who have pursued scientific careers (Bonetta, 2010) and finding informal networks through the
family and other means (Hathaway, Sharp, & Davis, 2001) are factors that inspire girls for science.
The potential of non-school settings and informal environments to provide opportunities for
inclusion of culturally, socially, and linguistically diverse students for science learning, is vast.
‘‘Many people with science-related careers credit their initial interest in STEM to informal rather
than formal exposure, identifying museum and science centres as the most important stimulants
to their childhood interest’’ (COSMOS Corporation, 1998, p. 4).

36
Better career guidance through schools including drawing students’ attention to less familiar and
marginal science subjects and related career paths such as environmental and earth sciences;
astronomy; meteorology; and forensic science, is useful to help students make informed choices.
Establishing school-business/industry links are also valuable in influencing students, such as
Jetnet,19
a network in the Netherlands that links schools and companies and tries to create
improved learning environments for students to help them better understand career paths that are
available with a degree in science or technology.
19
http://www.jet-net.nl/
37
3. Review of Literature
The interplay between the dimensions of diversity—race/ethnicity, culture, language and social
class—are complex and it is not simple to separate out their influences on science attitudes and
outcomes (Lee & Luykx, 2006). For instance, language is an important part of ethnicity; culture is
partly determined by social class and even habitat. This section presents the state of the art
research undertaken in the decade 2000-2010, with a focus on international research and research
originating specifically from within the six partner countries, which helps understand the dynamics
of the relationships between cultural diversity (of students and teachers), gender, and science
education.
3.1 STUDENT ATTITUDES TO SCIENCE EDUCATION
The primacy of the affective dimension of science education—positive attitudes towards science—
is vital “to inculcate respect for and appreciation for science as part of our culture” and because
they are “determinants for future educational choices as well as other behaviors as citizens”
(Sjøberg & Shreiner, 2010, p. 4). Several studies have shown a strong effect for stage of schooling, a
country’s level of development, and gender on attitudes towards science.
Reiss’s (2000) study of a group of 21 mixed ability English students over a period of five years of
secondary schooling to understand their attitudes towards science revealed that much of the initial
enthusiasm seen in the first year for science dissipated over the five years of the study. Some of
the conclusions Reiss reached were that students wanted compulsory school science to be relevant
and useful in life, individual teachers played a significant role in maintaining or losing the
enjoyment and interest that certain pupils had in science lessons and that school science
education is only likely to succeed when students believe that the science they are being taught is
of personal worth to themselves. Jenkins and Nelson (2005) found that many young people have
already made up their minds on whether to pursue science or technology as a career before they
reach the end of their secondary education. Students’ interest in and attitudes towards science
seem to change as they progress through school (George, 2006; Murphy & Beggs, 2003; Collins,
Reiss, and Simon, 2006; Jidesjö, A, 2008). Barmby, Kind and Jones' (2008) study of the attitudes of
English students towards science revealed a progressively declining trend over the first three years
of secondary schooling, and the decline was more pronounced for female students. Studies by
Altinok (2004) and Azizioğlu & Çetin (2009) of Turkish students have also shown a decline in girls’
attitudes towards science as they moved to upper grades.
38
The trend in India with regard to attitudes of school students towards science is in contrast.
According to the first India Science Report (2005), 60 percent of the students in grades 6-8 said
they wanted to pursue some science education (pure science, engineering or medicine) at a higher
level. Physics, Chemistry, and Biology are rated as the top subjects in grades 11 and 12 by about 30
percent of the students. This figure is triple that for students in grades 6-8 suggesting that the
attraction for science subjects increases dramatically in the higher grades in school. Over 40
percent of the students, whether in grades 6-8 or 11 and 12, wanted to become either an engineer
or a doctor.
In the fourth TIMSS study (2007), on average across countries where science is taught as a single
subject, more than 80 percent of eighth grade students who scored high on the Index of Students’
Positive Affect Toward Science (PATS) were from less developed countries that included Tunisia,
Botswana, Colombia, Oman, Egypt, and Ghana. In contrast, developed countries such as Singapore,
Scotland, and England showed decreasing percentages compared to 1999 and 1995 results.
Data from the ROSE study (Sjøberg & Shreiner, 2005) show that students’ attitudes to science are
negatively correlated with the country’s development. In more than 20 countries that participated
in the ROSE study, the response of students at the end of secondary school (age 15) to the
statement ‘I like school science better than other subjects’ was more negative the more developed
the country was (see figure 3). A similar negative correlation was seen between the students’
interest to learn about science and desire to become a scientist with a country’s level of
development. Pupils in the less developed countries expressed interest to learn about nearly all
the topics that were listed in the ROSE questionnaire (Sjøberg & Shreiner, 2010).
One interpretation of such data is that “this is a phenomenon that is deeply cultural and that the
problem lies beyond science education itself.” Values inherent to learning science such as
application, discipline, and delayed gratification appear to be neglected by contemporary culture
and therefore the relevance of the subject may not be obviously evident to students (Obsorne &
Dillon, 2008, p. 14).

39
Figure 3. Data from the ROSE study showing students’ responses to the question ‘I like school science better
than most other school subjects’ (1 – strongly disagree, 4 – strongly agree; dark symbols – female/light –
male).
Source: Osborne & Dillon (2008).
Such data may also be attributed to the differences in perception of schooling between children in
developing and developed countries. To attend secondary school may be perceived as a “luxury” or
“privilege” by children in developing countries and therefore they may be happy to learn almost
everything that the school can offer; for children in richer countries, attending school may be more
of an “obligation” (Sjøberg, 2002; Sjøberg & Shreiner, 2010, p. 16).
3.2 GENDER AND SCIENCE
Gender differences in science has been an area of interest in all countries and encompasses:
attitudes toward science, interest and achievement in science, choice of science subjects, and
careers in science. Portrayal of gender in science texts has also been researched.
In the continental European countries, women are found to be underrepresented in science,
mathematics and computing. The percentage of women in France, Germany and Austria in these
subject areas is around 35 percent; in Belgium, about 30 percent; and the Netherlands are at the
bottom end of the scale, with fewer than 20 percent of women in these subject areas (Diallo,

40
Meulders, O’Dorchai, & Plasman, 2010). Several explanations have been given for the exceptional
case of the Netherlands where the educational system forces pupils to choose a scientific career at
a younger age than is the case in other countries. Many consider the age of 14 or 15 too young for
making career choices and believe that during puberty students are far more preoccupied with
other things than school and are easily influenced by peer pressure. Furthermore, there are few
opportunities to start a science study without having taken the appropriate secondary school
courses and supplementary courses have to be taken at one’s own expense (van Langen & Dekkers,
2005).
Research varies considerably about the level of girls’ interest in science, and in science careers.
Some studies have found a very low level of interest; others, asking the question in a different way,
find a higher level. Despite the variation in research outcomes, gender disparities in science and a
gendered response to science education continues to be an important area of research driven by
the concern that girls and science may lose out. “Girls, because their lack of engagement with the
further study of science forecloses a number of career options; science because it is failing to
attract a large number of students who potentially have a very significant contribution to make”
(Osborne & Dillon, 2008).
Several studies from UK point to gender variations as being context dependent. In a survey
conducted by Haste (2004) of the values and beliefs that 704, eleven to twenty-one year old
individuals held about science and technology, four distinct groups emerged. There was a strong
effect for gender for the group described as ‘Alienated from science’ which consisted of mostly
young and female respondents. The effect was explained by the difference shown by boys and girls
in their approach to science, even when science was attractive to the girls. The ROSE data for
England shows that of the 108 topics presented on the questionnaire that secondary school
students might like to learn, there were statistically significant differences on 80 topics between
boys and girls (Jenkins & Nelson, 2005). A factor analysis of data collected by Haste, Muldoon,
Hogan, and Brosnan (2008) from nearly 600, Year 9 or 10 students in schools in the cities of Bath
and Bristol on their orientation to STEM, revealed four patterns of values. The most significant
distinction between girls and boys were to be found for the patterns which related to seeing
science as relevant to one’s own life and scepticism about ethical implications of science; girls
scored higher on both. The context in which science content is presented is a key to understand
the differences in interest and attitudes expressed by boys and girls towards science. While boys’
41
interests lie in “the technical, mechanical, electrical, spectacular, violent, and explosive”; girls’
interests lie in “health and medicine, beauty and the human body, ethics, aesthetics, wonder,
speculation, and the paranormal” (Sjoberg & Shreiner, 2010, p. 19). Context, however, is not to be
equated with “contextual curricula” as indicated by results of a comparative study of how 13-year-
old pupils perceive science and scientists. Emphasis on what is ‘concrete, near and familiar’ is not
necessarily what makes science relevant and interesting for the children. “It seems that both boys
and girls are more interested in learning about the possibility of life in the universe, the big bang,
extinct dinosaurs, planets, earthquakes and volcanoes than about food processing or soaps and
detergents!” (Sjøberg, 2002 cited in EC, 2004 ). Looking specifically at geosciences, Trend (2005)
found that “children have high interest in major geo-events set in the geological past, present and
future and in current environmental changes which have direct implications for the future of
humanity.” However, “Girls have a preference for phenomena perceived as aesthetically pleasing
and boys have a preference for the extreme and catastrophic” (p. 271).
Archer, DeWitt, Osborne, Dillon, Willis and Wong (2010) undertook six focus group discussions
with school children (age 10-11) to explore attitudes toward, and interest in, science. Whilst the
researchers found a generally positive attitude towards ‘doing science’, they also noted a general
lack of desire to ‘become’ a scientist which they suggest is due to a clash between the perceived
identity of a scientist with popular hegemonic forms of masculinity and femininity. In other words,
“in its present form, science appears to be constructed as too feminized for (many) boys and too
masculine for (many) girls” (p. 636). Altinok’s (2004) investigation of Turkish fifth grade students'
attitudes towards science showed that there was no significant gender difference in attitudes.
However, on the subscale 'Continue to Study Science,' there was a significant difference between
the attitudes of boys and girls, with girls less willing than boys to pursue further studies in
science—even when they were high achievers. An interesting pattern in gender differences was
observed in the Science and Scientists (SAS) study on the item measuring children’s ‘interest to
learn’ different science-related topics. In most of the developed countries, the difference was in
favour of boys, while in most of the developing countries the difference was in favour of the girls. A
tentative explanation offered by Sjøberg (2000) is that since access to education is often denied to
the girls, there may be a greater eagerness on their part to want to learn about most things.
The gender difference in preference for and choice of subjects is well documented. A divide in the
interests of boys and girls can be observed in the choices of subject clusters in all different tracks in
the Dutch education system with respect to technology; boys have a significant preference for it

42
over girls. At VMBO (pre-vocational secondary education track), the technology subject cluster is
most popular among boys whereas girls have a clear preference for the care/welfare subject
cluster.
At the higher general secondary education (HAVO) and pre-university education (VWO) tracks of
secondary education, the difference between boys and girls is largest for the S&T and the C&S
(Culture and Society) subject clusters. Almost no girls pick the S&T track in HAVO and few girls do
so at the VWO level. The opposite is true for the C&S track which is chosen by significantly more
girls than boys (see figures 4 & 5).
Figure 4. Choice of subject clusters for HAVO students in their 4th
and 5th
year; data from
2004-2008.
Source: Ministry of Education, Culture and Science, the Netherlands (2009).
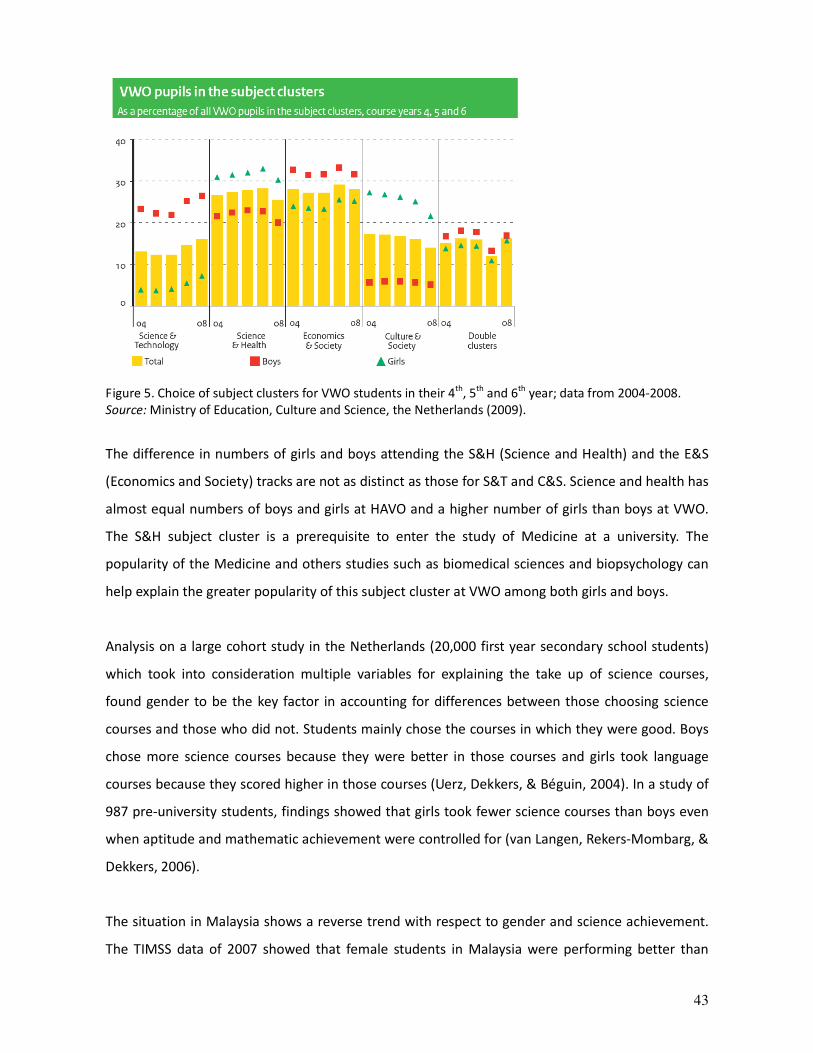
43
Figure 5. Choice of subject clusters for VWO students in their 4th
, 5th
and 6th
year; data from 2004-2008.
Source: Ministry of Education, Culture and Science, the Netherlands (2009).
The difference in numbers of girls and boys attending the S&H (Science and Health) and the E&S
(Economics and Society) tracks are not as distinct as those for S&T and C&S. Science and health has
almost equal numbers of boys and girls at HAVO and a higher number of girls than boys at VWO.
The S&H subject cluster is a prerequisite to enter the study of Medicine at a university. The
popularity of the Medicine and others studies such as biomedical sciences and biopsychology can
help explain the greater popularity of this subject cluster at VWO among both girls and boys.
Analysis on a large cohort study in the Netherlands (20,000 first year secondary school students)
which took into consideration multiple variables for explaining the take up of science courses,
found gender to be the key factor in accounting for differences between those choosing science
courses and those who did not. Students mainly chose the courses in which they were good. Boys
chose more science courses because they were better in those courses and girls took language
courses because they scored higher in those courses (Uerz, Dekkers, & Béguin, 2004). In a study of
987 pre-university students, findings showed that girls took fewer science courses than boys even
when aptitude and mathematic achievement were controlled for (van Langen, Rekers-Mombarg, &
Dekkers, 2006).
The situation in Malaysia shows a reverse trend with respect to gender and science achievement.
The TIMSS data of 2007 showed that female students in Malaysia were performing better than
44
male students in science achievement scores, although there was a decrease in the score for
females from 2003 (Martin et al, 2008). Results from the TIMSS data of 1999 (Martin et al, 2000)
showed that for all content areas, there were no significant gender differences.
Among the science subjects, physics has been found to be the least favoured by girls; biology, the
most. A study in the Netherlands on the predictive values of several characteristics of students for
the choice of physics in secondary education reported that girls scored lower than boys on interest
in physics, appreciation of its future relevance, self confidence and the grades they got for physics
(Stokking, 2000). Bell (2001) investigated gender stereotypes of boys outperforming girls in physics
and girls outperforming boys in biology using their relative performance in external examinations
in science at age 16. He found that “gender differences exist in question parts that only involve the
retrieval of declarative knowledge and not the use of procedural knowledge. These differences are
in favour of boys for physics contexts such as mechanics and earth and space, and in favour of
females for human biology” (p. 484). The EC report Europe needs more scientists (2004) refers to
research that indicates that girls' perception of and self-confidence in their scientific abilities is
lower than that of boys. Consequently, the number of girls choosing to study physics, computer
science and engineering, is low. Murphy and Whitelegg’s (2006) review of national and
international research literature about girls’ participation in physics, reported significant gendered
associations about who is, and is not, competent in mathematics and physics. They also found that
interest and enjoyment in physics decline relative to other sciences through schooling, more so for
girls than boys. They note that:
The contents, contexts and ways of approaching problems and investigations in
physics more closely reflect what boys, more than girls, engage with outside school,
and those activities associated with what culture defines as masculine rather than
feminine attributes. These exert a negative influence on girls’ engagement with
physics, their sense of self-efficacy in relation to it, and their perception of its
personal relevance. (p. 281)
Ponchaud (2008), and Daly, Grant, and Bultitude (2009) report on the ‘Girls into Physics’ action
research programme, the focus of which was the under-representation of girls in physics after the
age of 16. According to Ponchaud, the ‘masculinist’ nature of physics teaching typical in UK schools
with characteristics such as “the abbreviated use of language, illustrations based on machines, lack
of social context and emphasis on individual response rather than group discussion” are reasons

45
behind the under-representation of female students in physics (p. 62-63). His ‘tips’ for engaging
female students include: encouraging collaboration in learning through more group discussion and
activities; providing students with privacy and confidence to take risks in their thinking; and having
an explicit rationale for teaching which includes, crucially, the social context. Daly et al. present
successes and challenges in engaging girls with physics which were identified by teachers who
participated in the action research programme.
Pehlivan and Köseoğlu (2010) studied the attitudes of secondary school students in a Turkish
science high school, towards biology. Results revealed a statistically significant difference between
the attitudes of male and female science high school students, the difference being in favour of
female students.
Gender based subject choices of boys and girls may also be influenced by the portrayal of gender
in school science texts. An analysis of illustrations and text in Indian science textbooks of grades 3-
10, and a survey of students' and teachers' ideas related to gender were undertaken by
Chunawala, Vinisha, K., and Patel (2009). The findings revealed that there are more human figures
in the lower grade textbooks than in those of the higher grades. Four of the ten books analysed
were not gender-fair and gender biases are presented in various ways; significantly less female
figures, and often in stereotypical images and non-remunerative occupations limited to the
domestic space. Students, and teachers as well, revealed gender stereotypical perceptions about
occupations; the image of science and technology being a male-only domain was a dominant
perception in most students' minds.
3.3 CULTURE AND SCIENCE EDUCATION
Cultural identities of students—and teachers of science—are known to influence the learning and
teaching of science. Poor participation in school science and enrolment in higher science education
is seen for students marginalised on the basis of their cultural identities. Ethnicity, religious beliefs,
native language, indigenous science20
, social class and habitat are some of the factors influencing
students’ cultural identities. Some of these also define science teachers’ cultural identities which
in turn influence their students’ engagement with the subject.
20
Aikenhead (2006) cites Ogawa (2002) and Battiste (2000) to differentiate between indigenous science and
indigenous knowledge; the former refers to systems of knowledge of nature developed by a culture indigenous to a
region or country such as Islamic science, the latter refers to the knowledge of nature held by the original peoples of a
land such as the Aboriginal peoples of Australia.
46
The underprivileged position of allochthonous pupils has been an important area of research in the
Netherlands. Almost half of all native Dutch pupils are in the HAVO or VWO tracks compared with
only slightly over 20 percent for Turkish and Moroccan pupils. Furthermore, ethnic minority
students are overrepresented among those that leave school without a diploma (Ministry of
Education, Culture and Science, 2009). While the position of Turkish and Moroccan pupils in Dutch
education seems dire, the number of Turkish and Moroccan students in higher tracks in secondary
education has slowly but steadily increased during the past five years (Gijsberts & Dagevos, 2009).
Furthermore, immigrant students make ample use of the possibility to ‘accumulate’ degrees, to
enter a higher degree of education after obtaining a lower degree in the same field of education.
Many students move from MBO to HBO. Around 40 percent of all Moroccan and Turkish students
obtain a degree in higher education (HBO and VWO) which is only around 10 percent lower than
the participation rate of native Dutch students (Gijsberts & Dagevos, 2009). This phenomenon is
rather unique for the Netherlands and partly compensates for the early selection in which many
immigrant children with insufficient mastery of the Dutch language are placed in tracks which do
not correspond with their abilities (Crul, Pasztor, Lelie, Mijs, & Schnell, 2009). The increasing
numbers of immigrant children attending pre-primary education in the last ten years might also
contribute to a further decrease in the educational gap between immigrant and native Dutch
students (Gijsberts & Dagevos, 2009).
Lim (2009) found that ethnicity may not be as important a factor—as once thought—in the
learning of science and mathematics, as is the medium of instruction. Malay and Indian students in
Chinese medium schools outperformed their counterparts in national type21
and Indian schools as
a whole suggesting that although ethnicity may play a role in the learning of science and
mathematics, it may be secondary to the medium of instruction used to learn the subjects.
However, Ng and Soo (2006) pointed out in their study that using the mother tongue of ethnic
groups to study science could pose a problem if students are not bilingual. The reason for this is
because expressing scientific jargon in the mother language may not be similar to the same
expression in English. In Malaysia, following the policy change in 2003 of using English to teach
science, students found it difficult to learn science in English (Osman, Halim, & Meerah, 2006).
Primary students, especially in the rural communities, performed poorly. The TIMSS 2007 overall
achievement scores in science for students showed a decline of 40 points between 2003 and 2007,
21
National type school refers to schools in Malaysia in which the medium of instruction is Mandarin, English, or Tamil.

47
despite an improvement between 1999 and 2003 when Malay was the language of instruction for
science (Martin et al., 2008). Before 2003, science books in the Malay language were limited as
most good science texts were in English (Hudson, 2009). When the teaching of science reverted to
English many teachers were of the opinion that the textbooks were inappropriate for the language
level of their students (Ong, 2004). Teachers could not use the prescribed science textbook even in
urban schools because the language was too sophisticated for students (Ong & Tan, 2008). The
MOE prepared a bilingual vocabulary of the science curriculum to aid both the teachers and
students in their teaching and learning of science through English (Ong, 2008). In a study
conducted by Idris et al (2007), it was found that 60 percent of science and mathematics teachers
indicated that they were not proficient in English while only 45 percent stated that they would be
comfortable to teach in English. The sudden transition from the Malay language to English to teach
science posed challenges for science teachers because many of the teachers themselves were not
proficient in English (Hudson, 2009; Ong, 2004). Lecturers and instructors at the teacher training
institutions were also grappling with teaching the science curriculum in English (Hudson, 2009).
There were demonstrations by Malays who protested that the use of English undermined their
struggle to modernise the Malay language and develop a domestic scientific glossary (Brunet,
2009). The plan to phase out the teaching of science and mathematics in English was announced
by the Malaysian government in 2009. In 2012 the former system will be re-adopted; Malay,
Chinese and Tamil will be languages of instruction for science at the primary level, and Malay at
the secondary level (Ho, 2010).
Students in rural schools in India usually study science in their mother tongue/regional language
up to grade 10. In many institutions, science is offered only in English during the two higher
secondary grades (11 and 12) which puts rural students at a great disadvantage. Even where the
course is offered in the local language, it is not a level playing field. Lack of textbooks, lack of
available teachers, and dearth of reference books are a few of the many problems rural students
face (NCERT, 2006, p.29).
Aikenhead and Ogawa (2005) note that “an increasing number of science educators want to
understand the cultural influence on school science achievement by students whose cultures and
languages differ from the predominant Eurocentric culture and language of science” (p. 541). Reiss
(1993, 2007, 2009, 2010) has been a long standing advocate of inclusive and multicultural science
education in the UK. For a vast majority of students, living in Western or non-Western

48
communities, school science seems foreign on account of differences between their life-world
cultures and the culture generally embraced by the scientific community, differences between
their worldview and the worldview commonly conveyed by Western science (Aikenhead, 2000;
Cobern, 1996; Costa, 1995; Jegede, 1995). There is a vast body of literature which acknowledges
that learning science is a cross-cultural event for many students when they move from their life-
worlds into the world of school science; an event in which science educators have a crucial role to
play (Aikenhead, 2001; Ogawa, 1995, 2002; Snively & Corsiglia, 2000). Frost, Reiss, and Frost (2005)
call for science education to orientate itself more towards the interests of ethnic minorities and
girls. Specifically, they suggest that science education should ‘tell stories’ that the students can
relate to both in terms of the kinds of science they are likely to encounter in everyday life, and also
by countering the underrepresentation of female and ethnic minority scientists in educational
materials.
Muğaloğlu and Bayram (2009) explored the relationships between prospective science teachers’
values (e.g. theoretical, religious, economic, aesthetic, social and political values) and their
attitudes towards science teaching. Science Teaching Attitude Scale-II and the Allport-Vernon-
Lindzey Values Test were administered to a sample of 281 prospective Turkish science teachers. It
was found that religious values of prospective science teachers are a significant predictor, which
may negatively affect prospective science teachers’ attitudes toward science teaching. To
neutralise the possible negative impact of religious values, it was suggested that science teachers
must be aware that religion and science are two different ways of knowing. In this respect, the
study implies the importance of explicitly discussing different ways of knowing in science teacher
training programmes.
Religious beliefs, particularly pertaining to the concepts of life and living things in biology influence
science teaching and learning. Kose (2010) explored to what extent Turkish secondary school
biology teachers and students accommodate the theory of biological evolution with their religious
beliefs. Evolution is introduced to 11th grade students as the final unit in secondary school biology
textbooks and curriculum. Findings revealed that the majority of the participants rejected the
theory of evolution.

49
4. Science Curriculum Analysis
Using five markers of diversity (gender, ethnicity, religion, language and habitat), the six countries
undertook an analysis of their country’s science curriculum to determine the ways in which their
educational systems value the issue of diversity as evidenced in policy documents and curriculum
materials (including curriculum frameworks, textbooks, teacher manuals).22
A set of rubrics23
developed to identify the nature of occurrences of the five diversity markers were used by each
country to guide the analysis. A summary with country specific examples is presented here.
GENDER: Gender bias in curriculum texts is most obviously visible through references to and
representations of gender in text and illustrations. In Malaysian and Lebanese texts, references to
gender appear to be minimal compared to texts of the other countries. In the latter, efforts
towards reducing gender bias are apparent by an even distribution of males and females,
especially in illustrations. Yet, in some, the roles they are depicted in show shades of stereotyping.
In the Dutch texts, it is seen in the way men and women are depicted in occupations other than
scientists and in their spare time. Men, more often than women, are depicted in heavy technical
occupations (carpenter, electrician, technician) and women are depicted in caring roles
(beautician, physiotherapist). The depiction of men and women in their spare time is also
indicative of traditional gender roles. Men wash cars and women do the laundry. There are
however a number of depictions that counter these traditional roles (a man doing the dishes, a
female technician) but numerically these are fewer than the traditional ones. Moreover, all science
teachers are represented as old, Caucasian males. In the Lebanese Grade 6 and Grade 8 Life &
Earth Sciences textbooks, there are pictures of males as doctors, surgeons, construction workers,
and engineers; women are shown as mothers, caregivers, and nurses. In the English and Turkish
texts males tend to be depicted in more active roles and females in more passive roles. In Turkish
texts, scenarios usually involve Mert (a male) and Zeynap (a female) and experiments are
presented to show a boy and girl conducting them. Despite a tendency towards stereotypical
depictions of women in pictures there are exceptions with women shown featuring in adrenaline
sports (rafting, swimming), space careers (astronaut) and even as a researcher. In the Indian grade
7 & 8 textbooks, a girl and a boy team feature in every topic/ chapter and their role is to
accompany the reader through the text, asking questions and finding answers. Neither is depicted
in stereotypical ways with regard to the kinds of questions they ask or the activities they are shown
22
Refer to Annexure B for the details of curriculum materials and documents each country analysed. 23
Refer to Annexure C for the set of rubrics. A common set was developed for Language and Ethnicity as they overlap.

50
to be engaged in. Study exercises in the form of vignettes mostly include a male and female
character. References to hardships faced by women/adolescent girls in the context of fetching
water from long distances and adolescent pregnancies, in the Indian texts, are a clear attempt to
demonstrate gender sensitivity—but stop short of discussing gender discrimination as the source
of these hardships. Need for “more discerning efforts” to deal with gender bias, and to make the
contribution of women to the field of science and technology more visible in the curriculum, are
addressed in the Position Paper Teaching of Science (2006)24
.
ETHNICITY: Ethnic diversity can be captured through references to indigenous knowledge and
ethnic groups in text, representations of them in illustrations, and the contribution of different
cultures to the history of science. The use of words from the native language is indicative of
sensitivity to linguistic diversity. Lebanon does not have an ethnically diverse population which
may explain the lack of reference to ethnicity in any form in its texts. However, despite being
ethnically diverse, Malaysian texts do not reflect this diversity except in some illustrations in which
a mix of people from ethnic groups are shown to be working together in a laboratory or at certain
tasks. In the English texts, there is barely any references to ethnic minorities and on the few
occasions that they are depicted, it is usually Blacks and/or and somewhat stereotypically Black
athletes through photographs. In the Dutch texts, the majority of the pictures are of Caucasian
people; when they are occasionally of non-Westerners, they are depicted in a situation of poverty
in their homeland. Within the scope of the texts analysed, Western science is presented as the
dominant way of knowing in all countries. In the Indian context, the Position Paper Habitat and
Learning (2006) advocates a participatory approach to environmental education, recognising that
“a great deal of the knowledge of the environment lies with India’s barefoot ecologists, the people
at the grass roots” (p. iii).
The history of science, which provides a context for acknowledging the contributions of different
cultures to science, is mostly absent from the texts. The Indian texts make a few references to
contributions from other cultures such as silk fibre from China, the idea of divisibility of matter by
Indian and Greek philosophers, the Bose-Einstein Condensate, and traditional Indian and Chinese
24
A total of 21 Position Papers—on each of the curricular areas with a focus on pedagogy—as well as on related
issues were prepared by National Focus Groups (NFG) set up by the National Council of Educational Research and
Training (NCERT). They form a part of the National Curriculum Framework 2005 package.
51
medicinal systems. The Turkish texts too make minimal references to other cultures such as the
Tibetan peoples’ use of sunlight energy and a news item about a Nigerian teacher winning a prize
for inventing a cheap and simple refrigerator. In grade 7 and 8 Indian textbooks, several concepts
and terms are accompanied by their counterpart in the Indian/indigenous language, but these are
altogether absent from the grade 9 textbook. The etymology of some of the concepts is included
which point to their Arabic or Greek origin.
RELIGION: Science and religion have been broadly posed in opposition to each other in public and
scientific discourse, and indigenous science has been posed in opposition to Western, modern
science. The texts in none of the six countries addressed either of these two kinds of dichotomies.
“Evolution vs creationism” is a potent topic for debate in science curricula, especially in countries
like England and the Netherlands where Christianity is the majority religion. In the English texts,
there was a minor reference to it. Since the texts used for analysis in the Dutch context were
physics and chemistry, it was not possible to detect this debate. The religious diversity which
prevails in some of these countries was either not reflected in their texts, or to some degree, if at
all. Of the six countries, Malaysia and India are the most religiously diverse. Yet, there was no
mention of religion in the Malaysian texts. In the Indian texts there appears to be a clear effort to
represent the majority (Hindu) and the largest minority (Muslim) religious communities which
have a history of communal tension. In a chapter of the grade 8 textbook, the two adult characters
are a Hindu and a Muslim. Study exercises follow each topic, and in some of the exercises
presented as vignettes, a mix of Hindu and Muslim characters is usually included. The Position
Paper Teaching of Science exhorts the use of the science curriculum as an instrument of social
change to reduce the divide created by religion (as well as by economic class, gender, region, and
caste) and to “empower students to question the social beliefs, notions and practices that
perpetuate social inequality” (p. 28).
HABITAT: An almost equal percentage of the world’s population is urban (50.6 percent) and rural
(49.4 percent). Science’s relationship with the biological and physical world (habitat) is mediated
by the people who inhabit it. Western, modern science’s relationship with habitat and therefore
the people inhabiting it, reflects an urban, technocentric bias; rural regions and lifestyles,
traditional industries, agrarian economies, and sustainable development are relegated to the
background. Contexts from different geographical regions in the country are well represented in
the Indian, Lebanese and Turkish texts. Discussion of urban and rural contexts, rural lifestyles, and

52
traditional industries is minimal or occasional in most countries; science’s association with high
technology and modern industries is greater. However, the Turkish text for grade 5 which presents
Ataturk’s sayings emphasising the crucial role of science and technology, has also emphasised
disadvantages of technological development on human health and the negative effect of industry
on environmental pollution and agriculture. Traditional agricultural practice and implements find
mention in the Indian texts, as do indigenous substances (e.g. the commonly used Indian spice
turmeric and china rose petals as natural indicators to test substances, the use of dried neem
leaves—a tree of the mahogany family, native to India and other south Asian countries—to protect
grains stored in the house from pests). Texts from all countries address the issue of sustainability in
some manner, either explicitly or implicitly. In the English texts, it is largely framed in the context of
technocentric solutions. In the Dutch texts, pictures of wind and solar energy are shown and there
are discussions on acid rain and global warming. In the Indian texts, pertinent words such as acid
rain, deforestation, global warming, protected areas, biodiversity are highlighted or further
elaborated as boxed text to draw students’ attention to them. Debates and discussion on issues
which address sustainable development (displacing tribals from the forests, Bt cotton) are included
in study exercises when appropriate to the topic.

53
5. Barriers to and Factors facilitating Reform to Support Diversity in Science
Education
Academic research exploring and seeking to explain issues of equity/diversity in the context of
science education; changes in policies based on empirical research and public opinion; effective
implementation and evaluation of policies and programmes (primarily related to curriculum and
teacher education); private and public initiatives in science education; and awards and rewards
recognising best practices are factors in different countries which have facilitated—or have the
potential to facilitate—reform to support diversity in science education.
The merit of a policy for science instruction in the mother tongue debated in Malaysia since 1978,
has undergone several changes. With effect from 2003, students in primary Standard 1 (7 year
olds), secondary Form 1 (13 year olds) and post-secondary lower Form 6 (18 year olds) were taught
science and mathematics in English which extended to all students from Form 1 to upper Form 6,
by 2008. This policy was adopted because science and technology gained importance for national
development, and English is a universal ‘globalised’ language. Many studies were carried out to
study and measure the success of the implementation of the “teaching of science and
mathematics in English”. Several studies, especially the studies carried out by Curriculum
Development Department of MOE (Sharifah 2003a, 2003b) showed positive results. However,
strong voices of objection came from certain groups in the Chinese and Malay community which
were not heeded much until much stronger voices emerged from NGOs, the general public as well
as strong empirical evidence research papers (Isahak, 2008). The achievement discrepancy
between students who are and those who are not fluent in English became apparent. The policy
was revoked, and in 2012 the former system will be re-adopted where Malay, Chinese and Tamil
will be languages of instruction for science and mathematics in primary level, and Malay language
be used as language of instruction in the secondary level.
Science is portrayed in most curricula as objective, factual and non-negotiable; dealing with
phenomena and not people; culture-free and value-free; male, masculine and exclusive; and
harder than other areas to study (Schwedes, 2008). Such a perception proves to be one of the
greatest barriers to adolescent girls who want to be seen as ‘normal’ females pursuing further
studies in science (Lee, 1998). The Netherlands undertook several studies through the 1980s
which led to curricular changes to make science and technology courses more appealing to girls.

54
The studies showed that girls had different learning styles and interests than boys and that the
teaching methods employed at the time had a negative impact on the study results of girls in
science classes (ten Dam, van Eck, & Volman, 1992). In 1994, the emancipation council
(emancipatieraad), an organisation which advises the government on emancipation matters
published the report ‘The mystery of Thea’ (Het mysterie van Thea) (Emancipatieraad, 1994) in
which not the girls themselves but the nature of technology and the teaching methods employed
were considered the reasons for the low involvement of women in technical studies. The report
thus reversed the habitual thinking about women and technology which considered the attitudes
of women as problematic—rather than the fixed ways in which technology is presented. In the
second half of the 1980s, several campaigns were launched to increase the numbers of girls
choosing scientific and technical careers (see box 6). These campaigns were the most visible aspect
of the governments’ educational emancipation policy. These campaigns were the only efforts on a
national scale to interest more girls in science and technology. Since then, efforts have been on a
more local scale.
The best known campaign ‘Kies Exact’ (Choose Exact) lasted from 1987 to 1989. It was
aimed at convincing girls in secondary education that choosing science courses would lead
to improved career options. The campaign made use of brochures, posters, advertisements,
TV commercials, a TV show, a magazine and a leaflet for study advisers. A part of the
campaign was named ‘Slaag Exact’ (Graduate Exact) which aimed at convincing girls to
choose a scientific study.
A technology related campaign from the late 1980s was ‘Thea studeert techniek’ (Thea
studies technology). A few years later (from 1990 to 1993), a campaign named ‘Een slimme
meid is op haar toekomst voorbereid’ (A smart girl is prepared for her future). The latter
campaign was aimed at making girls aware that they should prepare for a future in which
they would be financially independent; a career in technology or science was a good way to
achieve financial independence.
Box 6. Campaigns in the Netherlands to attract girls to science and technology education.

55
Organisations and science centres also play a vital role to facilitate reforms supporting diversity
(see box 7).
INDIA
The Centre for the Promotion of Science established by the Aligarh Muslim University25 focuses on
modernising education, especially the sciences, in madrassas. The main objectives of the Centre are: i)
to create awareness amongst Indian Muslims of the importance of acquiring and creating scientific
knowledge and to provide possible help to minimize their backwardness in sciences, and ii) to help in the
introduction of regular science teaching in madrassas and in the improvement of the quality of science
education in Muslim schools.
THE NETHERLANDS
Technika 10 is an organization that has been organizing technical clubs and workshops for girls in the
age group of 10 to 12 years since 1986. The organization currently has around 60 girls clubs and 350
female mentors26. Clubs are organized in after school hours where girls work on technical projects.
Currently, Technika 10 also develops teaching materials and provides technology courses for primary
school teachers.
VHTO27 is the national expertise centre for girls and women who work or study in science and
technology. The organisation tries to interest girls more for careers in science and technology and aims to
make the labour market for jobs in science and technology more accessible for women. VHTO organises
events at key moments when girls have to make important decisions in their educational career (for
instance choosing for a subject cluster or a study in tertiary education). Events include meetings with role
models, women who study or work in science and technology and who can counter stereotypical images
girls may have of women and company visits.
UK
STEMNET28 is a charity aimed at increasing young people's choice and chances through science,
technology, engineering, and mathematics. Its vision and purpose is to ensure that all young people,
regardless of background, are encouraged to understand the excitement and importance of science,
technology, engineering and mathematics in their lives, and the career opportunities to which the STEM
subjects can lead; to help all schools and colleges across the UK understand the range of STEM
Enhancement & Enrichment opportunities available to them and the benefits these can bring to everyone
involved; and to encourage business, organizations, and individuals wanting to support young people in
STEM to target their efforts and resources in a way that will deliver the best results for them and young
people.
Box 7. Government and private initiatives to promote science education for diversity.
25
Founded in 1875 as a college, it acquired the status of a central university in 1920 and came to be known such. 26
http://www.technika10.nl/technika10/wiewezijn.htm 27
http://www.vhto.nl/ 28
http://www.stemnet.org.uk/
56
Evaluations of policies and programmes are important to determine their effectiveness and
recommend appropriate changes to facilitate further reform. The ‘Kies Exact’ campaign was
evaluated by the Ministry of Science and Education which funded the campaign. It was found that
there were small but significant increases in the number of girls taking up courses in chemistry,
physics and mathematics in the years that the campaign was held. However, it was also found that
this increase was partly undone in later years by girls dropping out of the science classes they had
taken. Universities and HBOs did not see a large increase in the number of women taking science
courses or studying science or technology.
Compared to their male counterparts, girls who took science classes in secondary education still
chose in greater numbers to follow studies outside the field of science and technology. The
campaign had not addressed other means for improving emancipation such as educational
materials and methods and teacher education (ten Dam, van Eck, & Volman, 1992); nor had it
explored the internal psychological reasons why girls do not choose hard scientific courses (Leune
& van der Rest, 2000).
Lack of adequate research in the area of science education for diversity, policies driven by ideology
rather than evidence, poorly conceptualised and implemented policies, poorly developed
textbooks, and sometimes even complete silence on the issue of diversity can serve as barriers and
impede reform. India’s National Policy on Education 1968 stressed the need to correct regional
imbalances in the provision of educational facilities by providing good educational facilities in rural
and other backward areas which in the context of science education is infrastructure such as
computer laboratories, library facilities, and science laboratories. Statistics show a wide gap
between policy initiatives and the ground reality. As on 30th
September, 2008, flash statistics for
elementary education in India show that only 14 percent schools have a computer, (NUEPA, 2010).
Less than 30 percent of secondary schools have computer education, and about 18 percent have
adequate number of computers. Less than a million schools (70 thousand as per the 7th AISES
29)
have a library. Of these, about nine thousand have a full or part-time trained librarian and almost
half the number of schools has less than 500 books in the library. Approximately 58 percent of
secondary schools in India have a science laboratory, but only about 38 percent have an adequate
science laboratory (NCERT, 2002). A discussion document on National Curriculum Framework for
School Education released in 2000 sparked off a fierce debate about the then prevailing
29
All India School Education Survey
57
government casting science in a right-wing Hindu nationalistic mould.
The national science curriculum of most countries fail to adopt a multicultural perspective—one
which acknowledges and incorporates indigenous knowledge—and thereby bypass students of
non-Western and minority cultures who feel alienated from the understanding of science and
distanced from its pursuit. The reverse, as pointed out by Snively and Corsiglia (2000), is also
exclusionary, with mainstream students being prevented from “examining important values,
assumptions, and information imbedded in other cultural perspectives” with respect to science
(p.24). Frameworks to explore multicultural perspectives while teaching a particular concept or
topic are either missing from or not adequately developed within curricula, for teachers. Also
lacking in curricula is the scope for exploring the role of religion and religious beliefs which are
perceived to be in conflict with science. Mansour (2008) found that teachers’ religious beliefs is
one of the major constructs that influences teachers’ ways of thinking and classroom practices
about scientific issues related to religion. Similarly, students’ alternative frameworks affect their
receptivity of these issues if the curriculum does not offer space to consider them.
Even when science curriculum frameworks aim to be inclusive and culture sensitive, they are often
not supported by textbooks with content that matches the aims, or teacher education programmes
which prepare teachers to use pedagogical strategies that are suitable for an inclusive approach to
teaching and learning science. The conduit metaphor is commonly used to describe the pedagogy
in school science wherein knowledge is a commodity to be transmitted by teachers to students.
Teachers are primarily concerned with “getting ideas across,” which becomes apparent even in the
kind of writing and experiments expected of students—copying information from the board and
writing up experiments formulaically. “This limited range of pedagogy is one reason why students
disengage with science—particularly girls” (Osborne & Dillon, 2008, p. 9). Inquiry-based and
collaborative learning provide students with opportunities to work in groups, allows for written
and oral expression, and more open-ended, problem solving experiences—all of which encourage
participation from diverse students. While such pedagogy has gained favour—in principle—in
school science curricula in many countries, it leaves a lot to be desired, in practice. Teachers are
often not comfortable with an inquiry-based learning approach and prefer a more teacher-centred
structured environment which emphasises transmission of facts. Ong and Ruthven (2010) found in
their study that Malaysian teachers in school tended to require students to copy lengthy detailed
and structured notes written on blackboards. When interviewed to seek further clarification on
58
their practice, the teachers were of the perception that copying notes was a ‘student centred
activity’.

59
6. Science Education for Diversity in Teacher Education Programmes
Faced with the growing diversity in student population in recent times, England and the
Netherlands have addressed the issue more explicitly through policy statements and teacher
training. For the first time in 1999, the UK National Curriculum included a detailed statutory
statement on inclusion— providing effective learning opportunities for all students—and specifies
three principles that are essential to developing a more inclusive curriculum: Setting suitable
learning challenges, Responding to students’ diverse learning needs, and Overcoming potential
barriers to learning and assessment. Diverse learning needs take into consideration the needs of
“boys and girls, pupils with special educational needs, pupils from all social and cultural
backgrounds, pupils from different ethnic groups including travellers, refugees and asylum seekers,
and those from diverse linguistic backgrounds” (DfEE & QCA, 1999a, p.31). Specific actions that
teachers can take to respond to students’ diverse needs are also suggested, with examples for each
action; some examples make a specific reference to science (see box 8 which outlines some of the
actions with examples). A booklet which sets out the legal requirements of the National
Curriculum in England for science is available for science teachers. It specifies ways in which the
teaching of science can contribute to learning across the curriculum, in areas such as pupils’
spiritual, moral, social and cultural development, which acknowledge diversity concerns
(see box 9).
In the Netherlands, most pedagogical academies for primary education (PABOs) and teacher
training programmes at universities offer courses in educating a diverse student population.
Courses like these are also offered by other institutions which are available to practising teachers.
However, few of these courses have been evaluated. In an study of teacher-training courses, it was
found that courses on intercultural education had little effect on the teaching of teachers, the topic
of intercultural education received little interest and it was not considered to be an issue at all if
the class was homogeneous native Dutch (Hermans, 2002).
An outcome of a research project between Turkey and the EC in 2000 is a set of generic and
specific teacher competencies developed by the country’s Ministry of National Education to
improve teacher education. Teachers are required to use their awareness and understanding of
physical, emotional, social and cultural differences and needs of students with the aim of
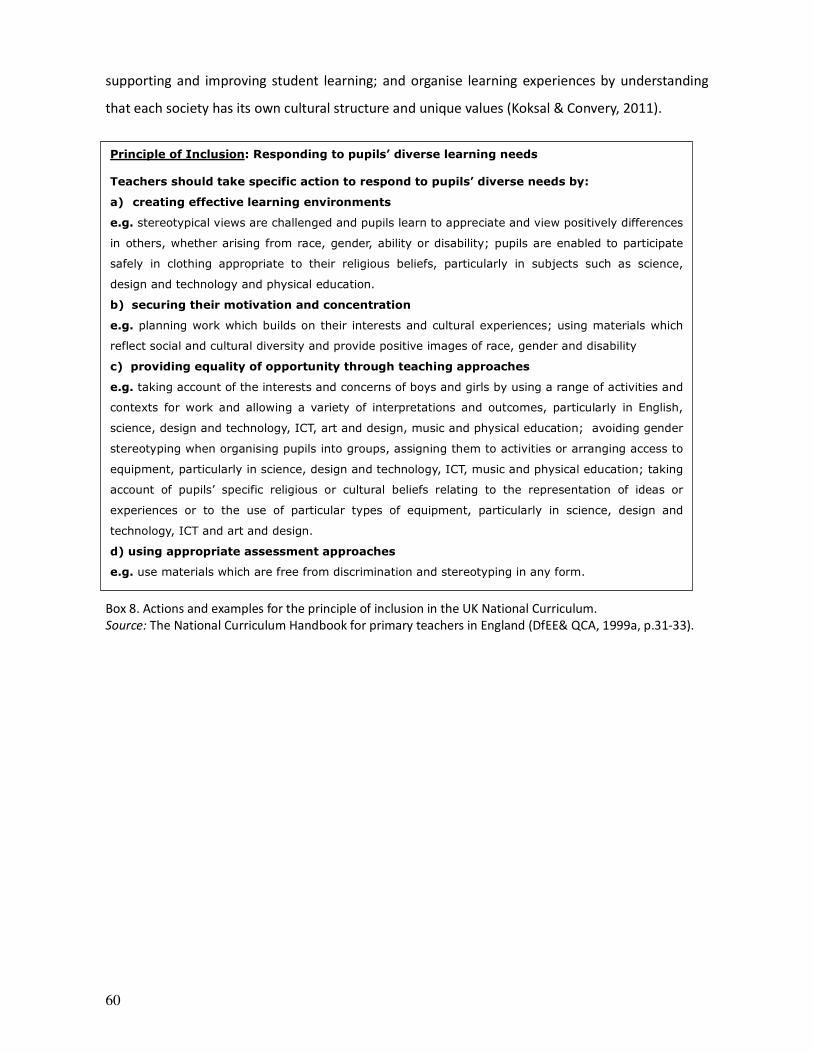
60
Principle of Inclusion: Responding to pupils’ diverse learning needs
Teachers should take specific action to respond to pupils’ diverse needs by:
a) creating effective learning environments
e.g. stereotypical views are challenged and pupils learn to appreciate and view positively differences
in others, whether arising from race, gender, ability or disability; pupils are enabled to participate
safely in clothing appropriate to their religious beliefs, particularly in subjects such as science,
design and technology and physical education.
b) securing their motivation and concentration
e.g. planning work which builds on their interests and cultural experiences; using materials which
reflect social and cultural diversity and provide positive images of race, gender and disability
c) providing equality of opportunity through teaching approaches
e.g. taking account of the interests and concerns of boys and girls by using a range of activities and
contexts for work and allowing a variety of interpretations and outcomes, particularly in English,
science, design and technology, ICT, art and design, music and physical education; avoiding gender
stereotyping when organising pupils into groups, assigning them to activities or arranging access to
equipment, particularly in science, design and technology, ICT, music and physical education; taking
account of pupils’ specific religious or cultural beliefs relating to the representation of ideas or
experiences or to the use of particular types of equipment, particularly in science, design and
technology, ICT and art and design.
d) using appropriate assessment approaches
e.g. use materials which are free from discrimination and stereotyping in any form.
supporting and improving student learning; and organise learning experiences by understanding
that each society has its own cultural structure and unique values (Koksal & Convery, 2011).
Box 8. Actions and examples for the principle of inclusion in the UK National Curriculum.
Source: The National Curriculum Handbook for primary teachers in England (DfEE& QCA, 1999a, p.31-33).
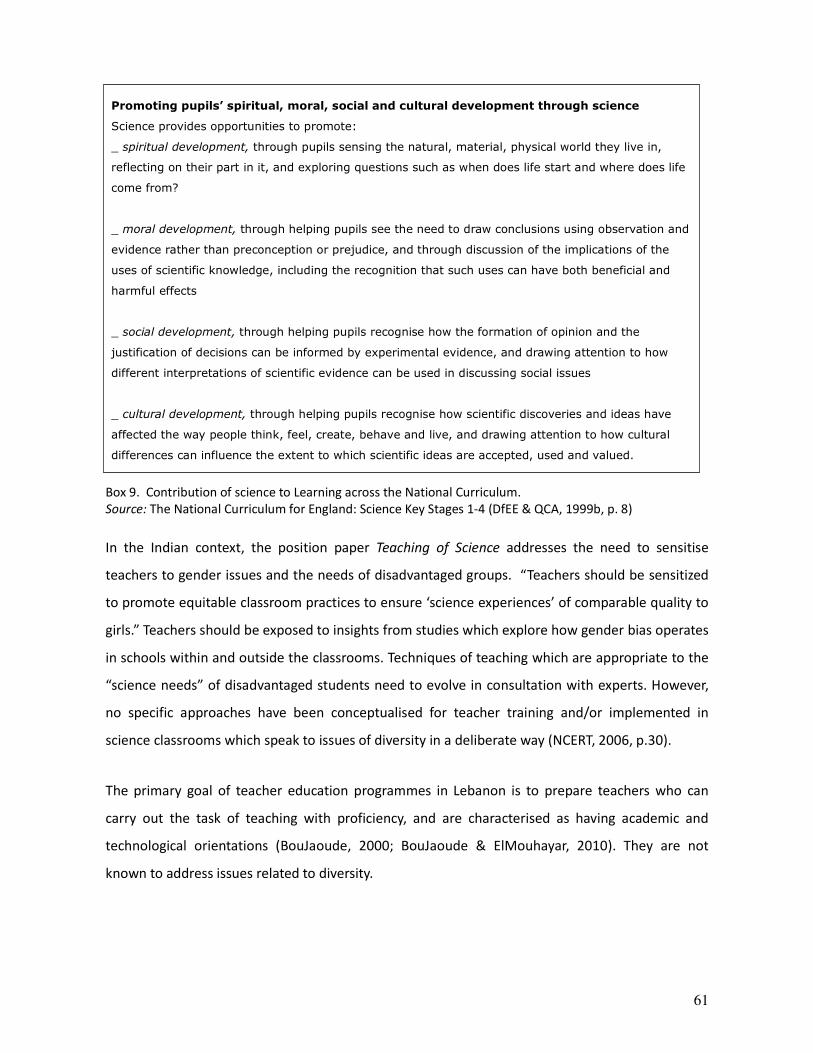
61
Promoting pupils’ spiritual, moral, social and cultural development through science
Science provides opportunities to promote:
_ spiritual development, through pupils sensing the natural, material, physical world they live in,
reflecting on their part in it, and exploring questions such as when does life start and where does life
come from?
_ moral development, through helping pupils see the need to draw conclusions using observation and
evidence rather than preconception or prejudice, and through discussion of the implications of the
uses of scientific knowledge, including the recognition that such uses can have both beneficial and
harmful effects
_ social development, through helping pupils recognise how the formation of opinion and the
justification of decisions can be informed by experimental evidence, and drawing attention to how
different interpretations of scientific evidence can be used in discussing social issues
_ cultural development, through helping pupils recognise how scientific discoveries and ideas have
affected the way people think, feel, create, behave and live, and drawing attention to how cultural
differences can influence the extent to which scientific ideas are accepted, used and valued.
Box 9. Contribution of science to Learning across the National Curriculum.
Source: The National Curriculum for England: Science Key Stages 1-4 (DfEE & QCA, 1999b, p. 8)
In the Indian context, the position paper Teaching of Science addresses the need to sensitise
teachers to gender issues and the needs of disadvantaged groups. “Teachers should be sensitized
to promote equitable classroom practices to ensure ‘science experiences’ of comparable quality to
girls.” Teachers should be exposed to insights from studies which explore how gender bias operates
in schools within and outside the classrooms. Techniques of teaching which are appropriate to the
“science needs” of disadvantaged students need to evolve in consultation with experts. However,
no specific approaches have been conceptualised for teacher training and/or implemented in
science classrooms which speak to issues of diversity in a deliberate way (NCERT, 2006, p.30).
The primary goal of teacher education programmes in Lebanon is to prepare teachers who can
carry out the task of teaching with proficiency, and are characterised as having academic and
technological orientations (BouJaoude, 2000; BouJaoude & ElMouhayar, 2010). They are not
known to address issues related to diversity.
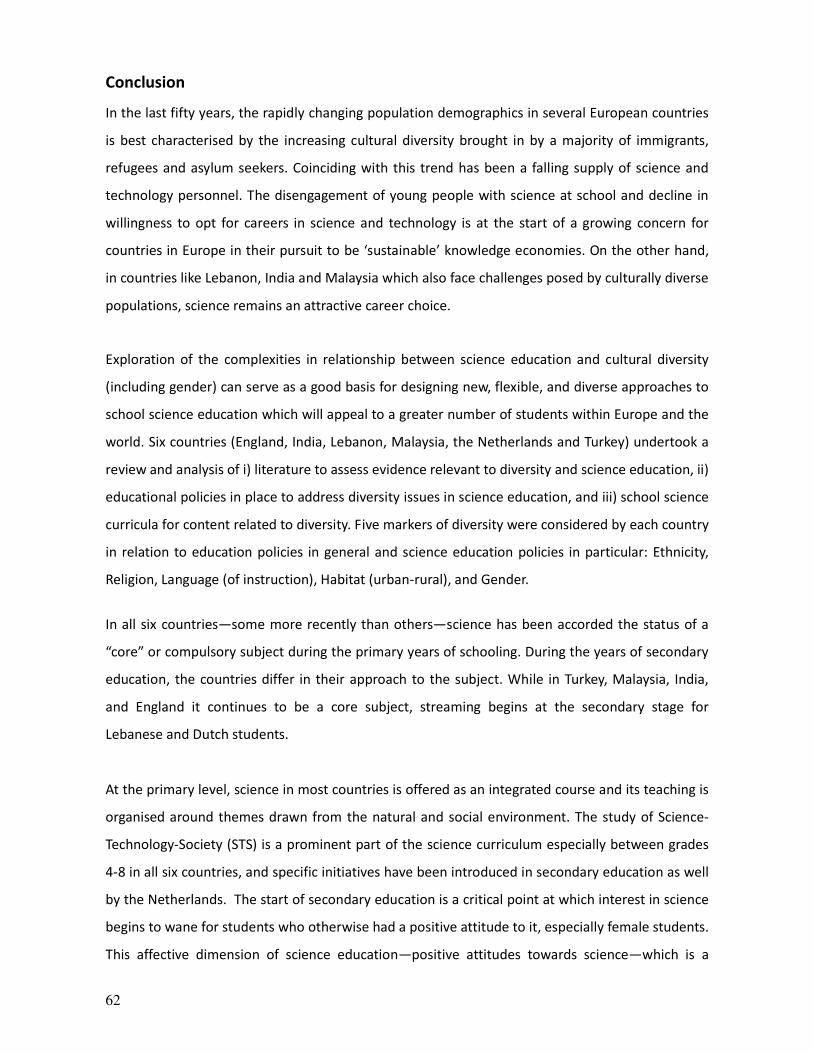
62
Conclusion
In the last fifty years, the rapidly changing population demographics in several European countries
is best characterised by the increasing cultural diversity brought in by a majority of immigrants,
refugees and asylum seekers. Coinciding with this trend has been a falling supply of science and
technology personnel. The disengagement of young people with science at school and decline in
willingness to opt for careers in science and technology is at the start of a growing concern for
countries in Europe in their pursuit to be ‘sustainable’ knowledge economies. On the other hand,
in countries like Lebanon, India and Malaysia which also face challenges posed by culturally diverse
populations, science remains an attractive career choice.
Exploration of the complexities in relationship between science education and cultural diversity
(including gender) can serve as a good basis for designing new, flexible, and diverse approaches to
school science education which will appeal to a greater number of students within Europe and the
world. Six countries (England, India, Lebanon, Malaysia, the Netherlands and Turkey) undertook a
review and analysis of i) literature to assess evidence relevant to diversity and science education, ii)
educational policies in place to address diversity issues in science education, and iii) school science
curricula for content related to diversity. Five markers of diversity were considered by each country
in relation to education policies in general and science education policies in particular: Ethnicity,
Religion, Language (of instruction), Habitat (urban-rural), and Gender.
In all six countries—some more recently than others—science has been accorded the status of a
“core” or compulsory subject during the primary years of schooling. During the years of secondary
education, the countries differ in their approach to the subject. While in Turkey, Malaysia, India,
and England it continues to be a core subject, streaming begins at the secondary stage for
Lebanese and Dutch students.
At the primary level, science in most countries is offered as an integrated course and its teaching is
organised around themes drawn from the natural and social environment. The study of Science-
Technology-Society (STS) is a prominent part of the science curriculum especially between grades
4-8 in all six countries, and specific initiatives have been introduced in secondary education as well
by the Netherlands. The start of secondary education is a critical point at which interest in science
begins to wane for students who otherwise had a positive attitude to it, especially female students.
This affective dimension of science education—positive attitudes towards science—which is a

63
primary determinant for future educational choices, has been the subject of research in most
countries. Several studies have shown a strong effect for stage of schooling, a country’s level of
development, and gender on attitudes towards science. In developing countries where secondary
education is less accessible and therefore valued more, students hold more positive attitudes
towards science education as well. The change in the portrayal of science in primary science
curricula from an activity which is embedded in context and linked to human concerns, to a more
objective, value-free, phenomena-driven area of study in secondary school curricula, also explains
the change in attitude for some students—girls especially.
Gender disparities in science and a gendered response to science education continues to be an
important area of research in all countries, driven by the concern that both—girls and science—
stand to lose what each has to offer to the other. Despite the cultural diversity in the six countries,
research on whether determinants of students’ and teachers’ cultural identities—other than
gender and language (medium of instruction)—mediate science learning and teaching favourably
or unfavourably, is scarce. Policy and research have focused greater attention on general
educational deprivation experienced by ethnic/cultural identity groupings (issues such as
discrimination, access, achievement) stemming from the socioeconomic inequities they face in
common. Issues arising distinctly from their cultural identities shaped by their religious beliefs and
indigenous knowledge, in the context of science education in particular, have received less
attention. This may be due a mix of reasons ranging from country policies towards diversity
swinging from multiculturalism to assimilation; to the dominant view of science as being white,
Western and modern; to science teachers insufficiently prepared to address these issues in science
classroom discourse.
Yet, deliberate efforts have been made in some countries like England, the Netherlands, and India
to acknowledge and address diversity issues in science education, through curriculum and teacher
education programmes. Nonschool, informal science learning environments are offered by all
countries and they play a vital role for inclusion of culturally, socially, and linguistically diverse
students, and in facilitating reforms supporting diversity. These efforts, however, need to be
researched or evaluated systematically to draw further and long-term lessons.

64
References
Aikenhead, G. S. (2001). Students' ease in crossing cultural borders into school science. Science
Education, 85, 180–188.
Aikenhead, G. S. (2006, July-August). Science and technology education from different cultural
perspectives. Keynote paper presented at the twelfth symposium of the International
Organization for Science and Technology Education, Batu Ferringghi, Penang, Malaysia.
Aikenhead, G. S., & Ogawa, M. (2007). Cultural Studies of Science Education 2, 539–620.
Aitbach, P. G., & Umakoshi, T. (2004). Asian universities: Historical perspective and comtemporary
challenges. Maryland: John Hopkins University Press.
Archer, L., Dewitt, J., Osborne, J., Dillon, J., Willis, B. & Wong, B. (2010). “Doing” science versus
“Being” a scientist: Examining 10/11-year-old schoolchildren’s construction of science
through the lens of identity. Science Education, 94(4), 617–639.
Aydagül, B. (2007). Turkey Country Case Study. Country Profile commissioned for the EFA Global
Monitoring Report 2008, Education for All by 2015: Will we make it?.
Battiste, M. (2002). Indigenous knowledge and pedagogy in First Nations education: A literature
review with recommendations. Ottawa: Indian and Northern Affairs Canada.
Bell, J. F. (2001). Investigating gender differences in the science performance of 16-year-old pupils
in the UK. International Journal of Science Education, 23(5), 469–486.
Berlet, I., Bulthuis, F., Jacobs, H., Langberg, M., Wanner, P., & Thijs, A. (2008). Omgaan met
culturele diversiteit in het onderwijs - Een verkennende literatuurstudie Enschede: SLO
Stichting Leerplanontwikkeling.
Bhalotra, S. (2009). Educational deficits and social identity in India. Paper commissioned for the
EFA Global Monitoring Report 2010, Reaching the marginalized.
Bonetta, L. (2010). Reaching gender equity in science: The importance of role models and
mentors. Science Career Magazine, February 12, 2010. Retrieved March 21, 2011
from http://sciencecareers.sciencemag.org/career_magazine/previous_issues/articles/2010
02_12/science.opms.r1000084 BouJaoude, S. (2000). Science teacher preparation in Lebanon: Reality and future directions. In S.
Abell (Ed.), Science teacher education: An international perspective (pp. 45–74).
Dordrecht: Kluwer.
BouJaoude, S. & Al-Mouhayar. (2010). Teacher education in Lebanon: Trends and issues. In K.
Karras & C. C. Wolhuter (Eds.), International Handbook of Teacher Education World-wide:
Vol. 2. (pp. 309–332). Athens: Astrapos Editions.
Brunet, J. R. (2009, July 23). Malaysia halts English experiment. Macleans , p. 32.Cavas, B.,
Cavas, P., Tekkaya, C., Cakiroglu, J., Kesercioglu, Y. (2009). Turkish students’ views on
environmental challenges with respect to gender: An analysis of ROSE data. Science
Education International 20(1/2), 69–78.
Chunawala S., Vinisha, K. and Patel A. (2009). Gender, science and schooling: Illustrations in
science textbooks and students' and teachers' ideas related to gender. Mumbai: Homi
Bhabha Centre of Science Education.
COSMOS Corporation. (1998). A report on the evaluation of the National Science Foundation's
Informal Science Education Program. Bethesda, MD: COSMOS Corporation.
Costa, V.B. (1995). When science is “another world”: Relationships between worlds of family,
friends, school, and science. Science Education, 79, 313–333.
Crul, M., Pasztor, A., Lelie, F., Mijs, J., & Schnell, P. (2009). De lange route in internationaal
vergelijkend perspectief Amsterdam: Instituut voor Migratie en Ethnische Studies.
DCSF. (2007a). The Children’s Plan, (Norwich, TSO).
DCSF. (2007b). Guidance on the duty to promote community cohesion. In, DCSF (Ed.)
Nottingham, DCSF Publications.
Dekkers, H., Bosker, R. J., & Driessen G. (2000). Complex inequalities of educational
opportunities. A large-scale longitudinal study on the relation between gender, social class, ethnicity
and school success. Educational Research and Evaluation 6(1), 59–82.

65
Denessen, E., Driessena, G., & Sleegers, P. (2005). Segregation by choice? A study of group-
specific reasons for school choice. Journal of Education Policy, 20, 347–368.
Department of Statistics Malaysia. (2009). Population. Retrieved June 1, 2010, from
http://www.statisitcs.gov.my
DfEE & QCA. (1999a). The National Curriculum for England: Science Key Stages 1-4, London:
HMSO.
DfEE & QCA. (1999b). The National Curriculum: Handbook for primary teachers in England. London: HMSO.
Daly, L., Grant, A., & Bultitude, K. (2009). Girls into physics—Action Research (DCFS-RB103).
London: Department for Children, Schools and Families.
Diallo, H., Meulders, D., O’Dorchai, S., & Plasman, R. (2010). Meta-analysis of gender and science
research: Continental European countries report (draft). Retrieved February 27, 2011, from
http://www.genderandscience.org/web/reports.php
Driessen, G. (2000). The limits of educational policy and practice? The case of ethnic minorities in
the Netherlands. Comparative Education, 36, 55–72.
Dutch Eurydice Unit. (2007). The education system in the Netherlands 2007. The Hague: Ministry
of Education, Culture and Science.
European Commission. (2004). Europe neeeds more scientists: Report by the High Level Group
on Increasing Human Resources for Science and Technology in Europe 2004. Report for
European Commission (Brussels).
Frost, S., Reiss, M. & Frost, J. (2005). Count me in! Gender and minority ethnic attainment in school science.
School Science Review, 86 (316), 105–112.
George, R. (2006). A cross-domain analysis of change in students' attitudes toward science and
attitudes about the utility of science. International Journal of Science Education, 28(6), 571–589.
George, R. (2000). Measuring change in students’ attitudes toward science over time: An
Application of latent variable growth modeling. Journal of Science Education and
Technology, 9, 213–225.
Gijsberts, M., & Dagevos, J. (2009). Jaarrapport integratie 2009 Den Haag: Sociaal en Cultureel
Planbureau.
Government of India. (2005). Socio economic development. In National Commission for Scheduled
Tribes. Retrieved September 15, 2010, from http://ncst.nic.in/index.asp?langid=1
Government of India. (2009). 10th Joint Review Mission Report of Sarva Shiksha Abhiyan, Aide-
Memoire. [Electronic version].
HM Treasury, DTI & DfES. 2004. Science and innovation investment framework 2004 – 2014. In
HM Treasury, DTI & DfES (Eds). London, HMSO.
Haste, H. (2004). Science in my future: A study of values and beliefs in relation to science and
technology amongst 11-21 year olds. London: Nestle Social Research Programme.
Haste, H., Muldoon, C., Hogan, A., & Brosnan, M. (2008, September). If girls like ethics in their
science and boys like gadgets, can we get science education right? Paper read at BA Festival of
Science, University of Liverpool, UK.
Hathaway, R.S., Sharp, S., and Davis, C.S. (2001). Programmatic efforts affect retention of women
in science and engineering. Journal of Women and Minorities in Science and Engineering,
7, 107–124.
Hermans, P. (2002). Intercultural education in two teacher-training courses in the North of the Netherlands.
Intercultural Education, 13, 183–199.
Ho, C. C. (2010). Review of teaching and learning of science and mathematics in schools. Science
and Mathematics Education Workshop. Shah Alam: Akademi Sains Malaysia.
Jegede, O. (1995). Collateral learning and the eco-cultural paradigm in science and mathematics
education in Africa. Studies in Science Education, 25, 97–137.
Jidesjö, A. (2008). Different content orientations in science and technology among primary and
secondary boys and girls in Sweden: Implications for the transition from primary to
secondary school? NorDiNa 4(2), 192–208.
Kalantzis, M., & Pandian, A. (2001). Literacy matters: Issues for new times. Australia: Common
Ground-USM.
Karsten S., Felix C., Ledoux G., Meijnen W., Roeleveld J., & van Schooten E. (2006). Choosing

66
segregation or integration? The extent and effects of ethnic segregation in Dutch cities.
Education and Urban Society, 38, 228–247.
Koksal, N., and Convery, A. (2011). Initial teacher education in Turkey and England: Comparing
competencies and standards. Pamukkale University Scientific Research Project Centre, Turkey.
Kose. E. O. (2010). Biology students’ and teachers’ religious beliefs and attitudes towards theory of
evolution. H. U. Journal of Education, 38, 189–200.
Lee, J. D. (1998). Which kids can 'become' scientists: Effects of gender, self-concepts, and
perceptions of scientists. Social Psychology Quaterly , 61(3), 199–219.
Lee, O., & Luykx, A. (2006). Science education and student diversity: Synthesis and research
agenda. New York: Cambridge University Press.
Leune, J. M. G., & van der Rest, A. (2000). Onderwijsemancipatie uit de stijgers Den Haag:
Onderwijsraad.
Lim, S. C. (2009). Cultural differences and mathematics learning in Malaysia. MATHTED 2009.
Pahlawan City: Pahlawan State University.
Malaysia Singapore Thailand. 2005. Migration news, 12 (2), 1.
Mansour, N. (2008). Religious beliefs: A hidden variable in the performance of science teachers in
the Classroom. European Educational Research Journal 7 (4), 557-576.
Martin, M., Mullis, I., Foy, P., Olson, J., Erberber, E., Preuschoff, C., et al. (2008). TIMSS 2007 International
Science Report: Findings from IEA’s Trends in International Mathematics and Science Study at the
Fourth and Eighth Grades. Chestnut Hill: TIMSS & PIRLS
International Study Center, Boston College.
Ministerie van Onderwijs en Wetenschappen. (1990). Evaluatie voorlichtingscampagne Kies Exact
The Hague.
Ministry of Education, C. a. S. (2009). Key figures 2004-2008 - Education, Culture and Science
Kelpen: Hub. Tonnaer.
Ministry of Education Malaysia. (1994). Science committee report 1994. Kuala Lumpur: Curriculum
Development Centre.
Ministry of Education Malaysia. (2000). Science committee report 2000. Kuala Lumpur: Curriculum
Development Centre.
Ministry of Education. (2010). Teacher. Retrieved May 5, 2010, from http://www.moe.gov.my
Muğaloğlu, E, Z., & Bayram, H. (2009). Do religious values of prospective teachers affect their
attitudes toward science teaching? Türk Fen Eğitimi Dergisi, Yıl 6, Sayı 3.
Multimedia Development Corporation. (2005). The Smart School roadmap 2005-2020: An
educational odyssey. A consultative paper on the expansion of the Smart School initiative
to all schools in Malaysia. Retrieved March 15, 2011, from
http://www.msc.com.my/smartschool/whatis/components.asp
Murphy, C., & Beggs, J. (2003). Children’s perceptions of school science. School Science Review,
84, 109–116.
National Council of Educational Research and Training. (2006). National focus group on habitat
and learning Position paper. New Delhi: NCERT.
National Council of Educational Research and Training. (2006). National focus group on teaching
of science. Position paper. New Delhi: NCERT.
Ng, K. T., & Soo, B. N. (2006). Exploring factors contributing to science learning via Chinese
language. Studies About Language, 8, 50–57.
National University of Educational Planning and Administration. (2010). Elementary Education in
India: Progress towards UEE, DISE Flash Statistics: 2008-09. New Delhi: NUEPA.
Ong, E. T., & Ruthven, K. (2010). The distinctiveness and effectiveness of science teaching in
Malaysian 'Smart school'. Research in Science and Technological Education , 28 (1), 25–
41.
Osman, K., Halim, L., & Meerah, M. S. (2006). What Malaysian science teachers need to improve
their science instruction: A comparison across gender, school location and area of
specialisation. Eurasia Journal of Mathematics, Science and Technology Education , 2, 58–
81.
Pell, T., & Jarvis, T. (2001). Developing attitude to science scales for use with children of ages from

67
five to eleven years. International Journal of Science Education, 23, 847–862.
Ponchaud, B. (2008). Girls into Physics Project. School Science Review, 89 (328), 61–67.
Qualifications and Curriculum Authority. (2007). Science: Programme of study for key stage 3.
Retrieved March 15, 2011, from http://curriculum.qcda.gov.uk/key-stages-3-and-4/
Qualifications and Curriculum Authority. (2007). Science: Programme of study for key stage 4.
Available online at: http://curriculum.qcda.gov.uk/key-stages-3-and-4/
Rajput, J. S., & Srivastava, V.P. (2005). India. In D.B.Rao (Ed.), Science education for the
contemporary society (pp. 21–25). New Delhi: Discovery Publishing House.
Ramachandran, V. (2009). Education for all—Mid decade assessment: Towards gender equality in
education. New Delhi: NUEPA.
Reiss, M. (1993). Science education for a pluralist society. Bristol, PA: Open University Press.
Reiss, M. (2007). Representing the world: difference and science education. In M. Reiss, R.
DePalma & E. Atkinson (Eds.), Marginality and difference in education and beyond (pp.61–
72). Straffordshire: Trentham Books.
Reiss, M. (2009). Imagining the world: the significance of religious worldviews for science
education. In M. R. Matthews (Ed.), Science, worldviews and education (pp. 135–48). New
York: Springer.
Reiss, M. (2010). Science and religion: implications for science educators. Cultural Studies in
Science Education, 5, 91–101.
Republic of Turkey, Ministry of Education. (2011). National Education Statistics, Formal Education
2010-2011. [Electronic version].
Rijkschroeff, R., ten Dam, G., Duyvendak, J. W., de Gruijter, M., & Pels, T. (2005). Educational
policies on migrants and minorities in the Netherlands: success or failure? Journal of
Education Policy, 20, 417–435.
Schwedes, H. (2008). Gender bias in science and science education. Retrieved June 9, 2009, from
http://www.physik.uni-bremen.de/physics
Sjøberg, S. (2000). Interesting all children in the ‘science for all’ curriculum. In R. Millar, J. Leach, &
J. Osborn (Eds.), Improving science education – the contribution of research (pp. 165–186).
Buckingham: Open University Press.
Sjøberg, S. (2002). Science for the children? Report from the SAS-project, a cross-cultural study of
factors of relevance for the teaching and learning of science and technology. Retrieved
March 1, 2011, from University of Oslo Web site: http://folk.uio.no/sveinsj/
Sjøberg, S., & Schreiner, C. (2010). The ROSE project: An overview and key findings.
Specialist Schools and Academies Trust. About science specialism. Retrieved February, 21, 2011,
from
https://www.ssatrust.org.uk/subjects/science/Pages/Aboutsciencespecialism.aspx
STEMNET. (2010). STEM Access Grants: A report on a DIUS project to enhance the teaching of
STEM subjects in schools of high ethnic diversity. London: STEMNET.
Stokking, K.M. (2000). Predicting the choice of physics in secondary education. International
Journal of Science Education 22(12), 1261–1283.Tai, R. H., Qi Liu, C., Maltese, A. V. & Fan,
X. (2006). Planning early for careers in science. Science, 312, 1143–1145.
Tasar, M.F., & Timur, B. (2009). Conceptualising technology rich science education: Local context
in Turkey, theoretical foundations, and practical issues. Retrieved March 15, 2011, from
https://www.ntnu.no/wiki/.../WP6_GU_Literature+Review_Final.doc
ten Dam, G., van Eck, E., & Volman, M. (1992). Onderwijs en Sekse - een verkenning van
researchprogramma's The Hague: DCO/STEO.
Thorat, S. (2006). Higher education in India: Emerging issues related to access, inclusiveness, and
quality [Electronic version]. Paper presented at the Nehru Memorial Lecture, University of
Mumbai, Mumbai.
Trend, R. (2005). Individual, situational and topic interest in geoscience among 11- and 12-year-old
children. Research Papers in Education, 20(3), 271–302.
Turkish Eurydice Unit. (2009). Organisation of the education system in Turkey. European
Commission.

68
Uerz, D., Dekkers, H., & Beguin, A. A. (2004). Mathematics and language skills and the choice of
science subjects in secondary education. Educational Research and Evaluation 10(2), 163–
182.
United Nations, Department of Economic and Social Affairs, Population Division. (2006).
International Migration 2006. United Nations Publication, No. E.06.XIII.6. [Electronic
version].
van Langen, A., Rekers-Mombarg, L., and Dekkers, H. (2006). Sex-related differences in the
determinants and process of science and mathematics choice in pre-university education.
International Journal of Science Education 28(1), 71–94.
van Langen, A. & Dekkers, H. (2005). Cross-national differences in participating in tertiary science,
technology, engineering, and mathematics education. Comparative Education, 41, 329–
350.
Wawrinec, C. (2010). Tribality and indigeneity in Malaysia and Indonesia: Political and sociological
categorizations. The Stanford Journal of East Asian Affairs , 96–107.
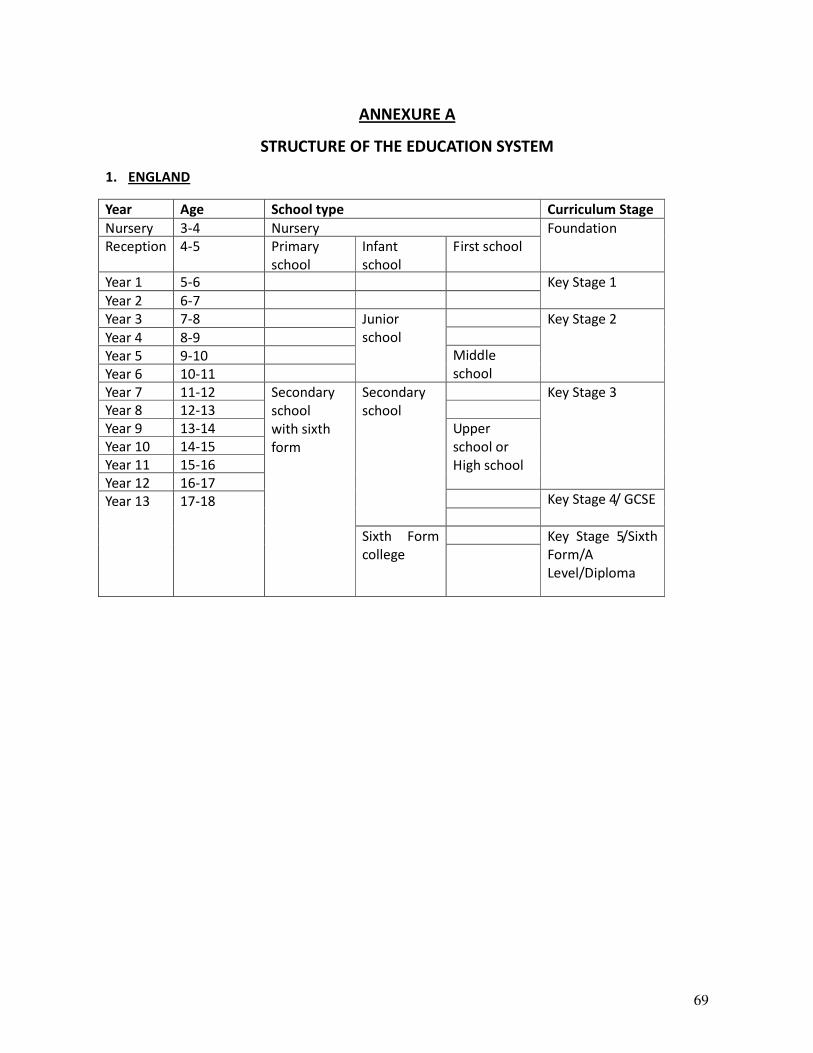
69
ANNEXURE A
STRUCTURE OF THE EDUCATION SYSTEM
1. ENGLAND
Year Age School type Curriculum Stage
Nursery 3-4 Nursery Foundation
Reception 4-5 Primary
school
Infant
school
First school
Year 1 5-6 Key Stage 1
Year 2 6-7
Year 3 7-8 Junior
school
Key Stage 2
Year 4 8-9
Middle
school
Year 5 9-10
Year 6 10-11
Year 7 11-12 Secondary
school
with sixth
form
Secondary
school
Key Stage 3
Year 8 12-13
Year 9 13-14 Upper
school or
High school
Year 10 14-15
Year 11 15-16
Year 12 16-17 Key Stage 4/ GCSE Year 13 17-18
Sixth Form
college
Key Stage 5/Sixth
Form/A
Level/Diploma
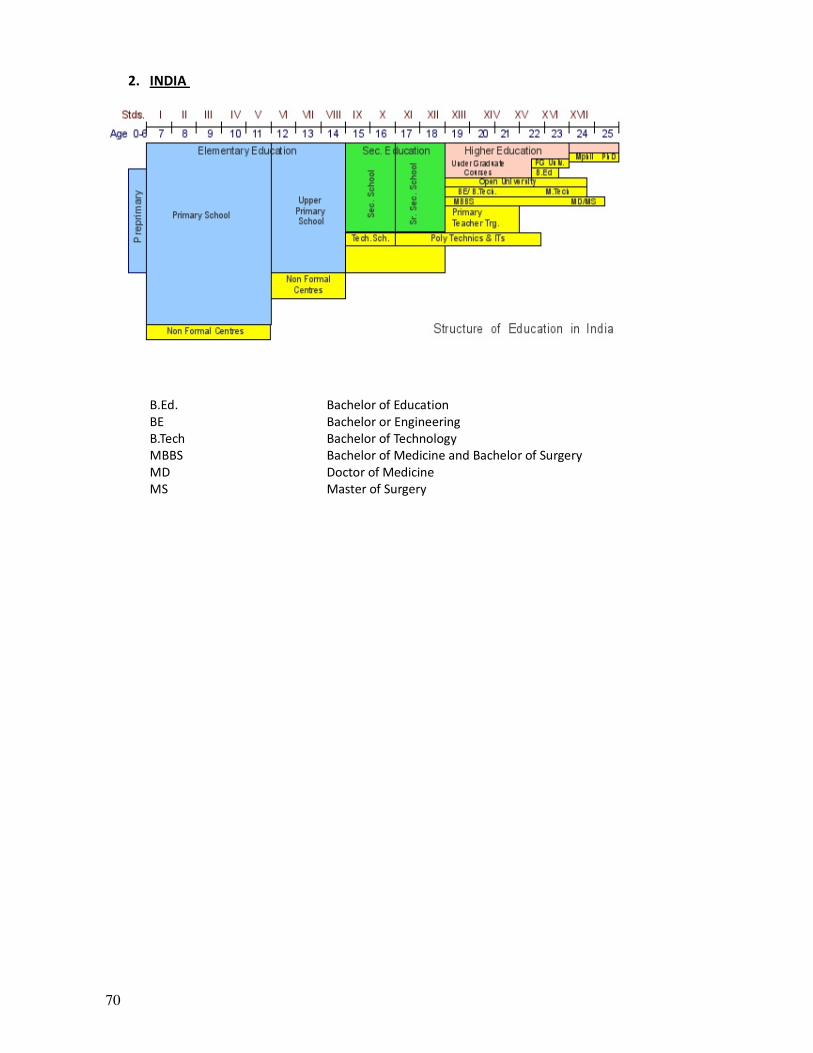
70
2. INDIA
B.Ed. Bachelor of Education
BE Bachelor or Engineering
B.Tech Bachelor of Technology
MBBS Bachelor of Medicine and Bachelor of Surgery
MD Doctor of Medicine
MS Master of Surgery
71
3. LEBANON
Adopted from Center for Educational Research and Development. (1995). New Framework for
Education. Beirut: CERD.
Higher Education
Tec
hn
ica
l a
nd
Vo
cati
on
al
Ed
uca
tion
Sec
on
dary
Sta
ge
Secondary Stage
Age 17-18
Life Sciences
Official Certificate: General Secondary
Certificate
Secondary Stage
Age 17-18
General Sciences
Official Certificate: General Secondary
Certificate
Secondary Stage
Age 17-18
Sociology and
Economics
Official Certificate:
General Secondary
Certificate
Secondary Stage
Age 17-18
Literature and
Humanities
Official Certificate: General Secondary
Certificate
Secondary Stage
Age 16-17
Sciences
Secondary Stage
Age 16-17
Humanities
Secondary Stage
Age 15-16
Grade 10
Inte
rmed
iate
sta
ge
Basic education – Third Cycle – 3 years
Ages 12-15
Grades 7, 8, and 9
Official Intermediate Level Certificate-
Ele
men
tary s
tag
e
Basic education – Second Cycle – 3 years
Ages 9-12
Grades 4, 5, and 6
Basic education – First Cycle – 3 years
Ages 6-9
Grades 1, 2, and 3
KG
Sta
g
e
Kindergarten - 2 years
Ages 4-6
Nursery

72
4. MALAYSIA
Year Age School Type Curriculum Stage
Pre-school
education
4-6 Nursery and Kindergarten
Can have own choice of medium of instruction
Foundation
-follow national pre-school
curriculum
Primary
Education
7-9 National School
Medium of
instruction: National
language (Malay
Language)
National Type
School: SJK
(C) or SJK (T)
Medium of
instruction:
Mother
tongue(Chinese
or Tamil)
Other Schools:
Private School,
Independent
School,
Religious
School, etc
Lower primary
Follow national curriculum KBSR
Standard 1-3 10-12
Upper primary
Follow national curriculum KBSR Standard 4-6
Secondary
Education
13-15 National School
Medium of
instruction: National
language (Malay
Language)
National Type
School: SMJK
Medium of
instruction:
National
language
(Malay
Language)
Other Schools:
Private School,
Independent
School, Religious
School, etc
Lower Secondary
Follow national curriculum
KBSM Form 1-3
16-17 National School
Medium of
instruction: National
language (Malay
Language)
National Type
School: SMJK
Medium of
instruction:
National
language
(Malay
Language)
Other Schools:
Private School,
Independent School,
Religious
School,
Technical,
Vocational
School, etc
Upper Secondary
Academic route: Follow national
curriculum KBSM Standard 4-6 (‘Science’ or ‘Arts’ Streams)
Post-
Secondary
Education
18-19 Pre-University:
Lower Form and
Upper Form 6
Local national
examination (STPM) – Malay Language as
medium of
instruction
Foreign A-Level
examination or
equivalent programme -e.g:
Cambridge A-Level
or International
Baccalaureate -
English Language as
medium of
instruction
Malaysia
Matriculation
Programme:
A one-to-two
year programme run
by the Ministry
of Education
No unified
examination or
syllabuses Malay
Language as
medium of
instruction
90% of the
places being
reserved for the
Bumiputeras,
and the other 10% for the
non-
Bumiputeras
Technical/Vocat
ional/Skill
based
Programme
Certificate/ Diploma/
Advanced
Diploma/
Graduate
Diploma
Programmes Levels of the
programmes are
governed by
Malaysia
Qualification
Framework
(MQF), which
is administered
by Malaysia Qualifications
agency). MQA
is under the
purview of
Ministry of
Higher Education of
Malaysia
Tertiary
Education &
Postgraduate
Education
>18 Levels of the programmes are governed by Malaysia Qualification Framework (MQF) which is
administered by Malaysia Qualifications agency (MQA).
MQA is under the purview of Ministry of Higher Education of Malaysia
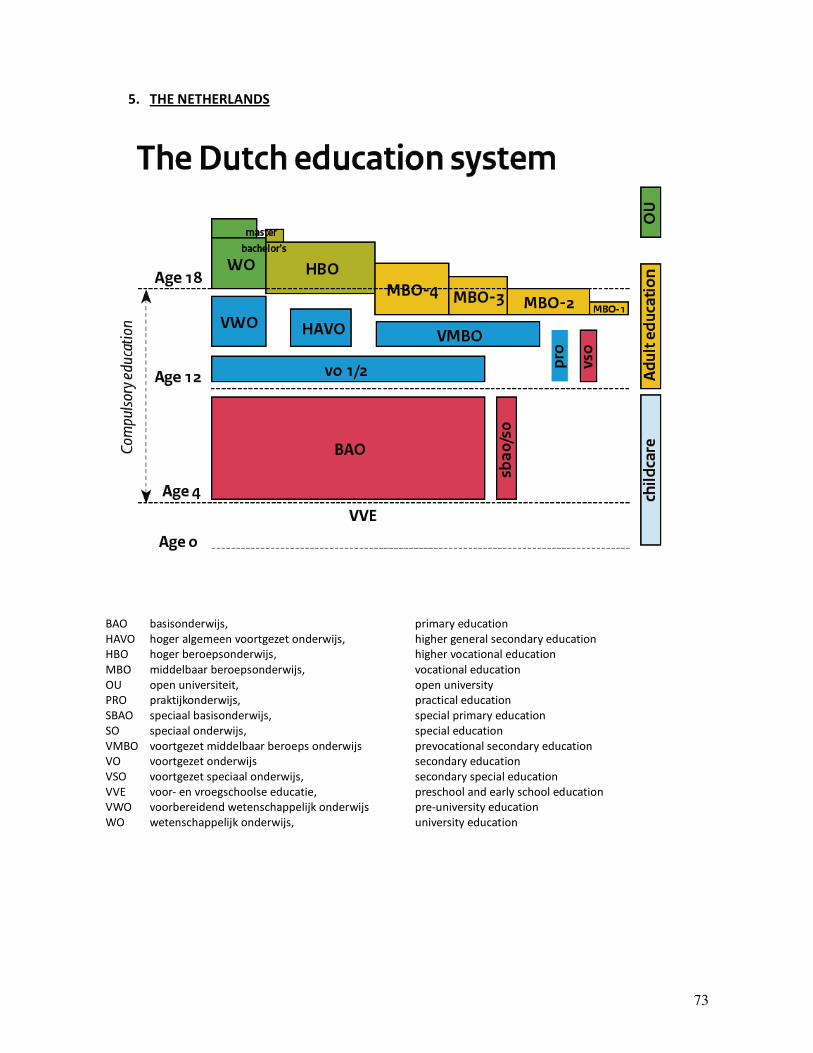
73
5. THE NETHERLANDS
BAO basisonderwijs, primary education
HAVO hoger algemeen voortgezet onderwijs, higher general secondary education
HBO hoger beroepsonderwijs, higher vocational education
MBO middelbaar beroepsonderwijs, vocational education
OU open universiteit, open university
PRO praktijkonderwijs, practical education
SBAO speciaal basisonderwijs, special primary education
SO speciaal onderwijs, special education
VMBO voortgezet middelbaar beroeps onderwijs prevocational secondary education
VO voortgezet onderwijs secondary education
VSO voortgezet speciaal onderwijs, secondary special education
VVE voor- en vroegschoolse educatie, preschool and early school education
VWO voorbereidend wetenschappelijk onderwijs pre-university education
WO wetenschappelijk onderwijs, university education
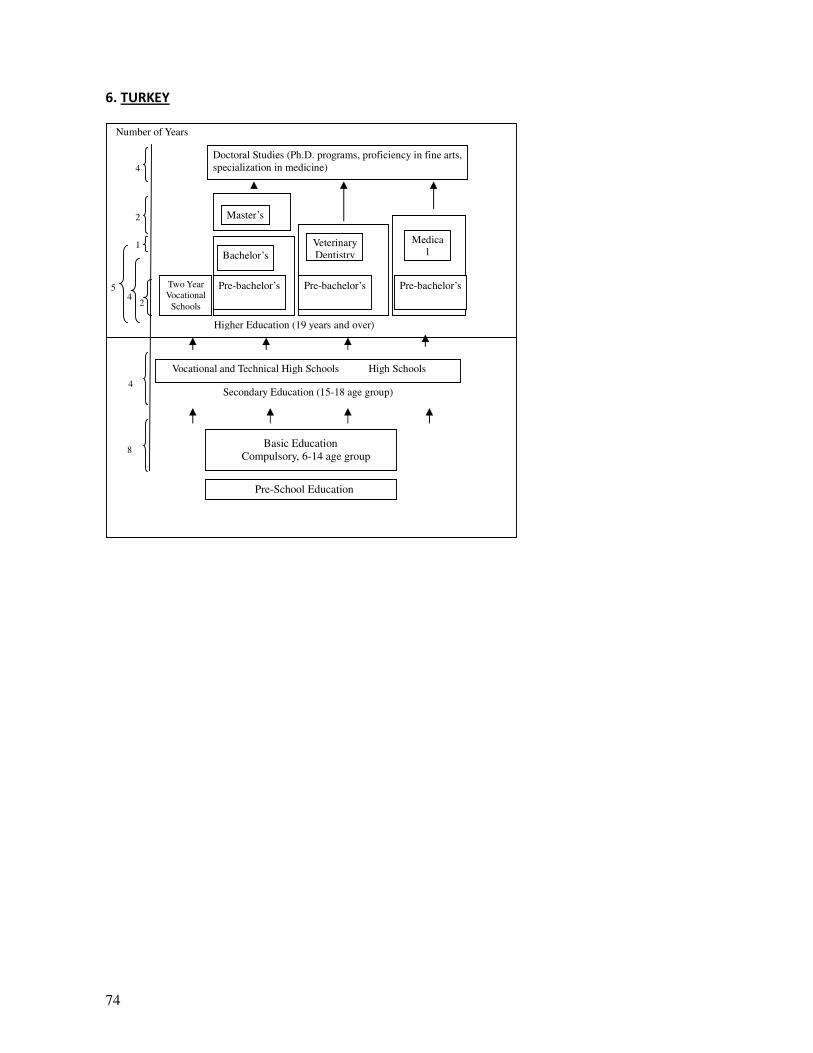
74
6. TURKEY
Doctoral Studies (Ph.D. programs, proficiency in fine arts,
specialization in medicine)
Two Year
Vocational
Schools
Master’s
Bachelor’s
Pre-bachelor’s
Veterinary
Dentistry
Pre-bachelor’s
Medica
l
Pre-bachelor’s
Vocational and Technical High Schools High Schools
Basic Education
Compulsory, 6-14 age group
2
2 4
5
4
8
4
1
Higher Education (19 years and over)
Secondary Education (15-18 age group)
Number of Years
Pre-School Education
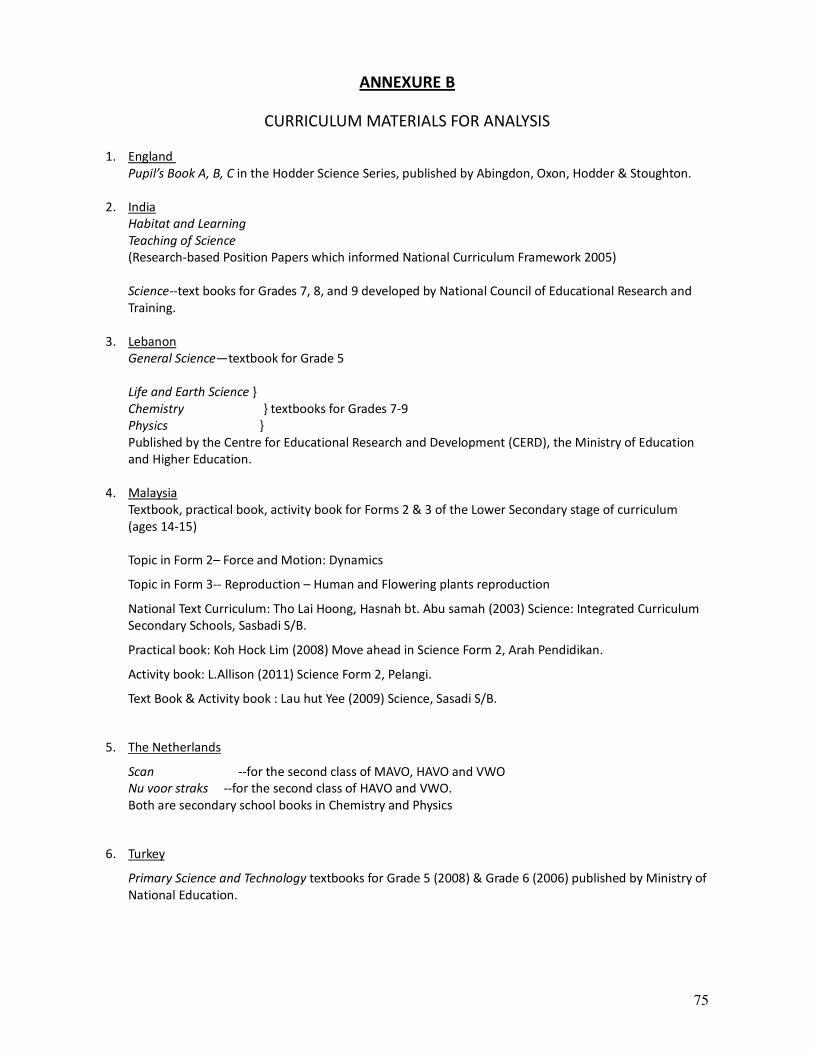
75
ANNEXURE B
CURRICULUM MATERIALS FOR ANALYSIS
1. England
Pupil’s Book A, B, C in the Hodder Science Series, published by Abingdon, Oxon, Hodder & Stoughton.
2. India
Habitat and Learning
Teaching of Science
(Research-based Position Papers which informed National Curriculum Framework 2005)
Science--text books for Grades 7, 8, and 9 developed by National Council of Educational Research and
Training.
3. Lebanon
General Science—textbook for Grade 5
Life and Earth Science }
Chemistry } textbooks for Grades 7-9
Physics }
Published by the Centre for Educational Research and Development (CERD), the Ministry of Education
and Higher Education.
4. Malaysia
Textbook, practical book, activity book for Forms 2 & 3 of the Lower Secondary stage of curriculum
(ages 14-15)
Topic in Form 2– Force and Motion: Dynamics
Topic in Form 3-- Reproduction – Human and Flowering plants reproduction
National Text Curriculum: Tho Lai Hoong, Hasnah bt. Abu samah (2003) Science: Integrated Curriculum
Secondary Schools, Sasbadi S/B.
Practical book: Koh Hock Lim (2008) Move ahead in Science Form 2, Arah Pendidikan.
Activity book: L.Allison (2011) Science Form 2, Pelangi.
Text Book & Activity book : Lau hut Yee (2009) Science, Sasadi S/B.
5. The Netherlands
Scan --for the second class of MAVO, HAVO and VWO
Nu voor straks --for the second class of HAVO and VWO.
Both are secondary school books in Chemistry and Physics
6. Turkey
Primary Science and Technology textbooks for Grade 5 (2008) & Grade 6 (2006) published by Ministry of
National Education.

76
ANNEXURE C
CURRICULUM ANALYSIS RUBRICS
GENDER
Definition of Gender: Gender is a sociocultural construct referring to the personality
characteristics supposedly associated with being male and female - masculinity and
femininity. What defines masculine and feminine, that is the construct of gender, varies across
different groups of people and over time.
1.* Are the pronouns used gendered?
(Gendered pronouns include he, she, him, her, himself, herself. Are pronouns for both genders
used interchangeably or are masculine pronouns used more frequently? )
2.* Are the narrative characters used balanced among male and female characters? (If there is
use of characters in the narrative of a science lesson/chapter, are both male and female
characters depicted or is there a predominance of either one of them?)
3. Is there a stereotypical depiction of gender in text and visuals? (Are males and females
depicted in stereotypical ways with respect to one or more of the following: Appearance – e.g.
males looking robust and females frail/delicate, Character traits – e.g. males as adventurous,
leaders, successful; females as cautious, unsure, followers, Aspirations - males aspiring for a
career in the pure sciences, high technology professions; females aspiring for a career in the
applied sciences, in caring professions, teaching. Some of these stereotypes may be culture
specific—e.g. In the Indian context, girls always depicted in visuals with long hair.
4.* Is there a balance in references to/representations of male and female scientists in text and
visuals? (When women scientists have had a contribution to make, are they included or excluded
in the text and visuals?)
5. Is there a depiction of gender neutral roles in text and visuals? (Text and visuals show human
figures fully or partially such that whether they are males or females cannot be clearly
distinguished. E.g. The profile or back of a human figure; only hands devoid of clearly
distinguishing male or female features such as jewellery or make up.)
6. Is there a balance in the depiction of activities (agency - active and passive) for both boys and
girls in text and visuals? (Counter example: Males are shown to be predominantly engaged in
tasks which are active/outdoors and females in tasks that are predominantly passive/indoors.)
7.* Is science represented as a collaborative endeavour? (Are scientific tasks described /depicted
in terms of several persons working together—sometimes even cross-culturally; are scientific
discoveries /processes described as the outcome of collaboration between scientists and not as
individuals working in isolation/independently; are experiments /exercises in the text book
presented in a way which requires students to work together?)
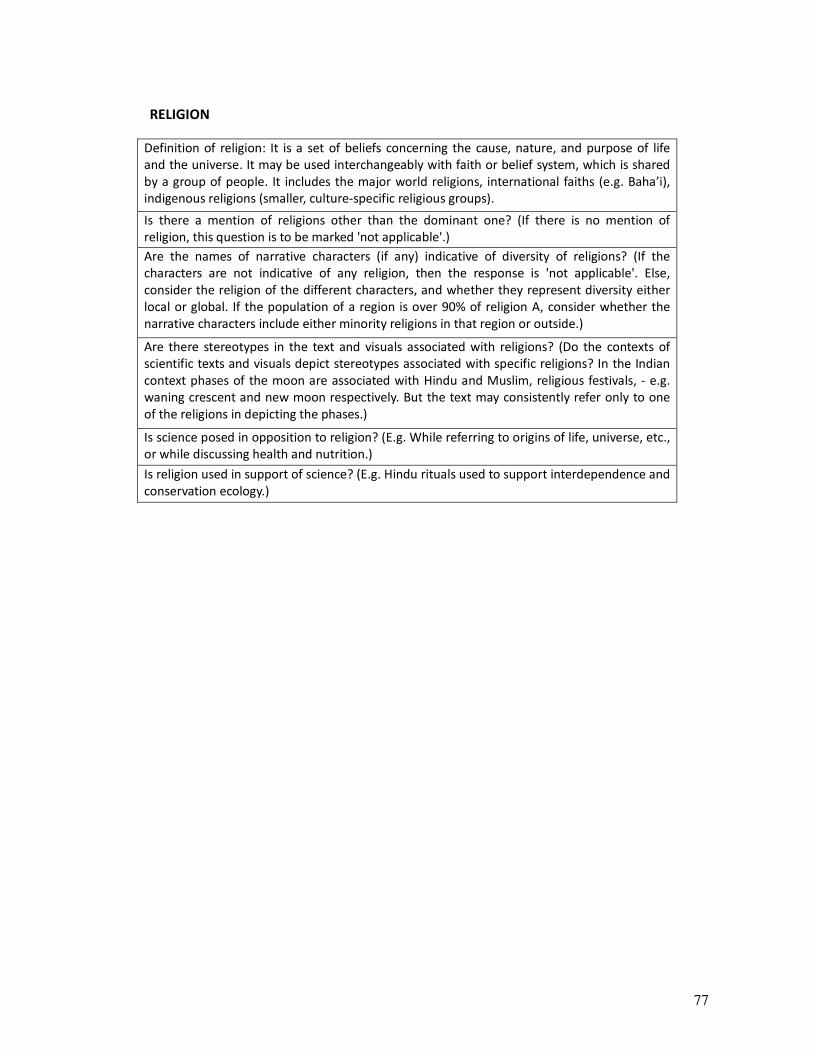
77
RELIGION
Definition of religion: It is a set of beliefs concerning the cause, nature, and purpose of life
and the universe. It may be used interchangeably with faith or belief system, which is shared
by a group of people. It includes the major world religions, international faiths (e.g. Baha’i),
indigenous religions (smaller, culture-specific religious groups).
Is there a mention of religions other than the dominant one? (If there is no mention of
religion, this question is to be marked 'not applicable'.)
Are the names of narrative characters (if any) indicative of diversity of religions? (If the
characters are not indicative of any religion, then the response is 'not applicable'. Else,
consider the religion of the different characters, and whether they represent diversity either
local or global. If the population of a region is over 90% of religion A, consider whether the
narrative characters include either minority religions in that region or outside.)
Are there stereotypes in the text and visuals associated with religions? (Do the contexts of
scientific texts and visuals depict stereotypes associated with specific religions? In the Indian
context phases of the moon are associated with Hindu and Muslim, religious festivals, - e.g.
waning crescent and new moon respectively. But the text may consistently refer only to one
of the religions in depicting the phases.)
Is science posed in opposition to religion? (E.g. While referring to origins of life, universe, etc.,
or while discussing health and nutrition.)
Is religion used in support of science? (E.g. Hindu rituals used to support interdependence and
conservation ecology.)

78
ETHNICITY
Definition of Ethnicity: It refers to groups of people who identify with each other, either on the
basis of a common ancestry, or by common cultural, linguistic, religious, or territorial traits.
1. Is there a mention of diverse ethnic groups? (Explicitly)
2. Is western science presented as the dominant way of knowing? (Whether attributes
associated explicitly with western science, like rationality, objectivity and value neutrality,
etc. are emphasised to the exclusion of other human/ social values.)
3. Are alternative/indigenous ways of knowing explored? (E.g. Does the narrative include
discussions of ethnic, cultural, religious and other empirical ways of knowing about the
world, about life and living, etc.? This question is related to the above question.)
4. Are words from different languages used in the text? (They may be in concept words,
examples, phenomena, etc. E.g. The planet Saturn is accompanied with shani in brackets,
a name common to most Indian languages.)
5. Are contributions of different cultures presented in the history of science? (If the narrative
includes references to history in relation to evolution of ideas, then are these exclusively
from European culture? Or are there references to ideas from indigenous cultures of
Africa, Asia, and South America as well? If the narrative does not have references to the
history of science, then the response would be 'not applicable'.)
6. Are the names of narrative characters (if any) indicative of diversity of ethnicity? (If there
are no narrative characters or their names are neutral to ethnicity, then the response
would be 'not applicable'.)
7. Are there stereotypes in the text and visuals associated with ethnicity? (E.g. Do
occupations depicted indicate persons of certain ethnicity, and are these stereotypical?)

79
HABITAT
Definition of Habitat: This refers primarily to activities associated with different geographical
regions of the country, in which science is contextualised. It also includes differences
between villages, small towns and metropolises, slums and high-rise buildings, etc.
1. Is there a balanced representation of contexts from different geographical regions? (This
refers primarily to the geographical diversity of the country. India has several bio-
geographical regions – desert, rain forest, deciduous forest, coastal, hilly, etc.)
2. Is there a balanced discussion/presentation of urban and rural contexts? (E.g. Whether a
discussion of water source and use includes rural and urban conditions.)
3. Is science associated with high technology and modern industries? (The association may
be implicit, but there are often explicit association of science with the space age,
computers, etc.)
4. Is science associated with rural life? (E.g. Do the examples and discussion contexts
include rural life styles? Does the text or visual have any reference to aspects related to
rural living?)
5. Is science associated with agriculture?
6. Is science associated with indigenous and traditional industries?
7. Is sustainability mentioned in the context of development? (E.g. References to avoiding
excessive consumption of materials and goods, recognising the interdependence of life,
and responsible behaviour towards the environment while pursuing development.)