SCIENCE EDUCATION FOR DIVERSITY: WP2
47
SCIENCE EDUCATION FOR DIVERSITY: WP2 India Report
-
Upload
khangminh22 -
Category
Documents
-
view
0 -
download
0
Transcript of SCIENCE EDUCATION FOR DIVERSITY: WP2
SCIENCE EDUCATION FOR DIVERSITY: WP2
India Report
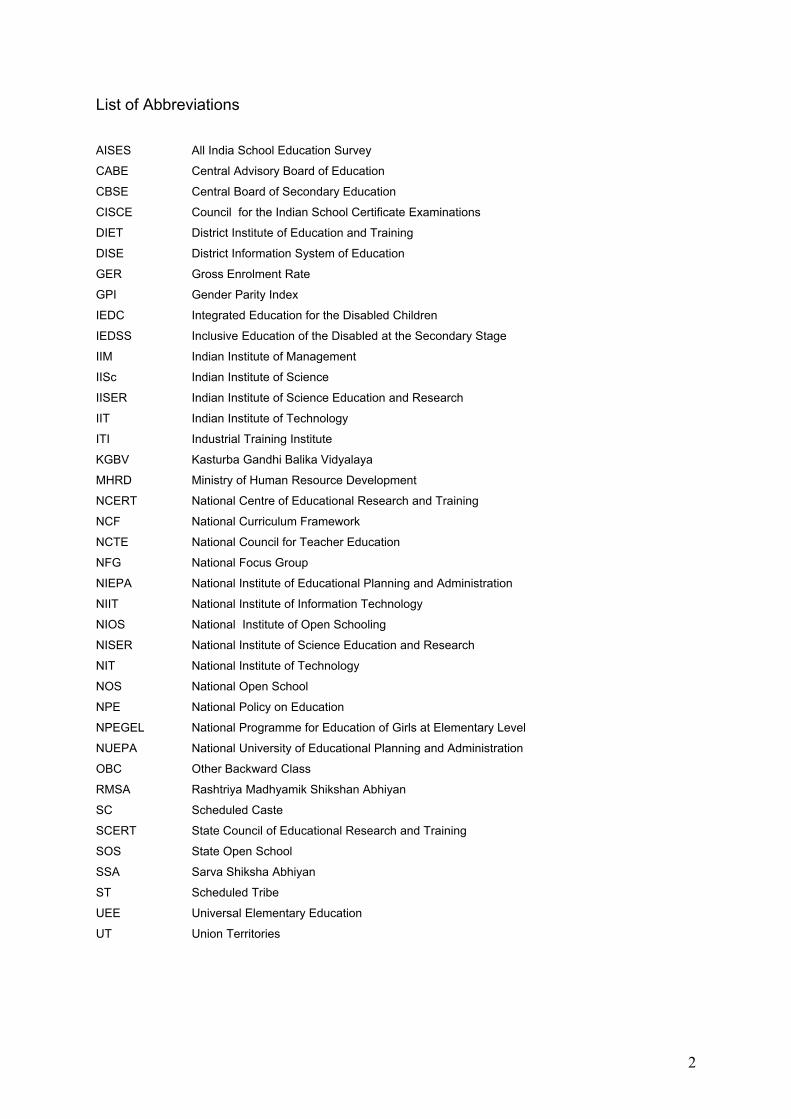
List of Abbreviations
AISES All India School Education Survey
CABE Central Advisory Board of Education
CBSE Central Board of Secondary Education
CISCE Council for the Indian School Certificate Examinations
DIET District Institute of Education and Training
DISE District Information System of Education
GER Gross Enrolment Rate
GPI Gender Parity Index
IEDC Integrated Education for the Disabled Children
IEDSS Inclusive Education of the Disabled at the Secondary Stage
IIM Indian Institute of Management
IISc Indian Institute of Science
IISER Indian Institute of Science Education and Research
IIT Indian Institute of Technology
ITI Industrial Training Institute
KGBV Kasturba Gandhi Balika Vidyalaya
MHRD Ministry of Human Resource Development
NCERT National Centre of Educational Research and Training
NCF National Curriculum Framework
NCTE National Council for Teacher Education
NFG National Focus Group
NIEPA National Institute of Educational Planning and Administration
NIIT National Institute of Information Technology
NIOS National Institute of Open Schooling
NISER National Institute of Science Education and Research
NIT National Institute of Technology
NOS National Open School
NPE National Policy on Education
NPEGEL National Programme for Education of Girls at Elementary Level
NUEPA National University of Educational Planning and Administration
OBC Other Backward Class
RMSA Rashtriya Madhyamik Shikshan Abhiyan
SC Scheduled Caste
SCERT State Council of Educational Research and Training
SOS State Open School
SSA Sarva Shiksha Abhiyan
ST Scheduled Tribe
UEE Universal Elementary Education
UT Union Territories
2

Introduction
The basic goals and aspirations of the people of India as enshrined in the Indian
Constitution have guided the development of education in the country during the last
64 years. A number of important provisions1 which have a direct or indirect bearing
on education have been included in the Constitution of India. They address diversity,
a defining feature of the second most populous country in the world (1.15 billion) and
home to 17% of the world’s population. The geopolitical division of the country into
28 States and 7 Union Territories (UTs) embody the country’s diversity primarily in
the form of class (social and economic), regional, linguistic, religious, and habitat
differences—further compounded by their overlap. The Indian education system is
defined in distinct ways by these dimensions of diversity, including gender.
CLASS Stratification of the Indian population occurs along social and economic
lines, characterised by caste and income respectively. The origin of the word caste is
from the Portuguese word casta, meaning breed, race, or kind. Castes are ranked,
named, endogamous groups, membership in which is achieved by birth. There are
thousands of castes and subcastes in India. Each caste is part of a locally based
system of interdependence with other groups, involving occupational specialisation.
There is some correlation between ritual rank on the caste hierarchy and economic
prosperity. Many lower-caste people live in conditions of great poverty and social
disadvantage.
Numerous groups called tribes are also integrated into the caste system. Tribes that
live separately from others--particularly in the far northeast and in the forested areas
of the country—are more like ethnic groups than castes. Some tribes are themselves
divided into groups similar to subcastes (Heitzman & Worden, 1995). Caste and
class affiliations overlap, especially in rural areas.
Backward Classes is a collective term, used by the Government of India, for castes
which are economically and socially disadvantaged. They typically include the Dalits,
1 Article 350-A states that, “ it shall be the endeavour of every State and of every local authority within the State to provide adequate facilities for instruction in the mother tongue at the primary stage of education to children belonging to linguistic minority groups”; Article 46 states, “The State shall promote with special care the educational and economic interests of the weaker sections of the people, and in particular, of the Scheduled Castes and the Scheduled Tribes, and shall protect them from social injustice and all forms of exploitation”;
3
the Scheduled Castes (SCs), and the Other Backward Classes (OBCs). In addition
there are the Scheduled Tribes (STs). In 1950, by a Constitutional Order, a complete
listing of castes and tribes based on the prevailing definition of Scheduled Castes
and Scheduled Tribes (terms brought into use by the Government of India Act 1935
passed by the British) was made. They together comprise over 24% of India's
population, with SCs at over 16% and STs over 8% as per the 2001 Census. There
are over 700 notified STs spread over the country. Tribal communities live in about
15% of the country’s areas in various ecological and geo-climatic conditions ranging
from plains to forests, hills and inaccessible areas (National Commission for
Scheduled Tribes, Government of India; Ministry of Tribal Affairs, Government of
India).
As measured by the new international Multi-dimensional Poverty Index (MPI), a
composite indicator made up of ten markers of education, health and standard of
living achievement levels, about 645 million people or 55% of India's population is
poor. Multi-dimensional poverty is highest (81.4% poor) among Scheduled Tribes,
followed by Scheduled Castes (65.8%), Other Backward Class (58.3%) and finally
the general population (33.3%) (Shrinivasan, 2010).
LANGUAGES The Indian Constitution lists 22 official or Scheduled Languages and
another 100 are the non-scheduled languages. Of the total 122 scheduled and non-
scheduled languages, 66 belong to the Tibeto-Burman, 24 to the Indo-European,
and 17 to the Dravidian family of languages (Census of India, 2001). As per the
Constitution, the official language of the country is Hindi.
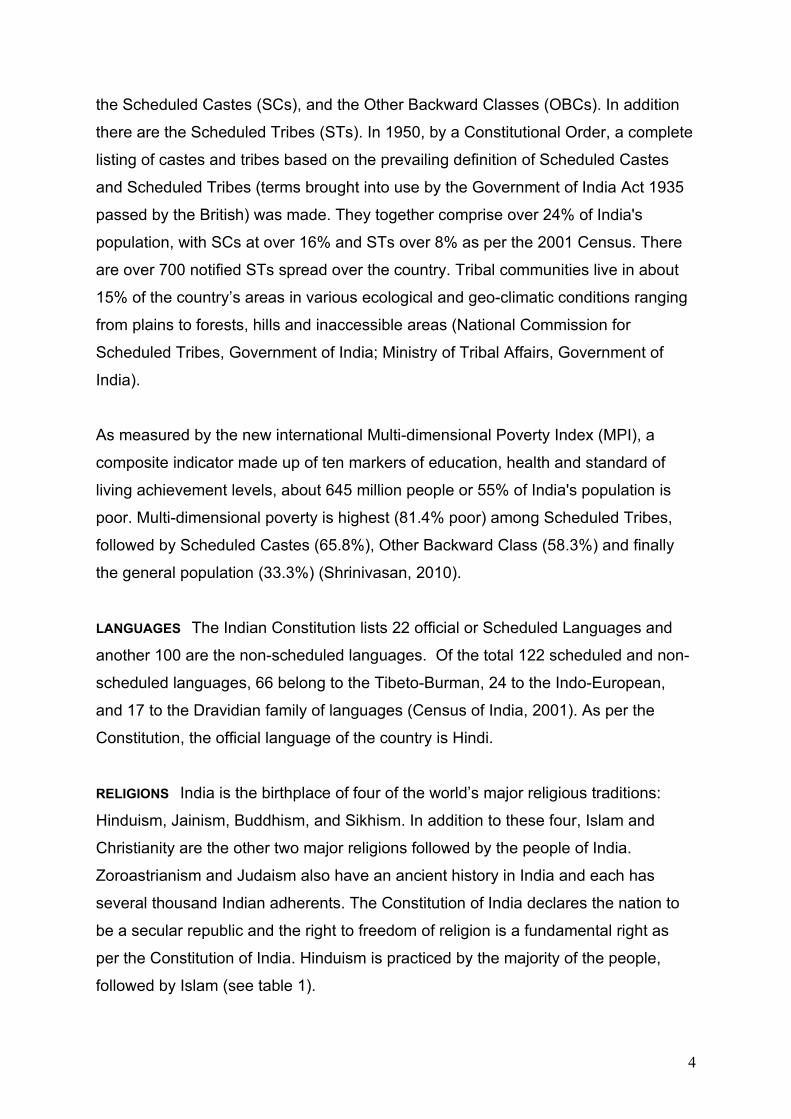
RELIGIONS India is the birthplace of four of the world’s major religious traditions:
Hinduism, Jainism, Buddhism, and Sikhism. In addition to these four, Islam and
Christianity are the other two major religions followed by the people of India.
Zoroastrianism and Judaism also have an ancient history in India and each has
several thousand Indian adherents. The Constitution of India declares the nation to
be a secular republic and the right to freedom of religion is a fundamental right as
per the Constitution of India. Hinduism is practiced by the majority of the people,
followed by Islam (see table 1).
4
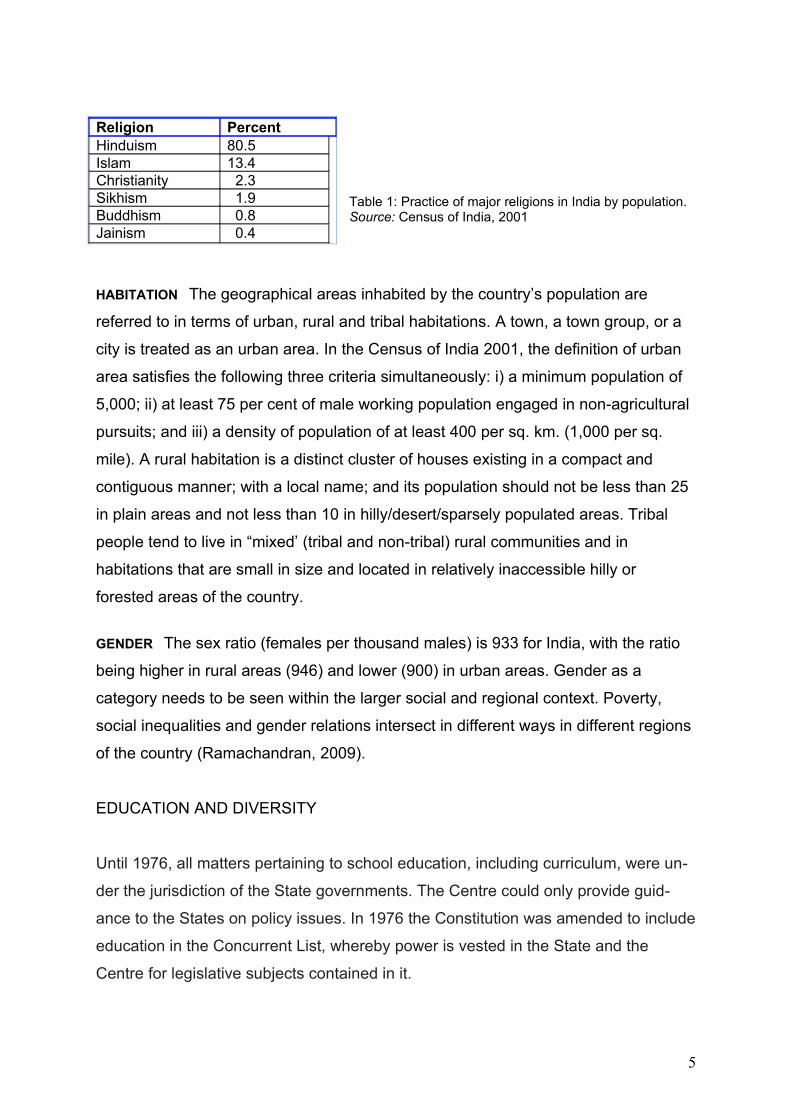
Table 1: Practice of major religions in India by population.Source: Census of India, 2001
HABITATION The geographical areas inhabited by the country’s population are
referred to in terms of urban, rural and tribal habitations. A town, a town group, or a
city is treated as an urban area. In the Census of India 2001, the definition of urban
area satisfies the following three criteria simultaneously: i) a minimum population of
5,000; ii) at least 75 per cent of male working population engaged in non-agricultural
pursuits; and iii) a density of population of at least 400 per sq. km. (1,000 per sq.
mile). A rural habitation is a distinct cluster of houses existing in a compact and
contiguous manner; with a local name; and its population should not be less than 25
in plain areas and not less than 10 in hilly/desert/sparsely populated areas. Tribal
people tend to live in “mixed’ (tribal and non-tribal) rural communities and in
habitations that are small in size and located in relatively inaccessible hilly or
forested areas of the country.
GENDER The sex ratio (females per thousand males) is 933 for India, with the ratio
being higher in rural areas (946) and lower (900) in urban areas. Gender as a
category needs to be seen within the larger social and regional context. Poverty,
social inequalities and gender relations intersect in different ways in different regions
of the country (Ramachandran, 2009).
EDUCATION AND DIVERSITY
Until 1976, all matters pertaining to school education, including curriculum, were un-
der the jurisdiction of the State governments. The Centre could only provide guid-
ance to the States on policy issues. In 1976 the Constitution was amended to include
education in the Concurrent List, whereby power is vested in the State and the
Centre for legislative subjects contained in it.
5
Religion PercentHinduism 80.5Islam 13.4Christianity 2.3Sikhism 1.9Buddhism 0.8Jainism 0.4

Formal education in India is a hierarchically structured system from kindergarten to
university, including institutions of technical and professional education and training
and is conceived as the National System of Education2. It requires that up to a given
level, all students, irrespective of caste, creed, location or sex, have access to edu-
cation of a comparable quality. While the national system of education aims at a
common educational structure, constitutional provisions, educational policies and
programmatic interventions have strived to address challenges posed by diversities
that characterise the country and its people. After Independence, the concerns of
education articulated during the freedom struggle were revisited by the National
Commissions—the Secondary Education Commission (1952-53) and the Education
Commission (1964-66).
National Policy on Education (NPE) 1968
It came into being following a comprehensive review of education in the country car-
ried out by the Education Commission (1964-66) and the recommendations it made.
The principles of NPE 1968 aimed to promote national progress, a sense of common
citizenship and culture, and to strengthen national integration. It laid stress on the
need for a radical reconstruction of the education system to improve its quality at all
stages and correcting regional imbalances in the provision of educational facilities by
providing good educational facilities in rural and other backward areas. In addition to
this, emphasis on education of girls to achieve social justice and accelerate social
transformation; intensive efforts to develop education among the backward classes
and especially among the tribal people; promotion of educational interests of minori-
ties; and development of integrated programmes to enable physically and mentally
disabled children to study in regular schools were principles enunciated by the pol-
icy. In response to the diversity of linguistic situations in the country, the three-lan-
guage formula3 was adopted.
2 Non formal education (NFE) is conceptualized as an educational activity occurring within the frame-work of the formal education system. Its major characteristic in the Indian context is its flexibility in terms of organisation, timing and duration of teaching and learning, clientele groups, age group of learners, content, methodology of instruction and evaluation procedure (Mitra, 2007).
3 The First language to be studied at the primary level must be the mother tongue or the regional lan-guage. The Second language in Hindi speaking States will be some other modern Indian language or English, and in non-Hindi speaking States, the second language will be Hindi or English. The Third language in Hindi speaking States will be English or a modern Indian language not studied as the sec-ond language, and in non-Hindi speaking States, the third language will be English or a modern Indian language not studied as the second language.
6

It urged for much greater attention to science and technology emphasising that the
education system must produce young men and women of character and ability
committed to national service and development. With a view to accelerating the
growth of the national economy, it recommended that “science education and re-
search should receive high priority. Science and mathematics should be an integral
part of general education till the end of schooling.”
National Policy on Education 1986
NPE 1986 laid special emphasis on education for women’s equality. The removal of
female illiteracy and obstacles inhibiting girls’ access to, and retention in, elementary
education received priority. Greater emphasis was laid on “women's participation in
vocational, technical and professional education at different levels. The policy of non-
discrimination will be pursued vigorously to eliminate sex stereotyping in vocational
and professional courses and to promote women's participation in non-traditional oc-
cupations, as well as in existing and emergent technologies.”
For the educational development of the Scheduled Castes, the focus was on their
equalisation with the non-SC population at all stages and levels of education and re-
cruitment of scheduled caste teachers. For the education of the Scheduled Tribes,
priority was accorded to opening primary schools in tribal areas, establishing resid-
ential schools (ashram shalas) on a large scale, designing curricula at all stages of
education to create an awareness of their rich cultural identity, and devising instruc-
tional materials in tribal languages at the initial stages, with arrangements for switch-
ing over to the regional language. Greater attention was paid to educationally de-
prived minority groups including the Constitutional guarantees given to them to es-
tablish and administer their own educational institutions (such as madrassas and
maktabs for the Muslims4), and protection to their languages and culture. The
scheme of establishing pace-setting residential and coeducational schools, Jawahar
Navodaya Vidyalayas (JNV), for providing opportunities to talented children in
classes VI-XII predominantly from rural areas was started with two schools on an ex-
4 Maktabs provide instruction in religious as well as some secular subjects up to primary level and are often attached to a masjid (mosque); madrassas impart education generally up to the senior secondary level.
7

perimental basis in 1985-86. At present there are over 500 JNVs across the country
except in the southern state of Tamil Nadu. Students are selected on the basis of a
merit test administered annually at the block and district levels. Seventy-five percent
of the seats are reserved for rural students; for children from SC and ST communit-
ies, seats are reserved in proportion to their population in the district. One third of the
seats are for girls and three percent are reserved for disabled children (Navodaya
Vidyalaya Samiti, MHRD).
Science education was seen as necessary “to develop in the child well defined abili-
ties and values such as the spirit of inquiry, creativity, objectivity, the courage to
question, and an aesthetic sensibility.” Science education programmes to enable the
learner to acquire problem solving and decision making skills and to discover the re-
lationship of science with health, agriculture, industry and other aspects of daily life
were to be designed. Every effort was to be made “to extend science education to
the vast numbers who have remained outside the pale of formal education.”
In 1992, the Central Advisory Board of Education (CABE), the members of which in-
clude Ministers of Education of different states and union territories and leading edu-
cationists of the country, made some modifications to NPE 1986. Access to second-
ary education was widened with emphasis on enrolment of girls, SCs and STs, par-
ticularly in science, commerce and vocational streams. Efforts were made towards
computer literacy in as many secondary level institutions as possible so that children
are equipped with skills to be effective in a growing technological world. National Pol-
icy on Education 1986 and (as modified in) 1992 proposed a national framework for
curriculum as a means of evolving a national system of education capable of re-
sponding to India's diversity of geographical and cultural milieus while ensuring a
common core of values along with academic components.
8

Section 1
GENERAL EDUCATION SYSTEM
STRUCTURE OF THE EDUCATION SYSTEM
The education system in the States and UTs of India generally follow the 8+2+2+3
pattern, which provides for eight years of elementary education, two years each of
secondary and senior/higher secondary schooling, and three years of higher/univer-
sity education (see figure 1). There is high degree of uniformity in the pattern of edu-
cational structure within a particular State or UT and also a broad consensus has
emerged for adoption by all States (MHRD, 2000).
Fig.1: Stages of school education in IndiaSource: Development of Education: 1986-1988. National Report of India
A. SCHOOL EDUCATION
In pursuance of the National Policy on Education of 1968 and of 1986, school
education consists of 12 years, commonly following the 10+2 pattern. The 'plus two'
stage refers to classes XI and XII which constitute the higher secondary stage
across all 35 States/UTs. (In some states, higher secondary stage is part of
collegiate education known as Junior Colleges. Of the ten years, classes I-VIII
correspond to elementary education, further demarcated into primary and upper
primary schooling. The primary and upper primary pattern is more commonly 5+3
years (in 21 States/UTs), or may be 5+2 (in 3 States/UTs), 4+4 (in 3 States), 4+3
years (in 9 States/UTs). Secondary education consists of two years (see table 2 for
the pattern of school education).
9
STAGE Age Class/Standard
1. Elementary Education (8 yrs)
• Primary School
• Upper Primary
6-14 years
• 6-10 yrs
• 11-14 yrs
Stds. I-VIII
• I-IV/V
• V/VI-VIII
2. Secondary Education (2 yrs) 15-16 yrs IX-X
3. Higher/Senior Secondary Education (2 yrs)
17-18 yrs XI-XII/Junior College
Table 2: Pattern of school education in India.
A child is normally admitted to Class I at the age of six and is expected to complete
Class VIII by 14 years of age. At this point, a child can either join the secondary
school providing general education programmes or alternatively can join a vocational
school or an Industrial Training Institute (ITI) which equips him/her with specialised
vocational skills. A person who completes 10 years of general education has a
similar choice to take up either academic courses at the higher secondary level in
preparation for college education or opt for vocational courses within the higher
secondary programme or through specialised institutions such as polytechnics and
ITIs.
The constitutional obligation of providing free and compulsory education to all
children up to the age of 14 is now legislated by The Right of Children to Free and
Compulsory Education Act 2009 which came into force in April 2010. Every child in
the age group of 6-14 years has the right to free and compulsory admission,
attendance and completion of 8 years of elementary education in an age appropriate
classroom in the vicinity of his/her neighbourhood. The Act favours a policy of “no
failure” and has made it mandatory for schools to promote all students up to Class
VIII.
a) Elementary Education
Elementary education aims to develop literacy and numeracy, acquaintance with the
social and physical environment, creative expression, and healthy living. Sarva Shik-
sha Abhiyan (SSA) is Government of India's flagship programme for achievement of
Universalisation of Elementary Education (UEE) in a time bound manner. Under
10

SSA, special focus is on girls, children belonging to SC/ST communities, other weak-
er sections, minorities and urban deprived children.
SSA is being implemented in partnership with State Governments to cover the entire
country and address the needs of 192 million children in 1.1 million habitations.
Today, 180 million children are taught by almost 5.7 million teachers in more than
1.2 million primary and upper primary schools across the length and breadth of the
country.
b) Secondary and Higher Secondary Education
Secondary education aims to develop the intellectual, social, and moral qualities es-
sential for democratic citizenship, and to prepare young people for entry into the
world of work or for continuation of academic pursuits (Secondary Education Com-
mission Report, 1952; Report of Education Commission, 1964-66).
For secondary education, a new mission along the lines of SSA was suggested in
2005. Accordingly, a centrally sponsored scheme, Rashtriya Madhyamik Shiksha
Abhiyan (RMSA) has been launched to universalise access to and improve quality of
education at the secondary level. It aims at universal access to secondary level edu-
cation by 2017 and universal retention by 2020 (MHRD, 2009). There are about 44
thousand existing secondary schools and the target for 2011-2012 is opening 11
thousand new secondary schools.
The centrally sponsored scheme of vocationalisation of secondary education at the
+2 level is being implemented since 1988. It provides for diversification of educa-
tional opportunities so as to enhance individual employability, reduce the mismatch
between demand and supply of a skilled workforce and provides an alternative for
those pursuing higher education. Vocational education falls under the purview of
MHRD and the All India Council for Vocational Education under it is responsible for
planning, guiding and coordinating the programme at the national level. At the state
level, similar functions are performed by the State Councils for Vocational Education.
Courses fall under the following six disciplines:
i) Agriculture (e.g.veterinary pharmacist/technician; watershed management)
ii) Business and Commerce (e.g. taxation practices, stenography)
11
iii) Humanities (e.g. classical dance, entrepreneurship)
iv) Engineering and Technology (e.g. lineman, cost effective building technology)
v) Home Science (e.g. textile design, gerontology)
vi) Health and Para-medical skills (e.g. x-ray technician, health/sanitary inspec-
tor).
(Draft paper of The World Bank, 2006)
Contrary to the NPE 1986 goal of achieving 25 percent of the +2 enrolment in the vo-
cational stream by 2000, currently less than 5 percent choose this option (National
Curriculum Framework, 2005).
B. HIGHER EDUCATION
In its size and diversity, India has the third largest higher education system in the
world, next only to China and the United States. Higher education in India covers all
post-secondary education beyond class twelve in different subject areas including all
professional streams such as engineering and technology, medical, agriculture etc. It
comprises three levels of qualifications -Bachelor’s or undergraduate degree pro-
grammes, Master’s or post graduate degree programmes and the pre-doctoral and
doctoral programmes.
Although playing a critical role in knowledge generation and promoting India’s inte-
gration with the global knowledge economy and society, the enrolment rates at high-
er education at 11 percent are relatively small (The World Bank Report, 2009). . At
present, there are 504 Universities and university-level institutions (as on
31.12.2009) - 243 State Universities, 53 State Private Universities, 40 Central Uni-
versities, and 130 Deemed Universities, In addition, there are 25,951 colleges includ-
ing around 2,565 women colleges (MHRD, 2009).
Though there is no clear demarcation, the colleges mainly focus on undergraduate
education while the universities impart post graduate education and conduct re-
search. In addition, there are many institutions like the Indian Institutes of Manage-
ment (IIMs) that only award diplomas. These diplomas are however equated to de-
grees granted by the universities. Most universities and colleges offer multidisci-
plinary programmes, however, there are also some that are confined to a particular
12

discipline only – such as agriculture, law, technology, language, medical etc. There
are also open universities that offer distance education programmes only (Agarwal,
2006).
The Indian parliament has adopted major policy statements relating to higher educa-
tion and science and technology (S&T) development. These developments have
been largely guided by the Scientific Policy Resolution of 1958. The Technology Pol-
icy Statement was adopted by the Government in 1983, its basic objective being the
development of indigenous technology and efficient absorption and adaptation of im-
ported technology appropriate to national priorities and resources.
a) Technical Education
Technical Education has a vital role to play in human resource development of the
country by creating skilled manpower, enhancing industrial productivity and improv-
ing the quality of life. There are 65 centrally funded institutions for technology and
science education.
The fifteen Indian Institutes of Technology (IITs) are apex institutions for engineering
education and research. The main objective of IITs is to impart world – class educa-
tion in engineering and technology; to conduct research in the relevant fields, and to
further advancement of learning and dissemination of knowledge. These Institutes
also contribute significantly to education and research in basic sciences and human-
ities. The IITs offer undergraduate programmes in various branches of engineering
and technology; postgraduate programmes with specialization and Ph.D. pro-
grammes in various engineering and science disciplines, interdisciplinary areas; and
conduct basic, applied and sponsored research. There are four Indian Institutes of
Information Technology (IIITs) to develop manpower for different areas of the know-
ledge economy. The seventeen National Institutes of Technology (NITs) play a vital
role in creating the required technical manpower by providing undergraduate educa-
tion and training in different branches of engineering & technology. They also func-
tion as pace setters and provide academic leadership to the technical institutions in
their respective regions.
13

The oldest institute for science education, Indian Institute of Science (IISc), came
into existence in 1909 in Bangalore and has been engaged in higher learning and
advanced research in the fields of science and engineering. Since 2006, five new in-
stitutions devoted to science education and research, Indian Institutes of Science
Education and Research (IISER) broadly on the lines of IISc have been established.
These institutions are devoted to under-graduate and post-graduate teaching in sci-
ences in an intellectually vibrant atmosphere of research and make education and
career in basic sciences more attractive by providing opportunities in integrative
teaching and learning of sciences (Department of Higher Education, MHRD).
There are also autonomous institutions of higher education in the field of science and
technology.
SCHOOLING (AND RELATED INDICATORS)
Within the pattern of school education outlined in table 2, there is great variation in
terms of the types of schools that exist in India. While no single scheme of classifica-
tion can portray the complete variety, table 3 below is one of several ways of under-
standing types of schools: how they are managed, the geographical areas in which
they operate, and the kinds of students they cater to. For elementary education en-
rollment by type of school, see table 4.
Type of management
Geographical scope Students catered to
Government • Central
• State
i) Urban (Kendriya Vidyalayas), ii) Rural (Navodaya Vidyalayas, residential)
i) Urban and rural ii) Tribal areas (Ashram Shalas, residential)
i) Children of transferablecentral government employees (including defence and para-military personnel)ii) Talented rural children
Municipal Cities Underprivileged children of different linguistic communities
Private • Aided (by
Govt.)
• Unaided
• Urban and rural
• Primarily urban
• Privileged and underprivileged children
• Primarily children of the elite
Table 3: Types of schools in India by management, geographical scope and student population.
14

Percentage enrolment in schools (2008-09)
CLASSES I –VIII
All Government Managements
Private Aided Managements
Private Unaided Managements
Private Managements
70.96 9.41 19.60 29.01Table 4: Student enrolment in elementary schools by management.Source: DISE Flash Statistics 2008-2009.5
There are also schools run by the Central Tibetan Schools Administration6 and public
sector companies such as the Atomic Energy Commission for the children of their
staff. In metropolises like Delhi and Mumbai there are schools run by international
embassies. A number of children are also enrolled through correspondence courses
to the National or State Open Schools (NOS or SOS)7.
Since the advent of Muslim rule, Islamic religious institutions known as maktabs and
madrassas were established in different parts of the country. There are a total of
1,823 maktabs at the primary level following the system of general education, 190 at
the upper primary level, 54 at the secondary level and 18 at the higher secondary
level. The corresponding figures are higher for madrassas: 4,589 at the primary
level, 2,102 at the upper primary level, 651 at the secondary level, and 204 at the
higher secondary level. At all levels, majority of maktabs and madrassas are in the
rural areas. However, there are also maktabs (6,019) and madrassas (11,523) that
do not follow the system of general education.
According to the Sachar Committee Report (2006), 1.1 million boys and just under 1
million girls attended madrassas in 2002 (p. 293), with over 70 percent of these be-
ing at the primary level. The general misconception “that a large majority of children
from Muslim families are enrolled in madrassas is in part because of the tendency of
5 The Flash Statistics: 2008-09 is based on the data received from as many as 1.29 million schools spread over 633 districts across 35 States & UTs. 6 Central Tibetan Schools administration is an autonomous organization under MHRD, Government of India established in 1961 with the objective to establish, manage and assist schools in India for the education of Tibetan children living in India while preserving and promoting their culture and heritage. 7 The National Institute of Open Schooling (NIOS) with current enrolment of about 1.3 million students at Secondary and Senior Secondary stage is the largest open schooling organisation in the world. To meet the regional diversity, State Open Schools (SOSs) have come up in 11 states, with 8 more states in the process of setting them up.
15

the general population to consider madrassas and maktabs to be one and the same.
A large proportion of the children who go to maktabs to learn to read and recite the
Qu’ran are also enrolled full time in regular mainstream schools” (Nair, 2009). Ac-
cording to the Sachar report, “Aided madrassas are often the last recourse of
Muslims especially those who lack the economic resources to bear the costs of
schooling, or households located in areas where ‘mainstream’ educational institu-
tions are inaccessible” (2006, p.78).
CO-EDUCATION
Although no clear statistics are available, co-education schools are more in number
than single-sex schools across the country.
ACCESS
Over 98% of the children are estimated to have access to primary schooling within
one kilometer of their habitation, and almost 92% to an upper primary school within
three kilometers of their habitation.
One of the largest groups that are still outside the general education system are chil-
dren with disabilities. The Integrated Education for the Disabled Children (IEDC), a
centrally sponsored scheme, is currently implemented in States and UTs in over
90,000 schools benefitting over 200 thousand children with disabilities. SSA supports
inclusion of children with special needs at the early childhood education and elemen-
tary education level and therefore another centrally sponsored scheme recently en-
visaged for disabled children at the secondary stage is the Inclusive Education of the
Disabled at Secondary Stage (IEDSS). It aims to: i) enable all students with disabili-
ties completing eight years of elementary schooling an opportunity to complete four
years of secondary schooling (classes IX to XII) in an inclusive and enabling environ-
ment, ii) to provide educational opportunities and facilities to students with disabili-
ties in the general education system at the secondary level (classes IX to XII), and iii)
to support the training of general school teachers to meet the needs of children with
disabilities at the secondary level (Department of Secondary Education, MHRD).
16
ENROLMENT
Gross enrolment ratios have increased significantly across all social categories, drop
out rates at primary level have declined, and transition from primary to upper primary
stage has improved. The Gross Enrolment Ratio (GER)8 at primary level, based on
the District Information System of Education (DISE) data for 2008-09 is estimated to
be 115.31 percent, corresponding to 98.59 percent of the Net Enrolment Ratio
(NER)9. In upper primary classes too, GER has shown consistent increase; from a
low of 37.72 million in 2004-05 to 53.35 million in 2008-09 (GER 73.74 percent).
At the primary level, the share of SC and ST enrolment with respect to total enrol-
ment is 19.94 percent and 11.68 percent respectively. At the elementary level, the
share of OBC is 42.26 percent; the share of Muslim enrolment is 10.49 percent,
(NUEPA, 2010).
The GER at the secondary and higher secondary level during 2007-08 was 45.5 per-
cent. In absolute terms, the secondary and higher secondary enrolment were 28.22
and 15.94 million respectively. The dropout rate is 56.8 percent by the time students
reach the level of qualifying examination at the end of Class X (MHRD, 2010).
GENDER ISSUES
Gender Parity Index (GPI)10 and percentage of girls' enrolment in primary and upper
primary classes reveal that there is improvement both in GPI and girls' share in en-
rolment. The average of 633 districts in 2008-09 indicates a GPI of 0.94 in primary
classes and 0.91 in case of upper primary classes. At the elementary level of educa-
tion, enrolment of SC, ST, OBC and Muslim girls is similar, standing at 48.09%,
48.01%, 48.22%, and 49.2% respectively.
The National Programme for Education of Girls for Elementary Level (NPEGEL), a
distinct component of SSA was launched in September 2003. It provides additional
8 Total enrolment in a specific level of education, regardless of age, expressed as a percentage of the eligible official school-age population corresponding to the same level of education in a given school year.9 Total enrolment of the official age for a given educational level expressed as a percentage of the corresponding population.10 An index designed to measure the relative access to education of males and females, calculated as the quotient of the number of females by the number of males enrolled in a given stage of education (primary, secondary, etc.).
17
provisions for enhancing the education of underprivileged/disadvantaged girls at the
elementary level through the development of model schools in clusters, gender sens-
itisation of teachers, development of gender sensitive learning materials, and provi-
sion of need-based incentives like escorts, stationery, work books and uniforms etc.
Kasturba Gandhi Balika Vidyalaya (KGBV), a scheme for setting up residential
schools at upper primary level for girls belonging predominantly to the SC, ST, OBC
and Minority Communities was launched in 2004. The scheme is being implemented
in educationally backward blocks of the country where the female rural literacy is be-
low the national average and gender gap in literacy is above the national average.
A “National Scheme of Incentive to Girls for Secondary Education” was launched in
June 2008, to provide a onetime incentive mainly to eligible girls belonging to SC/ST
communities to continue secondary education.
Toilet facilities for girls are available in only 53.6% of all schools; even less so in
primary schools (44.37%).
MEDIUM OF INSTRUCTION
Some multilingual states have introduced as a state policy bilingual education in
which a developing language in a region is used as a partial medium, together with
English, Hindi, or the neighbouring regional language as the major medium. Tribal
populations in some states have been introduced to bilingual schooling; various mi-
nority communities, particularly in urban areas, also prefer bilingual media. The pol-
icy of bilingual media is, for the most, not encouraged in 'prestigious' institutions; yet
in actual practice code-switching and hybridization of two or more contact languages
in informal teaching settings is common. There are also multilingual institutions with
multilingual teachers catering to the needs of diverse populations in every state.
Many minority institutions in every state impart education through minority lan-
guages, and/or pan-Indian languages like English and Hindi.
18
Though many states have a policy of promoting the use of mother tongue as medium
of instruction, many students experience shift in language medium at one or another
stage of their educational career, depending upon the context, domain, and channel
- Passive and active media: Students listen to lectures in one language and write an-
swers in another.
- Formal and informal media: Formal teaching in the classroom is conducted in one
language, but informal explanations are provided in another language.
- Multi-tier media: Elementary education is initiated through mother tongue as the
preparatory medium, but when a student moves upward in the education ladder, he
has to shift to a more cultivated medium (Khubchandani, 2008, p. 378-379.).
The mother tongue is the medium of instruction in 92.07% schools at the primary
stage and 91.95% schools teach two or more languages. At upper primary stage,
90.61% schools follow the three-language formula. At secondary stage 84.86%
schools follow the three-language formula. Teaching of English is compulsory in all
the States/UTs, except Bihar. However, the classes in which teaching of English is
compulsory differs from State to State. In general, it is compulsory in Classes VI-X
in most of the States/UTs. The demand for English is rapidly increasing across the
country. At the primary stage, 87.49% schools teach English and 59.70% schools
teach Hindi. However, English as medium of instruction is used in only 12.98%
schools at the primary stage, 18.25% schools at the upper primary stage, 25.84%
schools at the secondary stage and 33.59% schools at the higher secondary stage.
LIBRARY FACILITIES
Less than a million schools (70 thousand as per the 7th AISES11) have a library. Of
these, about 9 thousand have a full or part-time trained librarian and almost half the
number of schools has less than 500 books in the library.
COMPUTER FACILITIES
Only 14.12% of all schools have computer facilities. Less than 30 percent of sec-
ondary schools have computer education, and about 18 percent have adequate
number of computers. 35.56% of all schools have electricity connection.
11 All India School Education Survey
19

SCIENCE LABORATORIES
Approximately 58 percent of secondary schools in the country have a science labo-
ratory, but only about 38 percent have an adequate science laboratory.
AGENCIES RESPONSIBLE FOR EDUCATION, CURRICULUM DEVELOPMENT AND
TEACHER TRAINING
The Departments of School (Elementary and Secondary) Education and Higher
Education are under the charge of the (MHRD) of the Central Government. The
purpose of keeping the Departments of Education as part of the MHRD is to ensure
that education does not operate in isolation but functions as an integral component
of the total system which has the development of human resources as the overall
objective.
The organisation and structure of education are largely the concern of the
States/UTs. In some of the States, local self-government bodies, namely, Panchayat
Samitis in rural areas and Municipal Corporations in urban areas are also associated
with school education in order to make the system of administration sensitive to local
conditions and also to facilitate community participation. State governments continue
to hold the major responsibility of administering and financing of higher education,
but are, by and large, required to operate through universities and other autonomous
institutions which essentially function according to the guidelines laid down by the
University Grants Commission12. In other words, while school education is mainly a
local-State partnership, higher education operates as an area of Centre-State
partnership (NIEPA, 1988).
Actions related to education at the national level including planning and policy-mak-
ing are guided and coordinated by CABE. There are also national level institutions
specialising in particular aspects of education which assist and advise the Central
Government in the formulation and implementation of policies and programmes in
the respective areas. The National University of Educational Planning and Adminis-
tration (NUEPA) assists the MHRD in its efforts to strengthen and improve educa-
tional planning and administration in the country. The National Centre of Educational
12 A statutory body of the Government of India which coordinates, determines and maintains standards of university education in India.
20

Research and Training (NCERT) assists and advises the MHRD and State govern-
ments in formulation and implementation of policies and programmes and innova-
tions in the field of school education and teacher education.
CURRICULUM DEVELOPMENT
There are various curriculum bodies governing school education. The States have
autonomous examination boards to determine the curricula and examination pattern
at both secondary and higher secondary levels. The State Council of Educational
Research and Training (SCERT) are usually responsible for developing the syllabi
and textbooks at the elementary level. In addition, there is:
ι ) Central Board of Secondary Education (CBSE) which affiliates institutions at
secondary and higher secondary education levels from all over the country for
the purpose of examinations. The Board also prescribes courses and syllabi,
organises orientation programmes and undertakes development and
publication of textbooks, when found necessary.
ι ι ) Council for the Indian School Certificate Examinations (CISCE), a non-
governmental board of school education.
ι ι ι ) National Institute of Open Schooling Board (NIOS)
ι ϖ ) Islamic schools, whose boards are controlled by local state governments, or
autonomous, or affiliated with Darul Uloom Deoband.
ϖ) International schools affiliated to the International Baccalaureate Programme
and/or the Cambridge International Examinations.
ϖ ι ) Autonomous schools like Woodstock School and Auroville.
As an apex national agency of education reform, NCERT is assigned the role of
preparing and reviewing the school curriculum. Following the National Policy on
Education 1968, it has prepared roughly after every decade, a National Curriculum
Framework (NCF) for school education. However, NCERT is not a syllabus
prescribing authority.
HISTORICO-POLITICAL DEVELOPMENT OF NCF
In 1975, NCERT brought out the Curriculum for the Ten Year School: A Framework
which for the “sake of uniformity of standards and of national identity” strived to “de-
velop a common curriculum within a broad framework of acceptable principles and
21

values.” Curriculum was defined as “the sum total of all the deliberately planned set
of educational experiences provided to the child by the school. As such it is con-
cerned with:
i) the general objectives of education at a particular stage or class
ii) subject-wise instructional objectives and content
iii) courses of studies and time allocation
iv) teaching-learning experiences
v) instructional aids and materials
vi) evaluation of learning outcomes and feedback to pupils, teachers and par-
ents.”
However, its implementation remained uneven on account of two primary reasons: i)
a comprehensive plan to link the curriculum changes with the processes of teaching
and learning, teacher training and examination reform was lacking, and ii) there were
widespread disparities in the physical and human resources necessary for effective
transaction of the curriculum in schools. The mismatch between the curriculum ob-
jectives and the actual curriculum transaction in the classroom led to disparities in
the levels of attainment of pupils and in the standard of education among schools in
different parts of the country.
Following the document brought out in 1975, the Council's work culminated in the
National Curriculum for Elementary and Secondary Education: A Framework, 1988
(NCF 1988). A national system of education evolved, its most salient features being:
provision of equal educational opportunity to all, not only in terms of access to
educational facilities, but also in the conditions for success; a common 10+2+3
structure of education; and introduction of norms of minimum levels of learning for
each stage of education. Some of the main thrusts of the curricular framework were
broad-based general education to all learners at the elementary (primary and upper
primary) secondary stages; a common scheme of studies for elementary and
secondary stages; emphasis on defining Minimum Learning Outcomes for each area
of learning at all stages of education; provision for flexibility in terms of selection of
content/components and learning experiences which would facilitate the attainment
of minimum learning outcomes laid down for each stage of school education;
emphasis on child-centred and activity-based processes rather than the teacher-
centred approach during the transaction of curriculum; and provision of essential
22

facilities for effective transaction of curriculum in all schools/non-formal learning
centres.
In January 2000, a Discussion Document on National Curriculum Framework for
School Education was released by NCERT. The new curriculum framework sparked
off a fierce debate and was discussed among intellectuals, educationists, teachers,
professional organisations including parent-teacher associations, and other voluntary
organisations. Introduction of a spiritual quotient, education about religions, value
based education, teaching of Sanskrit, an emphasis on the 'traditional' social order
and its values, and a Hindutva brand of science were all seen as attempts at
“saffronisation”13 of education by the Bhartiya Janata Party, the dominant centre-right
political party in the National Democratic Alliance-led government of that time. In
August 2001, education ministers of nine non-BJP states came together at a
National Convention against Saffronisation of Education to sign a statement calling
for withdrawal of the National Curriculum Framework 2000.
Currently, National Curriculum Framework 2005 guides school education. The aims
of education, as stated within NCF2005, serve two major purposes; to reflect collec-
tive socio-political aspirations of the whole society and to serve a significant peda-
gogical purpose of providing direction to the teacher in choice of content and meth-
ods of education.
The nine main areas relevant for curricular planning are i) Language, ii) Mathemat-
ics, iii) Science, iv) Social Science, v) Art Education, vi) Heath and Physical Educa-
tion, vii) Work and Education, viii) Education for Peace, and ix) Habitat and Learning.
A total of 21 Position Papers—on each of the curricular areas with a focus on peda-
gogy—as well as on related issues such as Aims of Education, Educational Technol-
ogy, Teacher Education, Gender Issues, and Examination Reforms amongst others,
have been prepared by National Focus Groups (NFG) that were set up for this pur-
pose. The NFG on Curriculum, Syllabus, and Textbooks recommends a curriculum
framework which is neither a document nor a sequence of experiences, but rather a
plan of facilitating learning for the child. 13 A political neologism (derived from the saffron robes of the Hindu clerics), used to refer to the policy of right-wing Hindu nationalism (or Hindutva) which seeks to make the Indian state into a "Hindu nation" (Wikipedia)
23
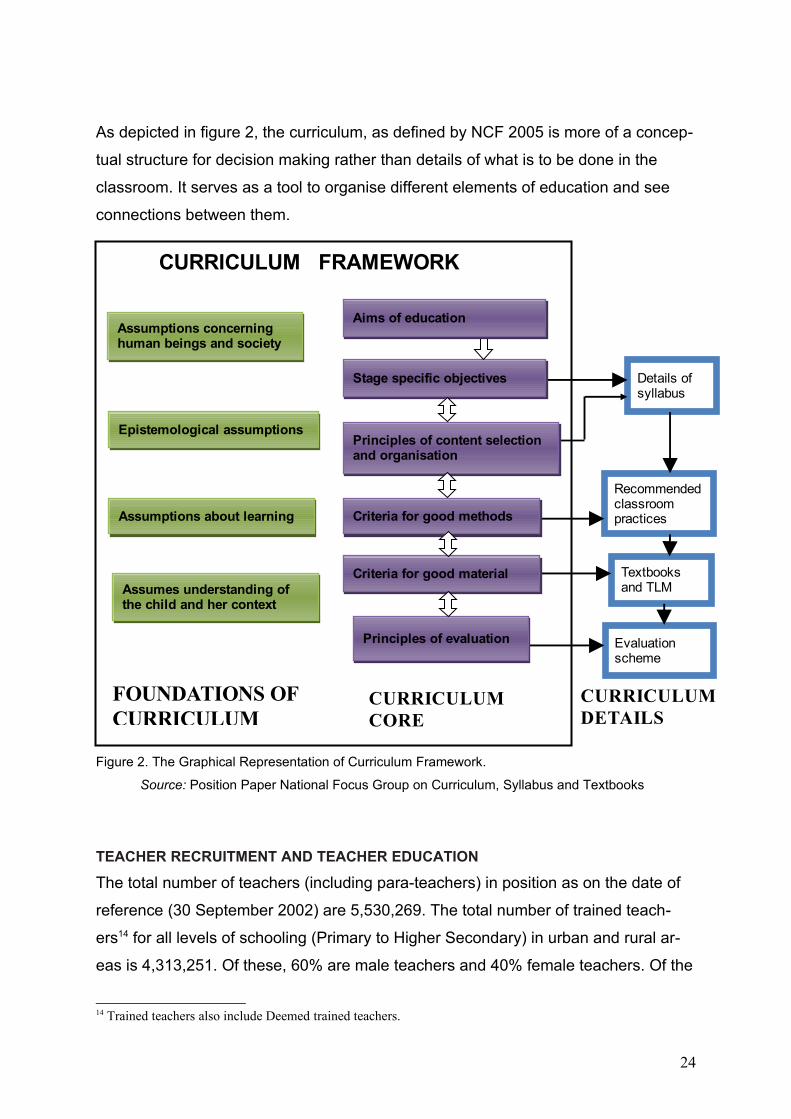
As depicted in figure 2, the curriculum, as defined by NCF 2005 is more of a concep-
tual structure for decision making rather than details of what is to be done in the
classroom. It serves as a tool to organise different elements of education and see
connections between them.
Figure 2. The Graphical Representation of Curriculum Framework.
Source: Position Paper National Focus Group on Curriculum, Syllabus and Textbooks
TEACHER RECRUITMENT AND TEACHER EDUCATION
The total number of teachers (including para-teachers) in position as on the date of
reference (30 September 2002) are 5,530,269. The total number of trained teach-
ers14 for all levels of schooling (Primary to Higher Secondary) in urban and rural ar-
eas is 4,313,251. Of these, 60% are male teachers and 40% female teachers. Of the
14 Trained teachers also include Deemed trained teachers.
24
CURRICULUM FRAMEWORK
Assumptions concerning human beings and society
Epistemological assumptions
Assumptions about learning
Assumes understanding of the child and her context
FOUNDATIONS OF CURRICULUM
Details of syllabus
Recommended classroom practices
Textbooks and TLM
Evaluation scheme
CURRICULUM DETAILS
Stage specific objectives
Principles of content selection and organisation
Criteria for good methods
Criteria for good material
Principles of evaluation
CURRICULUM CORE
Aims of education

trained teachers, 22% have studied up to secondary level of schooling or less, 55%
are either graduates or have completed higher secondary level of schooling, and
23% are post graduates. The total number of untrained teachers are 1,000,569. Of
these, 62% are male and 38% are female.
The National Policy on Education 1986 stated that improvement in status and profes-
sional competence of teachers is cornerstone of educational reconstruction. It em-
phasised the significance and need for a decentralised system for the professional
preparation of teachers. The Centrally Sponsored Scheme of Restructuring and Re-
organisation of Teacher Education was put in place proactively by the Central Gov-
ernment in the 8th plan (1992-1997) with the establishment of District Institutes of Ed-
ucation and Training (DIETs) for elementary teacher education, and Institutes of Ad-
vanced Studies in Education (IASEs) and Colleges of Teacher Education (CTEs) for
secondary stage teacher capacity building. Since the 1990s, further decentralization
has led to the formation of Block Resource Centres (BRCs) and Cluster Resource
Centres (CRCs). By 2005, 500 DIETs, 87 CTEs, 38 IASEs and 30 SCERTs had
been set up as teacher education resource institutions in the country.
The Centrally Sponsored Scheme of Restructuring and Reorganisation of Teacher
Education of 1986 aimed at providing academic resource support to elementary and
secondary teachers through training, action research and experimentation, and de-
veloping institutional infrastructure for pre- and in-service training. The implementa-
tion of the Scheme in achieving the basic objectives of Teacher Education has been
uneven across States/UTs. There has been variation in quality of performance even
within a state/UT. Most of the CTEs and IASEs have not been able to undertake the
teacher education programme as comprehensively as the DIETs have been able to
at the elementary stage (NCERT, 2009).
The National Council for Teacher Education (NCTE) came into existence as a statu-
tory body in 1995 as a first step for overhauling the system of teacher education. It
has four regional committees to look after its statutory responsibilities. The main ob-
jective of the NCTE is to achieve planned and coordinated development of the
teacher education system throughout the country, the regulation and proper mainte-
25
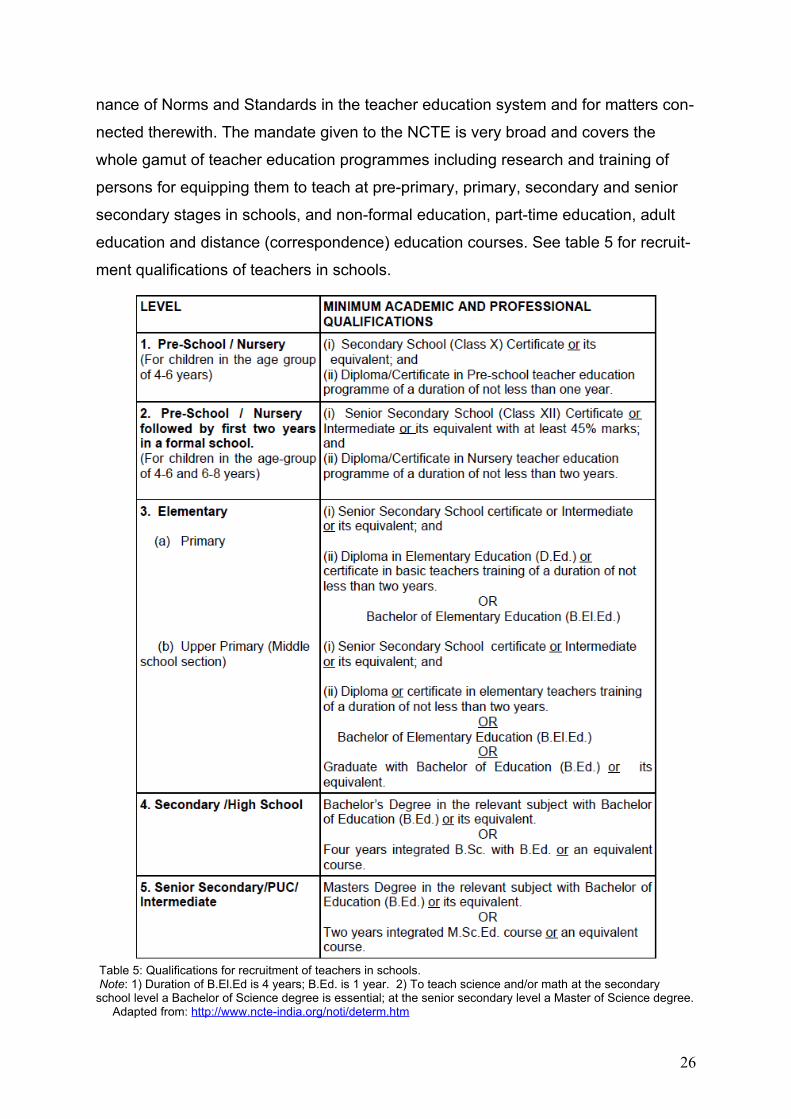
nance of Norms and Standards in the teacher education system and for matters con-
nected therewith. The mandate given to the NCTE is very broad and covers the
whole gamut of teacher education programmes including research and training of
persons for equipping them to teach at pre-primary, primary, secondary and senior
secondary stages in schools, and non-formal education, part-time education, adult
education and distance (correspondence) education courses. See table 5 for recruit-
ment qualifications of teachers in schools.
Table 5: Qualifications for recruitment of teachers in schools. Note: 1) Duration of B.El.Ed is 4 years; B.Ed. is 1 year. 2) To teach science and/or math at the secondary school level a Bachelor of Science degree is essential; at the senior secondary level a Master of Science degree. Adapted from: http://www.ncte-india.org/noti/determ.htm
26

The UGC, in order to ensure effective region-wise coverage throughout the country,
has decentralised its operations by setting up six regional centres. Its mandate in-
cludes determining and maintaining standards of teaching, examination and re-
search in universities. The National Educational Testing Bureau of the UGC con-
ducts the National Eligibility Test (NET) to determine eligibility for lectureship and for
award of Junior Research Fellowship (JRF) for Indian nationals in order to ensure
minimum standards for the entrants in the teaching profession and research. The
Test is conducted in Humanities (including languages), Social Sciences, Forensic
Science, Environmental Sciences, Computer Science and Applications and Electron-
ic Science. The Council of Scientific and Industrial Research (CSIR) conducts the
UGC-CSIR NET for other Science subjects, namely, Life Sciences, Physical Sci-
ences, Chemical Sciences, Mathematical Sciences and Earth Atmospheric Ocean &
Planetary Sciences jointly with the UGC.
SCIENCE EDUCATION SYSTEM
The constitutional amendment of 1976 placed education including science and
technology education in the concurrent list which implies the joint responsibility of the
central and the state governments. The Ministry of Human Resource Development
functions as an administrative ministry and the UGC and the All India Council for
Technical Education were established to superintend the functioning of higher
education in science and technology respectively.
SCHOOL LEVEL
Based on the recommendations of NPE1968, science and mathematics were made
compulsory subjects, for the first time, for all pupils as part of general education dur-
ing the first ten years of schooling. The next national policy on education (NPE1986)
reaffirmed the need for science and mathematics to be compulsory subjects during
the first ten years of schooling. The science syllabus and textbooks are prescribed
by respective state curriculum agencies and therefore the content and process of
teaching science varies from state to state.
27

The general objectives of science teaching identified for Classes I-VIII during the
1960s have guided the evolution of science education in the country, especially at
the elementary level. The two major objectives have been:
1) To acquire knowledge of biological, physical and material environments in-
cluding forces of nature and simple natural phenomena, and
2) To develop scientific attitudes such as objective outlook, spirit of enquiry,
truthfulness and integrity, inventiveness, accuracy and precision, avoiding
hasty conclusions on insufficient data, respect for the opinion of others.
SCIENCE CURRICULUM
Some of the main recommendations of NCF 1975 have had a direct bearing on the
teaching of science, its syllabi and textbooks. For Classes I-V (primary level), sci-
ence and social sciences are taught as a single subject, Environmental Studies
(EVS). For Classes I and II, there is only a Teacher's Guide; no textbooks for the stu-
dents. Classes I and II look at both the natural and social environment and in
classes III-V these are separated into general science and social studies respectively
with separate textbooks for each. For Classes I-V, concepts are introduced in a
graded manner through a set of common EVS themes which allow for an intercon-
nected understanding to develop.
At the upper primary level, the approach to teaching science is integrated rather than
disciplinary to emphasise the unified nature of science. The curriculum attempts to
link the teaching of scientific principles with daily life experiences of the learners; the
focus is more on the process of science than product.
According to NCF 2005, at the primary stage the child should be engaged in joyfully
exploring the world around it. The objectives at this stage are to nurture the curiosity
of the child about the world (natural environment, artifacts and people), to have the
child engage in exploratory and hands on activities to acquire the basic cognitive and
psycho-motor skills through observation, classification, inference, etc.; to emphasise
design and fabrication, estimation and measurement as a prelude to development of
technological and quantitative skills of later stages; and to develop the basic lan-
guage skills: speaking, reading and writing not only for science but also through sci-
ence. Science and social science should be integrated as Environmental Studies as
28
is at present, with health as an important component. Throughout the primary stage,
there should be no formal periodic tests, no awarding of grades or marks, and no de-
tention.
The syllabus has been developed with a child-centred perspective of themes drawn
from issues in social studies, sciences and environmental education. The syllabus
for Classes III-V is woven around six common themes: Family and Friends; Food;
Shelter; Water; Travel; and Things we Make and Do. The first theme encompasses
four sub-themes: Relationships, Work and Play, Animals, and Plants. The syllabus is
framed within a social constructivist perspective of learning and each theme is pre-
sented as a matrix consisting of leading questions, key concepts, suggested re-
sources and activities. See figure 3 on the following page for an illustration of this.
At the upper primary stage the focus is on students learning principles of science
through familiar experiences, working with hands to design simple technological
units and modules (e.g. designing and making a working model of a windmill to lift
weights) and continuing to learn more about environment and health through activi-
ties and surveys.15 Activities and experiments are the primary means for students to
acquire scientific concepts. Important components of pedagogy include group activ-
ity, discussions with peers and teachers, surveys, organisation of data and their dis-
play through exhibitions, etc. in schools and neighbourhood.
At the secondary stage the students are engaged in learning science as a composite
discipline16, in working with hands and tools to design more advanced technological
modules than at the upper primary stage, and in activities and analysis on issues
surrounding environment and health. Systematic experimentation as a tool to dis-
cover/verify theoretical principles, and working on locally significant projects involving
science and technology are important parts of the curriculum at this stage.
15 A new feature of NCF 2000 was teaching of ‘Science and Technology’ in place of ‘Science’ at the upper primary and secondary stages, so as to familiarise all learners with variousdimensions of scientific and technological literacy, and offer something of value to all students. 16 Majority of the students are not likely to take up careers as scientists or technologists and so it is important that the science curriculum is oriented towards developing awareness about the interface of science, technology and society.
29

At the higher secondary stage science is introduced as separate disciplines (phyiscs,
chemistry, biology) and is expected to emphasise experiments, technology, inves-
tigative projects, historical development of key concepts of science, and awareness
of conceptual pitfalls.
Fig. 3.Framing of the EVS syllabus (primary level)
Source: NCERT
30

INSTRUCTIONAL TIME
Time allocation to subjects at the primary, upper primary and secondary stages was
discussed by NCF 1988: the instructional time at the primary stage for math and
science was 15 percent each; at the upper primary and secondary stages
respectively, 12 percent to math and 13 percent to science (see figure 4). In most
curricular documents, a period has been presented as a basic unit of 45 minutes of
teaching-learning in a timetable. Frequently, this is compromised into 30 or 35
minutes. A period can, in general, serve as an organisational unit for many text-
based lessons. The number of periods for each theme is specified in the upper
primary and secondary syllabus for science (e.g. 20 periods for the theme Food, 26
periods for the theme Materials).
Fig. 4. Time allocation to subjects at the primary, upper primary and secondary stages of schooling.
Source: NCF 1988. http://www.education.nic.in/cd50years/q/91/HL/91HL0405.htm
31

STUDENTS’ ATTITUDES TOWARDS SCIENCE EDUCATION
The first India Science Report (2005, p.ii-iii)17, reported the following on (school) stu-
dents’ attitude towards science education:
Mathematics remains the most preferred subject, with a third of students in
classes six to eight rating it as number one; over 21% in classes 11 and 12
rate it similarly. Subjects like Physics, Chemistry, and Biology are rated as the
top subjects in classes 11 and 12 by about 30% of the students. This figure is
triple that for students in classes six to eight suggesting that the attraction for
science subjects increases dramatically in the higher classes in school (see
table 6).
• At the class six to eight level, 22% of the students said they would like to
study pure science at higher levels of education. Yet, only 13.4% of the stu-
dents in class 11 and 12 wanted to study pure science at the graduate/post-
graduate level (see figure 5).
• The interest in all types of science education does not decline much — 60%
of the students at the class six to eight level said they wanted to pursue some
science education (pure science, engineering or medicine) at a higher level as
compared to 57% students in classes 11 and 12.
• Over 40% of the students, whether in classes six to eight or 11 and 12,
wanted to become either an engineer or a doctor.
• While close to two–thirds of students in classes six to eight are satisfied with
the quality of science teaching, this falls to just 40% in classes 11 and 12.
• About 60–70% students are satisfied with the quality of teaching of most of
the subjects except computer science where just 15% of the students in gov-
ernment
schools are satisfied with the teaching as compared to 23% in private schools.
• Not too many students are keeping away from science deeming it a costly
subject to pursue. While ten per cent of the students cite this as the reason for
17 This report was commissioned by the Indian National Science Academy (INSA) to National Council of Applied Economic Research (NCAER). The results presented in this report are primarily based on information collected through an all India field survey called the “National Science Survey–2004” un-dertaken by NCAER and supplemented by information available from various reliable secondary sources such as the Census 1981, 1991 & 2001, National Sample Survey (NSS–1993–94 and 2000-01), Department of Science and Technology (DST), University Grants Commission (UGC), and Insti-tute of Applied Manpower Research (IAMR).
32

not having taken up science at the plus–2 level, 45% state they are not pursu-
ing science because they have no interest in science (see table 7).
• Parents and teachers play an important role in the selection of courses as well
as in deciding career choices.
• The three most preferred professions for students turn out to be teacher, doc-
tor and engineer.
• There is no decline in interest in the proportion of students who wish to study
science. A third of the students said they did not study science as they did not
feel motivated enough and another 40% said the number of students in a
class were too many for them to understand what was being taught.
Table 6. Favourite subjects by level of education (% of students).
Source: NCAER’s National Science Survey—2004
33
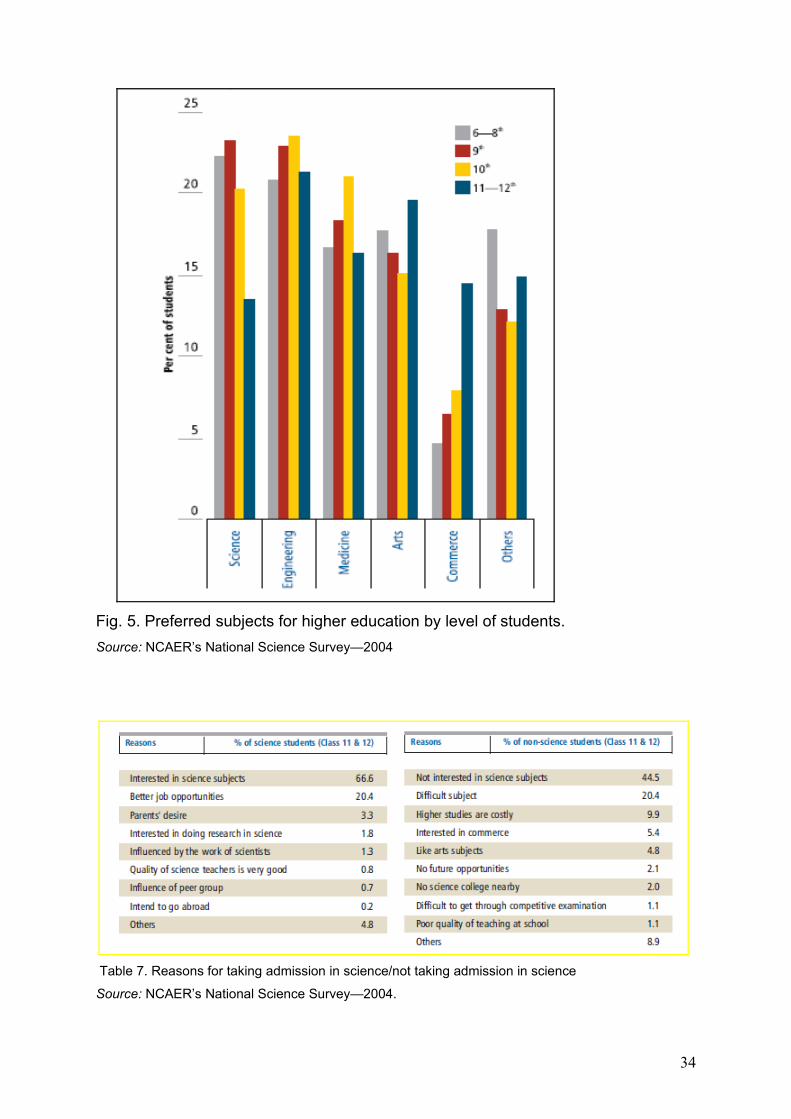
Fig. 5. Preferred subjects for higher education by level of students.
Source: NCAER’s National Science Survey—2004
Table 7. Reasons for taking admission in science/not taking admission in science
Source: NCAER’s National Science Survey—2004.
34

HIGHER EDUCATION
“The most common pattern prevalent all over the country for post-school (10+2)
teaching programmes in basic sciences requires the students to go through a 3-year
B.Sc. course followed by a 2-year M.Sc. course before they can join a Ph.D. pro-
gramme.
The B.Sc. programmes offered in different central/state/private universities have sev-
eral variations. Most of them follow the annual system, although a few have switched
over to the semester pattern. The B.Sc. (pass) degree typically involves study of a
pre-defined combination of three subjects in all the years, although in some cases
during the third year of B.Sc., only two subjects, out of the three studied earlier, are
taught. Several universities offer Honours at B.Sc.: in this case, the student studies a
pre-defined set of three subjects in the first two years and only one subject in the
third year for Honours (or Major) in that subject. In some universities, the Honours
subject is defined in the first year of B.Sc. itself such that the student studies three
subjects all through the three-year course but with greater emphasis on the subject
chosen for Honours. In yet another variation, some B.Sc. degrees involve study of
only one subject all through the three years.
In most of the universities, the three-subject combination at B.Sc. is compartmental-
ized among three major science streams, viz., the ‘Bio’ (or ‘Medical’) group, the
‘Maths’ or ‘Physics’ (or ‘non-Medical’ or ‘pure science’) group, or the ‘Geo’ group,
with little freedom for the students to learn across these groups. For example, those
opting for ‘Mathematics’ or ‘pure Science’ stream, study Physics, Chemistry and
Mathematics or Statistics or Computer Science but nothing of Biology while those
opting for the ‘Biology’ stream cannot study Physics, Mathematics, Statistics or Com-
puter Science etc.
On completion of the B.Sc. degree, the student seeks admission to the 2-year M.Sc.
(annual or semester) often with a specialization in the final year. A majority of the
M.Sc. courses are also confined to one subject only, with the possibility of a student
opting for a particular branch within the subject as ‘special paper’ or ‘major elective’.
Barring a few cases, there is hardly any avenue available for students to learn some-
thing outside the subject in which they qualify for the M.Sc. degree. In most cases,
35

there is only a little component of research in the M.Sc. curricula. Some institutions
have also started integrated M.Sc. – Ph.D. programme for B.Sc. degree holders, with
a provision for graduation with M.Sc. degree after successful completion of the
course work” (IAS-INSA-NAS report, 2008).
In 2004, about a quarter (22.3%) of the 39.2 million graduates had a background of
science education; about a fifth (19.4%) of the 9.3 million postgraduates and a third
of the 0.3 million doctorates were from the science stream. Of the total 'professional,
technical and related jobs', 29% are educated in science. Of the total graduates who
are unemployed, 22.3% have studied science. In the total unemployed
postgraduates, 62.8% are with science background (India Science Report, 2005).
SCIENCE AND TECHNOLOGY PERSONNEL in R&D
Of the 1,54,827 S&T personnel engaged primarily in R&D activities as on 1st April,
2005, academic qualifications were available with respect to 75 percent of them;
47.6 percent had an engineering and technology background 29.8 percent had a
background in natural sciences, 12.1 percent in agricultural sciences, 8.1 percent in
medical sciences and the remaining 2.4% in social sciences.
Of the 1,54,827 S&T personnel engaged in R&D, only 12.7 percent were females:
29.9 percent of them had a background in natural sciences, 39 percent in engineer-
ing and technology, 14.8 percent in medicine, 10.3 percent in agricultural sciences
and the remaining 6 percent in social sciences (Ministry of Statistics and Develop-
ment, 2009).
POLICY RECOMMENDED RESOURCES/OPPORTUNITIES
Improvement of Science Education in Schools: A centrally sponsored scheme to im-
prove the quality of science education and to promote scientific temper, became op-
erational in 1987-88. Under the scheme 100% assistance is provided to the
States/UTs for provision of science kits to upper primary schools, up gradation of sci-
ence laboratories and library facilities in senior/secondary schools and training of sci-
36
ence teachers. The scheme also provides for assistance to voluntary organizations
for undertaking innovative projects in the field of science education.
Kishore Vaigyanik Protsahan Yojana (KVPY): A programme started in 1999 by the
Department of Science and Technology (DST) to encourage students of Basic Sci-
ences, Engineering and Medicine at the higher secondary, undergraduate and
graduate levels to take up research careers in these areas. The aim of the pro-
gramme is to identify and encourage talented students with aptitude for research.
Learning Enhancement Programme: In 2009-2010, 28 States have been supported
through SSA for this programme which focuses on strengthening science and math
learning at the upper primary level.
Computer literacy and studies in schools (CLASS): A pilot project of the Department
of Electronics in collaboration with MHRD initiated in the school year 1984-85 was
modified and converted into a centrally sponsored scheme from 1993-94. The aims
of the projects were:
• To provide pupils with an understanding of computers and their use;
• To provide hands-on experiences;
• To ‘demystify’ computers to young school goers; and
• To familiarise pupils with a range of computer applications.
The government initiated the CLASS 2000 programme with the aim of providing
computer literacy in 10,000 schools, computer-assisted learning in 1,000 schools,
and computer-based learning in 100 schools. These hundred schools were called
SMART schools18 and were designed to be agents of change seeking to promote the
extensive use of computers in the teaching-learning process. As on 30th September,
2008, flash statistics for elementary education in India report that 14% schools have
a computer (NUEPA, 2010).
Computer Aided Learning (CAL): Under SSA, up to Rs. 5 million is available to each
district for strengthening computer aided learning in schools. Activities include
providing computer equipment or labs to schools, development of computer-based e-
18 A school in which at least one section (of 40 students) in each of the class IX-XII is fully computerized.
37

learning materials in local languages, and training of teachers in computer use often
with the help of private sector partners. Since the inception of the programme, about
67,000 schools have benefited, including 102.61 lakh children and 1.99 lakh teach-
ers who were provided with training in handling CAL resources.
ICT @ Schools: The centrally sponsored scheme was launched in December 2004
to provide opportunities to secondary stage students to mainly build their capacity in
ICT skills and make them learn through a computer-aided learning process. The
scheme serves as a major catalyst to bridge the digital divide amongst students of
various socioeconomic and geographical barriers. The scheme provides support to
States/UTs to establish enabling ICT infrastructure support in government and gov-
ernment-aided secondary and higher secondary schools. It also aims to set up
SMART schools in Kendriya Vidyalayas and Navodaya Vidyalayas to act as “Tech-
nology Demonstrators” and to lead in propagating ICT skills among students of
neighbourhood schools.
INSPIRE: A programme developed recently by the DST to attract talent to the excite-
ment and study of science at an early age. It has three components, aimed at stu-
dents in the age groups 10-15, 17-22 and 22-32.
i. Scheme for Early Attraction of Talent (SEATS) awards Rs 5000 to one million
young learners in the age group 10-15 years for a duration of five years to
study science. To experience the joy of innovations, annual winter and
summer camps are planned with global leaders of science for the top 1%
performers in the Class X Board exams.
ii. Scholarship for Higher Education (SHE) offers 10,000 scholarships every year
@ Rs 0.80 lakh per year to talented youth in the age group 17-22 years, for
undertaking Bachelor and Masters level education in Natural and Basic
Sciences. The main feature of the scheme is mentorship support through
summer attachment to performing researchers.
iii. Assured Opportunity for Research Careers (AORC) offers doctoral INSPIRE
Fellowship in the age group 22-27 years, in the both basic and applied
sciences (including engineering and medicine). It also aims to assure
opportunities for post-doctoral researchers through contractual and tenure
38

track positions for 5 years in both basic and applied sciences areas through
an INSPIRE Faculty Scheme.
Scheme for Providing Quality Education in Madrassas (SPQEM): This centrally
sponsored scheme was launched in 2009 through the National Institute of Open
Schooling to bring about a qualitative change in the education being imparted in
madrassas and maktabs and bring them into the mainstream of the national educa-
tion system. The measures include giving financial assistance to introduce science,
math, social studies, Hindi and English in their curriculum so that academic profi-
ciency for Classes I-XII is attainable for students studying in these institutions, as
well as providing in-service training to teachers appointed under this scheme to
teach modern subjects like science and improve their pedagogical skills. The
scheme aims to cover up to 6 thousand madrassas by 2012.
Out-of-school activities have been used innovatively by government institutions19 and
voluntary organisations20 independently and collaboratively to promote and popular-
ise science education.
Jawaharlal Nehru National Science Exhibition: is an annual event organised by
NCERT. The national level science exhibition is the culmination of a series of exhibi-
tions organised at school, district, regional and state level every year. With a view to-
wards improving educational facilities in rural areas and for economically weaker
sections of the society, the main theme of national and state-level science exhibi-
tions reflect the felt needs of rural India. The social aspect of science and relevance
of science and technology for development also are criteria, which are given consid-
eration in determining the themes.
Science Museums: NCSM contributes to science education of children through its
four museums located at Calcutta, Bangalore, Mumbai and Delhi. It also utilises a
number of regional centres situated in different parts of the country to organise activ-
19 The NCERT, the Department of Science & Technology (DST), the National Council of Science Museums (NCSM), the National Council for Science and Technology Communication (NCSTC)20 Vikram A. Sarabhai Community Science Centre (VASCSC), Ahmedabad; Homi Bhabha Centre of Science Education (HBCSE), Mumbai
39

ities like demonstration lectures, mobile science exhibitions for rural schools, science
quiz shows, science seminars, and science fairs. NCSM has set up 301 school sci-
ence centres across several states.
Children’s Science Congress: is an annual event organised by the NCSTC. Children
in the age group of 10-17 years work on scientific projects related to local issues, un-
der the supervision of the teachers/science activists and report their findings at
school/block or district level Congresses (Rajput and Srivastava, 2005).
National Science Day: is another initiative of the NCSTC, observed every year on
February 28 to celebrate the discovery of Raman Effect by the Indian Physicist Sir C.
V. Raman on 28th February, 1928. Various programmes ranging from a day to a full
month either begin or culminate on February 28. The activities, centred around a
theme selected for the year, include debates, quiz competitions, exhibitions, lectures
and involve college and school students and teachers.
Exploratory: is a science centre developed at Pune where school and college chil-
dren can explore and experiment, invent and innovate, and design and fabricate. Its
vision is that very young children aspire to become scientists. There are no teachers
in the Exploratory but highly experienced guides who explore along with the students
the basic concepts in science through carefully designed activities. The purpose is to
enable children to learn science by participating in the process of science. The ex-
ploratory promotes keen and careful observation, excites curiosity, encourages chil-
dren to ask questions, question the answers and enables them to generalize and dis-
cover. The formal system of science education has not yet adopted the exploratory
way of learning science (INSA, 2001).
40

Section 2 STATE OF THE ART - SCIENCE EDUCATION AND DIVERSITY WITHININTERNATIONAL ACADEMIC LITERATURE
The chapter on Science Education in the Sixth Survey of Educational Research
(1993-2000) reveals the paucity of research in the field of science education, particu-
larly school science education. As few as 120 studies featured across five science
education journals during this period. The focus of about a quarter of the studies was
on cognitive aspects of science (understanding of science, misconceptions of sci-
ence, cognition), and a third of the studies were on science teaching (science con-
tent, contexts of teaching, ethics in science, assessment, gender issues) and teach-
ing materials (curricula, science kits, software development). The other areas studied
were students' attitudes towards science, achievement in science subjects, creativity,
and environmental factors that influence the science learning (Chunawala, 2000).
In the Indian context, the issue of gender has received significantly greater attention
in research related to science education/careers in science as evidenced by the
studies/projects undertaken. A project undertaken by the Centre for Science Educa-
tion and Communication (New Delhi) jointly with UNICEF India and UNESCO New
Delhi on gender issues in school science was reported in 'How to make Science
more Friendly, particularly to Girls, within the framework of STL' (Mukherjee and
Varma, 2001). The primary activity of the project was to develop supplementary
teaching materials by teachers at workshops organised for this purpose, and to mod-
ify them after field trials in their own schools. The participation of women teachers
from government institutions and NGOs was sought; they were encouraged to reflect
on what makes science unfriendly to girls and design materials to rectify this.
Subrahmanyan (1995) explored two factors that contributed to the choice of science
as a specialisation by a group of academic women scientists at the University of
Madras in South India: the encouragement they received to pursue education to the
highest level, and the circumstances that led to their pursuit of science as a speciali-
sation. In spite of patrifocality, the reasons for the participants' choice of science
have been personal or school-related. An interesting challenge to patrifocality is in
the form of mentors and role models in schools and in work-places who are able to
41

help women focus their interest in science, and in some cases, even influence family
decisions in favour of girls and women.
Mukhopadhyay (2001) studied the cultural context of gendered science in India and
found that “patrifocality is only one major factor in student science-related academic
decisions.” Patrifocality intersects with socioeconomic factors and academic prereq-
uisites in affecting decisions to continue schooling as well as science-related
choices.
A study in 2004 to investigate factors which influence science career as a choice for
women scientists and post-graduate students (sample size 149 and 147 respec-
tively) revealed that the preferred choices tended to be biotechnology, microbiology
and the life sciences. As many as 90 percent of the scientists and students said the
choice of science as a career was an individual choice driven by personal motivation,
and most of them were encouraged by their teachers and parents. However, the mo-
tivation for girls and women in colleges in north India to pursue science at the higher
secondary level and subsequently at the graduate level was because it enhanced
their value in the marriage market! Girls were encouraged to take up science as it
added value, and was useful for them to teach children at home. Majority of the re-
spondents were educated in cities or towns suggesting that selective, privileged indi-
viduals opt for science (INSA, 2004).
Kurup, Maithreyi, Kantharaju, and Godbole (2010) conducted a survey to understand
the reasons for the loss of trained women scientists and to identify strategies and
provisions to retain them in Science. The survey was conducted across India with
568 women scientists and 226 men scientists who had a PhD in Science, Engineer-
ing or Medicine: either currently engaged in scientific research and teaching (55 per-
cent women, 71 percent men); or engaged in jobs other than scientific research and
teaching (32 percent women, 28 percent men); and even those who were currently
not working (13 percent women and 0.44 percent men).21
21 Data was reported with respect to four groups: Women in Research (WIR), Women Not in Research (WNR), Women Not Working (WNW), Men in Research (MIR).
42

The three groups among the women scientists – WIR, WNR, and WNW – differ in
their degree of perceptions of why women drop out of Science (see figure 6). Yet,
the majority in all three groups considers family commitment as the reason for
women to drop out of science.
Fig. 6. Women scientists’ reasons for why women drop out of science
Source: Kurup, Maithreyi, Kantharaju, and Godbole, 2010.
The majority of the MIR group also considers family commitment as the reason for
women dropping out of science. In contrast, the majority of WIR as well as MIR con-
sider the search for lucrative careers the reason for men to drop out of science.
The three groups of women scientists differ with respect to the provisions considered
important by them to retain women in science careers. All three groups are in agree-
ment about flexibility of timings being the most important provision. In addition, provi-
sions for transport and accommodation are important for the WIR group; better HR
policies for the WNR group; and child care facilities at the workplace for the WNW
group.
43

Section 3
Under review and dialogue between partner countries
Section 4
Barriers impeding and Factors facilitating Reform for Supporting Diversity
The heterogeneity of the country poses a formidable challenge to support diversity--
with a view to the larger goal of achieving equity. The NFG on the Teaching of Sci-
ence addressed this issue in their position paper. Quality science education “for all”
remains
an issue to be grappled with; many groups of students are in a disadvantageous po-
sition vis-a-vis the learning of science and exit the school system as 'scientific illiter-
ates.' The disadvantaged groups are girls, children from rural and tribal areas, other
socio-economically underprivileged students in rural and urban areas, those with
learning disabilities, and physically challenged children. In addition, the quality of sci-
ence education for Muslim students studying in madrassas is also unsatisfactory.
The main barriers to support diversity are lack of minimum infrastructure, inadequate
support systems, and lack of access to resources for quality science education for
the disadvantaged students. A consequence of this is that curriculum designers and
textbook writers create material that is aligned with the poor facilities—supporting the
belief that space and practical work are not essential to science teaching. Another
consequence of poorly equipped or non-existent laboratories is teachers neglecting
the possibilities afforded by low-cost activities and experiments using locally and
easily available material. Science curricula and textbooks do not adequately reflect
the diversity of the students across the country in terms of content or pedagogy. The
wide potential of the use of ICT to bridge the social divide remains untapped; appro-
priate multimedia software in different Indian languages is still uncommon
The rural-urban divide in science education is apparent in science curricula and pro-
grammes in which rural issues, lifestyles, trades and occupations are in low propor-
tion, if at all. Educational and career information in science, and assistance for com-
petitive examinations in science are not easily available to rural students. Curricular
44

and classroom practices are known to smack of gender bias. There is little or no
gender sensitisation of teachers at the pre-service or in-services stages of teacher
education (NCF, 2005).
The Centre for the Promotion of Science established by the Aligarh Muslim
University22 focuses attention on modernising education, especially the sciences, in
madrassas. The main objectives of the Centre are i) to create awareness amongst
Indian Muslims of the importance of acquiring and creating scientific knowledge and
to provide possible help to minimize their backwardness in sciences, and ii) to help in
the introduction of regular science teaching in madrassas and in the improvement of
the quality of science education in Muslim schools.
Section 5Identifying approaches to Teacher Training related to Diversityand Evidence of Success or Otherwise
The position paper by the NFG on the teaching of science addresses the need to
sensitise teachers to gender issues and the needs of disadvantaged groups.
“Teachers should be sensitized to promote equitable classroom practices to ensure
‘science experiences’ of comparable quality to girls.” Teachers should be exposed to
insights from studies which explore how gender bias operates in schools within and
outside the classrooms. Techniques of teaching which are appropriate to the “sci-
ence needs” of disadvantaged students need to evolve in consultation with experts.
However, there are is no evidence of specific approaches that have been conceptu-
alized for teacher training and/or implemented in science classrooms which speak to
issues of diversity in a deliberate way.
22 Founded in 1875 as a college, it acquired the status of a central university in 1920 and came to be known such.
45

REFERENCES
Agarwal, P. 2006. Higher education in India: The need for change. Working Paper No. 180. New Delhi: Indian Council for Research on International Economic Relations.
Chunawala, S. 2006. Science Education. In Sixth Survey of Educational Research 1993-2000, Volume 1, p 77-92. New Delhi: National Council of Educational Research and Training.
Heitzman, J. & Worden, R.L. 1995. India: A country study. Washington D.C: Library of Congress.
Indian National Science Academy. 2001. Pursuit and promotion of science: The Indian experience. New Delhi.
Indian National Science Academy. 2004. Science career for Indian women: An examination of Indian women’s access to and retention in scientific careers. New Delhi.
Khubchandani, L. 2008. Languages of instruction in plurilingual India. International Review of Education, 24 (3), 375-380.
Kurup, A., Maithreyi, R., Kantharaju, B., & Godbole, R. (2010). Trained scientific women power: How much are we losing? Bangalore: Indian Academy of Sciences and National Institute of Advanced Studies.
Ministry of Human Resource Development. 2000. Education for All: The Year 2000 Assessment Report. New Delhi: Government of India.
Ministry of Human Resource Development. 2010. Report to the people on education 2009-10. New Delhi: Government of India.
Ministry of Science and Technology. 2009. Research and development statistics 2007-08. New Delhi: Government of India.
Mitra, A. 2007. Country Profile commissioned for the EFA Global Monitoring Report 2008, Education for All by 2015: Will we make it?
Mukherjee, A. and Varma, V.S. (2001). How to make science more friendly, particularly to girls, within the framework of STL. New Delhi: Centre for Science Education and Communication.
Mukhopadhyay, C. 1996. The Cultural Context of Gendered Science: An Indian Case Study. Proceedings. 8th International Conference on Gender, Science,Technology [GASAT]. Towards Sustainable Development: Achieving the 4E's: Education, Employment, Equality, Empowerment. Vol.I: pp. 286-304. SATWAC: Ahmedabad,India.
Nair, P. 2009. The State and madrasas in India. Birmingham: Religions and Research Development Programme.
National Council of Educational Research and Training. 1975. Curriculum for the Ten Year School: A Framework.
National Council of Educational Research and Training. 1988, 2000, 2005. National Curriculum Framework.
46

National Council of Educational Research and Training. 2009. Comprehensive evaluation of Centrally Sponsored Scheme on Restructuring and Reorganization of Teacher Education: A Report.
National Institute of Educational Planning and Administration. 1988. Development of Education: 1986-1988. National Report of India. New Delhi: NIEPA.
National University of Educational Planning and Administration. 2010. Elementary Education in India: Progress towards UEE, DISE Flash Statistics: 2008-09. New Delhi: NUEPA.
Rajput, J. S. & Srivastava, V.P. 2005. India. In Science education for the contemporary society, ed. D.B.Rao, 37-51. New Delhi: Discovery Publishing House.
Ramachandran, V. 2009. Education for all—Mid decade assessment: Towards gender equality in education. New Delhi: NUEPA.
Shrinivasan, R. 55% percent of India’s population poor: A report. Times of India, July 15, 2010.
Shukla, R. 2005. India Science Report: Science Education, Human Resources and Public Attitude towards Science and Technology. New Delhi: National Council of Applied Economic Research.
Subrahmanyan, L. 1995. Patrifocality and the entry of women into science. Higher Education 30, 1-15.
The World Bank. 2006. Skill development in India: The Vocational education and training system (draft paper).
The World Bank. 2009. Secondary education in India; Universalizing opportunity, vol.2.
Position Paper National Focus Group on Educational Technology. 2005. New Delhi: NCERT.
Restructuring Post-School Science Teaching Programmes: A Position Paper. 2008. Indian Academy of Sciences (Bangalore), Indian National Science Academy (New Delhi), The National Academy of Sciences, India (Allahabad).
http://ncst.nic.in/ National Commission for Scheduled Tribes
http://censusindia.gov.in/ Census of India
http://www.ideadutch.com/ Indian Dutch Education Society I.D.E.A.
http://www.ncte-india.org/noti/determ.htm National Council For Teacher Education
http://www.education.nic.in/policy/npe-1968.pdf National Policy on Education 1968
http://education.nic.in/cd50years/g/T/49/toc.htm National Policy on Education 1986
http://education.nic.in/policy/npe86-mod92.pdf National Policy on Education 1986 (as modified in 1992)
http://www.navodaya.nic.in/ Navodaya Vidyalaya Samiti, MHRD.
47