Arvind Corporate Presentation - February 2012
43
Transformation February 2012 1 Arvind Limited Naroda Road, Ahmedabad - 380025 Tel: +91-79-22208000 Fax: +91-79-30130630 www.arvind.com 1
-
Upload
khangminh22 -
Category
Documents
-
view
4 -
download
0
Transcript of Arvind Corporate Presentation - February 2012

Transformation
February 2012
1
Arvind Limited
Naroda Road,Ahmedabad - 380025
Tel: +91-79-22208000Fax: +91-79-30130630
www.arvind.com
1

Disclaimer
The views expressed here may contain information derived from publicly available sources that have not beenindependently verified. No representation or warranty is made as to the accuracy, completeness or reliability of thisinformation.
Certain statements in this release concerning our future growth prospects are forward-looking statements within themeaning of applicable securities laws and regulations , and which involve a number of risks and uncertainties, beyondthe control of the Company, that could cause actual results to differ materially from those in such forward-lookingstatements. The risks and uncertainties relating to these statements include, but are not limited to, risks anduncertainties regarding fluctuations in earnings, our ability to manage growth, intense competition including thosefactors which may affect our cost advantage, wage increases, our ability to attract and retain highly skilledprofessionals, political instability, legal restrictions on raising capital or acquiring companies outside India, andprofessionals, political instability, legal restrictions on raising capital or acquiring companies outside India, andunauthorized use of our intellectual property and general economic conditions affecting our industry. Arvind Ltd. may,from time to time, make additional written and oral forward looking statements, including our reports to shareholders.The Company does not undertake to update any forward-looking statement that may be made from time to time by oron behalf of the company. Certain figures in this release have been worked out from information available to thecompany and in some cases by making several assumptions which may not be entirely verifiable or can be interpreteddifferently with different set of assumptions. The Company also expects the media to have access to all or parts of thisrelease and the management’s commentaries and opinions thereon, based on which the media may wish to commentand/or report on the same. Such comments and/or reporting maybe made only after taking due clearance and approvalfrom the Company’s authorized personnel. The Company does not take any responsibility for any interpretations/views/commentaries/reports which may be published or expressed by any media agency, without the prior authorizationof the Company’s authorized personnel.
2

Growth Drivers - Textiles, Retail & Brands Industry
Domestic FactorsPopulation
Rising Disposable Income
Higher Consumption
Changing Consumption Patterns
Evolution of Textile Industry
Consumption Levels
Global Factors
Global Demand Recovery
China Advantage
3

Evolution of Arvind
• The Arvind Store, - Best fabrics, brands and bespoke styling and tailoring solutions under one roof. 2010
• Unique one-stop shop service on a global scale, offering garment packages to brands
• Ranks amongst the top 3 players in Apparel Brands & Retail segment
2005 -2007
• Launches Us brand Arrow in India
1993 - 1997• Launches Us brand Arrow in India
• India’s largest state-of-the-art facility for shirting, gabardine and knits is set up at Santej.
1993 - 1997
• Changing the business focus from local to global, towards a high-quality premium niche market|
First Indian Company to enter Denim| Becomes 3rd
largest Denim producer in the world
1980 - 1991
• Arvind Mills Limited promoted by Kasturbhai, Narottambhai and Chimanbhai Lalbhai |
Acquires leadership position in Indian Textile1931-1980
4

Size
Revenue : $ 1 billion
EBIDTA: $ 150 million
Market Cap : $ 531 million(14th Feb 2012)
Business Segments
Fabrics : Denim| Woven|Knits
Garments : Jeans | Shirts
Branded Apparel | Value Retail
Today
Unique StrengthsPresent across entire value chain
Largest producer of Denim in world
Largest portfolio of domestic & foreign licensed apparel brands
Designing capabilities
Large land bank available for monetization to reduce leverage
Medium Term Strategic Plan
Grow @ CAGR of 20% | Brands & Retail to drive the future growth
Achieve ROCE of 18% p.a.
Bring down financial leverage
Develop future growth engines
Today
5

Financial PerformanceApril 2011 – December 2011April 2011 – December 2011
(9 Months)
6

Arvind’s Consolidated Financials
Particulars Actual Up to Q331st March
% of FY 2010-112011 2010
Revenues 3655 4090 3262 89%
EBITDA (Operating Profit) 534 556 412 96%
Margin 14.6% 13.6% 12.6%
Other Income 64 37 21
Interest & Finance Cost 294 245 212
Cash Accrual 304 348 220 87%
Depreciation 120 173 173
Profit before tax 183 176 47
7
Profit before tax 183 176 47
Profit after Tax 178 165 53 108%
Particulars 31.12.2011 31.3.2011 31.3.2010
Shareholder's Funds 1894 1695 1283
Borrowed Funds 2174 2211 2202
Fixed Assets 2903 2685 2489
Investment 51 44 44
Net Current Assets 1136 1215 981
Capital Employed 4096 3944 3513

Arvind’s Consolidated Financials
Key Ratios
Particulars 2010-112011-12
Upto Q3
EPS 6.5 6.8
Debt / Equity 1.3 1.1
Debt / EBIDTA 3.7 2.7
8
Debt / EBIDTA 3.7 2.7
ROCE 10.6% 15.5%
ROE 8.4% 12.4%
Revenue Growth 25.0% 26.5%

Upto Q3 - 2011-12- Revenue
2011-12 (upto Q3) 2010-11 (upto Q3)
�Compared FY 2009-10
�Brands & Retail Business grew by 40%
�Share of apparel & fabric retailing grew to 33% from 31%
�Share of domestic revenue grew to 68% from 67%
�Textile Business grew by 25%
9

Business Performance – 2010-11 Rs. crores
SegmentUpto Q3 2011-12 Upto Q3 2010-11 2010-11 2009-10
Rev. EBIDTA ROCE Rev. EBIDTA ROCE Rev. EBIDTA ROCE Rev. EBIDTA ROCE
Textiles 2564 454 20.3% 2086 328 13.1% 2934 467 15% 2410 351 9%
Brands &
Retail945 73 11.7% 693 68 12.5% 935 76 10% 713 37 2%
Others 135 6 0.4% 112 -21 -2.3% 221 13 1% 140 23 3%
Other
Income20 63 0 73 0.0% 37 21
Total 3644 596 15.4% 2891 448 10.5% 4090 593 11% 3262 432 7%
10
Business Upto Q3 2011-12 2010-11 2009-10
Denim 1,220 1,359 1051
Wovens 842 987 819
Garments 350 458 526
Voiles 173 211 179
Knits 110 109 56
Brands & Retail 955 935 731
Engineering 67 107 96
Real Estate 1 30 0
Telecom 43 48 36
Others 19 36 7

Key Parameters- upto Q3 - 2011-12-Textiles
Denim Shirting & Khakis
2011-12 2010-11 2011-12 2010-11
Exports (Mn Mtrs) 29 32 12 10
Domestics (Mn Mtrs) 42 39 33 34
Total 71 70 45 44
Avg Price (Rs/ Mtr) (Q3) 159 139 153 148
1111
Avg Price (Rs/ Mtr) (Q3) 159 139 153 148
Cotton Gas
Major Cost Components 2011-12 2010-11 2011-12 2010-11
Cost - Rs / Kg (For Q3) 120 99 19 16

Textile BusinessTextile Business
12

Particulars Capacity Volume
Fabrics As on Date 2010-11
Denim 108 mn mtrs 96 mn mtrs
Woven 84 mn mtrs 65 mn mtrs
�Arvind’s Textile business is Rs. 2935 growing at 15%
Woven 84 mn mtrs 65 mn mtrs
Knits 4800 MT 4158 MT
Volies 38 mn mtrs 34 mn mtrs
Total Fabric 238 mn mtrs 212 mn mtrs
Garments 10 mn pcs 13 mn pcs
13

Arvind Textile Business
• Denim: GAP | Miss Sixty | Diesel | Armani Exchange | Ann Taylor | Hugo Boss | Polo Ralph | Jack & Jones | Levi’s | Lee | Wrangler | Zara | Esprit | H & M | Quick silver
• Woven: GAP | Banana Republic | Brooks Brothers | Ann Taylor | Hugo Boss | Calvin Klein | Polo Ralph | Eddie Bauer| Express | J Crew | Louis Phillip | Van Heusen | Arrow | Color Plus | Esprit | Paul Smith | Park Avenue | Color plus
Key Customers
Park Avenue | Color plus
• Domestic (Denim): Raymonds |KG Denim |LNJ Denim|MalwaIndustries | Bhaskar,
• Domestic (Woven): Bombay Rayon Fashions | Nahar | Alok
• Global (Denim): Travex-S. America|Artistic -Pakistan | Cone-N.America | Isko-Turkey| Orta-Turkey | Atlantic Denim-Thailand
• Global (Woven): Luthai-China | Smart Shirt-China
Major Competitors
14

Textile Business | Growth Strategy
• Arvind is one of the largest producers of denim in the world
• With market share of over 13%, Arvind is the largest player in domestic market in India.
• Arvind has about 50% market
• With over 72 Million fabric manufacturing capacity, Arvind is the largest producers of shirting & Khaki fabrics in the country
• Growth Strategy
– Grow Wovens capacity by 15
Wovens�Denims
• Arvind has about 50% market share with leading national & international brands in India.
• Growth Strategy
- Grow denim business by ~10% p.a
- Planned capacity by 2015
140 M
– Grow Wovens capacity by 15 % p.a
– Planned capacity by 2015- 100 M
Domestic Focus | Develop strong B2C model in India
15

Innovative and futuristic fabrics
New standards of Bespoke tailoring
The best of Arvind’s ready-
B2C Business Model for retailing fabric in India
• Strong presence in the traditional retail market through Shop-in-Shop conceptSetting-up exclusive
The Arvind Store
Experience 2020 in 2010
futuristic fabrics with clear functional benefits
Arvind’s ready-made apparel portfolio
16
• Setting-up exclusive Arvind Stores across the Country

The Arvind StoreThe Arvind Store
17

Welcome to the Future….Welcome to the Future….
Opened 40 stores so far
18
Ahmedabad Borivali Guntur Hyderabad Karim Nagar Nadiad Porbandar Secunderabad Surat Vishakapatanam
Anand Chennai Haldia Jaipur Khammam Nalgonda Pune Siligury Vadodara Vijaywada
Bangalore Durgapur Hanamkonda Kakinada Mancherial Nashik Rajkot Srikakulam Vidhyadhar Nagar Vizianagaram
18

Innovative Fabrics
Three in One Miracle Fabric Ever Fresh
19

A new world of Bespoke tailoring20

Emerging as Largest Retailer of Fabric & Apparel in India
Arvind’s revenue from Retailing of Fabric & Branded Apparel has grown to Rs. 1213 Crores (upto Q3) making it one of the largest
Retailer of Fabric & Apparel in India
SISArvindStore
Branded Apparel Retailing
Value Retail
�Retail Sales Break-up21

Arvind Lifestyle Brands Ltd & Arvind Retail Ltd : Brands & Arvind Lifestyle Brands Ltd & Arvind Retail Ltd : Brands & Retail Powerhouse in Apparel space
22

Arvind is the pioneer in the Apparel Brands & Retail Space in India
� First Denim Brand
� Flying Machine
� First International Brand
� Arrow
� First Exclusive Brand Outlet
Arvind’s Firsts in India
2006 – Gant
2007 – Megamart Large Format
2007 - Cherokee
2009 - USPA
Brand Launch Calendar
2010 - Energie
2011 - Mossimo
2011 - Elle
23
� First Exclusive Brand Outlet
�Arrow Store
� First Mass Market Brand
�Ruf n Tuf
� First Factory Outlet
�Megamart
� First Designer Premium Brand
� Tommy Hilfiger
1993 - Arrow
1995 - Lee
1995 - Megamart
1994 – New Port
1995 – Ruf n Tuf
1997 - Excalibur
1999 - Wrangler
2004 – Tommy Hilfiger
2006 – Gant
1980 – Flying Machine

�Owned �Licensed
Arvind’s Brand Portfolio is unmatched in India
�Joint Venture�Private Labels
24

Arvind Brands & Retail Business
Sales Rs. 935 Crs (2010-11)Sales Rs. 1003 Crs (Upto Q3)
Arvind’s pedigree in Apparel Brands & Retailis un-parallelled in
India
Arvind’s Brands & Retail Business
Brands & Retail subsidiaries
Sales: Rs 788 Crs (2010-11)Sales: Rs. 866 Crs (upto Q3)
VF Arvind JVArvind: 40%VF : 60%
Sales: Rs 284 Crs. (2010-11)Sales: Rs. 229 Crs (upto Divestment)
Arvind’s share 40% = 91 cr (uptoDisinvestment))
Arvind Tommy JVArvind: 50%Murjani: 50%
Sales: Rs 80 Crs (2010-11)Sales: Rs 92 Crs (upto Q3)
Arvind’ share 50%=46 cr (uptoQ3)
Note: Arvind’s 40% stake in VF Arvind Brands has been divested in
November 2011 at Rs. 257 Crores
25
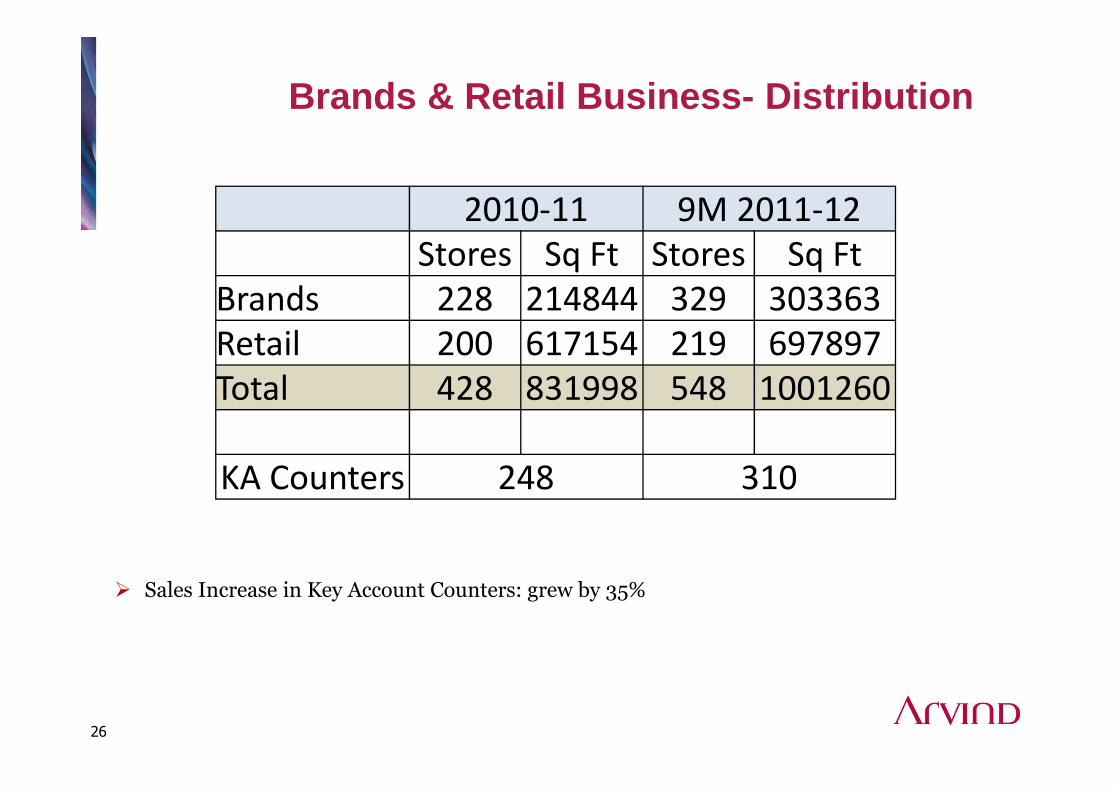
Brands & Retail Business- Distribution
2010-11 9M 2011-12
Stores Sq Ft Stores Sq Ft
Brands 228 214844 329 303363
Retail 200 617154 219 697897
Total 428 831998 548 1001260
� Sales Increase in Key Account Counters: grew by 35%
26
Total 428 831998 548 1001260
KA Counters 248 310

Revenue Rs Crs
% Growth
ALBL 484 57%
ARL 382 29%
Total 866 43%
% LTL
ALBL 15.5
ARL 4.3
Fastest Growing Apparel Brands & Retail Company in India
Following a 47 % revenue growth in 2010-11, the revenue grew by 43 % upto Q3 of FY 2011-12
Revenue upto Q3 - FY 2011-12 Like to Like Growth…
�CAGR 0f
ALBL- Brands ARL- MegaMart Retail27
�CAGR 0f 22%
250.5
442.6
552.6
816
0
100
200
300
400
500
600
700
800
900
2005-06 2008-09 2009-10 2010-11
Published Results of Brands & Retail Companies Indicate that Arvind is the Fastest growing Company in the Brands & Retail Space

Retail Productivity
Figs: Rs Per Sq. Ft. Sales Per Day
16.1
22.1
25.0
28.5
17.7
19.9
22.1
17.1
2008-09 2009-10 2010-11 2011-12 - YTD Dec
ALBL ARL
28

Rapid Roll Out of
Successful MegaMart Hub & Spoke Model
Distribution Expansion of Brands
Multiple Growth Engines to Drive Accelerated Growth
Growth Engine 1
Growth Engine 2
Category Expansion of Brands
Launch of New Brands to fill up
Market Segment Opportunities
Growth Engine 3
Growth Engine 4
29

Large Format MM
30

Arrow store US POLO store
31

Club America Flying Machine
32

� Differentiated
•Rapid Roll Out of Successful
�Hub & Spoke Model
• Distribution Expansion of Brands
�Strong Growth Engines
CAGR OF 33%� Efficient
Arvind is well on its way to be Brands & Retail Powerhouse in the Apparel Space
� Differentiated
�Multi
�Brand Strategy
• Distribution Expansion of Brands
• Category Expansion of Brands
• Launch of New Brands to fill up
� Market Segment Opportunities
CAGR OF 33%
For next 4 years� Efficient
�Organization+ +
33

Real Estate
34

Real Estate
Get Regulatory approvals to significantly increase the market value
Realize
Arvind has a large land bank which it does not require for growth of its other businesses
Realize the cash flow either through sale of land or development in form of JV or on our own
Realize
Cash flow
Develop
Expertise
In this business
Over 500 acres of surplus land: Expected to generate Rs. 1000 Crs.over next 4 years
No incremental investment required
35

Land bankLocation Area Plan
Expected Cash flow
Cash flowRealized
Moti-Bhoyan, Gandhinagar (Near Ahmedabad)
135 Acres
Township (JV with TATA Housing)
569 53
Khokra, (1/3)Ahmedabad
17 Acres
Land Sale 47 47
Khokra, (1/3) (Parishkar)Ahmedabad
17 Acres
Residential & Commercial
Space (JV with B Safal)
87 47
Rs. Crores
• The Company is expecting to realize the Cash flow over a period of next 7-8 years
• PV is estimated to be
Khokra, (1/3)Ahmedabad
17 Acres
Residential & Commercial
Space125 -
Naroda, Ahmedabad35
Acres
Residential & Commercial
Space557 -
Jethlaj, Gandhinagar (Near Ahmedabad)
220 Acres
Currently under Planning
164 -
Bangalore2.14 lacsq ft
Commercial 49 -
Others - - 75 -
Total424Acres
1672 147
estimated to be Rs. 1000 Cr.
• From next FY it is expected to receive the cash flow of about Rs. 100 cr every year for next 7-8 years
36

New Growth Engines
• Company had done 51:49 JV for manufacturing glass fabric with PD Group, Germany.
• Application in Automobiles & Transportation, Wind Energy, Aerospace, Ship-building and Infrastructure
Technical TextilesArvind PD
Composites Pvt. Ltd.
• EPC and water management business• Won several contracts in last few months• Currently have order book of more than Rs. 100 crores.
• Acquired business having Mechanical Vapor Recompression system
• Finnish technology to recover water from highly concentrated effluent
EngineeringArvind Accel Ltd.
37

Investment Case
38
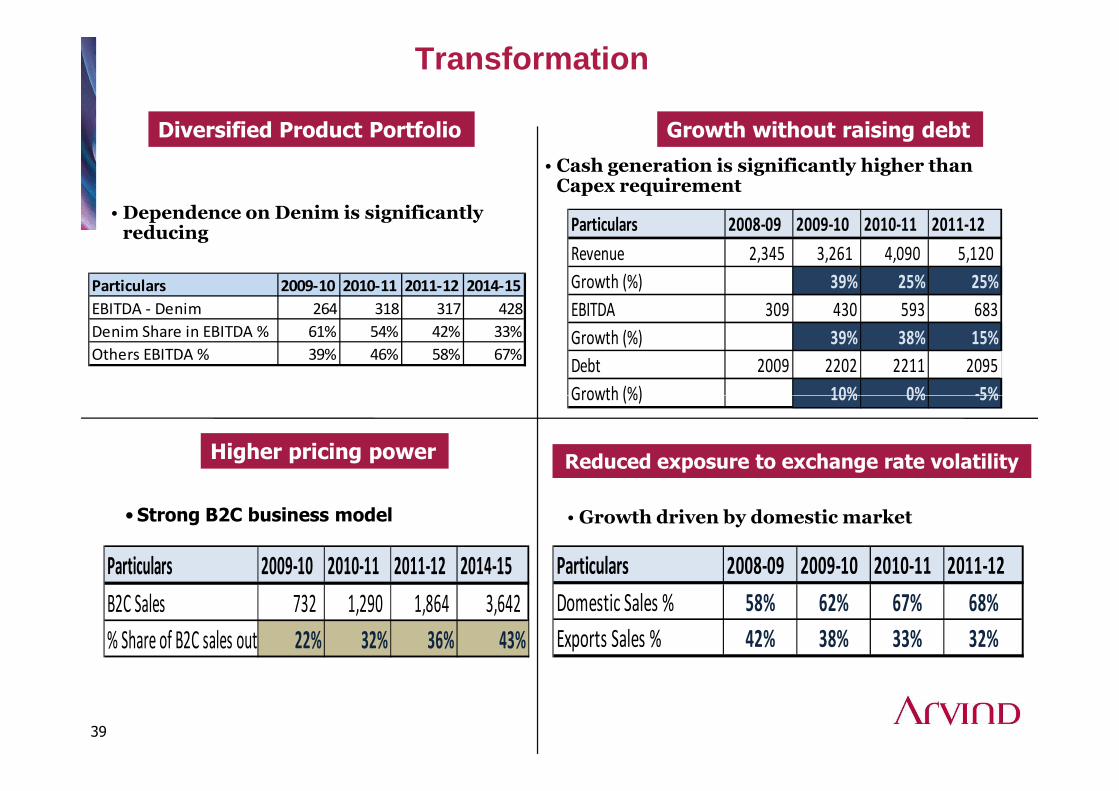
Transformation
Particulars 2009-10 2010-11 2011-12 2014-15
EBITDA - Denim 264 318 317 428
Denim Share in EBITDA % 61% 54% 42% 33%
Others EBITDA % 39% 46% 58% 67%
•Dependence on Denim is significantly reducing
• Cash generation is significantly higher than Capex requirement
Particulars 2008-09 2009-10 2010-11 2011-12
Revenue 2,345 3,261 4,090 5,120
Growth (%) 39% 25% 25%
EBITDA 309 430 593 683
Growth (%) 39% 38% 15%
Debt 2009 2202 2211 2095
Growth (%) 10% 0% -5%
Diversified Product Portfolio Growth without raising debt
Growth (%) 10% 0% -5%
•Strong B2C business model
Particulars 2009-10 2010-11 2011-12 2014-15
B2C Sales 732 1,290 1,864 3,642
% Share of B2C sales out of Total Sales22% 32% 36% 43%
• Growth driven by domestic market
Particulars 2008-09 2009-10 2010-11 2011-12
Domestic Sales % 58% 62% 67% 68%
Exports Sales % 42% 38% 33% 32%
Higher pricing power Reduced exposure to exchange rate volatility
39

Medium term Plan
Growth
Grow revenue at CAGR of 20% p.a.
Returns
Improve ROCE from 10% to 18%
De-Risk
Reduce dependence on Denim
Leverage
Bring down Debt / EBIDTA multiple to 2
2011-2015
40

Investment Considerations
Revenue Growth 20%
EBIDTA Margin Improvement 2-3%
Sharp
EBIDTA Increase
Improved 3%
Real Estate
Divestment Rs. 1000 cr
Reduced Capital Employe
d
ROCE Improveme
nt
Improved returns on shareholders
equity
41

Forecast by Brokerage FirmsRs. mn
ParticularsEquirius Securities HSBC InvestDirect Batlivala & Karani Securities
FY12E FY13E FY12E FY13E FY12E FY13E
Sales 48275 51611 47066 53397 47701 55183
EBITDA 7116 7627 6421 7457 7171 7806
EBITDA Margin 15.0% 15.0% 13.6% 14.0% 14.9% 14.0%
Net Profit 2482 3401 2081 2976 2459 3480Net Profit 2482 3401 2081 2976 2459 3480
EPS 9.8 13.4 8 11.5 9.836 13.92
ROCE 15.0% 14.0% 12.8% 14.0% 13.6% 14.4%
42

Thank You
43