ARGUED APRIL 13, 2012 DECIDED AUGUST 21, 2012 No. 11 ...
70
ARGUED APRIL 13, 2012 DECIDED AUGUST 21, 2012 No. 11-1302 (and consolidated cases) (COMPLEX) IN THE UNITED STATES COURT OF APPEALS FOR THE DISTRICT OF COLUMBIA CIRCUIT ________________ EME Homer City Generation, L.P., et al., Petitioners, v. United States Environmental Protection Agency, et al., Respondents, ________________ On Petitions for Review of an Action of the United States Environmental Protection Agency ________________ JOINT OPPOSITION OF INDUSTRY/LABOR PETITIONERS TO MOTIONS TO LIFT THE STAY ________________ F. William Brownell Hunton & Williams LLP 2200 Pennsylvania Avenue, N.W. Washington, D.C. 20037 P. Stephen Gidiere III Balch & Bingham LLP Suite 1500 1901 Sixth Avenue North Birmingham, Alabama 35203 Counsel for Luminant Petitioners Peter D. Keisler C. Frederick Beckner III Roger R. Martella, Jr. Timothy K. Webster Eric D. McArthur Sidley Austin LLP 1501 K Street, N.W. Washington, D.C. 20005 (202) 736-8000 Dated: July 31, 2014 USCA Case #11-1302 Document #1505492 Filed: 07/31/2014 Page 1 of 70
-
Upload
khangminh22 -
Category
Documents
-
view
0 -
download
0
Transcript of ARGUED APRIL 13, 2012 DECIDED AUGUST 21, 2012 No. 11 ...

ARGUED APRIL 13, 2012 DECIDED AUGUST 21, 2012
No. 11-1302 (and consolidated cases) (COMPLEX)
IN THE UNITED STATES COURT OF APPEALS FOR THE DISTRICT OF COLUMBIA CIRCUIT
________________
EME Homer City Generation, L.P., et al., Petitioners,
v.
United States Environmental Protection Agency, et al., Respondents,
________________
On Petitions for Review of an Action of the United States Environmental Protection Agency
________________
JOINT OPPOSITION OF INDUSTRY/LABOR PETITIONERS TO MOTIONS TO LIFT THE STAY
________________ F. William Brownell Hunton & Williams LLP 2200 Pennsylvania Avenue, N.W. Washington, D.C. 20037 P. Stephen Gidiere III Balch & Bingham LLP Suite 1500 1901 Sixth Avenue North Birmingham, Alabama 35203 Counsel for Luminant Petitioners
Peter D. Keisler C. Frederick Beckner III Roger R. Martella, Jr. Timothy K. Webster Eric D. McArthur Sidley Austin LLP 1501 K Street, N.W. Washington, D.C. 20005 (202) 736-8000 Dated: July 31, 2014
USCA Case #11-1302 Document #1505492 Filed: 07/31/2014 Page 1 of 70

i
TABLE OF CONTENTS
TABLE OF AUTHORITIES ............................................................................................... ii
INTRODUCTION................................................................................................................ 1
BACKGROUND ................................................................................................................... 2
ARGUMENT ......................................................................................................................... 4
I. EPA’S MOTION IS AN IMPROPER ATTEMPT TO AVOID NOTICE-AND-COMMENT RULEMAKING ................................................... 4
II. THE STAY SHOULD REMAIN IN EFFECT .................................................... 9
A. The Industry/Labor Petitioners Have A Substantial Probability Of Success On The Merits ............................................................................. 9
1. The Transport Rule overcontrols many upwind States ................ 10
2. EPA regulated insignificant contributions ...................................... 14
3. Industry/Labor petitioners’ unaddressed arguments .................... 15
B. Petitioners Would Suffer Irreparable Harm If The Transport Rule Became Effective In 2015 ............................................................................ 16
C. The Equities Favor Maintaining The Stay .................................................. 18
CONCLUSION ................................................................................................................... 20
Exhibit 1: Declaration of Matthew Goering
Exhibit2: Declaration of James Marchetti
USCA Case #11-1302 Document #1505492 Filed: 07/31/2014 Page 2 of 70

ii
TABLE OF AUTHORITIES
Page CASES
Aamer v. Obama, 742 F.3d 1023 (D.C. Cir. 2014) ..................................................................................... 17
Armour & Co. v. Freeman, 304 F.2d 404 (D.C. Cir. 1962) ....................................................................................... 16
EME Homer City Generation, L.P. v. EPA, 696 F.3d 7 (D.C. Cir. 2012), rev’d, 134 S. Ct. 1584 (2014) ........................................... 3
EPA v. EME Homer City Generation, L.P., 134 S. Ct. 1584 (2014) ............................................................................. 2, 3, 4, 5, 10, 14
Iowa Utils. Bd. v. FCC, 109 F.3d 418 (8th Cir. 1996) ......................................................................................... 16
Wis. Gas v. FERC, 758 F.2d 669 (D.C. Cir. 1985) ....................................................................................... 16
STATUTES AND REGULATIONS
42 U.S.C. §7409(b)(1) ........................................................................................................... 19
42 U.S.C. §7607(d)(3) ............................................................................................................. 8
40 C.F.R. §97.510(b) ............................................................................................................... 7
40 C.F.R. §97.610(b) ............................................................................................................... 7
40 C.F.R. §97.710(b) ............................................................................................................... 7
75 FR 54778 (Sept. 9, 2010) ................................................................................................ 12
75 FR 58312 (Sept. 24, 2010) .............................................................................................. 12
76 FR 29652 (May 23, 2011) ............................................................................................... 13
76 FR 48208 (Aug. 8, 2011) ................................................ 4, 5, 6, 8, 10, 11, 12, 13, 14, 15
76 FR 70091 (Nov. 10, 2011) .............................................................................................. 13
USCA Case #11-1302 Document #1505492 Filed: 07/31/2014 Page 3 of 70

iii
77 FR 10324 (Feb. 12, 2012) ....................................................................................... 5, 7, 18
OTHER AUTHORITIES
Air Quality TSD (July 2010), available at http://www.epa.gov/airtransport/CSAPR/pdfs/TSD_analysis_to_quantify_significant_contribution_7-8-10.pdf .......................................................................... 14
EPA, Cross-State Air Pollution: Regulatory Actions, http://www.epa.gov/airtransport/CSAPR/actions.html (visited July 29, 2014) ................................................................................................................................... 6
EPA, Cross-State Air Pollution Rule, http://www.epa.gov/airtransport/CSAPR (visited July 29, 2014) ....................................................................................................... 7
EPA, Progress Report 2011: Environmental and Health Results Report (2013) http://www.epa.gov/airmarkt/progress/ARPCAIR11_downloads/ARPCAIR11_environmental_health.pdf ................................................................................... 19
USCA Case #11-1302 Document #1505492 Filed: 07/31/2014 Page 4 of 70

1
INTRODUCTION
The undersigned petitioners (“Industry/Labor petitioners”) oppose EPA’s
motion to lift the stay of the Transport Rule.1 Neither the Supreme Court’s decision
nor any intervening change in circumstances warrants revisiting this Court’s decision
to stay the Rule “pending the court’s resolution of th[e] petitions for review,”
Doc.1350421 at 2, which present important issues that remain to be resolved.
Initially, EPA’s motion is fundamentally improper. It is premised on EPA’s
request that this Court “toll” the Rule’s compliance deadlines, which imposed
emission budgets based on EPA’s air-quality projections for specific years. Nothing in the
record justifies treating 2015 as if it were 2012 despite the intervening changes in air
quality. Rather, EPA’s own projections show that air quality would improve by
2014—and indeed that many locations would attain the relevant NAAQS by 2014—
without any good-neighbor emission controls. EPA cannot lawfully regulate the
numerous upwind States linked exclusively to these locations. Moreover, important
Transport Rule deadlines cannot be changed without modifying other rules that are
not before the Court and that implicate policy issues requiring further rulemaking.
Until EPA undertakes such rulemaking, the stay cannot be lifted. See infra Part I.
In all events, EPA (and ALA) fall well short of demonstrating a stay is no
longer warranted. Far from supporting EPA’s motion, the Supreme Court’s ruling in 1 American Lung Association, et al. (“ALA”) responded in support of EPA’s motion and also sought additional affirmative relief. The Industry/Labor petitioners hereby oppose ALA’s request for affirmative relief.
USCA Case #11-1302 Document #1505492 Filed: 07/31/2014 Page 5 of 70

2
EPA v. EME Homer City Generation, L.P., 134 S. Ct. 1584 (2014), is fatal to it. The
Supreme Court “agree[d]” with this Court that EPA has a “statutory duty to avoid
over-control.” Id. at 1608–09. And the Transport Rule clearly overcontrols many
upwind States. In addition, petitioners have a probability of success on other grounds
not addressed in this Court’s prior opinion. See infra Part II.A.
Moreover, EPA’s declarant confirms that petitioners would be irreparably
harmed if the stay were lifted. ALA’s proposed implementation schedule—rejected as
unworkable in the Transport Rule—would magnify these harms. See infra Part II.B.
At the same time, lifting the stay would disserve the public interest. Electric
generators remain subject to the Clean Air Interstate Rule (“CAIR”), under which
widespread attainment has been achieved. EPA has not demonstrated that lifting the
stay would bring any environmental benefits. Nor has it accounted for the disruption
and wasted resources that would result from replacing the existing, effective CAIR
regime with an illegal rule that this Court likely will soon set aside. See infra Part II.C.
BACKGROUND
EPA and ALA do not accurately present the background of this proceeding. At
every stage, petitioners have shown that the Transport Rule’s emission budgets exceed
EPA’s statutory authority. See, e.g., Industry/Labor Br. 19–30 (Doc.1364190);
USCA Case #11-1302 Document #1505492 Filed: 07/31/2014 Page 6 of 70

3
Industry/Labor Br. in Opp. to Cert. 9–23; Industry/Labor S. Ct. Br. 15–41.2 Rather
than undermine these arguments, the Supreme Court’s ruling confirms their validity.
In the Transport Rule, EPA imposed emission budgets on upwind States to
reduce the interstate transport of certain air pollutants. This Court held that the
Transport Rule exceeded EPA’s authority in “at least three independent” respects.
EME Homer City Generation, L.P. v. EPA, 696 F.3d 7, 23–28 (D.C. Cir. 2012). On
certiorari, the Supreme Court disagreed with only one of these holdings—the
“proportionality” holding. EME Homer, 134 S. Ct. at 1603–07.
As to the overcontrol and one-percent “insignificance” threshold issues that
provided the two other “independent” grounds for this Court’s invalidation of the
Transport Rule, 696 F.3d at 23, the Supreme Court expressly “agree[d]” with this
Court’s statutory analysis, 134 S. Ct. at 1608 (emphasis added). As to overcontrol, the
Supreme Court held that “[i]f EPA requires an upwind State to reduce emissions by
more than the amount necessary to achieve attainment in every downwind State to
which it is linked, the Agency will have overstepped its authority.” Id. As to the one-
percent threshold, the Supreme Court held that EPA cannot “demand reductions that
would drive an upwind State’s contribution to every downwind State to which it is
linked below one percent of the relevant NAAQS.” Id.
2 The parties’ Supreme Court filings are available online at http://www.scotusblog. com/case-files/cases/american-lung-association-v-eme-homer-city-generation/.
USCA Case #11-1302 Document #1505492 Filed: 07/31/2014 Page 7 of 70

4
Although the Supreme Court concluded that the possibility that EPA had
overstepped its authority in one of these respects did not “justif[y] wholesale
invalidation of the Transport Rule,” the Court held that an upwind State may maintain
an “as-applied” challenge if “it has been forced to regulate emissions below the one-
percent threshold or beyond the point necessary to bring all downwind States into
attainment.” Id. at 1608–09. In this regard, the Supreme Court accepted EPA’s
suggestion that as-applied challenges to the Rule could be considered by this Court on
remand. Tr. of Oral Arg. 27–28, EME Homer, 134 S. Ct. 1584 (2014) (No. 12-1182).
ARGUMENT
I. EPA’S MOTION IS AN IMPROPER ATTEMPT TO AVOID NOTICE-AND-COMMENT RULEMAKING.
EPA’s motion is a curious one. Although EPA seeks to lift the stay, it does not
argue that the Transport Rule can be put into effect as written. For good reason: The
Transport Rule adopted emission budgets for specific calendar years, imposing Phase
1 emission budgets for 2012 and 2013 and stricter Phase 2 budgets for 2014 and
beyond. See EPA Mot., Harvey Decl. ¶12. EPA found that this two-year phase-in was
“as expeditious as practicable” given the time required to install the necessary
controls. See 76 FR 48208, 48282 (Aug. 8, 2011). EPA thus does not contend that the
Transport Rule’s 2014 emission budgets could feasibly be imposed before 2017.
Instead, EPA asks this Court to change the Transport Rule’s compliance
deadlines such that the Rule’s Phase 1 emission budgets would “apply in 2015 and
USCA Case #11-1302 Document #1505492 Filed: 07/31/2014 Page 8 of 70

5
2016 (instead of 2012 and 2013), and the Phase 2 emissions budgets [would] apply in
2017 and beyond (instead of 2014 and beyond).” EPA Mot. 1. EPA also asks this
Court to change the deadlines for the “variability limits” that the Transport Rule
adopted to restrict interstate allowance trading and use of “banked” allowances. Id. at
14. Under the Transport Rule, these limits were scheduled to take effect in 2012, but
in a subsequent rulemaking, EPA changed their effective date to January 1, 2014, to
facilitate allowance trading. 77 FR 10324 (Feb. 21, 2012).
EPA’s request for “tolling” ignores that the Transport Rule’s emission budgets
were set based on EPA’s air-quality findings with respect to specific years. See, e.g., 76 FR at
48256–59. EPA nowhere explains why it is appropriate in 2015 to impose emission
budgets based on air-quality conditions projected by EPA to exist in 2012, and in
2017 to impose emission budgets based on air-quality conditions projected by EPA to
exist in 2014. These budgets cannot be justified on the Transport Rule’s record.
Quite the opposite is true: the Transport Rule record shows it would be illegal
to impose 2012 budgets in 2015. EPA’s modeling projected substantial improvement
in downwind air quality between 2012 and 2014 even absent any good-neighbor
regulation. Indeed, EPA projected that many downwind locations would attain the
relevant NAAQS in 2014 without the Transport Rule (or CAIR). See JA2546–637,
2959–62; Industry/Labor Br. 45 & n.28 (Doc.1364190). EPA lacks authority to
require emission reductions from States linked exclusively to such locations. See EME
Homer, 134 S. Ct. at 1608. And if EPA cannot impose such reductions directly, this
USCA Case #11-1302 Document #1505492 Filed: 07/31/2014 Page 9 of 70

6
Court should not authorize EPA to impose them under the guise of tolling deadlines.
Treating 2015 as if it were 2012, and 2017 as if it were 2014, would be the epitome of
arbitrary agency action where EPA’s own findings show that many downwind
locations would attain the NAAQS in 2014 without any good-neighbor regulation.
In addition to ignoring its own air-quality findings, EPA’s proposal would give
regulated parties even less time to prepare for compliance than they had under the
Transport Rule. Affected parties had less than six months’ notice of the Transport
Rule’s initial compliance obligations. See http://www.epa.gov/airtransport/CSAPR
/actions.html (Transport Rule finalized on July 6, 2011, with Phase 1 budgets
effective on January 1, 2012). EPA would provide an even shorter compliance period
here. EPA’s request is particularly inappropriate because one of petitioners’ original
challenges, which this Court did not resolve, is that the Transport Rule compliance
deadlines were too short in the first place. Industry/Labor Br. 52–58 (Doc.1364190).
ALA, for its part, proposes to compound this problem by insisting that
regulated parties comply with the stricter Phase 2 emission budgets beginning in 2015.
See ALA Resp. 1–2. In effect, ALA asks this Court to find, based on its made-for-
litigation analysis rather than any evidence in the administrative record, that “States
can practicably achieve th[e] reductions necessary to meet their Transport Rule Phase
2 assurance levels … in 2015.” Id. at 17. But EPA made no such finding; indeed, it
found the opposite: sources would need two years to install the controls necessary to
comply with Phase 2 emission budgets. See 76 FR at 48277–78, 48282.
USCA Case #11-1302 Document #1505492 Filed: 07/31/2014 Page 10 of 70

7
ALA’s contrary position rests on the baseless assertion that regulated parties
should have been complying with the Transport Rule even while it was stayed, and
indeed, even after it had been vacated as unlawful. See ALA Resp. 14–15. This would
defeat the entire purpose of a stay, which is to relieve parties from complying with a
challenged regulation until its legality is adjudicated. Indeed, EPA advised regulated
parties that, pending further proceedings before this Court on remand, “CAIR
remains in place and no immediate action from States or affected sources is expected.”
http://www.epa.gov/airtransport/CSAPR (visited July 29, 2014) (emphasis added).
Moreover, EPA effectively acknowledges that its proposal would require this
Court to refashion rules that are not even before the Court and to grant EPA a blank
check to make numerous other changes to the regulation that would be required to
conform it to the revised compliance deadlines. In asking this Court to toll the
variability-limit deadlines along with the Transport Rule’s budgets, EPA ignores that
those deadlines were not even promulgated in the Transport Rule, but instead were
contained in the so-called “First Revisions Rule.” See 77 FR 10324 (Feb. 21, 2012); 40
C.F.R. §§97.510(b), 97.610(b), 97.710(b) (variability limits will apply “for the control
periods in 2014 and thereafter”). The First Revisions Rule was not stayed, and is the
subject of separate petitions for review in this Court. EPA Mot., Harvey Decl. ¶25.
Although EPA states (correctly) that the variability limits should be delayed to allow
trading to develop, id. ¶¶29, 34, it does not explain how this Court, on review of the
Transport Rule, can rewrite substantive provisions enacted in the First Revisions Rule.
USCA Case #11-1302 Document #1505492 Filed: 07/31/2014 Page 11 of 70

8
Nor does EPA explain why this Court should bless its attempt to circumvent
notice-and-comment rulemaking to make changes to important regulatory provisions
that are not even specified, let alone justified, in its motion. EPA acknowledges that
“[t]he Rule contains additional deadlines” that would need to be changed and says
that it “would ... tak[e] any necessary administrative action to amend the existing
regulatory text in the Code of Federal Regulations to be consistent with this Court’s
action.” Id. at 14 n.5. But several of these “additional deadlines” raise policy issues
that cannot be addressed through “ministerial actions.” Id. For example, will EPA
continue to bar States from developing different allowance allocations than EPA
imposed even though the Transport Rule permitted States to begin doing so in 2013?
See 76 FR at 48328–29. Or will EPA treat units constructed and made operational
since the Transport Rule as “planned” rather than “existing” units? Id. at 48284.
EPA’s “tolling” proposal is in reality a request for this Court’s advance authorization
to change key regulatory provisions, which EPA has not even identified, without the
requisite notice-and-comment rulemaking. See 42 U.S.C. §7607(d)(3).
As its sole authority for this extraordinary request, EPA cites this Court’s order
lifting the stay in Michigan v. EPA, No. 98-1497 (D.C. Cir. June 22, 2000). EPA Mot.
15. That order cannot bear the weight EPA puts on it. In contrast to the order EPA
and ALA seek here, the order lifting the stay in Michigan was entered only after all
proceedings in this Court had concluded. And it did not authorize EPA to impose
illegal emission budgets based on outdated air-quality data or to accelerate compliance
USCA Case #11-1302 Document #1505492 Filed: 07/31/2014 Page 12 of 70

9
deadlines for regulated parties. Instead, by extending the deadline for States to submit
their implementation plans, it allowed the States to account for changed circumstances.
Here, by contrast, EPA seeks permission to impose federal implementation
plans directly on regulated sources without regard to how relevant circumstances have
changed since 2012. While the Court is hearing from the parties to this case, these
parties represent only a small subset of the sources that would be subject to the Rule
in just a few months. EPA must undertake a notice-and-comment rulemaking to reset
the various deadlines in the Transport Rule and related rules and address the
regulatory issues that flow from the new deadlines. Until EPA has conducted such a
rulemaking, this Court should not entertain a motion to lift the stay.
II. THE STAY SHOULD REMAIN IN EFFECT.
In any event, the movants fall well short of demonstrating that the stay is no
longer warranted under the traditional test for equitable relief.
A. The Industry/Labor Petitioners Have A Substantial Probability Of Success On The Merits.
In light of the Supreme Court’s ruling, the Industry/Labor petitioners have an
overwhelming probability of success on the central statutory arguments they have
pressed in this proceeding. They also have a substantial probability of success on the
other challenges raised in their prior briefs that this Court did not address.
USCA Case #11-1302 Document #1505492 Filed: 07/31/2014 Page 13 of 70

10
1. The Transport Rule overcontrols many upwind States.
As noted, the Supreme Court “agree[d]” with this Court that EPA has a
“statutory duty to avoid over-control.” 134 S. Ct. at 1608–09. The Court rejected
EPA’s contentions that overcontrol could be excused because the agency did not “set
out” to overcontrol, EPA S. Ct. Br. 54, or that overcontrol is “unavoidable” because
some upwind States are linked to multiple downwind nonattainment locations, EPA S.
Ct. Reply Br. 22. The Supreme Court expressly stated that the Transport Rule would
impose “unnecessary” overcontrol if an upwind State is linked solely to locations that
would attain the relevant NAAQS with lesser emission reductions. 134 S. Ct. at 1609.
The Transport Rule, in fact, overcontrols several States. This overcontrol
resulted from fundamental flaws in EPA’s approach to setting emission budgets. EPA
used air-quality modeling to determine locations expected to have attainment
problems in 2012 absent CAIR-mandated emission controls. 76 FR at 48211. EPA
then set thresholds at 1% of each NAAQS. Id. at 48236. States whose projected
“contributions” met or exceeded this threshold at a given downwind location were
deemed “linked” to that location and subjected to budgets. Id. In contrast, “States
whose contributions [we]re below these thresholds” were found by EPA to “not
significantly contribute to nonattainment” and thus were not subject to budgets. Id.
For regulated upwind States, EPA set each State’s budgets by determining the
emission reductions that would be achieved if the State adopted the emission controls
available at “specific cost per ton thresholds.” Id. at 48248; see also id. at 48258. For
USCA Case #11-1302 Document #1505492 Filed: 07/31/2014 Page 14 of 70

11
2014 budgets, EPA split States into two groups for SO2, using $2,300/ton for Group
1 States and $500/ton for Group 2 States. Id. at 48252. EPA based the 2014 NOX
budgets on the $500/ton threshold. Id. at 48257.
This approach led to overcontrol. First, EPA failed to consider whether less-
restrictive emission budgets would achieve attainment. Industry/Labor Br. 31–34
(Doc.1364190). EPA never considered whether attainment could be achieved at cost
thresholds below $500/ton, 76 FR at 48256–58, despite evidence that attainment
could be achieved at lower cost thresholds, JA1062–69, 1374.
Second, EPA did not adjust the 2014 budgets to account for the fact that it
projected that air quality would improve substantially between 2012 and 2014 even
without any good-neighbor emission reductions. See supra p. 5. In fact, EPA projected that
many areas that were expected to have air-quality problems in 2012 would achieve air
quality superior to the NAAQS by 2014 even without the Transport Rule or CAIR. Id.
Petitioners thus have a substantial probability of demonstrating that EPA’s
approach, in fact, resulted in overcontrol. The most vivid examples are as follows.3
Overcontrol as to ozone. EPA imposed emission budgets on 10 upwind
States—Florida, Maryland, New Jersey, New York, North Carolina, Ohio,
3 Although EPA has vaguely suggested these overcontrol arguments may have been waived, EPA Mot. to Govern 9–11 (Doc.1500830), that is not the case, see Luminant Resp. 6–9 (Doc.1501970). In fact, consideration of these as-applied challenges is required by the Supreme Court’s mandate, id. at 6 n.3, and, moreover, EPA has waived its waiver argument, Industry/Labor Mot. to Govern Reply 7 (Doc.1504905).
USCA Case #11-1302 Document #1505492 Filed: 07/31/2014 Page 15 of 70

12
Pennsylvania, South Carolina, Virginia, and West Virginia—that were linked
exclusively to locations that EPA projected would attain the ozone NAAQS in 2014
without any good-neighbor obligations.4 For example, EPA linked Florida to only two
downwind locations, both in Harris, TX, 76 FR at 48246 (tbl.V.D-9), but EPA
projected that those areas would have no attainment or maintenance issues in 2014—
even without the Transport Rule or CAIR, see JA2575–76.5
Overcontrol as to South Carolina for PM2.5. South Carolina was regulated
for PM2.5 solely because EPA found it was linked to projected annual PM2.5 attainment
problems at Fulton, GA. 76 FR at 48241 (tbl.V.D-2). EPA projected, however, that
Fulton would have air quality superior to the relevant NAAQS in 2014 without any
good-neighbor emission reductions. JA2584, 2959–60 (2014 “base case” projections).
Overcontrol as to Texas for PM2.5. EPA has never disputed that it
overcontrolled Texas, because it cannot. See Luminant Summ. Vac. Mot. 6–12
(Doc.1504643). The only downwind location to which Texas was linked for PM2.5 was
Madison, IL. 76 FR at 48241–44 (tbls.V.D-2–3, 5–6). EPA’s data show that Madison
4 These upwind States were linked exclusively to one or more of the following locations: Fairfield and New Haven, CT; Harford, MD; Allegan, MI; and Harris, TX. 76 FR at 48246 (tbl.V.D-9). EPA projected that none of these areas would have attainment or maintenance concerns in 2014 even in the absence of good-neighbor emission reductions. See JA2550, 2560, 2561, 2575–76 (2014 “base case” projections). 5 EPA also overcontrolled Texas as to ozone. Texas was linked to ozone problems in only two areas (East Baton Rouge and Allegan), 76 FR at 48246 (tbls.V.D-8–9), which both attained the ozone NAAQS under CAIR. See 75 FR 58312 (Sept. 24, 2010); 75 FR 54778 (Sept. 9, 2010). See also Luminant Summ. Vac. Mot. 12 (Doc.1504643).
USCA Case #11-1302 Document #1505492 Filed: 07/31/2014 Page 16 of 70

13
was projected to achieve PM2.5 air quality far superior to the NAAQS under the
Transport Rule. JA2964–65. In fact, Madison attained the NAAQS at the higher
emission levels that occurred under CAIR. Compare 76 FR 29652, 29654 (May 23,
2011) (showing Madison attained the PM2.5 NAAQS), with 76 FR 70091, 70099 (Nov.
10, 2011) (Transport Rule “mandates even greater reductions than have already
occurred under CAIR”). Where attainment has been achieved at higher emission
levels, further emission reductions are unnecessary to ensure attainment. Indeed,
EPA’s data show that Madison would have air quality right at the NAAQS without
any good-neighbor obligations. JA2586, 2615 (2014 “base case” projections). These
projections confirm that Madison would achieve attainment with only modest upwind
emission-reduction obligations. See infra n.6 (EPA data confirming Madison would
attain the relevant NAAQS with lower-cost emission controls).
Overcontrol of Group 2 States. EPA set SO2 budgets for Group 2 States, and
NOx budgets for all states, at $500/ton of emissions removed. But, as noted, EPA did
not consider whether attainment would be achieved at lower cost thresholds despite
evidence demonstrating this to be the case. As to SO2, EPA offered no reason for its
refusal, and as to NOx, it stated only that it “did not find cost thresholds lower than
$500/ton … to be reasonable” because they might cause some sources “to stop
operating existing pollution control equipment.” 76 FR at 48257.
Although EPA disregarded this critical statutory issue when setting final
emission budgets, it did consider the impact of lower cost thresholds when it
USCA Case #11-1302 Document #1505492 Filed: 07/31/2014 Page 17 of 70

14
proposed the Transport Rule. EPA’s air-quality data from the proposal stage show
that Alabama, Georgia, South Carolina, and Texas are linked exclusively to downwind
locations that would attain and maintain the PM2.5 NAAQS even if cost thresholds
lower than $500/ton were used to determine upwind emission budgets.6
2. EPA regulated insignificant contributions.
EPA also regulated “insignificant” emissions in violation of the limits on its
statutory authority. As noted, the Supreme Court held that EPA cannot “demand
reductions that would drive an upwind State’s contribution to every downwind State
to which it is linked below one percent of the relevant NAAQS.” EME Homer, 134 S.
Ct. at 1608. Having determined that contributions of less than 1% of the NAAQS
were insignificant, EPA could not ignore that finding when setting emission budgets.
The Supreme Court thus remanded to this Court to determine the extent to which
EPA had transgressed this limit on its authority. Id. at 1608–10.
6 EPA linked these four States to certain locations that were projected to have attainment or maintenance problems in 2012 without good-neighbor emission reductions. See 76 FR at 48241–44 (tbls.V.D-2–3, 5–6). However, at the notice stage, EPA generated tables showing the extent of reduction in upwind contribution to downwind nonattainment areas that would occur if States adopted emission controls at varying cost increments between $0 and $500/ton. Air Quality TSD (Notice) 69–70 (tbl.3-1), 75–78 (tbl.3-4) (July 2010) (http://www.epa.gov/airtransport/CSAPR /pdfs/TSD_analysis_to_quantify_significant_contribution_7-8-10.pdf). Those tables show that the downwind locations to which Alabama, Georgia, South Carolina, and Texas were linked would attain the NAAQS with SO2 controls costing less than $500/ton. Id. For example, Texas was linked only to Madison, IL, 76 FR at 48241–44 (tbls.V.D-2–3, 5–6), but EPA’s data projected Madison would attain the NAAQS if all States adopted $100/ton cost controls for SO2, Air Quality TSD (Notice) 69, 75.
USCA Case #11-1302 Document #1505492 Filed: 07/31/2014 Page 18 of 70

15
As explained in Luminant’s motion for summary vacatur (at 12–15)
(Doc.1504643), EPA clearly did so with respect to Texas. EPA found that Texas’s
maximum contribution was only slightly above the “insignificance” threshold for the
PM2.5 NAAQS, yet required the State to make substantial emission reductions. See 76
FR at 48240 (tbl.V.D-1) (showing Texas’s maximum contribution of only 0.03 µg/m3
above the “insignificance” threshold of 0.15 µg/m3); id. at 48261–62 (tbl.VI.D-3)
(requiring emission reductions). The same analysis shows EPA exceeded its authority
with respect to South Carolina for ozone. See id. at 48245 (tbl.V.D-7) (showing South
Carolina maximum contribution of only 0.1 ppb above the “insignificance” threshold
of 0.8 ppb); id. at 48262–63 (tbl.VI.D-4) (requiring emission reductions).
3. Industry/Labor petitioners’ unaddressed arguments.
As noted, a number of challenges in the Industry/Labor petitioners’ opening
brief remain unresolved: (i) whether EPA arbitrarily failed to consider lower cost
thresholds when setting emission budgets, Industry/Labor Br. 31–34 (Doc.1364190);
(ii) whether EPA arbitrarily adopted a “one-way” ratchet when setting budgets, id. at
34–36; (iii) whether EPA’s reliance on flawed air-quality modeling was arbitrary and
capricious, id. at 37–47; and (iv) whether EPA’s use of the Integrated Planning Model
to set emission budgets was arbitrary and capricious, id. at 47–52.
The Industry/Labor petitioners have a substantial probability of success on
these arguments for the reasons set forth in their prior briefing. Indeed, the Supreme
Court, by confirming that EPA has a statutory obligation to avoid overcontrol,
USCA Case #11-1302 Document #1505492 Filed: 07/31/2014 Page 19 of 70

16
affirmed the essential predicate of the argument that EPA arbitrarily failed to consider
lower cost thresholds. See supra p. 11. It also confirmed that EPA could not ignore its
air-quality projections that showed substantial downwind attainment in 2014 without
any good-neighbor controls. See supra pp. 11–12.
B. Petitioners Would Suffer Irreparable Harm If The Transport Rule Became Effective In 2015.
EPA’s proposal to implement the Transport Rule in 2015 would require some
petitioners to make deep emission reductions through costly changes at generating
units. These harms are irreparable because the costs cannot be recovered even if
petitioners prevail on the merits. See Armour & Co. v. Freeman, 304 F.2d 404, 406 (D.C.
Cir. 1962) (“loss of profits which could never be recaptured” is irreparable harm); Iowa
Utils. Bd. v. FCC, 109 F.3d 418, 426 (8th Cir. 1996) (inability to recover damages from
government renders economic losses irreparable harm).7
Luminant’s situation is a good example. While EPA is correct that Luminant
has taken steps to reduce emissions during the pendency of the stay, EPA’s proposal
to implement the Transport Rule in 2015 would require further, unlawful emission
reductions that would impose substantial, unrecoverable costs on Luminant. See
generally Goering Decl. (Ex. 1). These unrecoverable costs are more than sufficient to 7 EPA has wrongly contended that financial loss is irreparable only when it threatens the “‘very existence’” of the company. EPA Opp. 17 (Doc.1333987) (citing Wisc. Gas Co. v. FERC, 758 F.2d 669, 674 (D.C. Cir. 1985)). But that is so only when financial loss would later be recoverable. Wisc. Gas, 758 F.2d at 674 (“Recoverable monetary loss may constitute irreparable harm only where the loss threatens the very existence of the movant’s business.”); accord Iowa Utils., 109 F.3d at 426.
USCA Case #11-1302 Document #1505492 Filed: 07/31/2014 Page 20 of 70

17
support preserving the status quo in light of petitioners’ overwhelming probability of
success on the merits. See Aamer v. Obama, 742 F.3d 1023, 1043–44 (D.C. Cir. 2014).
EPA’s own analysis confirms that Texas sources, including Luminant, would be
harmed by a 2015 implementation date. According to EPA, Texas’s Phase 1 SO2
budget is 20% lower than the State’s predicted emissions, EPA Mot., Harvey Decl. at
11, tbl.2, and the substantial allowance shortfall is borne almost entirely by Luminant,
Goering Decl. ¶¶3, 19. Luminant would have a substantial shortfall of NOx
allowances as well. Id. ¶19. Luminant would incur substantial unrecoverable costs to
close this gap. Id. ¶22. Because it operates in a competitive market, even if Luminant
were to prevail, these expenditures could never be recovered. Id. ¶¶2, 22.
ALA’s proposed implementation schedule would exacerbate petitioners’ injury.
First, the more restrictive Phase 2 budgets ALA seeks to have imposed on January 1,
2015, would decrease the availability of allowances that could be traded. Id. ¶23.
Second, by having variability limits apply on January 1, 2015, ALA would diminish the
likelihood that a trading market will develop. Id. Indeed, EPA, quite properly, delayed
application of the variability limits for this very reason. See 77 FR at 10331.
Moreover, as explained in the Declaration of James Marchetti (Ex. 2), ALA’s
speculation that it is feasible to achieve the Phase 2 reductions by January 1, 2015, is
unfounded. Unlike ALA’s declaration, Mr. Marchetti’s declaration is based on
information directly from owners and operators of most of the units discussed in
USCA Case #11-1302 Document #1505492 Filed: 07/31/2014 Page 21 of 70

18
ALA’s declaration. Marchetti Decl. ¶7. The best available data show that affected
parties cannot meet Phase 2 requirements by January 1, 2015. Id. ¶¶16–35.
C. The Equities Favor Maintaining The Stay.
Maintaining the stay will not harm the public health. EPA concedes that
aggregate emissions are substantially lower under the stay with CAIR’s budgets in place
than Phase 1 of the Transport Rule would allow if implemented. See, e.g., EPA Mot.
18. EPA speculates this “could change” because the emission reductions were due “in
part” to non-regulatory factors, but it does not even assert that emissions will exceed the
Transport Rule’s Phase 1 budgets if the stay continues for the limited period needed
for remand proceedings. Id. at 10.8
Instead, EPA’s argument for lifting the stay is premised on asserted benefits
from the Transport Rule’s Phase 2 budgets. Id. at 11 (“In the future, sources will need
to achieve additional emissions reductions to achieve the Rule’s Phase 2 requirements
and fully realize the Rule’s benefits.”). But under EPA’s own proposal, Phase 2
budgets would not go into effect until 2017, and EPA makes no claim that imposing
Phase 1 budgets would have any significant environmental benefits.
Nor could it. As a result of the reductions “already achieved,” id. at 10, EPA
has reported that virtually all downwind locations in the eastern United States attained
8 Tellingly, while EPA’s Harvey claims that “emissions data for the first quarter of 2014 show an increase in emissions of pollutants controlled under Transport Rule programs from the first quarter 2013 levels,” EPA Mot., Harvey Decl. ¶49, he does not claim that 2014 emissions exceed the Transport Rule’s Phase 1 budgets.
USCA Case #11-1302 Document #1505492 Filed: 07/31/2014 Page 22 of 70

19
the NAAQS addressed in the Transport Rule by 2011. E.g., EPA, Progress Report 2011:
Environmental and Health Results Report 12, 14 (2013). EPA found that CAIR-related
reductions were a “significant contributor to these improvements.” Id. at 12.9
Relatedly, the State/Local petitioners demonstrate in detail that the downwind
locations of concern in the Transport Rule are overwhelmingly attaining and
maintaining the applicable NAAQS under CAIR. See State/Local Opp. Part II.B.
By contrast, allowing the Transport Rule to take effect now would cause
disruption in the (likely) event that the Rule is again struck down. Reinstituting CAIR
at that point would be much more complicated than simply maintaining CAIR during
the limited pendency of this appeal (which all agree should proceed quickly). For
example, “banked” CAIR allowances would need to be returned to their owners and
new CAIR allowances distributed. It would also almost certainly result in regulated
entities having purchased Transport Rule allowances that could no longer be used.
EPA’s primary concern seems to be “getting on with the replacement of
CAIR,” EPA Mot. 12–13, regardless of whether CAIR’s replacement is legal and
regardless of the resulting disruption and wasted resources. Lifting the stay now, while
9 ALA seeks to impose Phase 2 budgets because, according to ALA, EPA found the Phase 2 reductions are necessary to prevent thousands of deaths. ALA Resp. 9. This argument is based on a misleading and irrelevant comparison. EPA calculated the Transport Rule’s benefits assuming no good-neighbor restrictions were in place. EPA’s analysis, and thus ALA’s argument, ignores CAIR, which is in place and has produced widespread attainment—a level of air quality that is sufficient “to protect the public health” with “an adequate margin of safety.” 42 U.S.C. §7409(b)(1).
USCA Case #11-1302 Document #1505492 Filed: 07/31/2014 Page 23 of 70

20
the Rule’s legality remains unresolved, would not produce “regulatory certainty,” id. at
13, but only litigation advantage for EPA. Petitioners expect that EPA would argue
that, if the stay is lifted and the Transport Rule becomes effective, CAIR cannot be
reinstituted at the end of this litigation. But that real possibility provides a further
reason for maintaining the stay, because allowing the Transport Rule to take effect
may ultimately dictate petitioners’ ability to obtain effective relief.
CONCLUSION
For these reasons, the Court should deny the motions to lift the stay.
Dated: July 31, 2014 Respectfully submitted,
/s/ Peter D. Keisler F. William Brownell Hunton & Williams LLP 2200 Pennsylvania Avenue, N.W. Washington, D.C. 20037 P. Stephen Gidiere III Balch & Bingham LLP Suite 1500 1901 Sixth Avenue North Birmingham, Alabama 35203
Peter D. Keisler C. Frederick Beckner III Roger R. Martella Jr. Timothy K. Webster Eric D. McArthur Sidley Austin LLP 1501 K Street, N.W. Washington, DC 20005 Tel. (202) 736-8000 Fax (202) 736-8711
Counsel for Luminant Petitioners10
10 Luminant Generation Company LLC, Sandow Power Company LLC, Big Brown Power Company LLC, Oak Grove Management Company LLC, Luminant Mining Company LLC, Big Brown Lignite Company LLC, Luminant Big Brown Mining Company LLC, Luminant Energy Company LLC, and Luminant Holding Company LLC.
USCA Case #11-1302 Document #1505492 Filed: 07/31/2014 Page 24 of 70

21
Daniel J. Kelly Associate General Counsel Energy Future Holdings Corp. 1601 Bryan Street, 41st Floor Dallas, Texas 75201 Counsel for Energy Future Holdings Corp. William M. Bumpers Joshua B. Frank Megan H. Berge Baker Botts LLP 1299 Pennsylvania Ave., NW The Warner, Suite 1300 West Washington, DC 20004 (202) 639-7700 Counsel for Petitioners Entergy Corp., Southwestern Public Service Co., Western Farmers Electric Cooperative Kelly M. McQueen Assistant General Counsel Entergy Services, Inc. 425 W. Capitol Ave., 27th Floor Little Rock, AR 72201 (501) 377-5760 Counsel for Petitioner Entergy Corp.
Stephanie Zapata Moore General Counsel Luminant Generation Company LLC 1601 Bryan Street, 22nd Floor Dallas, Texas 75201 Counsel for Luminant Generation Grant Crandall Arthur Traynor, III United Mine Workers of America 18354 Quantico Gateway Dr., Suite 200 Triangle, VA 22172 (703) 291-2457 Eugene M. Trisko Law Offices of Eugene M. Trisko P.O. Box 47 Glenwood, MD 21738 (301) 639-5238 Counsel for Petitioner United Mine Workers of America Ann M. Seha Assistant General Counsel XCEL Energy Inc. 414 Nicollet Mall, 5th Floor Minneapolis, MN 55401 (612) 215-4619 Counsel for Petitioner Southwestern Public Service Co.
USCA Case #11-1302 Document #1505492 Filed: 07/31/2014 Page 25 of 70

22
Todd E Palmer, Bar No. 46148 Jordan J. Hemaidan, Bar No. 53728 Valerie L. Green, Bar No. 53659 One South Pinckney Street, Suite 700 P.O. Box 1806 Madison, WI 53701-1806 (608) 257-3501 Counsel for Petitioners Wisconsin Paper Council, Inc., Wisconsin Manufacturers and Commerce, Midwest Food Processers Association and Wisconsin Cast Metals Association Jeffrey L. Landsman Vincent M. Mele Wheeler, Van Sickle & Anderson, S.C. 25 West Main Street Suite 801 Madison, WI 53703-3398 (608) 255-7277 Counsel for Petitioner Dairyland Power Cooperative Richard G. Stoll Brian H. Potts Foley & Lardner LLP 3000 K Street, NW, 6th Floor Washington, DC 20007-5143 (202) 672-5300 Counsel for Petitioner Wisconsin Public Service Corp.
Janet J. Henry Deputy General Counsel American Electric Power Service Corp. 1 Riverside Plaza Columbus, OH 43215 (614) 716-1612 Counsel for Petitioners AEP Texas North Co., Appalachian Power Co., Columbus Southern Power Co., Indiana Michigan Power Co., Kentucky Power Co., Ohio Power Co., Public Service Co. of Oklahoma, Southwestern Electric Power Co. Robert A. Manning Joseph A. Brown Mohammad O. Jazil Hopping Green & Sams, PA 119 South Monroe Street, Suite 300 Tallahassee, FL 32301 (850) 222-7500 Counsel for the Environmental Committee of the Florida Electric Power Coordinating Group Bart E. Cassidy Katherine L. Vaccaro Manko, Gold, Katcher & Fox, LLP 401 City Avenue, Suite 901 Bala Cynwyd, PA 19004 (484) 430-5700 Counsel for Petitioner ARIPPA
USCA Case #11-1302 Document #1505492 Filed: 07/31/2014 Page 26 of 70

23
Terry R. Yellig Sherman, Dunn, Cohen, Leifer & Yellig, P.C. 900 7th Street, N.W., Suite 1000 Washington, D.C. 20001 Counsel for International Brotherhood of Electrical Workers Margaret Claiborne Campbell Byron W. Kirkpatrick Hahnah Williams Gaines Troutman Sanders LLP 600 Peachtree St., N.E. 5200 Bank of America Plaza Atlanta, GA 30308 (404) 885-3000 Counsel for Georgia Power Co., Southern Co. Services, Inc., and Southern Power Co. Jeffrey A. Stone Beggs & Lane, RLLP 501 Commendencia Street Pensacola, FL 32502 (850) 432-2451 James S. Alves Gary V. Perko Hopping Green & Sams, P.A. 119 S. Monroe Street, Suite 300 Tallahassee, FL 32301 (850) 222-7500 Counsel for Gulf Power Co.
Steven G. McKinney C. Grady Moore, III Balch & Bingham LLP 1901 Sixth Avenue North, Suite 1500 Birmingham, AL 35203 (205) 251-8100 Counsel for Alabama Power Co. Ben H. Stone Terese T. Wyly Balch & Bingham LLP 1310 Twenty Fifth Ave. Gulfport, MS 39501 (228) 864-9900 Counsel for Mississippi Power Co. Karl R. Moor Southern Company Services, Inc. 31 Inverness Center Parkway, Suite 130 Birmingham, AL 35242 (205) 992-6371 Julia A. Bailey Dulan Southern Company Services, Inc., BIN 1201 30 Ivan Allen Jr., Blvd., Suite 1200 Atlanta, GA 30308 Counsel for Southern Co. Services, Inc
USCA Case #11-1302 Document #1505492 Filed: 07/31/2014 Page 27 of 70

24
Andrea Bear Field Norman W. Fichthorn E. Carter Chandler Clements Hunton & Williams LLP 2200 Pennsylvania Avenue, NW Washington, DC 20037 (202) 955-1500 Counsel for Petitioner Utility Air Regulatory Group
USCA Case #11-1302 Document #1505492 Filed: 07/31/2014 Page 28 of 70

CERTIFICATE OF SERVICE
I hereby certify that on July 31, 2014, I caused the foregoing Opposition to be
served on all registered counsel through the Court’s CM/ECF system.
/s/ Peter D. Keisler Peter D. Keisler Counsel for Luminant Petitioners
USCA Case #11-1302 Document #1505492 Filed: 07/31/2014 Page 29 of 70

EXHIBIT 1
USCA Case #11-1302 Document #1505492 Filed: 07/31/2014 Page 30 of 70

IN THE UNITED STATES COURT OF APPEALS FOR THE DISTRICT OF COLUMBIA CIRCUIT
_______________________________________
Luminant Generation Company LLC, et al.
Petitioners,
v.
Environmental Protection Agency, et al.
Respondents. _______________________________________
)))))))))))
Case No. 11-1315
Declaration of Matthew Goering
1. I am vice president of fuel and emissions strategy for Luminant Energy Company LLC, a
wholesale marketing and trading operation. I will use “Luminant” in this declaration to
refer to all of the Luminant entities that are parties in this matter. I make this declaration
in support of Industry/Labor Petitioners’ opposition to the “Respondents’ Motion to Lift
the Stay Entered on December 30, 2011” of the Cross-State Air Pollution Rule
(“Transport Rule”). See U.S. Environmental Protection Agency, (EPA) Federal
Implementation Plans: Interstate Transport of Fine Particulate Matter and Ozone and
Correction of SIP Approvals, 76 Fed. Reg. 48208 (Aug. 8, 2011).1 In addition to
reviewing EPA’s motion, I have also reviewed and analyzed the supporting Declaration
of Reid Harvey, which explains how EPA proposes to implement the Transport Rule
should the Court grant EPA’s motion. I have also reviewed the declaration filed by
Ranajit Sahu that was filed on behalf of the American Lung Association and several other
groups (collectively, “ALA”) in response to EPA’s motion to lift the stay. This
1 Unless otherwise specified, references to the Transport Rule include corrections to that rule, including corrections to the emissions budgets for Texas. See 77 Fed. Reg. 10324 (Feb. 21, 2012); 77 Fed. Reg. 34830 (June 12, 2012).
USCA Case #11-1302 Document #1505492 Filed: 07/31/2014 Page 31 of 70

2
declaration is based on my personal knowledge and on analyses conducted by my staff
and reviewed by me. All opinions are based on my education, training, and experience in
the power generation industry.
Summary of Harm
2. The purpose of this declaration is to demonstrate that, were the Transport Rule to go into
effect on January 1, 2015, Luminant would suffer irreparable harm as a result. In brief,
the emissions budgets imposed by the Transport Rule for Texas for sulfur dioxide
(“SO2”) and annual and seasonal nitrogen oxides (“NOx”) will not provide Luminant with
sufficient emissions allowances to operate its plants without alterations, including
changes to existing pollution controls and fuel substitution, and the acquisition of
additional allowances through trading. Luminant expects that the single-year cost to
comply with the Transport Rule’s limits would be $17-25 million for 2015. Because
Luminant operates in a competitive, deregulated market, it cannot simply ask the Public
Utility Commission of Texas to increase its rates so as to recover these extra
expenditures; nor can it recover them from EPA. Similar harms would continue to
impact Luminant beyond 2015 for so long as the current Transport Rule remains in
effect, should the stay be lifted. In contrast, none of these harms would occur were
Luminant to continue to comply with the Clean Air Interstate Rule (“CAIR”) until EPA
can promulgate a lawful successor to the Transport Rule.
3. Mr. Harvey’s declaration illustrates why the harm to Luminant will be so significant. As
Mr. Harvey states, Texas is unique among all of the 23 states subject to the Transport
Rule’s SO2 provisions in that its current emission levels are well above the budget limits
that EPA seeks to impose in less than 6 months. Harvey Decl. at Tables 1 & 2. Imposing
the Transport Rule now would require Texas—but no other state—to reduce SO2
USCA Case #11-1302 Document #1505492 Filed: 07/31/2014 Page 32 of 70

3
emissions by approximately 20% from 2013 levels. Harvey Decl. at Table 2. Moreover,
lifting the stay falls even harder on Luminant, because Luminant is entitled to only a
share of the state’s budget and assurance level, and its share reflects an even greater
proportionate deficit of SO2 allowances.
Background
4. I graduated from the University of Kansas with a bachelor’s degree in mechanical
engineering in 1991. I also earned a MBA degree in finance from the Wharton School at
the University of Pennsylvania in 1997.
5. I have been employed by the company, including its predecessor TXU, for over 12 years.
Prior to my current position, I oversaw fuels management for TXU Power (now
Luminant Generation) as well as coal, emissions, crude, and fuel-oil trading for TXU
Portfolio Management (now Luminant Energy).
6. Luminant is the largest competitive power generation company in Texas. Luminant has
over 15,400 megawatts (“MW”) of generation capacity including coal-fueled, gas-fueled,
and nuclear units. This generation portfolio includes 8,017 MW fueled by lignite and
subbituminous coal at twelve coal-fueled electric generating units (“EGUs”) at five
generating plants in Texas. Luminant contributes approximately 22% of the electricity
dispatched to Texas consumers and businesses by the Electric Reliability Council of
Texas (“ERCOT”), the independent system operator that manages Texas’s competitive
power market that serves the majority of the state. Luminant develops and operates
generation units using a variety of fuel sources, including coal, in order to meet the
growing demand for electricity in Texas.
7. I am part of a cross-functional team at Luminant studying all aspects of the Transport
Rule and the company’s compliance options in light of the U.S. Supreme Court decision
USCA Case #11-1302 Document #1505492 Filed: 07/31/2014 Page 33 of 70

4
that remanded the case to the D.C. Circuit Court of Appeals and the EPA’s subsequent
motion to lift the stay that has been in effect since December 30, 2011. This declaration
is based on ordinary-course business analysis that Luminant has conducted to understand
how its operations would be impacted if the Transport Rule were to be put into effect.
During the stay, industry (including Luminant) has continued to comply with CAIR in
lieu of the Transport Rule.
8. The EPA’s motion to lift the stay seeks to have a rule that was originally scheduled to
become effective January 1, 2012, instead become effective January 1, 2015, less than 6
months from now. The Transport Rule contains very detailed provisions regarding
emissions in 2012 and later years. Many of these provisions were issued in rules not
before the Court in this case. Further, because three of the initial years will have passed
while the Transport Rule was stayed, EPA has requested that the Court impose the
Transport Rule as if it were 2012, not 2015. It is not clear to Luminant whether the Court
could or would do so, especially with respect to deadlines and provisions that were issued
in rules not before the Court in this case. EPA has also stated that it would conduct one
or more rulemakings if the Court lifts the stay before EPA could implement the Transport
Rule in 2015. But, EPA has not provided a schedule for those rulemakings, which
themselves may be subject to challenge.
9. Thus, there is much uncertainty in what EPA’s motion is proposing, making it difficult to
predict exactly how a 2015 effective date would impact Luminant. For purposes of this
declaration, my analyses focus on Luminant’s compliance options for 2015 under the
Transport Rule, both as the rule is presently written (i.e., with no tolling or further
rulemaking) and with the three years of tolling requested by EPA and assuming that the
USCA Case #11-1302 Document #1505492 Filed: 07/31/2014 Page 34 of 70

5
additional rulemakings EPA says it would undertake are indeed undertaken and
completed by January 1, 2015. My team, under my supervision, analyzed the Texas and
other states’ emissions budgets for emissions of SO2 and annual and seasonal NOx, the
potential availability of trading allowances to offset otherwise required emission
reductions, and the full range of operational changes that may be possible at Luminant’s
plants, including everything from derating or shutting down plants to installing or
modifying pollution control equipment on short notice to switching types of fuels,
including the intersection of other environmental rules and requirements that apply to
Luminant’s plants such as the Mercury and Air Toxics Standards and specific unit permit
requirements. Due to the very short lead time Luminant has before January 1, 2015,
Luminant could not explore long-term options that may provide lasting, multi-year
benefits. Exploring such options requires both regulatory certainty (as to long-term
compliance requirements) and sufficient lead time for consideration, analysis, planning
and possibly permitting of potentially large, multi-year, capital-intensive projects.
Steps Taken by Luminant Since 2011 to Reduce Emissions
10. Before discussing the harms associated with lifting the stay currently in place, I first note
that Luminant has not sat on its hands since the Transport Rule was stayed at the end of
2011. In support of its original motion for a stay in 2011, for example, Luminant
estimated that its fleet-wide SO2 emissions for 2012 would be almost 240,000 tons.
Now, a mere three years later, Luminant estimates that its total SO2 emissions for 2015
will be almost 85,000 tons lower (see the table below – 155,000 tons), which is a 35%
reduction. The reductions are due to a variety of steps taken by Luminant, including
scrubber upgrades at several plants, improved scrubber utilization rates, some fuel
switching from lignite to lower sulfur coal from the Powder River Basin area of
USCA Case #11-1302 Document #1505492 Filed: 07/31/2014 Page 35 of 70

6
Wyoming, and, for a few units, anticipated seasonal operations. Some reductions—
especially in 2012—also relate to natural gas prices. Nevertheless, as Mr. Harvey’s
declaration states, EPA is still seeking significant additional SO2 reductions from Texas
over 2013 levels, and those reductions, if required in 2015, would, as before, cause
Luminant irreparable harm. Harvey Decl. at Table 2.
The Transport Rule’s Allowance System for SO2 and NOx Emissions
11. EPA seeks to lift the stay and impose stringent annual SO2 and NOx emission limitations
on Texas starting on January 1, 2015, due to concerns about the attainment status of one
“downwind” county in Illinois. It would also impose stringent seasonal NOx emission
limitations starting May 1, 2015, due to concerns about impacts in two other downwind
locations located in Michigan and Louisiana. EPA would impose these limits regardless
of the significant improvements in downwind air quality at the three locations in question
under CAIR that essentially negate the need for the Transport Rule’s limitations.
12. The Transport Rule’s limitations are expressed in emission budgets that are applicable to
EGUs such as those operated by Luminant. The rule includes four trading programs –
one for annual SO2 emissions (subdivided into two groups) and one each for seasonal and
annual NOx emissions – which allow for limited trading of “allowances” from sources in
Texas and other states. The SO2 trading program is further divided among “group 1” and
“group 2” states. Texas is a group 2 state and may only trade with other group 2 states
for the SO2 trading program. Trading allowances essentially represent a ton of emissions
of SO2 or NOx and are used to demonstrate compliance by offsetting emissions that are
not reduced through other means.
13. EPA assigned each state in the emissions trading programs an overall budget for
allowances in the programs in which they participate. The allowances in a state’s budget
USCA Case #11-1302 Document #1505492 Filed: 07/31/2014 Page 36 of 70

7
are further allocated among the sources in that state based on EPA’s modeling
assumptions. Had the Transport Rule not been stayed in December 2011, EPA would
have, under a subsequent “Revisions Rule,” 77 Fed. Reg. 10324 (Feb. 21, 2012),
permitted industry to engage in unlimited allowance trading to comply with the
applicable limits in 2012 and 2013 to achieve compliance with the Transport Rule.
However, as I understand it, that error corrections rule is not before the Court in this case
and is being challenged in separate case that has been stayed pending the conclusion of
this case. Even if the Revisions Rule is deemed effective on January 1, 2015, as written,
it still limits the amount of trading from 2014 forward. (EPA refers to these limits as
“variability limits”). EPA seems to be asking the Court to delay the variability limits by
three years by changing the dates in the Revisions Rule, but I understand that the
Revisions Rule is not before the Court in this case and EPA has not issued a rulemaking
proposal to change the effective date of those variability limits.2
14. The post-2013 limits on allowance trading restrict the number of allowances that can be
acquired by any given company to that company’s allocated share of the state’s
“variability limit” established by EPA. Variability limits allow a state to emit a certain
number of tons in excess of its budgets. However, if a state’s emissions exceed its state
budgets plus variability limits (the sum of which EPA calls “assurance levels”) for SO2,
annual NOx, or seasonal NOx, each individual source with emissions above its pro rata
portion of the assurance level would be penalized by being required to surrender three
allowances for every ton of its excess emissions. Thus, industry’s overall harm would
2 These limitations are found in the current and effective version of 40 C.F.R. §§ 97.410(b), 97.510, 97.610(b), 97.710(b).
USCA Case #11-1302 Document #1505492 Filed: 07/31/2014 Page 37 of 70

8
increase, and the flexibility that EPA intended for the first two years of the program
would be lost, were the Transport Rule to become effective in 2015 as written without
adjustments being made to the applicability of the assurance levels.
15. The increased harms I referred to in the prior paragraph would be all but certain if ALA’s
proposed implementation of the Transport Rule were adopted. As I understand it, ALA is
proposing that there would be no “tolling” of the Transport Rule’s compliance deadlines
and that regulated sources would be required to meet the Rule’s “Phase 2” budgets on
January 1, 2015. For many states, the Transport Rule’s Phase 2 budgets are more
restrictive than their Phase 1 budgets and, even for those states that have the same
budgets, there would be fewer allowances available for trading if Phase 2 budgets were
implemented on January 1, 2015. I further understand that ALA would have the
variability limits that restrict allowance trading apply on January 1, 2015.
The Transport Rule Provides Insufficient Allowances for Luminant Plants to Operate Normally in 2015
16. Luminant operates both coal-fueled and gas-fueled plants that emit SO2 and NOx.
Generally, the Transport Rule’s SO2 and NOx limitations are the constraining factor for
the coal plants, and its NOx limitations are the constraining factor at the gas plants.
17. In his declaration, Mr. Harvey focuses on state budgets and assurance levels, but not on
individual sources or companies. As I noted above, for example, the Texas SO2 budgets
and the assurance level are insufficient to meet the state’s needs for allowances. But
much more critically, it is the allocation of those budgets among individual sources that
determine a company’s compliance obligations. Even where a state may have a “surplus”
of allowances, individual sources may not hold sufficient allowances to operate normally.
USCA Case #11-1302 Document #1505492 Filed: 07/31/2014 Page 38 of 70

9
18. Ranajit Sahu makes this same error in his analysis. In fact, he assumes for example that
there is no shortage of annul NOx allowances in Texas, yet I demonstrate below that
Luminant faces exactly that deficit. He also suggests that some so-called “cleaner”
sources will be coming on-line in Texas, and he seems to imply that this will materially
impact the compliance obligations of individual sources. As noted, the fact that other
generating sources may come on line in 2015 does not change the fact that, under EPA’s
current distribution of allowances, Luminant would not be allocated sufficient allowances
to continue normal operations in 2015. Further, dispatch of wind-generation is very
irregular because those sources are often not generating power when they can be
economically dispatched. In any event, my analysis is based on the best estimates
available of the expected mix of generation and dispatch for 2015 in Texas, including the
extent to which Luminant facilities would be dispatched.
19. Luminant’s allocated share of allowances for SO2, and seasonal NOx for 2015 is
insufficient to allow continued operation of the existing fleet of generation assets without
causing significant harm as discussed in more detail below. Neither Mr. Harvey nor Dr.
Sahu consider the allocations to specific companies and, contrary to their suggestions, if
the Transport Rule were to go into effect, Luminant would have a substantial shortfall of
emissions allowances. Table 1 summarizes the shortfall that Luminant expects to see for
its own operations in 2015. As noted, this is based on Luminant’s ordinary-course
business analysis of expected operations in 2015.
USCA Case #11-1302 Document #1505492 Filed: 07/31/2014 Page 39 of 70

10
Table 1: Estimated 2015 Allowance Shortfalls (exclusive of Oak Grove 2 which is considered a new unit.)
Group 2SO2
AnnualNOx
SeasonalNOx
Luminant’s Projected Emissions (tons) 155,000 31,000 15,800
Luminant’s Share of Allowances 95,201 32,048 14,998
Luminant’s Projected Allowance Shortfall 59,799 (1,048) 802
20. Based on our analysis of the potential SO2 and NOx (annual and seasonal) trading
markets, Luminant does not believe that a significant market would exist in 2015 for
group 2 SO2 allowances. First, Texas itself will not have sufficient allowances to cover
estimated state-wide SO2 emissions from Texas EGUs, leaving no SO2 allowances left
over for trading among generators within the state. Second, Luminant expects companies
to approach this new trading market conservatively. This is particularly true for regulated
utilities, which have little economic incentive to sell their allowances quickly,
particularly since allowances can be used to demonstrate compliance in future years.
Thus, while the seven group 2 states collectively may have a surplus of SO2 allowances
available for trading, Luminant has no guarantee that any individual company would be
willing to sell its allowances at a reasonable price or at all. Projections of actual
emissions are not always accurate; therefore, companies presumably would not part with
their allowances until they are confident they will not need them, which may not be until
late in the year, following the end of the compliance period, or after the surrender
deadline; or they may choose to bank the allowances for future company use. Companies
are also competitive, and those with excess allowances may wish to retain them for a
perceived competitive advantage. I believe this would be true even if the three years of
USCA Case #11-1302 Document #1505492 Filed: 07/31/2014 Page 40 of 70

11
tolling requested by EPA were granted, although the odds are better for a market to
develop in that scenario. As a prudent manager of risk, Luminant could not wait
indefinitely for a market to develop and risk noncompliance with the Transport Rule.
21. In contrast, Luminant predicts that a limited market may develop for trading annual and
seasonal NOx allowances, largely because of the larger size of the marketplace (23 states
for annual NOx allowances and 25 states for seasonal NOx allowances). This result is
even more likely if the three years of tolling requested by EPA were granted.
Harms Caused by the Transport Rule’s SO2 and NOx Budgets
22. As noted, in order to comply with the Transport Rule in 2015 (with or without the three
years of tolling and rule changes by EPA), Luminant expects that it would have to reduce
its overall SO2 emissions from an estimated 155,000 tons to 95,201 tons. To achieve
those reductions on short notice (i.e., in a matter of months, without the years of lead time
necessary to design, permit, fabricate, install, test, and commence operating major new
pollution control equipment), Luminant would have to take the following actions:
immediately increase operation and maintenance expenditures to procure additional
consumables for use at multiple plants to enable scrubber units to remove additional SO2
emissions; increase purchases of lower sulfur Powder River Basin coal; and/or attempt to
acquire both SO2 and NOx allowances, to the extent a market develops and the price of
the allowances is cost-effective in comparison to other options (such as more scrubbing
and more fuel switching). Assuming some amount of cost-effective SO2 allowances are
available, I estimate that the total estimated harm for 2015 would be $17-22 million. If
cost-effective SO2 allowances are not available, or if no market develops at all, then the
total harm is likely to be approximately $25 million. Again, this harm is irreparable, as
USCA Case #11-1302 Document #1505492 Filed: 07/31/2014 Page 41 of 70

USCA Case #11-1302 Document #1505492 Filed: 07/31/2014 Page 42 of 70

EXHIBIT 2
USCA Case #11-1302 Document #1505492 Filed: 07/31/2014 Page 43 of 70

1
IN THE UNITED STATES COURT OF APPEALS FOR THE DISTRICT OF COLUMBIA
EME HOMER CITY GENERATION, L.P., ) ) Petitioner, ) ) v. ) No. 11-1302 (and ) consolidated cases) UNITED STATES ENVIRONMENTAL PROTECTION AGENCY, et al.,
) )
) (COMPLEX) Respondents, ) )
DECLARATION OF JAMES MARCHETTI
1. I, James Marchetti, under penalty of perjury, affirm and declare that the following statements are true and correct to the best of my knowledge and belief and that they are based upon my own personal knowledge, on information gathered from the sources described herein, and on information contained in the documents and other records cited herein.
2. I am an economist, with masters degrees from both Rutgers University and Boston University. As a consultant, I have over 35 years of experience in performing various kinds of environmental policy, regional and environmental economic analyses for a variety of companies, including many in the electric generation industry.
3. I have completed numerous strategic analyses related to environmental policy and compliance. I co-developed the Emission-Economic Modeling System (EEMS) and maintain its database. EEMS and its database have been used by electric utilities to evaluate the economic and technological implications of state and federal multi-pollutant regulatory proposals and policies.
USCA Case #11-1302 Document #1505492 Filed: 07/31/2014 Page 44 of 70

2
4. I have conducted numerous technical analyses of EPA’s Cross-State Air Pollution Rule (“CSAPR” or the “Transport Rule”) for utilities, trade associations and others, some of which are listed below:
• For a Georgia utility, I evaluated its sulfur dioxide (“SO2”) and nitrogen oxide (“NOx”) emission exposure and allowance banks for several EPA rules, including CSAPR, and I assisted that utility in providing comments to EPA on several notices of data availability related to the Transport Rule. I also evaluated the final Transport Rule and proposed revisions to that rule, focusing on how these proposed revisions affect Georgia state budgets and unit allowance allocations.
• For a group of Kansas utilities, I estimated the availability of CSAPR SO2 (Group 2) allowances, annual NOx allowances, and seasonal NOx allowances for the years 2012 to 2014.
• For an Indiana utility, I determined a compliance plan under the Transport Rule, the Mercury and Air Toxics Standards (“MATS”) Rule, and hypothetical Transport Rules II and III. This analysis was submitted as a supporting document to the Indiana Public Service Commission.
• For a trade association, I developed two specific CSAPR databases: (i) a database that illustrated 2012 and 2014 SO2 (Group 1 and Group 2) budgets, annual NOx budgets, and seasonal NOx budgets for the final Transport Rule and proposed revisions to that rule; and (ii) a database focused on a specific group of units to evaluate their 2012 to 2014 allocations of SO2, NOx annual and NOx seasonal allowances under CSAPR.
• For the Utility Air Regulatory Group (“UARG”), I used the EEMS database to identify EPA modeling errors in CSAPR. This analysis was submitted to EPA by UARG in support of UARG’s petition for reconsideration of CSAPR.
• For a trade association, I developed a series of databases related to emission exposure and costs under both the proposed and the final versions of the Transport Rule.
USCA Case #11-1302 Document #1505492 Filed: 07/31/2014 Page 45 of 70

3
5. This declaration is filed in support of the Joint Opposition of Industry/Labor Petitioners to Motions to Lift the Stay, to be filed in the above-captioned case on July 31, 2014. I was retained by petitioner UARG to conduct the analysis described in this declaration.
6. The purpose of this declaration is to provide comments on and corrections to statements made in the Declaration of Ranajit Sahu (“Sahu Dec.”), which was filed in support of the Response of Public Health Intervenors to Respondents’ Motion to Lift the Stay Entered on December 30, 2011 Combined with Motion for Alternative Relief. In his declaration, Dr. Sahu examined past and current SO2 emissions from and emission rates of electric generating units (“EGUs”) in seven states (Indiana, Kentucky, Michigan, Ohio, Pennsylvania, Texas, and Wisconsin) and EGUs’ NOx emission and emission rates in one state (Missouri). Following that examination, Dr. Sahu concluded that the Transport Rule’s Phase 2 emission budgets for NOx and SO2 are achievable by early 2015. See Sahu Dec. at ¶¶ 5, 11, and 17.
7. In preparing this declaration, I not only reviewed Dr. Sahu’s emission calculation methodology and assumptions regarding emission control technology deployment schedules and emission rates, but also contacted individuals familiar with emission units evaluated by Dr. Sahu. In addition, I consulted publicly available information concerning the operations of relevant EGUs, and I reviewed information concerning the capabilities of emission control equipment. Based on my comprehensive review and the information available to me, I believe the information that I present in this declaration correctly represents how these EGUs can be expected to operate in the next few years.
Methodology in the Sahu Declaration
8. In his analysis, Dr. Sahu makes several key assumptions. First, Dr. Sahu “focus[es] . . . on the assurance levels” established in Phase 2 of the Transport Rule – rather than on the actual emission budgets established by the Rule – because “assurance levels . . . place a firm cap on emissions from EGUs in each of the covered states.” Sahu Dec. ¶6. In addition, Dr. Sahu assumes that it is reasonable to use one year of emissions and emission rate data and to base predictions of future-year compliance on that narrow snapshot of data. See, for example, Sahu
USCA Case #11-1302 Document #1505492 Filed: 07/31/2014 Page 46 of 70

4
Dec. ¶14 (“I assume for the purpose of this analysis that EGUs without SCR [selective catalytic reduction] controls [for NOx emissions] continue operating at their 2013 NOx emission rates”). Because a number of Dr. Sahu’s methodological assumptions are flawed, his reliance on them has led him to draw erroneous conclusions as to whether, and to what extent, regulated sources in affected states will be able to comply with Phase 2 of the Transport Rule by early 2015.
9. Dr. Sahu’s initial premise is that the assurance levels provide the operative frame of analysis. For that premise to work, by the beginning of 2015, EGUs in a state that needs allowances in 2015 would have to be able to get those allowances from EGUs in other states – states that would not need the extra allowances for their own EGUs. To evaluate the reasonableness of this assumption, I compared the actual year-2013 SO2 emissions of EGUs in Group 1 states with those same states’ Phase 2 emission budgets under CSAPR. I focused on the Group 1 states because Dr. Sahu’s analysis focused primarily on Group 1 states. (The Sahu analysis addresses only one Group 2 state: Texas.) As illustrated by the table below, total SO2 emissions from all Group 1 states’ EGUs in 20131 exceeded the total of CSAPR budgets for Group 1 states by over 500,000 tons.2
2013 Group 1 SO2 Emissions Total
Group 1: Phase 2 Budgets Total
1,876,246 1,372,631
1 The present analysis uses 2012 and 2013 emissions figures, as well as state budget and assurance levels, as they appear in Tables 1, 2, 3, and 4 in the Declaration of Reid Harvey that was attached to EPA’s motion to lift the stay filed on June 26, 2014. 2Group 1 emissions are from the U.S. Environmental Protection Agency’s Clean Air Markets Division’s Air Markets Program Data file (“CAMD Air Markets Program Data File”) for the states of Illinois, Indiana, Iowa, Kentucky, Maryland, Michigan, Missouri, New Jersey, New York, North Carolina, Ohio, Pennsylvania, Tennessee, Virginia, West Virginia and Wisconsin.
USCA Case #11-1302 Document #1505492 Filed: 07/31/2014 Page 47 of 70

5
10. Carrying this analysis a step further, I compared EGU SO2 emissions from Group 1 states in the first quarter of 2013 to EUG SO2 emissions from those same states in the first quarter of 2014. I determined that SO2 emissions from Group 1 states increased from a total of 491,151 tons in the first quarter of 2013 to a total of 575,496 tons in the first quarter of 2014.3 That this upward trend in SO2 emissions might continue into 2015 is supported by the year-2015 emissions forecast in the Energy Information Administration’s (“EIA”) Annual Energy Outlook 2014 (AEO2014).4
11. This information indicates that even if now-planned “scrubbers,” or flue gas desulfurization devices, to reduce EGUs’ SO2 emissions are installed on schedule and even if plant retirements occur when scheduled, it is likely that in 2015 there would be few SO2 allowances available for trading among states in Group 1. Moreover, any banked allowances under the Clean Air Interstate Rule (“CAIR”), which is the program that preceded CSAPR and which remains on the books unless and until the Transport Rule is implemented, cannot be carried over and used to fulfill emission reduction requirements under Phase 2 of CSAPR. Because there will not be an abundance of allowances that EGUs in “over-budget” Group 1 states could use to meet their CSAPR Phase 2 obligations by 2015, it is not reasonable to conclude that Phase 2 of CSAPR could be implemented for Group 1 states in 2015.
12. There are also problems with the methodology that Dr. Sahu used to compute potential emission reductions in the states he evaluated. First, Dr. Sahu selected the lowest emission rates, whether it was a single year or the average of “the three lowest” years. Sahu Dec. ¶¶ 8, 14. This approach, however, will produce biased results. To avoid such bias, it is necessary to look at operational data averaged over a longer period (typically a five- to six-year period), without using or averaging only the “lowest” years. 3 From CAMD Air Markets Program Data File. 4 The electricity market regions that are included in the EIA modeling and that cover the Group 1 states are: MRO East, NPCC Upstate NY, RFC East, RFC Michigan, RFC West, SERC Gateway, SERC Central and SERC VACAR. According to the Reference Case in AEO2014, in 2015, SO2 emissions within these regions will total in excess of 2 million tons.
USCA Case #11-1302 Document #1505492 Filed: 07/31/2014 Page 48 of 70

6
13. Equally important, to get an accurate picture of unit emission rates, it is necessary to talk to those operating the affected units and to inquire about how a particular unit may operate in the future. For example, one can make a theoretical calculation that, at a particular facility, a newly installed scrubber with an assumed SO2 emission removal efficiency of 95 percent, with the facility using its current coal, would yield a particular emission rate. But what if the plant operator changes the coal being burned at the facility? If that happens, the emission rate might well change – it might be higher or lower. In short, if one looks at only a small window of operating data and picks the lowest emission rates within that window, and if one does not undertake a more detailed analysis that includes discussions with operators, inaccuracies in emission predictions are likely.
14. An additional flaw is Dr. Sahu’s use of the average heat input for the years 2012 and 2013 to predict future emissions. Sahu Dec. ¶8. Heat input is affected by numerous factors that change over time, such as weather, electricity demand and planned retirements of EGUs, as well as outages of EGUs – both outages that are planned and those that are unplanned due to unforeseen contingencies – during the relevant period. Thus, in cases where heat input is lower in the first year (e.g., 2012) than in the second year (2013), the use of a two-year (2012-2013) average heat input may well lead an analyst to erroneously project lower-than-actual emissions and greater-than-actual emission reductions in subsequent years. For this reason, I believe that the use of a two-year average heat input is inappropriate. To obtain a more accurate prediction, it would be better to use publicly available regional electric generation forecasts by fuel type. Such data are currently available in AEO2014.
State-Specific Information on SO2 Emissions
15. The flaws in Dr. Sahu’s methodology have a significant effect on his emission reduction predictions. The following is a state-by-state review of Dr. Sahu’s predictions for SO2 and flaws with each. It should be noted that in this part of my analysis, I accepted, for purposes of the analysis, the following assumptions that Dr. Sahu made: (i) use of the average 2012-2013 annual heat input to estimate new or 2015 emission levels; (ii) use of Dr. Sahu’s 2013 emission levels to estimate potential emission reductions; and (iii) attribution of emission reductions
USCA Case #11-1302 Document #1505492 Filed: 07/31/2014 Page 49 of 70

7
to emission control technologies or EGU retirements. I made these assumptions here solely for purposes of comparison of Dr. Sahu’s calculations to mine.
Texas
16. In 2012, Texas’ SO2 emission levels were 339,309 tons compared to the CSAPR Phase 2 assurance level of 347,476 tons and the state budget of 294,471 tons. In 2013, however, state SO2 emissions exceeded the state’s Phase 2 assurance level: they totaled 365,657 tons, which is more than 18,000 tons above the state’s Phase 2 assurance level (and more than 71,000 tons above the state’s Phase 2 budget).
17. In his declaration, Dr. Sahu concludes that Texas would be able to comply with its CSAPR Phase 2 assurance level if it were “merely” to return to 2012 SO2 emission levels. Sahu Dec. ¶19. However, electric utilities in Texas cannot reasonably be expected to cut back so significantly on the amount of generation they must produce in 2015 because there are now extremely tight reserve margins in the Electric Reliability Council of Texas (“ERCOT”) and ERCOT forecasters expect about 68,000 MW of peak electric demand in 2014, which is within 1 percent of the all-time electric demand peak (68,305 MW) set on August 3, 2011.5 Even though ERCOT expects six new combined-cycle units to begin operations in August 2014, ERCOT expects the state's existing coal resources to help meet this demand. This is confirmed by available generation data for the first quarter of 2013 and the first quarter of 2014. The data show that Texas’s total generation increased from 93,657 GWh in the first quarter of 2013 to 102,041 GWh in the first quarter of 2014, while the state’s coal-fired generation increased from 32,469 GW to 36,907 GWh during the same period.6 Given these facts, it is very unlikely that Texas’s SO2 emissions in 2015 will fall below the CSAPR Phase 2 budget or assurance level for Texas.
Michigan
5 See ERCOT news release May 1, 2014, entitled Several new power plants expected to begin operating by late summer, available at www.ercot.com/news/press_releases/show/26625 6 From EIA’s” Form-923 monthly data.
USCA Case #11-1302 Document #1505492 Filed: 07/31/2014 Page 50 of 70

8
18. Dr. Sahu concludes that scrubber retrofits at DTE Energy’s Monroe Units 1 and 2 should bring Michigan below that state’s assurance level. Sahu Dec. ¶20. It is true that the operation of the two new scrubbers at Monroe 1 and 2 could reduce the state’s SO2 emissions. The operation of the new scrubbers, however, is unlikely to yield SO2 reductions of more than 40,000 tons, as Dr. Sahu asserts. Sahu Dec. ¶20. That is because DTE is currently blending higher-emitting petroleum coke and eastern bituminous coals with the current low-sulfur sub-bituminous coal at the Monroe units with scrubbers. This type of blending will occur at the new scrubbed units at Monroe 1 and 2, based on a discussion with the plant operator.7 This will result in potential SO2 reductions of between 32,000 to 36,000 tons. That means that after scrubber installation, Michigan’s SO2 emissions will be between 14,000 and 18,000 tons above the CSAPR Phase 2 state budget (143,995 tons), requiring utilities within the state to enter an allowance market where there might well be no available allowances.
Wisconsin
19. Dr. Sahu concludes that Wisconsin would be able to “meet its Phase 2 SO2 assurance level starting in 2015 with no difficulty” due to the operation of two new scrubbers at Columbia Units 1 and 2. Sahu Dec. ¶21. It is true that the two scrubbers at Columbia Units 1 and 2 may be able to reduce Wisconsin's 2015 SO2 emission emissions by about 20,000 tons. This misses the point, however: even with these reductions from the two Columbia units, depending on the level of 2015 emissions state-wide, Wisconsin could still be above its SO2 Phase 2 budget, thereby requiring utilities in the state to enter an allowance market in which there may well be few if any available allowances.
Pennsylvania
20. Dr. Sahu estimates that in 2015, Pennsylvania could achieve a reduction of 185,867 tons of SO2 emissions below 2013 levels of emissions, a reduction that, he says, would put the state below its Phase 2 assurance level and Phase 2 state budget. Sahu Dec. ¶22-25 and Table 3. This calculation is incorrect.
7 2013 EIA Form-923 illustrates this type of fuel blending at Monroe Units 3 and 4.
USCA Case #11-1302 Document #1505492 Filed: 07/31/2014 Page 51 of 70

9
21. The major factor contributing to Dr. Sahu’s calculated 2015 emission reduction level in Pennsylvania is emission reductions projected from the Homer City Unit 1 and Unit 2 scrubbers, which – according to Dr. Sahu – will be in operation in the third quarter of 2015 and will contribute almost 106,000 tons of Pennsylvania’s potential SO2 emission reductions in 2015. Sahu Dec. ¶24 & Table 3; see also Sahu Dec. ¶24 (stating, without supporting citation, that “it is my opinion that [the scrubbers] can commence operation at the end of 2014.”).
22. In fact, however, construction on the Homer City scrubbers will not be completed until the end of 2015, and full operation will not begin until 2016.8 Therefore, there will be no potential emission reductions associated with the Homer City scrubbers in 2015.
23. Dr. Sahu also calculates slightly over 23,000 tons of potential SO2 emission reductions from Keystone Units 1 and 2. Sahu Dec. Table 3. Dr. Sahu’s calculation was premised on an assumed SO2 emission rate of 0.06 lbs/mmbtu at those units. This assumed emission rate by Dr. Sahu is incorrect. The operational SO2 emission rate for Keystone is 0.5 lbs/mmbtu, based upon a discussion with plant operator. If the correct emission rate is used, there will be no SO2 emission reductions at these units.
24. If these two major miscalculations and other errors in Dr. Sahu’s analysis are corrected, the 2015 SO2 emission reductions in Pennsylvania would be closer to 12,811 tons, as shown in Table 1 attached to this declaration. This would leave the state more than 107,000 tons above its Phase 2 assurance level of 132,185 tons.
Ohio
25. Dr. Sahu calculates that in 2015, Ohio could potentially reduce its SO2 emissions by 143,565 tons from 2013 levels, a reduction that, he says, would bring Ohio’s emissions below its Phase 2 assurance level. See Sahu Dec. ¶¶22, 26 and Table 4. I believe that this calculation is based on several faulty premises,
8 See Homer City Generation, L.P, Management Financial Statements, March 31, 2014, available at www.homercitygeneration.com/docs/Homer_City_Generation_LP_Q1_14_FS_Final.pdf.
USCA Case #11-1302 Document #1505492 Filed: 07/31/2014 Page 52 of 70

10
including the following: (i) Dr. Sahu assigned very substantial emission reductions to a coal-fired unit retiring (or converting to natural gas firing) in 2016 (Avon Lake Unit 12), and it is implausible to assume substantial emission reductions in 2015 from a unit that is planning to retire early the following year; (ii) he made errors in retirement schedules; and (iii) he miscalculated SO2 emission rates. If these errors are corrected, the data show that there would be year-2015 emission reductions in Ohio (103,241 tons below what they were in 2013, as shown in Table 2). However, that would still leave the state almost 11,000 tons above its Phase 2 assurance level of 167,843.
Indiana
26. Dr. Sahu calculates that in 2015, Indiana sources could potentially reduce their SO2 emissions by 64,833 tons from 2013 levels. See Sahu Dec. ¶¶ 27, 28 and Table 5. Even with these reductions, however, Indiana’s SO2 emissions would still exceed its Phase 2 assurance level of 196,410 tons, as Dr. Sahu concedes. In fact, the situation in Indiana is bleaker if one uses more accurate information. In particular, based on discussions with operators of the relevant facilities, I recalculated SO2 emission rates at Rockport 1 and 2 (from installation of direct sorbent injection (“DSI”)), at RM Schahfer 14 and 15 (from new scrubbers),9 and at Michigan City 12 (from a new scrubber). Using more accurate emission rate data suggests that there might be a slightly greater increase in potential reductions in 2015: 66,953 tons instead of Dr. Sahu’s estimate of 64,833 tons, as shown in Table 3.
27. Even with this recalculated net change in potential reductions, however, Indiana will still be above its state assurance level by almost 4,900 tons. Dr. Sahu suggests that to reach the state assurance level, utilities in Indiana could: (i) run existing scrubbers at higher SO2 removal efficiencies; (ii) reduce the sulfur content at several coal-fired units; and (iii) dispatch lower-emitting sources. These assertions, however, fail to take into account the following economic, regulatory, and operational issues faced by Indiana utilities.
9 In Dr. Sahu’s tables, these units are listed as Stations 14 and 15.
USCA Case #11-1302 Document #1505492 Filed: 07/31/2014 Page 53 of 70

11
• By 2015, all operating coal-fired units in Indiana will have some kind of SO2 emission control system in operation, and those without such systems will be retired by 2016. Many of these units are operating under consent decrees and either already have high SO2 removal efficiencies or demanding emission rate targets.
• Some of the units with newer scrubbers have shifted to a higher sulfur coal due to economic considerations.
• In 2012, Indiana’s natural gas-fired combined-cycle facilities, which are substantially lower-emitting than coal-fired units, operated at an average 53 percent capacity factor, and for these facilities to increase their generation to displace coal-fired generation would be highly dependent on the relationship between the price of natural gas and the price of coal. If the price of natural gas remains at or above $3.50 per mmbtu (Henry Hub),10 it is likely that there will be much displacement of coal-fired generation.
28. Given the increase in Indiana EGUs’ SO2 emissions between the first quarter of 2013 (73,467 tons) and the first quarter of 2014 (90,317 tons),11 it is very likely that Indiana will be above its assurance level in 2015.
Kentucky
29. Dr. Sahu calculates that by early 2015, Kentucky sources could potentially reduce their SO2 emissions by 49,284 tons from 2013 levels. Sahu Dec. ¶30 and Table 6. Even with these reductions, the state would still exceed its Phase 2 assurance level of 125,415 tons by 13,416 tons. Sahu Dec. ¶31. Errors in Dr. Sahu’s 2015 reduction calculation, however, make the situation even worse for Kentucky sources. In particular, Dr. Sahu may have overestimated emission reductions attributable to Green River Units 4 and 5. These reductions account for almost 40 percent of Dr. Sahu’s estimated reductions. In his analysis, Dr. Sahu assumed that these units would be retired in 2015. However, Green River’s owner and operator, LGE-KU, is currently evaluating the possibility of keeping both units 10 According to the U.S. Department of Energy, Office of Electricity Delivery and Energy Reliability, Energy Assurance Daily (July 30, 2014), the Henry Hub price for July 30, 2014, was $3.75/mmbtu. 11 From CAMD Air Market Program Data File.
USCA Case #11-1302 Document #1505492 Filed: 07/31/2014 Page 54 of 70

12
in operation through 2015 and retiring them in 2016, based on a discussion with the plant operator. This shift in the retirement schedule could reduce Dr. Sahu’s estimated reductions in 2015 by over 40 percent.
30. Other corrections to Dr. Sahu’s Kentucky calculations pertain to changes in scrubber schedules and emission rates, based upon discussions with plant operators. Once these errors are corrected, there is a potential SO2 emission reduction of only 21,425 tons in 2015 from 2013 levels, as shown in Table 4. The recalculated emission reduction level pushes the state even further above its assurance level, by 41,275 tons.
31. Dr. Sahu proposes a strategy to achieve the Phase 2 assurance level in Kentucky by reducing the capacity utilization at Paradise Units 1 and 2 and by making up the lost generation from the state’s natural gas-fired capacity. The state’s natural gas capacity is, however, entirely at simple-cycle combustion turbines, which are not designed to operate at levels to replace baseload coal-fired capacity such as that at the Paradise units. Taking this into account, it is clear that Kentucky will be unable to reduce its SO2 emissions to its assurance level in 2015.
Missouri
32. Dr. Sahu uses an unusual methodological approach to estimate the seasonal and annual NOx emission reductions that could be achieved by sources in Missouri. In particular, for units that already are equipped with SCR, he selected either the average of the three lowest NOx emission rates from 2008-2012 or the 2013 NOx rate, whichever is lower. Sahu Dec. ¶14 and Tables 1 and 2 (footnote *). Using this approach, Dr. Sahu calculated that in 2015, Missouri could potentially reduce its annual NOx emissions by 30,310 tons from 2013 emissions of 75,943 tons (see Sahu Table 2). These reductions would put Missouri below both its Phase 2 annual NOx budget of 48,743 tons and its Phase 2 annual NOx assurance level of 57,517 tons.
33. Dr. Sahu’s methodological approach, however, is flawed and produces a biased result. That is because his assumed levels of emission rate performance are not achievable on a long-term basis. To determine more realistic long-term NOx emission rates, one must take into account the variability that can exist in NOx emission rates under specific regulatory regimes, which is greatly affected by
USCA Case #11-1302 Document #1505492 Filed: 07/31/2014 Page 55 of 70

USCA Case #11-1302 Document #1505492 Filed: 07/31/2014 Page 56 of 70

Facility Name Unit ID FGD
Controls
2013 SO2 Emissions
(tons)
2013 Heat Input
(MMBtu)
2013 SO2 Rate
(MMBtu)
Average of the 2012-2013 Heat Input (MMBtu)
Re-calculated SO2 Rate
(lb/MMBtu)
Possible 2015 SO2 Emissions
(tons)
Possible SO2 Emissions
Reductions in 2015 due to SO2
Controls and Retirements
(tons)
Operational Comments
Homer City 1 No 55,726 36,957,407 3.02 32,973,144 2.92 48,141 0Construction will be completed on or about 12/31/15. Both FGDs will not be in full operation until 2016. Assume the 2008 to 2012 SO2 emission rate
Homer City 2 No 55,451 37,618,511 2.95 36,422,221 2.87 52,266 0Construction will be completed on or about 12/31/15. Both FGDs will not be in full operation until 2016. Assume the 2008 to 2012 SO2 emission rate
Keystone 1 Yes 14,600 58,508,622 0.5 54,920,457 0.5 13,730 870 Operational SO2 emission rate 0.5, burning a 4.0lbs/mmbtu SO2 coal
Keystone 2 Yes 11,797 62,098,517 0.38 53,223,278 0.5 13,306 -1,509 Operational SO2 emission rate 0.5, burning a 4.0lbs/mmbtu SO2 coal
Bruce Mansfield 3 Yes 10,830 61,694,411 0.35 61,584,397 0.25 7,698 3,132
Consent Decree requires a 95 percent removal. Currently burning a coal with an SO2 emission rate of at least 5.0lbs/mmbtu of SO2, resulting in minimal emission rate of 0.25 lbs/mmbtu
Shawville 3 No 9,259 6,258,873 2.96 5,394,371 2.75 2,166 7,093Retiring by April 2015. Need to prorate emission possible emission reductions. Assume retirement date April 15, 2015
Montour 2 Yes 6,440 33,116,889 0.39 35,992,568 0.41 7,378 -938
Based upon the average SO2 emission rate between 2009 to 2012. Unit is burning a 3.9 lb SO2 coal with a 89 percent removal efficiency and are expected to be operating at this level in the near term
Brunner Island 3 Yes 6,277 34,347,206 0.37 32,494,479 0.39 6,336 -59
Based upon the average SO2 emission rate between 2010 to 2012. Unit is burning a 3.9 lb SO2 coal with a 90 percent removal efficiency and are expected to be operating at this level in the near term.
Shawville 4 No 6,164 4,130,558 2.98 4,173,337 2.94 1,791 4,373Retiring by April 2015. Need to prorate emission possible emission reductions. Assume retirement date April 15, 2015
Montour 1 Yes 5,996 34,339,654 0.35 36,193,047 0.4 7,239 -1,243
Based upon the average SO2 emission rate between 2009 to 2012. Unit is burning a 3.9 lb SO2 coal with a 90 percent removal efficiency and are expected to be operating at this level in the near term
Shawville 2 No 5,431 3,639,389 2.98 3,298,748 2.99 1,440 3,991Retiring by April 2015. Need to prorate emission possible emission reductions. Assume retirement date April 15, 2015
Table 1 - Pennsylvania SO2USCA Case #11-1302 Document #1505492 Filed: 07/31/2014 Page 57 of 70
10018
Typewritten Text
10018
Typewritten Text
Pennsylvania Table (Page 1 of 3)

Facility Name Unit ID FGD
Controls
2013 SO2 Emissions
(tons)
2013 Heat Input
(MMBtu)
2013 SO2 Rate
(MMBtu)
Average of the 2012-2013 Heat Input (MMBtu)
Re-calculated SO2 Rate
(lb/MMBtu)
Possible 2015 SO2 Emissions
(tons)
Possible SO2 Emissions
Reductions in 2015 due to SO2
Controls and Retirements
(tons)
Operational Comments
Table 1 - Pennsylvania SO2
Shawville 1 No 4,815 3,294,155 2.92 2,900,103 2.92 1,236 3,579Retiring by April 2015. Need to prorate emission possible emission reductions. Assume retirement date April 15, 2015
Conemaugh 1 Yes 4,131 63,446,309 0.13 57,263,201 0.13 3,722 409Based upon the average SO2 emission rate between 2008 to 2012. Unit is burning a 3.9 lb SO2 coal with a 97 percent removal efficiency
Bruce Mansfield 1 Yes 3,437 60,073,633 0.11 57,376,073 0.25 7,172 -3,735
Consent Decree requires a 95 percent removal. Currently burning a coal with an SO2 emission rate of at least 5.0lbs/mmbtu of SO2, resulting in minimal emission rate of 0.25 lbs/mmbtu
Brunner Island 2 Yes 3,101 15,663,810 0.4 17,059,870 0.39 3,327 -226
Based upon the average SO2 emission rate between 2010 to 2012. Unit is burning a 3.9 lb SO2 coal with a 90 percent removal efficiency and are expected to be operating at this level in the near term.
Homer City 3 Yes 3,069 33,557,512 0.18 33,608,012 0.2 3,361 -292Based upon the average SO2 emission rate between 2008 to 2012. Unit is burning a 4.6 lb SO2 coal with a 96 percent removal efficiency
Bruce Mansfield 2 Yes 2,899 49,042,146 0.12 53,352,540 0.25 6,669 -3,770
Consent Decree requires a 95 percent removal. Currently burning a coal with an SO2 emission rate of at least 5.0lbs/mmbtu of SO2, resulting in minimal emission rate of 0.25 lbs/mmbtu
Brunner Island 1 Yes 2,798 15,916,093 0.35 12,883,779 0.39 2,512 286
Based upon the average SO2 emission rate between 2010 to 2012. Unit is burning a 3.9 lb SO2 coal with a 90 percent removal efficiency and are expected to be operating at this level in the near term.
Colver Power Project AAB01 Yes 2,756 10,727,086 0.51 10,633,404 0.34 1,808 948
New Castle 5 No 2,348 1,923,909 2.44 1,842,756 2.19 2,018 0 Retiring by April 2016; therefore, no emission reductions are credited in 2015
Conemaugh 2 Yes 2,278 49,514,850 0.09 51,697,953 0.13 3,360 -1,082Based upon the average SO2 emission rate between 2008 to 2012, burning a 3.9 lb SO2 coal with a 97 percent removal efficiency
Seward 2 Yes 2,251 10,491,381 0.43 11,344,504 0.4 2,269 -18Ebensburg Power 31 Yes 1,935 6,107,538 0.63 6,279,561 0.4 1,256 679
Seward 1 Yes 1,829 8,692,115 0.42 8,654,342 0.4 1,731 98St. Nicholas Cogen 1 Yes 1,823 10,248,638 0.36 10,748,759 0.23 1,236 587
USCA Case #11-1302 Document #1505492 Filed: 07/31/2014 Page 58 of 70
10018
Typewritten Text
Pennsylvania Table (Page 2 of 3)

Facility Name Unit ID FGD
Controls
2013 SO2 Emissions
(tons)
2013 Heat Input
(MMBtu)
2013 SO2 Rate
(MMBtu)
Average of the 2012-2013 Heat Input (MMBtu)
Re-calculated SO2 Rate
(lb/MMBtu)
Possible 2015 SO2 Emissions
(tons)
Possible SO2 Emissions
Reductions in 2015 due to SO2
Controls and Retirements
(tons)
Operational Comments
Table 1 - Pennsylvania SO2
Cheswick 1 Yes 1,686 29,469,741 0.11 27,292,268 0.15 2,047 -361 Based upon a 98 percent removal of a 6.2 lb SO2 coal
New Castle 4 No 1,646 1,387,899 2.37 1,318,268 2.34 1,542 0 Retiring by April 2016; therefore, no emission reductions are credited in 2015
Total 230,773 206,758 12,811
USCA Case #11-1302 Document #1505492 Filed: 07/31/2014 Page 59 of 70
10018
Typewritten Text
10018
Typewritten Text
10018
Typewritten Text
Pennsylvania Table (Page 3 of 3)

Facility Name Unit ID FGD Controls
2013 SO2 Emissions
(tons)
2013 Heat Input (MMBtu)
2013 SO2 Rate
(MMBtu)
Average of the 2012-2013 Heat
Input (MMBtu)
Re-calculated SO2 Rate
(lb/MMBtu)
Possible 2015 SO2 Emissions (tons)
Possible SO2 Emissions Reductions in 2015 due
to SO2 Controls and Retirements (tons)
Operational Comments
Avon Lake Power Plant 12 No 39,562 26,371,180 3 24,866,393 2.54 31,580 0 Retiring by April 2016; therefore, no emission reductions are credited in 2015
Walter C Beckjord 6 No 31,029 14,813,208 4.19 17,156,343 3.44 7,377 23,652 Retiring April 1, 2015. Assumed emission rate based upon average 2008 to 2012
Miami Fort Station 6 No 19,958 11,142,736 3.58 9,958,678 3.8 7,890 12,068 Retiring June 1, 2015. Assumed emission rate based upon average 2008 to 2012
Walter C Beckjord 5 No 19,325 8,726,639 4.43 8,704,270 3.34 3,634 15,691 Retiring April 1, 2015. Assumed emission rate based upon average 2008 to 2012
W H Zimmer Generating Station 1 Yes 18,457 89,712,238 0.41 67,597,388 0.45 15,209 3,248
Based upon the average SO2 emission rate between 2008 to 2012. Unit is burning a 6.0 lb SO2 coal with a 93 percent removal efficiency
Muskingum River 3 No 16,244 5,296,176 6.13 5,165,661 4.81 5,181 11,063 Retiring June 1, 2015. Assumed emission rate based upon average 2008 to 2012
Gen J M Gavin 1 Yes 14,719 81,308,610 0.36 85,274,811 0.31 13,218 1,501Based upon the average SO2 emission rate between 2008 to 2012. Unit is burning a 5.7 lb SO2 coal with a 94 percent removal efficiency
Gen J M Gavin 2 Yes 13,133 68,929,336 0.38 76,562,543 0.32 12,250 883Based on the average SO2 emission rate between 2008 to 2012. Unit is burning a 5.7 lb SO2 coal with a 94 percent removal efficiency
Muskingum River 5 No 12,919 15,564,937 1.66 11,755,074 1.59 3,897 9,022 Retiring June 1, 2015. Assumed emission rate based upon average 2008 to 2012
Killen Station 2 Yes 7,885 37,332,118 0.42 36,314,113 0.17 3,087 4,798 Planned FGD operation is 96 percent removal of 4.3 lb SO2 coal
Miami Fort Generating Station 8 Yes 6,704 34,477,867 0.39 32,960,710 0.19 3,131 3,573
Based upon the average SO2 emission rate between 2008 to 2012. Units burning a 5.8 lb SO2 coal with a 97 percent removal efficiency
Ashtabula 7 No 6,664 3,539,938 3.76 3,456,714 1.00 505 6,159 Retiring April 2015. Assumed emission rate based upon average 2008 to 2012
Miami Fort Generating Station 7 Yes 5,182 38,614,089 0.27 39,652,907 0.19 1,100 4,082
Based on the average SO2 emission rate between 2008 to 2012. Unit is burning a 5.6 lb SO2 coal with a 97 percent removal efficiency
Cardinal 1 Yes 4,636 33,440,056 0.28 30,020,546 0.375 5,629 -993
Currently burning a 7.0 lb SO2 coal at a 95 percent removal efficiency, but the design allows for a 7.5 lb coal, which Cardinal 1 & 2 may be burning in the near term
Eastlake 3 No 4,370 2,147,863 4.07 3,296,217 1.48 712 3,658 Retiring April 15, 2015. Assumed emission rate based upon average 2008 to 2012
Cardinal 2 Yes 3,993 34,452,060 0.23 36,059,023 0.375 6,761 -2,768
Currently burning a 7.0 lb SO2 coal at a 95 percent removal efficiency, but the design allows for a 7.5 lb coal, which Cardinal 1 & 2 may be burning in the near term
Eastlake 2 No 3,953 1,981,929 3.99 3,061,560 1.5 670 3,283 Retiring April 15, 2015. Assumed emission rate based upon average 2008 to 2012
Muskingum River 4 No 3,861 1,246,847 6.19 2,174,435 4.8 2,171 1,690 Retiring June 1, 2015. Assumed emission rate based upon average 2008 to 2012
J M Stuart 1 Yes 3,655 34,428,852 0.21 33,387,849 0.18 3,005 650
Consent decree calls for a station average of 96 percent. Assumed emission rate is based upon a 2012 FGD removal of 96 percent on 4.6 lb SO2 coal
Table 2 - Ohio SO2USCA Case #11-1302 Document #1505492 Filed: 07/31/2014 Page 60 of 70
10018
Typewritten Text
10018
Typewritten Text
10018
Typewritten Text
Ohio Table (Page 1 of 2)
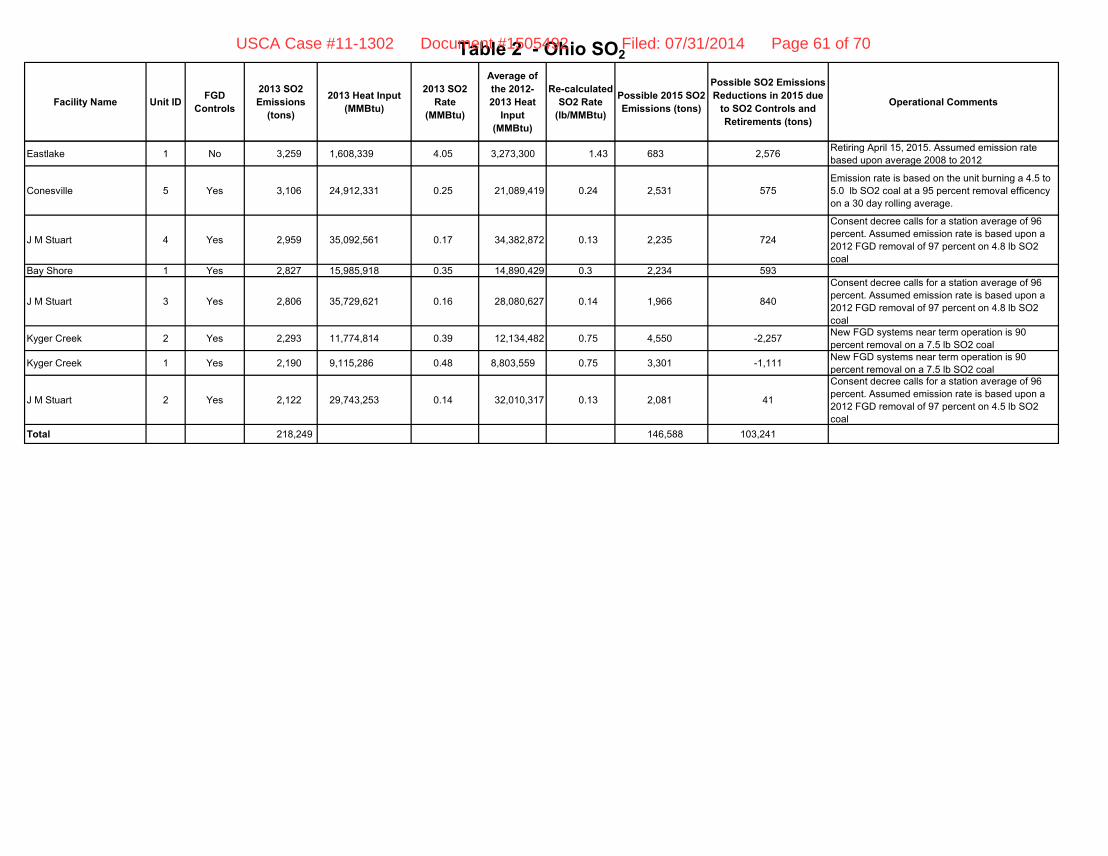
Facility Name Unit ID FGD Controls
2013 SO2 Emissions
(tons)
2013 Heat Input (MMBtu)
2013 SO2 Rate
(MMBtu)
Average of the 2012-2013 Heat
Input (MMBtu)
Re-calculated SO2 Rate
(lb/MMBtu)
Possible 2015 SO2 Emissions (tons)
Possible SO2 Emissions Reductions in 2015 due
to SO2 Controls and Retirements (tons)
Operational Comments
Table 2 - Ohio SO2
Eastlake 1 No 3,259 1,608,339 4.05 3,273,300 1.43 683 2,576 Retiring April 15, 2015. Assumed emission rate based upon average 2008 to 2012
Conesville 5 Yes 3,106 24,912,331 0.25 21,089,419 0.24 2,531 575Emission rate is based on the unit burning a 4.5 to 5.0 lb SO2 coal at a 95 percent removal efficency on a 30 day rolling average.
J M Stuart 4 Yes 2,959 35,092,561 0.17 34,382,872 0.13 2,235 724
Consent decree calls for a station average of 96 percent. Assumed emission rate is based upon a 2012 FGD removal of 97 percent on 4.8 lb SO2 coal
Bay Shore 1 Yes 2,827 15,985,918 0.35 14,890,429 0.3 2,234 593
J M Stuart 3 Yes 2,806 35,729,621 0.16 28,080,627 0.14 1,966 840
Consent decree calls for a station average of 96 percent. Assumed emission rate is based upon a 2012 FGD removal of 97 percent on 4.8 lb SO2 coal
Kyger Creek 2 Yes 2,293 11,774,814 0.39 12,134,482 0.75 4,550 -2,257 New FGD systems near term operation is 90 percent removal on a 7.5 lb SO2 coal
Kyger Creek 1 Yes 2,190 9,115,286 0.48 8,803,559 0.75 3,301 -1,111 New FGD systems near term operation is 90 percent removal on a 7.5 lb SO2 coal
J M Stuart 2 Yes 2,122 29,743,253 0.14 32,010,317 0.13 2,081 41
Consent decree calls for a station average of 96 percent. Assumed emission rate is based upon a 2012 FGD removal of 97 percent on 4.5 lb SO2 coal
Total 218,249 146,588 103,241
USCA Case #11-1302 Document #1505492 Filed: 07/31/2014 Page 61 of 70
10018
Typewritten Text
Ohio Table (Page 2 of 2)

Facility Name Unit ID FGD Controls
2013 SO2 Emissions (tons)
2013 Heat Input (MMBtu)
2013 SO2 Rate (MMBtu)
Average of the 2012-2013 Heat Input (MMBtu)
Re-calculated SO2 Rate (lb/MMBtu)
Possible 2015 SO2 Emissions (tons)
Possible SO2 Emissions
Reductions in 2015 due to SO2 Controls
and Retirements (tons)
Operational Comments
Rockport MB1 No 30,839 92,775,612 0.66 94,042,378 0.47 22,100 8,739
DSI operating by April 16, 2015. DSI SO2 emission rate is 0.4 lbs/mmbtu. Assumed emission rate is the weighted average emission rate from the 2008-12 (0.64) and the DSI rate of 0.40
Rockport MB2 No 20,797 61,477,013 0.68 76,357,380 0.47 17,944 2,853
DSI operating by April 16, 2015. DSI SO2 emission rate is 0.4 lbs/mmbtu. Assumed emission rate is the weighted average emission rate from the 2008-12 (0.64) and the DSI rate of 0.40
Wabash River Gen Station 6 No* 17,868 11,598,992 3.08 11,072,689 3.01 16,664 0
Retiring in April 2016 due to MATS extension, no emission reductions credited in 2015. There is no FGD on this unit
IPL - Petersburg Generating
Station
2 Yes 14,395 17,407,868 1.65 16,438,097 0.22 1,808 12,587
Based on the average of 2008, 2011, & 2012 SO2 emission rates, because unit had a outage in 2008 that affected FGD operation. Unit is burning a 4.9 lb SO2 coal with a 96 percent removal efficiency.
IPL - Harding Street Station
(EW Stout)50 No* 13,324 6,770,399 3.94 6,406,189 3.14 10,058 0 Retiring in April 2016, no emission reductions credited in
2015. There is no FGD on this Unit 50.
IPL - Harding Street Station
(EW Stout)60 No 12,603 6,423,947 3.92 6,163,648 3.13 9,646 0 Retiring in April 2016, no emission reductions credited in
2015. Michigan City Generating
Station12 Yes 10,429 21,341,123 0.98 22,184,882 0.85 9,429 1,000 Dry FGD operational by November 30, 2015 at a SO2
emission rate of 0.10 lbs/mmbtu
Tanners Creek U4 No* 10,346 14,188,929 1.46 16,554,225 1.41 4,867 5,479 Retiring by June 1, 2015 and there is no FGD on Unit 4
Gibson 5 Yes* 9,887 30,507,322 0.65 31,793,623 0.71 11,287 -1,400
Based on the average SO2 emission rate between 2008 to 2012. Unit is burning a 7.3 lb SO2 coal with a 90 percent removal efficiency, indicating a FGD system on Unit 5
RM Schahfer 15 Yes 8,401 27,201,127 0.62 27,493,555 0.2 2,749 5,652Wet FGD will become operational in the Fall of 2014 and will operating at a emission rat o 0.20 lbs/mmbtu in 2015.
IPL-Petersburg Generating
Station2 Yes* 8,129 19,955,581 0.81 21,883,297 0.19 2,079 6,050
Based on the average of 2008 to 2012 SO2 emission rates. Unit is burning a 4.8 lb SO2 coal with a 96 percent removal efficiency.
IPL - Petersburg Generating
Station
3 Yes* 6,383 37,878,497 0.34 32,439,655 0.29 4,704 1,679 Based on the average of 2008 to 2012 SO2 emission rates. Unit is burning a 4.8 lb SO2 coal with a 94 percent removal efficiency.
RM Schahfer 14 Yes 6,193 18,188,583 0.68 15,521,086 0.08 621 5,572 Wet FGD went into operation in 2013, must meet a 0.08 limit (Consent Decree)
Frank E Ratts 1SG1 No* 5,376 3,695,338 2.91 3,300,934 2.81 1,544 3,832Unit is not being retired, but will be idled in 2015 and is keeping permits. There is no FGD on Unit 1
Clifty Creek 6 Yes 5,069 9,225,668 1.1 9,672,817 0.5 2,418 2,651 New FGD systems near term operation is 90 percent removal on a 5.0 lb SO2 coal
Table 3 - Indiana SO2USCA Case #11-1302 Document #1505492 Filed: 07/31/2014 Page 62 of 70
10018
Typewritten Text
10018
Typewritten Text
Indiana Table (Page 1 of 2)

Facility Name Unit ID FGD Controls
2013 SO2 Emissions (tons)
2013 Heat Input (MMBtu)
2013 SO2 Rate (MMBtu)
Average of the 2012-2013 Heat Input (MMBtu)
Re-calculated SO2 Rate (lb/MMBtu)
Possible 2015 SO2 Emissions (tons)
Possible SO2 Emissions
Reductions in 2015 due to SO2 Controls
and Retirements (tons)
Operational Comments
Table 3 - Indiana SO2
Clifty Creek 2 Yes 4,923 12,925,526 0.76 10,696,303 0.5 2,674 2,249 New FGD systems near term operation is 90 percent removal on a 5.0 lb SO2 coal
Frank E Ratts 2SG1 No* 4,876 3,361,459 2.9 2,880,609 2.79 1,338 3,538Unit is not being retired, but will be idled in 2015 and is keeping permits. There is no FGD on Unit 2
IPL - Petersburg Generating
Station
4 Yes 4,848 33,412,698 0.29 33,428,613 0.2 3,343 1,505 Based on the 2012 SO2 emission rate. Unit is burning a 4.9 lb SO2 coal with a 96 percent removal efficiency. FGD upgrade in 2011.
A B Brown Generating
Station1 Yes 4,457 14,006,565 0.64 13,350,937 0.64 4,272 185
Based on the average SO2 emission rate between 2008 to 2012 Unit is burning a 5.3 lb SO2 coal with a 88 percent removal efficiency.
Clifty Creek 5 Yes* 4,369 11,092,493 0.79 10,578,864 0.5 2,645 1,724New FGD systems near term operation is 90 percent removal on a 5.0 lb SO2 coal, indicating a FGD system Unit 5
Gibson 4 Yes 3,647 35,045,890 0.21 33,803,091 0.18 3,042 605Based on the average SO2 emission rate between 2008 to 2012. Unit is burning a 7.7 lb SO2 coal with a 98 percent removal efficiency.
Wabash River Gen Station 3 No* 3,493 2,232,175 3.13 1,968,492 3.1 3,051 0
Retiring in April 2016 due to MATS extension, no emission reductions credited in 2015. There is no FGD on this unit
IPL - Eagle Valley
Generating 6 No* 3,221 3,074,127 2.1 2,388,259 2.11 2,520 0 Retiring in April 2016, no emission reductions credited in
2015. There is no FGD on this unit.
Wabash River Gen Station 4 No* 3,203 2,032,168 3.15 2,140,058 3.05 3,264 0
Retiring in April 2016 due to MATS extension, no emission reductions credited in 2015. There is no FGD on this unit
Tanners Creek U3 No* 3,151 5,866,488 1.07 6,264,927 1.02 1,332 1,819 Retiring by June 1, 2015 and there is no FGD on Unit 3
Wabash River Gen Station 2 No* 3,022 1,902,979 3.18 2,013,724 3.1 3,121 0
Retiring in April 2016 due to MATS extension, no emission reductions credited in 2015. There is no FGD on this unit
Gibson 1 Yes* 2,782 40,748,235 0.14 39,041,311 0.11 2,147 635Based on the average SO2 emission rate between 2008 to 2012. Unit is burning a 7.2 lb SO2 coal with a 98 percent removal efficiency.
Total 226,031 150,667 66,953
Note: The * indicates corrections to Dr. Sahu's assumptions regarding FGD installations.
USCA Case #11-1302 Document #1505492 Filed: 07/31/2014 Page 63 of 70
10018
Typewritten Text
10018
Typewritten Text
Indiana Table (Page 2 of 2)

Facility Name Unit ID FGD
Controls
2013 SO2 Emissions
(tons)
2013 Heat Input
(MMBtu)
2013 SO2 Rate (MMBtu)
Average of the 2012-2013 Heat Input (MMBtu)
Re-calculated SO2 Rate
(lb/MMBtu)
Possible 2015 SO2 Emissions
(tons)
Possible SO2 Emissions
Reductions in 2015 due to
SO2 Controls and
Retirements (tons)
Operational Comments
Green River 5 No 12,121 6,317,700 3.84 6,291,901 3.98 12,521 0LGE-KU looking into operation through 2015 and to retire unit in 2016. These reductions may be unlikely
Big Sandy BSU2 No 11,711 15,878,773 1.48 17,109,336 1.4 4,994 6,717 Unit is retiring by June 1, 2015
Paradise 1 Yes 9,623 44,570,885 0.43 47,516,175 0.64 15,205 0Received an extension on retirement through April 16, 2016 from the state, no emission reductions credited in 2015
Mill Creek 4 Yes 9,361 28,093,646 0.67 26,056,345 0.47 6,123 3,238
New FGD system to enter operation in the Fall of 2014. Assumed emission rate is the weighted average of the 2008-2012 (0.56) and targeted emission rate (0.20) for the new FGD
Paradise 2 Yes 9,202 46,169,365 0.4 45,489,306 0.7 15,921 0Received an extension on retirement through April 16, 2016 from the state, no emission reductions credited in 2015
Mill Creek 3 Yes 8,872 22,555,009 0.79 24,833,038 0.68 8,443 429New FGD system to enter operation in May of 2016. Assumed emission rate is the weighted average of the 2008-2012
Green River 4 No 7,877 4,188,322 3.76 3,872,658 4.03 7,803 0LGE-KU looking into operation through 2015 and to retire unit in 2016. Therefore, these reductions may be unlikely
D B Wilson W1 Yes 7,607 32,722,466 0.46 32,689,302 0.49 8,009 -402Based upon the average SO2 emission rate between 2008 to 2012. Unit is burning a 5.9 lb SO2 coal with a 92 percent removal efficiency
Big Sandy BSU1 No 7,021 9,562,887 1.47 8,546,840 1.41 6,026 0Received a MATS extension to April 2016 and will convert to natural gas no emission reductions in 2015.
Mill Creek 2 Yes 6,534 19,162,163 0.68 17,225,196 0.34 2,928 3,606
New FGD system to enter operation in May 2015. Assumed emission rate is the weighted average of the 2008-2012 (0.53) and targeted emission rate (0.20) for the new FGD
Ghent 2 Yes 6,323 36,426,543 0.35 33,145,980 0.27 4,475 1,848Based on the average SO2 emission rate between 2010 to 2012. Unit is burning a 5.3 lb SO2 coal with a 95 percent removal efficiency
Table 4 - Kentucky SO2USCA Case #11-1302 Document #1505492 Filed: 07/31/2014 Page 64 of 70
10018
Typewritten Text
Kentucky Table (Page 1 of 3)
10018
Typewritten Text

Facility Name Unit ID FGD
Controls
2013 SO2 Emissions
(tons)
2013 Heat Input
(MMBtu)
2013 SO2 Rate (MMBtu)
Average of the 2012-2013 Heat Input (MMBtu)
Re-calculated SO2 Rate
(lb/MMBtu)
Possible 2015 SO2 Emissions
(tons)
Possible SO2 Emissions
Reductions in 2015 due to
SO2 Controls and
Retirements (tons)
Operational Comments
Table 4 - Kentucky SO2
Elmer Smith 2 Yes 5,414 20,350,020 0.53 18,482,977 0.5 4,621 793Based on the average SO2 emission rate between 2080 to 2012. Unit is burning a 6.5 lb SO2 coal with a 93 percent removal efficiency
Ghent 3 Yes 4,967 34,725,149 0.29 33,817,921 0.23 3,889 1,078Based on the average SO2 emission rate between 2008 to 2012. Unit is burning a 5.2 lb SO2 coal with a 96 percent removal efficiency
Mill Creek 1 Yes 4,680 14,609,365 0.64 16,952,982 0.3 2,543 2,137
New FGD system to enter operation in April 2015. Assumed emission rate is the weighted average of the 2008-2012 (0.49) and targeted emission rate (0.20) for the new FGD
Coleman C3 Yes 3,863 12,591,557 0.61 12,599,878 0.26 1,638 2,225Based on the average SO2 emission rate between 2008 to 2012. Unit is burning a 4.8 lb SO2 coal with a 95 percent removal efficiency
Shawnee 5 No 3,249 9,020,451 0.72 9,108,901 0.71 3,234 0 Based on the average SO2 emission rate between 2008 to 2012.
Shawnee 8 No 3,189 8,974,833 0.71 8,891,739 0.70 3,112 0 Based on the average SO2 emission rate between 2008 to 2012.
Shawnee 4 No 3,158 8,736,818 0.72 8,229,272 0.73 3,004 0 Based on the average SO2 emission rate between 2008 to 2012.
Shawnee 1 No 3,095 8,599,786 0.72 7,508,877 0.71 2,666 0 Based on the average SO2 emission rate between 2008 to 2012.
Shawnee 3 No 3,056 8,483,257 0.72 8,126,894 0.71 2,885 0 Based on the average SO2 emission rate between 2008 to 2012.
Shawnee 6 No 3,000 8,480,477 0.71 8,497,741 0.70 2,974 0 Based on the average SO2 emission rate between 2008 to 2012.
Shawnee 7 No 2,884 8,021,275 0.72 8,744,419 0.71 3,104 0 Based on the average SO2 emission rate between 2008 to 2012.
Shawnee 9 No 2,847 8,038,678 0.71 8,500,597 0.70 2,975 0 Based on the average SO2 emission rate between 2008 to 2012.
John S. Cooper 1 No 2,812 4,106,883 1.37 4,879,573 2.00 4,880 0 Dry FGD to be connected to Unit 2 in 2016
Shawnee 2 No 2,731 7,557,731 0.72 8,137,156 0.73 2,970 0 Based on the average SO2 emission rate between 2008 to 2012.
USCA Case #11-1302 Document #1505492 Filed: 07/31/2014 Page 65 of 70
10018
Typewritten Text
Kentucky Table (Page 2 of 3)

Facility Name Unit ID FGD
Controls
2013 SO2 Emissions
(tons)
2013 Heat Input
(MMBtu)
2013 SO2 Rate (MMBtu)
Average of the 2012-2013 Heat Input (MMBtu)
Re-calculated SO2 Rate
(lb/MMBtu)
Possible 2015 SO2 Emissions
(tons)
Possible SO2 Emissions
Reductions in 2015 due to
SO2 Controls and
Retirements (tons)
Operational Comments
Table 4 - Kentucky SO2
R D Green G1 Yes 2,702 18,521,436 0.29 18,133,522 0.17 1,541 1,161Based on the average SO2 emission rate between 2008 to 2012. Unit is burning a 5.8 lb SO2 coal with a 97 percent removal efficiency
Paradise 3 Yes 2,698 38,271,742 0.14 51,273,530 0.16 4,102 -1,404Based on the average SO2 emission rate between 2009 to 2012. Unit is burning a 4.8 lb SO2 coal with a 97 percent removal efficiency
Total 150,597 142,586 21,425
USCA Case #11-1302 Document #1505492 Filed: 07/31/2014 Page 66 of 70
10018
Typewritten Text
10018
Typewritten Text
10018
Typewritten Text
Kentucky Table (Page 3 of 3)

Facility Name Unit SCR
2013 NOx Emissions
(tons)
2013 Heat Input
(MMBtu)
2013 NOx Rate (lb/ MMBtu)
Avg. 2012-2013 Heat
Input
Avg. of 3 lowest Annual NOx rates (lb/ (lb/ MMBtu)
MMBtu)
Re-calculated NOx rate
Possible 2015 NOx
Emissions (tons)
Possible NOx Emissions
Reductions in 2015 due to NOx
Controls and Retirements (tons)
Operational Comments
New Madrid Power Plant 2 Yes 12,071 38,581,042 0.63 38,247,530 0.17 0.27 5,163 6,908
Based on the average emission rate between 2009 and 2013
New Madrid Power Plant 1 Yes 10,256 38,683,085 0.53 37,504,657 0.12 0.35 6,563 3,693
Based on the average emission rate between 2009 and 2013
Thomas Hill Energy Center MB2 Yes 7,271 21,282,561 0.68 19,064,219 0.33 0.46 4,385 2,886
Based on the average emission rate between 2009 and 2013
Thomas Hill Energy Center MB1 Yes 4,562 14,889,551 0.61 14,330,448 0.12 0.29 2,078 2,484
Based on the average emission rate between 2009 and 2013
Thomas Hill Energy Center MB3 Yes 3,994 48,341,695 0.17 46,174,768 0.1 0.16 3,694 300
Based on the average emission rate between 2009 and 2013
Sioux 1 No 3,080 25,045,245 0.25 23,909,957 0.26 0.27 3,228 -148Based on the average emission rate between 2009 and 2013
Sioux 2 No 2,924 24,262,185 0.24 24,337,736 0.24 0.25 3,042 -118Based on the average emission rate between 2009 and 2013
Asbury 1 Yes 2,290 15,933,028 0.29 14,865,750 0.14 0.18 1,338 952Based on the average emission rate between 2009 and 2013
Labadie 1 No 1,921 41,394,242 0.09 42,287,846 0.1 0.1 2,114 -193Based on the average emission rate between 2009 and 2013
Labadie 2 No 1,904 38,948,252 0.1 35,846,610 0.11 0.11 1,972 -68Based on the average emission rate between 2009 and 2013
Labadie 4 No 1,831 41,543,426 0.09 38,830,433 0.1 0.1 1,942 -111Based on the average emission rate between 2009 and 2013
Labadie 3 No 1,819 37,973,504 0.1 36,926,971 0.11 0.11 2,031 -212Based on the average emission rate between 2009 and 2013
Sibley 3 Yes 1,809 20,730,850 0.17 20,107,060 0.12 0.14 1,407 402Based on the average emission rate between 2009 and 2013
Lake Road 6 No 1,723 5,284,913 0.65 4,702,472 0.66 0.67 1,575 148Based on the average emission rate between 2009 and 2013
Iatan 1 Yes 1,554 46,876,303 0.07 50,523,350 0.07 0.08 2,021 -467Based on the average emission rate between 2009 and 2013
Rush Island 2 No 1,542 37,860,229 0.08 36,438,901 0.08 0.09 1,640 -98Based on the average emission rate between 2009 and 2013
Rush Island 1 No 1,525 36,480,883 0.08 37,118,252 0.08 0.09 1,670 -145Based on the average emission rate between 2009 and 2013
Iatan 2 Yes 1,448 56,358,120 0.05 59,306,736 0.05 0.05 1,483 -35Based on the average emission rate between 2010 and 2013
Table 5 - Missouri (Annual NOx)USCA Case #11-1302 Document #1505492 Filed: 07/31/2014 Page 67 of 70
10018
Typewritten Text
Missouri Annual NOx Table (Page 1 of 2)

Facility Name Unit SCR
2013 NOx Emissions
(tons)
2013 Heat Input
(MMBtu)
2013 NOx Rate (lb/ MMBtu)
Avg. 2012-2013 Heat
Input
Avg. of 3 lowest Annual NOx rates (lb/ (lb/ MMBtu)
MMBtu)
Re-calculated NOx rate
Possible 2015 NOx
Emissions (tons)
Possible NOx Emissions
Reductions in 2015 due to NOx
Controls and Retirements (tons)
Operational Comments
New Madrid Power Plant 2 Yes 12,071 38,581,042 0.63 38,247,530 0.17 0.27 5,163 6,908
Based on the average emission rate between 2009 and 2013
New Madrid Power Plant 1 Yes 10,256 38,683,085 0.53 37,504,657 0.12 0.35 6,563 3,693
Based on the average emission rate between 2009 and 2013
Thomas Hill Energy Center MB2 Yes 7,271 21,282,561 0.68 19,064,219 0.33 0.46 4,385 2,886
Based on the average emission rate between 2009 and 2013
Thomas Hill Energy Center MB1 Yes 4,562 14,889,551 0.61 14,330,448 0.12 0.29 2,078 2,484
Based on the average emission rate between 2009 and 2013
Thomas Hill Energy Center MB3 Yes 3,994 48,341,695 0.17 46,174,768 0.1 0.16 3,694 300
Based on the average emission rate between 2009 and 2013
Sioux 1 No 3,080 25,045,245 0.25 23,909,957 0.26 0.27 3,228 -148Based on the average emission rate between 2009 and 2013
Sioux 2 No 2,924 24,262,185 0.24 24,337,736 0.24 0.25 3,042 -118Based on the average emission rate between 2009 and 2013
Asbury 1 Yes 2,290 15,933,028 0.29 14,865,750 0.14 0.18 1,338 952Based on the average emission rate between 2009 and 2013
Labadie 1 No 1,921 41,394,242 0.09 42,287,846 0.1 0.1 2,114 -193Based on the average emission rate between 2009 and 2013
Table 5 - Missouri (Annual NOx)
Chamois Power Plant 2 No 1,442 3,067,657 0.94 3,158,608 0.87 - 0 0
Closed in September 2013, need to account for replacement generation
Hawthorn 5A Yes 1,378 37,625,680 0.07 37,678,417 0.07 0.07 1,319 59Based on the average emission rate between 2010 and 2013
Montrose 1 No 1,281 7,833,294 0.33 7,746,636 0.33 0.33 1,278 3Based on the average emission rate between 2009 and 2013
Sikeston 1 No 1,264 19,103,660 0.13 18,013,947 0.21 0.22 1,982 -718Based on the average emission rate between 2008 and 2012
Meramec 4 No 948 11,401,953 0.17 14,778,945 0.18 0.18 1,330 -382Based upon the average emission rate between 2009 and 2013
Montrose 2 No 919 11,780,332 0.16 9,218,975 0.29 0.16 738 181Based on 2013 emission rate, LNB/OFA was installed in 2012
Montrose 3 No 882 11,317,127 0.16 8,876,660 0.29 0.16 710 172Based on 2013 emission rate, LNB/OFA was installed in 2012
James River 5 No 596 4,973,917 0.24 4,654,945 0.19 0.21 489 107Based on the average emission rate between 2009 and 2013
Meramec 3 No 541 6,440,098 0.17 8,928,697 0.17 0.17 759 -218Based on the average emission rate between 2009 and 2013
Total 72,775 55,950 15,383
USCA Case #11-1302 Document #1505492 Filed: 07/31/2014 Page 68 of 70
10018
Typewritten Text
Missouri Annual NOx Table (Page 2 of 2)

Facility Name Unit SCR2013 NOx Emissions
(tons)
2013 Heat Input (MMBtu)
2013 NOx Rate (lb/ MMBtu)
Avg. 2012-2013 Heat Input
Avg. of 3 lowest OS NOx rates
(lb/ (lb/ MMBtu) MMBtu)
Re-calculated NOx rate
Possible 2015 NOx
Emissions (tons)
Possible NOx Emissions
Reductions in 2015 due to NOx
Controls and Retirements (tons)
Operational Comments
New Madrid Power
Plant2 Yes 4,328 17,278,766 0.5 16,769,657 0.09 0.26 2,180 2,148 Based on the average emission rate
between 2009 and 2013New Madrid Power
Plant1 Yes 4,126 13,447,549 0.61 15,742,672 0.09 0.33 2,598 1,528 Based on the average emission rate
between 2009 and 2013Thomas Hill Energy
CenterMB2 Yes 2,430 7,926,738 0.61 8,660,415 0.33 0.46 1,992 438 Based on the average emission rate
between 2009 and 2013Thomas Hill Energy
CenterMB1 Yes 1,812 6,168,477 0.59 6,587,779 0.09 0.28 922 890 Based on the average emission rate
between 2009 and 2013Thomas Hill Energy
CenterMB3 Yes 1,786 23,130,695 0.15 20,823,789 0.08 0.11 1,145 641 Based on the average emission rate
between 2009 and 2013
Sioux 1 No 1,523 12,465,155 0.24 11,787,204 0.23 0.26 1,532 -9 Based on the average emission rate between 2009 and 2013
Sioux 2 No 1,269 10,693,714 0.24 9,963,958 0.23 0.24 1,196 73 Based on the average emission rate between 2009 and 2013
Asbury 1 Yes 960 7,039,789 0.27 6,020,405 0.14 0.18 542 418 Based on the average emission rate between 2009 and 2013
Labadie 2 No 864 18,145,210 0.1 15,526,209 0.1 0.1 776 88 Based on the average emission rate between 2009 and 2013
Chamois Power
Plant2 No 777 1,664,391 0.93 1,550,365 0.85 - 0 0 Closed in September 2013, need to
account for replacement generation
Labadie 3 No 774 16,466,559 0.09 16,974,096 0.11 0.11 934 -160 Based on the average emission rate between 2009 and 2013
Labadie 1 No 768 17,032,904 0.09 16,972,444 0.1 0.1 849 -81 Based on the average emission rate between 2009 and 2013
Labadie 4 No 763 17,099,567 0.09 18,445,063 0.1 0.1 922 -159 Based on the average emission rate between 2009 and 2013
Lake Road 6 No 728 2,134,276 0.68 2,251,031 0.64 0.66 743 -15 Based on the average emission rate between 2009 and 2013
Iatan 2 Yes 718 27,389,868 0.05 26,124,538 0.05 0.05 653 65 Based on the average emission rate between 2011 and 2013
Sibley 3 Yes 715 8,780,392 0.16 8,616,507 0.1 0.13 560 155 Based on the average emission rate between 2009 and 2013
Rush Island 1 No 651 15,373,057 0.08 16,274,205 0.09 0.09 732 -81 Based on the average emission rate between 2009 and 2013
Montrose 1 No 646 3,940,867 0.33 4,423,104 0.33 0.32 708 -62 Based on the average emission rate between 2009 and 2013
Rush Island 2 No 645 15,871,549 0.08 14,747,902 0.08 0.09 664 -19 Based on the average emission rate between 2009 and 2013
Meramec 4 No 585 6,990,800 0.17 7,614,565 0.18 0.18 685 -100 Based on the average emission rate between 2009 and 2013
Table 6 - Missouri (Ozone-season NOx)USCA Case #11-1302 Document #1505492 Filed: 07/31/2014 Page 69 of 70
10018
Typewritten Text
10018
Typewritten Text
Missouri Ozone-season NOx Table (Page 1 of 2)

Facility Name Unit SCR2013 NOx Emissions
(tons)
2013 Heat Input (MMBtu)
2013 NOx Rate (lb/ MMBtu)
Avg. 2012-2013 Heat Input
Avg. of 3 lowest OS NOx rates
(lb/ (lb/ MMBtu) MMBtu)
Re-calculated NOx rate
Possible 2015 NOx
Emissions (tons)
Possible NOx Emissions
Reductions in 2015 due to NOx
Controls and Retirements (tons)
Operational Comments
Table 6 - Missouri (Ozone-season NOx)
Iatan 1 Yes 576 18,363,316 0.06 21,194,112 0.07 0.08 848 -272 Based on the average emission rate between 2009 and 2013
Hawthorn 5A Yes 546 14,790,981 0.07 16,467,623 0.07 0.07 576 -30 Based on the average emission rate between 2009 and 2013
Sikeston 1 No 463 8,900,968 0.1 8,453,941 0.21 0.19 803 -340 Based on the average emission rate between 2008 and 2012
Meramec 3 No 462 5,535,373 0.17 6,132,711 0.17 0.17 521 -59 Based on the average emission rate between 2009 and 2013
Montrose 2 No 384 4,822,372 0.16 4,248,402 0.26 0.16 340 44 Based on 2013 emission rate, LNB/OFA was installed in 2012
TOTAL 29,299 23,421 5,101
USCA Case #11-1302 Document #1505492 Filed: 07/31/2014 Page 70 of 70
10018
Typewritten Text
Missouri Ozone-season NOx Table (Page 2 of 2)