AREC ECON 535 Problem Set 2 16:26 Monday, August 30, 2021 1 ...
49
AREC ECON 535 Problem Set 2 16:26 Monday, August 30, 2021 1 Obs Year qb qp qc rpb rpp rpc rdpi 1 1960 63.5 59.1 23.5 787.9 549.2 419.5 20440 2 1961 65.5 56.7 26.0 763.4 568.6 374.9 20841 3 1962 66.3 57.3 26.0 736.3 529.9 366.8 20152 4 1963 70.4 58.4 27.2 668.8 482.2 341.6 19721 5 1964 74.8 58.4 27.8 608.9 445.0 300.9 19746 6 1965 74.8 51.8 29.8 598.1 475.6 284.5 19253 7 1966 78.3 50.7 32.1 561.2 488.1 274.6 18735 8 1967 80.1 55.5 32.6 550.8 433.6 248.0 19416 9 1968 82.2 56.7 32.9 554.3 417.5 248.7 20045 10 1969 82.8 55.0 34.9 578.1 432.1 247.4 20120 11 1970 84.7 55.9 36.9 614.4 467.6 246.5 22446 12 1971 84.0 60.6 36.7 642.4 414.8 244.2 23779 13 1972 85.8 54.7 38.5 616.4 429.4 215.0 22281 14 1973 80.8 49.0 37.0 694.9 534.0 291.5 23266 15 1974 85.7 52.8 36.9 644.6 475.0 246.7 22674 16 1975 88.2 43.0 36.7 625.2 543.6 255.7 22846 17 1976 94.6 45.5 39.9 566.1 511.8 228.0 23293 18 1977 91.7 47.0 40.7 532.3 449.8 215.6 23795 19 1978 87.5 47.0 43.1 605.7 478.2 221.4 24438 20 1979 78.2 53.7 46.0 677.0 456.2 202.5 24104 21 1980 76.6 57.3 45.8 626.6 389.0 187.0 23439 22 1981 78.3 54.7 46.9 570.2 385.1 174.9 23463 23 1982 77.1 49.1 47.0 545.8 417.7 160.7 23618 24 1983 78.6 51.7 47.4 521.4 393.5 158.8 24558 25 1984 78.5 51.5 49.2 503.0 359.8 170.0 25882 26 1985 79.3 51.9 51.0 471.5 346.2 154.7 26405 27 1986 78.9 49.0 52.0 459.1 375.7 166.2 27244 28 1987 73.9 49.2 55.1 465.6 382.8 150.7 27448 29 1988 72.7 52.5 55.3 469.6 357.7 157.4 28417 30 1989 69.0 52.0 56.6 474.7 340.3 163.0 28849 31 1990 67.7 49.7 59.5 479.4 375.3 150.0 28808 32 1991 66.6 50.2 61.9 461.7 359.0 140.9 28396 33 1992 66.1 52.7 65.5 442.4 325.7 135.1 29091 34 1993 64.6 51.9 67.9 442.8 315.6 134.3 29047 35 1994 66.3 52.5 68.7 416.3 308.3 132.6 29348 36 1995 66.6 51.7 67.9 406.9 295.0 131.2 29755 37 1996 67.1 48.3 69.2 389.5 324.9 135.3 30104 38 1997 65.7 47.5 71.4 379.8 332.9 136.2 30669 39 1998 66.7 51.5 72.0 370.8 324.7 139.7 31852 40 1999 67.5 52.6 76.3 376.8 316.0 138.2 32313 41 2000 67.8 51.2 77.0 388.1 327.0 135.6 33275 42 2001 66.3 50.3 76.8 415.9 331.8 136.1 33564
-
Upload
khangminh22 -
Category
Documents
-
view
1 -
download
0
Transcript of AREC ECON 535 Problem Set 2 16:26 Monday, August 30, 2021 1 ...
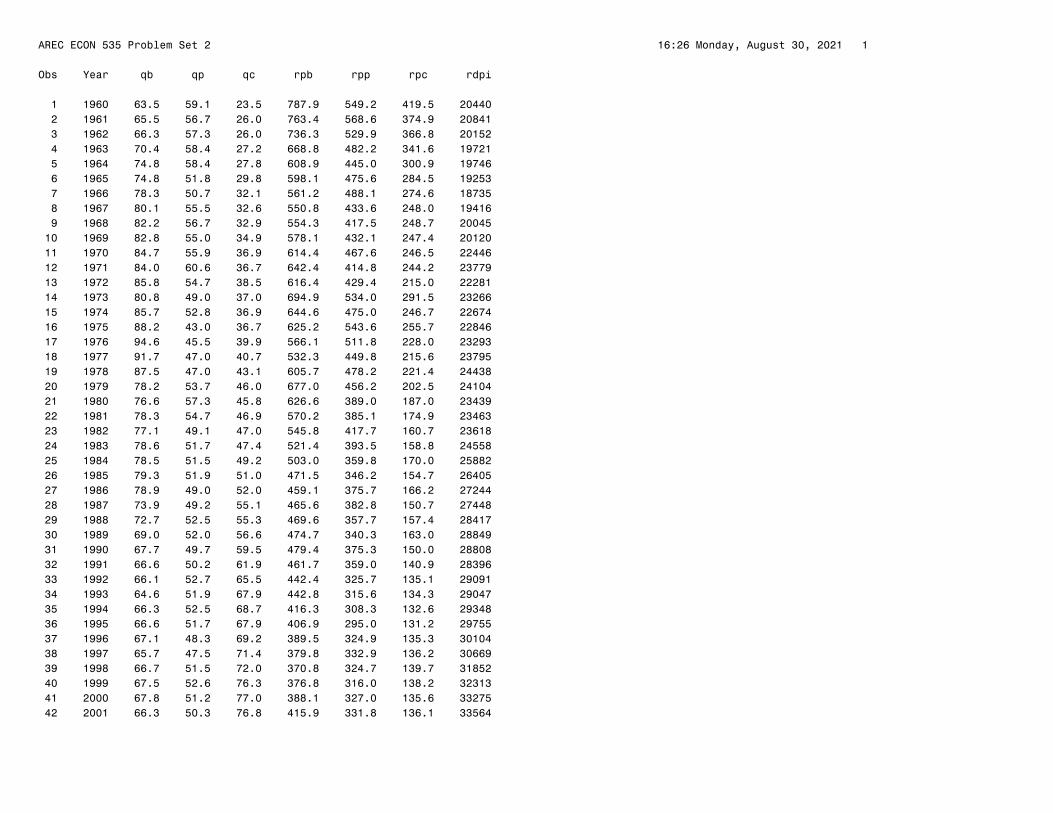
AREC ECON 535 Problem Set 2 16:26 Monday, August 30, 2021 1
Obs Year qb qp qc rpb rpp rpc rdpi
1 1960 63.5 59.1 23.5 787.9 549.2 419.5 20440 2 1961 65.5 56.7 26.0 763.4 568.6 374.9 20841 3 1962 66.3 57.3 26.0 736.3 529.9 366.8 20152 4 1963 70.4 58.4 27.2 668.8 482.2 341.6 19721 5 1964 74.8 58.4 27.8 608.9 445.0 300.9 19746 6 1965 74.8 51.8 29.8 598.1 475.6 284.5 19253 7 1966 78.3 50.7 32.1 561.2 488.1 274.6 18735 8 1967 80.1 55.5 32.6 550.8 433.6 248.0 19416 9 1968 82.2 56.7 32.9 554.3 417.5 248.7 20045 10 1969 82.8 55.0 34.9 578.1 432.1 247.4 20120 11 1970 84.7 55.9 36.9 614.4 467.6 246.5 22446 12 1971 84.0 60.6 36.7 642.4 414.8 244.2 23779 13 1972 85.8 54.7 38.5 616.4 429.4 215.0 22281 14 1973 80.8 49.0 37.0 694.9 534.0 291.5 23266 15 1974 85.7 52.8 36.9 644.6 475.0 246.7 22674 16 1975 88.2 43.0 36.7 625.2 543.6 255.7 22846 17 1976 94.6 45.5 39.9 566.1 511.8 228.0 23293 18 1977 91.7 47.0 40.7 532.3 449.8 215.6 23795 19 1978 87.5 47.0 43.1 605.7 478.2 221.4 24438 20 1979 78.2 53.7 46.0 677.0 456.2 202.5 24104 21 1980 76.6 57.3 45.8 626.6 389.0 187.0 23439 22 1981 78.3 54.7 46.9 570.2 385.1 174.9 23463 23 1982 77.1 49.1 47.0 545.8 417.7 160.7 23618 24 1983 78.6 51.7 47.4 521.4 393.5 158.8 24558 25 1984 78.5 51.5 49.2 503.0 359.8 170.0 25882 26 1985 79.3 51.9 51.0 471.5 346.2 154.7 26405 27 1986 78.9 49.0 52.0 459.1 375.7 166.2 27244 28 1987 73.9 49.2 55.1 465.6 382.8 150.7 27448 29 1988 72.7 52.5 55.3 469.6 357.7 157.4 28417 30 1989 69.0 52.0 56.6 474.7 340.3 163.0 28849 31 1990 67.7 49.7 59.5 479.4 375.3 150.0 28808 32 1991 66.6 50.2 61.9 461.7 359.0 140.9 28396 33 1992 66.1 52.7 65.5 442.4 325.7 135.1 29091 34 1993 64.6 51.9 67.9 442.8 315.6 134.3 29047 35 1994 66.3 52.5 68.7 416.3 308.3 132.6 29348 36 1995 66.6 51.7 67.9 406.9 295.0 131.2 29755 37 1996 67.1 48.3 69.2 389.5 324.9 135.3 30104 38 1997 65.7 47.5 71.4 379.8 332.9 136.2 30669 39 1998 66.7 51.5 72.0 370.8 324.7 139.7 31852 40 1999 67.5 52.6 76.3 376.8 316.0 138.2 32313 41 2000 67.8 51.2 77.0 388.1 327.0 135.6 33275 42 2001 66.3 50.3 76.8 415.9 331.8 136.1 33564
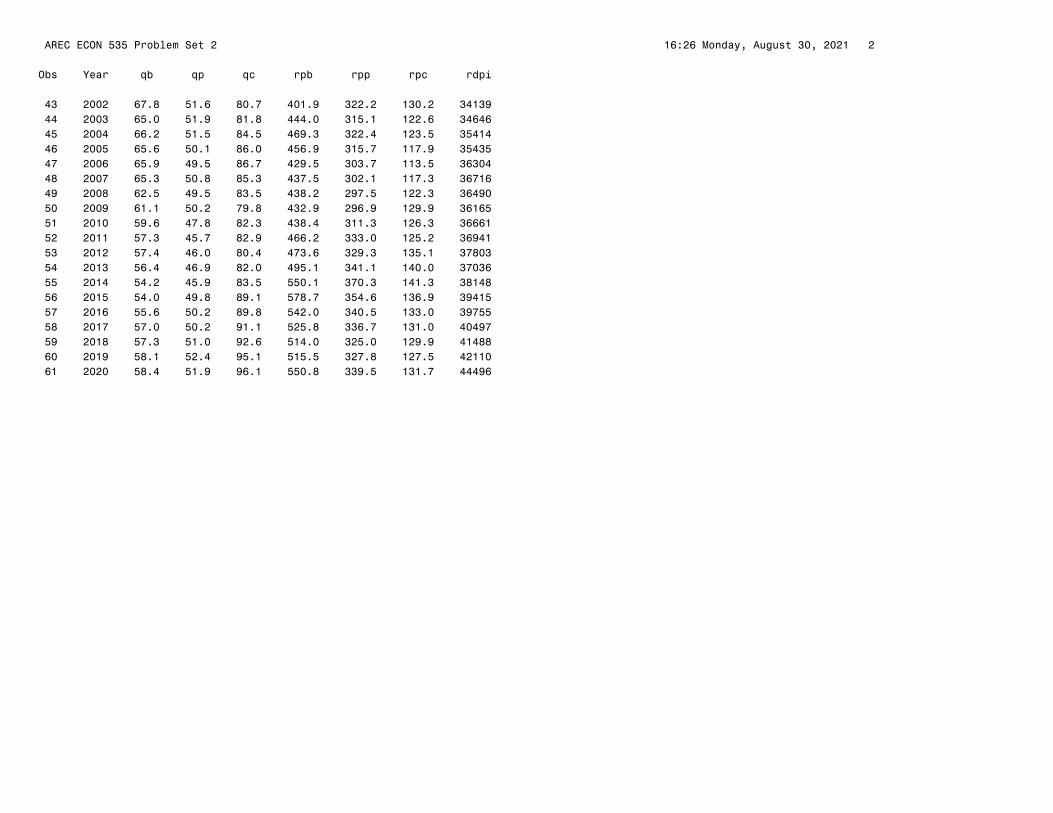
�AREC ECON 535 Problem Set 2 16:26 Monday, August 30, 2021 2
Obs Year qb qp qc rpb rpp rpc rdpi
43 2002 67.8 51.6 80.7 401.9 322.2 130.2 34139 44 2003 65.0 51.9 81.8 444.0 315.1 122.6 34646 45 2004 66.2 51.5 84.5 469.3 322.4 123.5 35414 46 2005 65.6 50.1 86.0 456.9 315.7 117.9 35435 47 2006 65.9 49.5 86.7 429.5 303.7 113.5 36304 48 2007 65.3 50.8 85.3 437.5 302.1 117.3 36716 49 2008 62.5 49.5 83.5 438.2 297.5 122.3 36490 50 2009 61.1 50.2 79.8 432.9 296.9 129.9 36165 51 2010 59.6 47.8 82.3 438.4 311.3 126.3 36661 52 2011 57.3 45.7 82.9 466.2 333.0 125.2 36941 53 2012 57.4 46.0 80.4 473.6 329.3 135.1 37803 54 2013 56.4 46.9 82.0 495.1 341.1 140.0 37036 55 2014 54.2 45.9 83.5 550.1 370.3 141.3 38148 56 2015 54.0 49.8 89.1 578.7 354.6 136.9 39415 57 2016 55.6 50.2 89.8 542.0 340.5 133.0 39755 58 2017 57.0 50.2 91.1 525.8 336.7 131.0 40497 59 2018 57.3 51.0 92.6 514.0 325.0 129.9 41488 60 2019 58.1 52.4 95.1 515.5 327.8 127.5 42110 61 2020 58.4 51.9 96.1 550.8 339.5 131.7 44496
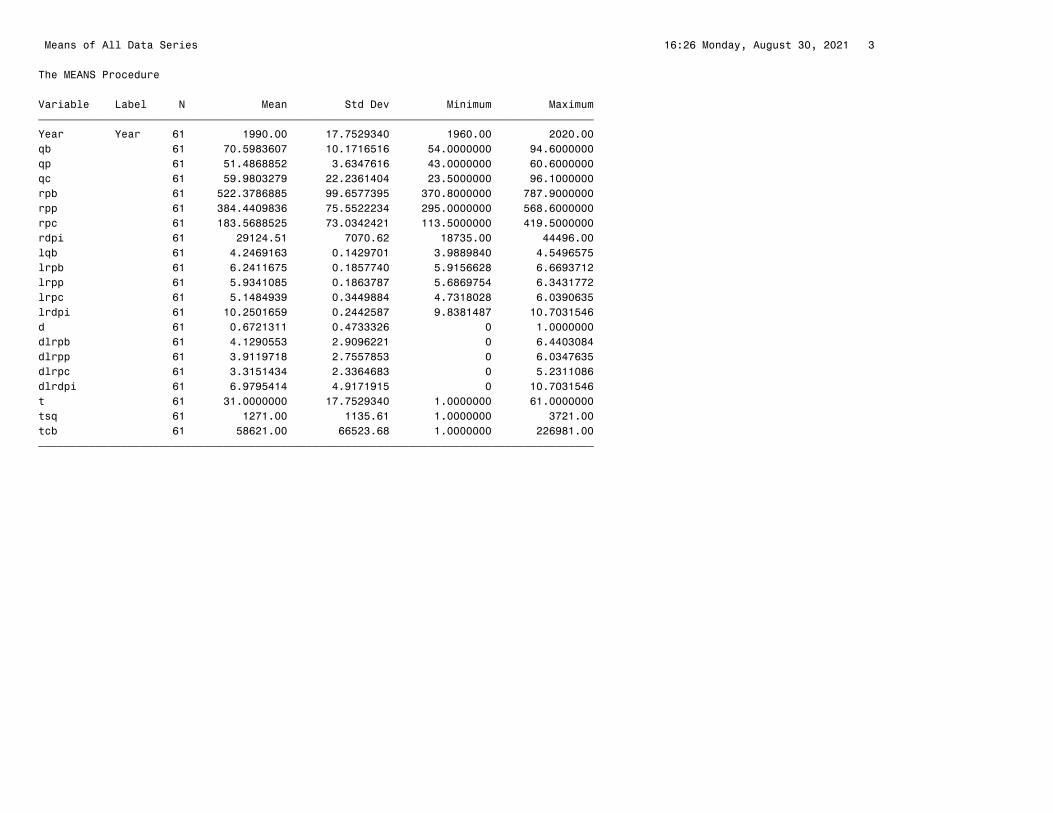
�Means of All Data Series 16:26 Monday, August 30, 2021 3
The MEANS Procedure
Variable Label N Mean Std Dev Minimum MaximumƒƒƒƒƒƒƒƒƒƒƒƒƒƒƒƒƒƒƒƒƒƒƒƒƒƒƒƒƒƒƒƒƒƒƒƒƒƒƒƒƒƒƒƒƒƒƒƒƒƒƒƒƒƒƒƒƒƒƒƒƒƒƒƒƒƒƒƒƒƒƒƒƒƒƒƒƒƒƒƒƒƒƒƒƒƒƒYear Year 61 1990.00 17.7529340 1960.00 2020.00qb 61 70.5983607 10.1716516 54.0000000 94.6000000qp 61 51.4868852 3.6347616 43.0000000 60.6000000qc 61 59.9803279 22.2361404 23.5000000 96.1000000rpb 61 522.3786885 99.6577395 370.8000000 787.9000000rpp 61 384.4409836 75.5522234 295.0000000 568.6000000rpc 61 183.5688525 73.0342421 113.5000000 419.5000000rdpi 61 29124.51 7070.62 18735.00 44496.00lqb 61 4.2469163 0.1429701 3.9889840 4.5496575lrpb 61 6.2411675 0.1857740 5.9156628 6.6693712lrpp 61 5.9341085 0.1863787 5.6869754 6.3431772lrpc 61 5.1484939 0.3449884 4.7318028 6.0390635lrdpi 61 10.2501659 0.2442587 9.8381487 10.7031546d 61 0.6721311 0.4733326 0 1.0000000dlrpb 61 4.1290553 2.9096221 0 6.4403084dlrpp 61 3.9119718 2.7557853 0 6.0347635dlrpc 61 3.3151434 2.3364683 0 5.2311086dlrdpi 61 6.9795414 4.9171915 0 10.7031546t 61 31.0000000 17.7529340 1.0000000 61.0000000tsq 61 1271.00 1135.61 1.0000000 3721.00tcb 61 58621.00 66523.68 1.0000000 226981.00ƒƒƒƒƒƒƒƒƒƒƒƒƒƒƒƒƒƒƒƒƒƒƒƒƒƒƒƒƒƒƒƒƒƒƒƒƒƒƒƒƒƒƒƒƒƒƒƒƒƒƒƒƒƒƒƒƒƒƒƒƒƒƒƒƒƒƒƒƒƒƒƒƒƒƒƒƒƒƒƒƒƒƒƒƒƒƒ
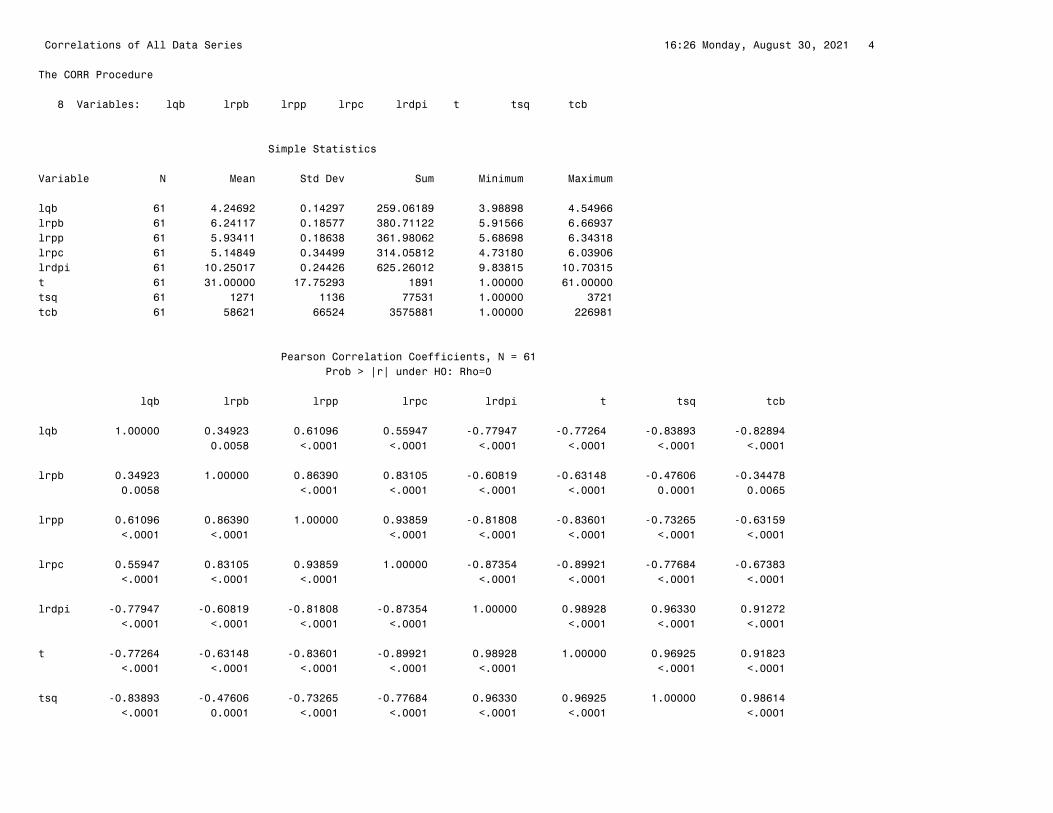
�Correlations of All Data Series 16:26 Monday, August 30, 2021 4
The CORR Procedure
8 Variables: lqb lrpb lrpp lrpc lrdpi t tsq tcb
Simple Statistics Variable N Mean Std Dev Sum Minimum Maximum
lqb 61 4.24692 0.14297 259.06189 3.98898 4.54966lrpb 61 6.24117 0.18577 380.71122 5.91566 6.66937lrpp 61 5.93411 0.18638 361.98062 5.68698 6.34318lrpc 61 5.14849 0.34499 314.05812 4.73180 6.03906lrdpi 61 10.25017 0.24426 625.26012 9.83815 10.70315t 61 31.00000 17.75293 1891 1.00000 61.00000tsq 61 1271 1136 77531 1.00000 3721tcb 61 58621 66524 3575881 1.00000 226981
Pearson Correlation Coefficients, N = 61 Prob > |r| under H0: Rho=0 lqb lrpb lrpp lrpc lrdpi t tsq tcb
lqb 1.00000 0.34923 0.61096 0.55947 -0.77947 -0.77264 -0.83893 -0.82894 0.0058 <.0001 <.0001 <.0001 <.0001 <.0001 <.0001
lrpb 0.34923 1.00000 0.86390 0.83105 -0.60819 -0.63148 -0.47606 -0.34478 0.0058 <.0001 <.0001 <.0001 <.0001 0.0001 0.0065
lrpp 0.61096 0.86390 1.00000 0.93859 -0.81808 -0.83601 -0.73265 -0.63159 <.0001 <.0001 <.0001 <.0001 <.0001 <.0001 <.0001
lrpc 0.55947 0.83105 0.93859 1.00000 -0.87354 -0.89921 -0.77684 -0.67383 <.0001 <.0001 <.0001 <.0001 <.0001 <.0001 <.0001
lrdpi -0.77947 -0.60819 -0.81808 -0.87354 1.00000 0.98928 0.96330 0.91272 <.0001 <.0001 <.0001 <.0001 <.0001 <.0001 <.0001
t -0.77264 -0.63148 -0.83601 -0.89921 0.98928 1.00000 0.96925 0.91823 <.0001 <.0001 <.0001 <.0001 <.0001 <.0001 <.0001
tsq -0.83893 -0.47606 -0.73265 -0.77684 0.96330 0.96925 1.00000 0.98614 <.0001 0.0001 <.0001 <.0001 <.0001 <.0001 <.0001
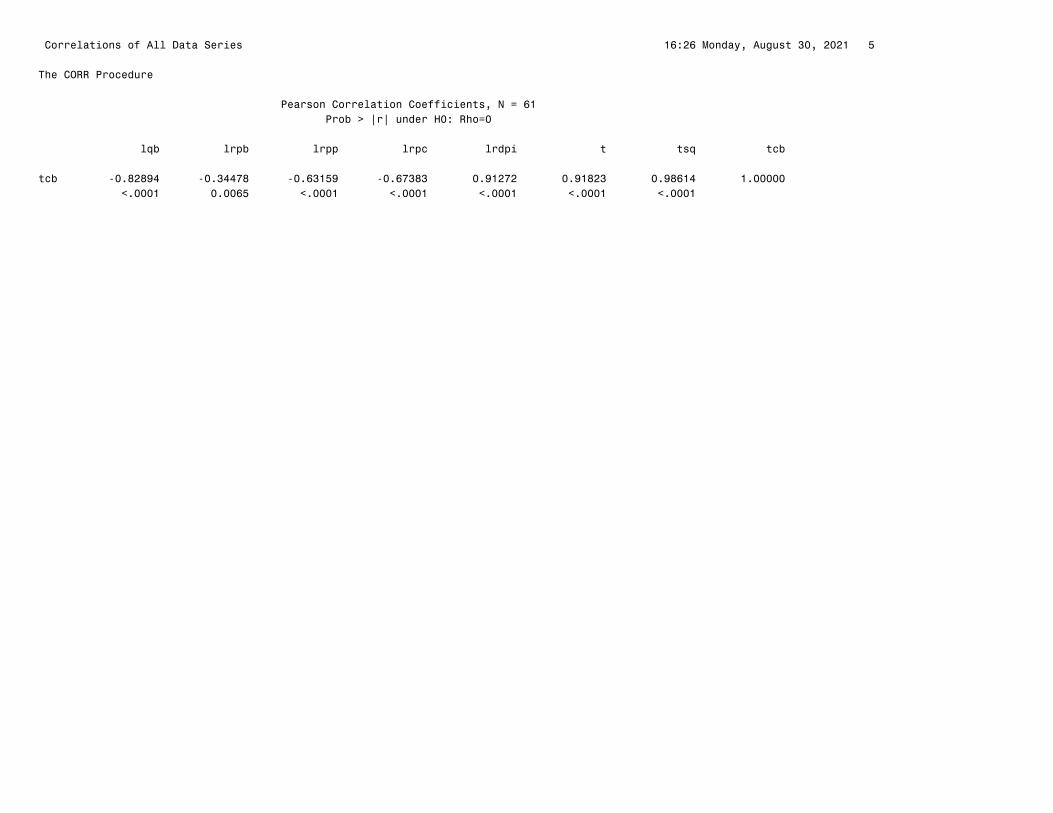
�Correlations of All Data Series 16:26 Monday, August 30, 2021 5
The CORR Procedure
Pearson Correlation Coefficients, N = 61 Prob > |r| under H0: Rho=0 lqb lrpb lrpp lrpc lrdpi t tsq tcb
tcb -0.82894 -0.34478 -0.63159 -0.67383 0.91272 0.91823 0.98614 1.00000 <.0001 0.0065 <.0001 <.0001 <.0001 <.0001 <.0001
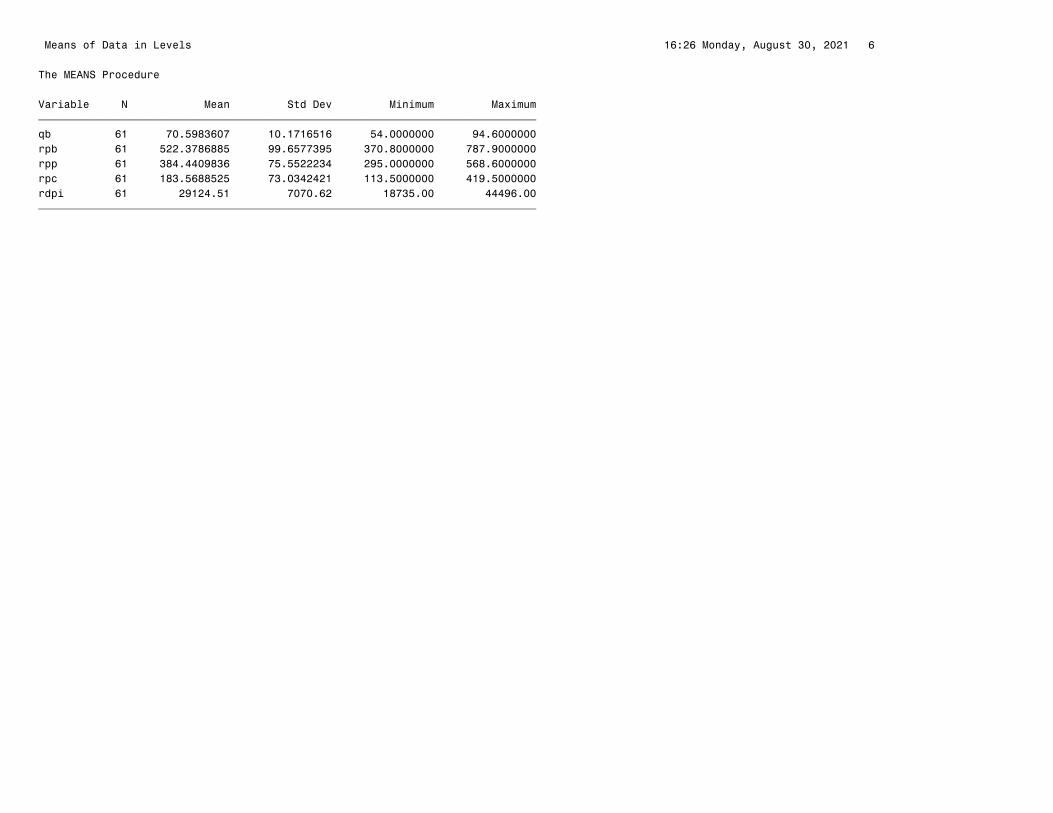
�Means of Data in Levels 16:26 Monday, August 30, 2021 6
The MEANS Procedure
Variable N Mean Std Dev Minimum Maximumƒƒƒƒƒƒƒƒƒƒƒƒƒƒƒƒƒƒƒƒƒƒƒƒƒƒƒƒƒƒƒƒƒƒƒƒƒƒƒƒƒƒƒƒƒƒƒƒƒƒƒƒƒƒƒƒƒƒƒƒƒƒƒƒƒƒƒƒƒƒƒƒƒƒƒƒƒƒqb 61 70.5983607 10.1716516 54.0000000 94.6000000rpb 61 522.3786885 99.6577395 370.8000000 787.9000000rpp 61 384.4409836 75.5522234 295.0000000 568.6000000rpc 61 183.5688525 73.0342421 113.5000000 419.5000000rdpi 61 29124.51 7070.62 18735.00 44496.00ƒƒƒƒƒƒƒƒƒƒƒƒƒƒƒƒƒƒƒƒƒƒƒƒƒƒƒƒƒƒƒƒƒƒƒƒƒƒƒƒƒƒƒƒƒƒƒƒƒƒƒƒƒƒƒƒƒƒƒƒƒƒƒƒƒƒƒƒƒƒƒƒƒƒƒƒƒƒ
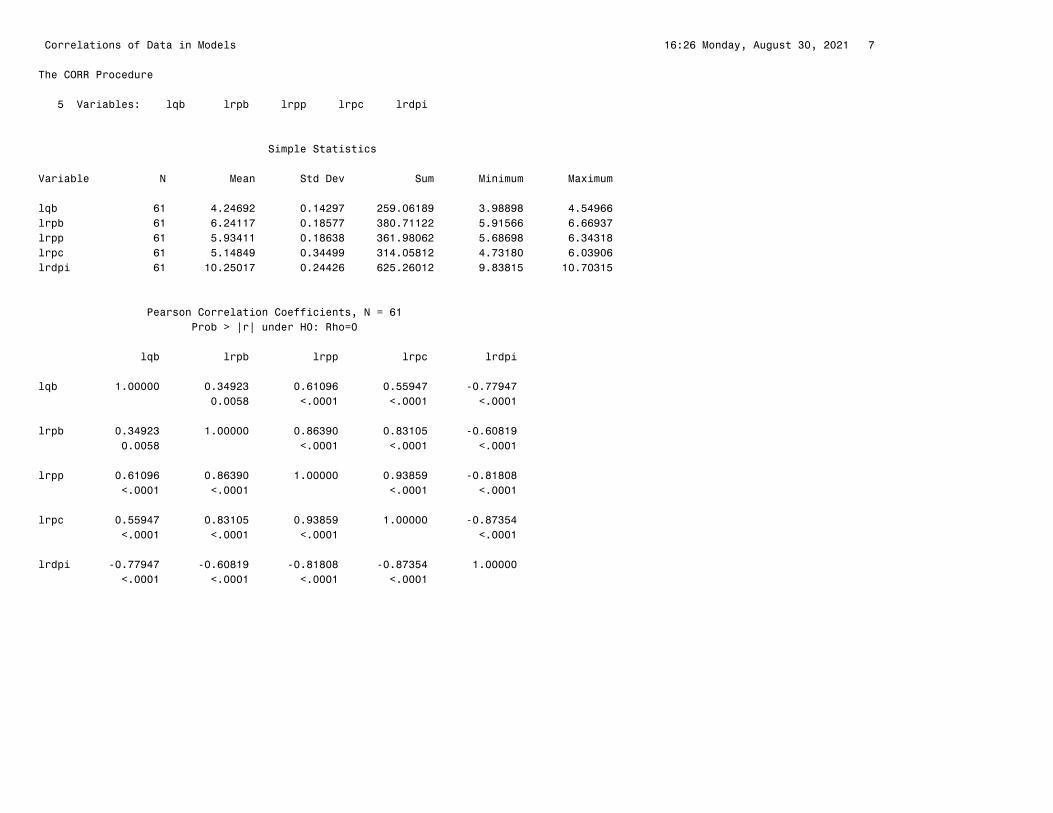
�Correlations of Data in Models 16:26 Monday, August 30, 2021 7
The CORR Procedure
5 Variables: lqb lrpb lrpp lrpc lrdpi
Simple Statistics Variable N Mean Std Dev Sum Minimum Maximum
lqb 61 4.24692 0.14297 259.06189 3.98898 4.54966lrpb 61 6.24117 0.18577 380.71122 5.91566 6.66937lrpp 61 5.93411 0.18638 361.98062 5.68698 6.34318lrpc 61 5.14849 0.34499 314.05812 4.73180 6.03906lrdpi 61 10.25017 0.24426 625.26012 9.83815 10.70315
Pearson Correlation Coefficients, N = 61 Prob > |r| under H0: Rho=0 lqb lrpb lrpp lrpc lrdpi
lqb 1.00000 0.34923 0.61096 0.55947 -0.77947 0.0058 <.0001 <.0001 <.0001
lrpb 0.34923 1.00000 0.86390 0.83105 -0.60819 0.0058 <.0001 <.0001 <.0001
lrpp 0.61096 0.86390 1.00000 0.93859 -0.81808 <.0001 <.0001 <.0001 <.0001
lrpc 0.55947 0.83105 0.93859 1.00000 -0.87354 <.0001 <.0001 <.0001 <.0001
lrdpi -0.77947 -0.60819 -0.81808 -0.87354 1.00000 <.0001 <.0001 <.0001 <.0001
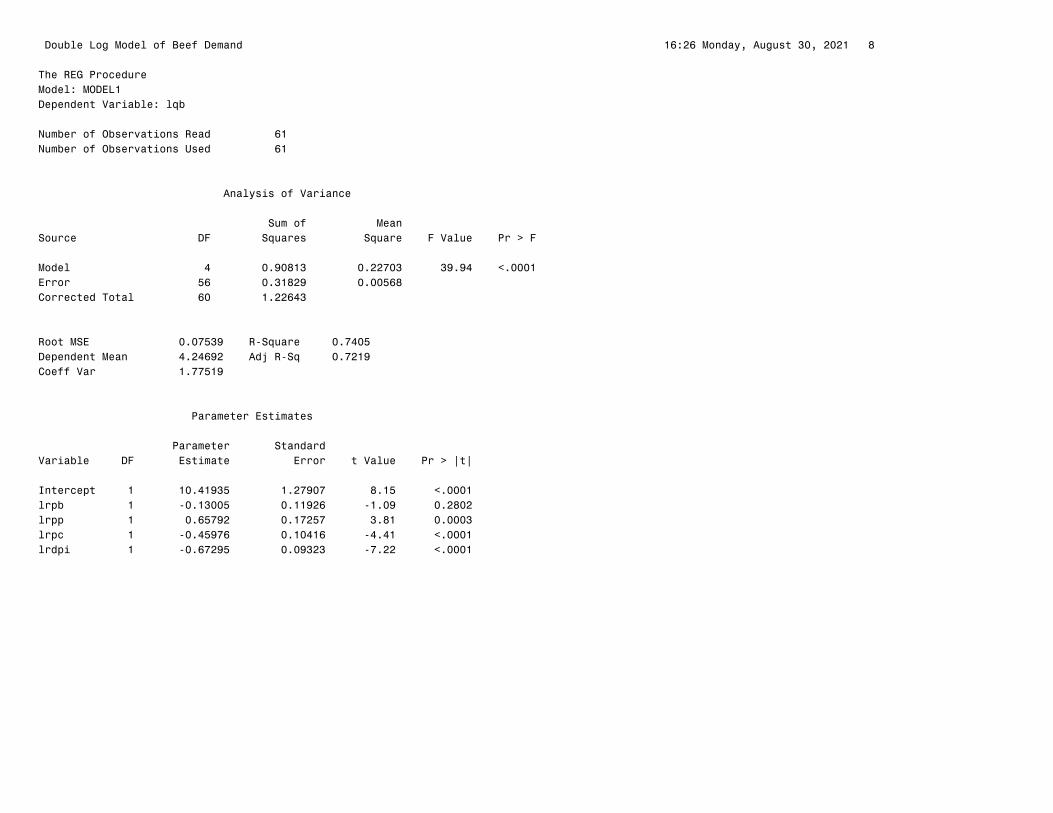
�Double Log Model of Beef Demand 16:26 Monday, August 30, 2021 8
The REG ProcedureModel: MODEL1Dependent Variable: lqb
Number of Observations Read 61Number of Observations Used 61
Analysis of Variance Sum of MeanSource DF Squares Square F Value Pr > F
Model 4 0.90813 0.22703 39.94 <.0001Error 56 0.31829 0.00568 Corrected Total 60 1.22643
Root MSE 0.07539 R-Square 0.7405Dependent Mean 4.24692 Adj R-Sq 0.7219Coeff Var 1.77519
Parameter Estimates Parameter StandardVariable DF Estimate Error t Value Pr > |t|
Intercept 1 10.41935 1.27907 8.15 <.0001lrpb 1 -0.13005 0.11926 -1.09 0.2802lrpp 1 0.65792 0.17257 3.81 0.0003lrpc 1 -0.45976 0.10416 -4.41 <.0001lrdpi 1 -0.67295 0.09323 -7.22 <.0001

�Double Log Model of Beef Demand 16:26 Monday, August 30, 2021 9
The REG ProcedureModel: MODEL1
Test equal Results for Dependent Variable lqb MeanSource DF Square F Value Pr > F
Numerator 1 0.12332 21.70 <.0001Denominator 56 0.00568
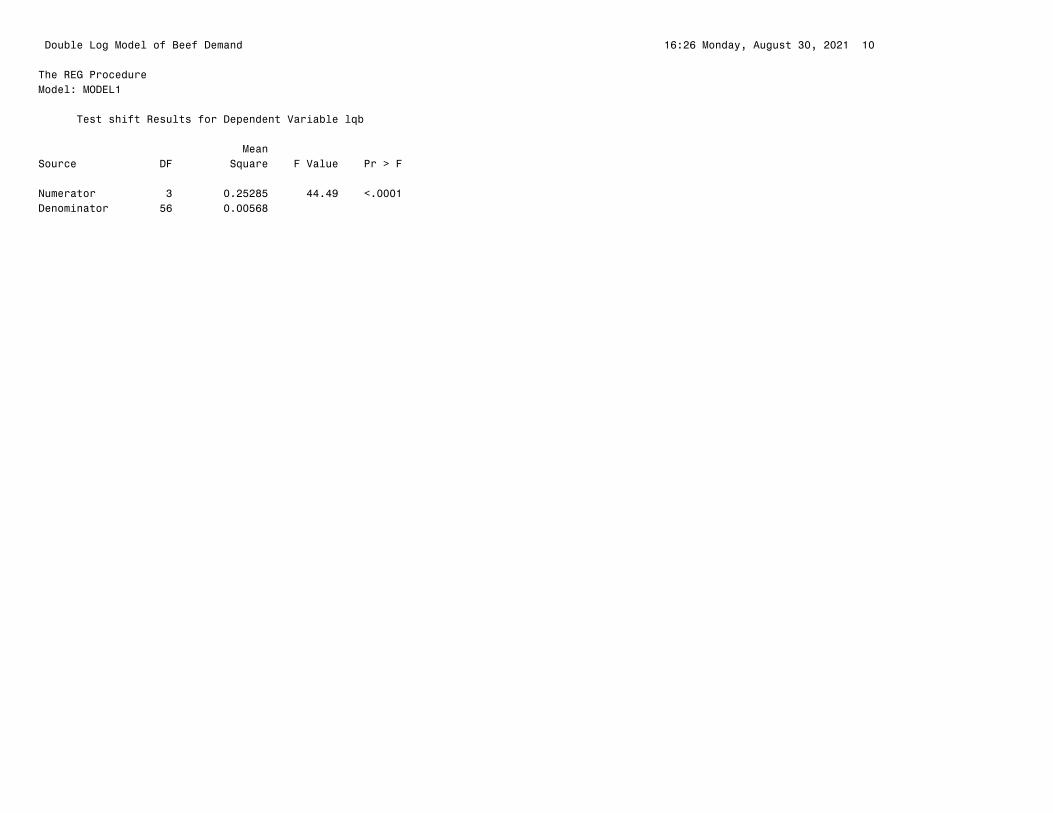
�Double Log Model of Beef Demand 16:26 Monday, August 30, 2021 10
The REG ProcedureModel: MODEL1
Test shift Results for Dependent Variable lqb MeanSource DF Square F Value Pr > F
Numerator 3 0.25285 44.49 <.0001Denominator 56 0.00568
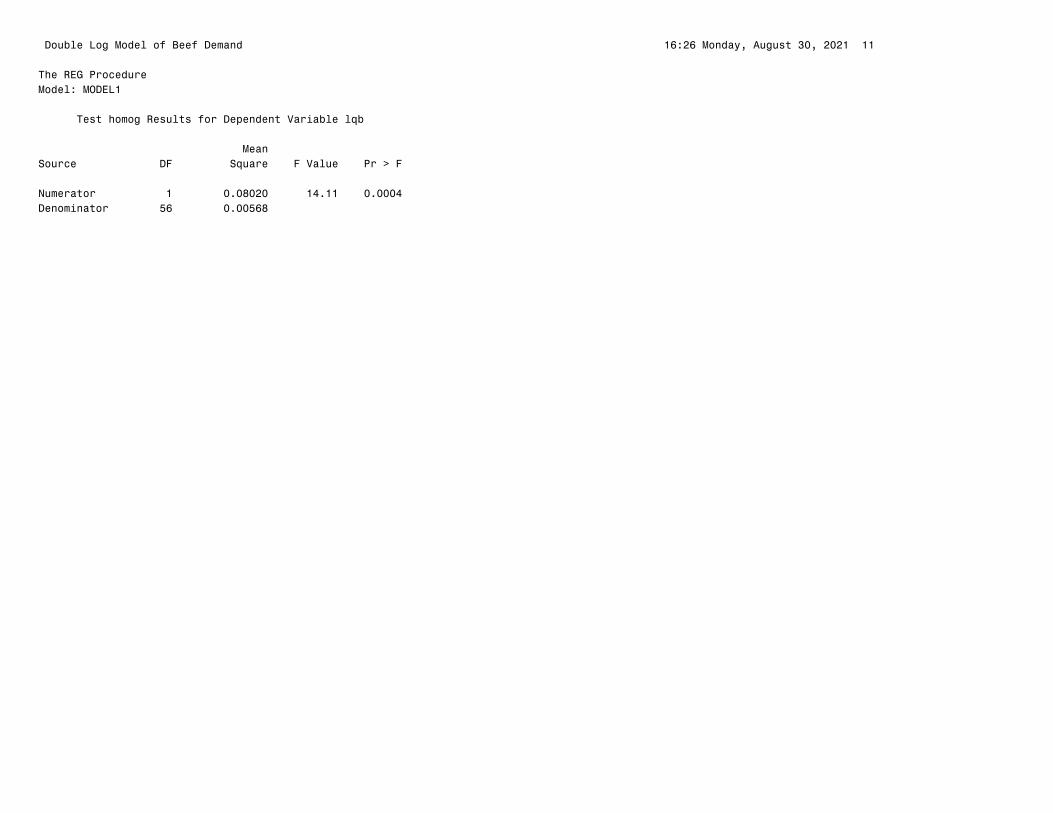
�Double Log Model of Beef Demand 16:26 Monday, August 30, 2021 11
The REG ProcedureModel: MODEL1
Test homog Results for Dependent Variable lqb MeanSource DF Square F Value Pr > F
Numerator 1 0.08020 14.11 0.0004Denominator 56 0.00568
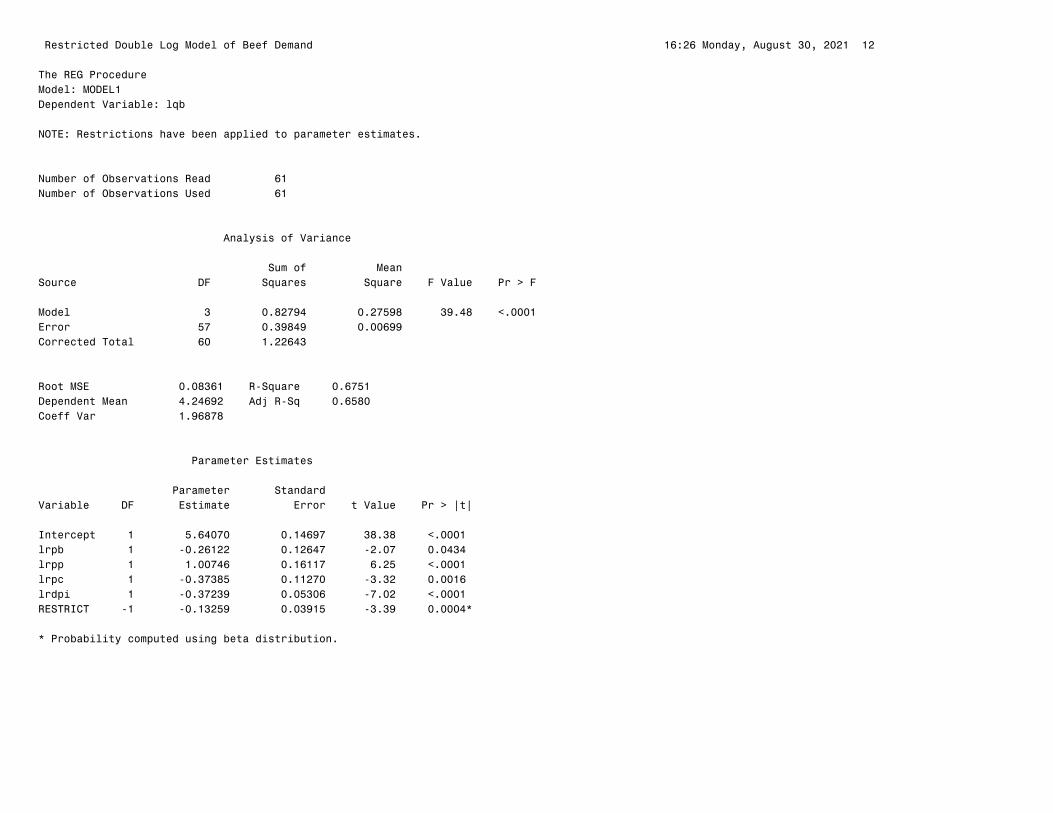
�Restricted Double Log Model of Beef Demand 16:26 Monday, August 30, 2021 12
The REG ProcedureModel: MODEL1Dependent Variable: lqb
NOTE: Restrictions have been applied to parameter estimates.
Number of Observations Read 61Number of Observations Used 61
Analysis of Variance Sum of MeanSource DF Squares Square F Value Pr > F
Model 3 0.82794 0.27598 39.48 <.0001Error 57 0.39849 0.00699 Corrected Total 60 1.22643
Root MSE 0.08361 R-Square 0.6751Dependent Mean 4.24692 Adj R-Sq 0.6580Coeff Var 1.96878
Parameter Estimates Parameter StandardVariable DF Estimate Error t Value Pr > |t|
Intercept 1 5.64070 0.14697 38.38 <.0001 lrpb 1 -0.26122 0.12647 -2.07 0.0434 lrpp 1 1.00746 0.16117 6.25 <.0001 lrpc 1 -0.37385 0.11270 -3.32 0.0016 lrdpi 1 -0.37239 0.05306 -7.02 <.0001 RESTRICT -1 -0.13259 0.03915 -3.39 0.0004*
* Probability computed using beta distribution.
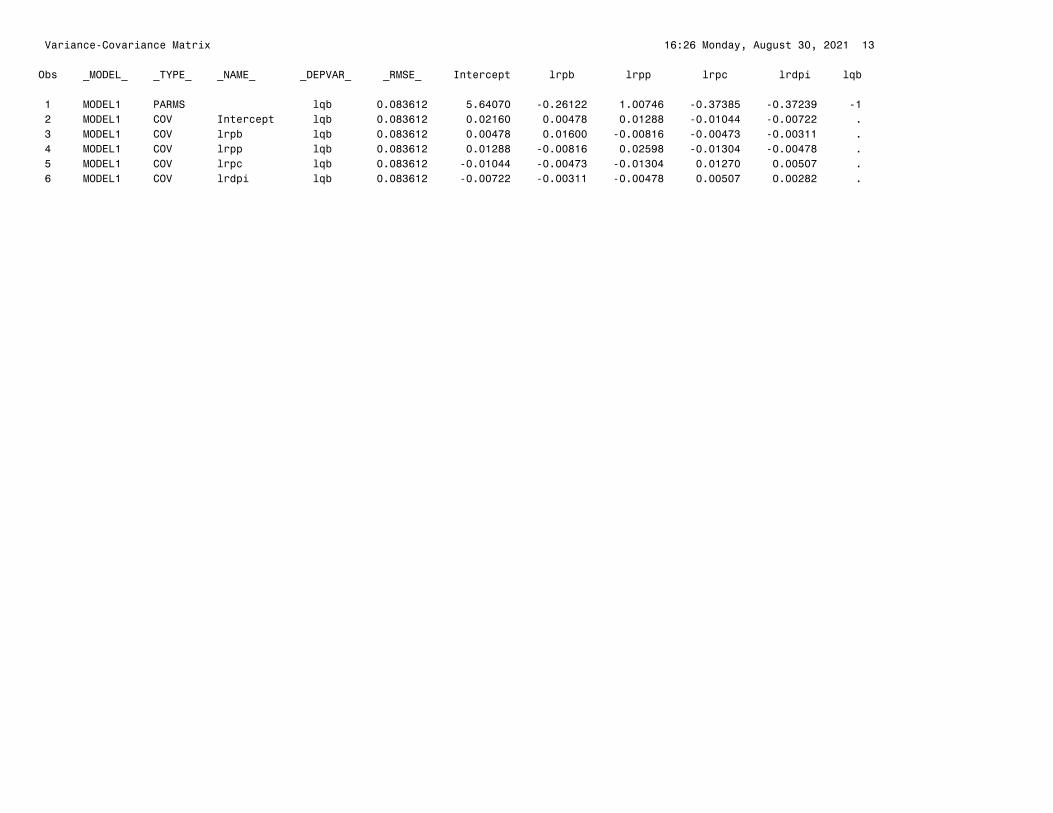
�Variance-Covariance Matrix 16:26 Monday, August 30, 2021 13
Obs _MODEL_ _TYPE_ _NAME_ _DEPVAR_ _RMSE_ Intercept lrpb lrpp lrpc lrdpi lqb
1 MODEL1 PARMS lqb 0.083612 5.64070 -0.26122 1.00746 -0.37385 -0.37239 -1 2 MODEL1 COV Intercept lqb 0.083612 0.02160 0.00478 0.01288 -0.01044 -0.00722 . 3 MODEL1 COV lrpb lqb 0.083612 0.00478 0.01600 -0.00816 -0.00473 -0.00311 . 4 MODEL1 COV lrpp lqb 0.083612 0.01288 -0.00816 0.02598 -0.01304 -0.00478 . 5 MODEL1 COV lrpc lqb 0.083612 -0.01044 -0.00473 -0.01304 0.01270 0.00507 . 6 MODEL1 COV lrdpi lqb 0.083612 -0.00722 -0.00311 -0.00478 0.00507 0.00282 .
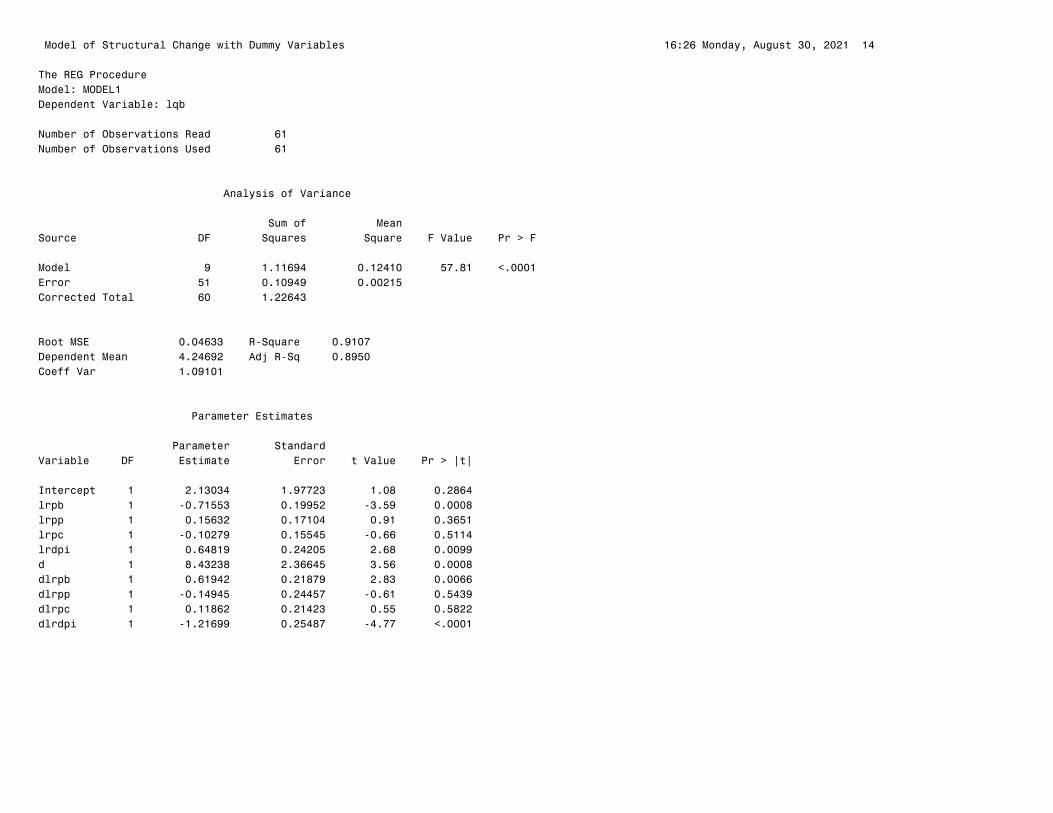
�Model of Structural Change with Dummy Variables 16:26 Monday, August 30, 2021 14
The REG ProcedureModel: MODEL1Dependent Variable: lqb
Number of Observations Read 61Number of Observations Used 61
Analysis of Variance Sum of MeanSource DF Squares Square F Value Pr > F
Model 9 1.11694 0.12410 57.81 <.0001Error 51 0.10949 0.00215 Corrected Total 60 1.22643
Root MSE 0.04633 R-Square 0.9107Dependent Mean 4.24692 Adj R-Sq 0.8950Coeff Var 1.09101
Parameter Estimates Parameter StandardVariable DF Estimate Error t Value Pr > |t|
Intercept 1 2.13034 1.97723 1.08 0.2864lrpb 1 -0.71553 0.19952 -3.59 0.0008lrpp 1 0.15632 0.17104 0.91 0.3651lrpc 1 -0.10279 0.15545 -0.66 0.5114lrdpi 1 0.64819 0.24205 2.68 0.0099d 1 8.43238 2.36645 3.56 0.0008dlrpb 1 0.61942 0.21879 2.83 0.0066dlrpp 1 -0.14945 0.24457 -0.61 0.5439dlrpc 1 0.11862 0.21423 0.55 0.5822dlrdpi 1 -1.21699 0.25487 -4.77 <.0001
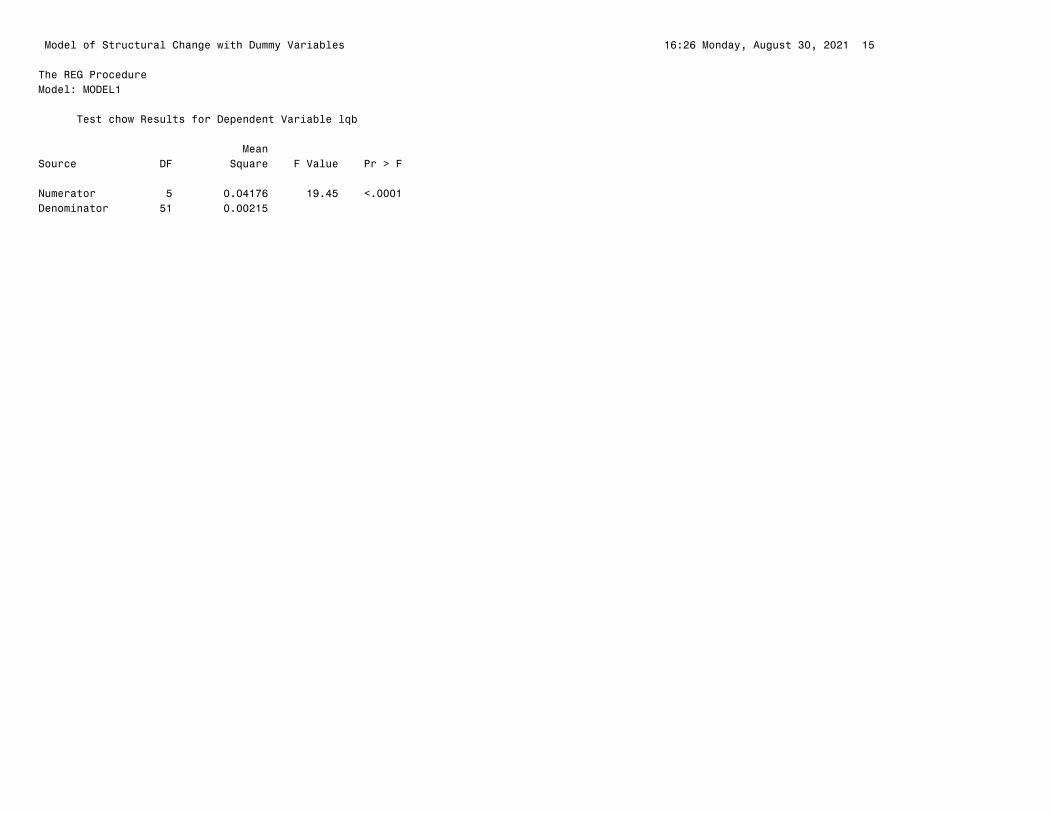
�Model of Structural Change with Dummy Variables 16:26 Monday, August 30, 2021 15
The REG ProcedureModel: MODEL1
Test chow Results for Dependent Variable lqb MeanSource DF Square F Value Pr > F
Numerator 5 0.04176 19.45 <.0001Denominator 51 0.00215
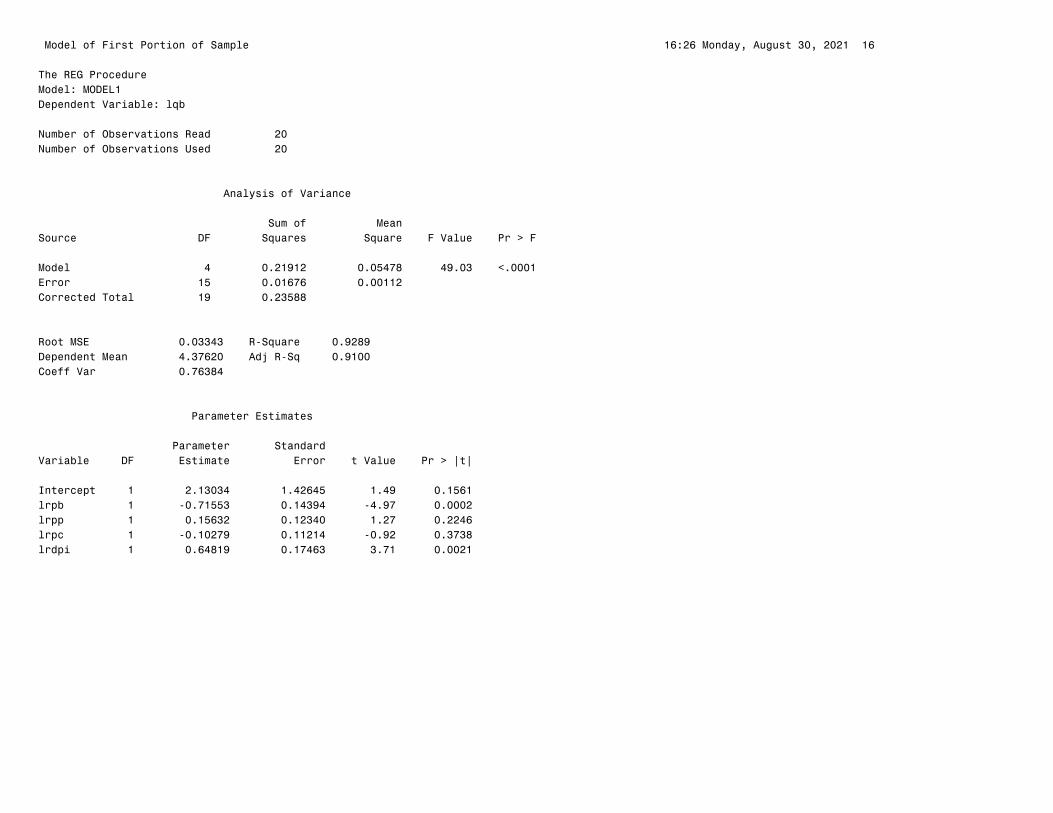
�Model of First Portion of Sample 16:26 Monday, August 30, 2021 16
The REG ProcedureModel: MODEL1Dependent Variable: lqb
Number of Observations Read 20Number of Observations Used 20
Analysis of Variance Sum of MeanSource DF Squares Square F Value Pr > F
Model 4 0.21912 0.05478 49.03 <.0001Error 15 0.01676 0.00112 Corrected Total 19 0.23588
Root MSE 0.03343 R-Square 0.9289Dependent Mean 4.37620 Adj R-Sq 0.9100Coeff Var 0.76384
Parameter Estimates Parameter StandardVariable DF Estimate Error t Value Pr > |t|
Intercept 1 2.13034 1.42645 1.49 0.1561lrpb 1 -0.71553 0.14394 -4.97 0.0002lrpp 1 0.15632 0.12340 1.27 0.2246lrpc 1 -0.10279 0.11214 -0.92 0.3738lrdpi 1 0.64819 0.17463 3.71 0.0021

�Model of Second Portion of Sample 16:26 Monday, August 30, 2021 17
The REG ProcedureModel: MODEL1Dependent Variable: lqb
Number of Observations Read 41Number of Observations Used 41
Analysis of Variance Sum of MeanSource DF Squares Square F Value Pr > F
Model 4 0.40047 0.10012 38.87 <.0001Error 36 0.09273 0.00258 Corrected Total 40 0.49320
Root MSE 0.05075 R-Square 0.8120Dependent Mean 4.18385 Adj R-Sq 0.7911Coeff Var 1.21306
Parameter Estimates Parameter StandardVariable DF Estimate Error t Value Pr > |t|
Intercept 1 10.56271 1.42424 7.42 <.0001lrpb 1 -0.09611 0.09836 -0.98 0.3350lrpp 1 0.00687 0.19148 0.04 0.9716lrpc 1 0.01582 0.16147 0.10 0.9225lrdpi 1 -0.56879 0.08743 -6.51 <.0001
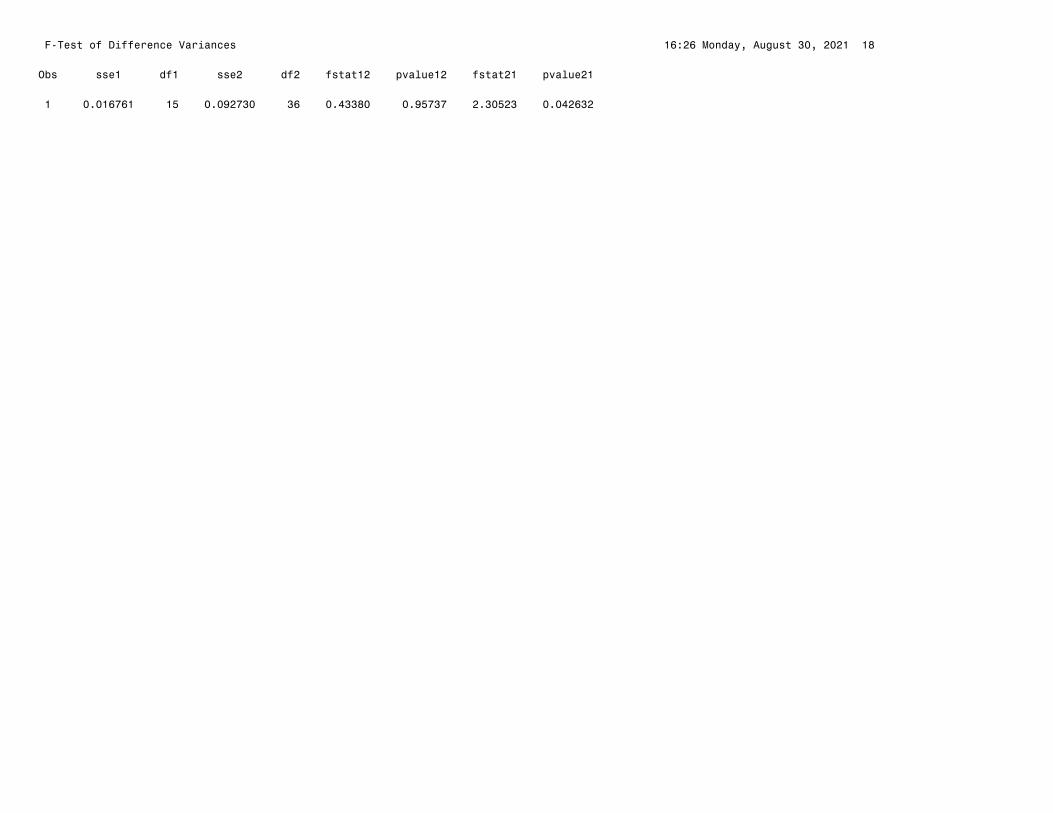
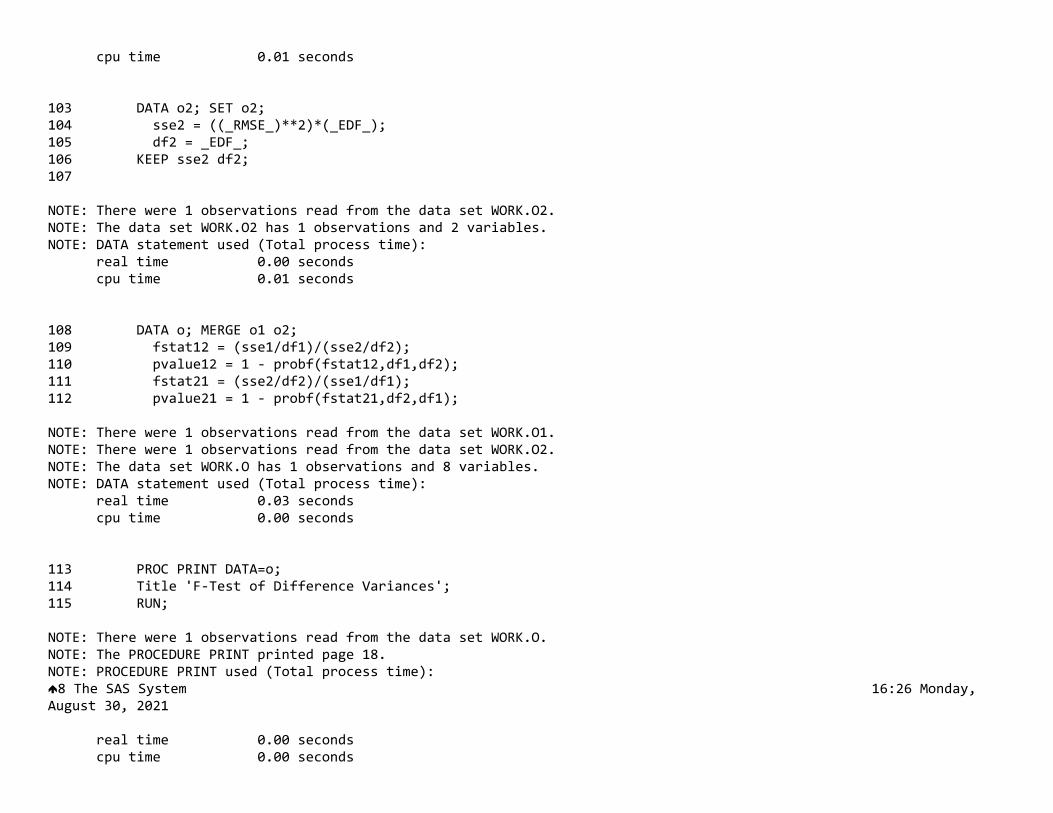
�F-Test of Difference Variances 16:26 Monday, August 30, 2021 18
Obs sse1 df1 sse2 df2 fstat12 pvalue12 fstat21 pvalue21
1 0.016761 15 0.092730 36 0.43380 0.95737 2.30523 0.042632
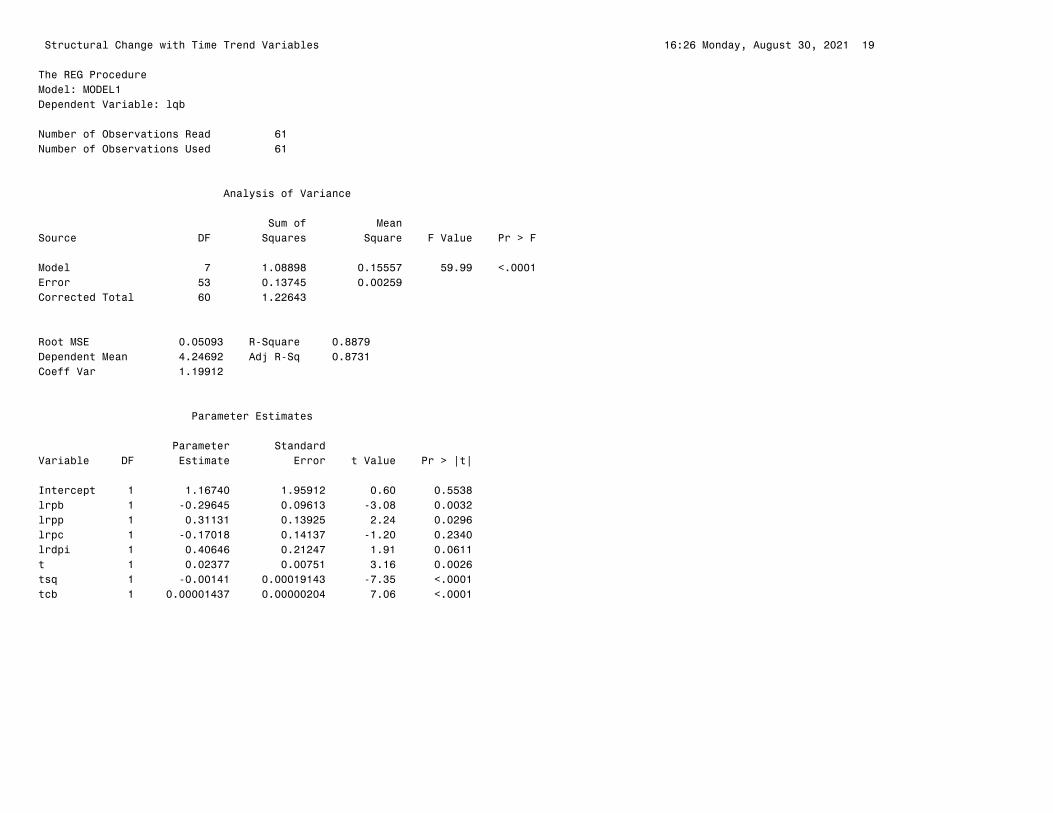
�Structural Change with Time Trend Variables 16:26 Monday, August 30, 2021 19
The REG ProcedureModel: MODEL1Dependent Variable: lqb
Number of Observations Read 61Number of Observations Used 61
Analysis of Variance Sum of MeanSource DF Squares Square F Value Pr > F
Model 7 1.08898 0.15557 59.99 <.0001Error 53 0.13745 0.00259 Corrected Total 60 1.22643
Root MSE 0.05093 R-Square 0.8879Dependent Mean 4.24692 Adj R-Sq 0.8731Coeff Var 1.19912
Parameter Estimates Parameter StandardVariable DF Estimate Error t Value Pr > |t|
Intercept 1 1.16740 1.95912 0.60 0.5538lrpb 1 -0.29645 0.09613 -3.08 0.0032lrpp 1 0.31131 0.13925 2.24 0.0296lrpc 1 -0.17018 0.14137 -1.20 0.2340lrdpi 1 0.40646 0.21247 1.91 0.0611t 1 0.02377 0.00751 3.16 0.0026tsq 1 -0.00141 0.00019143 -7.35 <.0001tcb 1 0.00001437 0.00000204 7.06 <.0001
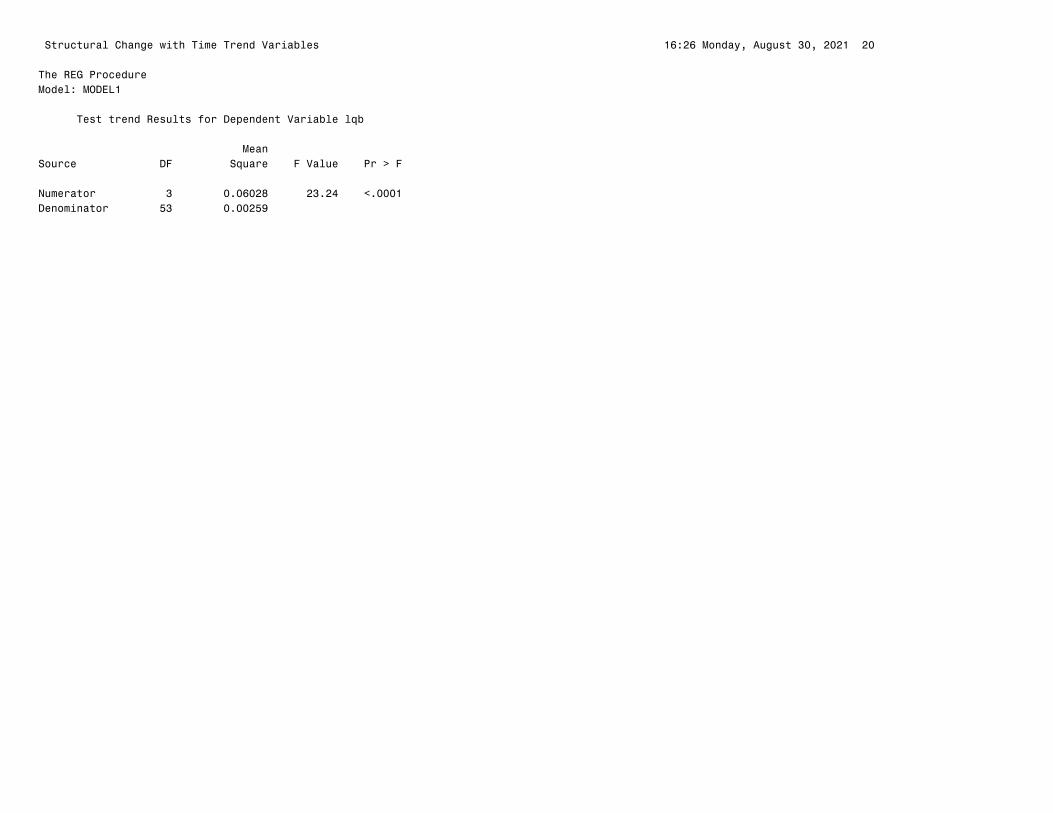
�Structural Change with Time Trend Variables 16:26 Monday, August 30, 2021 20
The REG ProcedureModel: MODEL1
Test trend Results for Dependent Variable lqb MeanSource DF Square F Value Pr > F
Numerator 3 0.06028 23.24 <.0001Denominator 53 0.00259
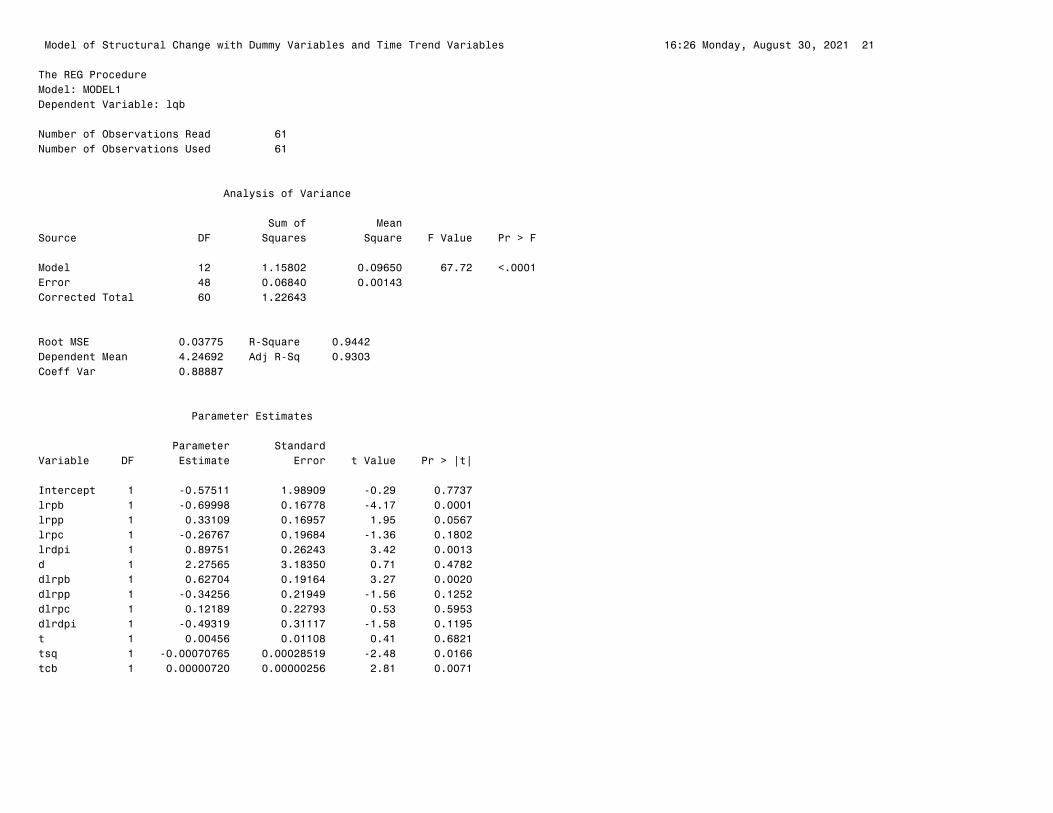
�Model of Structural Change with Dummy Variables and Time Trend Variables 16:26 Monday, August 30, 2021 21
The REG ProcedureModel: MODEL1Dependent Variable: lqb
Number of Observations Read 61Number of Observations Used 61
Analysis of Variance Sum of MeanSource DF Squares Square F Value Pr > F
Model 12 1.15802 0.09650 67.72 <.0001Error 48 0.06840 0.00143 Corrected Total 60 1.22643
Root MSE 0.03775 R-Square 0.9442Dependent Mean 4.24692 Adj R-Sq 0.9303Coeff Var 0.88887
Parameter Estimates Parameter StandardVariable DF Estimate Error t Value Pr > |t|
Intercept 1 -0.57511 1.98909 -0.29 0.7737lrpb 1 -0.69998 0.16778 -4.17 0.0001lrpp 1 0.33109 0.16957 1.95 0.0567lrpc 1 -0.26767 0.19684 -1.36 0.1802lrdpi 1 0.89751 0.26243 3.42 0.0013d 1 2.27565 3.18350 0.71 0.4782dlrpb 1 0.62704 0.19164 3.27 0.0020dlrpp 1 -0.34256 0.21949 -1.56 0.1252dlrpc 1 0.12189 0.22793 0.53 0.5953dlrdpi 1 -0.49319 0.31117 -1.58 0.1195t 1 0.00456 0.01108 0.41 0.6821tsq 1 -0.00070765 0.00028519 -2.48 0.0166tcb 1 0.00000720 0.00000256 2.81 0.0071
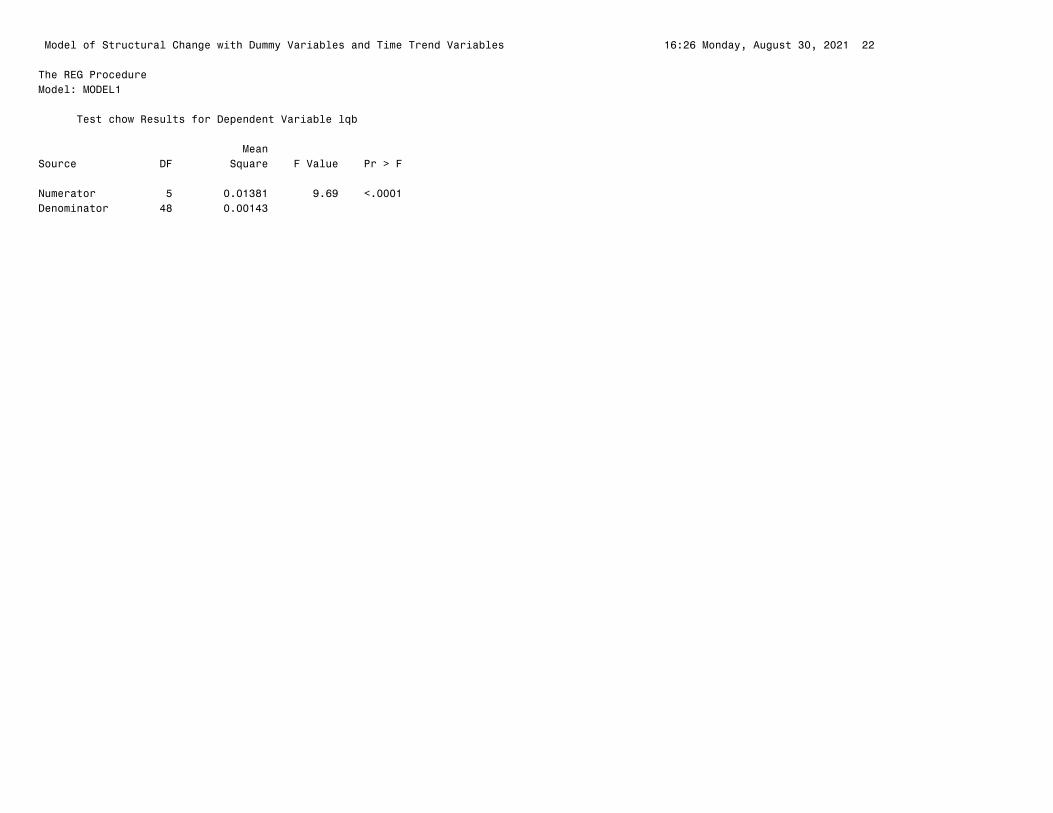
�Model of Structural Change with Dummy Variables and Time Trend Variables 16:26 Monday, August 30, 2021 22
The REG ProcedureModel: MODEL1
Test chow Results for Dependent Variable lqb MeanSource DF Square F Value Pr > F
Numerator 5 0.01381 9.69 <.0001Denominator 48 0.00143

�Model of Structural Change with Dummy Variables and Time Trend Variables 16:26 Monday, August 30, 2021 23
The REG ProcedureModel: MODEL1
Test trend Results for Dependent Variable lqb MeanSource DF Square F Value Pr > F
Numerator 3 0.01370 9.61 <.0001Denominator 48 0.00143
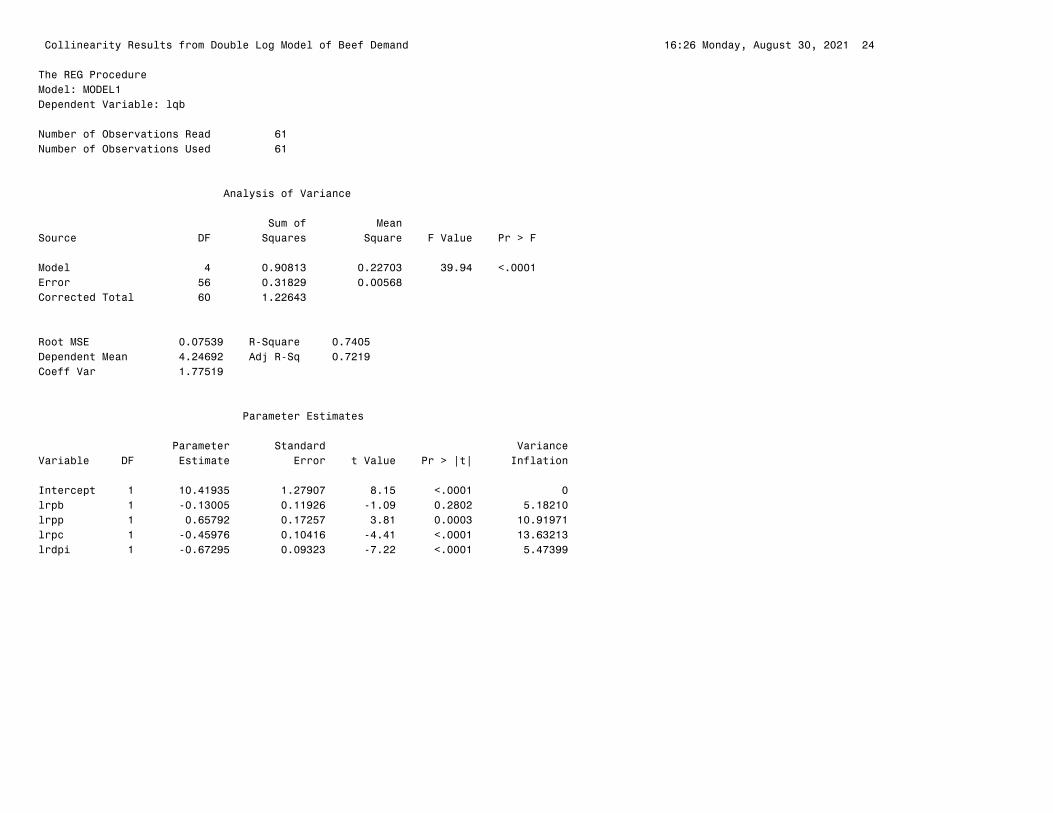
�Collinearity Results from Double Log Model of Beef Demand 16:26 Monday, August 30, 2021 24
The REG ProcedureModel: MODEL1Dependent Variable: lqb
Number of Observations Read 61Number of Observations Used 61
Analysis of Variance Sum of MeanSource DF Squares Square F Value Pr > F
Model 4 0.90813 0.22703 39.94 <.0001Error 56 0.31829 0.00568 Corrected Total 60 1.22643
Root MSE 0.07539 R-Square 0.7405Dependent Mean 4.24692 Adj R-Sq 0.7219Coeff Var 1.77519
Parameter Estimates Parameter Standard VarianceVariable DF Estimate Error t Value Pr > |t| Inflation
Intercept 1 10.41935 1.27907 8.15 <.0001 0lrpb 1 -0.13005 0.11926 -1.09 0.2802 5.18210lrpp 1 0.65792 0.17257 3.81 0.0003 10.91971lrpc 1 -0.45976 0.10416 -4.41 <.0001 13.63213lrdpi 1 -0.67295 0.09323 -7.22 <.0001 5.47399
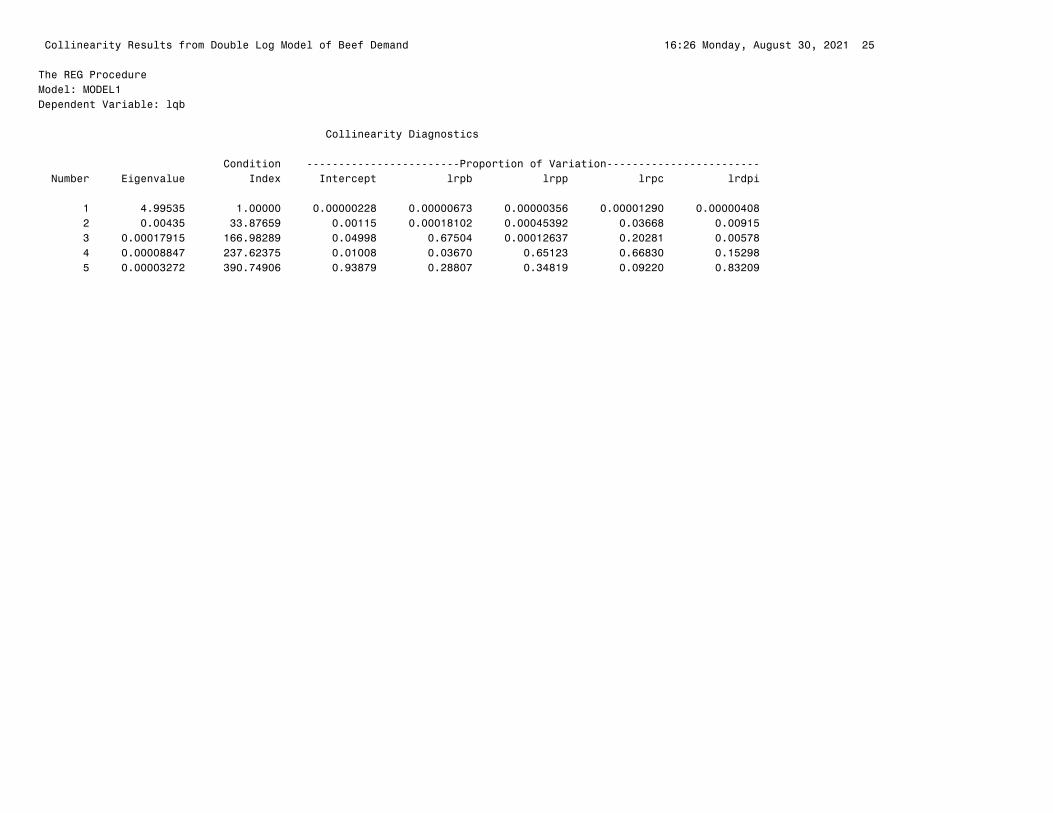
�Collinearity Results from Double Log Model of Beef Demand 16:26 Monday, August 30, 2021 25
The REG ProcedureModel: MODEL1Dependent Variable: lqb
Collinearity Diagnostics Condition ------------------------Proportion of Variation------------------------ Number Eigenvalue Index Intercept lrpb lrpp lrpc lrdpi
1 4.99535 1.00000 0.00000228 0.00000673 0.00000356 0.00001290 0.00000408 2 0.00435 33.87659 0.00115 0.00018102 0.00045392 0.03668 0.00915 3 0.00017915 166.98289 0.04998 0.67504 0.00012637 0.20281 0.00578 4 0.00008847 237.62375 0.01008 0.03670 0.65123 0.66830 0.15298 5 0.00003272 390.74906 0.93879 0.28807 0.34819 0.09220 0.83209
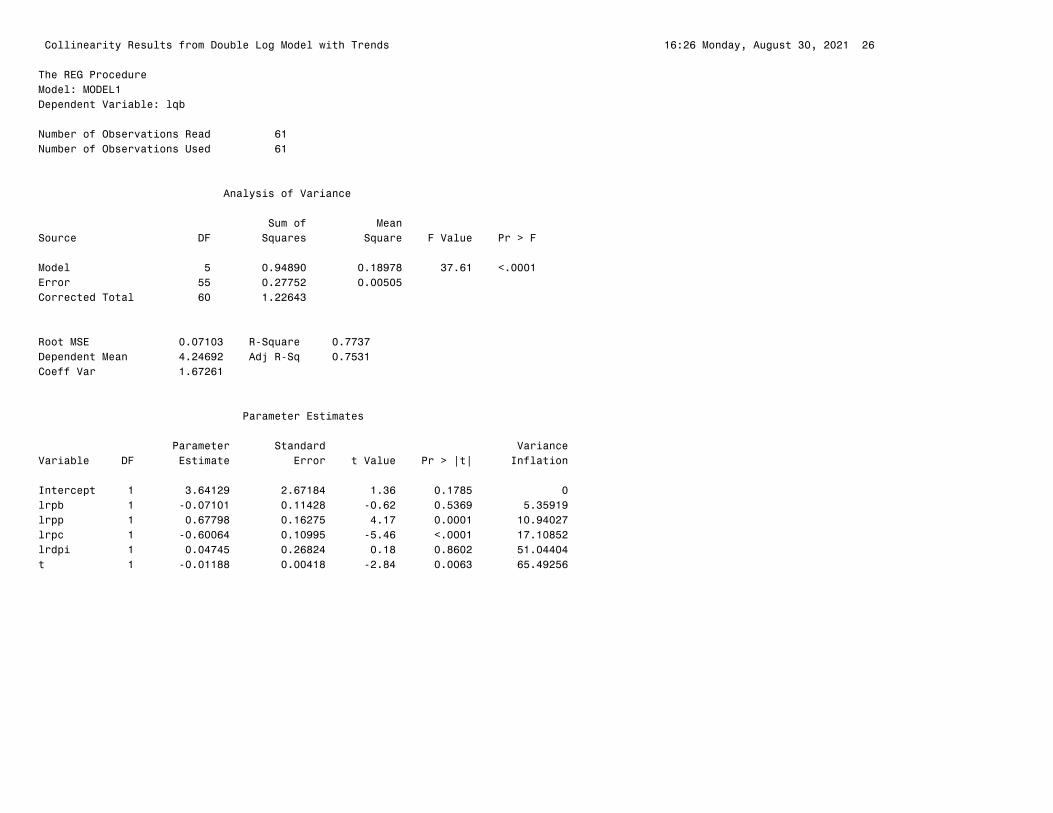
�Collinearity Results from Double Log Model with Trends 16:26 Monday, August 30, 2021 26
The REG ProcedureModel: MODEL1Dependent Variable: lqb
Number of Observations Read 61Number of Observations Used 61
Analysis of Variance Sum of MeanSource DF Squares Square F Value Pr > F
Model 5 0.94890 0.18978 37.61 <.0001Error 55 0.27752 0.00505 Corrected Total 60 1.22643
Root MSE 0.07103 R-Square 0.7737Dependent Mean 4.24692 Adj R-Sq 0.7531Coeff Var 1.67261
Parameter Estimates Parameter Standard VarianceVariable DF Estimate Error t Value Pr > |t| Inflation
Intercept 1 3.64129 2.67184 1.36 0.1785 0lrpb 1 -0.07101 0.11428 -0.62 0.5369 5.35919lrpp 1 0.67798 0.16275 4.17 0.0001 10.94027lrpc 1 -0.60064 0.10995 -5.46 <.0001 17.10852lrdpi 1 0.04745 0.26824 0.18 0.8602 51.04404t 1 -0.01188 0.00418 -2.84 0.0063 65.49256
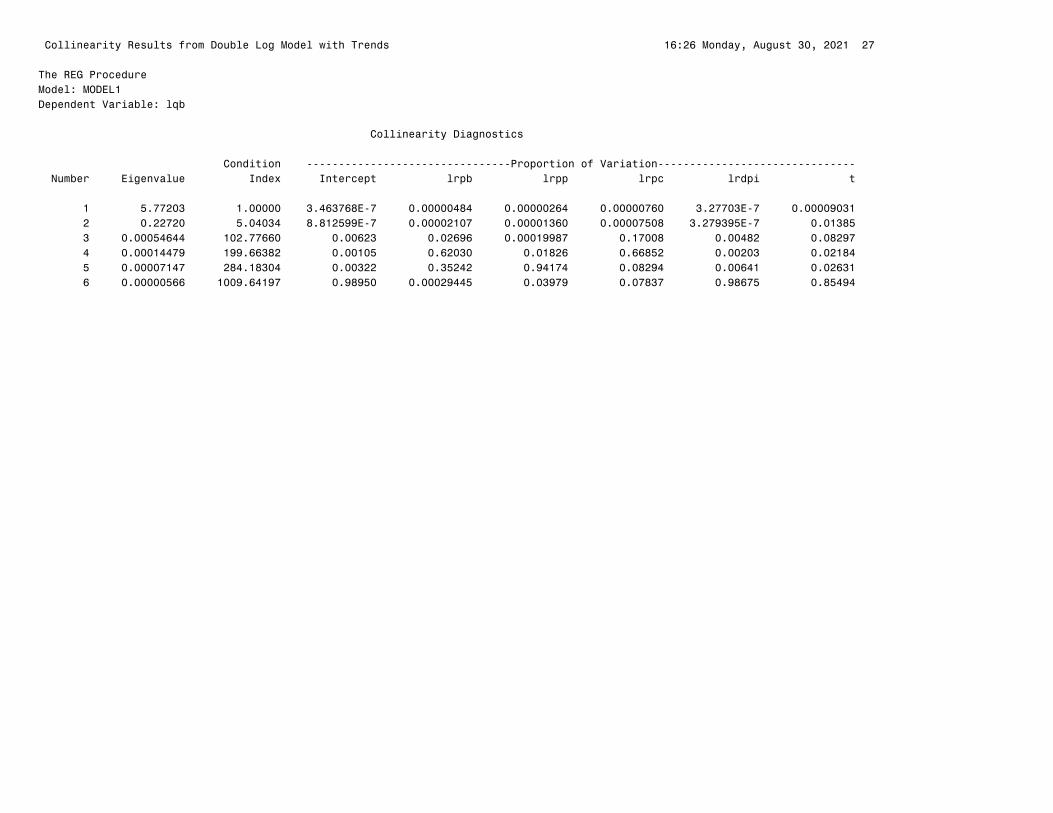
�Collinearity Results from Double Log Model with Trends 16:26 Monday, August 30, 2021 27
The REG ProcedureModel: MODEL1Dependent Variable: lqb
Collinearity Diagnostics Condition --------------------------------Proportion of Variation------------------------------- Number Eigenvalue Index Intercept lrpb lrpp lrpc lrdpi t
1 5.77203 1.00000 3.463768E-7 0.00000484 0.00000264 0.00000760 3.27703E-7 0.00009031 2 0.22720 5.04034 8.812599E-7 0.00002107 0.00001360 0.00007508 3.279395E-7 0.01385 3 0.00054644 102.77660 0.00623 0.02696 0.00019987 0.17008 0.00482 0.08297 4 0.00014479 199.66382 0.00105 0.62030 0.01826 0.66852 0.00203 0.02184 5 0.00007147 284.18304 0.00322 0.35242 0.94174 0.08294 0.00641 0.02631 6 0.00000566 1009.64197 0.98950 0.00029445 0.03979 0.07837 0.98675 0.85494
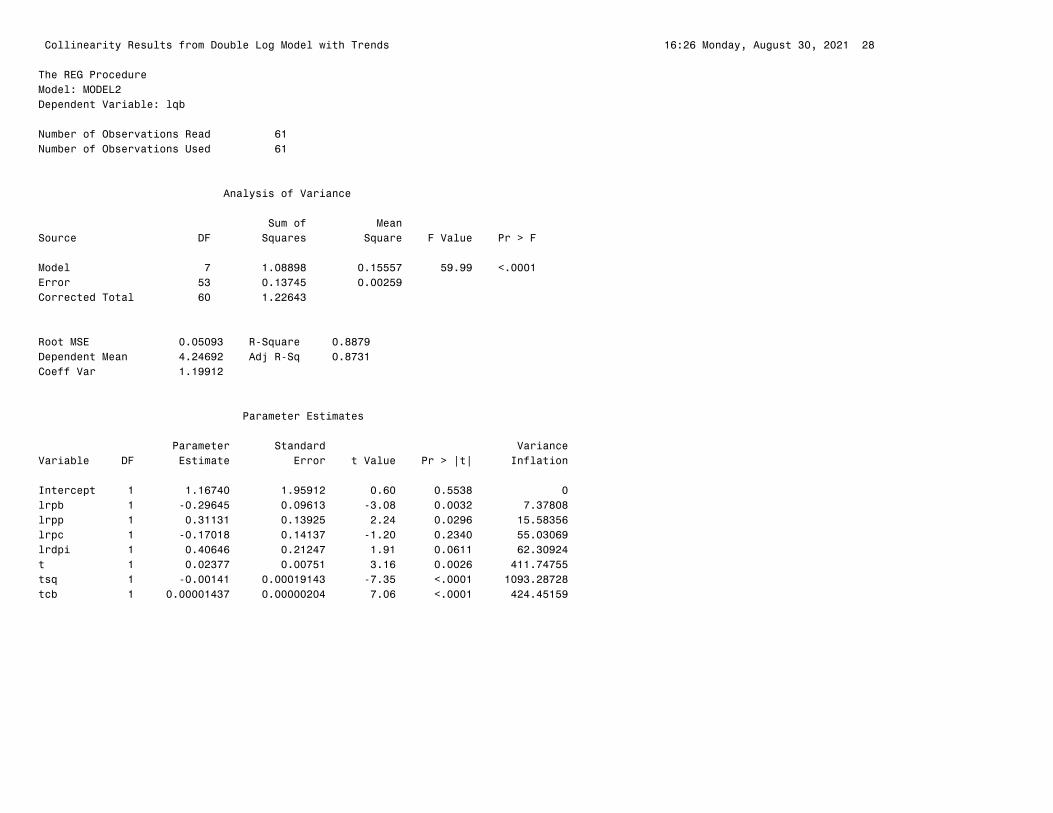
�Collinearity Results from Double Log Model with Trends 16:26 Monday, August 30, 2021 28
The REG ProcedureModel: MODEL2Dependent Variable: lqb
Number of Observations Read 61Number of Observations Used 61
Analysis of Variance Sum of MeanSource DF Squares Square F Value Pr > F
Model 7 1.08898 0.15557 59.99 <.0001Error 53 0.13745 0.00259 Corrected Total 60 1.22643
Root MSE 0.05093 R-Square 0.8879Dependent Mean 4.24692 Adj R-Sq 0.8731Coeff Var 1.19912
Parameter Estimates Parameter Standard VarianceVariable DF Estimate Error t Value Pr > |t| Inflation
Intercept 1 1.16740 1.95912 0.60 0.5538 0lrpb 1 -0.29645 0.09613 -3.08 0.0032 7.37808lrpp 1 0.31131 0.13925 2.24 0.0296 15.58356lrpc 1 -0.17018 0.14137 -1.20 0.2340 55.03069lrdpi 1 0.40646 0.21247 1.91 0.0611 62.30924t 1 0.02377 0.00751 3.16 0.0026 411.74755tsq 1 -0.00141 0.00019143 -7.35 <.0001 1093.28728tcb 1 0.00001437 0.00000204 7.06 <.0001 424.45159
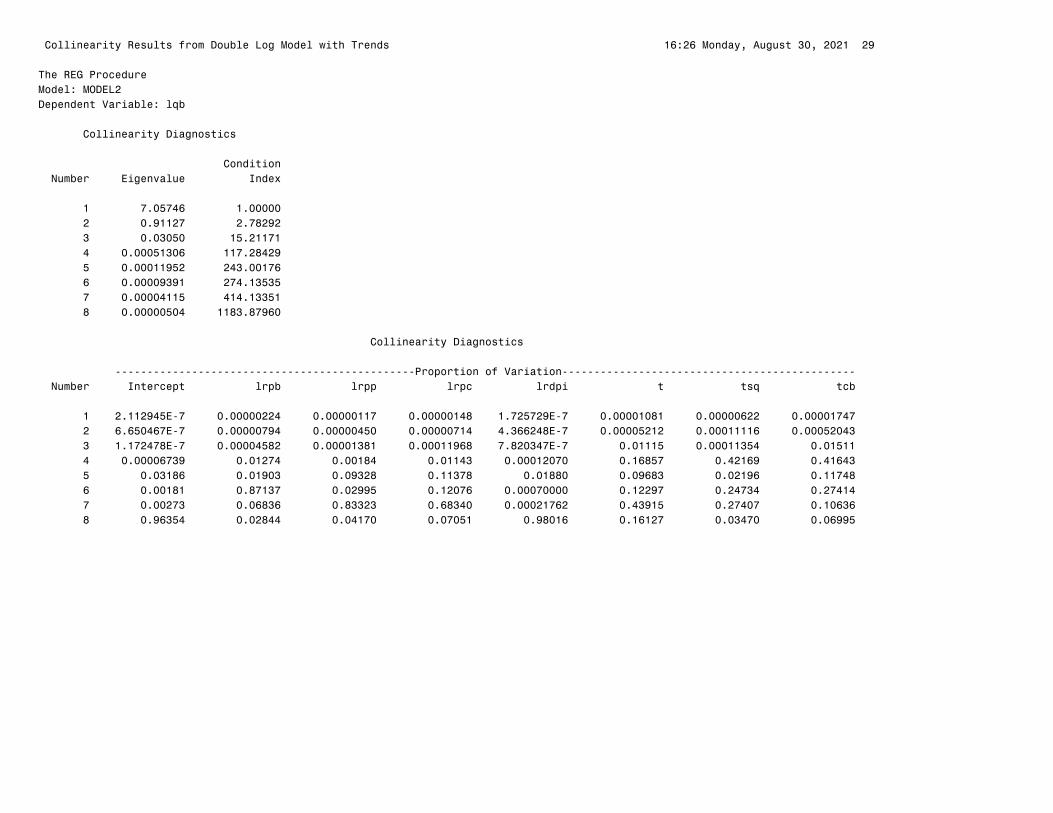
�Collinearity Results from Double Log Model with Trends 16:26 Monday, August 30, 2021 29
The REG ProcedureModel: MODEL2Dependent Variable: lqb
Collinearity Diagnostics Condition Number Eigenvalue Index
1 7.05746 1.00000 2 0.91127 2.78292 3 0.03050 15.21171 4 0.00051306 117.28429 5 0.00011952 243.00176 6 0.00009391 274.13535 7 0.00004115 414.13351 8 0.00000504 1183.87960
Collinearity Diagnostics -----------------------------------------------Proportion of Variation---------------------------------------------- Number Intercept lrpb lrpp lrpc lrdpi t tsq tcb
1 2.112945E-7 0.00000224 0.00000117 0.00000148 1.725729E-7 0.00001081 0.00000622 0.00001747 2 6.650467E-7 0.00000794 0.00000450 0.00000714 4.366248E-7 0.00005212 0.00011116 0.00052043 3 1.172478E-7 0.00004582 0.00001381 0.00011968 7.820347E-7 0.01115 0.00011354 0.01511 4 0.00006739 0.01274 0.00184 0.01143 0.00012070 0.16857 0.42169 0.41643 5 0.03186 0.01903 0.09328 0.11378 0.01880 0.09683 0.02196 0.11748 6 0.00181 0.87137 0.02995 0.12076 0.00070000 0.12297 0.24734 0.27414 7 0.00273 0.06836 0.83323 0.68340 0.00021762 0.43915 0.27407 0.10636 8 0.96354 0.02844 0.04170 0.07051 0.98016 0.16127 0.03470 0.06995
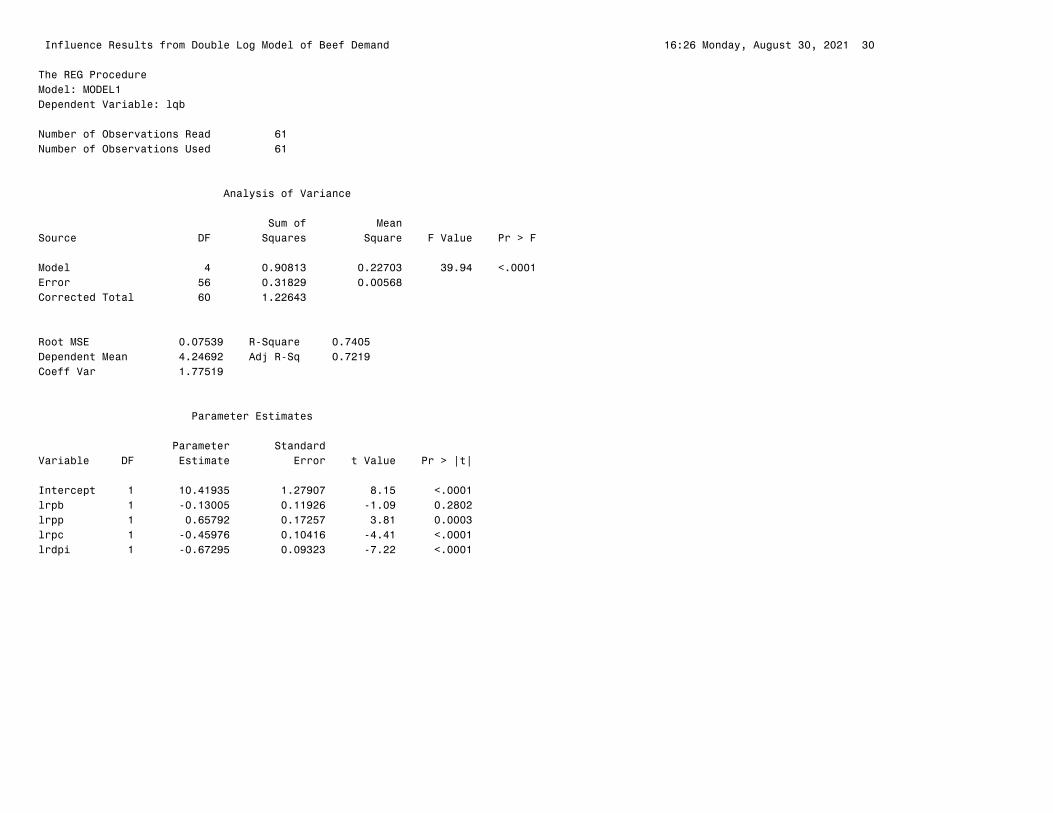
�Influence Results from Double Log Model of Beef Demand 16:26 Monday, August 30, 2021 30
The REG ProcedureModel: MODEL1Dependent Variable: lqb
Number of Observations Read 61Number of Observations Used 61
Analysis of Variance Sum of MeanSource DF Squares Square F Value Pr > F
Model 4 0.90813 0.22703 39.94 <.0001Error 56 0.31829 0.00568 Corrected Total 60 1.22643
Root MSE 0.07539 R-Square 0.7405Dependent Mean 4.24692 Adj R-Sq 0.7219Coeff Var 1.77519
Parameter Estimates Parameter StandardVariable DF Estimate Error t Value Pr > |t|
Intercept 1 10.41935 1.27907 8.15 <.0001lrpb 1 -0.13005 0.11926 -1.09 0.2802lrpp 1 0.65792 0.17257 3.81 0.0003lrpc 1 -0.45976 0.10416 -4.41 <.0001lrdpi 1 -0.67295 0.09323 -7.22 <.0001
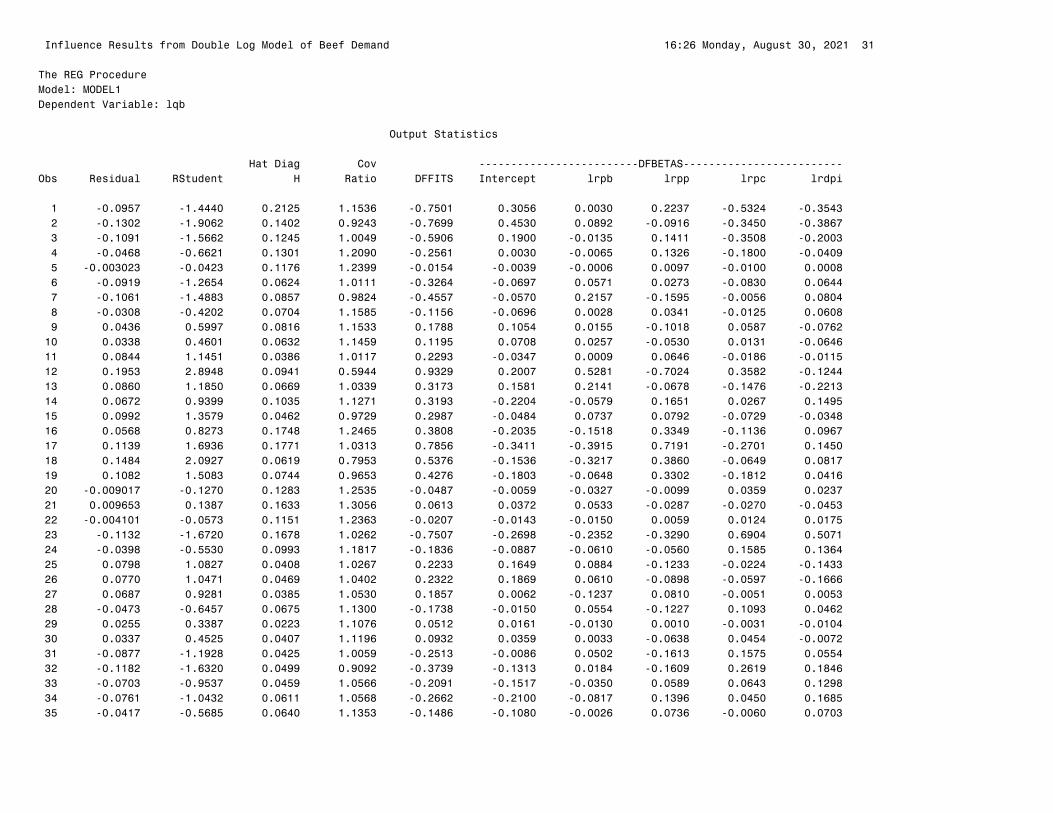
�Influence Results from Double Log Model of Beef Demand 16:26 Monday, August 30, 2021 31
The REG ProcedureModel: MODEL1Dependent Variable: lqb
Output Statistics Hat Diag Cov -------------------------DFBETAS-------------------------Obs Residual RStudent H Ratio DFFITS Intercept lrpb lrpp lrpc lrdpi
1 -0.0957 -1.4440 0.2125 1.1536 -0.7501 0.3056 0.0030 0.2237 -0.5324 -0.3543 2 -0.1302 -1.9062 0.1402 0.9243 -0.7699 0.4530 0.0892 -0.0916 -0.3450 -0.3867 3 -0.1091 -1.5662 0.1245 1.0049 -0.5906 0.1900 -0.0135 0.1411 -0.3508 -0.2003 4 -0.0468 -0.6621 0.1301 1.2090 -0.2561 0.0030 -0.0065 0.1326 -0.1800 -0.0409 5 -0.003023 -0.0423 0.1176 1.2399 -0.0154 -0.0039 -0.0006 0.0097 -0.0100 0.0008 6 -0.0919 -1.2654 0.0624 1.0111 -0.3264 -0.0697 0.0571 0.0273 -0.0830 0.0644 7 -0.1061 -1.4883 0.0857 0.9824 -0.4557 -0.0570 0.2157 -0.1595 -0.0056 0.0804 8 -0.0308 -0.4202 0.0704 1.1585 -0.1156 -0.0696 0.0028 0.0341 -0.0125 0.0608 9 0.0436 0.5997 0.0816 1.1533 0.1788 0.1054 0.0155 -0.1018 0.0587 -0.0762 10 0.0338 0.4601 0.0632 1.1459 0.1195 0.0708 0.0257 -0.0530 0.0131 -0.0646 11 0.0844 1.1451 0.0386 1.0117 0.2293 -0.0347 0.0009 0.0646 -0.0186 -0.0115 12 0.1953 2.8948 0.0941 0.5944 0.9329 0.2007 0.5281 -0.7024 0.3582 -0.1244 13 0.0860 1.1850 0.0669 1.0339 0.3173 0.1581 0.2141 -0.0678 -0.1476 -0.2213 14 0.0672 0.9399 0.1035 1.1271 0.3193 -0.2204 -0.0579 0.1651 0.0267 0.1495 15 0.0992 1.3579 0.0462 0.9729 0.2987 -0.0484 0.0737 0.0792 -0.0729 -0.0348 16 0.0568 0.8273 0.1748 1.2465 0.3808 -0.2035 -0.1518 0.3349 -0.1136 0.0967 17 0.1139 1.6936 0.1771 1.0313 0.7856 -0.3411 -0.3915 0.7191 -0.2701 0.1450 18 0.1484 2.0927 0.0619 0.7953 0.5376 -0.1536 -0.3217 0.3860 -0.0649 0.0817 19 0.1082 1.5083 0.0744 0.9653 0.4276 -0.1803 -0.0648 0.3302 -0.1812 0.0416 20 -0.009017 -0.1270 0.1283 1.2535 -0.0487 -0.0059 -0.0327 -0.0099 0.0359 0.0237 21 0.009653 0.1387 0.1633 1.3056 0.0613 0.0372 0.0533 -0.0287 -0.0270 -0.0453 22 -0.004101 -0.0573 0.1151 1.2363 -0.0207 -0.0143 -0.0150 0.0059 0.0124 0.0175 23 -0.1132 -1.6720 0.1678 1.0262 -0.7507 -0.2698 -0.2352 -0.3290 0.6904 0.5071 24 -0.0398 -0.5530 0.0993 1.1817 -0.1836 -0.0887 -0.0610 -0.0560 0.1585 0.1364 25 0.0798 1.0827 0.0408 1.0267 0.2233 0.1649 0.0884 -0.1233 -0.0224 -0.1433 26 0.0770 1.0471 0.0469 1.0402 0.2322 0.1869 0.0610 -0.0898 -0.0597 -0.1666 27 0.0687 0.9281 0.0385 1.0530 0.1857 0.0062 -0.1237 0.0810 -0.0051 0.0053 28 -0.0473 -0.6457 0.0675 1.1300 -0.1738 -0.0150 0.0554 -0.1227 0.1093 0.0462 29 0.0255 0.3387 0.0223 1.1076 0.0512 0.0161 -0.0130 0.0010 -0.0031 -0.0104 30 0.0337 0.4525 0.0407 1.1196 0.0932 0.0359 0.0033 -0.0638 0.0454 -0.0072 31 -0.0877 -1.1928 0.0425 1.0059 -0.2513 -0.0086 0.0502 -0.1613 0.1575 0.0554 32 -0.1182 -1.6320 0.0499 0.9092 -0.3739 -0.1313 0.0184 -0.1609 0.2619 0.1846 33 -0.0703 -0.9537 0.0459 1.0566 -0.2091 -0.1517 -0.0350 0.0589 0.0643 0.1298 34 -0.0761 -1.0432 0.0611 1.0568 -0.2662 -0.2100 -0.0817 0.1396 0.0450 0.1685 35 -0.0417 -0.5685 0.0640 1.1353 -0.1486 -0.1080 -0.0026 0.0736 -0.0060 0.0703
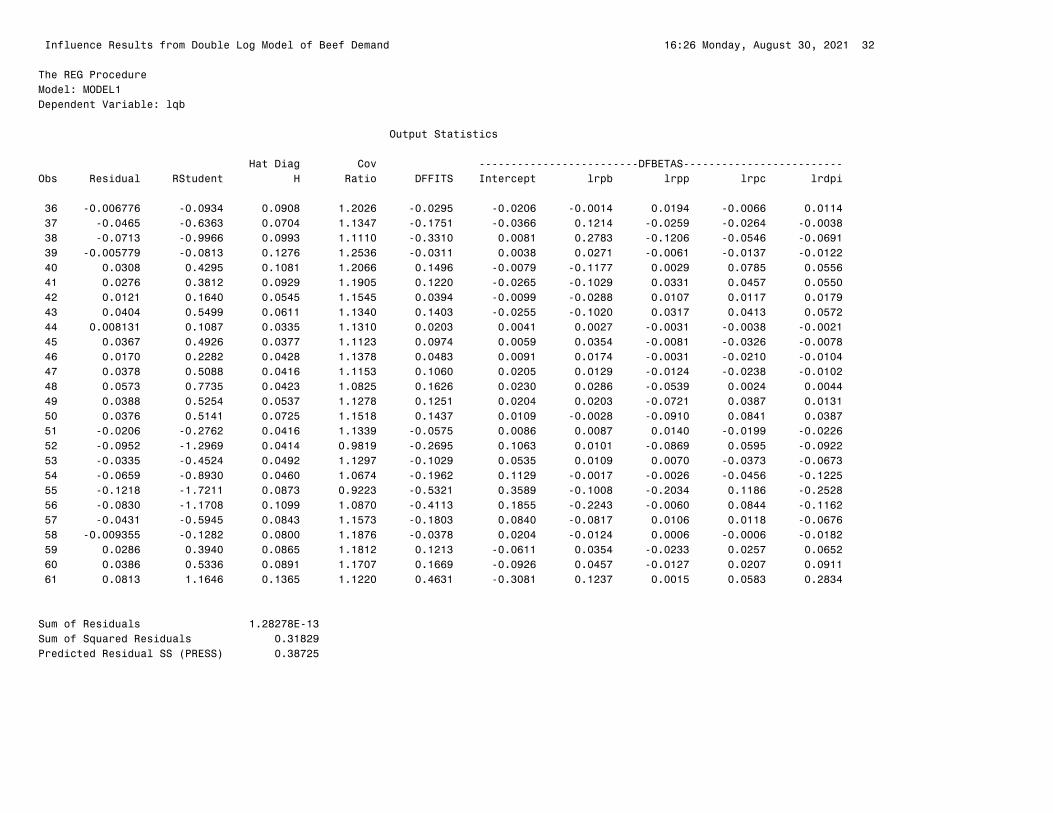
�Influence Results from Double Log Model of Beef Demand 16:26 Monday, August 30, 2021 32
The REG ProcedureModel: MODEL1Dependent Variable: lqb
Output Statistics Hat Diag Cov -------------------------DFBETAS-------------------------Obs Residual RStudent H Ratio DFFITS Intercept lrpb lrpp lrpc lrdpi
36 -0.006776 -0.0934 0.0908 1.2026 -0.0295 -0.0206 -0.0014 0.0194 -0.0066 0.0114 37 -0.0465 -0.6363 0.0704 1.1347 -0.1751 -0.0366 0.1214 -0.0259 -0.0264 -0.0038 38 -0.0713 -0.9966 0.0993 1.1110 -0.3310 0.0081 0.2783 -0.1206 -0.0546 -0.0691 39 -0.005779 -0.0813 0.1276 1.2536 -0.0311 0.0038 0.0271 -0.0061 -0.0137 -0.0122 40 0.0308 0.4295 0.1081 1.2066 0.1496 -0.0079 -0.1177 0.0029 0.0785 0.0556 41 0.0276 0.3812 0.0929 1.1905 0.1220 -0.0265 -0.1029 0.0331 0.0457 0.0550 42 0.0121 0.1640 0.0545 1.1545 0.0394 -0.0099 -0.0288 0.0107 0.0117 0.0179 43 0.0404 0.5499 0.0611 1.1340 0.1403 -0.0255 -0.1020 0.0317 0.0413 0.0572 44 0.008131 0.1087 0.0335 1.1310 0.0203 0.0041 0.0027 -0.0031 -0.0038 -0.0021 45 0.0367 0.4926 0.0377 1.1123 0.0974 0.0059 0.0354 -0.0081 -0.0326 -0.0078 46 0.0170 0.2282 0.0428 1.1378 0.0483 0.0091 0.0174 -0.0031 -0.0210 -0.0104 47 0.0378 0.5088 0.0416 1.1153 0.1060 0.0205 0.0129 -0.0124 -0.0238 -0.0102 48 0.0573 0.7735 0.0423 1.0825 0.1626 0.0230 0.0286 -0.0539 0.0024 0.0044 49 0.0388 0.5254 0.0537 1.1278 0.1251 0.0204 0.0203 -0.0721 0.0387 0.0131 50 0.0376 0.5141 0.0725 1.1518 0.1437 0.0109 -0.0028 -0.0910 0.0841 0.0387 51 -0.0206 -0.2762 0.0416 1.1339 -0.0575 0.0086 0.0087 0.0140 -0.0199 -0.0226 52 -0.0952 -1.2969 0.0414 0.9819 -0.2695 0.1063 0.0101 -0.0869 0.0595 -0.0922 53 -0.0335 -0.4524 0.0492 1.1297 -0.1029 0.0535 0.0109 0.0070 -0.0373 -0.0673 54 -0.0659 -0.8930 0.0460 1.0674 -0.1962 0.1129 -0.0017 -0.0026 -0.0456 -0.1225 55 -0.1218 -1.7211 0.0873 0.9223 -0.5321 0.3589 -0.1008 -0.2034 0.1186 -0.2528 56 -0.0830 -1.1708 0.1099 1.0870 -0.4113 0.1855 -0.2243 -0.0060 0.0844 -0.1162 57 -0.0431 -0.5945 0.0843 1.1573 -0.1803 0.0840 -0.0817 0.0106 0.0118 -0.0676 58 -0.009355 -0.1282 0.0800 1.1876 -0.0378 0.0204 -0.0124 0.0006 -0.0006 -0.0182 59 0.0286 0.3940 0.0865 1.1812 0.1213 -0.0611 0.0354 -0.0233 0.0257 0.0652 60 0.0386 0.5336 0.0891 1.1707 0.1669 -0.0926 0.0457 -0.0127 0.0207 0.0911 61 0.0813 1.1646 0.1365 1.1220 0.4631 -0.3081 0.1237 0.0015 0.0583 0.2834
Sum of Residuals 1.28278E-13Sum of Squared Residuals 0.31829Predicted Residual SS (PRESS) 0.38725
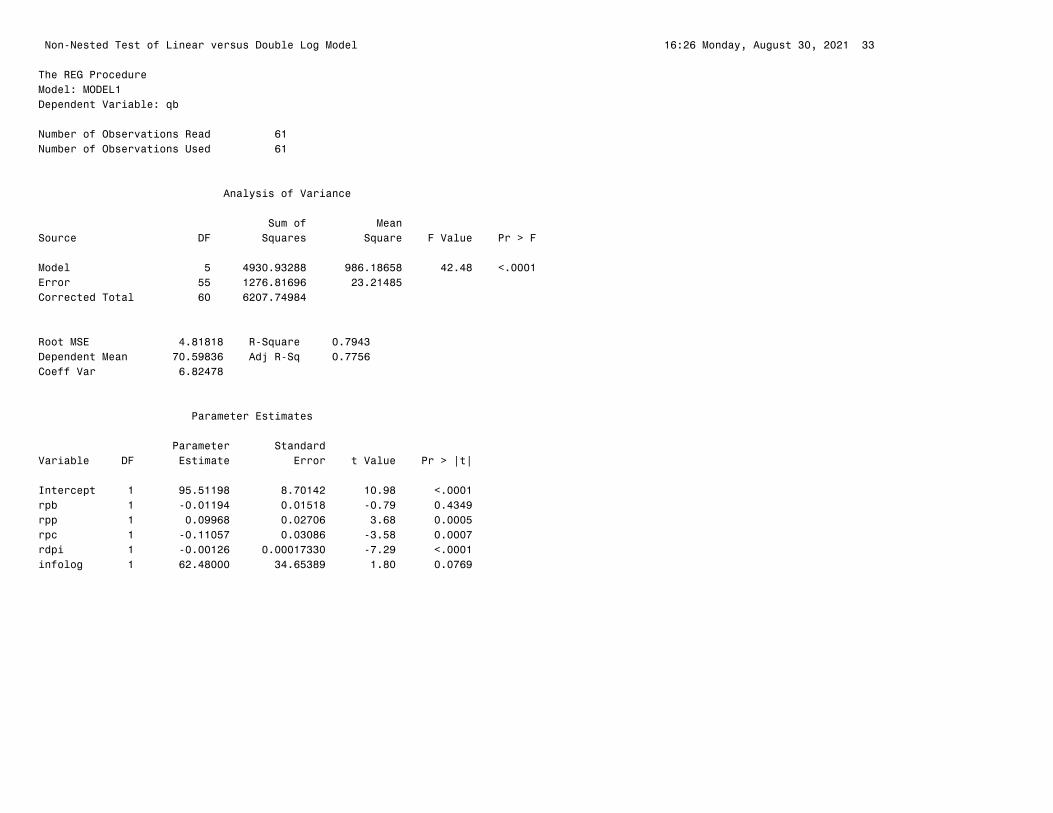
�Non-Nested Test of Linear versus Double Log Model 16:26 Monday, August 30, 2021 33
The REG ProcedureModel: MODEL1Dependent Variable: qb
Number of Observations Read 61Number of Observations Used 61
Analysis of Variance Sum of MeanSource DF Squares Square F Value Pr > F
Model 5 4930.93288 986.18658 42.48 <.0001Error 55 1276.81696 23.21485 Corrected Total 60 6207.74984
Root MSE 4.81818 R-Square 0.7943Dependent Mean 70.59836 Adj R-Sq 0.7756Coeff Var 6.82478
Parameter Estimates Parameter StandardVariable DF Estimate Error t Value Pr > |t|
Intercept 1 95.51198 8.70142 10.98 <.0001rpb 1 -0.01194 0.01518 -0.79 0.4349rpp 1 0.09968 0.02706 3.68 0.0005rpc 1 -0.11057 0.03086 -3.58 0.0007rdpi 1 -0.00126 0.00017330 -7.29 <.0001infolog 1 62.48000 34.65389 1.80 0.0769
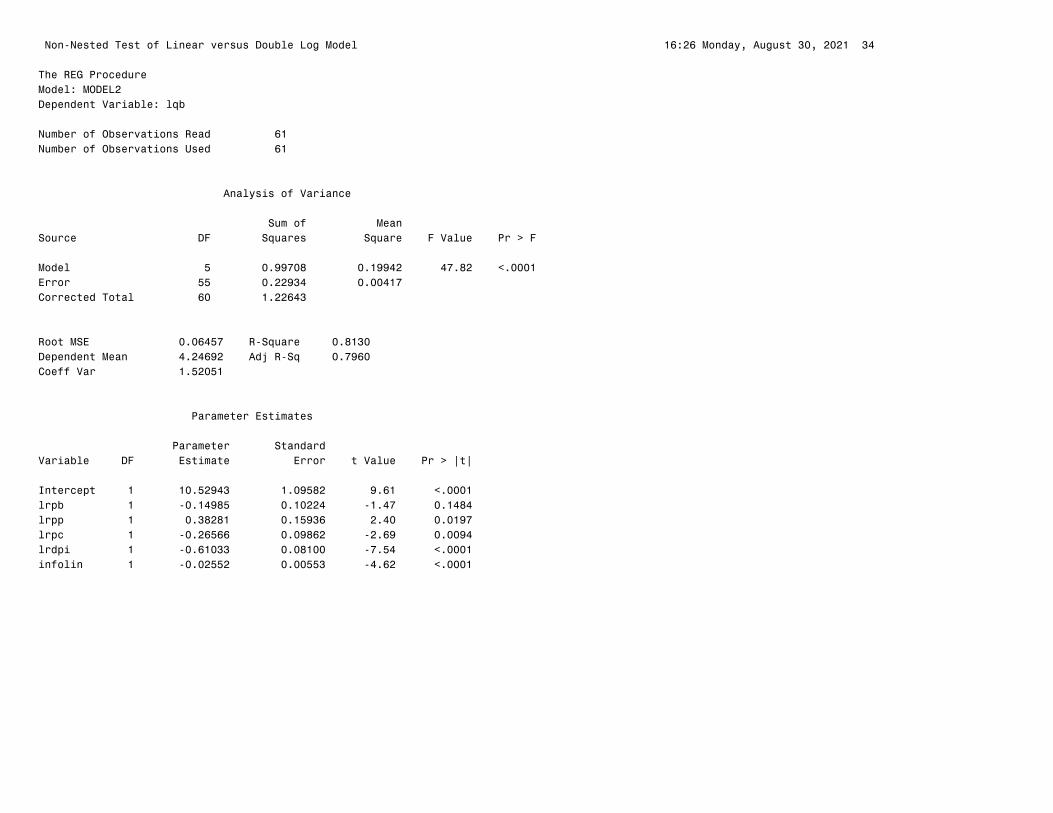
�Non-Nested Test of Linear versus Double Log Model 16:26 Monday, August 30, 2021 34
The REG ProcedureModel: MODEL2Dependent Variable: lqb
Number of Observations Read 61Number of Observations Used 61
Analysis of Variance Sum of MeanSource DF Squares Square F Value Pr > F
Model 5 0.99708 0.19942 47.82 <.0001Error 55 0.22934 0.00417 Corrected Total 60 1.22643
Root MSE 0.06457 R-Square 0.8130Dependent Mean 4.24692 Adj R-Sq 0.7960Coeff Var 1.52051
Parameter Estimates Parameter StandardVariable DF Estimate Error t Value Pr > |t|
Intercept 1 10.52943 1.09582 9.61 <.0001lrpb 1 -0.14985 0.10224 -1.47 0.1484lrpp 1 0.38281 0.15936 2.40 0.0197lrpc 1 -0.26566 0.09862 -2.69 0.0094lrdpi 1 -0.61033 0.08100 -7.54 <.0001infolin 1 -0.02552 0.00553 -4.62 <.0001
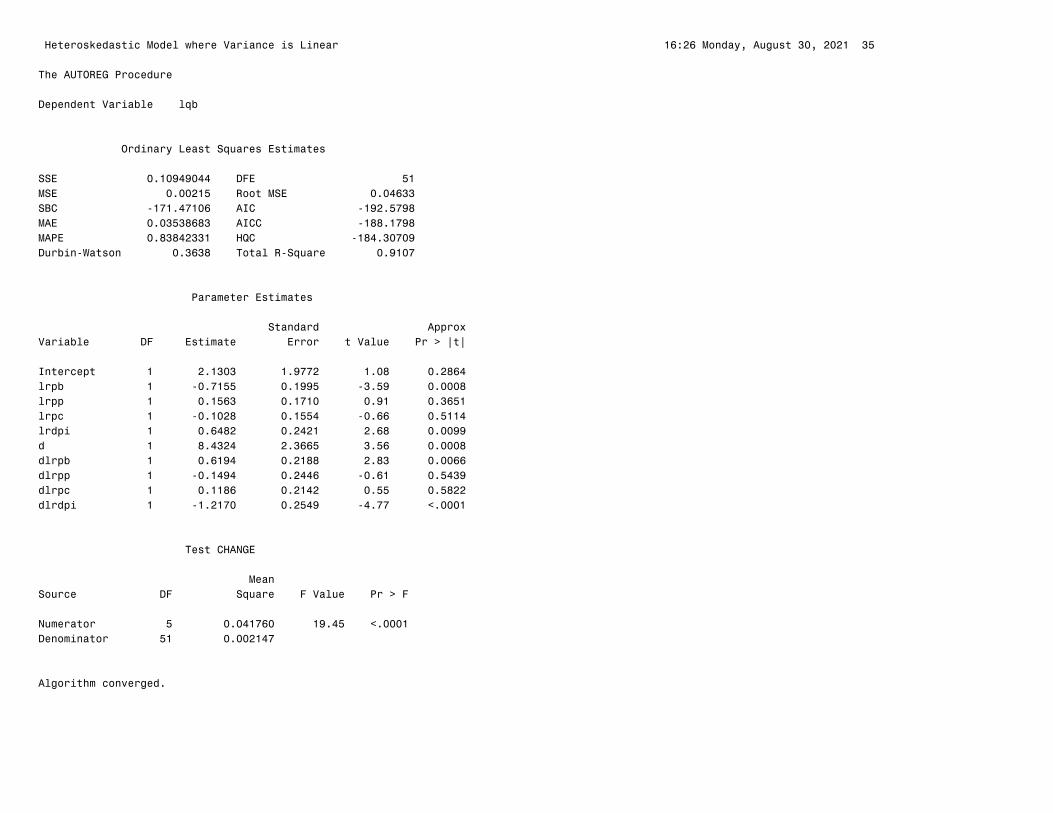
�Heteroskedastic Model where Variance is Linear 16:26 Monday, August 30, 2021 35
The AUTOREG Procedure
Dependent Variable lqb
Ordinary Least Squares Estimates
SSE 0.10949044 DFE 51MSE 0.00215 Root MSE 0.04633SBC -171.47106 AIC -192.5798MAE 0.03538683 AICC -188.1798MAPE 0.83842331 HQC -184.30709Durbin-Watson 0.3638 Total R-Square 0.9107
Parameter Estimates Standard ApproxVariable DF Estimate Error t Value Pr > |t|
Intercept 1 2.1303 1.9772 1.08 0.2864lrpb 1 -0.7155 0.1995 -3.59 0.0008lrpp 1 0.1563 0.1710 0.91 0.3651lrpc 1 -0.1028 0.1554 -0.66 0.5114lrdpi 1 0.6482 0.2421 2.68 0.0099d 1 8.4324 2.3665 3.56 0.0008dlrpb 1 0.6194 0.2188 2.83 0.0066dlrpp 1 -0.1494 0.2446 -0.61 0.5439dlrpc 1 0.1186 0.2142 0.55 0.5822dlrdpi 1 -1.2170 0.2549 -4.77 <.0001
Test CHANGE MeanSource DF Square F Value Pr > F
Numerator 5 0.041760 19.45 <.0001Denominator 51 0.002147
Algorithm converged.
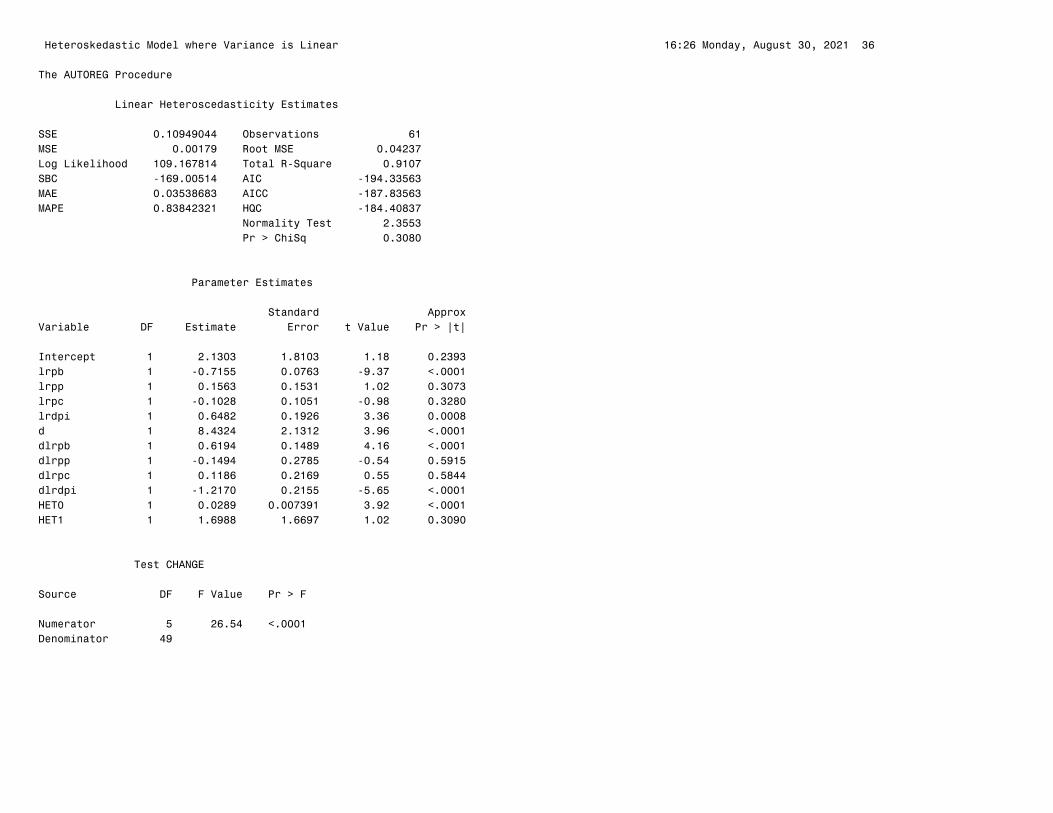
�Heteroskedastic Model where Variance is Linear 16:26 Monday, August 30, 2021 36
The AUTOREG Procedure
Linear Heteroscedasticity Estimates
SSE 0.10949044 Observations 61MSE 0.00179 Root MSE 0.04237Log Likelihood 109.167814 Total R-Square 0.9107SBC -169.00514 AIC -194.33563MAE 0.03538683 AICC -187.83563MAPE 0.83842321 HQC -184.40837 Normality Test 2.3553 Pr > ChiSq 0.3080
Parameter Estimates Standard ApproxVariable DF Estimate Error t Value Pr > |t|
Intercept 1 2.1303 1.8103 1.18 0.2393lrpb 1 -0.7155 0.0763 -9.37 <.0001lrpp 1 0.1563 0.1531 1.02 0.3073lrpc 1 -0.1028 0.1051 -0.98 0.3280lrdpi 1 0.6482 0.1926 3.36 0.0008d 1 8.4324 2.1312 3.96 <.0001dlrpb 1 0.6194 0.1489 4.16 <.0001dlrpp 1 -0.1494 0.2785 -0.54 0.5915dlrpc 1 0.1186 0.2169 0.55 0.5844dlrdpi 1 -1.2170 0.2155 -5.65 <.0001HET0 1 0.0289 0.007391 3.92 <.0001HET1 1 1.6988 1.6697 1.02 0.3090
Test CHANGE Source DF F Value Pr > F
Numerator 5 26.54 <.0001Denominator 49

1 The SAS System 16:26 Monday, August 30, 2021
NOTE: Copyright (c) 2002‐2012 by SAS Institute Inc., Cary, NC, USA. NOTE: SAS (r) Proprietary Software 9.4 (TS1M3) Licensed to COLORADO STATE UNIVERSITY ‐ SFA ‐ T&R, Site 70091687.NOTE: This session is executing on the X64_8PRO platform.
NOTE: Updated analytical products: SAS/STAT 14.1 SAS/ETS 14.1 SAS/OR 14.1 SAS/IML 14.1 SAS/QC 14.1
WARNING: Your system is scheduled to expire on September 28, 2021, which is 29 days from now. The SAS System will no longer function on or after that date. Please contact your SAS Installation Representative to obtain your updated SAS Installation Data (SID) file, which includes SETINIT information.To locate the name of your SAS Installation Representative go to http://support.sas.com/repfinder and provide your site number 70091687 and company name as COLORADO STATE UNIVERSITY ‐ SFA ‐ T&R. On the SAS REP list provided, locate the REP for operating system Windows.NOTE: Additional host information:
X64_8PRO WIN 6.2.9200 Workstation
NOTE: SAS initialization used: real time 0.24 seconds cpu time 0.24 seconds 1 * Problem Set 2 SAS Program ;2 * 2020 ;3 4 OPTIONS LS=130 PS=46 NOCENTER;5 6 PROC IMPORT DATAFILE="C:\Users\srkoontz\Documents\Office\Documents\Classes\AREC‐ECON 535 Econometrics\AREC‐ECON 5356 ! Problem Set 2 Data.xlsx"WARNING: The Base SAS Software product with which IMPORT is associated will be expiring soon, and is currently in warning mode to indicate this upcoming expiration. Please run PROC SETINIT to obtain more information on your warning period.
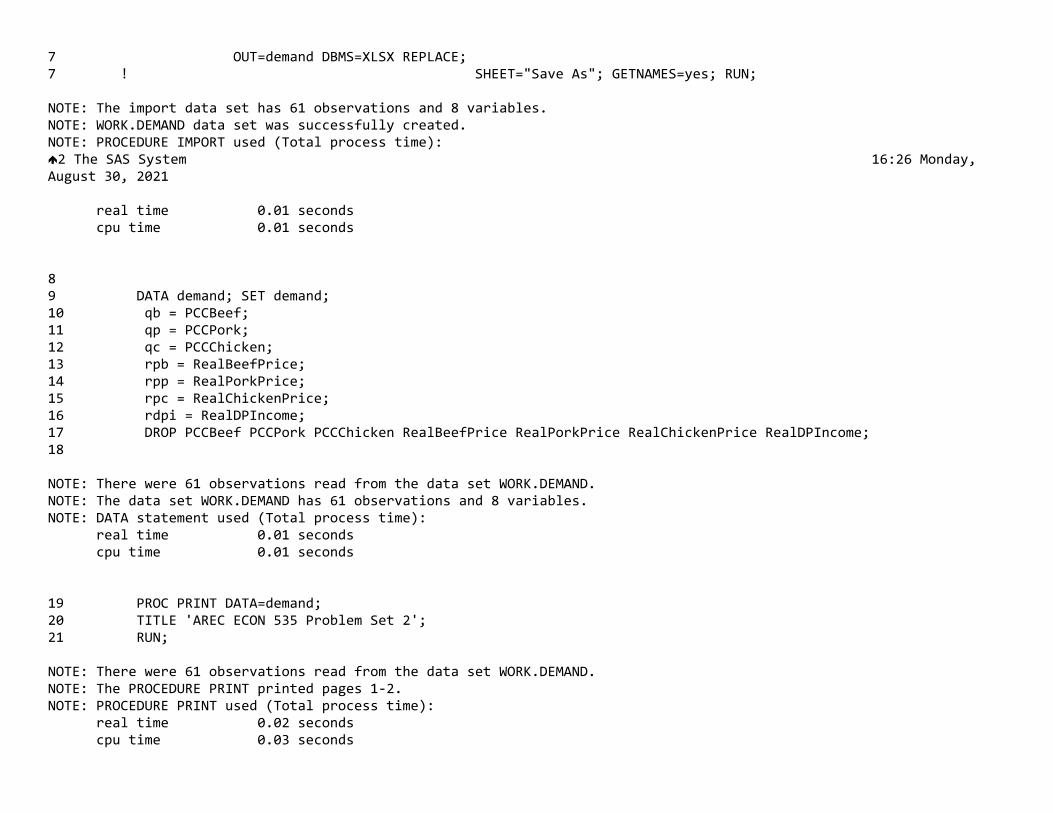
7 OUT=demand DBMS=XLSX REPLACE;7 ! SHEET="Save As"; GETNAMES=yes; RUN;
NOTE: The import data set has 61 observations and 8 variables.NOTE: WORK.DEMAND data set was successfully created.NOTE: PROCEDURE IMPORT used (Total process time):�2 The SAS System 16:26 Monday, August 30, 2021
real time 0.01 seconds cpu time 0.01 seconds
8 9 DATA demand; SET demand;10 qb = PCCBeef;11 qp = PCCPork;12 qc = PCCChicken;13 rpb = RealBeefPrice;14 rpp = RealPorkPrice;15 rpc = RealChickenPrice;16 rdpi = RealDPIncome;17 DROP PCCBeef PCCPork PCCChicken RealBeefPrice RealPorkPrice RealChickenPrice RealDPIncome;18
NOTE: There were 61 observations read from the data set WORK.DEMAND.NOTE: The data set WORK.DEMAND has 61 observations and 8 variables.NOTE: DATA statement used (Total process time): real time 0.01 seconds cpu time 0.01 seconds
19 PROC PRINT DATA=demand;20 TITLE 'AREC ECON 535 Problem Set 2';21 RUN;
NOTE: There were 61 observations read from the data set WORK.DEMAND.NOTE: The PROCEDURE PRINT printed pages 1‐2.NOTE: PROCEDURE PRINT used (Total process time): real time 0.02 seconds cpu time 0.03 seconds
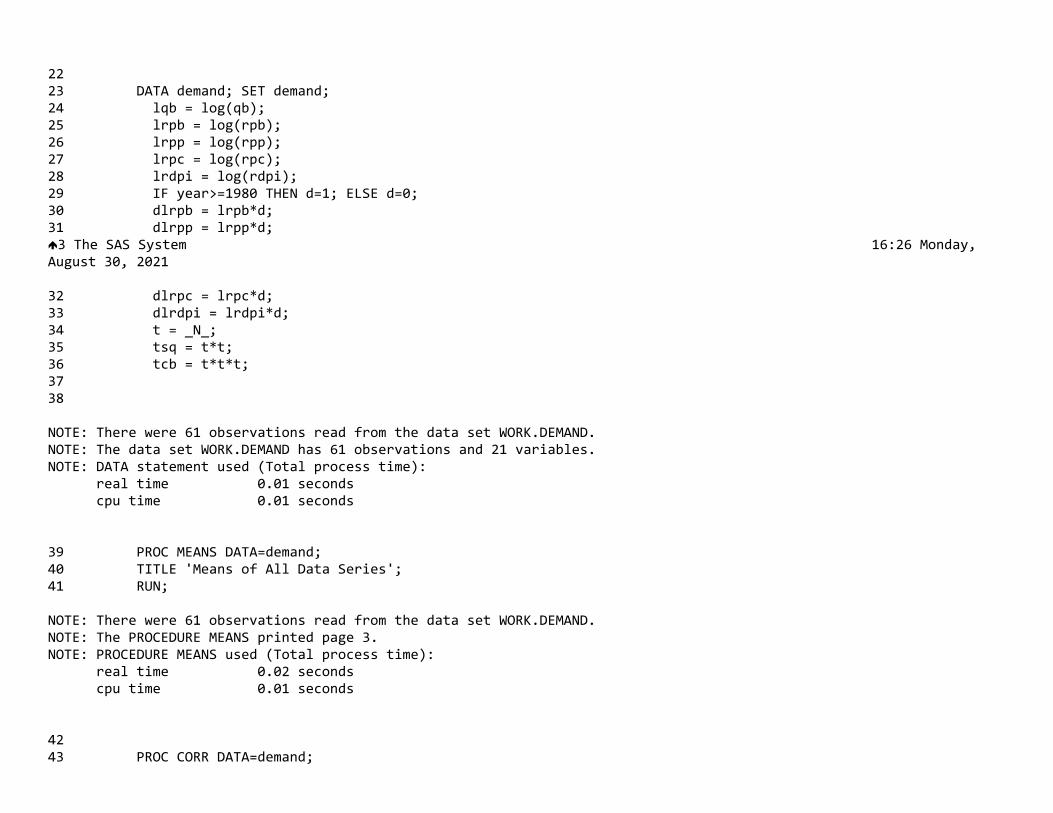
22 23 DATA demand; SET demand;24 lqb = log(qb);25 lrpb = log(rpb);26 lrpp = log(rpp);27 lrpc = log(rpc);28 lrdpi = log(rdpi);29 IF year>=1980 THEN d=1; ELSE d=0;30 dlrpb = lrpb*d;31 dlrpp = lrpp*d;�3 The SAS System 16:26 Monday, August 30, 2021
32 dlrpc = lrpc*d;33 dlrdpi = lrdpi*d;34 t = _N_;35 tsq = t*t;36 tcb = t*t*t;37 38
NOTE: There were 61 observations read from the data set WORK.DEMAND.NOTE: The data set WORK.DEMAND has 61 observations and 21 variables.NOTE: DATA statement used (Total process time): real time 0.01 seconds cpu time 0.01 seconds
39 PROC MEANS DATA=demand;40 TITLE 'Means of All Data Series';41 RUN;
NOTE: There were 61 observations read from the data set WORK.DEMAND.NOTE: The PROCEDURE MEANS printed page 3.NOTE: PROCEDURE MEANS used (Total process time): real time 0.02 seconds cpu time 0.01 seconds
42 43 PROC CORR DATA=demand;
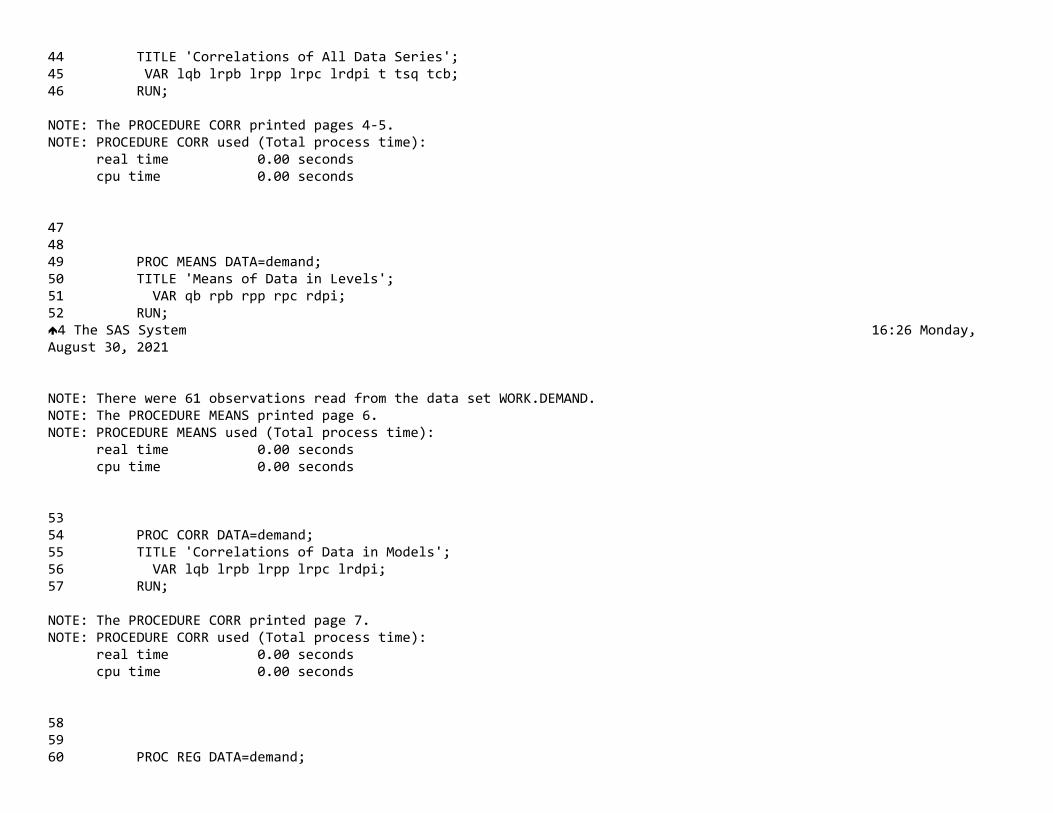
44 TITLE 'Correlations of All Data Series';45 VAR lqb lrpb lrpp lrpc lrdpi t tsq tcb;46 RUN;
NOTE: The PROCEDURE CORR printed pages 4‐5.NOTE: PROCEDURE CORR used (Total process time): real time 0.00 seconds cpu time 0.00 seconds
47 48 49 PROC MEANS DATA=demand;50 TITLE 'Means of Data in Levels';51 VAR qb rpb rpp rpc rdpi;52 RUN;�4 The SAS System 16:26 Monday, August 30, 2021
NOTE: There were 61 observations read from the data set WORK.DEMAND.NOTE: The PROCEDURE MEANS printed page 6.NOTE: PROCEDURE MEANS used (Total process time): real time 0.00 seconds cpu time 0.00 seconds
53 54 PROC CORR DATA=demand;55 TITLE 'Correlations of Data in Models';56 VAR lqb lrpb lrpp lrpc lrdpi;57 RUN;
NOTE: The PROCEDURE CORR printed page 7.NOTE: PROCEDURE CORR used (Total process time): real time 0.00 seconds cpu time 0.00 seconds
58 59 60 PROC REG DATA=demand;
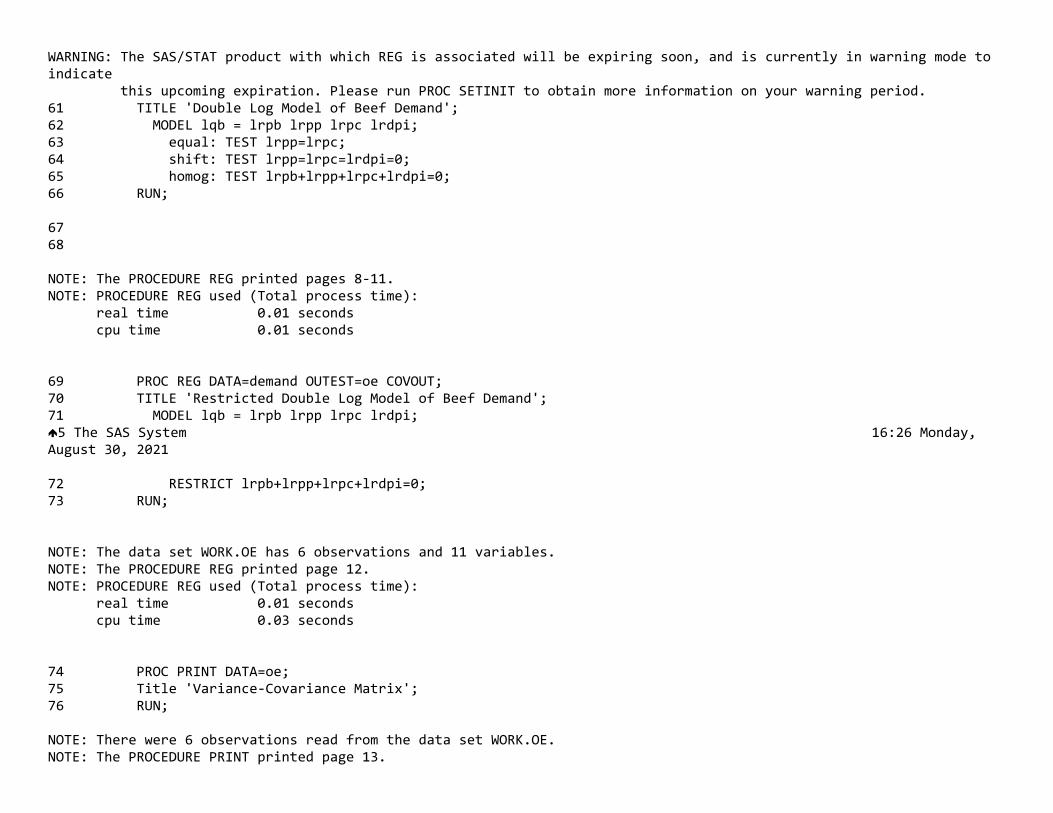
WARNING: The SAS/STAT product with which REG is associated will be expiring soon, and is currently in warning mode to indicate this upcoming expiration. Please run PROC SETINIT to obtain more information on your warning period.61 TITLE 'Double Log Model of Beef Demand';62 MODEL lqb = lrpb lrpp lrpc lrdpi;63 equal: TEST lrpp=lrpc;64 shift: TEST lrpp=lrpc=lrdpi=0;65 homog: TEST lrpb+lrpp+lrpc+lrdpi=0;66 RUN;
67 68
NOTE: The PROCEDURE REG printed pages 8‐11.NOTE: PROCEDURE REG used (Total process time): real time 0.01 seconds cpu time 0.01 seconds
69 PROC REG DATA=demand OUTEST=oe COVOUT;70 TITLE 'Restricted Double Log Model of Beef Demand';71 MODEL lqb = lrpb lrpp lrpc lrdpi;�5 The SAS System 16:26 Monday, August 30, 2021
72 RESTRICT lrpb+lrpp+lrpc+lrdpi=0;73 RUN;
NOTE: The data set WORK.OE has 6 observations and 11 variables.NOTE: The PROCEDURE REG printed page 12.NOTE: PROCEDURE REG used (Total process time): real time 0.01 seconds cpu time 0.03 seconds
74 PROC PRINT DATA=oe;75 Title 'Variance‐Covariance Matrix';76 RUN;
NOTE: There were 6 observations read from the data set WORK.OE.NOTE: The PROCEDURE PRINT printed page 13.
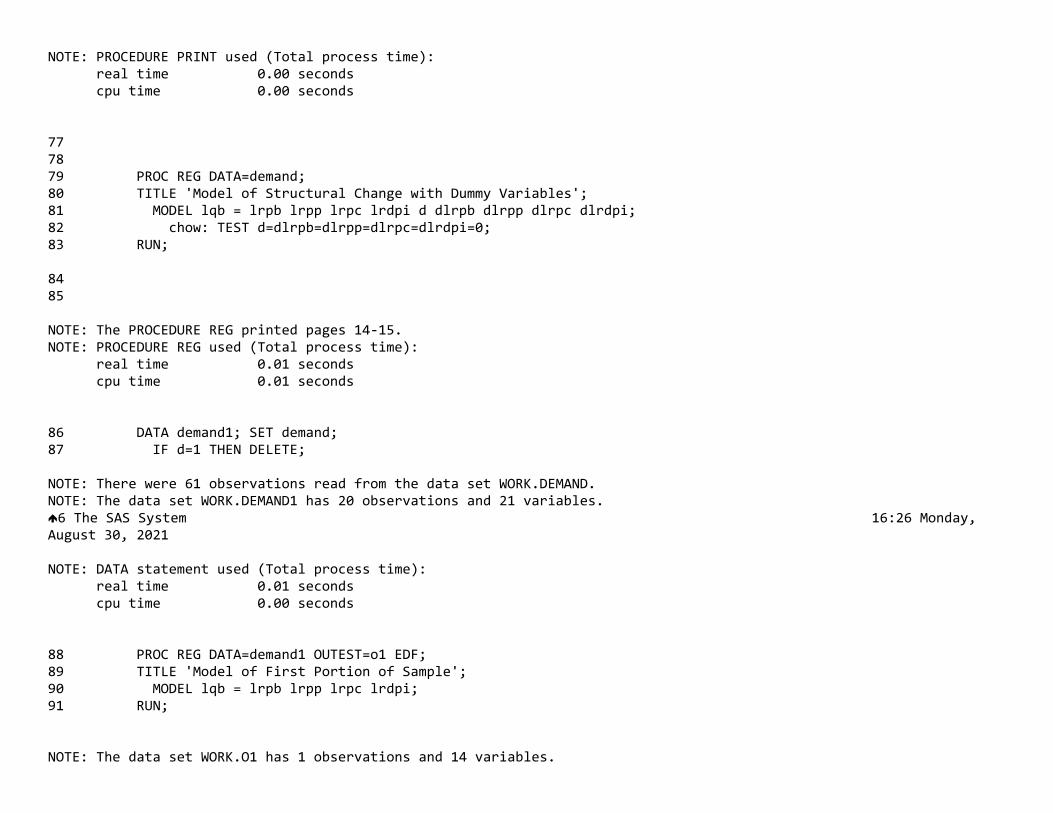
NOTE: PROCEDURE PRINT used (Total process time): real time 0.00 seconds cpu time 0.00 seconds
77 78 79 PROC REG DATA=demand;80 TITLE 'Model of Structural Change with Dummy Variables';81 MODEL lqb = lrpb lrpp lrpc lrdpi d dlrpb dlrpp dlrpc dlrdpi;82 chow: TEST d=dlrpb=dlrpp=dlrpc=dlrdpi=0;83 RUN;
84 85
NOTE: The PROCEDURE REG printed pages 14‐15.NOTE: PROCEDURE REG used (Total process time): real time 0.01 seconds cpu time 0.01 seconds
86 DATA demand1; SET demand;87 IF d=1 THEN DELETE;
NOTE: There were 61 observations read from the data set WORK.DEMAND.NOTE: The data set WORK.DEMAND1 has 20 observations and 21 variables.�6 The SAS System 16:26 Monday, August 30, 2021
NOTE: DATA statement used (Total process time): real time 0.01 seconds cpu time 0.00 seconds
88 PROC REG DATA=demand1 OUTEST=o1 EDF;89 TITLE 'Model of First Portion of Sample';90 MODEL lqb = lrpb lrpp lrpc lrdpi;91 RUN;
NOTE: The data set WORK.O1 has 1 observations and 14 variables.
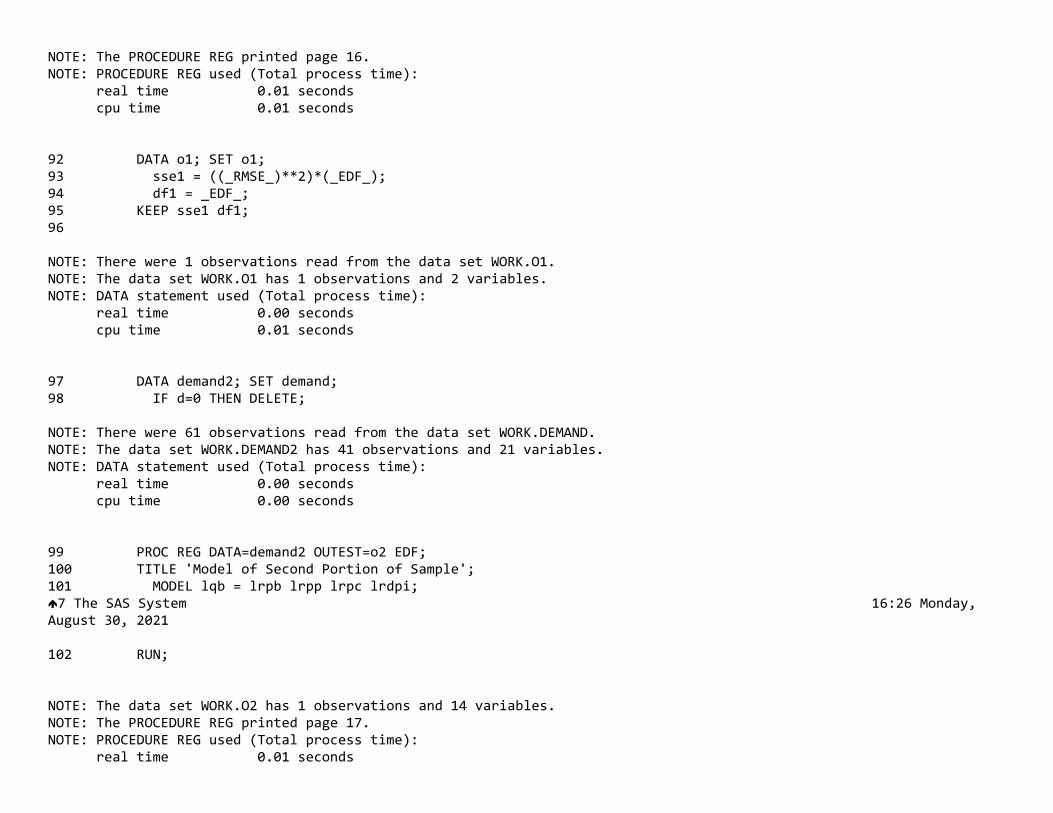
NOTE: The PROCEDURE REG printed page 16.NOTE: PROCEDURE REG used (Total process time): real time 0.01 seconds cpu time 0.01 seconds
92 DATA o1; SET o1;93 sse1 = ((_RMSE_)**2)*(_EDF_);94 df1 = _EDF_;95 KEEP sse1 df1;96
NOTE: There were 1 observations read from the data set WORK.O1.NOTE: The data set WORK.O1 has 1 observations and 2 variables.NOTE: DATA statement used (Total process time): real time 0.00 seconds cpu time 0.01 seconds
97 DATA demand2; SET demand;98 IF d=0 THEN DELETE;
NOTE: There were 61 observations read from the data set WORK.DEMAND.NOTE: The data set WORK.DEMAND2 has 41 observations and 21 variables.NOTE: DATA statement used (Total process time): real time 0.00 seconds cpu time 0.00 seconds
99 PROC REG DATA=demand2 OUTEST=o2 EDF;100 TITLE 'Model of Second Portion of Sample';101 MODEL lqb = lrpb lrpp lrpc lrdpi;�7 The SAS System 16:26 Monday, August 30, 2021
102 RUN;
NOTE: The data set WORK.O2 has 1 observations and 14 variables.NOTE: The PROCEDURE REG printed page 17.NOTE: PROCEDURE REG used (Total process time): real time 0.01 seconds
cpu time 0.01 seconds
103 DATA o2; SET o2;104 sse2 = ((_RMSE_)**2)*(_EDF_);105 df2 = _EDF_;106 KEEP sse2 df2;107
NOTE: There were 1 observations read from the data set WORK.O2.NOTE: The data set WORK.O2 has 1 observations and 2 variables.NOTE: DATA statement used (Total process time): real time 0.00 seconds cpu time 0.01 seconds
108 DATA o; MERGE o1 o2;109 fstat12 = (sse1/df1)/(sse2/df2);110 pvalue12 = 1 ‐ probf(fstat12,df1,df2);111 fstat21 = (sse2/df2)/(sse1/df1);112 pvalue21 = 1 ‐ probf(fstat21,df2,df1);
NOTE: There were 1 observations read from the data set WORK.O1.NOTE: There were 1 observations read from the data set WORK.O2.NOTE: The data set WORK.O has 1 observations and 8 variables.NOTE: DATA statement used (Total process time): real time 0.03 seconds cpu time 0.00 seconds
113 PROC PRINT DATA=o;114 Title 'F‐Test of Difference Variances';115 RUN;
NOTE: There were 1 observations read from the data set WORK.O.NOTE: The PROCEDURE PRINT printed page 18.NOTE: PROCEDURE PRINT used (Total process time):�8 The SAS System 16:26 Monday, August 30, 2021
real time 0.00 seconds cpu time 0.00 seconds
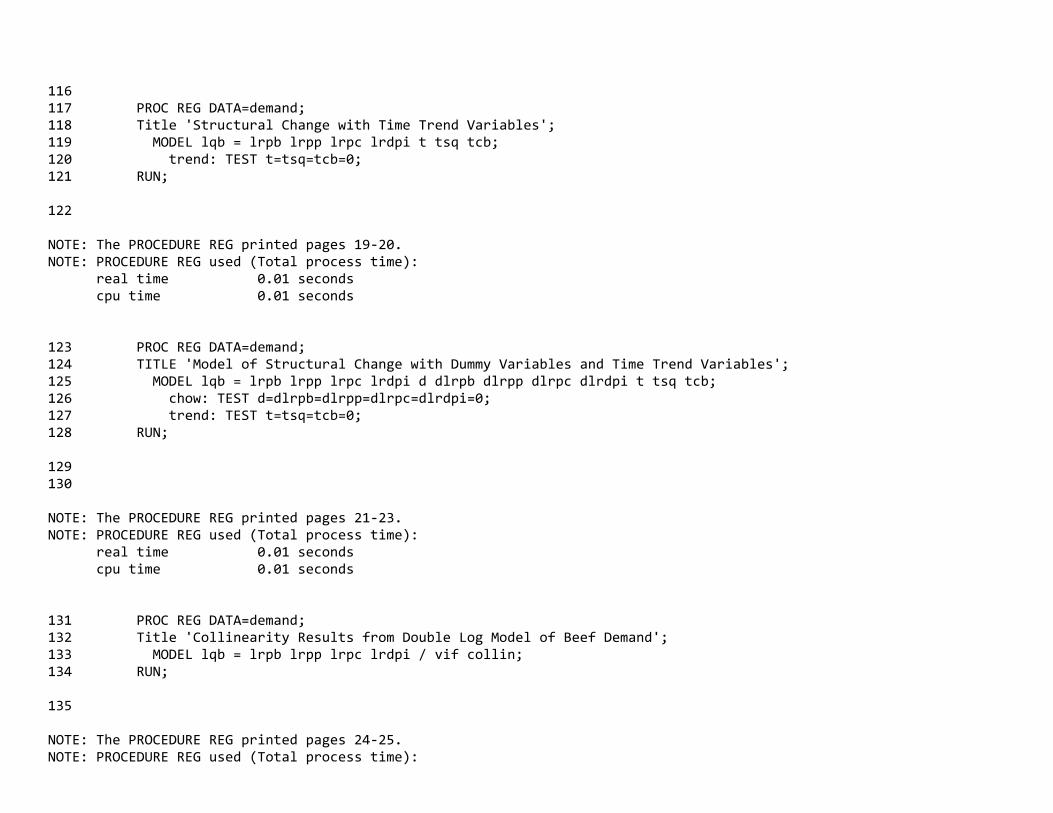
116 117 PROC REG DATA=demand;118 Title 'Structural Change with Time Trend Variables';119 MODEL lqb = lrpb lrpp lrpc lrdpi t tsq tcb;120 trend: TEST t=tsq=tcb=0;121 RUN;
122
NOTE: The PROCEDURE REG printed pages 19‐20.NOTE: PROCEDURE REG used (Total process time): real time 0.01 seconds cpu time 0.01 seconds
123 PROC REG DATA=demand;124 TITLE 'Model of Structural Change with Dummy Variables and Time Trend Variables';125 MODEL lqb = lrpb lrpp lrpc lrdpi d dlrpb dlrpp dlrpc dlrdpi t tsq tcb;126 chow: TEST d=dlrpb=dlrpp=dlrpc=dlrdpi=0;127 trend: TEST t=tsq=tcb=0;128 RUN;
129 130
NOTE: The PROCEDURE REG printed pages 21‐23.NOTE: PROCEDURE REG used (Total process time): real time 0.01 seconds cpu time 0.01 seconds
131 PROC REG DATA=demand;132 Title 'Collinearity Results from Double Log Model of Beef Demand';133 MODEL lqb = lrpb lrpp lrpc lrdpi / vif collin;134 RUN;
135
NOTE: The PROCEDURE REG printed pages 24‐25.NOTE: PROCEDURE REG used (Total process time):
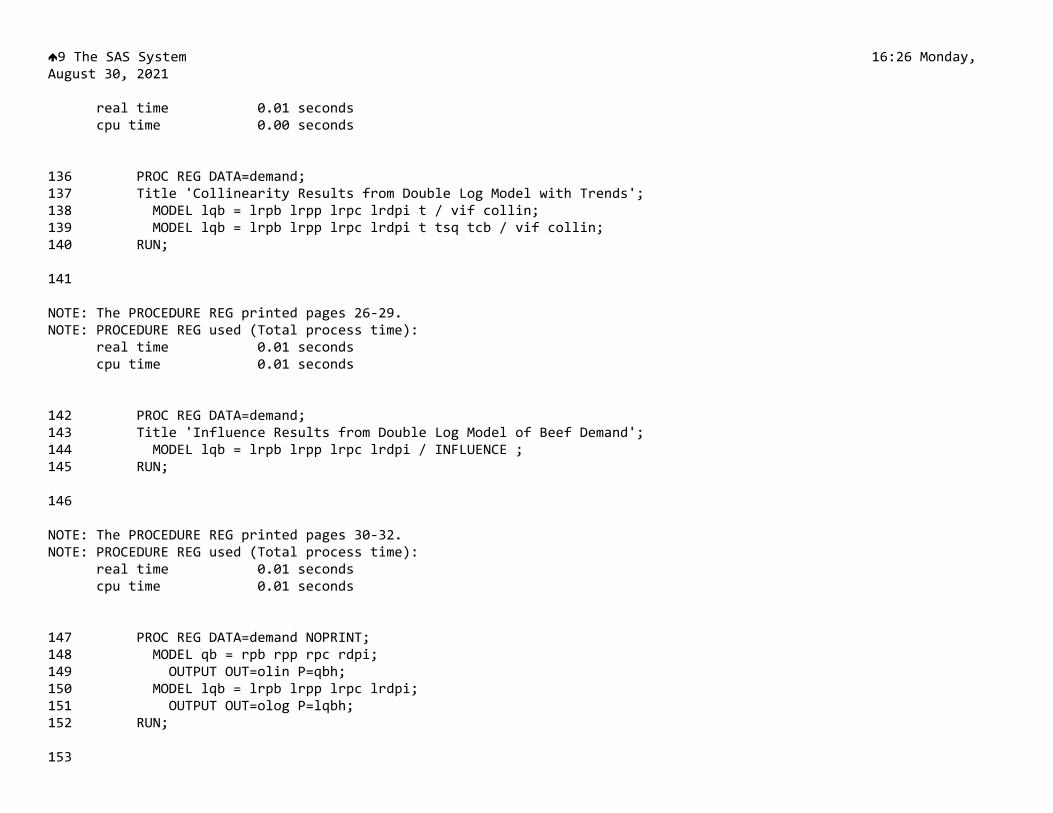
�9 The SAS System 16:26 Monday, August 30, 2021
real time 0.01 seconds cpu time 0.00 seconds
136 PROC REG DATA=demand;137 Title 'Collinearity Results from Double Log Model with Trends';138 MODEL lqb = lrpb lrpp lrpc lrdpi t / vif collin;139 MODEL lqb = lrpb lrpp lrpc lrdpi t tsq tcb / vif collin;140 RUN;
141
NOTE: The PROCEDURE REG printed pages 26‐29.NOTE: PROCEDURE REG used (Total process time): real time 0.01 seconds cpu time 0.01 seconds
142 PROC REG DATA=demand;143 Title 'Influence Results from Double Log Model of Beef Demand';144 MODEL lqb = lrpb lrpp lrpc lrdpi / INFLUENCE ;145 RUN;
146
NOTE: The PROCEDURE REG printed pages 30‐32.NOTE: PROCEDURE REG used (Total process time): real time 0.01 seconds cpu time 0.01 seconds
147 PROC REG DATA=demand NOPRINT;148 MODEL qb = rpb rpp rpc rdpi;149 OUTPUT OUT=olin P=qbh;150 MODEL lqb = lrpb lrpp lrpc lrdpi;151 OUTPUT OUT=olog P=lqbh;152 RUN;
153
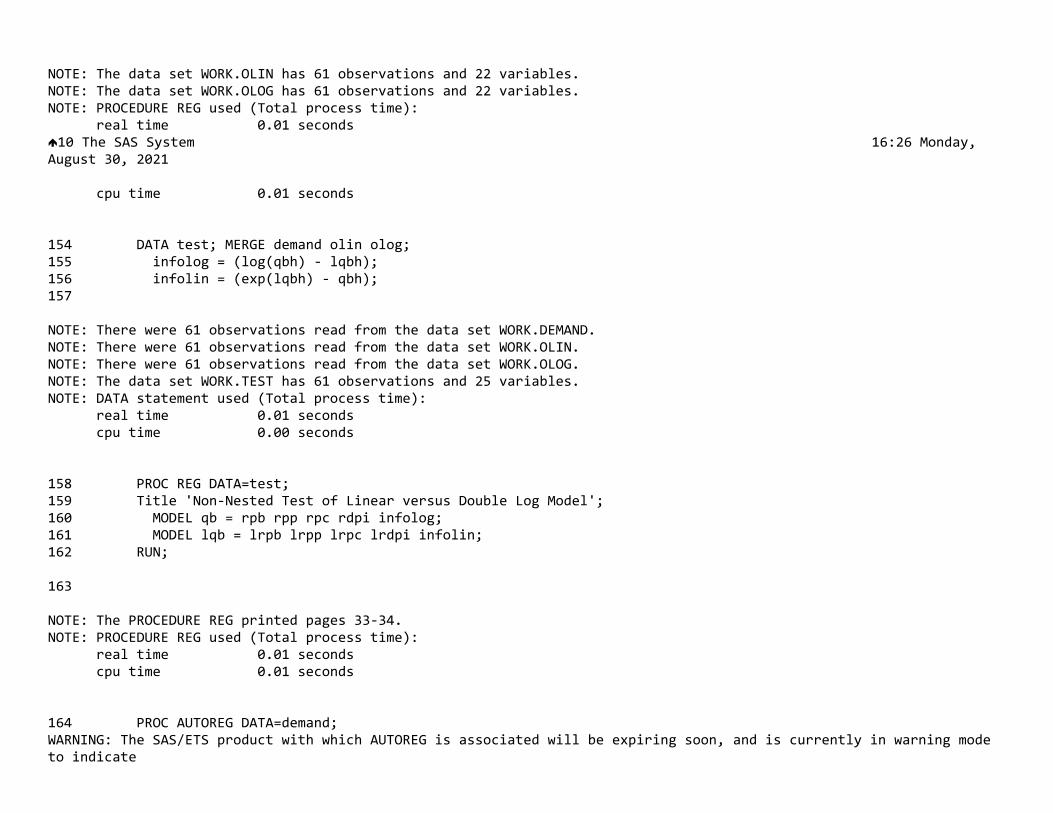
NOTE: The data set WORK.OLIN has 61 observations and 22 variables.NOTE: The data set WORK.OLOG has 61 observations and 22 variables.NOTE: PROCEDURE REG used (Total process time): real time 0.01 seconds�10 The SAS System 16:26 Monday, August 30, 2021
cpu time 0.01 seconds
154 DATA test; MERGE demand olin olog;155 infolog = (log(qbh) ‐ lqbh);156 infolin = (exp(lqbh) ‐ qbh);157
NOTE: There were 61 observations read from the data set WORK.DEMAND.NOTE: There were 61 observations read from the data set WORK.OLIN.NOTE: There were 61 observations read from the data set WORK.OLOG.NOTE: The data set WORK.TEST has 61 observations and 25 variables.NOTE: DATA statement used (Total process time): real time 0.01 seconds cpu time 0.00 seconds
158 PROC REG DATA=test;159 Title 'Non‐Nested Test of Linear versus Double Log Model';160 MODEL qb = rpb rpp rpc rdpi infolog;161 MODEL lqb = lrpb lrpp lrpc lrdpi infolin;162 RUN;
163
NOTE: The PROCEDURE REG printed pages 33‐34.NOTE: PROCEDURE REG used (Total process time): real time 0.01 seconds cpu time 0.01 seconds
164 PROC AUTOREG DATA=demand;WARNING: The SAS/ETS product with which AUTOREG is associated will be expiring soon, and is currently in warning mode to indicate
this upcoming expiration. Please run PROC SETINIT to obtain more information on your warning period.165 Title 'Heteroskedastic Model where Variance is Linear';166 MODEL lqb = lrpb lrpp lrpc lrdpi d dlrpb dlrpp dlrpc dlrdpi;167 HETERO d / LINK=linear;168 change: TEST d=dlrpb=dlrpp=dlrpc=dlrdpi=0;169 RUN;
NOTE: The PROCEDURE AUTOREG printed pages 35‐36.NOTE: PROCEDURE AUTOREG used (Total process time): real time 0.04 seconds cpu time 0.01 seconds�11 The SAS System 16:26 Monday, August 30, 2021
170
NOTE: SAS Institute Inc., SAS Campus Drive, Cary, NC USA 27513‐2414NOTE: The SAS System used: real time 0.85 seconds cpu time 0.65 seconds