Are you overlooking your greatest source of talent? - Deloitte
71
Issue 23 | July 2018 Are you overlooking your greatest source of talent? Special report: Deloitte City Mobility Index Designing work environments for digital well-being (Donʼt get) fooled by hype Smashing ITʼs glass ceiling
-
Upload
khangminh22 -
Category
Documents
-
view
0 -
download
0
Transcript of Are you overlooking your greatest source of talent? - Deloitte

Issue 23 | July 2018
Are you overlooking your greatest source of talent?
Special report: Deloitte City Mobility Index
Designing work environments for digital well-being
(Donʼt get) fooled by hype
Smashing ITʼs glass ceiling

DELOITTE REVIEW
EXECUTIVE EDITORCraig Giffi
EDITOR-IN-CHIEFLuke Collins
EDITORJunko Kaji
LEAD ART DIRECTORSonya Vasilieff
Deloitte refers to one or more of Deloitte Touche Tohmatsu Limited, a UK private company limited by guarantee, and its network of member firms, each of which is a legally separate and independent entity. Please see http://www/deloitte.com/about for a detailed description of the legal structure of Deloitte Touche Tohmatsu Limited and its member firms. Please see http://www.deloitte.com/us/about for a detailed description of the legal structure of the US member firms of Deloitte Touche Tohmatsu Limited and their respective subsidiaries. Certain services may not be available to attest clients under the rules and regulations of public accounting. For information on the Deloitte US Firms’ privacy practices, see the US Privacy Notice on Deloitte.com.
Copyright © 2018 Deloitte Development LLC. All rights reserved.
CONTACT
Email: [email protected]
@DeloitteInsight #DeloitteReview
www.linkedin.com/company/deloitte-insights
DELOITTE INSIGHTS
DIGITAL MANAGING EDITORMike Boone
PRODUCTIONLead: Blythe HurleyPreetha Devan
EDITORSRupesh BhatMatthew BudmanKaren EdelmanAbrar KhanRamani MosesAditi RaoKavita SainiRithu Thomas
STAKEHOLDER ENGAGEMENTDavid Scholes
AUDIENCE DEVELOPMENTLead: Amy BergstromNikita GariaAlexandra KaweckiShraddha Sachdev
DESIGNLead: Emily MoreanoTushar BarmanAdamya ManshivaMahima NairAnoop R.Kevin WeierMolly Woodworth
DATA VISUALIZATION & MULTIMEDIASarah JersildJoanie PearsonAlok PepakayalaSourabh Yaduvanshi
FEATURES
ISSUE 2 3 , JULY 2018
Are you overlooking your greatest source of talent? | 36by Robin Erickson, Denise Moulton, and Bill Cleary
Few large companies have cultures of internal mobility that can help meet skill shortages, prepare the next generation of leaders, and fuel a virtuous talent cycle.
Smashing ITʼs glass ceiling | 48by Kavitha Prabhakar, Kristi Lamar, Anjali Shaikh, and Caroline Brown
Perspectives from leading women CIOs on essential leadership qualities and what it takes to build an inclusive culture.
www.deloittereview.com
Positive technology | 60by Connor Joyce, Jen Fisher, Jim Guszcza, and Susan K. Hogan
Digital technology can be a blessing and a curse, both personally and in the workplace. Here's how organizations can make sure the positives outweigh the negatives.
Well-being: A strategy and a responsibility | 70by Dimple Agarwal, Josh Bersin, Gaurav Lahiri, Jeff Schwartz, and Erica Volini
Innovative wellness programs aren't just to help workers be more productive—they're also integral to meeting new workforce and social expectations.
Fooled by the hype | 78by John Lucker, Susan K. Hogan, and Brenna Sniderman
An understanding of behavioral factors can help individuals decide whether to adopt innovations—or ignore them.
Delivering the digital state | 92by William D. Eggers and Steve Hurst
What if state government services worked like Amazon? Learn how governments can improve the user experience by emulating top digital companies' methods.
Zoom out/zoom in | 110by John Hagel and John Seely Brown
An alternative approach to strategy in a world that defies prediction.

SPECIAL REPORT
IN BRIEF
DEPARTMENTS
LeaderDeloitte US chief executive officer Cathy Engelbert on building the organization of the future.
On the WebExplore highlights from our website.
The end noteMichael Raynor reexamines what we said in 2012 about accepting and exploiting tradeoffs in the pursuit of growth.
4 6 136
Short takes from our longer content
Discounting the gig economy
The great retail bifurcation
Three keys to leading amid digital disruption
Why business model compatibility matters
Transforming biopharma R&D
What if youʼre ...wrong?
46 58 76
90 108
www.deloittereview.com
ISSUE 2 3 , JULY 2018
| | | | | ||
|
||
||
||
||
||
||
||
|
||
||||||||||||
|
||
||
||
||
||
||
||
|
||
| | | | |
118
A reality check on advanced vehicle technologies | 16by Craig Giffi, Joseph Vitale Jr., Thomas Schiller, and Ryan Robinson
The idea of self-driving and electrified vehicles is gaining acceptance among global consumers, but is this enough to make our utopian dreams come true?
8 The Deloitte City Mobility Indexby Simon Dixon, Haris Irshad, Derek M. Pankratz, and Justine Bornstein
What does smart urban mobility look like, and are global cities reaching their potential? Learn the steps that cities can take to realize the future of mobility in the coming decades.
Funding the future of mobility | 26by Justine Bornstein, Simon Dixon, Michael Flynn, and Derek M. Pankratz
Fees for everything from parking to vehicle registration, drivers’ licenses, and public transportation today provide critical revenue for many of the world’s governments. So what happens if that money dries up?

5
NEARLY everyone seems to be talking about the future of work these days, from business leaders to academics to journalists. What does daily work, or a lifelong career, look like a decade from now, or two decades? What roles
will automation and artificial intelligence play? Are robots really coming to take our jobs? Will machine learning eventually outpace—and displace—human learning? And what does this huge, impending shift mean for companies and the economy? These are all valid concerns, and the social and economic challenges are real.
There are plenty of predictions about what’s ahead. Technology-driven change can be disruptive, but it also gives us powerful tools that we can use to gain new insights, drive business transformation, and unlock value. There is no better time than now to start building the organization of the future.
Our efforts are bound to have far-reaching effects, at every level of the organi-zation and all around the business ecosystem. CXOs will have to recalibrate and
coordinate, so that they work more as a symphonic c-suite. No one executive can build the future of work on their own. And we also need to rethink talent models. Talent is increasingly untethered from the workplace and setting new priorities in the marketplace. In the face of rapid change, leading organizations are developing
CATHY ENGELBERT CEO, Deloitte US
LEADER
open networks to attract new kinds of talent, build collaboration, and foster continuous learning. More than ever, careers are nonlinear—something I’ve experienced first-hand.
If smart machines can automate tasks, intelligent machines can augment human work. In professional services, we’re already seeing that AI and other technologies are placing a new premium on human talent and ingenuity. We can’t lose sight of what makes human work distinctive.
This issue of the Deloitte Review takes up these topics, offering new perspectives on the opportuni-ties we have to redesign work—and collaborate with technology—so that we can succeed and thrive. Here, you’ll discover new research on workplace design and well-being, how to unlock the secret of internal talent mobility, and what a rising new class of female CIOs say about careers, leadership, and whether the future of IT is female. As other articles in this issue outline, the changes we are seeing in the workplace will also have important social consequences. Technology and the mobility it enables will change the way we live, from the planning of cities to the delivery of public services.
I hope you’ll find this issue of the Deloitte Review thought provoking. The diversity of thinking and analysis here suggests that there are many promising paths forward for the work we do, the careers we pursue, and the 21st century society we are busy creating.
Building the organization of the future
4
www.deloittereview.com
Cultivate friction to generate new insightsFriction can drive faster, more robust learning to help teams come up with better approaches. This series explores nine business practices, including how to create productive disagreements, to help
both workers and companies get better, faster. www.deloitte.com/insights/cultivate-friction
The Internet of Things in the real worldHow is IoT helping farmers irrigate better? How are lessons from retail being applied to health care? How is the auto industry handling all that data? In this podcast, learn how IoT is transforming the world.www.deloitte.com/insights/IoT-podcast
7
Now available on www.deloitte.com/insights
6
Tackling gender bias in the workplaceOrganizations have come a long way in preventing intentional discrimination against women. But can they address the implicit biases that can sabotage women’s advancement? www.deloitte.com/insights/designing-equality
Global Human Capital Trends 2018There’s more to success than a mere balance sheet.
As organizations are increasingly judged for their impact on society, we explore the trends leading to
the rise of the social enterprise. www.deloitte.com/insights/human-capital-trends
Millennials: Uneasy, pessimistic, and concernedFor younger workers, the gap is widening between how responsible companies should behave and what they actually do. The good news? Our 2018 Deloitte Millennial Survey finds business leaders can still win back millennialsʼ loyalty. www.deloitte.com/insights/millennial-survey
Following the digital threadWhat is the “digital thread”? This eight-part video series
produced with MIT Sloan Management Review explains all by following an airplane part as it moves from
ideation to flight.www.deloitte.com/insights/digital-thread
www.deloittereview.com

8 9
GAUGING GLOBAL READINESS FOR THE FUTURE OF MOBILITY
by Simon Dixon, Haris Irshad, Derek M. Pankratz, and Justine Bornstein
ILLUSTRATION BY SONYA VASILIEFF
A SMART city is a data-driven city, one in which municipal leaders have an increas- .ingly sophisticated understanding of con-
ditions in the areas they oversee, including the urban transportation system. In the past, regula-tors used questionnaires and surveys to map user needs. Today, platform operators can rely on data-bases to provide a more accurate picture in a much shorter time frame at a lower cost. Now, leaders can leverage a vast array of data from the Internet of Things, artificial intelligence, and other digital technologies to develop and inform intelligent deci-sions about people, places, and products.
Unfortunately, when it comes to designing and implementing a long-term vision for future mobility, it is all too easy to ignore, misinterpret, or skew this data to fit a preexisting narrative.1 We have seen this play out in dozens of conversations with trans-portation leaders all over the world. To build that vision, leaders need to gather the right data, ask the right questions, and focus on where cities should go tomorrow.
Given the essential enabling role transportation plays in a city’s sustained economic prosperity,2 we set out to create a new and better way for city offi-cials to gauge the health of their mobility network
SPECIAL REPORT The Deloitte City Mobility Index
www.deloittereview.com

and their readiness to embrace the future. The result is the Deloitte City Mobility Index (DCMI), a collection of conscious choices based on our vision of what smart urban mobility should look like. The DCMI is an in-depth exploration into the rapid changes occurring in the way people and goods move about, with intermodal journeys, active trans-portation options, such as sidewalks and bicycle lanes, and public transit playing prominent roles. The DCMI places economic prosperity at its core, takes a holistic view of the city’s entire mobility landscape, and it is informed by our clear image of how the future of mobility could unfold in urban areas.
Here you will find an overview of how we constructed the DCMI and a discussion of some of our key findings.
Measuring urban mobility performance
To develop a picture of mobility across the globe, we went beyond what transportation looks like today to explore what mobility could be in a truly smart, liveable, economically vibrant city. Three key themes emerged from this research:1. Performance and resilience. Urban
mobility should be efficient. It’s a given that the trains should literally run on time. But cities that scored highest in this category also minimize congestion and travel times, maintain roads and other infrastructure, and offer multiple, inte-grated modes of transportation.
2. Vision and leadership. Urban mobility requires innovation, coordination among stakeholders, and direction. Creating a high-performing, resilient, and inclusive mobility system is unlikely to happen by accident. This second theme analyzes how deliberate and forward-thinking a city’s leaders are regarding its future mobility needs.
3. Service and inclusion. Urban mobility should be accessible to all residents. Exemplary cities in this category offer widespread coverage
and modest wait times for public transit, afford-able options, and user-friendly ways to access a variety of transportation modes.
With these three themes as our lodestar, we dug into the component pieces of each.
What we learned: Select findings“WHAT’S PAST IS PROLOGUE”3—BUT NOT DESTINY
Some of the cities we looked at are centuries old; they reflect countless choices made by polit-ical leaders, businesses, and residents over time. Naturally, those circumstances, both physical and political, shape today’s mobility landscape, and affected their rankings in our index. Cities in which decision-making authority rests with multiple actors, like Paris and Washington, D.C., often struggle with articulating and acting upon a cohe-sive vision for the future.
That said, many of the cities we profiled have shown a remarkable ability to overcome their circumstances through new approaches. The mobility profile of Columbus, Ohio, for example, is typical of many mid-sized American cities: car-domi-nated, with limited public transit but also limited congestion due to its modest size. Faced with rapid growth and critical shortcomings, especially when it came to key health outcomes, city leaders crafted an ambitious strategy to remake Columbus’s trans-portation system into a model for smart mobility.4 Even weather need not be a hindrance. Walking and cycling are most prevalent in Paris, Berlin, and Amsterdam—all northern European cities. Helsinki is a top performer, too, where it frequently snows!
INTEGRATION IS KEYCities with high population densities, such as
London, Singapore, and Berlin, scored highest on transportation performance. With more people funding systems that cover less ground, these cities get more bang for their buck. Cities with large
geographic areas, such as New York and Chicago, tend to do better within city limits but do not perform as well in their larger exo-urban areas.
One reason for this may be the lack of integra-tion, coordination, and effective governance among transportation regulators and providers between the city and the suburbs, and between public and private entities. The city proper usually has one transit authority, surrounding areas have their own, and the level of cooperation between the various entities can vary widely. While this is improving in many of the cities surveyed, it still has a ways to go.
Our findings suggest that having multiple regu-latory providers inhibits a smoothly functioning and integrated transportation system, but inter-agency coordination can be successful. The Toronto Transit Commission, for example, handles public transportation within the city, while a multitude of smaller authorities (GO Transit, YRT/Viva, MiWay, and others) cover the surrounding municipalities. The various authorities operated largely indepen-dently—for years, passengers traveling between regions required multiple tickets and, apart from a few exceptions, travelers who crossed boundaries had to pay two fares. However, since city leaders created Metrolinx and the region’s “Big Move” plan in 2009, integration has proceeded in stages. When completed, this multiyear endeavor will fully inte-grate a number of transit systems across Ontario, allowing users to pay fares with a single card across the network.5
As cities grow and expand and housing costs rise, many young families have little choice but to move to the suburbs and commute into the city for work. Too often, it becomes clear that the only viable commuting option is driving; absent a single authority or close coordination among multiple authorities, public transportation can be too complex and time-consuming to utilize. But driving private cars adds to congestion, pollution, and parking chal-lenges, not to mention the financial burden it places on families. In fact, some families find that the lower costs associated with a move outside of the city core are offset by car ownership costs or expensive travel passes. City governments would do well to work
together with their surrounding regions to fix this issue, and to do so quickly.
There is also a direct tie between the pres-ence of multiple regulatory authorities and service providers and having a lower ability or willingness to explore innovative solutions. In our index, the leading innovations include smart parking and ticketing, integrated payments, intelligent transit systems, and electric vehicle (EV) infrastructure. For any of these efforts to succeed, they often need to be offered across commuting corridors, and inter-agency (regulatory body) coordination and coop-eration are required. Data integration, governance, and security are also easier with more tightly linked governing bodies.
Finally, the data suggests that having low levels of integration is correlated with low readiness to face the future of mobility—more than any other indicator. Creating seamless urban transportation demands a unity of purpose and an ability to act in concert across different modes and jurisdictions.
THE CHALLENGES OF PRIVATE CARSOur vision for smart urban mobility emphasizes
active transportation and public transit. That neces-sarily means any city that relies heavily on private cars—as many US cities do—will fare poorly on several metrics in the index. We think that choice is reasonable. Our analysis—and many others’—reveals a number of deleterious consequences from overreliance on private autos, including congestion, pollution, and accidents.6 If cities continue to grow—and the Organisation for Economic Co-operation and Development (OECD) predicts that 70 percent of the world’s population will live in urban areas by 20507—then public and private players need to find ways to move people and goods in ways that maxi-mize use of space and minimize such social costs.
Private cars can work well in some circum-stances and are an important piece of the mobility landscape, however. Geographically spread-out cities tend to favor car use, and North American and Australian cities are among the most geographically spread out of the cities measured. Thus, they have a higher modal share of private cars and a lower share
10 11SPECIAL REPORT The Deloitte City Mobility Index
www.deloittereview.com

government often takes on different roles, such as enabling data-sharing, monitoring cybersecurity, incentivizing private-sector innovation and partici-pation, and establishing the standards and rules by which mobility providers must abide.•
of active transportation. Their strategic plans also tend to focus more on road improvements and road-based transportation.
Still, cities that rely heavily on personal vehicles should think through ways to optimize their use. For example, by augmenting private ownership with carsharing and ridesharing, perhaps as part of a mobility-as-a-service solution, it may be possible to keep the cars-to-people ratio in check—or even drive it down. And cars are often the fallback option when the first mile/last mile problem is unsolved. Our research suggests that if getting to public trans-portation is a problem, people will get in their cars ... and won’t get out until they reach their destination. Creating convenient and affordable solutions for the beginning and end of a journey—think bicycle-sharing, dynamic shuttles, and ride-hailing, ideally integrated via a full-fledged mobility-as-a-service offering—can be an important step to reducing reli-ance on personally owned vehicles.
Paris has made significant strides in reducing the number of single-occupancy vehicles. It intro-duced a bicycle-sharing plan in 2007, an electric carsharing plan in 2011, and closed the left bank of the Seine to cars in 2013. Traffic has dropped by more than 30 percent in the past 15 years.8
CULTURE’S ROLE IN TRANSPORTATIONSimilar to the EU’s designation for traditional
foodstuffs of specific character, a city’s mobility system will ultimately be shaped by its culture and “terroir” and have its own distinctive local flavor.
Geography plays a massive role in mobility, and this is something that leaders should consider when looking at other cities for inspiration. Spread-out cities tend not to rank highly for active transporta-tion. This is no surprise: If you have to get from A to B, cycling across a large city is a less viable option. While it is relatively easy for cities like Amsterdam and Helsinki to do well in this regard, their recipes for success may be hard to replicate in a sprawling metropolis such as Los Angeles.
The role of culture is also much more important to the development of a transportation system than we usually assume. Casual ridesharing is common in
cities such as Washington, D.C. (where it is known as “slugging”) and New York, but less so in other US cities. Similarly, Amsterdam is quite famous for its cycling culture, but this seems not as common in other cities, even those with similar geographic and population profiles.
Then there is the issue of social attitudes toward public transportation, such as “bus stigma” and the importance of “car culture.” Cities can spend billions to upgrade their transportation systems, but if the public perceives that taking a bus or train is a second-class option compared to driving in, passenger numbers will not increase. Such was the case for Denver (not included in our survey).9 Car ownership is deeply ingrained in the American psyche, reinforced by decades of advertising by automakers,10 and it is an increasingly important status symbol in China.11 Overcoming those cultural barriers could be particularly challenging for trans-portation planners. They should consider ways either to work with prevailing beliefs, or to find ways to shape them gently.12
Remaking your mobility landscape
From our research, we found that mobility plays a central role in a city’s economic prosperity. This is why the rewards for getting it right are poten-tially great. Looking for out-of-the-box solutions to solve their problems, leading future of mobility cities demonstrate that finding money is rarely a long-term solution. Their success tends to stem from integration and innovation rather than sheer investment.
For cities that have fared poorly across specific indicators, all is not lost. Given the speed of change and technological trends, any city has the opportu-nity to radically remake its mobility landscape over the next five to 10 years. Cities that rank poorly today could leapfrog to become leaders in the future of mobility by deploying advanced solutions that solve some of transportation’s perennial problems.
Leaders need to identify what the “right” kinds of investments are—typically, those that integrate
systems or introduce technological improvements. These will produce better returns over time. While adding more service or building more roads can be helpful, developing better-integrated strategies with greater involvement from the private sector often yields better results. In these scenarios, the
DCMI METHODOLOGYWe chose more than 60 unique data parameters based on a review of existing literature, their correlations with economic growth, and our research team’s analysis. Data was gathered from a variety of sources, including government statistical databases, third-party reports, private vendors, and nongovernmental organizations. We then brought in the qualitative judgments of a variety of experts on urban mobility or particular cities, both inside and outside Deloitte.13
We assigned each metric a score between 1 and 5 based on the data parameters within it. Depending on the metric, score assignment involved converting a qualitative assessment into a number, indexing data to create a relative score, or both. We applied some data parameters and metrics to more than one theme.
To look specifically at a city’s readiness for the future of mobility,14 we focused more closely on the parameters that dealt with “smart” or “digital” elements of transportation. In particular, the DCMI looks at integrated and shared mobility, vision and strategy, innovation, regulatory readiness for the future of mobility, and ease of use. The metric scores were then averaged. “Five” indicates being closest to full future of mobility readiness. (See figure 1.)
The data was collected for the years 2016 and 2017 (or earlier where newer data did not exist). Unless specified otherwise, this information is no more than five years old. In some instances, trend data was collected, but predominately the data was cross-sectional for the latest year.
In all, we examined more than 40 cities. (Profiles of 18 cities were published contemporaneously with this report. Additional cities will be added in the coming months.) Cities were selected to achieve geographic distribution, a variety of sizes (population and area), and various levels of economic development.
Of course, any effort to create a composite measure such as this is a product of choices and assumptions made along the way. Ours were guided by a view of how seamless urban mobility that is faster, cheaper, safer, and cleaner than today could look, and the important contribution such a system can make to prosperity and productivity. Places that had multiple modes of easily accessible transportation; that had placed an emphasis on walking, biking, and public transit relative to personally owned automobiles; and that had taken steps toward digitally enabling their mobility network received high marks. Different choices and assumptions, guided by a different vision, would necessarily yield different results. In addition, the DCMI currently presents a snapshot, not a trajectory. It does not capture how cities have trended over time, nor can it evaluate how past investments have affected mobility. As we update the data every year, a more robust picture will emerge.
12 13SPECIAL REPORT The Deloitte City Mobility Index
www.deloittereview.com

Deloitte City Mobility Index:Themes, metrics, and select data
Performance and
resilience
Congestion• Peak hours spent in congestion• Congestion level
• Driving time to city center (10km drive from each cardinal direction, peak hours)
• Dedicated bus lane in km
Public transit reliability
• Percentage of metro/tram delays• Percentage of bus delays
• Average waiting time for public transportation (in minutes)
Transit safety• Road quality• Walkability score
• Number of traffic-related fatalities• Number of traffic-related serious injuries
Integration and shared mobility
• Existence of open data or APIs for transport• Existence of integrated ticketing option across
transport modes• Carsharing system in the city
• Bikesharing system in the city• Existence of MaaS-based application• Private car dependency
Air quality• Annual mean of PM2.5 concentration• Annual mean of PM10 concentration
• CO2 per capita emissions• Air quality index
Vision and leadership
Vision and innovation
• City innovation and Future of Mobility strategy • Regulatory collaborations and joint initiatives with the private sector and academia
Investment• Transport budget as a percentage of the total
local authority/city budget• Investment levels in transport
Innovation
• Electric vehicles (EVs) adoption • Existence of open data or APIs for transport• Smart transportation/FoM-focused
accelerators/venture capitals/startups
• City rank in IESE Smart Cities index• City innovation and Future of Mobility strategy• Existence of MaaS-based application
Regulatory environment
• Operation of ridesharing companies• Number of regulatory bodies• City innovation and Future of Mobility strategy
• Regulatory collaborations and joint initiatives with the private sector and academia
• Autonomous vehicles (AVs) –city support
Environmental sustainability initiatives
• Transport sustainability score• Sustainability plan score• Length of bicycle lanes (in km)• Electric vehicles (EVs) incentives
• Cars sold/registered in given year that are low CO2 (BEV or PHEV)
• Dedicated bus lane (in km)• “Environmentally friendly” modal share (includes
public transport, walking, and cycling)
Service and inclusion
Public transport supply
• Rail system length (in km)• Number of light rail stops• Length of bicycle lanes (in km)
• Metro/subway average peak frequency (in minutes)
• Dedicated bus lane (in km)• Average waiting time for public transportation
(in minutes)
Transport affordability
• Monthly public transport cost (in $)• Fuel price per liter (in $)• Average parking price (in $)• Average cost of taxi (in $)
• Minimum daily wage (in $)• Modal share divided into percentage of trips
by cars, public transport, cycling, walking, and other modes such as taxi, ferries, etc.
Versatility
• Presence of tube or commuter rail system• Presence of tram system• Operation of ridesharing companies• Carsharing system in the city
• Presence of dedicated rapid bus transport• Presence of other mode of transport: rickshaw,
taxis, ferries, etc.• Bikesharing system in the city• Private car dependency
Customer satisfaction
• Customer satisfaction with public transport I• Customer satisfaction with public transport II• Road quality
• Congestion level• Average waiting time for public transportation
(in minutes)
Accessibility• Transport accessibility score• Accessibility of bus fleet (in percentage)
• Accessibility of train or metro fleet (in percentage)
• Walkability score
THEME METRIC EXAMPLE DATA
SIMON DIXON is the global transportation leader for Deloitte, a partner in Deloitte’s Public Sector practice, and leads Deloitte’s global initiatives into the Future of Mobility and Smart Cities. He is based in London.
HARIS IRSHAD is a senior manager of strategy and operations for Deloitte MCS Limited. He is based in London.
DEREK M. PANKRATZ is a senior research manager with the Center for Integrated Research in Deloitte Services LP. He is based in Milwaukee.
JUSTINE BORNSTEIN is the UK Insight lead and program manager for the UK Future of Mobility practice and a senior manager at Deloitte MCS Limited. She is based in London.
Many colleagues offered invaluable insights throughout the development of this project, including Scott Corwin, Mike Turley, Bill Eggers, Tiffany Dovey Fishman, Mark Gardner, Mark Price, and John Skowron.
The authors would like to thank Warwick Goodall, Kim Metzger, Andy Tong, Andrew Nothstine, Anant Aggarwal, Abhilash Kondapalli, Aarchit Jaiswal, Ankita Raghuvanshi, Vansh Kukreja, Vaibhav Pandey, and Chaitanya San-daka for their invaluable assistance in developing and researching the Index. The authors would also like to thank the team at Deloitte Insights for their work in seeing this project through to publication, in particular: Karen Edelman, Abrar Khan, Nikita Garia, Preetha Devan, Joanie Pearson, Sonya Vasilieff, Alok Pepakayala, Anoop R, Tushar Barman, and Mahima Nair.
Research and analysis team: Joanna Karlic, Amit Tzur, Kaustubh Dubey, Ashish Mishra, and Jae Park.
14 15SPECIAL REPORT The Deloitte City Mobility Index
www.deloittereview.com
Read more on www.deloitte.com/insights
Deloitte City Mobility IndexGo online to explore our full collection examining what smart urban mobility looks like and how global cities can reach their potential, including:
• Individual profiles of more than 45 cities
• An interactive comparing city performance, able to be sorted by everything from geography to population size and wealth
• Our full Future of Mobility collection, including articles, videos, and podcasts spanning the global mobility ecosystem and industry issues
www.deloitte.com/insights/city-mobility-index

www.deloittereview.com
Article title Article title16 17
by Craig Giffi, Joseph Vitale Jr., Thomas Schiller, and Ryan Robinson
ILLUSTRATION BY DIETER BRAUN
EVALUATING THE BIG BETS MADE ON
AUTONOMOUS AND ELECTRIC VEHICLES
A REALITY CHECK ON
YOU would be hard-pressed to open an auto-motive industry publication these days and not be inundated by articles detailing new
possibilities of bringing autonomous and electrified vehicles to market.
Indeed, manufacturers, suppliers, and tech companies are investing enormous amounts of money to make these technologies a reality. There are several reasons behind this R&D push: Autonomous vehicles have the potential to dramatically improve road safety by reducing driver error; and electric vehicles (EVs) can reduce the negative environmental impact caused by burning fossil fuels for transportation. Although these are undeniably positive goals, achieving them may be more difficult than we think. In fact, the current pace of investment in advanced vehicle tech-nologies can be described as a game of high-stakes poker where the players are all in, and the outcome is largely undetermined, though unlikely to favor everyone at the table.
Capital allocations for these technologies are skyrocketing
In an industry where it has become increas-ingly difficult to differentiate between vehicles or brands, leading-edge technologies such as autono-mous driving and electrification represent a huge opportunity to fundamentally change a hypercom-petitive playing field that has been maturing over the last 100 years. Most analysts will agree that electrified, autonomous vehicles will be part of our lives at some point in the future, but there are many different opinions regarding how long it will take for that to happen on a large scale. Optimists believe we are sitting on the edge of a revolution that is ready to play out in the next several years. On the other hand, a more conservative view tempers this enthusiasm by taking into account several headwinds that, when combined, especially threaten traditional automakers.
It’s difficult to accurately determine the amount of money being shoveled into these new technolo-gies, but a recent study by the Brookings Institute estimates investment in the autonomous technology ecosystem to be at least US$80 billion over the past three years.1 Similar levels of investment have recently been announced by several automakers looking to push their global powertrain strategies toward an electric future. For example, Volkswagen has stated its total investment in EVs will be in the range of US$86 billion by 2022.2
On the surface, these investments seem well founded. Recent findings from the Deloitte's 2018 global automotive consumer study suggest that consumers may be warming to the concept of fully self-driving vehicles: 47 percent of US consumers in this year’s study feel that autonomous cars will not be safe, which is down significantly from last year’s 74 percent. The same can be said for every country covered in the study (figure 1), for example, South Korea (54 percent this year felt self-driving vehicles will not be safe vs. 81 percent last year); Germany (45 percent this year vs. 72 percent last year); and France (37 percent vs. 65 percent).3 However, even though the survey results suggest a positive direc-tional trend for autonomous vehicles, it still leaves almost half of consumers in most markets doubting the safety of this technology. While we fully expect consumers’ acceptance of autonomous vehicle technology to grow more favorable with real-world positive experiences, how this new technology can effectively be monetized should be a concern for company boards and senior executives searching for signs that these investment decisions will yield significant returns down the road.
Evidence suggests that it will be difficult for manufacturers to see substantial returns on invest- ments in autonomous technology using current business models, as a significant number of con- sumers in countries such as Germany (50 percent), the United States (38 percent), and Japan (31
A reality check on advanced vehicle technologiesSPECIAL REPORT 1716
www.deloittereview.com
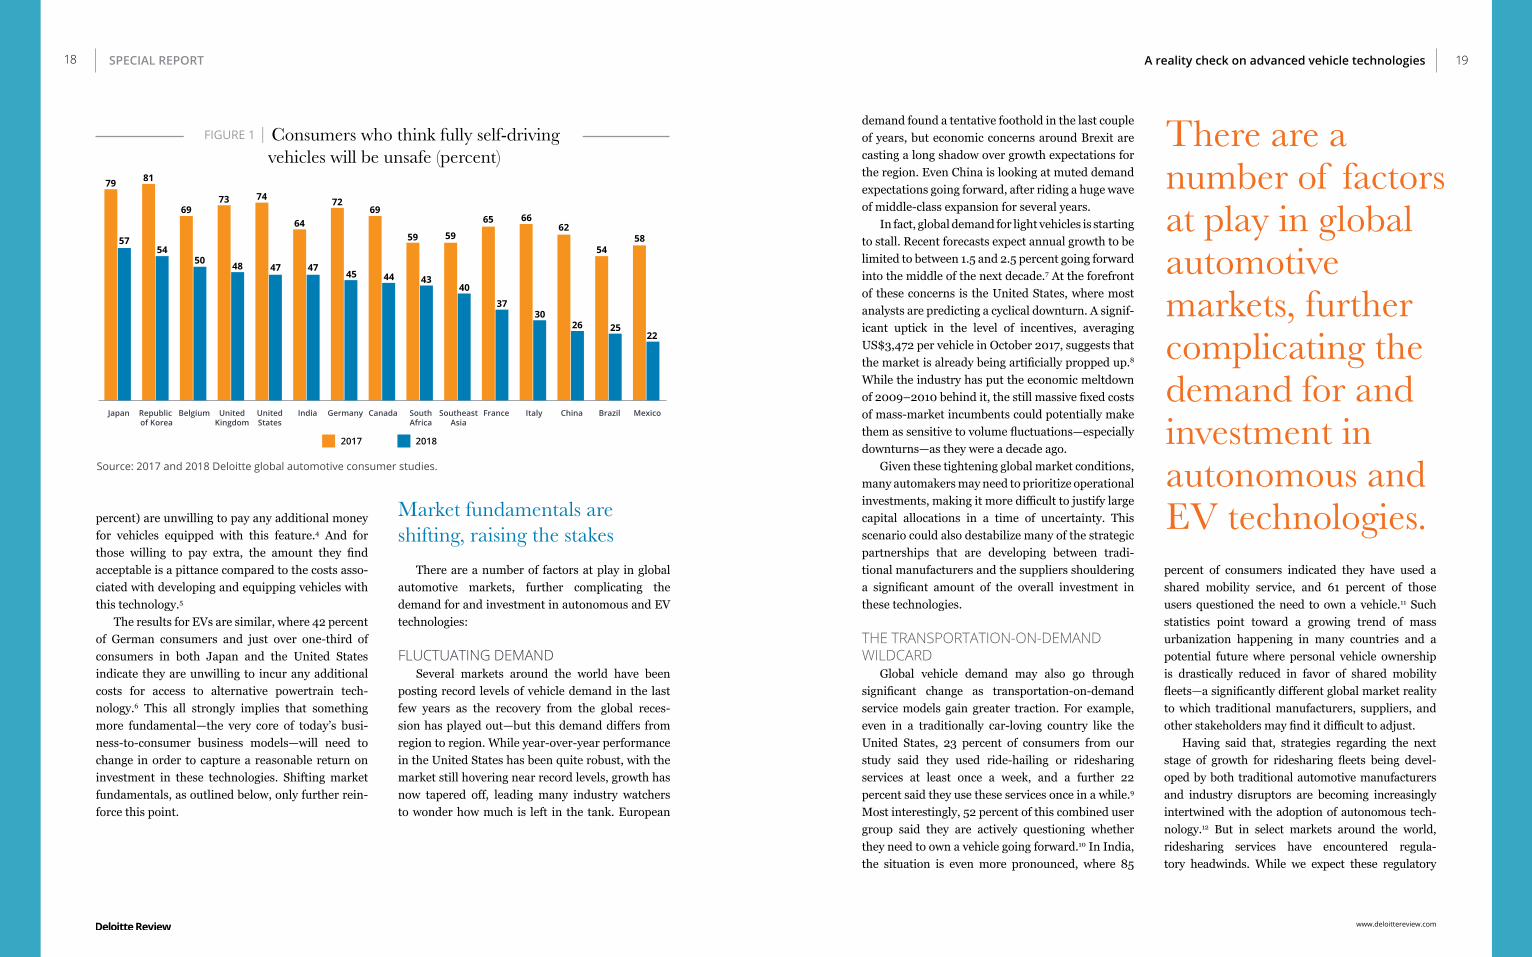
percent) are unwilling to pay any additional money for vehicles equipped with this feature.4 And for those willing to pay extra, the amount they find acceptable is a pittance compared to the costs asso-ciated with developing and equipping vehicles with this technology.5
The results for EVs are similar, where 42 percent of German consumers and just over one-third of consumers in both Japan and the United States indicate they are unwilling to incur any additional costs for access to alternative powertrain tech-nology.6 This all strongly implies that something more fundamental—the very core of today’s busi-ness-to-consumer business models—will need to change in order to capture a reasonable return on investment in these technologies. Shifting market fundamentals, as outlined below, only further rein-force this point.
Market fundamentals are shifting, raising the stakes
There are a number of factors at play in global automotive markets, further complicating the demand for and investment in autonomous and EV technologies:
FLUCTUATING DEMAND Several markets around the world have been
posting record levels of vehicle demand in the last few years as the recovery from the global reces-sion has played out—but this demand differs from region to region. While year-over-year performance in the United States has been quite robust, with the market still hovering near record levels, growth has now tapered off, leading many industry watchers to wonder how much is left in the tank. European
SPECIAL REPORT
FIGURE 1 | Consumers who think fully self-driving vehicles will be unsafe (percent)
Source: 2017 and 2018 Deloitte global automotive consumer studies.
2017 2018
Japan Republic of Korea
Belgium UnitedKingdom
UnitedStates
India Germany Canada SouthAfrica
SoutheastAsia
France Italy China Brazil Mexico
57
79
5458
22
54
25
62
26
66
30
59
65
37
40
59
43
69
44
72
45
64
47
74
47
73
48
69
50
81
19
demand found a tentative foothold in the last couple of years, but economic concerns around Brexit are casting a long shadow over growth expectations for the region. Even China is looking at muted demand expectations going forward, after riding a huge wave of middle-class expansion for several years.
In fact, global demand for light vehicles is starting to stall. Recent forecasts expect annual growth to be limited to between 1.5 and 2.5 percent going forward into the middle of the next decade.7 At the forefront of these concerns is the United States, where most analysts are predicting a cyclical downturn. A signif-icant uptick in the level of incentives, averaging US$3,472 per vehicle in October 2017, suggests that the market is already being artificially propped up.8 While the industry has put the economic meltdown of 2009–2010 behind it, the still massive fixed costs of mass-market incumbents could potentially make them as sensitive to volume fluctuations—especially downturns—as they were a decade ago.
Given these tightening global market conditions, many automakers may need to prioritize operational investments, making it more difficult to justify large capital allocations in a time of uncertainty. This scenario could also destabilize many of the strategic partnerships that are developing between tradi-tional manufacturers and the suppliers shouldering a significant amount of the overall investment in these technologies.
THE TRANSPORTATION-ON-DEMAND WILDCARD
Global vehicle demand may also go through significant change as transportation-on-demand service models gain greater traction. For example, even in a traditionally car-loving country like the United States, 23 percent of consumers from our study said they used ride-hailing or ridesharing services at least once a week, and a further 22 percent said they use these services once in a while.9 Most interestingly, 52 percent of this combined user group said they are actively questioning whether they need to own a vehicle going forward.10 In India, the situation is even more pronounced, where 85
percent of consumers indicated they have used a shared mobility service, and 61 percent of those users questioned the need to own a vehicle.11 Such statistics point toward a growing trend of mass urbanization happening in many countries and a potential future where personal vehicle ownership is drastically reduced in favor of shared mobility fleets—a significantly different global market reality to which traditional manufacturers, suppliers, and other stakeholders may find it difficult to adjust.
Having said that, strategies regarding the next stage of growth for ridesharing fleets being devel-oped by both traditional automotive manufacturers and industry disruptors are becoming increasingly intertwined with the adoption of autonomous tech-nology.12 But in select markets around the world, ridesharing services have encountered regula-tory headwinds. While we expect these regulatory
A reality check on advanced vehicle technologies
There are a number of factors at play in global automotive markets, further complicating the demand for and investment in autonomous and EV technologies.
18
www.deloittereview.com

setbacks to be mere speed bumps challenging the growth of this new form of transportation, the uncer-tainty of the regulatory environment should be a concern if the large capital investments in autono-mous technology are predicated on scaling it through the shared mobility model. In this regard, disruptors have a distinct advantage, as their typical capital- and asset-light business models are not burdened by the significant existing asset base and broader set of capital requirements of traditional automakers.
AFFORDABILITY There is also a growing affordability issue in key
markets such as the United States, where the average transaction price for a new vehicle continues to hover in record territory, hitting US$35,428 in October 2017, representing a 1.5 percent increase on a year-over-year basis.13 In response, more consumers are looking to exploit financial tools such as leasing and long-term loans as a way to keep monthly vehicle payments within reach. According to Edmunds, leasing remains near-record levels, accounting for almost one-third of new vehicle transactions (31.1 percent) through the first half of this year.14 As for loan terms, the average term for the U.S. market hit a record high of 69.3 months in June 2017.15
As a result, consumers may be increasingly hesitant to commit to vehicles equipped with autonomous or electric powertrain features, as these vehicles typically command a significant price premium compared with more traditional vehicles. Ironically, it is this affordability issue that may prompt consumers to rethink vehicle owner-ship altogether, opting for the much lower, usage-based cost model that shared transportation repre-sents. At the very least, it may prompt consumers to look at acquiring a used vehicle. With record numbers of off-lease vehicles becoming avail-able over the next few years, prices of used vehi-cles should moderate, encouraging a substantial number of consumers to effectively prolong the use of “conventional” vehicles.
While recent survey results (figure 2) suggest that the percentage of people who would prefer an alternative powertrain in their next vehicle has increased over the past 12 months in key global markets such as China, India, Japan, and Germany, consumers in both the United States and Japan cite price premiums as the biggest reason they will not consider buying a full battery-powered electric vehicle (BEV). In fact, 80 percent of US consumers would still prefer either a gas or a diesel powertrain in their next vehicle (which is actually up from 76 percent in last year’s study)—likely due to the low-fuel-cost environment in the United States, where gas prices continue to hover in the range of US$2.50 per gallon.16
To date, U.S. consumers have been enticed into buying electrified vehicles through the use of heavy government incentives, which can range up to US$7,500, depending on the model.17 However, even with these federal tax credits in place, the U.S. EV market has struggled to gain a foothold, accounting for only a small portion of annual vehicle sales.
REGULATORY-DRIVEN ELECTRIFICATION Policymakers in a variety of global jurisdictions
are aggressively promoting the next generation of urban environments that include a clean, connected, efficient, and safe transportation system. In fact, countries such as Norway, Britain, France, and the Netherlands have already announced that they plan to ban the sale of vehicles that run on conven-tional gas and diesel engines over the next two to three decades. China is also studying a timeline to move away from traditional gas- and diesel-engine vehicles, in large part due to government desire to both stem harmful emissions that are choking major cities and significantly reduce the country’s reliance on imported oil.18 India also aims to have an all-EV fleet by 2030, prompting automakers such as Hyundai and Suzuki to announce aggres-sive plans to introduce a range of EVs in the Indian market.19 The combination of all these government announcements make the drive to electrification
seem inevitable in most markets, but autonomous cars have yet to be given a clear regulatory mandate that companies can use to justify their massive capital investments.
However, for the time being, consumers remain wary of EVs as the technology races to keep up with unrelenting expectations. The main reason Chinese and German consumers are keeping their distance from BEVs is anxiety over how far they can drive on a single battery charge. Similarly, consumers in both India and South Korea are the most concerned about a lack of vehicle-charging infrastructure in their respective countries.
In several countries around the world, the invest-ment required to update already-flagging infra-structure to facilitate advanced technologies such as electric charging stations and smart sensors is staggering. It calls for creative, long-term thinking in the face of dramatic changes to traditional funding models. This includes the most basic impli-cation regarding EVs: no gas tax revenue to fund
large-scale government projects. For this reason, many jurisdictions, including India, are looking to public-private partnerships for the funding required to modernize mobility systems.20 In Europe, auto-makers BMW, Daimler, Volkswagen, and Ford have set up a joint venture called Ionity with a goal to install a network of 400 high-power EV charging stations, each costing approximately US$233,000, across the continent by 2020.21
What’s it going to take for consumers to get on board?
Safety, brand trust, and cost are all major factors determining consumer acceptance of these two technologies, especially self-driving vehicles. For example, 54 percent of US consumers in last year’s study said they would be more likely to ride in an autonomous vehicle if it was offered by a brand they trust; the number has increased to 63 percent this year.22
FIGURE 2 | Consumer preference for engine typein next vehicle (percent, 2018)
Source: 2018 Deloitte global automotive consumer study.
Gasoline/diesel (ICE) Hybrid electric (HEV) Battery electric (BEV)
SouthAfrica
UnitedStates
UnitedKingdom
Canada India Brazil SoutheastAsia
Germany Belgium France Mexico Republicof Korea
Japan Italy China
Other
Note: “Other” category includes ethanol, compressed natural gas, and hydrogen fuel cell.
8580
73 71 69 67 66 66 64 62 60 6052 49
39
1015
19 2216
13 21 23 3023 31 29 38 3640
3 3 5 67
2
9 7 9 5 6 6 97 16
18 882 2 3 1 4 4 4 3 3 5 1 5
SPECIAL REPORT 21A reality check on advanced vehicle technologies20
www.deloittereview.com

Interestingly, consumers in China are the most positive about self-driving vehicles, with the percentage of people who think autonomous cars will not be safe plunging from 62 percent last year to only 26 percent in this year’s study. One of the reasons for this difference could be that Chinese consumers recognize their country ranks among the highest in the world for annual road fatalities.23 Younger consumers in several global markets also seem more likely to embrace autonomous tech-nology, with 70 percent of the Generation Y/Z popu-lation cohort in the United States saying they would be more likely to use a self-driving or autonomous vehicle if it were produced by a trusted brand. This compares with 62 percent of Generation X and 56 percent of boomer/pre-boomer consumers.
That said, even though brand trust is becoming more important, the type of company consumers would most trust to bring fully self-driving tech-nology to market has not changed over last year (figure 3). Consumers in Japan, Germany, and the United States still favor traditional vehicle manu-facturers; this is in contrast to consumers in South
Korea, India, and China, who would most favor new autonomous vehicle manufacturers or existing technology companies.24 One of the reasons for this difference could be tied to the relative strength of automotive brands in more mature markets.
Another way to make consumers feel more comfortable about new technologies such as auton-omous vehicles is to prove that the technology can be used safely and reliably in real-world conditions. Whether it’s a serious accident linked to the use of autonomous drive features or a relatively minor fender-bender involving a fully self-driving shuttle in Las Vegas,25 the result is similar: consumers who seriously question the readiness of the technology. For example, 71 percent of U.S. consumers said they would be more likely to ride in an autono-mous vehicle if it had an established safety record (up from 68 percent last year). It is a similar story in South Korea (83 percent versus 70 percent), and Germany (63 percent versus. 47 percent).26 In response, several companies, including some of the largest tech companies in the world, have been testing autonomous technology for many years with
FIGURE 3 | Companies consumers trust most to bring fully autonomous vehicle technology to market (percent, 2018)
Source: 2018 Deloitte global automotive consumer study.
Traditional car manufacturer New AV company/other Existing tech company
Japan France Brazil UnitedKingdom
Italy Belgium Germany UnitedStates
SouthAfrica
Canada Mexico Republicof Korea
India China SoutheastAsia
10 22 28 21 26 21 24 25 34 24 30 12 41 19 49
14
2320
2823
31 28 28
21
3328
47
30
53
38
76
55 52 51 51 48 48 47 45 43 42 41
29 28
13
relatively few issues, but it only takes one nega-tive incident to destroy much of the goodwill, faith, and interest built up around these long-term R&D experiments.
In addition, the price premium for a battery-powered vehicle should come down as battery production increases. In fact, battery prices have dropped by nearly 50 percent since 2013, from US$599 per kilowatt-hour to US$273 per kilowatt-hour in 2016. Prices will likely fall even further, potentially hitting US$100 per kilowatt-hour by 2026,27 making BEVs more price-competitive with traditional vehicles and, ultimately, a more attrac-tive option to consumers. However, these projec-tions are based on using lithium-ion batteries, which run the risk of igniting if punctured during an accident. New developments in battery technology such as the use of solid-state materials promise to improve the overall safety of batteries used in BEVs, but they are also likely to cost more, at least in the near term.
Finally, with an increasing number of connected vehicles in operation, consumers also express fear that their vehicle could be compromised by a hacker with malicious intent. In a recent poll conducted by the American International Group, nearly 75 percent of respondents listed vehicle hacking as an issue of concern.28 As a result, our survey shows that 54 percent of US consumers would feel better about riding in self-driving cars if governments would implement standards and regulations to help ensure manufacturers are taking cybersecurity issues as seriously as possible.
Where is all this going?Considering the headwinds of slowing demand
and cooling global conditions that threaten to derail several key automotive markets around the world, it is unlikely that OEMs, suppliers, and technology companies will be able to sustain the frantic pace of capital allocations currently flowing into autono-mous drive and electric powertrain development. Even companies that are actively looking for ways
to maintain a level of focused investment through market rationalization, brand divestitures, or oper-ational cost cutting are likely to find it difficult. In fact, some companies may quickly find themselves struggling with more immediate operational issues that take precedence over long-term technology investment strategies.
At the end of the day, it can be argued that the investment process required to bring fully autono-mous and EV technology into the mainstream is not yet mature enough. Driverless cars are still very much in an experimental stage, and new develop-ments such as solid-state batteries designed to improve the performance and safety of BEVs remain just out of reach. The further out the investment window goes, the harder it will be for most players to justify and maintain their spending on develop-ment. For this reason alone, it is likely that compa-nies will have to make some hard choices in terms of which technology investment bets they are able and willing to make.
The difficulty these companies face is com-pounded by their need to make significant invest-ments in a host of other areas, including mobility services, advanced materials, connectivity, and the digital transformation of the customer experience. In short, the cumulative demand for capital invest-ment in the automotive sector is nothing short of astonishing, and while global consumer interest in advanced technologies is somewhat encouraging, their appetite to pay for any of it is very limited.
Going forward, the following three takeaways should be top of mind for industry stakeholders:
• New business models will be necessary to capture a return. Consider that dozens of companies are engaged in a gold rush to develop and own the predominant autonomous vehicle platform. Not everyone investing in this tech-nology is going to win. And consumers are only willing to pay for certain technologies using current “sell-to-consumer” business models. At a minimum, autonomous technology invest-ments will require new business models to monetize investments. This, in turn, may further
SPECIAL REPORT 23A reality check on advanced vehicle technologies22
www.deloittereview.com

open the door for disrup tors to capitalize on your investment. If a com prehensive business model solution is needed to generate an appro-priate return on the technol ogy investment, be prepared for the Herculean challenge of creating new successful business models. As advanced and complicated as it is, the technology is actu-ally the easy part.
• Keep a watchful eye on regulators and policymakers. Sooner or later, standards will be imposed on all of this new technology. History suggests the fragmented nature of regu-lation across markets will play out here as well. Standards represent both an opportunity to moderate technology development and invest-ment toward clearer targets, as well as a threat to undermine any competitive advantage for first movers. Early, active, and consistent involve-ment with regulators in tandem with ecosystem partners is essential to best inform investment decisions and market plans. Environmental policy pressure around the world is likely to
grow, suggesting EV and similar alternative powertrain technologies are perhaps a safer bet, while the opportunities and challenges for autonomous technology are more varied and may need a different mindset to calibrate the timing and level of investments.
• Don’t lose sight of the present while chasing the future. Finally, there are more than 325 million vehicles in operation in North America, with a further 390 million in Europe, and 165 million in China alone.29 Given the sheer size of the global vehicle parc, or total vehicle population, and the fact that each one now lasts for 10–15 years or more, the kind of transfor-mational change that comes with autonomous driving and electric powertrains will likely take several decades to reach a tipping point in an industry that has been maturing for well over a century. Players that forget this reality in the frenzy of making big bets on the future may not survive long enough to see that future eventually unfold.•
At the end of the day, it can be argued that the investment process required to bring fully autonomous and electrified vehicle technology into the mainstream is not yet mature enough.
CRAIG GIFFI is vice chairman and national automotive industry leader for Deloitte USA and the managing prin-cipal of Deloitte Research & Insights. He is based in Cleveland.
JOSEPH VITALE JR. is a principal with Deloitte Consulting LLP and leader of the global automotive industry practice. He is based in Detroit.
THOMAS SCHILLER is a partner and automotive practice lead with Deloitte Deutschland. He is based in Munich.
RYAN ROBINSON is automotive research leader with Deloitte Canada. He is based in Toronto.
We would like to thank the tremendous team that helped with the development of this research and report, includ-ing Srinivasa Reddy Tummalapalli, assistant manager, and Ankit Mittal, senior analyst from Deloitte Support Services India Pvt. Ltd.
We would also like to acknowledge the continued support of Srinivasarao Oguri, Vaibhav Khobragade, Sanket Surve, and Kruttika Dwivedi from Deloitte Support Services India Pvt. Ltd.
SPECIAL REPORT 25A reality check on advanced vehicle technologies24
www.deloittereview.com

www.deloittereview.com
Article title Article title26 2726 SPECIAL REPORT
MOST governments rely heavily on revenue generated directly and indirectly by trans-portation. Everything from fuel taxes to
parking fees, traffic violation fines, value-added taxes from vehicle purchases, subway and bus fares, and registration and licensing charges can provide critical revenue to maintain infrastructure, support public transit, and more.
Yet as the future of mobility unfolds, those re- liable sources of funding1 could come under increas-ing strain. The rising electrification of vehicles could reduce tax receipts from diesel and gasoline. Shared mobility services may prompt people to abandon car ownership altogether, which would lead to declin-
ing revenue from sales taxes and licensing and registration fees. And if autonomous vehicles take off, traffic violations and demand for parking could plummet. For an indication of the possible revenue shortfall, figure 1 provides a snapshot of current vehicle-derived revenue in the United States and rough estimates of how it could shift by 2040.
At the same time, the need of governments globally for transportation funding has rarely been greater. Fueled by population growth and urbanization, the cumulative global shortfall in funding for road infrastructure could balloon to more than US$7.5 trillion by 2040, according to the G20-sponsored Global Investment Hub.2 And
by Justine Bornstein, Simon Dixon, Michael Flynn, and Derek M. Pankratz
ILLUSTRATION BY NEIL WEBB
FUNDING THE FUTURE OF MOBILITY
Funding the future of mobility 27
www.deloittereview.com

capitalizing on emerging trends in mobility is likely to require new spending. For example, the experi-ences of London, Stockholm, and Singapore suggest the gantries, cameras, and vehicle sensors needed to enable congestion charging can cost several hundred million dollars to install.3 In the future, establishing even more dynamic usage-based road pricing and
setting up a citywide “digital backbone”—an inte-grated mobility platform—that can help manage supply and demand and increase throughput could require even greater upfront investment (although the potential long-term revenue generated could also be greater).4
$0
FIGURE 1 | Most transportation revenue sources are likely to decline
$20 $40
86% of the Highway Trust Fund comes from fuel taxes; the tax rate hasn’t changed since 1993.
Improving fuel economy and vehicle electrification could cut gasoline demand by roughly 30% by 2040.
There are more than 250 million registered vehicles and more than 210 million licensed drivers in the United States.
Roughly one-half of ride-hailing consumers question the need to own a vehicle.
New York City generated nearly US$1 billion from parking fees and fines in 2016, and another US$110 million from traffic violations.
By 2040, two-thirds of the miles traveled in urban and suburban areas could be in AVs, which would rarely need to be parked.
The Oklahoma Turnpike Authority collectedUS$256 million in tolls in 2015.
Vehicle miles traveled in the United States could increase by 20% in 2040.
Potential impact of mobility trends on US vehicle-related public sector revenue
Source: Deloitte analysis based on data from the Federal Highway Administration, United States Census Bureau, the CIA World Fact Book, the Congressional Research Service, and Governing magazine. These estimates should be considered notional, assume policies remain unchanged, and do not account for operating expenses.
2016 2040
Fuel tax
Registrations and licenses
Parking
Traffic enforcement
Other (primarily tolling)
36
Dollars in US billions
26
4129
207
62
1417
Approach Examples Key considerations
Usage-based charging
• Congestion charging in London, Singapore, and Stockholm
• Relatively high upfront costs• Tends to be politically unpopular during
early stages
Licensing and fees
• Per-trip rideshare fees in Chicago and New York City
• Risks disincentivizing new mobility services
• Revenue potential can be modest
Monetizing mobility data
• Relatively few, although some cities and states have charged for access to data and records5
• Difficult to value• Could limit other benefits associated
with open data• Potential privacy and cybersecurity
concerns
PPPs • Delhi-Meerut Expressway• Toronto-Sidewalk Labs Quayside
neighborhood project
• Typically only defers payments, unless project generates free cash flow
• Can be complex to negotiate and execute
Source: Deloitte analysis.
Four ways to potentially address mobility costs
So what can be done? Some governments have explored a number of ways to help shift transporta-tion-derived revenue away from traditional sources like fuel taxes. Four broad approaches have either proved successful, attracted interest from some governments, or may emerge in line with new tech-nology—usage-based charging, licenses and fees, monetizing mobility data, and public-private part-nerships (PPPs) (figure 2). All four have advantages, limitations, and potential challenges, and we’re not suggesting there’s a silver bullet for funding tomor-row’s mobility needs. But understanding the trade-offs associated with these different funding and financing mechanisms allows public and private
sector leaders to be clear-eyed about their options as they seek to enable a mobility landscape that is faster, cleaner, safer, and more equitable.
1. USAGE-BASED CHARGINGMany countries have experience with tolling in
some form, whether tied to a specific point such as a bridge or tunnel or covering a particular section of roadway. Such traditional, static tolling is typically designed to generate revenue, either to recoup the cost of building the infrastructure or cover opera-tional costs. More recently, some governments have explored congestion charging schemes—a fee associated with entering a particular area, typi-cally a city center—as seen in London, Singapore, and Stockholm, where those charges net between US$100 million and US$230 million annually.6 In
FIGURE 2 | Potential mobility funding approaches
SPECIAL REPORT 29Funding the future of mobility28
www.deloittereview.com

contrast to traditional tolling, many of these new efforts aren’t necessarily aiming to raise revenue—instead, they seek to manage traffic and price exter-nalities from congestion and emissions by targeting specific user groups (such as heavy freight vehicles), geographic areas (such as city centers), or times of day (such as peak travel hours).
We envisage truly dynamic user-based charging systems that can adjust prices in real time based on an array of conditions, thanks in part to new technology and sensors and more ubiquitous data. Such a system could provide transport managers with a flexible and adaptable tool that can be used to influence behavior and help manage demand, by adjusting pricing such that people drive at different times or on different roadways. It can also be used to shift usage to different modes of transport; as driving a personal vehicle alone becomes costlier, people may switch to public transport, carpooling, or cycling. And more dynamic pricing could extend beyond roads to include curbsides, with many cities revisiting their curb management plans.7 New tech-nology and detailed, dynamic maps of when an area can be used for, say, delivery vehicles and when it can be used for buses might be the first steps toward differentially charging users for their use of that space.8 The most encompassing version could
manifest as a citywide integrated mobility platform that brings together physical infrastructure (roads, rails), modes of transport (cars, public transit, ride-sharing, bikesharing), and transportation service providers (aggregators, public transport system), and creates optimization systemwide through market-clearing mechanisms.9
Key considerationsOf all possible goals for road charging, raising
revenue can be the most challenging and requires the longest wait for a payoff. Setting up, operating, and maintaining a road charging scheme can be quite costly (although declining sensor prices and the growing ubiquity of smartphones may help). Stockholm spent US$237 million setting up the infrastructure for its road pricing system,10 although it today nets the city about US$155 million a year.11 More fundamentally, road charging tends to work at cross-purposes to revenue aims. If the goal is to raise money, you want more vehicles on the roads paying fees—yet most road charging efforts reduce the number of vehicles. Being clear on the goals of a particular road charging plan can be key. Finally, road charging is often politically unpopular, at least when first introduced.12 There are often percep-tions it represents a regressive tax on lower-income
We envisage truly dynamic user-based charging systems that can adjust prices in real time based on an array of conditions, thanks in part to new technology and sensors and more ubiquitous data.
individuals who typically travel from outlying areas into the city center and who may not have easy access to alternative travel options.13 Ring-fencing revenue so it goes into transportation infrastruc-ture rather than a general fund can help shore up support, as can keeping charges similar to existing public transportation fares or parking fees. More specific and accurate data about who is traveling where and when can also enable governments to target charges more precisely, potentially miti-gating concerns about inequitable treatment.
2. LICENSES AND FEESWhile often serving multiple purposes, licenses
and permits have long helped governments raise revenue from everything from hairstyling to liquor sales. Similarly, regional and local governments can directly monetize market access for mobility
providers. For example, Transport for London in 2018 instituted a tiered licensing fee system for private for-hire providers; the largest such providers (more than 10,000 vehicles) will pay more than US$4 million over five years.14 In the United States, flat fees for ride-hailing and transportation network companies vary widely, from as little as US$1,000 in Arizona15 to US$100,000 in Virginia.16 Airport access can be particularly valuable. In many instances, fixed licensing fees are combined with per-trip or revenue-based charges.
Cities can also explore trip-based or per-use fees on mobility services to generate revenue and to help ensure public transit remains viable. Chicago adds 67 cents to every rideshare trip, for example, and hopes to raise about US$16 million in 201817 to maintain and repair the city’s train lines.18 Many other states and cities have implemented similar plans.19 Such programs can provide a key source of income—new fees on for-hire vehicles in New York could raise roughly US$400 million annu-ally20—and help keep public transportation costs competitive with private services, helping to limit the “hollowing out” of buses and trains seen in some areas.21
Key considerationsWhile adding new fees or licensing charges could
be relatively straightforward to implement, govern-ments should carefully calibrate their approach so as not to stifle innovation or unduly penalize new mobility options, which consumers often value. Working directly with providers of such services to establish an equitable fee structure may be the best way forward. Depending on the market, the amount of revenue that can be raised from annual licensing fees is often relatively modest, in part because there are typically only a handful of major private sector mobility providers that they can be applied to.
3. MONETIZING MOBILITY DATA Many cities sit on a veritable treasure trove
of mobility-related data. Transit operators often possess highly detailed and comprehensive records of the daily movement of people. As cities and regional governments begin exploring integrated mobility platforms that private sector providers also tap into,22 the resulting picture of urban mobility could grow more comprehensive—and valuable. In general, cities should carefully consider whether to “give away” the valuable information and access that such a system typically collects, analyzes, and manages. Creating a free information data exchange with open APIs available to anyone, for instance, could squander an opportunity to mone-tize the system’s data—a potential asset for mobility
Many cities sit on a veritable treasure trove of mobility-related data.
SPECIAL REPORT 31Funding the future of mobility30
www.deloittereview.com
services providers, advertisers, and many others. Importantly, many types of mobility data likely exhibit increasing returns to scale, where the more they are used, analyzed, and combined, the more valuable they can become.23 A variety of models could be explored, including volume-based charges (free up to a certain amount of data, with fees tied to the amount thereafter), customer-specific fees (free for individuals and nonprofits, for example), charging for specific types of access (such as APIs), and others.24
Key considerationsValuing data can be tricky,25 and it remains
unclear what the revenue-generating potential could be from efforts to license access. What’s more, such a move cuts against current trends toward “open data,” which have arguably generated signifi-cant benefits for many transit agencies through the development of third-party applications that can
increase overall network efficiency and customer satisfaction.26 Not all global cities that have closely guarded their data have been successful in efforts to monetize it.27 Governments will have to care-fully weigh the tradeoffs in any decision to gate and charge access for data. In some cases, providing open access might be more prudent, even fiscally. For example, open public transit data could actu-ally drive up ridership—and collected fares—by making schedules more transparent and linking them with other modes, like ride-hailing. There are also serious and potentially fraught challenges around data privacy and security that would almost certainly need to be addressed.
4. PPPsMany of the funding approaches discussed here,
and others, can be structured and executed via PPPs where governments pay private sector firms to provide a service. PPPs aim to increase the effi-ciency of infrastructure projects by creating a long-term relationship between the public sector and private business, and a range of models exist from contractual PPPs (concessions, build-and-operate) to institutional partnerships (joint ventures, special purpose vehicles). Governments are increasingly turning to PPPs or other types of private sector participation to attract private investment and corporate expertise (see sidebar, “Finding funding partners”). In a fast-changing environment like mobility, the private sector can bring speed, effi-ciency, a drive for innovation, and reduce the amount of upfront capital required to perform a project. The National Highways Authority of India (NHAI), for example, signed an agreement with a private-sector service provider to develop the first phase of the Delhi-Meerut Expressway, a project designed to reduce congestion in the city of Delhi. Under this concession agreement, the contractor will develop a portion of the expressway and operate it for 15 years.28
PPPs also can go far beyond traditional infra-structure funding. In Toronto’s Quayside neigh- borhood, a partnership between Sidewalk Labs
and the intergovernmental Waterfront Toronto group aims to remake the entire area, using “urban design and new digital technology to create people-centered neighborhoods.”32 Sidewalk, a unit of Alphabet, committed US$50 million to the upfront planning, and its long-term vision includes a self-driving shuttle, adaptive traffic lights, a Mobility-as-a-Service app, and robot-based urban freight delivery.33
Key considerationsPPPs are not always—or even often—the best
solution to government funding challenges. Govern-ments should look carefully at a range of options
when deciding to bring in the private sector, or to pay for projects via some other mechanism. At the most fundamental level, PPPs typically only defer govern-ment funding—substituting annual payments for an upfront capital expenditure—unless third-party income can be generated. PPPs also have seem-ingly inherent complexities, including ensuring flexibility to adapt over time to meet government requirements and changing technological needs and making long-term funding available to meet contractual payments. Legal impediments and uncertainties regarding PPPs affect both the public and private sectors.
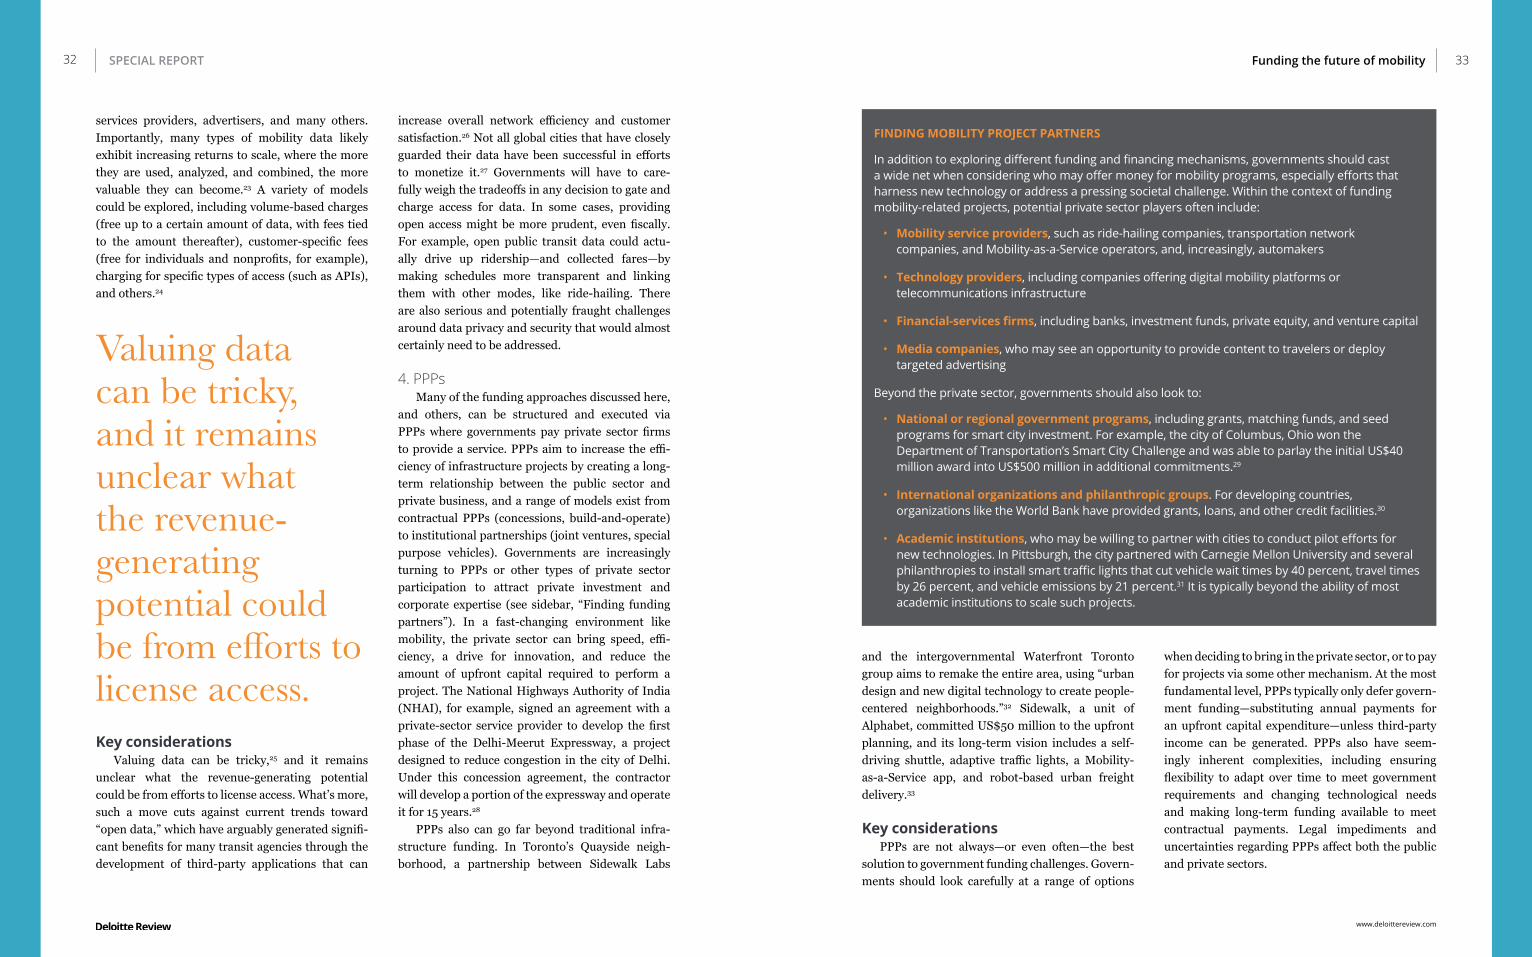
FINDING MOBILITY PROJECT PARTNERS
In addition to exploring different funding and financing mechanisms, governments should cast a wide net when considering who may offer money for mobility programs, especially efforts that harness new technology or address a pressing societal challenge. Within the context of funding mobility-related projects, potential private sector players often include:
• Mobility service providers, such as ride-hailing companies, transportation network companies, and Mobility-as-a-Service operators, and, increasingly, automakers
• Technology providers, including companies offering digital mobility platforms or telecommunications infrastructure
• Financial-services firms, including banks, investment funds, private equity, and venture capital
• Media companies, who may see an opportunity to provide content to travelers or deploy targeted advertising
Beyond the private sector, governments should also look to:
• National or regional government programs, including grants, matching funds, and seed programs for smart city investment. For example, the city of Columbus, Ohio won the Department of Transportation’s Smart City Challenge and was able to parlay the initial US$40 million award into US$500 million in additional commitments.29
• International organizations and philanthropic groups. For developing countries, organizations like the World Bank have provided grants, loans, and other credit facilities.30
• Academic institutions, who may be willing to partner with cities to conduct pilot efforts for new technologies. In Pittsburgh, the city partnered with Carnegie Mellon University and several philanthropies to install smart traffic lights that cut vehicle wait times by 40 percent, travel times by 26 percent, and vehicle emissions by 21 percent.31 It is typically beyond the ability of most academic institutions to scale such projects.
Valuing data can be tricky, and it remains unclear what the revenue-generating potential could be from efforts to license access.
SPECIAL REPORT 33Funding the future of mobility32
www.deloittereview.com

A strategic approach to funding mobility
The diverse approaches to funding are rarely mutually exclusive, and when crafting a mobility funding strategy, governments should consider what mix of policies can best meet their needs. But all successful projects should generally start with the same set of preliminary steps:
• Understand the business model the proposed project will follow, including finan-cial dynamics, potential risks, when costs will be incurred, and when revenue will start to flow (including potential sources of revenue). Participants also should determine whether the project will generate cash after all costs have been paid that can be used to repay any external financing.
• Understand the value generated directly by a project (such as through the ability to charge usage fees) and indirectly (through the increased value of adjacent land). Governments should make efforts to capture a portion of this value generated to assist funding the specific project or future expenditures.
• Determine the financing options avail-able from public or private sources, debt, or equity, depending on expected levels of cash flow and value capture opportunities.
• Create a procurement and delivery model to ensure the project achieves the required outcomes, including optimal risk transfer. This is essentially a definition of the proposed contract structure. Government leaders should look to build flexibility into any agreements to avoid being “locked in” as technology develops and to make it easier to stitch together plans that cover multiple geographies.
When evaluating the suitability of a particular approach, public sector leaders should also consider the political and technical complexities involved. Some approaches may face resistance from key
stakeholders, requiring awareness building and education, outreach, and deft management. A number of funding options, like establishing a for-fee mobility data exchange, could demand rela-tively sophisticated technological capabilities. Does the government have the expertise and wherewithal to implement the policy? If not, where might the resources be found?
The future of smart cities and smart mobility looks bright—provided it can be paid for. We expect to see novel funding and financing models in the future of mobility, and here only scratch the surface of some of the most prominent approaches. By having a thorough understanding of the busi-ness models, value drivers, and financing options, governments can, in collaboration with the private sector, develop creative ways of funding future projects.
Paying for mobility solutions is likely to be an ongoing challenge for the public sector, and there is no fail safe way to meet those needs. But by acting with foresight and understanding the opportunities and challenges inherent in different approaches, cities and regions can help deliver a transporta-tion system that could offer faster, cheaper, cleaner, safer, and more equitable mobility—without breaking the bank.•
JUSTINE BORNSTEIN is the UK Insight lead and program manager for the UK Future of Mobility practice and a senior manager at Deloitte MCS Limited. She is based in London.
SIMON DIXON is the global transportation leader for Deloitte and a partner in Deloitte’s Public Sector practice. He is based in London.
MICHAEL FLYNN is the Global Financial Advisory Public Sector leader and the Infrastructure & Capital Projects EMEA leader. He is based in Dublin.
DEREK M. PANKRATZ is a senior research manager with the Center for Integrated Research in Deloitte Services LP. He is based in Milwaukee.
The authors would like to thank Scott Corwin, Bill Eggers, Tiffany Dovey Fishman, Mark Gardner, and John Skowron, along with colleagues in Portugal—Afonso Machado Arnaldo, Renato Carreira, Silvia Margarida Coelho, Filipe Gomes Silva, and Andre Alpoim Vasconcelos—for their support and contributions.
The future of smart cities and smart mobility looks bright—provided it can be paid for.
SPECIAL REPORT 35Funding the future of mobility34
www.deloittereview.com

www.deloittereview.com
Article title Article title36 3736 FEATURE Are you overlooking your greatest source of talent? 37
LEADERS know that if you want strategic execution, you need the right people and teams. Without them, everything is in doubt.
Yet finding the right people is an evergreen struggle—and harder still when unemployment in many coun-tries is at record lows and the job market is booming for the most sought-after individuals. No wonder the task of recruiting, promoting, and retaining talent consumes so many C-suite conversations.1
Which raises the question: Why do so many orga-nizations overlook their greatest source of talent— themselves? Large companies employ tens of thou- sands of people across geographies, industries,
and functions. Yet it’s not unusual for recruiters to be completely unaware that the best candidate for a position may already work inside the organi-zation. In fact, the culture at many companies actively discourages managers from “poaching” workers from other functions. Overcoming these hurdles effectively requires specific tactics and HR- based systems. But, more than that, it requires leaders to build and support a culture where people at all levels are encouraged to—and even expected to—look internally for personal growth and new challenges.
by Robin Erickson, Denise Moulton, and Bill Cleary
ILLUSTRATION BY ANNA GODEASSI
www.deloittereview.com

FEATURE
The business opportunity is clear-cut. First, you can avoid replacement and recruitment costs incurred when people leave. But even greater is the opportunity to reshape your employment brand and workplace culture. Many of today’s youngest workers are eager to build their careers rapidly and want to work for organizations that challenge them and promote them quickly. Internal mobility—how that happens—is not just a way to retain talent. It also helps to create a powerful magnet for people outside your organization who seek professional growth. The result? The talent market can see your organization as one that champions ambition and performance in everything it does. Think about what kind of talent you’ll attract and keep—whether inside or outside your organization.
Ways organizations get mobility wrong—and why it matters
For all the talk of robotics, artificial intelli-gence, and other advanced technologies, people are still needed to run organizations. And it’s getting
harder to find them, despite the prevalance of social networks including Glassdoor, LinkedIn, Facebook, Instagram, Twitter, YouTube, and others. A strong global economy, healthy job market, and rising employee expectations mean there’s intense compe-tition for talent—and the price for winning keeps going up (see “Why is finding top talent so difficult?” on page 51). Roughly one-half of all workers may be thinking about leaving their jobs,2 and easily can if they have the right capabilities and skills (see figure 1).3
But here’s the thing: What’s driving workers to leave organizations isn’t always just the promise of more money (though that inevitably plays a role). It’s also the opportunity to grow skills and build a career path. Surveys show that all workers—and especially millennials—expect the opportunity to rise within an organization.4 Without that, they’ll likely look elsewhere. And the reality is that workers will always want more than a job. Most want a career path, and the best ones can either find it from you or someone else.
39Are you overlooking your greatest source of talent?
WHY IT’S SO HARD TO HIRE INTERNALLYThis isn’t to suggest that many organizations
don’t recognize the value of hiring from within. But knowing something and acting on it are two different things. Organizations often have in place structural hurdles to promoting and recruiting from within—or a culture that discourages it. For example, we’ve seen companies where recruiters go looking for the right people for an opening and find them through social media postings, only to discover they already work there in a different role. And while it’s hard to believe, there are organiza-tions where recruiters are told they cannot reach out to the employees within the company about a different role.
This could require a simple mechanical fix—better internal job posting systems, for example. What’s often tougher to solve is when talent acqui-sition as a function isn’t included in the internal mobility conversation along with the career management and the learning and development functions or when an organization doesn’t do what’s necessary to prepare people for promotion. Creating a strong culture of internal mobility isn’t just about posting positions on an internal job site. It involves all leaders encouraging and supporting employees to develop the skills that prepare them for their next role, and creating a matching career plan. All too often, such efforts are largely absent: While a 2015 survey found 87 percent of employers agreed a strong internal mobility program would help their retention goals and attract better candi-dates, only 33 percent of respondents actually had such a program.5
Of course, even when these structures and programs are in place, many managers are loath to lose their stars. Yet the reality is that a culture of talent hoarding can lead to a culture of talent loss: When you block people from moving up within an organization, they often simply go elsewhere. This problem persists at all levels, and the risk of losing high-potential workers is acute with today’s youngest workers. In 2016, according to Deloitte’s millennial survey, slightly less than one-third of
millennials believed their organization was making the most of their skills and experience6—a stun-ning failure to leverage talent given the relationship between workers, strategic execution, and financial performance. And in 2017, Deloitte found that 38 percent of millennials surveyed said they plan to leave their organization within the next two years.7
CONNECTING TALENT AND STRATEGY At many low-performing organizations, talent
and strategy are seen as separate channels. At many high-performing organizations, recruitment and retention and internal mobility are inextricably linked. These organizations expend meaningful effort and energy creating experiences and expec-tations for talent that encourage growth, learning, engagement, and communication. They spend far more time coaching and developing employees, creating cross-training and stretch assignment
It’s not unusual for recruiters to
be completely unaware that the
best candidate for a position may already
work inside the organization.
FIGURE 1 | As unemployment falls, voluntary turnover rises
Source: Robin Erickson, Calculating the true cost of voluntary turnover: The surprising ROI of retention, Bersin, Deloitte Consulting, LLP, 2016.
0
0.5
1.0
1.5
2.0
2.5
3.0
3.5
4.0
0
2
4
6
8
10
12
2001 2002 2003 2004 2005 2006 20172007 2008 2009 2010 2011 2012 2013 2014 2015 2016
Unemployment rateSeasonally adjustedQuit level of nonfarm employees
Seasonally adjusted
2018
Millions Percent
38
www.deloittereview.com

opportunities, and focus more on workplace values than on the kind of capabilities that can be claimed on a résumé. The goal isn’t merely to help an indi-vidual worker build a more certain career path. The goal is to give each worker a way to differentiate themselves as they move up within an organiza-tion—not all that different than an extended job performance review.
Organizations that excel at talent management and acquisition don’t seek out internal candidates merely to improve engagement and retention rates—although that’s usually a happy side effect, as on-the-job development opportunities such as lateral moves and stretch assignments can increase engagement by up to 30 percent.8 Rather, they are creating a relationship. These employers want to closely tie a worker’s long-term goals with the organization’s objectives and performance. As one progresses, so should the other.
A new approach to internal mobility
Transforming a culture to promote internal mobility should be seen as part of a larger, systemic approach to talent management. It begins with an awareness that one of the most effective ways to promote retention, career ambition, and internal mobility is to champion it at the highest levels and build it into the culture of the organization. But that takes a shift in mindset.
That can start by challenging the assumption that losing an employee, from a financial perspective, is a neutral event. It’s true that when employees leave, their salaries and benefits disappear from expenses and are reabsorbed into the bottom line, resulting in near-term savings. But those savings are quickly overwhelmed by other costs, both direct and indi-rect: for one, there’s the loss of productivity, insti-tutional knowledge, and client relationships when an experienced employee leaves, not to mention the cost of recruiting and training a replacement. These costs do vary, based on industry, size of organization, and position. But we calculate that the departure of
an average employee earning US$130,000 annually in salary and benefits results in a loss of US$109,676 based on lost productivity and the subsequent cost of recruiting and training a new hire. Consider the potential implications of such losses on an organi-zation with 30,000 employees and a fairly typical 13 percent voluntary departure rate.9 The losses add up quickly—to more than US$400 million annu-ally—and reducing voluntary turnover can have significant financial benefits.10
The cost may also extend beyond dollars. In an organization with heavy turnover, especially among high-potential performers, the impact on the compa-ny’s employment brand can be significant—and self-fulfilling. Call it the negative talent cycle: There’s no implied loyalty between employees and employers, so employers don’t want to invest in career plan-ning and learning programs. Because there are no career planning and learning programs, employees don’t have the skills to be considered for promo-tion—and there’s no internal mobility. Because there’s no internal mobility, the very best employees keep leaving, hurting the organization’s brand in the career market. And the cycle begins again.
It's always better to focus on the bottom-line costs associated with hiring externally rather than from within. It demands a risk-adjusted approach to hiring—what’s the risk of hiring someone you don’t know well as opposed to looking at talent within the organization you do know? It’s no different than what happens at a flea market. The seller always knows the goods better than anyone else—and if you’re a buyer, it’s caveat emptor.
The same is true with talent. Employers have the seller’s advantage, as nobody knows their talent better. If an external candidate and an internal candidate both apply for a leadership position, whose résumé and job record can you trust more? The internal candidate has a demonstrated work history, manager reviews, and a verifiable list of accomplishments, not to mention deep familiarity with your organization’s culture, expectations, and strategy. The external candidate is, by comparison, a closed book. Even the most rigorous talent acquisi-tion process, extensive interviews, testing, and refer-ence checks can’t give you the same level of confi-dence that they’re ready for the job you need to fill.
And the numbers support this. Organizations that promoted internally are 32 percent more likely to be satisfied with the quality of their new hires.11 That’s because it typically takes two years for the performance reviews of an external hire to reach the same level as those of an internal hire.12 Compared with internal hires in similar positions, external hires are 61 percent more likely to be laid off or fired in their first year of service and 21 percent more likely to leave.13
So how should organizations seek to transform their approach to internal mobility? We view it across three dimensions:
CREATING A CULTURE OF INTERNAL MOBILITY
Executives should fully grasp the close relation-ship between talent and organizationwide perfor-mance—and then view talent as a capital asset critical to growth. Recognizing talent as a precon-dition for performance helps leaders look at all aspects of talent acquisition and management as an ongoing part of doing business, rather than just a necessary cost.
With that recognition, the investments neces-sary to an overall culture of talent development can lead inevitably to greater internal mobility. For example, active programs in career “story-telling” help champion those who have climbed the
career ladder—a sure way to reward outstanding performers and draw attention to them. But such programs also demonstrate in real and practical ways how younger workers can achieve the same level of success, which is an essential part of building a culture of internal mobility. Giving workers the necessary opportunities to learn and stretch assign-ments is one critical step; giving them a narrative they can model their own careers on is another (and especially impor-tant, because it helps raise the sights of those who might not otherwise believe they can move forward in an organiza-tion). That’s why long-term investments are able to create a stronger pipeline of talent through improved employment brand, higher retention, and more successful recruitment.
Consider Farm Bureau Financial Services, where the talent process was once highly reactive; recruiters scrambled to find candidates when jobs came open. While a new approach was needed, the company’s talent acquisition team looked beyond merely setting up internal job boards to seek to foster a culture that encouraged employees to drive their career journeys through advancement oppor-tunities.14 It pushed workers to reflect on their performance, image, and exposure throughout the organization with the goal of developing a profes-sional brand to open internal doors of opportu-nity. The result has been a far richer talent pipe-line of internal candidates.15 Another example is Minnesota’s Mayo Clinic, where employees are encouraged to be lifelong learners and build career paths anchored by exploration and growth. Managers work with employees to explore ways to build capabilities and new experiences, and they are required to be familiar with career resources the company offers so they can promote those programs to employees. Mayo Clinic’s turnover rate is well below similar-sized organizations in health care, and it’s common for employees with 30-year tenures to have held multiple jobs.16
Amount saved annually by reducing voluntary turnover by only 1 percentage point at an
organization with 30,000 employees and a typical 13
percent voluntary turnover rate.
FEATURE 41Are you overlooking your greatest source of talent?40
www.deloittereview.com

GAINING LEADERSHIP SUPPORTLeaders should support a companywide goal
of retention through internal mobility. Many of the highest-performing organizations explicitly set hiring targets for internal candidates and support those metrics by tying management compensa-tion to making sure workers are building skills and gaining the kind of training that helps them merit promotion. Recruiters and hiring managers can work together to identify the qualities that will make for outstanding candidates for positions that are not yet open, so that capable or potentially capable candidates can be identified and prepared. In addition, recruiters and hiring managers should seek out the ambitions of employees and seek ways to satisfy those aspirations. The goal is a “pull-through” effect, where high-potential workers reach ever-higher levels within the organization, creating opportunities as well as examples for others to follow.
At Home Depot, which employs 400,000 people in stores across North America, leaders are squarely at the center of internal mobility efforts. The company encourages storytelling—leaders and managers describing their own career
trajectories—to create models for more recent hires to emulate. It encourages associates to plan their careers, and to follow that path wherever it takes them inside the company, whether laterally or verti-cally. And, finally, leaders and managers are rated on their ability to fill talent pipelines with internal candidates so they participate on both the supply and demand sides.17
REIMAGINING HUMAN RESOURCESThe process for reshaping the HR function
should be supported by a simple argument: You get more bang for your buck by recruiting and hiring internally. Though most companies spend only 6 percent of their recruitment budgets on internal candidates, these candidates fill 14 percent of job openings.18 It’s clearly an efficient way to find candi-dates, and bypasses other costs such as onboarding, company-specific training, and other upfront expenses associated with hiring from the outside.
There’s another demonstrated benefit: Organ-izations that are good at promoting from within are more likely to be effective at many other aspects of talent recruitment and retention. Three out of four of the leading talent acquisition teams, as measured
by Bersin’s 2018 talent acquisition industry study, tap into internal talent pools, compared with roughly one in 10 low-performing teams. And these high-performing talent acquisition teams are five times more likely to offer a strategic approach to internal mobility.19
That strategic approach is re- flected in a focus on worker experi-ences and building strong capabili-ties to deliver career journeys. This has multiple implications for internal mobility efforts. For example, in large, high-performing organizations, HR teams comprising learning and career management are increasingly working hand-in-hand with HR colleagues focused on talent acquisition.20 The
more likely to continue applying for posted roles. The organization’s initial target was to eventually fill 10 percent of all open positions with internal candidates, but within a year, it was sourcing 30 percent of hires from within.21
Now imagine a process that also turns a cold rejection for a role into a career conversation about how internal candidates can close identified skill gaps. This means that talent acquisition teams work hand in hand with career-management colleagues, which, in turn, need to work closely with their learning counterparts. The net result is all of HR working together to help make employees feel they are a valued part of the organization and don’t need to look externally in order to grow professionally and personally.
Taken together, acting across these dimensions can lay the foun-dation for a new kind of talent cycle. Instead of an absence of professional-growth programs leading to low retention leading to a damaged employment brand leading to poor recruitment, organizations can create a virtuous talent cycle: an employment brand defined by professional growth opportuni-ties that attracts the very people who seek oppor-tunities for promotion and growth—and who value it as much as, if not more than, what they’re paid. Inextricably linking culture, leadership, and HR can increase internal mobility and retention. But it takes specific efforts such as including the talent acquisition function, creating learning and skills programs, establishing career narrative-building, and investing in employee experience. The net result of these efforts can be an organization able to invest confidently in its own people. And just like buying back stock in its own growth story, the company knows exactly what it’s getting and why it’s confident in making the move.•
idea is that those organizations focused on talent acquisition have a better understanding of the typical career journeys of high-potential, high-performing workers—and look for those qualities throughout the talent universe, both inside and outside the organization. For too long, talent acquisition has often been siloed and excluded from conversations around career management, promotion, and work-place culture, to the point where recruiters are often unaware that the best candidates for open positions are often already inside the organization. In high-performing HR organizations, talent acquisition sits at the center of those conversations so recruiters have a clear understanding of the kind of talent that can thrive, as well as the processes and technologies required to deliver it.
An effective transformation of HR’s approach to internal talent requires buy-in across the organiza-tion, especially in an age where teams are replacing hierarchies. Teams are a testing ground for poten-tial leaders—in short-term assignments and focused projects, a team can be led by someone with very little management experience. This provides them a window into their own skills as a leader, and gives them a chance to shine. Managers and HR leaders should work together to use team-based structures to identify possible internal candidates for promo-tion and further growth opportunities. It’s not just about posting job openings and creating internal career mileposts. It’s about stretching workers’ imag-inations, challenging them in real-life situations, and helping them see that they’re capable of more than they thought. This work doesn’t happen by itself, and HR will often have to take a leading role.
One global consumer goods company struggling with its employment brand set a new expectation that recruiters would have 48 hours to respond to internal applicants and 72 hours to conduct an initial screening—even if the applicant was not quite suited to the role. This simpler, streamlined process had an immediate impact, with employees feeling more connected and engaged with hiring teams and
Organizations that are good at promoting from within are more likely to be effective at many other aspects of talent recruitment and retention.
FEATURE 43Are you overlooking your greatest source of talent?42
www.deloittereview.com

ROBIN ERICKSON is a vice president and leader of Talent Acquisition, Engagement, and Retention research for Bersin. She is based in Chicago.
DENISE MOULTON is a manager and leader of HR Research for Bersin. She is based in Boston.
BILL CLEARY is a senior manager and leader of the Talent Acquisition offering for Deloitte Consulting. He is based in Downingtown, Pennsylvania.
45Are you overlooking your greatest source of talent?
There’s a simple reason why looking inward is critical to meeting your organization’s talent needs: Workers are becoming scarce. The developed world has emerged from the post-recession sluggishness of a decade ago to experience an unusual period of simultaneous economic growth, pushing many countries toward very low unemployment rates. For example, despite an economic expansion now closing in on its ninth year, Deloitte forecasts that the United States—the world’s biggest economy—will grow by more than 2.5 percent this year and next.*
Job seekers are hard to find in nations around the world
Source: International Monetary Fund, World Economic Outlook Database, April 2018.
Australia
2007 2008 2009 2010 2011 2012 2013 2014 2015 2016 2017
12
10
8
6
4
2
0
KoreaGermany
United StatesUnited Kingdom
Japan
Unemployment rates in selected countries, 2007–2017Percentage of labor force
Mexico
Why is finding top talent becoming so difficult?
*Daniel Bachman and Rumki Majumdar, United States Economic Forecast: 1st quarter 2018, Deloitte Insights, March 13, 2018.Read more on www.deloitte.com/insights
Is a leader born or made?Executives and HR have historically held divergent opinions. The answer in fact lies somewhere in between. In this podcast Stacey Philpot and Kelly Monahan talk about how inherent biases can become barriers in choosing a leader—and how diversity and a data-driven approach can remove them.
www.deloitte.com/insights/data-driven-leader Read our latest economic analysis and forecasts
on www.deloitte.com/insights/economics.
FEATURE44
www.deloittereview.com
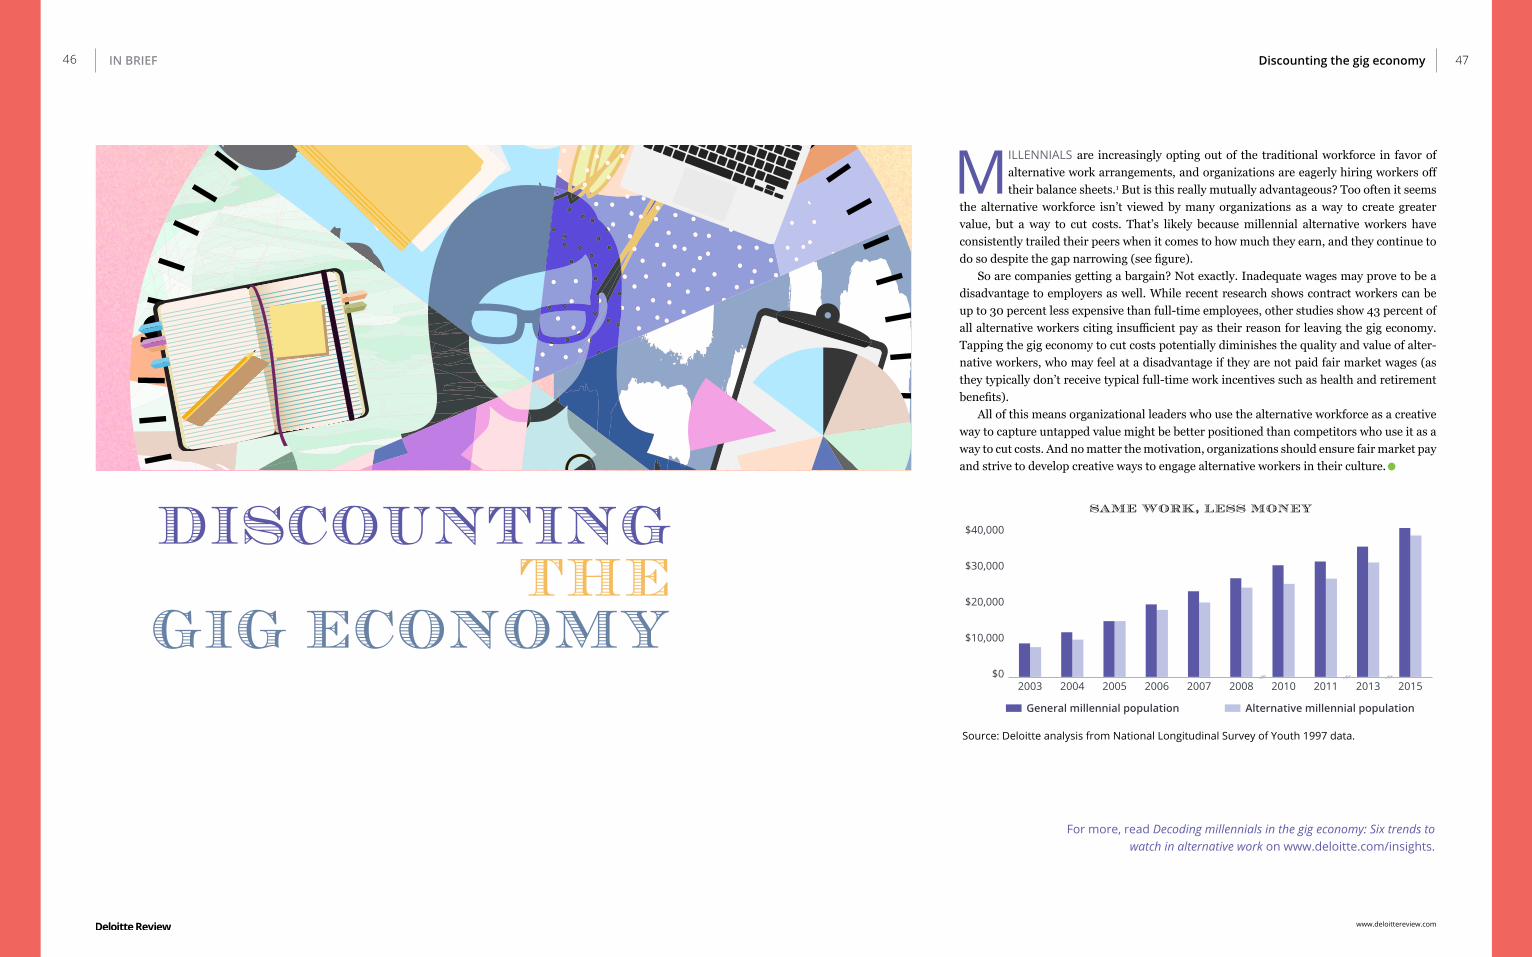
IN BRIEF46
| | | | | ||
|
||
||
||
||
||
||
||
|
||
||||||||||||
||
||
||
||
||
||
||
||
||
| | | | |Discounting the gig economy 47
For more, read Decoding millennials in the gig economy: Six trends to watch in alternative work on www.deloitte.com/insights.
MILLENNIALS are increasingly opting out of the traditional workforce in favor of alternative work arrangements, and organizations are eagerly hiring workers off their balance sheets.1 But is this really mutually advantageous? Too often it seems
the alternative workforce isn’t viewed by many organizations as a way to create greater value, but a way to cut costs. That’s likely because millennial alternative workers have consistently trailed their peers when it comes to how much they earn, and they continue to do so despite the gap narrowing (see figure).
So are companies getting a bargain? Not exactly. Inadequate wages may prove to be a disadvantage to employers as well. While recent research shows contract workers can be up to 30 percent less expensive than full-time employees, other studies show 43 percent of all alternative workers citing insufficient pay as their reason for leaving the gig economy. Tapping the gig economy to cut costs potentially diminishes the quality and value of alter-native workers, who may feel at a disadvantage if they are not paid fair market wages (as they typically don’t receive typical full-time work incentives such as health and retirement benefits).
All of this means organizational leaders who use the alternative workforce as a creative way to capture untapped value might be better positioned than competitors who use it as a way to cut costs. And no matter the motivation, organizations should ensure fair market pay and strive to develop creative ways to engage alternative workers in their culture.•
same work, less money
Source: Deloitte analysis from National Longitudinal Survey of Youth 1997 data.
2003 2004 2005 2006 2007 2008 2010 2011 2013 2015
General millennial population Alternative millennial population
$0
$10,000
$20,000
$30,000
$40,000
www.deloittereview.com

48 FEATURE 49
by Kavitha Prabhakar, Kristi Lamar, Anjali Shaikh, and Caroline Brown
ILLUSTRATION BY DANA KUBLIN
PERSPECTIVES FROM LEADING WOMEN CIOs
NO shortage of ink has been spilled on the chal-lenges faced by women in today’s IT work-force. Many business leaders and corporate
boards are taking steps to improve C-suite diver-sity; yet, too often, women continue to be underrep-resented in technology leadership positions and the technology workforce in general.
Despite numerous challenges, many highly com-petent and qualified women have risen through the ranks and smashed IT’s glass ceiling. In fact, the percentage of women technology chiefs is far higher
than that of female CEOs and CFOs, according to multiple analyses1—perhaps because technology teams can benefit from women’s unique combina-tion of leadership skills, such as empathy, flexibility, persuasiveness, assertiveness, and risk-taking.2
Here, we share insights from women who have risen to the top of the IT profession, including their perspectives on essential leadership qualities and guidelines for cultivating diverse and inclusive IT cultures.
Smashing ITʼs glass ceiling
www.deloittereview.com

Building the business case: Perspectives from leading women CIOs
Gender parity in IT is about more than being fair; many research studies suggest a business case for more gender-diverse technology teams and leadership. For example, the presence of women in leadership positions is correlated with higher finan-cial performance, better team dynamics, and higher productivity.3 More gender-diverse technology teams also demonstrate a number of business bene-fits (see figure 1).4
Fumbi Chima, CIO of Fox Networks Group, combines many leadership skills and capabilities to excel as a technology leader. For example, she says, “I’ve always taken difficult roles and tough projects, such as transformations, that no one wants to do. People may think you’re going to fail, and many times you do fail. But I’ve always been very resilient. You have to have the leadership and the tenacity to help solve very complex business problems.”5
Cultivating gender-diverse teams and creating more women technology leaders can help companies combat the ongoing shortage of technical talent—because high-performing teams with inspirational
leaders, regardless of gender, can help attract and retain IT staff. Capitalizing on this vast untapped resource could give companies a performance boost, deliver significant positive impact to the bottom line, and improve competitive advantage.
Scoping the challenge: Alone in a crowded room
Executing on the business case appears to be easier said than done. In the United States, multiple analyses peg the percentage of female CIOs in larger companies at between 17 percent and 22 percent.6 These low numbers may be due in part to a leaky pipeline that begins in the education system—where few women earn technology-related degrees7—and continues to the C-suite. (See figure 2.) A 2016 benchmark study of more than 540,000 technical workers found that women’s representa-tion declined at successive levels, from about 27 percent of the entry-level workforce to 23 percent of mid-level managers, 18 percent of senior-level managers, and just 14 percent of executives.8
The pipeline to the CIO’s office starts in a shallow pool: In 2017, for example, women comprised only 19 percent of applications and systems software
FIGURE 1 | The business case for gender diversity in IT
Source: National Center for Women & Information Technology; Anita Borg Institute.
Improved operational and financial performance
Lower project costs
Better adherence to project schedules
Better problem-solving
Higher employee performance ratings
Increased innovation
Higher employee pay bonuses
Better group performance
BENEFITS OF GENDER-DIVERSE
TECHNOLOGY TEAMS
developers, 24 percent of network and systems administrators, and 26 percent of employees in all computer and mathematical occupations in U.S. companies.9 Research has shown that hiring biases—both conscious and unconscious—can prevent newly degreed women technologists from being hired in IT.10
The pipeline fills slowly. Women who do get hired in IT may feel isolated and sidelined by all-male networking events, inflexible work envi-ronments, and widespread pay disparities.11 Discouragement with the IT culture can lead to high turnover. Twenty-seven percent of women cite discomfort with the work environment as a factor in leaving their IT job.12
For many women, an IT career is incompatible with starting or growing a family. Many companies provide free meals, alcohol, caffeine, games, and other perks to encourage hard work, high energy, and loyalty; staff are rewarded for long hours and marathon overnight coding sessions. And even in organizations with supportive parental leave poli-cies—critical for keeping women in the workforce—maternity leave is often seen as a career setback.13 Many women technologists must start their careers afresh each time they return from maternity leave.
Women who tough it out often struggle to advance. Female technologists say their top two
barriers are the lack of female mentors and role models,14 which can result in exclusion from critical informal networks that could help them further their careers. In US companies, women held only 27 percent of IT managerial roles.15 According to one study, at current advancement rates, it will take 100 years for women in technical and nontechnical roles combined to reach parity with men at the C-level.16
In spite of these challenges, many highly compe-tent and qualified women executives have risen through the ranks to become CIOs. In fact, the C-suite may be slightly more welcoming to women technology leaders than women leaders from other business functions. A review of data from a number of analyses of technology leadership at top US companies shows the percentage of female CIOs is much higher than that of female CEOs and CFOs. (See figure 3.)17
Women’s leadership capabilities may be aligned with those required to lead and manage evolving IT teams. We asked four veteran technology executives to weigh in on the personal traits that helped them succeed.
FIGURE 2| Women in IT: Leakypipeline on the way to C-suite
Source: Deloitte analysis.
ENTRY-LEVEL
MID-LEVEL
SENIOR
EXEC
It will take 100 years for women in technical and nontechnical roles combined to reach parity with men at the C-level.
51Smashing ITʼs glass ceilingFEATURE50
www.deloittereview.com

Who runs the world? Essential leadership traits of women CIOs
Women aiming for executive leadership posi-tions may find that societal expectations of leaders—such as assertiveness and self-reliance18—are misaligned with expectations of gender behavior.19 One study revealed a classic catch-22: Women with more stereotypically masculine management styles were perceived as less warm, and their subordinates were less willing to comply with their requests.20 Other researchers found that women needed to demonstrate both sensitivity and strength to be seen as effective leaders while men needed only to exhibit strength.21
These expectations may be changing. For example, the majority of participants in a recent survey saw no significant gender differences in the essential leadership traits of intelligence, inno-vation, ambition, honesty, and decisiveness, and gave women the advantage in compassion and organization.22
Another study combining personality assess-ment tests, in-depth interviews, and demographic analysis concluded that compared to male leaders, women were more persuasive, assertive, and willing to take risks. They also outperformed their male colleagues in areas of emotional intelligence and
interpersonal skills, including empathy, flexibility, and sociability (see figure 4).23
In general, the executives we interviewed regard success as the result of working hard and developing deep expertise in the absence of traditional “old boy” networks, recognizing and learning from mistakes, and persisting after a failure. By fine-tuning tech-nology, project management, and problem-solving skills, they were able to gain respect by talking to programmers, technologists, and project managers in their own “language” and offering advice on strategy and direction. They also had to learn how technology can help solve business challenges and to speak in terms of both business and IT.
FIGURE 3 | Percentage of women executives
Source: Deloitte analysis.
U.S. top 1,000 by revenue U.S. Fortune 500 U.S. Fortune 100
CIOs 19% 17% 22%
CEOs 5% 6%
CFOs 12% 12% 10%
5%
Women bring a unique set of communication skills to the C-suite.
“When I was pursuing my master’s degree in nuclear physics, there weren’t a lot of female role models, professors, or students,” explains Suma Nallapati, secretary of technology and CIO for the state of Colorado. “I learned early on that I had to stand up and speak up, hone in on my knowl-edge, and keep on top of my game. That experience shaped my future career in IT.”24
Technology skills were secondary to business background for Julie Lagacy, CIO and vice president of Global Information Services at Caterpillar Inc. Because of her pre-CIO background in finance and HR, technology expertise has not been as vital to her success as have business acumen and communica-tion skills. “Having a business background has been very beneficial as CIO, because my role is to help connect IT to business,” she notes. “And as CIO, the power of persuasion is important because people have a perception of how technology should work. They have to buy into your journey and strategy more than for many other C-suite roles.”25
Nallapati agreed that women bring a unique set of communication skills to the C-suite. She suggests that the ability to communicate and be empathic is needed to bring warmth to the often cold and mechanical world of IT. “Women are equipped with the natural skills to be great translators between IT and the rest of the world,” she says. “We also have an innate ability to translate IT into real-life scenarios and real-world solutions.”
These communication skills can help women build successful relationships across the organiza-tion. “Early in my career, I learned how important it is to build strong peer relationships,” says Monique Shivanandan, group CIO of the Chubb Group of Insurance Companies. “I really work hard to build strong, trust-based relationships—not just verti-cally, but horizontally as well.”26
Confidence and assertiveness, balanced with empathy and compassion, are other attributes that these leaders found invaluable on the path to CIO. “However, most women are not socialized to be unapologetically competitive,” notes Shivanandan. “They tend to be less comfortable with self-promo-tion, and more likely to be criticized when they do
grab the spotlight. I’ve often given advice to women to be careful to not ‘fly too close to the sun,’ which is really not good advice—but necessary.”
At the same time, women are often more empathic and compassionate. “Most women are people-oriented, and some of us focus more on people than we do on the details of technology,” Chima says. “We have genuine empathy for others that many of our male counterparts lack. I don’t think that’s acceptable—there has to be compassion.”
Lagacy had to tap into a reservoir of self-confi-dence as she moved among various non-IT func-tional areas before becoming a CIO. “Women often don’t raise their hand as high—or at all. We’re more likely to self-select out of a challenge or opportunity than men,” she notes. “The attitude is, ‘If I haven’t done this before or I’m not a real expert, then I’m not good enough to do it.’”
The antidote is for women to surround them-selves with people who have the skills and knowl-edge that they lack and not be afraid to ask ques-tions. “When I mentor people, one piece of advice I share is to stop apologizing for not knowing every-thing,” says Lagacy. “Not only does it appear you’re not confident, it’s also okay to not know. What is important is continuous learning and taking the initiative to find the answer.”
FIGURE 4| Where female leadersoutperform their male colleagues
Source: Caliper.
Emotional intelligence
Willingness to take risks
Empathy
Networking Assertiveness
Interpersonal skills Persuasion
53Smashing ITʼs glass ceilingFEATURE52
www.deloittereview.com

Looking forward: The journey to gender parity in IT
Gleaned from our interviews, these guidelines can help IT organizations turn aspirations for a diverse and inclusive IT culture into reality. The goal is to plug the leaks in the C-suite pipeline by creating a more diverse and inclusive organization, while simultaneously increasing the percentages of women technologists in the pipeline.
Create more gender-diverse IT organi-zations. Companies can attract, hire, and retain female technology talent by removing gender biases from the hiring process through steps such as insti-tuting blind resume reviews, eliminating gender-based wage gaps, creating gender-based hiring goals, and updating IT and HR policies that exclude or alienate women. Examples include more family leave for both genders, childcare options, and more flexible work arrangements.
“We want to have a merit-based hiring system without being exclusionary to any gender, race, or group,” says Nallapati. “So for example, if I’m looking at two candidates who are both very good programmers, I would then look to see if they also have empathy or servant leadership—traits that go beyond technical chops. We have gone after female
leaders who have exhibited high levels of empathy and a collaborative mind-set and I’m proud to say they’ve brought great skills and attitude to the table.”
A common practice for many IT organizations is to partner externally to engage the next generation of female technologists to study STEM in schools, improve their access to technologies and tools, create safe spaces where they can experiment with technologies and connect with others, and provide them with women role models and mentors. For example, Girls Who Code conducts intensive coding courses and many other programs for middle- and high-school girls.27
The CIOs we interviewed also emphasized that commitment to a diverse IT organization extended beyond gender to race, ethnicity, disability, and other protected statuses.
Build more inclusive IT cultures. Today’s CIOs are often expected to create IT organizations that are not only more diverse, but also more inclu-sive. In inclusive cultures, all employees are able to be authentic and thrive, regardless of gender, race, age, sexual orientation, disability, or other charac-teristics. In IT, this sometimes requires taming infa-mous “brogrammer” cultures, a task that can often be difficult because of resistance to change.
BUILD AN AUTHENTIC PERSONAL BRANDWell-known business executives reap many benefits from clearly defining and cultivating their personal brands through networking, social media, speaking engagements, and media opportunities. A strong personal brand is valuable because it can be used to drive change in IT and business cultures, open career doors, improve relationships with key business stakeholders, and inspire teams.
The CIOs we interviewed all emphasized the importance of building an authentic personal brand that conveys real values, beliefs, behaviors, and sense of purpose. “A big part of my brand is about diversity in STEM,” says Chima. “I speak and write about it because I believe in it and I’m passionate about it.”
“For me, brand building has to be natural,” says Nallapati. “It’s about doing the hard work, not being afraid to get your hands dirty, and being a real leader to your team and in your organization. The brand can be the icing on the cake, but it can’t be the only thing. You still need to deliver.”
CIOs can create more hospitable envi-ronments by establishing ground rules that support equality and having zero tolerance for rule-breakers. This requires IT and HR leaders to commit to taking bias or harass-ment complaints seriously and fairly investi-gating and mitigating them. They can also take steps to recognize and eliminate biases that limit women’s advancement opportunities.
Managers and leaders may need to be retrained to evaluate staff that communi-cate, collaborate, and work in different ways. Shivanandan remembers observing talent reviews where women and men were treated differently for how they express emotion. “Some of the women were getting coached for being too angry or emotional, while men known for the same traits were looked upon as strong leaders,” she says. “Showing emotion isn’t a sign of weakness—it’s a sign of passion and caring, and it can inspire people to want to work with you.”
Lagacy is proud of the steps that Caterpillar is taking at the corporate level to create a more inclu-sive culture. For example, a women’s leadership organization meets regularly to address opportu-nities for growing the pipeline of female leaders. The company has recently introduced a course to educate male leaders, promote a more gender-inclusive culture, and specifically discuss the actions and behaviors that disadvantage and disengage a minority population of the workforce. Caterpillar also instituted a flexible work environment that has received positive employee feedback. “It’s impor-tant as a woman leader to be a role model and send a message with your behavior,” Lagacy notes. “If I’m late to a meeting because of a school commitment, I’ll explain why. By role modeling the behavior, you’re letting others know that the company is really walking the talk.”
Chima agrees. “It has to be more than just lip service,” she says. “You have to talk to people and connect with them, but it has to be authentic. If a team has an MLK walk and their leader doesn’t show up, that sends African-American team members a message. Authentic leadership is the hardest thing
to do, but being an authentic leader is also the best thing you can be. People stay with a company when they feel connected, and they’ll leave if they see that that leaders are insincere.”
Fill the management and leadership pipe-line with high-performing women. A clear path for advancing and developing female talent can increase the opportunities for female representation in management, and eventually, in leadership.
According to one study, women are promoted based on performance; men are promoted based on potential.28 CIOs can alleviate this bias by proac-tively identifying potential high-performing women early in their careers. This favorable identification can help ensure employees with high potential have the resources needed to advance, such as a formal leadership development program that includes career road maps, learning and development plans, formal and informal mentoring and sponsorship opportunities, and if applicable, rotating assign-ments for global and/or functional experience.
Mentoring can be critical. “Throughout my career, I’ve had mentors that helped increase my confidence and developed me as an employee,” says Lagacy. “I’ve also personally mentored both males and females. I strive to create fulfilling mentoring relationships so I limit what I take on—I don’t want the relationship to turn into a checkbox activity.”
According to one study, women are
promoted based on performance; men
are promoted based on potential.
55Smashing ITʼs glass ceilingFEATURE54
www.deloittereview.com

Recent research indicates that women can benefit from both mentors, whose role is to listen and advise, and sponsors, who have direct manage-ment experience and are willing to advocate for development and growth.29 One study found that compared to women without sponsors, women in STEM careers who have sponsors are 37 percent more likely to ask for a raise, 22 percent more likely to be satisfied with their rate of promotion, 70 percent more likely to have their ideas endorsed,
119 percent more likely to have their ideas devel-oped, and 200 percent more likely to see their ideas implemented.30
Sponsors and mentors can help inspire, protect, and advance women technologists, giving them access to networks that many women lack. As more women rise to leadership levels, they can in turn serve the next generation as mentors and sponsors.•
KAVITHA PRABHAKAR is a principal with Deloitte Consulting and leads the Deloitte US CIO Program's Women in Tech initiative. She is based in Chicago.
KRISTI LAMAR is a managing director and experience leader for the Deloitte US CIO Program at Deloitte Consulting. She is based in Denver.
ANJALI SHAIKH is a senior manager leading the research and insights team for Deloitte Consulting's CIO Program. She is based in Costa Mesa, California.
CAROLINE BROWN is a senior writer with Deloitte. She is based in San Francisco.
The authors would like to acknowledge Fumbi Chima, Julie Lagacy, Suma Nallapati, and Monique Shivanandan. Their perspectives on female leadership and the role of the CIO were immensely insightful, and we are deeply appreciative of the time they spent sharing their experiences with us.
This article was made possible by the efforts of Elizabeth Moore, Keara O’Brien, Allen Qiu, and Jessica Sierra. We are indebted to Dana Kublin for her thoughtful and exquisite artwork and to Junko Kaji, Rithu Thomas, and Sonya Vasilieff.
Read more on www.deloitte.com/insights
Tackling gender bias in the workplace with design thinkingOrganizations have come a long way in preventing intentional discrimination against women. But how can they also neutralize implicit biases that can sabotage women’s advancement?
www.deloitte.com/insights/designing-equality
57Smashing ITʼs glass ceilingFEATURE56
www.deloittereview.com

5858
IT’S popular to declare a retail apocalypse is upon us. The narrative goes something like this: Shoppers, especially millennials, are
making more and more purchases online and that’s decimating traditional retailers, in turn forcing the closure of bricks-and-mortar stores. Yet it’s not quite that simple. Our research reveals a greater set of factors are driving consumer behavior and, looking behind the gloomy headlines, the so-called apocalypse may actually be a renaissance—if you’re the right kind of retailer.
We spent the better part of a year examining the U.S. retail environment: Studying official data; surveying more than 2,000 participants; and drawing on the knowledge of our clients, industry contacts, and our own industry specialists. We found that at the upper end of the spectrum, premium retailers—who seek to deliver value through premier or highly differentiated offerings—have seen revenue soar 81 percent during the past five years. Retailers at the other extreme—who deliver value by selling at the lowest-possible price—have enjoyed a steady 37 percent revenue increase during the same period (see figure).
IN BRIEF
www.deloittereview.com
59The great retail bifurcation 59
So who’s losing? Balanced retailers—those seeking to deliver value through a combination of price and promotion. Revenue among balanced retailers rose just 2 percent in the past five years,1 and they account for the majority of store closures and bankruptcies. In fact, price-based and premium retailers actually opened more stores between 2015 and 2017 than they closed.2 What’s more, consumers are more likely to recommend retailers at either end of the spectrum, suggesting they are more in tune with changing consumer needs.
What could be driving this bifurcation of the world’s biggest retail market? While the overall financial landscape appears healthy, supported by U.S. macroeconomic conditions and industry trends, it’s actually been a tough decade for 80 percent of American consumers. The bottom 40 percent measured by income has struggled to keep up with expenses, while the middle 40 percent has seen its income shrink.3 Income and net worth gains have disproportionately gone to the highest-income group. Mirroring this divergence, price-based retailers are meeting growing demand from shoppers with limited disposable income, while premium retailers cater to wealthier consumers.
These economic considerations also affect spending behavior across channels and categories. For example, we found low-income consumers are 44 percent more likely than their wealthier counterparts to shop at discount retailers, supermarkets, convenience stores, and department stores. High-income consumers, on the other hand, report they are 52 percent more likely to shop online.4 Of course, even with e-commerce growth expected to continue to outpace in-store sales, one factor traditional retailers need to remember is online shopping still represents just 9 percent of total U.S. retail sales.5 Not to downplay the challenges, but commanding 91 percent of the retail market hardly seems the stuff of apocalypse.•
Source: Deloitte analysis of various annual reports.
Dangerous middle ground for U.S. retailers
Five-year revenue growth One-year revenue growth
Data from 2015–2017 when available
Balanced-108
Premier109
Net store openings
Price-based263
Balanced+2%
Balanced-2%
Price-based+7%
Price-based+37%
Premier+8%
Premier+81%
To read more about the state of the world’s biggest retail market, read The great retail bifurcation on www.deloitte.com/insights.
www.deloittereview.com

60 FEATURE
www.deloittereview.com
61
THE transformative impact of technology on the modern workplace is plain to see. Face-to-face meetings have often given way to
video conferences, mailrooms to email inboxes, and typewriters and carbon paper to word processors. Technology has also allowed a substantial portion of work—and the workforce—to move beyond the confines of a traditional office.2 It is common for digitally connected professionals to perform some of their work in cafés or shops, at home, even lying by the pool while on “vacation.”
This technological revolution brings with it many obvious benefits. Colleagues can easily
by Connor Joyce, Jen Fisher, Jim Guszcza, and Susan K. Hogan
ILLUSTRATION BY JON KRAUSE
POSITIVE TECHNOLOGYDESIGNING WORK ENVIRONMENTS FOR DIGITAL WELL-BEING
Positive technology
A wealth of information creates a poverty of attention.
—Herbert Simon1
communicate across geographies, simultaneously reducing expenses, environmental damage, and bodily wear and tear. Open source software, search engines, and online shopping services enable us to summon in a few clicks the tools and information we need to be productive. Online maps, global posi-tioning systems, and real-time translation services help us navigate unfamiliar places and communi-cate with locals.
But there are downsides to our technology-infused lives. Of particular concern are the engaging—some fear addictive3—aspects of digital technologies, which can sap us of truly finite
www.deloittereview.com

The perils of workplace digital technology
Working long, stressful days was once regarded as a characteristic of the proletariat life. Yet today, being “always on” is instead often emblematic of high social status.5 Technology may have physically freed us from our desks, but it has also eliminated natural breaks which would ordinarily take place during the workday. And recent research suggests that this effect is not restricted to the workday. According to the American Psychological Association, 53 percent of Americans work over the weekend, 52 percent work outside designated work hours, and 54 percent work even when sick.6 Flextime, typically viewed as a benefit of technology providing greater freedom, actually leads to more work hours.7 Without tangible interventions, there’s little reason to think this behavior will change anytime soon.
These environmental factors and cultural norms are increasingly compounded by techno-logical design elements—some intentional, others not—that make technology use compulsive and habit-forming, taking on the characteristics of an addiction.
resources: our time and attention. While companies may benefit from tech-enabled increased produc-tivity in the short term, the blurring of the line between work and life follows a law of diminishing returns. As recent Deloitte research suggests, the value derived from the always-on employee can be undermined by such negative factors as increased cognitive load and diminished employee perfor-mance and well-being.4
In short, digital and mobile technologies give—but they also take away. It falls on talent and tech-nology leaders to weigh the efficiencies enabled by always-connected employees against increased demands on scarce time and attention, and longer-term harm to worker productivity, performance, and well-being. Getting the most from technology and people isn’t about simply demanding restraint. It’s about designing digital technologies that facili-tate the cultivation of healthy habits of technology use, not addictive behavior. And it’s possible for leaders of organizations to play an active role in designing workplaces that encourage the adoption of healthy technology habits.
UNINTENTIONAL VS. INTENTIONAL DESIGN It often seems that for technology designers, the main objective has been to maximize productivity and profitability, forgoing all other concerns.9 Yet ignoring the end user’s well-being means these products have become devoid of features to help mitigate the negative outcomes of technology. This has resulted in products being designed to capture some of the scarcest commodities we have: our time and attention.
Some of these design decisions occur unintentionally, a byproduct of an endless pursuit to create the most efficient product. Other designs are products of designers creating features to maximize the likelihood that employees will become hooked. Both unintentional and intentional design can result in a similar outcome: addicted users.
Fortunately, both can be overcome when more attention is paid to the problem, and interventions—both technological and environmental—are put in place. Even more heartening is our belief that as users become more educated and more accustomed to being less beholden to technology, they will willingly employ these countermeasures themselves to promote better usage and well-being.
In his recent book Irresistible, New York University marketing and psychology professor Adam Alter identifies a variety of factors that can contribute to digital addiction.8 In the context of the workplace, many of these factors—summarized in the following section—can enable employee tech-nology addiction.
METRIFICATION AND ALERTSDigital technologies can quantify previously
unquantifiable aspects of our lives, yielding fresh insight into how we spend our time. On a personal level, we can track our steps and count our likes, friends, and followers. At work, we are greeted each morning with dozens of unopened emails and reminders of sequences of meetings. During the day, workers are interrupted by continual streams of emails, texts, and instant messages.
Certainly, many such messages and notifications are necessary and helpful. But many others do little more than distract us from important tasks at hand, undermining productivity rather than enhancing it. In a widely cited study, cognitive scientist Gloria Mark and her colleagues state that people compen-sate for interruptions by working faster, but this comes at a two-fold price: The individual experi-ences more stress, frustration, and time pressure and effort.10 Concurrently, the organization often experiences not only decreased employee perfor-mance,11 but also, as elaborated in the next section, less optimal business decisions due to the lack of adequate time to sufficiently weigh pros and cons and consider and evaluate viable alternatives.
Specifically, constant streams of messages, prioritized in terms of importance, can create cognitive scarcity, resulting in a deterioration of the individual’s ability to adequately process infor-mation.12 Recent research has found that condi-tions of scarcity impose a kind of “cognitive tax” on individuals. For example, an experiment that involved focusing low-income persons’ attention on a scenario in which they urgently needed to raise several thousand dollars resulted in the equivalent
of a 13-point drop in IQ. (This is similar to the drop in IQ someone would experience after going a night without sleep.) Surprisingly, this phenomenon has similar effects on overloaded individuals who are scarce on a different dimension: time. This raises the concern that digital firehoses of poorly-filtered information can hamper our ability to pay attention, make good decisions, and stick to plans. And when we try to compensate for interruptions by working faster, we only get more frustrated and stressed.13
Another cognitive effect of too many alerts and too much unfiltered information is choice overload. Individuals experiencing choice overload often find it difficult to make decisions unless clear environ-mental cues or default options are established to help guide—nudge—their decision-making.14 Such cues and defaults are examples of what the authors of the 2008 book Nudge call choice architecture.15 Absent smart choice architecture, workers often come up with their own rules for prioritizing options and tasks. Such improvised heuristics can vary over time and across individuals, and be inconsistent with roles and performance goals.16
ZERO COST FOR INCLUSIONVirtual meetings offer organizations many advan-
tages, such as cost savings, knowledge transfer, and team culture-building.17 And employees can benefit from less travel and more telecommuting oppor-tunities. But the very ease with which people can be invited to and accept these meetings (especially many days in advance, when calendars are typi-cally more open) can translate into a disadvantage. Meeting organizers often choose to err on the side of inclusion, minimizing the risk of leaving someone out; and the average worker often chooses to attend it for fear of missing out on something important. The all-too-common net result is a day packed with back-to-back meetings, during which much is said, less retained, and even less achieved. This results in either less time to complete actual tasks at hand, or multitasking, which can diminish the quality of the meetings and the overall engagement.
62 FEATURE 63Positive technology
www.deloittereview.com

BOTTOMLESS BOWLS Technology design that removes natural stop-
ping points keeps the user in a state of productive inertia.18 This mindset often plays a productive role in our work life, enabling us to get into the groove and accomplishing task after task without the inef-ficacy of acting to continue. Although when we immerse ourselves in an inconsequential task, there can also be unproductive flows. Who hasn’t lost hours reading low-priority emails simply because they appear one after another? This is perhaps a workplace analog of the “bottomless design” imple-mented in social media feeds and online entertain-ment platforms to capture viewers’ attention. The natural default is to continue, not to stop.19
SMART SCREENS AND SLOT MACHINESWho can resist checking a buzzing mobile device?
It could be an email congratulating a promotion or a team message about a testing success. Or it could be spam. Yet we’re compelled to check, and technology designers know that—which is why, drawing from the work of psychologist B. F. Skinner, they know altering the timing between rewards for particular tasks is highly effective—and often addictive. This variability of rewards, which Skinner called the “variable-ratio schedule,”20 has been put to ample use in technology design, embodied particularly in the swipe-down-to-refresh design of many mobile applications. In this sense, our devices are meta-phorical slot machines, incentivizing us to continue coming back for the big payoff.21 To capitalize on this addictive quality of the element of surprise, many popular social media sites have changed their algorithms to no longer show feeds in chronological order. Instead, each refresh presents a new cura-tion of a tailored feed—incorporating both old and new—with no apparent rhyme or reason for the new ordering.22
Unhealthy use of workplace technology can do more than compromise productivity—it can impair workers’ physical and mental well-being. A few examples establish the point.
Poor sleep: Addiction to technology and the always-on work culture are contributing to a societal
dearth of sleep.23 The wakefulness that accompanies engaging in work means we’re less tired during the day, while exposure to blue screen light emitted by mobile devices simultaneously reduces the mela-tonin required for good sleep. This self-reinforcing loop makes the seven- to nine-hour sleep cycle, considered necessary to avoid a catalogue of nega-tive health outcomes, more difficult to maintain.24
Physical disconnection: Technology is having an even more profound negative effect on social well-being. While it can enable us to engage in relationships across distances and time zones, this sometimes comes at the expense of good old-fashioned face-to-face relationships.25 With devices always demanding our attention, family and friends are often neglected—altering our entire social struc-ture.26 And our connection to social media too can become strong enough to mimic the rewarding sensation caused by cocaine.27
Anxiety and depression: Information over-load is not only distracting, but potentially mentally damaging. We live with a finite amount of time and a limitless well of information and choices, often resulting in a phenomenon called FOMO—fear of missing out. With phones and computers constantly alerting us of all the opportunities avail-able, becoming double-booked is not infrequent and can lead to anxiety when the user needs to skip one meeting in favor of another. Viewing others’ social profiles can also affect our mood.28 We see sites filled with users only emphasizing the positives,29 showcasing glamorous vacation and social photos, or news of promotions and other triumphs. Perhaps it’s no wonder we can begin to question whether our lives pale by comparison.
What employers can doSkeptics of technology addiction often respond:
“Just put the phone down.” Yet willpower is not enough. Technology is designed to psychologically stimulate the reward centers of our brain to keep us coming back for more, mimicking the effects of a physical drug addiction.30 Rectifying this will ulti-mately require that developers and technologists
adopt the human-centered approach of designing technologies and work environments that help users overcome—rather than be overcome by—natural human limitations.31
Fortunately, the growing ubiquity of digital technology is matched by the growing promi-nence of the cognitive and behavioral sciences, accompanied by a burgeoning collection of prac-tical tools for prompting healthy behavior change. Especially significant is the emergence of the field of behavioral science, or when applied, behavioral “nudges.” This core insight finds that relatively modest evidence-based environmental tweaks can lead to outsized changes in behaviors and positive outcomes.32 (See the sidebar “Behavioral science and design application ethics.”) Take one example: placing less nutritious foods in a cafeteria out of direct sight or easy reach. Doing so doesn’t elimi-nate any options; individuals are still free to choose whatever they want. But the thoughtful placement prompts more nutritious choices and less “mind-less eating.”33 Analogous sorts of behavioral design can be applied to our technology-mediated work
environments when employers choose both better technologies that have been designed with user well-being in mind, and better workplace environ-ments, social norms, and expectations to positively influence how we use our devices.
Better technologyTRACK, ANALYZE, AND CHANGE USAGE PATTERNS
All of us are now effectively part of the Internet of Things: We leave behind “digital breadcrumbs” as we go about our digitally mediated lives.35 In partic-ular, this happens on the job: Email and calendar metadata are a rich, largely untapped data source, and it is now technologically feasible to collect “affective computing” data from cheap electronic devices that capture data about tone of voice, facial expression, and even how much we sweat during states of stress or excitement.
It is obviously crucial to avoid using such data in invasive, “Big Brother” ways.36 Still, it is worth-while to consider using such data to help individuals better understand and regulate their use of tech-nology.37 For instance, smart meters can display individuals’ application usage patterns, highlighting areas of concern. There is already software avail-able to monitor application usage and time spent on various websites; at the enterprise level, other solu-tions exist that can track the time that an employee spends on each application, creating reports that include comparisons to other employees. Such comparison metrics can help workers truly under-stand how their efforts compare to those of their colleagues, and, when delivered with the appropri-ately framed message, convey messages about work-hour social norms in an effort to guide decisions and also discourage “always-on behavior.” Such data could also be used to tailor peer comparison messages designed to nudge healthier technology use. Such social proof-based messaging has proven effective in applications ranging from curbing energy use to prompting more timely tax payments.38 For instance, an employee working more than 50 hours a week could be sent a notification informing her
BEHAVIORAL SCIENCE AND DESIGN APPLICATION ETHICS Behavioral science can be applied to nudge people to act in ways that are either consistent or inconsistent with their long-term best interests. Therefore, organizations considering nudge strategies should think through the ethical dimension of applied behavioral science. Choice architecture pioneers Richard Thaler and Cass Sunstein use the term “libertarian paternalism” to characterize the field. Ethical choice architecture is “libertarian” in the sense that it maintains freedom of choice, and at the same time “paternalistic” in the sense that it makes it easier for individuals to act in ways that are consistent with their long-term goals. Thaler comments that whenever he autographs a copy of Nudge, he writes “Nudge for good.”34
64 FEATURE 65Positive technology
www.deloittereview.com

that she has been working more than her coworkers, who average around 45 hours of work a week. This nudge could be enough to break her free from the perceived social norm that everyone works a 60-hour week or prompt her to begin a workload conversation with her manager.39
USE AI TO PROMOTE HEALTHIER BEHAVIOR
Artificial intelligence (AI) can also help us better mediate our interaction with technology, performing tedious “spadework,” to free us to focus on higher-level tasks. In particular, AI can be harnessed to help us manage our digital work envi-ronments. For example, some email systems now use AI to sort emails into categories, making urgent emails easier to locate and only pushing primary emails to a user’s phone.40 Google has also worked with behavioral economist Dan Ariely to build AI into its calendar application, which can automati-cally schedule “appointments” for performing tasks that are important but tend to get crowded out by concrete tasks that are urgent in the short term. “Email shows up and says, ‘Answer me,’” Ariely says. “Unfortunately, time for thinking does not do that.”41
At the next level, emerging examples include a chatbot that can help cut down technology-related negative behaviors. For instance, its software features a smart filter that can prevent certain applications, such as a social media feed, from refreshing.42 It is possible that AI products can be designed to ameliorate other forms of stress and anxiety on the job. Another AI-enabled chatbot, designed by a team of Stanford University psycholo-gists and computer scientists, can perform cognitive behavioral therapy (CBT). CBT is often employed as an intervention technique to help individuals identify the factors driving negative thoughts and behaviors and subsequently identify and encourage positive alternative behaviors.43 This technique was covered in recent Deloitte research,44 and has been found to be a solid intervention for improving emotional well-being.45
ENCOURAGE PRODUCTIVE FLOWSEmployers can build into their email and internal
systems mechanisms that incorporate stopping points into applications, nudging users to decide whether to continue an activity. Reminders have proven to be an effective nudge strategy in various contexts.46 Drawing from the consumer realm, some developers have begun to incorporate new nudging features. When a customer begins to excessively use another commonly scarce resource, data, many phones will notify the user that they are about to exceed their data limit. These alerts can nudge a user to break free from the flow of data usage and reassess their continued use. Transferring this concept to the work environment could, for instance, take the form of employers nudging employees to disconnect from emails while on vacation or outside of work hours.
Technology can likewise be used to maintain positive states of flow, and also as a commitment device to nudge us toward better behaviors.47 For example, the “Flowlight” is a kind of “traffic light” designed to signal to coworkers that a knowledge worker is currently “in the zone,” and should not be disturbed. The Flowlight is based on keyboard and mouse usage as well as the user’s instant message status.48 "Likewise, Thrive Global has a new app that, when you put it in “thrive” mode, responds to senders that you are thriving and will reply later.49
BETTER ENVIRONMENTSThe aforementioned ideas exemplify various
forms of human-centered design applied to work-place technologies. However, as also alluded to, human-centered design can also be applied to work environments. Indeed, nudging can be viewed as human-centered design applied to choice environ-ments.50 Providing information and establishing policies, restrictions, and guidelines are “classical economics”-inspired levers for effecting behav-ioral change. Smart defaults, commitment devices, social norms, and peer comparisons are examples of “soft touch” choice architecture tools that can be employed to design work environments that are conducive to more productive uses of technology (see figure).
vacation, notifying the sender that the message was not received.54 If this seems too radical, another option is offering a day-long vacation extension, allowing employees who have been off for multiple successive days to ease back into work by catching up on email and other non-collaborative tasks. Another simple bit of choice architecture can lighten the load of numerous back-to-back meetings: Setting the default meeting durations to 25 minutes rather than 30 automatically builds in rest periods.
COMMITMENT DEVICES AND SOCIAL SUPPORT
Research shows that if someone publicly commits to specific steps to achieve a goal, they are more likely to follow through.55 Commitment devices such as pledges are premised on this finding. For example, Johns Hopkins University has created a well-being pledge for its employees. Interested workers are offered a plethora of opportunities and strategies to help increase work/life fit over the course of 30 or 90 days. Once they sign up, they begin to make life changes with the support of their employer. So far, the organization has found this approach successful.56 In addition to the automatic-reply
TECHNOLOGY AND SOCIAL PRESSURE Employer policies and cultural norms can miti-
gate the always-on culture. For example, both poli-cies and organizational cultures can be tuned to discourage employees from communicating with each other via email outside of work hours. This can be complemented with technological default mech-anisms that make it logistically harder or impossible to send emails or set up meetings during off hours.
A less heavy-handed but potentially equally powerful persuasive technique is subtly employing the power of peer pressure via social proof. Social proof is premised on the social psychology finding that individuals often use the behavior of others to guide their own actions.51 Social proof has proven effective in a variety of settings ranging from encouraging people to reuse their hotel towels52 to getting them to pay their taxes on time.53 With this in mind, companies could inform employees that sending emails to colleagues during off hours is not the norm and not encouraged. Going one step further, one leading multinational auto corpora-tion uses a hybrid of technology-enabled processes and cultural norms, allowing employees the option of automatically deleting all emails received during
Potential environmental nudge strategiesto help break technology addiction
Design technology-enabled reminders to break ongoing continuous activity on digital tools such as email and social media.
Reminders
Social proof
Commitment devices
Communicate social norms regarding email and work habits during off-work hours—for example, that the majority of workers and leaders do not check email during certain times.
Encourage employees to take a “digital detox” or work/life balance pledge, committing to limiting their email use outside of work hours.
66 FEATURE 67Positive technology
www.deloittereview.com

DIGITAL DETOX: ACTIONS CONSUMERS CAN TAKE (AND EMPLOYERS CAN ENCOURAGE)
In need of a digital detox? Here’s a sample approach:
Monday: Unsubscribe from all unwanted emails; unfollow anyone you don’t know on social media. If you are feeling really ambitious, put your phone on grayscale to reduce its distracting attractiveness.
Tuesday: Move any mobile apps that you have not used in the past month into a folder to cut down clutter; turn off push notifications on social media.
Wednesday: Charge your device outside of your bedroom. Buy an alarm clock to replace your phone clock.
Thursday: Don’t look at your phone until you arrive at work. When you sit down for dinner, shut off your phone.
Friday: Eat all your meals in a room without a TV, phone, or computer for the day.
Saturday: Stay off social media for the entire day.
Sunday: Turn your phone off for eight consecutive hours (while you’re awake!). Take your smartwatch off your wrist.
devices we mentioned earlier, another activity that could incorporate a pre-commitment pledge is a “digital detox,” something Deloitte itself employs. This is a seven-day program that involves making small technology-related changes each day.
Regardless of the specific policy or choice archi-tecture intervention, the overarching aim is to rewire the workplace in ways that improve the employee-technology relationship. To be successful, there must be a push from the top down: It is one thing to create a new policy, but quite another for an organi-zation’s leaders to openly display their commitment to it, and communicate its resulting benefits.
A matter of habitImproving our relationship with technology—
both on the job and off—is less a matter of continual exercise of willpower than designing digital tech-nologies and environments to reflect the realities of
human psychology. Poorly (or perversely) designed technologies can hijack our attention and lead to technology addiction. But design can also facilitate the cultivation of healthy habits of technology use. Many of our automatic, repeated behaviors are cued by environmental factors.57 People who successfully cultivate positive habits do so less through continual exercises of willpower than by taking the time to redesign their environments in ways that make positive behaviors more effortless and automatic.
Metaphorically, it pays to reimagine and reshape our environments in ways that make healthy habits a downhill rather than an uphill climb. In the work-place, individual employees can play a role in cocre-ating positive technological environments. But, ultimately, leaders of organizations should play an active role in spearheading such design efforts and taking an evidence-based approach to learning what works, and continually improving on it.•
CONNOR JOYCE is a Human Capital Business Analyst, and a member of the Human Resource Transformation practice.
JEN FISHER is the national managing director for Well-Being at Deloitte.
JIM GUSZCZA is the US chief data scientist of Deloitte Consulting, and a member of Deloitte’s Advanced Analyt-ics and Modeling practice.
SUSAN K. HOGAN is a researcher with Deloitte’s Center for Integrated Research.
The authors would like to thank Jonathan Holdowsky, Junko Kaji, Ramani Moses, Brenna Sniderman, and Jon Krause for their contributions, and everyone who served along the way as a sounding board to increase employee well-being at work!
Learn more on www.deloitte.com/insights
Listen to the podcastAuthors Jennifer Fisher and Connor Joyce discuss why technology should enhance—not rule— our lives.
www.deloitte.com/insights/digital-wellbeing-podcast
68 FEATURE 69Positive technology
www.deloittereview.com
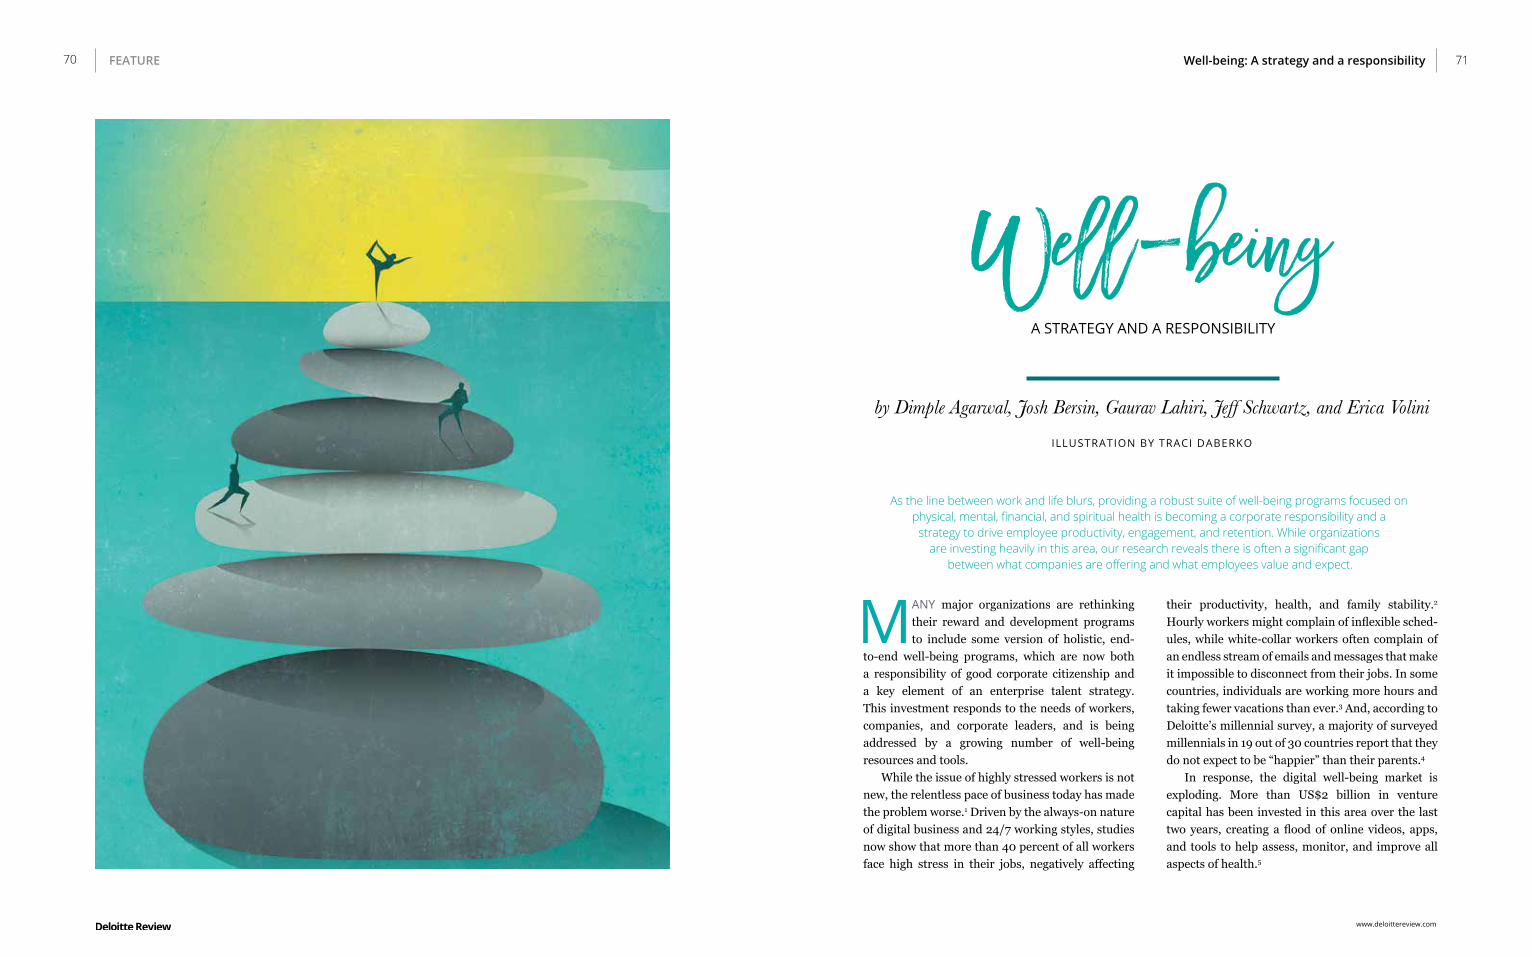
70 71
MANY major organizations are rethinking their reward and development programs to include some version of holistic, end-
to-end well-being programs, which are now both a responsibility of good corporate citizenship and a key element of an enterprise talent strategy. This investment responds to the needs of workers, companies, and corporate leaders, and is being addressed by a growing number of well-being resources and tools.
While the issue of highly stressed workers is not new, the relentless pace of business today has made the problem worse.1 Driven by the always-on nature of digital business and 24/7 working styles, studies now show that more than 40 percent of all workers face high stress in their jobs, negatively affecting
their productivity, health, and family stability.2 Hourly workers might complain of inflexible sched-ules, while white-collar workers often complain of an endless stream of emails and messages that make it impossible to disconnect from their jobs. In some countries, individuals are working more hours and taking fewer vacations than ever.3 And, according to Deloitte’s millennial survey, a majority of surveyed millennials in 19 out of 30 countries report that they do not expect to be “happier” than their parents.4
In response, the digital well-being market is exploding. More than US$2 billion in venture capital has been invested in this area over the last two years, creating a flood of online videos, apps, and tools to help assess, monitor, and improve all aspects of health.5
FEATURE Well-being: A strategy and a responsibility
As the line between work and life blurs, providing a robust suite of well-being programs focused on physical, mental, financial, and spiritual health is becoming a corporate responsibility and a
strategy to drive employee productivity, engagement, and retention. While organizations are investing heavily in this area, our research reveals there is often a significant gap
between what companies are offering and what employees value and expect.
by Dimple Agarwal, Josh Bersin, Gaurav Lahiri, Jeff Schwartz, and Erica Volini
ILLUSTRATION BY TRACI DABERKO
A STRATEGY AND A RESPONSIBILITY
www.deloittereview.com

Well-being emerges as a strategic priority
The corporate wellness marketplace began decades ago with a highly specific focus on employee physical health and safety. Today, however, the definition of wellness has expanded dramatically to include a range of programs aimed at not only protecting employee health, but actively boosting performance as well as social and emotional well-being. These now include innovative programs and tools for financial wellness, mental health, healthy diet and exercise, mindfulness, sleep, and stress
management, as well as changes to culture and lead-ership behaviors to support these efforts.
Propelled by these innovations, the corporate wellness market—including health care programs, screening, assessment, education, and apps—has reached nearly US$8 billion in the United States alone, where it is expected to hit US$11.3 billion by 2021.6 And as the market has grown, so has lead-ership’s understanding of the critical role these programs play in defining an organization. For example, two-thirds of organizations now state that well-being programs are a critical part of their employment brand and culture.7
FIGURE 1 | Well-being: What employees value versuswhat employers offer
Source: Deloitte Global Human Capital Trends survey of more than 11,000 executives, 2018.
Highly valuable or valuable Offering program
59%
Flexible schedule
Telecommuting
Designated officespace for wellness
Reimbursement forwell-being expenses
Healthy snacks
Employeeassistance program
Mental healthcounseling
Wellness counseling
Health monitoring orcessation programs
Back-up daycare
86%
60%
21%
24%
50%
35%
70%
26%
63%
67%
60%
27%
30%63%
67%
27%
53%8%
32%
Yet despite increased corporate attention and investment in well-being, our research indicates that companies must do a better job connecting well-being programs with employee expectations. As figure 1 illustrates, substantial gaps remain in many areas between what employees value and what companies offer to their employees.
It is our view that expanding well-being programs to encompass what employees want and value is now essential for organizations to treat their people responsibly—as well as to boost their social capital and project an attractive employment brand.
Research has found that student loan support is one of the most highly regarded well-being benefits, as are volunteerism and opportunities for local citi-zenship.8 Salesforce, for example, prides itself on giving employees seven days of “volunteer time off” each year to help them feel purpose at work.9
Well-being plays a crucial role in multinational food company Danone’s overall business strategy, which is based on the two pillars of economic and social growth. The company’s Dan’Cares program provides medical coverage for most significant health-related risks, and the company has imple-mented a global parental leave policy. The aim is not only to support worker well-being, but to position Danone employees as health ambassadors.10
Lendlease, a multinational construction, prop-erty, and infrastructure company, focuses not only on using the physical workplace to support well-being, but also on developing policies and leadership approaches that embed well-being into its culture. The company’s work environment features “neigh-borhood” tables, working walls, focus points for activities that require concentration, and enclosed pods and breakaway areas that foster collaboration and social interaction.11 Lendlease’s Wellness Hub, a preventative care facility that occupies two floors of its corporate headquarters, offers employees the use of dedicated rooms—the “Consultation Room,” the “Contemplation Room,” the “Carer’s Room,” and the “First Aid Room”—as well as adjoining areas for physical activity and training.12 A highlight of the Wellness Hub is a six-meter-high breathing wall, which contains about 5,000 plants that
accelerate the removal of air pollutants and cool the surrounding space—while also improving energy efficiency and reducing air conditioning costs. The company’s leave policy includes two days during which employees can volunteer their time to a charity of personal interest. Across its international regions, Lendlease continuously rolls out well-being initiatives, including three annual well-being days and extensive health initiatives around diet and exercise that incorporate inclusive and supportive health assessment approaches.13
Well-being benefits are particularly important to younger employees. Millennials, who now make up more than one-half of the workforce in many countries, spend almost twice as much on self-care as baby boomers do.14 This has fed the growth of consumer apps for mindfulness, cognitive-behav-ioral therapy, and online personal and profes-sional coaching,15 all of which are also available as employer programs.
Advancing from health to well-being to performance
As the definition of well-being expands, organi-zations now see well-being not just as an employee benefit or responsibility, but as a business perfor-mance strategy. In this year’s Global Human Capital Trends survey, only 23 percent of respondents told us that their well-being program was designed to reduce insurance costs. In contrast, 43 percent believed that well-being reinforces their organiza-tion’s mission and vision, 60 percent reported that it improves employee retention, and 61 percent said that it improves employee productivity and bottom-line business results.
There is growing evidence to support the idea that well-being drives performance. Research shows that the costs of lost productivity are 2.3 times higher than medical and pharmacy costs.16 Complicating the range of potential employer responses, these costs often occur when an employee is actually at work. A study at Dow Chemical Company found that “presen-teeism” costs reached an average of US$6,721 per employee per year.17 No wonder, then, that the focus
72 73FEATURE Well-being: A strategy and a responsibility
www.deloittereview.com

on well-being now extends to helping employees perform well at work, not just avoid absences.
New solutions, indexes, and toolsDriven by intense demand and an influx of
venture capital, many new well-being solutions have entered the market, allowing employers to deliver a wide range of employee well-being solu-tions through integrated apps.18
VirginPulse, for example, offers an employee app that is used as frequently as Facebook and whose active users are 65 percent more engaged, have 32 percent lower turnover rates, and deliver 9 percent higher productivity than their peers.19 Deloitte has developed its own “Vitality” app to help their profes-sionals better manage their energy, and now offers a well-being index. Other vendors are developing similar indexes to help organizations benchmark their well-being programs.
CEOs and CHROs are getting the message. Just as productivity, citizenship, and inclusion have risen in importance, so has the importance of well-being moved up on the agenda. Aetna CEO Mark Bertolini summarizes the importance and impact of well-being programs: “If people can’t make ends meet at home with food, benefits, health, and health care in particular, how can they be present, engaged knowledge workers when they come to work?”20
The bottom line? Well-being is becoming a core responsibility of good corporate citizenship and a critical performance strategy to drive employee engagement, organizational energy, and produc-tivity. It is also a growing expectation among the talent companies most want to recruit, access, and retain. No longer an optional or narrowly focused element of the rewards menu, well-being is now front and center as a business imperative for leading, high-performance companies.•
TABLE 1 | What role does the C-suite play in promoting well-being?How can individuals adjust?
CHROWell-being is a personal matter, so it needs to evolve as individuals’ needs evolve. Invest in ways to take a constant pulse of employee’s needs, even looking at ways to leverage predictive analytics to stay ahead of trends in this space.
CIO
The cornerstone of a sustainable well-being strategy is the integration of
a multitude of disparate apps that may provide bells and whistles, but defeat the purpose of an integrated platform that can increase the value of well-being investments.
CFOThe link between well-being and productivity is clear. Work with others on
investment in well-being programs that can improve the bottom line.
Consider ways to manage the increased focus on personal data and the associated risks. With more technologies and applications in use around well-being today, getting involved early can help to put the appropriate controls in place to guard against future adverse impacts.
Chief marketing Position well-being programs as critical components of your employer brand and rewards strategy, and as integral to your organization’s performance and productivity strategy.
IndividualsLook for and take advantage of well-being programs available through your employer, and consider these programs when making employment decisions—to join, stay, or leave.
Source: Deloitte analysis.
CHROWell-being is a personal matter, so it needs to evolve as individuals’ needs evolve. Invest in ways to take a constant pulse of employee’s needs, even looking at ways to leverage predictive analytics to stay ahead of trends in this space.
CIO
The cornerstone of a sustainable well-being strategy is the integration of technology to promote, track, and manage well-being programs. Avoid offering a multitude of disparate apps that may provide bells and whistles, but defeat the purpose of an integrated platform that can increase the value of well-being investments.
CFOThe link between well-being and productivity is clear. Work with others on the executive team to quantify the financial costs and benefits of continued investment in well-being programs that can improve the bottom line.
Chief risk officer
Consider ways to manage the increased focus on personal data and the associated risks. With more technologies and applications in use around well-being today, getting involved early can help put the appropriate controls in place to guard against future adverse impacts.
Chief marketing officer
Position well-being programs as critical components of your employer brand and rewards strategy, and as integral to your organization’s performance and productivity strategy.
Individuals Look for and take advantage of well-being programs available through your employer, and consider these programs when making employment decisions—to join, stay, or leave.
DIMPLE AGARWAL is the global leader of Organization Transformation and Talent for Deloitte’s Human Capi-tal practice. She is based in London.
JOSH BERSIN, a principal with Deloitte Consulting, leads Bersin & Associates, now Bersin, Deloitte Consulting. He is based in Oakland, California.
GAURAV LAHIRI, of Deloitte India, leads Deloitte India’s Human Capital consulting practice. He is based in Delhi.
JEFF SCHWARTZ, a principal with Deloitte Consulting, is Deloitte’s global leader for Human Capital Marketing, Eminence, and Brand. He is based in New York City.
ERICA VOLINI, a principal with Deloitte Consulting, is the U.S. Human Capital practice leader. She is based in New York City.
Read more on www.deloitte.com/insights
2018 Global Human Capital Trends: The rise of the social enterpriseOrganizations today are judged for more than their success as a business. They’re now being held responsible for their impact on society at large. Explore 10 trends for 2018.
www.deloitte.com/insights/human-capital-trends
74 75FEATURE Well-being: A strategy and a responsibility
www.deloittereview.com

Direction—in the form of an aspiring vision and purpose for an organization that drives employees to commit their talents and energy to a common objective—can be critical for companies in the digital age. As the pace of change accelerates, a clearly articulated vision and purpose can serve as a compass to guide employees as they work, espe-cially in distributed environments where employees have greater autonomy to make decisions.
The need to spearhead innovation may account for the development of distributed, less hierarchical organizational structures. Our research indicates these structures are thought to encourage collabo-ration and experimentation, which can enable an organization to adopt the collaborative and risk-embracing culture and mindset that mark a digital environment.
Finally, empowering employees to execute often means creating a culture where taking risks is supported and people feel empowered to make decisions. In a distributed workplace structure, employees may find themselves in new positions,
Three keys to leading amid
NEW and evolving digital technologies continue to disrupt organizations of all sizes across all industries, fundamentally altering how many companies operate. It’s also changing the nature of the modern workplace. When our MIT Sloan Management Review and Deloitte Digital study asked more than
3,300 respondents to describe what’s different about working in a digital environment compared with a tradi-tional one, three differences accounted for nearly 60 percent of all replies: the pace of change; a flexible, distributed workplace; and culture.
None of these differences are technical in nature. They instead point to the way digitization is changing the very nature of work—which in turn can require new ways of leading. So just how should executives respond? Our study revealed three critical actions they can adopt to help employees excel: providing direction, enabling innovation, and facilitating execution.
Three keys to leading amid digital disruption 7777
Read the full survey by MIT Sloan Management Review and Deloitte, Coming of age digitally, at www.deloitte.com/insights.
having to make business decisions that may have been traditionally passed up a hierarchy (for example, a retail associate may no longer have to consult a manager before deciding to take back a worn but damaged garment). More than one-half of digitally maturing companies in our survey said they are increasingly pushing decision-making authority to lower levels of their organizations, empowering employees to generate creative solutions on behalf of their organization.
Of course, this doesn’t diminish the importance of leadership traits critical in traditional hierarchical business environments, such as making decisions based on sound judgment and building an effective talent pool. But the traits of effective leaders can take on a new level of meaning in a digital world where speed and agility are critical, and execution depends on your talent’s ability to think more creatively, work more collaboratively, make decisions, and take risks. Often, effective digital leaders understand this new environment and create the conditions that will help let their employees shine.•
7676 IN BRIEF
www.deloittereview.com
How digitization is changing the workplace ...
What is the biggest difference between working in a digital business environment and a traditional one? (top 3 responses)
Increased pace of business 23%
Flexible, distributed workplace structure 18%
Culture and mindset 18%
... and how leaders should respond
What would you like your leaders to have more of to navigate digital trends? (top 3 responses)
Direction: Providing vision and purpose 26%
Innovation: Creating the conditions for people to experiment
18%
Execution: Empowering people to think differently 13%

www.deloittereview.com
Article title Article title78 79FEATURE78
IS IT THE NEXT BIG THING OR MERELY A SHINY NEW OBJECT?
by John Lucker, Susan K. Hogan, and Brenna Sniderman
ILLUSTRATION BY LIVIA CIVES
by the hype
Fooled by the hype 79
www.deloittereview.com

80 FEATURE80
EVERYONE’S continually looking for “the next big thing,” whether it’s technology,1 a manage-ment method,2 or the latest human-resources
approach.3 And in a “now economy” that seems ever-accelerating, businesses feel pressured to meet rapidly changing customer demands, rein-vent or evolve themselves more frequently, and beat competitors to the punch by being the first to provide faster, better, and shinier solutions.
While innovations are hugely beneficial to busi-ness and society, hype often goes along with the territory. In their quest to reap the benefits of the next big thing, individuals can find themselves led astray by the publicity or buzz surrounding a new product, service, or idea. They may focus too heavily on the hype surrounding an innovation, as opposed to whether the innovation can actually help solve their problem or meet a business need they are dealing with.4
This is understandable—and perfectly human. But understanding behavioral factors, such as hype, is critical to avoid making the wrong strategic deci-sions about innovations. Doing so requires moving beyond the headlines to understand and evaluate an innovation’s potential longevity and extent of
adoption, balancing this information with an orga-nization’s tolerance for risk. Armed with this infor-mation, leaders can then decide not only whether to embrace an innovation, but how and when they can successfully introduce it into their organiza-tion. Having a more nuanced understanding of the factors involved can enable them to mitigate hype and manage expectations for what business prob-lems it may (and may not) help to address.
Of course, it’s not easy to avoid being influ-enced by hype surrounding what could be the next big thing, or whatever is being forced on decision-makers internally and/or externally. Yet taking a methodical approach to assessing innovations is essential to differentiating between what’s real and what’s not.
Hype and inflated expectationsHype is generally defined as “publicity; espe-
cially, promotional publicity of an extravagant or contrived kind.”5 While people often think of it as negative, attention and discussion about new concepts or ideas can be useful and generate value: It can help developers better improve their new
It’s easy to be seduced by hype, buzz, and shiny new objects. Yet rather than focusing on each innovation, decision-makers should better and more frequently focus on the problem at hand.
www.deloittereview.com
81Fooled by the hype 81
concepts6 and refine innovations as they develop. However, publicity surrounding innovations can be overinflated in terms of the benefits derived, the speed with which they will replace existing prod-ucts, and the ways they might change our lives.7 This process of overpromising and underdelivering is so well-known that Gartner created a frame- work more than 20 years ago to describe it, illus-trating how early hype gives way to more modest expectations and actual delivery of new technolo-gies (figure 1).8
A number of factors drive the prevalence of hype, or overpromising what an innovation can do. First is the sheer enthusiasm and optimism on the part of developers and stakeholders for the unproven but possibly abstract potential of an innovation. Optimism and overconfidence are common personality traits among entrepreneurs9 and early adopters. Yet while it may be tempting to blame the creators or messengers of hype for often unrealistic expectations, society is also at fault.
We tend to encourage, applaud, and even seek out the opinion of people who confidently predict the future, despite understanding (and often forgiving) inherent inaccuracies and embellishments in many prognostications.10
Second, hype remains a time-tested method for getting more people on a bandwagon. It facili-tates the likelihood and speed of adoption for a new product, service, or offering,11 which is why firms developing innovations seek to increase communi-cability, buzz, and observability.
Third, excessive publicity may be encouraged by those who have already made emotional or monetary investments in a concept. That’s because investing such energy helps people deal with the cognitive dissonance, or psychological discomfort, they may have about their decision to embrace an unproven shiny new object.12 It can also spur excite-ment about innovation in general, making people more receptive to new ideas, perhaps even encour-aging others to try new things.
Source: Gartner, “Research methodologies,” accessed May 17, 2018.
FIGURE 1 | Gartner’s hype cycle
Innovation trigger
Peak of inflated
expectationsTrough of
disillusionmentSlope of
enlightenmentPlateau of
productivityExpe
ctat
ions
Time
www.deloittereview.com

EXPLAINING HYPE’S BEGUILING SIREN SOUND
There are several reasons why overpromising on a new product or idea can help gain public support, acceptance, and enthusiasm. For starters, hype can effectively play into our fascination with new for the sake of newness—the tendency for individuals to be distracted by or attracted to new ideas, people, or things simply because they haven’t seen them before.13 This fascination can be driven by many factors, including the promise of a better solution, disenchantment with what’s currently in place, the excitement of being the first to adopt a new tech-nology, or a desire to put one’s own mark on a business.
Hype also has the capacity to trigger several decision-making biases, many of which are summa-rized in figure 2. These biases can lead to indi-viduals embracing an innovation too quickly or to a greater extent than they might otherwise have done. For example, by emphasizing limited avail-ability, organizations can create a perception of scarcity. This encourages greater perceived value for products and a greater sense of purchasing urgency among consumers. This desire to be among the first to possess the new product can motivate customers to preorder large volumes of products
or line up outside stores overnight.14 Ever noticed how these queues—say, for the latest smartphone or gaming system—are heavily publicized? It capital-izes on the behavioral economics concept of social proof: a tendency for people to look to the actions of others—ideally similar or “desirable” groups—to guide their own behavior.15
Beyond using scarcity to create a sense of urgency, hype can also unduly influence others to embrace an innovation before it has reached matu-rity. This is due to leveraging the concept of loss aversion: the notion that, when making decisions, people are typically more concerned with reducing downsides than deriving potential upsides.16 Being moved to action to avoid losing out is by no means limited to marketing ploys or consumer decision-making. Indeed, business clients can feel pressure and a sense of urgency to embrace a new technology or business process, driven not so much by the desire to capitalize on the innovation’s upside potential, but more out of fear of missing an opportunity or being perceived as a laggard. While embracing this new technology may turn out to be the right choice in the long run, the initial decision may be driven by a fear of missing out rather than a well-thought-out evaluation of the benefits and relevant criteria surrounding the technology.
FIGURE 2 | How hype strategies play to our cognitive biases
Placing greater value on limited quantity items
Hype strategy: Emphasize limited or uncertain
availability
Scarcity bias Social proof bias Loss aversion bias
The tendency to let the behaviors and influence of others guide our decisions
Hype strategy: Highlight who is or has already adopted
the innovation
Greater concern for downside vs. upside
potential
Hype strategy: Emphasize downsides of missing out
while potentially neglecting to evaluate the risks
www.deloittereview.com
AVOIDING HYPE’S PERILSWhile hype often focuses on what one may lose
by waiting too long to embrace the innovation, decision-makers would be wise to keep in mind the adverse consequences that may arise by putting too much stock in hype messaging. Some of the down-sides include the risk of consumer dissatisfaction due to unmet expectations. If a hyped innovation does not perform as anticipated, it can leave early adopters in what Gartner’s hype cycle refers to as the “trough of disillusionment.” This is consistent with the expectancy disconfirmation theory,17 which suggests that satisfaction with an object is subjec-tive—driven by expectations—rather than objec-tive. Even if a new technology has some benefit or marginal advantage relative to existing solutions, if expectations are too high, there may be less satis-faction with the product. Additionally, timeframes of expectation may play into satisfaction. Even if the benefits of a new technology do eventually live up to the promised hype, a truly innovative offering may be deemed a failure simply because it took longer than expected to bear fruit.
Hype can also lead individuals to become disen-chanted with an innovation due to over-inflated and often unrealistic expectations regarding its scope of applicability. For instance, additive manufacturing technology has, over time, shown to be disruptive to many business applications, having a positive effect on product development, design, and supply
chains.18 Yet the predictions of many experts of a “3D printer in every household” have been premature.
Another adverse consequence of being unduly influenced by hype extends beyond the product itself. Leaders who continually embrace overly hyped innovations can leave employees expe-riencing shiny new object “fatigue” in the form of decreased morale, and increased confusion and cynicism—particularly when they’ve had to either abandon tried-and-true methods or jettison recently adopted processes that haven’t been given a chance to realize their potential.19
Moving beyond the hypeSeveral criteria influence the likelihood a new
offering will transcend hype to diffuse through a desired target market, the speed at which this acceptance or adoption will occur, and whether the innovation will prove lasting or merely a passing trend. Combined, these criteria can help leaders make more informed decisions about what’s here to stay, and what may not live up to its promise.
FACTORS DETERMINING THE SPEED AND EXTENT OF ADOPTION
Drawing heavily on research into the diffusion process, recent findings, and market observations, here are some considerations to keep in mind with regard to whether an innovation will be adopted—and how quickly.
Leaders who continually embrace overly hyped innovations can leave employees experiencing shiny new object “fatigue”: Decreased morale, increased confusion, and cynicism.
82 FEATURE82 83Fooled by the hype 83
www.deloittereview.com

the only risks decision-makers are concerned about. Rather, perceived risks come in many forms, such as financial, social, psychological, obsolescence, and performance, to name a few.31 Thus, it is critical to consider multiple facets of “risk”—in whatever form that risk may take—when positioning an innovation for adoption and to avoid the hype moniker.
FACTORS DETERMINING AN INNOVATION’S LONGEVITY
Even if an innovation is adopted, a critical ques-tion is its likely longevity. Will it be a passing fad? Or something more significant? In addition to the criteria mentioned in the section above, below are other considerations that have been identified as criteria or indicators to help gauge the potential longevity of an innovation.32
Personalization or customization. One size rarely fits all. It can, therefore, be helpful to incorporate the flexibility of customization or cocre-ation where possible to help users turn “hype” into something truly valuable for them; for example, providers of mobile-phone hardware and software allow users to do everything from choosing the color of devices to adding accessories and customizing screen wallpaper, layout, ringtones, and hundreds of other options. In the case of additive manufac-turing, medical devices can be customized to an individual’s unique measurements and needs; 3D printed hearing aids, artificial joints, and orthodon-tics are just three examples.
Compatibility and complexity. How com-patible is an innovation with potential users’ existing routines, norms and habits, and other trends simultaneously occurring in the environ-ment? How will it work with existing assets or infra-structures? And just how complex is it? An innova-tion doesn’t need to reinvent the wheel. Those likely to be adopted quickly are both easy to understand and simple to use. They enhance an existing prac-
tice rather than reinvent it; consumers don’t have to think too hard about using it, and it doesn’t require dramatic changes in behavior. If these criteria aren’t met, an innovation is less likely to be adopted. For example, non-refrigerated milk products have not thrived—even though they provide a tangible benefit to customers. Adopting them requires not only accepting the idea of milk being less perish-able, but also storing it in a pantry rather than the refrigerator. This can help explain why companies regularly introduce “new” products under existing brand names. For example, P&G includes name extensions to follow-on products in its Swiffer line so consumers know exactly how to categorize the product and, with that, which specific cleaning products these household innovations should be replacing.20
Relative advantage. History shows indi-viduals are willing to make behavior changes, but it may take more time when that change is signifi-cant. Critical factors that affect whether we’re willing to change include the amount or degree of benefit, the fear of negative change impact, and the perceived overall risks of change—all considered to help ensure the relative advantage of changing behavior is worth the extra effort. This can be as
straightforward as taking an existing product and making it less expensive, simpler, faster, or more convenient.21 But what if the degree of rela-tive advantage is limited? While the Internet of Things (IoT) has been accepted in many contexts, in one area its success has been rela-tively limited: kitchen appli-ances. While smart refrig-erators can provide some benefit, both consumer feed-back and limited sales of IoT refrigerators suggest their marginal additional value is not enough to drive house-
holds to adopt this new, slightly improved, more expensive item.22 On the other hand, the Amazon Dash Button allowing consumers to reorder goods simply by touching a physical button has been effec-tive. Each button costs less than five dollars, repre-senting a relatively low investment.23
Observability and communicability. Innovations that are easily observed are likely to spread faster, since this exposure provides more opportunities to learn about it.24 For new prod-ucts that are less observable by nature, the chal-lenge for developers and marketers is to make them either more visible or part of conversations. This can be particularly challenging for components of products (such as ingredient brands) or interme-diary services, where greater awareness can come through efforts such as educational advertising or
An innovation doesn't need to reinvent the wheel. Those likely to be adopted quickly are both easy to understand and simple to use.
www.deloittereview.com
Hype tells us something, but it doesn't tell us
everything.
co-branding. German chemical company BASF has been effective in making people aware of its ingre-dient brand through it’s “we don't make a lot of the products you buy, we make a lot of the products you buy better” campaign.25 Similarly, Intel has also raised brand awareness for its processors through the “Intel Inside” campaign.26
Trialability and perceived risk. As anyone who’s taken a car for a test drive or enjoyed a free weekend in a timeshare property can attest, prod-ucts that provide an opportunity for trial are more likely to be accepted or purchased. The same applies for innovations. When evaluating a potential “next big thing,” consider whether opportunity exists for sampling the technology, without making a full commitment. This can help encourage adop-tion. Many innovators understand this desire to try before you buy, and often provide trial or beta versions to existing or desirable target customers before fully investing or incorporating the inno-vation. Indeed, much of the success of eyewear manufacturer Warby Parker could be due to its home try-on program, which allows consumers to select five pairs to receive via mail and return free of charge, thereby inducing both trialability and reducing perceived risks.27
Perceived risks. The ability to trial an inno-vation reduces the unknown or potential risks that might arise from full adoption. As previously mentioned, loss aversion tells us that while individ-uals care about the potential upside of their actions, the potential downside of making the wrong deci-sion weights much more heavily.28 That’s why the likelihood and speed of adoption of innovations can be hampered by concerns over possible downsides. Theoretically, self-driving (autonomous) vehicles could be safer, more efficient, and ultimately less expensive than traditional vehicles. Yet recent acci-dents or other risks can cloud that perception.29 Even if the percentage of accidents involving auton-omous vehicles is a fraction of regular cars, their perceived risk seems likely to be a major factor in whether consumers will adopt the technology.30 Worth noting is the fact that physical risks are not
84 FEATURE84 85Fooled by the hype 85
www.deloittereview.com

Subcultures currently embracing inno-vation. Another factor for evaluating whether an innovation is a flash-in-the-pan are the subcultures embracing the innovation. Factors to consider are the sheer size of the subculture; its importance or marketplace, sector, or industry dominance; its growth trend; and its connection with mainstream society (that is, fringe vs. core players). For instance, recent Deloitte research has noted firms in non-G7 countries appear to be quicker to embrace emerging technologies in the finance sector relative to their counterparts in G7 countries.33 It may be worth digging deeper to explore the size, growth trends, and interconnectivity of these early adopters to help predict the potential staying power of these various emerging technologies. For example, the embrace of IoT in the industrial sector demonstrates the significant value of the technology in improving business processes. Similarly, it is important to note
that in some cases, what seems like hype can actu-ally simply be the wrong audience. For example, augmented reality glasses were met with resistance in consumer settings, but have found success in industrial settings where they are increasingly being used for maintenance, training, and other areas, driving real value.
Guidelines for making better decisions
Hype tells us something, but it doesn’t tell us everything. It should be merely one factor in a more comprehensive decision-making process for whether, when, and how (for example, to what degree) to embrace an innovation. Below is not only a summary of the other factors to consider, but also other considerations leaders should keep in mind when being enticed by a shiny new object.
1. USE AN INNOVATION SCORECARDFigure 3 provides some guidelines to keep in
mind as you consider what may—or may not be—the next big thing. Leaders can use their own judgment when considering how potential next big things compare against current solutions and past innova-tions that were, or were not, embraced.
2. KNOW THYSELF—AND YOUR TOLERANCE FOR RISK
Besides weighing the characteristics of poten-tial next big things, decision-makers can turn their gaze inward to objectively determine just how well an innovation fits with their organization’s mission, vision, culture, and structure. In terms of culture, one way that companies vary is with regard to toler-ance for risk.35 When weighing potential benefits against possible risks, decision-makers should look beyond their own risk tolerance and take into consideration that of their firm as well as other stakeholders.
FOCUSING ON UNDERLYING PHENOMENON VS. A SIDE EFFECT
One potential challenge for decision-makers evaluating an innovation is to identify and assess the actual trend occurring rather than a side effect. Sometimes it’s the overly hyped or easy to understand side effect that gets initial attention, rather than the actual phenomenon (a recent example in the consumer realm is the interest in Pokémon Go as opposed to a broader interest in augmented reality).34 Similarly, in the business realm, many are treating bitcoin as an innovation when, in reality, bitcoin is a component of the bigger cryptocurrency and blockchain phenomenon. That means effectively evaluating the likelihood of bitcoin being successful requires looking at the advantages and other factors surrounding cryptocurrencies.
DESIRABLE ADOPTION (DIFFUSION) CHARACTERISTICS
Compatibility (routines, lifestyle, infrastructure, trends)
Complexity: Cognitive effort and behavior or change required
Trialability
Observability/communicability
Relative advantage
Potential risks
LONGEVITY CONSIDERATIONS
Flexibility, “personalization,” customization
Subcultures currently embracing innovation
ADDITIONAL CONSIDERATION
Side effect vs. the main underlying phenomenon
ExcellentOKPoor
FIGURE 3 | The innovation scorecard
86 FEATURE86 87Fooled by the hype 87
www.deloittereview.com

JOHN LUCKER is an advisory principal with Deloitte & Touche LLP, Global Advanced Analytics Market Leader, and a U.S. leader of Deloitte Analytics. He is based in Hartford, Connecticut.
SUSAN K. HOGAN is a researcher with Deloitte’s Center for Integrated Research. She is based in Atlanta.
BRENNA SNIDERMAN is a senior manager at Deloitte’s Center for Integrated Research. She is based in Philadelphia.
The authors would like to thank Duleesha Kulasooriya for his insights and for challenging our initial hypotheses, and Swati Garg and Negina Rood for their contributions to the article.
3. DEFINE SUCCESS AND MANAGE EXPECTATIONS
At the same time, leaders must understand how their stakeholders define success, and what their expectations are for innovations. Where clear expectations and measures of success do not exist, decision-makers can instead articulate and manage constituents’ expectations.
4. TAKE YOUR TIMERarely is it the case that he who hesitates is lost.
Rather, many companies in established sectors, such as financial services, are becoming more and more wary of hype surrounding emerging technolo-gies, and more concerned with how these technolo-gies will impact existing operating models and back-office operations.36 Before blindly jumping on an innovation bandwagon, for example, many leaders
can create opportunities for trial and experimen-tation within particular groups or pockets of the organization.37
It’s easy to be seduced by hype, buzz, and shiny new objects. Yet rather than focusing on each inno-vation, decision-makers should better and more frequently focus on the problem at hand. When things don’t work out, don’t blame what’s new—consider revisiting your processes in terms of strategy, decision-making, business and technology implementation and integration, change manage-ment, and how you are measuring and refining your indicators of success. Because when all is said and done, innovations don’t create hype: It is people who tend to inflate expectations, overpromise results, and confuse hype with the real potential progress has to offer.•
Read more on www.deloitte.com/insights
Nothing for moneyCan you pay people to innovate? Dangling financial rewards in front of workers to advance new strategies, products, services, and processes, can actually prove counterproductive. Behavioral research points to ways to effectively kindle employees’ motivation to innovate.
www.deloitte.com/insights/nothing-for-money
Because when all is said and done, innovations don’t create hype: It is people who tend to inflate expectations, overpromise results, and confuse hype with the real potential progress has to offer.
88 FEATURE88 89Fooled by the hype 89
www.deloittereview.com

Why business model compatibility matters
WHAT’S the most important factor in the success of mergers and acquisitions (M&A)? In the aero-space and defense (A&D) industry, it may be something most leaders don’t pay much attention to: business model compatibility. Our research shows it’s highly related to transaction success, and
failing to consider business model alignment could spell trouble for U.S. A&D companies seeking to diversify through M&A.
We examined 228 A&D deals from 2007 through March 2017, including all transactions of US$50 million or more where the acquirer was based in the United States. We then examined business model compatibility—the extent to which an acquirer’s business model either is similar to the target’s, or the extent to which accom-modations have been made for any differences. Our finding? Business model compatibility showed the stron-gest relationship with M&A success, even more so than lawsuits, oil prices, or defense budgets (see figure).
Now, we’re not claiming A&D companies shouldn’t acquire organizations whose business models differ from their own, or that they can’t do so successfully. And companies can and do, of course, choose to engage in multiple businesses with different business models. Yet organizations should consider thoughtfully planning for and addressing differences when evaluating and executing deals. And leaders should be aware the core business model of the acquiring company often exerts a “pull” on subsidiary businesses, resulting in the model employed by the main business, or small variants of it, applying across the board. That’s why talk of adopting “best practices” from parties in a deal can be an illusion: The acquiring company’s approach often becomes the default for all.
Why business model compatibility matters 9191
To read more about business models’ impact on M&A transactions, read Finding equilibrium: Managing business model compatibility in A&D deals on www.deloitte.com/insights.
What’s typically required for M&A success is a willingness to find an equilibrium between the acquirer’s and the target’s business models—one that achieves a good fit between the markets pursued and the busi-ness models employed. To do this, be honest in evaluating the company’s ability to support specific business models, and specifically address business model compatibility as a focus area for the senior executive team. Dedicate appropriate time and resources to planning how to integrate and run the acquired business in light of its degree of compatibility. And give the people in charge of executing the integration the necessary strategic understanding, decision-making authority, and operational latitude to establish a business model that works for the marketplace—whether that means completely integrating the target into the main business, setting it up as a wholly separate division, or something in between.
The path to business model equilibrium lies in understanding what business models are needed to effec-tively serve the markets in which one chooses to compete—and then deliberately designing each business model to fit its market. Those who do not may risk destroying value in their M&A pursuits.•
M&A outcome by deal type
79
33
15 11 9
14
29
116
7
6756
7884
0%
10%
20%
30%
40%
50%
60%
70%
80%
90%
100%
Diversification Value chainextension
China setcompletion
Proprietaryroll-up
Core scaling
Successful Unclear Unsuccessful
Source: For deal type definitions, see Harlan Irvine, Gagan Chawla, Maryann Zeira, and Ted Sinsheimer, Finding equilibrium: Managing business model compatibility in A&D deals, Deloitte Insights, February 7, 2018.
Business model alignmentLow High
9090 IN BRIEF
www.deloittereview.com

Article title92 93
by William D. Eggers and Steve Hurst
ILLUSTRATION BY MARIO WAGNER
SAY you’ve been laid off from your job and want to apply for unemployment benefits. You log into your state’s web portal, which
welcomes you by name. A note on the left of the screen reminds you you’re due to renew your driv-er’s license in July; another asks if you want to rent a cabin in a state park, as you did last year.
Skipping those items for the moment, you type in your request and are immediately sent to the page for claiming unemployment benefits. You
click on “apply for benefits” and up pops a form displaying your name, address, and contact infor-mation, as well as details on your employer the state captured from your income taxes. You check the fields for accuracy, enter your separation date, and you’re just about done.
When the transaction is complete, the system asks if you want to go next to your state’s health insurance exchange, in case your job loss left you in need of a new policy.
WHAT IF STATE GOVERNMENT SERVICES WORKED LIKE AMAZON?
Delivering the digital stateFEATURE92
www.deloittereview.com

94
Many commercial online services offer this kind of customer experience—so many that we typi-cally take fast, frictionless transactions for granted. Nobody is surprised that TurboTax offers to prepop-ulate your tax forms for easy filing. So why don’t most state governments offer anything similar? Citizens certainly want them.
Consumer surveys indicate that satisfaction with government services has fallen to an eight-year low.1 Recent Gallup polls show that Americans continue to name dissatisfaction with government as the nation’s second most-important problem, after the economy.2
Many government officials, moreover, are entirely aware of this dissatisfaction. In our digital government survey of state and local govern-ment officials, 73 percent believed their organiza-tion’s digital capabilities were behind those in the private sector.3 In another recent survey, state IT personnel and decision-makers identified the most critical areas needing better digital capabilities; these included health and human services, motor vehicles, employment, public safety, licensing, renewals, and permitting.4
Clearly, there’s a huge gap between the service state and provincial governments offer today and that provided by companies such as Amazon, eBay, Uber, and Airbnb. To provide the same seamless experience these companies do, a state government
would need a robust digital platform offering the equivalent of one-stop shopping, making a range of functions available in a few clicks. This government platform would “know you” based on past transactions, and anticipate your needs. It would be able to navigate the breadth of content to connect you with the right service or the answer you seek.
Most states can’t do that today, largely because of the way in which they organize and govern digital technology: with databases that can’t communicate with one another, limited information sharing, and overly complex rules and protocols. The 2017 Center for Digital Government survey identified some of the most significant obstacles: legacy
systems, lack of qualified staff, poor procurement processes, security issues, inadequate funding, and current employee practices.5
To deliver the customer experience their citizens want, states need to focus on three crucial elements: 1. An end-to-end digital experience devel-
oped from the customer’s point of view, acces-sible anywhere, anytime, and from any device.
2. A unique, uniform digital ID that grants agencies access to the appropriate data and services.
3. Mechanisms that allow agencies to share data across the state enterprise.
Why transform digital services?As with any mass provider of goods and services,
a government can’t provide great citizen service without an integrated, digital workflow. Citizens want outstanding digital service from their govern-ment for the same reason they want it from an online retailer, bank, or travel booking site: It makes their lives easier. The less time people must spend searching for information or filling out forms, the more time they can spend getting on with their lives. Citizens increasingly want—and expect—the same service from government they receive from online retailers. Failing to meet that expectation can become synonymous with poor government service.
Consumer surveys indicate that satisfaction with government services has fallen to an eight-year low.
FEATURE
Many government projects aiming to digitize operations and services struggle with user adoption. The problem? They may not adequately take into account user needs throughout the development process, often failing to consider how people actually think and act.
More than six decades of behavioral science research has found people often act irrationally, despite their best efforts to do the opposite. This can hold true for program designers as well. By not putting the end user first, programs can be designed in a manner that fails to resonate with how the human mind works. We identified three major behavioral science themes that can contribute to technology rejection among government employees and the citizens and businesses they are trying to serve:
1. Cognitive overload. We live in a fast-paced, constantly changing environment. With limited physical and cognitive resources, asking people to incorporate just “one more thing” can simply become too much. Behavioral science explains this is because cognitive reasoning is finite and easily depleted. Give people too much to consider and they will most likely forgo specific steps and tasks, often unconsciously.
2. Black boxes. When either front-end or back-end tasks are ambiguous, people can be less moti-vated to follow through. Up front, when leaders fail to communicate to employees why a change has been made, employees may be less likely to find value in taking on a new way of conducting the work they do. Similarly, if their buy-in is not considered, the entire change may run counter to how employees conduct their work effectively. On the back end, if people do not perceive a positive result, it may feel like the action is not worth doing. For instance, why would citizens report an issue, such as a pothole, if they do not feel their municipality will do anything to address the problem?
3. The power of inertia. Behavioral insights reveal that people usually take the path of least resis-tance. In most cases, we stick to the behavior and habits we have already developed. This may be why a majority of people do not increase retirement contributions even after a big raise—it’s cogni-tively easier to “stay the course.” For technology adoption, in the immediate term, it’s typically easier to adhere to the old way of doing things versus learning a new method.
Failed digital adoption may have little to do with the technology itself. But the behavioral hurdles that prevent people from willingly undertaking new action can be overcome if government program admin-istrators kindle buy-in by leveraging behavioral science-based design principles that put people before technology. Real change generally happens through designs that make life easier, fill the end user with a greater sense of purpose, and offer a better line of sight into why new behaviors should be adopted in the first place.
For more on technology adoption and human behavior, read How nudge theory and design thinking can help your government IT project succeed on www.deloitte.com/insights.
95Delivering the digital state
www.deloittereview.com

Well-designed digital government services also give citizens new opportunities. Say you’ve heard about a government program that helps pay your home heating bills. When you enter the typical government services portal, you might find a page where you can sign up for heating assistance. But if you entered a truly customer-centric environment, the system would know that people who can’t pay their heating bills might also need help buying food or finding transportation to medical appointments. Once you sign up for the heating program, the system might offer you several other opportunities and even pre-qualify you for some programs based on the information you’ve already provided.
Digital transformation, however, also benefits governments themselves. Self-service digital tools allow government organizations to devote fewer resources to call centers, field offices, and other labor-intensive customer service operations. But this is true only if customers take advantage of digital tools—if they find them easy and effective to use. By understanding their customers, government entities can avoid spending money on features and tools their customers will never use, or messaging that misses the mark.
Digital transformation also can enhance mission effectiveness. Well-designed digital services encourage customers to engage with the public sector in ways that help government achieve its own goals. In 2012, the government of New Zealand formed Better for Business, a group of 10 agencies that work together to improve their policies and service design to make it easier for businesses to engage with the government. By 2020, Better for Business aims to reduce the business cost of dealing with the government by 25 percent, and to achieve key performance ratings comparable to those earned by leading private companies.6
Digital transformation also provides new oppor-tunities to “nudge” citizens—to influence their behavior in ways that promote broader societal goals. With effective digital tools, for example, a government can encourage higher voluntary tax compliance, discourage benefits fraud, and get more people to participate in work training.7
The New Mexico Department of Workforce Solutions, for instance, uses behavioral tactics to nudge unemployment insurance claimants toward honest responses. When the system spots an answer that doesn’t fit the usual pattern or range, it trig-gers a pop-up message emphasizing the importance of providing correct information. Administrators tested a dozen different messages, and because claimants must certify each week, quickly learned which were most effective. In the year after the smarter system went live, improper payments fell 50 percent and unrecovered overpayments fell by almost 75 percent, saving the state nearly US$7 million.8
Falling short of rising citizen expectations
Again, many government officials understand that their current services fall short of what most customers want. Here’s what the Obama adminis-tration said in the US federal budget for fiscal year 2015:
The American people deserve a govern-ment that is responsive to their needs. Citizens and businesses expect govern-ment services to be well-designed [and] efficient ... Despite some important strides to improve customer service over the past 15 years, too many federal government services fail to meet the expectations of citizens and businesses, creating unnec-essary hassle and cost for citizens, busi-nesses, and the government itself.9
Government officials also understand that digital capabilities are essential to delivering outstanding customer service. In our Deloitte survey of 1,200 government officials from more than 70 coun-tries, 78 percent said digital capabilities allow their employees to work better with citizens. Eighty-two percent said that improving the customer experi-ence and increasing transparency are prime objec-tives of their organizations’ digital strategy.10 And
some states are heeding this demand; consider Connecticut’s OpenCheckbook, for instance, which is designed to provide real-time information on state payments to improve financial transparency.11
Unfortunately, even when government officials understand the connection between digital capabili-ties and customer service, many have not been able to translate their knowledge into action. In a 2017 study by Deloitte and the Massachusetts Institute of Technology’s Sloan Management Review, more than 80 percent of public sector respondents said digital business is important for organizational success. Yet 42 percent also said their organization lacks a clear and coherent digital business strategy, and 58 percent described their organization as slow adopters or nonparticipants.12
Our 2015 survey of members of the National Association of State Auditors, Comptrollers and Treasurers (NASACT) also found that government officials are not aggressively pursuing digital strat-egies. Less than one-quarter of respondents said citizen demand is a primary driver of digital trans-formation within their organizations. Even among agencies that do seek to provide digital services in response to customer demand, few said they engage significantly with customers to cocreate these services. In other words, customers were often on their mind, but rarely involved in service design.13
In constituents’ eyes, good digital government is synonymous with good government. It was this
realization, perhaps, that motivated governors from eight states to mention improved digital citizen services as an important objective in their 2016 “State of the State” speeches.14
The three pillars of digital transformation
How will state governments work toward digital transformation? As noted earlier, we believe their success will depend on three essential components: 1) an end-to-end digital experience; 2) a unique, uniform digital ID; and 3) the ability to share data across the state enterprise. Each has been pioneered in the commercial sector, allowing governments to borrow from proven strategies.
AN END-TO-END CUSTOMER EXPERIENCE A state government’s ability to execute its
mission effectively depends on its ability to deliver an effective customer experience to businesses, citi-zens, and its own employees. When customers find a digital service too complicated or inconvenient, they may use it incorrectly or infrequently—or refuse to use it at all.
A uniform environment. Think of a theme park. Once you pass through the gate, you’re envel-oped by its look and feel. You see the same logo and signature colors everywhere. Your admission bracelet gets you on any ride you want. Throughout
Self-service digital tools allow government organizations to devote fewer resources to call centers, field offices, and other labor-intensive customer service operations.
96 FEATURE 97Delivering the digital state
www.deloittereview.com

the park, you’ll find the same map to guide you; staff members wearing identical uniforms are there to answer your questions.
The Australian state of Victoria plans to offer a kind of service “theme park.” Called Service Victoria, it’s a central organization created to provide services currently offered by a variety of different agencies. Although 65 percent of Victoria residents say they want to deal with the state electronically, as of mid-2017, customers could choose the digital option for only 1 percent of all government transac-tions. But that should change with Service Victoria. More than one-half of the project’s AUD 81 million budget will go toward a new technology infrastruc-ture that will support activities such as renewing drivers’ licenses, registering births and deaths, and obtaining fishing licenses. The government expects to release its first set of digital services under the Service Victoria brand by the end of 2017.15
A seamless experience. Citizens don’t care about organizational charts, and they certainly don’t want to spend time hopping from one agency’s website to another, trying to find out who can help them. They want to get their questions answered or their transactions completed in a few simple steps. They’re like shoppers who’ve grown tired of visiting a different store for each item they need. Why drive all over town when you can go to Walmart—or, better yet, to Amazon or Overstock.com?
BECU, a credit union based near Seattle, kept the seamless customer experience in mind when it developed a digital strategy encompassing all four lines of its business: consumer, small business, wealth management, and mortgage. BECU’s new digital vision has improved the member experi-ence while responding more accurately to market-place needs.16 Today, membership in BECU is growing, as is the volume of members’ self-service transactions.17
Like the best e-commerce sites, a seamless digital service environment wouldn’t greet you by asking, “Where do you want to go?” Instead, it would ask, “What do you want to do?”—and it would take you where you can accomplish it. Want to register to vote? You shouldn’t need to know the name of the
agency that handles that. The system would take you to the right place.
The goal of creating one seamless environment clearly presents a leadership challenge to most states, which still operate largely in silos, with limited cross-agency governance.
For people in the Australian state of Queensland, the service “mall” is One-Stop Shop, a program developed to satisfy citizens who expect govern-ment transactions to resemble their other online transactions. The service debuted in 2014 with 40 digital services; today it offers more than 400.18 Queensland has made a point of asking citizens what digital services they want and how they should work. In response to customer requests, for example, Queensland added a “tell us once” change of address service, employing a single form to update records across multiple services. Customers also can use a single tool to send complaints or feedback to any agency, without needing to know how to reach the relevant government employees.19
Customer experience is more than customer service. The most unified, seamless service in the world won’t really please its users unless it’s built on a deep understanding of what they want. The first step in any state digital project should be to explore and pinpoint the needs of the people who will use the service, and the ways in which it could fit into their lives. Whether users are citizens or government employees, policymakers should include real people in the design process from the beginning. The needs of users—not the constraints of government structures—should inform technical and design decisions. Governments should continu-ally test the products they build with real people to stay focused on what’s important.
This requires governments to understand the difference between customer service and customer experience. Consider a customer purchasing a book. The experience begins the moment she contem-plates buying it and continues until she’s read it and, if it’s good, recommends it to her friends. Customer service, on the other hand, is narrowly focused on the actual transaction: “Was the book in stock?”
“Was the salesperson friendly?” “Was there a line at the register?”
When government agencies assess their perfor-mance by focusing primarily on their own process measures such as speed and accuracy, they risk being misled. Narrow improvements to customer service may not be enough to improve customer satisfaction, which reflects the entirety of the experience.
As they seek to improve the customer experi-ence, governments should rethink their strategies for gaining customer feedback. Beware of untested assumptions. For example, if you’re rushing to build a mobile app, be aware that there’s such a thing as app fatigue; many people now prefer a mobile web experience. Similarly, if you plan to invest heavily in creating user accounts, such as online banks have, understand that most online retail transactions are completed in “guest” mode.
The only way to know for sure what customers want is to send designers into the field. In fact, a whole discipline concerning customer experience has emerged from ethnographic research and behavioral science (also known as design thinking and human- or user-centered design). Design thinking seeks to understand the personas, the service journey and the “moments that matter”—points where a favor-able or unfavorable perception can be amplified. Nothing can replace the insights gained through experiencing firsthand what customers encounter—the highs, the lows, and everything in between.
The US Citizenship and Immigration Services (USCIS) followed these principles when it used customer feedback to inform two efforts, a project to optimize its website for mobile users and another to improve its responses to questions. USCIS has used customer personas and customer journey mapping to better understand the varied needs of the people who use its services.20
The Texas Health and Human Services Commission (HHSC) also used extensive customer research in designing a mobile version of an online service that aggregates eligibility for numerous federal and state benefit programs. Designers thought applicants would find it useful to be able
to submit verification documents with a smart-phone photo. But rather than simply run with that assumption, they visited service centers to talk with applicants. There, they learned that most benefit applicants had smartphones, but their devices often lacked advanced capabilities. They also learned that applicants knew how to get the most from their phones.
“Many users were used to conducting their business on mobile devices instead of personal computers, making them sophisticated users,” explains Stephanie Muth, the HHSC deputy execu-tive commissioner who spearheaded the project. Armed with such insights, the design team created an app that was downloaded 300,000 times within its first few months.21
CREATE ENTERPRISEWIDE IDENTITY MANAGEMENT
Imagine you were browsing an online retailer for a few items: a book, a pair of shoes, and a new case for your smartphone. You log in and the experi-ence is relatively smooth, but after you find the book and move on to the shoes, you are asked to register anew as if you’d never registered the first time. Mildly annoyed, you fill out the registration form and carry on—until the same thing happens when you search for phone cases. And then again when you try to check out. By the time you’ve paid, you’ve had to register and authenticate yourself four times. And, weirdly, each time the process is just a little different. Even if you’re pleased with the products and prices, you may find yourself annoyed at the overall experience—and at the company that made you jump through these hoops.
While such experiences are rare for online shop-pers, they’re familiar to anyone using online govern-ment services.
Most governments rely on a sprawling patch-work of systems to identify and manage informa-tion about people, using everything from passwords to smart cards to biometrics. At the same time, the data must be tagged so that only the right users have access. Unfortunately, these elements rarely come together in a way that seems convenient or logical
98 FEATURE 99Delivering the digital state
www.deloittereview.com
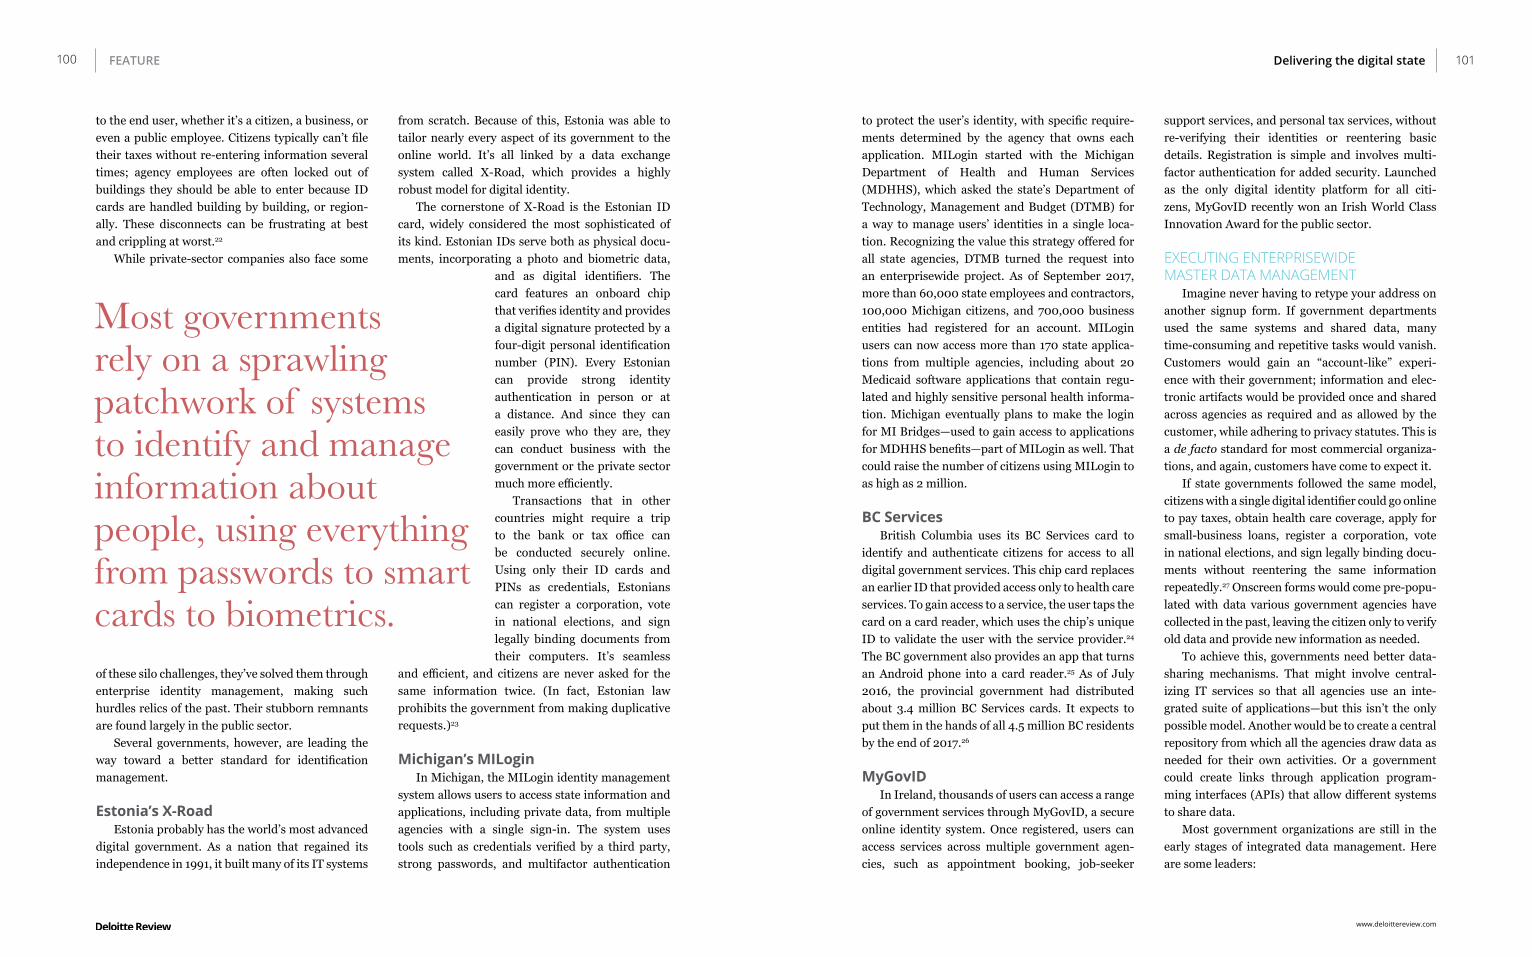
to the end user, whether it’s a citizen, a business, or even a public employee. Citizens typically can’t file their taxes without re-entering information several times; agency employees are often locked out of buildings they should be able to enter because ID cards are handled building by building, or region-ally. These disconnects can be frustrating at best and crippling at worst.22
While private-sector companies also face some
of these silo challenges, they’ve solved them through enterprise identity management, making such hurdles relics of the past. Their stubborn remnants are found largely in the public sector.
Several governments, however, are leading the way toward a better standard for identification management.
Estonia’s X-RoadEstonia probably has the world’s most advanced
digital government. As a nation that regained its independence in 1991, it built many of its IT systems
from scratch. Because of this, Estonia was able to tailor nearly every aspect of its government to the online world. It’s all linked by a data exchange system called X-Road, which provides a highly robust model for digital identity.
The cornerstone of X-Road is the Estonian ID card, widely considered the most sophisticated of its kind. Estonian IDs serve both as physical docu-ments, incorporating a photo and biometric data,
and as digital identifiers. The card features an onboard chip that verifies identity and provides a digital signature protected by a four-digit personal identification number (PIN). Every Estonian can provide strong identity authentication in person or at a distance. And since they can easily prove who they are, they can conduct business with the government or the private sector much more efficiently.
Transactions that in other countries might require a trip to the bank or tax office can be conducted securely online. Using only their ID cards and PINs as credentials, Estonians can register a corporation, vote in national elections, and sign legally binding documents from their computers. It’s seamless
and efficient, and citizens are never asked for the same information twice. (In fact, Estonian law prohibits the government from making duplicative requests.)23
Michigan’s MILoginIn Michigan, the MILogin identity management
system allows users to access state information and applications, including private data, from multiple agencies with a single sign-in. The system uses tools such as credentials verified by a third party, strong passwords, and multifactor authentication
Most governments rely on a sprawling patchwork of systems to identify and manage information about people, using everything from passwords to smart cards to biometrics.
to protect the user’s identity, with specific require-ments determined by the agency that owns each application. MILogin started with the Michigan Department of Health and Human Services (MDHHS), which asked the state’s Department of Technology, Management and Budget (DTMB) for a way to manage users’ identities in a single loca-tion. Recognizing the value this strategy offered for all state agencies, DTMB turned the request into an enterprisewide project. As of September 2017, more than 60,000 state employees and contractors, 100,000 Michigan citizens, and 700,000 business entities had registered for an account. MILogin users can now access more than 170 state applica-tions from multiple agencies, including about 20 Medicaid software applications that contain regu-lated and highly sensitive personal health informa-tion. Michigan eventually plans to make the login for MI Bridges—used to gain access to applications for MDHHS benefits—part of MILogin as well. That could raise the number of citizens using MILogin to as high as 2 million.
BC ServicesBritish Columbia uses its BC Services card to
identify and authenticate citizens for access to all digital government services. This chip card replaces an earlier ID that provided access only to health care services. To gain access to a service, the user taps the card on a card reader, which uses the chip’s unique ID to validate the user with the service provider.24 The BC government also provides an app that turns an Android phone into a card reader.25 As of July 2016, the provincial government had distributed about 3.4 million BC Services cards. It expects to put them in the hands of all 4.5 million BC residents by the end of 2017.26
MyGovIDIn Ireland, thousands of users can access a range
of government services through MyGovID, a secure online identity system. Once registered, users can access services across multiple government agen-cies, such as appointment booking, job-seeker
support services, and personal tax services, without re-verifying their identities or reentering basic details. Registration is simple and involves multi-factor authentication for added security. Launched as the only digital identity platform for all citi-zens, MyGovID recently won an Irish World Class Innovation Award for the public sector.
EXECUTING ENTERPRISEWIDE MASTER DATA MANAGEMENT
Imagine never having to retype your address on another signup form. If government departments used the same systems and shared data, many time-consuming and repetitive tasks would vanish. Customers would gain an “account-like” experi-ence with their government; information and elec-tronic artifacts would be provided once and shared across agencies as required and as allowed by the customer, while adhering to privacy statutes. This is a de facto standard for most commercial organiza-tions, and again, customers have come to expect it.
If state governments followed the same model, citizens with a single digital identifier could go online to pay taxes, obtain health care coverage, apply for small-business loans, register a corporation, vote in national elections, and sign legally binding docu-ments without reentering the same information repeatedly.27 Onscreen forms would come pre-popu-lated with data various government agencies have collected in the past, leaving the citizen only to verify old data and provide new information as needed.
To achieve this, governments need better data-sharing mechanisms. That might involve central-izing IT services so that all agencies use an inte-grated suite of applications—but this isn’t the only possible model. Another would be to create a central repository from which all the agencies draw data as needed for their own activities. Or a government could create links through application program-ming interfaces (APIs) that allow different systems to share data.
Most government organizations are still in the early stages of integrated data management. Here are some leaders:
100 FEATURE 101Delivering the digital state
www.deloittereview.com

Federal Communications CommissionThe Federal Communications Commission
(FCC) is taking incremental steps toward a fully integrated IT platform. In 2013, with 207 legacy systems in place, many of them near-obsolete, the FCC could barely keep up with a barrage of online comments from the public and directives from Congress. Rather than trying to replace all its systems, the FCC found a way to let them share information in the near term, while it took the time it needed to streamline and integrate its IT processes.
“[T]he idea was, let’s have a single common data platform that has all the data from the legacy systems, and over time, use modular elements of commercial cloud platforms to deliver reusable, remixable processes for the FCC,” says former FCC CIO David Bray, who launched the initiative in late 2013.28
The FCC team used modular pieces of code that can be used and reused to interact with the common data platform. It’s a governmental variation on the plug-and-play model adapted for cloud computing. Instead of building big, heavy applications that commingle code and data, the agency chose to develop smaller, lightweight modules of code that can tap a more permanent “data lake.” By sepa-rating data and code, Bray realized, the FCC could more easily “remix” the code to meet congressional demands. The system costs far less to maintain while making the agency much more nimble and responsive.29
National Information Exchange Model The National Information Exchange Model
(NIEM), created after the September 11 attacks, facilitates information sharing among law-enforce-ment and homeland-security organizations. Begun as an initiative of the US Department of Justice (DOJ), NIEM morphed into a joint approach when the Department of Homeland Security (DHS) and then later the Department of Health and Human Services (HHS) came on board. In essence, it’s a protocol for sharing information between normally siloed departments.
“No one was really sharing information, even within the federal law-enforcement community,” explains Van Hitch, the onetime DOJ CIO who founded NIEM. “In the past, the primary way to share information was to set up a task force with members from all relevant agencies.”30
At its core, NIEM is a protocol that sets some standard definitions for key data fields—“person,” “location,” “activity,” “item,” and so forth—as well as for message types that can be adopted across different jurisdictions and departments, allowing for rapid, widespread data access and sharing. It’s like a data dictionary with thousands of data fields and individual chapters specific to sectors using NIEM, such as justice, transportation, homeland security, and social services.
All 50 states, at least 16 federal agencies, and even many foreign governments have adopted the NIEM standard. NIEM has, for example, enabled Canada and the United States to avoid the head-ache of trying to build an integrated system that would coordinate data about people crossing their common border. Engineers used the program to connect the countries’ legacy systems through a common approach.
Numerous state and local jurisdictions also have adopted the NIEM standard to coordinate infor-mation and action in a wide variety of areas. For example, Massachusetts uses NIEM to share infor-mation related to gangs and gang activity among state and local law-enforcement agencies. New York City, meanwhile, uses the program to allow resi-dents to sign up for social service programs.31
MichiganIn addition to MILogin, Michigan is taking other
steps to create an integrated, citizen-centric service platform. Among these is an initiative to foster data collaboration.32 In 2014, DTMB began developing an “Open First” data policy to foster data sharing across the enterprise. The policy includes identi-fying master data across all state agencies; estab-lishing a chief data steward in each state agency; and reducing the time and resources needed to
share data by 50 percent. Work has begun to estab-lish governance structures that will allow the state to use data and analytics to drive policymaking and service delivery.33
British ColumbiaThe province of British Columbia has created
common standards to make it easier for provincial ministries and agencies to share data. The province’s Data Custodianship Guidelines were developed by a DataBC Council of data custodians from each ministry.34 British Columbia also has created the Centre for Data-Driven Innovation, a central reposi-tory where government entities can securely access government data for use in research, analytics, and other initiatives.35
Road map to a digital transformation
Given that the goal is clear, how do you get there? The road map will be different for each state, but five strategic principles can help guide the journey.
USE DESIGN THINKING PRINCIPLESThe first step is to learn to think like the
customers who use government services, both citizens and employees. Traditional methods for designing digital government services focus on the government entity and the process. They ask, “What digital processes do we need to accomplish our goals?” But that’s not the right question. Instead, you should ask, “What do my customers want, and what processes do we need to accomplish their goals?”
Commercial organizations do this all the time. They seek relentlessly to understand and improve the digital customer experience using design thinking to reimagine the experience from the customer’s perspective.
Design thinking has become mainstream in the private sector. JC Penney used it, for example, when the company decided to offer a new smartphone app for the holidays—with only 12 weeks of lead time. Working with a consultant team including
experienced creative designers, developers, and digital retail experts, JC Penney searched for new ways to solve persistent problems, keeping its customer base firmly in mind. The new app, released that October, includes easy-to-use product searches, lists, and filters; quick navigation and an easy path to purchase; and customized merchan-dise recommendations.36
Work conducted according to the principles of design thinking is highly iterative, based on real-world research into the human needs behind the problem they’re trying to solve or the service they’re building. They brainstorm to generate ideas and do a great deal of sketching, prototyping, and testing.37
The 18F office within the US General Services Administration (GSA), which helps federal agen-cies deliver digital services, has adopted a design-focused approach since its inception. They use a technique called protosketching: In three hours or less, designers and developers build a rough proto-type by sketching in code as well as on paper. Even if the protosketch is imperfect or outright unus-able, it gives teams and clients something concrete to examine and elevates the discussion to issues of data, design, and function.38
The United Kingdom’s Government Digital Service (GDS) mirrors 18F’s approach, articulating its vision through 10 concise design principles: 1. Start with needs (user needs, not government
needs).2. Do less.3. Design with data.4. Do the hard work to make it simple.5. Iterate. Then iterate again.6. This is for everyone.7. Understand context.8. Build digital services, not websites.9. Be consistent, not uniform.10. Make things open: It makes things better.39
Whenever you see an organization that excels at digital design, you’ll find it builds a user focus into every step of its projects. With genuine insight into user needs, you can make design decisions that meet their needs and your business goals.
102 FEATURE 103Delivering the digital state
www.deloittereview.com

ESTABLISH A STATE DIGITAL STUDIO States should have a central point to orchestrate
the digital vision. Many commercial organizations—and some government leaders—have put developing a creative “digital studio” at the center of their digital transformation. The studio provides web develop-ment, design thinking, and prototyping capability.
A whole industry has cropped up to do this; it’s a model that supports the interac-tive, creative approach of design thinking. So, if you’re going to take this approach, you need to work with a studio. While you can contract for one, build it all in-house, or take a hybrid approach, we recommend creating at least a core in-house group. This digital studio can become a catalyst for innovation and a great place to work. And you can make it a shared service available to all agencies that need its skills.
One of the first governments to set up an enterprisewide design studio was the United Kingdom, which founded its Government Digital Service (GDS) in 2011. GDS soon evolved into a cabinet office and inspired other governments to form organizations based on its practices, including the US Digital Service and 18F in the United States, the Australian Digital Transformation Agency, as well as a proposed Canadian Digital Service.40 Hong Kong, Singapore, and Thailand have established similar organizations.41
When smart organizations develop digital studios, they often make their resources available to all departments and agencies. For example, the city of New York is creating a master service agreement (MSA) for several digital studios to provide design thinking services to city agencies.42
GET THE GOVERNANCE RIGHT Our research shows that, for a state government
trying to meet its citizens’ needs, a website isn’t enough. A set of mobile apps isn’t enough. A portal leading to a variety of independent agency services isn’t enough.
In many cases, each services agency has its own website, with its own look and feel and its own back-end infrastructure. No central organization has the authority to launch initiatives and set stan-dards for the whole enterprise, or to get agencies working together toward the common goal of better customer service.
Such environments produce fragmented, confusing customer experiences. When a citizen visits the page for their state health department, the system there doesn’t know that the same person recently visited another page seeking information on disability benefits. And the citizen’s experience on that page tells her nothing about navigating the Health Department’s other services.
This uncoordinated approach is a recipe for frus-tration. It generates the problems citizens repeatedly cite when complaining about digital government. The website is poorly organized; search functions return useless information; answers are poorly organized and unclear; and different sites, or different portions of the same site, provide conflicting information.43
A government seeking to transform
its digital services doesn’t need to
complete the entire metamorphosis in a
single, giant leap.
The state, meanwhile, loses out on the benefits of increased efficiency. In a siloed government, agen-cies workers have no idea that colleagues in other offices are working on related problems with the same customers. And in a state where citizens can’t use digital self-service tools to conduct business, employees spend more time providing customer service on the phone or in-person, driving up opera-tional costs.
So whether a government creates a digital studio in-house or contracts for these capabilities, it should rethink its governance structure to reap the full benefits. With a different governance structure, a state could eliminate the obstacles that drive citi-zens crazy when they try to use digital services. The state could create a way to manage identities across government functions. The digital platform then could provide a single view of each customer, built from data collected in transactions with multiple agencies.
In commercial organizations, the chief mar-keting officer (CMO) is usually responsible for the end-to-end customer experience. Governments should consider how to replicate this function, creating blueprints for cross-departmental coor-dination. Several federal agencies including the Census Bureau already have chief customer experi-ence officers.
Sometimes, in-house digital studios can play a governance role, developing policies and infrastruc-ture that apply across the whole government. In the United Kingdom, for example, GDS has created a data group to oversee how the government collects, manages, and employs data. Its work includes an initiative to build a common data infrastructure, making data available to functions throughout government with APIs. GDS also has created a Data Leaders Network and a steering committee to develop policies and governance structures for managing and sharing government data.44
ADOPT AN ITERATIVE APPROACHA government seeking to transform its digital
services doesn’t need to complete the entire
metamorphosis in a single, giant leap. Just as design thinking encourages incremental, iterative processes, the journey toward customer-centric digital services can proceed in small steps. It’s possible, and perhaps most practical, to start the transformation on a small scale and then grow.
Start with really good customer insight. Customers will tell you what they need and where their biggest problems are.
Prioritize cases based on factors such as value to the customer and complexity of implementation. Then start at the top of the list, with a project that is relatively easy to implement, but promises to make a real difference for its users. Rack up one success, and you’ll have an easier time gaining buy-in for your next project.
BusinessUSA, for example, whose goal is to digi-tally connect businesses with government assistance services, started by connecting siloed agencies. The federal government launched this portal in just 90 days, but it was only the start. As the portal gener-ated user feedback, the project team kept making improvements.
The secret to digital initiatives is to have a clear “north-star” vision in terms of customer experience and the necessary technologies and governance. It’s where you’re headed, and each iterative release takes you one step closer.
FINDING THE ROIGaining strong leadership support for digital
transformation can be difficult, because traditional metrics don’t always provide a business case for it. In a retail business, when you make your customers happy, their pleasure translates into dollars. With government services, that’s not always the case.
Mature organizations find ways to measure their digital returns on investment using common private-sector practices. A few years back, Amazon started to invest heavily in innovations such as its Prime delivery services, the Kindle tablet, and media services. These programs provided slim margins and depressed profits. But, as Amazon CEO Jeff Bezos explained, the strategy behind those offerings
104 FEATURE 105Delivering the digital state
www.deloittereview.com

was based on a customer focus and a long-term view of success. For example, Amazon considered usage of the Kindle, rather than e-book sales, to be the best metric for measuring its success.45
Digital transformation, however, does provide some ROI in the traditional sense. As a government uses design thinking to improve the customer expe-rience, it not only reengineers its customer-facing processes, but also the back-end processes that support them. The result could be a better designed set of workflows and IT systems, or policy improve-ments that better align government practice with citizens’ needs.
The Intellectual Property Office of New Zealand (IPONZ) has transformed itself into the world’s first 100 percent digital intellectual property (IP) office.46 Businesses can file patent applications, monitor their progress, and update their contact details online. Businesses and IPONZ staff track a case through a single “inbox.” The shared window makes the process transparent and predictable for business, while reducing transaction costs.47 With more time to examine IP rather than simply admin-ister, IPONZ employees can respond more quickly and accurately. More than 98 percent of applica-tions receive a response within 15 working days,
and 99 percent of decisions to grant or deny IP are upheld.48
Getting there from hereSuccess in the digital age ultimately depends
on how state governments execute each of the three pillars for digital transformation (a seam-less, end-to-end experience; a uniform digital iden-tity; and data sharing across the enterprise). Well-designed digital services designed around the user, and powered by systems built iteratively, tested rigorously, and operated in response to changing customer needs, will be truly transformational.
This kind of innovation should become commonplace in state government. The key is to exploit the capabilities of good design, data sharing, personalization, and adaptation. The most digitally adept state governments will imagine the future by meshing their business goals with user-centered experience design and a good understanding of current technologies. They can deliver the future by adopting agile methods, breaking away from the sluggish pace of waterfall change. And they could run the future with a culture of continuous feedback and analytics-driven insights.•
WILLIAM D. EGGERS is the executive director of Deloitte’s Center for Government Insights, and is based in Arlington, Virginia.
STEVE HURST is managing director in Deloitte’s US Public Sector practice, and is based in New York.
Learn more on www.deloitte.com/insights
When Agile meets governmentCan government benefit from Agile software development techniques? It can seem that fluid Agile methodologies and rules-driven government agencies donʼt mix, but our series explores ways to bridge the culture gap.
www.deloitte.com/insights/agilegov
106 FEATURE 107Delivering the digital state
www.deloittereview.com

IN BRIEF108
biopharmaR&D
IN the past decade, biopharma companies have released breakthrough treatments transforming deadly diseases into manageable chronic conditions, raising the standard
of medical care, and improving the quality of patients’ lives. Yet many of these same companies admit that their high-risk, high-cost approach to research and development (R&D) is unsustainable. R&D departments are under pressure to develop innovative medicines; offer differentiated value to patients, providers, and payers; and reduce cost and time to market.
Digital technologies have the potential to transform clin-ical development by incorporating valuable insights from multiple sources of data, radically improving the patient expe-rience, enhancing clinical trial productivity, and increasing the amount and quality of data collected in trials. But are biopharma companies adopting these technologies? Not really. We interviewed 43 leaders across the clinical-develop-ment ecosystem and found adoption varies widely, with even the most advanced organizations largely only piloting tech-nologies across different areas of clinical development.
Transforming biopharma R&D 109
To learn more about the potential of digitization for the biopharma industry, read Digital R&D: Transforming the future of clinical development on www.deloitte.com/insights.
Expected timeline for adopting digital technology at scale
Source: Deloitte Center for Health Solutions interviews with industry stakeholders and Deloitte client experience.
Now 3 years 5 years 10 years
Ready for near-term adoption
• E-consent• Patient-reported outcomes
captured using mobile devices• Risk-based site monitoring• Technology-based medication
adherence solutions• Assessing feasibility of protocol
design using multiple data sources
Next in line
Utility still being explored
• eSource (electronic recording and integration of all findings, observations, or other trial activities)
• Mine EHRs and patient records to assess protocol feasibility and target patients
• Workflow automation of some routine activities
• Partially virtual trials• Digital biomarkers as secondary
endpoints• Natural language processing to
produce patient safety narratives
• Blockchain• Virtual/augmented reality
Advanced technologies
• Synthetic and in-silico trials• Artificial intelligence to analyze
and interpret unstructured information from other studies and data
• Cognitive technologies to clean and analyze trial data
• Completely virtual trials• Digital biomarkers as primary
endpoints• Natural language processing to
perform more complex medical writing activities
• Digital assistants and voice recognition
Our concern is the window of opportunity is closing for biopharma companies to pursue comprehensive digital clinical strategies. To avoid falling behind, they need an integrated approach and comprehensive digital R&D strategy, which requires new capabilities, new skill sets, and new partnerships. And based on our inter-views and client experience, we conservatively estimate even early adopters may need a decade to begin taking full advantage of advanced technologies (see figure).
That’s why the time to start is now. We’re not denying it’s likely to be a complex, resource-intensive, and lengthy undertaking. The path to scaled adoption of digital is not obvious, and it is strewn with challenges, including immature data infrastructure and analytics, regulatory considerations, and internal organizational and cultural issues.
Yet the results can be transformative. Biopharma companies that are early adopters can benefit from better access to and engagement with patients, deeper insights, and faster cycle times for products in development. With commitment and a little luck, organizations accustomed to radically improving the lives of patients have the potential to upgrade their own prognosis.•
www.deloittereview.com

Article title110 FEATURE110
WITH change and performance pressure only accelerating, it may be time to reassess how we approach strategy. Traditional approaches
don’t account for the increasing pace of change and risk generating diminishing returns or missing the mark entirely. Fortunately, there is a more prom-ising way to address the challenges ahead.
What’s wrong with the five-year plan?
Despite the challenges of strategic planning in a rapidly changing world, most companies have remained loyal to the five-year plan as a basic
framework. Some have moved to a three-year plan-ning horizon to address the growing uncertainty, with a few taking the dramatic step of abandoning a long-term strategic plan altogether.
Regardless of the time frame, executives have increasingly adopted a reactive approach to strategy. The goal: to sense and respond as quickly as possible to events as they happen. Many see strategies of movement as the most effective way to cope with change and uncertainty; flexibility and speed are keys to success.
What’s been the result? Many companies are spreading themselves ever more thinly to deal with an ever-expanding array of initiatives. Even the very
by John Hagel and John Seely Brown
ILLUSTRATION BY RIKI BLANCO
AN ALTERNATIVE APPROACH TO STRATEGY IN A
WORLD THAT DEFIES PREDICTION
Zoom out/zoom in 111
www.deloittereview.com

112
largest companies are wrestling with the realization that the number of new programs exceeds the avail-able resources. They are also realizing that these initiatives tend to be incremental in nature, due not only to limited resources but to the programs responding to short-term events.
The results are not encouraging. We have been tracking the performance of all US public compa-nies over the last half century. Measured in terms of return on assets, performance on average for all public companies has declined by more than 75 percent since 1965.1 If the goal of strategy is to at least maintain current financial performance over time, this is unfortunate evidence that the current approaches are not working.
An alternative approachFortunately, there is an alternative to reactive
strategy and incremental steps. It’s based on an approach that some of the most successful digital technology companies have pursued over the past several decades. It goes by different names; we call it zoom out/zoom in.
This approach focuses on two very different time horizons in parallel and iterates between them. One
is 10 to 20 years: the zoom-out horizon. The other is six to 12 months: the zoom-in horizon.
Notice a key difference from the conventional approach—the five-year strategic plan—that many traditional companies take. Companies pursuing a zoom out/zoom in approach spend almost no time looking at the one-to-five-year horizon. Their belief is that if they get the 10-to-20-year horizon and the six-to-12-month horizon right, everything else will take care of itself.
A desire to learn faster is what drives this approach to strategy: These companies’ leadership teams are constantly reflecting on what they have learned about both time horizons and refining their approaches to achieve more impact in a less predict-able world.
Notice, too, that this approach is distinct from scenario planning or scenario development. Many large companies’ top teams have engaged in exer-cises asking them to imagine a range of alternative futures and focusing on those that seem most likely to materialize. But then the offsite meeting ends, everyone goes back to his or her day job, and often nothing really changes. However provocative, the exercise is more or less theoretical, with no clear path to taking action to prepare for that future.
KEY QUESTIONS ACROSS TWO TIME HORIZONS
Zoom out• What will our relevant market or industry look like 10 to 20 years from now?
• What kind of company will we need to be 10 to 20 years from now to be successful in that market or industry?
Zoom in • What are the two or three initiatives that we could pursue in the next six to 12 months that would
have the greatest impact in accelerating our movement toward that longer-term destination?
• Do these two or three initiatives have a critical mass of resources to ensure high impact?
• What are the metrics that we could use at the end of six to 12 months to best determine whether we achieved the impact we intended?
FEATURE
In the zoom out/zoom in approach, the meeting is not over until the leadership has aligned around the two or three highest-impact initiatives that can be pursued in the next six to 12 months—and has ensured that these have appropriate resource commitments. What was a theoretical exercise becomes very real, with clear implications for what the company will be doing differently in the short term to build the critical capabilities for the long term.
BEYOND THE SHORT TERM This alternative approach to strategy can have a
number of benefits. It pulls executives out of short-term thinking that is driven by pressure for quar-terly performance—and forces people out of their comfort zone. Consider: If we focus on a five-year horizon, it’s possible to convince ourselves that our company, and the business environment, will look then pretty much like they do today. But if we really understand the implications of exponential change and shift our focus to 10 to 20 years, it is difficult to envision an unchanged future. Zoom out challenges
us to consider how different our companies could be, and will need to be, to thrive in rapidly changing markets. It prompts us to question our most basic assumptions about what business we really should be in and fights the tendency toward incremen-talism that short-term views promote. And it may reduce the risk that we will be blindsided by some-thing that appears trivial today but could end up fundamentally redefining our market.
This approach also powerfully combats the tendency to spread ourselves too thinly across too many initiatives. It forces us to focus in the short term on the initiatives that will have the greatest impact in accelerating our movement toward a future opportunity—and to ensure that those initia-tives are adequately funded.
Changing approachesThis approach requires us to both expand hori-
zons and narrow focus. While the approach will vary depending on the company’s specific context, figure 1 provides a high-level overview of the approach.
Zoom out. Typically, the first step is to expand the leadership team’s horizons. In part, this involves building greater awareness of the accelerating pace of change, largely shaped by exponential advances in the performance of digital technology. While every executive is at least somewhat aware of these advances, taking people out of the comfort of their corner offices to embark on a “learning journey” to a center of technology innovation—places such as Silicon Valley, Tel Aviv, and Shenzhen—often helps them more viscerally experience what is already occurring and see tangible examples of the acceler-ating change.
The next step is to start building alignment within the leadership team around a shared view of the 10-to-20-year future. In this context, scenario-planning techniques certainly have a role to play. It is helpful to begin by imagining alternative futures shaped by the key uncertainties ahead. A key to success on this front is to bring in outside provo-cateurs who can help challenge executives on key
Notice a key difference from
the conventional approach—the
five-year strategic plan—that
many traditional companies take.
Zoom out/zoom in 113
www.deloittereview.com

assumptions about what business they will need to be 10 to 20 years from now.
Here, it’s important to drive an outside-in perspective and to resist the tendency to look at the future from the inside out. Start with the likely evolu-tion of customers and stakeholders. Understand their evolving unmet needs, and then work back-ward to identify the opportunities to create signifi-cant value by addressing those needs in a distinctive way. In addition, focus on leverage: Strive to iden-tify and understand the potential ecosystems that can leverage the company’s capabilities and deliver value to the market.
While imagining alternative futures is helpful, this strategic approach hinges on building alignment around a shared view of what the most likely future will be. This shared view isn’t a detailed blueprint of the future, but it needs to have enough clarity on
key trends/opportunities to help executives make choices regarding short-term priorities. Note that it is important to not view the future as a given beyond one’s ability to influence. We have written elsewhere about the opportunity to shape strategies that can materially alter certain futures’ probability.2
As the shared view of the future takes shape, the focus shifts to the implications for the business. What kind of business can create the most value and occupy a privileged position in that evolving future? Here, tools such as the strategic choice cascade can play an important role, but questions like where to play? and how to play? are framed in the context of the anticipated zoom-out future. The goal is to gain alignment within the leadership team on what the company will need to look like 10 to 20 years from now to capture the most value and reduce vulner-ability to competitors.
The zoom out/zoom in strategy approach
A. EnvisionSynthesize ashared view ofthe long-termdirection ofyour industry(10–20 years)
D. MobilizeEnsure there is acritical mass ofresources alignedagainst the keyinitiatives and thatclear measuresof success areestablished
B. FocusDetermine whatyour businessneeds to looklike to succeedin the future,specifying whereto play and howto win
C. DefineIdentify two tothree initiatives(no more) with thegreatest potentialto accelerate youtoward that long-term destinationover the next six to12 months
Zoom inZoom out
Envisionthe future
Refl
ect
and
refi
ne
Refl
ect and refine
Focus onwhat will
berequired
forsuccess
Definehigh-impactinitiatives
Mobilizeresources totake action
Zoom in. This is often the most difficult part: identifying and agreeing on the few near-term initia-tives that can most help to accelerate the organiza-tion toward the future position. While the specific initiatives will clearly differ based on the company’s context, our suggestion is that for large, traditional companies, the three zoom-in initiatives ideally cover these three fronts:
• Identify and begin to scale the “edge” of the company that could drive the transformation required to become the zoom-out business3
• Determine the one near-term initiative that would have the greatest ability to strengthen the business’s existing core—after all, the core is generating the near-term profits required to accelerate the journey
• Determine what marginally performing activities the company could stop doing in the next six to 12 months that would free up the most resources to fund initiatives on the other two frontsIn developing the zoom-in initiatives, here are
some things to watch out for:• Clustering many initiatives into one “umbrella”
initiative—instead, be rigorous about focusing on impact and singling out the one near-term initiative with the greatest potential to deliver that impact
• Favoring the incremental—because the focus is on results in six to 12 months, there is a tempta-tion to fall back to initiatives that are more modest
in scope. Even if the chosen zoom-in initiative may take longer to deliver its full impact, the key is to identify a meaningful milestone within this shorter time frame to demonstrate progress. For example, in bringing a major new technology to market, the zoom-in initiative might be the development of a functioning prototype.Reflect and refine. This is all part of an initial
effort to clarify and build alignment around the zoom-out perspective and the zoom-in initiatives. But that’s just the beginning.
The leadership of companies pursuing this stra-tegic approach regularly step back to reflect on what they have learned, both in terms of monitoring the outside world and, more importantly, about the zoom-in initiatives they are pursuing. They typi-cally hold regular sessions to evolve their zoom out/zoom in approach every six to 12 months, driven by the opportunity to assess the results of the zoom-in initiatives. But many of the leadership meetings throughout the year include discussions of both the zoom-out and zoom-in horizons to test and refine the approach on an ongoing basis.
This strategy approach can be a powerful vehicle for learning about the future and how to get there. Such learning requires ongoing reflection and refinement, however, and the pressures of the immediate can make it easier to avoid making that effort. Resist the temptation.
As the shared view of the future takes shape, the focus shifts to the implications for the business.
114 FEATURE Zoom out/zoom in 115
www.deloittereview.com

Potential objections to this approach
There’s a natural skepticism that materializes in any effort to expand executives’ horizons. Some of the most common objections:
“The future’s too uncertain.” While we certainly don’t want to be interpreted as saying that antici-pating the future is easy, we suggest that looking ahead is becoming increasingly essential. If we lack a clear sense of direction, we risk being consumed by the accelerating pace of change. A key is to focus on reasonably predictable factors such as certain technological and demographic trends.
“Our investors just want short-term results—don’t distract me with the future.” Here’s the paradox: Investors may focus on quarterly earn-ings, but anticipation of future earnings—that is, the multiple of today’s earnings—drives most of any large company’s stock price. The more a company can be persuasive about significant future opportu-nities and demonstrate tangible short-term prog-ress toward addressing those opportunities, the better the stock price is likely to perform.
“Any near-term economic impact of this approach to strategy is likely to be marginal; the payback will take too long.” While a view of the future drives strategy, that view can be helpful in achieving greater short-term focus that is likely to improve economic performance. If we have a clearer view of what the future might look like, we are better positioned to take steps that will reduce
our vulnerability to near-term disruptions—and to make difficult choices about shedding portions of our business that are currently underperforming. Done right, this approach to strategy has the poten-tial to significantly improve near-term economic performance.
The opportunity aheadZoom out/zoom in is a great example of
combining and amplifying two competing goals: preparing for the future and achieving greater near-term impact. By focusing on these two in tandem, we have greater potential to accelerate our move-ment toward the most promising future opportuni-ties and delivering near-term impact that matters to stakeholders. Maybe strategy is less about posi-tion or movement than about trajectory: having a sense of destination and committing to accelerating movement to reach that destination.
This approach can be used for an entire corpora-tion; for diversified companies, it can also be applied at the business-unit level.
But it’s not just for companies. Every institu-tion—and every individual—can use this approach to increase impact. What’s our zoom-out opportunity? And what should be our most important zoom-in priorities? Until we can answer those questions, we risk being buffeted by an increasingly demanding world and experiencing more and more stress as we spread ourselves too thinly.•
JOHN HAGEL is co-chairman of the Deloitte Center for the Edge, and is based in San Francisco.
JOHN SEELY BROWN (JSB) is independent co-chairman of the Deloitte Center for the Edge. JSB is based in Palo Alto, California.
The authors would like to thank Duleesha Kulasooriya, Andrew de Maar, Blythe Aronowitz, and Maggie Wooll for their contributions to this approach.
Read more on www.deloitte.com/insights
Moving from best to better and betterIn a world of constant disruption, is consistent, sustained performance improvement even possible? We believe it is—and to get there, we suggest a path based on frontline workgroups adopting business practices—focused on new value creation—that aim to help both workers and companies get better, faster.
www.deloitte.com/insights/best-to-better
116 FEATURE Zoom out/zoom in 117
www.deloittereview.com
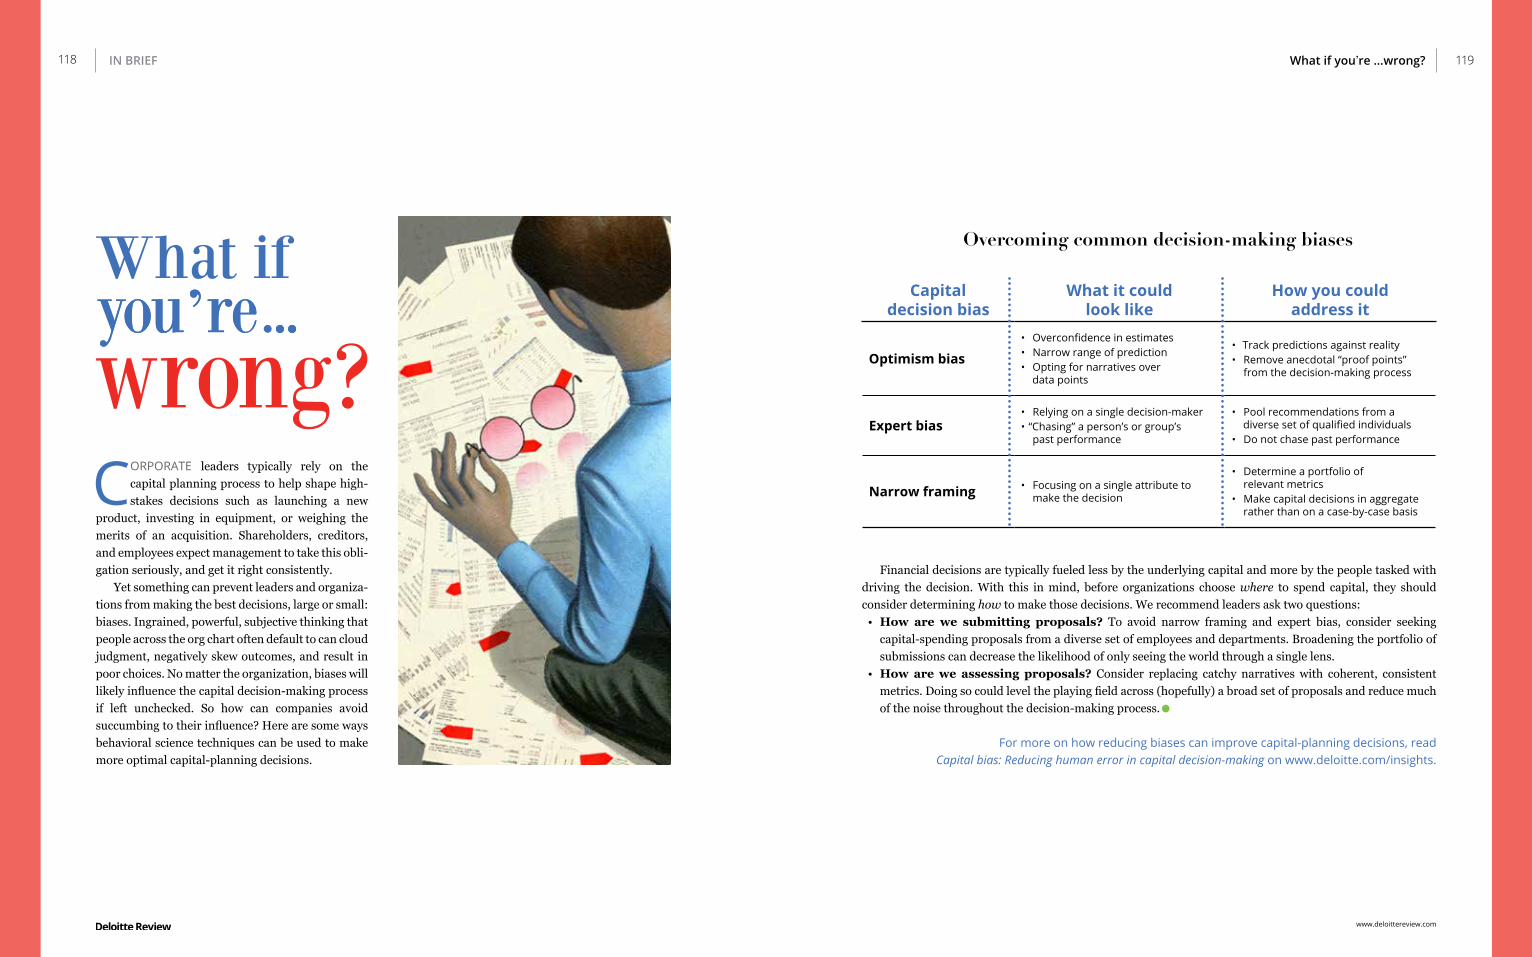
118 IN BRIEF
CORPORATE leaders typically rely on the capital planning process to help shape high-stakes decisions such as launching a new
product, investing in equipment, or weighing the merits of an acquisition. Shareholders, creditors, and employees expect management to take this obli-gation seriously, and get it right consistently.
Yet something can prevent leaders and organiza-tions from making the best decisions, large or small: biases. Ingrained, powerful, subjective thinking that people across the org chart often default to can cloud judgment, negatively skew outcomes, and result in poor choices. No matter the organization, biases will likely influence the capital decision-making process if left unchecked. So how can companies avoid succumbing to their influence? Here are some ways behavioral science techniques can be used to make more optimal capital-planning decisions.
What if youʼre ...wrong? 119
Financial decisions are typically fueled less by the underlying capital and more by the people tasked with driving the decision. With this in mind, before organizations choose where to spend capital, they should consider determining how to make those decisions. We recommend leaders ask two questions:
• How are we submitting proposals? To avoid narrow framing and expert bias, consider seeking capital-spending proposals from a diverse set of employees and departments. Broadening the portfolio of submissions can decrease the likelihood of only seeing the world through a single lens.
• How are we assessing proposals? Consider replacing catchy narratives with coherent, consistent metrics. Doing so could level the playing field across (hopefully) a broad set of proposals and reduce much of the noise throughout the decision-making process.•
For more on how reducing biases can improve capital-planning decisions, read Capital bias: Reducing human error in capital decision-making on www.deloitte.com/insights.
Capital decision bias
What it could look like
How you could address it
Optimism bias• Overconfidence in estimates• Narrow range of prediction• Opting for narratives over
data points
• Track predictions against reality• Remove anecdotal “proof points”
from the decision-making process
Expert bias• Relying on a single decision-maker• “Chasing” a person’s or group’s
past performance
• Pool recommendations from a diverse set of qualified individuals
• Do not chase past performance
Narrow framing • Focusing on a single attribute to make the decision
• Determine a portfolio of relevant metrics
• Make capital decisions in aggregate rather than on a case-by-case basis
Overcoming common decision-making biases
www.deloittereview.com

Endnotes Endnotes120 121
page 8
1. City leaders are not alone in this. Corporate goal-setting is plagued by similar biases and challenges when it comes to assessing current performance and setting future goals. See Michael E. Raynor, Mumtaz Ahmed, Derek M. Pankratz, and Rob Del Vicario, “A theory of relativity: Setting priorities and goals for financial performance improvement,” Deloitte Review 17, July 27, 2015.
2. Sir Rod Eddington, “The Eddington transport study,” UK Department for Transport, December 2006.
3. William Shakespeare, The Tempest, Act II, Scene 1.
4. Andrew J. Ginther, “Smart city: The city of Colum-bus,” E&E News, accessed December 15, 2017.
5. Metrolinx, “The big move: Baseline moni-toring report,” September 2013.
6. See, for example, Graham Cookson and Bob Pishue, “INRIX Global Traffic Scorecard,” INRIX Research, February 2017; Federico Karagulian et al., “Contribu-tions to cities’ ambient particulate matter (PM): A systematic review of local source contributions at global level,” Atmospheric Environment 120 (2015): pp. 475–83; World Health Organization, “WHO global urban ambient air pollution database,” 2016; OECD, The Cost of Air Pollution: Health Impacts of Road Transport, (Paris: OECD Publishing, 2014); Jonathan I. Levy, Jonathan J. Buonocore, and Katherine von Stackelberg, “Evaluation of the public health impacts of traffic congestion: A health
risk assessment,” Environmental Health 9, no. 1 (2010): p. 65; and Erik Hansson, et al., “Relation-ship between commuting and health outcomes in a cross-sectional population survey in southern Sweden,” BMC Public Health 11, no. 1 (2011): p. 834.
7. OECD and CDRF, “Trends in urbanisation and urban policies in OECD countries: What lessons for China?,” OECD, accessed December 15, 2017.
8. Adele Peters, “Inside Paris mayor Anne Hidalgo’s ambitious plans to create the post-car city,” Fast Company, April 4, 2017.
9. Andrew Small, “Denver radically expanded its transit. So why are more people driv-ing cars?,” CityLab, November 2, 2017.
10. Derek M. Pankratz, Sarah Kovar, Jordan Sanders, and Philipp Willigmann, “Framing the future of mobility: Using behavioral economics to accelerate consumer adoption,” Deloitte Review 20, January 23, 2017.
11. Tania Branigan, “China and cars: A love story,” Guardian, December 14, 2012.
12. Richard H. Thaler and Cass R. Sunstein, Nudge (London: Penguin Books, 2009). See also Deloitte Insights’ collection on Behav-ioral Economics and Management.
13. The sources of data included:
• 2thinknow data: Data sources purchased from 2thinknow, a research company based in Australia that focuses on analysis of cities. Data points include metro/subway average peak frequency, taxi rate per km, traffic-related injuries and casualties, and others (14 data points in total).
• Government statistical databases: Including census reports, economic statistics, and geographical information.
• City and state/province websites: Including US Department of Transportation, city transport authority websites.
• External reports and indexes: Including Movmi Shared City Mobility Index, INRIX Global Traffic Scorecard, TomTom Traffic Index, Waze Driver Satisfaction Index, IESE Smart Cities Index, Arcadis Sustainability Index, Easy Park Smart Cities Index, Moovit average waiting time for public transportation survey.
• NGO reports: These include the road qual-ity rating provided by World Economic Forum, Particulate Matter (PM2.5 and PM10) reports by World Health Organization, European Alternative Fuels Observatory, OECD, CDP, and American Public Transportation Association.
• Qualitative analysis: Done mostly by the Deloitte USI team. For example, evaluation of Electric Vehicles and Autonomous Vehicles regulation, operation of ridesharing companies.
14. See Scott Corwin, Joe Vitale, Eamonn Kelly, and Elizabeth Cathles, The future of mobility: How transportation technology and social trends are creating a new business ecosystem, Deloitte Univer-sity Press, September 24, 2015; and Scott Corwin, Nick Jameson, Derek M. Pankratz, and Philipp Willigmann, The future of mobility: What’s next?, Deloitte University Press, September 14, 2016.
page 16
1. Cameron F. Kerry and Jack Karsten, Gauging investment in self-driving cars, Brookings Institution, October 16, 2017.
2. Andreas Cremer and Jan Schwartz, “Volkswagen accelerates push into electric cars with $40 billion spending plan,” Reuters, November 17, 2017.
3. Deloitte, 2018 Deloitte global automotive consumer study, 2018.
4. Ibid.
5. The average amount consumers are willing to pay for access to advanced vehicle technologies, including self-driving and alternative powertrains, declined significantly between 2014 and 2016: Germany (US$1,590 in 2014 vs. US$360 in 2016); Japan (US$700 vs. US$360), and the United States (US$1,370 vs. US$925).
6. Deloitte, 2018 Deloitte global automotive consumer study.
7. IHS Markit, "Light vehicle sales forecast," accessed December 19, 2017.
8. Edmunds, "New car prices reach all-time high in October," November 1, 2017.
9. Deloitte, 2017 Deloitte global automotive consumer study, 2017.
10. Ibid.
11. Ibid.
12. MIT Technology Review, "Autonomous vehicles: Are you ready for the new ride?," November 9, 2017.
13. Edmunds, "New car prices reach all-time high in October."
14. Peter Gareffa, “Auto leasing drops for the first time in four years, Edmunds finds,” Edmunds, July 19, 2017.
15. Edmunds, "Auto loan lengths reach all-time high according to new Edmunds analysis," July 3, 2017.
16. According to Gasbuddy website, accessed December 19, 2017.
The Deloitte City Mobility Index
A REALITY CHECK ON
www.deloittereview.com
www.deloittereview.com
17. David Welch, “EVs from Tesla and GM may start losing their tax credits,” Bloomberg Businessweek, November 2, 2017.
18. Charles Clover, “Electric cars: China’s highly charged power play,” Financial Times, October 12, 2017.
19. Malyaban Ghosh, “Hyundai set to enter India’s EV race with Ioniq brand,” Hindustan Times, November 30, 2017.
20. BMI Research, "Transport growth boosted by road, rail investments," March 14, 2017.
21. Reuters, "Carmakers plan 400 Europe car charging stations by 2020," November 3, 2017.
22. Deloitte, 2018 Deloitte global automotive consumer study.
23. World Health Organization, Global status report on road safety, 2015.
24. Deloitte, 2018 Deloitte global automotive consumer study.
25. Aarian Marshall, “Self-driving shuttle buses might be the future of transportation,” Wired, November 10, 2017.
26. Deloitte, 2018 Deloitte global automotive consumer study.
27. Tom Randall, “Tesla’s battery revolution just reached critical mass,” Bloomberg, January 30, 2017; Chisaki Watanabe, “Why battery cost could put the brakes on electric car sales,” Bloomberg, November 29, 2017.
28. Business Wire, “AIG study: Americans evenly split on sharing the road with driverless vehicles; hacking a major concern, while lower insurance costs seen as likely benefit,” October 3, 2017.
29. OICA, “World vehicles in use—all vehicles,” accessed December 19, 2017.
page 26
1. Technically, funding and financing refer to distinct mechanisms for raising revenue. For the purposes of this paper, we treat them synonymously to avoid rep-etition. See Steve Hamilton and Ximon Zhu, “Funding and financing smart cities,” Deloitte, 2017.
2. Global Infrastructure Outlook, “Forecasting infrastruc-ture investment needs and gaps,” Global Infrastruc-ture Hub, accessed May 3, 2018.
3. Christina Anderson et al., “Three far-flung cities offer clues to unsnarling Manhattan’s traffic,” New York Times, February 26, 2018.
4. Scott Corwin et al., Cities explore digital mobility plat-forms, Deloitte Insights, March 9, 2018.
5. Nick Grube, “Many states charge insane fees for ac-cess to public records,” Huffington Post, October 17, 2013.
6. Anderson et al., “Three far-flung cities offer clues to unsnarling Manhattan’s traffic.”
7. National Association of City Transportation Officials, Curb appeal: Curbside management strategies for im-proving transit reliability, November 2017.
8. Linda Poon, “This map takes all the guesswork out of confusing street parking rules,” CityLab, April 3, 2018.
9. Corwin et al., Cities explore digital mobility platforms.
10. Anderson et al., “Three far-flung cities offer clues to unsnarling Manhattan’s traffic.”
11. Ibid.
12. R. Owen et al., Public acceptability of road pricing, final report for Department for Transport, 2008.
13. Jarrett Murphy, “Debate fact check: Is congestion pric-ing regressive,” CityLimits.org, September 7, 2017.
14. Based on an exchange rate of US$1.00:£0.72; Trans-port for London, “A guide for applicants who are ap-plying for a London private hire operator’s licence,” accessed March 12, 2018.
15. Arizona Department of Transportation, “Vehicle for hire licensing: Transportation network companies,” accessed March 12, 2018.
16. Virginia Department of Transportation, “TNC fre-quently asked questions,” accessed March 12, 2018.
17. John Byrne and Bill Ruthhart, “Emanuel's 2018 budget approved; cost of phone fees and ride-share trips to rise,” Chicago Tribune, November 21, 2017.
18. Sarah Freund, “City rideshare fee to pay for $179 mil-lion in CTA upgrades,” Curbed, February 5, 2018.
19. Winnie Hu, “When calling an Uber can pay off for cities and states,” New York Times, February 18, 2018.
20. Winnie Hu and Jessie McKinley, “Congestion pricing plan for Manhattan ran into politics. Politics won,” New York Times, April 9, 2018.
21. Henry Grabar, “The astounding collapse of American bus ridership,” Slate, July 21, 2016; Emma G. Fitzsim-mons, Ford Fessenden, and K. K. Rebecca Lai, “Every New York City subway line is getting worse. Here’s why,” New York Times, June 28, 2017.
22. Corwin et al., Cities explore digital mobility platforms.
23. James E. Short and Steve Todd, “What’s your data worth?,” Sloan Management Review, March 3, 2017.
24. Andrew Nicklin, “How free open government data can coexist with fee-based access,” Medium, April 19, 2017.
25. Dante Disparte and Daniel Wagner, “Do you know what your company’s data is worth?,” Harvard Business Review, September 16, 2016.
26. Bibiana McHugh, “Pioneering open data standards: The GTFS story,” in Beyond Transparency: Open Data and the Future of Civic Innovation (San Francisco: Code for America Press, 2013).
27. David Zipper, “Who owns transit data?,” CityLab, April 9, 2017.
28. Business Standard, “Welspun Enterprises to develop 1st phase of Delhi-Meerut Eʼway,” March 5, 2016.
29. Teena Maddox, “How Columbus, Ohio parlayed 50 million into 500 million for a smart city transportation network,” TechRepublic, May 10, 2017.
30. World Bank, “Transport,” accessed March 9, 2018.
31. Carnegie Mellon University, “Smart traffic signals,” ac-cessed March 9, 2018.
32. Sidewalk Labs, “New district in Toronto will tackle the challenges of urban growth,” press release, October 17, 2017.
33. Sidewalk Labs, “Vision sections of RFP submission,” accessed April 14, 2018.
Endnotes Endnotes122 123
www.deloittereview.com

www.deloittereview.com
page 36
1. Josh Bersin, Bill Pelster, Jeff Schwartz, and Bernard van der Vyver, Global human capital trends 2017: Rewriting the rules for the digital age, Deloitte University Press, February 28, 2017.
2. Jim Harter and Amy Adkins, “Are your star employees slipping away?,” Gallup, February 24, 2017.
3. Robin Erickson, Calculating the true cost of voluntary turnover: The surprising ROI of retention, Bersin, Deloitte Consulting, LLP, 2016.
4. Christie Smith and Stephanie Turner, The millennial majority is transforming your culture, Deloitte University, The Leadership Center for Inclusion, 2017.
5. Roy Maurer, “Internal recruitment critical to hiring, retention,” Society for Human Resource Management, December 2, 2015.
6. Deloitte, The 2016 Deloitte millennial survey: Winning over the next generation of leaders, 2016.
7. Deloitte, The 2017 Deloitte millennial survey: Apprehensive millennials: seeking stability and opportunities in an uncertain world, 2017.
8. Anne Fulton and Maya Crawley, “Career enablement best practices,” Fuel50 Global Benchmarking Research, 2017.
9. Karen O’Leonard and Jennifer Krider, HR factbook 2015: Benchmarks and trends for US organizations, Bersin, Deloitte Consulting LLP, 2015.
10. Erickson, Calculating the true cost of voluntary turnover.
11. Anne Fulton and Maya Crawley, “Integrated career development,” Fuel50, 2018.
12. Susan Adams, “Why promoting within usually beats hiring from outside,” Forbes, April 5, 2012
13. Ibid.
14. Robin Erickson and Denise Moulton, Six key insights to put talent acquisition at the center of business strategy and execution, Bersin, Deloitte Consulting LLP, 2018.
15. Ibid.
16. Dani Johnson, The career management framework, Bersin, Deloitte Consulting LLP, 2016.
17. Ibid.
18. Jennifer Krider, Karen O’Leonard, and Robin Erickson, Talent acquisition factbook, Bersin, Deloitte Consulting LLP, 2015.
19. Erickson and Moulton, Six key insights to put talent acquisition at the center of business strategy and execution.
20. Ibid.
21. Bersin, Deloitte Consulting LLP, Interview, September 2017.
page 48
1. See, for example, Korn Ferry Institute, The gap at the top, August 17, 2016. For a more detailed analysis, see figure 4. For full sources, see endnote 17.
2. Caliper Corporation, The qualities that distinguish women leaders, 2005, pp. 2–4.
3. Lecia Barker, Cynthia Mancha, and Catherine Ashcraft, What is the impact of gender diversity on technology business performance?, National Center for Women in Information Technology, 2014, pp. 2–3.
4. Ibid; Susan Davis-Ali, Advancing women technologists into positions of leadership, Anita Borg Institute, 2017, p. 4.
5. All information from Fumbi Chima taken from phone interview, February 2, 2018.
6. Korn Ferry Institute, The gap at the top; Sharon Gillenwater, “Chief information officer: Fortune 500 female CIOs in 2017,” Boardroom Insiders, September 6, 2017.
7. Catalyst, “Women in science, technology, engineering, and mathematics (STEM),” January 3, 2018.
8. Davis-Ali, Advancing women technologists into positions of leadership, p. 16.
9. Bureau of Labor Statistics, “Table 11: Employed persons by detailed occupation, sex, race, and Hispanic or Latino ethnicity,” Current Population Survey, Household Data Annual Averages 2017, 2018.
10. Both men and women are twice as likely to hire a man for an IT job than they are an equally qualified woman, according to Paul Lee and Duncan Stewart, "Women in IT jobs," Deloitte TMT Predictions 2016.
11. A female web developer in the United States makes 79 cents on the dollar compared to a man, and a female information systems manager makes 87 cents on the dollar compared to a man, according to Lee and Stewart, “Women in IT jobs.”
12. Deloitte Insights in CIO Journal, “Companies falling short on IT gender parity,” February 11, 2016.
13. Rebecca Grant, “Silicon Valley’s best and worst jobs for new moms (and dads),” Atlantic, March 2, 2015.
14. ISACA, The future tech workforce: Breaking gender barriers, 2017.
15. Deloitte Insights in CIO Journal, “Companies falling short on IT gender parity.”
16. Davis-Ali, Advancing women technologists into posi-tions of leadership, p. 4.
17. The percentages of CIOs, CFOs, and CEOs at US top 1,000 companies are taken from Korn Ferry Institute, The gap at the top. The percentages of CIOs in Fortune 500 and Fortune 100 companies are derived from Gillenwater, “Chief information officer.” The percentages of CEOs in Fortune 500 and Fortune 100 companies are derived from Fortune, “These are the women CEOs leading Fortune 500 companies,” June 7, 2017. The percentages of CFOs in Fortune 500 and Fortune 100 companies are derived from Fortune, “Female CFOs in the Fortune 500,” February 24, 2015.
Endnotes Endnotes124 125
www.deloittereview.com

www.deloittereview.com
18. Gary N. Powell, D. Anthony Butterfield, and Jane D. Parent, “Gender and managerial stereotypes: Have the times changed?,” Journal of Management, April 1, 2002.
19. Agota Alvarez, Women leaders research study, Caliper Corporation, November 22, 2017.
20. C. von Hippel, C. Wiryakusuma, J. Bowden, and M. Shochet, “Stereotype threat and female communication styles,” Personal and Social Psychology Bulletin, October 2011.
21. S. K. Johnson, et al. “The strong, sensitive type: Effects of gender stereotypes and leadership prototypes on the evaluation of male and female leaders,” Organizational Behavior and Human Decision Processes, 2008.
22. Pew Research Center, Women and leadership: Public says women are equally qualified, but barriers persist, January 14, 2015.
23. Caliper Corporation, The qualities that distinguish women leaders, pp. 2–4.
24. All information from Suma Nallapati taken from phone interview, January 22, 2018.
25. All information from Julie Lagacy taken from phone interview, January 25, 2018.
26. All information from Monique Shivanandan taken from phone interview, January 23, 2018.
27. Girls Who Code, “Girls Who Code launches new summer program to teach more girls to code,” November 6, 2017.
28. Davis-Ali, Advancing women technologists into positions of leadership, p. 18.
29. Janet Foutty, “Keeping women in tech careers,” LinkedIn, January 23, 2018.
30. Sylvia Ann Hewlett and Laura Sherbin with Fabiola Dieudonné, Christina Fargnoli, and Catherine Fredman, Athena factor 2.0: Accelerating female talent in science, engineering & technology, Center for Talent Innovation, 2014, p. 3.
page 60
1. Economist, “Herbert Simon,” March 20, 2009.
2. FlexJobs, “Current trends of telecommuting,” June 21, 2013.
3. Williesha Morris, “Technology addiction,” IAAP Edge, November 24, 2015.
4. Kelly Monahan, Mark Cotteleer, and Jen Fisher, Does scarcity make you dumb? A behavioral understanding of how scarcity diminishes our decision making and control, Deloitte University Press, July 19, 2016.
5. Silvia Bellezza, Anat Keinan, and Neeru Paharia, “Con-spicuous consumption of time: When busyness and lack of leisure time become a status symbol,” Advances in Consumer Research 44 (2016): pp. 118–38.
6. American Psychological Association, “Americans stay connected to work on weekends, vacation and even when out sick,” press release, September 4, 2013.
7. Heejung Chung, “Flexible working is making us work longer,” Quartz, April 27, 2017.
8. Adam Alter, Irresistible: Why We Can’t Stop Checking, Scrolling, Clicking and Watching (London: The Bodley Head, 2017).
9. Alex Hern, “Never get high on your own supply – why social media bosses don’t use social media,” Guardian, January 23, 2018.
10. Gloria Mark, Daniela Gudith, and Ulrich Klocke, “The cost of interrupted work: More speed and stress,” CHI’08: Proceedings of the SIGCHI Conference on Hu-man Factors in Computing Systems, April 5–10, 2008.
11. Monahan, Cotteleer, and Fisher, Does scarcity make you dumb?, Deloitte University Press, July 19, 2016.
12. Eldar Shafir and Sendhil Mullainathan, Scarcity: The New Science of Having Less and How it Defines Our Lives (London: Macmillan/Picador, 2014).
13. Mark, Gudith, and Klocke, “The cost of interrupted work: More speed and stress.”
14. Sheena S. Iyengar and Mark Lepper, “When choice is demotivating: Can one desire too much of a good thing?,” Journal of Personality and Social Psychology 79, no.6 (2001): pp. 995–1006.
15. See Richard H. Thaler and Cass R. Sunstein, Nudge: Im-proving Decisions about Health, Wealth, and Happiness (Yale University Press, 2008).
16. Considerations for talent: Give employees more guid-ance for prioritizing emails and meetings; consider-ations for technology: Give employees training and technology to sort emails by importance and send meetings in a way that includes options for “optional” vs. “required” attendees. HR can also encourage cultures and norms that discourage attending every meeting or inviting “everyone” to err on the safe side.
17. Melly Parker, “What are the benefits of virtual meet-ings?,” Chron.com, accessed February 8, 2018.
18. Brigitte Madrian and Dennis Shea, “The power of suggestion: Inertia in 401(k) participation and savings behavior,” Quarterly Journal of Economics 116, no. 4 (2001): pp. 1149–187.
19. Natasha Singer, “Can’t put down your device? That’s by design,” New York Times, December 5, 2015.
20. B. F. Skinner, Contingencies of Reinforcement: A Theo-retical Analysis (New York: Appleton-Century-Crofts, 1969).
21. Tristan Harris, “How technology is hijacking your mind—from a magician and Google design ethicist,” Thrive Global, May 18, 2016.
22. Sadiacreates, “Instagram algorithm: The best market-ing strategy ever implemented on the social media site?,” January 16, 2018.
23. Centers for Disease Control and Prevention, “1 in 3 adults don’t get enough sleep,” CDC Newsroom, Febru-ary 18, 2016.
24. Cleveland Clinic, “What happens to your body when you don’t get enough sleep,” Health Essentials, Sep-tember 18, 2015.
25. Chris Morris, “Is technology killing the human touch?,” CNBC Disruptor 50, August 15, 2015.
26. Sherry Turkle, Alone Together: Why We Expect More from Technology and Less from Each Other (Basic Books, 2011).
27. Mark Molloy, “Facebook addiction ‘activates same part of the brain as cocaine,’” Telegraph, February 17, 2016.
28. Markham Heid, “You asked: Is social media making me miserable?,” Time, accessed February 19, 2018.
29. Olivia Petter, “Social media is making it easier to con-ceal mental illnesses,” Independent, January 24, 2018.
30. Kathy Pretz, “Medical experts say addiction to technol-ogy is a growing concern,” IEEE, December 23, 2016.
31. For a related discussion, see Jim Guszcza, “Smarter together: Why artificial intelligence needs human-centered design,” Deloitte Review 22, January 2018.
32. Sunstein and Thaler, Nudge.
Endnotes Endnotes126 127
www.deloittereview.com

www.deloittereview.com
33. Laszlo Bock, Work Rules! Insights from Inside Google That Will Transform How You Live and Lead (New York: Twelve, 2015).
34. See Jim Guszcza, “The importance of misbehaving: A conversation with Richard Thaler,” Deloitte Review 18, January 25, 2015.
35. This theme is explored in Jim Guszcza, Harvey Lewis, and John Lucker, “IoT’s about us: Emerging forms of innovation in the Internet of Things,” Deloitte Review 17, July 27, 2015.
36. We reference Big Brother which was first coined by George Orwell in his novel 1984.
37. Alain Samson, “Salience,” Behavioral Economics Guide 1 (2014): p. 5.
38. Sunstein and Thaler, Nudge.
39. Sapience, “People Analytics @ Work,” Adver- tisement.
40. Itamar Gilad, “A new inbox that puts you back in con-trol,” Official Gmail Blog, May 29, 2013.
41. Quentin Hardy, “Google’s calendar now finds spare time and fills it up,” New York Times, April 13, 2016.
42. Chris Weller, “I tried a new app designed to curb obsessive cell phone use—and it’s already working wonders,” Business Insider, April 4, 2017.
43. Koushiki Choudhury, Managing Workplace Stress: The Cognitive Behavioural Way (Springer, 2013).
44. Shanil Ebrahim and Timothy Murphy, “Think slower: How behavioral science can improve decision making in the workplace,” Deloitte Review 18, January 25, 2016.
45. Megan Molteni, “The chatbot therapist will see you now,” Wired, June 7, 2017.
46. Nudge blog, “Eco reminders for your light switches,” February 11, 2011; Jeana Lee Tahnk, “text4baby sends free informational text messages during your pregnancy and baby’s first year,” Parenting, accessed February 2, 2018.
47. Todd Rogers, Katherine L. Milkman, and Kevin G. Volpp, “Commitment devices: Using initiatives to change behaviors,” Journal of American Medical Asso-ciation 311, no. 20 (2014): pp. 2065–2066.
48. Luke Dormehl, “Flowlight is an office traffic light sys-tem that lets coworkers know when you’re too busy to talk,” Digital Trends, May 2, 2017.
49. Arianna Huffington, “Introducing the Thrive app: We’re partnering with Samsung to help you disconnect with others, and reconnect with yourself,” Thrive Global, October 19, 2017.
50. In Misbehaving, Richard Thaler reports that while co-authoring Nudge with Cass Sunstein, the breakthrough idea of choice architecture came from rereading Don Norman’s classic book The Psychology of Everyday Things (New York: Basic, 1988).
51. Robert B. Cialdini, Influence: Science and Practice (Bos-ton: Allyn & Bacon, 2001).
52. N. J. Goldstein, R. B. Cialdini, and V. Griskevicius, “A room with a viewpoint: Using social norms to moti-vate environmental conservation in hotels,” Journal of Consumer Research 35, no.3 (2008): pp. 472–482.
53. See, for example David Halpern, Inside the Nudge Unit (WH Allen, 2015), or Thaler and Sunstein, Nudge.
54. Megan Gibson, “Here’s a radical way to end vacation email overload,” Time, August 15, 2014.
55. Cialdini, Influence: Science and Practice.
56. Hub, “Johns Hopkins recognized for work-life effec-tiveness,” February 12, 2016.
57. Some of this research is reviewed in Sarah Guminski, “Healthy habits: Using behavioral science in health policy,” Chicago Policy Review, February 8, 2017.
page 70
1. Jeff Schwartz et al., The overwhelmed employee: Simplify the work environment, Deloitte University Press, March 7, 2014.
2. EKU Online, “Work-related stress on employees health,” accessed March 2, 2018.
3. US Travel Association and GfK Public Affairs and Corporate Communications, Overwhelmed America: Why don’t we use our earned leave?, August 2014.
4. Deloitte, The 2017 Deloitte millennial survey: Apprehensive millennials: Seeking stability and oppor- tunities in an uncertain world, 2017.
5. Global Wellness Institute, “Global Wellness Institute releases report and survey on ‘the future of wellness at work,’” press release, February 17, 2016.
6. IBISWorld, Corporate Wellness Services in the US, February 2016, p. 5.
7. Proprietary research by Limeaid.
8. Proprietary research by BugInsights, acquired by Deloitte in January 2018.
9. Salesforce, “Employee volunteering & giving,” accessed February 28, 2018.
10. Danone, “Rewards & recognition,” accessed February 28, 2018.
11. Duncan Young (head of workplace health and wellbeing, Lendlease), interview with the authors, February 28, 2018.
12. Lendlease, “Lendlease taking employee health and well-being to the next level at new global head-quarters,” press release, September 26, 2016.
13. Young interview.
14. Christianna Silva, “The millennial obsession with self-care,” NPR, June 4, 2015.
15. Amy Fleming, “Can apps improve your mental well-being?,” Guardian, September 12, 2016.
16. Leonard Berry, Ann Mirabito, and William Baun, “What’s the hard return on employee wellness programs?,” Harvard Business Review, December 2010.
17. Ibid.
18. Josh Bersin, HR technology disruptions for 2018: Productivity, design, and intelligence reign, Bersin, Deloitte Consulting LLP, 2017.
19. Proprietary research by VirginPulse.
20. Making Sen$e editor, “Good pay, good worker, good company? Aetna CEO thinks so,” PBS, May 28, 2015.
page 78
1. Clayton M. Christensen and Scott Anthony, “Are you reading the right signals?,” Strategy & Innovation: Breakthrough Insight and Ideas for Driving Growth, Harvard Business School Publishing and Innosight,
Endnotes Endnotes128 129
www.deloittereview.com

www.deloittereview.com
September–October 2004; Thomas H. Davenport, “Don’t believe the (Technology) hype,” Harvard Business Review, December 17, 2007.
2. Julian Birkinshaw, “Beware of the next big thing: Before you adopt a management idea, figure out if it’s right for you,” Harvard Business Review, May 2014.
3. John Boudreau and Steven Rice, “Bright, shiny objects and the future of HR: How Juniper Networks tests and integrates the most valuable new approaches,” Harvard Business Review, July–August 2015.
4. Ibid.
5. Merriam-Webster Dictionary, “Hype,” https://www.merriam-webster.com/dictionary/hype (accessed March 19, 2018).
6. Birkinshaw, “Beware of the next big thing.”
7. Steve Cocheo, “Faster than a speeding hype? Think less about digital transformation and more about transformation overall,” Banking Exchange, December 11, 2017.
8. Jackie Fenn and Mark Raskino, Mastering the Hype Cycle: How to Choose the Right Innovation at the Right Time (Harvard Business Press, 2008).
9. Daniel Kahneman, Thinking, Fast and Slow (New York: Farrar, Straus, and Giroux, 2011), pp. 219–220; Philip Tetlock, Expert Political Judgment: How good is it? How can we know? (Princeton: Princeton University Press, 2005), p. 233; Philip Tetlock, “Why foxes are better forecasters than hedgehogs (Seminar),” Long Now Foundation, January 26, 2007; Isaiah Berlin, The Hedgehog and the Fox: An Essay on Tolstoy’s View of History (London: Weidenfeld & Nicolson, 1953).
10. Kahneman, Thinking, Fast and Slow.
11. Everett M. Rogers, Diffusion of Innovations (New York: The Free Press, 1983).
12. Leon Festinger, A Theory of Cognitive Dissonance (Stanford University Press, 1957).
13. Vanessa Van Edwards, “How to resist shiny-object syndrome,” Magzter, July-August 2017; Kelley Pidhirsky, “SOS: The shiny object syndrome. Do you suffer from it?,” Forbes, October 3, 2014.
14. Robert Cialdini, Influence: Science and Practice (Boston: Allyn and Bacon, 1984).
15. Andy Vuong, “iPhone hype a creation of consumer behavior and Apple strategy,” Denver Post, September 21, 2012; Robert Cialdini, “Harnessing the science of persuasion,” Harvard Business Review, October 2001; Muzafer Sherif, “A study of some social factors in perception,” Archives of Psychology 27, no. 187 (1935).
16. Amos Tversky and Daniel Kahneman, “Advances in prospect theory: Cumulative representation of uncertainty,” Journal of Risk and Uncertainty 5, no. 4 (1992): pp. 297–323.
17. Richard L. Oliver, “A cognitive model of the antecedents and consequences of satisfaction decisions,” Journal of Marketing Research 17, no. 4 (1980): pp. 460–469.
18. Signe Brewster, “Whatever happened to 3D printing?,” TechCrunch, July 10, 2016.
19. Brad Power, “Avoid the improvement hype cycle,” Harvard Business Review, March 23, 2011.
20. Mike Duff, “Swept up by demand, P&G extends Swiffer products,” DSN Retailing Today 44, no. 19 (2005): p. 26.
21. Craig Lambert, “Disruptive genius,” Harvard Magazine, July-August 2014.
22. Statista, “Share of smart connected major home appliances shipments by type in 2014 and 2020,” accessed May 17, 2018; Nilesh Rajput, “Smart home appliances market,” Allied Market Research, accessed May 17, 2018.
23. Sarah Halzack, “Amazon Dash: A way to order products with the touch of a button,” Washington Post, March 31, 2015.
24. Rogers, Diffusion of Innovations.
25. Ted Hardy, “BASF: Lessons from German marketing,” Better Projects, January 27, 2011.
26. Beth Snyder Bulik, “Inside the ‘Inside Intel’ campaign,” Business Insider, September 21, 2009. Intel Inside and the Intel Inside logo are trademarks of Intel Corporation or its subsidiaries in the United States and/or other countries.
27. Melanie Pinola, “Try on five pairs of glasses for free at home with Warby Parker's try-on program,” Lifehacker, June 20, 2012.
28. Tversky and Kahneman, “Advances in prospect theory,”; Amos Tversky and Daniel Kahneman “Choices, values, and frames,” American Psychologist 39, no. 4 (1984): pp. 341–350.
29. R. J. Reinhart, “Americans hit the brakes on self-driving cars,” Gallup, February 21, 2018; Craig Giffi et al., What's ahead for fully autonomous driving: Consumer opinions on advanced vehicle technology, Deloitte, 2017.
30. Zeninjor Enwemeka, “Consumers don't really want self-driving cars, MIT study finds,” WBUR, May 25, 2017.
31. Jagdish N. Sheth and Banwari Mittal, Customer Behavior: A Managerial Perspective (Mason, Ohio: South-Western College Pub., 2004)
32. Martin G. Letscher, “Fad or trend? How to distinguish them and capitalize on them,” Journal of Consumer Marketing 7, no. 2 (1990): pp. 21–26.
33. Jim Eckenrode, Talent, technology, and trans-formation: Global executives' expectations for the future of financial services, Deloitte Insights, 2017.
34. Robert Burnson, “Pokemon Go fad has passed but monster trespassing suit lives on,” Bloomberg, March 30, 2018.
35. Geert Hofstede, Culture's Consequences: Inter-national Differences in Work-Related Values (London: Sage Publications, 1980); Geert Hofstede
“Dimen-sionalizing cultures: The Hofstede model in context,” Online Readings in Psychology and Culture, January 6, 2009.
36. Eckenrode, Talent, technology, and transformation.
37. Birkinshaw, “Beware of the next big thing.”
page 92
1. American Customer Satisfaction Index, “ACSI federal government report 2015: Citizen satisfaction dips, but future looks brighter,” January 26, 2016.
2. Jeffrey M. Jones, “Americans name economy, govern-ment as top problems,” Gallup News, March 10, 2016.
3. Deloitte, Digital government transformation, Deloitte, October 2015.
4. Center for Digital Government, “Essential digital ser-vices survey,” February 2017.
5. Ibid.
6. New Zealand Ministry of Business, Innovation and Employment, “How we work,” accessed November 2, 2017.
7. John O’Leary and Timothy Murphy, Beyond carrots and sticks: How state and local governments can use nudge thinking to improve outcomes, Deloitte University Press, May 16, 2017.
8. William D. Eggers, Jim Guszcza, and Michael Greene, Making cities smarter, Deloitte University Press, Janu-ary 23, 2017.
Endnotes Endnotes130 131
www.deloittereview.com
www.deloittereview.com
9. Performance.gov, “Cross-agency priority goals,” ac-cessed November 2, 2017.
10. Deloitte, Digital government transformation.
11. Connecticut Office of the State Comptroller, “Open-Checkbook,” accessed November 2, 2017.
12. Gerald C. Kane et al., Achieving digital maturity: Adapt-ing your company to a changing world, Deloitte Univer-sity Press, July 13, 2017.
13. Deloitte, How are digital trends reshaping government financial management organizations? Findings from De-loitte NASACT 2015 digital transformation survey, 2015.
14. Center for Digital Government, “Essential digital ser-vices survey.”
15. Allie Coyne, “Victoria gives Deloitte $43m to build IT for super service agency,” IT News, June 23, 2017.
16. Bob Meara, “Celent model bank 2016, Part II: Case studies in omnichannel banking,” Celent, April 2016.
17. Ibid.
18. Asha McLean, “Queensland to spend AU$40m on digi-tal transformation,” ZD Net, June 14, 2017.
19. Queensland Government, “What we have delivered,” accessed November 2, 2017.
20. Tobias Naegele, “Citizens expect a consumer-quality customer experience,” GovTechWorks, May 24, 2017.
21. William D. Eggers, Delivering on Digital: The Innovators and Technologies That Are Transforming Government (New York: Deloitte University Press/RosettaBooks, 2016), p. 80.
22. Ibid, p. 162.
23. Republic of Estonia, E-Residency, “What is e-Residen-cy?,” accessed November 2, 2017.
24. To use the card with a computer, the user must install a USB card reader available from the provincial government.
25. Province of British Columbia, “BC services card,” ac-cessed November 2, 2017.
26. Rob Shaw, “BC government building smartphone app to authenticate your identity,” Vancouver Sun, July 11, 2016.
27. Eggers, Delivering on Digital, p. 142.
28. Interview with David Bray, chief information officer, Federal Communications Commission, May 4, 2015.
29. Eggers, Delivering on Digital, p. 147.
30. Ibid, p. 153.
31. Ibid, p. 155.
32. Deloitte, “Michigan streamlines secure online services for citizens,” accessed November 2, 2017.
33. Michigan Department of Technology, Manage-ment and Budget, “Michigan digital strategy,” September 2014.
34. Province of British Columbia, “Data Management in BC,” accessed November 2, 2017.
35. Province of British Columbia, “Centre for data-driven innovation,” accessed November 2, 2017; Province of British Columbia, “BC Centre for Data Innovation: Final report of the working group,” November 2014.
36. Deloitte Digital, Case Study — JC Penney, http://www.deloittedigital.com/us/work/case_study/jcpenney.
37. Interaction Design Foundation, “What is design think-ing?,” accessed November 2, 2017.
38. Eggers, Delivering on Digital, p. 76.
39. Ibid, p. 77.
40. Amanda Clarke, “Digital government units: Origins, orthodoxy and critical considerations for public man-agement theory and practice,” Carleton University, July 12, 2017, p. 7.
41. Lorenzo Allio, “Design thinking for public service excel-lence,” UNDP Global Centre for Public Service Excel-lence, 2014, p. 16.
42. New York City Department of Information Technology and Telecommunications, “NYC government x design,” accessed November 2, 2017.
43. Peter Hutchinson and Steve Hurst, “Digital govern-ment: Great expectations, untapped potential,” Ac-centure Consulting, 2016, p. 4.
44. Clarke, “Digital government units: Origins, orthodoxy and critical considerations for public management theory and practice,” p. 13.
45. Mathieu Colas et al., “Measure for measure: The dif-ficult art of quantifying return on digital investments,” Capgemini Consulting, 2014, p. 7.
46. New Zealand State Services Commission, “Better pub-lic services result 9—Case study: IPONZ: Delivering better public services through business transforma-tion,” February 20, 2014.
47. Margaret McLachlan, “Project compass points IPONZ in the right direction,” Public Sector 37, no. 1 (2014).
48. William D. Eggers and Pankaj Kishnani, Compliance without tears: Improving the government-to-business experience, Deloitte University Press, August 24, 2016.
page 110
1. John Hagel, et al. The paradox of flows: Can hope flow from fear?, Deloitte University Press, December 13, 2016.
2. John Hagel, John Seely Brown, and Lang Davison, “Shaping strategy in a world of constant disruption,” Harvard Business Review, October 2008.
3. John Hagel, John Seely Brown, and Duleesha Kulasooriya, Scaling edges: A pragmatic pathway to broad internal change, Deloitte, 2012.
Endnotes Endnotes132 133
www.deloittereview.com

Contributing artists134
www.deloittereview.com
Contributing artists 135
DIETER BRAUNHamburg, Germany
NEIL WEBBBrighton, England
SONYA VASILIEFFSeattle, Washington
ANNA GODEASSIMilan, Italy
JON KRAUSEPhiladelphia, Pennsylvania
TRACI DABERKOSeattle, Washington
LIVIA CIVESStockholm, Sweden
MARIO WAGNERHamburg, Germany
RIKI BLANCOMadrid, Spain
DANA KUBLINSeattle, Washington
EMILY MOREANOSeattle, Washington
JOHN JAY CABUAYNew York, New York
| | | | | ||
|
||
||
||
||
||
||
||
|
||
||||||||||||
|
||
||
||
||
||
||
||
|
||
| | | | |
MARK MORSESeattle, Washington
CHRIS WADDENLondon, England
GWEN KERAVALLyon, France
JON KRAUSEPhiladelphia, Pennsylvania
www.deloittereview.com

136
THE END NOTE
{ What we think now }
{ What we said then }
“For all the rhetorical fireworks, the tyranny of the or is very often your best friend when seeking to break through from very good to truly exceptional. Prevailing over capable adversaries requires accepting and exploiting trade-offs, and very often seeking an advantage in only a very small number of very carefully identified ways, while frequently
accepting disadvantages along other dimensions.”
From “Pulling ahead vs. catching up: Trade-offs and the quest for exceptional profitability” By Michael Raynor and Mumtaz Ahmed
Published July 1, 2012
The core insight holds true. Of course, some organizations can break con- straints and ride a period of super-
normal profitability because they enjoy differentiation and low costs simulta-neously. But these are short-run aber-rations. In theory, in well-functioning markets, the competition always catches up, and companies find them-selves having to choose—having to once again cope with “or.” Innovation is about the “and.” Strategy is about the “or.”
The pursuit of growth becomes pathological when it leads companies to ignore tradeoffs. Companies seeking to grow at all costs can feel themselves pulled in the direction of compro-mising on trade-offs, believing they will be able to address a larger market. They can address a larger market—they just may not win. They typically end up pursuing profitless and ultimately value-destroying growth.
Deciding when growth isn’t worth the cost re- quires subtle, challenging, difficult judgment calls. Chances are, in tough choices you will find the
seeds of sustainable profitability. Don’t run away from them. Understand them deeply, and you may well conclude that the first order of business is to remain profitable, sustainable, and viable in the long haul. When the pursuit of growth requires watering down the strategic focus that has been a source of success to date, you might have to be willing to sacrifice that seemingly easy growth in the interests of preserving a viable and valuable strategic position.
It’s popular to hope it need not be one or the other—for example, growth or profits. But what we’ve dis-
covered empirically is, more often than not, you will find yourself having to make a tough choice. Don’t use the glamor of the pursuit of innovation as an excuse to avoid making the tough choices required by good strategy.•
MICHAEL RAYNOR Managing Director,
Monitor Deloitte
Deloitte Review is printed by a company that has been a long-term leader in environmental
responsibility.
The facility uses vegetable-based inks and alcohol-free chemistry in the pressroom.
Computer-to-plate technology replaces film and photographic chemicals in prepress
operations, with all metal plates collected and recycled.
The company was among the first printers in Western Canada to recycle its water-miscible
waste solvent, resulting in a reduced environmental impact. A chemical distiller allows the
facility to distill, recycle, and reuse the chemicals from its presses, eliminating the need
to send out hundreds of barrels of contaminated chemicals per year to be disposed of
or recycled.
Its paper-baling equipment recycles up to 40 tons per month of trimmings, vastly reducing
waste while capturing paper dust that affects air quality as well as product quality.
This issue of Deloitte Review is printed on Anthem Matte, resulting in these savings:*
Wood consumption: Reduced by 9.9 tons
Net energy use: Reduced by 27 million BTUs
Wastewater generation: Reduced by 30,350 gallons
Solid waste production: Reduced by 1,910 pounds
Greenhouse gases: Reduced CO2 by 6,682 pounds
*Source: Environmental Paper Network, papercalculator.org.

Follow @DeloitteInsight #DeloitteReview
www.linkedin.com/company/deloitte-insights
Subscribe to receive email updates at deloitte.com/insights