
Creative Cities and the Film Industry: Antalya's Transition to a ...

ARE CENTRAL CITIES MORE CREATIVE?THE INTRAMETROPOLITAN GEOGRAPHY
OF CREATIVE INDUSTRIES
RIC KOLENDAGeorgia State University
CATHY YANG LIUGeorgia State University
ABSTRACT: This paper examines the location and growth of creative industries within metropoli-tan areas. In recent years, the creative industries have been increasingly sought after as potentialengines of metropolitan economic growth. Although some research has been done on the locationdecisions by such firms and workers, it has primarily focused on interregional and intermetropoli-tan disparities. We use establishment-level data to investigate intrametropolitan (central city versussuburban) location and growth for creative industry establishments in 40 of the top 101 metropolitanstatistical areas (MSAs). We compared the number of employees and total annual payroll in eachlocation, and categorize them by region, population size, and creative employment growth. Findingssuggest that although creative industries are more centralized, they are decentralizing faster thanother industries in general, but this rate, and even the direction, varies widely across MSAs.
Much attention in recent economic development scholarship and practice has been placedon attracting creative workers and creative industries as an urban economic development tool(Donegan, Drucker, Goldstein, Lowe, & Malizia, 2008; Peck, 2005; Rausch & Negrey, 2006;Reese, Faist, & Sands, 2010; Reese & Sands, 2008; Sands & Reese, 2008). In the introductionto their symposium on the creative class theory, Reese and Sands (2008) suggested that theempirical work on the subject can be classified into three questions. First, is the theory valid,i.e., does growth in the creative class lead to economic growth (Donegan et al., 2008; Hoyman& Faricy, 2009; Rausch & Negrey, 2006; Rushton, 2006; Sands & Reese, 2008)? Second, whatis the nature and size of the creative class (Markusen, Wassall, DeNatale, & Cohen, 2008; Reeseet al., 2010)? And third, what policies should be pursued in implementing this strategy? Criticssuch as Jamie Peck have argued that creative class approaches constitute a “creativity cargo cult”that plays on the competitive insecurities of local leaders, and others have suggested that adoptingsuch strategies is both risky and premature, and have attempted to show theoretically and empir-ically that the reasoning behind them is flawed (Donegan et al., 2008; Hoyman & Faricy, 2009;
Direct correspondence to: Cathy Yang Liu, Georgia State University, P.O. Box 3992, Andrew Young School of PolicyStudies, Atlanta, GA 30338, USA. E-mail: [email protected].
JOURNAL OF URBAN AFFAIRS, Volume 00, Number 0, pages 1–25.Copyright C© 2012 Urban Affairs AssociationAll rights of reproduction in any form reserved.ISSN: 0735-2166. DOI: 10.1111/j.1467-9906.2011.00593.x

2 II JOURNAL OF URBAN AFFAIRS II Vol. 00/No. 0/2012
Reese & Sands, 2008; Sands & Reese, 2008). One such concern is the resulting “creativity gap,”or income inequality, along gender, place, and skill level (Negrey & Rausch, 2009).
Despite the controversies in the scholarly literature, economic development practitioners atstate and local level have been quick to embrace these approaches since the 1990s. Mayors inProvidence, RI and Austin, TX, among others, have touted creative class strategies as the keyto economic prosperity for their cities, and organizations have sprung up around the country topromote localities as creativity magnets (City of Providence, 2009; Peck, 2005; Wynn, 2011).Some examples of strategies used at the municipal level include a project to cultivate culturalspaces in the City of Philadelphia (Stern & Seifert, 2007, 2010), and “Creative New York,” aproject of the Center for an Urban Future (Keegan, Kleiman, Seigel, & Kane, 2005; Kleimanet al., 2001), which among other things highlighted work by the City of New York to address thelack of affordable artist workspace and housing. Smaller cities have undertaken such approachesas well. Providence, RI, an early adopter of the creative class strategy, laid out a detailed planfor nurturing creativity with six primary goals, and multiple strategies including the creation of acity department to promote and develop arts organizations, and tax-increment-financing to attractcreative firms to the city, among many others (City of Providence, 2009).
Although central city leaders have championed and implemented strategies to attract creativeindustries and creative workers, we know very little about the intrametropolitan spatial distributionof creative industries and their economic impact in central cities. Virtually all of the work doneon the location of creative workers and jobs has used the state or metropolitan area as thegeographic unit of analysis, with no distinction between central city and suburban areas. It maybe argued that this core-periphery dichotomy is not very important, because economic decisionson firm location may in fact be made on the basis of the assets of the metropolitan area, andthe economic benefits of these decisions are likely to be evaluated on that level as well. Thismetropolitan focus might be appropriate, except for the problem of jurisdictional fragmentation.Not only does this fragmentation create fiscal challenges regarding the distribution of costs andbenefits of economic development policies (Storper, 2010), but it may actually impact the levelof employment decentralization (Glaeser, Kahn, & Chu, 2001; Glaeser & Kahn, 2001). Thus,we ask the question: are central cities actually more creative than their suburban counterpartsby hosting a higher market share of creative industries, and experiencing higher growth in theseindustries as well?
Creative industries have been shown to play an important role in economic growth, thoughits definition is subject to discussion. Markusen et al. (2008) used industrial and occupationalcategories, as did Reese et al. (2010). Although both included creative industries such as artists,musicians, and writers, Reese and colleagues also included education and high technology in-dustries. We focus here on three key sectors in particular: information (including publishing andinformation technology); arts, entertainment, and recreation; and professional, scientific, andtechnical services. Each has demonstrated important contributions to economic growth over thelast decade, and this trend is likely to continue. According to the latest report on the high-techeconomy in North America by the Milken Institute, by 2003 these industries had begun a rapidrecovery, suggesting that they will likely lead the current recovery as well (DeVol, Klowden,Bedroussian, & Yeo, 2009). Similarly, arts and cultural industries have shown major contribu-tions to growth. The 2007 national study by Americans for the Arts showed that the nonprofit artsand culture industry generates annual economic activity of $166.2 billion, up 24% since their 2002study; full time employment increased over 17% to 5.7 million (Americans for the Arts, 2007a).This activity also produced a net fiscal gain to federal, state, and local government of about$26 billion (Americans for the Arts, 2007b).
Much as Porter (1997) argued for the competitive advantage of the inner city in general, Hutton(2004) argues that this advantage is especially present for “New Economy” industries dependent

II Creative Central Cities II 3
on “the innovative milieu of the inner city” (p. 92). Do creative industries cluster in central cities,or are their location decisions driven by the same forces that have led to the employment de-centralization witnessed over the past 50 years? Are these industries leading a “back-to-the-city”movement, or simply following larger trends? In what follows, we first review the relevant liter-ature on employment decentralization and the relative locational decisions of creative industriesat various geographic scales, thus deriving hypotheses on their intrametropolitan distribution andgrowth. We then describe the data and methods used to examine the growth and location ofcreative industries in a sample of 40 metropolitan areas in the United States during the periodbetween 1998 and 2002. Next we present a series of findings on the changing intrametropolitandistribution and growth of the employment and annual earnings of creative industries and how itvaries with region and city size. Finally, we conclude with a discussion of the implications ourfindings might have for economic development planning in cities and metropolitan areas, andsome suggestions for future research.
REVIEW OF LITERATURE
This study bridges two streams of literature in the field: that on intrametropolitan employmentlocation—or more explicitly, employment decentralization—and that which looks specifically atthe location of creative industries within metropolitan areas. By synthesizing these two frame-works, we hope to make an important and unique contribution to our understanding of thelocational patterns of establishments in creative industries.
Employment Decentralization
Suburbanization, the process of urban decentralization that became a major phenomenon inthe postwar era in the United States, has been studied extensively. The two main theories in theliterature about the causes of suburbanization are the natural evolution theory and the “flight-from-blight” theory (Mieszkowski & Mills, 1993). The natural evolution theory suggests thatsuburbanization is a natural result of initial centralization and the filtering that comes as housingstock and other infrastructure age and wealth increases, leading to a pull to areas with more landand newer amenities. Flight-from-blight, as the name suggests, describes push factors createdby the social problems in central cities, most notably crime, concentrated poverty, and decliningpublic schools. Public policy contributed to suburbanization in a number of ways, but mostnotably through a combination of transportation policies favoring private vehicles, tax incentivesoriented toward new construction, and local land use controls that reinforced class and racialsegregation in suburban communities (Dreier, Mollenkopf, & Swanstrom, 2004).
Decentralization of employment in American metropolises accelerated in the second half ofthe 20th century and recent statistics show that this trend is not slowing: a quarter of central citiesexperienced job losses and more than three quarters lost their private sector employment shareto suburbs between 1993 and 1996 (Brennan & Hill, 1999). In 1996 a third of people workedmore than 10 miles from the city center (Glaeser et al., 2001). Recent statistics show that mostemployment (72%) is located more than 5 miles from central business districts (CBDs) (Raphael& Stoll, 2010).
Although the causes of employment decentralization are still not completely clear, studies dosuggest that population size of the metropolitan area (Kneebone, 2009), residential location ofworkers, region, industrial specialization, and level of education are all related to employmentconcentration (Glaeser et al., 2001; Glaeser & Kahn, 2001). According to Glaeser and Kahn(2001), by many measures the Midwest was the most decentralized, and the South was somewhat
4 II JOURNAL OF URBAN AFFAIRS II Vol. 00/No. 0/2012
more centralized than the Midwest. Within this general pattern, cities specializing in serviceindustries are more centralized, and those with more manufacturing spread out to the suburbanareas. Relatively insensitive to knowledge spillover and other proximity advantages of centralcities, manufacturing firms are attracted to the suburbs for cheaper land rents, convenient trans-portation, and lower congestion. In addition, and possibly most relevant to this study, Glaeserand Kahn (2001) found that idea-intensive industries, and those employing a highly educatedworkforce, tend to locate in central cities.
Creative Industries in the Metropolitan Areas
Before discussing the issue of location for creative industries, it is important to consider theparameters that define them. These industries differ from other industries in that they tend to focuson artistic objectives over (or at least equal to) monetary values, tend to be smaller enterprises,and tend to be organized around projects using temporary workers (Bagwell, 2008). Many haveargued that software development, part of the information industry, should not be included amongcreative or cultural industries (Garnham, 2005; Markusen et al., 2008). However, much softwaredevelopment is increasingly creative in the traditional sense, as interface design, graphic design,and animation become larger components of the industry. Hesmondhalgh and Pratt (2005) makethe case for at least some new media industries being included in their definition, noting theimportance of the aesthetic qualities of their products, as well as “the unclear and malleablenature of the skills required, and the project-based nature of the work” (p. 9). These industriestend to be more centralized than average. Kneebone, who revisited Glaeser and Kahn’s work onjob sprawl, showed higher rates of centralization for creative industries (Kneebone, 2009). Shefound that information; professional, scientific, and technical services; and health care and socialassistance jobs locate in central cities, and educational services are distributed equally throughoutthe metropolitan area, although other industries are more likely to locate in suburbs. This is likelythe result of the need for close proximity to better facilitate information flows necessary to theseindustries.
The importance of urban place has been considered for some time, but we still know littleabout the actual industrial location distribution within the metropolis. Allen Scott and RichardFlorida have both suggested the importance of cities to economic activity in the informationeconomy. Scott (2006, 2008) focuses on labor specialization and cultural production. Laborspecialization, according to Scott, in an increasingly global economy, requires agglomeration(or spatial concentration) to achieve the flexible specialization required to compete in the neweconomy (2006, p. 3). In addition, he argues that ideally there should be a balance between theseproduction systems and urban cultural assets (2006, p. 10). The combination of the two tends toadvantage larger cities, but there are notable exceptions where specialized industries exist (2006,p. 9). Labor flexibility is also a theme of Neff, who studied the importance of networks in theproject-based and short-term relationships of new media workers in New York City (Neff, 2005).
Florida (2002, 2003) emphasizes “place” as an organizing unit, a preexisting condition at-tracting or repelling a creative workforce. Inspired by Jane Jacobs and others, Florida suggeststhat the right combination of amenities will make cities attractive to creative workers, and henceto the industries that employ them. And because the amenities desired—“abundant high-qualityexperiences, an openness to diversity of all kinds, and above all else, the opportunity to validatetheir identities as creative people” (Florida, 2003, p. 9)—tend to exist in urban centers rather thanthe periphery of the metropolis, central cities would be expected to capitalize on this advantage.
Pratt (2000) showed the importance of social networks to the location of creative industries.Using a detailed analysis of the new media industry in New York’s Silicon Alley, he argues thatdespite the fact that traditional reasons for agglomeration—e.g., the minimization of transactioncosts—are not applicable, spatial proximity was very important to this industry because of

II Creative Central Cities II 5
the desire for “face-to-face communication of a formal and informal, planned, chance, andserendipitous nature” (p. 434). It is this very type of communication that others have identifiedas well. Neff (2005), Currid (2007), and Currid and Williams (2010a) demonstrated that thesesocial interactions went beyond the workplace and into the streets and bars, suggesting theimportance of knowledge spillovers and residential proximity to work. Currid pointed to fourspecific reasons that socializing was important to creative industries: the opportunity for cross-subgroup interactions, networking for job opportunities, access to cultural gatekeepers (such ascritics and industry leaders), and creating support networks (Currid, 2007). In addition, spatialproximity for cultural industries is especially important because the value of production is moretaste-driven than performance-driven, and due to a preference for consuming, forming tastes for,and sharing cultural goods collectively (Currid & Williams, 2010a). Markusen looked at artsoccupations, and found that artists, especially in the performing arts, tend to favor central citylocations (Markusen, 2006).
Hutton summarizes the theories for the inner-city preference of creative industries, pointingto several factors that advantage the urban core. These include agglomeration effects, a skilledworkforce, a unique urban form, and a concentration of institutions and amenities favored by theirworkforce, all suggesting what should be a competitive edge for central cities (Hutton, 2009).
Others have looked at how these agglomeration effects work in creative industries. Industrialagglomeration is important, because it is directly linked to high density, and hence urban con-centration. Currid and Williams (2010b) used zip code level data and GIS mapping to look atgeographic clusters of cultural industries. They found that the cultural industries they looked attended to concentrate in fairly dense areas, such as downtown Manhattan, Beverly Hills, andSanta Monica. They posit two possible reasons for this concentration: the desire for an immediateconsumer base, and hence a concentration of demand; and the need for cultural institutionalinfrastructure within which workers could produce their art. Florida, Mellander, and Stolarick(2009) identified similar clusters of complementary creative industries, though they looked onlyat the intermetropolitan level for 297 U.S. metropolitan statistical areas (MSAs). One study look-ing at intrametropolitan location of artists, a specific group of creative workers, was done byRushton (2006, 2009), who showed that concentrations of artists in the city core were associatedpositively and significantly with both human capital and per capita income growth.
Despite these studies, systematic examination of the intrametropolitan location of creativeindustries and their economic impact is lacking. Answering the question of intrametropolitandistribution for creative industries will not only deepen our understanding of the employmentgrowth and economic development potential of this sector in central cities and their suburbs, butalso inform policymakers interested in attracting or retaining creative industries in cities to bettertarget their strategies based on specific location patterns.
DATA AND METHODOLOGY
Data and Sample
To examine the spatial organization of creative industries and workers, we use the CountyBusiness Patterns Special Extracts (CBPSE) of the State of the Cities Data System (SOCDS),which had been used previously to assess the intrametropolitan distribution of employmentin general and the financial sector in particular (Hill & Brennan, 2005; Immergluck, 2001).This data set is particularly useful for our purposes, because it gives us three key variablesfor both the MSA and associated central city: number of establishments (not firms, which canhave multiple establishments), number of employees, and total annual payroll.1 There are twoimportant drawbacks to the CBPSE data, however. First, there are large numbers of suppressed

6 II JOURNAL OF URBAN AFFAIRS II Vol. 00/No. 0/2012
observations, making cross-metropolitan comparisons difficult in many cases. In addition to thislimitation, detail for each industry is lacking, with only two- and three-digit NAICS codes foreach variable.
After exploring several ways to overcome the obstacle of suppressed observations, we choseinstead to limit the analysis to cities and MSAs without any suppressed observations at thetwo-digit NAICS level. Of the remaining 48 MSAs, we further eliminated the MSAs that have apredominant central city (greater than 80% of MSA jobs in central city) or an extremely weakcentral city (less than 15% of MSA jobs in central city), following the example of previousliterature (Immergluck, 2001). This left us with a sample of 40 MSAs covering 44 central cities(four MSAs have two central cities). The list of cities by geographic region is in Appendix A.The cities represent a relatively representative cross-section of U.S. cities in terms of regionaldistribution with a total city population of over 32.5 million.
The time periods for our analysis are 1998 and 2002. These years were chosen becausethey were the largest and most recent range possible for consistent industrial codes and MSAdesignations. Note that 1998 was the first year in which the NAICS codes were in place, and theprevious SIC codes were inadequate to serve our purposes, as they are relatively crude in definingservice industries. Meanwhile, in 2002, a major revision of the metropolitan and micropolitanCore Based Statistical Areas (CBSAs) was implemented, making the size and number of MSAsnoncomparable to previous data. Finally, at the time this data set was drawn, 2004 was the latestyear for which data were available, making the period under both new systems only 2 years.Given these data constraints, we decided to use the period between 1998 and 2002 for consistentindustrial codes and MSA definitions. This period begins with the economic expansion duringthe 1990s and ends with the early 2000 recession, during which time the information sectormight have experienced slower growth. As was discussed earlier, the definitions of creative andcultural industries are still being developed, and thus we chose to use a rather broad definition.We include three industry categories: information; professional, scientific, and technical services;and arts, entertainment, and recreation industries (see Appendix B for detailed NAICS codes). Weunderstand that not all workers in creative industries are in fact creative workers, but in this paperwe are concerned with the locational distribution and economic impact of creative businesses,not of creative workers.
Methodology
As stated earlier, the subject of this paper is the geography of creative industries within themetropolitan region, and their economic impact and performance in cities and suburbs. On thebasis of the literature, we expect to see higher concentrations of creative industries and workersin the urban core, and that they will decentralize at a lower rate than other industries (Glaeseret al., 2001; Glaeser & Kahn, 2001; Kneebone, 2009). More specifically, we examine the locationalpatterns for three industrial sectors broadly considered to make up the largest part of creativeindustries. We trace the number of workers and total annual payrolls for cities and their suburbs,and assess the level of centralization or decentralization that is occurring in these industries andchange over time. We also look at how these trends vary by region and size of the MSAs. Previousresearch suggests that regional differences exist, with the Northeast and South being somewhatmore centralized in general than the Midwest and West (Glaeser et al., 2001; Glaeser & Kahn,2001), and that larger cities are generally more decentralized (Kneebone, 2009). An overviewof the growth in these industries for the United States as a whole and for our selected sample ispresented in Table 1.
The results seemed to confirm both the sample validity and the increasing importance ofcreative industries in the overall economy. For the United States as a whole, creative industrieshired close to 11 million workers in 1998 (or 10% of all workers) and more than 12 million

II Creative Central Cities II 7
TABLE 1
Size and Growth of Employment and Annual Payroll by Industry, 1998–2002
Employment Total Annual Payroll ($1,000s)
% change % changeIndustry 1998 2002 1998–2002 1998 2002 1998–2002
U.S. total All industries 108,117,731 112,400,654 4.0% 3,309,405,533 3,943,179,606 19.2%All creative
industries10,777,376 12,383,316 14.9% 460,507,291 604,579,513 31.3%
Information 3,141,957 3,536,120 12.5% 146,822,075 188,076,999 28.1%Professional
services6,051,636 7,046,205 16.4% 277,640,216 368,778,137 32.8%
Arts andentertainment
1,583,783 1,800,991 13.7% 36,045,000 47,724,377 32.4%
Sample All industries 29,153,158 30,336,794 4.1% 964,613,245 1,158,341,816 20.1%MSAs All creative
industries3,425,173 3,931,384 14.8% 157,010,265 210,737,338 34.2%
Information 987,246 1,095,911 11.0% 51,928,921 67,635,088 30.2%Professional
services1,963,581 2,296,405 16.9% 91,547,782 125,265,769 36.8%
Arts andentertainment
474,346 539,068 13.6% 13,533,562 17,836,481 31.8%
Source: Authors’ calculations of County Business Patterns Special Extracts of the State of the Cities Data System, 1998and 2002.
workers in 2002 (or 11% of all workers). The growth rate for jobs in this sector is 15% overthe 4-year period, which is significantly greater than the 4% of all jobs in the country. In our40-city sample, creative employment represents close to 12% of all employment in 1998 and13% in 2002, giving credence to the sample as being representative of the population. The growthrate figures are almost identical to national figures as well. Of the three industries considered,professional services registered the highest growth rate, followed by arts and entertainment, theninformation. Creative industries payroll makes up about 14% of total payroll in 1998 (or 16% forthe sample) and about 15% of total payroll in 2002 (or 18% for the sample), signaling the aboveaverage pay of creative jobs. Payroll grew at an even greater rate than employment in the creativesector, at 31% for U.S. total and 34% for our selected sample, outpacing that of overall payrollearnings.
FINDINGS
Importance of Creative Industries in Central Cities
Table 2 shows that for 2002, the share of central city employment held by creative industriesaveraged 14.5%, with a high of nearly 25% for San Francisco and a low of 7.7% for Stockton, CA.Five of the top six central cities with the most centralized creative industries—San Francisco, SanDiego, Seattle, Los Angeles/Long Beach, and San Jose—were in the west. At the same time, fourof the bottom six were in the west—Stockton, CA; Tacoma, WA; Riverside/San Bernardino, CA;and Spokane, WA—with two Midwestern cities—Fargo, ND and Grand Rapids, MI—roundingout the bottom. Although creative industries as a whole represent a 14% share of central city jobs,they make up nearly 21% of the total payroll in central cities. Again, San Francisco and Stocktonheld the top and bottom positions across all cities, at 31.7% and 8.5%, respectively.

8 II JOURNAL OF URBAN AFFAIRS II Vol. 00/No. 0/2012
TAB
LE
2
Sh
are
of
Cre
ativ
eE
mp
loym
ent
and
Ear
nin
gs
inC
entr
alC
itie
s,20
02
Cre
ativ
e%
ofA
llA
llE
arni
ngs
Cre
ativ
eE
arni
ngs
%of
all
Avg
.all
Avg
.Cre
ativ
eC
entr
alC
ityA
llJo
bsJo
bsJo
bsR
ank
($1,
000s
)($
1,00
0s)
Ear
ning
sR
ank
Ear
ning
s($
)E
arni
ngs
($)
San
Fran
cisc
o50
1,76
812
5,01
124
.9%
128
,458
,818
9,02
6,57
431
.7%
156
,717
72,2
06S
anD
iego
626,
988
123,
806
19.7
%2
26,4
22,3
727,
483,
054
28.3
%2
42,1
4260
,442
Orla
ndo
229,
007
42,1
0718
.4%
37,
806,
345
1,75
2,75
622
.5%
634
,088
41,6
26S
eattl
e41
7,02
871
,709
17.2
%4
19,1
52,5
354,
262,
207
22.3
%7
45,9
2659
,438
Los
Ang
eles
/Lon
gB
each
1,58
8,65
727
1,83
017
.1%
565
,606
,141
17,1
10,7
8126
.1%
341
,297
62,9
47
San
Jose
334,
297
53,8
1616
.1%
619
,111
,470
4,04
5,94
421
.2%
1057
,169
75,1
81C
hica
go1,
177,
807
189,
253
16.1
%7
54,3
14,3
4413
,049
,406
24.0
%5
46,1
1568
,952
Mia
mi
210,
278
33,1
1715
.7%
88,
414,
450
2,08
1,73
924
.7%
440
,016
62,8
60P
ittsb
urgh
314,
093
48,6
7915
.5%
912
,413
,517
2,69
7,01
021
.7%
839
,522
55,4
04D
alla
s76
7,03
711
3,29
414
.8%
1032
,819
,265
6,97
7,50
821
.3%
942
,787
61,5
88C
leve
land
259,
954
38,1
4114
.7%
1110
,449
,445
2,14
8,63
220
.6%
1140
,197
56,3
34S
acra
men
to20
4,67
629
,901
14.6
%12
7,24
4,41
11,
464,
402
20.2
%12
35,3
9548
,975
Cha
rlest
on59
,285
8,49
414
.3%
131,
700,
452
291,
387
17.1
%18
28,6
8334
,305
Por
tland
62,9
798,
788
14.0
%14
2,23
0,29
440
9,67
318
.4%
1535
,413
46,6
17S
altL
ake
City
229,
855
31,4
7613
.7%
158,
139,
390
1,50
5,26
718
.5%
1435
,411
47,8
23C
harlo
tte44
3,24
660
,172
13.6
%16
18,3
82,2
693,
263,
429
17.8
%17
41,4
7254
,235
Mad
ison
145,
170
18,4
4212
.7%
174,
975,
973
812,
101
16.3
%20
34,2
7744
,035
Oak
land
163,
311
20,0
6612
.3%
186,
848,
206
1,24
5,61
118
.2%
1641
,934
62,0
76O
mah
a28
4,70
934
,950
12.3
%19
9,84
5,40
51,
683,
952
17.1
%19
34,5
8148
,182
Buf
falo
144,
855
17,6
0612
.2%
204,
660,
547
644,
958
13. 8
%27
32,1
7436
,633
Lexi
ngto
n-Fa
yette
139,
587
16,4
4811
.8%
214,
375,
222
677,
548
15.5
%23
31,3
4441
,193
Col
umbi
a11
3,60
913
,176
11.6
%22
3,66
1,45
556
0,19
715
.3%
2432
,229
42,5
16P
hoen
ix/M
esa
825,
378
95,6
1611
.6%
2327
,601
,697
4,28
1,08
415
.5%
2233
,441
44,7
74Tu
cson
198,
421
22,6
7411
.4%
245,
643,
822
1,05
1,81
118
.6%
1328
,444
46,3
88B
altim
ore
286,
965
32,3
1211
.3%
2511
,279
,616
1,76
5,02
215
.6%
2139
,307
54,6
24Je
rsey
City
88,8
689,
919
11.2
%26
5,11
8,07
659
8,05
311
.7%
3057
,592
60,2
94
(Con
tinue
d)

II Creative Central Cities II 9
Tab
le2.
Con
tinue
d
Cre
ativ
e%
ofA
llA
llE
arni
ngs
Cre
ativ
eE
arni
ngs
%of
all
Avg
.all
Avg
.Cre
ativ
eC
entr
alC
ityA
llJo
bsJo
bsJo
bsR
ank
($1,
000s
)($
1,00
0s)
Ear
ning
sR
ank
Ear
ning
s($
)E
arni
ngs
($)
Pro
vide
nce
102,
665
11,3
6211
.1%
273,
777,
297
536,
882
14.2
%26
36,7
9247
,252
Jack
sonv
ille
397,
861
41,1
4610
.3%
2813
,077
,656
1,86
8,51
614
.3%
2532
,870
45,4
12M
obile
118,
254
11,6
869.
9%29
3,32
9,18
540
1,37
312
.1%
2928
,153
34,3
46B
aker
sfiel
d90
,792
8,96
99.
9%30
2,77
9,04
330
0,81
610
.8%
3330
,609
33,5
40W
ilmin
gton
99,1
659,
308
9.4%
315,
034,
657
504,
718
10.0
%36
50,7
7154
,224
Tole
do14
0,24
813
,088
9.3%
324,
613,
052
451,
499
9.8%
3832
,892
34,4
97Fr
esno
155,
178
14,2
599.
2%33
4,64
2,55
748
7,76
910
.5%
3529
,918
34,2
08S
anta
Ana
/Ana
heim
322,
959
29,5
069.
1%34
11,0
75,8
201,
426,
320
12.9
%28
34,2
9548
,340
Spo
kane
109,
320
9,87
59.
0%35
3,34
7,46
137
5,46
111
.2%
3230
,621
38,0
21G
rand
Rap
ids
126,
089
11,3
809.
0%36
4,44
4,14
447
6,46
010
.7%
3435
,246
41,8
68Fa
rgo
66,1
525,
954
9.0%
371,
941,
254
192,
927
9.9%
3729
,345
32,4
03R
iver
side
/San
Ber
nard
ino
150,
881
13,2
918.
8%38
4,46
6,06
250
3,65
411
.3%
3129
,600
37,8
94
Taco
ma
88,2
617,
497
8.5%
392,
986,
356
273,
518
9.2%
3933
,836
36,4
84S
tock
ton
78,5
466,
021
7.7%
402,
368,
319
200,
551
8.5%
4030
,152
33,3
09
Tota
ls11
,864
,199
1,72
4,14
514
.5%
474,
558,
400
98,8
90,5
7020
.8%
39,9
9957
,356
Info
rmat
ion
488,
814
4.1%
28,1
67,6
265.
9%57
,624
Pro
fess
iona
lser
vice
s1,
030,
939
8.7%
62,0
75,9
3513
.1%
60,2
13A
rts
and
ente
rtai
nmen
t20
4,39
21.
7%8,
647,
009
1.8%
42,3
06
Sou
rce:
Aut
hors
’cal
cula
tions
ofC
ount
yB
usin
ess
Pat
tern
sS
peci
alE
xtra
cts
ofth
eS
tate
ofth
eC
ities
Dat
aS
yste
m,1
998
and
2002
.

10 II JOURNAL OF URBAN AFFAIRS II Vol. 00/No. 0/2012
Looking at the aggregate numbers by industry, we see variations across creative industries. Theoverall share of creative industries in central cities is largely driven by professional, scientific,and technical services at 8.7%; only 1.7% was in arts, entertainment, and recreation. Relativepayrolls also varied, with professional services comprising 13.1% of total payroll with only 8.7%of the total number of jobs. Information also has a higher percentage of payroll than its share ofjobs, but to a lesser extent (5.9% of payroll with 4.1% of jobs). Arts and entertainment had onlya slightly higher portion of total payroll than its share of jobs, with 1.8% of earnings for 1.7% ofthe jobs. This indicates the relative pay premium of creative jobs in central cities.
Further calculating the average pay for a typical job versus a typical creative job in the centralcity reveals that this is indeed the case. Although intercity variations exist, the average job inthe central city paid close to $40,000 in 2002. In comparison, an average creative job pays$57,356, with professional services being the highest at $60,213, and arts and entertainmentbeing the lowest at $42,306. These results demonstrate the economic clout that creative jobshave on central city economies, and the potential economic impact such jobs can bring under acreative-oriented strategy. However, it is worth noting that professional service and informationemployment features much higher pay scales than the arts and entertainment industry. Thus, it isimportant to distinguish among these subsectors.
Intrametropolitan Distribution and Growth of Creative Industries
Although central cities were home to 39.5% of MSA jobs in 1998 and 39.1% in 2002, thecreative industries in general were slightly more centralized (45.4% in central cities in 1998 and43.9% in 2002, Table 3). Of the three industries, information was the most centralized in bothyears (49% in 1998 and 44.5% in 2002) although arts and entertainment was the least centralized(35.1% in 1998 and 37.9% in 2002), contrary to what the literature would suggest (Currid &Williams, 2010b; Florida et al., 2009; Rushton, 2006, 2009). This industry however experienceda slight centralizing trend during this period, the reverse of all industries combined, as well as theother two creative industries. A higher percentage of creative industry payroll was concentratedin central cities than the total payroll of all industries. With the exception of information, centralcity share of payroll for each industry and all combined was higher than share of jobs, suggestingthat earnings are generally higher in city centers. The greatest disparity is observed for artsand entertainment, where close to 50% of industry earnings were concentrated in central citiesalthough less than 40% of jobs in this industry were. The literature does not suggest a directrationale for this disparity, but we do know that incomes in the arts are generally lower on average(Markusen, 2006), a finding reflected in our data. In the sample, average income was around$42,000, only slightly higher than that for all jobs ($40,000), but much lower than for othercreative industries, which were closer to $60,000 on average (see Table 2).
Table 4 shows the intercity variation in central city’s share of MSA creative jobs as comparedto its share of MSA total jobs for both 1998 and 2002, as well as percentage point changeover time. Figure 1 further plots the percentage change in the share of creative jobs in centralcities against change in the share of all jobs in the central city for the 40 MSAs in the period1998–2002. The X-axis represents change in central cities’ share of jobs in all sectors, and theY-axis is change in the central cities’ share of jobs in creative industries. We divided the plot intoquadrants according to the change in share of employment in each of the two industry groups.The diagonal dashed line dividing quadrants B and D, further divides them by the relative rateof centralization or decentralization. This dividing line represents the null hypothesis, that thereis no difference between the rate and direction of change in the concentration of creative jobsin the central city and those of all jobs. Therefore, creative industry jobs in the MSAs above and to

II Creative Central Cities II 11
TAB
LE
3
Cen
tral
Cit
yS
har
eo
fM
SA
Em
plo
ymen
tan
dA
nn
ual
Pay
roll
byIn
du
stry
Em
ploy
men
tTo
talA
nnua
lPay
roll
1998
2002
1998
2002
%po
intc
hang
e%
poin
tcha
nge
Sha
reJo
bsS
hare
Jobs
1998
–200
2S
hare
Pay
roll
Sha
reP
ayro
ll19
98–2
002
All
indu
strie
s39
.5%
11,5
28,5
2639
.1%
11,8
64,1
99−0
.4%
41.1
%39
6,93
3,85
241
.0%
474,
558,
400
−0.1
%A
llcr
eativ
ein
dust
ries
45.4
%1,
553,
913
43.9
%1,
724,
145
−1.5
%48
.7%
76,5
40,3
0046
.9%
98,8
90,5
70−1
.8%
Info
rmat
ion
49.0
%48
3,50
044
.6%
488,
814
−4.4
%44
.9%
23,3
38,9
0541
.6%
28,1
67,6
26−3
.3%
Pro
fess
iona
lser
vice
s46
.0%
904,
139
44.9
%1,
030,
939
−1.1
%51
.0%
46,6
49,4
2849
.6%
62,0
75,9
35−1
.4%
Art
san
den
tert
ainm
ent
35.1
%16
6,27
437
.9%
204,
392
2.8%
48.4
%6,
551,
967
48.5
%8,
647,
009
0.1%
Sou
rce:
Aut
hors
’cal
cula
tions
ofC
ount
yB
usin
ess
Pat
tern
sS
peci
alE
xtra
cts
ofth
eS
tate
ofth
eC
ities
Dat
aS
yste
m,1
998
and
2002
.

12 II JOURNAL OF URBAN AFFAIRS II Vol. 00/No. 0/2012
TABLE 4
Change in Central City’s Share of MSA Jobs
Central City Share All Jobs Central City Share Creative Jobs Diff in PlotMSA/PMSA/NECMA 1998 2002 Change 1998 2002 Change Change Region
Buffalo–NiagaraFalls, NY MSA
31.3% 30.8% −0.5% 38.2% 43.6% 5.4% 5.9% A
Toledo, OH MSA 50.8% 50.0% −0.8% 55.9% 58.9% 2.9% 3.8%Cleveland–Lorain–
Elyria, OHPMSA
27.4% 26.0% −1.4% 39.4% 40.4% 1.1% 2.4%
Orange County, CAPMSA
24.2% 23.3% −0.8% 15.3% 16.5% 1.3% 2.1%
Miami, FL PMSA 25.8% 25.6% −0.2% 34.7% 35.5% 0.8% 1.0%Bakersfield, CA
MSA52.5% 58.9% 6.4% 55.6% 65.9% 10.3% 3.9% B1
Portland, MENECMA
40.9% 42.4% 1.5% 49.7% 55.0% 5.2% 3.8%
Orlando, FL MSA 24.2% 28.9% 4.6% 28.8% 35.8% 7.0% 2.4%Charlotte–
Gastonia–RockHill, NC–SC MSA
52.3% 56.1% 3.8% 69.3% 75.3% 6.0% 2.2%
Mobile, AL MSA 60.0% 60.1% 0.1% 70.0% 70.8% 0.9% 0.8%Los Angeles–Long
Beach, CA PMSA41.2% 41.9% 0.7% 40.7% 40.9% 0.2% −0.5% B2
Fargo–Moorhead,ND–MN MSA
73.6% 74.9% 1.3% 83.2% 83.3% 0.2% −1.1%
Salt LakeCity–Ogden, UTMSA
37.1% 38.7% 1.6% 47.1% 46.7% −0.4% −2.0% C
Madison, WI MSA 63.2% 64.0% 0.8% 72.2% 70.4% −1.8% −2.6%San Jose, CA
PMSA37.2% 37.3% 0.1% 33.8% 30.9% −2.8% −3.0%
Charleston, WVMSA
51.0% 52.2% 1.1% 75.3% 72.9% −2.4% −3.6%
Wilmington–Newark, DE–MDPMSA
31.3% 32.0% 0.6% 34.1% 30.9% −3.2% −3.8%
Fresno, CA MSA 62.7% 63.7% 1.0% 72.9% 68.7% −4.2% −5.2%Seattle–Bellevue–
Everett, WAPMSA
34.8% 35.2% 0.4% 43.4% 38.3% −5.1% −5.5%
Spokane, WA MSA 63.1% 66.6% 3.5% 75.9% 66.3% −9.5% −13.0%Tucson, AZ MSA 73.7% 67.7% −6.0% 74.6% 73.5% −1.1% 4.9% D1San Francisco, CA
PMSA55.2% 53.4% −1.8% 60.3% 59.9% −0.5% 1.3%
Lexington, KY MSA 65.2% 62.9% −2.3% 82.3% 81.2% −1.1% 1.2%Omaha, NE–IA
MSA77.4% 76.2% −1.2% 81.2% 80.4% −0.8% 0.3%
Riverside–SanBernardino, CAPMSA
17.8% 16.5% −1.4% 20.3% 18.8% −1.4% −0.1% D2
Baltimore, MDPMSA
30.1% 27.3% −2.8% 27.3% 24.4% −2.9% −0.2%
(Continued)

II Creative Central Cities II 13
Table 4. Continued
Central City Share All Jobs Central City Share Creative Jobs Diff in PlotMSA/PMSA/NECMA 1998 2002 Change 1998 2002 Change Change Region
Providence–Warwick–Pawtucket, RINECMA
26.6% 26.5% −0.1% 35.6% 35.0% −0.5% −0.5%
Sacramento, CAPMSA
34.6% 34.4% −0.2% 38.6% 37.8% −0.8% −0.6%
Pittsburgh, PA MSA 30.8% 30.2% −0.6% 43.7% 42.5% −1.2% −0.7%Columbia, SC MSA 47.3% 46.7% −0.6% 56.9% 55.6% −1.3% −0.7%San Diego, CA MSA 59.2% 57.9% −1.3% 74.2% 72.1% −2.0% −0.8%Oakland, CA PMSA 17.1% 16.8% −0.3% 15.6% 14.3% −1.3% −1.0%Jacksonville, FL
MSA83.1% 81.8% −1.3% 85.9% 83.6% −2.4% −1.1%
Chicago, IL PMSA 32.0% 31.4% −0.6% 43.9% 41.8% −2.2% −1.6%Stockton–Lodi, CA
MSA49.0% 48.8% −0.2% 61.6% 59.3% −2.3% −2.1%
Jersey City, NJPMSA
39.3% 38.3% −1.0% 51.9% 48.7% −3.1% −2.1%
Tacoma, WA PMSA 46.9% 44.2% −2.7% 52.9% 45.8% −7.1% −4.4%Phoenix–Mesa, AZ
MSA61.0% 59.4% −1.6% 67.5% 61.3% −6.2% −4.6%
Grand Rapids–Muskegon–Holland, MIMSA
26.2% 24.1% −2.1% 39.4% 32.7% −6.7% −4.6%
Dallas, TX PMSA 45.8% 41.8% −3.9% 55.6% 46.0% −9.6% −5.6%All sample MSAs 39.5% 39.1% −0.4% 45.4% 43.9% −1.5% −1.1%
Source: Authors’ calculations of County Business Patterns Special Extracts of the State of the Cities Data System, 1998 and2002.
the left of this line (regions A, B1, and D1) are either centralizing more rapidly, or decentralizingless rapidly, than employment in general.
The central cities more successful in expanding or maintaining creative industry employmentrelative to suburban areas are in D1, where the share of metropolitan employment decreased forall jobs in the central city, but the cities’ share of creative jobs decreased at a lower rate; A,where the central cities’ share of creative jobs increased, although decreasing for all jobs; andB1, where the share increased for all jobs in the central city, but cities’ share of creative jobsincreased at a higher rate. Central cities less successful in expanding or maintaining creativeindustry employment relative to the suburban areas were found in B2, where the share for all jobsincreased in the central city, but the cities’ share of creative jobs increased at a lower rate; C,where the share of creative jobs decreased in the central city, although increasing for all jobs; andD2, where the share for all jobs in the central city decreased, but share of creative jobs decreasedat an even higher rate.
We can see from Table 4 and Figure 1 that there are 14 MSAs in the more successful group,or 35% of the sample MSAs. Of these, the 10 in A and B1 showed centralization for creativeindustries, and in 5 of them (region A), this was the reverse of the trend for employment as awhole. Buffalo–Niagara Falls showed especially strong creative industry centralization, with a5.4 percentage point increase in creative jobs in the central city as compared to a 0.5 percentagepoint decrease for all jobs. The four MSAs in region D1 showed a slight decentralization forcreative industries compared to even more rapid decentralization for all employment. Especially

14 II JOURNAL OF URBAN AFFAIRS II Vol. 00/No. 0/2012
FIGURE 1
Change in Central City’s Share of Jobs, 1998–2002
notable was Tucson, where the loss in creative jobs in the central city was only 1.1 percentagepoints, although the share of all jobs in the central city dropped by 6 percentage points. Anothernotable outlier was Bakersfield, CA, with the highest rate of centralization for creative jobs andall jobs (10.3 and 6.4 percentage points, respectively). However, by far the largest single groupwas region D2, with 16 MSAs (40%), in which jobs in creative industries decentralized at a morerapid rate than those of all industries. For example, Dallas, although losing 3.9 percentage pointsfor all jobs, lost nearly 10 percentage points for creative jobs. Perhaps least surprisingly, however,employment decentralized for creative industries in 28 of the 40 MSAs, or 70% (regions C andD), and for all industries in 25, or 63% of the sample MSAs (regions A and D). All these indicatethat although central cities enjoy a relative concentration of creative jobs, such advantages havebeen gradually losing ground over recent years.
This next analysis, represented by Table 5 and Figure 2, looks at the differences in employmentgrowth for creative employment relative to overall employment growth for central cities. Onaverage, total jobs grew by 4.5% in central cities and 5% in their suburbs during this period.Creative jobs grew much faster in comparison, with 12.8% for central cities and 15.1% forsuburbs. It is evident that the creative sector experienced robust growth over other industries,and that its growth in the suburbs outpaced that in the urban core. This roughly correspondsto the declining share of this industry in central cities as seen in the share analysis above. InFigure 2, the X-axis represents job growth in all sectors, and the Y-axis is employment growth increative industries.
The sectors in which central cities have been more successful in attracting or retaining creativeindustry employment are D1, where employment decreased for all jobs in the central city, butcreative jobs decreased at a lower rate; A, where creative employment increased in the centralcity, although overall employment decreased; and B1, where employment increased overall inthe central city, but creative jobs increased at a higher rate. Central cities less successful in

II Creative Central Cities II 15
TABLE 5
Variation in Percentage Change of Employment in Central Cities and Suburbs
All Jobs Creative Jobs
Central CentralCity % Suburb City % Suburb
Change % Change Change % Change Diff in PlotMSA/PMSA/NECMA 1998–2002 1998–2002 Diff 1998–2002 1998–2002 Diff Change Region
Miami, FL PMSA −2.5% −1.6% −0.9% 26.2% 21.6% 4.6% 28.8% ABuffalo–Niagara
Falls, NY MSA−0.8% 1.4% −2.2% 24.2% −0.8% 25.0% 25.0%
San Francisco, CAPMSA
−5.5% 1.5% −7.0% 16.3% 18.7% −2.4% 21.9%
Cleveland–Lorain–Elyria, OHPMSA
−8.9% −2.4% −6.5% 6.7% 2.0% 4.7% 15.6%
San Jose, CAPMSA
−5.0% −5.6% 0.6% 10.1% 25.4% −15.3% 15.2%
Toledo, OH MSA −2.9% 0.4% −3.3% 11.7% −1.0% 12.7% 14.6%Lexington, KY MSA −1.7% 8.7% −10.4% 9.3% 17.6% −8.3% 11.0%Mobile, AL MSA −1.7% −2.0% 0.3% 8.9% 4.4% 4.4% 10.6%Baltimore, MD
PMSA−3.9% 10.0% −13.9% 5.9% 23.5% −17.6% 9.8%
Tacoma, WA PMSA −1.3% 10.0% −11.3% 6.8% 41.7% −35.0% 8.1%Chicago, IL PMSA −1.6% 1.1% −2.7% 2.9% 12.4% −9.5% 4.5%Portland, ME
NECMA9.5% 3.0% 6.5% 35.1% 9.5% 25.6% 25.6% B1
Orange County, CAPMSA
4.8% 9.8% −5.0% 24.6% 13.4% 11.2% 19.8%
Salt LakeCity–Ogden, UTMSA
4.9% −1.9% 6.8% 22.3% 24.4% −2.1% 17.4%
Charlotte–Gastonia–RockHill, NC-SC MSA
16.7% −0.1% 16.7% 34.0% −0.9% 34.9% 17.3%
San Diego, CA MSA 10.3% 16.2% −5.9% 25.4% 39.1% −13.6% 15.1%Providence–
Warwick–Pawtucket, RINECMA
2.8% 3.2% −0.3% 16.8% 19.7% −2.8% 14.0%
Seattle–Bellevue–Everett, WAPMSA
2.6% 0.7% 1.8% 15.3% 42.4% −27.1% 12.7%
Bakersfield, CAMSA†
21.4% −6.4% 27.8% 34.0% −13.1% 47.1% 12.6%
Riverside–SanBernardino, CAPMSA
10.2% 21.3% −11.0% 22.3% 34.1% −11.8% 12.1%
Jacksonville, FLMSA
4.2% 13.8% −9.6% 15.3% 38.8% −23.5% 11.1%
Orlando, FL MSA 26.6% −0.2% 26.8% 37.6% −0.3% 37.9% 11.0%Pittsburgh, PA MSA 1.4% 4.1% −2.7% 12.2% 17.9% −5.7% 10.8%Tucson, AZ MSA 0.4% 34.4% −34.1% 10.8% 17.4% −6.6% 10.5%
(Continued)

16 II JOURNAL OF URBAN AFFAIRS II Vol. 00/No. 0/2012
Table 5. Continued
All Jobs Creative Jobs
Central CentralCity % Suburb City % Suburb
Change % Change Change % Change Diff in PlotMSA/PMSA/NECMA 1998–2002 1998–2002 Diff 1998–2002 1998–2002 Diff Change Region
Oakland, CA PMSA 7.7% 10.1% −2.4% 14.9% 27.5% −12.6% 7.3%Stockton–Lodi, CA
MSA11.9% 12.8% −0.9% 16.7% 28.3% −11.5% 4.8%
Sacramento, CAPMSA
17.3% 18.3% −1.0% 21.4% 25.5% −4.1% 4.2%
Los Angeles–LongBeach, CA PMSA
4.4% 1.4% 3.1% 8.3% 7.4% 0.9% 3.9%
Madison, WI MSA 6.9% 3.2% 3.7% 9.7% 19.9% −10.1% 2.8%Fargo–Moorhead,
ND–MN MSA4.7% −2.1% 6.8% 6.9% 5.6% 1.3% 2.2%
Phoenix–Mesa, AZMSA
6.2% 13.6% −7.4% 5.6% 38.5% −33.0% −0.7% B2
Fresno, CA MSA 8.6% 4.1% 4.5% 5.7% 29.6% −23.9% −2.9%Spokane, WA MSA† 7.6% −7.6% 15.3% 4.1% 66.1% −62.0% −3.5%Charleston, WV
MSA9.4% 4.5% 4.9% 4.3% 18.4% −14.1% −5.0%
Omaha, NE–IAMSA
3.0% 10.0% −7.0% −0.8% 4.8% −5.6% −3.8% C
Columbia, SC MSA 2.9% 5.3% −2.4% −2.2% 3.1% −5.4% −5.1%Jersey City, NJ
PMSA7.7% 12.3% −4.6% −3.9% 9.0% −12.9% −11.6%
Wilmington–Newark, DE–MDPMSA
11.6% 8.4% 3.2% −2.2% 13.1% −15.3% −13.8%
Grand Rapids–Muskegon–Holland, MIMSA
−6.7% 4.1% −10.8% −5.1% 26.9% −32.0% 1.7% D1
Dallas, TX PMSA† −4.1% 12.5% −16.7% −6.0% 38.1% −44.1% −1.9% D2All sample MSAs 2.9% 4.8% −1.9% 11.0% 18.0% −7.0% 5.1%
Source: Authors’ calculations of County Business Patterns Special Extracts of the State of the Cities Data System, 1998 and2002.†Bakersfield, Spokane, and Dallas are omitted as outliers in Table 8.
attracting or retaining creative industry employment relative to the suburban areas are foundin B2, where employment increased for all jobs in the central city, but creative jobs increasedat a lower rate; C, where creative employment decreased in the central city, although overallemployment increased; and D2, where employment decreased for all jobs in the central city, butcreative jobs decreased at an even higher rate.
But in contrast to Figure 1, Figure 2 shows that over three quarters of the MSAs were in themore successful half of the plot. Some of the notable outliers include Miami, in quadrant A,which showed the greatest relative creative industry growth, with creative employment growingat a rate of over 26%, although all jobs in the central city declined by 2.5%, a difference of nearly30 percentage points. Miami was followed closely by Portland, ME, at 35% and 9.5% growth,respectively, and Buffalo–Niagara Falls, NY, at 24% and –1%, respectively. The differentialsfavoring growth in all industries were smaller; the largest of these being a bit less than 14% forWilmington–Newark, DE, where creative jobs in the central city declined by 2% as all jobs grewby 11.6%. We also looked at the growth in creative jobs relative to all jobs for the suburban

II Creative Central Cities II 17
FIGURE 2
Industry Job Growth in Central Cities, 1998–2002
areas, and although job growth favored creative industries here as well, the differences were lesspronounced. In the suburbs, there were three MSAs with declines in both creative and all sectors,and none in which creative employment declined more than overall employment. When centralcity and suburbs are compared, in a majority of cases, the suburbs outpaced the central cities inthe growth of creative industries over the time period.
Based on the data from these two primary metrics—share and growth of creative industries—we developed a typology of central city creativity (see Figure 3). Using the direction of thechange in the central city’s share of metropolitan creative jobs and the direction of the change incentral city’s total creative employment, four types of cities were created. However, all of the 40cities in the sample can be categorized within three of these types. We identified these types ascreative flight cities, in which both share and number of creative jobs in the central city declined;creative sprawl cities, where creative jobs in the central city grew, although their metropolitanshare declined; and creative engine cities, which saw creative jobs grow in both absolute andrelative terms.
Variation by Region, City Size, and Industrial Structure
Tables 6 and 7 show how regional and central city size differences impact creative industrycentralization. Although the regional differences shown in Table 6 were somewhat negligible interms of both share and change over the period, the small sample size for some regions maymake those differences harder to detect. We expected to see higher rates of centralization in theNortheast and South (Glaeser et al., 2001; Glaeser & Kahn, 2001), but this was not borne out bythe data for creative industries. In all but the Northeast, a region with only five cities, and whichdid not include New York City, the share of creative industry employment in central cities in bothyears was between 46% and 48%, respectively, although the Northeastern cities had slightly lessthan a 33% share in both years. But it is also fair to say that the patterns we observed on thenational level are not driven by a particularly creative region.

18 II JOURNAL OF URBAN AFFAIRS II Vol. 00/No. 0/2012
TABLE 6
Variation in Creative Industry Employment Decentralization by Region, 1998–2002
Average Change inRegion Central City Share(Census Number of 1998 Average 2002 Average of Metropolitan CreativeDivision) Cities Share Share Industry Jobs, 1998–2002 (%)
Northeast 5 32.9% 32.8% −0.1%South 11 47.9% 47.2% −0.7%Midwest 7 47.9% 47.3% −0.6%West 17 46.7% 46.1% −0.7%Total 40 45.5% 44.9% −0.6%
Source: Authors’ calculations of County Business Patterns Special Extracts of the State of the Cities Data System, 1998 and2002.
TABLE 7
Variation in Creative Industry Employment Decentralization by Central City Size, 1998–2002
Average Change inCentral City Share
Central City Number 1998 Average 2002 Average of Metropolitan CreativePopulation of Cities Share Share Industry Jobs, 1998–2002 (%)
>1,000,000 5 51.1% 48.8% −2.2%500,000–999,999 8 35.6% 34.6% −1.0%250,000–499,999 10 45.6% 45.2% −0.4%100,000–249,999 13 47.8% 47.6% −0.2%<100,000 4 50.1% 50.7% 0.6%Total 40 45.5% 44.9% −0.6%
Source: Authors’ calculations of County Business Patterns Special Extracts of the State of the Cities Data System, 1998 and2002.Note: Population size based on 1998 census estimates, and includes all central cities in each MSA.
Table 7 shows that employment in larger cities decentralized more quickly over the period,which was suggested by previous studies (Kneebone, 2009). Population sizes of the central citiesare provided in Appendix C. In the five central cities with over one million in population, theshare of creative jobs in central cities declined from 51.1% to 48.8%, a drop of 2.2 percentagepoints. None of the other size categories declined more than one percentage point between 1998and 2002. These results should probably be interpreted cautiously, however, because there areonly five cities in the largest and smallest categories.
We further conducted multivariate regression analysis to assess the factors leading to em-ployment concentration (or possibly more likely, decentralization) of creative industries. Thedependent variable we chose to measure this phenomenon is the change in the central cities’share of metropolitan creative jobs, 1998–2002. Based on theory and previous research, weincluded three groups of independent variables: city size, industrial specialization, and region.
We chose metropolitan total employment in 1998, the base year of the period we studied,and city population in the same year as city size variables. We expect the share of metropolitanemployment to correlate positively with the centralization of creative industry jobs (Glaeseret al., 2001; Glaeser & Kahn, 2001), although population size correlates with decentralizationfor total employment (Kneebone, 2009). Industrial specialization is measured by the share of allmetropolitan jobs in creative industries (1998), the central city’s share of metropolitan creativejobs (1998), the growth of creative jobs in the metropolitan area (1998–2002), and the share of allMSA creative jobs in each of the three creative subsectors (with information being the reference

II Creative Central Cities II 19
FIGURE 3
Creative City Typology and Sample Cities
group). Because cities specializing in services, especially “idea-intensive” ones such as creativeindustries, tend to be more centralized, we would expect regional specialization in these industriesto disproportionally benefit central cities.
Finally, we entered regional dummy variables of the South, Midwest, and West, using theNortheast region as a reference group. In Immergluck’s study of the financial services sector, hefound that the greatest decentralization in this industry occurred in the South and Northeast, withlower rates in the West (especially California) and Midwest (Immergluck, 2001), though thesefindings were not supported by his multivariate analysis. Hill and Brennan (2005) found thatoverall the pattern was somewhat different, which has led us to predict that the Midwest will bethe region most rapidly decentralizing, followed by the South, West, and Northeast, respectively.
Given the small sample size (40 cities) and broadly defined industrial sectors (two-digit NAICScodes), using the full sample yielded no significant coefficients. Consequently, we followedImmergluck’s (2001) example of eliminating a few outliers. In this case, 3 of the 40 cities (Dallas,Spokane, and Bakersfield) had dependent variables at the extreme tails of the value distributioncurve2 and were thus dropped from the model. The results from both models are shown in Table 8.Although no significant variables were found in the model using the 40-city sample, in mostcases their signs and magnitudes were similar to those in the reduced observation model. Robuststandard errors are reported to address the issue of heteroskedasticity. The two general populationvariables (1998 MSA employment and 1998 city population) yielded variables with differentsigns in each model, but the coefficients in both cases were very small, and not statisticallysignificant.3
20 II JOURNAL OF URBAN AFFAIRS II Vol. 00/No. 0/2012
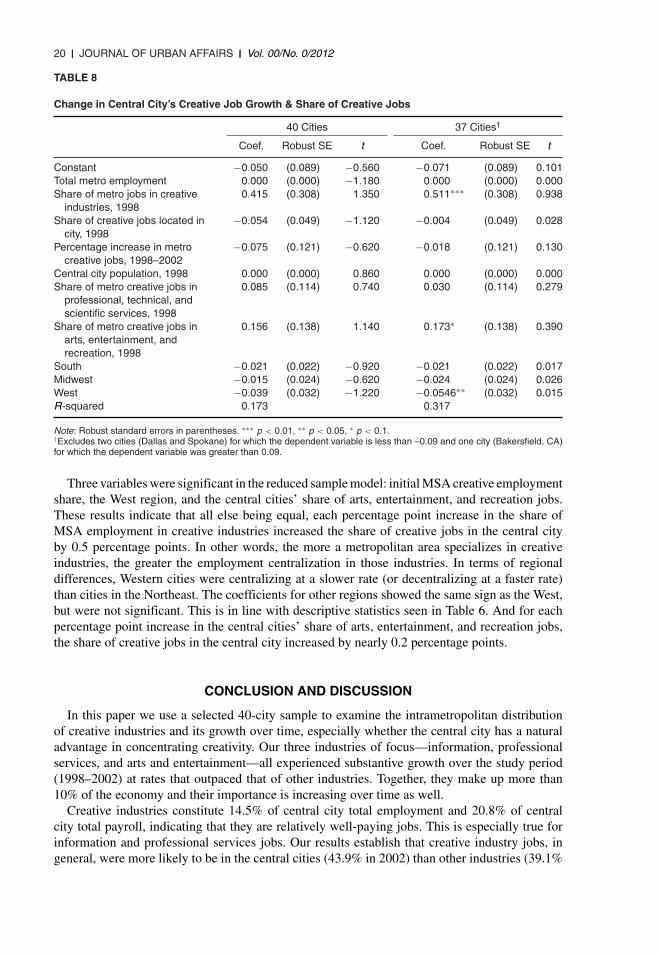
TABLE 8
Change in Central City’s Creative Job Growth & Share of Creative Jobs
40 Cities 37 Cities†
Coef. Robust SE t Coef. Robust SE t
Constant −0.050 (0.089) −0.560 −0.071 (0.089) 0.101Total metro employment 0.000 (0.000) −1.180 0.000 (0.000) 0.000Share of metro jobs in creative
industries, 19980.415 (0.308) 1.350 0.511∗∗∗ (0.308) 0.938
Share of creative jobs located incity, 1998
−0.054 (0.049) −1.120 −0.004 (0.049) 0.028
Percentage increase in metrocreative jobs, 1998–2002
−0.075 (0.121) −0.620 −0.018 (0.121) 0.130
Central city population, 1998 0.000 (0.000) 0.860 0.000 (0.000) 0.000Share of metro creative jobs in
professional, technical, andscientific services, 1998
0.085 (0.114) 0.740 0.030 (0.114) 0.279
Share of metro creative jobs inarts, entertainment, andrecreation, 1998
0.156 (0.138) 1.140 0.173∗ (0.138) 0.390
South −0.021 (0.022) −0.920 −0.021 (0.022) 0.017Midwest −0.015 (0.024) −0.620 −0.024 (0.024) 0.026West −0.039 (0.032) −1.220 −0.0546∗∗ (0.032) 0.015R-squared 0.173 0.317
Note: Robust standard errors in parentheses. ∗∗∗ p < 0.01, ∗∗ p < 0.05, ∗ p < 0.1.†Excludes two cities (Dallas and Spokane) for which the dependent variable is less than –0.09 and one city (Bakersfield, CA)for which the dependent variable was greater than 0.09.
Three variables were significant in the reduced sample model: initial MSA creative employmentshare, the West region, and the central cities’ share of arts, entertainment, and recreation jobs.These results indicate that all else being equal, each percentage point increase in the share ofMSA employment in creative industries increased the share of creative jobs in the central cityby 0.5 percentage points. In other words, the more a metropolitan area specializes in creativeindustries, the greater the employment centralization in those industries. In terms of regionaldifferences, Western cities were centralizing at a slower rate (or decentralizing at a faster rate)than cities in the Northeast. The coefficients for other regions showed the same sign as the West,but were not significant. This is in line with descriptive statistics seen in Table 6. And for eachpercentage point increase in the central cities’ share of arts, entertainment, and recreation jobs,the share of creative jobs in the central city increased by nearly 0.2 percentage points.
CONCLUSION AND DISCUSSION
In this paper we use a selected 40-city sample to examine the intrametropolitan distributionof creative industries and its growth over time, especially whether the central city has a naturaladvantage in concentrating creativity. Our three industries of focus—information, professionalservices, and arts and entertainment—all experienced substantive growth over the study period(1998–2002) at rates that outpaced that of other industries. Together, they make up more than10% of the economy and their importance is increasing over time as well.
Creative industries constitute 14.5% of central city total employment and 20.8% of centralcity total payroll, indicating that they are relatively well-paying jobs. This is especially true forinformation and professional services jobs. Our results establish that creative industry jobs, ingeneral, were more likely to be in the central cities (43.9% in 2002) than other industries (39.1%

II Creative Central Cities II 21
in 2002), and the difference is even higher for annual earnings. Contrary to expectations, however,arts and entertainment employment is less clustered in the central city than overall employment(37.9% in 2002), though close to half of the annual earnings in this industry are in the urbancore. In general, creative industries are an important source of employment and wealth for centralcity economies. Trends over the 5 years suggest that although there exist intercity variations, themajority of cities showed creative industries either centralizing at a lower rate or decentralizingat a higher rate than industries in general. Although creative industry growth in a typical centralcity outpaced the growth of all industries (11% versus 2.9%), their corresponding suburban areassaw even faster growth in this sector (18%). Regional variations of creative industry distributionare not substantive, though creative jobs in larger cities decentralized more rapidly than those insmaller cities.
We set out to address the mismatch of research and policy, the former occurring mostly at themetropolitan level, and the latter at the municipal level. Understanding the implications of thisstudy for central cities will empower policymakers to consider industries that are either mostlikely to locate in their cities, and those that are less likely to move to the neighboring suburbanareas. The analysis presented contributes to our understanding of intrametropolitan location forcreative industries, but also suggests some challenges going forward. Although it does seem thatthese industries were somewhat more concentrated in central cities during the period studied,the increasing decentralization of the creative sector suggests that policymakers should considerhow policies designed to attract and retain this sector might be shaped by this overarching markettrend, and whether they may be able to reverse it through the policy process. Thus, whether citiesaround the country can expect the creative sector to maintain its current presence and momentumin their jurisdictions is an open question.
As cities continue to pursue creative-oriented economic development strategies, it is importantto consider the central cities’ unique comparative advantage on a city-by-city and industry-by-industry basis. As noted earlier, the forces that shape these various creative industries are likelydifferent. Therefore, there is possibly no silver bullet for a one-size-fits-all economic developmentremedy that applies to all these industries. Returning to the typology developed earlier, as wellas the findings on the relative growth and share of creative industries within and around centralcities, we can consider strategies appropriate to each.
For creative flight cities, these central cities are likely suffering from other issues that eitherpush jobs to suburban areas, or simply make them less attractive than the alternatives. Localitydevelopment strategies that encourage social interaction in downtown areas, as well as targetingcreative industries for which density and centrality are attractive to firms and employees, mighthelp reverse the trend of creative flight.
For creative sprawl cities, although all of these cities gained creative jobs, they did so at a lowerrate than their suburbs. These cities all experienced employment growth generally, but even moreso in creative industry jobs. Nevertheless, all 22 saw their share of creative employment decline.These cities represent, in most cases, growing cities within regions of even greater growth, oftencharacterized by urban sprawl. It should not be too surprising, then, that all but five are in the Westor South, and that more than three quarters of the Western cities in our sample are in this group.
Although regional and size effects exist, regression results suggest that the most impor-tant factor that determined the spatial distribution of creative industries is metropolitan indus-trial specialization. That is, metropolitan areas specializing in creative employment have seencentralizing creative industry employment. Regional cooperation in expanding employment sharein this sector may thus be warranted to ensure part of that growth happens in the central cities.Encouraging the growth of creative industries may be the elusive “win–win” proposition in theintrametropolitan competition for economic development. Suburban areas would benefit fromexpansion in a growing sector with relatively high-wage employment, although central citieswould benefit by helping them offset the rapid decentralization of other employment sectors.

22 II JOURNAL OF URBAN AFFAIRS II Vol. 00/No. 0/2012
For creative engine cities, these are cities in which creative industry employment is expanding,and even helping to drive the regional economy from the central city outward. Data suggest thatthe growth in creative jobs in the central city is driving employment in all sectors throughout theregion. Cities in this group may want to continue on their current path, as eventually creative jobgrowth should lead overall employment growth as well. Cleveland may be a good example hereof a community that saw declining employment years ago, and has worked hard to drive growththrough creative employment. Time will tell if that investment will pay off.
So can creative industry development benefit central cities in the regional economy? Thisresearch serves as a first step in addressing this important question, but it is limited in scopein numerous ways. The data are limited both in the number of variables available and the highincidence of missing values that constrained our sample size. Imputing values based on existingestimates is one approach that might allow more detail. More recent statistics can be desirableas well to provide a longer term trajectory of the spatial evolution of jobs. Analysis in this paperends in year 2002 given the fact that equivalent data are not yet available to compile systematiccomparison for the period after that. Our preliminary analysis shows that although the growthrate for all industries was 4.4% between 2002 and 2007, creative industries registered 8.4%overall growth during that period. This growth rate is lower than the 14.9% for the 4 yearsbefore 2002. One major factor behind this slower growth was the stagnation of the informationindustry during this period, with a slight decline in absolute employment 2002–2007. The othertwo industries, professional services and arts and entertainment, both sustained their two-digitgrowth rate during the same period. Based on our findings, information is the most centralizedindustry of the three. If this pattern continues to hold in the intervening years, the declining shareof information industry in the creative sector would necessarily mean that this sector in generalwill suburbanize faster than it did previously. However, detailed analysis would be required toexamine these dynamics. Future research should also explore the particular reasons behind thelocation decisions of specific industries and the policy incentives that can effectively attract them.
APPENDIX A: SAMPLE MSAs BY REGION
Northeast (5 MSAs) Midwest (7 MSAs) South (11 MSAs) West (17 MSAs)
Buffalo–Niagara Falls,NY MSA
Jersey City, NJ PMSAPittsburgh, PA MSAPortland, ME NECMAProvidence–
Warwick–Pawtucket,RI NECMA
Chicago, IL PMSACleveland–Lorain–Elyria,
OH PMSAFargo–Moorhead,
ND–MN MSAGrand Rapids–
Muskegon–Holland,MI MSA
Madison, WI MSAOmaha, NE–IA MSAToledo, OH MSA
Baltimore, MD PMSACharleston, WV MSACharlotte–Gastonia–
Rock Hill, NC–SCMSA
Columbia, SC MSADallas, TX PMSAJacksonville, FL MSALexington, KY MSAMiami, FL PMSAMobile, AL MSAOrlando, FL MSAWilmington–Newark,
DE–MD PMSA
Bakersfield, CA MSAFresno, CA MSALos Angeles–Long Beach,
CA PMSAOakland, CA PMSAOrange County, CA PMSAPhoenix–Mesa, AZ MSARiverside–San Bernardino,
CA PMSASacramento, CA PMSASalt Lake City–Ogden,
UT MSASan Diego, CA MSASan Francisco, CA PMSASan Jose, CA PMSASeattle–Bellevue–Everett,
WA PMSASpokane, WA MSAStockton–Lodi, CA MSATacoma, WA PMSATucson, AZ MSA

II Creative Central Cities II 23
APPENDIX B: SELECTED NAICS FOR CREATIVE INDUSTRIES
51 Information5110 Publishing industries5120 Motion picture and sound recording industries5130 Broadcasting and telecommunications5140 Information and data processing services
54 Professional, scientific, and technical services71 Arts, entertainment, and recreation
7110 Performing arts, spectator sports, and related industries7120 Museums, historical sites, and like institutions7130 Amusement, gambling, and recreation industries
APPENDIX C: SAMPLE CENTRAL CITIES BY SIZE∗
500,000–999,999 250,000–499,999 100,000–249,999 <100,0001,000,000 (5 Cities) (8 Cities) (10 Cities) (13 Cities) (4 Cities)
Los Angeles– San Jose Tucson Lexington, KY FargoLong Beach∗ San Francisco Riverside–San Stockton Wilmington, DE
Chicago Baltimore Bernardino∗ Jersey City Portland, MEPhoenix–Mesa∗ Jacksonville Sacramento Bakersfield Charleston, WVSan Diego Santa Ana–Anaheim Fresno Madison, WIDallas (Orange County)∗ Oakland Mobile
Seattle Omaha Grand Rapids, MICharlotte Miami SpokaneCleveland Pittsburgh Tacoma
Toledo OrlandoBuffalo Salt Lake City
Providence, RIColumbia, SC
∗Includes the total central city population where there are multiple central cities in an MSA.Source: Population size based on 1998 census estimates. Population estimates for states, counties, places, and minor civildivisions: Annual time series, July 1, 1990 to July 1, 1999 (includes April 1, 1990 Population Estimates Base).http://www.census.gov/popest/archives/1990s/SU-99-10.htmlhttp://www.census.gov/popest/archives/1990s/su-99-10/SU-99-10_US.txt
ENDNOTES
1 In a handful of cases, the MSAs in the data set have two or three central cities. These multiple central citieswere combined in our data, because we were only interested in locations in central cities relative to suburbs;specific city within the MSA was not important.
2 Dallas at –9.6%, Spokane at –9.5%, and Bakersfield at 10.3%.
3 To test for any multicollinearity, we ran correlation tables for the independent variables, and found one pair ofvariables—total metropolitan employment and central city population in 1998—with a correlation coefficientof 0.923. Then we ran both models without these variables, as well as running stepwise regressions on each,but there were no substantive change in the results. Further, we ran two auxiliary models in which we regressedeach of these two variables with the other independent variables, and though the R2 in each was fairly high(0.932 and 0.925, respectively), in neither of these did we find variance inflation factors above 3.73, far below

24 II JOURNAL OF URBAN AFFAIRS II Vol. 00/No. 0/2012
the threshold for concern. We thus concluded that the multicollinearity of these variables had no significantimpact on their predicted effects in the models.
REFERENCES
Americans for the Arts (2007a). Arts & economic prosperity III: The economic impact of nonprofit arts and cultureorganizations and their audiences. Washington, DC: Americans for the Arts.
Americans for the Arts (2007b). Arts & economic prosperity III: The economic impact of nonprofit arts and cultureorganizations and their audiences in the City of Atlanta, GA. Atlanta: Americans for the Arts.
Bagwell, S. (2008). Creative clusters and city growth. Creative Industries Journal, 1(1), 31–46.Brennan, J., & Hill, E. W. (1999). Where are the jobs? Cities, suburbs, and the competition for employment. Survey
Series. Washington, DC: The Brookings Institution Metropolitan Policy Program.City of Providence. (2009). Creative Providence: A cultural plan for the creative sector. Providence, RI: City of
Providence.Currid, E. (2007). How art and culture happen in New York. Journal of the American Planning Association, 73(4),
454–467.Currid, E., & Williams, S. (2010a). The geography of buzz: Art, culture and the social milieu in Los Angeles and
New York. Journal of Economic Geography, 10(3), 423–451. doi:10.1093/jeg/lbp032Currid, E., & Williams, S. (2010b). Two cities, five industries: Similarities and differences within and between
cultural industries in New York and Los Angeles. Journal of Planning Education and Research, 29(3),322–335. doi:10.1177/0739456×09358559.
DeVol, R. C., Klowden, K., Bedroussian, A., & Yeo, B. (2009). North America’s high-tech economy: The geographyof knowledge-based industries. Santa Monica, CA: The Milken Institute.
Donegan, M., Drucker, J., Goldstein, H. A., Lowe, N., & Malizia, E. (2008). Which indicators explain metropolitaneconomic performance best? Traditional or creative class. Journal of the American Planning Association,74(2), 180–195.
Dreier, P., Mollenkopf, J., & Swanstrom, T. (2004). Place matters: Metropolitics for the twenty-first century (2ndEd., Revised). Lawrence: University Press of Kansas.
Florida, R. (2002). The rise of the creative class and how it’s transforming work, leisure, community and everydaylife (Paperback Ed.). New York, NY: Basic Books.
Florida, R. (2003). Cities and the creative class. City & Community, 2(1), 3–19. doi:10.1111/1540–6040.00034.Florida, R., Mellander, C., & Stolarick, K. (2009). That’s entertainment: Scale and scope economies in the location
and clustering of the entertainment economy. Toronto: Martin Prosperity Institute.Garnham, N. (2005). From cultural to creative industries. International Journal of Cultural Policy, 11(1), 15–29.Glaeser, E. L., & Kahn, M. E. (2001). Decentralized employment and the transformation of the American city
[with comments]. Brookings-Wharton Papers on Urban Affairs, 1–63.Glaeser, E. L., Kahn, M., & Chu, C. (2001). Job sprawl: Employment location in U.S. metropolitan areas. Survey
Series. Washington, DC: The Brookings Institution Metropolitan Policy Program.Hesmondhalgh, D., & Pratt, A. C. (2005). Cultural industries and cultural policy. International Journal of Cultural
Policy, 11(1), 1–13.Hill, E. W., & Brennan, J. (2005). America’s central cities and the location of work. Journal of the American
Planning Association, 71(4), 411–432.Hoyman, M., & Faricy, C. (2009). It takes a village: A test of the creative class, social capital, and human capital
theories. Urban Affairs Review, 44(3), 311–333. doi:10.1177/1078087408321496Hutton, T. A. (2004). The new economy of the inner city. Cities, 21(2), 89–108. doi:10.1016/j.cities.2004.01.002Hutton, T. A. (2009). Trajectories of the new economy: Regeneration and dislocation in the inner city. Urban
Studies, 46(5–6), 987–1001.Immergluck, D. (2001). The financial services sector and cities: Restructuring, decentralization, and declining
urban employment. Economic Development Quarterly, 15(3), 274–288. doi:10.1177/089124240101500308Keegan, R., Kleiman, N. S., Seigel, B., & Kane, M. (2005). Creative New York. New York: Center for an Urban
Future.

II Creative Central Cities II 25
Kleiman, N. S., Keegan, R., Fischer, D., Gordon, M., Duitch, S., Kane, M., & Zook, K. B. (2001). The creativeengine: How arts & culture is fueling economic growth in New York City neighborhoods. New York: Centerfor an Urban Future.
Kneebone, E. (2009). Job sprawl revisited: The changing geography of metropolitan employment. Metro economyseries. Washington, DC: The Brookings Institution Metropolitan Policy Program.
Markusen, A. (2006). Urban development and the politics of a creative class: Evidence from a study of artists.Environment and Planning A, 38, 1921–1940.
Markusen, A., Wassall, G. H., DeNatale, D., & Cohen, R. (2008). Defining the creative economy: Industry andoccupational approaches. Economic Development Quarterly, 22(1), 24–45.
Mieszkowski, P., & Mills, E. S. (1993). The causes of metropolitan suburbanization. The Journal of EconomicPerspectives, 7(3), 135–147.
Neff, G. (2005). The changing place of cultural production: The location of social networks in a digital mediaindustry. The ANNALS of the American Academy of Political and Social Science, 597(1), 134–152.
Negrey, C., & Rausch, S. D. (2009). Creativity gaps and gender gaps: Women, men and place inthe United States. Gender, Place & Culture: A Journal of Feminist Geography, 16(5), 517–533.doi:10.1080/09663690903148408
Peck, J. (2005). Struggling with the creative class. International Journal of Urban and Regional Research, 29(4),740–770.
Porter, M. E. (1997). New strategies for inner-city economic development. Economic Development Quarterly, 11,11–27.
Pratt, A. C. (2000). New media, the new economy and new spaces. Geoforum, 31(4), 425–436. doi:10.1016/s0016–7185(00)00011–7
Raphael, S., & Stoll, M. A. (2010). Job sprawl and the suburbanization of poverty. Metro opportunity series.Washington, DC: The Brookings Institution Metropolitan Policy Program.
Rausch, S., & Negrey, C. (2006). Does the creative engine run? A consideration of the effect of creative class oneconomic strength and growth. Journal of Urban Affairs, 28(5), 473–489.
Reese, L. A., Faist, J. M., & Sands, G. (2010). Measuring the creative class: Do we know it when we see it?Journal of Urban Affairs, 32(3), 345–366. doi:10.1111/j.1467–9906.2010.00496.x
Reese, L. A., & Sands, G. (2008). Creative class and economic prosperity: Old nostrums, better packaging?Economic Development Quarterly, 22(1), 3–7.
Rushton, M. (2006, July). The creative class and urban economic growth revisited. Paper presented at theInternational Conference of the Association for Cultural Economics International, Vienna, Austria.
Rushton, M. (2009). The creative class and economic growth in Atlanta. In D. L. Sjoquist (Ed.), Past trends andfuture prospects of the American city: The dynamics of Atlanta (pp. 163–180). Lanham, MD: LexingtonBooks.
Sands, G., & Reese, L. A. (2008) Cultivating the creative class: And what about Nanaimo? Economic DevelopmentQuarterly, 22(1), 8–23.
Scott, A. J. (2006). Creative cities: Conceptual issues and policy questions. Journal of Urban Affairs, 28(1), 1–17.Scott, A. J. (2008). Production and work in the American metropolis: A macroscopic approach. The Annals of
Regional Science, 42(4), 787–805.Stern, M. J., & Seifert, S. C. (2007). Cultivating “natural” cultural districts. Philadelphia: The Reinvestment
Fund.Stern, M. J., & Seifert, S. C. (2010). Cultural clusters: The implications of cultural assets agglomera-
tion for neighborhood revitalization. Journal of Planning Education and Research, 29(3), 262–279.doi:10.1177/0739456x09358555
Storper, M. (2010). Why does a city grow? Specialisation, human capital or institutions? Urban Studies, 47(10),2027–2050.
Wynn, W. (2011). Creative cities. Available at http://www.willwynn.com/creative-cities/, accessed March 3, 2011.
Copyright © 2022 FDOKUMEN