Early cretaceous absolute geomagnetic paleointensities from C´ ordoba Province (Argentina
Upload
univ-montpellierCategory
view
0download
0
Geophysical Journal InternationalGeophys. J. Int. (2013) 193, 603–614 doi: 10.1093/gji/ggs120
GJI
Geo
mag
netism
,ro
ckm
agne
tism
and
pala
eom
agne
tism
New archaeointensity data from Italy and geomagnetic field intensityvariation in the Italian Peninsula
E. Tema,1,2 J. Morales,3 A. Goguitchaichvili3,∗ and P. Camps4
1Dipartimento di Scienze della Terra, Universita degli Studi di Torino, via Valperga 35, 10125, Torino, Italy. E-mail: [email protected] Laboratory of Palaeomagnetism, via G.U. Luigi Massa 6, 12016, Peveragno, Italy3Laboratorio Interinstitucional de Magnetismo Natural, Instituto de Geofisica, UNAM, Campus Morelia, Michoacan, Mexico4Geosciences Montpellier, CNRS and Universite Montpellier 2, Montpellier, France
Accepted 2012 December 21. Received 2012 December 20; in original form 2012 September 12
S U M M A R YWe present new archaeointensity results from three Italian kilns situated at Ascoli Satriano,Vagnari and Fontanetto Po obtained with the Thellier modified by Coe double heating method.These data complement the directional results previously published. All sites are dated onthe basis of archaeological information and/or thermoluminescence dating. The results arecorrected for the anisotropy of the thermoremanent magnetization and the cooling rate effects.The new data are compared with previously published archaeointensity data from Italy andnearby countries within 900 km radius from Viterbo. An initial data set including archaeointe-sity data mainly coming from Italy, France, Switzerland, Czech Republic, Slovakia, Hungary,Greece and Bulgaria has been compiled. After the application of strict selection criteria, themost reliable data have been used for the calculation of a preliminary Italian intensity sec-ular variation (SV) curve for the last 3000 yr. The new curve covers the 300 BC–400 ADand 1200–1900 AD periods. It is established by means of sliding windows of 200 yr shiftedby 100 yr. The lack of reliable data for the 1000–200 BC and 400–1200 AD time intervalsdoes not permit the calculation of a continuous curve. Clearly, more high-quality archaeoin-tensity data from Italy and Europe are still needed to draw a robust intensity SV curve forthe Italian Peninsula that could be used for archaeomagnetic dating in combination with thedirectional data.
Key words: Archaeomagnetism; Palaeointensity; Palaeomagnetic secular variation.
I N T RO D U C T I O N
Palaeomagnetic records from archaeomagnetic artefacts extend thedirect observations of the Earth’s magnetic field, performed by satel-lite and geophysical observatories, through historical and archae-ological times. Thanks to important progress in archaeomagneticresearch during the last decades, a large number of reliable ar-chaeomagnetic data has been added in regional (Schnepp et al.2004; Gomez-Paccard et al. 2006; Tema et al. 2006) and global(Korte et al. 2005; Genevey et al. 2008; Donadini et al. 2009;Goguitchaichvili et al. 2011, 2012) data sets. Such data allow, witha good accuracy, modelling of past geomagnetic field variations(Korte & Constable 2005, 2011; Valet et al. 2008; Korte et al. 2009,2011; Pavon-Carrasco et al. 2009). However, in most of the pub-lished studies up to now only two of the ancient geomagnetic field
∗ Now at: Laboratorio de Paleomagnetismo, Departamento de Fısica, Es-cuela Politecnica Superior, Universidad de Burgos, C/Francisco de Vitoria,s/n, 09006, Burgos, Spain.
elements (declination and inclination) are retrieved. Consequently,archaeomagnetic dating is not as reliable as it could be if the fulllocal field vector (direction and intensity) is compared with thereference secular variation (SV) curves.
In Italy, archaeological remains are abundant but archaeomag-netic studies are still scarce (Tema 2011). Tema et al. (2006) con-structed a preliminary directional SV curve by means of Bayesianstatistical modelling from 74 reference directional data. However,although archaeointensity measurements do not require in situ sam-pling, reliable archaeointensity results in Italy are very limited andless numerous than the directional data. Their limited number hasnot permitted up to now the construction of a continuous and de-tailed intensity SV reference curve (Tema et al. 2010) and makescritical the need of new high-quality intensity records.
We present here new archaeointensity results from three Italiankilns with ages ranging from 300 to 1900 AD. These new abso-lute intensity data are obtained by Coe’s modified Thellier method(Thellier & Thellier 1959; Coe 1967) including regular partial ther-moremanent magnetization (pTRM) and pTRM tail checks. Theeffects of TRM anisotropy and cooling rate upon TRM acquisition
C© The Authors 2013. Published by Oxford University Press on behalf of The Royal Astronomical Society. 603
at Biblio Planets on A
ugust 26, 2013http://gji.oxfordjournals.org/
Dow
nloaded from
604 E. Tema et al.
were investigated for all specimens. The new data can be consideredas reliable markers of the past geomagnetic field intensity in Italyand enhance the European archaeointensity data set. These data to-gether with the archaeointensity results included in a 900-km circlearound Viterbo (42.45◦N, 12.03◦E) have been used for the calcu-lation of a preliminary intensity SV curve for the Italian peninsulacovering the 300 BC–400 AD and 1200–1900 AD time intervals.
A RC H A E O L O G I C A L S I T E S A N DS A M P L E S
The studied materials are bricks coming from three archaeologicalkilns excavated at Ascoli Satriano (Puglia, southern Italy), Vagnari(Puglia, southern Italy) and Fontanetto Po (Vercelli, northern Italy)(Fig. 1).
Archaeomagnetic sampling of the kiln excavated at the archae-ological site of Faragola, Ascoli Satriano was carried out on 2003July in collaboration with the archaeologists Prof Giuliano Volpeand Dr Maria Turchiano (Universita di Foggia). The excavationof Faragola is located a few kilometres NW of Ascoli Satriano(Lat. = 41.21◦, Long. = 15.56◦) in the province of Foggia (south-ern Italy). The archaeological excavation revealed an extended ruralsettlement dominated by a luxurious Roman villa, rich in decora-
tion, marble pavement and colourful mosaics. The kiln sampledwas excavated just few metres away from the villa and it is con-sidered as a small part of a wider group of workshop structures.It was constructed by a mixture of clay and brick fragments thatwere incorporated into the structure. The excavation brought intolight the combustion chamber and baking floor, while the firingchamber and the dome of the kiln were not preserved. We collectedfive brick hand samples from the baking floor of the kiln. Eachbrick was oriented in situ with a magnetic and a solar compass.According to archaeological evidence, the kiln was probably usedto produce bricks for the construction of the nearby Roman villa. Itis archaeologically dated around 350–400 AD.
The archaeological site of Vagnari (Lat. = 40.83◦, Long. =16.27◦) is located around 12 km south of Gravina, in Apugliaregion, southern Italy. It is considered as the largest site and themain economic centre in Gravina’s valley dated to the Roman Im-perial period. Excavation of the site began in 2000 directed byDr Alastair Small from the University of Edinburgh in collabora-tion with British, Italian, American and Canadian archaeologists.Excavations carried out in several years revealed the presence ofa settlement consisting of housing, as well as a large industrialzone, comprising four tile kilns, smithies and a block of workshops.The kiln sampled was excavated in Trench 5 during the excava-tion of 2001 July and it was almost attached to a much larger kiln
Figure 1. Location of the new sites.
at Biblio Planets on A
ugust 26, 2013http://gji.oxfordjournals.org/
Dow
nloaded from

Intensity secular variation in Italy 605
excavated a year before (kiln in Trench 4 excavated on 2000 July).It is a small kiln built in a cavity dug into the natural clay whichformed the floor and the lower part of the walls up to the level of thebrick arches that supported the firing chamber. The walls in the inte-rior of the combustion chamber are preserved to a maximum heightof 80 cm. Their upper parts are formed by tiles and bricks laid incourses with their edges outwards; four courses survive in the bestpreserved wall opposite the praefurnium. To sample this structurein 2003 July, its partial re-excavation was necessary, as the trenchwas backfilled with soil at the end of the excavation of 2001 July.This partial re-excavation brought to light only half of the kiln, butit made possible the collection of brick fragments from the westernwall of the combustion chamber. Nine hand samples were collectedand oriented in the field with an inclinometer and both magnetic andsolar compasses. Excavation of the Trench 5 provided archaeologi-cal evidence for the age of the kiln based on radiocarbon dating andalso on ceramic findings. A piece of charcoal from the stokeholeof the smaller kiln (archaeological layer 64) has a radiocarbon dateof 1775 ± 45 BP, which yields calibrated dates of 210–340 AD at59.4 per cent probability and 130–390 AD at 95.4 per cent probabil-ity (A. Small, 2004, personal communication). This age correspondsto the death of the wood found in the kiln that is not necessarily iden-tical to the age of the kiln itself. A fragment of pottery found in thelower fill of the combustion chamber is radiocarbon dated at 230–325 AD and pieces of an African red slip found in the upper layer ofthe fill of the stokehole are datable at 350–400 AD. This informationsuggests that the kiln was not filled before the late fourth centuryAD and according to the archaeologists can be safely dated around300–400 AD.
The third studied kiln was excavated near to the small village ofFontanetto Po, Vercelli Province, northern Italy, at the locality calledMulino San Giovanni (45.19◦N, 8.19◦E). It is a large, rectangularkiln, unearthed during a rescue excavation for the installation ofmethane gas pipelines. In the vicinity of the sampled kiln, at leastthree other kilns have been identified and according to the archae-ologists they probably were part of an important workshop for theproduction of bricks in the area (Barello et al. 2012). The kiln wasconstructed by several series of bricks. According to the archaeol-ogists, the kiln was in use during mediaeval times but no ceramicfragments or other archaeological findings exist to permit a moreprecise archaeological dating. Thermoluminescence dating on twobricks from the kiln structure suggests that the kiln’s last firing oc-curred at 1796–1914 AD (Tema et al., 2013). For this study, 23 bricksamples have been collected from the kiln walls and have been ori-ented in situ using an inclinometer. The metallic methane pipelinesalready situated at a depth of around 1 m below the structure pre-vented the reliable use of a magnetic compass and the wooden andplastic protection coverage mounted to protect the kiln from adverseweather conditions hampered the use of sun compass.
In all cases, the block samples collected in the field were thendrilled in the laboratory using an electric water-cooled rock drill toobtain cylindrical specimens of standard dimensions (diameter =25.4 mm, height = 22 mm). Almost all samples were drilled per-pendicular to their flat surface, interpreted as the top or the bottomof the brick. A part of the prepared samples have been previouslyused for archaeomagnetic directional studies and the directional re-sults from Ascoli Satriano and Vagnari kilns as well as those fromFontanetto Po kiln are published by Tema et al. (2006) and Temaet al. (2013) respectively. In this study, a total of 54 specimensfrom the three kilns (11 from Ascoli Satriano, 21 from Vagnariand 22 from Fontanetto Po) have been used for archaeointensitydetermination.
M A G N E T I C M I N E R A L O G Y
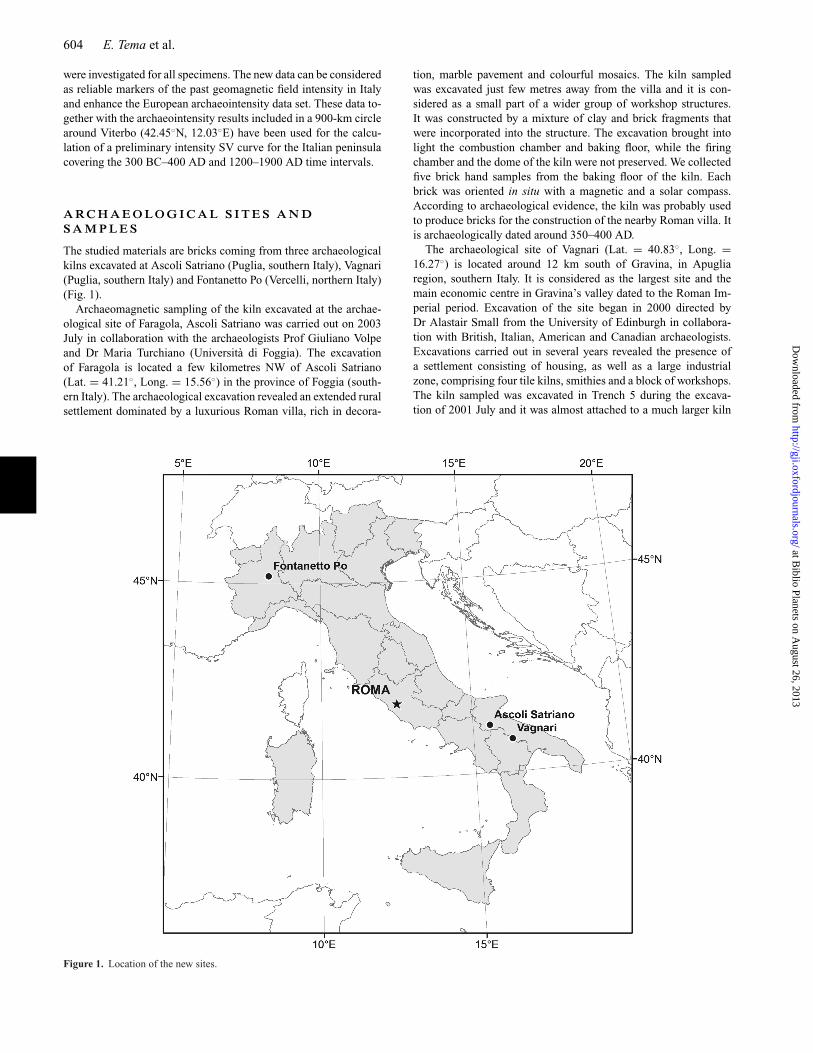
Magnetic mineralogy experiments have been done at the ALPPalaeomagnetic laboratory (Peveragno, Italy) and at the Palaeo-magnetic laboratory of Thessaloniki (Greece). Low-field magneticsusceptibility versus temperature experiments, isothermal remanentmagnetization (IRM) acquisition curves and thermal demagnetiza-tion of three orthogonal IRM components (Lowrie 1990) have beenused for the evaluation of the thermal stability of the samples andthe identification of the main magnetic minerals. The temperaturedependence of low-field magnetic susceptibility from ambient tem-perature up to 700 ◦C was monitored with a Bartington MS2Bsusceptibility meter in combination with an MS2WF heating unit.Thermomagnetic curves are useful indicators for the thermal stabil-ity of baked materials and thus for the suitability of the material forarchaeointensity determinations. For all studied sites, the obtainedheating and cooling curves, even if sometimes characterized bydifferent shapes, are almost always reasonably reversible (Fig. 2).They indicate that no substantial magnetomineralogical changestake place during heating and suggest that the bricks are magneti-cally stable.
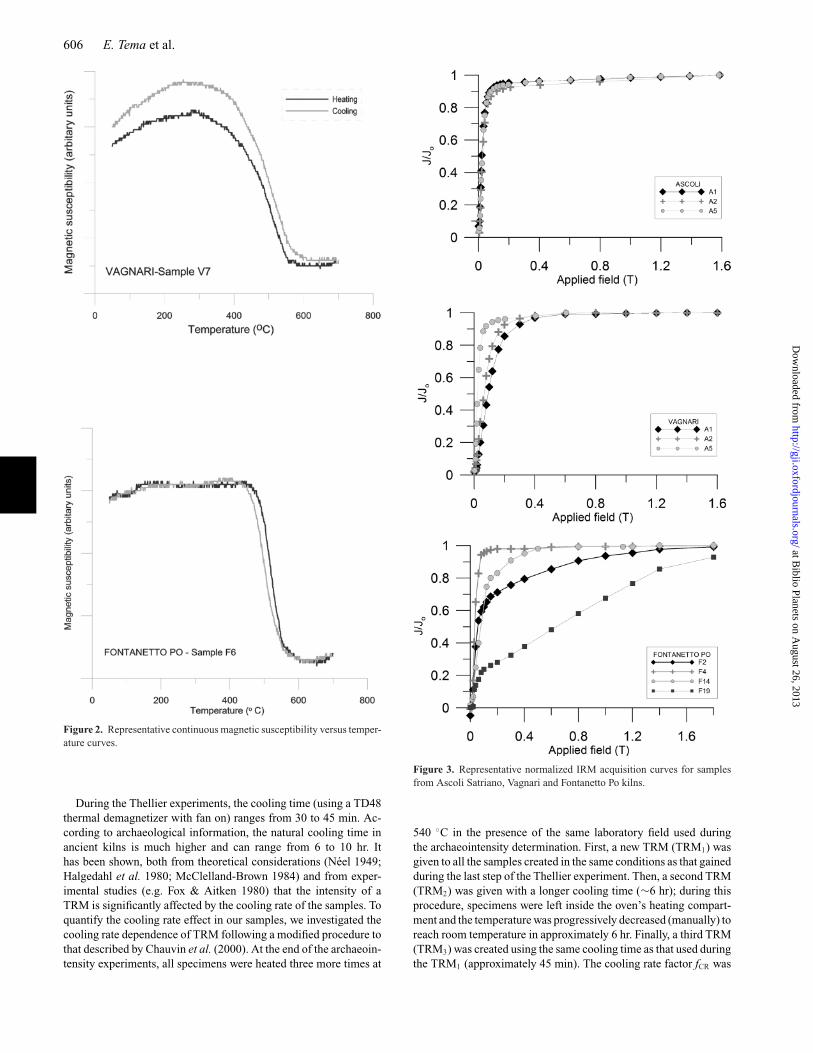
We determined the coercive force properties of some selectedsamples at the ALP Palaeomagnetic laboratory using an ASC pulsemagnetizer for imparting the IRM and a JR6 spinner magnetome-ter (AGICO) for measuring acquisition curves of IRM. Stepwisemagnetic fields up to 1.6 or 1.8 T were applied. Samples from allsites have similar magnetic properties. The IRM curves indicatethat the saturation of the magnetization is generally reached at lowfields varying from 0.2 to 0.4 T indicating the presence of a low-coercivity mineral such as magnetite (Fig. 3). Only few samplesfrom Fontanetto Po kiln (e.g. samples F14 and F19) remain un-saturated above 1.8 T and contain contributions of high-coercivitymineral, probably haematite. These results are confirmed by thermaldemagnetization experiments of a three-component IRM (Lowrie1990). Magnetization was induced along the three sample axes, ap-plying first the maximum field (1.6 T) along the cylinder Z-axis,then the intermediate field (0.5 T) along the Y-axis and finally theminimum field (0.1 T) along the X-axis. The demagnetization curves(Fig. 4) show the dominance of the magnetically soft fraction (<0.1T) with unblocking temperatures ranging between 460 and 520 ◦C.In few samples from Fontanetto Po, the presence of a small fractionof medium and/or high coercivity mineral is also observed. Theseresults point to magnetite or Ti-magnetite as the main magnetic car-rier in the studied samples, with some small content Ti-haematitein some cases.
A RC H A E O I N T E N S I T YD E T E R M I NAT I O N
All archaeointensity measurements have been carried out at theLIMNA palaeomagnetic laboratory of UNAM (Campus Morelia,Mexico) with the classical Thellier method (Thellier & Thellier1959) as modified by Coe (Coe 1967; Coe et al. 1978). Sampleswere heated and cooled in an ASC Scientific TD48-SC furnace andthe remanence was measured with a JR5 spinner magnetometer. Allheating/cooling cycles were performed in air. 10 temperature stepswere distributed from 25 to 540 ◦C. The direct laboratory field of30.00 ± 0.05 µT was applied during heating and cooling along thecylindrical axis (Z) of the samples. Every three temperature stepsa pTRM check was performed to detect any change in the pTRMacquisition capacity. Additional pTRM tail checks were performedat two intermediate temperatures (350 and 450 ◦C).
at Biblio Planets on A
ugust 26, 2013http://gji.oxfordjournals.org/
Dow
nloaded from
606 E. Tema et al.
Figure 2. Representative continuous magnetic susceptibility versus temper-ature curves.
During the Thellier experiments, the cooling time (using a TD48thermal demagnetizer with fan on) ranges from 30 to 45 min. Ac-cording to archaeological information, the natural cooling time inancient kilns is much higher and can range from 6 to 10 hr. Ithas been shown, both from theoretical considerations (Neel 1949;Halgedahl et al. 1980; McClelland-Brown 1984) and from exper-imental studies (e.g. Fox & Aitken 1980) that the intensity of aTRM is significantly affected by the cooling rate of the samples. Toquantify the cooling rate effect in our samples, we investigated thecooling rate dependence of TRM following a modified procedure tothat described by Chauvin et al. (2000). At the end of the archaeoin-tensity experiments, all specimens were heated three more times at
Figure 3. Representative normalized IRM acquisition curves for samplesfrom Ascoli Satriano, Vagnari and Fontanetto Po kilns.
540 ◦C in the presence of the same laboratory field used duringthe archaeointensity determination. First, a new TRM (TRM1) wasgiven to all the samples created in the same conditions as that gainedduring the last step of the Thellier experiment. Then, a second TRM(TRM2) was given with a longer cooling time (∼6 hr); during thisprocedure, specimens were left inside the oven’s heating compart-ment and the temperature was progressively decreased (manually) toreach room temperature in approximately 6 hr. Finally, a third TRM(TRM3) was created using the same cooling time as that used duringthe TRM1 (approximately 45 min). The cooling rate factor fCR was
at Biblio Planets on A
ugust 26, 2013http://gji.oxfordjournals.org/
Dow
nloaded from
Intensity secular variation in Italy 607
Figure 4. Stepwise thermal demagnetization of three IRM componentsfor representative samples. Symbols: dot = low- (0.1 T); diamond =intermediate- (0.5 T); square = high- (1.6 T) coercivity component.
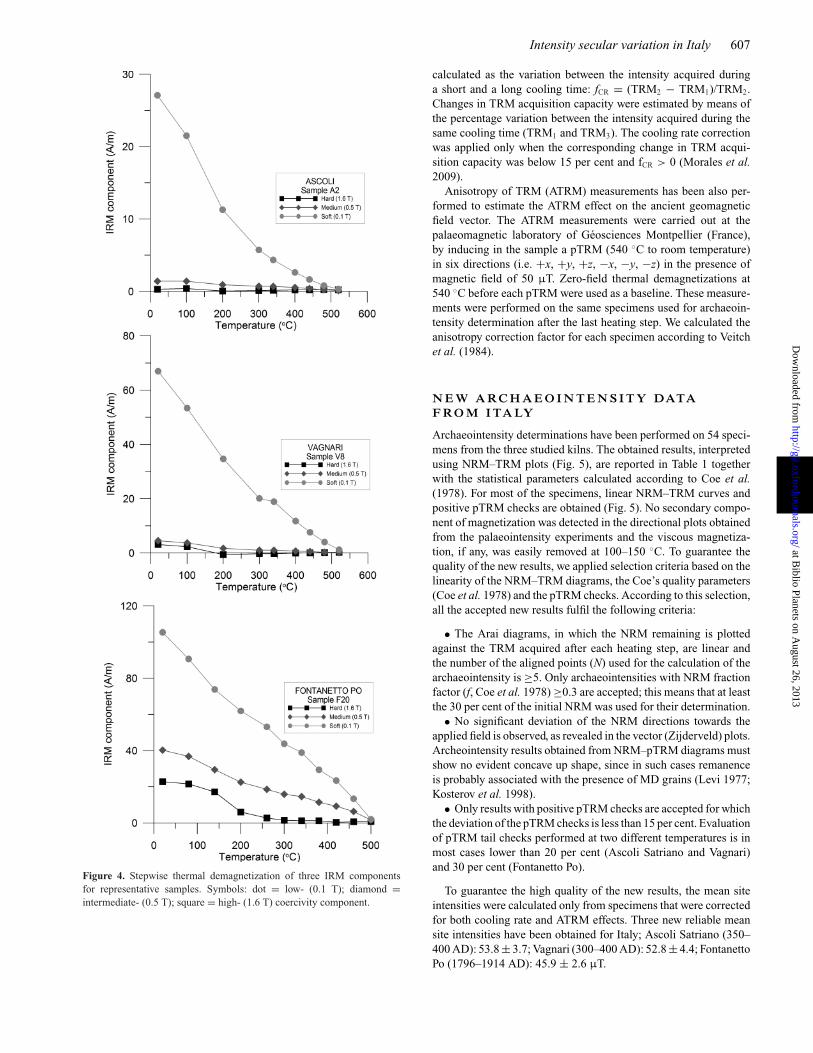
calculated as the variation between the intensity acquired duringa short and a long cooling time: fCR = (TRM2 − TRM1)/TRM2.Changes in TRM acquisition capacity were estimated by means ofthe percentage variation between the intensity acquired during thesame cooling time (TRM1 and TRM3). The cooling rate correctionwas applied only when the corresponding change in TRM acqui-sition capacity was below 15 per cent and fCR > 0 (Morales et al.2009).
Anisotropy of TRM (ATRM) measurements has been also per-formed to estimate the ATRM effect on the ancient geomagneticfield vector. The ATRM measurements were carried out at thepalaeomagnetic laboratory of Geosciences Montpellier (France),by inducing in the sample a pTRM (540 ◦C to room temperature)in six directions (i.e. +x, +y, +z, −x, −y, −z) in the presence ofmagnetic field of 50 µT. Zero-field thermal demagnetizations at540 ◦C before each pTRM were used as a baseline. These measure-ments were performed on the same specimens used for archaeoin-tensity determination after the last heating step. We calculated theanisotropy correction factor for each specimen according to Veitchet al. (1984).
N E W A RC H A E O I N T E N S I T Y DATAF RO M I TA LY
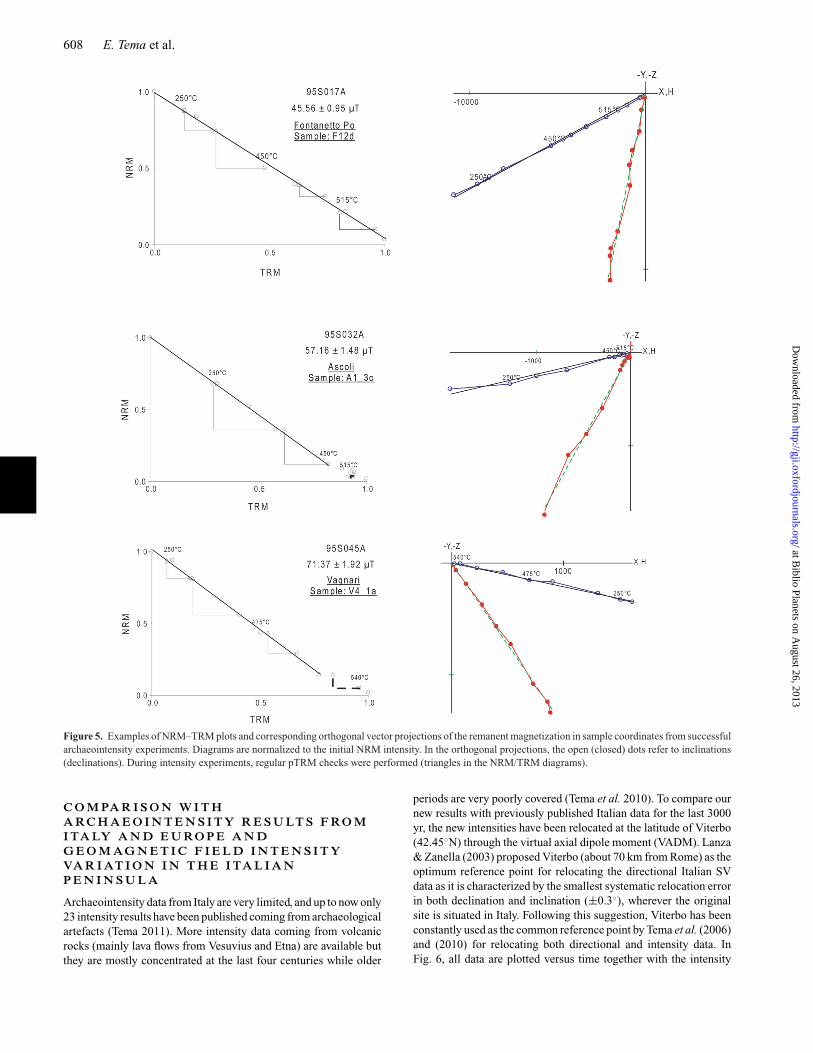
Archaeointensity determinations have been performed on 54 speci-mens from the three studied kilns. The obtained results, interpretedusing NRM–TRM plots (Fig. 5), are reported in Table 1 togetherwith the statistical parameters calculated according to Coe et al.(1978). For most of the specimens, linear NRM–TRM curves andpositive pTRM checks are obtained (Fig. 5). No secondary compo-nent of magnetization was detected in the directional plots obtainedfrom the palaeointensity experiments and the viscous magnetiza-tion, if any, was easily removed at 100–150 ◦C. To guarantee thequality of the new results, we applied selection criteria based on thelinearity of the NRM–TRM diagrams, the Coe’s quality parameters(Coe et al. 1978) and the pTRM checks. According to this selection,all the accepted new results fulfil the following criteria:
• The Arai diagrams, in which the NRM remaining is plottedagainst the TRM acquired after each heating step, are linear andthe number of the aligned points (N) used for the calculation of thearchaeointensity is ≥5. Only archaeointensities with NRM fractionfactor (f, Coe et al. 1978) ≥0.3 are accepted; this means that at leastthe 30 per cent of the initial NRM was used for their determination.
• No significant deviation of the NRM directions towards theapplied field is observed, as revealed in the vector (Zijderveld) plots.Archeointensity results obtained from NRM–pTRM diagrams mustshow no evident concave up shape, since in such cases remanenceis probably associated with the presence of MD grains (Levi 1977;Kosterov et al. 1998).
• Only results with positive pTRM checks are accepted for whichthe deviation of the pTRM checks is less than 15 per cent. Evaluationof pTRM tail checks performed at two different temperatures is inmost cases lower than 20 per cent (Ascoli Satriano and Vagnari)and 30 per cent (Fontanetto Po).
To guarantee the high quality of the new results, the mean siteintensities were calculated only from specimens that were correctedfor both cooling rate and ATRM effects. Three new reliable meansite intensities have been obtained for Italy; Ascoli Satriano (350–400 AD): 53.8 ± 3.7; Vagnari (300–400 AD): 52.8 ± 4.4; FontanettoPo (1796–1914 AD): 45.9 ± 2.6 µT.
at Biblio Planets on A
ugust 26, 2013http://gji.oxfordjournals.org/
Dow
nloaded from
608 E. Tema et al.
Figure 5. Examples of NRM–TRM plots and corresponding orthogonal vector projections of the remanent magnetization in sample coordinates from successfularchaeointensity experiments. Diagrams are normalized to the initial NRM intensity. In the orthogonal projections, the open (closed) dots refer to inclinations(declinations). During intensity experiments, regular pTRM checks were performed (triangles in the NRM/TRM diagrams).
C O M PA R I S O N W I T HA RC H A E O I N T E N S I T Y R E S U LT S F RO MI TA LY A N D E U RO P E A N DG E O M A G N E T I C F I E L D I N T E N S I T YVA R I AT I O N I N T H E I TA L I A NP E N I N S U L A
Archaeointensity data from Italy are very limited, and up to now only23 intensity results have been published coming from archaeologicalartefacts (Tema 2011). More intensity data coming from volcanicrocks (mainly lava flows from Vesuvius and Etna) are available butthey are mostly concentrated at the last four centuries while older
periods are very poorly covered (Tema et al. 2010). To compare ournew results with previously published Italian data for the last 3000yr, the new intensities have been relocated at the latitude of Viterbo(42.45◦N) through the virtual axial dipole moment (VADM). Lanza& Zanella (2003) proposed Viterbo (about 70 km from Rome) as theoptimum reference point for relocating the directional Italian SVdata as it is characterized by the smallest systematic relocation errorin both declination and inclination (±0.3◦), wherever the originalsite is situated in Italy. Following this suggestion, Viterbo has beenconstantly used as the common reference point by Tema et al. (2006)and (2010) for relocating both directional and intensity data. InFig. 6, all data are plotted versus time together with the intensity
at Biblio Planets on A
ugust 26, 2013http://gji.oxfordjournals.org/
Dow
nloaded from

Intensity secular variation in Italy 609
Tab
le1.
New
arch
aeoi
nten
sity
resu
lts
atsp
ecim
enle
vel.
Col
umns
:S
ite;
Spe
cim
en;
Tm
in-T
max
,min
imum
and
max
imum
tem
pera
ture
sus
edfo
rth
ein
tens
ity
dete
rmin
atio
n;N
,the
num
ber
ofhe
atin
gst
eps
used
for
the
inte
nsit
yde
term
inat
ion;
slop
e,sl
ope
ofth
ebe
stfi
t;β
,rat
ioof
the
stan
dard
erro
rof
the
slop
eto
the
abso
lute
valu
eof
the
best
-fitt
ing
slop
efo
rth
eda
taon
the
NR
M–T
RM
diag
ram
;f,t
hefr
acti
onof
NR
Mus
edfo
rin
tens
ity
dete
rmin
atio
n;g,
the
gap
fact
or;q
,the
qual
ity
fact
oras
defi
ned
byC
oeet
al.(
1978
);M
ad,m
axim
uman
gula
rde
viat
ion,
Dra
t,di
ffer
ence
rati
oas
defi
ned
byS
elki
n&
Taux
e(2
000)
;fA
TR
M,m
agne
tic
anis
otro
pyco
rrec
tion
fact
or;f
CR
,coo
ling
rate
corr
ecti
onfa
ctor
;F,P
alae
oint
ensi
tyin
µT
befo
rean
yco
rrec
tion
;SD
,sta
ndar
dde
viat
ion
inµ
T;F
atrm
:Pal
aeoi
nten
sity
inµ
Taf
ter
TR
Man
isot
ropy
corr
ecti
on;F
atrm
+cr:
Pala
eoin
tens
ity
inµ
Taf
ter
AT
RM
and
cool
ing
rate
corr
ecti
on;S
peci
men
sin
ital
ics
wer
ere
ject
edan
dth
eref
ore
notu
sed
for
the
calc
ulat
ion
ofth
esi
tem
ean.
Nsl
ope
bf
gq
Mad
Dra
tf A
TR
Mf C
RF
FT
min
–at
rmat
rm+c
rS
ite
Spe
cim
enT
max
(◦C
)F
(μT
)SD
(μT
)co
rrco
rr
Font
anet
toPo
F1B
220
–560
10−1
.53
0.03
0.95
0.75
25.6
2.1
3.2
0.98
10.
027
46.0
1.3
45.1
43.9
F1C
120
–560
10−1
.51
0.04
0.90
0.74
16.2
1.5
4.3
0.95
20.
024
45.3
1.9
43.1
42.1
F2B
220
–560
10−1
.46
0.04
0.98
0.73
18.9
1.4
4.0
0.98
3T
RM
1–3
>15
%43
.71.
742
.9
F3A
220
–515
8−1
.54
0.03
0.72
0.84
22.2
2.3
1.5
1.01
70.
065
46.1
1.3
46.9
43.9
F3C
120
–450
5−1
.57
0.06
0.89
0.69
9.9
1.5
4.1
1.00
8−0
.006
47.0
2.9
47.3
F5A
220
–475
6−1
.60
0.03
0.65
0.77
18.4
3.5
1.7
0.99
10.
088
48.1
1.3
47.7
43.5
F5A
320
–560
10−1
.62
0.02
0.96
0.84
37.4
2.5
2.3
0.98
70.
076
48.7
1.1
48.1
44.4
F6A
225
0–47
55
−1.7
80.
020.
520.
6614
.53.
01.
50.
973
0.10
553
.61.
352
.146
.6
F7B
2re
ject
ed
F7C
120
–350
4−1
.71
0.05
0.55
0.49
5.1
2.7
1.9
0.97
50.
026
51.2
2.7
49.9
48.6
F8A
220
–515
8−1
.80
0.04
0.88
0.75
15.8
2.9
2.5
0.99
90.
105
53.9
2.3
53.8
48.2
F9B
120
–515
8−1
.67
0.01
0.87
0.79
71.0
1.6
2.5
1.01
20.
123
50.1
0.5
50.7
44.5
F9C
120
–515
8−1
.85
0.03
0.83
0.82
20.6
3.6
3.5
0.96
90.
091
55.5
1.8
53.8
48.9
F9C
220
–560
10−1
.94
0.03
0.96
0.85
27.7
3.8
3.7
0.93
60.
132
58.3
1.7
54.6
47.4
F11
B1
20–4
505
−1.6
50.
030.
520.
6711
.72.
30.
60.
988
0.10
449
.51.
548
.943
.8
F12
C1
20–5
409
−1.6
30.
010.
950.
8556
.21.
81.
60.
984
0.07
948
.90.
748
.144
.3
F12
D20
–560
10−1
.52
0.02
0.96
0.86
39.6
1.6
1.3
1.10
30.
050
45.6
150
.347
.8
F16
A2
350–
560
7−1
.26
0.07
0.46
0.51
3.4
1.2
14.8
0.96
50.
000
37.8
2.6
36.5
F17
B1
20–3
504
−1.6
90.
050.
630.
618.
06.
41.
41.
005
−0.0
0550
.62.
450
.9
F18
C1
20–3
504
−1.7
30.
020.
570.
4817
.81.
90.
50.
981
−0.0
1252
.00.
851
.0
F19
C1
20–3
504
−1.7
80.
040.
600.
345.
73.
20.
40.
970
0.01
653
.51.
951
.951
.1
F21
A20
–540
9−1
.53
0.07
0.97
0.75
9.9
2.8
9.5
0.95
2−0
.007
45.8
3.4
43.6
Sit
em
ean:
F±
SD=
50.0
±3.
7μ
TF
atrm
±SD
=49
.4±
3.3
μT
Fat
rm+
cr±
SD=
45.9
±2.
6μ
T
Asc
oliS
atri
ano
A1–
1A35
0–56
07
−1.5
50.
100.
400.
552.
22.
928
.11.
091
−0.4
1346
.54.
750
.7
A1–
2B20
–540
8−1
.96
0.01
0.98
0.66
47.6
3.1
1.9
1.01
9−0
.422
58.9
0.8
60.0
A1–
3C20
–450
5−1
.91
0.03
0.88
0.72
24.6
3.5
2.5
1.05
2−0
.390
57.2
1.5
60.1
A2–
1A20
–475
6−2
.06
0.04
0.88
0.73
18.1
4.7
1.0
0.94
8−0
.359
61.8
2.2
58.6
at Biblio Planets on A
ugust 26, 2013http://gji.oxfordjournals.org/
Dow
nloaded from

610 E. Tema et al.
Tab
le1.
(Con
tinu
ed.)
Nsl
ope
bf
gq
Mad
Dra
tf A
TR
Mf C
RF
FT
min
–at
rmat
rm+c
rS
ite
Spe
cim
enT
max
(◦C
)F
(μT
)SD
(μT
)co
rrco
rr
A5–
1A20
–560
9−1
.92
0.04
0.96
0.74
16.9
2.7
12.7
1.08
5−0
.376
57.7
2.4
62.6
A5–
2B20
–560
10−1
.66
0.04
0.99
0.81
21.2
2.1
3.4
1.17
2−0
.024
49.7
1.9
58.2
A5–
3C20
–475
5−1
.91
0.05
0.87
0.70
11.3
3.5
0.1
1.07
0−0
.070
57.2
3.1
61.2
A2–
1A20
–475
6−2
.06
0.02
0.91
0.75
32.8
3.7
1.7
0.95
10.
019
61.9
1.3
58.9
57.8
A2–
2B20
–560
10−1
.88
0.05
0.95
0.79
15.5
4.5
5.1
0.98
10.
030
56.4
2.7
55.3
53.6
A2–
3C25
0–56
08
−1.7
30.
050.
690.
7810
.81.
96.
40.
978
0.03
751
.92.
650
.848
.9
A2–
4D20
–475
5−2
.04
0.02
0.91
0.69
26.2
2.1
3.0
0.93
30.
037
61.2
1.5
57.1
55.0
Sit
em
ean:
F±
SD=
57.4
±4.
0μ
TF
atrm
±SD
=58
.3±
3.3
μT
Fat
rm+
cr±
SD=
53.8
±3.
7μ
T
Vag
nari
V1–
1A45
0–56
06
−1.6
90.
090.
690
0.74
05.
43.
53.
31.
159
−0.0
5750
.74.
858
.8
V1–
2B20
–560
9−2
.07
0.04
0.96
00.
810
19.7
3.6
2.6
0.99
2−0
.064
62.2
2.5
61.7
V1–
3C20
–560
10−2
.06
0.09
0.92
70.
862
8.7
0.0
0.0
1.00
0−0
.026
61.8
2.8
61.8
V2–
1A20
–560
10−1
.93
0.04
0.89
00.
840
17.7
3.0
4.5
1.05
30.
033
57.8
2.5
60.8
58.8
V2–
2B20
–560
10−2
.22
0.12
0.93
40.
880
14.9
0.0
0.0
1.00
0−0
.009
66.5
3.7
66.5
V3–
1A20
–560
9−1
.79
0.06
1.00
00.
850
14.6
2.8
2.8
1.17
4−0
.013
57.3
3.1
67.3
V3–
2Bre
ject
ed
V3–
3C20
–515
7−2
.34
0.08
0.72
00.
810
7.3
4.4
3.3
1.18
8−0
.276
70.2
5.6
83.4
V4–
1A20
–515
7−2
.38
0.03
0.85
00.
810
25.5
1.9
1.8
0.89
5−0
.284
71.4
1.9
63.9
V4–
2B20
–475
5−2
.21
0.07
0.52
00.
730
5.1
3.8
4.1
1.01
9−0
.130
66.5
4.9
67.7
V4–
3Cre
ject
ed
V5–
1Are
ject
ed
V5–
2Bre
ject
ed
V5–
3C20
–475
5−1
.97
0.05
0.51
00.
700
6.8
5.1
4.1
1.12
8−0
.034
59.2
3.1
66.7
V6–
1A35
0–51
55
−1.8
90.
050.
600
0.72
09.
52.
12.
81.
133
TR
M1–
3>
15%
56.8
2.6
64.3
V7–
1Are
ject
ed
V7–
2B20
–560
10−2
.40
0.06
0.98
00.
820
13.3
2.6
5.4
1.02
6T
RM
1–3
>15
%72
.14.
473
.9
V7–
3Cre
ject
ed
V8F
-1A
350–
560
7−1
.89
0.07
0.48
00.
720
5.3
4.0
51.1
0.95
50.
044
56.6
3.7
54.1
51.7
V8K
-1A
450–
560
6−1
.82
0.12
0.27
00.
790
1.8
10.6
94.3
0.98
60.
022
54.5
6.5
53.7
52.5
V8L
-1A
250–
560
9−1
.62
0.04
0.70
00.
820
13.4
8.6
2.6
1.02
70.
033
48.6
2.1
49.9
48.3
Sit
em
ean:
F±
SD=
61.1
±6.
7μ
TF
atrm
±SD
=63
.1±
8.7
μT
Fat
rm+
cr±
SD=
52.8
±4.
4μ
T
at Biblio Planets on A
ugust 26, 2013http://gji.oxfordjournals.org/
Dow
nloaded from

Intensity secular variation in Italy 611
Figure 6. Italian archaeointensity data plotted versus age together with the Jackson et al. (2000) historical geomagnetic field model (black curve) for the lasttwo centuries. Symbols: diamonds = new data; grey dots = data from literature.
curve for the last two centuries derived from the historical geo-magnetic field model of Jackson et al. (2000). The archaeointensitydetermined from Fontanetto Po kiln is in very good agreementwith the direct intensity measurements available for the last 200 yr(Jackson et al. 2000). The new results from Vagnari and AscoliSatriano can be compared with the only archaeointensity resultavailable for the 300–500 AD period that come from the study ofa tile from the archaeological site of Carlino, dated around 380–430 AD (Hedley & Wagner 1991). There is a reasonable agreementbetween Ascoli Satriano and Carlino intensities, even though theAscoli’s intensity is slightly lower (Fig. 6). For this period, it can benoted that the new data contribute to our knowledge of the Earth’smagnetic field intensity in Italy during Late Roman times.
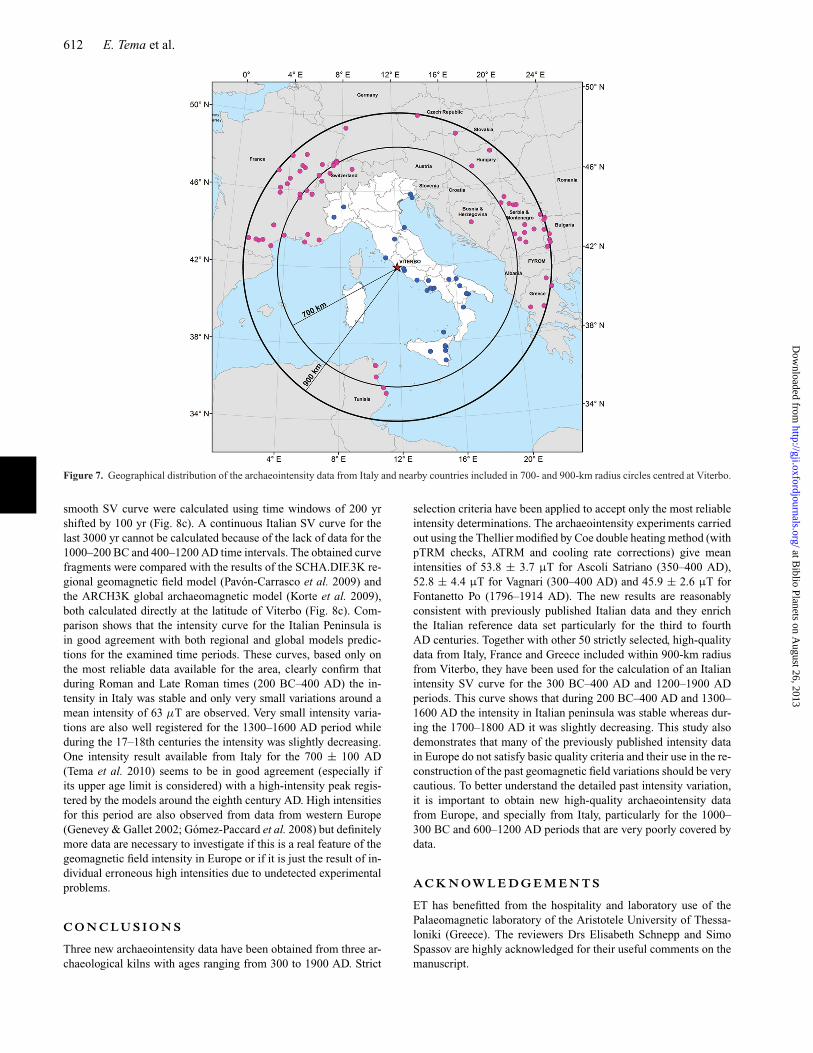
As already discussed by Tema (2011), data coming from Italianhistorical volcanic eruptions show important discrepancies whereasthose coming from archaeological material are still not sufficientlynumerous to reliably describe the fine characteristics of the ge-omagnetic field’s intensity variations. To increase the number ofreference data (coming from Italian archaeological artefacts andvolcanic rocks), we have compiled a data set including archaeoin-tensity results from nearby to Italy countries. The GEOMAGIAV.2 global database (Donadini et al. 2009, available at onlinehttp://geomagia.ucsd.edu) was used to collect all available inten-sity data that are included in a 700-km and a 900-km radius cir-cles around Viterbo and cover the last 3000 yr. This database hasbeen updated with some recently published data from Greece andTunisia (Fouzai et al. 2012; Tema et al. 2012). The 700-km cir-cle data set still remains poor with only 42 additional data added(Fig. 7). In contrast, the 900-km data set includes 159 more ar-chaeointensity data mainly coming from France, Switzerland, CzechRepublic, Slovakia, Hungary, Greece and Bulgaria (Fig. 7). Casas& Incoronato (2007) published a detailed analysis of the distri-bution of the relocation errors in both direction and intensity andshowed that in Europe, errors are about 0.25◦ per 100 km and100–200 nT per 100 km. That means that the geographic correc-tion of intensities from 900 km (using the VADM) could introducerelocation errors of around 0.9–1.8 µT that are negligible and inmost cases are much lower than the archaeointensity measurementsprecision.
The 900-km data set significantly enhances the number of ref-erence data for the Italian Peninsula and the data partially fill thegap between fourth and ninth centuries BC and first to fourth and
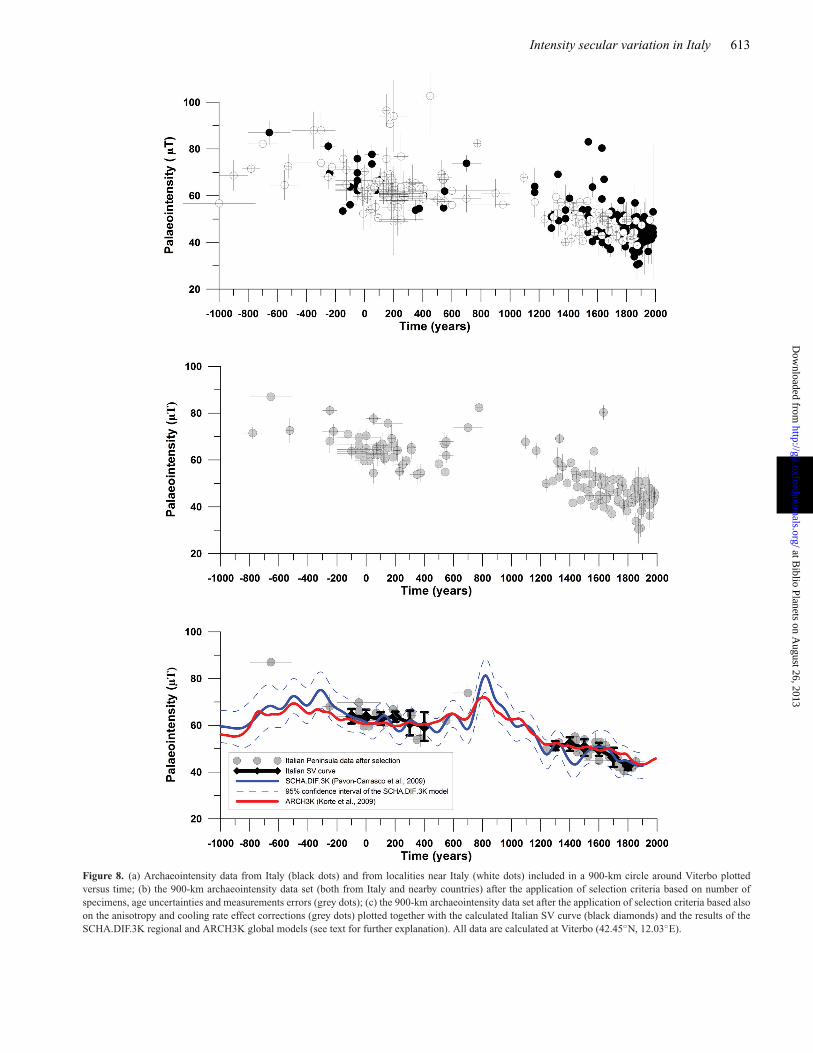
ninth to 11th AD for which no or very few Italian data are avail-able (Fig. 8a). Intensities from countries nearby Italy seem to be ingood agreement with the Italian data particularly for the last 800 yr(1200–2000 AD) and for Roman times. For other time periods, onlylimited Italian data are available for comparison and in some casesdiscrepancies can be observed (e.g. 200–300 AD). To have a controlon the quality of the reference data, quality selection criteria on the900-km data set have been applied. As already thoroughly discussedby several authors (e.g. Donadini et al. 2009; Pavon-Carrasco et al.2009; Tema & Kondopoulou 2011; Tema et al. 2012) controllingthe correctness and quality of the data included in global databasesis a very complicated task. The same is true for the establishment ofselection criteria to collect or reject reference data. Various selec-tion and/or ranking criteria have been proposed for the evaluationof the quality of the intensity data (Chauvin et al. 2000; Geneveyet al. 2008) that are mainly based on the method used, the numberof samples studied, the standard deviation, the applied anisotropyand cooling rate corrections. However, on one hand applying verystrict selection criteria often results to the elimination of more than80 per cent of the reference data (Tema & Kondopoulou 2011).On the other hand, applying soft selection criteria would allow thepresence of low-quality data in the reference data set. In this study,we first applied a basic selection filter (following Tema et al. 2012),and we rejected all data that are characterized by age uncertain-ties higher than 300 yr, those that are based on less than threearchaeointensity determinations and those that have standard de-viations higher than 6 µT. All data that were missing the aboveinformation have also been rejected. Applying this selection filter,from the 283 initial data, 140 were rejected mainly because of thevery small number of specimens/samples studied (in many casesonly one). The remaining 143 data are plotted in Fig. 8(b). As it canbe noted, the data are now better concentrated and some outlierspreviously observed around 200 AD and 450 AD are now elimi-nated. As a further step, we applied more severe selection criteriaand we rejected all data that missed anisotropy and cooling rate cor-rections, taking into consideration that these corrections are veryimportant to obtain reliable archaeointensity results, mainly in thecase of pottery and brick studies. After this selection, only 51 datapoints remain (Fig. 8c). These data coming from Italy, France andGreece can be considered of high quality, even if limited.
For the time periods 300 BC–400 AD and 1200–1900 AD forwhich enough data are available, fragments of a continuous and
at Biblio Planets on A
ugust 26, 2013http://gji.oxfordjournals.org/
Dow
nloaded from
612 E. Tema et al.
Figure 7. Geographical distribution of the archaeointensity data from Italy and nearby countries included in 700- and 900-km radius circles centred at Viterbo.
smooth SV curve were calculated using time windows of 200 yrshifted by 100 yr (Fig. 8c). A continuous Italian SV curve for thelast 3000 yr cannot be calculated because of the lack of data for the1000–200 BC and 400–1200 AD time intervals. The obtained curvefragments were compared with the results of the SCHA.DIF.3K re-gional geomagnetic field model (Pavon-Carrasco et al. 2009) andthe ARCH3K global archaeomagnetic model (Korte et al. 2009),both calculated directly at the latitude of Viterbo (Fig. 8c). Com-parison shows that the intensity curve for the Italian Peninsula isin good agreement with both regional and global models predic-tions for the examined time periods. These curves, based only onthe most reliable data available for the area, clearly confirm thatduring Roman and Late Roman times (200 BC–400 AD) the in-tensity in Italy was stable and only very small variations around amean intensity of 63 μT are observed. Very small intensity varia-tions are also well registered for the 1300–1600 AD period whileduring the 17–18th centuries the intensity was slightly decreasing.One intensity result available from Italy for the 700 ± 100 AD(Tema et al. 2010) seems to be in good agreement (especially ifits upper age limit is considered) with a high-intensity peak regis-tered by the models around the eighth century AD. High intensitiesfor this period are also observed from data from western Europe(Genevey & Gallet 2002; Gomez-Paccard et al. 2008) but definitelymore data are necessary to investigate if this is a real feature of thegeomagnetic field intensity in Europe or if it is just the result of in-dividual erroneous high intensities due to undetected experimentalproblems.
C O N C LU S I O N S
Three new archaeointensity data have been obtained from three ar-chaeological kilns with ages ranging from 300 to 1900 AD. Strict
selection criteria have been applied to accept only the most reliableintensity determinations. The archaeointensity experiments carriedout using the Thellier modified by Coe double heating method (withpTRM checks, ATRM and cooling rate corrections) give meanintensities of 53.8 ± 3.7 µT for Ascoli Satriano (350–400 AD),52.8 ± 4.4 µT for Vagnari (300–400 AD) and 45.9 ± 2.6 µT forFontanetto Po (1796–1914 AD). The new results are reasonablyconsistent with previously published Italian data and they enrichthe Italian reference data set particularly for the third to fourthAD centuries. Together with other 50 strictly selected, high-qualitydata from Italy, France and Greece included within 900-km radiusfrom Viterbo, they have been used for the calculation of an Italianintensity SV curve for the 300 BC–400 AD and 1200–1900 ADperiods. This curve shows that during 200 BC–400 AD and 1300–1600 AD the intensity in Italian peninsula was stable whereas dur-ing the 1700–1800 AD it was slightly decreasing. This study alsodemonstrates that many of the previously published intensity datain Europe do not satisfy basic quality criteria and their use in the re-construction of the past geomagnetic field variations should be verycautious. To better understand the detailed past intensity variation,it is important to obtain new high-quality archaeointensity datafrom Europe, and specially from Italy, particularly for the 1000–300 BC and 600–1200 AD periods that are very poorly covered bydata.
A C K N OW L E D G E M E N T S
ET has benefitted from the hospitality and laboratory use of thePalaeomagnetic laboratory of the Aristotele University of Thessa-loniki (Greece). The reviewers Drs Elisabeth Schnepp and SimoSpassov are highly acknowledged for their useful comments on themanuscript.
at Biblio Planets on A
ugust 26, 2013http://gji.oxfordjournals.org/
Dow
nloaded from
Intensity secular variation in Italy 613
Figure 8. (a) Archaeointensity data from Italy (black dots) and from localities near Italy (white dots) included in a 900-km circle around Viterbo plottedversus time; (b) the 900-km archaeointensity data set (both from Italy and nearby countries) after the application of selection criteria based on number ofspecimens, age uncertainties and measurements errors (grey dots); (c) the 900-km archaeointensity data set after the application of selection criteria based alsoon the anisotropy and cooling rate effect corrections (grey dots) plotted together with the calculated Italian SV curve (black diamonds) and the results of theSCHA.DIF.3K regional and ARCH3K global models (see text for further explanation). All data are calculated at Viterbo (42.45◦N, 12.03◦E).
at Biblio Planets on A
ugust 26, 2013http://gji.oxfordjournals.org/
Dow
nloaded from

614 E. Tema et al.
R E F E R E N C E S
Barello, F., Ferrara, E., Gatti, S. & Tema, E., 2012. Fontanetto Po, stradavicinale antica Torino-Casale. Fornaci di epoca moderna e strada glareataromana, Quaderni della Soprintendenza Archeologica del Piemonte, 27,242–244.
Casas, L. & Incoronato, A., 2007. Distribution analysis of errors due torelocation of geomagnetic data using the ‘Conversion via Pole’ (CVP)method: implications on archaeomagnetic data, Geophys. J. Int., 169,448–454.
Chauvin, A., Garcia, Y., Lanos, Ph. & Laubenheimer, F., 2000. Paleointen-sity of the geomagnetic field recovered on archaeomagnetic sites fromFrance, Phys. Earth planet. Inter., 120, 111–136.
Coe, R.S., 1967. Paleo-intensities of the Earth’s magnetic field determinedfrom Tertiary and Quaternary rocks, J. geophys. Res., 72(12), 3247–3262.
Coe, R.S., Gromme, S. & Mankinen, E.A., 1978. Geomagnetic paleointen-sities from radiocarbon-dated lava flows on Hawaii and the question ofthe Pacific nondipole low, J. geophys. Res., 83(B4), 1740–1756.
Donadini, F., Korte, M. & Constable, C.G., 2009. Geomagnetic field for 0–3ka: 1. New data sets for global modelling, Geochem. Geophys. Geosyst.,10, doi:10.1029/2008GC002295.
Fouzai, B., Casas, L., Ouazaa, N.L. & Alvarez, A., 2012. Archaeomagneticdata from four Roman sites in Tunisia, J. Arch. Sci., 39, 1871–1882.
Fox, J.M.W. & Aitken, M.J., 1980. Cooling rate dependence of the thermore-manent magnetisation, Nature, 283, 462–463
Genevey, A. & Gallet, Y., 2002. Intensity of the geomagnetic field in westernEurope over the past 2000 years: new data from ancient French pottery,J. geophys. Res., 107(B11), doi:10.1029/2001JB000701.
Genevey, A., Gallet, Y., Constable, C., Korte, M. & Hulot, G., 2008.ArcheoInt: an upgraded compilation of geomagnetic field intensity datafor the past ten millennia and its application to recovery of the past dipolemoment, Geochem. Geophys. Geosyst., 9, Q04038.
Goguitchaichvili, A., Greco, C. & Morales, J., 2011. Geomagnetic fieldintensity behavior in South America between 400 AD and 1800 AD: firstarcheointensity results from Argentina, Phys. Earth planet. Inter., 186,191–197.
Goguitchaichvili, A., Laponte, D., Morales, J. & Acosta, A., 2012. Ar-chaeointensity of the Earth’s magnetic field retrieved from Pampean Ce-ramics (South America), Archaeometry, 54(2), 213–224.
Gomez-Paccard, M. et al., 2006. A catalogue of Spanish archaeomagneticdata, Geophys. J. Int., 166, 1125–1143.
Gomez-Paccard, M., Chauvin, A., Lanos, Ph. & Thiriot, J., 2008. Newarchaeointensity data from Spain and the geomagnetic dipole moment inwestern Europe over the past 2000 years, J. geophys. Res., 113, B09103.
Halgedahl, S.L., Day, R. & Fuller, M., 1980. The effect of cooling rateintensity of week-field TRM in single-domain magnetite, J. geophys.Res., 85, 3690–3698.
Hedley, I. & Wagner, G.C., 1991. A magnetic investigation of Roman andpre-Roman pottery, in Archaeometry ’90, pp. 275–284, eds Pernicka, E.& Wagner, G.C., Birkhaeuser, Basel.
Jackson, A., Jonkers, A. & Walker, M., 2000. Four centuries of geomagneticsecular variation from historical records, Philos. Trans. R. Soc. Lond., A,358, 957–990.
Korte, M. & Constable, C.G., 2005. Continuous geomagnetic field modelsfor the past 7 millennia: 2.CALS7K, Geochem. Geophys. Geosyst., 6,Q02H16.
Korte, M. & Constable, C.G., 2011. Improving geomagnetic field recon-structions for 0–3 ka, Phys. Earth planet. Inter., 188, 247–259.
Korte, M., Genevey, A., Constable, C., Frank, U. & Schnepp, E., 2005.Continuous geomagnetic field models for the past 7 millennia: 1. A newglobal data compilation, Geochem. Geophys. Geosyst., 6, Q02H15.
Korte, M., Donadini, F. & Constable, C.G., 2009. Geomagnetic field for 0–3ka: 2. A new series of time-varying global models, Geochem. Geophys.Geosyst., 10, Q06008.
Korte, M., Constable, C.G., Donadini, F. & Holme, R., 2011. Reconstructingthe Holocene geomagnetic field, Earth planet. Sci. Lett., 312, 497–505.
Kosterov, A.A., Perrin, M., Glen, J.M. & Coe, R.S., 1998. Paleointensity ofthe Earth’s magnetic field in Early Cretaceous time: the Parana Basalt,Brazil, J. geophys. Res., 103, 9739–9753.
Lanza, R. & Zanella, E., 2003. Palaeomagnetic secular variation at Vulcano(Aeolian Islands) during the last 135 kyr, Earth planet. Sci. Lett., 213,312–336.
Levi, S., 1977. The effect of magnetite particle size on paleointensity de-terminations of the geomagnetic field, Phys. Earth planet. Inter., 13,245–259.
Lowrie, W., 1990. Identification of ferromagnetic minerals in a rock bycoercivity and unblocking temperature properties, Geophys. Res. Lett.,17, 159–162.
McClelland-Brown, E., 1984. Experiments on TRM intensity dependenceon cooling rate, Geophys. Res. Lett., 11(3), 205–208.
Morales, J., Goguitchaichvili, A., Acosta, G., Gonzalez-Moran, T., Alva-Valdivia, L., Robles-Camacho, J. & Hernandez-Bernal, M.S., 2009. Mag-netic properties and archeointensity determination on Pre-Columbian pot-tery from Chiapas, Mesoamerica, Earth Planets Space, 61, 83–91.
Neel, L., 1949. Theorie du traınage magnetique des ferromagnetiques engrains fins avec applications aux terres cuites, Ann. Geophys., 5, 99–136.
Pavon-Carrasco, F.J., Osete, M.L., Torta, J.M. & Gaya-Pique, L.R., 2009.A regional archaeomagnetic model for Europe for the last 3000 years,SCHA.DIF.3K: applications to archaeomagnetic dating, Geochem. Geo-phys. Geosyst., 10(3), Q03013.
Schnepp, E., Pucher, R., Reindeers, J., Hambach, U., Soffel, H. & Hedley,I., 2004. A German catalogue of archaeomagnetic data, Geophys. J. Int.,157, 64–78.
Selkin, P. & Tauxe, L., 2000. Long-term variations in palaeointensity, Phil.Trans. R. Soc. Lond., 358, 1065–1088.
Tema, E., 2011. Archaeomagnetic research in Italy: recent achievementsand future perspectives, in The Earth’s Magnetic Interior, IAGA SpecialSopron Book Series, Vol. 1, Chapter 15, pp. 213–233, eds Petrovsky, E.,Herrero-Bervera, E., Harinarayana, T. & Ivers, D., Springer.
Tema, E. & Kondopoulou, D., 2011. Secular variation of the Earth’s mag-netic field in the Balkan region during the last 8 millennia based onarchaeomagnetic data, Geophys. J. Int., 186, 603–614.
Tema, E., Hedley, I. & Lanos, Ph., 2006. Archaeomagnetism in Italy: acompilation of data including new results and a preliminary Italian secularvariation curve, Geophys. J. Int., 167, 1160–1171.
Tema, E., Goguitchaichvili, A. & Camps, P., 2010. Archaeointensity deter-minations from Italy: new data and the Earth’s magnetic field strengthvariation over the past three millennia, Geophys. J. Int., 180, 596–608.
Tema, E., Gomez-Paccard, M., Kondopoulou, D. & Ylenia, A., 2012. Inten-sity of the Earth’s magnetic field in Greece during the last five millennia:new data from Greek pottery, Phys. Earth planet. Inter., 202–203, 14–26.
Tema, E. et al., 2013. Combined archaeomagnetic and thermoluminescencestudy of a brick kiln excavated at Fontanetto Po (Vercelli, Northern Italy),J. Archaeol. Sci., 40, 2025–2035.
Thellier, E. & Thellier, O., 1959. Sur l’intensite du champ magnetiqueterrestre dans le passe historique et geologique, Ann. Geophys., 15, 285–376.
Valet, J.P., Herrero-Bervera, E., LeMouel, J.L & Plenier, G., 2008. Secularvariation of the geomagnetic dipole during the past 2000 years, Geochem.Geophys. Geosyst., 9, Q01008.
Veitch, R.J., Hedley, I.G. & Wagner, J.J., 1984. An investigation of theintensity of the geomagnetic field during Roman times using magneticallyanisotropic bricks and tiles, Arch. Sci. (Geneva), 37(3), 359–373.
at Biblio Planets on A
ugust 26, 2013http://gji.oxfordjournals.org/
Dow
nloaded from
Copyright © 2022 FDOKUMEN