Apresentação do PowerPoint - Santander
101
1
-
Upload
khangminh22 -
Category
Documents
-
view
7 -
download
0
Transcript of Apresentação do PowerPoint - Santander
1

2
DISCLAIMERThis presentation may contain certain forward-looking statements and information pertaining to Banco Santander (Brasil) S.A. (“Santander Brasil”) and its
subsidiaries, which reflect the current views and / or expectations of Santander Brasil and its management regarding its business performance and future events.
Forward-looking statements include, without limitation, any statement that may predict, forecast, indicate or imply future results, performance or
achievements, and may contain words such as “believe”, “anticipate”, “expect”, “estimate”, “could”, “forecast”, “potential”, “will likely result”, or other
words or expressions of similar meaning.
Such statements are subject to several risks, uncertainties and assumptions. We caution that a number of important factors may cause actual results to
differ substantially from the plans, objectives, expectations, estimates and intentions expressed herein.
We do not undertake any obligation to update or revise any forward-looking statements, whether as a result of new information, future events or
otherwise. In no event shall Santander Brasil, or any of its subsidiaries, affiliates, shareholders, directors, officers, employees or agents be liable to any
third party (including investors) for any investment or business decision or action taken in reliance on the information and statements contained in this
presentation or for any consequential, special or similar damages.
In addition to factors identified elsewhere in this presentation, the following factors, among others, may cause actual results to differ materially from the
forward-looking statements or historical performance: changes in the preferences and financial condition of our consumers and competitive conditions in the
markets in which we operate, changes in economic, political and business conditions in Brazil; government interventions, resulting in changes in the Brazilian
economy, taxes, tariffs or regulatory environment; our ability to compete successfully; changes in our business; our ability to successfully implement marketing
strategies; our identification of business opportunities; our ability to develop and introduce new products and services; changes in the cost of our products and
operating costs; our level of indebtedness and other financial obligations; our ability to attract new customers; inflation in Brazil; the devaluation of the Brazilian
Real against the U.S. Dollar and interest rate fluctuations; current or future changes in laws and regulations; and our ability to maintain existing business
relationships and create new relationships.
Agenda
2. Santander Brasil
3. Santander Worldwide
4. Santander in South America
1. Macroeconomics and Financial System
Corporate Profile2.1
Technology2.2
Business Overview2.3
Results2.4
3
1. Macroeconomics
and Financial System
4

Corporate Profile
2.1
Technology
2.2
Business Overview
2.3
Results
2.4
Santander Brasil
2
Santander Worldwide
3
Santander in LATAM
4 Institutional
Presentation
3Q19Macroeconomics and
Financial System
1
Macroeconomy | 2019-2021 Outlook
1 Sources: Santander Brasil Economic Department, as of November 1st, 2019. 5
Santander Forecasts¹
2016 2017 2018 2019 2020 2021
Real GDP (%) -3.3 1.1 1.1 0.8 2.0 2.7
IPCA-IBGE (%) 6.3 2.9 3.7 3.4 3.5 3.8
IGP-M (%) 7.2 -0.5 7.5 5.5 4.0 4.0
R$/US$ - end of period 3.26 3.31 3.87 4.00 4.00 4.10
SELIC - end of period (% p.a.) 13.75 7.00 6.50 4.50 4.00 6.00
Unemployment rate (average)(%) 11.5 12.8 12.3 12.0 10.9 9.4
Trade balance (USD bn) 47.7 67.1 59.9 43.3 37.0 35.0
Current account balance (% GDP) -1.3 -0.4 -0.8 -2.4 -2.4 -2.5
Primary Balance (% GDP) -2.5 -1.7 -1.6 -1.3 -1.2 -0.7
Net public sector debt (% GDP) 46.2 51.6 53.8 55.2 56.4 57.7
Gross public sector debt (% GDP) 70.0 74.1 77.2 78.9 79.8 80.7

Corporate Profile
2.1
Technology
2.2
Business Overview
2.3
Results
2.4
Santander Brasil
2
Santander Worldwide
3
Santander in LATAM
4 Institutional
Presentation
3Q19Macroeconomics and
Financial System
1
5.5
1.3 0.0
2.0
4.0
6.0
8.0
10.0
12.0
14.0
16.0
Dec-
15
Mar-
16
Jun
-16
Sep
-16
Dec-
16
Mar-
17
Jun
-17
Sep
-17
Dec-
17
Mar-
18
Jun
-18
Sep
-18
Dec-
18
Mar-
19
Jun
-19
Sep
-19
Selic
Real Interest Rates (1 year, ex-ante)
IPCA, last 12 month accumulated¹ (%) Selic Rate and Real Interest Rates ² (%)
Macroeconomy - Controlled inflation and interest rate at historical lows
6¹ Core by exclusion. Souces: IBGE, Santander. ² Sources: Brazil Central Bank, Anbima, Santander.
Estimates
2
4
6
8
10
12
Dec-1
5
Mar-
16
Jun
-16
Sep
-16
Dec-1
6
Mar-
17
Jun
-17
Sep
-17
Dec-1
7
Mar-
18
Jun
-18
Sep
-18
Dec-1
8
Mar-
19
Jun
-19
Sep
-19
Dec-1
9
Inflation - IPCA Core Target
Corporate Profile
2.1
Technology
2.2
Business Overview
2.3
Results
2.4
Santander Brasil
2
Santander Worldwide
3
Santander in LATAM
4 Institutional
Presentation
3Q19Macroeconomics and
Financial System
1
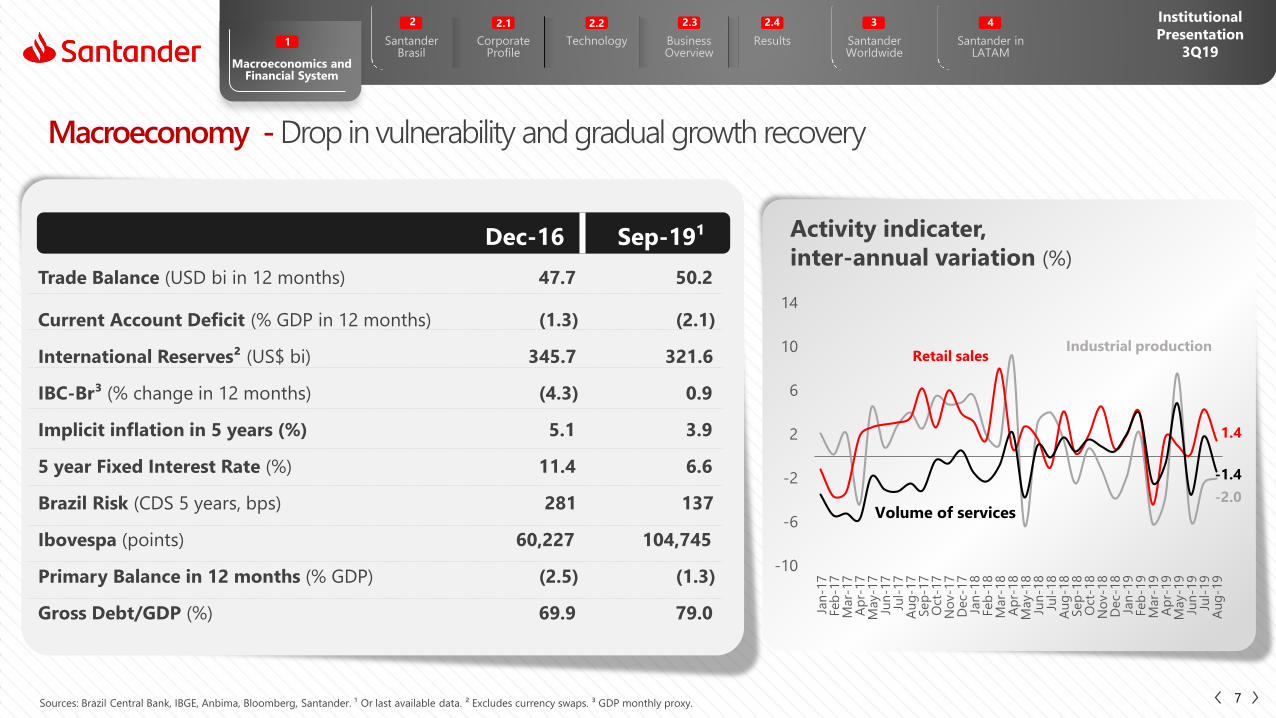
-2.0
1.4
-1.4
-10
-6
-2
2
6
10
14
Jan
-17
Feb
-17
Mar-
17
Ap
r-17
May-1
7Ju
n-1
7Ju
l-17
Au
g-1
7Sep
-17
Oct
-17
No
v-1
7D
ec-
17
Jan
-18
Feb
-18
Mar-
18
Ap
r-18
May-1
8Ju
n-1
8Ju
l-18
Au
g-1
8Sep
-18
Oct
-18
No
v-1
8D
ec-
18
Jan
-19
Feb
-19
Mar-
19
Ap
r-19
May-1
9Ju
n-1
9Ju
l-19
Au
g-1
9
Industrial productionRetail sales
Volume of services
Activity indicater,
inter-annual variation (%)
Macroeconomy - Drop in vulnerability and gradual growth recovery
7Sources: Brazil Central Bank, IBGE, Anbima, Bloomberg, Santander. ¹ Or last available data. ² Excludes currency swaps. ³ GDP monthly proxy.
Dec-16 Sep-19¹
Trade Balance (USD bi in 12 months) 47.7 50.2
Current Account Deficit (% GDP in 12 months) (1.3) (2.1)
International Reserves² (US$ bi) 345.7 321.6
IBC-Br³ (% change in 12 months) (4.3) 0.9
Implicit inflation in 5 years (%) 5.1 3.9
5 year Fixed Interest Rate (%) 11.4 6.6
Brazil Risk (CDS 5 years, bps) 281 137
Ibovespa (points) 60,227 104,745
Primary Balance in 12 months (% GDP) (2.5) (1.3)
Gross Debt/GDP (%) 69.9 79.0
Corporate Profile
2.1
Technology
2.2
Business Overview
2.3
Results
2.4
Santander Brasil
2
Santander Worldwide
3
Santander in LATAM
4 Institutional
Presentation
3Q19Macroeconomics and
Financial System
1
0
10
20
Dec-
15
Mar-
16
Jun
-16
Sep
-16
Dec-
16
Mar-
17
Jun
-17
Sep
-17
Dec-
17
Mar-
18
Jun
-18
Sep
-18
Dec-
18
Mar-
19
Jun
-19
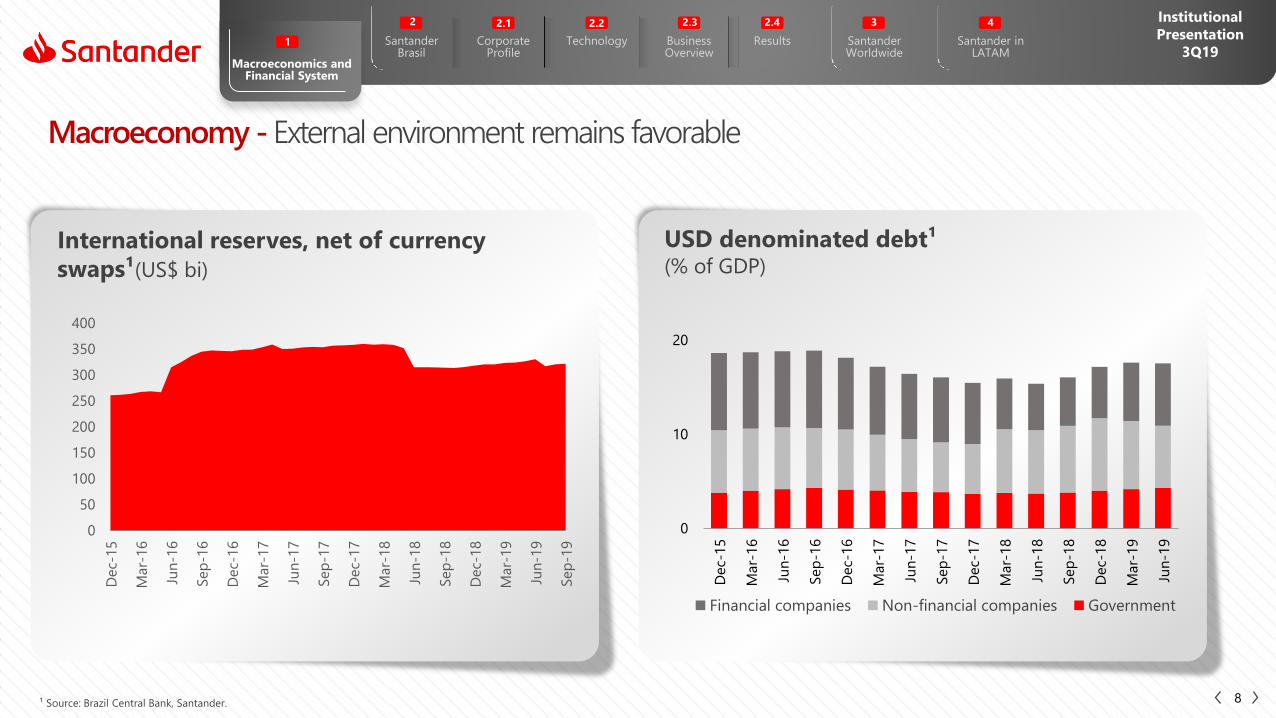
Financial companies Non-financial companies Government
0
50
100
150
200
250
300
350
400
Dec-
15
Mar-
16
Jun
-16
Sep
-16
Dec-
16
Mar-
17
Jun
-17
Sep
-17
Dec-
17
Mar-
18
Jun
-18
Sep
-18
Dec-
18
Mar-
19
Jun
-19
Sep
-19
USD denominated debt¹(% of GDP)
International reserves, net of currency
swaps¹(US$ bi)
Macroeconomy - External environment remains favorable
8¹ Source: Brazil Central Bank, Santander.

Corporate Profile
2.1
Technology
2.2
Business Overview
2.3
Results
2.4
Santander Brasil
2
Santander Worldwide
3
Santander in LATAM
4 Institutional
Presentation
3Q19Macroeconomics and
Financial System
1
44
3432
29
23 23 23 21 2118
15
50
60
70
80
90
-3
-2
-1
0
1
2
3
4
2006
2007
2008
2009
2010
2011
2012
2013
2014
2015
2016
2017
2018
2019E
2020E
2021E
2022E
Primary balance Gross debt
Structural initiatives needed
Primary balance and gross debt (% of GDP)
Investment/ GDP (%), 2013-17 average
Macroeconomy
9
Social Security Reform;
Elimination of the indexation of social
spending;
Stricter requirements to access social programs
in order to curb fraud;
Restrictions on discretionary
spending;
Tax Reform;
Create incentives to increase
domestic savings.
Source: Brazil Central Bank, Santander and IMF.
Corporate Profile
2.1
Technology
2.2
Business Overview
2.3
Results
2.4
Santander Brasil
2
Santander Worldwide
3
Santander in LATAM
4 Institutional
Presentation
3Q19Macroeconomics and
Financial System
1
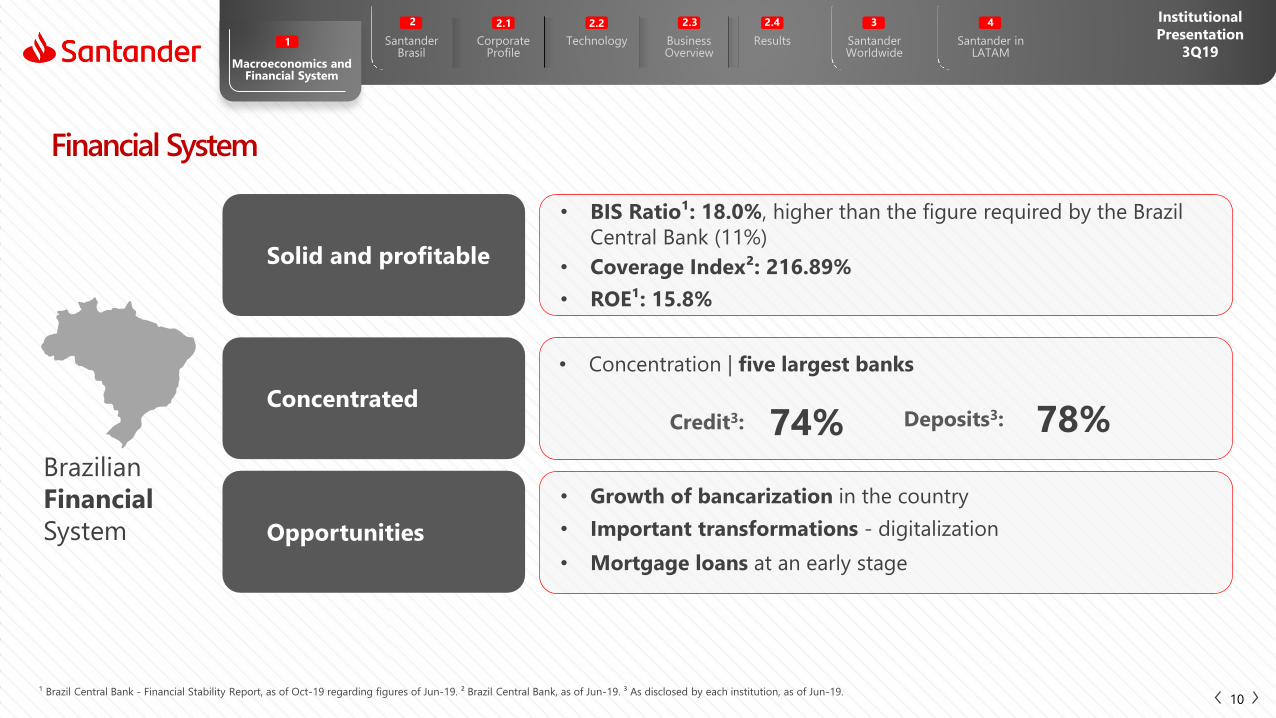
Financial System
Solid and profitable
Concentrated
• Concentration | five largest banks
Credit3:
Opportunities
74%
10
Deposits3: 78%
Brazilian
Financial
System
¹ Brazil Central Bank - Financial Stability Report, as of Oct-19 regarding figures of Jun-19. ² Brazil Central Bank, as of Jun-19. ³ As disclosed by each institution, as of Jun-19.
• BIS Ratio¹: 18.0%, higher than the figure required by the Brazil
Central Bank (11%)
• Coverage Index²: 216.89%
• ROE¹: 15.8%
• Mortgage loans at an early stage
• Growth of bancarization in the country
• Important transformations - digitalization
Corporate Profile
2.1
Technology
2.2
Business Overview
2.3
Results
2.4
Santander Brasil
2
Santander Worldwide
3
Santander in LATAM
4 Institutional
Presentation
3Q19Macroeconomics and
Financial System
1
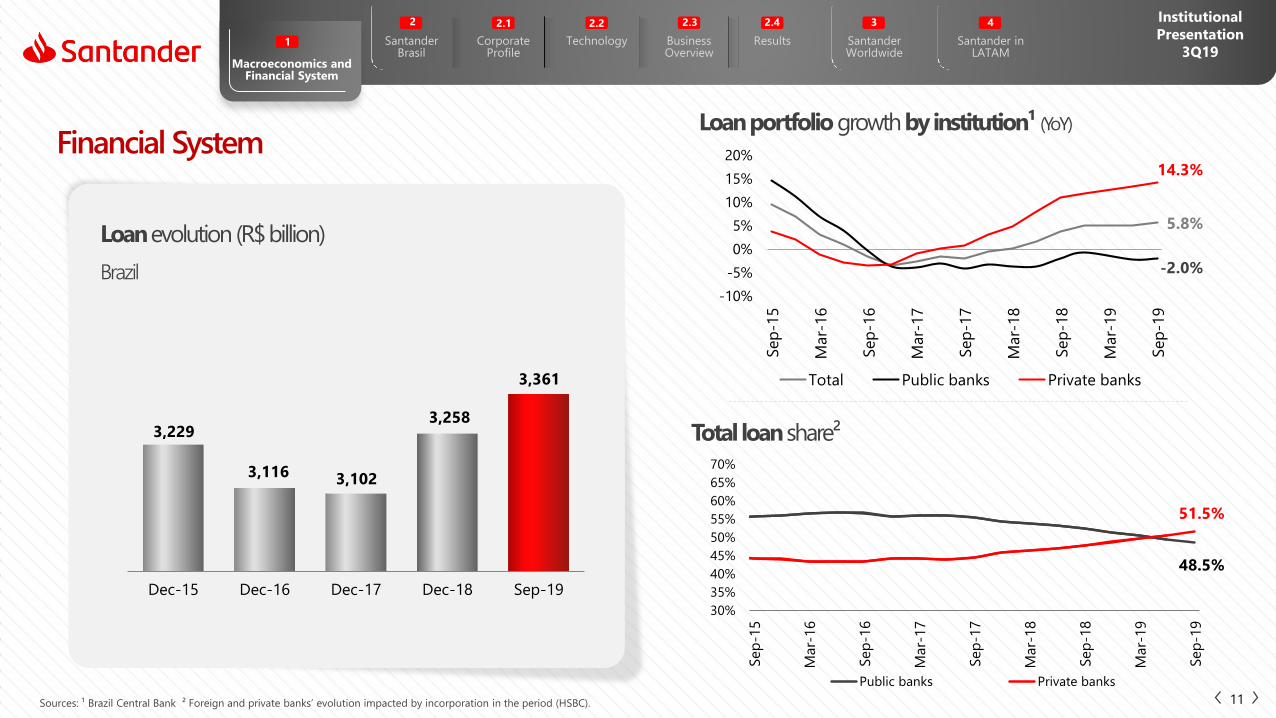
48.5%
51.5%
30%
35%
40%
45%
50%
55%
60%
65%
70%
Sep
-15
Mar-
16
Sep
-16
Mar-
17
Sep
-17
Mar-
18
Sep
-18
Mar-
19
Sep
-19
Public banks Private banks
5.8%
-2.0%
14.3%
-10%
-5%
0%
5%
10%
15%
20%
Sep
-15
Mar-
16
Sep
-16
Mar-
17
Sep
-17
Mar-
18
Sep
-18
Mar-
19
Sep
-19
Total Public banks Private banks
3,229
3,116 3,102
3,258
3,361
Dec-15 Dec-16 Dec-17 Dec-18 Sep-19
Loanevolution (R$ billion)
Loan portfolio growth by institution¹ (YoY)
Brazil
Total loanshare²
Financial System
11Sources: ¹ Brazil Central Bank ² Foreign and private banks’ evolution impacted by incorporation in the period (HSBC).
Corporate Profile
2.1
Technology
2.2
Business Overview
2.3
Results
2.4
Santander Brasil
2
Santander Worldwide
3
Santander in LATAM
4 Institutional
Presentation
3Q19Macroeconomics and
Financial System
1
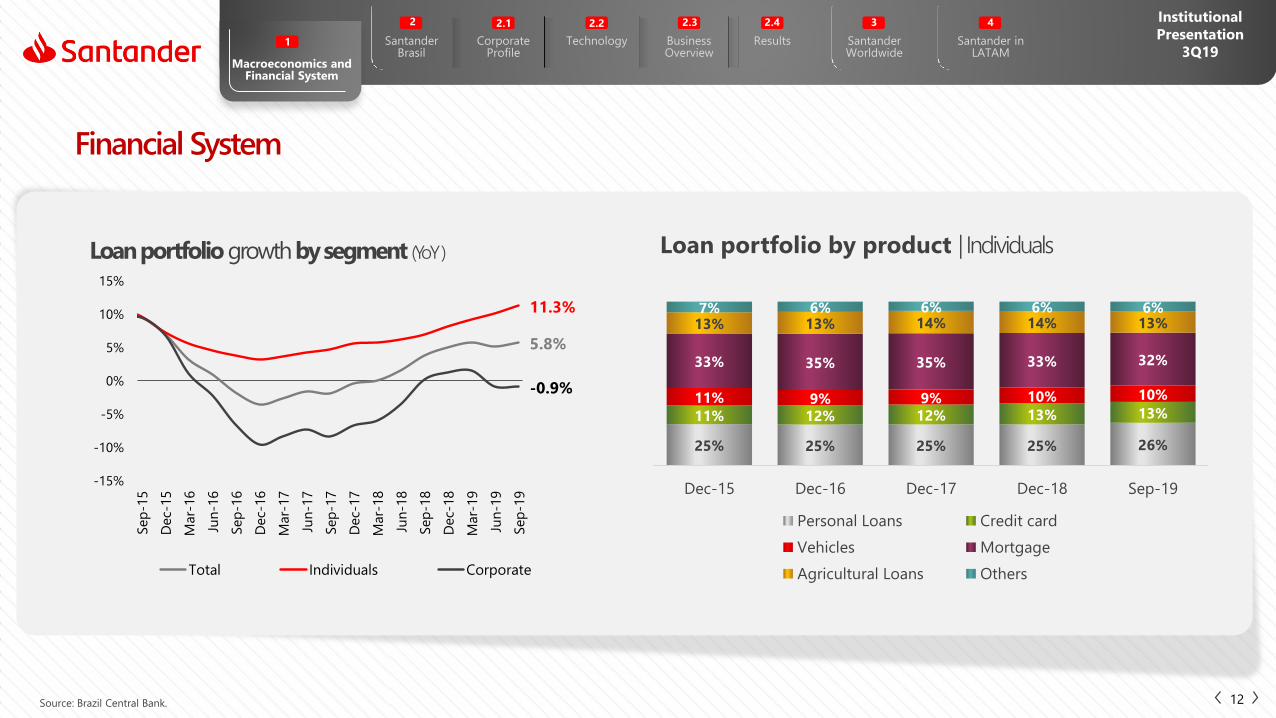
25% 25% 25% 25% 26%
11% 12% 12% 13% 13%11% 9% 9% 10% 10%
33% 35% 35% 33% 32%
13% 13% 14% 14% 13%7% 6% 6% 6% 6%
Dec-15 Dec-16 Dec-17 Dec-18 Sep-19
Personal Loans Credit card
Vehicles Mortgage
Agricultural Loans Others
5.8%
11.3%
-0.9%
-15%
-10%
-5%
0%
5%
10%
15%
Sep
-15
Dec-
15
Mar-
16
Jun
-16
Sep
-16
Dec-
16
Mar-
17
Jun
-17
Sep
-17
Dec-
17
Mar-
18
Jun
-18
Sep
-18
Dec-
18
Mar-
19
Jun
-19
Sep
-19
Total Individuals Corporate
Loan portfolio growth by segment (YoY) Loan portfolio by product | Individuals
Financial System
12Source: Brazil Central Bank.
Corporate Profile
2.1
Technology
2.2
Business Overview
2.3
Results
2.4
Santander Brasil
2
Santander Worldwide
3
Santander in LATAM
4 Institutional
Presentation
3Q19Macroeconomics and
Financial System
1
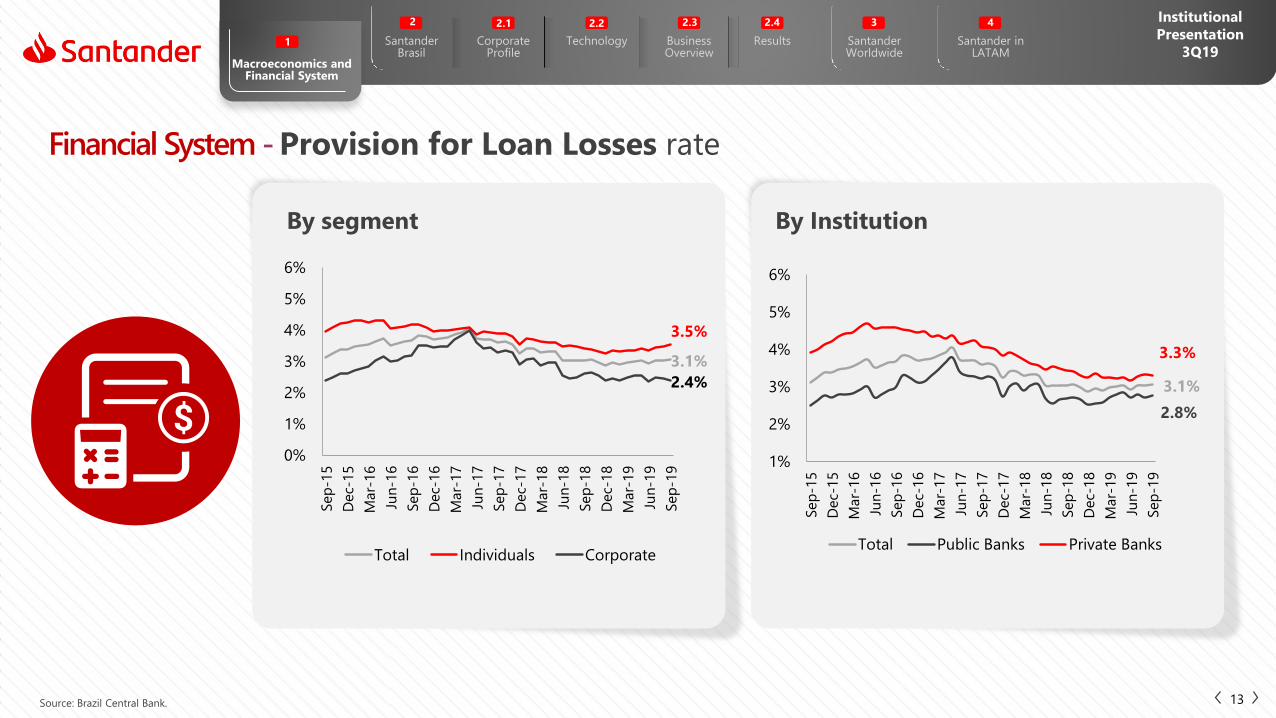
3.1%
2.8%
3.3%
1%
2%
3%
4%
5%
6%
Sep
-15
Dec-
15
Mar-
16
Jun
-16
Sep
-16
Dec-
16
Mar-
17
Jun
-17
Sep
-17
Dec-
17
Mar-
18
Jun
-18
Sep
-18
Dec-
18
Mar-
19
Jun
-19
Sep
-19
Total Public Banks Private Banks
3.1%
3.5%
2.4%
0%
1%
2%
3%
4%
5%
6%
Sep
-15
Dec-
15
Mar-
16
Jun
-16
Sep
-16
Dec-
16
Mar-
17
Jun
-17
Sep
-17
Dec-
17
Mar-
18
Jun
-18
Sep
-18
Dec-
18
Mar-
19
Jun
-19
Sep
-19
Total Individuals Corporate
By segment By Institution
Financial System - Provision for Loan Losses rate
13Source: Brazil Central Bank.
Corporate Profile
2.1
Technology
2.2
Business Overview
2.3
Results
2.4
Santander Brasil
2
Santander Worldwide
3
Santander in LATAM
4 Institutional
Presentation
3Q19Macroeconomics and
Financial System
1
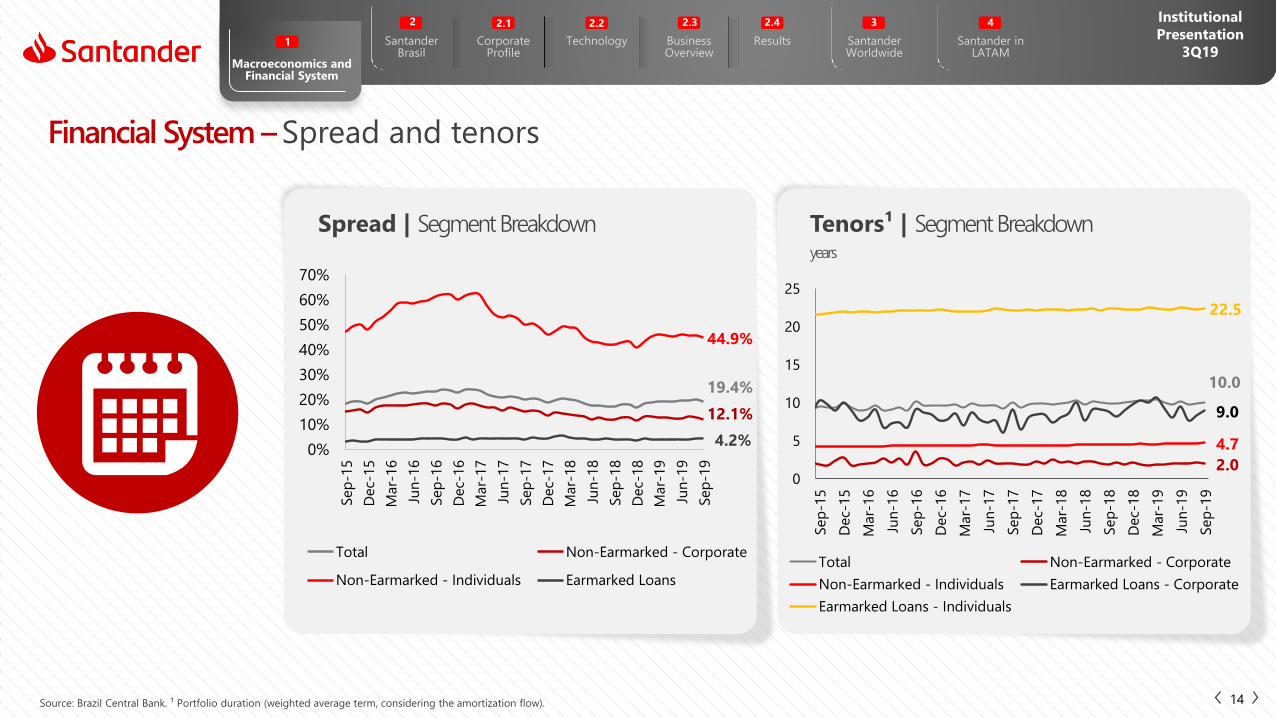
19.4%
12.1%
44.9%
4.2%0%
10%
20%
30%
40%
50%
60%
70%
Sep
-15
Dec-
15
Mar-
16
Jun
-16
Sep
-16
Dec-
16
Mar-
17
Jun
-17
Sep
-17
Dec-
17
Mar-
18
Jun
-18
Sep
-18
Dec-
18
Mar-
19
Jun
-19
Sep
-19
Total Non-Earmarked - Corporate
Non-Earmarked - Individuals Earmarked Loans
10.0
2.0
4.7
9.0
22.5
0
5
10
15
20
25
Sep
-15
Dec-
15
Mar-
16
Jun
-16
Sep
-16
Dec-
16
Mar-
17
Jun
-17
Sep
-17
Dec-
17
Mar-
18
Jun
-18
Sep
-18
Dec-
18
Mar-
19
Jun
-19
Sep
-19
Total Non-Earmarked - Corporate
Non-Earmarked - Individuals Earmarked Loans - Corporate
Earmarked Loans - Individuals
Spread | SegmentBreakdown Tenors¹ | SegmentBreakdownyears
Financial System –Spread and tenors
14Source: Brazil Central Bank. ¹ Portfolio duration (weighted average term, considering the amortization flow).

Corporate Profile
2.1
Technology
2.2
Business Overview
2.3
Results
2.4
Santander Brasil
2
Santander Worldwide
3
Santander in LATAM
4 Institutional
Presentation
3Q19Macroeconomics and
Financial System
1
20.6
18.3
2.3
4.9
Au
g-1
5
No
v-1
5
Feb
-16
May-1
6
Au
g-1
6
No
v-1
6
Feb
-17
May-1
7
Au
g-1
7
No
v-1
7
Feb
-18
May-1
8
Au
g-1
8
No
v-1
8
Feb
-19
May-1
9
Au
g-1
9
Household debt ratio
Household debt without mortgage loans
Mortgage loans
Deliquency ratio individuals (*)
44.6
26.0
18.6
4.9
Au
g-1
5
No
v-1
5
Feb
-16
May-1
6
Au
g-1
6
No
v-1
6
Feb
-17
May-1
7
Au
g-1
7
No
v-1
7
Feb
-18
May-1
8
Au
g-1
8
No
v-1
8
Feb
-19
May-1
9
Au
g-1
9
Household debt ratio
Household debt without mortgage loans
Mortgage loans
Deliquency ratio individuals (*)
Household Debt ( %) Household Debt Service Ratio ( %)
Financial System - Household debt profile
15Source: Brazil Central Bank. (*) Deliquency of individuals non-earmarked.

Corporate Profile
2.1
Technology
2.2
Business Overview
2.3
Results
2.4
Santander Brasil
2
Santander Worldwide
3
Santander in LATAM
4 Institutional
Presentation
3Q19Macroeconomics and
Financial System
1
86% 87%
77% 77% 79%
Dec-15 Dec-16 Dec-17 Dec-18 Sep-19
339 371407 407 402
19% 20% 19%17% 16%
Dec-15 Dec-16 Dec-17 Dec-18 Sep-19
Reserve Requirement Reserve Requirement/Total Deposit²
2,803 3,269 3,776 4,182 4,624
2,990 3,073
3,021 3,155
3,303 5,793
6,343 6,797
7,337 7,927
Dec-15 Dec-16 Dec-17 Dec-18 Sep-19
AuM (Anbima) Funding from Clients ¹
Total FundingR$ billion
Reserve Requirements
Credit / Funding 3
R$ billion
Financial System - Funding evolution
Dec.15 - Sep.19CAGR 8.7%
16¹ Funding from clients: demand, savings, time and other deposits (debenture, real estate credit notes (LCI), agribusiness credit notes (LCA), treasury notes and Certificate of Structured Operations COE).
²Total deposit considers demand, savings and time deposits. ³Funding from clients + Borrowings and Onlendings. * Last available data.

Corporate Profile
2.1
Technology
2.2
Business Overview
2.3
Results
2.4
Santander Brasil
2
Santander Worldwide
3
Santander in LATAM
4 Institutional
Presentation
3Q19Macroeconomics and
Financial System
1
Financial System - Funding instruments
17
Type of Funding Exigibility Remuneration Tax Rate FGC¹
Deposits:
Demand DepositMandatory
Reserve Requirement+ Mandatory lendingRegulated by the Government: 0%
- 0.12% p.a.
SavingsMandatory
Reserve Requirement+ Mandatory lending
Regulated by the Government:
TR + 6.17% p.a.²Tax exempt 0.12% p.a.
Time DepositMandatory
Reserve RequirementMarket Price
Income Tax Table applicable to Fixed
Income investments3 and IOF for
redemption in up to 30 days
0.12% p.a.
Other Instruments:
Real Estate Credit Notes (LCI)No reserve requirement.
Needs to be backed by mortgage loansMarket Price Tax exempt 0.12% p.a.
Agribusiness Credit Notes (LCA)No reserve requirement.
Needs to be backed by agribusiness loansMarket Price Tax exempt 0.12% p.a.
Guaranteed Real Estate Credit Notes (LIG)No reserve requirement. Backed and
guaranteed by a separate portfolio of mortgage loans.
Market Price Tax exempt -
Financial Bills (Letras Financeiras)No reserve requirement.
No backing neededMarket Price
Income Tax Table applicable to Fixed Income investments3 -
¹ According to the Credit Guarantee Fund (FGC) regulation, the maximum value of the collateral provided by the FGC, per financial institution, is R$ 250,000. ² If the Selic rate target is equal or less than 8.5%, remuneration will be TR+70% of the effective Selic Rate. ³ 22.5% for
applications up to 180 days; 20.0% for applications from 181 to 360 days; 17.5% for applications from 361 to 720 days; and 15% for applications above 720 days.

Corporate Profile
2.1
Technology
2.2
Business Overview
2.3
Results
2.4
Santander Brasil
2
Santander Worldwide
3
Santander in LATAM
4 Institutional
Presentation
3Q19Macroeconomics and
Financial System
1
Financial System - Reserve requirement
18
Type of DepositsAllocation
RateMandatory Allocation: Current Remuneration
(maximum rates)Before 2008
Financial Crisis
During
the CrisisCurrent
Demand Deposit
Reserve Requirement 45% 42% 21% Cash deposit in Bacen -
Reserve Requirement - Additional 8% 5% 0% - -
Rural Loan 25% 30% 30% Allocate 30% for Rural Loan 8%¹ p.a.
Microcredit 2% 2% 2% Allocate 2% for microcredit 4% p.m.
Free Funding 20% 21% 47%
Savings Deposit
Real Estate Financing 65% 65% 65% Allocate 65% for real estate financing TR + 12%¹ p.a.
Reserve Requirement 20% 20% 20% Cash deposit in Bacen TR + 6.17% p.a.²
Reserve Requirement - Additional 10% 10% - Mandatory allocation was extinguished -
Free Funding 5% 5% 15%
Time Deposit
Reserve Requirement 15% 14% 31% Cash deposit in Bacen Selic
Reserve Requirement – Additional 8% 4% - Mandatory allocation was extinguished -
Free Funding 77% 82% 69%
1. It is applied to regulated interest rate. 2. If the Selic rate target is equal or less than 8.5%, remuneration will be TR+70% of the effective Selic Rate.

2. Santander Brasil2.1 – Corporate Profile
19
Santander Worldwide
3
Santander in LATAM
4 Institutional
Presentation
3Q19
Macroeconomics andFinancial System
Corporate Profile
2.1
Technology
2.2
Business Overview
2.3
Results
2.4
Santander Brasil
2
1
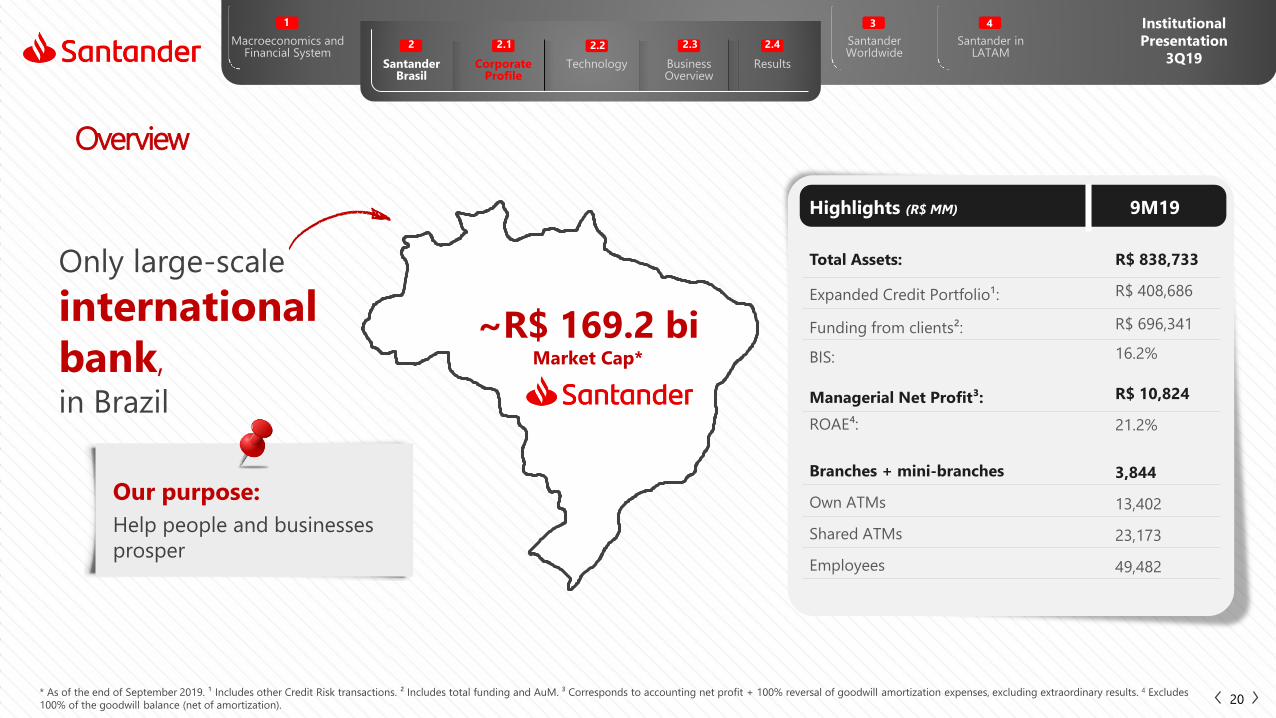
Highlights (R$ MM) 9M19
Total Assets: R$ 838,733
Expanded Credit Portfolio¹: R$ 408,686
Funding from clients²: R$ 696,341
BIS: 16.2%
Managerial Net Profit³: R$ 10,824
ROAE⁴: 21.2%
Branches + mini-branches 3,844
Own ATMs 13,402
Shared ATMs 23,173
Employees 49,482
Our purpose:
Help people and businesses
prosper
~R$ 169.2 bi Market Cap*
Only large-scale
international
bank,
in Brazil
Overview
20* As of the end of September 2019. ¹ Includes other Credit Risk transactions. ² Includes total funding and AuM. ³ Corresponds to accounting net profit + 100% reversal of goodwill amortization expenses, excluding extraordinary results. 4 Excludes
100% of the goodwill balance (net of amortization).
Santander Worldwide
3
Santander in LATAM
4 Institutional
Presentation
3Q19
Macroeconomics andFinancial System
Corporate Profile
2.1
Technology
2.2
Business Overview
2.3
Results
2.4
Santander Brasil
2
1
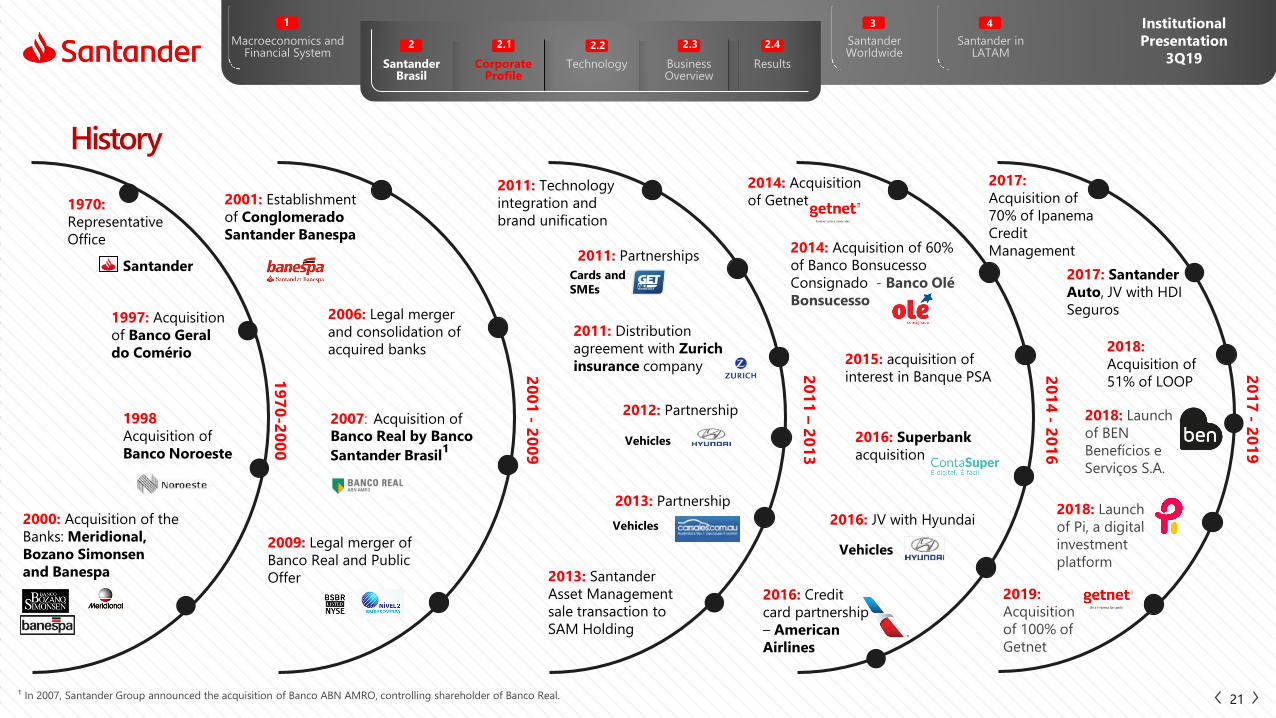
21¹ In 2007, Santander Group announced the acquisition of Banco ABN AMRO, controlling shareholder of Banco Real.
1998
Acquisition of
Banco Noroeste
1970:
Representative
Office
Santander
1997: Acquisition
of Banco Geral
do Comério
2000: Acquisition of the
Banks: Meridional,
Bozano Simonsen
and Banespa
2001: Establishment
of Conglomerado
Santander Banespa
2009: Legal merger of
Banco Real and Public
Offer
2007: Acquisition of
Banco Real by Banco
Santander Brasil¹
2006: Legal merger
and consolidation of
acquired banks
2013: Santander
Asset Management
sale transaction to
SAM Holding
2014: Acquisition
of Getnet
2014: Acquisition of 60%
of Banco Bonsucesso
Consignado - Banco Olé
Bonsucesso
2016: Superbank
acquisition
2015: acquisition of
interest in Banque PSA
Vehicles
2016: JV with Hyundai
2011: Technology
integration and
brand unification
Vehicles
2013: Partnership
Vehicles
2012: Partnership
2011: Partnerships
Cards and
SMEs
2011: Distribution
agreement with Zurich
insurance company
2016: Credit
card partnership
– American
Airlines
20
01
-2
00
9
19
70
-20
00
20
14
-2
01
6
20
11
–2
01
3
2017:
Acquisition of
70% of Ipanema
Credit
Management
2017: Santander
Auto, JV with HDI
Seguros
20
17
-2
01
9
2018:
Acquisition of
51% of LOOP
2018: Launch
of Pi, a digital
investment
platform
2018: Launch
of BEN
Benefícios e
Serviços S.A.
History
2019:
Acquisition
of 100% of
Getnet

Santander Worldwide
3
Santander in LATAM
4 Institutional
Presentation
3Q19
Macroeconomics andFinancial System
Corporate Profile
2.1
Technology
2.2
Business Overview
2.3
Results
2.4
Santander Brasil
2
1
Strategy
22
Increase customer
preference and loyalty by
offering targeted, simple,
digital and high added-
value products and
services through a multi-
channel platform.
Generate results in a
sustainable and profitable
manner, with greater revenue
diversification, aiming to strike
a balance between loans,
funding and services, while
maintaining a preemptive risk
management approach and
rigorous cost control.
Be disciplined with capital
and liquidity to preserve
our solidity, face regulatory
changes and seize growth
opportunities.
Achieve profitable market
share gains through our
robust portfolio, optimize
the ecosystem and launch
new ventures, consistently
improving the customer
experience.
Capital Discipline and Liquidity
Preference and Loyalty
Recurrence and Sustainability
Opportunities

Santander Worldwide
3
Santander in LATAM
4 Institutional
Presentation
3Q19
Macroeconomics andFinancial System
Corporate Profile
2.1
Technology
2.2
Business Overview
2.3
Results
2.4
Santander Brasil
2
1
Employees Customers
Society Shareholders
Continuous focus on
improving our customers'
experience
To be among the Top 10 Best
Companies and the Top 3 Best
Banks to Work For, strengthening
Santander corporate culture
To ensure that our
activities contribute to
social and economic
progress
To generate healthy and sustainable
profitability and returns
for our shareholders
Our purpose is to help people and businesses prosper
23

Santander Worldwide
3
Santander in LATAM
4 Institutional
Presentation
3Q19
Macroeconomics andFinancial System
Corporate Profile
2.1
Technology
2.2
Business Overview
2.3
Results
2.4
Santander Brasil
2
1
Prospera Microcredit
461.7kActive customers
Universities
+15.8 k²
scholarships
Socio-environmental business made viable
Resilient andInclusive Economy
Development ofHuman Potential
Efficient and Strategic Use of Natural Capital
289partner
Universities
Sustainability: helpingbusinesses and people prosper, while supporting Brazilian society in its transformation into
Brazil of the 21st century, through three strategic pillars:
With ethical values as the foundation and technology at the service of people and businesses
R$ 13 billion
24¹ Considers disbursement in renewable energy, sustainable agribusiness, Prospera Santander Microcredit, Student Financing (undergraduate medical school), Project Finance (renewable energy), other socio-environmental businesses and
participation in structuring and advisory of Green Bonds. ² Since 2015.
Santander Worldwide
3
Santander in LATAM
4 Institutional
Presentation
3Q19
Macroeconomics andFinancial System
Corporate Profile
2.1
Technology
2.2
Business Overview
2.3
Results
2.4
Santander Brasil
2
1
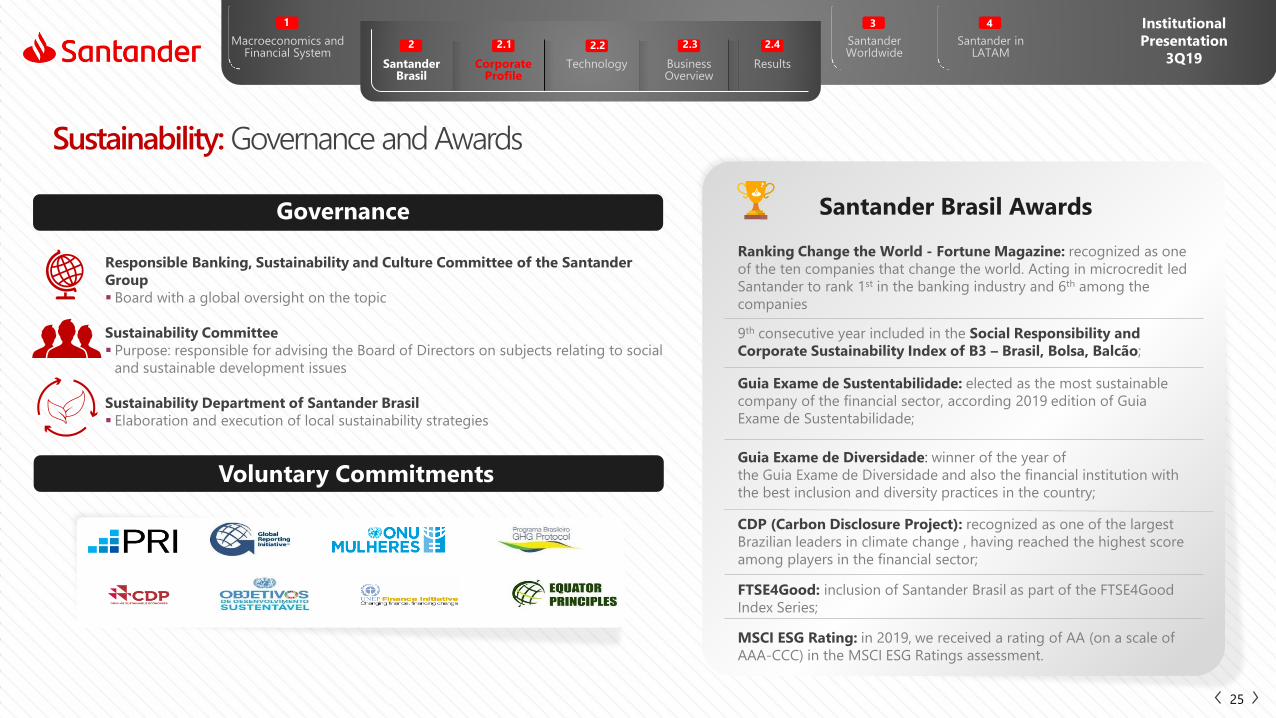
9th consecutive year included in the Social Responsibility and
Corporate Sustainability Index of B3 – Brasil, Bolsa, Balcão;
Responsible Banking, Sustainability and Culture Committee of the Santander
Group
Board with a global oversight on the topic
Sustainability Committee
Purpose: responsible for advising the Board of Directors on subjects relating to social
and sustainable development issues
Sustainability Department of Santander Brasil
Elaboration and execution of local sustainability strategies
Governance
Sustainability: Governance and Awards
Voluntary Commitments
25
Guia Exame de Sustentabilidade: elected as the most sustainable
company of the financial sector, according 2019 edition of Guia
Exame de Sustentabilidade;
Santander Brasil Awards
CDP (Carbon Disclosure Project): recognized as one of the largest
Brazilian leaders in climate change , having reached the highest score
among players in the financial sector;
FTSE4Good: inclusion of Santander Brasil as part of the FTSE4Good
Index Series;
MSCI ESG Rating: in 2019, we received a rating of AA (on a scale of
AAA-CCC) in the MSCI ESG Ratings assessment.
Ranking Change the World - Fortune Magazine: recognized as one
of the ten companies that change the world. Acting in microcredit led
Santander to rank 1st in the banking industry and 6th among the
companies
Guia Exame de Diversidade: winner of the year of
the Guia Exame de Diversidade and also the financial institution with
the best inclusion and diversity practices in the country;
Santander Worldwide
3
Santander in LATAM
4 Institutional
Presentation
3Q19
Macroeconomics andFinancial System
Corporate Profile
2.1
Technology
2.2
Business Overview
2.3
Results
2.4
Santander Brasil
2
1
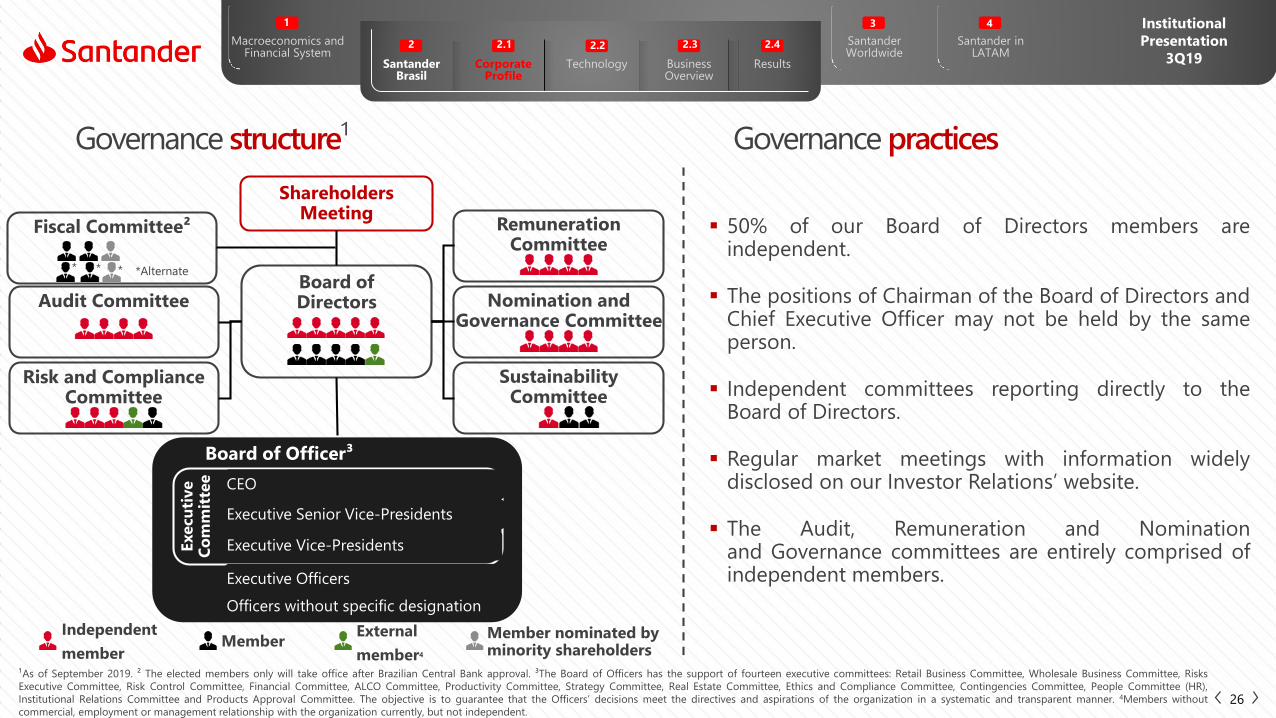
ShareholdersMeeting
Board ofDirectors Nomination and
Governance Committee
RemunerationCommittee
SustainabilityCommittee
Risk and Compliance Committee
Audit Committee
Execu
tive
Co
mm
itte
e
Board of Officer³
CEO
Executive Senior Vice-Presidents
Executive Vice-Presidents
Executive Officers
Officers without specific designation
Governance structure¹ Governance practices
Fiscal Committee²
¹As of September 2019. ² The elected members only will take office after Brazilian Central Bank approval. ³The Board of Officers has the support of fourteen executive committees: Retail Business Committee, Wholesale Business Committee, Risks
Executive Committee, Risk Control Committee, Financial Committee, ALCO Committee, Productivity Committee, Strategy Committee, Real Estate Committee, Ethics and Compliance Committee, Contingencies Committee, People Committee (HR),
Institutional Relations Committee and Products Approval Committee. The objective is to guarantee that the Officers’ decisions meet the directives and aspirations of the organization in a systematic and transparent manner. 4Members without
commercial, employment or management relationship with the organization currently, but not independent.26
50% of our Board of Directors members areindependent.
The positions of Chairman of the Board of Directors andChief Executive Officer may not be held by the sameperson.
Independent committees reporting directly to theBoard of Directors.
Regular market meetings with information widelydisclosed on our Investor Relations’ website.
The Audit, Remuneration and Nominationand Governance committees are entirely comprised ofindependent members.
Independent
memberMember
External
member4
*Alternate* * *
Member nominated by minority shareholders
Santander Worldwide
3
Santander in LATAM
4 Institutional
Presentation
3Q19
Macroeconomics andFinancial System
Corporate Profile
2.1
Technology
2.2
Business Overview
2.3
Results
2.4
Santander Brasil
2
1
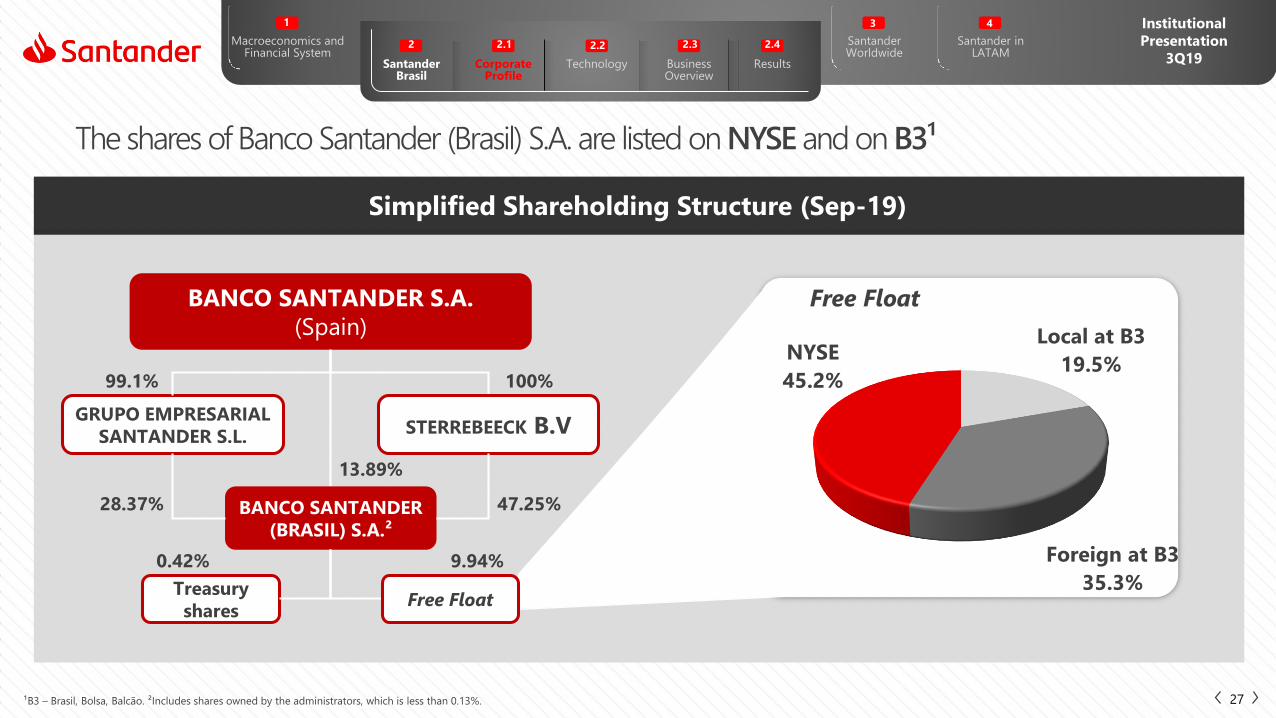
Local at B3
19.5%
Foreign at B3
35.3%
NYSE
45.2%
Simplified Shareholding Structure (Sep-19)
Free Float
The shares of Banco Santander (Brasil) S.A. are listed on NYSE and on B3¹
27¹B3 – Brasil, Bolsa, Balcão. ²Includes shares owned by the administrators, which is less than 0.13%.
BANCO SANTANDER S.A.
(Spain)
BANCO SANTANDER
(BRASIL) S.A.²
STERREBEECK B.VGRUPO EMPRESARIAL
SANTANDER S.L.
100%99.1%
28.37%
13.89%
47.25%
Treasury
shares
0.42% 9.94%
Free Float

Santander Worldwide
3
Santander in LATAM
4 Institutional
Presentation
3Q19
Macroeconomics andFinancial System
Corporate Profile
2.1
Technology
2.2
Business Overview
2.3
Results
2.4
Santander Brasil
2
1
441.37
232.46
Sep
-15
Oct
-15
No
v-1
5
Dec-
15
Jan
-16
Feb
-16
Mar-
16
Ap
r-16
May-1
6
Jun
-16
Jul-
16
Au
g-1
6
Sep
-16
Oct
-16
No
v-1
6
Dec-
16
Jan
-17
Feb
-17
Mar-
17
Ap
r-17
May-1
7
Jun
-17
Jul-
17
Au
g-1
7
Sep
-17
Oct
-17
No
v-1
7
Dec-
17
Jan
-18
Feb
-18
Mar-
18
Ap
r-18
May-1
8
Jun
-18
Jul-
18
Au
g-1
8
Sep
-18
Oct
-18
No
v-1
8
Dec-
18
Jan
-19
Feb
-19
Mar-
19
Ap
r-19
May-1
9
Jun
-19
Jul-
19
Au
g-1
9
Sep
-19
SANB11 IBOV
Stock Price Evolution¹Base 100
Return to our shareholders
28¹ Historical prices excluding dividends and interest on capital. Source: Bloomberg. ² Considers the number of Units disregarding treasury shares at the end of the period. ³ Closing price at the end of the period. 4 Market Capitalization: Total Units
(Unit = 1 Common + 1 Preferred) x Unit closing price at the end of the period. 5 Book Value excludes goodwill. 6 Excluding 100% of the goodwill balance (net of amortization).
9M19 9M18 Var. 12M 3Q19 3Q19 Var. 3M
Earnings (annualized) per Unit² (R$) 3.87 3.21 20.5% 3.97 3.89 1.9%
Dividend + IoC per Unit, Last 12 Months² (R$) 2.09 1.76 18.6% 2.09 1.98 5.4%
Unit closing price3 (R$) 45.33 35.71 26.9% 45.33 45.46 -0.3%
Market capitalization4 (R$ billion) 169.24 133.49 26.8% 169.24 169.75 -0.3%
Book Value per Unit5 (R$) 19.28 17.34 11.2% 19.28 18.40 4.8%
ROE annualized6 21.2% 19.4% 1.8 p.p. 21.1% 21.3% -0.2 p.p.

Santander Worldwide
3
Santander in LATAM
4 Institutional
Presentation
3Q19
Macroeconomics andFinancial System
Corporate Profile
2.1
Technology
2.2
Business Overview
2.3
Results
2.4
Santander Brasil
2
1
Standard & Poor’s1
(outlook)
Moody’s2
(outlook)
Ratings
29
Local ScaleGlobal Scale
Local Currency Foreign Currency National
BB-(stable)
brAAA(stable)
BB-(stable)
Ba1(stable)
Ba3(stable)
Long Term Short Term
B
Long Term Short Term Long Term Short Term
NP
B
NP
brA-1+
Aaa.br Br-1
¹ Last update on May 31st, 2019 ² Last update on August 14th, 2019.
2. Santander Brasil2.2 - Technology
30
Santander Worldwide
3
Santander in LATAM
4 Institutional
Presentation
3Q19
Macroeconomics andFinancial System
Corporate Profile
2.1
Technology
2.2
Business Overview
2.3
Results
2.4
Santander Brasil
2
1
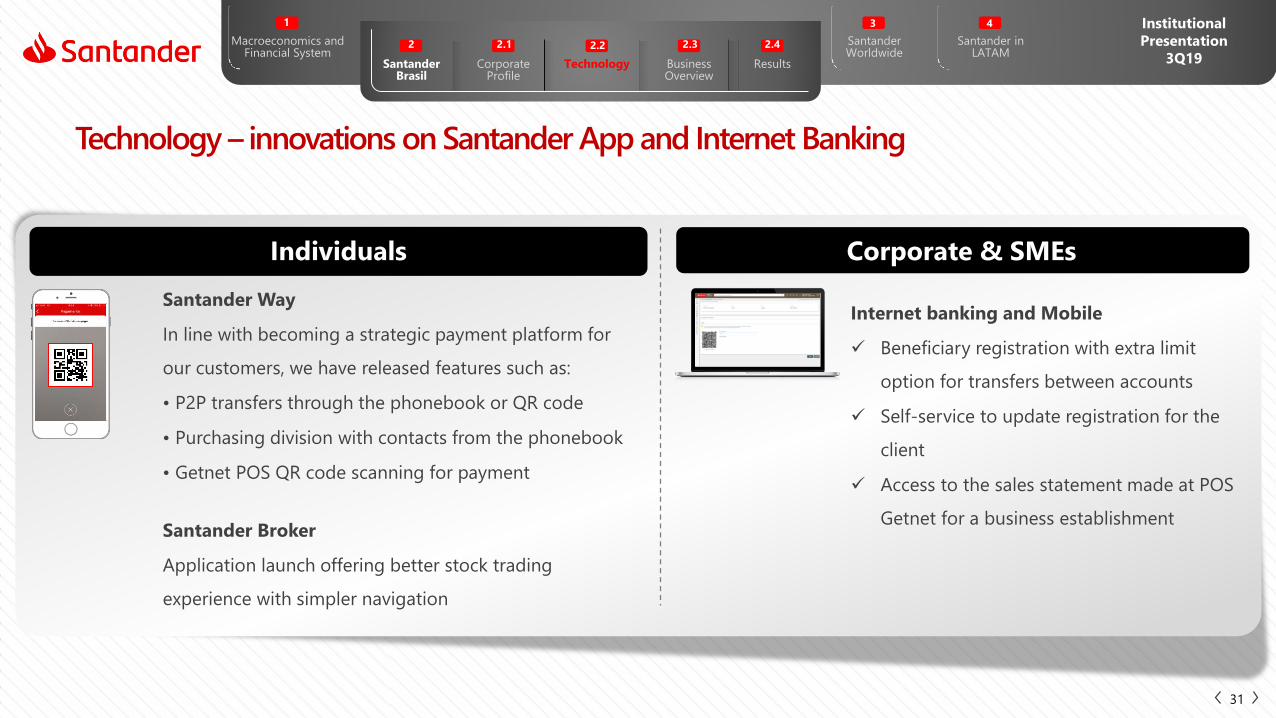
Technology – innovations on Santander App and Internet Banking
Individuals Corporate & SMEs
Santander Broker
Application launch offering better stock trading
experience with simpler navigation
Santander Way
In line with becoming a strategic payment platform for
our customers, we have released features such as:
• P2P transfers through the phonebook or QR code
• Purchasing division with contacts from the phonebook
• Getnet POS QR code scanning for payment
Internet banking and Mobile
Beneficiary registration with extra limit
option for transfers between accounts
Self-service to update registration for the
client
Access to the sales statement made at POS
Getnet for a business establishment
31

Santander Worldwide
3
Santander in LATAM
4 Institutional
Presentation
3Q19
Macroeconomics andFinancial System
Corporate Profile
2.1
Technology
2.2
Business Overview
2.3
Results
2.4
Santander Brasil
2
1
80.0%
ATM
37.7%
42.3%
8.3%
3.8%
7.1%
0.7%
Channel participation in transactions | 3Q19
Technology - Internet banking and mobile transactions represented 80.0% of the Bank's total
transactions in 3Q19
Internet
Banking
Mobile¹
Cashier
IVR
Call Center
32¹ Includes tablet transactions. Note: data refers to total transactions, composed by financial and non-financial.
2. Santander Brasil2.3 – Business Overview
33

Santander Worldwide
3
Santander in LATAM
4 Institutional
Presentation
3Q19
Macroeconomics andFinancial System
Corporate Profile
2.1
Technology
2.2
Business Overview
2.3
Results
2.4
Santander Brasil
2
1
34
Corporate &
SMEs¹Individuals
Income above R$ 10,000 and R$ 30,000 in
investments or R$ 20,000 of monthly income²
R$ 4,000 in monthly income³
R$ 5 million in investments
Up to R$ 1 millionNegócios DirectDigital service
Up to R$ 3 millionNegócios Agência
Up to R$ 30 millionEmpresas Polo
Up to R$ 200 millionEmpresas Núcleos
Above R$ 200 millionCorporate
Global customers listSantander Corporate
& Investment Banking
SMEs
Large
Corporate
SCIB
¹ Figures refer to annual revenues. ² Or R$ 300,000 in investments without proven income. ³ Or R$ 40,000 in investments.
Adequate segmentation for the reality of our customers
Up to R$ 81,000Negócios MEI
Santander Worldwide
3
Santander in LATAM
4 Institutional
Presentation
3Q19
Macroeconomics andFinancial System
Corporate Profile
2.1
Technology
2.2
Business Overview
2.3
Results
2.4
Santander Brasil
2
1
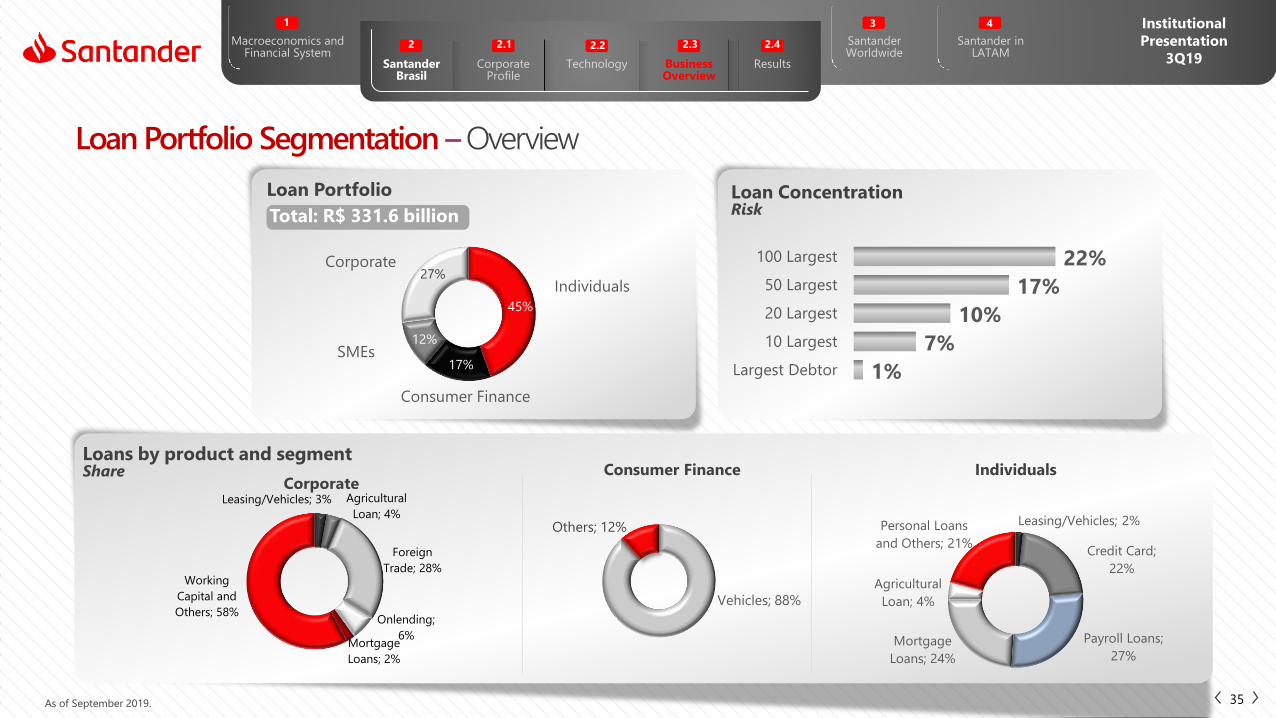
1%
7%
10%
17%
22%
Largest Debtor
10 Largest
20 Largest
50 Largest
100 Largest
Leasing/Vehicles; 2%
Credit Card;
22%
Payroll Loans;
27%Mortgage
Loans; 24%
Agricultural
Loan; 4%
Personal Loans
and Others; 21%
Vehicles; 88%
Others; 12%
Leasing/Vehicles; 3% Agricultural
Loan; 4%
Foreign
Trade; 28%
Onlending;
6%Mortgage
Loans; 2%
Working
Capital and
Others; 58%
45%
17%
12%
27%
As of September 2019.
Corporate
Loans by product and segmentShare
Loan Portfolio Loan ConcentrationRisk
Consumer Finance
Corporate
SMEs
Individuals
Total: R$ 331.6 billion
Consumer Finance Individuals
Loan Portfolio Segmentation –Overview
35

2. Santander Brasil2.3 – Business Overview
Retail
36
Santander Worldwide
3
Santander in LATAM
4 Institutional
Presentation
3Q19
Macroeconomics andFinancial System
Corporate Profile
2.1
Technology
2.2
Business Overview
2.3
Results
2.4
Santander Brasil
2
1
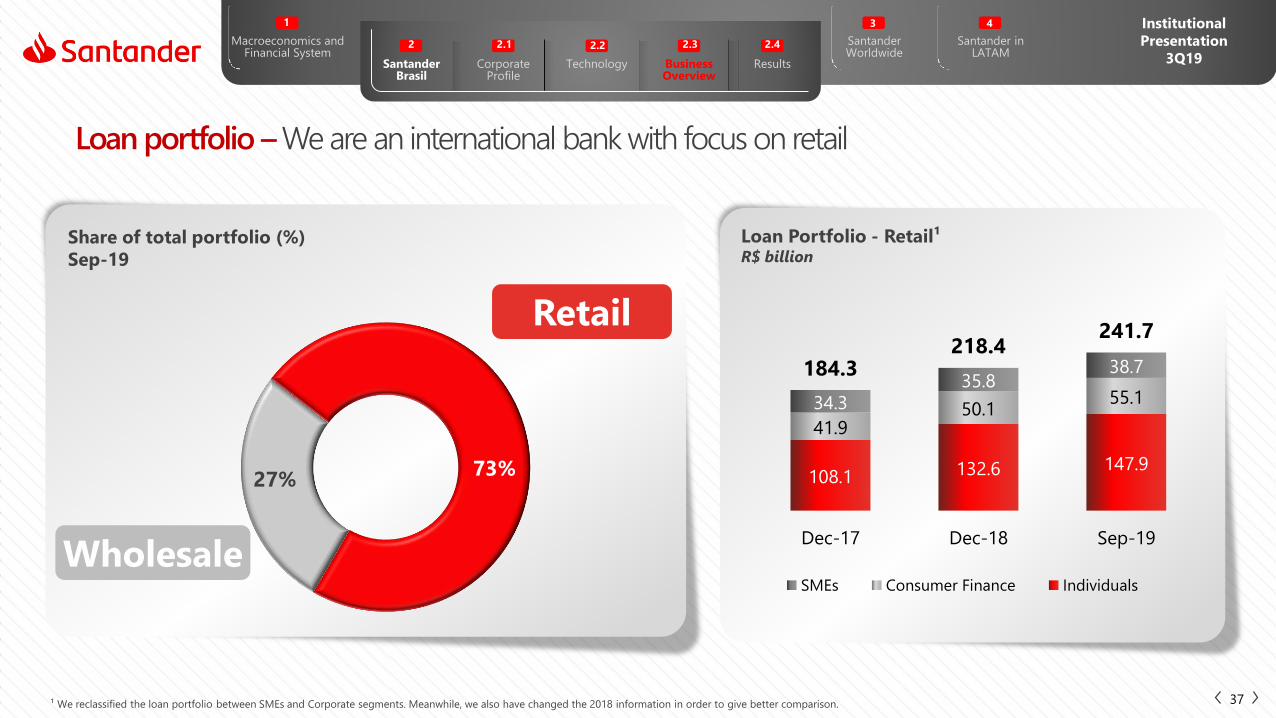
108.1 132.6 147.9
41.950.1
55.134.335.8
38.7184.3218.4
241.7
Dec-17 Dec-18 Sep-19
SMEs Consumer Finance Individuals
27%73%
Loan Portfolio - Retail¹R$ billion
Retail
Wholesale
Share of total portfolio (%)
Sep-19
Loan portfolio –We are an international bank with focus on retail
37¹ We reclassified the loan portfolio between SMEs and Corporate segments. Meanwhile, we also have changed the 2018 information in order to give better comparison.
Santander Worldwide
3
Santander in LATAM
4 Institutional
Presentation
3Q19
Macroeconomics andFinancial System
Corporate Profile
2.1
Technology
2.2
Business Overview
2.3
Results
2.4
Santander Brasil
2
1
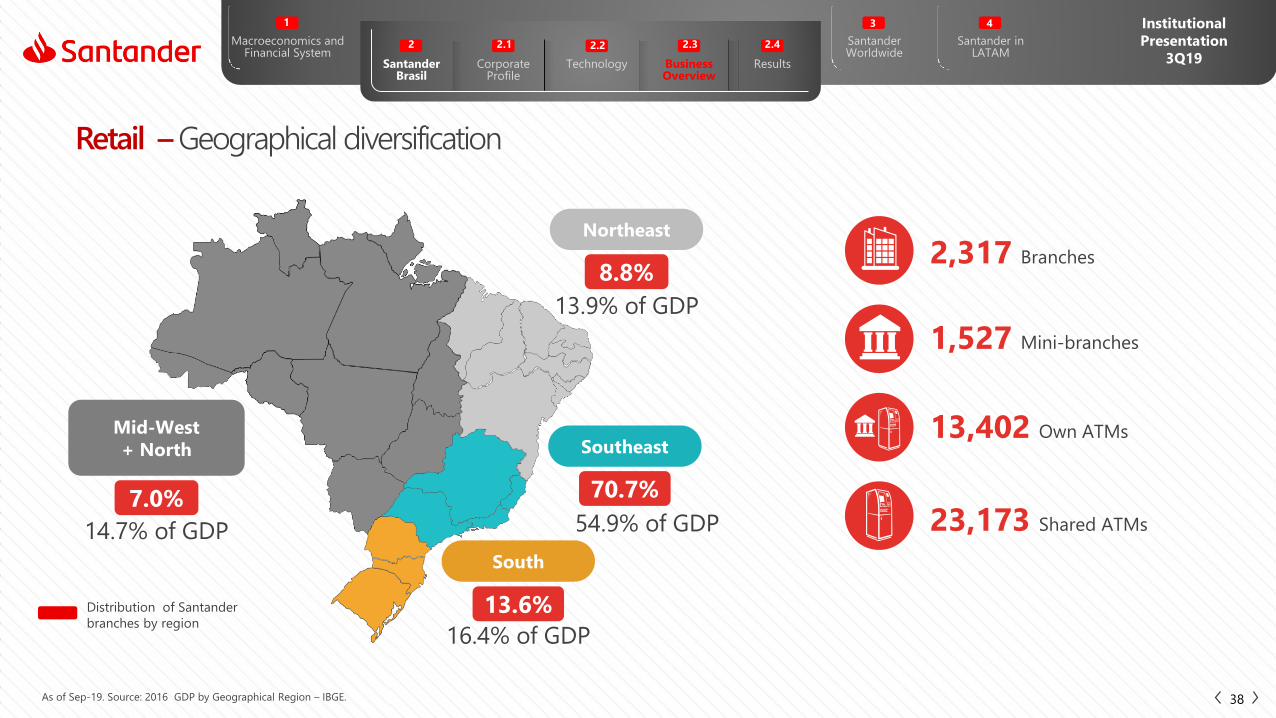
23,173 Shared ATMs
1,527 Mini-branches
2,317 Branches
13,402 Own ATMs
Retail –Geographical diversification
Distribution of Santander
branches by region
13.9% of GDP
54.9% of GDP
16.4% of GDP
14.7% of GDP
Mid-West
+ North
South
Southeast
7.0%
8.8%
70.7%
13.6%
38As of Sep-19. Source: 2016 GDP by Geographical Region – IBGE.
Northeast
Santander Worldwide
3
Santander in LATAM
4 Institutional
Presentation
3Q19
Macroeconomics andFinancial System
Corporate Profile
2.1
Technology
2.2
Business Overview
2.3
Results
2.4
Santander Brasil
2
1
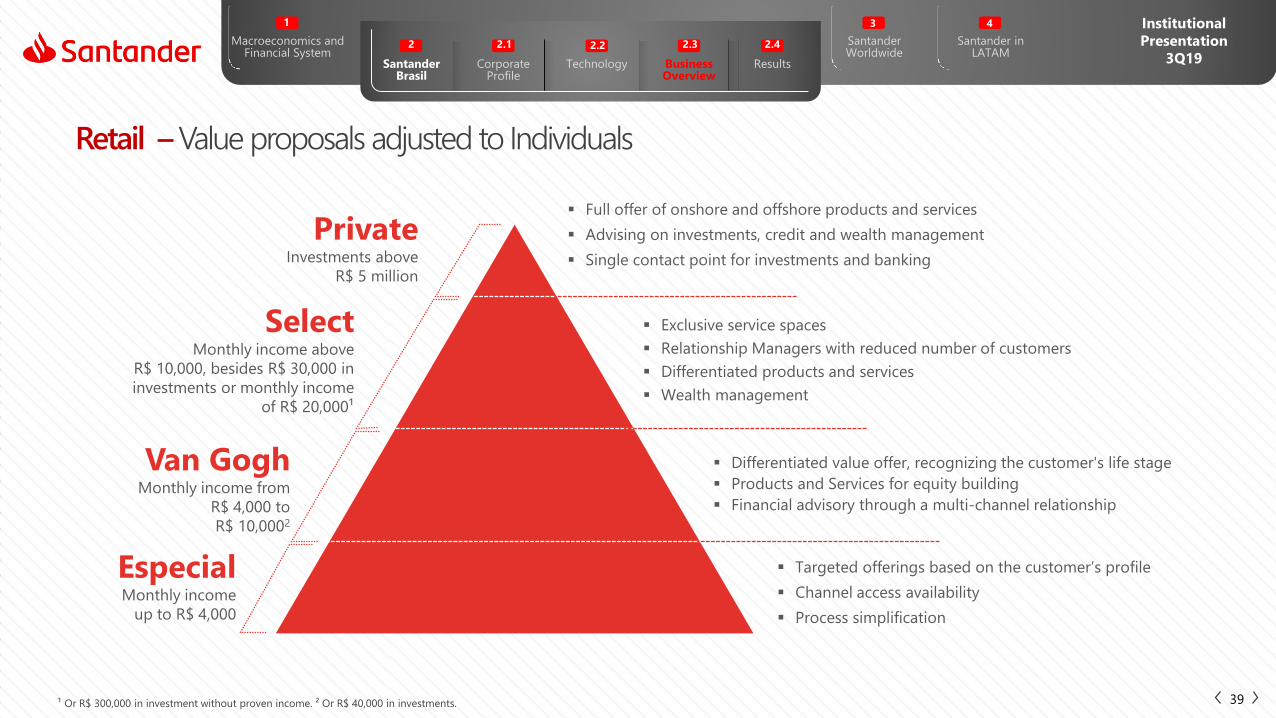
Retail –Value proposals adjusted to Individuals
39¹ Or R$ 300,000 in investment without proven income. ² Or R$ 40,000 in investments.
PrivateInvestments above
R$ 5 million
EspecialMonthly income
up to R$ 4,000
Van GoghMonthly income from
R$ 4,000 to
R$ 10,0002
Exclusive service spaces
Relationship Managers with reduced number of customers
Differentiated products and services
Wealth management
Targeted offerings based on the customer’s profile
Channel access availability
Process simplification
SelectMonthly income above
R$ 10,000, besides R$ 30,000 in
investments or monthly income
of R$ 20,000¹
Differentiated value offer, recognizing the customer's life stage
Products and Services for equity building
Financial advisory through a multi-channel relationship
Full offer of onshore and offshore products and services
Advising on investments, credit and wealth management
Single contact point for investments and banking
Santander Worldwide
3
Santander in LATAM
4 Institutional
Presentation
3Q19
Macroeconomics andFinancial System
Corporate Profile
2.1
Technology
2.2
Business Overview
2.3
Results
2.4
Santander Brasil
2
1
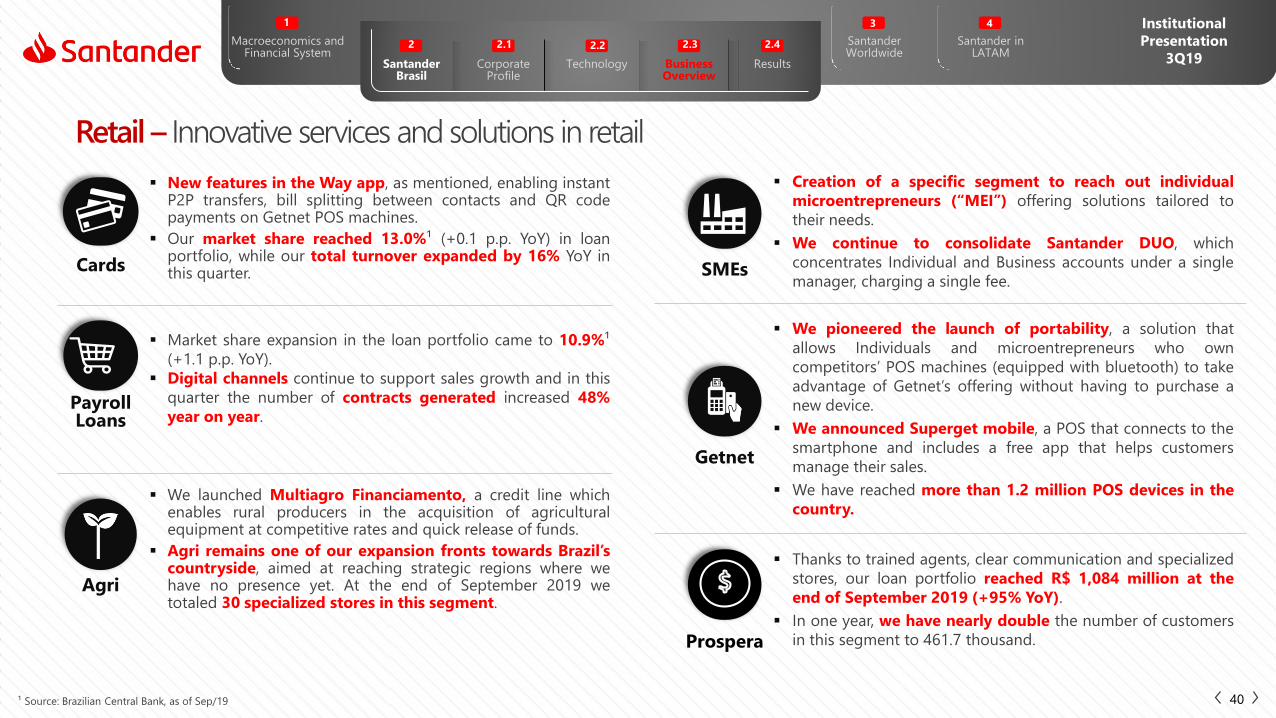
New features in the Way app, as mentioned, enabling instantP2P transfers, bill splitting between contacts and QR codepayments on Getnet POS machines.
Our market share reached 13.0%¹ (+0.1 p.p. YoY) in loanportfolio, while our total turnover expanded by 16% YoY inthis quarter.Cards
Market share expansion in the loan portfolio came to 10.9%¹
(+1.1 p.p. YoY).
Digital channels continue to support sales growth and in this
quarter the number of contracts generated increased 48%
year on year.PayrollLoans
Retail – Innovative services and solutions in retail
Agri
¹ Source: Brazilian Central Bank, as of Sep/19
SMEs
Thanks to trained agents, clear communication and specialized
stores, our loan portfolio reached R$ 1,084 million at the
end of September 2019 (+95% YoY).
In one year, we have nearly double the number of customers
in this segment to 461.7 thousand.
We launched Multiagro Financiamento, a credit line whichenables rural producers in the acquisition of agriculturalequipment at competitive rates and quick release of funds.
Agri remains one of our expansion fronts towards Brazil’scountryside, aimed at reaching strategic regions where wehave no presence yet. At the end of September 2019 wetotaled 30 specialized stores in this segment.
40
Getnet
Creation of a specific segment to reach out individual
microentrepreneurs (“MEI”) offering solutions tailored to
their needs.
We continue to consolidate Santander DUO, which
concentrates Individual and Business accounts under a single
manager, charging a single fee.
We pioneered the launch of portability, a solution that
allows Individuals and microentrepreneurs who own
competitors’ POS machines (equipped with bluetooth) to take
advantage of Getnet’s offering without having to purchase a
new device.
We announced Superget mobile, a POS that connects to the
smartphone and includes a free app that helps customers
manage their sales.
We have reached more than 1.2 million POS devices in the
country.
Prospera

Santander Worldwide
3
Santander in LATAM
4 Institutional
Presentation
3Q19
Macroeconomics andFinancial System
Corporate Profile
2.1
Technology
2.2
Business Overview
2.3
Results
2.4
Santander Brasil
2
1
Retail –New ventures
Pi
Digital investment platform that
caters to customers looking for
more autonomy and practicality in
the purchase of investment
products. It complements our
investment portfolio offer, reaching
account and non-account holders.
Portfolio includes approximately
198 fixed-income products and
213 investment funds. In the
quarter we began the distribution
of Tesouro Direto (government
bonds).
41
BEN Benefits and Services
Operating in the benefits sector,
starting with food and meal
vouchers, working in partnership
with the Visa Vale brand.
Continued to make advances in
partnering with merchants,
achieving the milestone of 200,000
commercial establishments.
Additionally, we underscore the
volume of active cards, which
exceeded 85,000 this quarter.
empréstimo simples
Sim - personal credit
Launch of this digital platform that
facilitates access to personal credit,
with customized offers according
to the profile
Possibility of using warranties such
as motorcycles, which is unique in
the market. In addition, the
customer will be able to parcel
slips and invoices using more
competitive rates compared to
traditional loans.

Cards
Acquiring – Getnet
Consumer Finance
Mortgage
Payroll Loans
SMEs
Strategic Business
Retail
42

Santander Worldwide
3
Santander in LATAM
4 Institutional
Presentation
3Q19
Macroeconomics andFinancial System
Corporate Profile
2.1
Technology
2.2
Business Overview
2.3
Results
2.4
Santander Brasil
2
1
2,266 2,389 2,589 2,524 2,724
2,153 2,309 2,634 2,392 2,470
4,419 4,698 5,223 4,916 5,195
2Q18 3Q18 4Q18 1Q19 2Q19
21.4% 22.1% 23.4% 23.4% 24.2%
33.8% 35.1% 38.0% 37.1% 37.9%
2Q18 3Q18 4Q18 1Q19 2Q19
% Credit card/ Consumption % Cards (Credit + Debit)/ Consumption
229 244 271 260 274
133 144 169 152 155
362 388 440 412 430
2Q18 3Q18 4Q18 1Q19 2Q19
Solid growth in the share of card usage in household consumption
Cards – Market Overview
Total turnover¹(R$ billion)
Participation in the household consumption¹
Credit
Debit
2Q19 vs 2Q18
+19%
Transactions¹(million)
2Q19 vs 2Q18
+18%
43¹ Source: ABECS (Brazilian Association of Credit Card Companies and Services) – “Monitor bandeiras”, as June-19. Methodology includes all acquiring. The concept of transactions was standardized with one for total turnover and participation in
the household consumption in order to give better comparison.
Santander Worldwide
3
Santander in LATAM
4 Institutional
Presentation
3Q19
Macroeconomics andFinancial System
Corporate Profile
2.1
Technology
2.2
Business Overview
2.3
Results
2.4
Santander Brasil
2
1
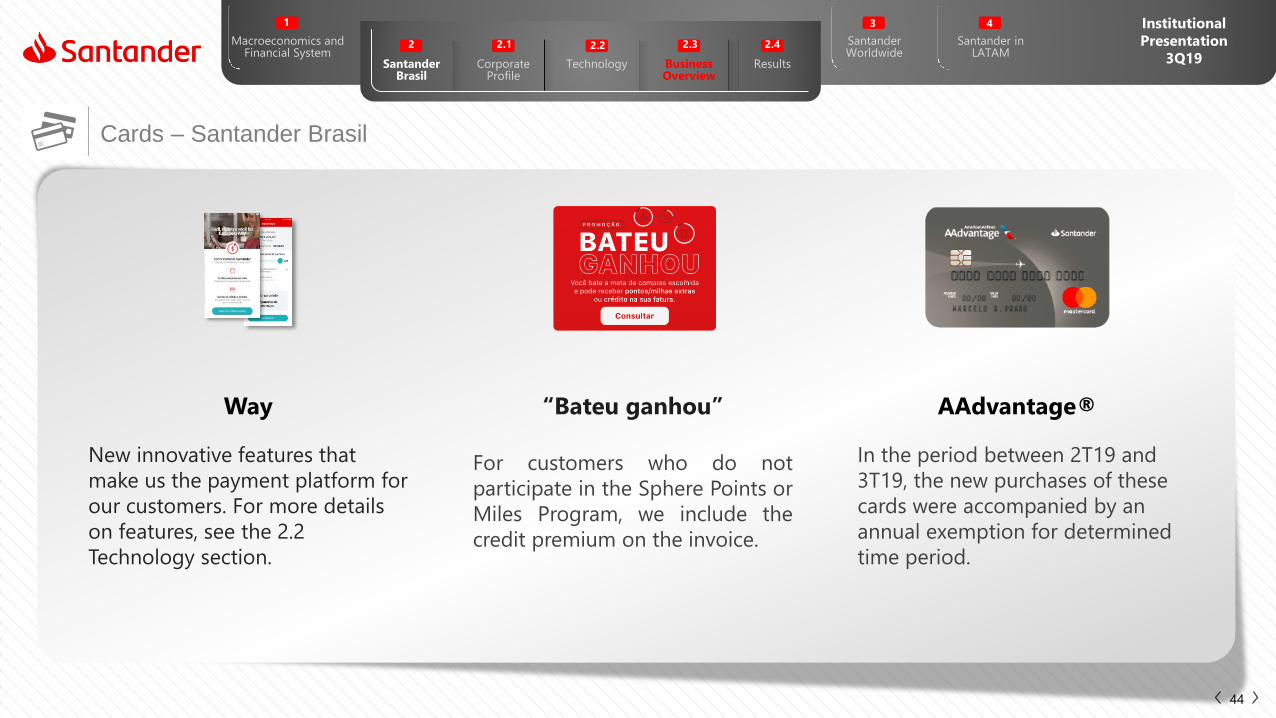
Cards – Santander Brasil
44
Way
New innovative features that
make us the payment platform for
our customers. For more details
on features, see the 2.2
Technology section.
“Bateu ganhou”
For customers who do not
participate in the Sphere Points or
Miles Program, we include the
credit premium on the invoice.
AAdvantage®
In the period between 2T19 and
3T19, the new purchases of these
cards were accompanied by an
annual exemption for determined
time period.

Santander Worldwide
3
Santander in LATAM
4 Institutional
Presentation
3Q19
Macroeconomics andFinancial System
Corporate Profile
2.1
Technology
2.2
Business Overview
2.3
Results
2.4
Santander Brasil
2
1
314.5 335.4 329.7 361.9 377.3
277.1318.9 309.0
319.3 323.5
591.7
654.3 638.6681.2 700.8
3Q18 4Q18 1Q19 2Q19 3Q19
34.839.4 37.4 39.7 40.1
15.7
19.217.3
17.5 18.3
50.5
58.654.8
57.3 58.4
3Q18 4Q18 1Q19 2Q19 3Q19
Source: Santander Bank. ¹ Cards turnover do not include withdrawal transactions, but only purchase volumes.
Constant growth of turnover and transactions
Turnover¹(R$ billion)
Transactions(million)
Credit
Debit
Cards – Santander Brasil
3Q19 vs 3Q18
+16%
3Q19 vs 3Q18
+ 18%
45

Santander Worldwide
3
Santander in LATAM
4 Institutional
Presentation
3Q19
Macroeconomics andFinancial System
Corporate Profile
2.1
Technology
2.2
Business Overview
2.3
Results
2.4
Santander Brasil
2
1
Cards
Acquiring – Getnet
Consumer Finance
Mortgage
Payroll Loans
SMEs
Strategic Business
Retail
46

Santander Worldwide
3
Santander in LATAM
4 Institutional
Presentation
3Q19
Macroeconomics andFinancial System
Corporate Profile
2.1
Technology
2.2
Business Overview
2.3
Results
2.4
Santander Brasil
2
1
Acquiring Getnet, it´s more business
47
Physical Digital Quality and Security
MobileWireless connection
with your Smartphone
Getnet is the 1st acquirer to offer portability solutions
for customers.
With the QR Code option, our clients have the freedom to decide
whether or not to have a POS
Portability GetPay

Santander Worldwide
3
Santander in LATAM
4 Institutional
Presentation
3Q19
Macroeconomics andFinancial System
Corporate Profile
2.1
Technology
2.2
Business Overview
2.3
Results
2.4
Santander Brasil
2
1
200 233 279
203
321354403
554633
3Q17 3Q18 3Q19
23 29 32
12
19 20 35
4852
3Q17 3Q18 3Q19
9M19 turnoverjumped
in 12 months
10% 10.8% Market Share¹ in
turnover
Acquiring
Transactions(million)
Turnover(R$ billion)
+14%
+9%
48
Debit
Credit
Debit
Credit
¹Source: ABECS, “Monitor Bandeiras” as of 2Q19 (new criterion).
Santander Worldwide
3
Santander in LATAM
4 Institutional
Presentation
3Q19
Macroeconomics andFinancial System
Corporate Profile
2.1
Technology
2.2
Business Overview
2.3
Results
2.4
Santander Brasil
2
1
Cards
Acquiring – Getnet
Consumer Finance
Mortgage
Payroll Loans
SMEs
Strategic Business
Retail
49
Santander Worldwide
3
Santander in LATAM
4 Institutional
Presentation
3Q19
Macroeconomics andFinancial System
Corporate Profile
2.1
Technology
2.2
Business Overview
2.3
Results
2.4
Santander Brasil
2
1
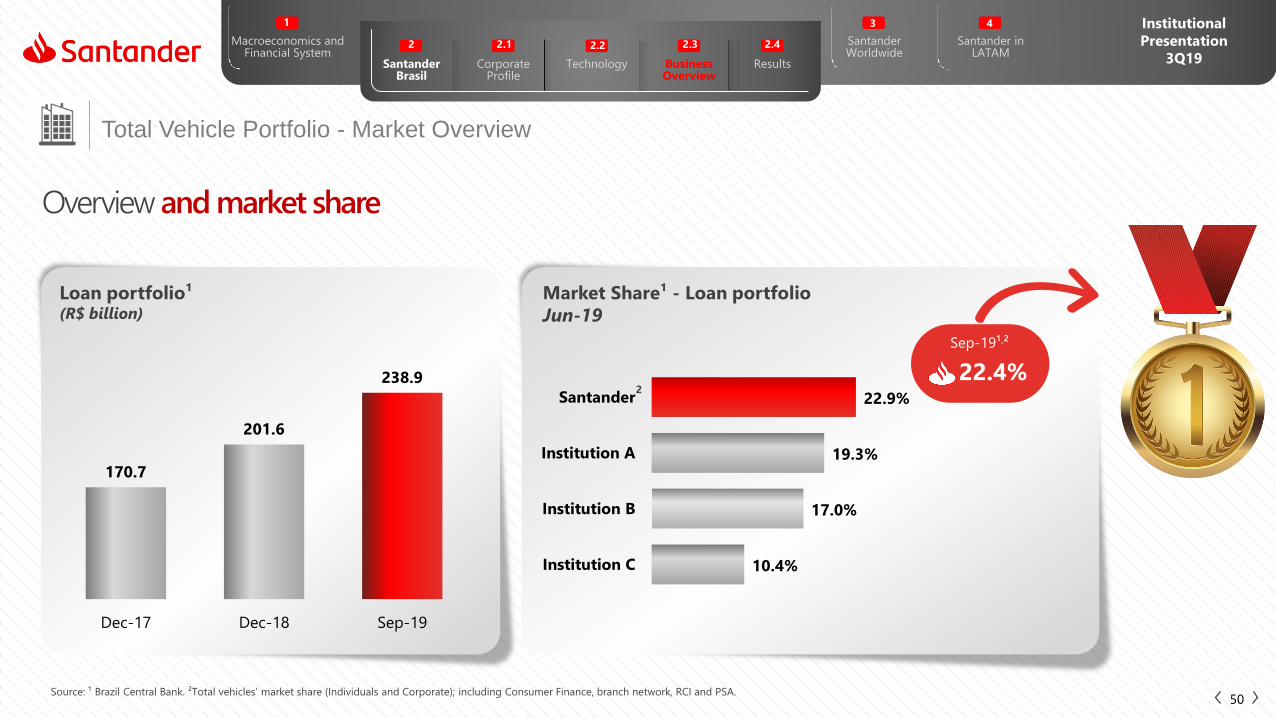
Total Vehicle Portfolio - Market Overview
50
Loan portfolio¹(R$ billion)
Overview and market share
Market Share¹ - Loan portfolio
Jun-19
Sep-19¹,²
22.4%
Source: ¹ Brazil Central Bank. ²Total vehicles’ market share (Individuals and Corporate); including Consumer Finance, branch network, RCI and PSA.
2
170.7
201.6
238.9
Dec-17 Dec-18 Sep-19
10.4%
17.0%
19.3%
22.9%
Institution C
Institution B
Institution A
Santander

Santander Worldwide
3
Santander in LATAM
4 Institutional
Presentation
3Q19
Macroeconomics andFinancial System
Corporate Profile
2.1
Technology
2.2
Business Overview
2.3
Results
2.4
Santander Brasil
2
1
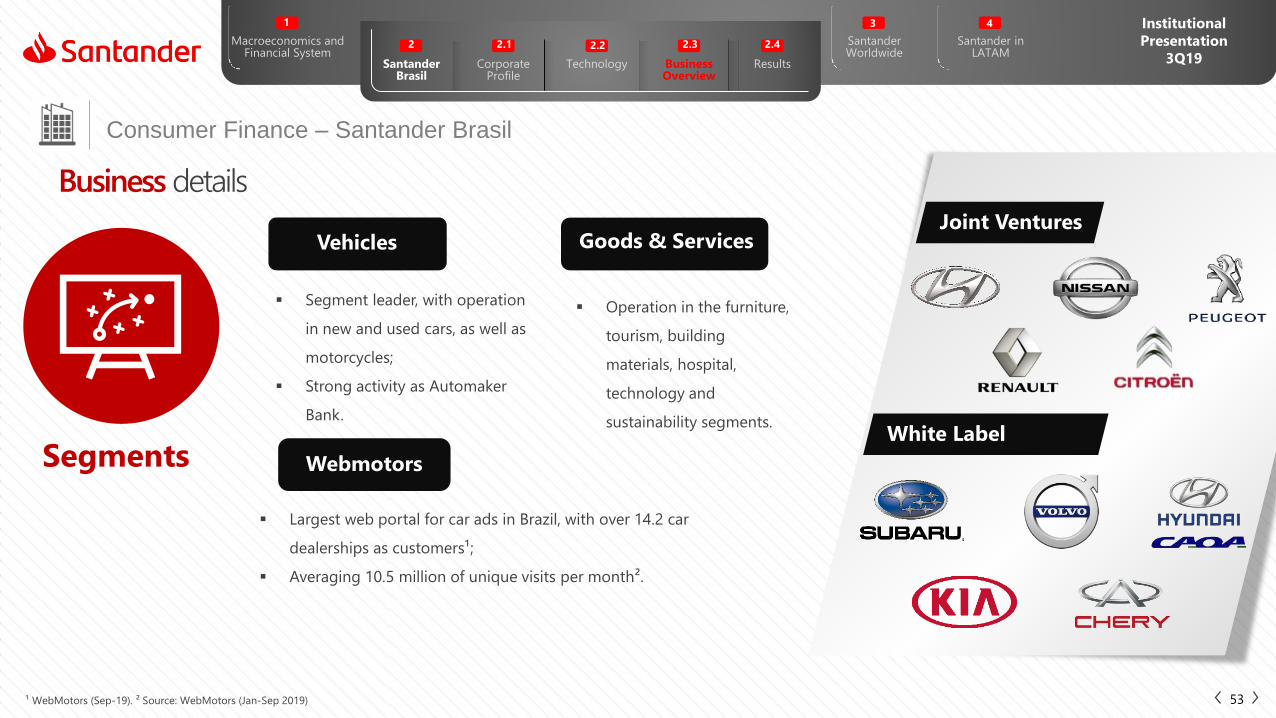
Consumer Finance – Santander Brasil
51
Loan portfolio – TotalR$ billion
Breakdown of
Consumer Finance
Portfolio (%) ; Sep-19
Total portfolio and vehicle financing for individuals
Vehicles Financing for Individuals¹ – TotalR$ billion
88%
12%
Vehicles Others
¹ Considering vehicle financing transactions originated through branches (internal channel) and external channel (contemplating RCI + PSA).
41.9
50.1
55.1
Dec-17 Dec-18 Sep-19
1.9 2.2 2.5
34.4 41.3
46.0
36.2
43.548.5
Dec-17 Dec-18 Sep-19
Internal channel Financial

Santander Worldwide
3
Santander in LATAM
4 Institutional
Presentation
3Q19
Macroeconomics andFinancial System
Corporate Profile
2.1
Technology
2.2
Business Overview
2.3
Results
2.4
Santander Brasil
2
1
Consumer Finance – Santander Brasil
52
Santander Financiamentos
55 years in the auto financing market
24.4 thousand active
intermediary customers¹
Leadership in consumer auto loan²:
Market share 25.1%²
in loan portfolio
of individuals
Digital Platform:
business model
innovation in the auto
market;
Greater agility in sales
and improved
efficiency;
Expansion of covered
activities.
New way of making
installment
purchases, with focus
on the goods and
services segment
(CDC)3;
Agile pre-credit
analysis;
Digital process, with
electronic signature.
Complete and
integrated CRM
solution for car
dealers, with better
lead4 management,
pricing (buying and
selling) and
financing, fostering
more sales and
dealership
monetization.
¹ Includes vehicles and Goods and Services segment. ² Central Bank of Brazil, date as of Sep-19. ³ Consumer Credit. 4 Leads: the creation of business opportunities between buyers and sellers.
Santander Worldwide
3
Santander in LATAM
4 Institutional
Presentation
3Q19
Macroeconomics andFinancial System
Corporate Profile
2.1
Technology
2.2
Business Overview
2.3
Results
2.4
Santander Brasil
2
1
Consumer Finance – Santander Brasil
53
Business details
Vehicles
Webmotors
Goods & Services
Segments
Joint Ventures
White Label
Segment leader, with operation
in new and used cars, as well as
motorcycles;
Strong activity as Automaker
Bank.
Operation in the furniture,
tourism, building
materials, hospital,
technology and
sustainability segments.
Largest web portal for car ads in Brazil, with over 14.2 car
dealerships as customers¹;
Averaging 10.5 million of unique visits per month².
¹ WebMotors (Sep-19). ² Source: WebMotors (Jan-Sep 2019)

Santander Worldwide
3
Santander in LATAM
4 Institutional
Presentation
3Q19
Macroeconomics andFinancial System
Corporate Profile
2.1
Technology
2.2
Business Overview
2.3
Results
2.4
Santander Brasil
2
1
Cards
Acquiring – Getnet
Consumer Finance
Mortgage
Payroll Loans
SMEs
Strategic Business
Retail
54

Santander Worldwide
3
Santander in LATAM
4 Institutional
Presentation
3Q19
Macroeconomics andFinancial System
Corporate Profile
2.1
Technology
2.2
Business Overview
2.3
Results
2.4
Santander Brasil
2
1
3.4%
5.8%
Dec-
15
Mar-
16
Jun
-16
Sep
-16
Dec-
16
Mar-
17
Jun
-17
Sep
-17
Dec-
17
Mar-
18
Jun
-18
Sep
-18
Dec-
18
Mar-
19
Jun
-19
Sep
-19
Mortgage YoY Total System YoY
Mortgage – Market Overview
55Source: Brazil Central Bank.
Overview
Mortgage Loan Portfolio – TotalR$ billion
Loan portfolio growth (YoY)
Mortgage-to-GDP
ratio was
9.4%
in September, 2019
Expansion Opportunity
578
612
632
645
662
Dec-15 Dec-16 Dec-17 Dec-18 Sep-19

Santander Worldwide
3
Santander in LATAM
4 Institutional
Presentation
3Q19
Macroeconomics andFinancial System
Corporate Profile
2.1
Technology
2.2
Business Overview
2.3
Results
2.4
Santander Brasil
2
1
Mortgage – Santander Brasil
56
Loan Portfolio Evolution Distribution Channels Loan to ValueR$ billion Sep-19 – Individuals origination Ratio between loans and the value of collaterals
Transfers to
Homebuilders
Brokers Branches
96% is high
income (Van
Gogh or Select)
Digital
6.6 4.1 2.7
28.1 32.4 35.5
34.736.5
38.2
Dec-17 Dec-18 Sep-19
Individuals Corporate & SMEs
60%
13%
14%
13%
60% 61% 63%
47% 48% 49%
Dec-17 Dec-18 Sep-19Origination (quartely average)
Loan Portfolio

Santander Worldwide
3
Santander in LATAM
4 Institutional
Presentation
3Q19
Macroeconomics andFinancial System
Corporate Profile
2.1
Technology
2.2
Business Overview
2.3
Results
2.4
Santander Brasil
2
1
Cards
Acquiring – Getnet
Consumer Finance
Mortgage
Payroll Loans
SMEs
Strategic Business
Retail
57

Santander Worldwide
3
Santander in LATAM
4 Institutional
Presentation
3Q19
Macroeconomics andFinancial System
Corporate Profile
2.1
Technology
2.2
Business Overview
2.3
Results
2.4
Santander Brasil
2
1
25.6
33.8
40.6
Dec-17 Dec-18 Sep-19
310.8333.2
372.1
Dec-17 Dec-18 Sep-19
Payroll Loans – Market and Santander Brasil
58
Total Payroll Loans | Market¹
R$ billion
Payroll Loans Portfolio| Santander Brasil²
R$ billion
Overview
¹ Source: Brazil Central Bank. ² Santander portfolio + Olé Consignado.

Santander Worldwide
3
Santander in LATAM
4 Institutional
Presentation
3Q19
Macroeconomics andFinancial System
Corporate Profile
2.1
Technology
2.2
Business Overview
2.3
Results
2.4
Santander Brasil
2
1
59
Payroll Loans – Santander Brasil
10.9% market share
in loan portfolio¹
Strategy and main initiatives
Internal channels External channel
+113 bps YoY
Better customer experience: progress in streamlining
processes, including portability of payroll loans, promoting a simple and
transparent journey, as well as digital and 100% Paperless end-to-end
purchase across all sales channels.
Financial Reorganization: Payroll loans as a credit
solution, contributing to the financial sustainability of our
customers.
Social security: action focused on beneficiaries, aimed at
increasing the loyalty of our customer base and achieving market
share growth.
New Alliances: Strategy associated with the capturing of new
payrolls, fostering customer loyalty through the offering of payroll
loans.
Multichannel and Digital: Product available, in a simple and
easy manner, wherever the customer is. Important advances in the
Digital platform with the implementation of Mobile and Internet
Banking, ensuring greater convenience to our customers.
¹ Considering internal and external channels, as of Sep-19, source Brazilian Central Bank.
Santander Worldwide
3
Santander in LATAM
4 Institutional
Presentation
3Q19
Macroeconomics andFinancial System
Corporate Profile
2.1
Technology
2.2
Business Overview
2.3
Results
2.4
Santander Brasil
2
1
Cards
Acquiring – Getnet
Consumer Finance
Mortgage
Payroll Loans
SMEs
Strategic Business
Retail
60
Santander Worldwide
3
Santander in LATAM
4 Institutional
Presentation
3Q19
Macroeconomics andFinancial System
Corporate Profile
2.1
Technology
2.2
Business Overview
2.3
Results
2.4
Santander Brasil
2
1
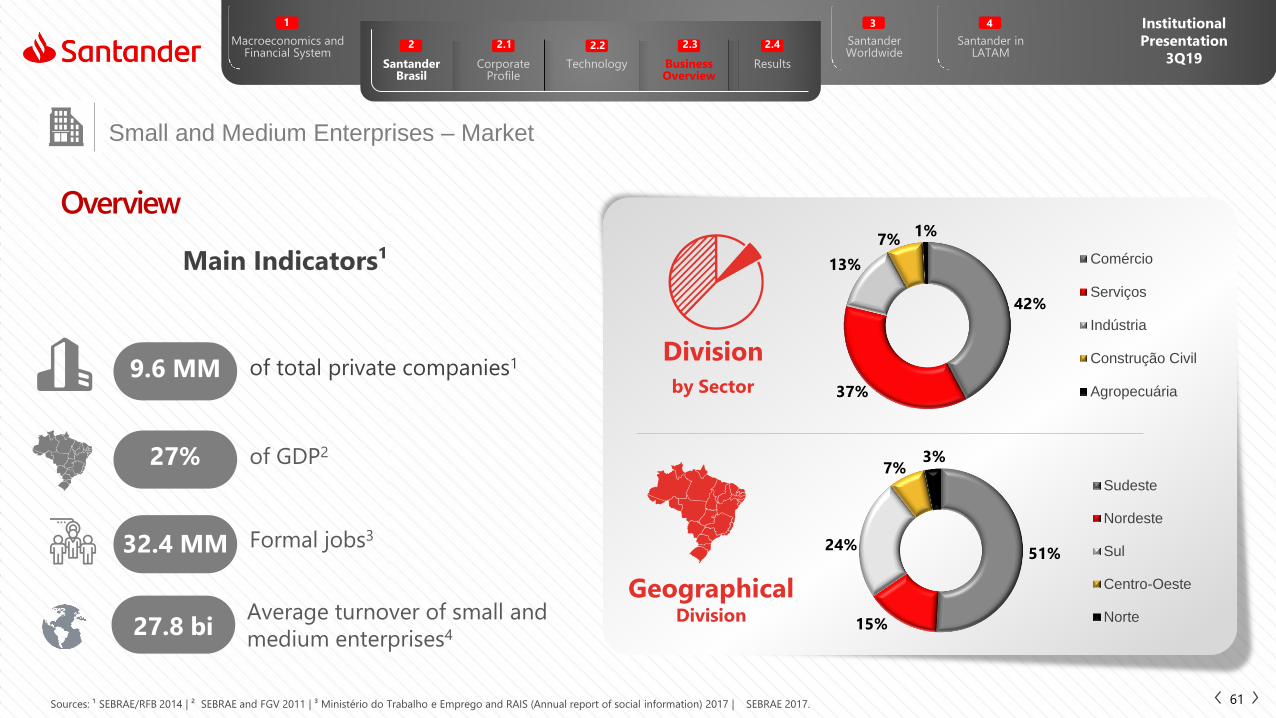
Small and Medium Enterprises – Market
61
Division
by Sector
GeographicalDivision
Main Indicators¹
Overview
9.6 MM of total private companies1
27% of GDP2
32.4 MM Formal jobs3
27.8 biAverage turnover of small and
medium enterprises4
Sources: ¹ SEBRAE/RFB 2014 | ² SEBRAE and FGV 2011 | ³ Ministério do Trabalho e Emprego and RAIS (Annual report of social information) 2017 | SEBRAE 2017.
42%
37%
13%
7%1%
Comércio
Serviços
Indústria
Construção Civil
Agropecuária
51%
15%
24%
7%3%
Sudeste
Nordeste
Sul
Centro-Oeste
Norte
Santander Worldwide
3
Santander in LATAM
4 Institutional
Presentation
3Q19
Macroeconomics andFinancial System
Corporate Profile
2.1
Technology
2.2
Business Overview
2.3
Results
2.4
Santander Brasil
2
1
Small and Medium Enterprises – Santander Brasil
62
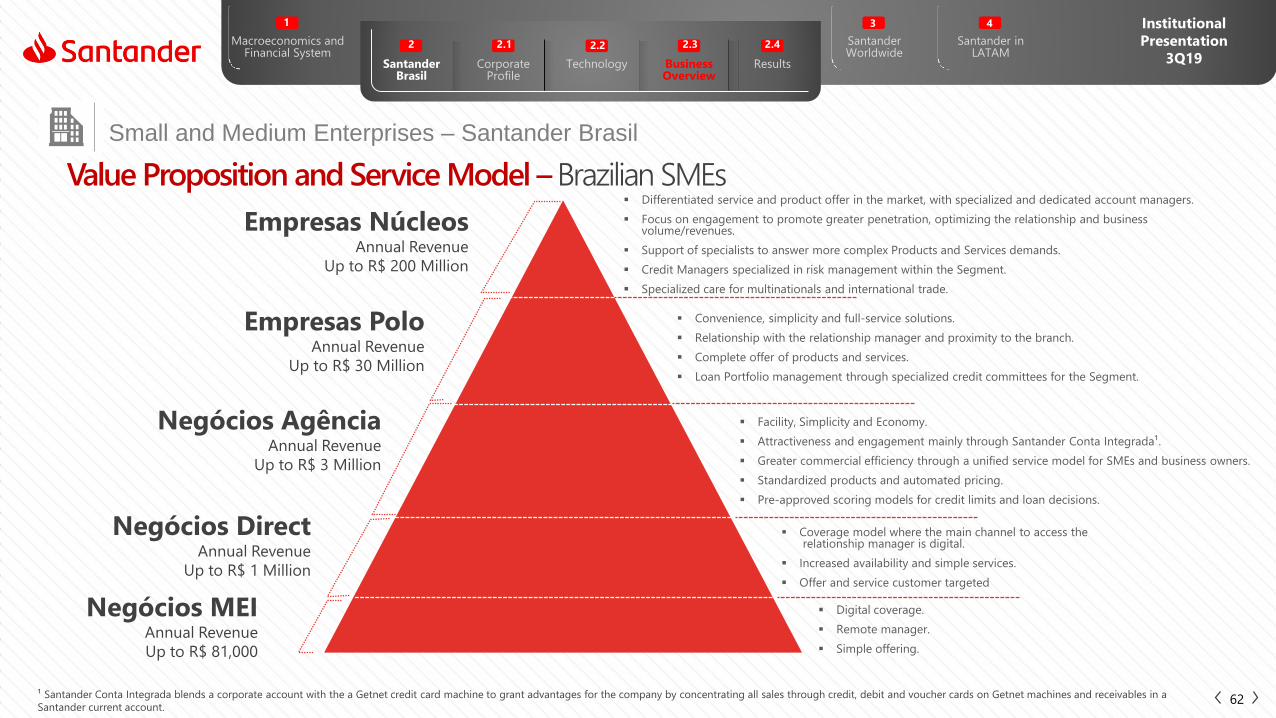
Value Proposition and Service Model –Brazilian SMEs
Negócios DirectAnnual Revenue
Up to R$ 1 Million
Negócios AgênciaAnnual Revenue
Up to R$ 3 Million
Empresas NúcleosAnnual Revenue
Up to R$ 200 Million
Empresas PoloAnnual Revenue
Up to R$ 30 Million
Convenience, simplicity and full-service solutions.
Relationship with the relationship manager and proximity to the branch.
Complete offer of products and services.
Loan Portfolio management through specialized credit committees for the Segment.
Coverage model where the main channel to access therelationship manager is digital.
Increased availability and simple services.
Offer and service customer targeted
Differentiated service and product offer in the market, with specialized and dedicated account managers.
Focus on engagement to promote greater penetration, optimizing the relationship and business volume/revenues.
Support of specialists to answer more complex Products and Services demands.
Credit Managers specialized in risk management within the Segment.
Specialized care for multinationals and international trade.
Facility, Simplicity and Economy.
Attractiveness and engagement mainly through Santander Conta Integrada¹.
Greater commercial efficiency through a unified service model for SMEs and business owners.
Standardized products and automated pricing.
Pre-approved scoring models for credit limits and loan decisions.
¹ Santander Conta Integrada blends a corporate account with the a Getnet credit card machine to grant advantages for the company by concentrating all sales through credit, debit and voucher cards on Getnet machines and receivables in a
Santander current account.
Negócios MEIAnnual Revenue
Up to R$ 81,000
Digital coverage.
Remote manager.
Simple offering.

Santander Worldwide
3
Santander in LATAM
4 Institutional
Presentation
3Q19
Macroeconomics andFinancial System
Corporate Profile
2.1
Technology
2.2
Business Overview
2.3
Results
2.4
Santander Brasil
2
1
Small and Medium Enterprises – Santander Brasil
63
Loan Portfolio¹
R$ billion
Digital Transformation: greater convenience to our Customers
More Digital Customers:
Corporate Internet Banking
ID Santander EmpresasMore safety and convenience to authenticate
transaction though Internet Banking and App.
Full solution for the company’s financial management.
Santander Empresas AppConvenience to manage the company from any
location and at any time.
¹ We reclassified the loan portfolio between SMEs and Corporate segments. Meanwhile, we also have changed the 2018 information in order to give better comparison.
34.3 35.838.7
Dec-17 Dec-18 Sep-19

Santander Worldwide
3
Santander in LATAM
4 Institutional
Presentation
3Q19
Macroeconomics andFinancial System
Corporate Profile
2.1
Technology
2.2
Business Overview
2.3
Results
2.4
Santander Brasil
2
1
Small and Medium Enterprises – Santander Brasil
64
Bars & Restaurants
Fuel Stations
Supermarket
High School Education
Beauty Parlors
Clinics and Medical Offices
Franchises
Hotels
Building Materials
Pharmacy
Religious Institutions
Service Package
Getnet
Merchant Cash Advance
Cash Management solutions
Short, medium and long term lines of credit
Insurances
Industry-tailored offers
Main
Offers
Sector-Oriented Offers: Products and services with exclusive conditions to meet the specific needs of the Brazilian economy sectors, thus making a stronger contribution for people and businesses to prosper.
For more details access: www.santandernegocioseempresas.com.br

Santander Worldwide
3
Santander in LATAM
4 Institutional
Presentation
3Q19
Macroeconomics andFinancial System
Corporate Profile
2.1
Technology
2.2
Business Overview
2.3
Results
2.4
Santander Brasil
2
1
Small and Medium Enterprises – Santander Brasil
65
Individual Microentrepreneur (“MEI”) - Market Overview
9 MM formal entrepreneurs
10 secondsA MEI is born every
Diverse public: +500 activities
Growth: market with +20 MM
Sector
concentration:
10.0% 7.6%
4.1%
2.8%
75.5%
Retail
Hairdressers
Masonry works
Snack bars
Miscellaneous
not yet formalized
MEI account
SuperGet
Service by managers with MEI expertise
Santander Benefits:
Sources: Sebrae 2017 and Federal government – “Portal do Empreendedor” 2019.

Santander Worldwide
3
Santander in LATAM
4 Institutional
Presentation
3Q19
Macroeconomics andFinancial System
Corporate Profile
2.1
Technology
2.2
Business Overview
2.3
Results
2.4
Santander Brasil
2
1
Small and Medium Enterprises – Santander Brasil
66For more details access: www.santandernegocioseempresas.com.br
Programa Avançar: Global Platform to our Customers
Combines access to online and in-class courses and other training programs, management content, talent hiring/retention
tools and support for business internationalization. The initiatives are divided into five pillars:
Financial
offering
Programa
Avançar
408 events, impacting 3,049
customers in 2019
298,000 portal users
Development: Support and training for executives, both in-class and online.
Team Building: Connecting with opportunities, announcement of vacancies
and internship program.
Internationalization: Advisory, personal attention, products and services
that help companies go international, in addition to the Santander Trade portal,
which gathers information from over 186 countries and provide tools to help
businesses expand into foreign markets.
Connectivity: The best conditions to bring companies into the digital world,
thereby expanding their horizons.
Accelerators: Support for companies to grow through business development
services.

Santander Worldwide
3
Santander in LATAM
4 Institutional
Presentation
3Q19
Macroeconomics andFinancial System
Corporate Profile
2.1
Technology
2.2
Business Overview
2.3
Results
2.4
Santander Brasil
2
1
2. Santander Brasil2.3 - Business Overview
Wholesale
67

Santander Worldwide
3
Santander in LATAM
4 Institutional
Presentation
3Q19
Macroeconomics andFinancial System
Corporate Profile
2.1
Technology
2.2
Business Overview
2.3
Results
2.4
Santander Brasil
2
1
Santander Brasil - Wholesale
68
The Large Corporate loan portfolio includes two segments: Santander Corporate & InvestmentBanking e Corporate
R$ billion
Loan Portfolio¹ – Wholesale
Sep-19
Share of the total portfolio (%)
Retail
Wholesale
¹ We reclassified the loan portfolio between SMEs and Corporate segments. Meanwhile, we also have changed the 2018 information in order to give better comparison.
27%
73%88.3
86.989.9
Dec-17 Dec-18 Sep-19
Santander Worldwide
3
Santander in LATAM
4 Institutional
Presentation
3Q19
Macroeconomics andFinancial System
Corporate Profile
2.1
Technology
2.2
Business Overview
2.3
Results
2.4
Santander Brasil
2
1
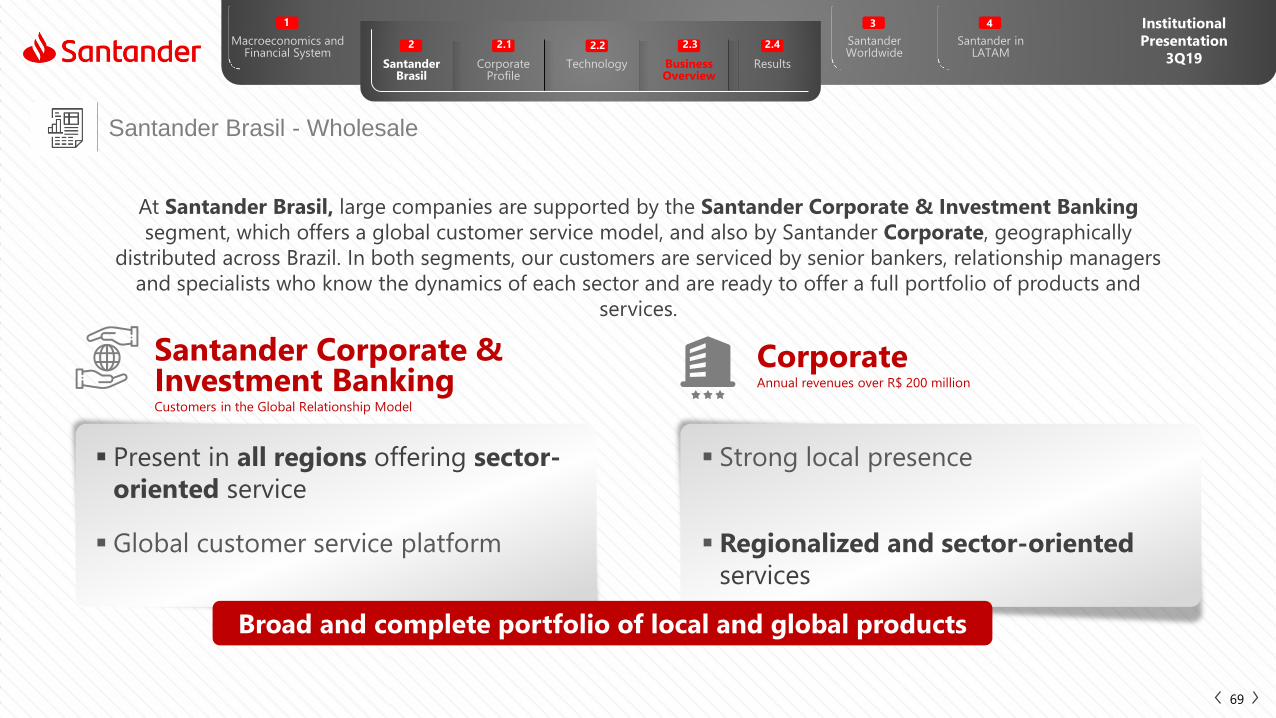
Santander Brasil - Wholesale
Present in all regions offering sector-
oriented service
Santander Corporate & Investment Banking Customers in the Global Relationship Model
At Santander Brasil, large companies are supported by the Santander Corporate & Investment Banking
segment, which offers a global customer service model, and also by Santander Corporate, geographically
distributed across Brazil. In both segments, our customers are serviced by senior bankers, relationship managers
and specialists who know the dynamics of each sector and are ready to offer a full portfolio of products and
services.
CorporateAnnual revenues over R$ 200 million
Broad and complete portfolio of local and global products
Strong local presence
Global customer service platform Regionalized and sector-oriented
services
69
Santander Worldwide
3
Santander in LATAM
4 Institutional
Presentation
3Q19
Macroeconomics andFinancial System
Corporate Profile
2.1
Technology
2.2
Business Overview
2.3
Results
2.4
Santander Brasil
2
1
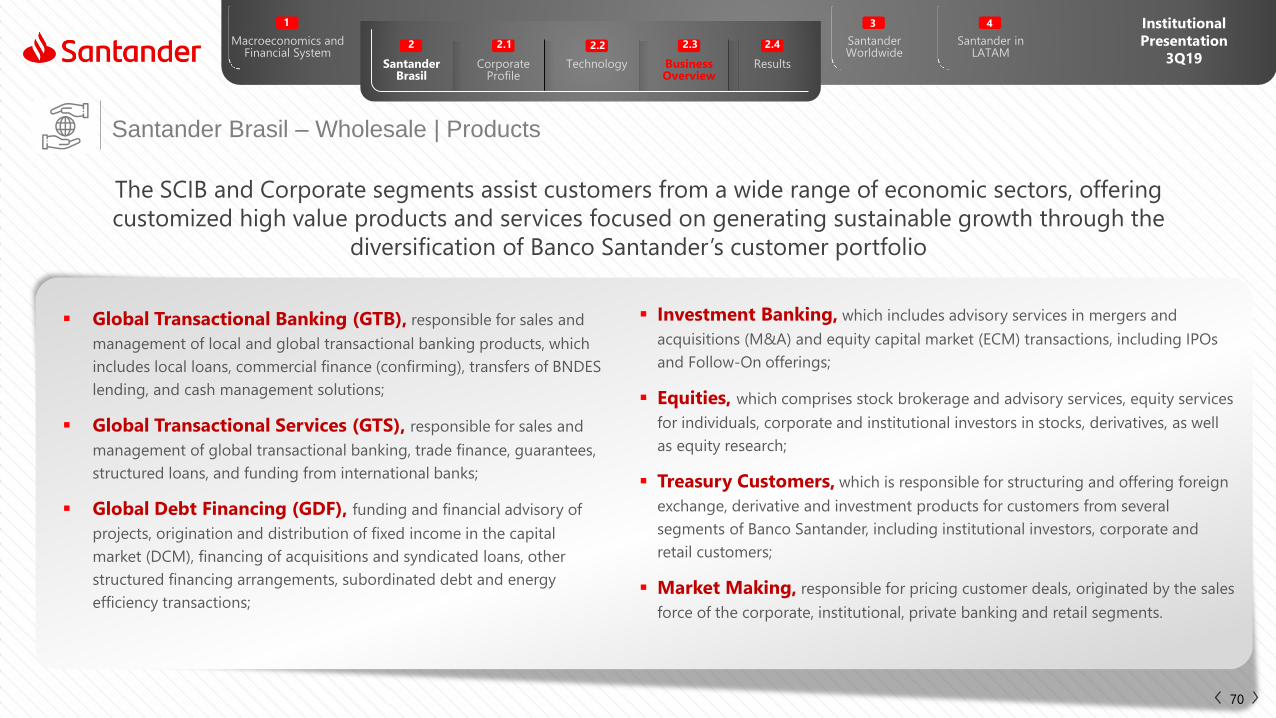
Santander Brasil – Wholesale | Products
The SCIB and Corporate segments assist customers from a wide range of economic sectors, offering
customized high value products and services focused on generating sustainable growth through the
diversification of Banco Santander’s customer portfolio
Global Transactional Banking (GTB), responsible for sales and
management of local and global transactional banking products, which
includes local loans, commercial finance (confirming), transfers of BNDES
lending, and cash management solutions;
Global Transactional Services (GTS), responsible for sales and
management of global transactional banking, trade finance, guarantees,
structured loans, and funding from international banks;
Global Debt Financing (GDF), funding and financial advisory of
projects, origination and distribution of fixed income in the capital
market (DCM), financing of acquisitions and syndicated loans, other
structured financing arrangements, subordinated debt and energy
efficiency transactions;
Investment Banking, which includes advisory services in mergers and
acquisitions (M&A) and equity capital market (ECM) transactions, including IPOs
and Follow-On offerings;
Equities, which comprises stock brokerage and advisory services, equity services
for individuals, corporate and institutional investors in stocks, derivatives, as well
as equity research;
Treasury Customers, which is responsible for structuring and offering foreign
exchange, derivative and investment products for customers from several
segments of Banco Santander, including institutional investors, corporate and
retail customers;
Market Making, responsible for pricing customer deals, originated by the sales
force of the corporate, institutional, private banking and retail segments.
70

Santander Worldwide
3
Santander in LATAM
4 Institutional
Presentation
3Q19
Macroeconomics andFinancial System
Corporate Profile
2.1
Technology
2.2
Business Overview
2.3
Results
2.4
Santander Brasil
2
1
Santander Brasil – Wholesale | Recognition
71
The outstanding work performed by the SCIB and Corporate team also brings market recognition through awards and
leading positions in major local and international rankings. Here are some of the highlights:
¹ Total market (Primary + Interbank). Cumulative between Jan-19 and Sep-19.
Best Commodity Finance Bank Latin America, Best
Trade Bank Latin America, Best Supply Chain
Finance Bank Latin America, Best Trade Bank
Mexico in 2016
In the last quarter of the past year, we were elected
the Best Treasury in Brazil.
Project Finance with Seaborn Networks wins“Perfect 10 ECA
Finance Deal of the Year 2016” Top Financial institutions.
ECA deals including commercial tranches: Santander 3rd
place. 1st place in Global ECA Financing by MLA and
Americas and Middle East MLA in 2018
LatinFinance 2017 Awards
Best Infrastructure Financing: Brazil
Ventos do Araripe III
Best Trade Bank in Latin America and Deal of the
Year LatAm: Seaborn Networks by Global Trade
Review in 2016 and 2017
Project Finance with Seaborn Networks wins
Greenfield Deal of the Year Award 2016 by World
Finance Magazine
2017
1st place as Financial Advisor and Structurer (number of
projects)
1st place as Financial Advisor for Auctions
(financial volume)
2018:
1st place - Financial Advisor by Volume
1st place - Auction Financial Advisor by Volume
1st place - Arranger by Volume
2019
2nd place – Local DCM, Fixed Income.
Santander Corretora
(Brokerage House)
Authorized to use the Agro Broker certifications
seal, issued by B3 – Brasil, Bolsa, Balcão.
Achieving all of B3's qualification seals.
Santander Corretora
(Brokerage House)
1st place in recommendation since 20121st place in FX¹ Ranking by BCB since 2014
2nd place in Derivatives
Ranked 6th overall among banks in Brazil and Latin
America. Ranked 1st place in the
Equities Strategy (Latam and Brazil), 2nd Andean
states, 3rd in Oil and Argentina team, beside main
position (Runner up) in Capital goods, education,
agribusiness, construction, energy, Banks, Telecom,
Brazil and Chile teams.
2nd place in Market Share in Trade Finance
Financial advisory: 1st place in Latam and Brazil ranking in 2018.
1st place in Americans Loans | MLA by Deals
1st place in Americas Financial Adviser by Deals
1st place in Global Renewable Energy | MLA by Deals & Volume
1st place in Americas Renewable Energy | MLA by Deals &
Volume
2nd place Europe ECA Financing by MLA
3rd place Global ECA Financing by MLA
2nd place in DCM International – Brazilian Bonds

Santander Worldwide
3
Santander in LATAM
4 Institutional
Presentation
3Q19
Macroeconomics andFinancial System
Corporate Profile
2.1
Technology
2.2
Business Overview
2.3
Results
2.4
Santander Brasil
2
1
Santander Corporate & Investment Banking
Global corporate
customer-centric modelGlobal business model Leveraging on local Banks
SCIB segment was created by Santander Group as a response to the globalization of corporate customers,
in order to fulfill their new financial needs as they expanded internationally
Integrated client coverage across Group’s
geographies (connectivity) & single risk view
Global insight & global product and
distribution capabilities (DCM, M&A, ECM,
treasury solutions, Project Finance and etc.)
Shared infrastructure
Access to an extensive range of currencies
Retail distribution through local networks
Local insight
Local infrastructure / systems
Local currency funding
Focus on offering Global Corporate
customers a full catalogue of products
and services
With an interconnected platform
translating into higher quality and
global services
72
SCIB Global Model
SCIB
Spain
SCIB
UK
SCIB
Brazil
SCIB
...
...Institutionals
Global CorporateCustomers
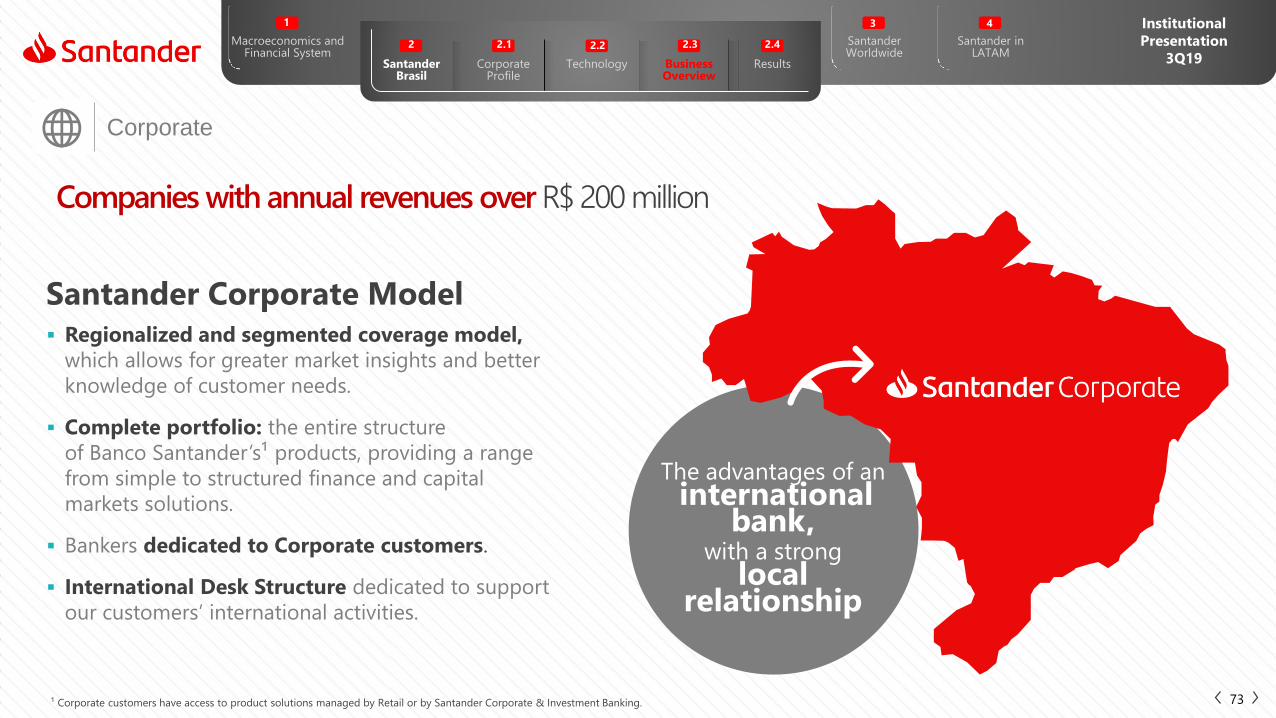
Santander Worldwide
3
Santander in LATAM
4 Institutional
Presentation
3Q19
Macroeconomics andFinancial System
Corporate Profile
2.1
Technology
2.2
Business Overview
2.3
Results
2.4
Santander Brasil
2
1
Corporate
The advantages of aninternational
bank, with a strong
local relationship
Companies with annual revenues over R$ 200 million
73
Regionalized and segmented coverage model,
which allows for greater market insights and better
knowledge of customer needs.
Complete portfolio: the entire structure
of Banco Santander’s¹ products, providing a range
from simple to structured finance and capital
markets solutions.
Bankers dedicated to Corporate customers.
International Desk Structure dedicated to support
our customers’ international activities.
Santander Corporate Model
¹ Corporate customers have access to product solutions managed by Retail or by Santander Corporate & Investment Banking.
2. Santander Brasil2.4 - Results
74
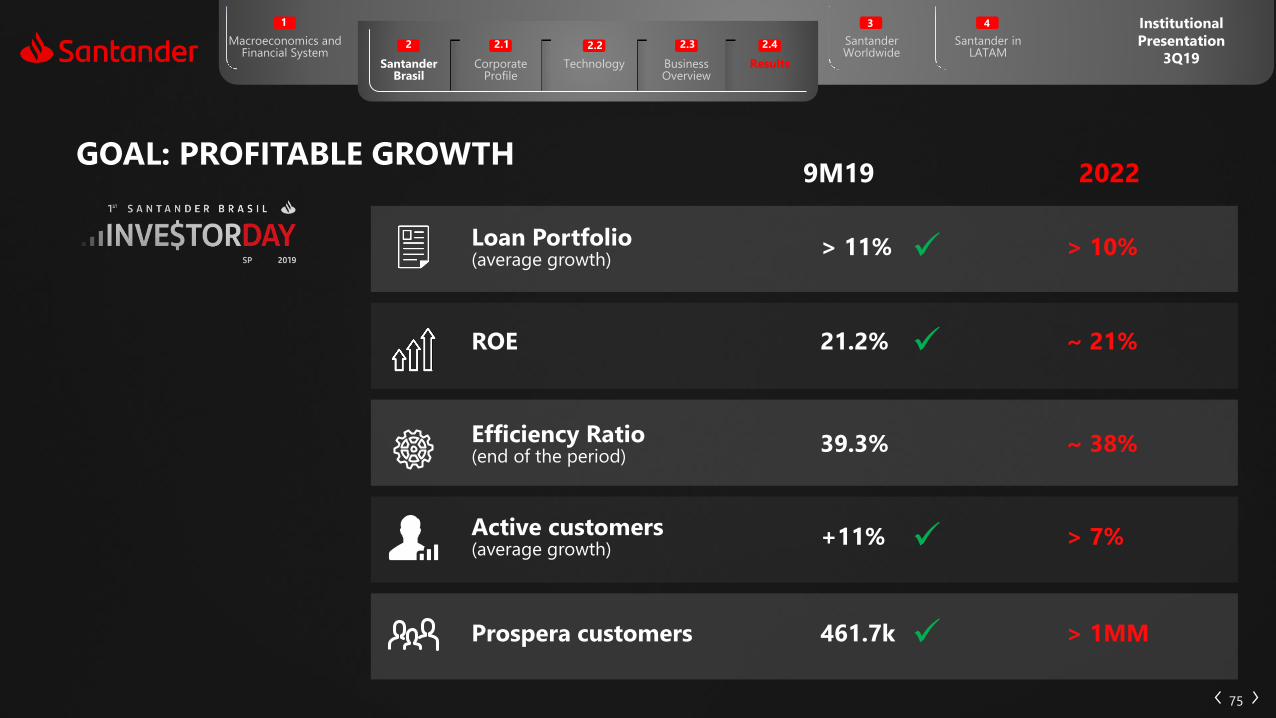
Santander Worldwide
3
Santander in LATAM
4 Institutional
Presentation
3Q19
Macroeconomics andFinancial System
Corporate Profile
2.1
Technology
2.2
Business Overview
2.3
Results
2.4
Santander Brasil
2
1
75
Loan Portfolio(average growth)
ROE
Efficiency Ratio(end of the period)
Active customers (average growth)
9M19 2022
> 10%
~ 21%
~ 38%
> 7%
> 11%
21.2%
39.3%
+11%
Prospera customers > 1MM461.7k
GOAL: PROFITABLE GROWTH
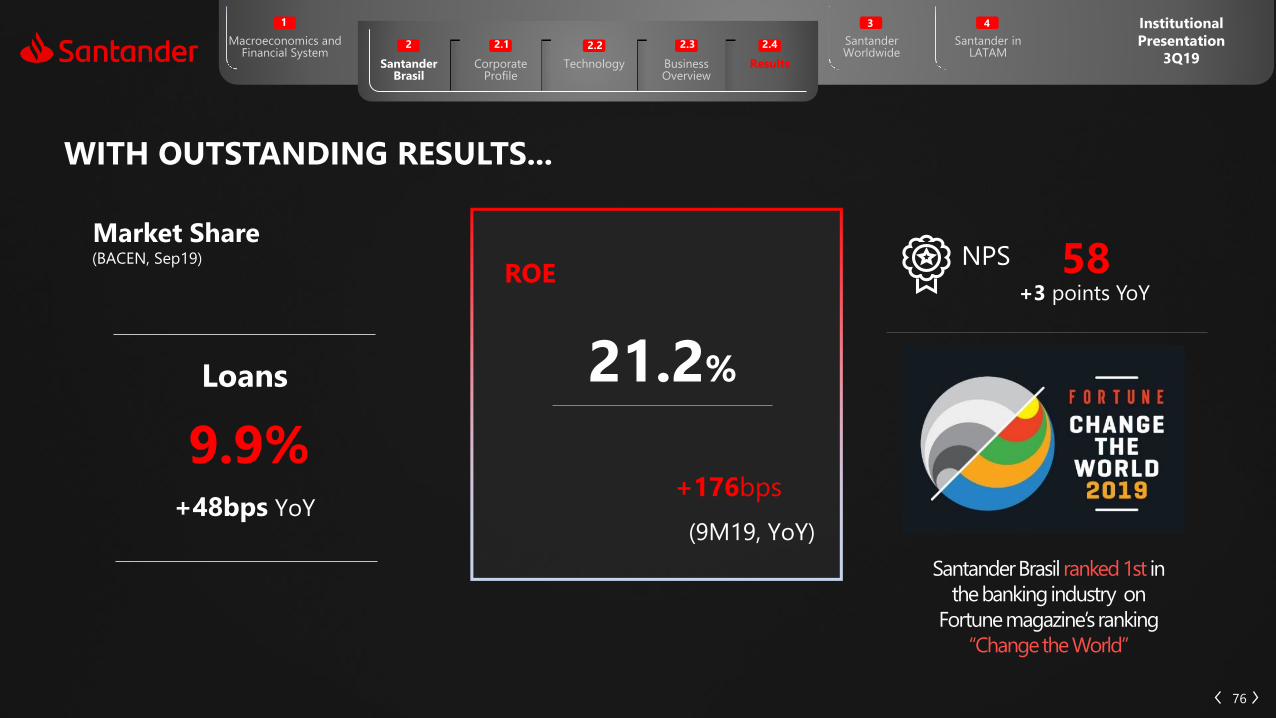
Santander Worldwide
3
Santander in LATAM
4 Institutional
Presentation
3Q19
Macroeconomics andFinancial System
Corporate Profile
2.1
Technology
2.2
Business Overview
2.3
Results
2.4
Santander Brasil
2
1
76
Market Share
ROE
+176bps
(9M19, YoY)
21.2%
(BACEN, Sep19)
Santander Brasil ranked 1st in
the banking industry on
Fortune magazine’s ranking
“Change the World”
NPS
+3 points YoY
58
9.9%
Loans
+48bps YoY
WITH OUTSTANDING RESULTS...

Santander Worldwide
3
Santander in LATAM
4 Institutional
Presentation
3Q19
Macroeconomics andFinancial System
Corporate Profile
2.1
Technology
2.2
Business Overview
2.3
Results
2.4
Santander Brasil
2
1
77
Our people Our customers
Active customersmillion
Digital customersmillion
Loyal customersmillion
+28% YoY
13.4
+10% YoY
5.5
Amongthe best
companies to work
4th consecutive
year
Our shareholders
R$ 3BiIn dividends ¹
+67%YoY
¹ We apportioned a total of R$ 3.0 billion as Interest on Capital (“IoC”), or equivalent to R$ 1.0 billion in 1Q19, 2Q19 and 3Q19.
In 3Q19, we apportioned R$ 1.0 billion for IoC, which will be paid starting from October 30th, 2019.
...AND DELIVERING BENEFITS TO OUR STAKEHOLDERS
25.9
+11% YoY

Santander Worldwide
3
Santander in LATAM
4 Institutional
Presentation
3Q19
Macroeconomics andFinancial System
Corporate Profile
2.1
Technology
2.2
Business Overview
2.3
Results
2.4
Santander Brasil
2
1
8,992
10,824
9M18 9M19
CONSISTENT, PROFITABLE AND CUSTOMER-FOCUSED GROWTH
78
Profitability sustained by:
20%
Net profit: R$ 10.8 billion
in 9M19 (+20%YoY)
3,108
3,405 3,485 3,635 3,705
3Q18 4Q18 1Q19 2Q19 3Q19
19%2%
52 consecutive months of customer
base expansion
Continued and solid loan portfolio
growth
Risk model accuracy
Costs under control
(R$ million)
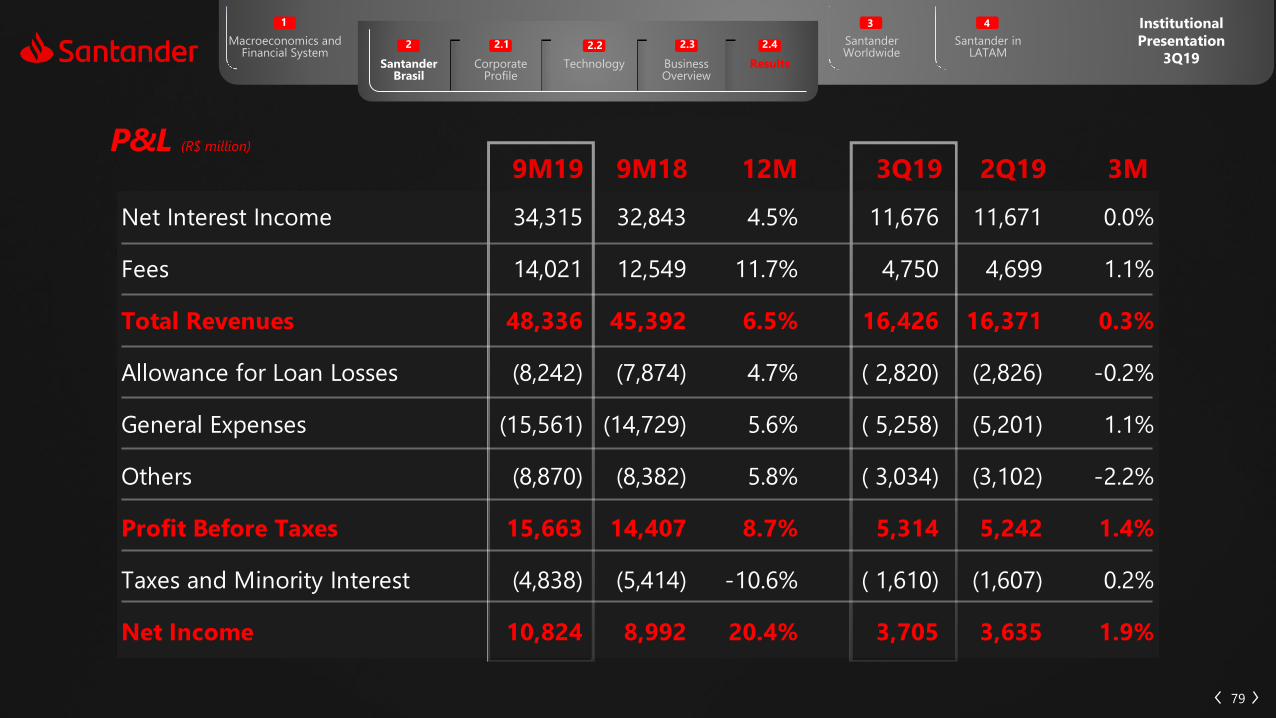
Santander Worldwide
3
Santander in LATAM
4 Institutional
Presentation
3Q19
Macroeconomics andFinancial System
Corporate Profile
2.1
Technology
2.2
Business Overview
2.3
Results
2.4
Santander Brasil
2
1
Net Interest Income 34,315 32,843 4.5% 11,676 11,671 0.0%
Fees 14,021 12,549 11.7% 4,750 4,699 1.1%
Total Revenues 48,336 45,392 6.5% 16,426 16,371 0.3%
Allowance for Loan Losses (8,242) (7,874) 4.7% ( 2,820) (2,826) -0.2%
General Expenses (15,561) (14,729) 5.6% ( 5,258) (5,201) 1.1%
Others (8,870) (8,382) 5.8% ( 3,034) (3,102) -2.2%
Profit Before Taxes 15,663 14,407 8.7% 5,314 5,242 1.4%
Taxes and Minority Interest (4,838) (5,414) -10.6% ( 1,610) (1,607) 0.2%
Net Income 10,824 8,992 20.4% 3,705 3,635 1.9%
79
9M19 9M18 12M 3M3Q19 2Q19P&L (R$ million)
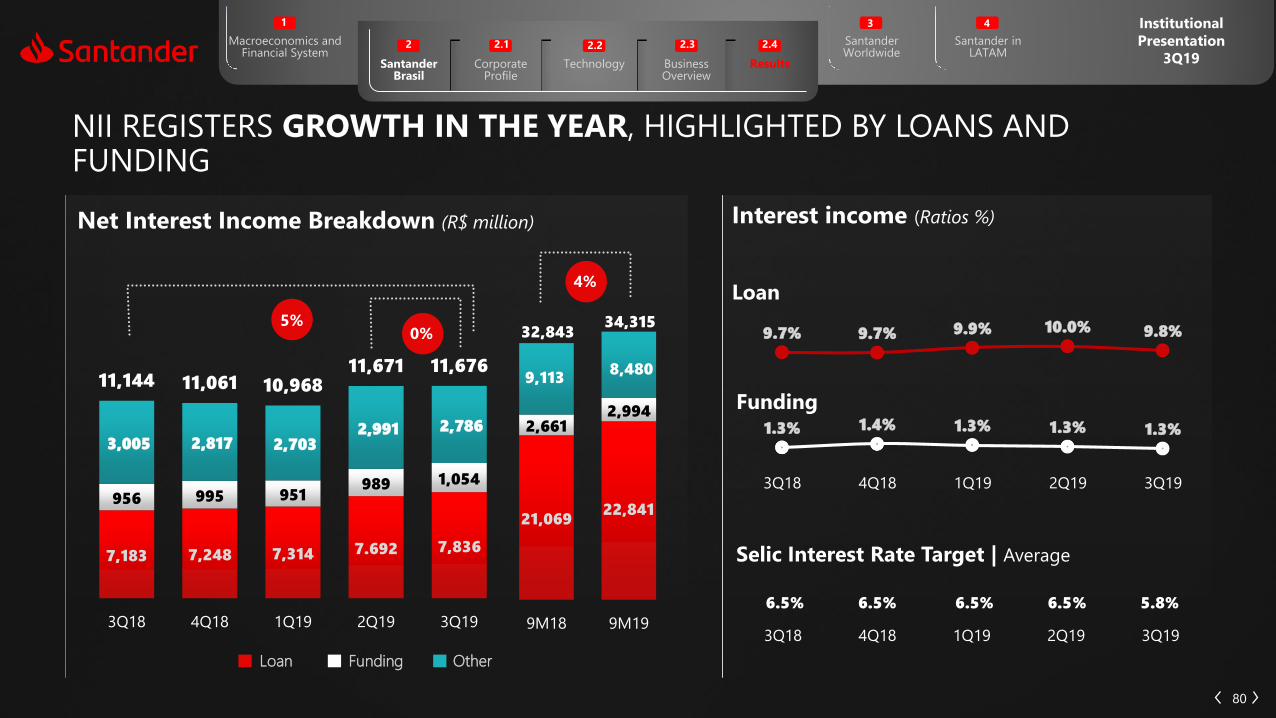
Santander Worldwide
3
Santander in LATAM
4 Institutional
Presentation
3Q19
Macroeconomics andFinancial System
Corporate Profile
2.1
Technology
2.2
Business Overview
2.3
Results
2.4
Santander Brasil
2
1
80
Interest income (Ratios %)
9.7% 9.7% 9.9% 10.0% 9.8%
1.3% 1.4% 1.3% 1.3% 1.3%
3Q18 4Q18 1Q19 2Q19 3Q19
Loan
Funding
6.5% 6.5% 6.5% 6.5% 5.8%
Loan Funding Other
5%0%
4%
3Q18 4Q18 1Q19 2Q19 3Q19
Net Interest Income Breakdown (R$ million)
Selic Interest Rate Target | Average7,183 7,248 7,314 7.692 7,836
956 995 951 989 1,054
3,005 2,817 2,703 2,991 2,786
11,144 11,061 10,96811,671 11,676
3Q18 4Q18 1Q19 2Q19 3Q19
21,069 22,841
2,661 2,994
9,113 8,480
32,843 34,315
9M18 9M19
NII REGISTERS GROWTH IN THE YEAR, HIGHLIGHTED BY LOANS AND FUNDING

Santander Worldwide
3
Santander in LATAM
4 Institutional
Presentation
3Q19
Macroeconomics andFinancial System
Corporate Profile
2.1
Technology
2.2
Business Overview
2.3
Results
2.4
Santander Brasil
2
1
30.6% 28.5% 28.0% 27.0% 27.1%
11.6% 11.7% 11.5% 11.7% 11.7%
15.8% 16.4% 16.5% 16.7% 16.6%
42.0% 43.4% 44.0% 44.6% 44.6%
Sep/18 Dec/18 Mar/19 Jun/19 Sep/19
81
LOAN PORTFOLIO EXPANDS BY 11% IN THE YEAR. IN THE QUARTER, THE PORTFOLIO RECORDS GROWTH ACROSS ALL SEGMENTS
Consumer Finance CorporateIndividuals SMEs
11%4%
Sep 18 12M 3MSep 19
331.6310.7305.3298.4
317.6
Loan Portfolio (R$ billion)
Individuals
Consumer Finance
SMEs
Corporate
Total
Other Transactions¹
Expanded Portfolio
R$ million
¹ Includes debentures, FIDC, CRI, international distribution promissory notes, promissory notes, acquiring activity-related assets, as well as sureties and guarantees.
147,876 125,336 18.0% 4.6%
55,133 47,274 16.6% 3.7%
38,667 34,641 11.6% 4.1%
89,925 91,181 -1.4% 4.7%
331,601 298,433 11.1% 4.4%
77,085 82,280 -6.3% 0.8%
408,686 380,713 7.3% 3.7%

Santander Worldwide
3
Santander in LATAM
4 Institutional
Presentation
3Q19
Macroeconomics andFinancial System
Corporate Profile
2.1
Technology
2.2
Business Overview
2.3
Results
2.4
Santander Brasil
2
1
22,191 17,421 27.4% 8.1%
47,341 44,429 6.6% 1.6%
235,559 239,098 -1.5% -4.9%
37,667 36,050 4.5% 2.8%
342,758 336,997 1.7% -2.5%
(71,290) (69,891) 2.0% -4.8%
83,480 79,398 5.1% 8.3%
354,947 346,504 2.4% 0.4%
341,394 301,541 13.2% 8.4%
696,341 648,046 7.5% 4.1%
82
COMFORTABLE LIQUIDITY POSITION WITH OPTIMIZED FUNDING COST
2%
-2%
337.0 332.3 336.1
351.5342.8
Sep/18 Dec/18 Mar/19 Jun/19 Sep/19
Sep 18 12M 3MSep 19
Funding from Customers (R$ billion)
1 Including Real Estate Credit Notes (LCI) and Agricultural Credit Notes (LCA) and Secured Real Estate Notes (LIG). ²Including Structured Transaction Certificates (COE).
R$ million
Savings Deposits
Time Deposits + Debentures¹
Financial Bills²
Funding from Customers
Others
Funds
Total Funding
Total Funding + AUM
Demand Deposits
(-) Reserve Requirements
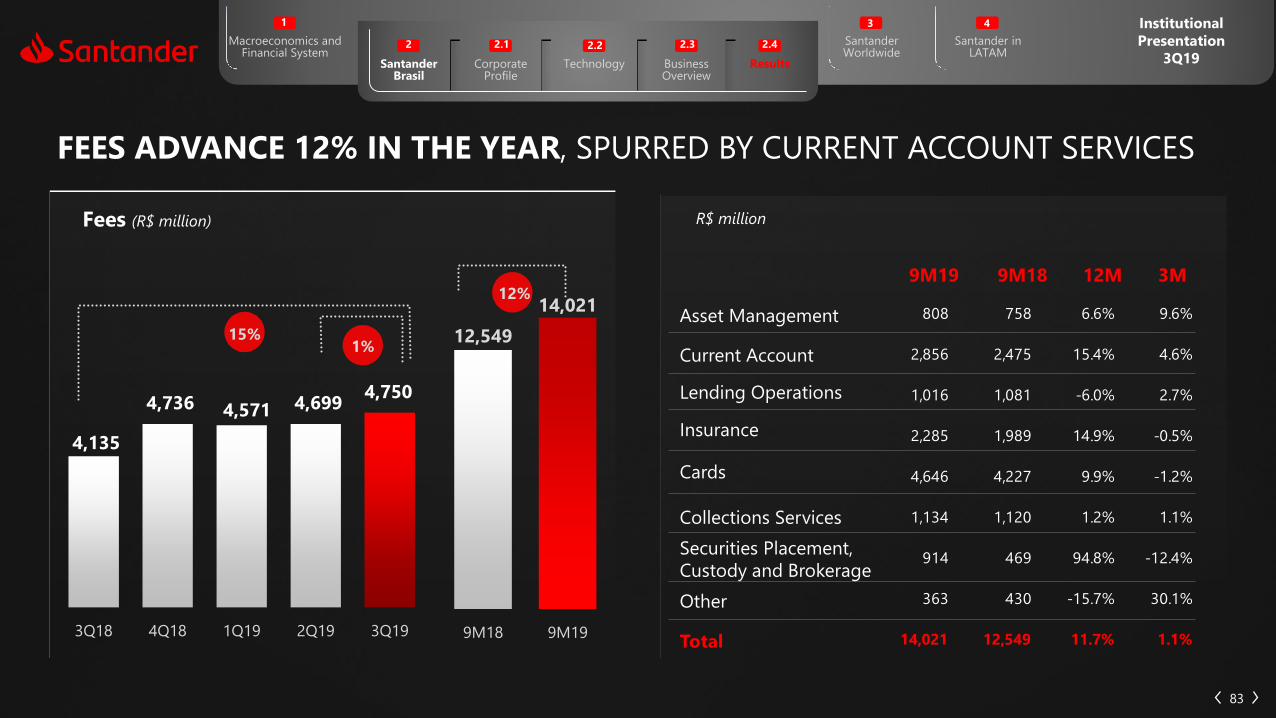
Santander Worldwide
3
Santander in LATAM
4 Institutional
Presentation
3Q19
Macroeconomics andFinancial System
Corporate Profile
2.1
Technology
2.2
Business Overview
2.3
Results
2.4
Santander Brasil
2
1
83
FEES ADVANCE 12% IN THE YEAR, SPURRED BY CURRENT ACCOUNT SERVICES
9M18 12M 3M9M19
Fees (R$ million)
Asset Management
Current Account
Lending Operations
Insurance
Cards
Collections Services
Securities Placement,
Custody and Brokerage
Other
Total
R$ million
808 758 6.6% 9.6%
2,856 2,475 15.4% 4.6%
1,016 1,081 -6.0% 2.7%
2,285 1,989 14.9% -0.5%
4,646 4,227 9.9% -1.2%
1,134 1,120 1.2% 1.1%
914 469 94.8% -12.4%
363 430 -15.7% 30.1%
14,021 12,549 11.7% 1.1%
4,135
4,736 4,571 4,699 4,750
3Q18 4Q18 1Q19 2Q19 3Q19
15%1%
12,549
14,021
9M18 9M19
12%
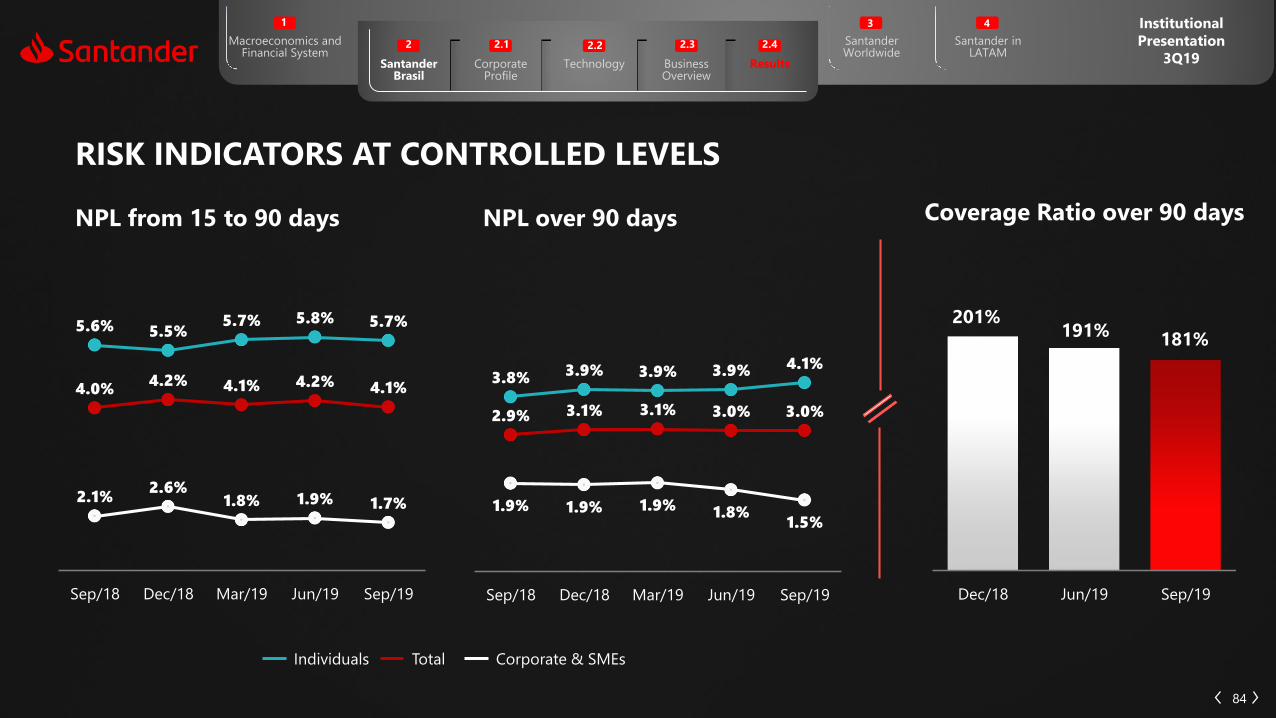
Santander Worldwide
3
Santander in LATAM
4 Institutional
Presentation
3Q19
Macroeconomics andFinancial System
Corporate Profile
2.1
Technology
2.2
Business Overview
2.3
Results
2.4
Santander Brasil
2
1
84
RISK INDICATORS AT CONTROLLED LEVELS
5.6% 5.5%5.7% 5.8% 5.7%
4.0%4.2% 4.1% 4.2% 4.1%
2.1%2.6%
1.8% 1.9% 1.7%
Sep/18 Dec/18 Mar/19 Jun/19 Sep/19
201%191%
181%
Dec/18 Jun/19 Sep/19
1.9% 1.9% 1.9% 1.8%1.5%
3.8% 3.9% 3.9% 3.9% 4.1%
2.9% 3.1% 3.1% 3.0% 3.0%
Sep/18 Dec/18 Mar/19 Jun/19 Sep/19
NPL from 15 to 90 days NPL over 90 days Coverage Ratio over 90 days
Individuals Total Corporate & SMEs

Santander Worldwide
3
Santander in LATAM
4 Institutional
Presentation
3Q19
Macroeconomics andFinancial System
Corporate Profile
2.1
Technology
2.2
Business Overview
2.3
Results
2.4
Santander Brasil
2
1
85
PROVISIONS AND COST OF CREDIT REMAIN UNDER CONTROL
(1,637) (1,607)
3,1263,557
3,0423,416 3,391
3.1% 3.5% 3.0% 3.2% 3.1%
9,511 9,849
7,874 8,242
3.2% 3.1%
9M18 9M19
2,8202,826
2,596
2,986
2,618
3Q18 4Q18 1Q19 2Q19 3Q19
Allowance for loan losses (R$ million) and Cost of credit (%)
Provisions for Loan Losses Recovery of Written-Off Loans Cost of Credit
(508) (571) (446) (590) (571)
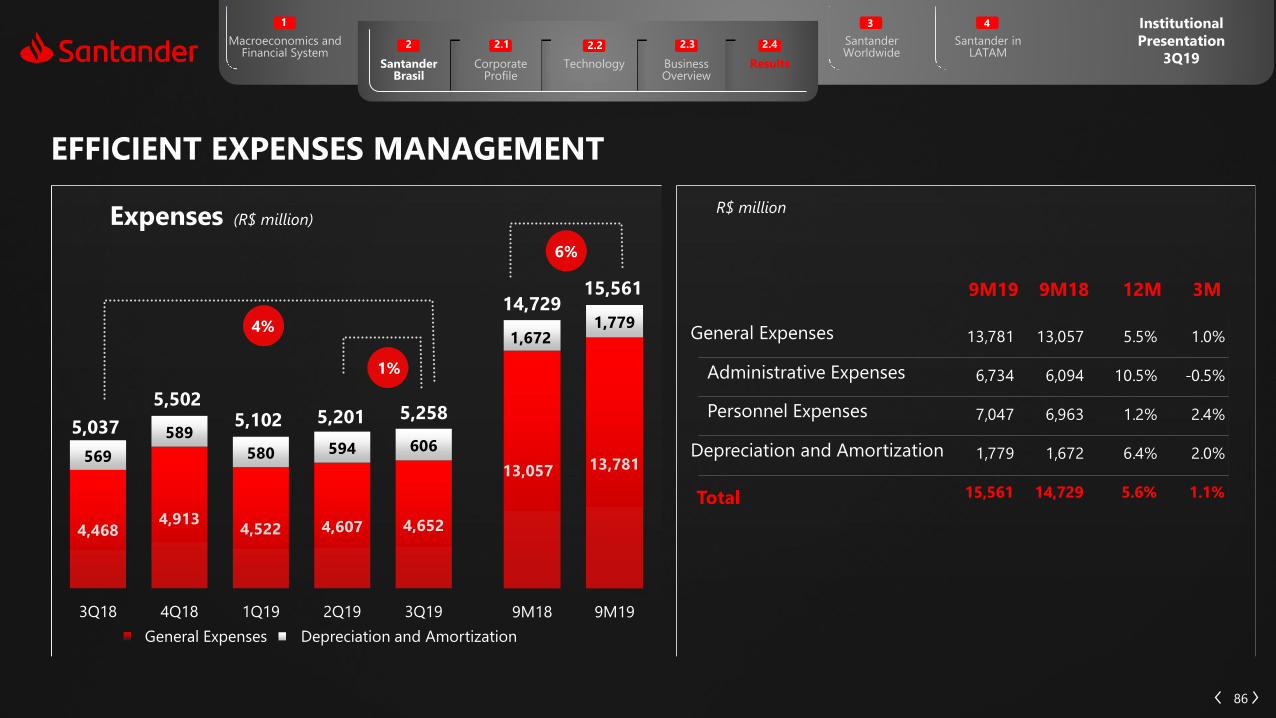
Santander Worldwide
3
Santander in LATAM
4 Institutional
Presentation
3Q19
Macroeconomics andFinancial System
Corporate Profile
2.1
Technology
2.2
Business Overview
2.3
Results
2.4
Santander Brasil
2
1
13,781 13,057 5.5% 1.0%
6,734 6,094 10.5% -0.5%
7,047 6,963 1.2% 2.4%
1,779 1,672 6.4% 2.0%
15,561 14,729 5.6% 1.1%
86
EFFICIENT EXPENSES MANAGEMENT
4,4684,913
4,522 4,607 4,652
569
589
580 594 6065,037
5,5025,102 5,201 5,258
3Q18 4Q18 1Q19 2Q19 3Q19
4%
1%
9M18 12M9M19 3M
13,057 13,781
1,6721,779
9M18 9M19
6%
15,56114,729
Expenses (R$ million)
General Expenses Depreciation and Amortization
General Expenses
Depreciation and Amortization
Personnel Expenses
Administrative Expenses
Total
R$ million

Santander Worldwide
3
Santander in LATAM
4 Institutional
Presentation
3Q19
Macroeconomics andFinancial System
Corporate Profile
2.1
Technology
2.2
Business Overview
2.3
Results
2.4
Santander Brasil
2
1
87
39.8% 38.9% 39.3%
3Q18 2Q19 3Q19
Efficiency Ratio
-0.5p.p.
YoY
-0.5p.p.
YoY
39.8% 39.3%
9M18 9M19
82.1%
90.4% 90.4%
3Q18 2Q19 3Q19
Recurrence Ratio
85.2%
90.1%
9M18 9M19
+8.3p.p.
YoY
+4.9p.p.
YoY
ROAA
1.6%1.8% 1.8%
3Q18 2Q19 3Q19
1.6%1.8%
9M18 9M19
+0.2p.p.
YoY
+0.2p.p.
YoY
ROAE
19.5%
21.3% 21.1%
3Q18 2Q19 3Q19
+1.6p.p.
YoY
+1.8p.p.
YoY
19.4%
21.2%
9M18 9M19
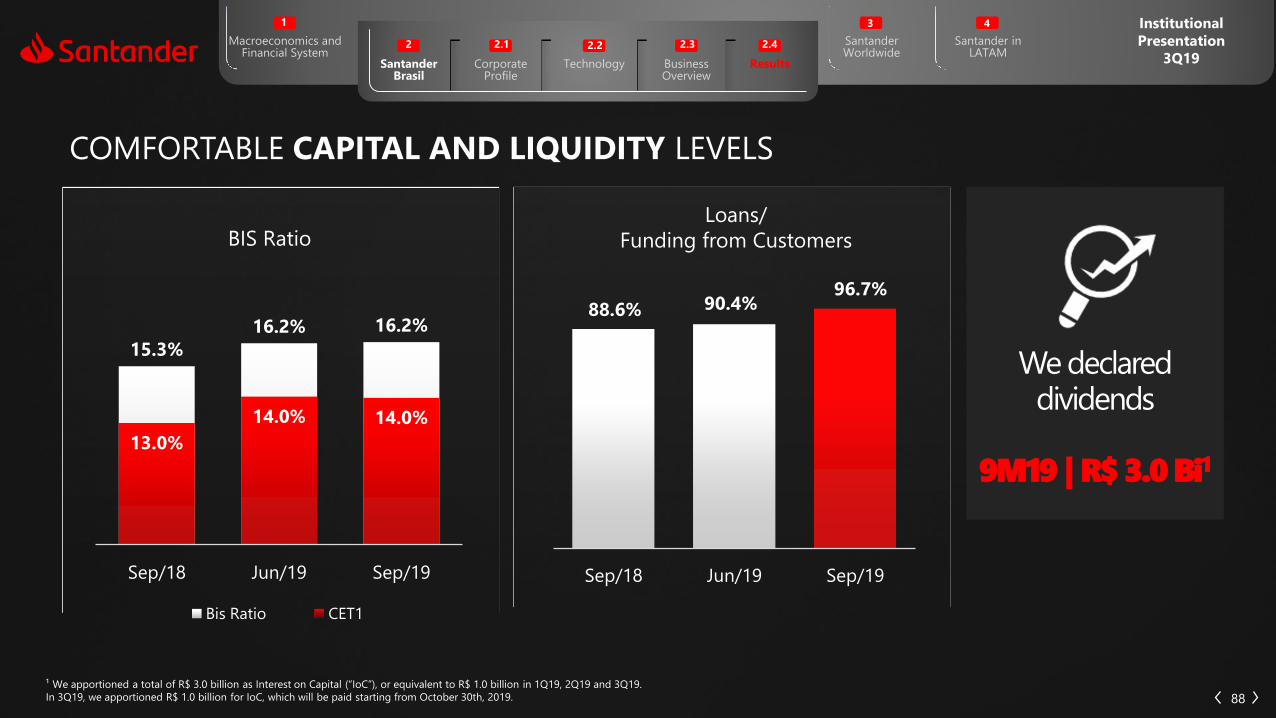
Santander Worldwide
3
Santander in LATAM
4 Institutional
Presentation
3Q19
Macroeconomics andFinancial System
Corporate Profile
2.1
Technology
2.2
Business Overview
2.3
Results
2.4
Santander Brasil
2
1
88
COMFORTABLE CAPITAL AND LIQUIDITY LEVELS
15.3%
16.2% 16.2%
13.0%
14.0% 14.0%
Sep/18 Jun/19 Sep/19
Bis Ratio CET1
We declareddividends
9M19 | R$ 3.0 Bi1
¹ We apportioned a total of R$ 3.0 billion as Interest on Capital (“IoC”), or equivalent to R$ 1.0 billion in 1Q19, 2Q19 and 3Q19.
In 3Q19, we apportioned R$ 1.0 billion for IoC, which will be paid starting from October 30th, 2019.
88.6% 90.4%96.7%
Sep/18 Jun/19 Sep/19
BIS RatioLoans/
Funding from Customers

Santander Worldwide
3
Santander in LATAM
4 Institutional
Presentation
3Q19
Macroeconomics andFinancial System
Corporate Profile
2.1
Technology
2.2
Business Overview
2.3
Results
2.4
Santander Brasil
2
1
89
LONG-TERM COMMITMENT TO PROFITABLE GROWTH
Relentless focus
on boosting
productivity, with
a better efficiency
ratio in 9M19
Active and
preventive risk
management
evidenced by our
loan quality
indicators
Total revenues rise
6.5% in the year
Net profit grows
20.4% on a year-
to-date basis
Significant
increase in
earnings
distribution in
9M19 compared
to the same
period of previous
years
+67% YoY
R$ 3bi in dividends
ROE 21.2%, (9M19, YoY)+176bps
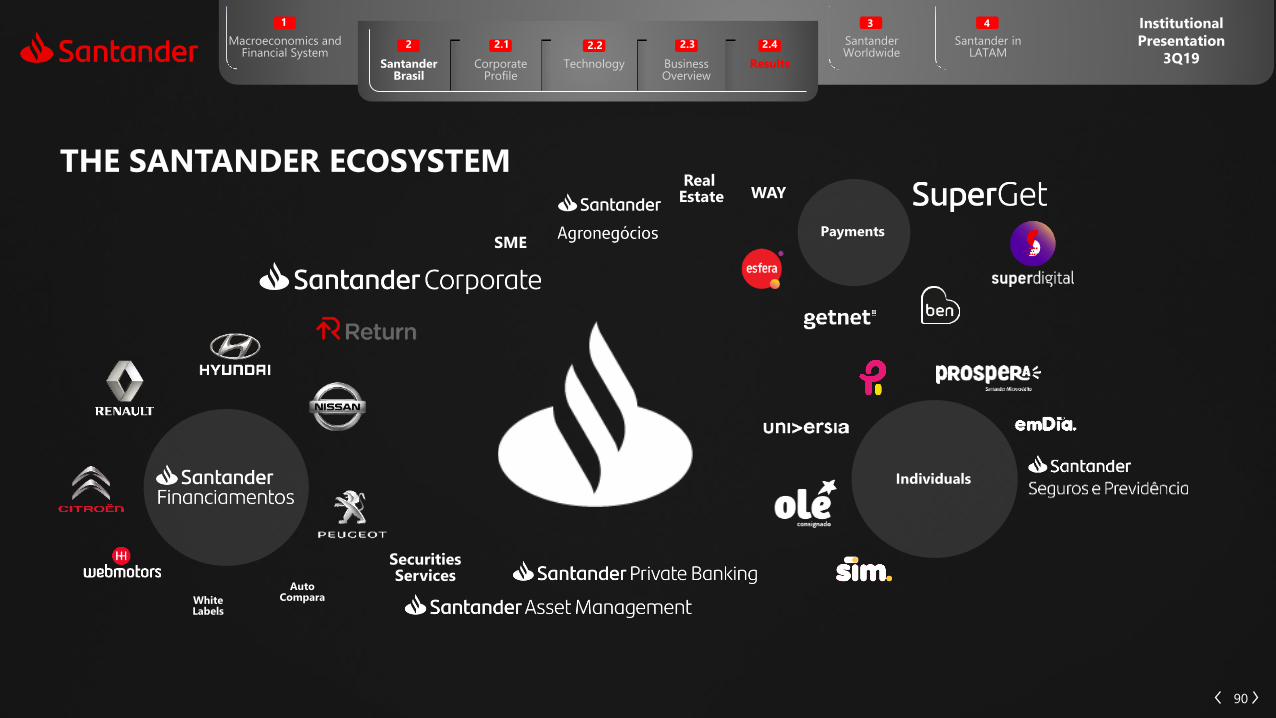
Santander Worldwide
3
Santander in LATAM
4 Institutional
Presentation
3Q19
Macroeconomics andFinancial System
Corporate Profile
2.1
Technology
2.2
Business Overview
2.3
Results
2.4
Santander Brasil
2
1
90
THE SANTANDER ECOSYSTEMWAY
Payments
RealEstate
SME
Securities Services
White Labels
AutoCompara
Individuals

Santander Worldwide
3
Santander in LATAM
4 Institutional
Presentation
3Q19
Macroeconomics andFinancial System
Corporate Profile
2.1
Technology
2.2
Business Overview
2.3
Results
2.4
Santander Brasil
2
1
34,315 32,843 1,471 4.5%
(8,242) (7,874) (368) 4.7%
26,073 24,969 1,103 4.4%
14,021 12,549 1,472 11.7%
(15,561) (14,729) (831) 5.6%
(7,047) (6,963) (85) 1.2%
(8,513) (7,767) (747) 9.6%
(3,081) (3,009) (72) 2.4%
(5,732) (5,421) (312) 5.7%
35 14 21 152.8%
(93) 33 (126) -376.5%
15,663 14,407 1,256 8.7%
(4,568) (5,154) 586 -11.4%
(271) (261) (10) 3.8%
10,824 8,992 1,832 20.4%
91
9M18 12M9M19 Abs.P&L (R$ million)
Allowance for Loan Losses
Fees
Personnel Expenses + Profit Sharing
Non-Operating Income
Profit Before Taxes
Income Tax and Social Contribution Tax
Minority Interest
Net Profit
Net Interest Income
Net Interest Income After Loan Losses
General Expenses
Administrative Expenses
Other Income (expenses)
Tax Expenses
Investments in Affiliates and Subidiaries

Santander Worldwide
3
Santander in LATAM
4 Institutional
Presentation
3Q19
Macroeconomics andFinancial System
Corporate Profile
2.1
Technology
2.2
Business Overview
2.3
Results
2.4
Santander Brasil
2
1
Allowance for Loan Losses
Fees
Personnel Expenses + Profit Sharing
Non-Operating Income
Profit Before Taxes
Income Tax and Social Contribution Tax
Minority Interest
Net Profit
Net Interest Income
Net Interest Income After Loan Losses
General Expenses
Administrative Expenses
Other Income (expenses)
Tax Expenses
Investments in Affiliates and Subidiaries
11,144 11,061 10,968 11,671 11,676
(2,618) (2,986) (2,596) (2,826) (2,820)
8,525 8,075 8,371 8,846 8,855
4,135 4,736 4,571 4,699 4,750
(5,037) (5,502) (5,102) (5,201) (5,258)
(2,347) (2,403) (2,335) (2,328) (2,385)
(2,690) (3,100) (2,767) (2,873) (2,873)
(1,012) (1,047) (1,054) (1,032) (995)
(1,602) (1,858) (1,693) (1,969) (2,071)
5 5 11 10 13
6 160 0 (112) 19
5,020 4,567 5,106 5,242 5,314
(1,825) (1,038) (1,529) (1,518) (1,520)
(87) (124) (92) (89) (89)
3,108 3,405 3,485 3,635 3,705
92
3Q18 3Q192Q191Q194Q18P&L (R$ million)

Santander Worldwide
3
Santander in LATAM
4 Institutional
Presentation
3Q19
Macroeconomics andFinancial System
Corporate Profile
2.1
Technology
2.2
Business Overview
2.3
Results
2.4
Santander Brasil
2
1
759,235 794,664 791,371 823,718 825,938
14,945 11,629 9,516 13,336 10,307
56,923 56,812 33,632 38,899 36,193
179,682 194,465 195,477 202,991 213,169
92,619 92,443 91,671 94,850 92,671
280,894 287,129 292,613 296,699 308,243
(18,224) (18,789) (18,700) (18,491) (18,241)
131,545 149,507 165,938 174,531 162,782
2,626 2,680 2,524 2,413 2,573
10,754 11,155 12,308 12,540 12,794
342 338 349 352 366
6,266 6,498 6,578 6,807 6,928
4,146 4,319 5,381 5,381 5,500
727 662 595 1,789 1,690
3,420 3,658 4,787 3,592 3,810
769,990 805,819 803,679 836,258 838,733
769,263 805,158 803,085 834,469 837,043
93
Balance sheet – Assets (R$ million) Sep 18 Sep 19Jun 19Mar 19Dec 18
Cash and Cash Equivalents
Securities and Derivative Financial Instruments
Lending Operations
Other Assets
Current and Long-Term Assets
Interbank Investments
Interbank Accounts
Allowance for Loan Losses
Other Receivables
Investments
Fixed Assets
Intangibles
Permanent Assets
Goodwill net of amortization
Others
Total Assets
Total Assets (Excluding Goodwill)

Santander Worldwide
3
Santander in LATAM
4 Institutional
Presentation
3Q19
Macroeconomics andFinancial System
Corporate Profile
2.1
Technology
2.2
Business Overview
2.3
Results
2.4
Santander Brasil
2
1
701,989 738,179 733,278 763,716 762,964
250,593 252,072 252,362 268,256 258,109
17,421 18,832 17,940 20,521 22,191
44,429 46,068 46,211 46,575 47,341
4,111 3,065 3,110 3,852 3,114
184,626 184,098 185,096 197,301 185,361
6 9 6 6 102
117,545 131,820 109,291 102,516 122,638
82,221 82,113 85,847 88,147 89,321
1,918 284 1,934 2,104 3,589
3,593 3,466 2,955 3,173 4,258
50,697 32,672 43,919 48,504 53,172
13,531 13,267 12,946 12,490 12,255
16,932 18,900 20,742 22,785 20,564
164,958 203,584 203,281 215,741 199,056
355 337 319 280 277
2,095 2,070 1,883 1,760 1,809
65,551 65,234 68,199 70,502 73,683
769,990 805,819 803,679 836,258 838,733
64,824 64,572 67,605 68,713 71,993
Balance Sheet – Liabilities and Equity(R$ million)
94
Sep 18 Sep 19Jun 19Mar 19Dec 18
Demand Deposits
Time Deposits
Interbank Deposits
Funds from Acceptance and Issuance of Securities
Domestic On-Lending-Official Institutions
Money Market Funding
Interbank Accounts
Interbranch Accounts
Borrowings
Deposits
Savings Deposits
Current and Long-Term Liabilities
Other Deposits
Derivative Financial Instruments
Other Payables
Deferred Income
Minority Interest
Equity
Total Liabilities
Equity (Excluding Goodwill)
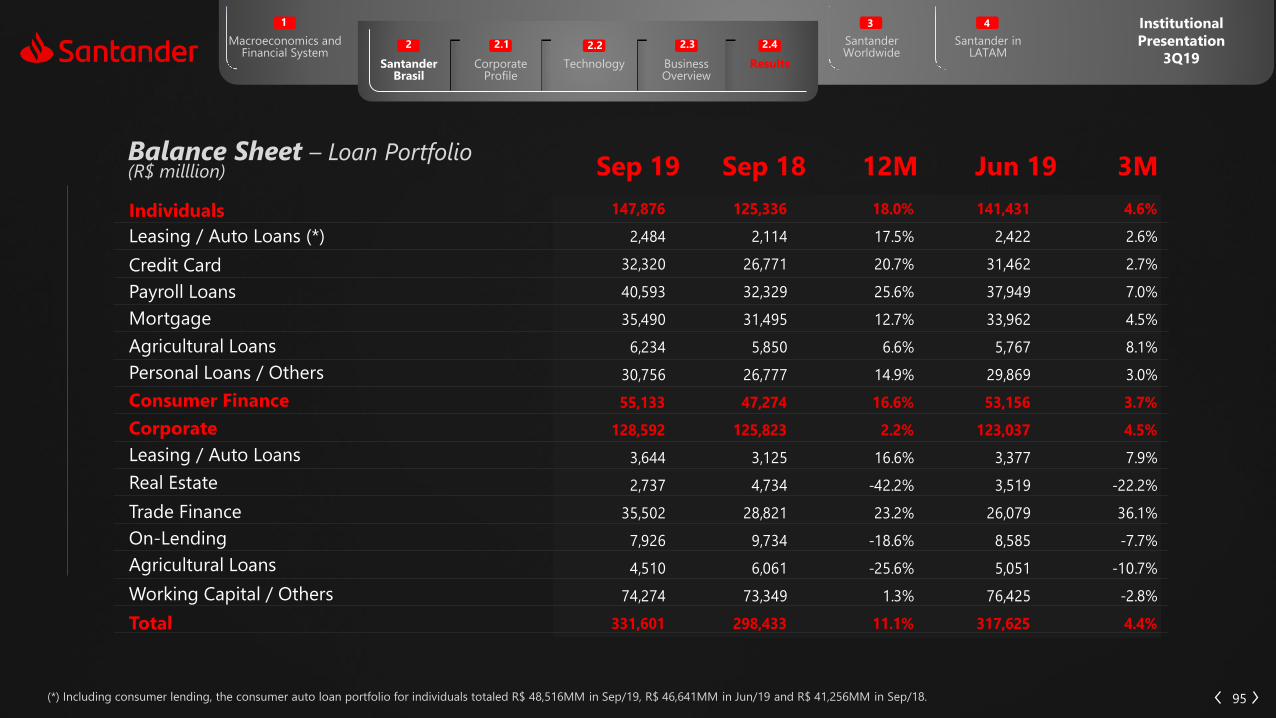
Santander Worldwide
3
Santander in LATAM
4 Institutional
Presentation
3Q19
Macroeconomics andFinancial System
Corporate Profile
2.1
Technology
2.2
Business Overview
2.3
Results
2.4
Santander Brasil
2
1
147,876 125,336 18.0% 141,431 4.6%
2,484 2,114 17.5% 2,422 2.6%
32,320 26,771 20.7% 31,462 2.7%
40,593 32,329 25.6% 37,949 7.0%
35,490 31,495 12.7% 33,962 4.5%
6,234 5,850 6.6% 5,767 8.1%
30,756 26,777 14.9% 29,869 3.0%
55,133 47,274 16.6% 53,156 3.7%
128,592 125,823 2.2% 123,037 4.5%
3,644 3,125 16.6% 3,377 7.9%
2,737 4,734 -42.2% 3,519 -22.2%
35,502 28,821 23.2% 26,079 36.1%
7,926 9,734 -18.6% 8,585 -7.7%
4,510 6,061 -25.6% 5,051 -10.7%
74,274 73,349 1.3% 76,425 -2.8%
331,601 298,433 11.1% 317,625 4.4%
Sep 19 Sep 18 12M Jun 19 3MBalance Sheet – Loan Portfolio(R$ milllion)
95(*) Including consumer lending, the consumer auto loan portfolio for individuals totaled R$ 48,516MM in Sep/19, R$ 46,641MM in Jun/19 and R$ 41,256MM in Sep/18.
Credit Card
Mortgage
Consumer Finance
Leasing / Auto Loans
Real Estate
Trade Finance
On-Lending
Agricultural Loans
Individuals
Leasing / Auto Loans (*)
Payroll Loans
Agricultural Loans
Corporate
Personal Loans / Others
Working Capital / Others
Total
3. Santander
Worldwide
96

Corporate Profile
2.1
Technology
2.2
Business Overview
2.3
Results
2.4
Santander Brasil
2
Santander in LATAM
4 Institutional
Presentation
3Q19
Macroeconomics andFinancial System
1
Santander Worldwide
3
97
A retail bank focused on the distribution and proximity with customers
9M19EUR million
1,517,885
916,003
108,526
6,180
12,691
201,017
21.0
Underlying attributable profit distribution
assigned by geographic business | 9M19
10%
15%
13%
5%3%
3%8%
8%
29%
6%
UK
Spain
SCF
Portugal
PolandUSA
Mexico
Brazil
Chile
OtherLatam
(*) Excluding Corporate Centre and Santander Global Plataform.
Assets
Net Customer Loans
Total Equity
Underlying Attributable Profit
Branches
Employees
Loyal customers (million)
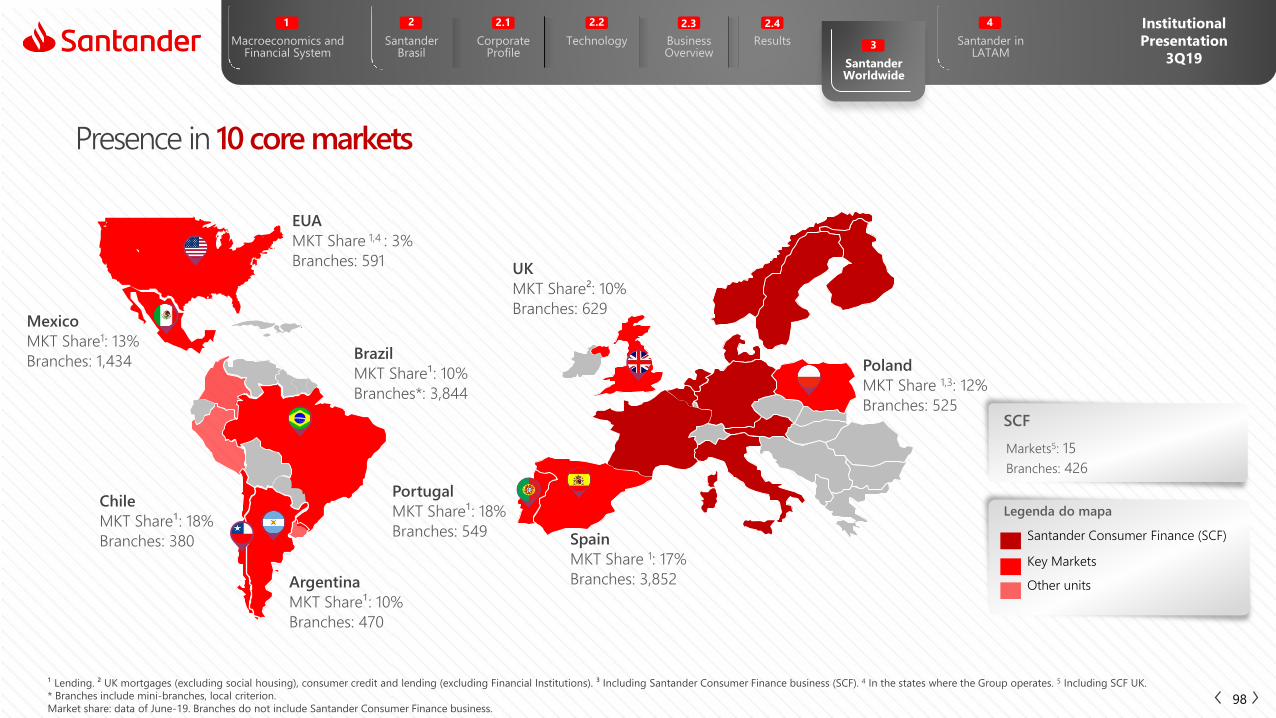
Corporate Profile
2.1
Technology
2.2
Business Overview
2.3
Results
2.4
Santander Brasil
2
Santander in LATAM
4 Institutional
Presentation
3Q19
Macroeconomics andFinancial System
1
Santander Worldwide
3
98
Presence in 10 core markets
EUA
MKT Share 1,4 : 3%
Branches: 591
Mexico
MKT Share1: 13%
Branches: 1,434Brazil
MKT Share¹: 10%
Branches*: 3,844
Chile
MKT Share¹: 18%
Branches: 380
Argentina
MKT Share¹: 10%
Branches: 470
Portugal
MKT Share¹: 18%
Branches: 549
UK
MKT Share²: 10%
Branches: 629
Spain
MKT Share 1: 17%
Branches: 3,852
Poland
MKT Share 1,3: 12%
Branches: 525
Legenda do mapa
Markets5: 15
Branches: 426
SCF
Key Markets
Santander Consumer Finance (SCF)
Other units
¹ Lending. ² UK mortgages (excluding social housing), consumer credit and lending (excluding Financial Institutions). ³ Including Santander Consumer Finance business (SCF). 4 In the states where the Group operates. 5 Including SCF UK.
* Branches include mini-branches, local criterion.
Market share: data of June-19. Branches do not include Santander Consumer Finance business.

4. Santander
in
South America
99

Institutional
Presentation
3Q19Santander in LATAM
4Santander Worldwide
3
Corporate Profile
2.1
Technology
2.2
Business Overview
2.3
Results
2.4
Santander Brasil
2
Macroeconomics andFinancial System
1
100
Santander is present in all major South America countries
9M19EUR milion
123,850
67,631
2,977
4,639
South America
represents 38%¹of Santander’s world
underlying profit111,766
71,264Chile
Argentina
Brazil
Uruguay
Colombia
Peru
Net Customer Loans
Deposits
Mutual and Pension Funds
Underlying Attributable Profit
Branches
Employees
¹ Excluding Corporate Centre and Santander Global Plataform.
Simple | Personal | Fair
Our purpose is to help people and
businesses prosper,
Our culture is based on the belief that
everything we do should be:
Investor Relations (Brazil)
Av, Juscelino Kubitschek, 2,235, 26th floor
São Paulo | SP | Brasil | 04543-011
Phone: 55 11 3553 3300
Fax: 55 11 3553 7797
E-mails: [email protected]