Post-cyclone livelihood status and strategies in coastal Bangladesh
Upload
khangminh22Category
view
0download
0
Article
Appraisal of climate change and cyclone trends in Indian coastal states: a systematic approach towards climate action
Kantamaneni, Komali, Panneer, Sigamani, Krishnan, Annaidasan, Shekhar, Sulochana, Bhat, Lekha, R, Aswathi K. and Rice, Louis
Available at http://clok.uclan.ac.uk/41658/
Kantamaneni, Komali ORCID: 0000-0002-3852-4374, Panneer, Sigamani, Krishnan, Annaidasan, Shekhar, Sulochana, Bhat, Lekha, R, Aswathi K. and Rice, Louis (2022) Appraisal of climate change and cyclone trends in Indian coastal states: a systematic approach towards climate action. Arabian Journal of Geosciences, 15 (9). p. 814. ISSN 1866-7511
It is advisable to refer to the publisher’s version if you intend to cite from the work.http://dx.doi.org/10.1007/s12517-022-10076-8
For more information about UCLan’s research in this area go to http://www.uclan.ac.uk/researchgroups/ and search for <name of research Group>.
For information about Research generally at UCLan please go to http://www.uclan.ac.uk/research/
All outputs in CLoK are protected by Intellectual Property Rights law, includingCopyright law. Copyright, IPR and Moral Rights for the works on this site are retainedby the individual authors and/or other copyright owners. Terms and conditions for useof this material are defined in the policies page.
CLoKCentral Lancashire online Knowledgewww.clok.uclan.ac.uk

Vol.:(0123456789)1 3
Arabian Journal of Geosciences (2022) 15:814 https://doi.org/10.1007/s12517-022-10076-8
ORIGINAL PAPER
Appraisal of climate change and cyclone trends in Indian coastal states: a systematic approach towards climate action
Komali Kantamaneni1 · Sigamani Panneer2 · Annaidasan Krishnan3 · Sulochana Shekhar3 · Lekha Bhat4 · Aswathi K. R2 · Louis Rice5
Received: 1 December 2021 / Accepted: 6 April 2022 © The Author(s) 2022
AbstractIndian coastal regions have often been affected by frequent climate-induced natural disasters such as cyclones, floods, droughts and other related hazards in recent decades. Existing literature was not sufficient to fully understand these event trends from diverse perspectives in a systematised manner at current scenarios. Therefore, a systematic approach has been employed to assess the climate change and cyclone trends of nine Indian coastal states by using various geographical infor-mation system (GIS) tools for 2006–2020. The results showed that 61 cyclones occurred in nine coastal states from 2006 to 2020; the highest numbers were recorded in Odisha (20), West Bengal (14) and Andhra Pradesh (11). Accordingly, these three coastal states emerged as the most vulnerable for high-intensity cyclones. The results also identified that the highest average temperature (29.3 °C) was recorded at Tamil Nadu and Gujarat, and the lowest temperature (26.7 °C) was recorded in West Bengal and Odisha. Most of the coastal states showed fluctuations in temperatures during the study period. At the same time, Kerala and Karnataka states recorded the highest average rainfall (2341 mm and 2261 mm) and highest rela-tive humidity (78.11% and 76.57%). Conversely, the Gujarat and West Bengal states recorded the lowest relative humidity at 59.65% and 70.78%. Based on these results, the current study generated GIS vulnerability maps for climate change and cyclone activity, allowing one to rank each state’s vulnerability. Cumulatively, these results and maps assist in understand-ing the driving mechanisms of climate change, cyclones and will contribute towards more effective and efficient sustainable disaster management in the future.
Keywords Climate change · Cyclones · Indian coastal states · GIS maps · Systematic approach
Responsible Editor: Amjad Kallel
* Komali Kantamaneni [email protected]
Sigamani Panneer [email protected]
Annaidasan Krishnan [email protected]
Sulochana Shekhar [email protected]
Lekha Bhat [email protected]
Aswathi K. R [email protected]
Louis Rice [email protected]
1 Faculty of Science and Technology, University of Central Lancashire, Preston PR1 2HE, Lancashire, UK
2 Department of Social Work, School of Social Sciences and Humanities and Centre for Happiness, Central University of Tamil Nadu, Thiruvarur, Tamil Nadu 610005, India
3 Department of Geography, School of Earth Sciences, Central University of Tamil Nadu, Thiruvarur, Tamil Nadu 610005, India
4 Department of Epidemiology & Public Health, School of Life Sciences, Central University of Tamil Nadu, Thiruvarur, Tamil Nadu 610005, India
5 Centre for Architecture and Built Environment Research, University of the West of England, Bristol BS16 1QY, UK

Arab J Geosci (2022) 15:814
1 3
814 Page 2 of 15
Introduction
Coastal states of India are often affected by frequent cli-mate induced natural disasters such as cyclones, floods, droughts and other related hazards in recent years (Mirza 2003; Patel et al. 2020; Thomalla and Schmuck 2004; Yadav and Barve 2017). Climate change is having a sig-nificant impact in tropical and subtropical countries, espe-cially coastal regions. Coastal areas in some countries par-ticularly in the global south are highly susceptible to the various impacts of climate change due to anthropogenic and natural climatic factors (Bouwer 2011; DasGupta and Shaw 2013; Nath and Behera 2011; Sivakumar and Stefan-ski 2010). Severe changes in climatic and weather condi-tions, rapid sea-level rise (SLR), storm surge, temperature fluctuations and irregular rainfall trends have increased coastal vulnerability problems in the majority of coastal regions across the globe, resulting in huge losses of coast-lines, properties and damage to coastal communities (Bur-kett 2012; Gupta et al. 2019; Lal 2003; Mimura 2013; Sánchez-Arcilla et al. 2011). Likewise, many coastal states of India suffer severe cyclonic storms leading to flooding. Furthermore, some of these coastal states are particularly highly populated: Maharashtra, West Bengal, Tamil Nadu, Karnataka, Andhra Pradesh, and Gujarat states’ coastal communities have been highly impacted by climate change and cyclones (Baig et al. 2020; Kantamaneni et al. 2019; Mazumdar and Paul 2016; Rao et al. 2020a; Rehman et al. 2020). The rapid urbanisation increases the risk of pluvial floods in the coastal areas (Zhang et al. 2018; Zhu et al. 2021, 2015), and the impact of climate change on coastal states is a serious concern.
Tropical cyclones are one of the greatest threats to human life and property even during the initial stages of cyclonic development. In the last 50 years, 1, 942 dis-asters have been identified as tropical cyclones, killing 77,9324 people and causing $1,407.6 billion fiscal destruc-tion across the world (World Meteorological Organisation 2021). Nearly, 630 million people will live below estimated annual flood levels for 2100; 1 hundred million people live below high tide areas globally (Kulp and Strauss 2019), and the number of high intensity global tropical cyclones will likely rise due to anthropogenic global warming in the twenty-first century (GFDL - Geophysical Fluid Dynamics Laboratory 2021). The different downscaling and Multiple Earth System Models (Emanuel 2017, 2021; Irvine et al. 2019; Knutson et al. 2020; Michaelis and Lackmann 2019; Patricola and Wehner 2018; Wehner et al. 2014) forecast that anthropogenic climate change will increase the fre-quency and intensity of the most intense tropical cyclones and amount of rainfall (Irvine et al. 2019). The warmer sea surface temperature has resulted in large stocks of
moisture and the intensification of cyclones which hit land. Over the past 50 years, the number of landfalling hurricanes in the North Atlantic has increased by 94% (Michaelis and Lackmann 2019), and East Asia and North West Pacific have experienced an increasing trend in rapid intensification of tropical cyclones with an escalated cost of destructions (Basconcillo and Moon 2022; Chan et al. 2021; Liu and Chan 2022).
The changes in global sectoral interactions in sev-eral countries due to tropical cyclones over the period of 1990–2015 show that tropical cyclones have a substantial adverse effect on the yearly growth rate of almost all sectors. Damage to productive capital, infrastructure, or buildings can have direct negative consequences and lead to a nega-tive income shock for the entire economy (Kousky 2012). The intensification of tropical cyclones due to global warm-ing exposes more people to it and also intensifies the future cost of climate change (Kunze 2021). The extreme weather events in 2020 caused significant damage to the economies in several countries across the globe particularly in Asian Countries such as China (USS238), India (USS87), and Japan (USS83) (WMO-World Meterological Organisation 2021).
The Indian Ocean area is one of the 6 most prone cyclone areas in the world with five to six cyclones on average per year (Sahoo and Bhaskaran 2018). Indian coastal regions with low-lying terrain, high population density, frequent cyclones and storms, and a high rate of coastal environ-mental degradation lead to many disasters and extreme vul-nerability for the coastal states. In the Indian region, more cyclones occur in the Bay of Bengal than in the Arabian Sea at a ratio of 4:1(Rao et al. 2020b). Many different types of coastal ecosystems can be found along the Indian coast-line, i.e. coastal wetlands, major estuaries, lagoons, and mangroves. Total coastal wetland covers 43, 230 km2 of the coastal states; 97 major estuaries and 34 major lagoons are found throughout the study area; 31 mangrove areas are located on the coastline and total mangrove areas covered 6740 km2, where 57% of mangrove areas are situated the East coast, and 23% of the area covered along the West coast and 20% of the mangroves area is located at the Anda-man and Nicobar Islands (Central Marine Fisheries Research Institute 2021). The coastal states have tropical climates and monsoons with a dry and rainy season. The rains are more or less intense and long-lasting depending on the area (Nandargi and Mulye 2012).
Frequent occurrence of cyclones is very common in the Indian coast and causes heavy damage resulting from the effects of storm surges and high tides (Rao et al. 2020b; Shaji et al. 2014; Unnikrishnan et al. 2006). Estimated sea-level projections for future years and centuries indicate the potential exposure of the coastal population to the various hazards; coastal planning is vital for further improvement

Arab J Geosci (2022) 15:814
1 3
Page 3 of 15 814
of adaption strategies. Additionally, three megacities are located on the Indian coastline, i.e. Mumbai, Kolkata, and Chennai, and some growing cities with millions of inhabit-ants are at high risk. Furthermore, the impact of climate change is reflected in sea surface temperatures and tropical storm characteristics which are increasing every year. India (coastal cities) has been chosen as a research area as one of the tropical countries in South Asia; however, the exist-ing literature was not sufficient to fully understand these events’ trends in coastal areas from diverse perspectives. Therefore, the current study examines climate change and cyclone trends in 9 coastal states. Also, this research address the UN-SDG (United Nations Sustainability Goal) 13 (cli-mate change) by doing the above mentioned assessments in diverse ways. Consequently, this research explains how cli-mate change will be a barrier to achieve SDG 13 in coastal states of India and offer some guidelines to overcome the problem. The changing environment and climatic condi-tions and the increasing number of extreme events (such as frequent floods, droughts, cyclones and other related disas-ters) push millions of people into chronic poverty world-wide. This increases the imbalances in physical, social and economic systems and affects sustainable development. It disturbs various economic activities, including agriculture, food safety and tourism. It threatens the very existence of island counties and coastal cities. Different research find-ings proved the effects of climate vulnerability on vector-borne diseases. Increasing sea surface temperature raises coastal vulnerability. Overall, it has a significant impact on the Sustainable Development Goals (SDGs), which we plan to achieve by 2030. Though SDG 13 focuses on combating climate change and its impacts, and national governments are taking various steps to build climate-change-resilient communities, climate change is still a great challenge and an impediment to achieving all the other SDGs. These results will help for future planning and policy making and efficient sustainable coastal management.
Study area
India is the seventh-largest country in the world by area (3.28 million sq. km) and the second-largest by population (1.3 billion), with 28 states and 8 union territories (Gov-ernment of India 2022). It occupies a significant portion of the South Asian subcontinent, which has nine coastal states and two coastal union territories. These states’ boundaries occupy the Bay of Bengal, the Arabian Sea and the Indian Ocean as shown in Fig. 1. The total length of the coastline is 7, 516.6 km, comprising the mainland with 5, 422.6 km and island territories of 2094 km (Table 1). The exclusive economic zone (the areas identified as economically benefi-cial) is an identified 2.02 × 10⁶ million km2, and three states
include megacities with the largest population pressure, i.e. Maharashtra, West Bengal and Tamil Nadu. The total popu-lation of coastal states and union territories is 560 million, and it comprises 46.2% of the total population (Kumar et al. 2006; Singh 2003). The inland consists of four areas called the plains of the Ganga and the Indus (1), the great mountain zone (2), the desert region (3) and the southern peninsula (4). India is a tropical country with hot to extremely hot weather in summers and dry winters with four main peri-ods per year called winter (December–February), summer (March–June), pre-monsoon season (June–September) and post-monsoon season (October–November) (Government of India 2022). However, significant changes have been recorded in these four seasons — extended hot summers and shortened winters.
According to the NDMA (National Disaster Manage-ment Authority), in 2022, 75% of the Indian coastline is susceptible to cyclones and related hazards. More than 60 districts and > 14% of the coastal states and the population of the union territories are frequently exposed to different levels of cyclones. Though 7% of global cyclones originate in the Arabian Sea and the Bay of Bengal, the impact of cyclones on Indian coastal states is enormous. The geog-raphy of India and the fluctuations in climatic conditions (temperature, rainfall trends, humidity, etc.) are vital factors that lead to an increase in the intensity and frequency of cyclones and in the damage inflicted on the coastal areas of India. Among all natural disasters, cyclones contributed to 15% of the total number of natural disasters that occurred in India between 1999 and 2020, and they rank third after floods and earthquakes (Government of India 2022). Based on these reasons, nine Indian coastal states (excluding two union territories) have been selected for the assessment to offer updated knowledge on climate changes and cyclone trends.
Methodology
Data
The current study adopted the Donnadieu et al. (2017)’s systematic approach to assess climate change and the cyclone trends in Indian coastal states. This systematic approach accumulates all the empirical evidence that is related to corresponding research, and it has been consid-ered the answer to an explicit research question. Besides, the systematic approach method reduces bias and leads to more trustworthy findings for decision-making. Accord-ingly, a systematic approach has been used to assess the trends of climate change and cyclones in a logical order to offer updated knowledge. The present research is an appraisal of historical climatic data (temperature, rainfall

Arab J Geosci (2022) 15:814
1 3
814 Page 4 of 15
and relative humidity) in relation to cyclone intensity. The data was acquired from NASA Power Data Access (https:// power. larc. nasa. gov/ data- access- viewer/) and NASA Langley Research Center. Temperature and humidity were measured 2 m above the surface. Correspondingly, the data about cyclones (Table 1) was gathered from IMD E-atlas, the Indian Meteorological Department, and was divided into three categories based on the intensity (i.e. depres-sions [D], cyclonic storms [CS] and severe cyclonic storms [SCS]). The current study analysed the spatial exhibitions of the cyclone-prone areas and the spatial exhibitions of the cyclonic paths using the ‘Display XY Data’ GIS tools – ArcGIS 10.6. Temperature, rainfall, and humidity data were constructed annually to reveal the in-depth climatic changes of Indian coastal states (Table 2).
Analysis
The study categorised the cyclones into three types based upon the intensity derived from the criteria-based classifica-tion, Indian Meteorological Department, such as cyclonic storms and severe cyclonic storms (Fig. 2). Moreover, the climatic data was calculated year-wise from 2006 to 2020, which was considered an average for each year. In addition, spatial and temporal analysis was accomplished using the choropleth method using ArcGIS 10.6 software. Spatial rep-resentations into four categories based on numerical values on the chronological order using the natural breaking tool in ArcGIS 10.6 were created; the units of measurement of the climatic data includes rainfall (mm), temperature (°C) and humidity (%). The study reveals the impacts of climate
Fig. 1 Map of the case study area: Indian coastal states
Arab J Geosci (2022) 15:814
1 3
Page 5 of 15 814
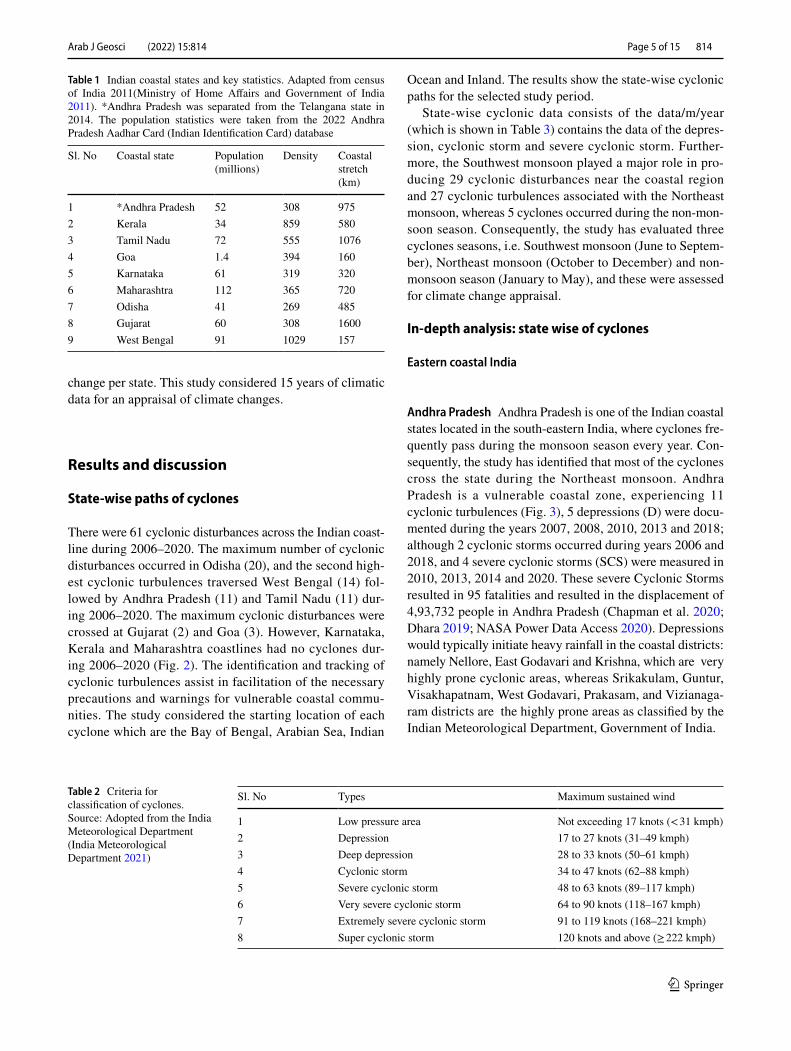
change per state. This study considered 15 years of climatic data for an appraisal of climate changes.
Results and discussion
State‑wise paths of cyclones
There were 61 cyclonic disturbances across the Indian coast-line during 2006–2020. The maximum number of cyclonic disturbances occurred in Odisha (20), and the second high-est cyclonic turbulences traversed West Bengal (14) fol-lowed by Andhra Pradesh (11) and Tamil Nadu (11) dur-ing 2006–2020. The maximum cyclonic disturbances were crossed at Gujarat (2) and Goa (3). However, Karnataka, Kerala and Maharashtra coastlines had no cyclones dur-ing 2006–2020 (Fig. 2). The identification and tracking of cyclonic turbulences assist in facilitation of the necessary precautions and warnings for vulnerable coastal commu-nities. The study considered the starting location of each cyclone which are the Bay of Bengal, Arabian Sea, Indian
Ocean and Inland. The results show the state-wise cyclonic paths for the selected study period.
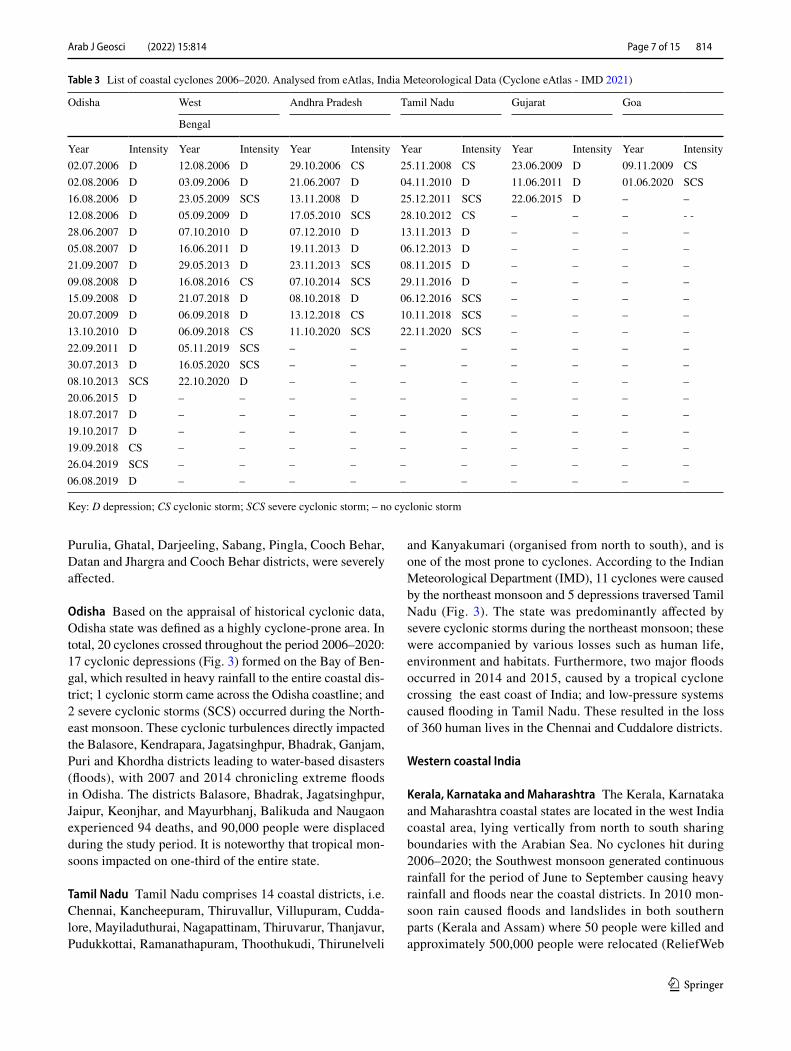
State-wise cyclonic data consists of the data/m/year (which is shown in Table 3) contains the data of the depres-sion, cyclonic storm and severe cyclonic storm. Further-more, the Southwest monsoon played a major role in pro-ducing 29 cyclonic disturbances near the coastal region and 27 cyclonic turbulences associated with the Northeast monsoon, whereas 5 cyclones occurred during the non-mon-soon season. Consequently, the study has evaluated three cyclones seasons, i.e. Southwest monsoon (June to Septem-ber), Northeast monsoon (October to December) and non-monsoon season (January to May), and these were assessed for climate change appraisal.
In‑depth analysis: state wise of cyclones
Eastern coastal India
Andhra Pradesh Andhra Pradesh is one of the Indian coastal states located in the south-eastern India, where cyclones fre-quently pass during the monsoon season every year. Con-sequently, the study has identified that most of the cyclones cross the state during the Northeast monsoon. Andhra Pradesh is a vulnerable coastal zone, experiencing 11 cyclonic turbulences (Fig. 3), 5 depressions (D) were docu-mented during the years 2007, 2008, 2010, 2013 and 2018; although 2 cyclonic storms occurred during years 2006 and 2018, and 4 severe cyclonic storms (SCS) were measured in 2010, 2013, 2014 and 2020. These severe Cyclonic Storms resulted in 95 fatalities and resulted in the displacement of 4,93,732 people in Andhra Pradesh (Chapman et al. 2020; Dhara 2019; NASA Power Data Access 2020). Depressions would typically initiate heavy rainfall in the coastal districts: namely Nellore, East Godavari and Krishna, which are very highly prone cyclonic areas, whereas Srikakulam, Guntur, Visakhapatnam, West Godavari, Prakasam, and Vizianaga-ram districts are the highly prone areas as classified by the Indian Meteorological Department, Government of India.
Table 1 Indian coastal states and key statistics. Adapted from census of India 2011(Ministry of Home Affairs and Government of India 2011). *Andhra Pradesh was separated from the Telangana state in 2014. The population statistics were taken from the 2022 Andhra Pradesh Aadhar Card (Indian Identification Card) database
Sl. No Coastal state Population (millions)
Density Coastal stretch (km)
1 *Andhra Pradesh 52 308 9752 Kerala 34 859 5803 Tamil Nadu 72 555 10764 Goa 1.4 394 1605 Karnataka 61 319 3206 Maharashtra 112 365 7207 Odisha 41 269 4858 Gujarat 60 308 16009 West Bengal 91 1029 157
Table 2 Criteria for classification of cyclones. Source: Adopted from the India Meteorological Department (India Meteorological Department 2021)
Sl. No Types Maximum sustained wind
1 Low pressure area Not exceeding 17 knots (< 31 kmph)2 Depression 17 to 27 knots (31–49 kmph)3 Deep depression 28 to 33 knots (50–61 kmph)4 Cyclonic storm 34 to 47 knots (62–88 kmph)5 Severe cyclonic storm 48 to 63 knots (89–117 kmph)6 Very severe cyclonic storm 64 to 90 knots (118–167 kmph)7 Extremely severe cyclonic storm 91 to 119 knots (168–221 kmph)8 Super cyclonic storm 120 knots and above (≥ 222 kmph)

Arab J Geosci (2022) 15:814
1 3
814 Page 6 of 15
West Bengal The coastline of West Bengal consists of two coastal districts, i.e. Midnapur and South Parganas dis-trict, and it encompasses the Sundarbans mangrove eco-system (Zhang et al. 2021). Fourteen cyclones traversed through West Bengal (Fig. 3); 9 cyclonic disturbances provided the lowest impacts on coastal districts, and 3 cyclonic turbulences created the largest impacts. In addi-tion, 2 cyclonic storms traversed through West Bengal,
and 3 severe cyclonic storms crossed, which created a high impact on humans and the environment as these cyclones lead to torrential rain. The resulted in a total of 138 fatali-ties and displacement of 8,38,000 people in the state (Ehrnsten et al. 2019; Serpetti et al. 2017). These cyclonic turbulences had major impacts on Kolkata and several districts, Sabang, North and South 24 Parganas, East and West Midnapore, Bankura, Howrah, Burdwan, Hoogly,
Fig. 2 Number of crossed cyclones thorough the coastal states for 2006–2020
Arab J Geosci (2022) 15:814
1 3
Page 7 of 15 814
Purulia, Ghatal, Darjeeling, Sabang, Pingla, Cooch Behar, Datan and Jhargra and Cooch Behar districts, were severely affected.
Odisha Based on the appraisal of historical cyclonic data, Odisha state was defined as a highly cyclone-prone area. In total, 20 cyclones crossed throughout the period 2006–2020: 17 cyclonic depressions (Fig. 3) formed on the Bay of Ben-gal, which resulted in heavy rainfall to the entire coastal dis-trict; 1 cyclonic storm came across the Odisha coastline; and 2 severe cyclonic storms (SCS) occurred during the North-east monsoon. These cyclonic turbulences directly impacted the Balasore, Kendrapara, Jagatsinghpur, Bhadrak, Ganjam, Puri and Khordha districts leading to water-based disasters (floods), with 2007 and 2014 chronicling extreme floods in Odisha. The districts Balasore, Bhadrak, Jagatsinghpur, Jaipur, Keonjhar, and Mayurbhanj, Balikuda and Naugaon experienced 94 deaths, and 90,000 people were displaced during the study period. It is noteworthy that tropical mon-soons impacted on one-third of the entire state.
Tamil Nadu Tamil Nadu comprises 14 coastal districts, i.e. Chennai, Kancheepuram, Thiruvallur, Villupuram, Cudda-lore, Mayiladuthurai, Nagapattinam, Thiruvarur, Thanjavur, Pudukkottai, Ramanathapuram, Thoothukudi, Thirunelveli
and Kanyakumari (organised from north to south), and is one of the most prone to cyclones. According to the Indian Meteorological Department (IMD), 11 cyclones were caused by the northeast monsoon and 5 depressions traversed Tamil Nadu (Fig. 3). The state was predominantly affected by severe cyclonic storms during the northeast monsoon; these were accompanied by various losses such as human life, environment and habitats. Furthermore, two major floods occurred in 2014 and 2015, caused by a tropical cyclone crossing the east coast of India; and low-pressure systems caused flooding in Tamil Nadu. These resulted in the loss of 360 human lives in the Chennai and Cuddalore districts.
Western coastal India
Kerala, Karnataka and Maharashtra The Kerala, Karnataka and Maharashtra coastal states are located in the west India coastal area, lying vertically from north to south sharing boundaries with the Arabian Sea. No cyclones hit during 2006–2020; the Southwest monsoon generated continuous rainfall for the period of June to September causing heavy rainfall and floods near the coastal districts. In 2010 mon-soon rain caused floods and landslides in both southern parts (Kerala and Assam) where 50 people were killed and approximately 500,000 people were relocated (ReliefWeb
Table 3 List of coastal cyclones 2006–2020. Analysed from eAtlas, India Meteorological Data (Cyclone eAtlas - IMD 2021)
Key: D depression; CS cyclonic storm; SCS severe cyclonic storm; – no cyclonic storm
Odisha West Andhra Pradesh Tamil Nadu Gujarat Goa
Bengal
Year Intensity Year Intensity Year Intensity Year Intensity Year Intensity Year Intensity02.07.2006 D 12.08.2006 D 29.10.2006 CS 25.11.2008 CS 23.06.2009 D 09.11.2009 CS02.08.2006 D 03.09.2006 D 21.06.2007 D 04.11.2010 D 11.06.2011 D 01.06.2020 SCS16.08.2006 D 23.05.2009 SCS 13.11.2008 D 25.12.2011 SCS 22.06.2015 D – –12.08.2006 D 05.09.2009 D 17.05.2010 SCS 28.10.2012 CS – – – - -28.06.2007 D 07.10.2010 D 07.12.2010 D 13.11.2013 D – – – –05.08.2007 D 16.06.2011 D 19.11.2013 D 06.12.2013 D – – – –21.09.2007 D 29.05.2013 D 23.11.2013 SCS 08.11.2015 D – – – –09.08.2008 D 16.08.2016 CS 07.10.2014 SCS 29.11.2016 D – – – –15.09.2008 D 21.07.2018 D 08.10.2018 D 06.12.2016 SCS – – – –20.07.2009 D 06.09.2018 D 13.12.2018 CS 10.11.2018 SCS – – – –13.10.2010 D 06.09.2018 CS 11.10.2020 SCS 22.11.2020 SCS – – – –22.09.2011 D 05.11.2019 SCS – – – – – – – –30.07.2013 D 16.05.2020 SCS – – – – – – – –08.10.2013 SCS 22.10.2020 D – – – – – – – –20.06.2015 D – – – – – – – – – –18.07.2017 D – – – – – – – – – –19.10.2017 D – – – – – – – – – –19.09.2018 CS – – – – – – – – – –26.04.2019 SCS – – – – – – – – – –06.08.2019 D – – – – – – – – – –

Arab J Geosci (2022) 15:814
1 3
814 Page 8 of 15
2021). In 2018, Kerala was severely affected by high rain-fall for all of its 14 districts, namely Alappuzha, Kasara-god, Wayanad, Kannur, Kozhikode, Malappuram, Palakkad, Ernakulam, Thrissur, Idukki, Kottayam, Pathanamthitta, Kollam and Thiruvananthapuram. Moreover, water was released from multiple dam reservoirs, and deaths were
documented at 359 with 7 people missing. In 2009, heavy monsoon rain caused flash floods, the states Andhra Pradesh, Karnataka and Kerala were severely affected by the floods, and many places saw exceptional monsoon rainfall, severe river flooding and landslides affecting west coast areas and southern provinces.
Fig. 3 The number of cyclones occurring in nine Indian coastal states for 2006–2020

Arab J Geosci (2022) 15:814
1 3
Page 9 of 15 814
Goa and Gujarat The state of Goa is divided into north and south administrative districts. Goa suffered 2 cyclonic dis-turbances (Fig. 3), crossing the Goa and Konkan regions during 2006–2020. Bicholim, Sattari, Ponda, Canacona and Sanguem areas were affected by floods, and Pernem, Bardez, Tiswadi, Salcete, Mormugao and the Canacona regions were affected by coastal erosion. During this period, 3 depressions crossed Gujarat caused by the southwest monsoon (June), and most of the coastal districts were affected by heavy mon-soon rainfall. In 2007, monsoon flooding harshly affected and/or damaged most of the regions, i.e. Saurashtra region, Surendranagar, Rajkot, Bhavnagar, Jamnagar, Junagadh and Amreli; in South Gujarat, Bharuch, Narmada, Surat, Juna-garh, Patan, Mehsana, Gandhinagar and Sabarkantha; and in the Kutch region, Vadodara, Ahmedabad, Anand, Panchma-hal, Daskroi, Dholka, Valsad and Kheda.
Climate change and data analysis
The research appraised the impacts of climate change on the coastal states from the east to west coast, i.e. West Bengal, Odisha, Andhra Pradesh, Tamil Nadu, Kerala, Karnataka, Goa, Maharashtra and Gujarat using the empirical climate data. These states measured climate change aspects from 2006 to 2020. The study revealed average temperature, average rainfall and average humidity for the selected study period. The result identified that Tamil Nadu and Gujarat had the highest temperatures 29.3 and 29.0 °C, and the low-est temperatures were in West Bengal and Odisha 26.7 and 27.5 °C. Kerala and Karnataka states recorded the highest average rainfall of 2341 and 2261 mm. Conversely, Odisha and Tamil Nadu states had the lowest rainfall levels of 994 and 1075 mm from 2006 to 2020. Kerala and Karnataka states had the highest humidity of 78.11 and 76.57 per-cent, whilst Gujarat and West Bengal states recorded the lowest humidity of approximately 59.65 and 70.78°. The
overall appraisal of climatic data identifies the Kerala and Karnataka states as being highly affected by climate change (Table 4).
Temperature
The study considered climatic parameters such as tem-perature, rainfall and humidity which was calculated as an average for each year from 2006 to 2020 (Fig. 4). West Bengal experienced the highest average temperature documented at 25.96 °C in 2015, and the lowest aver-age temperature identified at 25.32 °C in 2008. Odisha’s average temperature was recorded at 27.17 °C in 2009, whereas the lowest temperature noted at 26.10 °C in the year 2020. Andhra Pradesh’s highest average temperature was recorded at 27.83 °C in 2009, and the lowest aver-age temperature documented as 27.05 °C in 2007. Tamil Nadu highest average temperature was 35.62 °C in 2019, and their lowest average temperature was documented at 27.27 °C in 2020. Kerala’s highest average temperature was 27.41 °C in 2019, while the lowest average tempera-ture measured 26.50 °C in 2008. Karnataka’s maximum average temperature of 27.06 °C was in 2019, and their minimum average temperature measured 25.35 °C in 2007. The smallest state of Goa recorded their maximum aver-age temperature of 27.58 °C in 2020 and lowest average temperature of 27.10 °C in 2011. Maharashtra’s highest average temperature hit 27.66 °C in 2011, and their low-est average temperature measured 27.26 °C in 2007. The maximum temperature of Gujarat was 28.30 °C in 2015, and their lowest average temperature was 27.4 °C in 2013. However, whilst the distribution of average temperatures varies throughout the study period, the maximum average temperature overall was found in Tamil Nadu. Tropical cyclones form based upon intensifying temperatures in oceanic regions. This is also related to greenhouse gas
Table 4 Climatic data appraisal 2006–2020. Analysed from NASA Power Data Access (NASA Power Data Access 2020)
Sl. No Coastal states Average Changes 2006–2020
Temperature (°C)
Precipitation (mm)
Relative humid-ity (%)
Temperature (°C) Precipitation (mm 2006–2020)
Relative humidity (%)
1 West Bengal 26.7 1597 70.78 − 0.60 330 4.72 Odisha 27.5 1593 72.05 − 0.34 − 145 2.53 Andhra Pradesh 28.4 1191 71.87 0.14 226 1.74 Tamil Nadu 29.3 1075 75.35 0.71 − 285 -2.05 Kerala 27.9 2341 78.11 0.78 − 556 -1.26 Karnataka 27.7 2261 76.57 − 0.64 1072 -1.67 Goa 28.4 1383 75.14 0.43 602 0.78 Maharashtra 28.0 2210 70.28 0.22 − 111 1.09 Gujarat 29.0 994 59.65 − 0.29 188 2.8

Arab J Geosci (2022) 15:814
1 3
814 Page 10 of 15
(GHG)-induced surface temperature increase. Further-more, the world meteorological organization (WMO) global level appraisal (Knutson et al., 2020) concluded that tropical cyclones are extremely unusual compared with other natural causes.
Rainfall
The appraisal of average rainfall in Indian coastal states dates from 2006 to 2020 (Fig. 5), and the study describes the max-imum and minimum rainfall for each state. West Bengal’s maximum average rainfall observed 2080 mm in the year
Fig. 4 Average temperatures 2006–2020

Arab J Geosci (2022) 15:814
1 3
Page 11 of 15 814
2017 and minimum average rainfall measured at 1197 mm in 2012. Odisha’s maximum average rainfall was 1913 mm in 2018, with a minimum average rainfall of 1317 mm in 2009. Andhra Pradesh recorded their highest average rain-fall of 1682 mm in 2010 and lowest rainfall of 865 mm in 2009. Tamil Nadu observed their highest average rainfall of 1515 mm in 2015 and lowest average rainfall of 796 mm in
2012. Kerala measured their highest rainfall of 2960 mm in 2006 and lowest rainfall of 1691 mm in 2012. Karnataka observed their highest average rainfall of 3044 mm in 2020 and in 2008 their lowest rainfall of 1848 mm. Goa meas-ured their maximum average rainfall of 1915 mm in 2019 and minimum average rainfall of 1131 mm in 2008. A high-est average rainfall for Maharashtra was 2713 mm in 2006
Fig. 5 Average rainfall 2006–2020

Arab J Geosci (2022) 15:814
1 3
814 Page 12 of 15
and lowest average rainfall of 1464 mm in 2015. Gujarat received their highest average rainfall of 1349 mm in 2007 and their lowest average rainfall of 693 mm in 2018. The highest distribution of average rainfall was dispersed across the states. Most of the states, i.e. Odisha, Tamil Nadu and Kerala states, received the lowest average rainfalls, particu-larly in the year 2012, when the monsoon failed to arrive.
Humidity
The humidity is recorded during the study period as a state-wide quantity representing the amount of water vapour in the atmosphere as an average distribution. The highest average humidity was measured in West Bengal at 75.04% in 2020 (Fig. 6), and their lowest humidity was measured
Fig. 6 Average relative humidity 2006–2020

Arab J Geosci (2022) 15:814
1 3
Page 13 of 15 814
at 68.06% in 2012. Odisha’s highest average humidity was recorded at 75.4% in 2020 and their lowest humidity meas-ured 69.0% in 2009. Andhra Pradesh’s extreme humidity was 74.3% in 2020, while their lowest humidity was 69.3 in 2009. The highest average humidity measured at Tamil Nadu was 76.9% in 2006, and their lowest was 72.0% in 2016. Kerala recorded their highest value of humidity at 79.2% in 2006 and lowest value of 76.8 in 2019. The highest humidity measured in Karnataka was 79.7% in 2006, and the low-est was 74.6 in 2007. Goa’s maximum humidity was 76.9% in 2010, and the lowest was 74.1% in 2015. Maharashtra’s highest humidity at 72.7% in 2010 and lowest humidity was 67.5% in 2018. Gujarat’s highest humidity was 64.0% in 2020, and the lowest was 54.7% in 2018. The study revealed the West Bengal, Odisha, Andhra Pradesh and Gujarat states experienced the highest humidity, particularly the year 2020.
In the overall assessment of temperatures, rainfall and humidity, the study identified that the temperature increased in Kerala (0.78 °C) and Tamil Nadu (0.71 °C), whereas in Karnataka (− 0.64 °C) and West Bengal (− 0.60 °C) the temperature decreased. Karnataka (1072 mm) and Goa (605 mm) states received the highest rainfall. Kerala (− 556 mm) and Tamil Nadu (− 285 mm) states rainfall decreased from 2006 to 2020. West Bengal’s (4.7%) and Gujarat’s (2.8%) humidity increased; Tamil Nadu (− 2.0%) and Karnataka (− 1.6%) observed decreased humidity from 2006 to 2020. Therefore, the overall appraisal noted that the highest changes were documented in Karnataka and Kerala, and the results indicate these states are acquiring rapid cli-matic changes, with the rest of the coastal states experienc-ing no change, based on the appraisal of climatic data.
Overall trends of climate change and cyclones in Indian coastal states
Climate change and fluctuations in the climate are the major challenges for sustainable coastal zone management across India and also barriers to achieving the UN SDG 13. This study evaluated the climatic data for the past 15 years, iden-tifying the impacts of climate change on coastal states and revealing that the climate is changing for most of the coastal states with Karnataka, Goa, Kerala, Tamil Nadu, West Ben-gal and Andhra Pradesh experiencing increasing or decreas-ing temperatures, abnormal rainfall and humid conditions. As a result of these climate changes, increasing sea level rises (1.7 mm/year) is contributing to other challenges including habitat loss, degradation of coastlines and coastal ecosystems and shoreline changes. Furthermore, climate change is exacerbating coastal erosion within this short time period, leading to coastal area flooding and seawater intru-sion. West Bengal suffered the largest proportion of erosion between 1989 and 2001, with alteration along 70% of its
coast, followed by Kerala (65%), Gujarat (60%) and Odisha (50%). Sea-level rise and floods may cause greater evacua-tion in major coastal cities, in addition to the displacement of people along the eastern coast (Dhara 2019). These afore-mentioned issues are impacting on the Indian coastal states. Cyclones are a natural disaster that strike India almost every year, claiming many lives and wreaking havoc on property. Based upon historic cyclonic data from 2006 to 2020, the study reveals that Tamil Nadu, Andhra Pradesh, Odisha and West Bengal states are severely affected by cyclones dur-ing the northeast monsoon. The state of Gujarat is highly vulnerable to tropical cyclones every year by the southwest monsoon. In recent years, cyclonic intensity has been very high and damaged the human and coastal environment.
The direct impact of climate change to the coastal area is also from heavy rains, unbearably high temperatures, humid-ity, etc. (Chapman et al. 2020; Zhang et al. 2021). These studies have demonstrated the vulnerability of the coastal area and reveal the impacts of climate change on coastal states (Serpetti et al. 2017). A large number of drivers, such as cyclones and floods, are closely associated with climate change (Ehrnsten et al. 2019). This study has been under-taken in coastal states affected by climatic factors such as cyclone, temperature, rainfall and humidity. The study shows the influence of climate change to the coastal states of India. In addition, this should identify the natural hazards deter-mined by climate change and associated human stress in these coastal states. Adaptation to climate change must be implemented for resilience to future disasters as well as to achieve UN-SDG 13.
The study limitations
This study focused on the appraisal of climate change in Indian coastal states where the climatic data was available from 2006 to 2020. Consequently, the analysis is limited to the study duration, and it is not focused on the wider trends of climate change and water-based disasters such as flood and landslide. Furthermore, due to time constraints, the study did not evaluate the impacts of climate change on human health. While the researchers took this into consid-eration during the conception of the present study, it was not possible to achieve that goal on time.
Conclusions
Climate change (temperature, rainfall and humidity) and cyclones are some of the world’s most destructive issues and often lead to destruction in South Asia, particularly India. The regular occurrence of cyclones is widespread in the Indian coastal states and causes significant damage
Arab J Geosci (2022) 15:814
1 3
814 Page 14 of 15
resulting from the effect of storm surges and high tides. To improve information regarding these issues, the current study has assessed the climate change and cyclone trends in nine coastal states of India from 2006 to 2020 by using GIS tools, NASA and the IMD E-atlas and Indian Meteorological Data. The study identified that there has been a rise in high-intensity cyclones during the study period. Odisha and West Bengal are the most cyclone-prone states, and Maharash-tra, Kerala and Karnataka are the least prone states, though Kerala and Karnataka states recorded the highest average rainfall and highest humidity. The highest average tempera-ture was recorded in Tamil Nadu and Gujarat, and the low-est temperature was recorded in West Bengal and Odisha, although these two states have the highest cyclone vulner-ability. These trends once again raise the urgency of further investigations on the relationship between climate change and cyclone activities. The GIS maps, generated from the study results, help to identify the intensity of climate change and cyclones state-wise. The study results also help policy and decision-makers to progress and improve effective strat-egies for sustainable coastal management. Also, these results help towards achieving one of the goals of the UN-SDG 13 (climate change), which further helps to improve the sustain-ability of coastal management in Indian coastal regions and also people’s lives.
Acknowledgements The authors are grateful to the Indian Mete-orological Department (IMD) and NASA Langley Research Center (LaRC) POWER Project funded through the NASA Earth Science/Applied Science Program for providing cyclones and climatic data used in this study.
Declarations
Conflict of interest The authors declare competing interests.
Open Access This article is licensed under a Creative Commons Attri-bution 4.0 International License, which permits use, sharing, adapta-tion, distribution and reproduction in any medium or format, as long as you give appropriate credit to the original author(s) and the source, provide a link to the Creative Commons licence, and indicate if changes were made. The images or other third party material in this article are included in the article's Creative Commons licence, unless indicated otherwise in a credit line to the material. If material is not included in the article's Creative Commons licence and your intended use is not permitted by statutory regulation or exceeds the permitted use, you will need to obtain permission directly from the copyright holder. To view a copy of this licence, visit http:// creat iveco mmons. org/ licen ses/ by/4. 0/.
References
Baig MRI, Ahmad IA, Shahfahad, Tayyab M, Rahman A (2020) Analysis of shoreline changes in Vishakhapatnam coastal tract of Andhra Pradesh, India: an application of digital shoreline analysis system (DSAS). Ann GIS 26:361–376
Basconcillo J, Moon I-J (2022) Increasing activity of tropical cyclones in East Asia during the mature boreal autumn linked to long-term climate variability npj Climate and Atmospheric. Science 5:1–11
Bouwer LM (2011) Have disaster losses increased due to anthropogenic climate change? Bull Am Meteor Soc 92:39–46
Burkett V (2012) Coastal impacts, adaptation, and vulnerabilities. Springer
Central Marine Fisheries Research Institute (2021) Thrust areas of research. Indian Counicl of Agricultural Research https:// www. cmfri. org. in/ divis ion/ biodi versi ty. Accessed 10 Jun 2021
Chan FKS et al (2021) Urban flood risks and emerging challenges in a Chinese delta: the case of the Pearl River Delta. Environ Sci Policy 122:101–115
Chapman EJ, Byron CJ, Lasley-Rasher R, Lipsky C, Stevens JR, Peters R (2020) Effects of climate change on coastal ecosys-tem food webs: implications for aquaculture. Mar Environ Res 162:105103
Cyclone eAtlas - IMD (2021) Tracks of cyclones and depressions over North Indian Ocean (from 1891 onwards). E-Atlas- India Meteorological Data. http:// 14. 139. 191. 203/ About EAtlas. aspx. Accessed 10 Jul 2021
DasGupta R, Shaw R (2013) Cumulative impacts of human interven-tions and climate change on mangrove ecosystems of South and Southeast Asia: an overview. J Ecosyst 2013
Dhara C (2019) West Bengal’s climate change conundrum part III: extraordinarily rapid sea-level rise in sundarbans turns families into refugees. https:// www. accli matise. uk. com/ 2019/ 03/ 21/ west- benga ls- clima te- change- conun drum- part- iii- extra ordin arily- rapid- sea- level- rise- in- sunda rbans- turns- famil ies- into- refug ees/. Accessed 10 Jul 2021
Donnadieu G, Durand D, Neel D, Nunez E, Saint-Paul L The sys-temic approach: what is it all about? Synthesis of the work con-ducted by the AFSCET group “dissemination of the systemic thinking”,[online document], 2017
Ehrnsten E, Bauer B, Gustafsson BG (2019) Combined effects of envi-ronmental drivers on marine trophic groups–a systematic model comparison. Front Mar Sci 6:492
Emanuel K (2017) Assessing the present and future probability of Hur-ricane Harvey’s rainfall. Proc Natl Acad Sci 114:12681–12684
Emanuel K (2021) Response of global tropical cyclone activity to increasing CO 2: results from downscaling CMIP6 models. J Clim 34:57–70
GFDL - Geophysical Fluid Dynamics Laboratory (2021) Global warm-ing and hurricanes. NOOA. https:// www. gfdl. noaa. gov/ global- warmi ng- and- hurri canes/. Accessed 12 Jun 2021
Government of India (2022) Profile. Government of India. https:// www. india. gov. in/ india- glance/ profi le. Accessed 10 Jan 2022
Gupta S, Jain I, Johari P, Lal M Impact of climate change on tropical cyclones frequency and intensity on Indian coasts. In: Proceed-ings of International Conference on Remote Sensing for Disaster Management, 2019. Springer, pp 359–365
India Meteorological Department (2021) Cyclones. Ministry of Earth Sciences- Government of India. https:// mausam. imd. gov. in/ imd_ latest/ conte nts/ cyclo ne. php. Accessed 08 Jul 2021
Irvine P, Emanuel K, He J, Horowitz LW, Vecchi G, Keith D (2019) Halving warming with idealized solar geoengineering moderates key climate hazards Nature. Clim Change 9:295–299
Kantamaneni K et al (2019) A systematic review of coastal vulner-ability assessment studies along Andhra Pradesh, India: a critical evaluation of data gathering, risk levels and mitigation strategies. Water 11:393
Knutson T et al (2020) Tropical cyclones and climate change assess-ment: Part II: projected response to anthropogenic warming. Bull Am Meteor Soc 101:E303–E322

Arab J Geosci (2022) 15:814
1 3
Page 15 of 15 814
Kousky C (2012) Informing climate adaptation: a review of the eco-nomic costs of natural disasters, their determinants, and risk reduction options Resources for the future discussion paper
Kulp SA, Strauss BH (2019) New elevation data triple estimates of global vulnerability to sea-level rise and coastal flooding. Nat Commun 10:1–12
Kumar VS, Pathak K, Pednekar P, Raju N, Gowthaman R (2006) Coastal processes along the Indian coastline. Curr Sci 530–536
Kunze S (2021) Unraveling the effects of tropical cyclones on eco-nomic sectors worldwide: direct and indirect impacts. Environ Resource Econ 78:545–569
Lal M (2003) Global climate change: India’s monsoon and its vari-ability. J Environ Stud Policy 6:1–34
Liu KS, Chan JC (2022) Growing threat of rapidly-intensifying tropical cyclones in East Asia. Adv Atmos Sci 39:222–234
Mazumdar J, Paul SK (2016) Socioeconomic and infrastructural vul-nerability indices for cyclones in the eastern coastal states of India. Nat Hazards 82:1621–1643
Michaelis AC, Lackmann GM (2019) Climatological changes in the extratropical transition of tropical cyclones in high-resolution global simulations. J Clim 32:8733–8753
Mimura N (2013) Sea-level rise caused by climate change and its impli-cations for society. Proc Jpn Acad Ser B 89:281–301
Ministry of Home Affairs, Government of India (2011) 2011 census data. Government of India. https:// censu sindia. gov. in/ 2011- com-mon/ censu sdata 2011. html. Accessed 10 May 2021
Mirza MMQ (2003) Climate change and extreme weather events: can developing countries adapt? Climate Policy 3:233–248
Nandargi S, Mulye S (2012) Relationships between rainy days, mean daily intensity, and seasonal rainfall over the Koyna catchment during 1961–2005. Sci World J
NASA Power Data Access (2020) Data Access Viewer (DAV) NASA. https:// power. larc. nasa. gov/ data- access- viewer/. Accessed 10 Jul 2021
Nath PK, Behera B (2011) A critical review of impact of and adapta-tion to climate change in developed and developing economies. Environ Dev Sustain 13:141–162
Patel SK, Mathew B, Nanda A, Mohanty B, Saggurti N (2020) Voices of rural people: community-level assessment of effects and resil-ience to natural disasters in Odisha, India. Int J Popul Stud 6:3–15
Patricola CM, Wehner MF (2018) Anthropogenic influences on major tropical cyclone events. Nature 563:339–346
Rao A, Upadhaya P, Ali H, Pandey S, Warrier V (2020a) Coastal inun-dation due to tropical cyclones along the east coast of India: an influence of climate change impact. Nat Hazards 101:39–57
Rao A, Upadhaya P, Pandey S, Poulose J (2020b) Simulation of extreme water levels in response to tropical cyclones along the Indian coast: a climate change perspective. Nat Hazards 100:151–172
Rehman S, Sahana M, Kumar P, Ahmed R, Sajjad H (2020) Assessing hazards induced vulnerability in coastal districts of India using site-specific indicators: an integrated approach. Geo J :1–22
ReliefWeb (2021) India: Floods-Jul 2010. https:// relie fweb. int/ disas ter/ fl- 2010- 000125- ind. Accessed 10 December 2021
Sahoo B, Bhaskaran PK (2018) Multi-hazard risk assessment of coastal vulnerability from tropical cyclones–a GIS based approach for the Odisha coast. J Environ Manag 206:1166–1178
Sánchez-Arcilla A, Mösso C, Sierra JP, Mestres M, Harzallah A, Seno-uci M, El Raey M (2011) Climatic drivers of potential hazards in Mediterranean coasts. Reg Environ Change 11:617–636
Serpetti N, Baudron AR, Burrows M, Payne BL, Helaouet P, Fernandes PG, Heymans J (2017) Impact of ocean warming on sustainable fisheries management informs the Ecosystem Approach to Fisher-ies. Sci Rep 7:1–15
Shaji C, Kar S, Vishal T (2014) Storm surge studies in the North Indian Ocean: a review
Singh H (2003) Marine protected areas in IndiaSivakumar MV, Stefanski R (2010) Climate change in South Asia.
In: Climate change and food security in South Asia. Springer, pp 13–30
Thomalla F, Schmuck H (2004) ‘We all knew that a cyclone was com-ing’: disaster preparedness and the cyclone of 1999 in Orissa, India. Disasters 28:373–387
Unnikrishnan A, Kumar KR, Fernandes SE, Michael G, Patwardhan S (2006) Sea level changes along the Indian coast: observations and projections. Curr Sci 362–368
Wehner MF et al (2014) The effect of horizontal resolution on simula-tion quality in the C ommunity a tmospheric M odel, CAM 5.1. J Adv Model Earth Syst 6:980–997
WMO-World Meterological Organisation (2021) State of the climate in Asia. WMO. https:// libra ry. wmo. int/ doc_ num. php? expln um_ id= 10867. Accessed 12 Feb 2022
World Meteorological Organisation (2021) Tropical cyclones. https:// public. wmo. int/ en/ our- manda te/ focus- areas/ natur al- hazar ds- and- disas ter- risk- reduc tion/ tropi cal- cyclo nes. Accessed 13 Jul 2021
Yadav DK, Barve A (2017) Analysis of socioeconomic vulnerability for cyclone-affected communities in coastal Odisha, India. Int J Disast Risk Reduct 22:387–396
Zhang W, Villarini G, Vecchi GA, Smith JA (2018) Urbanization exac-erbated the rainfall and flooding caused by hurricane Harvey in Houston. Nature 563:384–388
Zhang Y, Wu T, Arkema KK, Han B, Lu F, Ruckelshaus M, Ouyang Z (2021) Coastal vulnerability to climate change in China’s Bohai Economic Rim. Environ Int 147:106359
Zhu L, Emanuel K, Quiring SM (2021) Elevated risk of tropical cyclone precipitation and pluvial flood in Houston under global warming. Environ Res Lett 16:094030
Zhu L, Quiring SM, Guneralp I, Peacock WG (2015) Variations in tropical cyclone-related discharge in four watersheds near Hou-ston, Texas. Clim Risk Manag 7:1–10
Copyright © 2022 FDOKUMEN