Applying multi-correlation for improving forecasting in cyber security
8
Applying Multi-Correlation for Improving Forecasting in Cyber Security Elvis Pontes, Adilson E. Guelfi, Sérgio T. Kofuji Laboratory of Integrated Systems of the Polytechnic School at University of São Paulo (EPUSP) São Paulo, Brazil [email protected], [email protected], [email protected] Anderson A. A. Silva, Adilson E. Guelfi Institute of Technological Research of São Paulo (IPT) São Paulo, Brazil [email protected] Abstract—Currently, defense of the cyber space is mostly based on detection and/or blocking of attacks (Intrusion Detection and Prevention System - IDPS). But, a significant improvement for IDPS is the employment of forecasting techniques in a Distributed Intrusion Forecasting System (DIFS), which enables the capability for predicting attacks. Notwithstanding, during our earlier works, one of the issues we have faced was the huge amount of alerts produced by IDPS, several of them were false positives. Checking the veracity of alerts through other sources (multi-correlation), e.g. logs taken from the operating system (OS), is a way of reducing the number of false alerts, and, therefore, improving data (historical series) to be used by the DIFS. The goal of this paper is to propose a two stage system which allows: (1) employment of an Event Analysis System (EAS) for making multi-correlation between alerts from an IDPS with the OS’ logs; and (2) applying forecasting techniques on data generated by the EAS. Tests applied on laboratory by the use of the two stage system allow concluding about the improvement of the historical series reliability, and the consequent improvement of the forecasts accuracy. Keywords: allert correlation, attacks prediction, intrusion forecasting, false positives I. INTRODUCTION Cyber attacks can be classified as a set of actions intending to compromise the integrity, confidentiality or availability of computer systems. Cyber attacks can be caused by users or malicious software, which try either to obtain access, to use systems in an unauthorized way, or to enumerate privileges [1]. Reference [2] published a study in the United States about losses in 2009 concerning cyber-attacks: frauds in cyber space caused about $559.7 million of losses in 336,655 organizations. This was a 111,5% increase for the losses and a 22.3% increase for the complaints, as compared to 2008 when 275,284 complaints were received, reporting $264.6 million in total losses. According to [3], in 2009 the largest reported volumetric Distributed Denial of Service (DDoS) attack exceeded 49 Gbps sustained towards a single target in Europe. Beyond sheer attack size, [3] indicated that cyber-attacks become more sophisticated, with attackers expressly aiming to exhaust resources other than bandwidth, such as firewalls, load- balancers, back-end database infrastructure and associated transaction capacity, cached data serving algorithms, etc. This increasing sophistication is a trend that has been captured in previous editions of the survey of [3] as well. In relation to DDoS, it is expected these attacks to become more common against independent media and human rights sites in 2011, as the recent highly publicized DDoS attacks on Wikileaks, and “Operation Payback” attacks by “Anonymous” on sites perceived to oppose Wikileaks [4]. Nowadays, Intrusion Detection and Prevention Systems (IDPS) are regularly employed for monitoring, detecting and/or blocking cyber attacks [1]. However, two issues for the process of analysis done by the IDPS can be mentioned: (1) it usually results in a huge amount of data (alerts like False Positives - FP) [5]; (2) it relies on reactive approaches, as attacks are identified and/or blocked most of the times only after they can inflict serious damage to the computer systems [6]. One way for improving the analysis of data is to correlate information between them, looking for similar characteristics that may be related [6-7]. Throughout correlation it is possible to eliminate redundant and false data, to discover attack patterns and understand attack strategies [8-12][39]. Nevertheless, alert correlation may be challenging as it depends on the reliability of the source of security alerts [5]. Therefore, the level of precision of detection tools is an important issue for validating correlations. Multi-correlation or integration of alerts with information from different sources, e.g. tools for monitoring or operating system logs, can allow a new classification for alerts, improving results accuracy [7] [10]. References [7], [10], [12] employed multi-correlation; however neither a detailed analysis concerning influence of isolated alerts in the FP rates, nor forecasting techniques were not applied for predicting future attacks. According to [6], [13- 15], an early warning system showing a future trend outlook with an increasing number of cyber-attacks, exposed by forecasting analysis, may influence decisions on the security devices adoption (e.g. rules in IDPS combined with rules in firewalls) before incidents happen, according to the needs. Forecasting analysis in the information security area can be similar to forecasting methodologies used in other fields: meteorology, for instance, use sensors to capture data about temperature, humidity, etc [16-17]; seismology employs sensors to capture electromagnetic emissions from the rocks [18]; for economics, specifically stock market, data is collected 978-1-4577-1539-6/11/$26.00 ©2011 IEEE 978-1-4577-1539-6/11/$26.00 ©2011 IEEE 179
Transcript of Applying multi-correlation for improving forecasting in cyber security
Applying Multi-Correlation for Improving Forecasting in Cyber Security
Elvis Pontes, Adilson E. Guelfi, Sérgio T. Kofuji Laboratory of Integrated Systems of the Polytechnic
School at University of São Paulo (EPUSP) São Paulo, Brazil
[email protected], [email protected], [email protected]
Anderson A. A. Silva, Adilson E. Guelfi Institute of Technological Research of São Paulo (IPT)
São Paulo, Brazil [email protected]
Abstract—Currently, defense of the cyber space is mostly based on detection and/or blocking of attacks (Intrusion Detection and Prevention System - IDPS). But, a significant improvement for IDPS is the employment of forecasting techniques in a Distributed Intrusion Forecasting System (DIFS), which enables the capability for predicting attacks. Notwithstanding, during our earlier works, one of the issues we have faced was the huge amount of alerts produced by IDPS, several of them were false positives. Checking the veracity of alerts through other sources (multi-correlation), e.g. logs taken from the operating system (OS), is a way of reducing the number of false alerts, and, therefore, improving data (historical series) to be used by the DIFS. The goal of this paper is to propose a two stage system which allows: (1) employment of an Event Analysis System (EAS) for making multi-correlation between alerts from an IDPS with the OS’ logs; and (2) applying forecasting techniques on data generated by the EAS. Tests applied on laboratory by the use of the two stage system allow concluding about the improvement of the historical series reliability, and the consequent improvement of the forecasts accuracy.
Keywords: allert correlation, attacks prediction, intrusion forecasting, false positives
I. INTRODUCTION Cyber attacks can be classified as a set of actions intending
to compromise the integrity, confidentiality or availability of computer systems. Cyber attacks can be caused by users or malicious software, which try either to obtain access, to use systems in an unauthorized way, or to enumerate privileges [1].
Reference [2] published a study in the United States about losses in 2009 concerning cyber-attacks: frauds in cyber space caused about $559.7 million of losses in 336,655 organizations. This was a 111,5% increase for the losses and a 22.3% increase for the complaints, as compared to 2008 when 275,284 complaints were received, reporting $264.6 million in total losses. According to [3], in 2009 the largest reported volumetric Distributed Denial of Service (DDoS) attack exceeded 49 Gbps sustained towards a single target in Europe. Beyond sheer attack size, [3] indicated that cyber-attacks become more sophisticated, with attackers expressly aiming to exhaust resources other than bandwidth, such as firewalls, load-balancers, back-end database infrastructure and associated transaction capacity, cached data serving algorithms, etc. This increasing sophistication is a trend that has been captured in
previous editions of the survey of [3] as well. In relation to DDoS, it is expected these attacks to become more common against independent media and human rights sites in 2011, as the recent highly publicized DDoS attacks on Wikileaks, and “Operation Payback” attacks by “Anonymous” on sites perceived to oppose Wikileaks [4].
Nowadays, Intrusion Detection and Prevention Systems (IDPS) are regularly employed for monitoring, detecting and/or blocking cyber attacks [1]. However, two issues for the process of analysis done by the IDPS can be mentioned: (1) it usually results in a huge amount of data (alerts like False Positives - FP) [5]; (2) it relies on reactive approaches, as attacks are identified and/or blocked most of the times only after they can inflict serious damage to the computer systems [6].
One way for improving the analysis of data is to correlate information between them, looking for similar characteristics that may be related [6-7]. Throughout correlation it is possible to eliminate redundant and false data, to discover attack patterns and understand attack strategies [8-12][39].
Nevertheless, alert correlation may be challenging as it depends on the reliability of the source of security alerts [5]. Therefore, the level of precision of detection tools is an important issue for validating correlations. Multi-correlation or integration of alerts with information from different sources, e.g. tools for monitoring or operating system logs, can allow a new classification for alerts, improving results accuracy [7] [10]. References [7], [10], [12] employed multi-correlation; however neither a detailed analysis concerning influence of isolated alerts in the FP rates, nor forecasting techniques were not applied for predicting future attacks. According to [6], [13-15], an early warning system showing a future trend outlook with an increasing number of cyber-attacks, exposed by forecasting analysis, may influence decisions on the security devices adoption (e.g. rules in IDPS combined with rules in firewalls) before incidents happen, according to the needs.
Forecasting analysis in the information security area can be similar to forecasting methodologies used in other fields: meteorology, for instance, use sensors to capture data about temperature, humidity, etc [16-17]; seismology employs sensors to capture electromagnetic emissions from the rocks [18]; for economics, specifically stock market, data is collected
978-1-4577-1539-6/11/$26.00 ©2011 IEEE978-1-4577-1539-6/11/$26.00 ©2011 IEEE 179
from diverse companies (annual profit, potential customers, assets, etc) to draw trends about shares of companies [19-20].
For any field formal models can be applied to predict events over the collected data. But, before applying formal models, data regarding different kind of variables should be correlated [21]. According to [21], to obtain a more accurate and realistic result about predictions it is suggested: (1) to use diverse forecasting techniques; (2) to analyze information regarding diverse variables and acquired data, from sensors for instance; (3) to employ diverse kind of employed forecasting models.
Concerning forecasting in IDPS, [22-33] employed forecasting models, though they used just one formal method for predicting events and they did not make use of any kind of correlation process. In other hand, in our earlier works we proposed the Distributed Intrusion Forecasting System (DIFS) [6], [15], which covered the following gaps of today’s forecasting techniques in IDPS: a) the use of few sensors and/or sensors employed locally for capturing data; b) the use of just one forecasting technique; and c) lack of information sharing among sensors to be used for correlation. Notwithstanding, we faced huge amount of alerts which could have negative influence over forecasting results.
In this paper, security events for cyber security are actions, processes that have an effect on the system, disregarding the kind of the effect – in other words, actions that could result in positive or negative effects on the system. In other hand, security alerts are types of security events, indicating anomalous activities or cyber attacks [5].
Therefore, the goal of this paper is to propose a Two Stage System (TSS) which allows: (1) in the first stage it is possible to make a correlation of security alerts using an Event Analysis System (EAS); and (2) to apply forecasting techniques on the data (historical series) generated by the previous stage (EAS).
This paper is organized as follows: state of art concerning event correlation and forecasting in IDPS are in section 2. Section 3 presents details about the tests and environment created to validate the TSS. Results are analyzed in section 4 and section 5 summarizes conclusions and suggestions for new studies.
II. EVENT CORRELATION AND FORECASTING In this section we approach event correlation for detecting
cyber-attacks, the forecasting methods used to predict cyber-attacks and Distributed Architecture for Intrusion Forecasting System (DIFS [6], [15]).
A. Correlation Approaches for Security Events Correlation techniques for security events can be classified
into three categories: (1) rule-based, (2) based on anomaly and (3) based on causes and consequences (Prerequisites and Consequences (PC)) [7]. The rule-based method requires some prior knowledge about the attack, so the target machine has to pass through a preparation phase called training. The goal of this phase is to make the target machine able to preciseness detect the vulnerabilities in which the target machine was trained for [7], [34]. Gaps of rule-based method are: (1) it is
computer intensive; (2) it results in lots of data; (3) the method works only for known vulnerabilities.
The method based on anomaly analyzes network data flow, using correlation by statistical methods, using accumulation of gathered information and using observations of the occurred deviations throughout processes of network data flow; in a manner to allow detecting new attacks. For instance, [35] demonstrates a system for detecting anomalies which is characterized by monitoring several parameters simultaneously. Reference [36] presents a probabilistic correlation proposed for IDPS, based on data fusion and multi-sensors. However, the method which uses anomaly cannot detect anomalous activity hidden in a normal process, if it is performed at very low levels. Besides, as this method analyzes normal processes reporting only wrong deviations, hence the method is not suitable for finding causes of attacks [40].
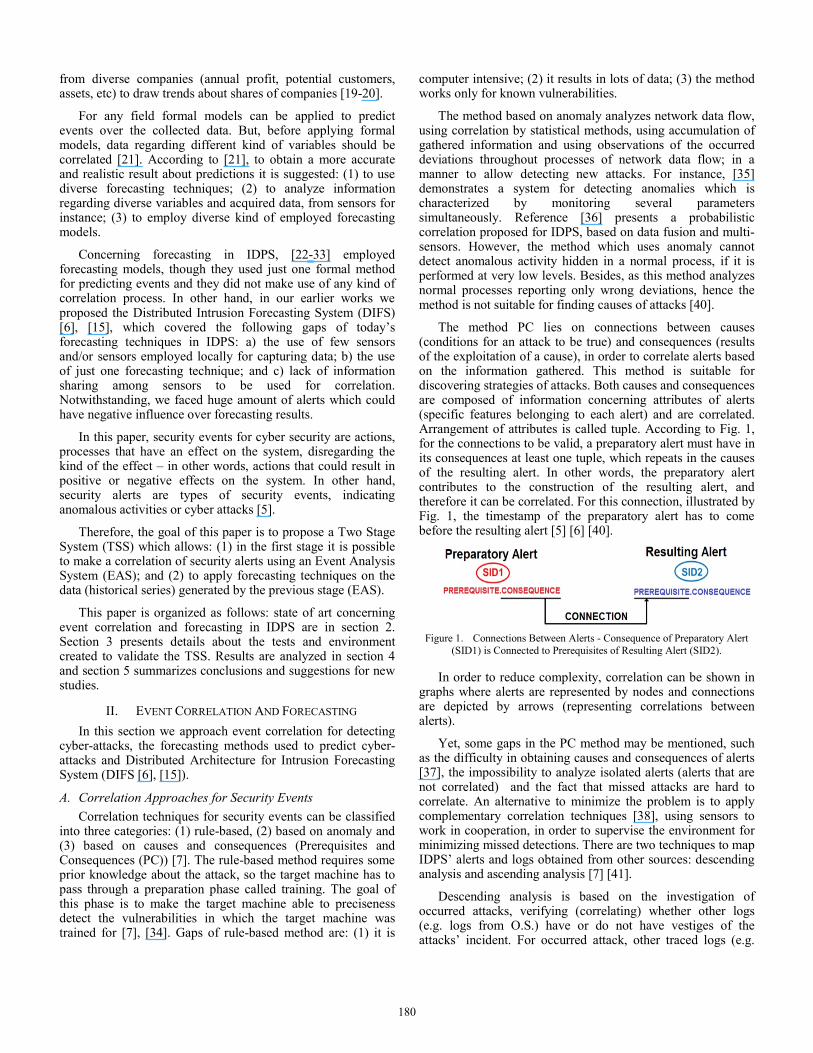
The method PC lies on connections between causes (conditions for an attack to be true) and consequences (results of the exploitation of a cause), in order to correlate alerts based on the information gathered. This method is suitable for discovering strategies of attacks. Both causes and consequences are composed of information concerning attributes of alerts (specific features belonging to each alert) and are correlated. Arrangement of attributes is called tuple. According to Fig. 1, for the connections to be valid, a preparatory alert must have in its consequences at least one tuple, which repeats in the causes of the resulting alert. In other words, the preparatory alert contributes to the construction of the resulting alert, and therefore it can be correlated. For this connection, illustrated by Fig. 1, the timestamp of the preparatory alert has to come before the resulting alert [5] [6] [40].
Figure 1. Connections Between Alerts - Consequence of Preparatory Alert
(SID1) is Connected to Prerequisites of Resulting Alert (SID2).
In order to reduce complexity, correlation can be shown in graphs where alerts are represented by nodes and connections are depicted by arrows (representing correlations between alerts).
Yet, some gaps in the PC method may be mentioned, such as the difficulty in obtaining causes and consequences of alerts [37], the impossibility to analyze isolated alerts (alerts that are not correlated) and the fact that missed attacks are hard to correlate. An alternative to minimize the problem is to apply complementary correlation techniques [38], using sensors to work in cooperation, in order to supervise the environment for minimizing missed detections. There are two techniques to map IDPS’ alerts and logs obtained from other sources: descending analysis and ascending analysis [7] [41].
Descending analysis is based on the investigation of occurred attacks, verifying (correlating) whether other logs (e.g. logs from O.S.) have or do not have vestiges of the attacks’ incident. For occurred attack, other traced logs (e.g.
180
Operational System’s logs) can be analyzed based on timestamp. This type of analysis is useful to trace evidences about strategies of events, in order to map attacks to its source.
The ascending technique is used to discover attacks by the analysis of several logs. Once an anomaly is detected in one of these logs, other logs are checked based on timestamp. Although ascending technique is computer intensive, this technique allows detecting new attacks.
In an earlier work we proposed the EAS [5], [41], intending to improve results of security events correlation and intrusion detection. EAS is able to make multi-correlation for events from Operational Systems (OSs) and from IDPS (log analysis), consequently, EAS is also capable for verifying the influence of isolated alerts in the cyber-security context.
The EAS architecture has 4 modules, as shown by Fig.2: (a) converter: the aim of this module is to handle the input data into the system (IDPS signatures, alerts and logs from the OS); (b) updating: it controls data which is going to be used by the system; (c) correlating: it does mappings for the correlation processes, FP identification, and the identification of isolated alerts; (d) calculator: it analyzes and compares FP, based on the results from the correlating module.
Figure 2. EAS’s Architecture [5], [41]
According to [5] [41], with the employment of the EAS it was possible to improve the today’s results of security events correlation considering the following issues: (1) traceability for causes and consequences within the PC-correlation method (with multi-correlation criteria, correlation analysis (ascending/descending) and identification of FP alerts through tables and graphs); and (2) the process of results validation regarding the correlation. In [5] [41], results of correlating phase were evaluated in three steps (FP1, FP2 and FP3) using tables and graphs. The stepwise analysis allowed comparison of the results. EAS achieved an increase of 112.09% in the identification of FP alerts after the multi-correlation. Another important result of EAS was the evidence of preparatory connections between individual alerts that are in fact part of larger and more elaborated attacks. In other words, EAS can show that individual alerts can be grouped in a single attack, since they are part of the same attack strategy [5] [41].
B. Forecasting Approache The forecasting approaches in IDS lie mainly on stochastic
methods [26-28]. With no attention about predictions, references [41-43] applied diverse probabilistic techniques (decision tree, Hotelling’s T² test, chi-square multivariate, Markov chain and Exponential Weighted Moving Average (EWMA)) on audit data as a way to analyze three properties of the UIT: frequency, duration, and ordering. Reference [41-42] has come to the following findings: 1) The sequence of events
is necessary for IDS, as a single audit event at a given time is not sufficient; 2) Ordering (transaction [43]) provides additional advantage to the frequency property, but it is computationally intensive. Frequency property by itself provides good intrusion detection [41-43]. References [41-43] did not approach correlation for IDPS.
Moving averages (simple, weighted, EWMA, or central) with time series data are regularly used to smooth out fluctuations and highlight trends [45]. EWMA may be applied for auto correlated and uncorrelated data for detecting cyber-attacks which manifest themselves through significant changes in the intensity of events occurring [42]. Both (EWMA for auto correlated and uncorrelated) has presented good efficiency for detecting attacks. EWMA applies weighting factors which decrease, giving much more importance to recent observations while still not discarding older observations entirely. The statistic that is calculated is [42]:
1 α for t=1, 2, …, n. (1)
Where: EWMA is the mean of historical data; Yt is the observation at time t; n is the number of observations to be monitored including EWMA; 0 <α< 1 is a constant that determines the depth of memory of the EWMA.
The parameter α determines the rate of weight of older data into the calculation of the EWMA statistic. So, a large value of α gives more weight to recent data and less weight to older data; a small value of α gives more weight to older data.
Reference [29] gives an overview of adopting EWMA with adaptive thresholds, based on normal profile of network traffic. The analysis of thresholds with EWMA may summarize huge amount of data in network traffic [10], [15]. Diverse moving averages, combined with Fibonacci sequence forecasting approach, were also used by [4] to spot trends of cyber attacks in the [30] datasets.
A simple moving average (SMA) is the non weighted mean of the previous n data. For example, a 10-hours SMA of intrusive event X (DoS, e.g.) is the mean of the previous 10 hours’ event X. If those events are: , , … , . Then the formula is [35]:
(2)
When calculating successive values, a new value comes into the sum and an old value drops out, meaning a full summation each time is unnecessary,
(3)
Nevertheless, the forecasting approaches which use moving averages to cope with cyber attacks in IDS are limited to analyze cyber attacks individually, e.g. in just one IDS. Therefore, there is no collaboration among the forecasters. Besides: the concept of sensors is not adopted in [3-6], [10], [15], [28].
Intrusion Forecasting Systems (IFS) [6] can work proactively in cyber defense contexts - as early warning systems - in order to indicate or identify attacks in advance. IFS
181
can also represent an improvement of IDPS, which is based on postmortem approaches (threats and attacks are identified and/or blocked only after they can inflict serious damage to the computer systems). IFS predicts attacks by the use of different forecasting techniques (for example, moving average, Fibonacci sequence etc) applied either for local or distributed environment. Additionally, for distributed environments, e.g. DIFS, the use of cooperative sensors can improve accuracy about predictions of attacks.
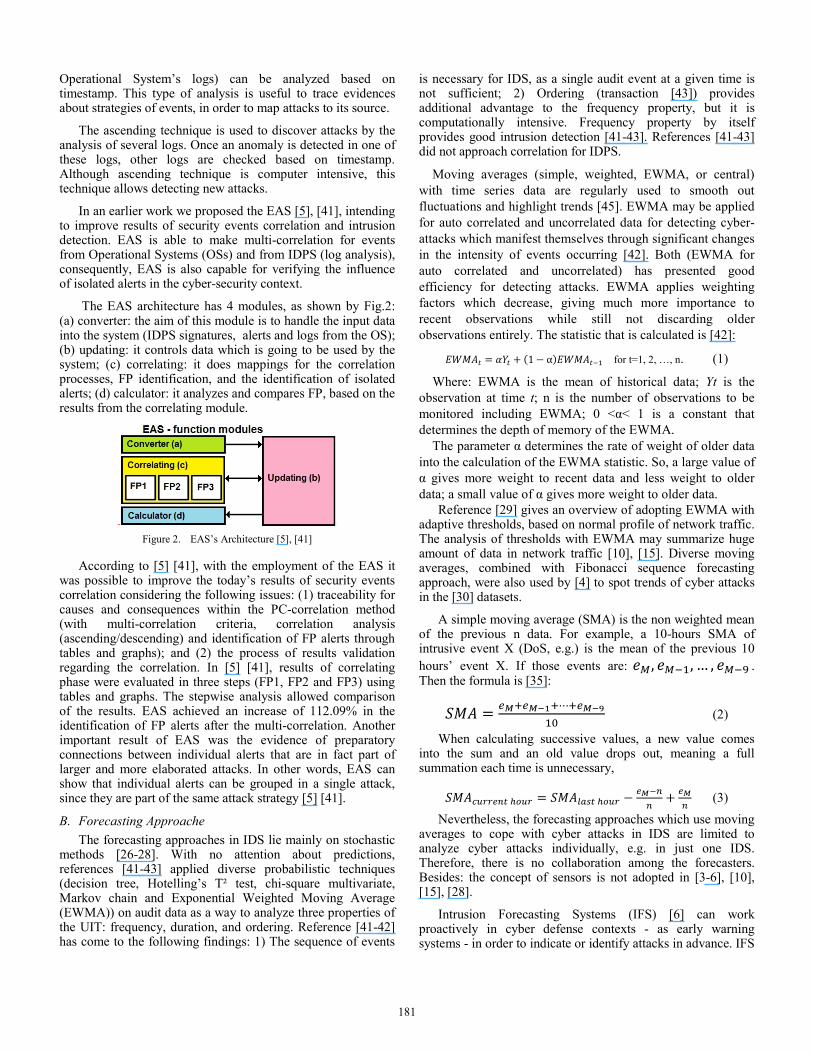
Fig. 2 depicts the DIFS and the forecasting levels. Similarly to forecasting methodologies used in other fields, DIFS also spreads agents and/or sensors widely to make predictions about the different kinds of cyber-attacks. There are four levels of the IFS: level 1 - independent security devices of hosts; level 2 - integrated security devices of hosts; level 3 - the network level; and level 4 - the backbone level. All levels have some communication degree among each other. In other words, the forecasts obtained from level 1 are shared and correlated to the forecasts of the other levels. Lower levels work as sensors to higher levels; consequently feedback about the attacks trends may be exchanged from one level to another.
WAN
Network Flow database
Border Gateway
Router 1...
Collector and Analyzer of
Network Flow
Firewall
Antivirus Antispam IDPS
Forecast Forecast Forecast Forecast
Host Security device n
Network Flow database
ForecastingQuery and feedback
LAN
Forecastslevel 1 x level 2
Forecastslevel 2 x level 3
Forecastslevel 3 x level 4
Collector and Analyzer of
Network Flow
Collector and Analyzer of
Network Flow
Collector and Analyzer of
Network Flow
LegendForecasts - level 1
Forecasts - level 2
Forecasts - level 3
Forecasts - level 4
...
Forecast
IFS Level 1
Forecasting
Forecasting
IFS Level 2
IFS Level 3
IFS Level 4
LANLAN
Network flow database
Network Flow database
Network Flow database
Router 2 Router n
Figure 3. Intrusion Forecasting System (IFS) [6]
III. THE TWO STAGE SYSTEM (TSS) FOR FORECASTING IN CYBER SECURITY
The TSS is the proposal of this paper. Fig. 4 presents the sequence of tasks done by the system:
(1) The first task is the multi-correlation, running the EAS, removing FP and tracing sophisticated attacks. During step 1, OS’s logs, IDPS’s logs and other logs are analyzed by the EAS. According to Fig. 4, diverse logs represent the Entry 1 for the TSS. After processing data from Entry 1, as a result the EAS produces a set of events which represents the real attacks (without FPs - Entry 2).
(2) As illustrated by Fig. 4, the second task is done by the IFS, applying forecasting techniques over the events from Entry 2 (historical series). Several forecasting techniques may
be adopted in this task (e.g. EWMA, Fibonacci sequence, Markov chains, etc). Task 2 considers just data from Entry 2. As a result for Task 2, the TSS is going to provide forecasts regarding the real cyber-attacks.
Figure 4. Sequence of Tasks: (1) EAS Multcorrelation – (2) IFS
Therefore both the EAS Multi-correlation and the IFS work as subsystems for The TSS proposed in this paper.
IV. TEST-ENVIRONMENT FOR THE TWO STAGE SYSTEM (TSS)
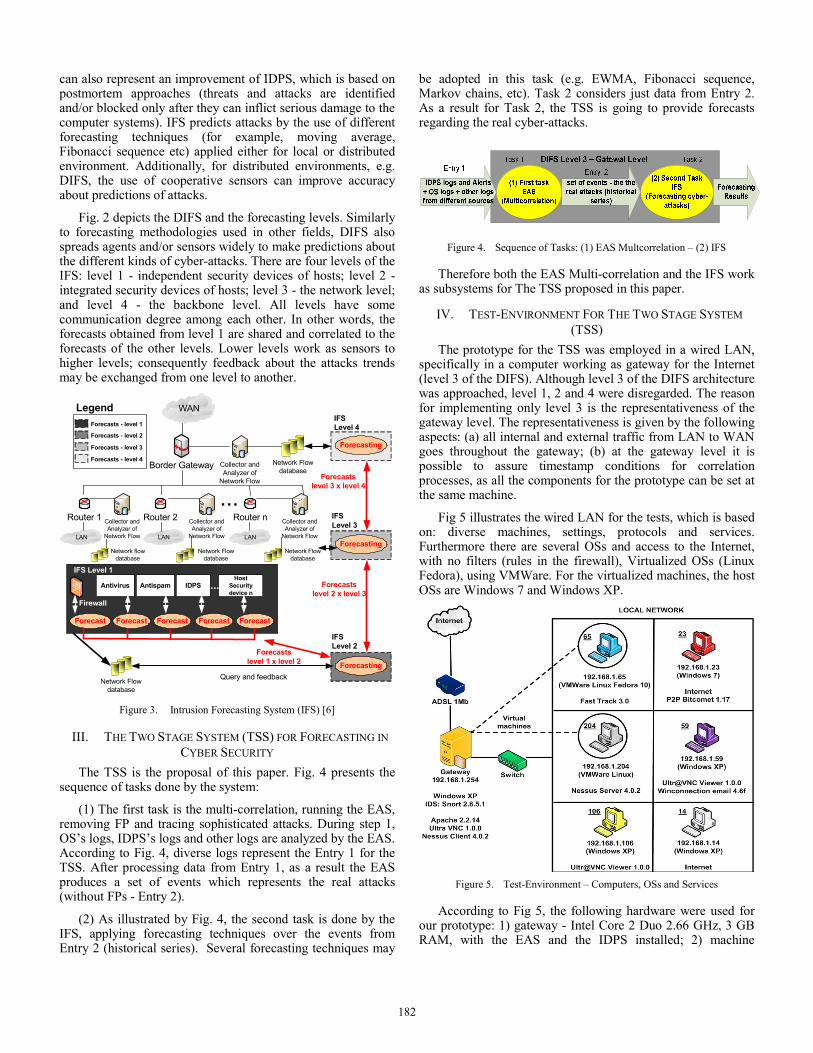
The prototype for the TSS was employed in a wired LAN, specifically in a computer working as gateway for the Internet (level 3 of the DIFS). Although level 3 of the DIFS architecture was approached, level 1, 2 and 4 were disregarded. The reason for implementing only level 3 is the representativeness of the gateway level. The representativeness is given by the following aspects: (a) all internal and external traffic from LAN to WAN goes throughout the gateway; (b) at the gateway level it is possible to assure timestamp conditions for correlation processes, as all the components for the prototype can be set at the same machine.
Fig 5 illustrates the wired LAN for the tests, which is based on: diverse machines, settings, protocols and services. Furthermore there are several OSs and access to the Internet, with no filters (rules in the firewall), Virtualized OSs (Linux Fedora), using VMWare. For the virtualized machines, the host OSs are Windows 7 and Windows XP.
Figure 5. Test-Environment – Computers, OSs and Services
According to Fig 5, the following hardware were used for our prototype: 1) gateway - Intel Core 2 Duo 2.66 GHz, 3 GB RAM, with the EAS and the IDPS installed; 2) machine
182
number 65 – Virtual machine with VMWare Workstation 6.0.2 768 MB RAM – Fedora 10 (Fast Track); 3) machine number 204 – Virtual machine with VMWare Workstation 6.0.2 512 MB RAM – Fedora 10 (Nessus Server 4.0.2); 4) machine number 14 – Intel Core 2 Duo 2.5 GHz, 4 GB RAM – Windows XP Professional (browser's Internet access); 5) machine number 23 – Intel Pentium 4 3.2 GHz, 4 GB RAM – Microsoft Windows 7 (browser's Internet accesss, Bitcomet 1.17); 6) machine number 59 – Intel Pentium 4 3.06 GHz, 1 GB RAM – Windows XP Professional (Winconnection E-mail Server 4.6f, Ultr@VNC Viewer 1.0); 7) machine number 106 – Intel Pentium 4 2,4 GHz, 2 GB –Windows XP Prof. (Ultr@VNC Server 1.0).
The gateway is able to register alerts using the Network IDPS (Snort) and logs from its own OS. Table I details services used in the test-environment, like the IP source address for each service and the destination. The IP source addresses represent the machines which executed the attacks. In this environment, multi-correlation was done between alerts from an IDPS and the OS’ logs from the gateway. Table II presents services used in the prototype. EAS was developed by the authors, in Visual FoxPro. Finally, Table II shows the elapsed time for the prototype.
TABLE I. SERVICES IN THE TEST ENVIRONMENT
Services IP Source Address
Destination Address
Diverse services using Internet browser 14 and 23 Internet
Remote access (VNC) 59 and 106 Gateway
Peer-to-peer (Bitcomet) 59 Internet
E-mail server (Winconnection) 59 Internet
Complete attack test (Fast-Track) 65 Gateway
Complete attack test (Nessus) 204 Gateway
TABLE II. EMPLOYED TOOLS
Features Tools Time (m) Details
EAS Visual FoxPro
IDPS Snort 19 13113 signatures
logs Detection Procmon 19 752851 logs
Graphs Graphviz
Both simulation of normal network traffic and simulation of cyber-attacks were referred in the prototype. Normal network traffic with no simulation was brought up as well. Unlike [6], [13-15] Cyber-attacks concern the following types: (1) AWStats - allows remote attackers to execute arbitrary commands via shell; (2) SNMP: remote attackers can cause a DoS or gain privileges via SNMPv1 trap handling (SNMP AGENTX/TCP REQUEST is an example of this kind of attack); (3) P2P: multiple TCP/IP and ICMP implementations allow remote attackers to cause a DoS (reset TCP connections) via spoofed ICMP error messages.
It is important to notice that the cyber-attacks considered in this prototype are, in matter of fact, a set of events (alerts and
logs) classified as a single and more elaborated attack. In our earlier works [6], [13-15], forecasting techniques considered just individual events in the cyber-security context. Consequently in this paper forecasting techniques are differently employed, considering the DIFS architecture, as the prototype deals with more refined sets of attacks.
Details regarding the EAS and the IFS tasks are not reported in this paper due space limitations, but the reader may consult [5], [41] and [6], [13-16] for more information relating to EAS and IFS, respectively.
V. RESULTS For the first step (EAS), results are achieved by analyzing
consecutive graphs and tables from each phase. Quantity of alerts and correlations are independently accounted, according to the registered route (source and destination). In case the alerts and correlation regards the gateway, whether for source or destination, they are registered as Gateway; the alerts and correlation which disregard the gateway are registered as Non-Gateway. Table III summarizes the prototype and some results.
TABLE III. PROTOTYPE RESULTS
Values Total
Detected alerts 2554 Gateway 1588 Non-gateway 4142
Alert types 137
Isolated alerts 29 (all in FP1) 21 FP / 8 TP 72,41% FP
Correlated alerts 14 FP1 = 21.08%
55 FP3 = 44.72%
% FP 21.08 (FP1) 44.72% (FP3) 54.22%
% TP 45.78% 10.52% of all TP alerts were isolated
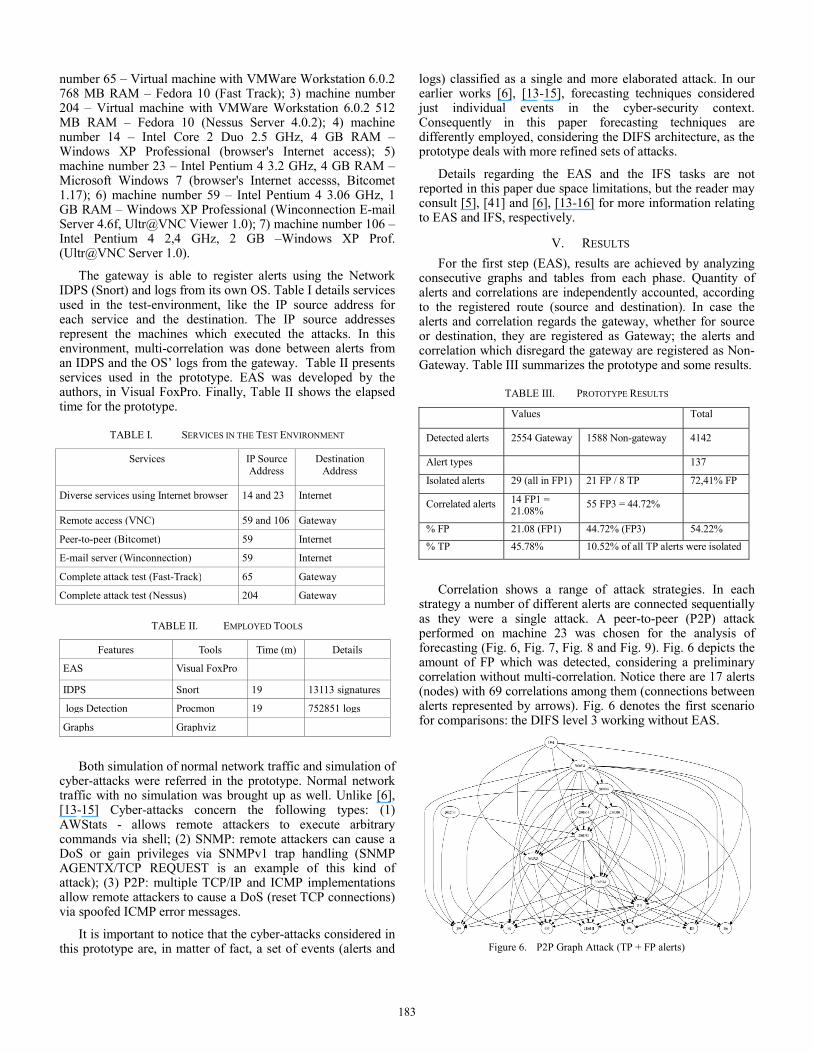
Correlation shows a range of attack strategies. In each strategy a number of different alerts are connected sequentially as they were a single attack. A peer-to-peer (P2P) attack performed on machine 23 was chosen for the analysis of forecasting (Fig. 6, Fig. 7, Fig. 8 and Fig. 9). Fig. 6 depicts the amount of FP which was detected, considering a preliminary correlation without multi-correlation. Notice there are 17 alerts (nodes) with 69 correlations among them (connections between alerts represented by arrows). Fig. 6 denotes the first scenario for comparisons: the DIFS level 3 working without EAS.
Figure 6. P2P Graph Attack (TP + FP alerts)
183
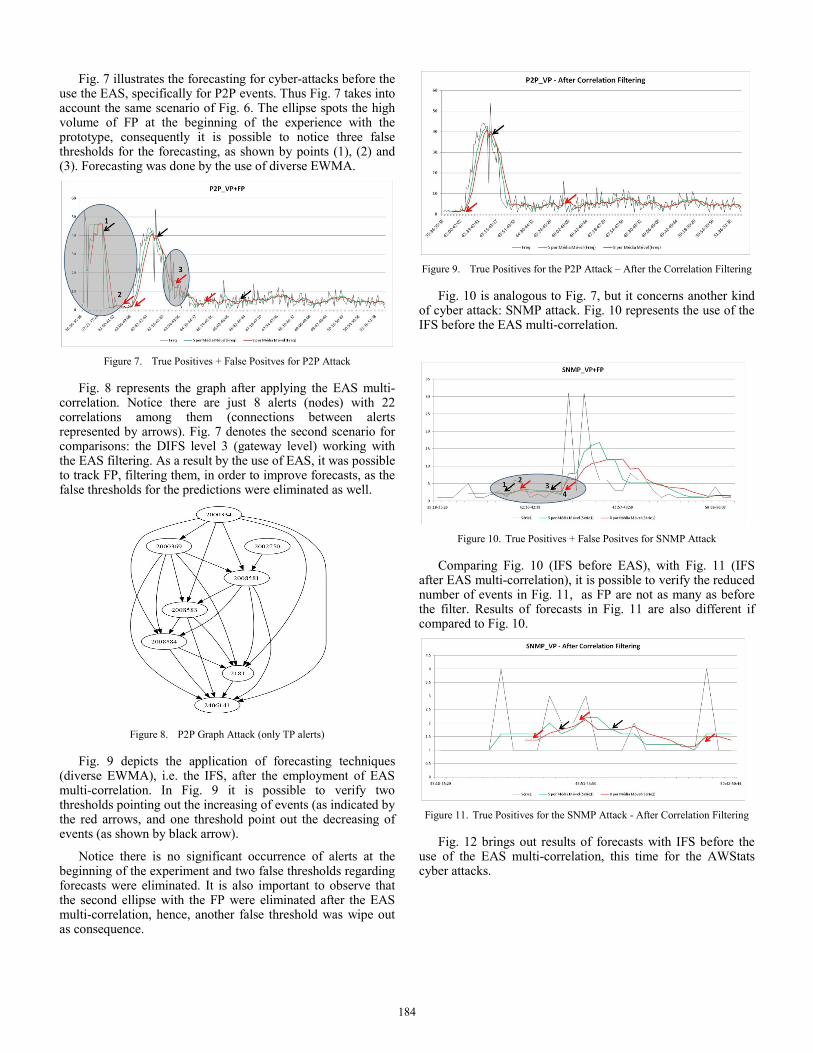
Fig. 7 illustrates the forecasting for cyber-attacks before the use the EAS, specifically for P2P events. Thus Fig. 7 takes into account the same scenario of Fig. 6. The ellipse spots the high volume of FP at the beginning of the experience with the prototype, consequently it is possible to notice three false thresholds for the forecasting, as shown by points (1), (2) and (3). Forecasting was done by the use of diverse EWMA.
Figure 7. True Positives + False Positves for P2P Attack
Fig. 8 represents the graph after applying the EAS multi-correlation. Notice there are just 8 alerts (nodes) with 22 correlations among them (connections between alerts represented by arrows). Fig. 7 denotes the second scenario for comparisons: the DIFS level 3 (gateway level) working with the EAS filtering. As a result by the use of EAS, it was possible to track FP, filtering them, in order to improve forecasts, as the false thresholds for the predictions were eliminated as well.
Figure 8. P2P Graph Attack (only TP alerts)
Fig. 9 depicts the application of forecasting techniques (diverse EWMA), i.e. the IFS, after the employment of EAS multi-correlation. In Fig. 9 it is possible to verify two thresholds pointing out the increasing of events (as indicated by the red arrows, and one threshold point out the decreasing of events (as shown by black arrow).
Notice there is no significant occurrence of alerts at the beginning of the experiment and two false thresholds regarding forecasts were eliminated. It is also important to observe that the second ellipse with the FP were eliminated after the EAS multi-correlation, hence, another false threshold was wipe out as consequence.
Figure 9. True Positives for the P2P Attack – After the Correlation Filtering
Fig. 10 is analogous to Fig. 7, but it concerns another kind of cyber attack: SNMP attack. Fig. 10 represents the use of the IFS before the EAS multi-correlation.
Figure 10. True Positives + False Positves for SNMP Attack
Comparing Fig. 10 (IFS before EAS), with Fig. 11 (IFS after EAS multi-correlation), it is possible to verify the reduced number of events in Fig. 11, as FP are not as many as before the filter. Results of forecasts in Fig. 11 are also different if compared to Fig. 10.
Figure 11. True Positives for the SNMP Attack - After Correlation Filtering
Fig. 12 brings out results of forecasts with IFS before the use of the EAS multi-correlation, this time for the AWStats cyber attacks.
184
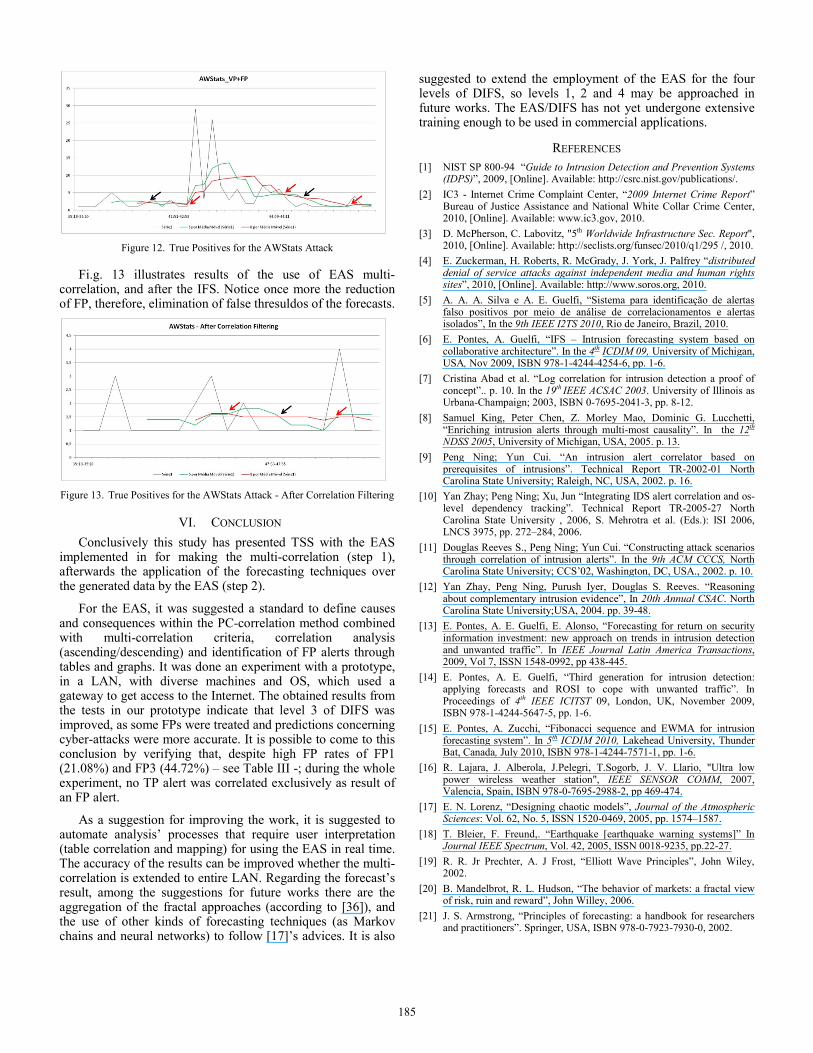
Figure 12. True Positives for the AWStats Attack
Fi.g. 13 illustrates results of the use of EAS multi-correlation, and after the IFS. Notice once more the reduction of FP, therefore, elimination of false thresuldos of the forecasts.
Figure 13. True Positives for the AWStats Attack - After Correlation Filtering
VI. CONCLUSION Conclusively this study has presented TSS with the EAS
implemented in for making the multi-correlation (step 1), afterwards the application of the forecasting techniques over the generated data by the EAS (step 2).
For the EAS, it was suggested a standard to define causes and consequences within the PC-correlation method combined with multi-correlation criteria, correlation analysis (ascending/descending) and identification of FP alerts through tables and graphs. It was done an experiment with a prototype, in a LAN, with diverse machines and OS, which used a gateway to get access to the Internet. The obtained results from the tests in our prototype indicate that level 3 of DIFS was improved, as some FPs were treated and predictions concerning cyber-attacks were more accurate. It is possible to come to this conclusion by verifying that, despite high FP rates of FP1 (21.08%) and FP3 (44.72%) – see Table III -; during the whole experiment, no TP alert was correlated exclusively as result of an FP alert.
As a suggestion for improving the work, it is suggested to automate analysis’ processes that require user interpretation (table correlation and mapping) for using the EAS in real time. The accuracy of the results can be improved whether the multi-correlation is extended to entire LAN. Regarding the forecast’s result, among the suggestions for future works there are the aggregation of the fractal approaches (according to [36]), and the use of other kinds of forecasting techniques (as Markov chains and neural networks) to follow [17]’s advices. It is also
suggested to extend the employment of the EAS for the four levels of DIFS, so levels 1, 2 and 4 may be approached in future works. The EAS/DIFS has not yet undergone extensive training enough to be used in commercial applications.
REFERENCES [1] NIST SP 800-94 “Guide to Intrusion Detection and Prevention Systems
(IDPS)”, 2009, [Online]. Available: http://csrc.nist.gov/publications/. [2] IC3 - Internet Crime Complaint Center, “2009 Internet Crime Report”
Bureau of Justice Assistance and National White Collar Crime Center, 2010, [Online]. Available: www.ic3.gov, 2010.
[3] D. McPherson, C. Labovitz, "5th Worldwide Infrastructure Sec. Report", 2010, [Online]. Available: http://seclists.org/funsec/2010/q1/295 /, 2010.
[4] E. Zuckerman, H. Roberts, R. McGrady, J. York, J. Palfrey “distributed denial of service attacks against independent media and human rights sites”, 2010, [Online]. Available: http://www.soros.org, 2010.
[5] A. A. A. Silva e A. E. Guelfi, “Sistema para identificação de alertas falso positivos por meio de análise de correlacionamentos e alertas isolados”, In the 9th IEEE I2TS 2010, Rio de Janeiro, Brazil, 2010.
[6] E. Pontes, A. Guelfi, “IFS – Intrusion forecasting system based on collaborative architecture”. In the 4th ICDIM 09, University of Michigan, USA, Nov 2009, ISBN 978-1-4244-4254-6, pp. 1-6.
[7] Cristina Abad et al. “Log correlation for intrusion detection a proof of concept”.. p. 10. In the 19th IEEE ACSAC 2003. University of Illinois as Urbana-Champaign; 2003, ISBN 0-7695-2041-3, pp. 8-12.
[8] Samuel King, Peter Chen, Z. Morley Mao, Dominic G. Lucchetti, “Enriching intrusion alerts through multi-most causality”. In the 12th NDSS 2005, University of Michigan, USA, 2005. p. 13.
[9] Peng Ning; Yun Cui. “An intrusion alert correlator based on prerequisites of intrusions”. Technical Report TR-2002-01 North Carolina State University; Raleigh, NC, USA, 2002. p. 16.
[10] Yan Zhay; Peng Ning; Xu, Jun “Integrating IDS alert correlation and os-level dependency tracking”. Technical Report TR-2005-27 North Carolina State University , 2006, S. Mehrotra et al. (Eds.): ISI 2006, LNCS 3975, pp. 272–284, 2006.
[11] Douglas Reeves S., Peng Ning; Yun Cui. “Constructing attack scenarios through correlation of intrusion alerts”. In the 9th ACM CCCS, North Carolina State University; CCS’02, Washington, DC, USA., 2002. p. 10.
[12] Yan Zhay, Peng Ning, Purush Iyer, Douglas S. Reeves. “Reasoning about complementary intrusion evidence”, In 20th Annual CSAC. North Carolina State University;USA, 2004. pp. 39-48.
[13] E. Pontes, A. E. Guelfi, E. Alonso, “Forecasting for return on security information investment: new approach on trends in intrusion detection and unwanted traffic”. In IEEE Journal Latin America Transactions, 2009, Vol 7, ISSN 1548-0992, pp 438-445.
[14] E. Pontes, A. E. Guelfi, “Third generation for intrusion detection: applying forecasts and ROSI to cope with unwanted traffic”. In Proceedings of 4th IEEE ICITST 09, London, UK, November 2009, ISBN 978-1-4244-5647-5, pp. 1-6.
[15] E. Pontes, A. Zucchi, “Fibonacci sequence and EWMA for intrusion forecasting system”. In 5th ICDIM 2010, Lakehead University, Thunder Bat, Canada, July 2010, ISBN 978-1-4244-7571-1, pp. 1-6.
[16] R. Lajara, J. Alberola, J.Pelegri, T.Sogorb, J. V. Llario, "Ultra low power wireless weather station", IEEE SENSOR COMM, 2007, Valencia, Spain, ISBN 978-0-7695-2988-2, pp 469-474.
[17] E. N. Lorenz, “Designing chaotic models”, Journal of the Atmospheric Sciences: Vol. 62, No. 5, ISSN 1520-0469, 2005, pp. 1574–1587.
[18] T. Bleier, F. Freund,. “Earthquake [earthquake warning systems]” In Journal IEEE Spectrum, Vol. 42, 2005, ISSN 0018-9235, pp.22-27.
[19] R. R. Jr Prechter, A. J Frost, “Elliott Wave Principles”, John Wiley, 2002.
[20] B. Mandelbrot, R. L. Hudson, “The behavior of markets: a fractal view of risk, ruin and reward”, John Willey, 2006.
[21] J. S. Armstrong, “Principles of forecasting: a handbook for researchers and practitioners”. Springer, USA, ISBN 978-0-7923-7930-0, 2002.
185

[22] C. Lai-Chenq, "A high-efficiency intrusion prediction technology based on markov chain", In the IEEE CISW, 2007.
[23] Q. Yin, L. Shen, R. Zhang, X Li, "A new intrusion detection method based on behavioral model", In the IEEE WCICA, 2004, pp 4370-4374.
[24] F. Jemilli, M. Zaghdoud, M. B. Ahmed, "DIDFAST.BN :Distibuted intrusion detection and forecasting multiagent system using bayesian network", In the IEEE ICTTA, 2006, pp 3040-3044.
[25] S.S.S. Sindhu, S. Geetha, S.S. Sivanath, A.Kannan, "A neuro-genetic ensemble short term forecasting framework for anomaly intrusion prediction", In the IEEE ADCOM, 2006, pp 187-190.
[26] P. Ramasubramanian, A. Kannan, "Quickprop neural network ensemble forecasting framework for database intrusion prediction system", In the Springer 7th ICAISC, 2004, pp 9-18.
[27] P. Alampalayam, A. Kumar, "predictive security model using data mining", in proc IEEE Globcom, 2004.
[28] Y Chung, I. Kim, C. Lee, E. G. Im, D. Won, "Design of on-line intrusion forecast system with a weather forecasting model", In the Springer ICCSA 2006.
[29] P. Cisar, S. M. Cisar, "EWMA Statistic in Adaptive Threshold Algorithm", In the IEEE INES, 2007, pp 51-54.
[30] F. Leu, W. Yang, W. Chang, "IFTS : Intrusion Forecast and Traceback based on Union Defense Environment", In the IEEE ICPADS, 2005.
[31] Z. Zhengdao, P. Zhumiao, Z. Zhiping, "The Study of Intrusion Prediction Based on HSMM", In the IEEE Asia-Pacific Services Computing Conference, 2008, pp 1358-1363.
[32] J. Viinikka, H. Debar, L. Mé, R. Séguier, "Time Series Modeling for IDS Alert Management", A In the CM ASIAN ACM Symposium on Information, Computer and Communications Security, 2006.
[33] C. Ishida, Y. Arakawa, I. Sasase, "Forecast Techniques for Predicting Increase or Decrease of Attacks Using Bayesian Inference", In the IEEE PACRIM, 2005, pp 450-453.
[34] Fumio Mizoguchi. Anomaly Detection using Visualization and Machine Learning. In the IEEE 9th International WET ICE, 2000, pp. 76-82. Science University of Tokyo – Information Media Center; Noda, Japan, 2000. p. 6.
[35] Constantine Manikopoulos, Symeon Papavassiliou. Network Intrusion and Fault Detection: A Statistical Anomaly Approach. In IEEE Communications Magazine 40, 2002, pp. 76-82 New Jersey Institute of Technology, NJ, EUA, 2002. p. 7.
[36] Alfonso Valdes, Keith Skinner. Probabilistic Alert Correlation. SRI International; In the 2001 International Workshop on the RAID, 2001, pp. 54-68. Springer-Verlag Berlin Heidelberg , 2001, W. Lee, L. Me, and A. Wespi (Eds).
[37] Tadeusz Pietraszek, Axel Tanner. Data mining and Machine Learning – Towards Reducing False Positives in Intrusion Detection. IBM Zuurich Research Laboratory, Ruschlikon, Suécia, 2005. Information Security Technical Report, Vol. 10, ed. 3, pp 169-183.
[38] Benjamin Morin, Hervé Debar. Correlation of Intrusion Symptoms: An Application of Chronicles. France Télécom R&D; In the 6th International Conference on RAID, 2003, PP. 94-112. Springer-Verlag - Berlin Heidelberg , 2003, G. Vigna, E. Jonsson, and C. Kruegel (Eds.).
[39] Ron Gula. Correlating IDS Alerts with Vulnerability Information. Chief Technology Officer – Tenable Network Security; Columbia, MD, EUA, 2007. p. 10.
[40] Peng Ning; Yun Cui; Douglas Reeves S. . Analyzing Intensive Intrusion Alerts via Correlation. North Carolina State University; In the 5th International Symposium on RAID, 2002, p. 21. Raleigh, NC, EUA, .
[41] A. A. A. Silva, “A security event analisys system to identify false positive alerts and evaluate isolated alerts creating multi-correlation criteria”. IPT; São Paulo, SP, Brasil, 2010, 107 f. Masters Dissertation in Computer Engeneering.
[42] N. Ye, X. Li, Q. Chen, S. M. Emran, M. Xu, "Probabilistic techniques for IDS based on computer audit data”, In the IEEE Transactions on Systems, Man and Cybernetics, pages 266-274, IEEE, 2001.
[43] N. Ye, S. Vilbert, Q. Chen, "Computer intrusion detection through EWMA for autocorrelated and uncorrelated data", In the IEEE Transactions on Reliability, pages 75-82, IEEE, 2003.
[44] W. Wong, X. Guan, X., Zhang, L. Yang, "Profiling program behavior for anomaly intrusion detection based on the transition and frequency property of computer audit data", In the ELSEVIER Computer & Security, 2006.
[45] NIST/SEMATECH, e-Handbook of Statistical Methods, 2009, www.itl.nist.gov/.
[46] S. W. Roberts, "Control Chart Tests Based On Geometric Moving Average", Technometrics, pages 239-251,1959.
[47] E. L. Feitosa, E. J. Souto, D. Sadok,. “Tráfego Internet não Desejado: Conceitos, Caracterização e Soluções”. in Proc. VIII SBSeg, SBC. 2008 pp. 91-137.
186