Applied Geospatial Perspectives on the Rock Art of the Lake of the Woods Region of Ontario, Canada.
17
October-December 2011, Vol. 2, No. 4 Special Issue on The Past Informing the Future: Applied Geospatial Solutions Editorial Preface i G. Rebecca Dobbs, University of North Carolina at Chapel Hill, USA Mary B. Ruvane, University of North Carolina at Chapel Hill, USA Research Articles 1 Visualizing Plant Community Change Using Historical Records Evelyn Brister, Rochester Institute of Technology, USA Elizabeth Hane, Rochester Institute of Technology, USA Karl Korfmacher, Rochester Institute of Technology, USA 19 Historical GIS as a Platform for Public Memory at Mammoth Cave National Park Katie Algeo, Western Kentucky University, USA Ann Epperson, Western Kentucky University, USA Mahew Brunt, Western Kentucky University, USA 37 Cultural Dasymetric Population Mapping with Historical GIS: A Case Study from the Southern Appalachians George Towers, Concord University, USA 56 The Efficacy of Aerial Search During the Bale of Midway Denis J. Dean, University of Texas at Dallas, USA 76 Applied Geospatial Perspectives on the Rock Art of the Lake of the Woods Region of Ontario, Canada John W. Norder, Michigan State University, USA Jon W. Carroll, Michigan State University, USA 92 Showing the Past: Integrating Cartographic Collections Through Virtual Map Rooms Willington Siabato, Technical University of Madrid, Spain Alberto Fernández-Wyenbach, Technical University of Madrid, Spain Miguel-Ángel Bernabé-Poveda, Technical University of Madrid, Spain InternatIonal Journal of applIed GeospatIal research Table of Contents
-
Upload
michiganstate -
Category
Documents
-
view
1 -
download
0
Transcript of Applied Geospatial Perspectives on the Rock Art of the Lake of the Woods Region of Ontario, Canada.

October-December 2011, Vol. 2, No. 4
SpecialIssueonThePastInformingtheFuture:AppliedGeospatialSolutions
EditorialPrefacei G.RebeccaDobbs,UniversityofNorthCarolinaatChapelHill,USA MaryB.Ruvane,UniversityofNorthCarolinaatChapelHill,USA
ResearchArticles 1 VisualizingPlantCommunityChangeUsingHistoricalRecords EvelynBrister,RochesterInstituteofTechnology,USA ElizabethHane,RochesterInstituteofTechnology,USA KarlKorfmacher,RochesterInstituteofTechnology,USA19 HistoricalGISasaPlatformforPublicMemoryatMammothCaveNationalPark KatieAlgeo,WesternKentuckyUniversity,USA AnnEpperson,WesternKentuckyUniversity,USA MatthewBrunt,WesternKentuckyUniversity,USA
37 CulturalDasymetricPopulationMappingwithHistoricalGIS:ACaseStudyfromtheSouthernAppalachians
GeorgeTowers,ConcordUniversity,USA
56 TheEfficacyofAerialSearchDuringtheBattleofMidway DenisJ.Dean,UniversityofTexasatDallas,USA
76 AppliedGeospatialPerspectivesontheRockArtoftheLakeoftheWoodsRegionofOntario,Canada
JohnW.Norder,MichiganStateUniversity,USA JonW.Carroll,MichiganStateUniversity,USA
92 ShowingthePast:IntegratingCartographicCollectionsThroughVirtualMapRooms WillingtonSiabato,TechnicalUniversityofMadrid,Spain AlbertoFernández-Wyttenbach,TechnicalUniversityofMadrid,Spain Miguel-ÁngelBernabé-Poveda,TechnicalUniversityofMadrid,Spain
InternatIonal Journal of applIed GeospatIal research
Table of Contents

76 International Journal of Applied Geospatial Research, 2(4), 76-91, October-December 2011
Copyright © 2011, IGI Global. Copying or distributing in print or electronic forms without written permission of IGI Global is prohibited.
Keywords: Geographic Information Systems (GIS), Hunter-Gatherer Studies, Indigenous Studies, Information Exchange, Least Cost Path Analysis, Monte Carlo Simulation, Pictographs, Point Pattern Analysis, Symbolic Communication
INTRODuCTION
The study of rock art has been an area of ar-chaeological interest for well over a century. However, it has only been within the past three decades that this heritage resource has gained mainstream disciplinary attention. Researchers have become increasingly aware of the signifi-cance of these sites as records of the ideologies, histories, politics, and religions of early societies ranging in complexity from hunter-gatherers
Applied Geospatial Perspectives on the Rock
Art of the Lake of the Woods Region of Ontario, Canada
John W. Norder, Michigan State University, USA
Jon W. Carroll, Michigan State University, USA
AbSTRACTThis study examines the role of rock art in the construction of Woodland Period (300 BC to AD 1700) hunter-gatherer landscapes in the Lake of the Woods region of northwestern Ontario. The authors examine the distribution of documented pictograph sites relative to the locations of rock formations where the geologic conditions would have favored the placement of pictographic rock art but are absent. Point pattern analysis, Monte Carlo simulation, and least cost path analysis were used to analyze the findings. The authors suggest that pictograph sites were placed at points on the landscape along water routes to facilitate information exchange among highly mobile hunter-gatherers.
of the Upper Paleolithic to the empires of Ancient Egypt and Rome. In addition, rock art has been an area of greater efforts in heritage management plans as increased development, air pollution, and other human-related factors have either destroyed, degraded, or currently threaten these sites. In this context, the study of rock art sites takes on greater urgency, not only for archaeologists, but for people with connected histories to these places such as those in this study.
This study examines the role of rock art in the construction of Woodland Period (300
DOI: 10.4018/jagr.2011100105

International Journal of Applied Geospatial Research, 2(4), 76-91, October-December 2011 77
Copyright © 2011, IGI Global. Copying or distributing in print or electronic forms without written permission of IGI Global is prohibited.
BC to AD 1700) hunter-gatherer landscapes in the Lake of the Woods region of northwestern Ontario (Figure 1). Across the broader Cana-dian Shield, in which the study area is located, rock art has long been suggested as a means by which ancestral Algonquian Indian communi-ties communicated information. The majority of research has focused on images at these sites and has been informed by ethnohistoric research and ethnographic fieldwork among Algonquian speaking peoples of the region – the Cree, Ojibwe, and Salteaux First Nations (Dewdney & Kidd, 1972; Conway, 1993; Molyneaux, 1980; Rajnovich, 1989, 1994; Steinbring, 1992; Vastokas & Vastokas, 1973). Interpretations derived from this research have emphasized religious and ritual meanings of these sites in terms of cosmological significance, ritual practice, and as components of the spiritual landscape of historic and ancestral Algonquian Indian communities. Recent and current re-search has focused more on this latter topic further linking these places to descendant First Nations aboriginal communities as part of their contemporary cultural landscapes (Arsenault, 2004; Norder, 2007, in press-a).
This paper builds on work conducted by one of the authors (Norder, 2003) that examines an additional area of study by focusing on the
potential significance of pictographic rock art site placement not just as part of a spiritual landscape, but as part of the broader social landscape of the makers. Fieldwork conducted in 2000 (Norder, 2003) and 2005 (Norder, in press-b) strongly suggested that locations of pictographs, or painted rock art sites (Figure 2), were intentionally selected and placed on the landscape to foster forms of secular infor-mation exchange related to population mobil-ity, and seasonal aggregation. Despite these initial findings, it has remained to be determined more conclusively whether the spatial distribu-tion on the landscape is a result of random behavior or if there is some form of patterning associated with their production. Using point pattern analysis, Monte Carlo simulation, and least cost path analysis, we propose that picto-graph sites were placed in strategic locations along specific water routes, which served to foster information exchange and guide travel and other forms of secular human activities and behaviors. Understanding this intentional place-ment of pictographs speaks to how these pre-Contact aboriginal communities actively used the landscape to facilitate information exchange predictably across space and time in structured and sophisticated manners that have previ-ously been overlooked.
Figure 1. Example of a CSRAT pictograph site (photograph by J. Norder)

78 International Journal of Applied Geospatial Research, 2(4), 76-91, October-December 2011
Copyright © 2011, IGI Global. Copying or distributing in print or electronic forms without written permission of IGI Global is prohibited.
PICTOGRAPHIC ROCK ART IN NORTHWESTERN ONTARIO
Rock art within the study area is considered to be part of a larger regional expression of rock art referred to as the Canadian Shield Rock Art Tradition (CSRAT). The CSRAT has a site distribution that spreads from Quebec in the east through the upper Great Lakes region and west-ward up through Manitoba into Saskatchewan. This geographic range is roughly equivalent to the spread of members of sub-Arctic Algon-guian speaking peoples that include, as noted above, groups of Ojibwe, Cree, Saulteaux and a variety of other culturally and linguistically related groups. As a result, and with support-ing archaeological evidence, CSRAT sites are considered to be Algonquian in origin and this recognition has subsequently been used as justification for application of historic and ethnohistoric accounts to the interpretations of these locations.
Rock art in the CSRAT occurs in four forms. The first, and the subject of the authors’ research here, are pictographs (Figure 2). These also are the dominant rock art form of the CS-RAT. The second are petroglyphs, which are images that are carved, incised or pecked into a stone surface. The third are petroforms, and
specifically refer to arrangements or alignments of boulders that either depict recognizable hu-man/animal figures or form abstract geometric patterns. The fourth and last are an unusual form of geoglyph, referred to in the region as lichenographs, and are made by the scraping away of surface molds and lichens from a rock surface to create an image.
While the majority of pictographic rock art in northwestern Ontario is likely pre-European in origin the exact time span of its production is not known with any certainty. Part of this stems from the nature of the production of the art itself. The primary pigment used in the production of CSRAT pictographs, derived from the ground mineral red ocher, is not dateable by any direct means (Keyser & Klassen, 2001; Nieves, 2006). However, it should be noted that based on eth-nohistoric and ethnographic sources red ocher was likely mixed with an organic binding agent, usually some form of animal fat or fish oil that would have been dateable. Nevertheless, direct exposure to the extreme seasonal weathering processes of the region would have dissolved this organic component after a relatively short period of time. Regardless, there is sufficient cir-cumstantial evidence based on multiple lines of ethnographic, ethnohistoric, and archaeological evidence to suggest an antiquity consistent with
Figure 2. Location of study area

International Journal of Applied Geospatial Research, 2(4), 76-91, October-December 2011 79
Copyright © 2011, IGI Global. Copying or distributing in print or electronic forms without written permission of IGI Global is prohibited.
the Woodland Period of the region (Rajnovich, 1994; Arsenault et al., 1995), during which the most developed hunting and gathering societies inhabited the region (Reid, 1977).
As with rock art globally, difficulty in direct dating has focused most research on the pursuit of the meaning of rock art imagery (Chippendale & Nash, 2004; Chippendale & Taçon, 1998; Clotte & Lewis-Williams, 1998; Coulson & Campbell, 2001; David, 2001; Diaz-Granados & Duncan, 2004; Domingo-Sanz, Fiore, & May, 2008; Hays-Gilpin, 2003; Helskog, 2001; Keyser & Klassen, 2001; Layton, 1992; Loen-dorf, Chippendale, & Whitley 2005; Nash & Chippendale, 2002; Schaafsma, 1980). Within the study region considerable effort has been made to interpret the rock art imagery using methods of standard stylistic analysis combined with ethnographic studies of the Algonquian descendants of the makers (Rajnovich, 1989, 1994; Conway, 1993; Conway & Conway, 1990; Dewdney, 1975; Dewdney & Kidd, 1967; Vastokas & Vastokas, 1973).
The results of these studies have shed a great deal of insight into elements of cosmological and ritual behaviors and meanings associated with these sites, but as with dating, the precise meaning of any given composition remains elusive. As noted by many of the researchers (Rajnovich, 1994; Dewdney & Kidd, 1967), despite insights provided by ethnographic and ethnohistoric sources, any single image could represent any number of real world phenomena or cultural ideological concepts. As a result, without direct transmission of a composi-tion’s meaning from maker to audience and transgenerationally from that point onward the meaning of a rock art site becomes altered or lost. As ethnographic fieldwork conducted with contemporary Algonquian descendants of the makers in 2005 indicated, this was much the case (Norder, 2007, in press-a).
To date, systematic documentation and research of the rock art of Lake of the Woods has been limited, with the majority of surveys conducted either by provincial government ar-chaeologists in a patchwork fashion throughout the region (Lambert, 1985; Pastershank, 1989;
Rusak, 1992) or as part of single or specific site comparisons (Conway, 1989; Rajnovich, 1980a, 1980b; Steinbring & Simpson, 1983). The first systematic survey of the region was begun by Norder in 2000 and elaborated substantially in 2005. The goal of the initial survey in 2000 was to research the potential for identifying functional sites types based upon information encoded in a given rock art site, a determination based on the use of the Shannon Information Measure (Hartley, 1992; Hartley & Vawser, 1998; Shannon, 1949). The measure determines the relative ease with which an observer would be able to interpret a given message based on the redundancy of the content of the composi-tion. Initial results suggested that there were at least three different types of sites that com-municated messages of particular significance to anyone with a basic familiarity with the regional iconography. In this context, most northern Algonquian-speaking peoples would have had this knowledge since they shared similar cosmological, ritual, and iconographic systems (Norder, 2003, in press).
Turning to the research presented here, there were several questions that remained after analysis of the results of the 2000 survey data that we have since sought to address with the survey work conducted in 2005. First and foremost was to try and develop a more complete understanding of the distribution of pictograph sites in a given area. The work of prior researchers, including that conducted by Norder in 2000 (Norder, 2003), remained lim-ited and opportunistic in its regional coverage. As a result, it was not possible to determine if the distribution of the sites was the result of documentary bias or not. Much of the analysis that follows addresses this issue, but it also examines additional factors related to issues of site placement. As we will demonstrate, an-cestral First Nations populations of the region clearly had numerous choices available to them but there was intentional selection of particular locations over others. The identification of intentional spatial placement on the landscape and selection of specific locations due to cultur-ally significant geomorphological features will

80 International Journal of Applied Geospatial Research, 2(4), 76-91, October-December 2011
Copyright © 2011, IGI Global. Copying or distributing in print or electronic forms without written permission of IGI Global is prohibited.
hopefully facilitate interpretations regarding the broader social significance of CSRAT rock art and potentially in other comparable socio-environmental contexts.
SuRVEy METHODOLOGy
One of the primary features of the survey methodology employed in both 2000 and 2005 was a 100% shoreline survey of a selection of bodies of water and navigable river systems in the study region. While this methodology was a standard feature of provincial archaeological projects done during the preceding decades (Adams, 1983; Halverson, 1988; Lambert, 1985; Pastershank, 1989; Rusak, 1989, 1992) where the focus was on locating pictographic and other types of rock art sites, the methodol-ogy employed by Norder (2003) was to locate not only pictographic rock art sites but to also document locations where pictographic art could have been placed, referred to from this point forward as ‘sterile’ locations.
The identification of sterile locations was based on two main criteria. First, they had to be clean surfaces relatively free of the ubiquitous growths of regional lichens and molds and, as a result, would have been suitable ‘canvases’ for rock art imagery. Second, they would need to be relatively easy to see from the water, a com-mon feature of nearly all documented CSRAT pictograph sites. As a result, the surface angle of the rock face to the water surface had to fall within a range of between 120 to 60 degrees with the ideal, based on normative criteria of other CSRAT pictograph sites, falling between 90 and 70 degrees. These sterile locations were documented in order to demonstrate the rela-tive availability of ‘canvases’ well in excess of those actually selected (Norder, 2003, in press).
In addition, a series of geomorphological variables were documented for both rock art sites and sterile locations. Regional archaeolo-gists have suggested that certain geophysical properties of the sites where pictographs and petroglyphs may be found were also typically located in conjunction with certain surface fea-
tures such as rock overhangs, places to sit, the presence of cracks, quartz or other crystalline mineral veins, orientation along cardinal or ordi-nal directions, angle to water, etc. Such features were demonstrated to have cultural significance to Algonquian communities (Arsenault, 2004; Conway, 1993; Molyneaux, 1980; Steinbring, 1992). Basic statistical analysis determined that there were several of these variables, typically visual elements such as the presence of quartz veins and crevices in the rock surface, that were directly related to the production of rock art sites, confirming elements of these observations (Norder, 2003).
The shoreline surveys conducted in 2000 and 2005 documented 51 pictograph sites (44 previously documented sites and seven new pictograph sites identified in the 2000 survey) and 610 sterile locations (Figure 3). Because of the large number of lakes within the study area, n>2000, a systematic strategy was employed in 2005 that focused on two of the major wa-tersheds that empty into Lake of the Woods (Figure 3). Within these watersheds, comprised of slightly more than 300 navigable lakes and interconnecting waterways, a two-tiered sur-vey was undertaken. All lakes with shorelines greater than 5 km in length were surveyed in these two watersheds, while a 20 percent random sample of those with smaller circumferences were surveyed. Each watershed was further divided into four quadrants for a total of eight survey regions. Six of these were surveyed us-ing this methodology. The remaining two were not due to time and access limitations. Two of the lakes surveyed in 2000 fell into the 2005 survey area and were resurveyed to check for consistency of documentation procedures be-tween the field seasons. Overall, the combined shoreline surveyed represented approximately 60 – 70% of the total available shoreline of all bodies of water in the surveyed quadrants.
In addition to the documentation proce-dures noted above sites were also coded for particular image types based on a hybrid clas-sification system of those previously developed for Canadian Shield pictographic art (Dewdney

International Journal of Applied Geospatial Research, 2(4), 76-91, October-December 2011 81
Copyright © 2011, IGI Global. Copying or distributing in print or electronic forms without written permission of IGI Global is prohibited.
& Kidd, 1967; Maurer & Whelan, 1977; Whelan, 1983) and consisted of 10 major image classes and 57 sub-classes. This information was used in the information calculation noted above. Point locations for both pictographs and sterile locations were collected using a Garmin GPSMAP 60 and then imported into ArcGIS 9.3. A Microsoft Access personal database was created and populated to manage survey data that was later tied to point locations.
ANALySIS
Our main object here is to determine the degree to which rock art sites occur in discrete, non-random spatial patterns on the landscape. Point pattern analysis was selected first to determine if these sites were arranged in an ordered manner or if they were scattered randomly across the landscape. The nearest neighbor analysis (Table 1) indicates clustering for both sites and sterile formations at the 0.01 significance level. This was not unexpected given that the distribution of water bodies is relatively ubiquitous across the survey area and the availability of surfaces with both rock art and sterile locations on any given body of water was generally only limited by the size of the water body. In other words, every lake surveyed had available and/or utilized surfaces. As clustering was demonstrated for both location types we decided to take another approach toward understanding the patterning of both sites and sterile formations.
Global and Local Moran’s I
The global Moran’s I statistic (Mitchell, 2005; O’Sullivan & Unwin, 2003) was used because of its ability to analyze point patterns and assess distributions across a region based on specific criteria. In this case, the variable that we were concerned with was the presence or absence of rock art. A local Moran’s I (LISA) test (Anselin, 1995) was subsequently run to identify any further clustering at a local scale (O’Sullivan & Unwin, 2003). These calcula-tions were both run to determine the degree to which rock art sites (represented as points in
the GIS) were either clustered, dispersed, or distributed randomly throughout the study area (represented as polygons) (Conolly & Lake, 2006; O’Sullivan & Unwin, 2003; Wong & Lee, 2005). Both documented pictograph sites (n=51) and sterile formations (n=610) were grouped and included in the calculation, with the pres-ence of pictographs serving as the variable used to assess spatial autocorrelation (Wheatley & Gillings, 2002). Our null hypothesis for these two tests was that there was no significant statistical difference in spatial autocorrelation between pictograph sites and sterile formations.
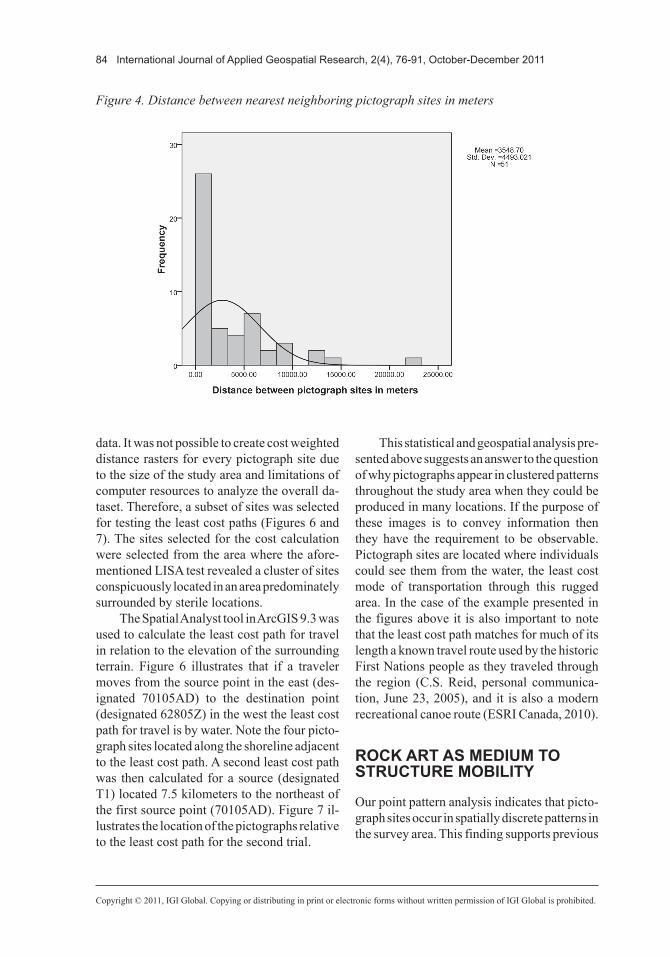
The results of the global Moran’s I trial using the values from the survey datasets re-sulted in a Moran’s I index of 0.11 at the 0.05 significance level with a z score of 2.01 and a critical value of 1.96. These scores indicate that rock art sites in the survey area occur in a clustered pattern with less than a 5% chance that the clustering is due to random chance. Where the global Moran’s I is able to charac-terize spatial autocorrelation across the study area as a whole the LISA test is able to pinpoint whether clustering is occurring at local scales. The results indicated that 74.5% (n=38) of the pictograph sites demonstrated clustering at the 0.05 significance level, demonstrating a high positive z score meaning that these sites are clustered around other sites (Mitchell, 2005; O’Sullivan & Unwin, 2003). There is a no-ticeable fall-off in site placement as distance between pictograph sites increase. Forty-nine percent (n=25) of sites are located within 1 kilometer of another site with a mean distance of 3.5 kilometers between sites (Figure 4). One smaller subset of pictograph sites (15.6%, n=8) were clustered in an area where predominately sterile formations exist. Low negative z scores associated with these sites indicate that they are surrounded by locations with dissimilar values (Mitchell, 2005; O’Sullivan & Unwin, 2003).
The results of both spatial analyses are not conclusive enough to support an interpretation without further exploration at the global scale. Taken as a static distribution of sites, there remains the possibility that clustering is a result of random chance. To address this issue we
82 International Journal of Applied Geospatial Research, 2(4), 76-91, October-December 2011
Copyright © 2011, IGI Global. Copying or distributing in print or electronic forms without written permission of IGI Global is prohibited.
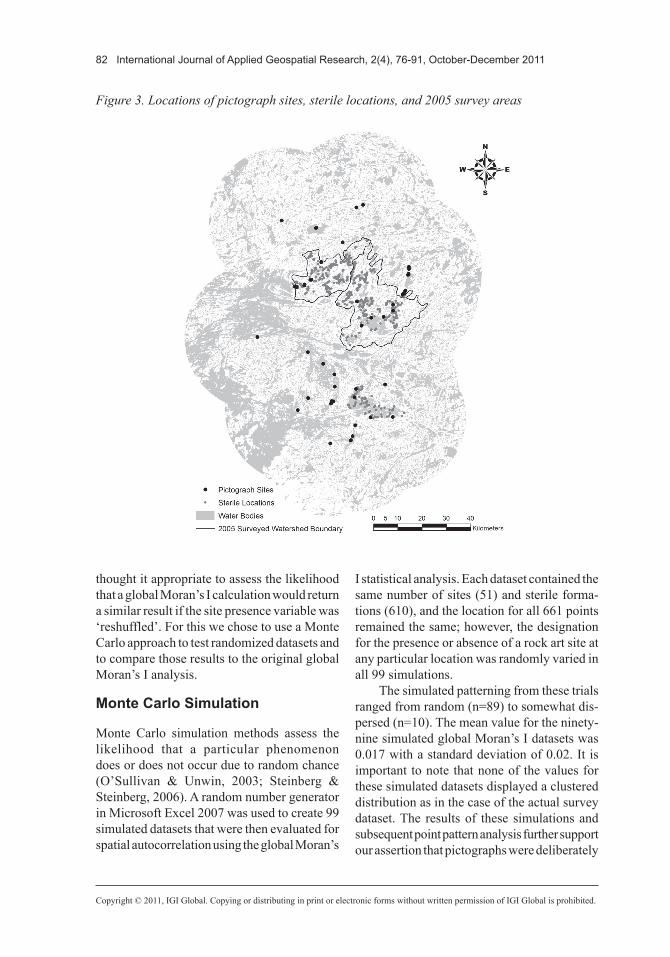
thought it appropriate to assess the likelihood that a global Moran’s I calculation would return a similar result if the site presence variable was ‘reshuffled’. For this we chose to use a Monte Carlo approach to test randomized datasets and to compare those results to the original global Moran’s I analysis.
Monte Carlo Simulation
Monte Carlo simulation methods assess the likelihood that a particular phenomenon does or does not occur due to random chance (O’Sullivan & Unwin, 2003; Steinberg & Steinberg, 2006). A random number generator in Microsoft Excel 2007 was used to create 99 simulated datasets that were then evaluated for spatial autocorrelation using the global Moran’s
I statistical analysis. Each dataset contained the same number of sites (51) and sterile forma-tions (610), and the location for all 661 points remained the same; however, the designation for the presence or absence of a rock art site at any particular location was randomly varied in all 99 simulations.
The simulated patterning from these trials ranged from random (n=89) to somewhat dis-persed (n=10). The mean value for the ninety-nine simulated global Moran’s I datasets was 0.017 with a standard deviation of 0.02. It is important to note that none of the values for these simulated datasets displayed a clustered distribution as in the case of the actual survey dataset. The results of these simulations and subsequent point pattern analysis further support our assertion that pictographs were deliberately
Figure 3. Locations of pictograph sites, sterile locations, and 2005 survey areas

International Journal of Applied Geospatial Research, 2(4), 76-91, October-December 2011 83
Copyright © 2011, IGI Global. Copying or distributing in print or electronic forms without written permission of IGI Global is prohibited.
placed at locations for reasons that were not explainable by the earlier research of others, leaving the question remaining of “why these places?”
Site Choice
The original study done by Norder (2003) assessed the relationships between several geomorphological variables including the fol-lowing: panel orientation, rock face angle, and outcrop surface area. For these he found no sta-tistically significant relationship to pictograph sites suggesting they were not variables con-sidered in the choice of pictograph creation. We further analyzed a subset of the pictograph sites (n=26) and sterile locations (n=139) compiled from the 2000 survey dataset (Norder, 2003). One geomorphological factor crucial to both image creation and visibility, the angle of the rock face in relation to water surface, was used for the trial. This variable is significant for site selection because open-air pictograph sites – versus sheltered, hidden, or cave sites – need to be created in places where people will encounter them if they are to facilitate communication. Rock face angle (measured in degrees) for both sites and sterile formations was compared for statistically significant differences between the two groups using an independent samples t test performed in SPSS 16.0 (Sirkin, 1999). The results of the t test (two- tailed significance = 0.192) indicate that there is no significant differ-ence at the 0.05 level (Norusis, 2008) between the pictograph sites and sterile formations in terms of rock face angle (Table 2), and this is consistent with Norder’s (2003) analysis.
Least Cost Path Analysis
Norder (2003) observed that all documented rock art sites are easily observable from pass-ing watercraft. This is especially important to consider when understanding how hunter-gatherers interact with and within this particular environment. Patterns of hunter-gatherer socio-spatial organization differ across the world and the need to move across the landscape varies depending on physical geography, subsistence strategies, territorial behaviors, and a host of other considerations (Binford, 2001; Kelly, 1995; Wendrich & Barnard, 2008). In the Lake of the Woods region travel by water or alongside waterways was the primary means of travel year-round for any sort of long distance movement. Consequently, this had a clear influence on how ancestral Algonquian peoples viewed and interacted with the landscape in terms of social practice and ideological belief (Norder, 2003). It is also no coincidence that water travel is the easiest way to negotiate this rugged terrain.
A further critical step in developing our understanding of how pictograph sites func-tion is to analyze least cost paths and their relation to known transportation routes (Lock, 2000; Wheatley & Gillings, 2002). To this end, topographic and hydrologic GIS data in both vector and raster formats were obtained from the Geography Network Canada (ESRI Canada, 2010) and values were combined to form a cost weighted distance raster (McCoy & Johnston, 2002) with a pictograph site serving as the source for the cost calculations (Figure 5). The cost raster was assigned a 10-meter cell size to reflect the same contour intervals as the vector
Table 1. Nearest neighbor analysis for both sites and sterile formations
Sites Sterile Formations
N 51 610
Nearest Neighbor Ratio .67 .35
Z-score -4.38 -30.83
Critical Value -2.58 -2.58
84 International Journal of Applied Geospatial Research, 2(4), 76-91, October-December 2011
Copyright © 2011, IGI Global. Copying or distributing in print or electronic forms without written permission of IGI Global is prohibited.
data. It was not possible to create cost weighted distance rasters for every pictograph site due to the size of the study area and limitations of computer resources to analyze the overall da-taset. Therefore, a subset of sites was selected for testing the least cost paths (Figures 6 and 7). The sites selected for the cost calculation were selected from the area where the afore-mentioned LISA test revealed a cluster of sites conspicuously located in an area predominately surrounded by sterile locations.
The Spatial Analyst tool in ArcGIS 9.3 was used to calculate the least cost path for travel in relation to the elevation of the surrounding terrain. Figure 6 illustrates that if a traveler moves from the source point in the east (des-ignated 70105AD) to the destination point (designated 62805Z) in the west the least cost path for travel is by water. Note the four picto-graph sites located along the shoreline adjacent to the least cost path. A second least cost path was then calculated for a source (designated T1) located 7.5 kilometers to the northeast of the first source point (70105AD). Figure 7 il-lustrates the location of the pictographs relative to the least cost path for the second trial.
This statistical and geospatial analysis pre-sented above suggests an answer to the question of why pictographs appear in clustered patterns throughout the study area when they could be produced in many locations. If the purpose of these images is to convey information then they have the requirement to be observable. Pictograph sites are located where individuals could see them from the water, the least cost mode of transportation through this rugged area. In the case of the example presented in the figures above it is also important to note that the least cost path matches for much of its length a known travel route used by the historic First Nations people as they traveled through the region (C.S. Reid, personal communica-tion, June 23, 2005), and it is also a modern recreational canoe route (ESRI Canada, 2010).
ROCK ART AS MEDIuM TO STRuCTuRE MObILITy
Our point pattern analysis indicates that picto-graph sites occur in spatially discrete patterns in the survey area. This finding supports previous
Figure 4. Distance between nearest neighboring pictograph sites in meters

International Journal of Applied Geospatial Research, 2(4), 76-91, October-December 2011 85
Copyright © 2011, IGI Global. Copying or distributing in print or electronic forms without written permission of IGI Global is prohibited.
research interpretations by Norder (2003) that pictograph site locations were deliberately se-lected. That is to say, while the creators of rock art had many options in terms of where they could place these images, the results presented above indicate that these locations were selected for reasons that were not defined by just the availability of surfaces. Some of these choices were defined by certain aspects of surface geo-morphology associated with Algonquian reli-gious and cosmological beliefs (Conway, 1993; Norder, 2003; Steinbring, 1992), but given the patterning demonstrated by our analysis there is reason to suggest that other social factors were also a consideration. In this case, linear pattern-ing and clustering of sites along least cost paths, which, in some documented cases follow known historic Indigenous travel routes, indicates that Woodland period peoples may have used these sites to structure population movements at the regional scale, at least. In sum, the creation and subsequent use of pictographic rock art in the study area were the results of social processes that required decisions regarding placement and what type of information to communicate, which could be either sacred, secular or, more likely, a combination of the two.
In regards to the potential secular informa-tion encoded in these pictograph sites Norder
(2003, in press-b) proposed that there were at least three different classes of pictographs that communicated different types of information, each ranging from general to specialized in their content. Drawing from both information theory and ethnohistorical accounts, he suggested that these sites and their active use facilitated the exchange of information relating to factors in-cluding group identity, land tenure, the locations of economically significant resources, ritual practice and belief, and broader Algonquian cosmology. Within a landscape of abundant lacustrine and riverine features, the primary mode of travel was via water either by canoe from late spring to fall or by foot when they were frozen over.
In this environmental context the placement of pictographs throughout the region in specific locations would have been, according to Norder (2003), strategic in both facilitating population movements and providing information to travel-ers as they passed by specific site types. Given the nature of Woodland period communities inhabiting the region at large people were not ignorant of territorial considerations and other social obligations (Howey, 2007). Rather, the people who created these images were hunting, gathering and fishing specialists who needed to plan and coordinate strategic movements across
Table 2. Results of independent samples t test for rock face angle to water surface
Group Statistics
Site Present N Mean
Std. De-viation Std. Error Mean
No 139 88.5612 4.74894 .40280
Yes 26 90.0000 6.92820 1.35873
Assumptions=Equal variances assumed
Levene’s Test for Equality of Variances t Test for Equality of Means
F Sig. t dfSig.
(2-tailed)Mean
DifferenceStd. Error Difference
95% Confidence Interval of the Dif-
ference
Lower Upper
An-gle 2.264 0.134 -1.309 163 0.192 -1.43885 1.09902 -3.60900 .73130

86 International Journal of Applied Geospatial Research, 2(4), 76-91, October-December 2011
Copyright © 2011, IGI Global. Copying or distributing in print or electronic forms without written permission of IGI Global is prohibited.
the landscape in order to access the diverse and seasonably abundant resource base. Examples would include, but not be limited to, wild rice fields, spring fish spawning areas (Reid, 1977), and intercept locations for migratory caribou herds (John O’Shea, personal communication, January 6, 2010).
These strategic movements, known as residential and logistical population mobility, are practiced in diverse manners by small scale hunting and gathering communities across the globe (Barnard & Wendrich, 2008; Binford, 1980; Kelly, 1995). For our purposes we refer to population mobility in the sense defined by Wendrich and Barnard (2008) where the term refers to the requirement, capability, and choice of humans to access culturally defined resources across the landscape. The social context of First Nations communities was one where mobile Algonquian communities practiced alternating patterns of aggregation and dispersal, typi-cally at the band and family level, at different points during the year for social, economic, and ideological purposes (Norder, 2003; Reid, 1977). In this sense, social interaction between hunter-gather communities served to buffer the uncertainty of resources and share risk with
other groups, ensuring that families and com-munities survived during periods of resource scarcity (Halstead & O’Shea, 1982).
In this setting, pictographic rock art in their easily visible locations would have provided in-formation not only in the absence of face-to-face communication, the primary means of obtaining the above information needed for scheduling and exploitation of regional resources, but would have indicated through their content, placement, and active use where people could likely be found. Active use could have been through the renewal or addition of images at a pictograph site, but the most expedient method of demonstrating use would have been to leave offerings of some type that would have been eas-ily visible to those passing by. This latter practice was docmented in both the ethnohistoric and ethnographic literature in the region (Norder, 2003; Rajnovich, 1994) and is a practice still done today by Algonquian communities living in the region (Norder, 2007, in press-a). Overall, we would argue that pictograph sites served as points on the landscape where people could access information that was spatial, temporal, social, and spiritual in nature, which provided guidance and minimized the potential for social
Figure 5. Location of pictographs relative to first least cost path trial

International Journal of Applied Geospatial Research, 2(4), 76-91, October-December 2011 87
Copyright © 2011, IGI Global. Copying or distributing in print or electronic forms without written permission of IGI Global is prohibited.
Figure 6. Location of pictographs relative to second least cost path trial
Figure 7. Location of the pictographs relative to the least cost path for the second trial

88 International Journal of Applied Geospatial Research, 2(4), 76-91, October-December 2011
Copyright © 2011, IGI Global. Copying or distributing in print or electronic forms without written permission of IGI Global is prohibited.
miscommunication in regards to how resources were both available and could be accessed in a landscape where others had prior claim.
CONCLuSION
The purpose of this investigation has been to develop a broader understanding for both the placement and function of pictograph sites in the Lake of the Woods region of Ontario. Point pattern analysis, Monte Carlo simulation and least cost path analysis indicate that pictograph sites were placed throughout the study area in linear and non-linear clusters that were lo-cated along likely travel routes and locations were people were likely to aggregate. These pictograph distributions afforded ancestral Al-gonquian peoples the opportunity to maximize information exchange while minimizing the cost of transportation by having clearly marked routes of travel. This is an important advantage for highly mobile, spatially dispersed hunter-gatherers who needed to access resources and maintain social ties across a relatively large landscape, such as that of the study area.
The application of these results to contem-porary research has important implications for considering how rock art is perceived in the mainstream literature. Less than a handful of studies of rock art have applied geospatial meth-odologies to any significant degree (Bradley, 1997; Hartley &Vawser, 1998; McCall, 2010; Norder, 2003; Robinson, 2010; Smith, 2001) despite the recognition of landscape as a sig-nificant aspect of the overall social context of these sites (Chippendale & Nash, 2004; David, 2001; Nash & Chippendale, 2002). The work here contributes to an expanded view of rock art as part of a more holistic conception of cultural landscapes in mobile hunter-gatherer societies, and recognizes the significance of these sites in secular as well as sacred contexts.
As a final note, we want to reiterate the importance of these sites not only to research but as heritage resources important to contem-porary community and national histories and
identities. Within northwestern Ontario, because of human-induced environmental change, these sites are vulnerable as are rock art sites worldwide. For example, since one of the one of the authors began visiting these sites in 1998 in northwestern Ontario, the past 12 years has seen the degradation of several of them at a pace that belies their great antiquity. In other areas of northwestern Ontario, humans have defaced these sites with graffiti or removed portions of sites for private collections or sale. These sites are valuable cultural resources that need to be preserved for future generations. Without them, we will be missing important information that helps us to understand how people have interacted across space and time and the rich heritage of First Nations communities.
REFERENCES
Adams, N. (1983). An archaeological survey of the Nakina Lakes area near Geralton, Ontario. Toronto, ON: Ontario Ministry of Citizenship and Culture.
Anselin, L. (1995). Local indicators of spatial association-LISA. Geographical Analysis, 27(2), 93–115. doi:10.1111/j.1538-4632.1995.tb00338.x
Arsenault, D. (2004). From natural settings to spiritual places in the Algonkian sacred landscape: An archae-ological, ethnohistorical and ethnographic analysis of Canadian Shield rock-art sites . In Chippendale, C., & Nash, G. (Eds.), The figured landscapes of rock-art: Looking at pictures in place (pp. 289–317). New York, NY: Cambridge University Press.
Arsenault, D., Gagnon, G., Martijn, C., & Watchman, A. (1995). Le projet Nisula: recherché pluridisci-plinaire autour d’un site á pictogrammes (DeEh-1) en Haute-Côte-Nord. Archaéologies québécoises, série Paléo-Québec, 23, 17-57.
Balac, A. M., Chapdelaine, C., Clermont, N., & Duguay, F. (Eds.). (1986). Archeologies Quebecoises (pp. 17–57). Montreal, QC, Canada: Recherches Amerindiennes au Quebec.
Barnard, H., & Wendrich, W. (Eds.). (2008). The archaeology of mobility: Old World and New World nomadism. Los Angeles, CA. Los Angeles: University of California.

International Journal of Applied Geospatial Research, 2(4), 76-91, October-December 2011 89
Copyright © 2011, IGI Global. Copying or distributing in print or electronic forms without written permission of IGI Global is prohibited.
Binford, L. (1980). Willow smoke and dogs’ tails: Hunter-gatherer settlement systems and archaeologi-cal site formation. American Antiquity, 45(1), 4–20. doi:10.2307/279653
Binford, L. (2001). Constructing frames of reference: An analytical method for archaeological theory build-ing using hunter-gatherer and environmental data sets. Berkeley, CA: University of California Press.
Bradley, R. (1997). Rock art and the prehistory of Atlantic Europe: Signing the land. New York, NY: Routledge Press.
Chippendale, C., & Nash, G. (Eds.). (2004). The figured landscapes of Rock-Art: looking at pictures in place. New York, NY: Cambridge University Press.
Chippendale, C., & Taçon, P. (Eds.). (1998). The archaeology of rock-art. New York, NY: Cambridge University Press.
Clotte, J., & Lewis-Williams, D. (1998). Shamans of prehistory. New York, NY: Harry N. Abrams Publishing.
Conolly, J., & Lake, M. (2006). Geographical in-formation systems in archaeology. Cambridge, UK: Cambridge University Press.
Conway, T. (1989). Scotia Lake pictograph site: shamanic rock art in northeastern Ontario. Man in the Northeast, 37, 1–23.
Conway, T. (1993). Painted dreams: Native American rock art. Minocqua, WI: Northword Press.
Conway, T., & Conway, J. (1990). Spirits on stone: The Agawa pictographs. Echo Bay, ON, Canada: Heritage Discovery Books.
Coulson, D., & Campbell, A. (2001). African rock art: paintings and engravings on stone. New York, NY: Harry N. Abrams.
David, B. (2001). Landscapes, rock-art and the dreaming: An archaeology of preunderstanding. New York, NY: Continuum.
Dewdney, S. (1975). The sacred scrolls of the south-ern Ojibway. Toronto, ON, Canada: University of Toronto Press.
Dewdney, S., & Kidd, K. (1967). Indian rock paint-ings of the Great Lakes (2nd ed.). Toronto, ON, Canada: University of Toronto Press.
Diaz-Granados, C., & Duncan, J. (Eds.). (2004). The rock-art of Eastern North America: Capturing images and insight. Tuscaloosa, AL: University of Alabama Press.
Domingo-Sanz, I., Fiore, D., & May, S. (Eds.). (2008). Archaeologies of art: Time, place, identity. Walnut Creek, CA: Left Coast Press.
ESRI Canada. (2010). Geography Network Canada. Retrieved from http://www.geographynetwork.ca
Halstead, P., & O’Shea, J. (1982). A friend in need is a friend indeed: Social storage and the origins of social ranking . In Renfrew, C., & Shennan, S. (Eds.), Ranking, resource, and exchange: Aspects of the archaeology of early European society (pp. 92–100). Cambridge, UK: Cambridge University Press.
Halverson, C. (1988). An archaeological survey of Stephen, Cameron, Flint and Kakagi Lakes in Northwestern Ontario. Kenora, ON, Canada: Ontario Ministry of Culture and Communications.
Hartley, R. (1992). Rock art on the northern Colo-rado Plateau: Variability in content and context. Brookfield, VT: Avebury Press.
Hartley, R., & Vawser, A. (1998). Spatial behavior and learning in the prehistoric environment of the Colorado River drainage (southeastern Utah), west-ern North America . In Chippendale, C., & Taçon, P. S. C. (Eds.), The archaeology of rock-art (pp. 185–211). New York, NY: Cambridge University Press.
Hayes-Gilpin, K. (2003). Ambiguous Images: gender and rock art. Walnut Creek, CA: Alta Mira Press.
Helskog, K. (Ed.). (2001). Theoretical perspectives in rock art research. Oslo, Norway: The Institute for Comparative Research in Human Culture.
Howey, M. (2007). Using multi-criteria cost surface analysis to explore past regional landscapes: A case study of ritual activity and social interaction in Michigan, AD 1200-1600. Journal of Archaeo-logical Science, 34(11), 1830–1846. doi:10.1016/j.jas.2007.01.002
Keiser, J., & Klassen, M. (2001). Plains Indian rock art. Seattle, WA: University of Washington Press.
Kelly, R. (1995). The foraging spectrum: Diversity in hunter-gatherer lifeways. Washington, DC: Smith-sonian Institution Press.
Lambert, P. (1985). The Northwestern Ontario rock art project: The 1984 results. Kenora, ON, Canada: Ontario Ministry of Citizenship and Culture.
Layton, R. (1992). Australian rock art: a new syn-thesis. New York, NY: Cambridge University Press.
Lock, G. (2000). Beyond the map: Archaeology and spatial technologies. Oxford, UK: IOS Press.

90 International Journal of Applied Geospatial Research, 2(4), 76-91, October-December 2011
Copyright © 2011, IGI Global. Copying or distributing in print or electronic forms without written permission of IGI Global is prohibited.
Loendorf, L., Chippendale, C., & Whitley, D. (Eds.). (2005). Discovering North American Rock Art. Tuc-son, AZ: University of Arizona Press.
Maurer, J., & Whelan, J. (1977). A Canadian Shield pictograph classification design. American Antiquity, 42(2), 196–202. doi:10.2307/278980
McCall, G. (2010). Changing views of Drakensberg San rock art: Examining landscape use, ritual activ-ity, and contact through multivariate content-based spatial analysis. American Antiquity, 75(4), 773–791.
McCoy, J., & Johnston, K. (2002). Using ArcGIS spatial analyst. Redlands, CA: ESRI Press.
Mitchell, A. (2005). The ESRI guide to GIS analysis: Vol. 2. Spatial measurements and statistics. Redlands, CA: ESRI Press.
Molyneaux, B. (1980). Landscape images: rock paintings in the Canadian Shield. Rotunda: The Magazine of the Royal Ontario Museum, 13, 6–11.
Nash, G., & Chippendale, C. (Eds.). (2002). Eu-ropean landscapes of rock art. New York, NY: Routledge Press.
Nieves, A. (2006). Reconstructing ritual: Some thoughts on the location of petroglyph groups in the Nasca Valley, Peru . In Robertson, E. C., Seibert, J. D., Fernandez, D. C., & Zender, M. U. (Eds.), Space and spatial analysis in archaeology (pp. 217–226). Calgary, AB, Canada: University of Calgary Press.
Norder, J. (2003). Marking place and creating space in northern Algonquian landscapes: The rock-art of the Lake of the Woods region, Ontario. Unpublished doctoral dissertation, University of Michigan, Ann Arbor, MI.
Norder, J. (2007). Iktomi in the land of the May-maygwayshi: Understanding lived experience in the practice of archaeology among American In-dians/First Nations. Archaeologies, 3(3), 230–248. doi:10.1007/s11759-007-9044-6
Norder, J. (in press). -a). The invention and endur-ance of memory and place among First Nations of northwestern Ontario, Canada. International Journal of Historical Archaeology.
Norder, J. (in press-b). Landscapes of memory and presence in the Canadian Shield. In L. Sundstrom & W. DeBoer (Eds.), Enduring motives: The archae-ology of tradition and religion in Native America. Tuscaloosa, AL: University of Alabama Press.
Norusis, M. (2008). SPSS 16.0 statistical procedures companion. Upper Saddle River, NJ: Prentice Hall.
O’Sullivan, D., & Unwin, D. (2003). Geographic information analysis. Hoboken, NJ: Wiley.
Pastershank, G. (1989). An archaeological survey of Sabaskong Bay, Lake of the Woods. Kenora, ON, Canada: Ontario Ministry of Culture and Com-munications.
Rajnovich, G. (1980a). Paired morphs at Cuttle Lake in northwestern Ontario. Canadian Rock Art Research Association Newsletter, 13, 46–50.
Rajnovich, G. (1980b). Two pictographs near Ignace, northwestern Ontario. Canadian Rock Art Research Association Newsletter, 14, 34–38.
Rajnovich, G. (1989). Visions in the quest for medi-cine: an interpretation of the Indian pictographs of the Canadian Shield. Midcontinental Journal of Archaeology, 14(2), 179–225.
Rajnovich, G. (1994). Reading Rock Art: The Indian Rock Paintings of the Canadian Shield. Toronto, ON, Canada: Natural Heritage/Natural History Press.
Reid, C. (1977). Environment, man, and Maymay-gwayshi: The dimensions of past human cultural impact in the Lake of the Woods area. Toronto, ON, Canada: Ministry of Culture and Recreation.
Robinson, D. (2010). Land use, land ideology: an integrated geographic information systems analysis of rock art within south-central California. American Antiquity, 75(4), 792–818.
Rusak, J. (1989). An archaeological survey on a por-tion of the Winnipeg River, Northwestern Ontario. Kenora, ON, Canada: Ontario Ministry of Culture and Communication.
Rusak, J. (1992). The White Otter Lake pictograph project: The 1991 results. Kenora, ON, Canada: Ontario Rock Art Conservation Association.
Schaafsma, P. (1980). Indian rock art of the South-west. Santa Fe, NM: School of American Research.
Shannon, C. (1949). The mathematical theory of com-munication. Urbana, IL: University of Illinois Press.
Sirkin, R. (1999). Statistics for the social sciences. Thousand Oaks, CA: Sage.

International Journal of Applied Geospatial Research, 2(4), 76-91, October-December 2011 91
Copyright © 2011, IGI Global. Copying or distributing in print or electronic forms without written permission of IGI Global is prohibited.
Smith, H. (2001). Rock art and the shape of landscape . In Szabo, J. (Ed.), Painters, patrons and identity: Essays in Native American art to honor J. J. Brody (pp. 211–240). Albuquerque, NM: University of New Mexico Press.
Steinberg, S., & Steinberg, S. (2006). GIS: Geo-graphic information systems for the social sciences: Investigating space and place. Thousand Oaks, CA: Sage.
Steinbring, J. (1992). Phenomenal attributes: sites selection factors in rock art. American Indian Rock Art, 17, 102–108.
Steinbring, J., & Simpson, D. (1983). The Mud Portage site (DkKr-4): a preceramic context for petroglyphs in Northwestern Ontario. American Indian Rock Art, 10, 145–156.
Vastokas, J., & Vastokas, R. (1973). Sacred art of the Algonkians: A study of the Peterborough petroglyphs. Peterborough, ON: Mansard Press.
Wendrich, W., & Barnard, H. (2008). The archaeol-ogy of mobility: Definitions and research approaches . In The archaeology of mobility: Old World and New World nomadism (pp. 1–21). Los Angeles, CA: University of California, Los Angeles.
Wheatley, D., & Gillings, M. (2002). Spatial tech-nology and archaeology: The archaeological ap-plications of GIS. New York, NY: Taylor & Francis. doi:10.4324/9780203302392
Whelan, J. (1983). Context and association in Cana-dian Shield rock art systematic. Canadian Journal of Archaeology, 7(1), 77–84.
Wong, D., & Lee, J. (2005). Statistical analysis of geographic information with ArcView GIS and ArcGIS. Hoboken, NJ: John Wiley & Sons, Inc.
John W. Norder is an Assistant Professor of Anthropology at Michigan State University. He has research interests in contemporary Indigenous community heritage management issues and Native American Ancestral Period archaeology of the upper Great Lakes. Currently, he is involved in continued applied archaeological work with First Nations groups in northwestern Ontario and is developing similar work with Native American tribes in Michigan and Arizona.
Jon W. Carroll is a Doctoral Candidate in the Department of Anthropology at Michigan State University. He has research interests in social exchange and interaction, political and economic organization, and the archaeological applications of Geographic Information Systems (GIS) and social science modeling and simulation.