Application of SMED Methodology and Scheduling in High ...
35
Application of SMED Methodology and Scheduling in High-Mix Low Volume Production Model to Reduce Setup Time: A Case of S Company by Wang Shih-Shun A thesis submitted in partial fulfillment of the requirements for the degree of Master of Engineering in Industrial and Manufacturing Engineering Examination Committee: Dr. Huynh Trung Luong (Chairperson) Dr. Chuang-Chun Chiou (Co-Chairperson) Dr. Pisut Koomsap Dr. Mongkol Ekpanyapong Nationality: Taiwanese Previous Degree: Bachelor of Science in Industrial Engineering and Enterprise Information Tung-Hai University Taiwan Asian Institute of Technology School of Engineering and Technology Thailand May 2019
-
Upload
khangminh22 -
Category
Documents
-
view
0 -
download
0
Transcript of Application of SMED Methodology and Scheduling in High ...
Application of SMED Methodology and Scheduling in High-Mix Low
Volume Production Model to Reduce Setup Time: A Case of S Company
by
Wang Shih-Shun
A thesis submitted in partial fulfillment of the requirements for the
degree of Master of Engineering in
Industrial and Manufacturing Engineering
Examination Committee: Dr. Huynh Trung Luong (Chairperson)
Dr. Chuang-Chun Chiou (Co-Chairperson)
Dr. Pisut Koomsap
Dr. Mongkol Ekpanyapong
Nationality: Taiwanese
Previous Degree: Bachelor of Science in Industrial Engineering and
Enterprise Information
Tung-Hai University
Taiwan
Asian Institute of Technology
School of Engineering and Technology Thailand
May 2019

ii
ACKNOWLEDGEMENTS
This report is the most crucial learning of my study life here in AIT. So now is the time
to express my gratitude to all those who help me to reach this step of success.
First of all, I would like to express my heartily gratitude to my advisor Dr. Huynh Trung
Luong whose guidance always help me to learn many new things in different ways. His
valuable suggestions are truly my inspirations and energy to accomplish this report in the
best way as now it is. I am also indebted with my home university advisor Dr. Chuang-
Chun Chiou whose continuous suggestions help me to gain many experiences for thesis
writing along with rectification of the mistakes occurred. All those support and
suggestions furnishes this report in well-organized format.
Another Unforgettable credit goes to SINBON Company where I accomplish my
internship along with data collection for this report. All my colleague, boss and overall
company’s support helps me gain both academic and professional experiences, so the
word of thanks is inevitable for all of them.
It gives me immense pleasure to thank my parents, siblings and overall family who always
support me in every step of my student and as well as personal life. This report is the
outcome of their believe on me. Without their support it was impossible to even move a
single step for this report to accomplish. My friends, Juniors and seniors are also the one
whom I cannot left behind with vote of thanks. Their moral support was one of my energy
to motivate myself to make this report complete.
Last but not least, here I sincerely express my gratitude to all those visible and invisible
hand who had believe on me and support me with the energy to complete my masters
study program. Once again thank you all for being with me.
iii
Abstract
Nowadays rapid changes in consumer demand determines the production model. The
demand for "single and large quantity" products has gradually turned into a "high-mix
and low volume" product demand. The main problem of high-mix low volume model is
significantly increasing frequency of set up, that leads an increase in set-up time for
production. For set-up reduction strategies, Shingo (1985) proposed single minute
exchange of die (SMED) method. The SMED method makes it possible to reduce setup
operations time within 10 minutes. Therefore, this study takes a cable processing
company as a case for improvement. The potential of faster setup cannot be completely
achieved with SMED method. So, this study eases an optimized scheduling reference
indicator for the molding machine that aid decision makers to determine the sequencing
rule of scheduling by each criterion through the system to achieve maximum benefit for
company.
Keywords: High-Mix and Low Volume, Single Minute Exchange Of Die, Scheduling,
Mathematical model, Case study

iv
TABLE OF CONTENTS
CHAPTER TITLE PAGE
TITLE PAGE i
ACKNOWLEDGEMENTS ii
ABSTRACT iii
TABLE OF CONTENTS iv
LIST OF FIGURES v
LIST OF TABLES
LIST OF ABBREVATIONS
Vi
Vii
1. INTRODUCTION 1
1.1 Background 1
1.2 Statement of the Problems 2
1.3 Objectives 3
1.4 Scope and Limitations 3
2. LITERATURE REVIEW 4
2.1 SMED Method 4
2.2 Scheduling 6
2.3 Scheduling Problem Solving method 6
3. METHODOLOGY 8
3.1 Overview 8
3.2 Proposed SMED’s Implementation Method 8
3.3 Data Gathering Procedure 9
3.4 Setup Operation Analysis Chart 9
3.5 Implemented solutions in case company 10
3.6 Solving Scheduling problem of molding machine 12
4. RESULTS AND DISCUSSION 13
4.1 Scheduling Problem 13
4.2 The pseudo code of system algorithm 13
4.3 Illustrative Example 15
4.4 Result Analysis 18
5. CONCLUSION AND RECOMMENDATIONS 23
REFERENCES 24
APPENDIXES 26

v
LIST OF FIGURES
FIGURE TITLE PAGE
Figure 1.1 The scenario of workshop production 2
Figure 1.2 The structure of off-line processing problem 3
Figure 3.1 The methodology flowchart 8
Figure 3.2
Figure 3.3
Figure 3.4
Figure 3.5
Figure 3.6
Figure 3.7
Figure 3.8
Figure 4.1
Figure 4.2
Figure 4.3
Figure 4.4
Figure 4.5
Figure 4.6
Figure 4.7
The schematic Diagram of SMED implementation
Operation analysis chart template
Operation analysis chart of molding Machine
By doing 5S method for molds
Align the inlet with a toothpick
Change injection port to cylindrical shape
Operator uses the wrench to lock the screw
Algorithm Architecture diagram
Using shortest setup Time sequencing rule process
The step1 and 2 based on SSUT rule
The schedule based on SSUT-EDD-SPT rule
The schedule based on EDD-SPT-SSUT rule
The schedule based on SPT-EDD- SSUT rule
The scheduling SPT rule result of the example
8
9
10
10
11
11
11
14
15
16
16
17
18
26

vi
LIST OF TABLES
TABLE TITLE PAGE
Table 2.1 SMED Application and result 4
Table 2.2 Criteria of Optimality Shaukat Ali Brah et al., (1991) 6
Table 2.3 Heuristic algorithms of solving scheduling problems 6
Table 4.1
Table 4.2
Table 4.3
Table 4.4
Table 4.5
Table 4.6
Table 4.7
Table 4.8
Table 4.9
Table4.10
Table 4.11
Table 4.12
Table 4.13
Table 4.14
Table 4.15
Table 4.16
Matrix of each job set up time (mins)
Information of each job
The results of the example
The make span for each rule
The average flow time for SSUT-EDD-SPT rule
The average flow time for EDD-SPT-SSUT rule
The average flow time for SPT-EDD-SSUT rule
The summary on the average flow time for each rule
The utilization for each rule
The summary on Utilization for each rule
The average number of jobs in the system for each rule
The summary on the average number of jobs in the system for
each rule
The average job lateness for each rule
The summary on the average job lateness for each rule
The total setup time for each rule
The summary on each performance measures for each rule
15
16
18
19
19
19
20
20
20
21
21
21
21
21
22
22

vii
LIST OF ABBREVIATIONS
AIT Asian Institute of Technology
EDD Earliest Due Date
ISE Industrial Systems Engineering
SMED Single-Minute Exchange of Die
SPT Shortest Processing Time
SSUT Shortest Setup Time
WIP Work in Process

1
CHAPTER 1
INTRODUCTION
1.1 Background
Mass production model is gradually being challenged. Nowadays rapid changes in consumer
demand determines the production model. Consumers buy the products that are offered by
companies, but they require those few products with their specifications to meet the needs
for functionality. Therefore, the demand for "single and large quantity" products has
gradually turned into a "high-mix and low volume" product demand. Production model is
also no longer standardized for mass production. So, customers’ needs and expectation are
addressed with company’s flexibility on many production criteria . Hence flexibility plays
an important role in all areas of industry (Bateman et al., 1999). Increased flexibility is one
of the key factors in converting performance (McIntosh et al., 2001). The faster changer-
over time increases the production time.
At same time, the main problem of high-mix low volume model is significantly increasing
frequency of set up, causing an increase in total set-up time for production. The setup time
is characterized as the time between subsequent to running the last task of present job and
beginning to run the first task of next job. Setup consist of those activities like detecting
equipment, fixtures or dies, inspection, and adjustment that aid to accomplish upcoming
operational activities. (Azzi et al., 2012), and, changeover is a subset of setups. The
changeover represents the elapsed time for detach and attach tool, dies or fixtures. Setup
time and change-over time are often used interchangeably. Setup time is nonproductive time
and due to this the productive time is wasted and this also leads to high production costs
(Goubergen and Landeghem, 2002). So, company must adopt set-up reduction strategies to
reduce the time for setup operations.
The reduction of setup time is mainly applied for flexible as well as lean manufacturing
(Gung and Studel, 1990). Rapid changeover capability is critical fundamental technique of
lean manufacturing for minimizing waste. This enhances responsiveness and flexibility in
regard of manufacturing processes. So, Shingo (1985) proposed single minute exchange of
die (SMED) method for flexibility technique. This method creates possibility to lower setup
time within 10 minutes, and Shingo (1985) also stated that SMED is “a scientific approach
to reduce set-up time that can be applied in any factory to any machine”. Conventional
SMED method highlights the setup activities that are performed mostly to achieve perfection
on machines (Ekincioglu and Boran, 2017); however, others related things involved in the
setup process such as operators and scheduling are rarely mentioned. Meanwhile
nonproductive time is also reduced via efficient set-ups, along with optimizing planning
schedules (e.g., determining an optimal scheduling sequence for diverse products). Sherali
et al. (2006), McIntosh et al. (2000) suggested the SMED method effectivity depends on
comprehensive knowledge on the possible improvement techniques. In this study, a cable
processing company will be examined as a case study for further improvement. Such as
application of SMED method to lessen total setup time.
The examined company’s processing flow is divided into in-line processing and off-line
processing. In-line processing is mostly carried out by manpower, and off-line processing is
processed through the machine outside the line. So, off-line processing machines scheduling
problem should be considered. The scenario of workshop production is shown in Figure1-1.
2
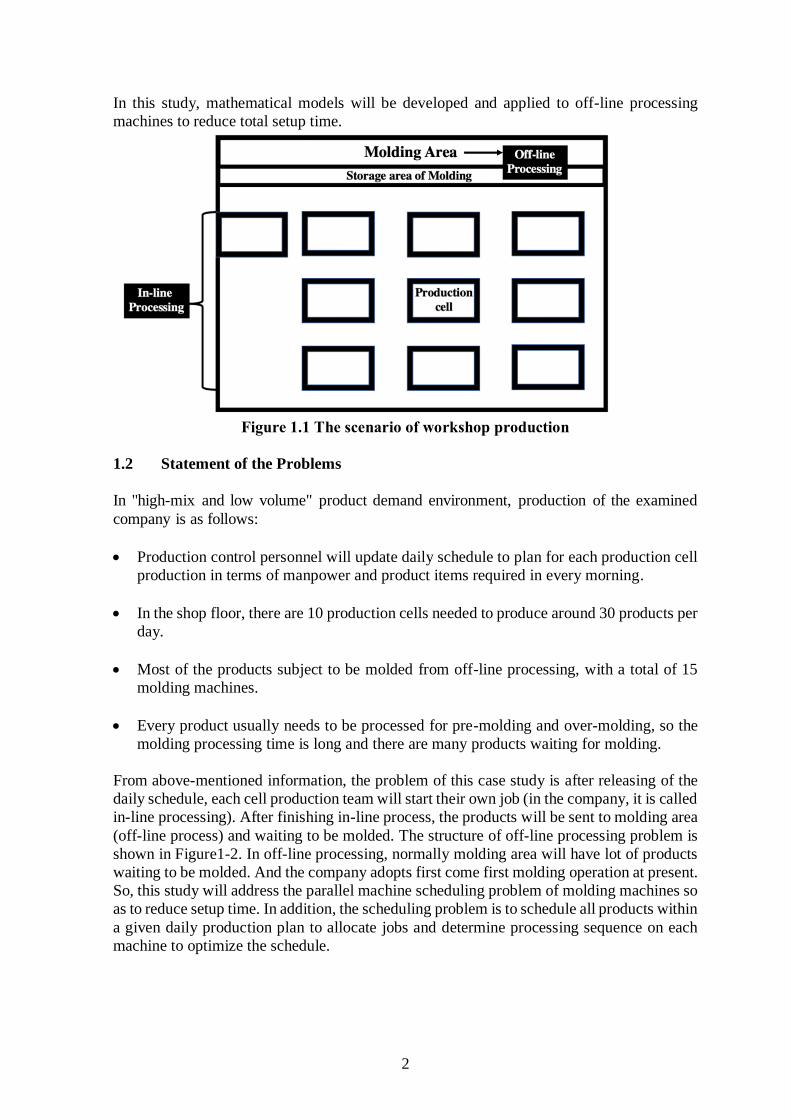
In this study, mathematical models will be developed and applied to off-line processing
machines to reduce total setup time.
Figure 1.1 The scenario of workshop production
1.2 Statement of the Problems
In "high-mix and low volume" product demand environment, production of the examined
company is as follows:
• Production control personnel will update daily schedule to plan for each production cell
production in terms of manpower and product items required in every morning.
• In the shop floor, there are 10 production cells needed to produce around 30 products per
day.
• Most of the products subject to be molded from off-line processing, with a total of 15
molding machines.
• Every product usually needs to be processed for pre-molding and over-molding, so the
molding processing time is long and there are many products waiting for molding.
From above-mentioned information, the problem of this case study is after releasing of the
daily schedule, each cell production team will start their own job (in the company, it is called
in-line processing). After finishing in-line process, the products will be sent to molding area
(off-line process) and waiting to be molded. The structure of off-line processing problem is
shown in Figure1-2. In off-line processing, normally molding area will have lot of products
waiting to be molded. And the company adopts first come first molding operation at present.
So, this study will address the parallel machine scheduling problem of molding machines so
as to reduce setup time. In addition, the scheduling problem is to schedule all products within
a given daily production plan to allocate jobs and determine processing sequence on each
machine to optimize the schedule.

3
Figure 1.2 The structure of off-line processing problem
1.3 Objectives
The main goals for case company problem are as follows. Firstly, adopting SMED method
and integrated lean manufacturing tool for molding machines to make setup time reduction
and optimization of die changeover time within 10 minutes.
The potential of faster setup cannot be completely achieved with SMED method. Thus, in
the case of the company under consideration, a sequencing model will be developed to
determine an optimal schedule for the molding machines. The scheduling problem is Np-
hard. Hany Seidgar et al., (2015) proposed a mathematical model to schedule flexible flow
shop problem, which coincides with the objective of this study. Here meta-heuristic
algorithm provides the best solution space and run numerical example that verifies the
confirmation of this mathematical model application as expected. However, in this study the
sequencing model will be developed based on the combination of various dispatching rules.
1.4 Scope and Limitations
The following assumptions and characteristics will be considered in this research:
• The scheduled molding machine environment is Parallel Machine.
• Each of the parallel machines only can process one job at a time.
• The scheduling problem is static.
• Each job has sequence dependent setup time.
• The information for each job is known and it can be scheduled at the same time.
• On every machine, the ready times that job can start processing are different.
• During the setup activities, only one operator will get involved and tasks cannot be
split.
4
CHAPTER 2
LITERATURE REVIEW
This chapter explores the related literature review over the years, organizes the application
of the SEMD method and the mathematical model of related scheduling problem to explains
separately. Section 2.1, discusses the implementation of the SMED method and the
improvement tool used in the past literatures, and explores the case company for this study
is described; Section 2.2, the development of case scheduling, sort out the methods proposed
by scholars in the past for scheduling problems. Solution method; Section 2.3, explain the
mathematical model used in this study to solve the scheduling problem.
2.1 SMED Method
Lean manufacturing technique must be responsive to the rapid changes in consumer demand
(Mehmet Cakmakci, 2009). As SMED method is a part of lean manufacturing tools, its
application is profound in numerous industries. (Joshi and Naik, 2012). This Shingo
proposed technique incorporates the possibility to complete setup operations to finish within
10 minutes. The setup operation is further classified into two categories (Shingo, 1985):
• Internal setup: The setup process which compulsory require the machine to halt its
operation. (Such as locating or detaching the dies.)
• External setup: The setup process that can do parallelly along with machine in
operation.
Briefly, achieving SMED method is to translate the internal setup operation into external
setup operation and optimize the internal setup operation to reduce total setup time.
A successful implementing SMED also can have the following benefits:
Company’s reduction in aspects of lot size and movements, stocks, WIP, and, enhancements
on quality and production flexibility (Shingo,1985)
• Reduction in production cost (Decline in non-productive time as result of faster
changeovers)
• Reduction in lot sizes (Speedier changeovers enable more frequent product changes)
• Improvements on quality and production flexibility (Quick changeovers leads to
flexibility to cope up with demand)
• Efficient startups (standardized changeover processes)
• Lesser inventory levels
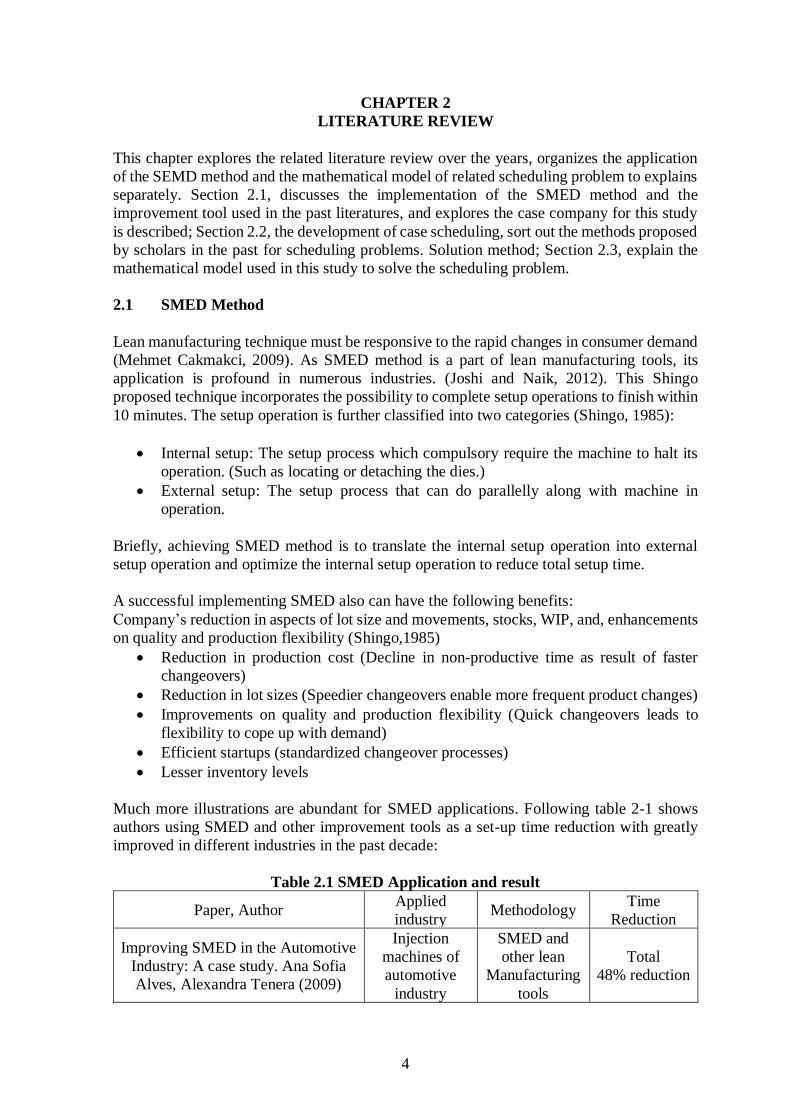
Much more illustrations are abundant for SMED applications. Following table 2-1 shows
authors using SMED and other improvement tools as a set-up time reduction with greatly
improved in different industries in the past decade:
Table 2.1 SMED Application and result
Paper, Author Applied
industry Methodology
Time
Reduction
Improving SMED in the Automotive
Industry: A case study. Ana Sofia
Alves, Alexandra Tenera (2009)
Injection
machines of
automotive
industry
SMED and
other lean
Manufacturing
tools
Total
48% reduction

5
Setup time reduction: SMED-
balancing integrated model for
manufacturing systems with
automated transfer. Maurizio Faccio
(2013)
Pump producer
with
automated
rotating
transfer
Traditional
SMED &
Proposed
SMED-
workload
balancing
model
After SMED
application
reduction-
59%
After SMED-
Balancing
application
Reduction-
79%
Improving changeover time: a
tailored SMED approach for
welding cells. Pablo Guzman
Ferradas, Konstantinos Salonitis
(2013)
Welding cell New tailored
SMED 33% reduction
Improvement of changeover times
via Taguchi empowered SMED/case
study on injection molding
production. M. Kemal Karasu,
Mehmet Cakmakci, Merve B.
Cakiroglu, Elif Ayva, Neslihan
Demirel-Ortabas (2014)
Plastic
injection
molding
Taguchi
empowered
SMED
30% overall
reduction
Reduction in Setup time on Rubber
Moulding Machine using SMED
Technique. Sanket P. Gaikwad,
Shivprasad S. Avhad, Swapnil S.
Pawar, Pradnya R.Thorat (2015)
Rubber
Moulding
Machine
SMED 2 hours to 8
mins
The contribution of lean
manufacturing tools to changeover
time decrease in the pharmaceutical
industry. A SMED project. Al-Akel
Karam, Marian Liviu, Veres
Cristina, Horea Radu(2017)
Pharmaceutical
Industry
SMED
methodology,
externalizing
steps, visual
management
and Full Time
Equivalent
redistribution
33% overall
reduction
SMED methodology based on fuzzy
Taguchi method. Caner Ekincioglu,
Semra Boran (2018)
CNCx
machines
Integrate the
fuzzy Taguchi
method into
the SMED
method
from 196 to
75 mins
Based on my personal knowledge, I have not found a study discussing the SMED method
and scheduling to reduce setup time in cable processing industry as well.

6
2.2 Scheduling
The job allocation process at specific time on a machine is called Scheduling. (Tavakkoli-
Moghaddam and Daneshmand-Mehr, 2005). Various methods like Cutting Plane, Branch
and Bound, Heuristic, Genetic Algorithm, Simulated Annealing, Machine Learning and
many more are used to solve Scheduling problems. Therefore, there are many measures for
scheduling performance, they can also be grouped into primarily two major categories.
Table 2-2 Shaukat Ali Brah et al., (1991) provides a list of the most commonly considered
criteria in the literature on scheduling.
Table 2.2 Criteria of Optimality Shaukat Ali Brah et al., (1991)
Category Metrics
BASED ON
COMPLETION TIME
Maximum/ Total/ Mean/ Weighted Sum of Flow Time
Maximum/ Total/ Mean/ Weighted Sum of Completion
Time
Jobs Waiting Time
Weighted Job Waiting Time
BASED ON DUE DAY
Maximum/ Total/ Mean/ Weighted Lateness
Maximum/ Total/ Mean/ Weighted Tardiness
Maximum/ Total/ Mean/ Weighted Earliness
Number of Tardy Jobs/ Early Jobs
2.3 Scheduling problem solving method
As described in Section 2.2, there are many ways to solve scheduling problems. Different
methods have their own characteristics and suitable types of problems. The following two
kinds of methods, such as the heuristic algorithm and the mathematical formulation.
Heuristic algorithm is a method that solves problems, learns, and finds through multiple logic
calculations, judgment and experience basis. The heuristic algorithm proves that the solution
is efficient and well, but it is not guaranteed to be the best solution. And, the time required
for each solution will not be the same. In the past, many authors have proposed heuristic
algorithms to solve scheduling problems in Table2-3.
Table 2.3 Heuristic algorithms of solving scheduling problems
Author Scheduling
environment Solving method
Scheduling
objective
Cintia Rigão Scrich,
Vinícius Amaral
Armentano, Manuel
Laguna (2004)
Flexible job shop Tabu search
approach
Minimize total
tardiness
Neto&Godinho
(2011) Flow Shop
Ant colony
optimization
approach
Multi-objective
considerations
Shih-Wei, Lin &
Kuo-Ching, Ying
(2015)
Unrelated parallel
machine
Simulated
Annealing
Minimize make
span, Total
weighted
completion time
and tardiness
7
Young-BinWoo,
Sunwoong Jung,
Byung Soo Kim
(2107)
Unrelated parallel
machine Genetic algorithm
Minimize
makespan
Thi-Kien Dao, Tien-
Szu Pan, Trong-The
Nguyen, Jeng-Shyang
Pan (2018)
Job shop Bat algorithm Optimize makespan
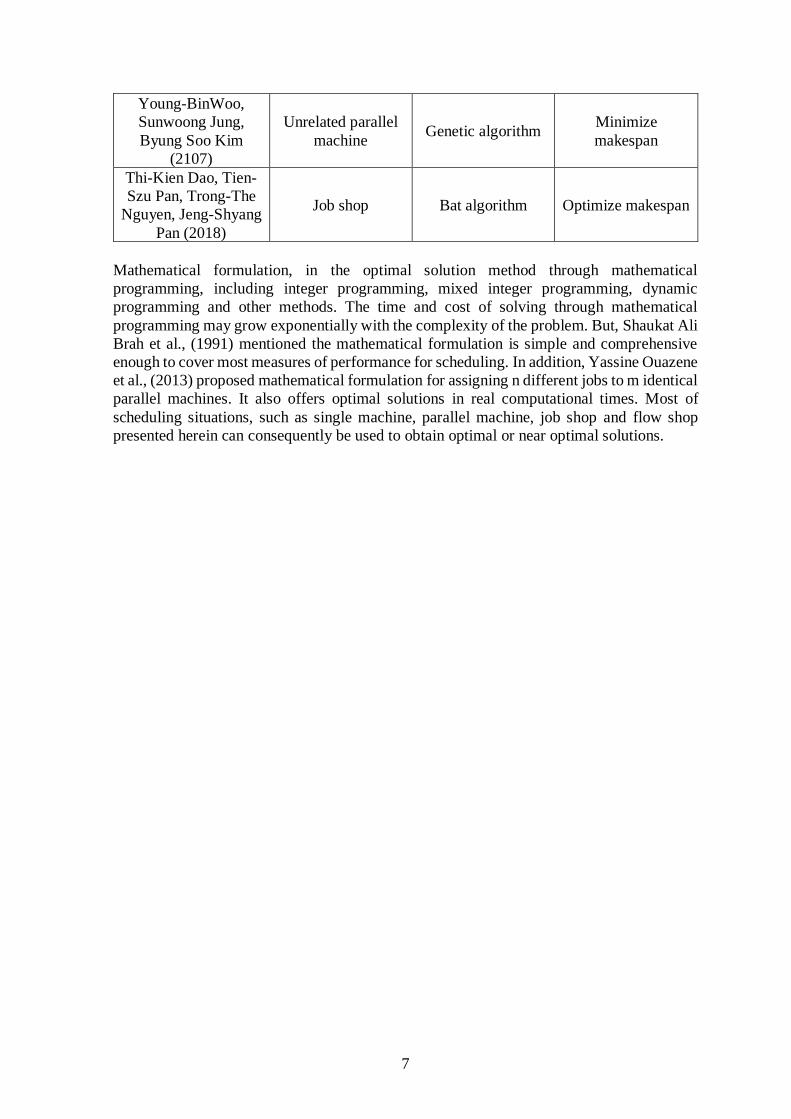
Mathematical formulation, in the optimal solution method through mathematical
programming, including integer programming, mixed integer programming, dynamic
programming and other methods. The time and cost of solving through mathematical
programming may grow exponentially with the complexity of the problem. But, Shaukat Ali
Brah et al., (1991) mentioned the mathematical formulation is simple and comprehensive
enough to cover most measures of performance for scheduling. In addition, Yassine Ouazene
et al., (2013) proposed mathematical formulation for assigning n different jobs to m identical
parallel machines. It also offers optimal solutions in real computational times. Most of
scheduling situations, such as single machine, parallel machine, job shop and flow shop
presented herein can consequently be used to obtain optimal or near optimal solutions.
8
CHAPTER 3
METHODOLOGY
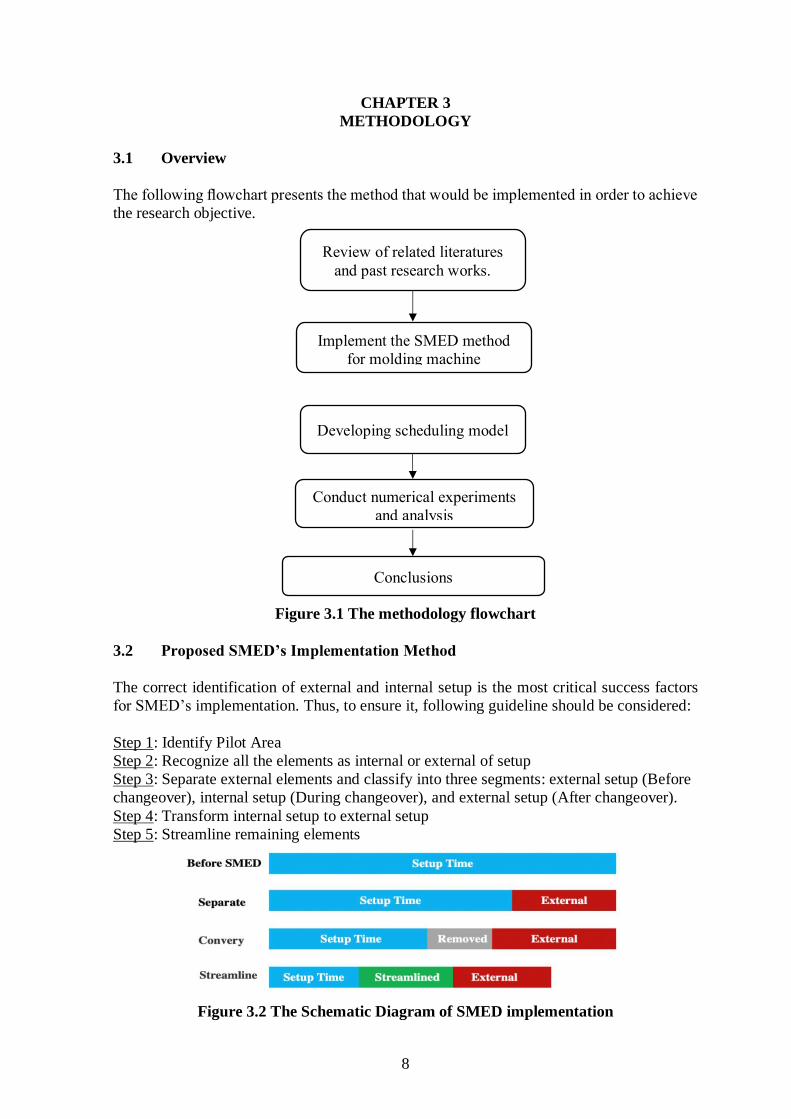
3.1 Overview
The following flowchart presents the method that would be implemented in order to achieve
the research objective.
Figure 3.1 The methodology flowchart
3.2 Proposed SMED’s Implementation Method
The correct identification of external and internal setup is the most critical success factors
for SMED’s implementation. Thus, to ensure it, following guideline should be considered:
Step 1: Identify Pilot Area
Step 2: Recognize all the elements as internal or external of setup
Step 3: Separate external elements and classify into three segments: external setup (Before
changeover), internal setup (During changeover), and external setup (After changeover).
Step 4: Transform internal setup to external setup
Step 5: Streamline remaining elements
Figure 3.2 The Schematic Diagram of SMED implementation
Review of related literatures
and past research works.
Implement the SMED method
for molding machine
Developing scheduling model
Conduct numerical experiments
and analysis
Conclusions
9
Based on SMED’s implementation there will be proposed a method which improves setup
time. This is done majorly to find out the operations that take more time in the setup process
and then explore new technique to lessen the required time of altering a tool for achieving
the best result.
3.3 Data Gathering Procedure
In this process of data gathering, the below mentioned three stages are performed to achieve
the desired pattern of data for analysis.:
1. Observation of the current changeover operations and working area
2. Interview with the team leader and the operators about the setup procedure
3. Documentation of the collected data (setup time)
While recording each time of the setup, it can observe critical points that reduce setup
procedure as well. The recorded data for set up time is also given as input parameter for the
scheduling system depending on the product type.
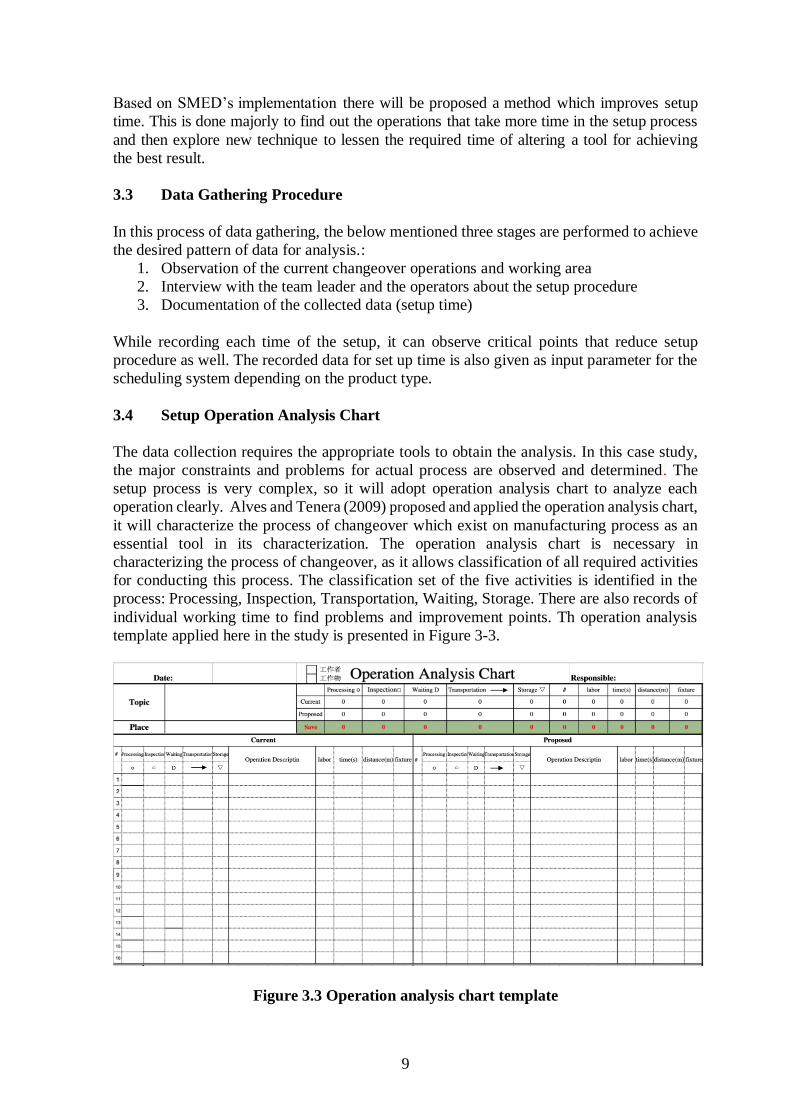
3.4 Setup Operation Analysis Chart
The data collection requires the appropriate tools to obtain the analysis. In this case study,
the major constraints and problems for actual process are observed and determined. The
setup process is very complex, so it will adopt operation analysis chart to analyze each
operation clearly. Alves and Tenera (2009) proposed and applied the operation analysis chart,
it will characterize the process of changeover which exist on manufacturing process as an
essential tool in its characterization. The operation analysis chart is necessary in
characterizing the process of changeover, as it allows classification of all required activities
for conducting this process. The classification set of the five activities is identified in the
process: Processing, Inspection, Transportation, Waiting, Storage. There are also records of
individual working time to find problems and improvement points. Th operation analysis
template applied here in the study is presented in Figure 3-3.
Figure 3.3 Operation analysis chart template

10
According to the operation analysis chart, it will be able to describe in details the time spent
on each operation and the time spent in each group of operations. In order to resolve the
operational parallelism in the transformation to distinguish between internal and external
setup, the Gantt chart must also be integrated and applied.
3.5 Implemented solutions in case company
In the case study, the SMED Methodology of the molding machine is discussed, so the setup
operations of the molding machine were observed and recorded first.
With 95% of trust level along with z=1.96, and standard error of 5%, the measurement
precision in this case are observed.
Given the average and standard deviation of the setup times found later by observing, 36
setup time observations were collected, and the results are recorded in Figure 3-4.
Figure 3.4 Operation analysis chart of molding machine
In setup operations, only steps 1 and 4 are belong to external elements changed. Both of
these steps are transportation and carrying. In high-mix and low volume product demand,
the company has many molds for products to mold. Therefore, through the 5S method
(SEIRI, SEITON, SEISO, SEIKETSU, SHITSUKE), the plastic material and mold storage
area are marked and discharged clearly to reduce the time of searching material and molds.
The results are shown in Figure 3-5.
Figure 3.5 By doing 5S method for molds

11
In addition, in Figure 3-4, step 8 takes the longest time for operating. Because the nozzle
hole should be aligned with the mold inlet, and the operator needs to use a toothpick to
calibrate, as shown in Figure 3-6.
Figure 3.6 Align the inlet with a toothpick
Therefore, by modifying the mold, the injection port is changed to a cylindrical shape, so
when the machine is pulled down, the feed port can be aligned into the injection port directly,
and the toothpick calibration operation is deleted, as shown in Figure 3-7.
Figure 3.7 Change injection port to cylindrical shape
By doing this, step 8 can be removed, because there is no need for calibration operation,
once the machine is pulled down, the injection port can be aligned. It also can save a lot of
time for setting up.
In addition, in the process of locking and unlocking of the mold, it is currently time-
consuming and laborious to use the wrench to lock and unlock the screw. as shown in Figure
3-8. It was found that the method of locking the mold by magnetic or vacuum can be
recommended to the company to reduce the time for locking and removing mold. But, the
cost of changing the equipment of machine is too high, so the company has not yet done.
Figure 3.8 Operator uses the wrench to lock the screw

12
3.6 Solving Scheduling problem of molding machine
Reducing the molding machine setup time through the SMED method also provides a scheduling
reference set of indicators for the molding machine that decision makers can use to determine the
sequencing rule of scheduling by use of some criteria through the system. Detailed scheduling model
will be presented in the following chapter.
13
CHAPTER 4
RESULT AND DISCUSSION
4.1 Scheduling Problem
The molding machine scheduling problem discussed in this study is defined as follows. Jobs
are allocated to each machine to solve the optimum processing order of the jobs. The jobs
are selected with parallel machines. The change of the selected machine increases the
difficulty and complexity of calculating the start time and finish time of each job on each
machine. The parallel machine scheduling problem in this study is NP-hard. Therefore, this
study solves the problem by considering the combination of various dispatching rules
through a computer program coded in C++.
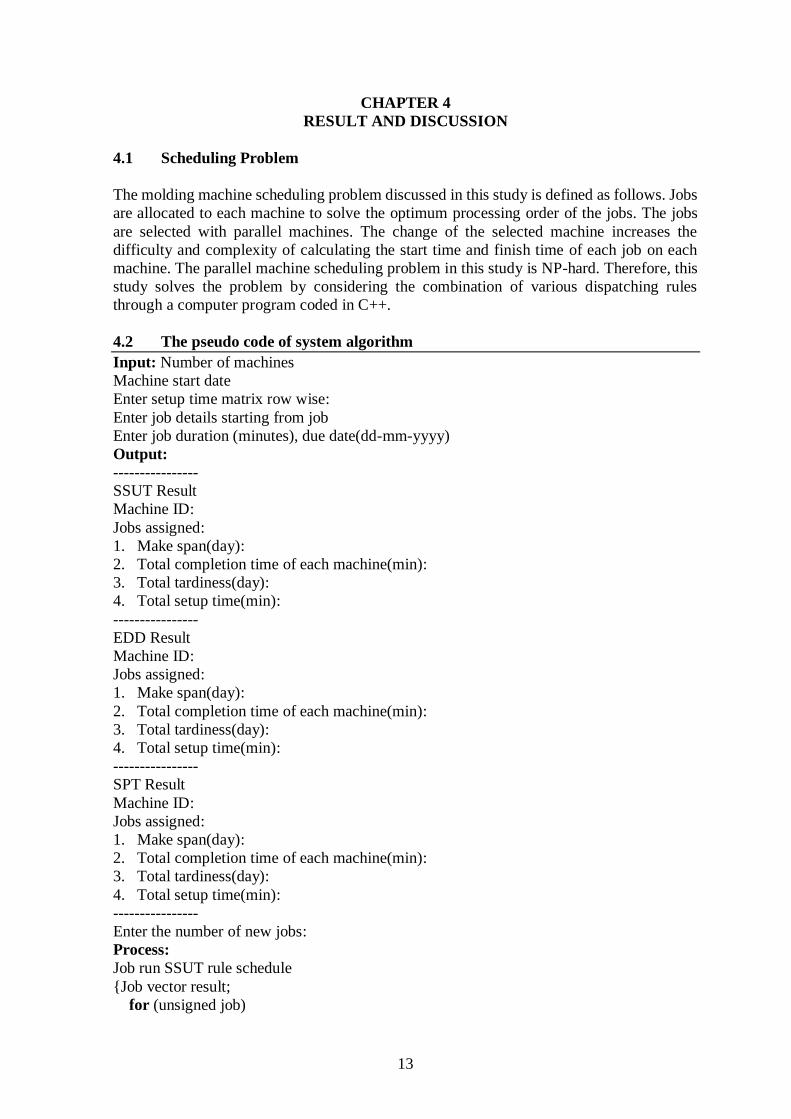
4.2 The pseudo code of system algorithm
Input: Number of machines Machine start date
Enter setup time matrix row wise:
Enter job details starting from job
Enter job duration (minutes), due date(dd-mm-yyyy)
Output:
----------------
SSUT Result
Machine ID:
Jobs assigned:
1. Make span(day):
2. Total completion time of each machine(min):
3. Total tardiness(day):
4. Total setup time(min):
----------------
EDD Result
Machine ID:
Jobs assigned:
1. Make span(day):
2. Total completion time of each machine(min):
3. Total tardiness(day):
4. Total setup time(min):
----------------
SPT Result
Machine ID:
Jobs assigned:
1. Make span(day):
2. Total completion time of each machine(min):
3. Total tardiness(day):
4. Total setup time(min):
----------------
Enter the number of new jobs:
Process:
Job run SSUT rule schedule
{Job vector result;
for (unsigned job)

14
if (job Machine Priority is -1)
Then select the job with shortest_setup_time}
Job run EDD rule schedule
{for (unsigned job) {
if (job Machine Priority is -1)
Then select the job with earliest due date}
Job run SPT rule schedule
{for (unsigned job) {
if (job Machine Priority is -1)
Then select the job with shortest processing time}
Processor for schedule Jobs rule
{findNextToProcessMachine ();
machine which finish first
switch (rule) {
case Processor for SSUT:
result = ssut_schedule (machine, jobs_);
if have two or more job with same set up time
then select the job with earliest due date}
if have two or more job with same due date
then select the job with shortest processing time}
break;
case Processor for SPT:
result = ssut_schedule (machine, jobs_);
if have two or more job with same shortest processing time
then select the job with earliest due date}
if have two or more job with same due date
then select the job with shortest setup time}
break;
case Processor for EDD:
result = edd_schedule (machine, jobs_);
if have two or more job with same due date
then select the job with shortest processing time}
if have two or more job with same shortest processing time
then select the job with shortest setup time}
If have new job come
Add machine information and setup matrix size
New Job will run each rule to compare with unprocessed job.}
Machine Processor to find next Process Machine
{Machine will be allocated the job first by which machine finish processes first}
Figure 4-1 Algorithm architecture diagram
15
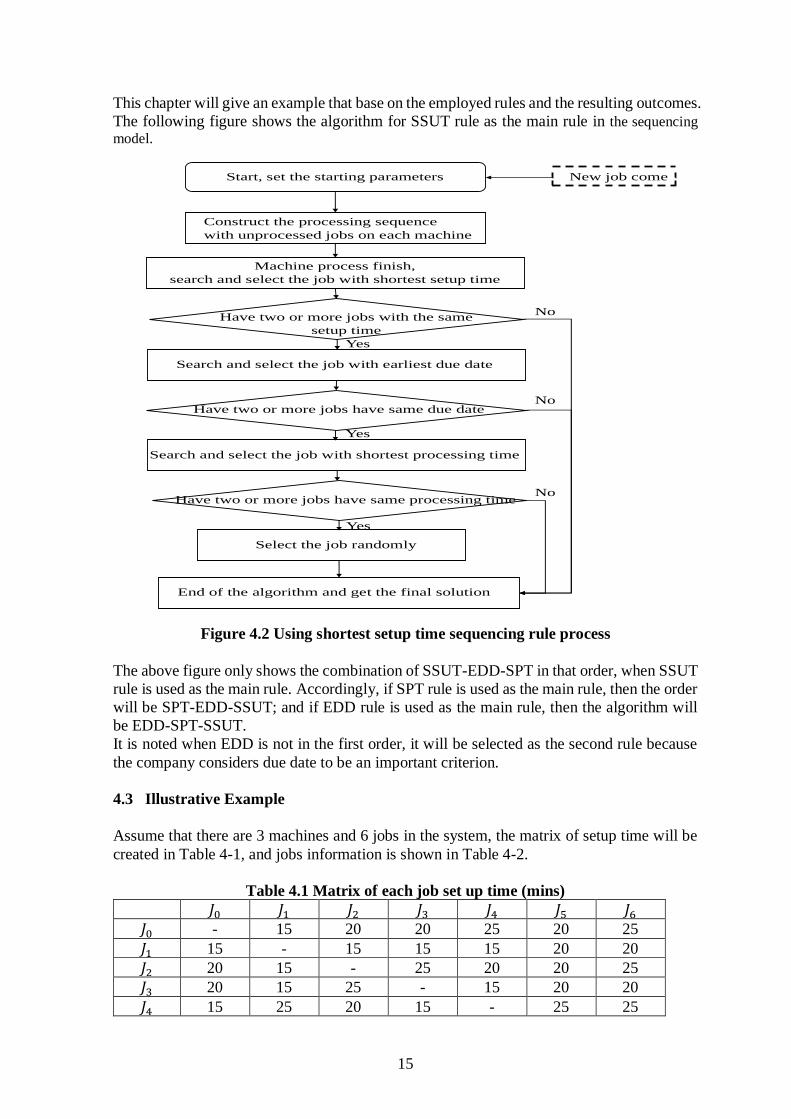
This chapter will give an example that base on the employed rules and the resulting outcomes.
The following figure shows the algorithm for SSUT rule as the main rule in the sequencing
model.
Figure 4.2 Using shortest setup time sequencing rule process
The above figure only shows the combination of SSUT-EDD-SPT in that order, when SSUT
rule is used as the main rule. Accordingly, if SPT rule is used as the main rule, then the order
will be SPT-EDD-SSUT; and if EDD rule is used as the main rule, then the algorithm will
be EDD-SPT-SSUT.
It is noted when EDD is not in the first order, it will be selected as the second rule because
the company considers due date to be an important criterion.
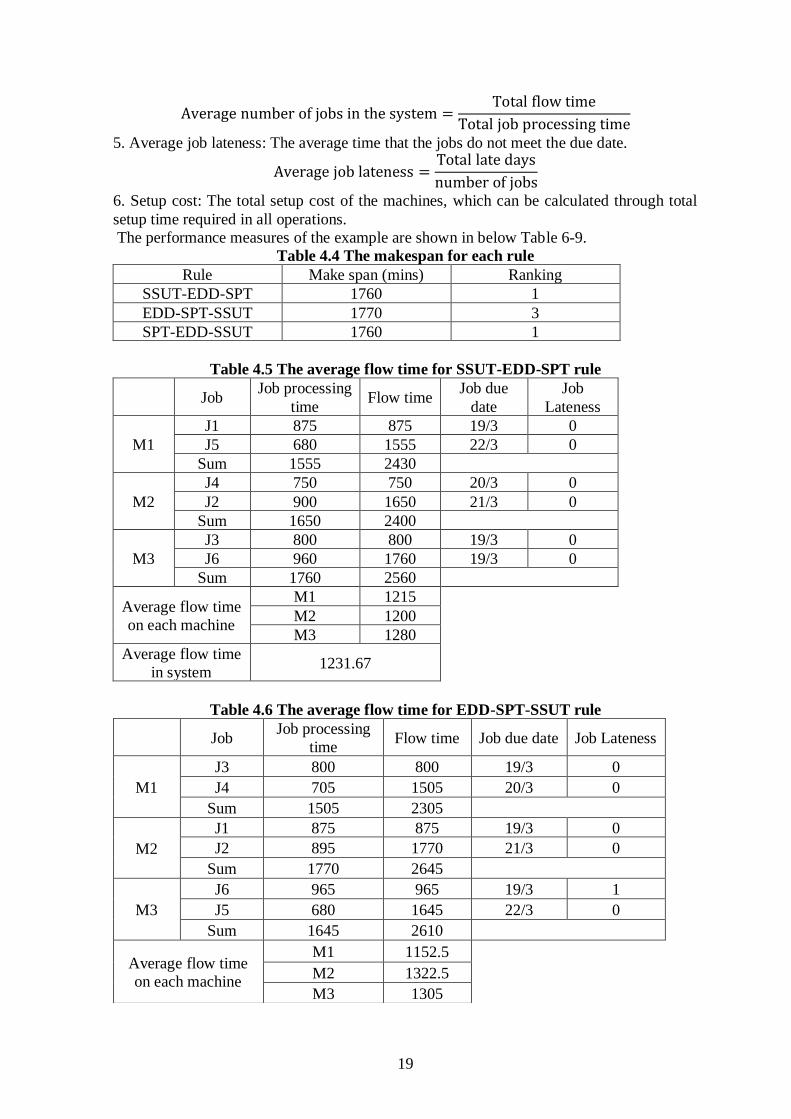
4.3 Illustrative Example
Assume that there are 3 machines and 6 jobs in the system, the matrix of setup time will be
created in Table 4-1, and jobs information is shown in Table 4-2.
Table 4.1 Matrix of each job set up time (mins)
𝐽0 𝐽1 𝐽2 𝐽3 𝐽4 𝐽5 𝐽6
𝐽0 - 15 20 20 25 20 25
𝐽1 15 - 15 15 15 20 20
𝐽2 20 15 - 25 20 20 25
𝐽3 20 15 25 - 15 20 20
𝐽4 15 25 20 15 - 25 25
Start, set the starting parameters
Construct the processing sequence
with unprocessed jobs on each machine
Machine process finish,
search and select the job with shortest setup time
Have two or more jobs with the same
setup time
Search and select the job with earliest due date
Have two or more jobs have same due date
Search and select the job with shortest processing time
Have two or more jobs have same processing time
Select the job randomly
End of the algorithm and get the final solution
Yes
Yes
Yes
No
No
No
New job come

16
𝐽5 20 20 20 20 25 - 20
𝐽6 25 20 25 20 25 20 -
Table 4.2 Information of each job
𝐽1 𝐽2 𝐽3 𝐽4 𝐽5 𝐽6
Processing
Time
860 880 780 690 660 940
Due Date 19-03-
2019
21-03-
2019
19-03-
2019
20-03-
2019
22-03-
2019
19-03-
2019
If SSUT-EDD-SPT is used, in step1 the job having shortest setup time in column 𝐽0 of setup
matrix will be selected first to assign to machine, so jobs 1,4 will be selected, and then next
in step 2 jobs 2,3,5,6 will be compared based on their earlier due dates. Job 3 has smallest
due date, so job 3 will be selected to assign next. The result of step1 and 2 is shown in below
figure 4-3.
Figure 4.3 The step1 and 2 results based on SSUT rule
After, the system will allocate the job to which machine finishes first. In the example,
machine 2 will finish first, so the system assigns job 2 to machine 2 because the setup time
to change from job 4 to job 2 is less than the setup time to change from job 4 to job 5 or job
6. After that, machine 3 will finish first, but jobs 3, 5, 6 have the same setup time, so the
system will select the earlier due date job. Therefore, job 6 will be assigned to machine 3
and job 5 will be processed on machine 1. The scheduling result of the example is shown in
below figure 4-4.
Figure 4.4 The schedule based on SSUT-EDD-SPT rule
From the above figure, the corresponding values of four criteria are as follows:

17
1. Make span: 19-03-2019
2. Total completion time of each machine(min): m1:1555, m2:1605, m3:1760
3. Total tardiness(day): 0
4. Total setup time(min): 110
If EDD-SPT-SSUT is used, in step1 the job having earliest due date will be selected first to
assign to machine, so jobs 3,1,6 will be selected, and then next in step 2, the system will
allocate the job to which machine finishes first. In the example, machine 1 will finish first,
so the system assigns job 4 to machine 1 because job 4 has smaller due date than jobs 2 and 5.
After that, machine 2 will finish first, so job 2 which has earlier due date will be allocated to
machine 2. Finally, the Job 5 will be assigned to machine 3. The scheduling result of the example
is shown in below figure 4-5.
Figure 4.5 The schedule based on EDD-SPT-SSUT rule
From the above figure, the corresponding values of four criteria are as follows:
1. Make span: 20-03-2019
2. Total completion time of each machine(min): m1:1505, m2:1770, m3:1645
3. Total tardiness(day): 1
4. Total setup time(min): 110
If SPT-EDD-SSUT is used, in step1 the job having shortest processing time will be selected
first to assign to machine, so jobs 5,4,3 will be selected, and then next in step 2, the system
will allocate the job to which machine finishes first. In the example, machine 1 will finish
first, so the system assigns job 1 to machine 1 because job 1 has shorter processing time than
jobs 2 and 6. After that, machine 2 will finish first, so job 2 which has shorter processing time
will be allocated to machine 2. Finally, the Job 6 will be assigned to machine 3. The scheduling
result of the example is shown in below figure 4-6.
18
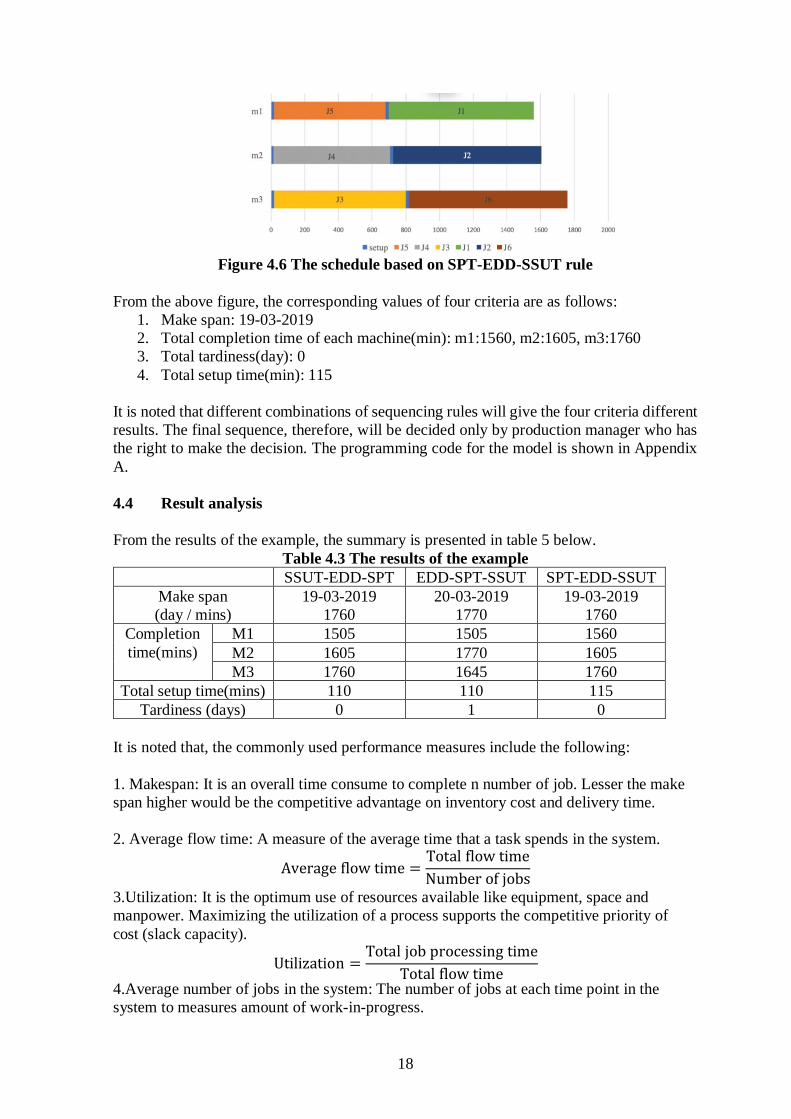
Figure 4.6 The schedule based on SPT-EDD-SSUT rule
From the above figure, the corresponding values of four criteria are as follows:
1. Make span: 19-03-2019
2. Total completion time of each machine(min): m1:1560, m2:1605, m3:1760
3. Total tardiness(day): 0
4. Total setup time(min): 115
It is noted that different combinations of sequencing rules will give the four criteria different
results. The final sequence, therefore, will be decided only by production manager who has
the right to make the decision. The programming code for the model is shown in Appendix
A.
4.4 Result analysis
From the results of the example, the summary is presented in table 5 below.
Table 4.3 The results of the example
SSUT-EDD-SPT EDD-SPT-SSUT SPT-EDD-SSUT
Make span
(day / mins)
19-03-2019
1760
20-03-2019
1770
19-03-2019
1760
Completion
time(mins)
M1 1505 1505 1560
M2 1605 1770 1605
M3 1760 1645 1760
Total setup time(mins) 110 110 115
Tardiness (days) 0 1 0
It is noted that, the commonly used performance measures include the following:
1. Makespan: It is an overall time consume to complete n number of job. Lesser the make
span higher would be the competitive advantage on inventory cost and delivery time.
2. Average flow time: A measure of the average time that a task spends in the system.
Average flow time =Total flow time
Number of jobs
3.Utilization: It is the optimum use of resources available like equipment, space and
manpower. Maximizing the utilization of a process supports the competitive priority of
cost (slack capacity).
Utilization =Total job processing time
Total flow time
4.Average number of jobs in the system: The number of jobs at each time point in the
system to measures amount of work-in-progress.
19
Average number of jobs in the system =Total flow time
Total job processing time
5. Average job lateness: The average time that the jobs do not meet the due date.
Average job lateness =Total late days
number of jobs
6. Setup cost: The total setup cost of the machines, which can be calculated through total
setup time required in all operations.
The performance measures of the example are shown in below Table 6-9.
Table 4.4 The makespan for each rule
Rule Make span (mins) Ranking
SSUT-EDD-SPT 1760 1
EDD-SPT-SSUT 1770 3
SPT-EDD-SSUT 1760 1
Table 4.5 The average flow time for SSUT-EDD-SPT rule
Job Job processing
time Flow time
Job due
date
Job
Lateness
M1
J1 875 875 19/3 0
J5 680 1555 22/3 0
Sum 1555 2430
M2
J4 750 750 20/3 0
J2 900 1650 21/3 0
Sum 1650 2400
M3
J3 800 800 19/3 0
J6 960 1760 19/3 0
Sum 1760 2560
Average flow time
on each machine
M1 1215
M2 1200
M3 1280
Average flow time
in system 1231.67
Table 4.6 The average flow time for EDD-SPT-SSUT rule
Job Job processing
time Flow time Job due date Job Lateness
M1
J3 800 800 19/3 0
J4 705 1505 20/3 0
Sum 1505 2305
M2
J1 875 875 19/3 0
J2 895 1770 21/3 0
Sum 1770 2645
M3
J6 965 965 19/3 1
J5 680 1645 22/3 0
Sum 1645 2610
Average flow time
on each machine
M1 1152.5
M2 1322.5
M3 1305

20
Table 4.7 The average flow time for SPT-EDD-SSUT rule
Job Job processing
time Flow time Job due date Job Lateness
M1
J5 680 680 22/3 0
J1 880 1560 19/3 0
Sum 1560 2240
M2
J4 705 705 20/3 0
J2 900 1605 21/3 0
Sum 1605 2310
M3
J3 800 800 19/3 0
J6 960 1760 19/3 0
Sum 1760 2560
Average flow time
on each machine
M1 1120
M2 1155
M3 1280
Average flow time
in system 1185
Table 4.8 The summary on the average flow time for each rule
Rule Mins Ranking
Average flow time
SSUT-EDD-SPT 1231.67 2
EDD-SPT-SSUT 1260 3
SPT-EDD-SSUT 1185 1
Table 4.9 The utilization for each rule
SSUT-EDD-SPT
M1 0.639917695
M2 0.6875
M3 0.6875
The average utilization in the system 67%
EDD-SPT-SSUT
M1 0.652928416
M2 0.669187146
M3 0.630268199
The average utilization in the system 65%
SPT-EDD-SSUT
M1 0.696428571
M2 0.694805195
M3 0.6875
The average utilization in the system 69%
Table 4.10 The summary on the utilization for each rule
Rule % Ranking
Utilization
SSUT-EDD-SPT 67 2
EDD-SPT-SSUT 65 3
SPT-EDD-SSUT 69 1
Average flow time
in system 1260

21
Table 4.11 The average number of jobs in the system for each rule
SSUT-EDD-SPT
M1 1.56
M2 1.45
M3 1.45
Average number of jobs in the system 1.49
EDD-SPT-SSUT
M1 1.53
M2 1.49
M3 1.59
Average number of jobs in the system 1.54
SPT-EDD-SSUT
M1 1.44
M2 1.44
M3 1.45
Average number of jobs in the system 1.44
Table 4.12 The summary on the average number of jobs in the system for each rule
Rule Jobs Ranking
Average number of
jobs in the system
SSUT-EDD-SPT 1.49 2
EDD-SPT-SSUT 1.54 3
SPT-EDD-SSUT 1.44 1
Table 4.13 The average job lateness for each rule
SSUT-EDD-SPT
M1 0
M2 0
M3 0
. 0
EDD-SPT-SSUT
M1 0
M2 0
M3 0.5
Average job lateness 0.17
SPT-EDD-SSUT
M1 0
M2 0
M3 0
Average job lateness 0
Table 4.14 The summary on the average job lateness for each rule
Rule Days Ranking
Average job
lateness
SSUT-EDD-SPT 0 1
EDD-SPT-SSUT 0.17 3
SPT-EDD-SSUT 0 1
Table 4.15 The total setup time for each rule
Rule Total setup time (mins) Ranking
SSUT-EDD-SPT 110 1
EDD-SPT-SSUT 110 1
SPT-EDD-SSUT 115 3

22
Table 4.16 The summary on each performance measures for each rule
Rules Makespan
(mins)
Average
flow time
(mins)
Utilization
(%)
Average
number of
jobs in the
system
Average job
lateness
(days)
Total
setup
time
(mins)
SSUT 1760 1231.67 67 1.49 0 110
EDD 1770 1260 65 1.54 0.17 110
SPT 1760 1185 69 1.44 0 115
From the above table of performance measures, the ranking of each rule has different results.
No one sequencing rule excels on all criteria. The selection of scheduling rule must be based
on the performance measures which can help to achieve the maximum benefit for the
company.
It is noted in this study that minimum setup time should be included in the scheduling rules.
Since the setup time is non-productive time, but also requires manpower, there will be more
costs and productivity also will decrease. However, in the pursuit of minimizing setup time,
it may also cause delays in job, and may receive penalty from customers and lose customers’
credit to the company. So, decision makers must evaluate the results carefully to achieve
maximum benefit.

23
CHAPTER 5
CONCLUSION AND RECOMMENDATIONS
In this study, two methods of SMED and scheduling are proposed to reduce setup time to
solve the high-mix and low volume product demand problem for a company. SMED
methodology has proven to be effective in a variety of industries. It possesses possibility of
reducing setup time. This study highlights the application of SMED method in the context
for molding machine where setup time drop from 1562 to 1239 seconds. Though it was
observed declining of setup time decline by 20 percent, setup activities involved still have
the ability to reduce more in term of setup time, but due to cost considerations, the company
has not implemented yet.
Furthermore, in terms of scheduling, it is also possible to reduce the setup time by employing
the appropriate mix of sequencing rule. But it may happen that company has to pay for
additional costs while pursuing the minimum setup time. For instance, if the company
employs the SSUT-EDD-SPT rule with minimum setup time as the main sequencing rule, it
is observed that the ranking of the SSUT-EDD-SPT rule is not the best in all performance
measures, which may result in more additional costs. Therefore, in this study, a system was
developed to allow decision makers to get scheduling results quickly after knowing job
information. The resulting performance measures of different combinations of sequencing
rules can help decision makers to make the decision so as to maximize the benefit for the
company.
In the case study, many moulds changeover operations involve the steps of unlocking and
locking the screws. The accuracy of the mould positioning will affect the product yield, and
the simple unlocking and locking action will depend on the skill of the workers. This leads
to the fact that the machine should be shut down for a long time. The automatic and precise
positioning of the clamp has been developed to effectively reduce the time and manpower
of setup. The clamp can be applied in the future, so that the company could enhance
flexibility as well as efficient production environment.
Regard to scheduling, in the future, the research works can address other important factors
like overall execution cost and load balancing during the scheduling process using
sequencing rules. The results of performance measures can be converted into a unit of cost
display, making it easier for decision makers to choose a solution that minimizes costs.
24
REFERENCES
Ana, S.A. & Tenera, A. (2009). Improving SMED in the Automotive Industry: A case study.
In Proceedings of the 20th Annual Conference of the Production and Operations
Management Society (POMS) (pp. 1-27)
Anna, A., Maurizio F., Alessandro, P., & Fabio, S. (2012). Lot Splitting Scheduling
Procedure for Makespan Reduction and Machines Capacity Increase in a Hybrid Flow
Shop with Batch Production. The International Journal of Advanced Manufacturing
Technology, 59 (5-8), 775-786.
Bateman, N., Stockton, D.J., & Lawrence, P. (1999). Measuring the mix response flexibility
of manufacturing systems. International Journal of Production Research, 37 (4), 871-
880.
Caner, E. & Semra, B. (2017). SMED methodology based on fuzzy Taguchi method. Journal
of Enterprise Information Management, 31 (6), 867-878.
Cintia, R.S., Vinícius, A.A., & Manuel, L. (2004). Tardiness minimization in a flexible job
shop: A tabu search approach. Journal of Intelligent Manufacturing, 15(1), 103-115.
Faccio, M. (2013). Setup time reduction: SMED-balancing integrated model for
manufacturing systems with automated transfer. International Journal of Engineering
and Technology, 5(5), 4075- 4084.
Ferradás, P.G. & Salonitis, K. (2013). Improving changeover time: a tailored SMED
approach for welding cell. Procedia CIRP (7), 598-603.
Gaikwad, S.P., Avhad, S.S., Pawar, S.S., & Thorat, P.R. (2015). Reduction in Setup time on
Rubber Moulding Machine using SMED Technique. International Journal of Research
& technology, 4 (4), 5.
Gung, D. & Studel, F. (1990). A work load balancing model for determining set-up time and
batch size reduction in G.T. flow line work cell. International Journal of Production
Research, 28(4), 255-292.
Joshi, R.R. & Naik, G.R. (2012). Application of SMED methodology-a case study in small
scale industry. International Journal of Scientific and Research Publications, 2(8), 1-
4.
Karam, A., Liviu, M., Cristina, V., & Radu, H. (2017). The contribution of lean
manufacturing tools to changeover time decrease in the pharmaceutical industry. A
SMED project. Procedia Manufacturing, 22, 886-892.
Kemal Karasu, M., Cakmakci, M., Cakiroglu, M.B., Ayva, E., & Demirel-Ortabas, N. (2014)
Improvement of changeover times via Taguchi empowered SMED/case study on
injection molding production, Measurement, 47, 741-748.
25
McIntosh R. I., Culley. S.J., Mileham A.R., & Owen. G.W. (2000). A critical evaluation of
Shingo's 'SMED' (Single Minute Exchange of Die) methodology. International Journal
of Production Research, 38(11), 2377-2395.
McIntosh, R.I., Culley, S.J., Mileham, A.R., & Owen, G.W. (2001). Improving Changeover
Performance- A strategy for becoming a lean and responsive manufacture. Oxford,
England: Butterworth-Heinemann.
Mehmet C. (2009). Process improvement: performance analysis of the setup time reduction-
SMED in the automobile industry. International Journal of Advanced Manufacturing
Technology, 41(1-2),168-179.
Pearn, W.-L., Chung, S.-H., & Lai, C.-M. (2007). Scheduling Integrated Circuit Assembly.
Operations on Die Bonder. IEEE Transactions On Electronics Packaging
Manufacturing, 30(2), 97-105.
Seidgar, H., Abedi, M., & Rad, S.T. (2015). A new mathematical model for scheduling
flexible flow shop problem with learning and forgetting effects of workers.
International Journal of Industrial and Systems Engineering, 21(4), 534-549.
Lin, S.-W. & Ying, K.-C. (2015). A multi-point simulated annealing heuristic for solving
multiple objective unrelated parallel machine scheduling problems. Journal
International Journal of Production Research, 53(4), 1065-1076.
Shaukat, A.B., John, L.H., & Jaymeen, R.S. (1991). Mathematical modeling of scheduling
problems. International Journal of Information and Management Sciences, 12(1),113-
137.
Sherali, H.D., Van Goubergen, D., & Van Landeghem, H. (2006). A quantitative approach
for scheduling activities to reduce set-up in multiple machine lines. European Journal
of Operational Research, 187(3), 1224-1237.
Shingo, S. (1985). A Revolution in Manufacturing: The SMED System. Cambridge:
Productivity Press.
Dao, T.-K., Pan, T.-S., Nguyen, T.-T., & Pan, J.-S. (2018). Parallel bat algorithm for
optimizing makespan in job shop scheduling problems. Journal of Intelligent
Manufacturing, 29(2), 451-462.
Tavakkoli-Moghaddam, R. & Daneshmand-Mehr, M. (2005). A computer simulation model
for job shop scheduling problems minimizing makespan. Computers & Industrial
Engineering, 48(4), 811-823.
Tavares Neto, R. F. & Godinho Filho, M. (2011). An ant colony optimization approach to a
permutational flowshop scheduling problem with outsourcing allowed. Computers &
Operations Research, 38(9), 1286-1293.
Van Goubergen, D., & Van Landeghem, H. (2002). Rules for integrating fast changeover
capabilities into new equipment design. Robotics and Computer Integrated
Manufacturing, 18(3-4), 205-214.

26
Woo, Y.-B., Jung, S., & Kim, B.S. (2107). A rule-based genetic algorithm with an
improvement heuristic for unrelated parallel machine scheduling problem with time-
dependent deterioration and multiple rate-modifying activities. Computers & Industrial
Engineering, 109, 179-190.
Yassine, O., Farouk, Y., Hicham, C., & Alice, Y. (2013). Workload balancing in identical
parallel machine scheduling using a mathematical programming method. International
Journal of Computational Intelligence Systems, 7(1), 58-67.

27
APPENDICES
Appendix A: Programming Code
In the program, at first the user should input machine and job information in order. The
example shown in below figure. Machine start date:19-03-2019. In the examined company,
there are two shifts per day, and working time of each day is 16 hours.
28
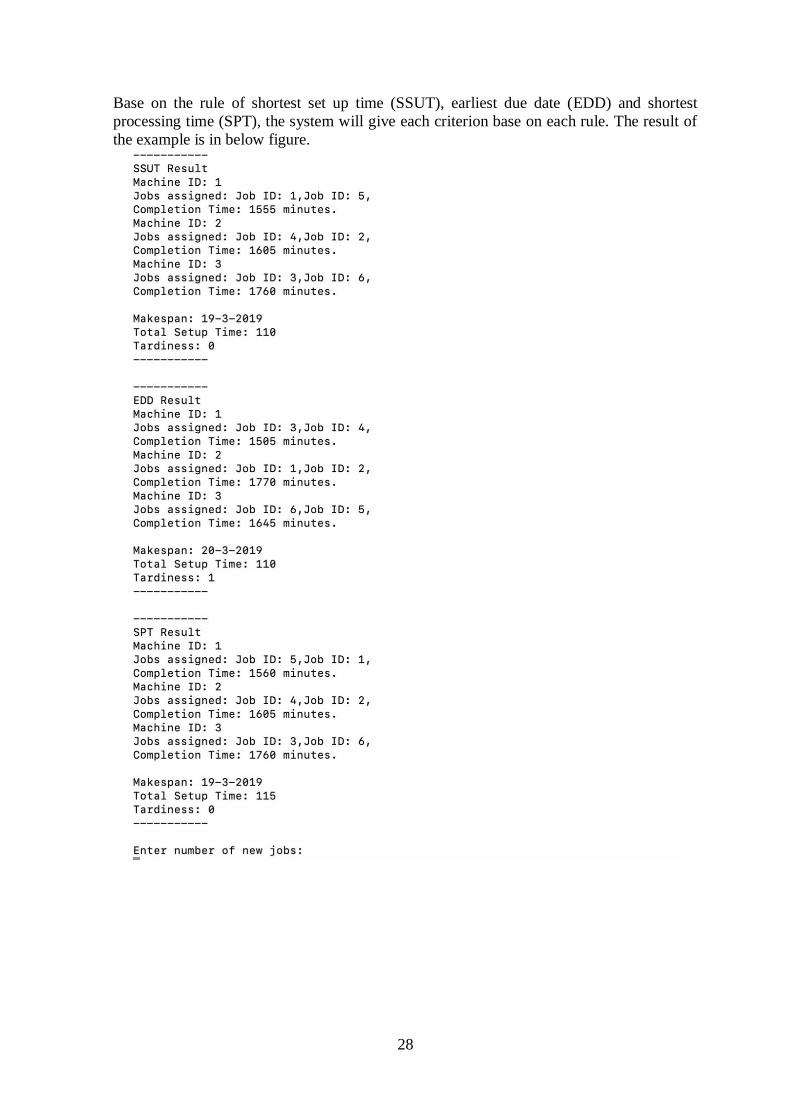
Base on the rule of shortest set up time (SSUT), earliest due date (EDD) and shortest
processing time (SPT), the system will give each criterion base on each rule. The result of
the example is in below figure.