Application of Different Multi-criteria Decision Techniques to Determine Optimum Flavour of...
18
1 23 Food and Bioprocess Technology An International Journal ISSN 1935-5130 Food Bioprocess Technol DOI 10.1007/s11947-012-0972-9 Application of Different Multi-criteria Decision Techniques to Determine Optimum Flavour of Prebiotic Pudding Based on Sensory Analyses Vildan Er Gurmeric, Mahmut Dogan, Omer Said Toker, Ercan Senyigit & Nevruz Berna Ersoz
-
Upload
independent -
Category
Documents
-
view
0 -
download
0
Transcript of Application of Different Multi-criteria Decision Techniques to Determine Optimum Flavour of...

1 23
Food and Bioprocess TechnologyAn International Journal ISSN 1935-5130 Food Bioprocess TechnolDOI 10.1007/s11947-012-0972-9
Application of Different Multi-criteriaDecision Techniques to DetermineOptimum Flavour of Prebiotic PuddingBased on Sensory Analyses
Vildan Er Gurmeric, Mahmut Dogan,Omer Said Toker, Ercan Senyigit &Nevruz Berna Ersoz

1 23
Your article is protected by copyright and all
rights are held exclusively by Springer Science
+Business Media New York. This e-offprint is
for personal use only and shall not be self-
archived in electronic repositories. If you
wish to self-archive your work, please use the
accepted author’s version for posting to your
own website or your institution’s repository.
You may further deposit the accepted author’s
version on a funder’s repository at a funder’s
request, provided it is not made publicly
available until 12 months after publication.

ORIGINAL PAPER
Application of Different Multi-criteria Decision Techniquesto Determine Optimum Flavour of Prebiotic Pudding Basedon Sensory Analyses
Vildan Er Gurmeric & Mahmut Dogan &
Omer Said Toker & Ercan Senyigit & Nevruz Berna Ersoz
Received: 18 April 2012 /Accepted: 25 September 2012# Springer Science+Business Media New York 2012
Abstract The selection of optimum aroma among vanilla,strawberry and cacao for prebiotic pudding was aimed basedon sensory analyses by performing multi-criteria decision tech-niques [analytic hierarchy process (AHP), simple additiveweighting (SAW), technique for order preference by similarityto ideal solution (TOPSIS) and elimination et choix traduisant larealite-elimination and choice translating reality (ELECTRE)]. Inthe first part of the study, the physicochemical (pH, viscosity, drymatter and ash content) and functional properties (bulk density,water-holding capacity and oil-holding capacity) of the dietaryfibres (lemon, inulin, apple andwheat) were determined.Accord-ing to our results, there are significant differences between thefibres (P<0.05). In the second part of the study, the INU/OLIdietary fibre was added to the different flavoured pudding sam-ples (cacao, strawberry and vanilla). Some of their physicochem-ical (bulk density, dry matter and viscosity) and sensorialproperties (appearance, consistency of appearance, consistencyin the mouth, taste and smell, adhesiveness and general accept-ability) were identified. In the last part of the study, multi-criteriadecision techniques (AHP, SAW, ELECTRE and TOPSIS) wereapplied to obtain the ranking of the pudding samples based onthe sensorial scores. According to the results of this study,strawberry-flavoured pudding (not including fibre) was mostlypreferred. By considering the ranking of the puddings, it was
seen that strawberry flavour was the most appropriate for prebi-otic pudding. As a result of this study, it was found that multi-criteria decision techniques may be performed to sensorial scoresin the food industry to reduce many results to one result thusfacilitating the comparison of samples and the explication ofresults obtained from sensory analysis.
Keywords Prebiotic pudding . Dietary fibre . Sensoryanalyses .Multi-criteria decision .AHP .SAW .ELECTRE .
TOPSIS
Introduction
Puddings are milk protein-based starch pastes with a semi-solid texture (Lim and Narsimhan 2006). Powdered andprepackaged forms of puddings can be found in the market(Toker et al. 2012). They are mainly composed of vanilla,milk, sugar and thickeners (gum and starch) (Ares et al.2009), and other ingredients such as cacao and fruit aromascan be added to formulations to provide a variety of differ-ent flavoured puddings for the market. Starch and gum,especially carrageenan, are very important for the desiredmouthfeel and texture of pudding (Verbeken et al. 2006).The type and amount of these ingredients affect the nutri-tional and sensory characteristics of the product which arethe crucial factors affecting consumer preference (Dogan etal. 2012). If the desired sensory and textural property ofpudding is obtained, it is relishingly consumed by people.
In addition to sensory and textural properties, consumersare now more interested in consuming functional foods(Dogan et al. 2012), which have health-promoting effectsas well as their nutritional value, since the awareness ofconsumers about diet and health has increased in recentyears (Fagan et al. 2006). In this respect, improving thefunctionality of pudding is important due to its wide
Electronic supplementary material The online version of this article(doi:10.1007/s11947-012-0972-9) contains supplementary material,which is available to authorized users.
V. E. Gurmeric :M. Dogan (*) :O. S. Toker :N. B. ErsozDepartment of Food Engineering, Faculty of Engineering,Erciyes University,38039, Kayseri, Turkeye-mail: [email protected]
E. SenyigitDepartment of Industrial Engineering, Faculty of Engineering,Erciyes University,38039, Kayseri, Turkey
Food Bioprocess TechnolDOI 10.1007/s11947-012-0972-9
Author's personal copy

consumption. In the food industry, dietary fibres are usedwidely due to their health-promoting effects. Dietary fibreshave an important role in the bacterial colonization of thegastrointestinal zone and promote healthy eating habits inyoung children (Edwards and Parrett 2003). In addition,foods which contain high amounts of dietary fibres reduceobesity because they give a feeling of fullness (Hanley et al.2000). Dietary fibre protects against cardiovascular dis-eases, diabetes, colon cancer and other diverticular diseases(Lee et al. 1992). Despite the many benefits of dietary fibre,the addition of dietary fibre to the formulation is not suffi-cient for consumption of the product since the sensorial andtextural acceptability of the product is also necessary.
Any undesirable taste resulting from dietary fibres may besuppressed by the addition of different flavours. Selection ofthe most appropriate flavour can be determined by sensoryanalysis. Sensory analyses involve the analysis and the inter-pretation of the responses by the panelists (Cruz et al. 2010).Sensory properties lead to the consumers’ acceptance or re-jection of a product, and these are determined by the humansenses. Although sensory analysis provides substantial infor-mation about the acceptability level of the product, the inter-pretation of the sensorial results is very difficult since sensoryanalysis is composed of many criteria such as appearance,colour, taste and consistency. While one sample is preferred interms of colour, another is appreciated for its consistency.Therefore, the combination of criteria is important and canprovide only one result, which facilitates the interpretation ofthe sensorial analysis results and the selection of the bestsample. In order to combine all the criteria of the sensoryanalysis, multi-criteria decision techniques can be used. To thebest of our knowledge, there is no study on the performance ofmulti-criteria decision techniques in the food industry.
Multi-criteria decision making (MCDM) is a well-knownbranch of decision making. It is a branch of a general class ofoperation research models which deal with decision problemsunder the presence of a number of decision criteria (Pohekarand Ramachadran 2004). Multi-criteria decision making canbe defined as the evaluation of the alternatives for the purposeof selection or ranking, using a number of qualitative and/orquantitative criteria that have different measurement units(Ozcan et al. 2011). There are several methods in MCDM.Analytic hierarchy process (AHP), technique for order prefer-ence by similarity to ideal solution (TOPSIS), elimination etchoix traduisant la realite-elimination and choice translatingreality (ELECTRE) and simple additive weighting (SAW) arewell known and the most acceptable methodologies.
Decision making methodologies are quite distinct fromeach other through their use of different calculation meth-ods. In MCDM methodologies, for the ranking among alter-natives and the determination of their preference, it isnecessary to determine the relative importance of criteria(Saaty 1980). Firstly, in this study, these methodologies are
compared in terms of the main characteristic of decisiontheory, and then, the advantages and disadvantages of thesemethodologies are given. The steps of all the methods arepresented in order. Later, the application of these methodol-ogies to the problem is presented.
One of the most outstanding MCDM approaches is theAHP which has its roots in obtaining the relative weightsamong the factors and the total values of each alternativebased on these weights. TOPSIS is a MCDM methodologywhich determines solution alternatives from a finite set on thebasis of maximising the distance from the negative ideal pointand minimising the distance from the positive ideal point(Olson 2004). The ELECTRE method shows a difference inhow preference relations between alternatives are obtainedand how to achieve the ranking of solutions by using theserelations (Wang and Triantaphyllou 2008). SAW, which isalso known as a weighted linear combination or scoringmethod, is a simple and commonly used MCDM method.
The aims of this research are as follows: (1) to determinesome of the physicochemical properties of different fibres,(2) to improve the functional property of different puddingsby adding dietary fibre and (3) to determine the best flavourfor prebiotic pudding by the AHP, TOPSIS, ELECTRE andSAW techniques based on sensory analyses.
Material and Methods
Materials
Wheat fibres (JRS, Germany), apple fibres (JRS, Germany),lemon fibres (Herbafood, Germany) and inulin fibres (Orafti,Belgium) were procured from Bayrak Gida, Kayseri. Sucrose,corn starch, skimmed milk powder, gum, cacao and vanillawere also obtained from Bayrak Gida, Kayseri.
Preparation of the Pudding Samples
Ten grams of sucrose, 4.2 g corn starch, 0.2 g gum, 5 gskimmed milk powder and 2 g flavoured compounds (va-nilla, cacao and strawberry) were slowly added to 100 mlmilk at 40 °C, and the mixture was then mixed by magneticstirrer (Yellow Line, Germany). It was heated to 85 °C in20 min and then stirred for 5 min at the same temperature.The puddings were then cooled to room temperature andstored in a refrigerator for 2 h before analysis. The dietaryfibre content of each pudding sample was adjusted to 2 %.
Determination of pH Value, Moisture Content, Ash Content,Bulk Density, and Viscosity Values of the Samples
The moisture and ash content of the fibres and the puddingsamples were determined according to the Association of
Food Bioprocess Technol
Author's personal copy

Official Analytical Chemists (1996). The moisture contentwas determined at 105 °C in a drying oven (Sartorious,MA30, Germany) as the time at which the samples reachedconstant weight. Ash content was carried out at 550 °C in anash oven (Nuve, MF120, Turkey) until the grey ashes wereobserved. The suspension for pH measurement was pre-pared by blending a 10 g fibre sample with 100 mL ofdeionized water for 3 min. The pH value was determinedusing a pH meter (Hanna, HI 120, Germany) at 25 °C. The2 % (w/v) fibre solution was prepared for viscosity measure-ments. The viscosity value of the fibre solution at 25 °C wasdetermined by using a viscosimeter (And, SV 10, Japan). Inorder to determine bulk density (grams per millilitre), a 10-ml graduated cylinder was used. The bottom of the cylinderwas gently tapped on a laboratory bench several times untilthere was no further decrease in the sample level (Chau et al.2007). Bulk density was expressed as grams of fibre per unitvolume (millilitre).
Determination of Water- and Oil-Holding Capacityof the Dietary Fibres
The water-holding capacity (WHC) and oil-holding capacity(OHC) of the fibres were determined by using the modifiedmethod of Robertson et al. (2000). Ten millilitres of distilledwater or commercial corn oil was added to 10 mg of fibre,and this mixture was stirred with a vortex every 30 s for aperiod of 5 min and left at room temperature for 30 min.Then it was centrifuged at 2,350×g for 10 min (Nüve, 800R, Turkey). After centrifugation, the weight of the residuewas determined. WHC and OHC were expressed as gramsof water and oil, respectively, held per gram of sample.
Statistical Analysis
The mean and standard deviations were calculated by usingSPSS 17.0.1. In addition, principal component analyse(PCA) was also performed by the Statistical Package forthe Social Sciences (SPSS) 17.0.1 statistical packageprogramme (Ural and Kilic 2006) to reduce the number ofvariables based on their similarities. PCA includes mathe-matical tools that reduce the overall set of original variablesinto smaller mathematical constructs known as principlecomponents (Brito et al. 2006). Correlations were deter-mined using Pearson correlation using SPSS 17.0.1. All ofthe analyses mentioned above were replicated three times.
Sensory Analyses of Pudding Samples
The prepared pudding samples were presented at 15 °C topanelists in randomly coded plastic containers. Twenty pan-elists were selected either from academic staff or fromgraduate students of the Food Engineering Department at
Erciyes University, Kayseri. The panelists cleaned theirpalates before proceeding to the next sample. Before thesensory analysis, the panelists were given training about thesensory evaluation techniques. Appearance, taste and smell,consistency of the appearance, consistency in the mouth andthe general acceptability of the pudding samples were eval-uated by the panelists. All sensory attributes were evaluatedby form using a scale of 1–9, in which 1 reflected a very lowand 9 a very high score.
Application of AHP, TOPSIS, ELECTRE and SAWTechniques to Sensory Analyse Results of the PuddingSamples
The decision hierarchy of the pudding flavour selection isshown in Fig. 1.
AHP Method
The AHP method builds on the pairwise comparison modelfor determining the weights for every unique criterion. Saaty(1980) developed the following steps to apply the AHP:
1. Define the problem and determine its goal.2. Construcion of a pairwise comparison matrix of the
criteria. Table 1 shows the pairwise comparison scalefor AHP method. According to Table 1, if one criterionis strongly preferred to the other criteria, numericalrating is selected as 5. In this study, the pairwise com-parison matrix was constructed based on the ten differ-ent people’s opinion.
Xij ¼
x11 x12 . . . x1mx21 x22 . . . x2m: :: :: :
xm1 xm2 . . . xmm
26666664
37777775
where Xij is the pairwise comparion matrix of thealternatives, xij is the numerical rating between thecriteria i and j. m is the number of the criteria. Thenumerical rating between criteria is formed by usingTable 1.
3. Normalisation of the Xij matrix. Normalisation isequal to the ratio of the relevant parameter to thesum of the its row. For example, normalised valueof x11 is equal to x11 x11 þ x21 þ . . . :xm1ð Þ:=
4. The consistency of the pairwise comparison matrix isdetermined by using the consistency ratio (CR).
5. In order to determine the CR, the following Di
matrix is formed by multiplying Xij matrix and itspriority matrix (Bi).
Food Bioprocess Technol
Author's personal copy

Di ¼
d1d2:::dm
26666664
37777775
By using Di and Bi (in step 8) matrices, thehighest eigenvalue (λmax) is calculated by usingthe following equation.
lmax ¼ 1
m
Xmi¼1
dibi
ð1Þ
6. Having made all the pairwise comparisons, the consis-tency is determined by using the eigenvalue, λmax, tocalculate the consistency index, CI, as follows: CI0(λmax−n)/(n−1) where n is the matrix size. Judgementconsistency can be checked by CR, equal to the dividingof the CI to the random consistency (RC) value obtainedfrom Table 2 according to the matrix size (n) which isequal to number of criteria. If the n value is 5, RC valuewas accepted as 1.12. The pairwise comparison matrixis acceptable if the CR value is lower than 0.10. If it ishigher, the judgment matrix is inconsistent. To obtain aconsistent matrix, judgments should be reviewed andimproved.
Pudding Flavor
Selection
Taste andOdour
Consistency in Mouth
Adhesiveness
Consistency of
Appearance
General Acceptability
V2
C2
C1
S2
S1
Appearance V1
Fig. 1 The decision hierarchyof the pudding flavour selectionproblem
Table 1 Pairwise comparison scale for AHP preferences
Numerical rating Verbal judgments of preferences
9 Extremely preferred
8 Very strongly to extremely
7 Very strongly preferred
6 Strongly to very strongly
5 Strongly preferred
4 Moderately to strongly
3 Moderately preferred
2 Equally to moderately
1 Equally preferred
Food Bioprocess Technol
Author's personal copy

Xij ¼
x11 x12 . . . x1mx21 x22 . . . x2m: :: :: :
xm1 xm2 . . . xmm
26666664
37777775
7. Paired comparison matrix of alternatives for each criterion isconstructed. In this study, that matrix was formed by deter-mination of the ratio between two alternatives. For instance,general acceptability of the alternative A is 2, and that of B is1.Whenmaking comparison, XAB02/102' (and XBA01/200.5). After construction of pairwise comparison matrix foreach criterion, their CR values are calculated (Kamal andAl-Harbi 2001). If CR is lower than 0.1, then continue themethod.
Yij ¼
x11 x12 . . . x1mx21 x22 . . . x2m: :: :: :
xm1 xm2 . . . xmm
26666664
37777775
where Yij is the pairwise comparisonmatrix of alternativesfor one criterion. That matrix is normalised like step 3.
8. Priority vectors of the alternatives for each criterion andthe criterion are calculated. For example, priority vectorof Yij is the following:
Bi ¼
b1b2:::bm
26666664
37777775
where a110(x11+x12+……..+x1m)/m. Then, the matrixCij is constructed by combining all of the priority ma-trices of alternatives for each criterion.
Cij ¼
x11 x12 . . . x1nx21 x22 . . . x2n: :: :: :
xm1 xm2 . . . xmn
26666664
37777775
where the first row is the priority matrix of alternatives forcriterion 1, and the second row is the that of criterion 2, andso on.
9. The overall score was calculated by multiplying priorityvectors of alternatives (Cij) and priority vectors of criteri-on. The alternative with the highest overall score valueshould be taken as the best alternative. One of the majoradvantages of AHP is that it calculates the inconsistencyindex as a ratio of the decision maker’s inconsistency andrandomly generated index. This index is important for thedecision maker to assure him that his judgments wereconsistent and that the final decision is made well (Pohekarand Ramachandran 2004).
SAW
1. Construct a pairwise comparison matrix (n×n) for cri-teria with respect to the objective by using Saaty’s 1–9scale of pairwise comparisons shown in Table 1. Inother words, it is used to compare each criterion witheach other criterion, one by one.
2. For each comparison, we decide which of the twocriteria is most important, and then assign a score toshow how much more important it is.
3. Construct a decision matrix (m×n) that includes malternative and n criteria. Normalised decision matrixwas formed like step 3 of the AHP method.
4. Formation of the weighted normalised matrix by usingthe following equation:
Ai ¼X
wj xij ð2Þwhere xij is the score of the ith alternative with respect tothe jth criteria, and wj is the weight of the criteria.(Afshari et al. 2010).
5. Ranking of the alternatives by calculating the sum of therows of the weighted normalised vectors.
ELECTRE
This method is capable of handling discrete criteria of both aquantitative and qualitative nature and provides completeordering of the alternatives. The problem is to be so formu-lated that it chooses alternatives that are preferred over mostof the criteria and that do not cause an unacceptable level ofdiscontent for any of the criteria. The concordance, discor-dance indices and threshold values are used in this tech-nique. Based on these indices, graphs for strong and weakrelationships are developed (Pohekar and Ramachandran2004). The steps of the method are as follows:
Table 2 Average random con-sistency (RI) Size of matrix 1 2 3 4 5 6 7 8 9 10
Random consistency 0 0 0.58 0.9 1.12 1.24 1.32 1.41 1.45 1.49
Food Bioprocess Technol
Author's personal copy
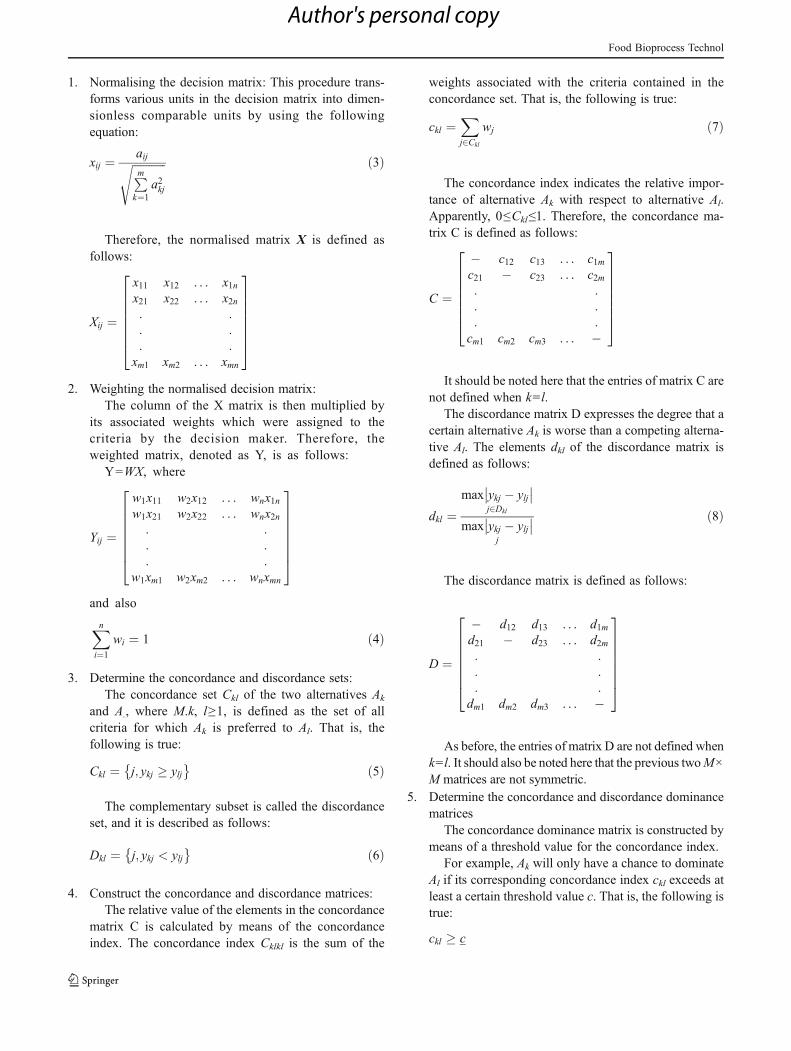
1. Normalising the decision matrix: This procedure trans-forms various units in the decision matrix into dimen-sionless comparable units by using the followingequation:
xij ¼ aijffiffiffiffiffiffiffiffiffiffiffiffiPmk¼1
a2kj
s ð3Þ
Therefore, the normalised matrix X is defined asfollows:
Xij ¼
x11 x12 . . . x1nx21 x22 . . . x2n: :: :: :
xm1 xm2 . . . xmn
26666664
37777775
2. Weighting the normalised decision matrix:The column of the X matrix is then multiplied by
its associated weights which were assigned to thecriteria by the decision maker. Therefore, theweighted matrix, denoted as Y, is as follows:
Y0WX, where
Yij ¼
w1x11 w2x12 . . . wnx1nw1x21 w2x22 . . . wnx2n: :: :: :
w1xm1 w2xm2 . . . wnxmn
26666664
37777775
and also
Xni¼1
wi ¼ 1 ð4Þ
3. Determine the concordance and discordance sets:The concordance set Ckl of the two alternatives Ak
and A., where M.k, l≥1, is defined as the set of allcriteria for which Ak is preferred to Al. That is, thefollowing is true:
Ckl ¼ j; ykj � ylj� � ð5Þ
The complementary subset is called the discordanceset, and it is described as follows:
Dkl ¼ j; ykj < ylj� � ð6Þ
4. Construct the concordance and discordance matrices:The relative value of the elements in the concordance
matrix C is calculated by means of the concordanceindex. The concordance index Cklkl is the sum of the
weights associated with the criteria contained in theconcordance set. That is, the following is true:
ckl ¼Xj2Ckl
wj ð7Þ
The concordance index indicates the relative impor-tance of alternative Ak with respect to alternative Al.Apparently, 0≤Ckl≤1. Therefore, the concordance ma-trix C is defined as follows:
C ¼
� c12 c13 . . . c1mc21 � c23 . . . c2m: :: :: :
cm1 cm2 cm3 . . . �
26666664
37777775
It should be noted here that the entries of matrix C arenot defined when k0l.
The discordance matrix D expresses the degree that acertain alternative Ak is worse than a competing alterna-tive Al. The elements dkl of the discordance matrix isdefined as follows:
dkl ¼max ykj � ylj
����j2Dkl
max ykj � ylj����
j
ð8Þ
The discordance matrix is defined as follows:
D ¼
� d12 d13 . . . d1md21 � d23 . . . d2m: :: :: :
dm1 dm2 dm3 . . . �
26666664
37777775
As before, the entries of matrix D are not defined whenk0l. It should also be noted here that the previous twoM×M matrices are not symmetric.
5. Determine the concordance and discordance dominancematrices
The concordance dominance matrix is constructed bymeans of a threshold value for the concordance index.
For example, Ak will only have a chance to dominateAl if its corresponding concordance index ckl exceeds atleast a certain threshold value c. That is, the following istrue:
ckl � c
Food Bioprocess Technol
Author's personal copy

The threshold value c can be determined as theaverage concordance index. That is, the following rela-tion is true:
c ¼ 1
mðm� 1ÞXmk¼1
Xml¼1
ckl ð9Þ
Based on the threshold value, the concordance dom-inance matrix F is determined as follows:
fkl ¼ 1; If ckl � cfkl ¼ 0; If ckl < c
Similarly, the discordance dominance matrix G isdefined by using a threshold value d, where d is definedas follows:
d ¼ 1
mðm� 1ÞXmk¼1
Xml¼1
dkl ð10Þ
And
gkl ¼ 1; if dkl � dgkl ¼ 0; if dkl < d
6. Determine the aggregate dominance matrix:The elements of the aggregate dominance matrix E
are defined as follows:
ekl ¼ fkl � gkl ð11Þ
7. Eliminate the less favourable alternatives:From the aggregate dominance matrix, we can obtain a
partial-preference ordering of the alternatives. If ekl01,then this means that Ak is preferred to Al by using bothconcordance and discordance criteria. If any column ofthe aggregate dominance matrix has at least one elementequal to 1, this column is “ELECTREally” dominated bythe corresponding row. Therefore, we simply eliminateany column(s) which has an element equal to 1. Then, thebest alternative is the one which dominates all otheralternatives in this manner (Triantaphyllou et al. 1998).
Finally, the ELECTRE method yields a whole systemof binary outranking relations between the alternatives.Because the system is not necessarily complete, theELECTRE method is sometimes unable to identify thepreferred alternative. It only produces a core of leadingalternatives. This method has a clearer view of alterna-tives by eliminating less favourable ones, especially con-venient while encountering a few criteria with a largenumber of alternatives in a decision-making problem(Pohekar and Ramachandran 2004).
TOPSIS
This method was developed by Huang and Yoon as an alter-native to ELECTRE. The basic concept of this method is thatthe selected alternative should have the shortest distance fromthe negative ideal solution in a geometrical sense. The methodassumes that each attribute has a monotonically increasing ordecreasing utility. This makes it easy to locate the ideal andnegative ideal solutions. Thus, the preference order of alter-natives is yielded through comparing the Euclidean distances(Pohekar and Ramachandran 2004).
1. Construct the normalised decision matrix:This process tries to convert the various attribute
dimensions into nondimensional attributes.An element rij of the normalised decision matrix can
be calculated as follows:
xij ¼ aijffiffiffiffiffiffiffiffiffiffiffiffiPmk¼1
a2kj
s ð12Þ
2. A set of weights W0(w1, w2, w3, …, wN), (wherePni¼1
wi ¼ 1) defined by the decision maker is accommodated
to the decision matrix to generate the weighted normal-ised matrix Yij as follows:
Yij ¼
w1x11 w2x12 . . . wnx1nw1x21 w2x22 . . . wnx2n: :: :: :
w1xm1 w2xm2 . . . wnxmn
26666664
37777775
3. Obtain performance data for n alternatives over k crite-ria. Raw measurements are usually standardized, con-verting raw measures rij into standardised measures nij.The conversion of the existing decision making matrixto the non-scaled matrix follows the following formula:
4. Develop a set of importance weights wk, for each of thecriteria. The basis for these weights can be anything, butusually is ad hoc reflective of relative importance. Scale isnot an issue if standardising was accomplished in Step 1.
5. Determination of the positive ideal solution (A*) andnegative ideal solution (A−).
A� ¼ v1�; v2�;v3� . . . . . . :; vn�� �
maximum valuesð ÞA� ¼ v�1 ; v2�;v3� . . . . . . :; : vn�
� �minimum valuesð Þ
v is the weighted normalised values.6. Calculation of the distance of each alternative from
positive and negative ideal solution
Di� ¼
ffiffiffiffiffiffiffiffiffiffiffiffiffiffiffiðvij � vj
q�Þ2
���ð13Þ
Food Bioprocess Technol
Author's personal copy

Di� ¼
ffiffiffiffiffiffiffiffiffiffiffiffiffiffiffiffiffiðvij �vj�
qÞ2��
ð14Þ
vij, vj* and vj− are the weighted normalised value,positive and negative ideal solutions, respectively.Di* and Di
− are the distance from positive andnegative ideal solution.
7. For each alternative, determine a ratio R equal to thedistance to the nadir divided by the sum of the distanceto the nadir and the distance to the ideal
R ¼ D�
D� þ Dþð Þ ð15Þ
8. Ranking of the alternatives by using the R values(Sadeghzadeh and Salehi 2011; Triantaphyllou et al.1998). The sample with the highest R value is the bestalternative.
Results and Discussion
Physicochemical Properties of the Dietary Fibres
In the first part of the study, the physicochemical and func-tional properties (moisture content, ash content, pH value,bulk density, water-holding and oil-holding capacity) ofnine different fibres (wheat fibres (WF 101, WF200, WF600 and WF 600/30), apple fibres (AF01 and AF401),lemon fibre (AQ plus), inulin and inulin/oligofructose) weredetermined to decide which fibre should be added to pud-ding. Table 3 shows the physicochemical properties of thefibres. As is seen, the moisture content of the fibres was inthe range of 4.98–7.55 %, while the ash content of the fibreschanged between 0.03 and 2.45 %. Wang et al. (2002) alsodetermined the moisture and ash content of carrot, pea andinulin fibres, and the range of the moisture and ash content
was determined as between 3.0 and 5.6 % and 1.4–2.2 %,respectively. In another study, the ash contents of the differ-ent fibre concentrates ranged between 0.56 and 3.91 %, andthe lemon fibre contained more ash than that of apple fibre(Figuerola et al. 2005), which is consistent with this study.In addition, the moisture content of different fibre concen-trates was found to be between 2.0 and 10.5 %. The chem-ical composition of the raw materials from which fibres areproduced may be the main factor affecting the ash andmoisture content of the fibres. In addition, the productionprocess of the fibres may also affect the chemical propertiesof the fibres. The raw material is scalded and dried duringthe production of the fibres (Viuda-Martos et al. 2012). Theash content decreases after these treatments as well as theprotein and flavonoid contents (Marín et al. 2007). In brief,the duration and condition of treatments (temperature) andcharacteristics of the raw materials are the main factors tocause variation in the ash and moisture contents of fibres.
The dietary fibre samples showed a pH value between 3.22and 7.51. The pH value of pomegranate fibre, orange fibre andlemon albedo fibre was found to be 4.40, 4.06 and 3.96,respectively (Garau et al. 2007; Lario et al. 2004; Viuda-Martos et al. 2012). As is seen, the pH value of lemon fibreand apple fibre was very close to each other, and they arelower than that of wheat fibres. The pH value is important forthe deterioration of the product resulting frommicroorganism,enzymes or nonenzymatic reactions (Viuda-Martos et al.2012). By considering this aspect of foods, the usage of lemonfibre and apple fibre in formulations may be safer than that ofwheat fibre.
In addition to physicochemical properties, some functionalcharacteristics (water-holding capacity, oil-holding capacityand bulk density) of the fibres were determined. The function-al properties of the fibres play an important role in the nutri-tional and sensory characteristics of food and the physicalbehaviour of food or its ingredients during preparation, pro-cessing and storage (Tiwari and Cummins 2011). Bulk densityis defined as the weight of sample per unit volume and is a
Table 3 Physicochemical properties of dietary fibres
Fibres Moisture (%) Ash (%) pH Bulk density (g/ml) WHC (g/g) OHC (g/g) Viscosity (mPa.s)
WF 101 7.03±0.09 0.80±0.01 7.33±0.01 0.51±0.23 2.83±0.06 2.12±0.02 1.12±0.33
WF 200 7.15±0.06 0.74±0.02 7.51±0.02 0.27±0.01 3.58±0.03 3.78±0.17 1.68±0.24
WF 600 6.42±0.18 0.65±0.01 7.39±0.01 0.47±0.01 3.04±0.01 2.36±0.01 1.59±0.06
WF 600/30 7.42±0.70 0.83±0.00 7.33±0.06 0.47±0.01 3.00±0.06 2.23±0.04 1.55±0.27
AF 401 6.36±0.19 1.50±0.01 3.61±0.01 0.70±0.01 2.97±0.02 1.34±0.03 2.49±0.39
AF 01 6.13±0.06 1.56±0.03 3.64±0.02 0.71±0.22 2.81±0.01 1.36±0.04 2.15±0.14
AQ PLUS 7.55±0.11 2.45±0.04 3.22±0.01 0.60±0.01 4.63±0.07 1.68±0.01 2.39±0.23
INU 4.98±0.29 0.03±0.00 7.03±0.01 0.79±0.01 – 1.17±0.01 1.48±0.20
INU/OLI 6.24±0.15 0.07±0.00 6.69±0.02 0.74±0.00 – 1.12±0.00 1.68±0.13
WHC water-holding capacity, OHC oil-holding capacity,WFs wheat fibres, AFs apple fibres, AQ PLUS lemon fibre, INU inulin, OLI oligofructose
Food Bioprocess Technol
Author's personal copy

good indicator of structural changes (Sreerama et al. 2009).The bulk density values of the fibres in our study variedbetween 0.27 and 0.79 g/mL (Table 3). Dalgetty and Baik(2003) reported the bulk density values of several legumes torange between 0.21 and 0.84 g/mL. The size of fibre particlesaffects the bulk density of samples, and it was reported thatsmaller fibre particles have a higher bulk density value(Huang et al. 2009). Moreover, the ratio of the soluble andinsoluble content of fibres is also a factor affecting the bulkdensity value (Dalgetty and Baik 2003).
The water-holding capacity (WHC) of fibres is importantfor the physiological actions as well as for the technologicalproperties of the dietary fibres (Tiwari and Cummins 2011).WHC represents the ability of a moist material when subjectedto force like centrifugal gravity (Viuda-Martos et al. 2012).The WHC is equal to the sum of the bound water, hydrody-namic water and physically trapped water (Vázquez-Ovandoet al. 2009). The water holding and swelling properties of thefibres are crucial for the physiological role in gut function andcontrol of postprandial glucose levels (Wolever 1990). Inaddition, fecal bulking capacity of fibres depends on theirwater-holding capacity (Lopes et al. 1998). The WHC valuesof the fibres were found to be between 0 and 4.63 g fibre/gwater (Table 3). Dalgetty and Baik (2003) found the WHCvalue of different fibres as between 0 and 13.4 ml/g fibre.According to their results, insoluble fibres had a higher WHCvalue than soluble fibres. TheWHC values of the citrus, appleand wheat fibres were also determined in many studies inwhich their WHC value ranged between 4.6 and 7.0 ml wa-ter/g dry fibre (Auffret et al. 1994; Robertson et al. 2000;Thibault et al. 1988), 4.6–7.0 ml water/g dry fibre (Auffretet al. 1994; Cloutour 1995; Ralet et al. 1993; Robertson et al.2000) and 0.9–2.7 ml water/g dry fibre (Auffret et al. 1994;Ralet et al. 1990), respectively. The variation between theWHC in dietary fibres might have resulted from the chemicalcomposition of the fibres and the porous matrix structure ofpolysaccharide chains (Cui and Roberts 2009; Guillon andChamp 2000). In addition, as mentioned above, the moisturecontent of the fibres was different, which may affect the WHCresults of the fibre since the dry matter content of the fibreswas different. The factors affecting the WHC value of thefibres are as follows;
1. Processing of fibre: washing causes a decrease in sugarcontent, which decreases WHC (Viuda-Martos et al.2012)
2. Particle size of the fibres: fibres composed of smallerparticles have a lower ability to retain water (Sangnarkand Noomhorm 2003).
3. Both the chemical and physical structures of the fibresaffect the WHC value. Soluble fibre content, like pectinand gums, has a higher WHC than cellulosic fibres(Campos-Vega et al. 2009). However, it was also reported
that insoluble fibres composed of lignin, cellulose andhemicellulose have high WHC (Cummings 1981;Eastwood et al. 1980; Viuda-Martos et al. 2012),which is contradictory with the previous opinion.
The other important property of the fibres used in the foodindustry is oil-holding capacity (OHC) important for stabilisa-tion of high-fat products and emulsions (Tiwari and Cummins2011). The hydrophobic bonding ability of the fibre moleculesaffects the OHC (Tiwari and Cummins 2011). As is seen fromTable 3, the OHC values of the fibres are in the range of 1.12–3.78 g oil/g fibre. Sánchez-Alonso et al. (2007) reported thatthe OHC value of wheat fibre with a particle size of 250 and80 μm was 6.3 and 3.1 g oil/g fibre, respectively. The OHCvalue of different apple and lemon fibres changed between0.60 and 1.45 g oil/g dry matter of fibre and 1.30–1.48 g oil/gdry matter of fibre, respectively (Figuerola et al. 2005). As isseen from the results of this study and the literature, there aresignificant differences between OHC values of fibres, whichcan result from several factors. The molecular affinity andporosity of fibres are factors affecting their OHC (Cui andRoberts 2009). Moreover, OHC depends on surface proper-ties, overall charge density, thickness and the hydrophobicnature of the fibres (Cui and Roberts 2009; Fernández-Lópezet al. 2009). Insoluble dietary fibre content (Thebaudin et al.1997), particle size and drying of the fibres are the otherfactors affecting OHC value (Viuda-Martos et al. 2012).
The magnitudes of viscosity changed between 1.12 and2.49 mPa.s. The main reasons for the difference between theviscosity values of the fibres may be their chemical structure(soluble and insoluble content), moisture content and WHC.The intrinsic characteristics of polysaccharides also affect theviscosity values of a solution (Guillon and Champ 2000).
Application of PCA on Physicochemical Propertiesof Fibres
PCAwas applied to data obtained from the physicochemicalanalyses of the fibres to reduce and correlate variables.Table 4 shows the correlation matrices of the variables.According to Kaiser’s rule, PC1 and PC2 satisfactorilydescribed the variance in the data set since their eigenvalueswere higher than 1 (Table 5). The eigenvalue of PC1 andPC2 was 3.331 and 3.096, respectively, indicating that PC1accounted for more variability than PC2 (47.59 and44.32 %). PC1 and PC2 explained approximately 92 %variance in the data set. This percentage is sufficient forqualitative purposes due to its being a higher value than70 % (Larrigaudiere et al. 2004). The other five PCs cannotexplain any variance since their eigenvalue was lower than1. After determination of the PCs, it is important to deter-mine which parameters are responsible for the variance in
Food Bioprocess Technol
Author's personal copy

the PCs. Table 6 shows the loading of the PCs. According toTable 6,
& The moisture content, the ash content and the WHC ofthe fibres accounted for variation in PC1.
& The pH, bulk density, OHC and viscosity explained thevariation in PC2.
Figure 2 presents the score plot of PC1 versus PC2, and italso provides information about the correlation coefficientbetween the variables equal to the cosine of the angle betweenrespective vectors of the variables on the plot (Shin et al.2010). The angle between pH and viscosity, bulk densityand OHC was equal to approximately 180°, indicating thattheir correlation coefficient was very close to −1 (cos180°0−1). A strong correlation between the WHC and viscosityvalue was expected, but the angle between them was approx-imately 90° meaning that there is no correlation between thesetwo parameters. The dry matter content and chemical structureof the fibres may have caused the relation between WHC andviscosity values.While theWHC depends onmostly insolublefibre content (it also depends on soluble fibre content) (Tiwariand Cummins 2011), viscosity depends on soluble fibre con-tent which dissolves in water to form gel and maximise theviscosity of the solution (Guillon and Champ 2002). For thisreason, there may not be a strong coefficient between WHCand viscosity values. The diversity in fibre content may resultfrom plant variety, environmental conditions, agronomic prac-tices, environmental interaction and various food processing
operations (domestic and industrial) (Khatoon and Prakash2004; Martín-Cabrejas et al. 2006; Vidal-Valverde and Frias1991; Wang et al., 2008). The sample scores, obtained fromEqs. 14 and 15, are shown in Fig. 2b.
F1 ¼ 0:077� A � 0:303� pHþ 0:287� B
þ 0:094� C � 0:109� OHCþ 0:281
�WHCþ 0:287� D ð16Þ
F2 ¼ 0:261� A � 0:081� pHþ 0:087
� B � 0:300� Cþ 0:281� OHCþ 0:241
�WHC � 0:047� D ð17Þwhere F1 and F2 are the sample scores of PC1 and PC2,respectively, A is the moisture content, B is the ash content,C is the bulk density andD is the viscosity values of the fibres.
As is seen from the figure, apple fibres (AF01 and AP401)and lemon fibre are clustered together on the bottom rightquadrant of the plot. The higher viscosity values and ash contentvalues of those fibres caused this clustering. That means, ifviscosity enhancement is expected from the fibre as well as itsfunctional properties, lemon or apple fibre may be added to theformulation for this purpose. The reason for the collection ofinulin fibres on the left bottom quadrant of the plot was their bulkdensity values. The location of the wheat fibres on the lower halfpart of the plot was due to their pH, WHC and OHC values.
This part of the study was carried out to determine whichfibre added to the formulation of the pudding was the best.According to the results, lemon and apple fibres were deter-mined due to their high viscosity values. However, theycaused a grainy texture. Therefore, the INU/OLI dietaryfibre was selected for the enrichment of the pudding samplesincluding different aroma.
Physicochemical Properties of the Pudding Samples
In this part of the study, three different flavoured puddings(vanillin, strawberry and cacao) and their dietary fibre (2 %)including formulations were prepared. The physicochemical
Table 4 Correlation matricesbetween the parameters obtainedfrom analysis of fibres
Bold character shows the signif-icant values at the significancelevel (α00.05)
Moisture Ash pH Bulk density WHC OHC Viscosity
Moisture 1 0.525 −0.053 −0.686 0.784 0.548 0.091
Ash 1 −0.830 −0.034 0.803 −0.043 0.756
pH 1 −0.467 −0.369 0.484 −0.914
Bulk density 1 −0.605 −0.973 0.310
WHC 1 0.516 0.392
OHC 1 −0.304
Viscosity 1
Table 5 Eigenvalues and variance (percentage) of the principalcomponents
PCs Eigenvalue Variance (%)
PC1 3.331 47.590
PC2 3.096 44.232
PC3 0.367 5.250
PC4 0.166 2.367
PC5 0.032 0.456
PC6 0.007 0.098
PC7 0.000 0.007
Food Bioprocess Technol
Author's personal copy

(bulk density, moisture content and viscosity values) andsensory properties of the puddings were determined. Table 7reports the physicocehmical properties of the pudding sam-ples. As is seen, the moisture content of the powderedformulation of the pudding samples was in the range of3.64–4.40 %. The moisture content of the vanillin, straw-berry and cacao flavours caused the moisture content
differences between the samples. The bulk density valuesof the samples were not significantly different from eachother (P>0.05) that means different aroma or fibre additiondid not affect the bulk density value. The viscosity value ofthe pudding samples changed between 44.90 and100.40 mPa.s. In study, while the lowest viscosity valuewas observed in S1 sample, the C2 sample had the highestviscosity value. The addition of fibre caused an increase inviscosity value for each flavour (P<0.05).
Sensory Analyses of the Pudding Samples
In order to determine which aroma is best suitable forprebiotic pudding, sensory analyses (appearance, strangetaste or smell, consistency in mouth, consistency ofappearance, adhesiveness and general acceptability)were carried out. The sensory scores of the puddingsamples are shown in Fig. 3. Generally, the incorpora-tion of the fibre into the pudding formulation caused adecrease in sensorial scores except for consistency. Theaddition of fibre improved the consistency of the pud-dings flavoured with vanillin and strawberry. Thestrawberry-flavoured pudding without fibre (S1) wasmostly appreciated in terms of appearance, strange smelland taste, and general acceptability (Fig. 3). The
Table 6 Loadings of the princi-ple components
most significant loadings arehighlighted in boldface
PC1 PC2 PC3 PC4 PC5 PC6 PC7
Moisture 0.793 −0.407 0.395 0.222 −0.020 −0.003 0.003
Ash 0.883 0.433 0.085 −0.148 −0.036 0.053 −0.007
pH −0.528 −0.840 0.053 0.024 0.098 0.051 0.001
Bulk density −0.481 0.866 0.131 −0.019 −0.021 0.023 0.016
WHC 0.963 −0.164 −0.005 −0.191 0.091 −0.022 0.009
OHC 0.400 −0.857 −0.312 0.015 −0.089 0.017 0.009
Viscosity 0.570 0.726 −0.294 0.238 0.064 0.014 0.000
WF101
WF 200
WF 600WF
600/30
AF 401
AF 01 AQPLUS
INU
INU/OLI
-4
-3
-2
-1
0
1
2
3
4
-4 -3 -2 -1 0 1 2 3 4
PC
2 (4
4.23
%)
PC1 (47.59 %)
b)
0
Moist.
0
Ash
0
pH
0
Bulkdensity
0WHC
0
OHC
0
Vis.
-1
-0.5
0
0.5
1
-1 -0.5 0 0.5 1
PC
2 (4
4.23
%)
PC1 (47.59 %)
a)
Fig. 2 Plot of the component (PC) loading vectors (a) and principalcomponent (PC) score vectors (b)
Table 7 Moisture content, bulk density and viscosity values of pud-ding samples
Samples Moisture (%) Bulk density (g/L) Viscosity (mPa.s)
V1 3.73±0.06 1.13±0.02 64.60±1.41
V2 4.21±0.15 1.10±0.03 67.75±2.62
S1 3.64±0.07 1.14±0.02 44.90±1.49
S2 4.40±0.11 1.11±0.03 51.90±2.75
C1 3.85±0.11 1.11±0.01 77.23±4.47
C2 4.04±0.08 1.12±0.02 100.40±4.22
V1 vanillin-flavoured pudding, V2 vanillin-flavoured including fibre,S1 strawberry-flavoured pudding, S2 strawberry-flavoured puddingincluding fibre, C1 cacao-flavoured pudding, C2 cacao-flavoured pud-ding including fibre
Food Bioprocess Technol
Author's personal copy

pudding which contained vanilla had the highest consis-tency of the appearance, and adhesiveness scores(Fig. 3). It seems that the strawberry prebiotic puddingwas preferred the most by panelists out of all.
As is seen, interpretation of the sensory results is verydifficult especially to determine which sample is best since
there are several results, and each of them is independent ofthe other. As mentioned above, the choice betweenstrawberry- and vanilla-flavoured pudding was very difficultsince strawberry-flavoured pudding was mostly appreciatedconsidering the three properties (appearance, strange smelland taste, general acceptability), and the pudding includingstrawberry was preferred according to consistency and ad-hesiveness scores. In order to facilitate consumer prefer-ence, using of multi-decision criteria techniques may beconsidered to obtain one result which was obtained fromsix different sensory scores.
Application of Multi-criteria Decision Techniquesto Sensory Scores of the Pudding Samples
Four different multi-criteria decision techniques (AHP,ELECTRE, TOPSIS and SAW) were performed to deter-mine the optimum flavour for prebiotic pudding. In the AHPmethod, the data obtained from sensory analyses were di-rectly used like the other methods. In the AHP method, it isnecessary to scale parameters as shown in Table 1. In thisstudy, the sensory scale is between 1 and 9; therefore, thearrangement of the data is not necessary. The comparisonmatrix of the criteria is shown in S1. These values werenormalised by dividing each value to the sum of its column(S1). Priority vectors of criteria were equal to average of thenormalised (synthesized) values of the each row. The pair-wise matrices of alternatives for each criterion were formedby proportioning of sensory scores of the alternatives amongeach other. The paired comparison, synthesized matricesand priority vectors of alternatives for criteria are shown inS2-S7. Consistency of the matrices was checked by theconsistency ratio (CR) values which are seen at the bottomof the each table. As is seen, all of the CR values were lowerthan 0.1 which means the paired comparison matrices wereconvenient. The ranking of the alternatives was performedby multiplying the weight of the criteria matrix by criteriapriority matrices of the alternatives (Table 8). The result of
Fig. 3 Sensory scores of the pudding samples (V1 vanillin-flavouredpudding, V2 vanillin-flavoured including fibre, S1 strawberry-flavoured pudding, S2 strawberry-flavoured pudding including fibre,C1 cacao-flavoured pudding, C2 cacao-flavoured pudding includingfibre, cons consistency, STO strange taste and odour)
Table 8 Priority matrix for flavour prequalification
C1 C2 C3 C4 C5 C6 Overall0.1212* 0.0606 0.1818 0.2424 0.0909 0.3030 −
V1 0.1704 0.1635 0.2116 0.1744 0.2070 0.1570 0.1843
V2 0.1728 0.1510 0.1925 0.1886 0.1874 0.1660 0.1841
S1 0.1849 0.1797 0.2066 0.1829 0.1845 0.1775 0.1921
S2 0.1583 0.1644 0.1930 0.1874 0.1956 0.1570 0.1810
C1 0.1547 0.1672 0.1133 0.1415 0.1167 0.1717 0.1499
C2 0.1588 0.1742 0.0831 0.1252 0.1089 0.1708 0.1395
C1 appearance, C2 taste and odour, C3 consistency of appearance, C4 consistency in mouth, C5 adhesiveness, C6 general acceptability
*Bold numbers show the weight of the criteria
Food Bioprocess Technol
Author's personal copy

that multiplication is shown in the ‘overall’ column. As isseen, S1 sample is the best alternative when consideringassigned conditions.
In the SAW method, sensory scores of the alternativeswere directly used, and those values were normalised byusing Eq. 1. Table 9 shows the normalised and weightednormalised values of the sensory scores. Weighted normal-ised values were calculated by using Eq. 2. Overall scorewas obtained by calculating the sum of the weighted nor-malised value of each criterion of the alternatives. Accord-ing to the SAW technique, S1 sample had the highest value(7.2397) meaning that S1 is the best sample.
Another method applied to determine best alternative isthe ELECTRE method. The sensory scores of the sampleswere calculated by using Eq. 3. The normalised values weremultiplied with weight of the criterion to obtain weightednormalised matrix. The normalised and weighted normal-ised matrices are shown in S8. The concordance (C) anddiscordance (D) indexes of the pudding alternatives for theELECTRE method are shown in Table 10. The overall Cand D values of the alternatives (calculated by using Eq. 9and 10) for the ELECTRE method are shown in Table 11.The S1 sample had the highest C and lowest D value, whichmeans that it was the best sample.
The normalised and weighted normalised matrices of theTOPSIS are the same as that of ELECTRE method. Thenormalised values were calculated by using Eq. 12, and theywere multiplied with the weight of the criterion to acquireweighted normalised matrice. The negative (A−) and posi-tive ideal solutions (A*) were determined by using theweighted normalised values. According to Table 8,
A� ¼ 0:0548; 0:0266; 0:0909; 0:1108; 0:0449; 0:1316ð Þ andA� ¼ 0:0458; 0:0224; 0:0357; 0:0735; 0:0236; 0:1164ð Þ:
The positive (D+) and negative (D−) ideal solution valuesof the alternatives were calculated by using Eq. 12–13, andthey are presented in Table 12. In order to rank the alter-natives, R values were calculated by using Eq. 14. Alikewith the other three methods, S1 sample was the best sampleaccording to the R value.
The ranking results obtained from AHP, TOPSIS,ELECTRE and SAW are presented in Table 13. The valuesin the table express the preference ranking of pudding alter-natives depending on the determined method. According toall the MCDM techniques, the best alternative for pudding isstrawberry-flavoured pudding (S1), while the worst alterna-tive for pudding is cacao-flavoured pudding including fibre
Table 9 Pairwise comparison matrix of alternatives based on the criteria and overall score of the alternatives obtained from SAW
Normalised comparison matrix Weighted normalised matrix Overall
A1 A2 A3 A4 A5 A6 A1 A2 A3 A4 A5 A6
V1 0.1736 0.1627 0.2064 0.1755 0.1975 0.1587 0.0210 0.0099 0.0375 0.0426 0.0180 0.0481 0.1770
V2 0.1715 0.1508 0.1892 0.1871 0.1847 0.1652 0.0208 0.0091 0.0344 0.0453 0.0168 0.0501 0.1765
S1 0.1820 0.1786 0.2015 0.1801 0.1847 0.1761 0.0221 0.0108 0.0366 0.0437 0.0168 0.0534 0.1833
S2 0.1590 0.1667 0.1892 0.1848 0.1879 0.1587 0.0193 0.0101 0.0344 0.0448 0.0171 0.0481 0.1737
C1 0.1548 0.1687 0.1204 0.1432 0.1274 0.1717 0.0188 0.0102 0.0219 0.0347 0.0116 0.0520 0.1492
C2 0.1590 0.1726 0.0934 0.1293 0.1178 0.1696 0.0193 0.0105 0.0170 0.0314 0.0107 0.0514 0.1402
A1 appearance, A2 taste and odour, A3 consistency of appearance, A4 consistency in mouth, A5 adhesiveness, A6 general acceptability, V1 vanillin-flavoured pudding, V2 vanillin-flavoured including fibre, S1 strawberry-flavoured pudding, S2 strawberry-flavoured pudding including fibre, C1cacao-flavoured pudding, C2 cacao-flavoured pudding including fibre
Table 10 The concordance (C)and discordance (D) indexes ofthe pudding alternatives(ELECTRE)
V1 vanillin-flavoured pudding,V2 vanillin-flavoured includingfibre, S1 strawberry-flavouredpudding, S2 strawberry-flavoured pudding including fi-bre, C1 cacao-flavoured pud-ding, C2 cacao-flavouredpudding including fibre
C (Cav00.50) D (Dav00.24)
V1 V2 S1 S2 C1 C2 V1 V2 S1 S2 C1 C2
V1 1.00 0.33 0.27 0.70 0.64 0.64 1.00 0.28 0.44 0.34 0.11 0.08
V2 0.67 1.00 0.33 0.67 0.64 0.64 0.28 1.00 0.32 0.01 0.05 0.03
S1 0.73 0.67 1.00 0.67 1.00 1.00 0.15 0.13 1.00 0.07 0.00 0.00
S2 0.30 0.33 0.33 1.00 0.64 0.52 0.37 0.05 0.42 1.00 0.12 0.09
C1 0.36 0.36 0.00 0.36 1.00 0.82 0.44 0.39 0.43 0.38 1.00 0.04
C2 0.36 0.36 0.00 0.48 0.19 1.00 0.46 0.42 0.46 0.42 0.48 1.00
Food Bioprocess Technol
Author's personal copy

(C2). According to the results, strawberry aroma is the bestchoice for prebiotic pudding to mask taste resulting from theaddition of fibre. The assigned conditions of the problemlike the weights of the criterion are the main factor affectingthe results. If the weights are changed, the results alsochanged. The consistent weights were determined in thisstudy, which is understood from the general acceptabilityscores. The sample had the highest general acceptabilityscore determined as the best sample according to the resultsof the MCDM techniques.
Conclusion
The demand of consumers for health-promoting foods hasgrown in recent years due to their increased awareness aboutthe relation between diet and health. Dietary fibre was addedto improve the functionality of pudding since it is widelyconsumed by people throughout the world. However, theaddition of fibre alone is not sufficient for the consumptionof the product. The sensorial characteristics of the product arealso crucial factors affecting the acceptance of the product bythe consumer. In this respect, the sensorial characteristics of
puddings with different flavours were also determined. Multi-criteria decision techniques (AHP, SAW, ELECTRE andTOPSIS) were performed to compare the samples accordingto sensorial scores. Strawberry flavour was found as the bestalternative for prebiotic pudding as a result of multi-criteriadecision techniques. By considering the results of this study, itwas seen that multi-critearia decision techniques can be suc-cessfully applied in the food industry to facilitate the interpre-tation of the sensorial results by providing one result which isobtained from a combination of many criteria.
Acknowledgments The author would like to thank the Unit ofScientific Investigations in Erciyes University for its financial supportof this work.
References
Afshari, A., Mojahed, M., & Yusuff, R. M. (2010). Simple additiveweighting approach to personnel selection problem. InternationalJournal of Innovation, Management and Technology, 1, 511–515.
AOAC. (1996). Official methods of analysis (15th ed.). Arlington:AOAC International.
Ares, G., Baixauli, R., Sanz, T., Varela, T., & Salvador, A. (2009). Newfunctional fibre in milk puddings: effect on sensory properties andconsumers’ acceptability. LWT—Food Science and Technology,42, 710–716.
Auffret, A., Ralet, M. C., Guillon, F., Barry, J. L., & Thibault, J. F.(1994). Effect of grinding and experimental conditions on themeasurement of hydration properties of dietary fibres. Lebensmit-tel Wissenschaft und Technologie, 27, 166–172.
Brito, G., Andrade, J. M., Havel, J., Díaz, C., García, F. J., & Peña-Méndez, E. M. (2006). Classification of some heat-treated liverpastes according to container type, using heavy metals contentand manufacturer’s data, by principal component analysis andpotential curves. Meat Science, 74, 296–302.
Campos-Vega, R., Reynoso-Camacho, R., & Pedraza-Aboytes, G.(2009). Chemical composition and in vitro polysaccharide fer-mentation of different beans (Phaseolus vulgaris L.). Journal ofFood Science, 74(7), 59–62.
Chau, C. F., Wang, Y. T., & Wen, Y. L. (2007). Different micronizationmethods significantly improve the functionality of carrot insolu-ble fibre. Food Chemistry, 100, 1402–1408.
Table 11 Overall C (concordance) and D (discordance) values of thealternatives (ELECTRE)
Alternative C D
V1 0.1515 −0.4478
V2 0.8788 −0.5686
S1 3.1214 −1.7244
S2 −0.7576 −0.1913
C1 −1.1818 0.9290
C2 −2.2121 2.0031
V1 vanillin-flavoured pudding, V2 vanillin-flavoured including fibre,S1 strawberry-flavoured pudding, S2 strawberry-flavoured puddingincluding fibre, C1 cacao-flavoured pudding, C2 cacao-flavoured pud-ding including fibre
Table 12 Positive (D+), negative (D−) ideal solution and ratio (R)values of the alternatives (TOPSIS)
Alternatives D+ D− R
V1 0.0074 0.0278 0.7906
V2 0.0057 0.0264 0.8218
S1 0.0026 0.0283 0.9148
S2 0.0079 0.0262 0.7688
C1 0.0231 0.0082 0.2615
V1 vanillin-flavoured pudding, V2 vanillin-flavoured including fibre,S1 strawberry-flavoured pudding, S2 strawberry-flavoured puddingincluding fibre, C1 cacao-flavoured pudding, C2 cacao-flavoured pud-ding including fibre
Table 13 Preference ranking of pudding alternatives depending ondifferent techniques
Samples AHP SAW ELECTRE TOPSIS
V1 2 2 3 3
V2 3 2 2 2
S1 1 1 1 1
S2 4 4 4 4
C1 5 5 5 5
C2 6 6 6 6
V1 vanillin-flavoured pudding, V2 vanillin-flavoured including fibre,S1 strawberry-flavoured pudding, S2 strawberry-flavoured puddingincluding fibre, C1 cacao-flavoured pudding, C2 cacao-flavoured pud-ding including fibre
Food Bioprocess Technol
Author's personal copy

Cloutour F. (1995). Caractérisation des fibres alimentaires: influencesur leur fermentation in vitro par la flore digestive de l’homme.Thése de Doctorat, Faculté des Sciences et des Techniques, Uni-versité de Nantes, pp. 123.
Cruz, A. G., Cadena, R. S., Walter, H. M. E., Mortazavian, A. M.,Granato, D., Faria, J. A. F., et al. (2010). Sensory analysis:relevance for prebiotic, probiotic, and symbiotic product de-velopment. Comprehensive Reviews in Food Science andTechnology, 9, 358–373.
Cui, S. W., & Roberts, K. T. (2009). Kasapis, Norton, and Ubbink:Modern Biopolymer Science. ISBN: 978-0-12-374195-0.
Cummings, J. H. (1981). Short chain fatty acids in human colon. Gut,22, 763–769.
Dalgetty, D. D., & Baik, B. K. (2003). Isolation and characterization ofcotyledon fibres from peas, lentils, and chickpeas. CerealChemistry, 80, 310–315.
Dogan, M., Toker, O. S., Aktar, T., & Goksel, M. (2012). Optimizationof gum combination in prebiotic instant hot chocolate beveragemodel system in terms of rheological aspect: mixture designapproach. Food and Bioprocess Technology. doi:10.1007/s11947-011-0736-y.
Eastwood, M. A., Brydon, W. G., & Tadesse, K. (1980). Effect of fibreon colonic function. In G. A. Spiller & R. M. Kay (Eds.),Medicalaspects of dietary fibre (pp. 1–26). New York: Plenum Press.
Edwards, C. A., & Parrett, A. M. (2003). Dietary fibre in infancy andchildhood. Proceedings of the Nutrition Society, 62, 17–23.
Fagan, C. C., O’Donnel, C. P., Cullen, P. J., & Brennan, C. S. (2006).The effect of dietary fibre inclusion on milk coagulation kinetics.Journal of Food Engineering, 77, 261–268.
Fernández-López, J., Sendra-Nadal, E., Navarro, C., Sayas, E., Viuda-Martos, M., & Pérez-Alvarez, J. A. (2009). Storage stability of ahigh dietary fibre powder from orange by-products. InternationalJournal of Food Science and Technology, 44, 748–756.
Figuerola, F., Hurtado, M. L., Estévez, A. M., Chiffelle, I., & Asenjo,F. (2005). Fibre concentrates from apple pomace and citrus peel aspotential fibre sources for food enrichment. Food Chemistry, 91,395–401.
Garau, M. C., Simal, S., Rosselló, C., & Femenia, A. (2007). Effect ofair-drying temperature on physico-chemical properties of dietaryfibre and antioxidant capacity of orange (Citrus aurantium v.Canoneta) by-products. Food Chemistry, 104, 1014–1024.
Guillon, F., & Champ, M. (2000). Structural and physical properties ofdietary fibres, and consequences of processing on human physiology.Food Research International, 33, 233–245.
Guillon, F., & Champ, M. (2002). Carbonhydrate fractions of legumes:uses in human nutrition and potential for health. British Journal ofNutrition, 88, 293–306.
Hanley, A. J., Harris, S. B., Gittelsohn, J., Wolever, T. M., Saksvig, B.,& Zinman, B. (2000). Overweight among children and adolescentsin a native Canadian community: prevalence and associated factors.American Journal of Clinical Nutrition, 71, 693–700.
Huang, S. C., Lia, T. S., Cheng, T. C., Chan, H. Y., Hwang, S.M., & Hwang, D. F. (2009). In vitro interactions on glucoseby different fibre materials prepared from mung bean hulls,rice bran and lemon pomace. Journal of Food and DrugAnalysis, 17, 307–314.
Kamal, M., & Al-Harbi, A.-S. (2001). Application of the AHP inproject management. International Journal of Project Manage-ment, 19, 19–27.
Khatoon, N., & Prakash, J. (2004). Nutritional quality of microwave-cooked and pressure-cooked legumes. International Journal ofFood Sciences and Nutrition, 55, 441–448.
Lario, Y., Sendra, E., García-Pérez, J., Fuentes, C., Sayas-Barberá, E.,Fernández-López, J., et al. (2004). Preparation of high dietaryfibre powder from lemon juice by-products. Innovative FoodScience and Emerging Technology, 5, 113–117.
Larrigaudiere, C., Lentheric, I., Puy, J., & Pinto, E. (2004). Biochem-ical characterisation of core browning and brown heart disorder inpear by multivariate analysis. Postharvest Biology and Technology,31, 29–39.
Lee, S. C., Prosky, L., & De Vries, J. W. (1992). Determination of total,soluble, and insoluble dietary fibre in foods enzymatic gravimet-ric method, MESTRIS buffer: collaborative study. Journal ofAOAC International, 75, 395–416.
Lim, H. S., & Narsimhan, G. (2006). Pasting and rheological behaviorof soy protein-based pudding. LWT Food Science and Technology,29, 343–349.
Lopes, T. J., Bender, D. A., Davidson, M. H., & Mc Donald, A.(1998). Fibre: forms and functions. Nutrition Research, 18,617–624.
Marín, F. R., Soler-Rivas, C., Benavente-García, O., Castillo, J., &Pérez-Alvarez, J. A. (2007). By-products from different citrusprocesses as a source of customized functional fibres. FoodChemistry, 100, 736–741.
Martín-Cabrejas, M. A., Aguilera, Y., Beníítez, V., Mollá, E., López-Andréu, F. J., & Esteban, R. M. (2006). Effect of industrialdehydration on the soluble carbohydrates and dietary fibre frac-tions in legumes. Journal of Agriculture and Food Chemistry, 54,7652–7657.
Olson, D. L. (2004). Compression of weights in TOPSIS models.Mathematical and Computer Modelling, 40, 721–727.
Ozcan, T., Celebi, N., & Esnaf, Ş. (2011). Comparative analysis ofmulti-criteria decision making methodologies and implementationof a warehouse location selection problem. Expert Systems withApplications, 38, 9773–9779.
Pohekar, S. D., & Ramachandran, M. (2004). Application ofmulti-criteria decision making to sustainable energy plan-ning—a review. Renewable and Sustainable Energy Reviews,8, 365–381.
Ralet, M. C., Thibault, J. F., & Della Valle, G. (1990). Influence ofextrusion cooking on the physico-chemical properties of wheatbran. Journal of Cereal Science, 11, 249–259.
Ralet, M. C., Della Valle, G., & Thibault, J. F. (1993). Raw andextruded fibre from pea hulls. Part I: composition and physico-chemical properties. Carbohydrate Polymers, 20, 17–23.
Robertson, J. A., de Monredon, J. F., Dysseler, P., Guillon, F., Amado,R., & Thibault, J. F. (2000). Hydration properties of dietary fibreand resistant starch: a European collaborative study. LebensmittelWissenschaft und Technologie/Food Science and Technology, 33,72–79.
Saaty, T. L. (1980). The analytic hierarchy process. New York:McGraw-Hill.
Sadeghzadeh, K., & Salehi, M. B. (2011). Mathematical analysis offuel cell strategic technologies development solutions in the au-tomotive industry by the TOPSIS multi-criteria decision makingmethod. International Journal of Hydrogen Energy, 36, 13272–13280.
Sánchez-Alonso, I., Solas, M. T., & Borderías, A. J. (2007). Techno-logical implications of addition of wheat dietary fibre to giantsquid (Dosidicus gigas) surimi gels. Journal of Food Engineering,81, 404–411.
Sangnark, A., & Noomhorm, A. (2003). Effect of particle sizes onfunctional properties of dietary fibre prepared from sugarcanebagasse. Food Chemistry, 80, 221–229.
Shin, E. C., Craf, B. D., Pegg, R. B., Phillips, R. D., & Eitenmille, R.R. (2010). Chemometric approach to fatty acid profiles in runnertype peanut cultivars by principal component analysis (PCA).Food Chemistry, 119, 1262–1270.
Sreerama, Y. N., Sashikala, V. B., & Pratape, V. M. (2009). Expansionproperties and ultrastructure of legumes: effect of chemical andenzyme pre-treatments. LWT Food Science and Technology, 42,44–49.
Food Bioprocess Technol
Author's personal copy
Thebaudin, J. Y., Lefebvre, A. C., Harrington, M., & Bourgeois, C. M.(1997). Dietary fibres: nutritional and technological interest.Trends of Food Science and Technology, 8, 41–48.
Thibault, J. F., Della Valle, G., & Ralet, M. C. (1988). Produits riches enparois végétales á fraction hydrosoluble accrue, leur obtention, leurutilisation et compositions les contenant, Brevet français, 88–11601.
Tiwari, U., & Cummins, E. (2011). Pulse foods: processing, qualityand nutraceutical applications (pp. 121–156). San Diego: Ac-ademic Press.
Toker, O. S., Dogan, M., Canıyılmaz, E., Ersöz, N., & Kaya, Y. (2012).The effects of different gums and their interactions on therheological properties of a dairy dessert: a mixture designapproach. Food and Bioprocess Technology. doi:10.1007/s11947-012-0787-8.
Triantaphyllou, E., Shu, B., Sanchez, S. N., & Ray, T. (1998). Multi-criteria decision making: An operations research approach. Ency-clopedia of Electrical and Electronics Engineering, (J.G. Webster,Ed.), John Wiley & Sons, New York, NY, Vol. 15, pp. 175–186.
Ural, A., & Kilic, I. (2006). Data analysis with SPSS. Ankara: DetayPublication.
Vázquez-Ovando, A., Rosado-Rubio, G., Chel-Guerrero, L., &Betancur-Ancona, D. (2009). Physicochemical properties of afibrous fraction from chia (Salvia hispanica L.). Food Scienceand Technology, 42, 168–173.
Verbeken, D., Bael, K., Thas, O., & Dewettinck, K. (2006). Interac-tions between k-carrageenan, milk proteins and modified starch insterilized dairy desserts. International Dairy Journal, 16, 482–488.
Vidal-Valverde, C., & Frias, J. (1991). Legume processing effects ondietary fibre components. Journal of Food Science, 56, 1350–1352.
Viuda-Martos, M., Ruiz-Navajas, Y., Martin-Sánchez, A., Sánchez-Zapata, E., Fernández-López, J., Sendra, E., et al. (2012). Chem-ical, physico-chemical and functional properties of pomegranate(Punica granatum L.) bagasses powder co-product. Journal ofFood Engineering, 110, 220–224.
Wang, J., Rosell, C. M., & Benetido de Barber, C. (2002). Effect of theaddition of different fibres on wheat dough performance andbread quality. Food Chemistry, 79, 221–226.
Wang, X., & Triantaphyllou, E. (2008). Ranking irregularities whenevaluating alternatives by using some ELECTRE methods. TheInternational Journal of Management Science, 36, 45–63.
Wang, N., Hatcher, D. W., & Gawalko, E. J. (2008). Effect of varietyand processing on nutrients and certain anti-nutrients in field peas(Pisum sativum). Food Chemistry, 111, 132–138.
Wolever, T. M. S. (1990). Relationship between dietary fibre contentand composition in foods and the glycemic index. The AmericanJournal of Clinical Nutrition, 51, 72–75.
Food Bioprocess Technol
Author's personal copy