Application of coagulation–ultrafiltration hybrid process for drinking water treatment:...
18
Separation and Purification Technology 65 (2009) 193–210 Contents lists available at ScienceDirect Separation and Purification Technology journal homepage: www.elsevier.com/locate/seppur Application of coagulation–ultrafiltration hybrid process for drinking water treatment: Optimization of operating conditions using experimental design A.W. Zularisam a,b,c , A.F. Ismail a,∗ , M.R. Salim c , Mimi Sakinah a , T. Matsuura d a Advanced Membrane Technology Research Center, Universiti Teknologi Malaysia, 81300 Skudai, Johor, Malaysia b Faculty of Civil & Earth Resources, Universiti Malaysia Pahang, UMP, 25000 Gambang, Pahang, Malaysia c Faculty of Civil Engineering, Universiti Teknologi Malaysia, 81300 Skudai, Johor, Malaysia d Industrial Membrane Research Institute, Department of Chemical Engineering, University of Ottawa, 161 Louis Pasteur Street, P.O. Box 450, Station A, Ottawa K1N 6N5, Canada article info Article history: Received 21 July 2007 Received in revised form 15 September 2008 Accepted 4 October 2008 Keywords: NOM Flocculation Coagulation Membrane Drinking water abstract Coagulation application prior to ultrafiltration process was carried out to increase NOM removal and membrane permeability. A systematic experimental design based on first order model of 2 4 full factorial design was used as an initial screening process to determine the significant variable factors and their inter-relationship towards natural organic matter (NOM) removal efficiency. The factors considered were SUVA (specific UV 254 nm absorbance), FRT (flocculation retention time), alum dosage and pH. Statistical analysis of result has shown the main effect of alum, pH, SUVA and the two level interactions of alum and FRT, alum and SUVA, alum and pH, FRT and SUVA, and SUVA and pH were the significant model terms. Thereafter a second order model which was the 2 3 central composite designs (CCD) was further employed to develop a mathematical correlation model between the significant factors for the optimum modes of operating condition, with respect to NOM removal and membrane permeability. The alum dosage is found to be the most significant factor that influences the NOM removal and this is followed by the two level interactions of pH and SUVA, the main effect of pH, the main effect of SUVA, the two level interaction of SUVA and alum, the second order effect of SUVA and the second order effect of pH. In the case of membrane permeability, the main effect of alum dosage and the second order effect of pH provided the principal effect, whereas the second order effect of alum, the main effect of pH, the two level interaction of pH and SUVA, the two level interaction of SUVA and alum dose, and the main effect of SUVA provided the secondary effect. The optimized values of 5.48, 3.24 L/(m mg) and 3.0 mg Al/L of pH, SUVA and alum dose were obtained respectively, and with these proposed optimized conditions, a NOM removal of 81.28% and permeability of 30.61 LMHBar was predicted. Thereafter via experimental validation process, 79.50% and 31.29 LMHBar of NOM removal and permeability was attained, respectively. In conjuction treatment efficiency has shown excellent water quality that is well beyond the Malaysian and WHO drinking water quality regulations with > 96% colour removal, about 87% UV 254 removal, < 0.2 NTU, > 99% suspended solids removal. and > 99% of turbidity removal. © 2008 Elsevier B.V. All rights reserved. 1. Introduction Membrane filtration process involving microfiltration (MF), ultrafiltration (UF), nanofiltration (NF) and reverse osmosis (RO) in potable water production have increased rapidly for the past decade and would potentially replace the conventional treatment which consist a complex series of unit operations, such as ozonation– precipitation–coagulation–flocculation–chlorination–gravel filtra- tion [1,2]. As part of drinking water treatment processes, ∗ Corresponding author. Tel.: +60 7 5535592; fax: +60 7 5581463. E-mail address: [email protected] (A.F. Ismail). Ultrafiltration (UF) has been known to be effective for the removal of suspended solids, colloidal material (>0.1 m), inorganic par- ticulates and fatal microorganisms such as colliform, protozoa, giardia and cryptosporidium [3,4]. In spite of offering high per- meate flux and low pressure requirement, this filtration type is relatively found to be less successful for wide application, par- ticularly in removing the dissolved organic matters (DOC) such as natural organic matter (NOM) which is regarded as a major factor for membrane fouling and poor permeate quality [5,6]. In fact removal of NOM which is inherently present in the form of DOC or colloidal material is required, since NOM is a pre- cursor to the formation of carcinogenic disinfection by-products (DBP), aesthetically unattractive, carbon source for biofilm growth 1383-5866/$ – see front matter © 2008 Elsevier B.V. All rights reserved. doi:10.1016/j.seppur.2008.10.018
-
Upload
teknologimalaysia -
Category
Documents
-
view
2 -
download
0
Transcript of Application of coagulation–ultrafiltration hybrid process for drinking water treatment:...

Separation and Purification Technology 65 (2009) 193–210
Contents lists available at ScienceDirect
Separation and Purification Technology
journa l homepage: www.e lsev ier .com/ locate /seppur
Application of coagulation–ultrafiltration hybrid process for drinking watertreatment: Optimization of operating conditions using experimental design
A.W. Zularisama,b,c, A.F. Ismail a,∗, M.R. Salimc, Mimi Sakinaha, T. Matsuurad
a Advanced Membrane Technology Research Center, Universiti Teknologi Malaysia, 81300 Skudai, Johor, Malaysiab Faculty of Civil & Earth Resources, Universiti Malaysia Pahang, UMP, 25000 Gambang, Pahang, Malaysiac Faculty of Civil Engineering, Universiti Teknologi Malaysia, 81300 Skudai, Johor, Malaysiad Industrial Membrane Research Institute, Department of Chemical Engineering, University of Ottawa, 161 Louis Pasteur Street, P.O. Box 450,Station A, Ottawa K1N 6N5, Canada
a r t i c l e i n f o
Article history:Received 21 July 2007Received in revised form15 September 2008Accepted 4 October 2008
Keywords:NOMFlocculationCoagulationMembraneDrinking water
a b s t r a c t
Coagulation application prior to ultrafiltration process was carried out to increase NOM removal andmembrane permeability. A systematic experimental design based on first order model of 24 full factorialdesign was used as an initial screening process to determine the significant variable factors and theirinter-relationship towards natural organic matter (NOM) removal efficiency. The factors considered wereSUVA (specific UV254 nm absorbance), FRT (flocculation retention time), alum dosage and pH. Statisticalanalysis of result has shown the main effect of alum, pH, SUVA and the two level interactions of alum andFRT, alum and SUVA, alum and pH, FRT and SUVA, and SUVA and pH were the significant model terms.Thereafter a second order model which was the 23 central composite designs (CCD) was further employedto develop a mathematical correlation model between the significant factors for the optimum modes ofoperating condition, with respect to NOM removal and membrane permeability. The alum dosage is foundto be the most significant factor that influences the NOM removal and this is followed by the two levelinteractions of pH and SUVA, the main effect of pH, the main effect of SUVA, the two level interactionof SUVA and alum, the second order effect of SUVA and the second order effect of pH. In the case ofmembrane permeability, the main effect of alum dosage and the second order effect of pH provided theprincipal effect, whereas the second order effect of alum, the main effect of pH, the two level interactionof pH and SUVA, the two level interaction of SUVA and alum dose, and the main effect of SUVA providedthe secondary effect. The optimized values of 5.48, 3.24 L/(m mg) and 3.0 mg Al/L of pH, SUVA and alumdose were obtained respectively, and with these proposed optimized conditions, a NOM removal of 81.28%and permeability of 30.61 LMHBar was predicted. Thereafter via experimental validation process, 79.50%
and 31.29 LMHBar of NOM removal and permeability was attained, respectively. In conjuction treatmentefficiency has shown excellent water quality that is well beyond the Malaysian and WHO drinking waterquality regulations with > 96% colour removal, about 87% UV254 removal, < 0.2 NTU, > 99% suspended solidsidity
1
upacpt
Uotgm
1d
removal. and > 99% of turb
. Introduction
Membrane filtration process involving microfiltration (MF),ltrafiltration (UF), nanofiltration (NF) and reverse osmosis (RO) inotable water production have increased rapidly for the past decade
nd would potentially replace the conventional treatment whichonsist a complex series of unit operations, such as ozonation–recipitation–coagulation–flocculation–chlorination–gravel filtra-ion [1,2]. As part of drinking water treatment processes,∗ Corresponding author. Tel.: +60 7 5535592; fax: +60 7 5581463.E-mail address: [email protected] (A.F. Ismail).
rtaffoc(
383-5866/$ – see front matter © 2008 Elsevier B.V. All rights reserved.oi:10.1016/j.seppur.2008.10.018
removal.© 2008 Elsevier B.V. All rights reserved.
ltrafiltration (UF) has been known to be effective for the removalf suspended solids, colloidal material (>0.1 �m), inorganic par-iculates and fatal microorganisms such as colliform, protozoa,iardia and cryptosporidium [3,4]. In spite of offering high per-eate flux and low pressure requirement, this filtration type is
elatively found to be less successful for wide application, par-icularly in removing the dissolved organic matters (DOC) suchs natural organic matter (NOM) which is regarded as a major
actor for membrane fouling and poor permeate quality [5,6]. Inact removal of NOM which is inherently present in the formf DOC or colloidal material is required, since NOM is a pre-ursor to the formation of carcinogenic disinfection by-productsDBP), aesthetically unattractive, carbon source for biofilm growth
1 Purification Technology 65 (2009) 193–210
it[rbclcpmmamdodtdpooNpaCmpwmbptstcpbalmciosapafitfttItpdotosrinop
Table 1Characteristics of Yong Peng NOM source water.
UV254 nm (cm−1) 0.174 (±0.015)DOC (mg/L) 5.36 (±1.27)SUVA (L/(mg m)) 3.24Turbidity (NTU) 14.1 (±5.1)Mn2+ (mg/L) 0.28CA
T
2
2
wNsmPGSlmdosipi0caTdictsahSUVA value [3.38 L/(m mg)] was found consistent with the in situSUVA of Yong Peng which was about 3.24 ± 0.17 (Table 1). In gen-eral high SUVA possession could be correlated with greater NOMaromaticity and negative charge density (Fig. 4) caused by the car-boxylic and phenolic moieties of hydrophobic acids [5], for NOM
94 A.W. Zularisam et al. / Separation and
n the distribution network and often reclaimed as an impor-ant factor for both reversible and irreversible membrane fouling7,8]. In the case of drinking water filtration the colloidal mate-ial may reduce the membrane permeability (reversible fouling)y accumulating solutes on the adjacent membrane surface (con-entration polarization), precipitating and forming a cake or gelayer as they become supersaturated [9], while the DOC mayause irreversible fouling by altering the effective membraneores through precipitating and absorbing onto the membraneatrix and within the pores space. Hence coagulation pretreat-ent prior to membrane filtration has been widely researched asmean of removing non-settleable NOM content and reducingembrane fouling through agglomeration of alum salts with the
estabilized particles before gravity precipitation [10–13]. Previ-us studies using integrated conventional coagulation followed byirect membrane filtration or an inline coagulation (without set-ling) combined with direct membrane filtration [10,11,14], haveemonstrated effective control of fouling, improved membraneermeability and superior permeate quality despite having appliedn low quality water sources. In details, coagulation pretreatmentf NOM with metal salt ions of Al3+ has been used to alter theOM characteristics such as the relative content of NOM com-osition (hydrophilic versus hydrophobic), NOM flocculant sizend charge density possession, prior to UF membrane filtration.hanges in NOM characteristics due to the complexation of NOM-etal ions are greatly influenced by the type and alum dosage,
H, ionic strength, NOM solubility and hydrodynamic condition,hich contributed to the overall efficiency of a coagulation–UFembrane process [15–17]. In this study the coagulation process
efore membrane filtration was primarily employed to create sus-ended coagulated micro-flocs which were relatively bigger thanhe membrane molecular weight cut-off. Such approach was pre-umably effective in promoting higher NOM removal efficiencyhrough micro-floc cake layer rejection, thus would imply inoagulant dosage lower than the optimized level for aggregatesrecipitation, reduce flocculation retention time, increase mem-rane flowrate capacity, eliminate non-settleable flocs concernsnd could effectively reduce pore clogging by particles. Particu-arly it was hypothesized that the hydrophobic fraction having
ore anionic binding sites than the hydrophilic fraction towardsationic aluminium hydrolysis product, was mainly contributingn forming the micro-flocs via charge neutralization. In the casef hydrophilic fraction which has less electron-rich sites, wasupposed not participating in the charge neutralization with theluminium hydrolysis product, thus apparently it was consideredlaying only a minor role in forming the micro-flocs and in beingssociated with pore adsorption and poor removal by membraneltration. However with optimal setting of experimental factorshe hydrophilic fraction could be effectively removed through sur-ace adsorption on the neutralized flocculant or entrapped withinhe coagulated suspension, before being retained or absorbed onhe micro-floc cake layer that is formed on the membrane surface.n particular a systematic experimental design based on full fac-orial design was employed to determine the significant effect ofH, SUVA, FRT and alum towards NOM removal. A second levelesign study was further conducted with central composite designf response surface methodology to develop an empirical predic-ive model of NOM removal and membrane permeability, basedn the significant factors obtained from previous factorial designtudy. In view of the fact that only a considerable amount of
esearch had been done, emphasis is placed towards quantitativedentification of significant and interaction factors, and determi-ation of the best setting of variable factors that produce theptimal outcome with respect to NOM removal and membraneermeability.Fwo
a2+ (mg/L) 2.16l3+ (mg/L) 5.95
he numbers in parenthesis are standards deviation.
. Materials and methods
.1. NOM source water, isolation and concentration apparatus
Selected Malaysian surface water source of Yong Peng wateras used as a model solution for the membrane permeability andOM rejection efficiency of coagulation-direct UF experiments. The
urface water quality and its NOM fractions characteristics are sum-arized in Table 1, Table 2 and Fig. 1, respectively. NOM of Yong
eng water was pretreated with 0.45 �m filter paper (WhatmanC) prior to coagulation process while preparation of surrogatedUVA was carried out by concentrating the NOM source using cel-ulose acetate reverse osmosis (RO) membrane. The concentration
odule unit was designed and modified based on the principleeveloped by Serkiz and Perdue [18]. The detailed characteristicsf the RO membrane and module used for concentrating the NOMources are given elsewhere by Idris et al. [19] and the whole exper-ment set-up is illustrated in Fig. 2, respectively. Moreover chemicalroperties of the feed stream solution was adjusted to the approx-
mate value as the experimental designed requirement, by using.1N HCl, 0.1N NaOH and deionized water. The relationship betweenoncentrations of Yong Peng NOM and its UV absorbance recordedt 254 nm were plotted in standard curves as tabulated in Fig. 3.he slope of line (Fig. 3.) represents SUVA [3.38 L/(m mg)] whichenotes an index of NOM relative aromaticity. In particular, SUVA
s a function of humic fraction content within the NOM source andan be employed as the surrogate for the relative humic concen-ration in the surface water. As can be inferred from Fig. 3 thereeems to appear a significant correlation between humic fractionnd SUVA (R2 = 98.15%) which can be substituted for the relativeumic fraction estimation by using UV and DOC measurements. The
ig. 1. Apparent molecular weight distributions (AMWD) of Yong Peng NOM sourceater by UF fractionation using a series of cellulose acetate membranes with MWCOsf 1 kDa, 5 kDa, 10 kDa and 30 kDa (Ultracel Millipore membrane).
A.W. Zularisam et al. / Separation and Purification Technology 65 (2009) 193–210 195
Table 2DOC concentrations of NOM fractions for Yong Peng water (based on DOC and mass balance technique).
Source water Hydrophobic DOC (%) Transphilic DOC (%)
Yong Peng Intake 57 (3.05) 21 (1.12)
The numbers in parenthesis are DOC concentration in mg/L.
Fig. 2. Schematic diagram of concentration unit of RO membrane (1) feed; (2) valve;(3) pump; (4) hollow fiber pressure housing; (5) flow meter; (6) permeate; (7)pressure gauge.
Fig. 3. Correlation curve of Yong Peng NOM concentration and its UV254 nm
absorbance.
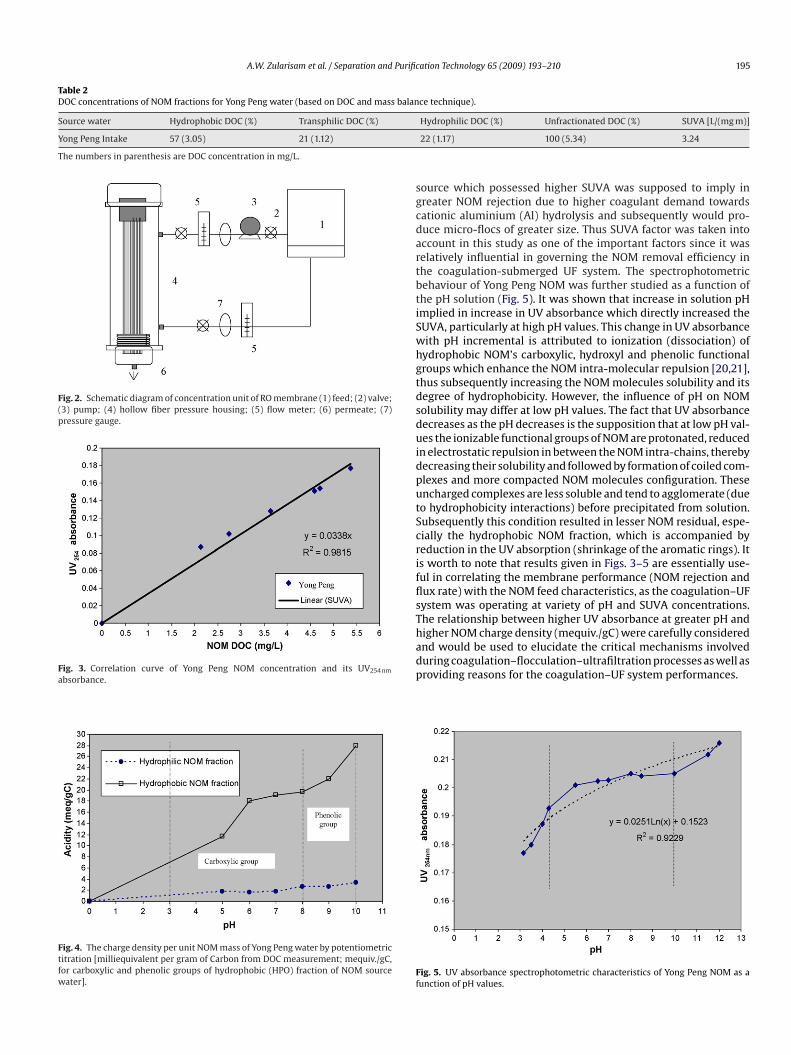
Fig. 4. The charge density per unit NOM mass of Yong Peng water by potentiometrictitration [milliequivalent per gram of Carbon from DOC measurement; mequiv./gC,for carboxylic and phenolic groups of hydrophobic (HPO) fraction of NOM sourcewater].
sgcdartbtiSwhgtdsduidputScrifflsThadp
Ff
Hydrophilic DOC (%) Unfractionated DOC (%) SUVA [L/(mg m)]
22 (1.17) 100 (5.34) 3.24
ource which possessed higher SUVA was supposed to imply inreater NOM rejection due to higher coagulant demand towardsationic aluminium (Al) hydrolysis and subsequently would pro-uce micro-flocs of greater size. Thus SUVA factor was taken intoccount in this study as one of the important factors since it waselatively influential in governing the NOM removal efficiency inhe coagulation-submerged UF system. The spectrophotometricehaviour of Yong Peng NOM was further studied as a function ofhe pH solution (Fig. 5). It was shown that increase in solution pHmplied in increase in UV absorbance which directly increased theUVA, particularly at high pH values. This change in UV absorbanceith pH incremental is attributed to ionization (dissociation) of
ydrophobic NOM’s carboxylic, hydroxyl and phenolic functionalroups which enhance the NOM intra-molecular repulsion [20,21],hus subsequently increasing the NOM molecules solubility and itsegree of hydrophobicity. However, the influence of pH on NOMolubility may differ at low pH values. The fact that UV absorbanceecreases as the pH decreases is the supposition that at low pH val-es the ionizable functional groups of NOM are protonated, reduced
n electrostatic repulsion in between the NOM intra-chains, therebyecreasing their solubility and followed by formation of coiled com-lexes and more compacted NOM molecules configuration. Thesencharged complexes are less soluble and tend to agglomerate (dueo hydrophobicity interactions) before precipitated from solution.ubsequently this condition resulted in lesser NOM residual, espe-ially the hydrophobic NOM fraction, which is accompanied byeduction in the UV absorption (shrinkage of the aromatic rings). Its worth to note that results given in Figs. 3–5 are essentially use-ul in correlating the membrane performance (NOM rejection andux rate) with the NOM feed characteristics, as the coagulation–UFystem was operating at variety of pH and SUVA concentrations.he relationship between higher UV absorbance at greater pH andigher NOM charge density (mequiv./gC) were carefully considered
nd would be used to elucidate the critical mechanisms involveduring coagulation–flocculation–ultrafiltration processes as well asroviding reasons for the coagulation–UF system performances.ig. 5. UV absorbance spectrophotometric characteristics of Yong Peng NOM as aunction of pH values.

196 A.W. Zularisam et al. / Separation and Purification Technology 65 (2009) 193–210
2
sumiri
Table 3UF membrane specification.
Parameter PSF UF membrane
Membrane type Hollow fiberMembrane material PolysulfoneExternal diameter (�m) 600(Based on spinneret opening)Internal diameter (�m) 300(Based on bore fluid needle)Contact angle (◦) 56Zeta potential (mV @ pH 7) −27MPP
allbwpsa
Fig. 6. Schematic diagram of the coagulation–direct UF system.
.2. Submerged coagulation–UF membrane
The experimental set-up is schematically illustrated in Fig. 6. Theystem consists of rapid mix coagulation, flocculation and direct
ltrafiltration without the need of sedimentation process. The UFembrane characteristics, SEM images of clean membrane andts zeta potential property are shown in Table 3, Figs. 7 and 8,espectively. Details of the UF membrane fabrication process andts properties determination procedure are given by Zularisam et
etwia
Fig. 7. SEM images of the cross section of
WCO 68 kDaure water flux; Jpwf at TMP of 250 mmHg (L m−2 h−1) 13.7ure water permeability (L m−2 h−1 bar−1) 43 ± 5
l. [22]. Continuous feed supply controlled by a buoyant waterevel controller was used to ensure sufficient loading of coagu-ated NOM source into the process tank. Bubbling system controlledy adjustable air flow regulator continuously supplied air bubblesithin the fibers network at the bottom of membrane module torovide a continuous up-flow circulation of micro-flocs suspen-ion for hindering any micro-particles settlement. In particularconstant air scouring bubble of 200 L/(m2 min) was applied to
xert shear stress to suppress potential particles deposition on
he membrane surface. A commercial alum of Al2(SO4)3·18H2Oas employed throughout this experiment as it is widely usedn Malaysian water treatment plants. Final NOM source pH wasdjusted from 5 to 10 by addition of 0.1N NaOH and 0.1N HCl before
clean asymmetric PSF membrane.

A.W. Zularisam et al. / Separation and Purification Technology 65 (2009) 193–210 197
F
ccac2aldflaTfwbtbm(
J
wa
P
wbfit
R
wDT
S(brosp
Table 4Independent variables for first order model (screening design).
Factors Unit Levels
−1 +1
ABCD
2
tammaormldsm
2
ndsaicctbwdraTvw
2
scmtpc(cpdFt
ig. 8. Zeta potential curves of PSF membrane by streaming potential technique.
oagulant mixing. The NOM source water spiked with the desiredoagulant dose was hydraulically pumped from the influent tanknd over-flowed into the process tank (Fig. 6). The flowrate of theoagulated NOM into the process tank was designed to range from.67 L/min to 8 L/min, which was technically equivalent to 15 minnd 5 min of flocculation retention time (FRT), respectively. Floccu-ation of feed water was done in the process tank according to theesigned FRT in order to maintain a rapid development of micro-ocs (pin-sized flocs). A PSF hollow fiber module with an effectiverea of 0.11 m2 was immersed in the process tank and a constantMP (250 mmHg) was maintained to extract the flocculated waterrom the outside to inside of the membrane fibers. The flux declineould be expected to increase in the course of time due to mem-rane fouling, thus operational permeate flux was monitored overhe time to determine the degree of membrane fouling to mem-rane permeability. Parameters used to quantify the efficiency ofembrane processes are flux (J), permeability and solute rejection
R), where the flux is defined as
= Q
A(1)
here Q is the permeate flowrate (L h−1) and A is the membranerea (m2) and permeability as
ermeability = Q
A�P= Q
N�Pdl�(2)
here Q is the permeate flowrate (L h−1), A is the effective mem-rane area (m2), �P is the transmembrane pressure (Pa), N is theber quantity, d is the membrane OD and l is the membrane effec-ive length (m), the rejection (R%) as
(%) =[
1 −(
Cp
Cf
)]× 100 (3)
here Cp is the permeate concentration in mg/L and Cf is the feedOC concentration (mg/L) measured by DOC analyzer (ShidmadzuOC-VE).
With optimal coagulant dosing, pH adjustment, appropriate
UVA and proper FRT, the evolved suspended pin-sized flocsinstead of settleable pin-sized flocs) could be effectively rejectedy the 68 kDa MWCO PSF membrane, resulting in higher NOMemoval with reasonable flux rate. This may also lead to lowerperating costs associated with lesser coagulant consumption andludge production, and shortened operation time as sedimentationrocess was eliminated.ototStf
(x1) Alum mg Al/L 1.8 3.0(x2) FRT min 5 15(x3) SUVA L/(m mg) 1.27 3.3(>x4) pH pH 5 10
.3. Analysis of data
Full factorial design and central composite design were usedo quantitatively measure the significant effect of variable factorsnd their interactions with each other on the membrane perfor-ance with respect to the NOM rejection efficiency and relativeembrane permeability (responses). In addition, analysis of vari-
nce (ANOVA) was used to analyze data collected in the perspectivef the model adequacy corresponding to the significance of theegression model, significance of individual model coefficients andodel’s lack of fit possession. In fact experimental plan (at second
evel design study) with the central composite design was used toevelop a prediction mathematical correlation model between theignificant factors with respect to the optimum NOM rejection andembrane permeability.
.3.1. Full factorial design (first order model)Design Expert Software (Stat-Ease Inc., Statistic made easy, Min-
eapolis, MN, USA, version 6.04) was used for the experimentalesign throughout this screening process study. A total of sixteenets of experiments (24 full factorial design) and three replicatest the center point were used to demonstrate the statistical signif-cance of the alum dosage (A; pretreatment), FRT (B; operationalondition), SUVA (C; NOM characteristic), and pH (D; solutionhemistry) on affecting the permeate quality. In this case DOC rejec-ion was chosen to represent the quality characteristic performedy the membrane as optimal configuration of operating conditionsas capable of achieving as close to a 100% rejection. A flux rate wasecided to be inappropriate as the quality characteristic since highejection rates are usually accompanied by low flux rates. The rangend levels of the variables investigated in this study are shown inable 4 while Table 5 shows the experimental design and predictedalues of the screening process. Range settings for variable factorsere adjusted based on previous findings and literature.
.3.2. Response surface methodology (second order model)The factorial design was further continued with the response
urface methodology (RSM) developed based on the centralomposite design (CCD) with NOM removal and membrane per-eability as the dependent variables (responses) while significant
erm from preliminary screening process were chosen as the inde-endent factors. The CCD was conducted with a 23 full factorialentral composite design of combinations factors at two levelshigh, +1 and low, −1 levels), included with six star points (axial)orresponding to an ˛ value of 2 and six replicates at the centeroints (coded level 0, midpoint of high and low levels). In thisesign, due to their relative insignificancies for NOM removal, theRT duration and aeration intensity were set at its center point set-ing (10 min) and 200 L/(m2 min), respectively. The range and levelsf the processing parameters involved are tabulated in Table 6 whilehe central composite design matrices and experimental response
f each individual experiment are shown in Table 7. In this studyhe independent variable for pH is represented by variable A whileUVA and alum by B and C, respectively. In this design, the FRT fac-or was constantly set at the center point settings (10 min) as it wasound to be insignificances in the organic removal (Table 8).
198 A.W. Zularisam et al. / Separation and Purification Technology 65 (2009) 193–210
Table 5Experimental design and results of 24 full factorial design.
Standard Run Block Coded factors NOM removal (%DOC)
Alum FRT SUVA pH Experiment Predicted
x1 x2 x3 x4
1 16 {1} −1.0 −1.0 −1.0 −1.0 30.42 32.492 19 {1} 1.0 −1.0 −1.0 −1.0 57.00 55.613 11 {1} −1.0 1.0 −1.0 −1.0 43.6 41.664 13 {1} 1.0 1.0 −1.0 −1.0 48.0 49.275 3 {1} −1.0 −1.0 1.0 −1.0 50.1 49.216 6 {1} 1.0 −1.0 1.0 −1.0 61.17 61.387 18 {1} −1.0 1.0 1.0 −1.0 62.9 63.678 1 {1} 1.0 1.0 1.0 −1.0 60.42 60.339 14 {1} −1.0 −1.0 −1.0 1.0 48.23 46.62
10 4 {1} 1.0 −1.0 −1.0 1.0 73.6 74.5411 12 {1} −1.0 1.0 −1.0 1.0 50.28 51.7712 10 {1} 1.0 1.0 −1.0 1.0 65.0 64.1813 17 {1} −1.0 −1.0 1.0 1.0 40.3 40.7414 9 {1} 1.0 −1.0 1.0 1.0 57.47 57.7115 7 {1} −1.0 1.0 1.0 1.0 51.5 57.1716 2 {1} 1.0 1.017 5 {1} 0.0 0.018 15 {1} 0.0 0.019 8 {1} 0.0 0.0
Table 6Independent variables and concentration levels for response surface study.
Factors Unit Levels
−2 −1 0 +1 +2
ABC
˛
a
Y
wcv
(
wttFlooRb
3
3
TE
S
2
(>x1) pH pH 2.5 5 7.5 10 12.5(>x2) SUVA L/m mg 0.26 1.27 2.29 3.3 4.31(x3) Alum mg Al/L 1.2 1.8 2.4 3 3.6
= 2.
The quadratic model for predicting the optimal point wasccording to Eq. (4).
= b0 +∑
bixi +∑
biixi2 +
∑bijxixj (4)
here Y is the response variable, b is the regression coeffi-ient of the model, x is the coded levels of the independentariables.
In general primary objective of RSM is to optimize the responseY) based on the factors investigated [23]. The Design Expert soft-
wedm
able 7xperimental layout and results of 23 full factorial central composite design.
tandard Run Block Factor variables
pH x1 SUVA x2
1 9 1 5.00 1.272 11 1 10.00 1.273 5 1 5.00 3.304 6 1 10.00 3.305 8 1 5.00 1.276 3 1 10.00 1.277 7 1 5.00 3.308 12 1 10.00 3.309 2 1 2.50 2.29
10 19 1 12.50 2.2911 10 1 7.50 0.2612 13 1 7.50 4.3113 4 1 7.50 2.2914 16 1 7.50 2.2915 20 1 7.50 2.2916 17 1 7.50 2.2917 15 1 7.50 2.2918 14 1 7.50 2.2919 1 1 7.50 2.290 18 1 7.50 2.29
1.0 1.0 53.0 51.180.0 0.0 57.4 52.640.0 0.0 55.8 57.170.0 0.0 58.3 57.17
are 6.0.4 was used to develop the experimental plan and optimizehe regression equation (Eq. (4)). The statistical significance ofhe second order model equation was determined by performingisher’s statistical test for analysis of variance (ANOVA). In particu-ar a good model must be significant based on F-value and P-value aspposed to the Lack of Fit (insignificant). Moreover the proportionf variance exhibited by the multiple coefficient of determination2 should be close to 1 as this would demonstrate better correlationetween the experimental and the predicted values.
. Results and discussion
.1. Factorial design
Analysis of experimental data by a complete 24 factorial designas systematically conducted as an initial screening process by
xamining the effects and interactions of pH, SUVA, FRT and alumose on NOM removal of filtered Yong Peng NOM source, as sum-arized in Table 5. A statistical testing using Fisher’s statistical test
Responses
Alum x3 NOM removal (%) Permeability LMHBar
1.80 44.70 17.331.80 66.30 8.701.80 55.20 9.701.80 46.50 13.753.00 50.10 27.093.00 74.60 12.003.00 82.70 32.083.00 74.60 28.302.40 54.20 22.032.40 75.80 8.662.40 56.50 26.102.40 77.10 32.101.20 45.30 9.533.60 79.70 22.392.40 58.00 23.102.40 56.00 24.902.40 62.00 28.102.40 56.00 23.482.40 58.00 28.802.40 60.00 25.00

A.W. Zularisam et al. / Separation and Purification Technology 65 (2009) 193–210 199
Table 8ANOVA for 24 full factorial design; response: NOM removal (%).
Source Sum of Squares DF Mean squares F-value Prob > F
Model 1628.07 10 162.81 49.36 <0.0001a
A 604.32 1 600.25 183.23 <0.0001B 16.83 1 16.83 5.10 0.0584C 26.86 1 26.86 8.14 0.0246D 41.50 1 41.50 12.58 0.0094AB 240.65 1 240.65 72.96 <0.0001AC 119.95 1 119.95 36.37 0.0005AD 23.01 1 23.01 6.98 0.0334BC 27.95 1 27.95 8.47 0.0226BD 16.10 1 16.10 4.88 0.0629CD 510.90 1 510.90 54.90 <0.0001
Residual 3.09 7 3.30Lack of Fit 19.88 5 3.98 2.48 0.3119b
Pure Error 3.21 2 1.60Cor Total 1688.69 18
Std. Dev. 1.82 R2 0.9860Mean 53.92 Adjusted R2 0.9660
V
faoasfite0tdibpaei9
witwtch(csTgtiatmfcwNd
oiabtsbtafrbFauremoval. However coagulant overdosing is not desirable as it couldpresent high residual metal concentration, substantial operationcosts and problems related to sludge production.
On the other hand, increasing the alum dose at the minimumpH level (pH 5; Fig. 10a) appeared to have only minor effects on the
alues of “Prob > F” less than 0.0500 indicate model terms are significant.a Significant.b Not significant.
or ANOVA was employed for the determination of significant vari-bles where degree of significance was ranked based on the valuef F-ratio. As matter of fact the larger the magnitude of F-valuend correspondingly the smaller the “Prob > F” value, the moreignificant are the corresponding model and the individual coef-cient [23]. It was observed from ANOVA analysis (Table 8) thathe confidence level was greater than 95% (P < 0.05) for removalfficiency while F-value and P-value of the model were 49.36 and.0001 respectively, thus indicating that the estimated model fitshe experimental data adequately. Furthermore the coefficient ofetermination R2 of the model was reasonably close to 1 (0.98),
mplying that about 98% of the variability in the data was explainedy the model. It was further shown that the main effect of alum (A),H (D), SUVA (C) and the two level interactions of AB, AC, AD, BCnd CD were significant model terms (factors). Other model termsspecially the main effect of FRT (B) was relatively less significant innfluencing NOM removal as their confidence level were less than5% (P > 0.05).
Significances of effects and interactions of factors on a responseere further diagnosed and compared, and graphically illustrated
n the half normal plot (Fig. 9), where results of dominating effectshat are likely to represent the important and influential factorsere found consistent with the ANOVA analysis results. Moreover
he significance of interactions between factors on the responsean be best considered using interaction analysis graph of Fig. 10. Itas been observed that the interaction effect between alum and pHFig. 10a) depicts a remarkable improvement in NOM removal effi-iency as the alum dose increases from minimal to maximum level,uggesting that this variable significantly affect the NOM removal.he enhancement brought by increasing alum dose appears to bereater at higher pH condition (pH 10), which is significantly con-rary to the results presented in Fig. 10b. Incremental of water pHncreases charge density and the UV254 absorbance (Figs. 4 and 5)s a result of ionization of the negatively charged functional groupshat increased intra-molecular repulsion and NOM solubility, pri-
arily the hydrophobic compounds. The dissociation of these
unctional groups creates large demand on the positively chargedoagulant, and as alum dose increased more Al hydrolysis speciesere available to neutralize the negatively charged sites of acidicOM. It is anticipated that higher DOC removal at greater alumose was due to the micro-flocs characteristics and cake morphol-gy effects, as addition of coagulation dose is presumably effectiven shifting towards larger physical size of coagulated suspensionnd consequently may result in greater water treatability eithery adsorbing on the membrane surface through molecular attrac-ion (van der Waals or London forces) or effectively rejected byteric hindrance prior to back transporting away from the mem-rane surface (to bulk water). Such condition could apparently leado formation of cake deposition of charged neutralized flocculantnd/or aluminium hydroxide precipitate on the membrane sur-ace. This particles deposition in response acts as a filter media,educing the effective molecular cut-off (MWCO) of the UF mem-rane, and thus improving the NOM removal. Apparently results ofig. 10a essentially depicting that an increase in coagulant dosaget high pH application, tends to widen the range of optimum coag-lant dosage, but not optimum pH, with respect to maximum NOM
Fig. 9. The half normal plot for 24 full factorial designs.

200 A.W. Zularisam et al. / Separation and Purification Technology 65 (2009) 193–210
2) effe
ecefaaapofid(cdtfsd(mcbgsea[t
OcioSlc1oodbtt[iswPfmah
Fig. 10. Plot of interaction effect for NOM removal (%DOC): (a1 and a
xtent of NOM removal despite conducting the experiment in theharge neutralization condition (pH 5). This observation could bexplained due to the insufficient anionic NOMs that were availableor charge neutralization with the increasing cationic aluminium,s low pH condition corresponded to less negatively charge (Fig. 4)nd more insoluble humic/fulvic acid [24]. In other word dissoci-tion of NOM is limited at low pH and the neutralization by theositively charged coagulant has little effect. Furthermore resultsf this study also revealed that coagulation prior to direct ultra-ltration was not only responsible for the removal of high chargeensity (presence of carboxylic groups) and high molecular weightMW) hydrophobic fraction, such as humic/fulvic acids, but alsoapable of removing some lower MW and non-ionic (low chargeensity) hydrophilic compounds which were poorly removed byhe conventional coagulation process [2,6,9,25]. This was evidentrom the results of Run 4 and Run 6 (Table 5) which demon-trated outstanding NOM removal (73.60% and 61.17%, respectively)espite of having total hydrophobic NOM fraction of only 57%Table 2). Surprisingly both results were corresponding to FRT of
inimum level (5 min), suggesting that within this shortest floc-ulation time, the micro-flocs have already grown large enough toe excluded by the membrane. This finding suggests that the inte-rated UF membrane process with precoagulation, removed NOM
ubstances more efficiently than results previously reported by Qint al. [26] (59.5%), Xia et al. [27] (47%) and Kabsch-Korbutowicz etl. [28] (66.2%). However experiment done by Pikkarainen et al.29] indicated maximum TOC removal that amounted to 78% buthis result was obtained with metal salt coagulant of higher dose.wonoi
ct between alum and pH, (b1 and b2) effect between SUVA and pH.
ther researchers reported similar observations, i.e. the specificake resistance was decreasing while TOC removal was increas-ng, with increasing dosage of coagulants [10,28,30]. In the casef interaction effect between SUVA and pH (Fig. 10b), increasingUVA from 1.27 (L/m mg) to 3.30 L/(m mg) improved NOM removalinearly at the low pH level (pH 5), however under identical SUVAonditions, opposite results were obtained at the high pH level (pH0). This observation significantly demonstrated that the efficiencyf coagulation–ultrafiltration process is reasonably controlled notnly by pore size exclusion but also by solution chemistry (pHependent), in addition to SUVA parameter. This could be explainedy the fact that DOC removal by membrane exclusion is higher inhe charge neutralization coagulation pH zone (pH 5.0–6.5) thanhat under the condition of sweep coagulation condition (pH > 6.5)31,32]. Primarily due to the negative charge carried by NOM, theres a stoichiometric relationship among the required coagulant dose,olution conditions such as pH and the TOC concentration in theater to be treated [33]. This supposition is consistent with Yong
eng’s NOM composition which mainly comprised hydrophobicraction (57%), carrying sufficient anionic binding sites that created
ore coagulant demand with the cationic aluminium hydrolysiss the SUVA is increased (due to dissociation of carboxylic andydroxyl functional groups) [Eq. (5)]. In particular this condition
as promoting formation of greater physical size of micro-flocsf metal–humic/fulvic complexes via charge neutralization mecha-ism that was more effectively removed by membrane filtration. Inther words as the relative fraction of humic/fulvic increases withncreasing SUVA, contribution of the charge neutralization to NOM
Purific
rtatddosesnwpio
A
isomcoeNmtcsTsepi
oddaasrirtpelsSctpTd(lS
dchrfipitfewv
TA
S
M
ABCABCAAB
RL
PC
SM
V
A.W. Zularisam et al. / Separation and
emoval increased, especially when the applied pH was closed tohe isoelectric point (IEP) of Al(OH)3(s) [34]. On the other handt pH greater than 6.5, the insoluble aluminium hydroxide crys-als dominate in water, contribution of the charge neutralizationecreased and micro-flocs formation process is eventually depen-ent on the adsorption of hydrophobic/hydrophilic substancesn the amorphous solid-phase Al(OH)3(s) [Eq. (6)]. Subsequenturface adsorption followed by sweep coagulation (conventionalntrapment) is presumed to generate micro-flocs of inadequateize, insufficiently large to be rejected neither by the cake layeror by membrane pores. This hypothesize is in good accordanceith previous studies which reported lower NOM removal rate byrecipitation occurred particularly at higher pH (pH > 5.5) due to
nsufficient floc density, implying that the formed micro-flocs weref smaller size [13,26,29].
Al(OH)n3−n + HPO NOM−x → Al(OH)n HPO NOM
(soluble complex)
→ Al(OH)n HPO NOM(s)(solid)
(5)
l(OH)n3−n + HPO/HPI NOM−x → HPO/HPI NOM · Al(OH)3(s)
(adsorbed)(6)
In another perspective, decrease in NOM removal with anncrease in SUVA at pH 10 (Fig. 10b), is attributable to the moleculartructure of humic/fulvic which varies from rigid spherocolloidalr compacted configuration (at low pH) to flexible linear macro-olecules (at alkaline pH range) [17,21]. Being a linear shape
onfiguration with more soluble compound enables easier passagef NOM macromolecule through membrane pores without beingxcluded by steric exclusion. Conversely, possibility relating to highOM removal at low pH level could be well corresponded to theembrane matrix (change in membrane pore size), which is a func-
ion of solution chemistry. Braghetta et al. [24] claimed that low pHondition attributed to compaction of membrane matrix or poreize that restricts the entrance of solute through the membrane.
his was reasoned due to reduction in electrostatic charge repul-ion or charge neutralization at the membrane surface followed bylectric double layer compression that distinctively caused com-action of membrane pore volume, thus considerably responsiblen implying high detainment of organic solutes. It has also been
N
able 9NOVA for Response Surface Quadratic Model [Partial sum of squares] Response: NOM re
ource Sum of squares DF
odel 2631.64 9
328.52 1260.02 11191.98 1
2 60.14 12 100.23 12 21.35 1B 494.55 1C 1.53 1C 219.45 1
esidual 67.72 10ack of Fit 40.39 5
ure Error 27.33 5or. Total 2699.37 19
td. Dev. 2.60ean 61.66
alues of “Prob > F” less than 0.0500 indicate model terms are significant.a Significant.b Not significant.
ation Technology 65 (2009) 193–210 201
bserved that reduction in electrostatic charge repulsion as pHecreased, has enhanced humic acid rejection by adsorbing moreensely on membrane surface, which significantly corresponded toless negatively charged membrane, less negatively charged humiccid and more insoluble humic material [35,36]. Fig. 10b demon-trated the importance of SUVA and the optimum pH range withespect to maximum NOM removal and as well as denoting thenter-relationship between the coagulation conditions towards theelative concentration of NOM composition. It was noticeable thathe relative NOM composition has turned out to be the optimalH range-determining factor with regards to process performancefficiency. In particular the charge neutralization coagulation (atow pH level) appeared to be relatively more significant for NOMource predominated with hydrophobic fraction such as at the highUVA level (+1), owing to the charge interactions, whereas sweepoagulation mechanism (at high pH level) through surface adsorp-ion was more favorable for low SUVA NOM source (−1), which wasrimarily occupied by less negatively charged of non-humic NOM.his notation was in good accordance with results of Fig. 10b whichepicted maximum organic removal only to occur at low pH levelpH 5) and at high SUVA (3.30 L/(m mg)), whereas under high pHevel (pH 10) maximum NOM removal was corresponded with lowUVA (1.27 L/(m mg)).
Apart of that the regression model obtained from the factorialesign analyses can be as well adopted in screening the crucial andritical variable of operating conditions. A variable is claimed toave greater significant effect on NOM removal if its coefficient waselatively larger than the others whereas the variable with positivetted constant, has an enhancer effect towards NOM removal com-ared to negative coefficient which had opposite effect. As can be
nferred from Eq. (7), which includes the coefficient for each effect,he main effect of alum dose (A) has the largest coefficient (+6.15)ollowed by pH (D, +1.61), SUVA (C, +1.30) and FRT (B, +1.03). Appar-ntly this result was consistent with ANOVA analysis in Table 8here the alum dose (A) variable is shown to have the highest F
alue.
OM removal = 53.31 + 6.15(A) + 1.03(B) + 1.30(C) + 1.61(D)
−3.88(A × B) − (%DOC)2.74(A × C) + 1.20(A × D)
+1.32(B × C) − 1.00(B × D) − 5.65(C × D) (7)
moval (%).
Mean squares F-value Prob > F
292.40 43.18 <0.0001a
328.52 48.51 <0.0001260.02 38.39 0.00011191.98 176.00 <0.000160.14 8.88 0.0138100.23 14.80 0.003221.35 3.15 0.1062494.55 73.02 <0.00011.53 0.23 0.6446219.45 32.40 0.0002
6.778.08 1.48 0.3394b
5.47
R2 0.9749Adjusted R2 0.9523

2 Purific
3
fotFlaocpeA4hsdimbivwm(Tieaeaos
Ne1pi%ttt
imsacwndmtbvtpwadirNcuhapmawcit
op0eceq
TA
S
M
ABCABAB
RL
PC
SM
V
02 A.W. Zularisam et al. / Separation and
.2. Response surface methodology (RSM)
The three significant variables alum dosage, pH and SUVA wereurther optimized using response surface methodology and resultsn the effect of variable factors towards NOM removal, one ofhe response variables, are shown in Table 9. In this design, theRT factor was set at the center point settings (10 min) due to itsow significances for organic removal (from Table 8) while aer-tion intensity was maintained at 200 L/(m2 min). Fit summaryutput analysis indicated that the quadratic model was statisti-ally significant to represent both the NOM removal and membraneermeability responses. The adequacy of a quadratic model wasxamined by F test, “Prob > F” and the determination coefficient R2.s can be inferred in Table 9, the computed F and Prob > F were3.18 and <0.0001, respectively, which implied that the model wasighly significant with low probability. Results obtained adequatelyuggesting that the present mathematical model was in good pre-iction of the experimental results and as a matter of fact the terms
n the model have a significant effect on the response. In a similaranner, the multiple correlation coefficient of R2 was calculated to
e 0.9749, indicating a good agreement existed between the exper-mental and predicted value as well as depicting that 97.49% of theariability in the response could be well explained by the modelhile only 2.51% of the total variation was poorly described by theodel. Moreover the “Lack of Fit” value was found insignificant
Prob > F = 0.3394) which denoted that the model was desirably fit.he main effect of alum dose (C) was found to be the most signif-cant factor to have the largest effect towards the NOM removalfficiency and this was followed by the two level interactions of pHnd SUVA (AB), and the main effect of pH (A). Moreover the mainffect of SUVA (B), the two level interactions between SUVA andlum dose (BC), the second order effect of SUVA (B2) and the sec-nd order effect of pH (A2) were found to be responsible for theecondary effect on the NOM removal.
The relative effect of alum dose as operating parameter onOM removal and membrane permeability was clearly visible sincexperiments operated at low alum dose level (−1 and −2; Runs 4, 9,1) exhibited some of the lowest organic removal and membraneermeability. It is further shown that at lower pH level (−1), an
ncrease of removal efficiency has been observed, with maximumDOC removal (82.70%) was found to occur at pH 5.0 (Run 7), onhe other hand the membrane permeability showed dependent onhe coagulation condition, being higher at the charge neutraliza-ion pH zone (pH 5) than for the sweep-floc condition (Run 19). An
tpeSa
able 10NOVA for Response Surface ReducedQuadratic Model [Partial sum of squares] Response
ource Sum of Squares DF
odel 2608.76 7
328.52 1260.02 1
1191.98 12 47.96 12 85.30 1B 494.55 1C 219.45 1 219.45
esidual 90.61 12ack of Fit 63.28 7
ure Error 27.33 5or. Total 2699.37 19
td. Dev. 2.75ean 61.66
alues of “Prob > F” less than 0.0500 indicate model terms are significant.a Significant.b Not significant.
ation Technology 65 (2009) 193–210
nverse relationship between organic removals and membrane per-eability, in the case of sweep-floc condition (Runs with pH > 6.5),
uggested that the lower membrane permeability was considerablyttributed to the formation of less porous and more compressibleake compared to those of the charge neutralization condition. Itas also observed that the removal efficiency seemed to decreaseoticeably when higher pH was employed (Run 19 and Run 20)espite fairly high alum dose and SUVA were used in the experi-ents. In conjunction, this observation corresponded as evidence
o results obtained from Fig. 5, which explained the relationshipetween the increases in UV254 nm absorbance with increasing pHalue. Apparently this phenomenon could be well explained dueo the fact that, NOM solubility and SUVA would be increasingroportionally with the pH increment as more functional groupsere ionized including the charged acidic groups such as carboxylic
nd phenolic. Such condition greatly increases the acidic chargedensity (Fig. 4) and the electrostatic repulsion between the NOM
ntra-chains, resulted in the formation of flexible linear configu-ation of NOM molecules, which were more soluble. Ionization ofOM molecules enable easier passage through membrane pores,oncomitantly reduced most of the acidic/charged NOM partic-larly the hydrophobic fraction and eventually left only solubleydrophilic NOM which has less electron-rich sites or insufficientnionic binding sites towards the cationic aluminium hydrolysisroduct [5,24]. Subsequently this phenomenon attributed to for-ation of relatively inadequate micro-flocs size via poor surface
dsorption onto the insoluble Al(OH)3(s) amorphous solid-phase,hich was ineffectively retained by the membrane pore size. This
ondition has therefore resulted in low NOM removal with slightlymproved flux rate as portion of the NOM solute could easily passinghrough the membrane pores.
It should also be noted that other model terms such as the sec-nd order effect of alum (C2) and the two level interactions of theH and alum (AC) were found insignificant (Prob > F more than.0500 indicate model terms are insignificant) and therefore can beliminated for model improvement (Reduced Quadratic Model). Inonjunction, the backward elimination procedure was employed toradicate the insignificant terms and ANOVA results of this reduceduadratic model is tabulated in Table 10. The results revealed that
he model significacy was improved (F = 49.36 instead of 43.18 forrevious model) with alum dose (C) appeared as the primary mainffect contributor followed by the two level interactions of pH andUVA (AB), main effect of pH (A), SUVA (B), the two level inter-ction of BC, the second order effect of B2 and A2. Hence in this: NOM removal (%).
Mean squares F-value Prob > F
372.68 49.36 <0.0001a
328.52 43.51 <0.0001260.02 34.44 0.0001
1191.98 157.86 <0.000147.96 6.35 0.026985.30 11.30 0.0057
494.55 65.50 <0.000129.06 0.0002
13.899.04 1.65 0.2998b
5.47
R2 0.9664Adjusted R2 0.9469

A.W. Zularisam et al. / Separation and Purification Technology 65 (2009) 193–210 203
Table 11ANOVA for Response SurfaceReducedQuadratic Model [Partial sum of squares] Response: Membrane permebility (LMHBar).
Source Sum of squares DF Mean squares F-value Prob > F
Model 1087.81 7 155.40 13.33 <0.0001a
A 157.44 1 157.44 13.50 <0.0032B 58.94 1 58.94 5.06 0.0441C 358.25 1 358.25 30.72 0.0001A2 229.23 1 229.23 19.66 0.0008AB 71.94 1 71.94 6.17 0.0288BC 71.22 1 71.22 6.11 0.0294
Residual 139.93 12 11.66Lack of Fit 111.85 7 15.98 2.85 0.1337b
Pure Error 28.08 5 5.62Cor Total 1227.73 19
Std. Dev. 3.41 R2 0.8860Mean 21.16 Adjusted R2 0.8195
V
sctis(tnaFncTbv
N
P
N
P
l
NvpatitirTrsaSNSt5wIwlpc(ositdp
mldwdtw
alues of “Prob > F” less than 0.0500 indicate model terms are significant.a Significant.b Not significant.
tudy the ranking is as follows: C > AB > A > B > BC > B2 > A2. In thease of membrane permeability as the second response variable,he backwards elimination procedure was also selected for modelmprovement (Table 11). The main effect of alum dosage (C), theecond order effect of pH (A2), the second order effect of alumC2), the main effect of pH (A), the two level interaction of AB, thewo level interaction of BC and main effect of SUVA (B) are sig-ificant model terms for membrane permeability, thus the rankingccording to the model term significacy (based on the magnitude of-value) is C > A2 > C2 > A > AB > BC > B. The co-efficcient of determi-ation R2 for membrane permeability was 0.8860 indicating goodorrelation existed between the experimental and predicted values.he multiple regression equations for NOM removal and mem-rane permeability using pH (A), SUVA (B) and alum (C) as the mainariable were as follows:
Final empirical model in terms of coded factors:
OM removal = +59.15 + 4.53 × A + 4.03 × B + 8.63 × C
+ 1.35 × A2 + 1.80 × B2 − 7.86 × A × B
+ 5.24 × B × C (8)
ermeability = +25.75 − 3.14 × A + 1.92 × B + 4.73 × C − 2.95
× A2 − 2.80 × C2 + 3.00A × B + 2.98 × B × C (9)
Final empirical model in terms of actual factors:
OM removal = +17.2747 + 5.65477 × pH − 1.41051 × SUVA
− 5.26596 × Alum + 0.21586 × pH2 + 1.74632
× SUVA2 − 3.09852 × pH × SUVA + 8.60016
× SUVA × Alum (10)
ermeability = −12.23 + (3.12 × pH) − (18.73 × SUVA)
2 2
+ (33.96 × Alum) − (0.47 × pH ) − (7.76 × Alum )+ 1.18 × pH × SUVA + 4.89 SUVA × Alum (11)
The above empirical model equations are mathematical corre-ation model that can be employed to predict and optimize the
op1wA
OM removal and membrane permeability within the range ofariable factors of this experiment. Analyses on normal probabilitylot of the residuals (Fig. 11) depicted nearly a straight line residu-ls distribution, which denoting errors are evenly distributed andherefore support adequacy of the least-square fit, while resultsllustrated in Fig. 12 revealed that the models proposed are dis-inctively adequate and reasonably free from any violation of thendependence or constant variance assumption, as studentizedesiduals are equally tabulated within the red line of the x-axis.he effect of pH, SUVA and alum dose process variables on NOMemoval and membrane permeability was further analyzed usingimulated three dimensional response surface and contour plotsccording to the backward quadratic model. The effect of pH andUVA on NOM removal depicted in Fig. 13 demonstrated that theOM removal increased when pH changed from 10.0 to 5.0 and asUVA concentration increased from 1.27 to 3.30. Based on the result,he maximum removal of 69.65% is obtained when pH and SUVA is.0 and 3.3, respectively. In addition, the change of organic removalas further analyzed as a function of alum dose and pH (Fig. 14).
t should be noted that alum dose affects NOM removal in a linearay as the pH, where removal efficiency is found maximum at high
evel factor (+1). In fact the slope of the increase is dependent onH and alum dose, and appears to be gradually steep at higher levelonditions. It is worth to note that increase in pH at high alum level3.0 mg/L), resulted in increase of NOM removal, however lowerrganic removal was applied at low level of alum dose (1.8 mg/L),uggesting that the performance of process applied was essentiallynfluenced by alum variable. Results of Figs. 13 and 14 were foundo be consistent with findings of Fig. 10 that demonstrated alumose provided the principle effect to NOM removal in addition toH and SUVA variable factors.
The surface and contour plots of the effect of SUVA and pH onembrane permeability while keeping alum dose at the middle
evel (2.40 mg Al/L), is shown in Fig. 15. It was clearly shown that theecrement of membrane permeability was apparently monotonousith the increase of SUVA, where the membrane permeabilityecreased from 27.01 L m−2 h−1 bar−1 at SUVA of 1.27 L m −1 mg−1
o 24.04 L m−2 h−1 bar−1 at SUVA of 3.30 L m−1 mg−1 when pHas constantly maintained at 5.0. Conversely, opposite result was
bserved with the high pH level (pH 10), in which the membraneermeability was increasing from 14.73 L m−2 h−1 bar−1 at SUVA of.27 L m−1 mg−1 to 24.55 L m−2 h−1 bar−1 (SUVA of 3.3 L m−1 mg−1)hen alum dose was applied at the centre point of 2.40 mg Al/L.pparently membrane permeability was varied with the oper-
204 A.W. Zularisam et al. / Separation and Purification Technology 65 (2009) 193–210
(a) N
acesstsstfltcctB
amntwcH(arL
Fig. 11. Normal probability plot of residual for
tional pH conditions as the SUVA was increased. Lower pHondition led to lower membrane permeability, while higher pH,nlarged the permeability to some extent. It is reasonable touppose that with increasing SUVA from 1.27 to 3.3 L m−1 mg−1,pecifically at the low pH level, contribution of the charge neu-ralization predominated for micro-floc formation of relativelyufficient size for steric hindrance. Hence allowing the coagulateduspension to accumulate densely in the form of cake layer athe membrane surface and to the extent of impeding permeateow despite improved organic solute rejection. In the case of bet-er membrane permeability shown at the high pH level, could be
losely related to the micro-floc formation of relatively insuffi-ient size to be effectively retained or presumably attributed tohe formation of more porous cake with the sweep-floc condition.esides that the effect of pH and alum dose on membrane perme-Nawt
Fig. 12. Plot of residual against predicted response (a)
OM removal and (b) membrane permeability.
bility is presented in Fig. 16. It can be seen that the maximumembrane permeability of 27.87 L m−2 h−1 bar−1 corresponded in
egative correlation with the pH but in opposite manner withhe alum dose. In particular the membrane permeability increasedhen pH was decreased from 10.0 to 5.0 and as alum dose con-
entration was increased from 1.8 mg Al/L to 3.0 mg Al/L (Fig. 16a).igher membrane permeability at low pH, as alum is increased
Fig. 16b), than at the high pH level suggested that excessive alumddition was not favorable as it could lead to insignificant NOMejection (Fig. 10a) due to inefficient charge neutralization process.ow pH condition reduced solubility and charge density of acidic
OM, and in the case of constant SUVA concentration (Fig. 16), alumddition would only result in formation of immature micro-flochich potentially managed to pass through the membrane pores,hus implying in high water permeability.
NOM removal and (b) membrane permeability.

A.W. Zularisam et al. / Separation and Purification Technology 65 (2009) 193–210 205
M rem
ahgoTofcpsnc
sichtttf
Fig. 13. Interaction graph (a) and contour plot (b) of NO
In general NOM source water contained humic (hydrophobiccids) and non-humic (hydrophilic) fractions distribution with theydrophobic NOM possessed higher contents of acidic functionalroups, while the hydrophilic fraction is consisted of none [5,37,38]r lesser ionizable functional groups (due to transphilic NOM).herefore better NOM rejection by NOM source of higher SUVAr source water which contained relatively greater hydrophobicraction could be explained due to reactivities difference of NOM
omponents towards cationic aluminium hydrolysis products. Inarticular the hydrophobic NOM fraction has more electron-richites (anionic binding sites) than with the hydrophilic compo-ents, thus attributed to better agglomeration of bulk NOM throughharge neutralization with the cationic aluminium hydrolysis. Sub-tcpbi
Fig. 14. Interaction graph (a) and contour plot (b) of NOM remo
oval from the model equation: effect of SUVA and pH.
equently better result of NOM agglomeration would then impliedn bigger micro-flocs and greater DOC rejection as the evolvedharge neutralized flocculant contributes to cake formation ofigher dynamic permeability, less denser, lower hydraulic resis-ance and more compressible, as illustrated in Fig. 17a. Notehat in Fig. 4, the charge density of hydrophobic NOM frac-ion appeared to be substantially greater than the hydrophilicraction, thus essentially suggesting that the hydrophobic frac-
ion contained relatively higher ionizable groups per unit organicarbon or had more anionic binding sites than the hydrophilicortion [22,39]. Moreover this observation was well supportedy statement of Altmann and Ripperger [40] who claimed thatt was more difficult for large particles to foul the membraneval from the model equation: effect of pH and alum dose.

206 A.W. Zularisam et al. / Separation and Purification Technology 65 (2009) 193–210
ne pe
sbeode[
R
wd
atmhlflitlNebAiscHbtdbhas
hcssmbowsmpasowihmdisflad
3
iwrpE
Fig. 15. Interaction graph (a) and contour plot (b) of membra
urface than smaller particulate. In fact this supposition coulde closely correlated with the Kozeny equation [Eq. (12)] thatxpresses the specific resistance (Rc) of incompressible cake. Basedn this equation, the cake specific resistance increases when theiameter of deposited particles (dp) decreases in size, thus appar-ntly resulting in higher hydraulic resistance of cake formation41].
c = 180(1 − εc)2
dp2εc3
(12)
here ε is the porosity of gel and dp is the diameter of particleeposited.
In addition it was also suppose that the residual NOM of chargedcidic groups, which were not participating in the charge neu-ralization, was effectively rejected by the negative charge of PSF
embrane surface (pH 5; −18 mV), thus eventually attributed toigher NOM removal. In contrast, filtration of NOM source with
ower SUVA (less charge density) was found to experience greaterux decline and lesser NOM removal despite lower hydrophobicity
nteractions with the hydrophobic PSF membrane. This observa-ion could be explained by the fact that NOM of low SUVA hasesser electrostatic attraction and minimal coagulant demand thanOM of high SUVA, therefore it (NOM of low SUVA) was appar-ntly favourable in becoming smaller micro-flocs due to inefficientinding process between COO− or OH− of NOM and the hydrolyzel3+ and consequently the flocs were poorly pore excluded. It
s worth to note that during early dissociation of aluminiumalts, soluble hydrolysis species will bind with negative chargearried by NOM such as phenolic and carboxylic groups [6,13].owever due to poor charge neutralization (insufficient anionicinding sites), the unreacted aluminium salts which were not neu-ralized or existed as residual aluminium (exceeded solubility)
uring aluminium hydrolysis reaction were converted into insolu-le aluminium hydroxides. Subsequently the insoluble aluminiumydrolysis products possessing of charged neutralized flocculantnd aluminium hydroxides would adsorb, entrap and sweep theuspended NOM of relatively higher hydrophilic fraction whichwwpaw
rmeability from the model equation: effect of SUVA and pH.
as smaller SUVA possession and lower repulsion toward the floc-ulant. Moreover micro-flocs with prematured size (inadequateize) especially with the sweep-floc condition (pH > 6.5) has con-iderably low settle ability problem (requires high FRT) and waserely detrimental to the effective membrane permeability (mem-
rane pores permeability) as it involved combination of adsorptionn membrane pore matrix and to the extent of pore constrictionithin the membrane pore structure, as illustrated in Fig. 17b. Sub-
equently NOM component that was relatively smaller than theembrane MWCO, could easily passing through the membrane
ore opening hence implying in low NOM removal and poor perme-te flux quality. Therefore possession of high SUVA property in NOMource is preferable as it could essentially influenced the possibilityf charge neutralization mechanism, instead of sweep coagulation,hich was noticeably responsible in changing the flocs morpholog-
cal characteristic (bigger pin-sized flocs), thus implying in lowerydraulic resistance, greater NOM removal and as well as betterembrane permeability (Fig. 17a). However inappropriate alum
osage application despite moderately high SUVA possession, asn the case of Standard order 13 (Run 4), could correspond to oppo-ite results and worse membrane filtration performance (permeateux parameter) considerably due to adsorption fouling mech-nism (induced by hydrophobicity interactions) and rapid fluxecline.
.2.1. Validation of empirical model adequacyAdequacy of the developed empirical model needs to be ver-
fied or validated in order to confirm the prediction accuracy,hich is generated by the regression equation in predicting the
emoval efficiency and membrane permeability at any particularH, SUVA and alum within the range of level defined previously.xperimental rechecking was performed using conditions that
ere previously used and combined with additional experimentshich have not been tried before but was within the limits testedreviously (Table 12). In addition water samples of different char-cteristics from other natural NOM sources such as Bekok Damater and Ulu Pontian river were also employed in the verifica-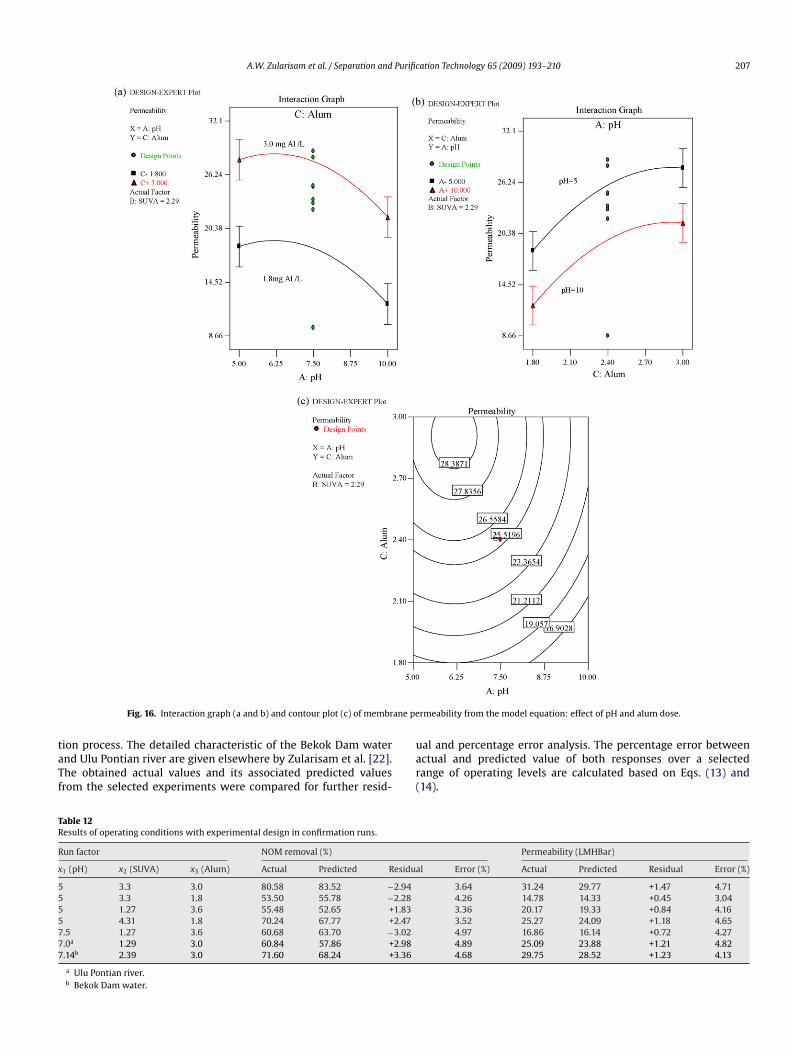
A.W. Zularisam et al. / Separation and Purification Technology 65 (2009) 193–210 207
ane pe
taTf
TR
R
x
5555777
Fig. 16. Interaction graph (a and b) and contour plot (c) of membr
ion process. The detailed characteristic of the Bekok Dam waternd Ulu Pontian river are given elsewhere by Zularisam et al. [22].he obtained actual values and its associated predicted valuesrom the selected experiments were compared for further resid-
uar(
able 12esults of operating conditions with experimental design in confirmation runs.
un factor NOM removal (%)
1 (pH) x2 (SUVA) x3 (Alum) Actual Predicted Residua
3.3 3.0 80.58 83.52 −2.943.3 1.8 53.50 55.78 −2.281.27 3.6 55.48 52.65 +1.834.31 1.8 70.24 67.77 +2.47
.5 1.27 3.6 60.68 63.70 −3.02
.0a 1.29 3.0 60.84 57.86 +2.98
.14b 2.39 3.0 71.60 68.24 +3.36
a Ulu Pontian river.b Bekok Dam water.
rmeability from the model equation: effect of pH and alum dose.
al and percentage error analysis. The percentage error betweenctual and predicted value of both responses over a selectedange of operating levels are calculated based on Eqs. (13) and14).
Permeability (LMHBar)
l Error (%) Actual Predicted Residual Error (%)
3.64 31.24 29.77 +1.47 4.714.26 14.78 14.33 +0.45 3.043.36 20.17 19.33 +0.84 4.163.52 25.27 24.09 +1.18 4.654.97 16.86 16.14 +0.72 4.274.89 25.09 23.88 +1.21 4.824.68 29.75 28.52 +1.23 4.13

208 A.W. Zularisam et al. / Separation and Purification Technology 65 (2009) 193–210
Table 13Results of optimum operational conditions for Yong Peng river.
Proposed optimal conditions Predicted removal (%DOC) Predicted permeability (LMHBar) Confirmation runs
Actual removal (%DOC) Actual permeability (LMHBar)
pH 5.48SA
N
R
%
raertw
Fr
rtm
3
81.28 30.61UVA 3.24lum 3.00
umber in parenthesis means percentage of error.
esidual = (Actual value − Predicted value) (13)
Error = ResidualActual value
× 100% (14)
Results of Table 12 have shown that the percentage errors areanging from 3.36% to 4.97% and 3.04% to 4.71% for NOM removal
nd membrane permeability, respectively. Thus implied that thempirical model developed were considerably accurate for bothesponding terms (NOM removal and membrane permeability) ashe percentage error between the actual and predicted values wereell within the value of 5%, suggesting that the model adequacy isig. 17. Conceptual model postulating the effect of coagulation condition on organicemoval and membrane permeability during coagulation–UF membrane filtration.
peavoifbttpiw(rttbtpfolpvowriwoftrrmtpdww
4
Rtca
79.50(2.24%)
31.29(2.17%)
easonably within the 95% of prediction interval. By this means fur-her analysis with regards to ideal operational process for optimal
embrane performance would be based on this developed model.
.2.2. Process optimizationConsidering the previous discussion, main effect of alum dose,
H and SUVA were found more dominant than their interactionffects with respect to both NOM removal and membrane perme-bility. Nevertheless one cannot simply neglect the importance ofarious interaction effects, for that interaction among them hadnly little influence on responses because any individual factor thatnvolved in interactions have to be considered jointly. In generalor any given separation, there is usually a trade-off relationship ofetween removal and permeability, where both parameters tendo exhibit a contradictory relation, that an increase in removalhrough a single effort was often accompanied with a decrease inermeability, or vice versa. In conjunction, this phenomenon was
n a good accordance with results of Run 11 and Run 19 (Table 7)hich demonstrated dramatically low membrane permeability
8.7 LMHBar and 8.66 LMHBar) were corresponded with high NOMemoval efficiency (66.3% and 75.8%). Hence a desirable combina-ion of pH, SUVA and alum dose is required in order to achievehe optimum operational conditions for NOM removal and mem-rane permeability. Utilizing the optimization mode capability ofhe software enables the prediction of response complete with 95%rediction interval. Optimization procedure has been conductedor the nom source waters of Yong Peng and the prediction resultsf the empirical model are tabulated in Table 13. The concentrationevel of pH and alum dose were set to range within the levels definedreviously while SUVA of NOM source water was fixed to its naturalalue. Results have shown optimum pH, SUVA and alum dose forptimal NOM removal and membrane permeability of Yong Pengater were determined to be 5.48, 3.24 L mg−1 m−1 and 3.0 mg Al/L,
espectively. Under these proposed optimized conditions, the max-mum value of removal and permeability predicted from the model
ere 81.28% and 30.61 LMHBar. In order to confirm the predictedptimization conditions, experimental confirmation runs were per-ormed by employing the suggested model conditions. Apparentlyhe optimal values of 79.50% and 31.29 LMHBar were obtained,espectively. It is worth to note results of the experimental car-ied out here adequately implied that the proposed mathematicalodels suggested are reasonably accurate and reliable as most of
he actual values for the confirmation runs are well within the 95%rediction interval, hence it could reliably be employed for the pre-iction of optimum coagulation–UF membrane process conditionsith respect to optimal production of high quality potable drinkingater.
. Conclusions
A Full factorial design and central composite design (CCD) ofesponse surface methodology (RSM) can be used to determinehe significant variables and optimum condition for hybrid pro-ess of coagulation–UF membrane with respect to NOM removalnd membrane permeability. Experimental results show that a UF

Purific
pdfaictfbbAdtaorbvtqcttt(brcflctsdAswmscpeorgacst
R
[
[
[
[
[
[
[
[
[
[
[
[
[
[
[
[
[
[
[
[
[
[
[
[
[
[
A.W. Zularisam et al. / Separation and
rocess with coagulation pretreatment has a great potential forrinking water treatment. This innovative technology has beenound to significantly dependent on addition of coagulant, suit-ble pH and with condition of sufficient SUVA of NOM source,n the perspective to promote greater colloidal destabilization,harge neutralization and agglomeration of dissolved organic mat-er (micro-flocs). The effectiveness of coagulation pretreatment andollowed by a direct UF with respect to NOM removal and mem-rane permeability appears to be a result of complex interactionsetween membrane surface and NOM flocculant characteristics.s a matter of fact these interactions may pronouncedly differepending on the pH adjustment, coagulant dosing and NOM frac-ions of the particulate water (relative distribution of hydrophilicnd hydrophobic NOM composition). Although proper adjustmentf pH and optimal coagulant dosage is considered promising ineducing membrane fouling and providing permeate quality fareyond the current regulatory, the relative NOM composition (HPIersus HPO fractions) is also critically important with respecto minimization of membrane fouling and improving permeateuality as it could influence the coagulated flocs morphologicalharacteristics, through selective domination of either charge neu-ralization or sweep coagulation mechanisms. Furthermore thisreatment system also demonstrates reduction in the floccula-ion hydraulic retention as the required flocs need only be largerpin-sized flocs) than the membrane pore size. This represents aenefit of requiring lesser coagulant consumption than would beequired for the formation of settleable flocs, improve productionapacity due to sedimentation process elimination, eliminatingocs settleability concerns, smaller footprint and lower operatingosts associating to minimal coagulant dosage, sludge produc-ion and treatment duration. It should also be pointed out thatelection of optimal pH with respect to maximum NOM removalepends greatly on the relative concentration of NOM composition.pparently charge neutralization coagulation is preferable for NOMource predominated with humic/hydrophobic fraction (Yong Pengater), owing to the charge interaction, whereas sweep coagulationechanism through surface adsorption is more favorable for NOM
ource primarily occupied by less negatively charged of non-humicompounds. In conjunction possession of moderately high SUVAroperty in NOM source is preferable as it could essentially influ-nced the possibility of charge neutralization mechanism, insteadf surface adsorption and sweep coagulation, which was noticeablyesponsible in changing the flocs morphological characteristic (big-er pin-sized flocs), lower FRT requirement, greater NOM removals well as lower flux decline. Therefore in future applications, NOMomposition should be critically considered in respect to optimalelection of coagulation pH zone and the suitability of alum dosageo be applied.
eferences
[1] S. Lee, C.-H. Lee, Effect of membrane properties and pretreatment on flux andNOM rejection in surface water nanofiltration, Sep. Purif. Technol. 56 (2007)1–8.
[2] J.D. Lee, S.H. Lee, M.H. Jo, P.K. Park, C.H. Lee, J.W. Kwak, Effect ofcoagulation conditions on membrane filtration characteristics in coagulation-microfiltration process for water treatment, Environ. Sci. Technol. 34 (17) (2000)3780–3788.
[3] C. Jucker, M.M. Clark, Adsorption of aquatic humic substances on hydrophobicultrafiltration membrane, J. Membr. Sci. 96 (1995) 137–152.
[4] A.W. Zularisam, A.F. Ismail, R. Salim, Behaviours of natural organic matterin membrane filtration for surface water—a review, Desalination 194 (2006)211–231.
[5] J. Cho, G. Amy, J. Pellegrino, Membrane filtration of natural organic matter:factors and mechanisms affecting rejection and flux decline with charged ultra-filtration (UF) membrane, J. Membr. Sci. 164 (2000) 89–110.
[6] H.-C. Kim, J.-H. Hong, S. Lee, Fouling of microfiltration membranes by naturalorganic matter after coagulation treatment: a comparison of different initialmixing conditions, J. Membr. Sci. 283 (2006) 266–272.
[
[
ation Technology 65 (2009) 193–210 209
[7] T. Leiknes, H. Odegaard, H. Myklebust, Removal of natural organic matter (NOM)in drinking water treatment by coagulation–microfiltration using metal mem-branes, J. Membr. Sci. 242 (2004) 47–55.
[8] N. Lee, G. Amy, J.P. Croue, H. Buisson, Identification and understanding of foulingin low-pressure membrane (MF/UF) filtration by natural organic matter (NOM),Water Res. 38 (2004) 4511–4523.
[9] T. Caroll, S. King, S.R. Gray, B.A. Bolto, N.A. Booker, The fouling of microfiltra-tion membrane by NOM after coagulation treatment, Water Res. 34 (11) (2000)2861–2868.
10] C. Guigui, J.C. Rouch, L. Durand-Bourlier, V. Bonnelye, P. Aptel, Impact of coag-ulation conditions on the in-line coagulation/UF process for drinking waterproduction, Desalination 147 (2002) 95–100.
11] P.-K. Park, C.H. Lee, S.-J. Choi, K.-H. Choo, S.-H. Kim, C.-H. Yoon, Effect of theremoval of NOMs on the performance of a coagulation–UF membrane systemfor drinking water production, Desalination 145 (2002) 237–245.
12] J.-I. Oh, S.H. Lee, Influence of streaming potential on flux decline of microfiltra-tion with in-line rapid pre-coagulation process for drinking water production,J. Membr. Sci. 254 (2005) 39–47.
13] R.M. Letterman, A. Amirtharajah, C.R. Omelia, Coagulation and Flocculation inWater Quality and Treatment, fifth ed., McGraw-Hill, New York, 1999.
14] L. Huang, M. Morissey, Fouling of membranes during microfiltration of surimiwash water: roles of pore blocking and surface cake formation, J. Membr. Sci.144 (1998) 113–123.
15] J.-S. Kim, S. Akeparathumchai, S.R. Wickramasinghe, Flocculation to enhancemicrofiltration, J. Membr. Sci. 182 (2001) 161–172.
16] M. Kabsch-Korbutowicz, Effect of Al coagulant type on natural organic mat-ter removal efficiency in coagulation/ultrafiltration process, Desalination 185(2005) 327–333.
17] A. Martin, F. Martinez, J. Malfeito, L. Palacio, P. Pradanos, A. Hernandez, Zetapotential of membranes as a function of pH optimization of isoelectric pointevaluation, J. Membr. Sci. 213 (2003) 225–230.
18] S.M. Serkiz, E.M. Perdue, Isolation of dissolved organic matter from the Suwan-nee river using reverse osmosis, Water Res. 24 (7) (1990) 911–916.
19] A. Idris, A.F. Ismail, M.Y. Noordin, S.J. Shilton, Optimization of cellulose acetatehollow fiber reverse osmosis membrane production using Taguchi method, J.Membr. Sci. 205 (2002) 223–237.
20] S. Hong, M. Elimelech, Chemical and physical aspects of natural organic mat-ter (NOM) fouling of nanofiltration membranes, J. Membr. Sci. 132 (1997)159–181.
21] M.R. Teixeira, M.J. Rosa, pH adjustment for seasonal control of UF fouling bynatural waters, Desalination 151 (2002) 165–175.
22] A.W. Zularisam, A.F. Ismail, M.R. Salim, Mimi Sakinah, O. Hiroaki, Fabrication,fouling and foulant analyses of asymmetric polysulfone (PSF) ultrafiltrationmembrane fouled with natural organic matter (NOM) source waters, J. Membr.Sci. 299 (2007) 97–113.
23] D.C. Montgomery, Design and Analysis of Experiment, second ed., John Wiley& Sons, New York, 1997, p, 445.
24] (a) A. Braghetta, F. DiGiano, W.P. Ball, Nanofiltration of natural organic matter:pH and ionic strength, J. Environ. Eng. 123 (7) (1997) 628–641;(b) R.H. Myers, D.C. Montgomery, Response Surface Methodology: Process andProduct Optimization Using Designed Experiments, second ed., John Wiley &Sons, New York, 2002.
25] Y. Chen, B.Z. Dong, N.Y. Gao, J.C. Fan, Effect of coagulation pretreatment onfouling of an ultrafiltration membrane, Desalination 204 (2007) 181–188.
26] J.J. Qin, M.H. Oo, K.A. Kekre, F. Knops, P. Miller, Impact of coagulation pH nenhanced removal of natural organic matter in treatment of reservoir water,Sep. Purif. Sci. 49 (2006) 295–298.
27] S. Xia, X. Li, R. Liu, G. Li, Pilot study of drinking water production with ultrafil-tration of water from the Songhuajiang River (China), Desalination 179 (2005)369–374.
28] M. Kabsch-Korbutowicz, Application of ultrafiltration integrated with coagula-tion for improved NOM removal, Desalination 174 (2005) 13–22.
29] A.T. Pikkarainen, S.J. Judd, J. Jokela, L. Gillberg, Precoagulation for microfiltrationof an upland surface water, Water Res. 38 (2004) 455–465.
30] S.J. Judd, O. Hillis, Optimization of combined coagulation and microfiltrationfor water treatment, Water Res. 35 (12) (2001) 2895–2904.
31] J.E. Gregor, C.J. Nokes, E. Fenton, Optimizing natural organics matter removalfrom low turbidity waters by controlled pH adjustment of aluminium coagula-tion, Water Res. 31 (12) (1997) 2949–2958.
32] R. Fabris, C. Chow, M. Drikas, The impact of coagulation type on NOM removal,in: Proceeding of the technology transfer workshop on natural organic matterin drinking water, Adelaide, Australia, November 27, 2002.
33] C.R. O’Melia, W.C. Becker, K.-K. Au, Removal of humic substances by coagulation,Water Sci. Technol. 40 (9) (1999) 47–54.
34] V.L. Snoeyink, D. Jenkins, Water Chemistry, John Wiley and Sons, Singapore,1980.
35] A. de la Rubia, M. Rodriquez, D. Prats, pH, ionic strength and flow velocity effecton the NOM filtration with TiO2/ZrO2 membranes, Sep. Purif. Technol. 52 (2006)325–331.
36] K.L. Jones, C.R. O’Melia, Ultrafiltration of protein and humic substances: effectof solution chemistry on fouling and flux decline, J. Membr. Sci. 193 (2001)163–173.
37] C.Y. Chang, Y.H. Hsu, Y.M. Lin, P.Y. Hu, C.C. Liu, K.H. Wang, The organic precur-sors affecting the formation of disinfection by products with chlorine dioxide,Chemosphere 44 (5) (2001) 1153–1158.

2 Purific
[
[
10 A.W. Zularisam et al. / Separation and
38] A.W. Zularisam, A.F. Ismail, M.R. Salim, Mimi Sakinah., H. Ozaki, The effects ofnatural organic matter (NOM) on fouling characteristics and flux recovery ofultrafiltration membranes, Desalination 212 (2007) 191–208.
39] M.R. Collins, G.L. Amy, C. Steelink, Molecular weight distribution, carboxylicacidity, and humic substances content of aquatic organic matter: implicationsfor removal during water treatment, Environ. Sci. Technol. 20 (1986) 1028–1032.
[
[
ation Technology 65 (2009) 193–210
40] J. Altmann, S. Ripperger, Particle deposition and layer formation at crossflowmicrofiltration, J. Membr. Sci. 124 (1997) 119–128.
41] M.R. Wiesner, P. Aptel, Mass transport and permeate flux and fouling in pressuredriven process AWWA, in: Water treatment: Membrane processes, McGraw-Hill, New York, 1996.