
Application of a fuzzy based decision making methodology to construction project risk assessment
12
Application of a fuzzy based decision making methodology to construction project risk assessment Jiahao Zeng a , Min An a, * , Nigel John Smith b a Department of Civil Engineering, School of Engineering, The University of Birmingham, Edgbaston, Birmingham B15 2TT, UK b School of Civil Engineering, The University of Leeds, Leeds LS2 9JT, UK Received 13 June 2006; received in revised form 14 November 2006; accepted 22 February 2007 Abstract The increasing complexity and dynamics of construction projects have plagued the construction industry with substantial hazards and losses. Project risk management, therefore, has been recognised critical for the construction industry to improve their performance and secure the success of projects. Risk magnitude may be assessed by considering two parameters: risk likelihood and risk severity. However, there are many possible risk factors in construction, which lead to a project failure and these risk factors should be incorporated into the evaluation process. Factor index is therefore introduced to structure and evaluate these factors and integrate them into the decision mak- ing process of risk assessment. This article presents a risk assessment methodology to cope with risks in complicated construction situ- ations. The application of fuzzy reasoning techniques provides an effective tool to handle the uncertainties and subjectivities arising in the construction process. A modified analytical hierarchy process is used to structure and prioritize diverse risk factors. Finally, an illustra- tive example on risk analysis of steel erection of the superstructure in a shopping centre is used to demonstrate the proposed method- ology. The results indicate that by using the proposed methodology the risks associated with steel erection can be assessed effectively and efficiently. Ó 2007 Elsevier Ltd and IPMA. All rights reserved. Keywords: Analytic hierarchy process; Decision making; Factor index; Fuzzy reasoning approach; Risk assessment 1. Introduction The construction industry, perhaps more than others, has been plagued by various risks often resulting in poor performance with increasing costs and time delay, even project failure [1]. The nature of construction has made it a challenging regime to handle risks, e.g. constant change on building environment, direct exposure to haz- ardous sources, high pressure on demanding schedules and costs, and increasing complexity on construction techniques [2]. Construction risk analysis, especially at the early stages of the project, is intricate because the nat- ure of risk is usually affected by numerous factors includ- ing human error and the data and information available. In many circumstances, it may be extremely difficult to assess the risks associated with a project due to the great uncertainty involved. Many risk assessment techniques currently used in the UK construction industry are com- paratively mature, such as Fault Tree Analysis, Event Tree Analysis, Monte Carlo Analysis, Scenario Planning, Sensitivity Analysis, Failure Mode and Effects Analysis, Programme Evaluation and Review Technique. Neverthe- less, for effective applications of these sophisticated quan- titative techniques, high quality data are a prerequisite [3]. Regrettably, such data are hard to obtain or even have not existed in the construction industry. Moreover, 0263-7863/$30.00 Ó 2007 Elsevier Ltd and IPMA. All rights reserved. doi:10.1016/j.ijproman.2007.02.006 Abbreviations: AHP, Analytic hierarchy process; G, Good; CF, Con- tribution factor; VG, Very good; FI, Factor index; VL, Very; MF, Membership function; L, Low; RL, Risk likelihood; M, Medium; RM, Risk magnitude; H, High; RS, Risk severity; VH, Very high; STFN, Standardised trapezoidal fuzzy number; N, Negligible; VP, Very poor; Mi, Minor; P, Poor; Ma, Major; F, Fair; C, critical. * Corresponding author. Tel.: +44 121 4145146; fax: +44 121 4143675. E-mail address: [email protected] (M. An). www.elsevier.com/locate/ijproman International Journal of Project Management 25 (2007) 589–600 INTERNATIONAL JOURNAL OF PROJECT MANAGEMENT
Transcript of Application of a fuzzy based decision making methodology to construction project risk assessment
INTERNATIONAL JOURNAL OF
www.elsevier.com/locate/ijproman
International Journal of Project Management 25 (2007) 589–600
PROJECTMANAGEMENT
Application of a fuzzy based decision making methodologyto construction project risk assessment
Jiahao Zeng a, Min An a,*, Nigel John Smith b
a Department of Civil Engineering, School of Engineering, The University of Birmingham, Edgbaston, Birmingham B15 2TT, UKb School of Civil Engineering, The University of Leeds, Leeds LS2 9JT, UK
Received 13 June 2006; received in revised form 14 November 2006; accepted 22 February 2007
Abstract
The increasing complexity and dynamics of construction projects have plagued the construction industry with substantial hazards andlosses. Project risk management, therefore, has been recognised critical for the construction industry to improve their performance andsecure the success of projects. Risk magnitude may be assessed by considering two parameters: risk likelihood and risk severity. However,there are many possible risk factors in construction, which lead to a project failure and these risk factors should be incorporated into theevaluation process. Factor index is therefore introduced to structure and evaluate these factors and integrate them into the decision mak-ing process of risk assessment. This article presents a risk assessment methodology to cope with risks in complicated construction situ-ations. The application of fuzzy reasoning techniques provides an effective tool to handle the uncertainties and subjectivities arising in theconstruction process. A modified analytical hierarchy process is used to structure and prioritize diverse risk factors. Finally, an illustra-tive example on risk analysis of steel erection of the superstructure in a shopping centre is used to demonstrate the proposed method-ology. The results indicate that by using the proposed methodology the risks associated with steel erection can be assessed effectively andefficiently.� 2007 Elsevier Ltd and IPMA. All rights reserved.
Keywords: Analytic hierarchy process; Decision making; Factor index; Fuzzy reasoning approach; Risk assessment
1. Introduction
The construction industry, perhaps more than others,has been plagued by various risks often resulting in poorperformance with increasing costs and time delay, evenproject failure [1]. The nature of construction has madeit a challenging regime to handle risks, e.g. constantchange on building environment, direct exposure to haz-ardous sources, high pressure on demanding schedules
0263-7863/$30.00 � 2007 Elsevier Ltd and IPMA. All rights reserved.
doi:10.1016/j.ijproman.2007.02.006
Abbreviations: AHP, Analytic hierarchy process; G, Good; CF, Con-tribution factor; VG, Very good; FI, Factor index; VL, Very; MF,Membership function; L, Low; RL, Risk likelihood; M, Medium; RM,Risk magnitude; H, High; RS, Risk severity; VH, Very high; STFN,Standardised trapezoidal fuzzy number; N, Negligible; VP, Very poor; Mi,Minor; P, Poor; Ma, Major; F, Fair; C, critical.
* Corresponding author. Tel.: +44 121 4145146; fax: +44 121 4143675.E-mail address: [email protected] (M. An).
and costs, and increasing complexity on constructiontechniques [2]. Construction risk analysis, especially atthe early stages of the project, is intricate because the nat-ure of risk is usually affected by numerous factors includ-ing human error and the data and information available.In many circumstances, it may be extremely difficult toassess the risks associated with a project due to the greatuncertainty involved. Many risk assessment techniquescurrently used in the UK construction industry are com-paratively mature, such as Fault Tree Analysis, EventTree Analysis, Monte Carlo Analysis, Scenario Planning,Sensitivity Analysis, Failure Mode and Effects Analysis,Programme Evaluation and Review Technique. Neverthe-less, for effective applications of these sophisticated quan-titative techniques, high quality data are a prerequisite[3]. Regrettably, such data are hard to obtain or evenhave not existed in the construction industry. Moreover,
590 J. Zeng et al. / International Journal of Project Management 25 (2007) 589–600
they are difficult to address the uncertainties and subjec-tivities associated with construction activities. It is there-fore essential to develop new risk analysis methods toidentify and assess construction risks in an acceptableway where any risk information produced is processedand reliably applied to decision making in the projectmanagement.
Risk magnitude (RM) can usually be assessed by con-sidering two fundamental risk parameters, risk likelihood(RL) and risk severity (RS) [4]. However, it should benoted that the magnitude of a particular risk is alsohighly dependant on many involved factors, e.g. humanfactors, workplace factors, material factors and equip-ment factors etc., which are difficult to quantify and ade-quately measure in a traditional way [5]. However, thesefactors should be taken into consideration in the projectrisk assessment process so that a reliable result can beobtained. In order to assess the risks associated withthe construction projects efficiently and effectively, anew risk parameter, factor index (FI) is proposed. TheFI indicates the nature of the inherent construction envi-ronment of a particular risk upon the investigation ondiverse involved factors, which includes the identificationof influential factors, the creation of FI hierarchy, themeasurement of factors, the prioritisation of factors andthe computation of FI.
Influential factors can be decomposed by brainstormingor checklist techniques, scored by fuzzy reasoning member-ship functions and weighed by analytic hierarchy process(AHP). The AHP is a popular decision making techniquethat has proven easy to understand and plausible for prior-itizing alternatives among multi-criteria and multi-attri-butes [6–11]. The use of AHP need not involvetroublesome mathematics but decomposition, pair-wisecomparison and priority vector creation. However, onedrawback of the current AHP method is that it can onlydeal with definite scales in reality. Construction problemsare complicated usually involving massive uncertaintiesand subjectivities. Therefore, a modified AHP method isproposed to create favourable property on its applicationsfor construction risk analysis.
The principles and algorithm of a new risk assessmentmethod are presented in this paper. The application offuzzy reasoning techniques provides a systematic tool todeal with qualitative and quantitative data and informationarising in the construction process. FI together with RLand RS is integrated into the fuzzy inference system toderive the RMs of the risks. An illustrative example on riskanalysis of steel erection of the superstructure in a shop-ping centre is used to demonstrate the proposed method.The results of the risk assessment in the case study are rep-resented as risk score, located in a defined range, and riskcategory with linguistic words associated with a belief ofpercentage, which indicates that by using the proposedmethodology the risks associated with steel erection canbe assessed effectively and efficiently.
2. New risk assessment model
A risk analysis should cover all aspects of risks in theconstruction process in question and specify how the risksinvolved are to be minimised. Therefore, it should includesufficient particulars to demonstrate that hazards with thepotential to cause the project failure can be identified andevaluated, and appropriate measures have been taken toreduce risks to As Low As Reasonably Practicably(ALARP) [1,2].
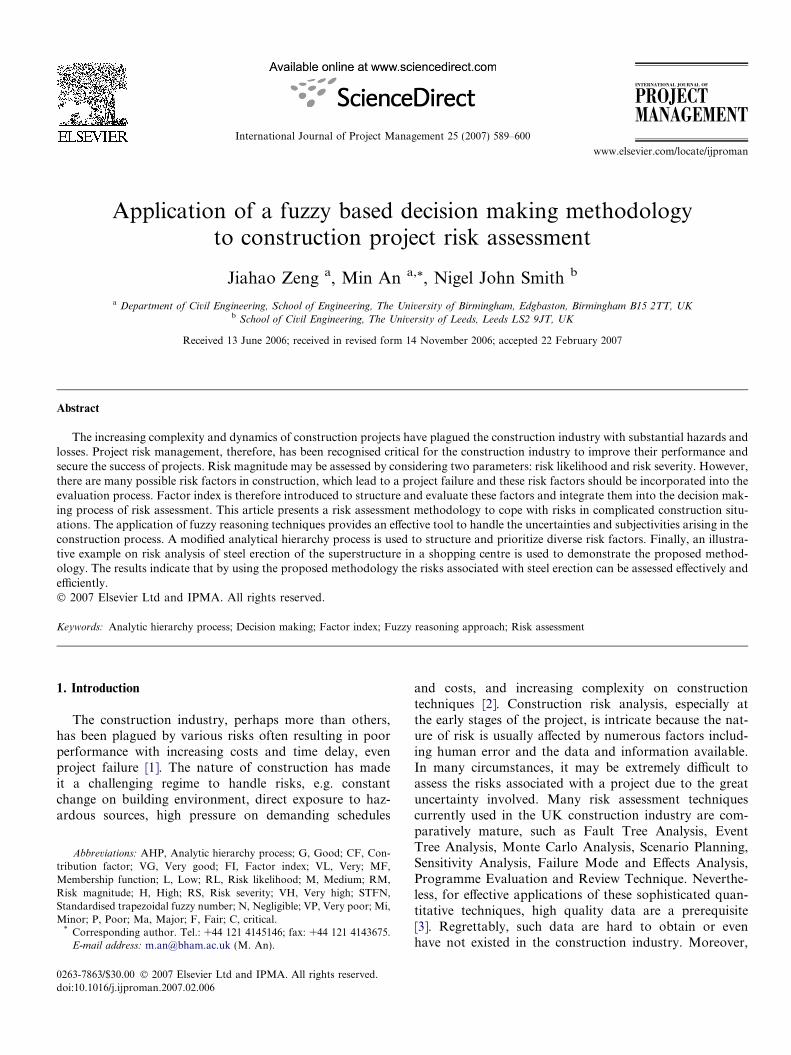
A typical risk assessment framework consists of fourstages: risk identification, risk assessment, risk response,and risk monitor and review [3,12,13]. The nature of con-struction has imposed substantial uncertainties and subjec-tivities in the risk analysis process, which has hampered theapplicability of many risk assessment methods that arewidely used in the construction industry. Fuzzy reasoningtechniques have proven useful to handle ill-defined andcomplex problems arising in construction projects to reacha reliable decision [1,5,14]. A risk assessment model basedon fuzzy reasoning and AHP approach is proposed asshown in Fig. 1, where CF stands for contribution factorand STFN stands for standardised trapezoidal fuzzy num-ber which are described in Sections 2.1 and 2.2, respec-tively. The algorithm of the risk model consists of fivephases: preliminary phase, measurement of FI phase, mea-surement of RL and RS phase, fuzzy inference phase andoutput modification phase. The details are described inthe following sections.
2.1. Preliminary phase
As risk data and information related to a particular con-struction project are massive, risk assessment starts withthe establishment of a risk assessment group in whichinvolves a range of experts with different background/disci-pline and essential experience regarding the constructionactivity under consideration, e.g. project manager, site con-struction manager, site engineers etc. The risk assessmentgroup undertakes the review of risk data and information,and determination of risk criteria.
2.1.1. Review risk data and determine risk criteria
The members in risk assessment group are required toreview all information related to the risks under consider-ation. A further investigation is also needed to clarify someideas and eliminate some doubts.
Risk criteria have to be discussed and agreed by groupmembers, which define the standards of risk parameters,i.e. RL, RS, FI and RM. For example, the context of high
of RL, the circumstances in which RM is intolerable. Thesecriteria provide a basis of measurement of the input riskparameters and the output RM.
2.1.2. Determine fuzzy MFs
Fuzzy membership functions (MFs) usually stem fromexperimental data, perception of the linguistic terms and
Construct FI hierarchy
Convertpreferences into
STFNsAggregate STFNs
Fuzzy inference Defuzzification
Risk magnitude
Determine fuzzy membership function
Output modification phase
Review risk data and determine risk criteria
Measurement of RL and RS
phase
Fuzzyinference
phase
Allocate CFs toexperts
Analyse experts’ backgrounds
Convert STFNs into fuzzy sets
Preliminary phase
Measure RL and RS
Defuzzify STFN scalesCompare factors pair-wise
Measure factors in the FI hierarchy
Measurement of FI phase
Convert preferences into STFNs Aggregate STFNs
Calculate FI
Establish a risk assessment group
Fig. 1. A fuzzy reasoning risk assessment model.
0 1 2 3 4 5 6 7 8 9 10
1.0
0.5
Score, FI, RL, RS
VP P F G VG)(xμ Score System & FIVL L M H VH RL, RS
0.8926
0.5586
0.37600.1599
F
Fig. 2. MFs of the score system, FI, RL and RS.
Fig. 3. MFs of RM.
J. Zeng et al. / International Journal of Project Management 25 (2007) 589–600 591
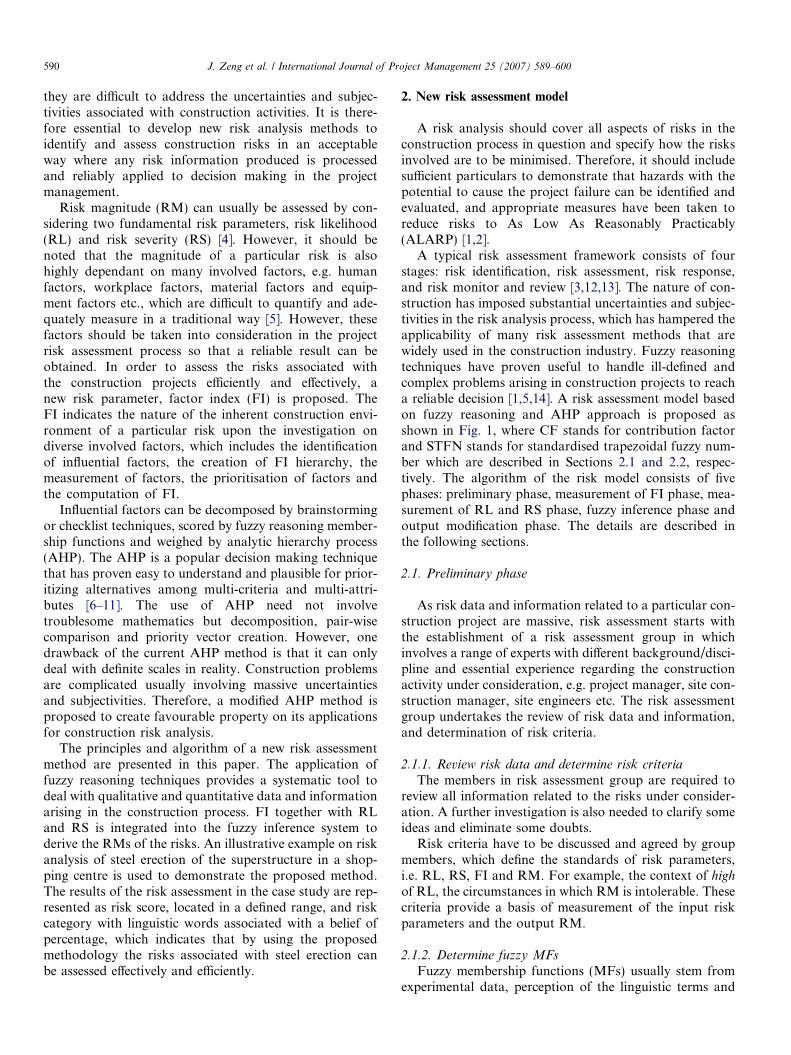
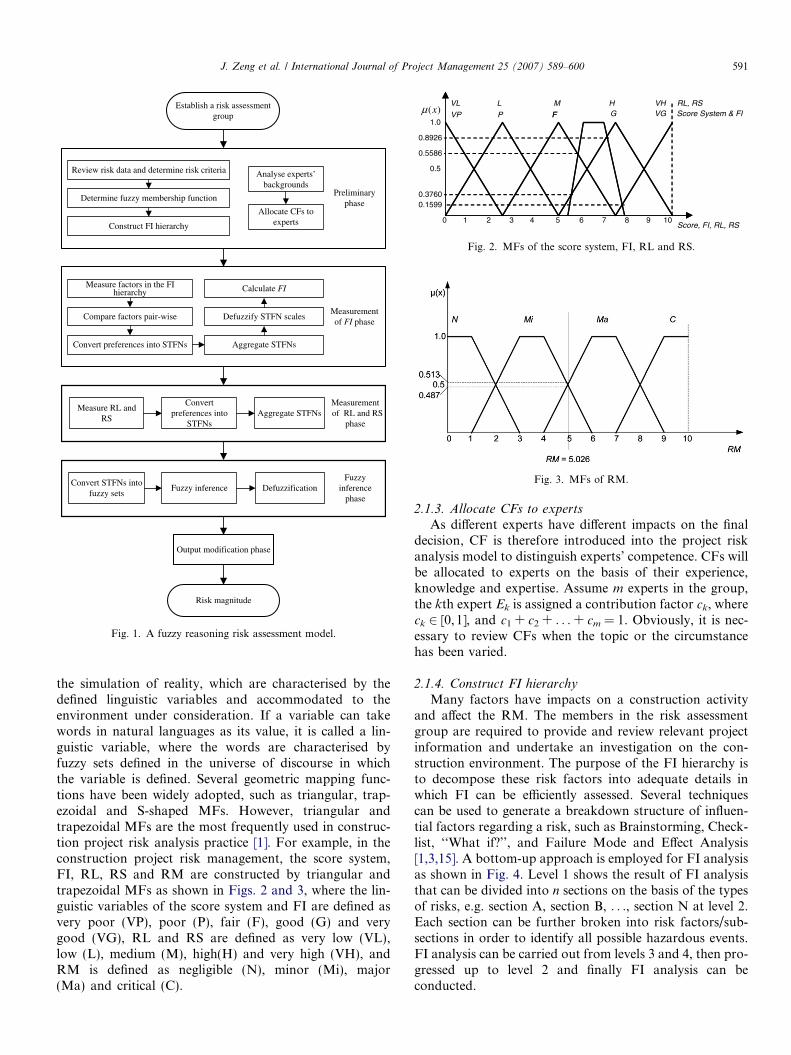
the simulation of reality, which are characterised by thedefined linguistic variables and accommodated to theenvironment under consideration. If a variable can takewords in natural languages as its value, it is called a lin-guistic variable, where the words are characterised byfuzzy sets defined in the universe of discourse in whichthe variable is defined. Several geometric mapping func-tions have been widely adopted, such as triangular, trap-ezoidal and S-shaped MFs. However, triangular andtrapezoidal MFs are the most frequently used in construc-tion project risk analysis practice [1]. For example, in theconstruction project risk management, the score system,FI, RL, RS and RM are constructed by triangular andtrapezoidal MFs as shown in Figs. 2 and 3, where the lin-guistic variables of the score system and FI are defined asvery poor (VP), poor (P), fair (F), good (G) and verygood (VG), RL and RS are defined as very low (VL),low (L), medium (M), high(H) and very high (VH), andRM is defined as negligible (N), minor (Mi), major(Ma) and critical (C).
2.1.3. Allocate CFs to expertsAs different experts have different impacts on the final
decision, CF is therefore introduced into the project riskanalysis model to distinguish experts’ competence. CFs willbe allocated to experts on the basis of their experience,knowledge and expertise. Assume m experts in the group,the kth expert Ek is assigned a contribution factor ck, whereck 2 [0, 1], and c1 + c2 + . . . + cm = 1. Obviously, it is nec-essary to review CFs when the topic or the circumstancehas been varied.
2.1.4. Construct FI hierarchy
Many factors have impacts on a construction activityand affect the RM. The members in the risk assessmentgroup are required to provide and review relevant projectinformation and undertake an investigation on the con-struction environment. The purpose of the FI hierarchy isto decompose these risk factors into adequate details inwhich FI can be efficiently assessed. Several techniquescan be used to generate a breakdown structure of influen-tial factors regarding a risk, such as Brainstorming, Check-list, ‘‘What if?’’, and Failure Mode and Effect Analysis[1,3,15]. A bottom-up approach is employed for FI analysisas shown in Fig. 4. Level 1 shows the result of FI analysisthat can be divided into n sections on the basis of the typesof risks, e.g. section A, section B, . . ., section N at level 2.Each section can be further broken into risk factors/sub-sections in order to identify all possible hazardous events.FI analysis can be carried out from levels 3 and 4, then pro-gressed up to level 2 and finally FI analysis can beconducted.
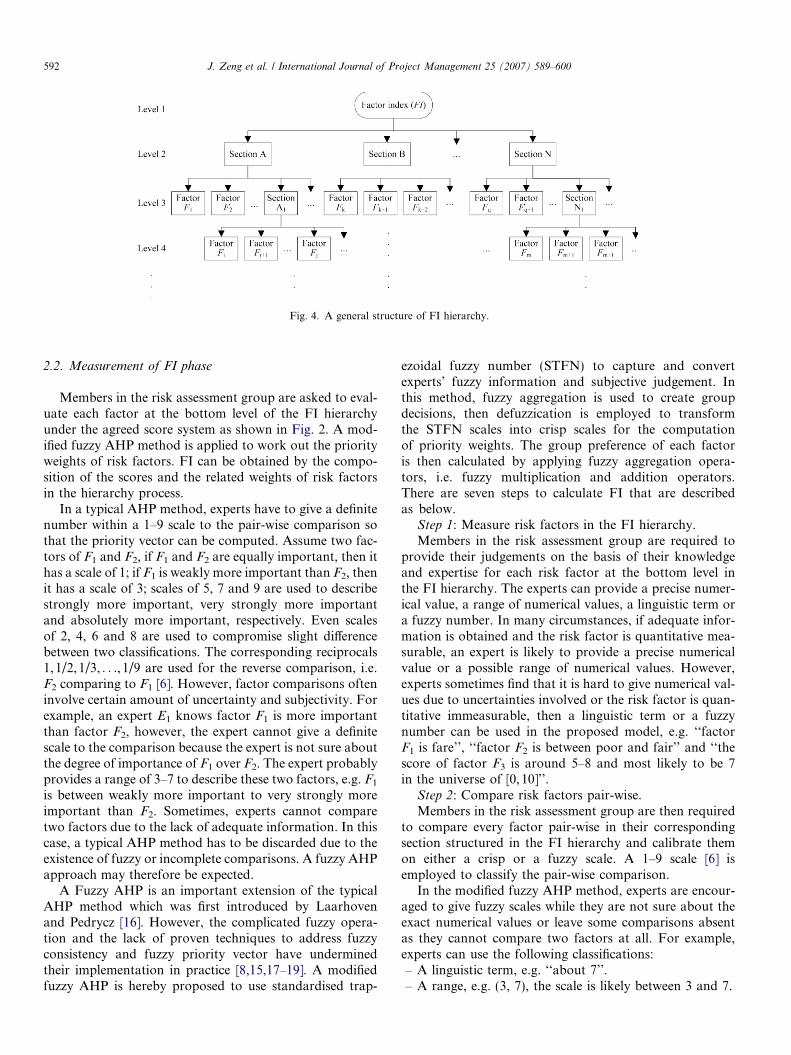
Fig. 4. A general structure of FI hierarchy.
592 J. Zeng et al. / International Journal of Project Management 25 (2007) 589–600
2.2. Measurement of FI phase
Members in the risk assessment group are asked to eval-uate each factor at the bottom level of the FI hierarchyunder the agreed score system as shown in Fig. 2. A mod-ified fuzzy AHP method is applied to work out the priorityweights of risk factors. FI can be obtained by the compo-sition of the scores and the related weights of risk factorsin the hierarchy process.
In a typical AHP method, experts have to give a definitenumber within a 1–9 scale to the pair-wise comparison sothat the priority vector can be computed. Assume two fac-tors of F1 and F2, if F1 and F2 are equally important, then ithas a scale of 1; if F1 is weakly more important than F2, thenit has a scale of 3; scales of 5, 7 and 9 are used to describestrongly more important, very strongly more importantand absolutely more important, respectively. Even scalesof 2, 4, 6 and 8 are used to compromise slight differencebetween two classifications. The corresponding reciprocals1,1/2,1/3, . . ., 1/9 are used for the reverse comparison, i.e.F2 comparing to F1 [6]. However, factor comparisons ofteninvolve certain amount of uncertainty and subjectivity. Forexample, an expert E1 knows factor F1 is more importantthan factor F2, however, the expert cannot give a definitescale to the comparison because the expert is not sure aboutthe degree of importance of F1 over F2. The expert probablyprovides a range of 3–7 to describe these two factors, e.g. F1
is between weakly more important to very strongly moreimportant than F2. Sometimes, experts cannot comparetwo factors due to the lack of adequate information. In thiscase, a typical AHP method has to be discarded due to theexistence of fuzzy or incomplete comparisons. A fuzzy AHPapproach may therefore be expected.
A Fuzzy AHP is an important extension of the typicalAHP method which was first introduced by Laarhovenand Pedrycz [16]. However, the complicated fuzzy opera-tion and the lack of proven techniques to address fuzzyconsistency and fuzzy priority vector have underminedtheir implementation in practice [8,15,17–19]. A modifiedfuzzy AHP is hereby proposed to use standardised trap-
ezoidal fuzzy number (STFN) to capture and convertexperts’ fuzzy information and subjective judgement. Inthis method, fuzzy aggregation is used to create groupdecisions, then defuzzication is employed to transformthe STFN scales into crisp scales for the computationof priority weights. The group preference of each factoris then calculated by applying fuzzy aggregation opera-tors, i.e. fuzzy multiplication and addition operators.There are seven steps to calculate FI that are describedas below.
Step 1: Measure risk factors in the FI hierarchy.Members in the risk assessment group are required to
provide their judgements on the basis of their knowledgeand expertise for each risk factor at the bottom level inthe FI hierarchy. The experts can provide a precise numer-ical value, a range of numerical values, a linguistic term ora fuzzy number. In many circumstances, if adequate infor-mation is obtained and the risk factor is quantitative mea-surable, an expert is likely to provide a precise numericalvalue or a possible range of numerical values. However,experts sometimes find that it is hard to give numerical val-ues due to uncertainties involved or the risk factor is quan-titative immeasurable, then a linguistic term or a fuzzynumber can be used in the proposed model, e.g. ‘‘factorF1 is fare’’, ‘‘factor F2 is between poor and fair’’ and ‘‘thescore of factor F3 is around 5–8 and most likely to be 7in the universe of [0,10]’’.
Step 2: Compare risk factors pair-wise.Members in the risk assessment group are then required
to compare every factor pair-wise in their correspondingsection structured in the FI hierarchy and calibrate themon either a crisp or a fuzzy scale. A 1–9 scale [6] isemployed to classify the pair-wise comparison.
In the modified fuzzy AHP method, experts are encour-aged to give fuzzy scales while they are not sure about theexact numerical values or leave some comparisons absentas they cannot compare two factors at all. For example,experts can use the following classifications:– A linguistic term, e.g. ‘‘about 7’’.– A range, e.g. (3, 7), the scale is likely between 3 and 7.
J. Zeng et al. / International Journal of Project Management 25 (2007) 589–600 593
– A fuzzy number, e.g. (3, 6, 8), the scale is between 3 and8, most likely 6 or (3, 5, 7, 8), the scale is between 3 and8, most likely between 5 and 7.
– 0, e.g. the expert cannot compare the two factors at all.Step 3: Convert preferences into the STFN.As described in steps 1 and 2, because the values of
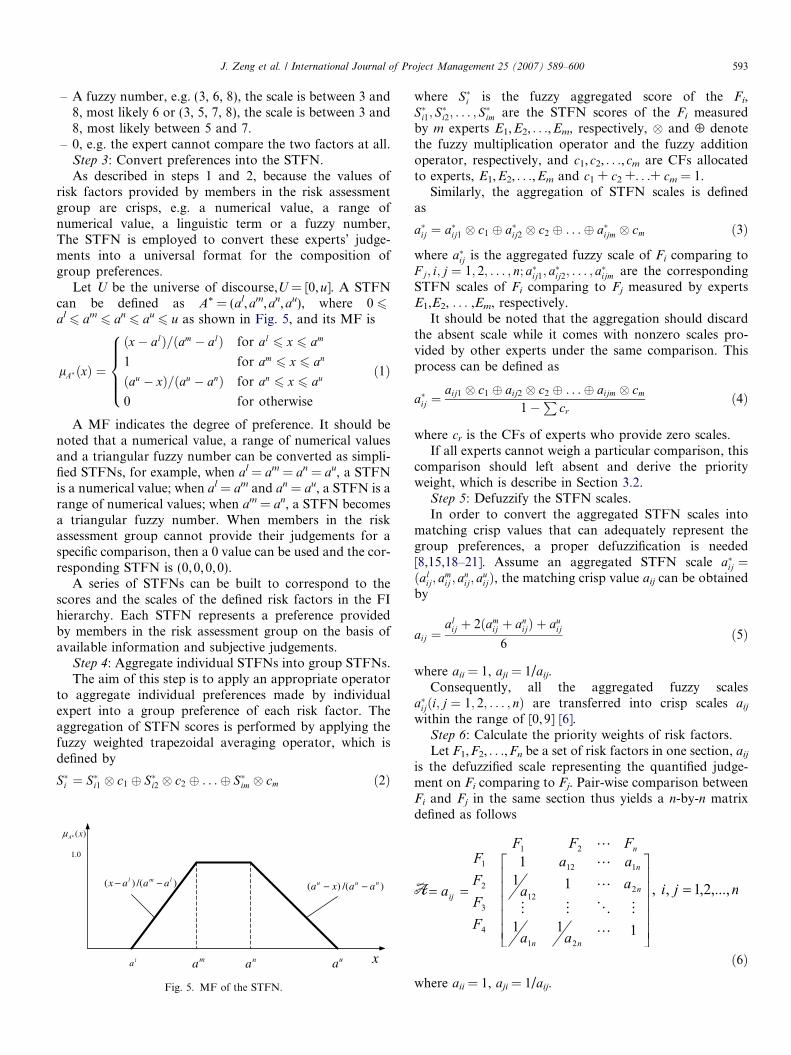
risk factors provided by members in the risk assessmentgroup are crisps, e.g. a numerical value, a range ofnumerical value, a linguistic term or a fuzzy number,The STFN is employed to convert these experts’ judge-ments into a universal format for the composition ofgroup preferences.
Let U be the universe of discourse,U = [0,u]. A STFNcan be defined as A* = (al,am,an,au), where 0 6al6 am
6 an6 au
6 u as shown in Fig. 5, and its MF is
lA� ðxÞ ¼
ðx� alÞ=ðam � alÞ for al6 x 6 am
1 for am6 x 6 an
ðau � xÞ=ðau � anÞ for an6 x 6 au
0 for otherwise
8>>><>>>:
ð1Þ
A MF indicates the degree of preference. It should benoted that a numerical value, a range of numerical valuesand a triangular fuzzy number can be converted as simpli-fied STFNs, for example, when al = am = an = au, a STFNis a numerical value; when al = am and an = au, a STFN is arange of numerical values; when am = an, a STFN becomesa triangular fuzzy number. When members in the riskassessment group cannot provide their judgements for aspecific comparison, then a 0 value can be used and the cor-responding STFN is (0,0,0,0).
A series of STFNs can be built to correspond to thescores and the scales of the defined risk factors in the FIhierarchy. Each STFN represents a preference providedby members in the risk assessment group on the basis ofavailable information and subjective judgements.
Step 4: Aggregate individual STFNs into group STFNs.The aim of this step is to apply an appropriate operator
to aggregate individual preferences made by individualexpert into a group preference of each risk factor. Theaggregation of STFN scores is performed by applying thefuzzy weighted trapezoidal averaging operator, which isdefined by
S�i ¼ S�i1 � c1 � S�i2 � c2 � . . .� S�im � cm ð2Þ
la ma na ua
)/()( lml aaax −− )/()( nuu aaxa −−
x
)(* xAμ
1.0
Fig. 5. MF of the STFN.
where S�i is the fuzzy aggregated score of the Fi,S�i1; S
�i2; . . . ; S�im are the STFN scores of the Fi measured
by m experts E1,E2, . . .,Em, respectively, � and ¯ denotethe fuzzy multiplication operator and the fuzzy additionoperator, respectively, and c1,c2, . . .,cm are CFs allocatedto experts, E1,E2, . . .,Em and c1 + c2 +. . .+ cm = 1.
Similarly, the aggregation of STFN scales is definedas
a�ij ¼ a�ij1 � c1 � a�ij2 � c2 � . . .� a�ijm � cm ð3Þ
where a�ij is the aggregated fuzzy scale of Fi comparing toF j; i; j ¼ 1; 2; . . . ; n; a�ij1; a
�ij2; . . . ; a�ijm are the corresponding
STFN scales of Fi comparing to Fj measured by expertsE1,E2, . . . ,Em, respectively.
It should be noted that the aggregation should discardthe absent scale while it comes with nonzero scales pro-vided by other experts under the same comparison. Thisprocess can be defined as
a�ij ¼aij1 � c1 � aij2 � c2 � . . .� aijm � cm
1�P
crð4Þ
where cr is the CFs of experts who provide zero scales.If all experts cannot weigh a particular comparison, this
comparison should left absent and derive the priorityweight, which is describe in Section 3.2.
Step 5: Defuzzify the STFN scales.In order to convert the aggregated STFN scales into
matching crisp values that can adequately represent thegroup preferences, a proper defuzzification is needed[8,15,18–21]. Assume an aggregated STFN scale a�ij ¼ðal
ij; amij ; a
nij; a
uijÞ, the matching crisp value aij can be obtained
by
aij ¼al
ij þ 2ðamij þ an
ijÞ þ auij
6ð5Þ
where aii = 1, aji = 1/aij.Consequently, all the aggregated fuzzy scales
a�ijði; j ¼ 1; 2; . . . ; nÞ are transferred into crisp scales aij
within the range of [0,9] [6].Step 6: Calculate the priority weights of risk factors.Let F1,F2, . . .,Fn be a set of risk factors in one section, aij
is the defuzzified scale representing the quantified judge-ment on Fi comparing to Fj. Pair-wise comparison betweenFi and Fj in the same section thus yields a n-by-n matrixdefined as follows
ð6Þwhere aii = 1, aji = 1/aij.
594 J. Zeng et al. / International Journal of Project Management 25 (2007) 589–600
The priority weights of factors in the matrix A can becalculated by using the arithmetic averaging method [6]
wi ¼1
n
Xn
j¼1
aijPnk¼1akj
i; j ¼ 1; 2; . . . ; n ð7Þ
where wi is the section weight of Fi. Assume Fi has t uppersections at different level in the FI hierarchy, and wðiÞsection isthe section weight of the ith upper section which con-tainsFi in the hierarchy, The final weight w0i of Fi can bederived by
w0i ¼ wi �Yt
i¼1
wðiÞsection ð8Þ
All individual upper section weights of wðiÞsection can alsobe derived by Eq. (7) to prioritize sections within the corre-sponding cluster in the FI hierarchy.
Step 7: Calculate FI.When the scores and the priority weights of risk factors
are obtained, the FI* can be calculated by
FI� ¼Xn
i¼1
S�i w0i i ¼ 1; 2; . . . ; n ð9Þ
where FI* is the fuzzy result of FI, represented by STFN;S�i is the fuzzy aggregated score of factor Fi calculated byEq. (2).
2.3. Measurement of RL and RS phase
The measurement of RL and RS is similar to the mea-surement of risk factors. RL and RS can be measured bymembers in the risk assessment group and convert individ-ual preferences into STFNs as defined in Eq. (1), and thenaggregate the STFNs into group preferences by using thefuzzy weighted trapezoidal averaging operator which aredefined as
RL� ¼ RL�1 � c1 �RL�2 � c2 . . .�RL�m � cm ð10Þand
RS� ¼ RS�1 � c1 �RS�2 � c2 . . .�RS�m � cm ð11Þwhere RL* and RS* is the fuzzy aggregated results of thegroup preference of RL and RS;RL�1;RL�2; . . . ;RL�m andRS�1;RS�2; . . . ;RS�m are the STFN evaluations of RL andRS measured by m experts E1,E2, . . .,Em, respectively; �and ¯ donate the fuzzy multiplication operator and thefuzzy addition operator, respectively. c1,c2, . . .,cm are CFsallocated to experts, E1,E2, . . .,Em and c1 + c2 + . . . +cm = 1.
2.4. Fuzzy inference phase
In the fuzzy inference phase, risk analysts convert theaggregated STFNs of FI, RL and RS into matching fuzzysets. These aggregated STFNs are then input to the fuzzyinference system to decide which rules are relevant to thecurrent situation, then calculate the fuzzy output of RM*.The procedures are described as below.
Step 1: Convert the STFNs into matching fuzzy sets.The aggregated measurement results of FI, RL and RS
are STFNs which are not always can be directly used ina fuzzy inference system, for example, the rules stored inthe rule base are constructed by linguistic terms andSTFNs are presented in numerical values. Therefore, it isnecessary to convert the STFNs into matching fuzzy sets.This can be done by taking the intersections between theSTFN and the MF of the corresponding risk parameter,which will be demonstrated in the illustrative case study.
Step 2: Fuzzy inference system.The fuzzy inference system provides an effective tool to
deal with imprecise and vague information associated withconstruction risks [5,14,22,23]. The knowledge base con-tains expert judgements and historical information. Rela-tions between input parameters FI*, RL*, RS* andoutput RM* are presented in a form of if-then rules. Con-sidering the kth rule has three parts in the premise
Rk : If FI� is lkFI� and RL� is lk
RL� and RS� is lkRS�
then RM� is lkRM� ð12Þ
where lkFI� , lk
RL� ; lkRS� , and lk
RM� denote MFs of FI*, RL*,RS*, and RM*, respectively; Rk, k = 1,2, . . .,K, is the kthrule in the rule base. The fuzzy inference system thus gen-erates a mapping between input parameters FI*, RL*, RS*
and output RM*. The three parts in the premise are con-nected with ‘‘and’’ and the firing strength lRk of fuzzy RuleRk can be obtained using fuzzy intersection (minimum)operation. The implication using fuzzy intersection (mini-mum) operation is given by
lRk ðv; yÞ ¼ lkFI� ðx1Þ ^ lk
RL� ðx2Þ ^ lkRS� ðx3Þ ^ lk
RM� ðyÞ;k ¼ 1; 2; . . . ;K ð13Þ
where x1 2 X1, x2 2 X2, x3 2 X3, v 2 X1 · X2 · X3 andy 2 U. X1, X2, X3 and U denote the universe of FI*, RL*,RS* and RM*, respectively. The firing strength is impli-cated with the value of the conclusion MF and the outputis a truncated fuzzy MF. The truncated fuzzy MFs thatrepresent the implication outputs of each rule are aggre-gated into a single fuzzy MF. The aggregation using fuzzyunion (maximum) operation is denoted by
lRðv; yÞ ¼ _Kk¼1Rkðv; yÞ ð14Þ
where lR(v,y) is the output fuzzy MF after aggregation.Given input RP* representing FI*, RL* and RS*, the out-put RM* is given by
RM� ¼ RP� � Rðv; yÞ ð15Þwhere symbol ‘‘�’’ denotes the compositional operation offuzzy sets.
Step 3: Defuzzification.As the output of the fuzzy inference system is a fuzzy set,
defuzzification is used to convert the fuzzy result into amatching numerical value that can adequately representRM*. The Centre-average method is employed for de-fuzzification. Assume the fuzzy output obtained from the
J. Zeng et al. / International Journal of Project Management 25 (2007) 589–600 595
fuzzy inference system is RM� ¼ fy; lRMðyÞ j y 2 U ;lRM 2 ½0; 1�g with q fuzzy term sets, the matching crispvalue RM can be calculated by [24]
RM ¼Xq
i¼1
Y ilRM� ðyiÞ !, Xq
i¼1
lRM� ðyiÞ !
;
i ¼ 1; 2; . . . ; q ð16Þ
where yi denotes the centre of the ith fuzzy term set ofRM*, and lRM(yi) denotes the MF of the ith fuzzy termset of RM*.
2.5. Output modification phase
The output modification is necessary in some situationsfor securing a reliable decision, for instance, the circum-stances of risks have been changed, the impact of some riskfactors have not been adequately measured. In this case,experts and risk analysts should gather more informationin relation to the risk, review the risk assessment processand modify the FI hierarchy, risk parameters or/and riskcriteria to reach a reliable decision. By using the proposedrisk assessment method, ill-defined or complex construc-tion risks can be adequately assessed and risk magnitudeis determined. The final result of risk assessment providesthe project management team with reliable data for riskrespond decision making.
3. A case study: risk assessment of steel erection
A case example of risk assessment on steel erection ispresented to demonstrate the application of the proposedrisk assessment methodology.
A project risk management team is formed to managerisks in the construction of a shopping centre. Accordingto the construction schedule, steel erection of the super-structure is identified as a critical event to meet the targetof duration. Therefore, the time overrun of steel erectionwork is identified as a major risk needed to be assessedfor securing the success of the project.
The risk assessment term has identified a number ofissues which can lead to the delay of the completion of steelerection work, such as adverse site conditions, inadequatesource of materials, incomplete design, ineffective workingschedule, unqualified workforces, etc. These issues havebeen proven to be difficult to measure due to the lack ofrisk data and uncertainties involved. As there are no ade-quate practical data and information to support a tradi-tional risk analysis, the proposed risk assessment methodhas been employed to assess the risk of completion of steelerection work.
3.1. Preliminary phase
3.1.1. Establishment of a risk assessment group
Five experts with high qualification regarding this sub-ject are selected to form a risk assessment group for under-
taking the risk assessment by using the proposed riskassessment methodology. CFs are assigned to experts onthe basis of their individual background and experienceas shown in Table 1.
3.1.2. Determination of risk criteria and fuzzy MFThree input parameters of FI, RL and RS are chosen for
assessing the RM of delay of completion of the steel erec-tion work. Five experts have agreed that five levels of lin-guistic terms to describe FI as very poor (VP), poor (P),fair (F), good (G) and very good (VG), the RL and RSare described by very low (VL), low (L), medium (M), high(H) and very high (VH), and the RM is classified into fourlevels negligible (N), minor (Mi), major (Ma) and critical(C). The definitions of FI, RL, RS and RM. FI are shownin Table 1. FI, RL and RS are defined by triangular MFs asshown in Fig. 2. Trapezoidal MFs are used to representRM as shown in Fig. 3.
3.1.3. Construction of FI hierarchy
On the basis of an investigation of the constructionenvironment, the risk assessment group constructs a FIhierarchy as shown in Fig. 6, which consists of four sec-tions, i.e. human factors, site factors, material factorsand equipment factors sections. Each section has a num-ber of major risk factors. For example, under the humanfactors section, there are four major risk factors will affectthe completion of steel erection work. They are ‘Attitudesand motivations’, ‘Training’, ‘Management’ and‘Communication’.
3.2. Measurement of FI phase
Each risk factor at the bottom level of the FI hierarchyis evaluated by members in the risk assessment group underthe defined terms and a score system as shown in Fig. 2.Experts can provide a precise numerical value, a possiblerange of numerical value, a linguistic term, or a fuzzy num-ber subject to their knowledge and the available informa-tion. Then these evaluations are converted into STFNs asdefined in Eq. (1). In this case study, Expert E1 and E4 pro-vided linguistic terms, E2 used precise numerical values, E3
used ranges while E5 provides fuzzy numbers as shown inTable 2.
The aggregations of FI scores can be calculated by Eq.(2), e.g. the aggregation of ‘Attitudes and motivations’under human factors section is calculated by
S�atti:&moti: ¼ ð5;7:5;7:5;10Þ� 0:23�ð7;7;7;7Þ� 0:23�ð5;5;8;8Þ� 0:20�ð6;7;7;8Þ� 0:18�ð5;7;7;9Þ� 0:16
¼ ð5:6400;6:7150;7:3150;8:3900Þ
Similarly, other aggregated scores of FIs can also beobtained as shown in Table 2.
The pair-wise comparisons of human factors section andthe corresponding STFNs are shown in Table 3. It shouldbe noted that aji = 1/aij. Table 3 only shows aij.
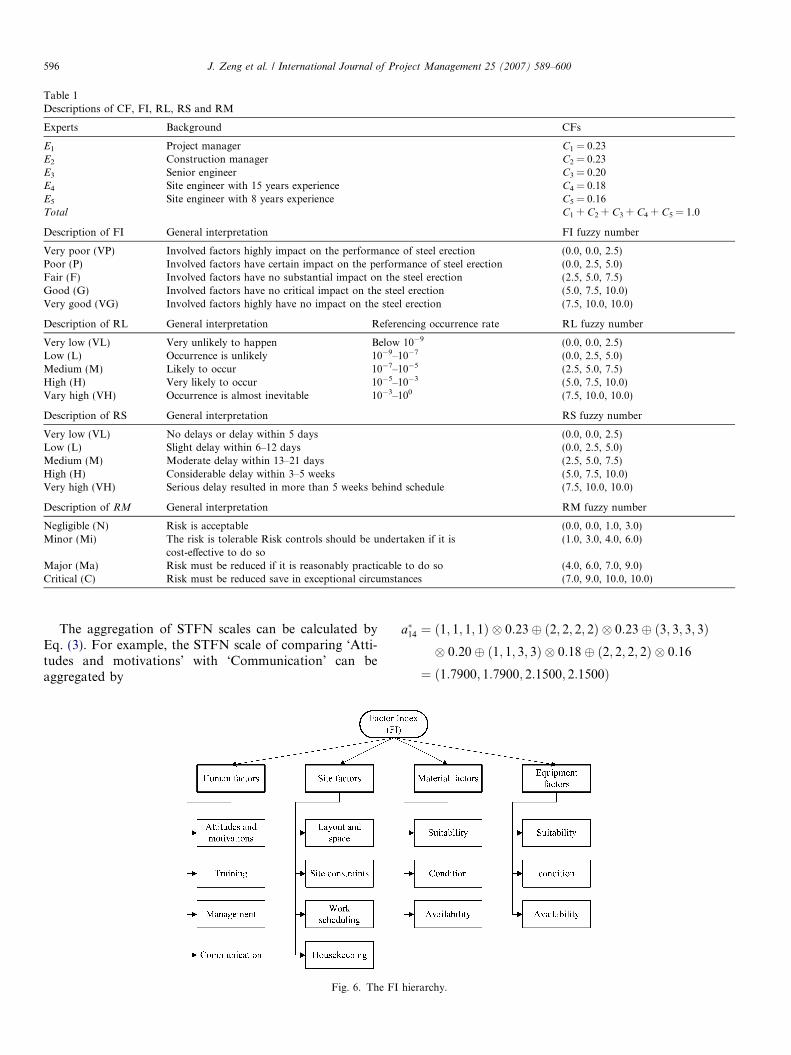
Table 1Descriptions of CF, FI, RL, RS and RM
Experts Background CFs
E1 Project manager C1 = 0.23E2 Construction manager C2 = 0.23E3 Senior engineer C3 = 0.20E4 Site engineer with 15 years experience C4 = 0.18E5 Site engineer with 8 years experience C5 = 0.16Total C1 + C2 + C3 + C4 + C5 = 1.0
Description of FI General interpretation FI fuzzy number
Very poor (VP) Involved factors highly impact on the performance of steel erection (0.0, 0.0, 2.5)Poor (P) Involved factors have certain impact on the performance of steel erection (0.0, 2.5, 5.0)Fair (F) Involved factors have no substantial impact on the steel erection (2.5, 5.0, 7.5)Good (G) Involved factors have no critical impact on the steel erection (5.0, 7.5, 10.0)Very good (VG) Involved factors highly have no impact on the steel erection (7.5, 10.0, 10.0)
Description of RL General interpretation Referencing occurrence rate RL fuzzy number
Very low (VL) Very unlikely to happen Below 10�9 (0.0, 0.0, 2.5)Low (L) Occurrence is unlikely 10�9–10�7 (0.0, 2.5, 5.0)Medium (M) Likely to occur 10�7–10�5 (2.5, 5.0, 7.5)High (H) Very likely to occur 10�5–10�3 (5.0, 7.5, 10.0)Vary high (VH) Occurrence is almost inevitable 10�3–100 (7.5, 10.0, 10.0)
Description of RS General interpretation RS fuzzy number
Very low (VL) No delays or delay within 5 days (0.0, 0.0, 2.5)Low (L) Slight delay within 6–12 days (0.0, 2.5, 5.0)Medium (M) Moderate delay within 13–21 days (2.5, 5.0, 7.5)High (H) Considerable delay within 3–5 weeks (5.0, 7.5, 10.0)Very high (VH) Serious delay resulted in more than 5 weeks behind schedule (7.5, 10.0, 10.0)
Description of RM General interpretation RM fuzzy number
Negligible (N) Risk is acceptable (0.0, 0.0, 1.0, 3.0)Minor (Mi) The risk is tolerable Risk controls should be undertaken if it is
cost-effective to do so(1.0, 3.0, 4.0, 6.0)
Major (Ma) Risk must be reduced if it is reasonably practicable to do so (4.0, 6.0, 7.0, 9.0)Critical (C) Risk must be reduced save in exceptional circumstances (7.0, 9.0, 10.0, 10.0)
596 J. Zeng et al. / International Journal of Project Management 25 (2007) 589–600
The aggregation of STFN scales can be calculated byEq. (3). For example, the STFN scale of comparing ‘Atti-tudes and motivations’ with ‘Communication’ can beaggregated by
Fig. 6. The FI
a�14 ¼ ð1; 1; 1; 1Þ � 0:23� ð2; 2; 2; 2Þ � 0:23� ð3; 3; 3; 3Þ� 0:20� ð1; 1; 3; 3Þ � 0:18� ð2; 2; 2; 2Þ � 0:16
¼ ð1:7900; 1:7900; 2:1500; 2:1500Þ
hierarchy.

Table 2Score and converted STFN of risk factors
Risk factor Evaluation Aggregated STFN
E1 (0.23) E2 (0.23) E3 (0.20) E4 (0.18) E5 (0.18)
Score ConvertedSTFN
Score ConvertedSTFN
Score ConvertedSTFN
Score ConvertedSTFN
Score ConvertedSTFN
Humanfactors
Attitudes andmotivations
Good (5,7.5,7.5,10) 7 (7,7,7,7) (5,8) (5,5,8,8) About7
(6,7,7,8) (5,7,9) (5,7,7,9) (5.6400,6.7150,7.3150,8.3900)
Training Good (5,7.5,7.5,10) 8 (8,8,8,8) (5,8) (5,5,8,8) 7 (7,7,7,7) (6,7,8) (6,7,7,8) (6.2100,6.9450,7.5450,8.2800)Management Good (5,7.5,7.5,10) 7 (7,7,7,7) (6,8) (6,6,8,8) (5,8) (5,5,8,8) (5,6,8) (5,6,6,8) (5.6600,6,3950,7.3350,8.2300)Communication Fair (2.5,5,5,7.5) 6 (6,6,6,6) (5,7) (5,5,7,7) About
5(4,5,5,6) (4,5,6,7) (4,5,6,7) (4.3150,5.2300,5.7900,6.7050)
Site factors Layout and space Fair (2.5,5,5,7.5) 6 (6,6,6,6) (4,6) (4,4,6,6) (5,7) (5,5,7,7) (4,6,7) (4,6,6,7) (4.2950,5.1900,5.9500,6.6850)Site constraints Fair (2.5,5,5,7.5) 5 (5,5,5,5) (3,6) (3,3,6,6) Fair (2.5,5,5,7.5) (4,5,7) (4,5,5,7) (3.4150,4.6000,5.2000,6.5450)Work scheduling Good (5,7.5,7.5,10) 7 (7,7,7,7) (6,7) (6,6,7,7) 8 (8,8,8,8) (5,7,8,9) (5,7,8,9) (6.2000,7.0950,7.4550,8.1900)Housekeeping Good (5,7.5,7.5,10) 7 (7,7,7,7) (5,8) (5,5,8,8) 8 (8,8,8,8) (6,7,8) (6,7,7,8) (6.1600,6.8950,7.4950,8.2300)
Materialfactors
Suitability Good (5,7.5,7.5,10) 7 (7,7,7,7) (6,8) (6,6,8,8) About7
(6,7,7,8) (5,7,9) (5,7,7,9) (5.8400,6.9150,7.3150,8.3900)
Condition Good (5,7.5,7.5,10) 6 (6,6,6,6) (7,8) (7,7,8,8) Good (5,7.5,7.5,10) (5,6,8) (5,6,6,8) (5.6300,6.8150,7.0150,8.3600)Availability Fair (2.5,5,5,7.5) 6 (6,6,6,6) (5,7) (5,5,7,7) (4,6) (4,4,6,6) (3,5,6) (3,5,5,6) (4.1550,5.0500,5.8100,6.5450)
Equipmentfactors
Suitability Good (5,7.5,7.5,10) 7 (7,7,7,7) (6,8) (6,6,8,8) About7
(6,7,7,8) (6,7,8) (6,7,7,8) (6.0000,6.9150,7.3150,8.2300)
Condition Good (5,7.5,7.5,10) 7 (7,7,7,7) (6,8) (6,6,8,8) 8 (8,8,8,8) (5,7,8) (5,7,7,8) (6.2000,7.0950,7.4950,8.2300)Availability Good (5,7.5,7.5,10) 8 (8,8,8,8) (6,9) (6,6,9,9) (6,8) (6,6,8,8) (6,8,9) (6,8,8,9) (6.2300,7.1250,8.0850,8.8200)
J.
Zen
get
al.
/In
terna
tiona
lJ
ou
rna
lo
fP
roject
Ma
na
gem
ent
25
(2
00
7)
58
9–
60
0597
598 J. Zeng et al. / International Journal of Project Management 25 (2007) 589–600
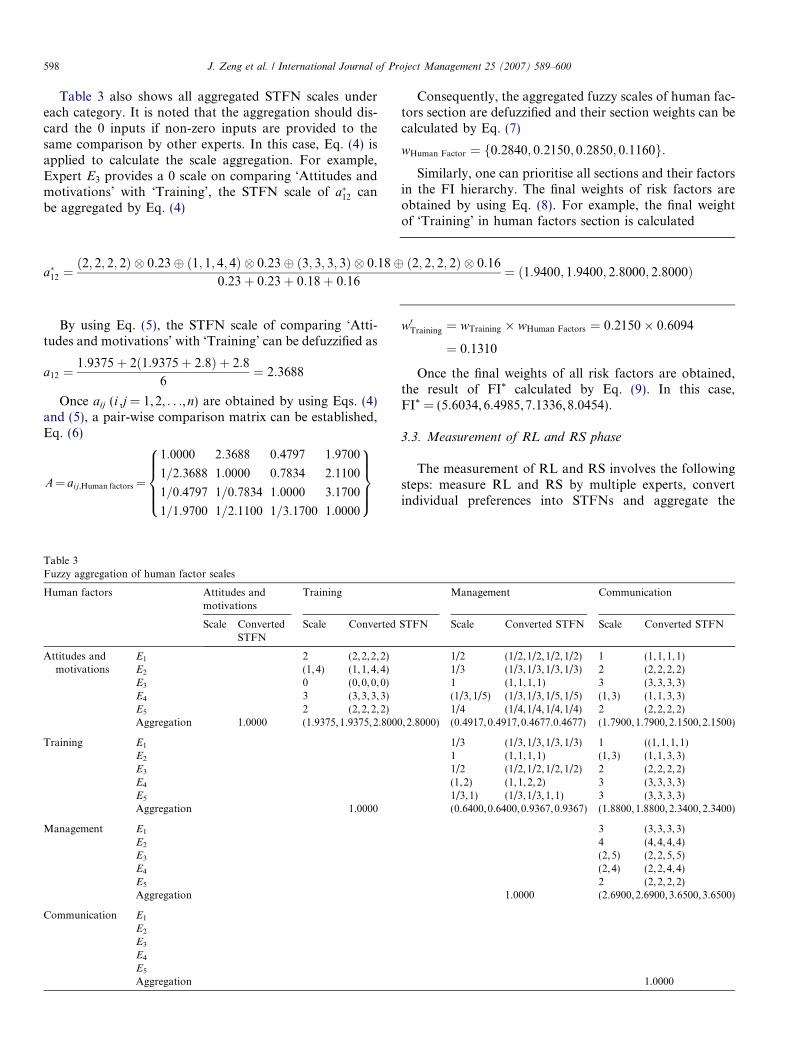
Table 3 also shows all aggregated STFN scales undereach category. It is noted that the aggregation should dis-card the 0 inputs if non-zero inputs are provided to thesame comparison by other experts. In this case, Eq. (4) isapplied to calculate the scale aggregation. For example,Expert E3 provides a 0 scale on comparing ‘Attitudes andmotivations’ with ‘Training’, the STFN scale of a�12 canbe aggregated by Eq. (4)
a�12 ¼ð2; 2; 2; 2Þ � 0:23� ð1; 1; 4; 4Þ � 0:23� ð3; 3; 3; 3Þ � 0:18� ð2; 2; 2; 2Þ � 0:16
0:23þ 0:23þ 0:18þ 0:16¼ ð1:9400; 1:9400; 2:8000; 2:8000Þ
By using Eq. (5), the STFN scale of comparing ‘Atti-tudes and motivations’ with ‘Training’ can be defuzzified as
a12 ¼1:9375þ 2ð1:9375þ 2:8Þ þ 2:8
6¼ 2:3688
Once aij (i ,j = 1,2, . . .,n) are obtained by using Eqs. (4)and (5), a pair-wise comparison matrix can be established,Eq. (6)
A¼ aij;Human factors¼
1:0000 2:3688 0:4797 1:9700
1=2:3688 1:0000 0:7834 2:1100
1=0:4797 1=0:7834 1:0000 3:1700
1=1:9700 1=2:1100 1=3:1700 1:0000
8>>><>>>:
9>>>=>>>;
Table 3Fuzzy aggregation of human factor scales
Human factors Attitudes andmotivations
Training
Scale ConvertedSTFN
Scale Converted
Attitudes andmotivations
E1 2 (2,2,2,2)E2 (1,4) (1,1,4,4)E3 0 (0,0,0,0)E4 3 (3,3,3,3)E5 2 (2,2,2,2)Aggregation 1.0000 (1.9375,1.9375,2.8000
Training E1
E2
E3
E4
E5
Aggregation 1.0000
Management E1
E2
E3
E4
E5
Aggregation
Communication E1
E2
E3
E4
E5
Aggregation
Consequently, the aggregated fuzzy scales of human fac-tors section are defuzzified and their section weights can becalculated by Eq. (7)
wHuman Factor ¼ f0:2840; 0:2150; 0:2850; 0:1160g:Similarly, one can prioritise all sections and their factors
in the FI hierarchy. The final weights of risk factors areobtained by using Eq. (8). For example, the final weightof ‘Training’ in human factors section is calculated
w0Training ¼ wTraining � wHuman Factors ¼ 0:2150� 0:6094
¼ 0:1310
Once the final weights of all risk factors are obtained,the result of FI* calculated by Eq. (9). In this case,FI* = (5.6034,6.4985,7.1336,8.0454).
3.3. Measurement of RL and RS phase
The measurement of RL and RS involves the followingsteps: measure RL and RS by multiple experts, convertindividual preferences into STFNs and aggregate the
Management Communication
STFN Scale Converted STFN Scale Converted STFN
1/2 (1/2,1/2,1/2,1/2) 1 (1,1,1,1)1/3 (1/3,1/3,1/3,1/3) 2 (2,2,2,2)1 (1,1,1,1) 3 (3,3,3,3)(1/3,1/5) (1/3,1/3,1/5,1/5) (1,3) (1,1,3,3)1/4 (1/4,1/4,1/4,1/4) 2 (2,2,2,2)
,2.8000) (0.4917,0.4917,0.4677.0.4677) (1.7900,1.7900,2.1500,2.1500)
1/3 (1/3,1/3,1/3,1/3) 1 ((1,1,1,1)1 (1,1,1,1) (1,3) (1,1,3,3)1/2 (1/2,1/2,1/2,1/2) 2 (2,2,2,2)(1,2) (1,1,2,2) 3 (3,3,3,3)1/3,1) (1/3,1/3,1,1) 3 (3,3,3,3)(0.6400,0.6400,0.9367,0.9367) (1.8800,1.8800,2.3400,2.3400)
3 (3,3,3,3)4 (4,4,4,4)(2,5) (2,2,5,5)(2,4) (2,2,4,4)2 (2,2,2,2)
1.0000 (2.6900,2.6900,3.6500,3.6500)
1.0000
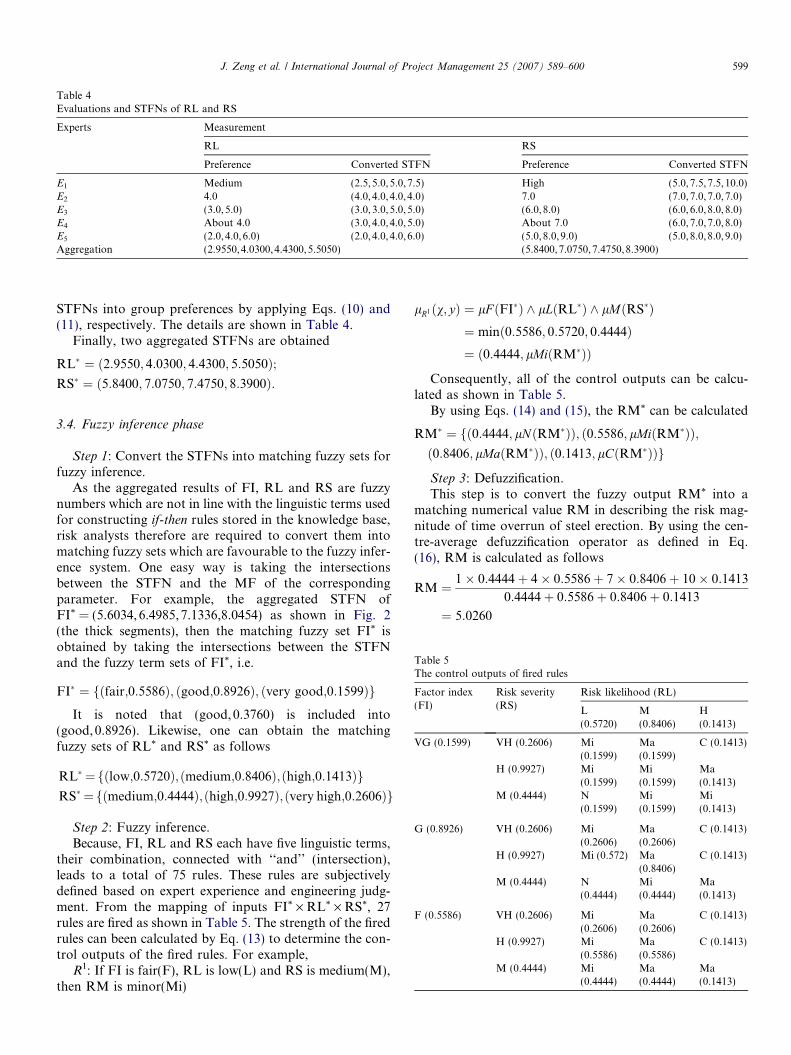
Table 4Evaluations and STFNs of RL and RS
Experts Measurement
RL RS
Preference Converted STFN Preference Converted STFN
E1 Medium (2.5,5.0,5.0,7.5) High (5.0,7.5,7.5,10.0)E2 4.0 (4.0,4.0,4.0,4.0) 7.0 (7.0,7.0,7.0,7.0)E3 (3.0,5.0) (3.0,3.0,5.0,5.0) (6.0,8.0) (6.0,6.0,8.0,8.0)E4 About 4.0 (3.0,4.0,4.0,5.0) About 7.0 (6.0,7.0,7.0,8.0)E5 (2.0,4.0,6.0) (2.0,4.0,4.0,6.0) (5.0,8.0,9.0) (5.0,8.0,8.0,9.0)Aggregation (2.9550,4.0300,4.4300,5.5050) (5.8400,7.0750,7.4750,8.3900)
J. Zeng et al. / International Journal of Project Management 25 (2007) 589–600 599
STFNs into group preferences by applying Eqs. (10) and(11), respectively. The details are shown in Table 4.
Finally, two aggregated STFNs are obtained
RL� ¼ ð2:9550; 4:0300; 4:4300; 5:5050Þ;RS� ¼ ð5:8400; 7:0750; 7:4750; 8:3900Þ:
Table 5The control outputs of fired rules
Factor index(FI)
Risk severity(RS)
Risk likelihood (RL)
L(0.5720)
M(0.8406)
H(0.1413)
VG (0.1599) VH (0.2606) Mi(0.1599)
Ma(0.1599)
C (0.1413)
H (0.9927) Mi(0.1599)
Mi(0.1599)
Ma(0.1413)
M (0.4444) N(0.1599)
Mi(0.1599)
Mi(0.1413)
G (0.8926) VH (0.2606) Mi(0.2606)
Ma(0.2606)
C (0.1413)
H (0.9927) Mi (0.572) Ma(0.8406)
C (0.1413)
M (0.4444) N(0.4444)
Mi(0.4444)
Ma(0.1413)
F (0.5586) VH (0.2606) Mi(0.2606)
Ma(0.2606)
C (0.1413)
H (0.9927) Mi(0.5586)
Ma(0.5586)
C (0.1413)
M (0.4444) Mi(0.4444)
Ma(0.4444)
Ma(0.1413)
3.4. Fuzzy inference phase
Step 1: Convert the STFNs into matching fuzzy sets forfuzzy inference.
As the aggregated results of FI, RL and RS are fuzzynumbers which are not in line with the linguistic terms usedfor constructing if-then rules stored in the knowledge base,risk analysts therefore are required to convert them intomatching fuzzy sets which are favourable to the fuzzy infer-ence system. One easy way is taking the intersectionsbetween the STFN and the MF of the correspondingparameter. For example, the aggregated STFN ofFI* = (5.6034, 6.4985,7.1336,8.0454) as shown in Fig. 2(the thick segments), then the matching fuzzy set FI* isobtained by taking the intersections between the STFNand the fuzzy term sets of FI*, i.e.
FI� ¼ fðfair;0:5586Þ; ðgood;0:8926Þ; ðvery good;0:1599ÞgIt is noted that (good, 0.3760) is included into
(good, 0.8926). Likewise, one can obtain the matchingfuzzy sets of RL* and RS* as follows
RL� ¼ fðlow;0:5720Þ;ðmedium;0:8406Þ;ðhigh;0:1413ÞgRS� ¼ fðmedium;0:4444Þ;ðhigh;0:9927Þ;ðvery high;0:2606Þg
Step 2: Fuzzy inference.Because, FI, RL and RS each have five linguistic terms,
their combination, connected with ‘‘and’’ (intersection),leads to a total of 75 rules. These rules are subjectivelydefined based on expert experience and engineering judg-ment. From the mapping of inputs FI* · RL* · RS*, 27rules are fired as shown in Table 5. The strength of the firedrules can been calculated by Eq. (13) to determine the con-trol outputs of the fired rules. For example,
R1: If FI is fair(F), RL is low(L) and RS is medium(M),then RM is minor(Mi)
lR1ðv; yÞ ¼ lF ðFI�Þ ^ lLðRL�Þ ^ lMðRS�Þ¼ minð0:5586; 0:5720; 0:4444Þ¼ ð0:4444; lMiðRM�ÞÞ
Consequently, all of the control outputs can be calcu-lated as shown in Table 5.
By using Eqs. (14) and (15), the RM* can be calculated
RM� ¼ fð0:4444; lNðRM�ÞÞ; ð0:5586; lMiðRM�ÞÞ;ð0:8406; lMaðRM�ÞÞ; ð0:1413; lCðRM�ÞÞg
Step 3: Defuzzification.This step is to convert the fuzzy output RM* into a
matching numerical value RM in describing the risk mag-nitude of time overrun of steel erection. By using the cen-tre-average defuzzification operator as defined in Eq.(16), RM is calculated as follows
RM ¼ 1� 0:4444þ 4� 0:5586þ 7� 0:8406þ 10� 0:1413
0:4444þ 0:5586þ 0:8406þ 0:1413
¼ 5:0260
600 J. Zeng et al. / International Journal of Project Management 25 (2007) 589–600
The overall risk magnitude is 5.0260 under the definedscale system of RM, i.e. the risk is between minor with abelief of 48.7% and major of 51.3% as shown in Fig. 3.
3.5. The output modification phase
In reviewing the assessment process, the final result isfound reliable so that no further modification is needed.This result provides the risk management project team witha valuable information for risk response decision making.
4. Conclusions
The construction industry has been plagued by riskand this has not always been dealt with adequately, oftenresulting in poor performance with increasing costs andtime delays. Additionally, construction projects arebecoming increasingly complex and dynamic in their nat-ure. Therefore, risk assessment is a complex subject whichis determined by numerous factors. Many constructionproject risk assessment techniques currently used are com-paratively mature tools. However, in many circumstances,the application of these tools may not give satisfactoryresults due to the incomplete risk data or the high levelof uncertainty involved in the risk data available. It istherefore essential to develop new risk analysis methodsto identify major factors and to assess the associated risksin an acceptable way in various environments where suchmature tools cannot be effectively or efficiently applied.This paper presents a new methodology for constructionproject risk analysis to deal with risks associated withthe construction projects in the complicated situations.This paper also presents a case example to demonstratethe proposed methodology. Comparing with those tradi-tional methods, the advantages of the proposed methodcan be summarised: (1) it can handle with the expertknowledge, engineering judgement and the historical datafor risk assessment in a consistent manner; (2) the risk canbe evaluated directly using linguistic terms which areemployed in risk assessment; and (3) the introduction offactor index enables decision makers to perform a riskanalysis of the underlying construction environment sothat a more reliable result can be obtained.
References
[1] An M, Baker C, Zeng J. A fuzzy-logic-based approach to qualitativerisk modelling in the construction process. World J Eng2005;2(1):1–12.
[2] Health and Safety Executive (HSE). Improving health and safety inconstruction: Phase 1: data collection, review and structuring. HSEBooks: Contract Research Report 387. Sudbury, Suffolk; 2001.
[3] Winch GM. Managing construction projects: an information pro-cessing approach. Oxford: Blackwell Science; 2002.
[4] Health and Safety Executive (HSE). Good practice and pitfalls in riskassessment. HSE Books: Research Report 151. Sudbury, Suffolk;2003.
[5] Zeng J, An M, Chan AHC. A fuzzy reasoning decision makingapproach based multi-expert judgement for construction project riskanalysis. In: Khosrowshahi F, editor. Proceedings of the twenty-firstannual conference. Association of Researchers in ConstructionManagement (ARCOM). London, UK; 2005. p. 841–52.
[6] Saaty TL. Multicriteria decision making: the analytic hierarchyprocess. Pittsburgh (US): RWS Publications; 1990.
[7] Kim SB, Whang KS. Forecasting the capabilities of Korean civilaircraft industry. Omega 1993;21(1):91–8.
[8] Cheng CH. Evaluating naval tactical missile systems by fuzzy AHPbased on the grade value of membership function. Euro J Oper Res1996;96:343–50.
[9] Badri M. Combining the AHP and GP for global facility location–allocation problem. Int J Product Econ 1999;62(3):237–48.
[10] Lee CW, Kwak NK. Information resource planning for a health-caresystem using an AHP-based goal programming method. J Oper ResSoc 1999;50:1191–8.
[11] Harbi KMA. Application of AHP in project management. Int JProject Manage 2001;19(4):19–27.
[12] Zhi H. Risk management for overseas construction. Int J ProjectManage 1995;13:231–7.
[13] Lyons T, Skitmore M. Project risk management in the Queenslandengineering construction industry: a survey. Int J Project Manage2004;22:51–61.
[14] Zeng J, An M, Chan AHC, Lin Y. A methodology for assessing risksin the construction process. In: Khosrowshahi F, editor. Proceedingsof the twentieth annual conference. Association of Researchers inConstruction Management (ARCOM). Edinburgh, UK; 2004. p.1165–74.
[15] Chang DY. Theory and methodology: applications of the extentanalysis method on fuzzy AHP. Eur J Oper Res 1996;95:649–55.
[16] Laarhoven PJM, Pedrycz W. A fuzzy extension of Saaty’s prioritytheory. Fuzzy Set Syst 1983;11:229–41.
[17] Buckley JJ. Fuzzy eigenvalues and input–output analysis. Fuzzy SetSyst 1990;34:187–95.
[18] Buckley JJ. Fuzzy hierarchical analysis. Fuzzy Set Syst1985;17:233–47.
[19] Zhu KJ, Jing Y, Chang DY. Theory and methodology: a discussionon extent analysis method and application of fuzzy AHP. Eur J OperRes 1999;116:450–6.
[20] Bojadziev G, Bojacziev M. Fuzzy logic for business, finance, andmanagement. Singapore: World Scientific; 1997.
[21] Dweiri F. Fuzzy development of crisp activity relationship chart forfacility layout. Comput Indust Eng 1999;36(1):99–124.
[22] Sousa JMC, Kaymak U. Fuzzy decision making in modeling andcontrol. Singapore: World Science; 2002.
[23] Pillay A, Wang J. Modified failure mode and effects analysis usingapproximate reasoning. Reliabil Eng Syst Safety 2003;79:69–85.
[24] Cox E. The fuzzy systems handbook. 2nd ed. New York: APProfessional; 1999.