Application and validation of chemometrics-assisted spectrophotometry and liquid chromatography for...
10
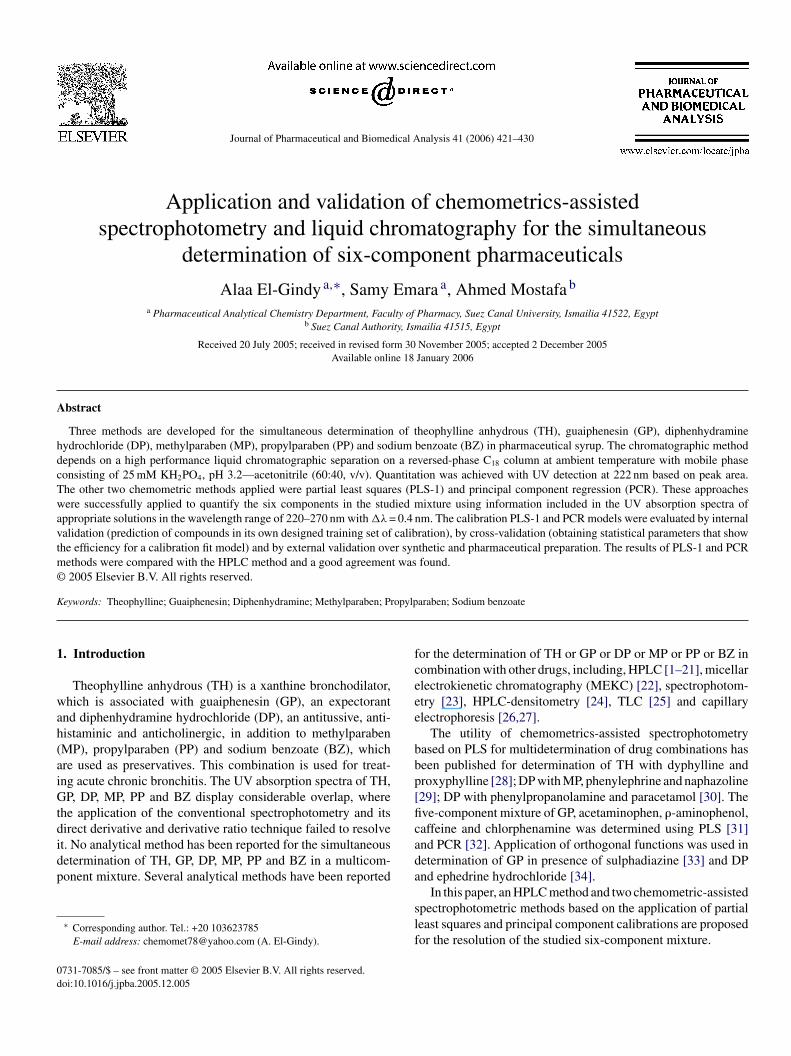
Journal of Pharmaceutical and Biomedical Analysis 41 (2006) 421–430 Application and validation of chemometrics-assisted spectrophotometry and liquid chromatography for the simultaneous determination of six-component pharmaceuticals Alaa El-Gindy a,∗ , Samy Emara a , Ahmed Mostafa b a Pharmaceutical Analytical Chemistry Department, Faculty of Pharmacy, Suez Canal University, Ismailia 41522, Egypt b Suez Canal Authority, Ismailia 41515, Egypt Received 20 July 2005; received in revised form 30 November 2005; accepted 2 December 2005 Available online 18 January 2006 Abstract Three methods are developed for the simultaneous determination of theophylline anhydrous (TH), guaiphenesin (GP), diphenhydramine hydrochloride (DP), methylparaben (MP), propylparaben (PP) and sodium benzoate (BZ) in pharmaceutical syrup. The chromatographic method depends on a high performance liquid chromatographic separation on a reversed-phase C 18 column at ambient temperature with mobile phase consisting of 25 mM KH 2 PO 4 , pH 3.2—acetonitrile (60:40, v/v). Quantitation was achieved with UV detection at 222 nm based on peak area. The other two chemometric methods applied were partial least squares (PLS-1) and principal component regression (PCR). These approaches were successfully applied to quantify the six components in the studied mixture using information included in the UV absorption spectra of appropriate solutions in the wavelength range of 220–270 nm with λ = 0.4 nm. The calibration PLS-1 and PCR models were evaluated by internal validation (prediction of compounds in its own designed training set of calibration), by cross-validation (obtaining statistical parameters that show the efficiency for a calibration fit model) and by external validation over synthetic and pharmaceutical preparation. The results of PLS-1 and PCR methods were compared with the HPLC method and a good agreement was found. © 2005 Elsevier B.V. All rights reserved. Keywords: Theophylline; Guaiphenesin; Diphenhydramine; Methylparaben; Propylparaben; Sodium benzoate 1. Introduction Theophylline anhydrous (TH) is a xanthine bronchodilator, which is associated with guaiphenesin (GP), an expectorant and diphenhydramine hydrochloride (DP), an antitussive, anti- histaminic and anticholinergic, in addition to methylparaben (MP), propylparaben (PP) and sodium benzoate (BZ), which are used as preservatives. This combination is used for treat- ing acute chronic bronchitis. The UV absorption spectra of TH, GP, DP, MP, PP and BZ display considerable overlap, where the application of the conventional spectrophotometry and its direct derivative and derivative ratio technique failed to resolve it. No analytical method has been reported for the simultaneous determination of TH, GP, DP, MP, PP and BZ in a multicom- ponent mixture. Several analytical methods have been reported ∗ Corresponding author. Tel.: +20 103623785 E-mail address: [email protected] (A. El-Gindy). for the determination of TH or GP or DP or MP or PP or BZ in combination with other drugs, including, HPLC [1–21], micellar electrokienetic chromatography (MEKC) [22], spectrophotom- etry [23], HPLC-densitometry [24], TLC [25] and capillary electrophoresis [26,27]. The utility of chemometrics-assisted spectrophotometry based on PLS for multidetermination of drug combinations has been published for determination of TH with dyphylline and proxyphylline [28]; DP with MP, phenylephrine and naphazoline [29]; DP with phenylpropanolamine and paracetamol [30]. The five-component mixture of GP, acetaminophen, -aminophenol, caffeine and chlorphenamine was determined using PLS [31] and PCR [32]. Application of orthogonal functions was used in determination of GP in presence of sulphadiazine [33] and DP and ephedrine hydrochloride [34]. In this paper, an HPLC method and two chemometric-assisted spectrophotometric methods based on the application of partial least squares and principal component calibrations are proposed for the resolution of the studied six-component mixture. 0731-7085/$ – see front matter © 2005 Elsevier B.V. All rights reserved. doi:10.1016/j.jpba.2005.12.005
-
Upload
independent -
Category
Documents
-
view
8 -
download
0
Transcript of Application and validation of chemometrics-assisted spectrophotometry and liquid chromatography for...
Journal of Pharmaceutical and Biomedical Analysis 41 (2006) 421–430
Application and validation of chemometrics-assistedspectrophotometry and liquid chromatography for the simultaneous
determination of six-component pharmaceuticals
Alaa El-Gindy a,∗, Samy Emara a, Ahmed Mostafa b
a Pharmaceutical Analytical Chemistry Department, Faculty of Pharmacy, Suez Canal University, Ismailia 41522, Egyptb Suez Canal Authority, Ismailia 41515, Egypt
Received 20 July 2005; received in revised form 30 November 2005; accepted 2 December 2005Available online 18 January 2006
Abstract
Three methods are developed for the simultaneous determination of theophylline anhydrous (TH), guaiphenesin (GP), diphenhydraminehydrochloride (DP), methylparaben (MP), propylparaben (PP) and sodium benzoate (BZ) in pharmaceutical syrup. The chromatographic methoddcTwavtm©
K
1
wah(aiGtdidp
0d
epends on a high performance liquid chromatographic separation on a reversed-phase C18 column at ambient temperature with mobile phaseonsisting of 25 mM KH2PO4, pH 3.2—acetonitrile (60:40, v/v). Quantitation was achieved with UV detection at 222 nm based on peak area.he other two chemometric methods applied were partial least squares (PLS-1) and principal component regression (PCR). These approachesere successfully applied to quantify the six components in the studied mixture using information included in the UV absorption spectra of
ppropriate solutions in the wavelength range of 220–270 nm with �λ = 0.4 nm. The calibration PLS-1 and PCR models were evaluated by internalalidation (prediction of compounds in its own designed training set of calibration), by cross-validation (obtaining statistical parameters that showhe efficiency for a calibration fit model) and by external validation over synthetic and pharmaceutical preparation. The results of PLS-1 and PCR
ethods were compared with the HPLC method and a good agreement was found.2005 Elsevier B.V. All rights reserved.
eywords: Theophylline; Guaiphenesin; Diphenhydramine; Methylparaben; Propylparaben; Sodium benzoate
. Introduction
Theophylline anhydrous (TH) is a xanthine bronchodilator,hich is associated with guaiphenesin (GP), an expectorant
nd diphenhydramine hydrochloride (DP), an antitussive, anti-istaminic and anticholinergic, in addition to methylparabenMP), propylparaben (PP) and sodium benzoate (BZ), whichre used as preservatives. This combination is used for treat-ng acute chronic bronchitis. The UV absorption spectra of TH,P, DP, MP, PP and BZ display considerable overlap, where
he application of the conventional spectrophotometry and itsirect derivative and derivative ratio technique failed to resolvet. No analytical method has been reported for the simultaneousetermination of TH, GP, DP, MP, PP and BZ in a multicom-onent mixture. Several analytical methods have been reported
∗ Corresponding author. Tel.: +20 103623785E-mail address: [email protected] (A. El-Gindy).
for the determination of TH or GP or DP or MP or PP or BZ incombination with other drugs, including, HPLC [1–21], micellarelectrokienetic chromatography (MEKC) [22], spectrophotom-etry [23], HPLC-densitometry [24], TLC [25] and capillaryelectrophoresis [26,27].
The utility of chemometrics-assisted spectrophotometrybased on PLS for multidetermination of drug combinations hasbeen published for determination of TH with dyphylline andproxyphylline [28]; DP with MP, phenylephrine and naphazoline[29]; DP with phenylpropanolamine and paracetamol [30]. Thefive-component mixture of GP, acetaminophen, �-aminophenol,caffeine and chlorphenamine was determined using PLS [31]and PCR [32]. Application of orthogonal functions was used indetermination of GP in presence of sulphadiazine [33] and DPand ephedrine hydrochloride [34].
In this paper, an HPLC method and two chemometric-assistedspectrophotometric methods based on the application of partialleast squares and principal component calibrations are proposedfor the resolution of the studied six-component mixture.
731-7085/$ – see front matter © 2005 Elsevier B.V. All rights reserved.oi:10.1016/j.jpba.2005.12.005

422 A. El-Gindy et al. / Journal of Pharmaceutical and Biomedical Analysis 41 (2006) 421–430
2. Experimental
2.1. Instrumentation
A double-beam Shimadzu (Japan) UV–vis spectrophotome-ter, model UV-1601 PC equipped with 1 cm quartz cells andconnected to an IBM compatible computer. HP 600 inkjetprinter was used. The bundled software was UVPC personalspectroscopy software version 3.7 (Shimadzu). The spectralbandwidth was 2 nm and the wavelength scanning speed was2800 nm min−1. PLS and PCR analysis were carried out by usingPLS-Toolbox software version 2.1—PC [35] for use with MAT-LAB5.
The HPLC (Shimadzu, Kyoto, Japan) instrument wasequipped with a model series LC-10 ADVP pump, SCL-10AVP system controller, DGU-12 A Degasser, Rheodyne 7725iinjector with a 20 �l loop and a SPD-10AVP UV–vis detector,separation and quantitation were made on a 250 mm × 4.6 mm(i.d.) Shim-pack RP18 column (4.6 �m particle size). The detec-tor was set at λ = 222 nm. Data acquisition was performed onclass-VP software.
2.2. Materials and reagents
Pharmaceutical grade of TH, GP, DP, MP, PP and BZwere used and certified to contain 99.9, 99.8, 99.9, 99.7, 99.8aHpg
PED
2
2
dpfla
2saDdt3fB
aps
2.3.2. Multivariate calibrationA calibration set of 25 samples was prepared in 0.1 M
hydrochloric acid, applying a multilevel multifactor design[36] in which five levels of concentrations of TH, GP, DP,MP, PP and BZ were introduced. The levels were in thecalibration range of 5.0–33.0 �g ml−1 for TH, 3–21 �g ml−1
for GP, 1.2–4.0 �g ml−1 for DP, 0.3–2.1 �g ml−1 for MP,0.4–1.6 �g ml−1 for PP and 0.5–3.5 �g ml−1 for BZ (Table 1).The electronic UV absorption spectra for these samples werecollected each 0.4 nm in the wavelength range of 220–270 nm.The computation was made in PLS-Toolbox software version2.1.
PCR and PLS-1 models were applied to the UV absorptionspectra of these mixtures using six latent variables for TH, GP,DP and BZ and seven latent variables for MP and PP by PLS-1.Seven principal components were used for PCR determinationof each compound.
2.3.3. Pharmaceutical sample preparationFive ml of the syrup equivalent to 46.65 mg of TH, 30.0 mg
of GP, 4.15 mg of DP, 3.0 mg of MP, 1.5 mg of PP and 5.0 mgof BZ was diluted to 100 ml with methanol, further dilutionswere made using 0.1 M hydrochloric acid (for spectrophotomet-ric methods) or the mobile phase (for HPLC method) to reach thecalibration range for each component. The general proceduresfor PCR, PLS-1 and HPLC methods described under calibrationwc
3
3
Pstoncmwwi
3
nppwsuaor
nd 99.9%, respectively. Acetonitrile and methanol used werePLC grade (BDH, Poole, UK). Potassium dihydrogen phos-hate, hydrochloric and phosphoric acids used were analyticalrade.
Tussipect-N® syrup (batch number 412112) (Misr Co. Forharmaceutical Industries, Mataria, Cairo, Egypt) were used.ach 5 ml contains 46.65 mg of TH, 30 mg of GP, 4.15 mg ofP, 3 mg of MP, 1.5 mg of PP and 5 mg of BZ.
.3. Procedure
.3.1. HPLC methodThe mobile phase was prepared by mixing 25 mM potassium
ihydrogen phosphate (apparent pH was adjusted to 3.2 usinghosphoric acid) and acetonitrile in a ratio of 60:40 (v/v). Theow rate was 2 ml min−1. All determinations were performed atmbient temperature.
.3.1.1. Standard solutions and calibration. Stock standardolutions of TH, GP, DP, MP, PP and BZ were prepared sep-rately by dissolving 50, 60, 40, 60, 40 and 50 mg of TH, GP,P, MP, PP and BZ, respectively, in 100 ml methanol. Furtherilutions were made for HPLC method using the mobile phaseo reach the concentration range of 5.0–33.0 �g ml−1 for TH,–21 �g ml−1 for GP, 1.2–4.0 �g ml−1 for DP, 0.3–3.0 �g ml−1
or MP, 0.4–2.0 �g ml−1 for PP and 0.5–4.0 �g ml−1 forZ.
Triplicate 20 �l injections were made for each concentrationnd chromatographed under the specified conditions describedreviously. The peak area values were plotted against corre-ponding concentrations. Linear relationship was obtained.
ere followed and the concentration of each compound wasalculated.
. Results and discussion
.1. Spectral features
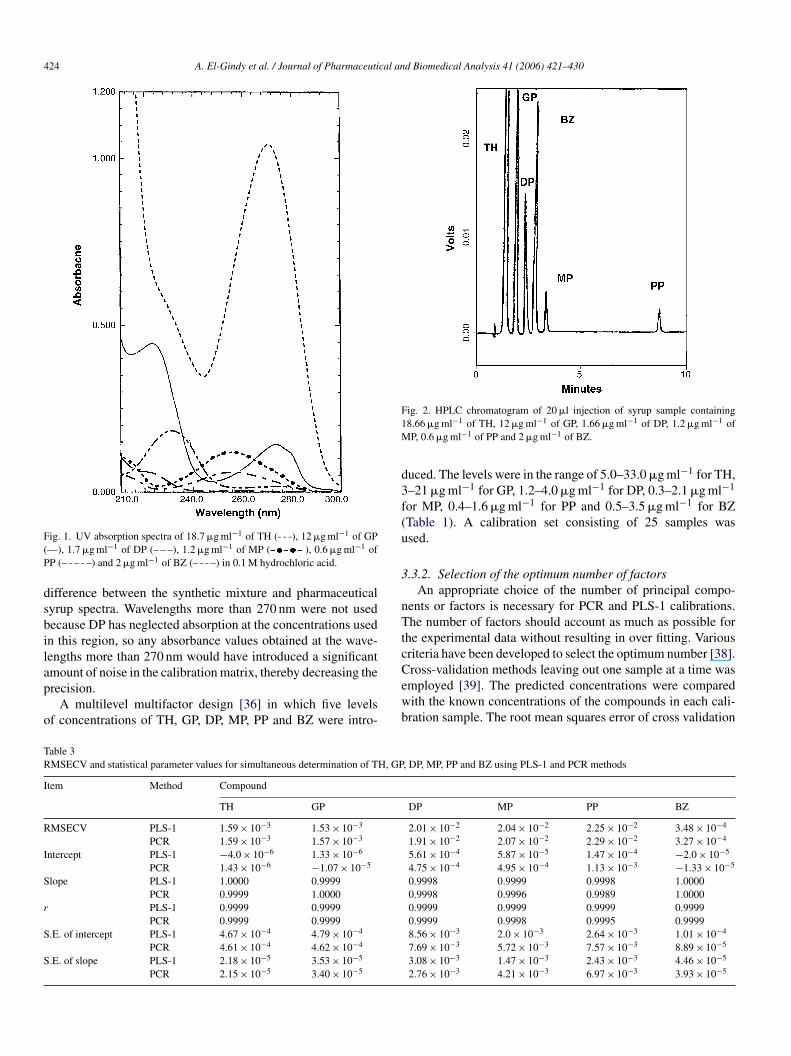
Fig. 1 shows the UV absorption spectra of TH, GP, DP, MP,P and BZ at their nominal concentrations in syrup. As can beeen, PP, DP, MP and BZ contribute very little to overall absorp-ion of the sample; also, the absorption band of TH is extensivelyverlapped with GP, DP, MP, PP and BZ spectra. The simulta-eous determination of TH, GP, DP, MP, PP and BZ in syrup byonventional, derivative and derivative ratio spectrophotometricethods is hindered by strong spectral overlap throughout theavelength range. HPLC or multivariate calibration methodsere necessary for such determination due to the presence of
nterference.
.2. HPLC method
The developed HPLC method has been applied for simulta-eous determination of TH, GP, DP, MP, PP and BZ. The mobilehase composition and pH of 25 mM potassium dihydrogenhosphate were studied and optimized. A satisfactory separationas obtained with a mobile phase composed of 25 mM potas-
ium dihydrogen phosphate (apparent pH was adjusted to 3.2sing phosphoric acid) and acetonitrile (60:40, v/v). Increasingcetonitrile concentration to more than 50% led to overlappingf GP and DP. At lower acetonitrile concentration (<30%) sepa-ation occurred but with excessive delay for PP peak. Variation

A. El-Gindy et al. / Journal of Pharmaceutical and Biomedical Analysis 41 (2006) 421–430 423
Table 1Concentration data for the different mixtures used in the calibration set and internal validation for the determination of TH, GP, DP, MP, PP and BZ using PLS-1 andPCR methods
Mixture composition (�g ml−1) Internal validation (percentage recovery)
Mixture No. TH GP DP MP PP BZ PLS-1 PCR
TH GP DP MP PP BZ TH GP DP MP PP BZ
1 19 12 2.6 1.2 1 2 100.0 100.0 100.1 100.3 99.7 100.0 100.0 100.0 100.2 100.9 98.9 100.02 19 3 1.2 2.1 0.7 3.5 100.0 100.0 100.9 100.0 99.9 100.0 100.0 100.0 100.9 99.8 100.8 100.03 5 3 4 0.75 1.6 2 100.0 100.0 100.3 99.8 100.1 100.0 100.0 100.0 100.3 101.2 99.4 100.04 5 21 1.9 2.1 1 1.25 100.0 100.0 99.2 100.2 99.6 100.0 100.0 100.0 99.5 101.1 97.3 100.05 33 7.5 4 1.2 0.7 1.25 100.0 100.0 100.1 100.6 98.9 100.0 100.0 100.0 99.9 100.9 98.3 100.06 12 21 2.6 0.75 0.7 2.75 100.0 100.0 99.5 100.5 99.5 100.0 100.0 100.0 99.9 101.4 98.3 100.07 33 12 1.9 0.75 1.3 3.5 100.0 100.0 101.0 101.1 99.3 100.0 100.0 100.0 100.8 102.3 98.5 100.08 19 7.5 1.9 1.65 1.6 2.75 100.0 100.0 99.5 99.6 100.5 100.0 100.0 100.0 99.8 100.4 99.6 100.09 12 7.5 3.3 2.1 1.3 2 100.0 100.0 98.7 100.1 99.9 100.0 100.0 100.0 98.7 99.7 100.5 100.010 12 16.5 4 1.65 1 3.5 100.0 100.0 100.2 100.2 99.7 100.0 100.0 100.0 99.9 99.8 100.3 100.011 26 21 3.3 1.2 1.6 3.5 100.0 100.0 100.4 99.5 100.4 100.0 100.0 100.0 100.4 97.6 102.0 100.012 33 16.5 2.6 2.1 1.6 0.5 100.0 100.0 100.3 100.3 99.6 100.0 100.0 100.0 99.8 100.4 99.4 100.013 26 12 4 2.1 0.4 2.75 100.0 100.0 100.0 99.9 100.9 100.0 100.0 100.0 100.0 99.8 101.1 100.014 19 21 4 0.3 1.3 0.5 100.0 100.0 99.8 99.3 100.2 99.9 100.0 100.0 100.0 97.6 100.6 100.015 33 21 1.2 1.65 0.4 2 100.0 100.0 99.4 99.5 102.1 100.0 100.0 100.0 99.9 98.8 105.6 100.016 33 3 3.3 0.3 1 2.75 100.0 100.0 99.4 97.6 100.8 100.0 100.0 100.0 99.6 98.0 100.7 100.017 5 16.5 1.2 1.2 1.3 2.75 100.0 100.0 100.5 99.9 100.1 100.0 100.0 100.0 100.5 100.2 99.8 100.018 26 3 2.6 1.65 1.3 1.25 100.0 100.1 100.0 100.1 99.9 100.0 100.0 100.1 100.5 100.5 99.4 100.019 5 12 3.3 1.65 0.7 0.5 99.9 100.0 101.1 99.9 100.3 100.1 99.9 100.0 101.0 98.7 103.4 100.120 19 16.5 3.3 0.75 0.4 1.25 100.0 100.0 99.8 99.5 101.1 100.0 100.0 100.0 100.0 102.0 95.8 100.021 26 16.5 1.9 0.3 0.7 2 100.0 100.0 100.1 100.9 99.6 100.0 100.0 100.0 99.4 104.0 98.1 100.022 26 7.5 1.2 0.75 1 0.5 100.0 100.0 101.0 100.5 99.6 100.0 100.0 100.0 100.7 99.3 100.6 100.023 12 3 1.9 1.2 0.4 0.5 100.0 100.0 99.7 99.6 101.4 100.0 100.0 100.0 99.8 99.0 103.5 100.124 5 7.5 2.6 0.3 0.4 3.5 100.0 100.0 100.0 101.8 98.6 100.0 100.0 100.0 99.8 99.7 100.3 100.025 12 12 1.2 0.3 1.6 1.25 100.0 100.0 99.5 99.5 100.1 100.0 100.0 100.0 99.0 95.4 101.0 100.0
Meana 100.0 100.0 100.0 100.0 100.1 100.0 100.0 100.0 100.0 99.9 100.1 100.0
S.D.a 0.02 0.02 0.59 0.76 0.77 0.03 0.02 0.02 0.55 1.76 2.05 0.02
a Mean and S.D., percentage recovery from the added amount.
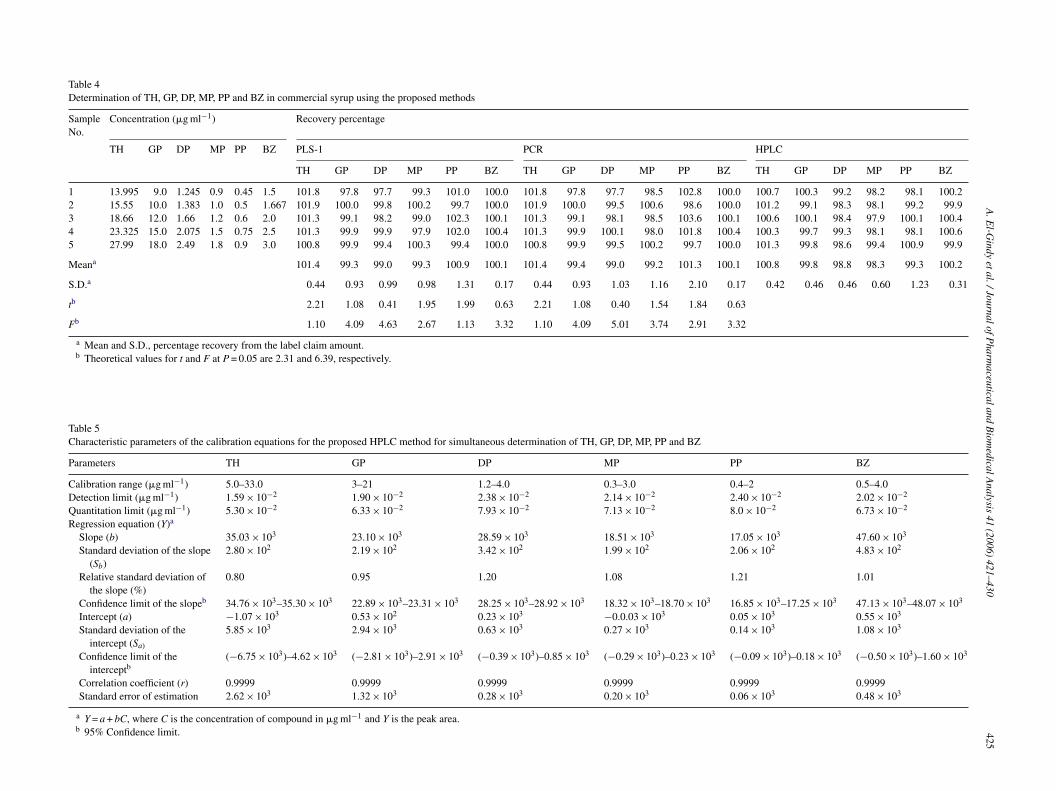
of pH of the 25 mM potassium dihydrogen phosphate resultedin maximum capacity factor (K’) value at pH 6.5. At pH 2.5–4.0improved resolution for the six drugs was observed. Howeverat pH 3.2 optimum resolution with reasonable retention timewas observed. Quantitation based on peak area achieved withUV detection at 222 nm. The specificity of the HPLC methodis illustrated in Fig. 2 where complete separation of the sixcompounds was noticed. The average retention time ± standarddeviation for TH, GP, DP, BZ, MP and PP were found to be1.5 ± 0.02, 2.0 ± 0.03, 2.5 ± 0.04, 2.9 ± 0.02, 3.5 ± 0.03 and8.7 ± 0.02 min, respectively, for 10 replicates. The response ofthe TH is very high which is not affected by the dead volume.The HPLC chromatographic characteristics of the studied drugswere given in Table 2.
3.3. Multivariate calibration
3.3.1. Calibration matrix and selection of spectral zonesfor analysis by PLS-1 and PCR
The quality of multicomponent analysis is dependent onthe wavelength range and spectral mode used. PLS proceduresare designated to be full spectrum computational procedures,thus wavelength selection is seemingly unnecessary, and so allavailable wavelengths are often used. However, measurements
from spectral wavelengths that are non-informative in a modeldegrade performance [37]. Original and reconstructed spectraof the calibration matrix were compared in order to select therange of wavelengths. The range was obtained by all regionsin which the difference between each component of the mix-ture and the others was maximum. Besides, the regions in whicheach component of the mixture were best reconstructed werealso considered. The spectral region between wavelengths 220and 270 nm was selected for this purpose as it was that pro-viding the greatest amount of information about the mixturecomponents. This entailed using 126 experimental points perspectrum, as spectra were digitized at 0.4 nm intervals. In addi-tion, wavelengths less than 220 nm were rejected due to the
Table 2Chromatographic characteristics of TH, GP, DP, MP, PP and BZ
Compound Retentiontime (min)
Capacityfactor (K’)
Selectivity Resolution
TH 1.5 0.81 1.74 1.54GP 2.0 1.41 1.38 1.5DP 2.5 1.95 1.31 1.67BZ 2.9 2.55 1.23 1.82MP 3.5 3.16 3 21.87PP 8.7 9.48
424 A. El-Gindy et al. / Journal of Pharmaceutical and Biomedical Analysis 41 (2006) 421–430
Fig. 1. UV absorption spectra of 18.7 �g ml−1 of TH (- - -), 12 �g ml−1 of GP(—), 1.7 �g ml−1 of DP (– – –), 1.2 �g ml−1 of MP ( ), 0.6 �g ml−1 ofPP (– - – - –) and 2 �g ml−1 of BZ (– - - –) in 0.1 M hydrochloric acid.
difference between the synthetic mixture and pharmaceuticalsyrup spectra. Wavelengths more than 270 nm were not usedbecause DP has neglected absorption at the concentrations usedin this region, so any absorbance values obtained at the wave-lengths more than 270 nm would have introduced a significantamount of noise in the calibration matrix, thereby decreasing theprecision.
A multilevel multifactor design [36] in which five levelsof concentrations of TH, GP, DP, MP, PP and BZ were intro-
Fig. 2. HPLC chromatogram of 20 �l injection of syrup sample containing18.66 �g ml−1 of TH, 12 �g ml−1 of GP, 1.66 �g ml−1 of DP, 1.2 �g ml−1 ofMP, 0.6 �g ml−1 of PP and 2 �g ml−1 of BZ.
duced. The levels were in the range of 5.0–33.0 �g ml−1 for TH,3–21 �g ml−1 for GP, 1.2–4.0 �g ml−1 for DP, 0.3–2.1 �g ml−1
for MP, 0.4–1.6 �g ml−1 for PP and 0.5–3.5 �g ml−1 for BZ(Table 1). A calibration set consisting of 25 samples wasused.
3.3.2. Selection of the optimum number of factorsAn appropriate choice of the number of principal compo-
nents or factors is necessary for PCR and PLS-1 calibrations.The number of factors should account as much as possible forthe experimental data without resulting in over fitting. Variouscriteria have been developed to select the optimum number [38].Cross-validation methods leaving out one sample at a time wasemployed [39]. The predicted concentrations were comparedwith the known concentrations of the compounds in each cali-bration sample. The root mean squares error of cross validation
Table 3RMSECV and statistical parameter values for simultaneous determination of TH, GP, DP, MP, PP and BZ using PLS-1 and PCR methods
Item Method Compound
TH GP DP MP PP BZ
RMSECV PLS-1 1.59 × 10⁻³ 1.53 × 10⁻³ 2.01 × 10⁻² 2.04 × 10⁻² 2.25 × 10⁻² 3.48 × 10⁻⁴
PCR 1.59 × 10⁻³ 1.57 × 10⁻³ 1.91 × 10⁻² 2.07 × 10⁻² 2.29 × 10⁻² 3.27 × 10⁻⁴
Intercept PLS-1 −4.0 × 10⁻⁶ 1.33 × 10⁻⁶ 5.61 × 10⁻⁴ 5.87 × 10⁻⁵ 1.47 × 10⁻⁴ −2.0 × 10⁻⁵
PCR 1.43 × 10⁻⁶ −1.07 × 10⁻⁵ 4.75 × 10⁻⁴ 4.95 × 10⁻⁴ 1.13 × 10⁻³ −1.33 × 10⁻⁵
Slope PLS-1 1.0000 0.9999PCR 0.9999 1.0000
r PLS-1 0.9999 0.9999PCR 0.9999 0.9999
S.E. of intercept PLS-1 4.67 × 10⁻⁴ 4.79 × 10⁻⁴
PCR 4.61 × 10⁻⁴ 4.62 × 10⁻⁴
S.E. of slope PLS-1 2.18 × 10⁻⁵ 3.53 × 10⁻⁵
PCR 2.15 × 10⁻⁵ 3.40 × 10⁻⁵
0.9998 0.9999 0.9998 1.00000.9998 0.9996 0.9989 1.00000.9999 0.9999 0.9999 0.99990.9999 0.9998 0.9995 0.99998.56 × 10−3 2.0 × 10⁻³ 2.64 × 10⁻³ 1.01 × 10⁻⁴
7.69 × 10⁻³ 5.72 × 10⁻³ 7.57 × 10⁻³ 8.89 × 10⁻⁵
3.08 × 10⁻³ 1.47 × 10⁻³ 2.43 × 10⁻³ 4.46 × 10⁻⁵
2.76 × 10⁻³ 4.21 × 10⁻³ 6.97 × 10⁻³ 3.93 × 10⁻⁵
A.E
l-Gindy
etal./JournalofPharm
aceuticalandB
iomedicalA
nalysis41
(2006)421–430
425
Table 4Determination of TH, GP, DP, MP, PP and BZ in commercial syrup using the proposed methods
SampleNo.
Concentration (�g ml−1) Recovery percentage
TH GP DP MP PP BZ PLS-1 PCR HPLC
TH GP DP MP PP BZ TH GP DP MP PP BZ TH GP DP MP PP BZ
1 13.995 9.0 1.245 0.9 0.45 1.5 101.8 97.8 97.7 99.3 101.0 100.0 101.8 97.8 97.7 98.5 102.8 100.0 100.7 100.3 99.2 98.2 98.1 100.22 15.55 10.0 1.383 1.0 0.5 1.667 101.9 100.0 99.8 100.2 99.7 100.0 101.9 100.0 99.5 100.6 98.6 100.0 101.2 99.1 98.3 98.1 99.2 99.93 18.66 12.0 1.66 1.2 0.6 2.0 101.3 99.1 98.2 99.0 102.3 100.1 101.3 99.1 98.1 98.5 103.6 100.1 100.6 100.1 98.4 97.9 100.1 100.44 23.325 15.0 2.075 1.5 0.75 2.5 101.3 99.9 99.9 97.9 102.0 100.4 101.3 99.9 100.1 98.0 101.8 100.4 100.3 99.7 99.3 98.1 98.1 100.65 27.99 18.0 2.49 1.8 0.9 3.0 100.8 99.9 99.4 100.3 99.4 100.0 100.8 99.9 99.5 100.2 99.7 100.0 101.3 99.8 98.6 99.4 100.9 99.9
Meana 101.4 99.3 99.0 99.3 100.9 100.1 101.4 99.4 99.0 99.2 101.3 100.1 100.8 99.8 98.8 98.3 99.3 100.2
S.D.a 0.44 0.93 0.99 0.98 1.31 0.17 0.44 0.93 1.03 1.16 2.10 0.17 0.42 0.46 0.46 0.60 1.23 0.31
tb 2.21 1.08 0.41 1.95 1.99 0.63 2.21 1.08 0.40 1.54 1.84 0.63
Fb 1.10 4.09 4.63 2.67 1.13 3.32 1.10 4.09 5.01 3.74 2.91 3.32
a Mean and S.D., percentage recovery from the label claim amount.b Theoretical values for t and F at P = 0.05 are 2.31 and 6.39, respectively.
Table 5Characteristic parameters of the calibration equations for the proposed HPLC method for simultaneous determination of TH, GP, DP, MP, PP and BZ
Parameters TH GP DP MP PP BZ
Calibration range (�g ml−1) 5.0–33.0 3–21 1.2–4.0 0.3–3.0 0.4–2 0.5–4.0Detection limit (�g ml−1) 1.59 × 10⁻² 1.90 × 10⁻² 2.38 × 10⁻² 2.14 × 10⁻² 2.40 × 10⁻² 2.02 × 10⁻²
Quantitation limit (�g ml−1) 5.30 × 10⁻² 6.33 × 10⁻² 7.93 × 10⁻² 7.13 × 10⁻² 8.0 × 10⁻² 6.73 × 10⁻²
Regression equation (Y)a
Slope (b) 35.03 × 10³ 23.10 × 10³ 28.59 × 10³ 18.51 × 10³ 17.05 × 10³ 47.60 × 10³
Standard deviation of the slope(Sb)
2.80 × 10² 2.19 × 10² 3.42 × 10² 1.99 × 10² 2.06 × 10² 4.83 × 10²
Relative standard deviation ofthe slope (%)
0.80 0.95 1.20 1.08 1.21 1.01
Confidence limit of the slopeb 34.76 × 10³–35.30 × 10³ 22.89 × 10³–23.31 × 10³ 28.25 × 10³–28.92 × 10³ 18.32 × 10³–18.70 × 10³ 16.85 × 10³–17.25 × 10³ 47.13 × 10³–48.07 × 10³
Intercept (a) −1.07 × 10³ 0.53 × 10² 0.23 × 10³ −0.0.03 × 103 0.05 × 10³ 0.55 × 10³
Standard deviation of theintercept (Sa)
5.85 × 10³ 2.94 × 10³ 0.63 × 10³ 0.27 × 10³ 0.14 × 10³ 1.08 × 10³
Confidence limit of theinterceptb
(−6.75 × 10³)–4.62 × 10³ (−2.81 × 10³)–2.91 × 10³ (−0.39 × 10³)–0.85 × 10³ (−0.29 × 10³)–0.23 × 10³ (−0.09 × 10³)–0.18 × 10³ (−0.50 × 10³)–1.60 × 10³
Correlation coefficient (r) 0.9999 0.9999 0.9999 0.9999 0.9999 0.9999Standard error of estimation 2.62 × 10³ 1.32 × 10³ 0.28 × 10³ 0.20 × 10³ 0.06 × 10³ 0.48 × 10³
a Y = a + bC, where C is the concentration of compound in �g ml−1 and Y is the peak area.b 95% Confidence limit.
426 A. El-Gindy et al. / Journal of Pharmaceutical and Biomedical Analysis 41 (2006) 421–430
Table 6Analysis of variance for repeatability and intermediate precision for TH, GP, DP, MP, PP and BZ using the proposed HPLC, PLS-1 and PCR methods
Drug Concentrationlevel (�g ml−1)
Sources ofvariance
Sum of squares DF MS F-ratio P-value
HPLC PLS-1 PCR HPLC PLS-1 PCR HPLC PLS-1 PCR HPLC PLS-1 PCR
TH 5.0 Between 1.42 2.11 2.11 7 0.20 0.30 0.30 0.64 1.25 1.25 0.72 0.38 0.38Within 2.56 1.94 1.94 8 0.32 0.24 0.24Total 3.98 4.05 4.05 15
TH 19.0 Between 0.83 2.63 2.63 7 0.12 0.38 0.38 0.21 0.89 0.89 0.97 0.56 0.56Within 4.50 3.40 3.40 8 0.59 0.42 0.42Total 5.33 6.03 6.03 15
TH 33.0 Between 1.08 0.27 0.27 7 0.15 0.04 0.04 1.11 1.15 1.15 0.44 0.42 0.42Within 1.11 0.27 0.27 8 0.14 0.33 0.33Total 2.19 0.54 0.54 15
GP 3 Between 3.01 1.36 0.57 7 0.43 0.19 0.08 1.28 1.15 0.70 0.37 0.42 0.67Within 2.69 1.35 0.92 8 0.34 0.17 0.12Total 5.70 2.71 1.49 15
GP 12 Between 1.11 1.40 2.95 7 0.15 0.20 0.42 1.11 0.96 2.55 0.44 0.52 0.11Within 1.11 1.67 1.32 8 0.14 0.21 0.17Total 2.22 3.07 4.27 15
GP 21 Between 1.10 0.49 0.73 7 0.16 0.07 0.10 0.22 0.74 0.92 0.97 0.65 0.54Within 5.82 0.75 0.90 8 0.73 0.09 0.11Total 6.92 1.24 1.63 15
DP 1.2 Between 3.89 2.27 0.73 7 0.56 0.32 0.10 1.51 0.94 0.73 0.29 0.53 0.65Within 2.94 2.77 1.13 8 0.37 0.35 0.14Total 6.83 5.04 1.86 15
DP 2.6 Between 0.78 0.32 2.06 7 0.11 0.05 0.29 0.16 0.17 1.45 0.99 0.99 0.31Within 5.71 2.16 1.62 8 0.71 0.27 0.20Total 6.49 2.48 3.68 15
DP 4.0 Between 1.37 0.99 1.06 7 0.20 0.14 0.15 0.58 0.52 0.54 0.76 0.80 0.78Within 2.70 2.18 2.24 8 0.34 0.27 0.28Total 4.07 3.17 3.30 15
MP 0.3 Between 2.15 2.39 2.96 7 0.31 0.34 0.42 0.65 1.04 1.36 0.71 0.47 0.34Within 3.80 2.63 2.49 8 0.47 0.33 0.31Total 5.95 5.02 5.45 15
MP 1.2 Between 1.08 1.01 2.21 7 0.15 0.14 0.32 1.11 0.96 1.70 0.44 0.52 0.24Within 1.11 1.20 1.49 8 0.14 0.15 0.19Total 2.19 2.20 3.70 15
MP 2.1 Between 1.24 1.34 2.28 7 0.18 0.19 0.33 0.44 0.42 2.01 0.85 0.86 0.17Within 3.20 3.62 1.30 8 0.40 0.45 0.16Total 4.44 4.96 3.58 15
PP 0.4 Between 0.62 1.40 2.88 7 0.09 0.20 0.41 1.86 0.96 1.95 0.20 0.52 0.18Within 0.38 1.67 1.69 8 0.05 0.21 0.21Total 1.00 3.07 4.57 15
PP 1.0 Between 2.25 0.72 2.98 7 0.32 0.10 0.43 1.68 0.28 2.46 0.24 0.94 0.12Within 1.53 2.91 1.38 8 0.19 0.36 0.17Total 3.78 3.63 4.36 15
PP 1.6 Between 2.66 2.70 1.29 7 0.38 0.39 0.18 1.96 1.34 1.05 0.18 0.34 0.47Within 1.55 2.30 1.40 8 0.19 0.29 0.17Total 4.21 5.00 2.69 15
BZ 0.5 Between 2.71 2.47 0.56 7 0.39 0.35 0.08 1.52 1.44 0.34 0.28 0.31 0.91Within 2.03 1.96 1.89 8 0.25 0.24 0.24Total 4.74 4.43 2.45 15
BZ 2 Between 1.89 1.55 0.93 7 0.27 0.22 0.13 1.08 0.55 0.99 0.45 0.78 0.50Within 1.20 3.23 1.07 8 0.25 0.40 0.13Total 3.09 4.78 2.00 15
BZ 3.5 Between 0.43 0.36 0.23 7 0.06 0.05 0.03 0.10 0.69 0.75 1.00 0.68 0.64Within 5.01 0.59 0.35 8 0.63 0.07 0.04Total 5.44 0.95 0.58 15
DF is the degree of freedom and MS is the mean square. The critical value of F-ratio is 3.5 and P-value is 0.05.

A. El-Gindy et al. / Journal of Pharmaceutical and Biomedical Analysis 41 (2006) 421–430 427
(RMSECV) was calculated for each method as follows:
RMSECV =√
PRESS
n
where n is the number of training samples and:
PRESS =∑
(Ypred − Ytrue)2
where Ypred and Ytrue are predicted and true concentrations in�g ml−1, respectively.
The RMSECV was used as a diagnostic test for examiningthe errors in the predicted concentrations. It indicates both of theprecision and accuracy of predictions. It was recalculated uponaddition of each new factor to the PLS-1 and PCR models.
The optimum number of factors was selected by following thecriterion of Haaland and Thomas [40]. The selected model wasthat with the fewest number of factors such that its RMSECV wasnot significantly greater than that for the model, which yieldedthe lowest RMSECV. A number of factors of six latent variablesfor TH, GP, DP and BZ and seven latent variables for MP and PPwere found to be optimum by PLS-1. Seven principal compo-nents were optimum for PCR determination of each compound.Plotting the actual known concentrations against the predictedconcentrations performed the evaluation of the predictive abil-ities of the models. The obtained results are shown in Table 3.A satisfactory correlation coefficient (r) value was obtained foremRai
3
trpai
3
tiSabnaHpdi
be Ta
ble
7D
eter
min
atio
nof
TH
,GP,
DP,
MP,
PPan
dB
Zin
synt
hetic
mix
ture
sus
ing
the
prop
osed
met
hods
Mix
ture
No.
Con
cent
ratio
nR
ecov
ery
perc
enta
ge
TH
GP
DP
MP
PPB
ZPL
S-1
PCR
HPL
C
TH
GP
DP
MP
PPB
ZT
HG
PD
PM
PPP
BZ
TH
GP
DP
MP
PPB
Z
19
31.
70.
60.
91.
510
0.0
100.
210
0.6
98.8
100.
699
.910
0.0
100.
210
0.6
98.2
101.
499
.910
0.2
99.8
100.
199
.710
0.5
99.9
214
122.
80.
91
0.5
100.
010
0.0
99.8
99.2
99.3
100.
010
0.0
100.
099
.898
.899
.510
0.0
99.9
99.9
99.8
100.
399
.410
0.2
319
61.
22.
11.
42.
599
.810
0.4
100.
199
.699
.099
.899
.810
0.4
100.
099
.898
.999
.999
.810
0.2
99.9
101.
498
.710
0.6
423
184
1.6
0.8
110
0.0
100.
010
0.3
98.7
100.
199
.910
0.0
100.
010
0.2
98.5
100.
999
.910
0.4
100.
199
.698
.810
0.3
99.8
528
92.
61.
51.
60.
599
.610
0.0
99.8
100.
398
.710
0.0
99.6
100.
099
.810
0.1
99.2
100.
099
.710
0.4
100.
399
.999
.199
.76
515
3.3
1.8
1.2
210
0.0
100.
199
.698
.410
0.6
100.
210
0.0
100.
199
.798
.198
.410
0.1
100.
699
.699
.599
.299
.910
0.5
733
61.
91.
20.
73
99.7
100.
110
0.4
99.7
98.9
100.
099
.710
0.1
100.
199
.410
1.5
100.
010
0.2
99.8
99.4
100.
610
1.2
100.
18
149
21.
81
3.5
99.9
100.
210
0.2
100.
498
.599
.999
.910
0.2
100.
310
0.6
99.1
99.9
99.9
100.
410
0.3
99.6
100.
299
.99
193
1.9
0.9
0.7
210
0.0
100.
599
.798
.399
.399
.810
0.0
100.
599
.898
.599
.199
.910
0.1
101.
299
.410
0.4
99.8
100.
3
Mea
na99
.910
0.2
100.
199
.399
.499
.999
.910
0.2
100.
099
.199
.810
0.0
100.
110
0.2
99.8
100.
099
.910
0.1
S.D
.a0.
140.
180.
340.
780.
800.
130.
140.
180.
300.
901.
160.
070.
290.
480.
360.
780.
760.
31
aM
ean
and
S.D
.,pe
rcen
tage
reco
very
from
the
adde
dam
ount
.
ach compound in the training set by PLS-1 and PCR optimizedodels indicating good predictive abilities of the models. TheMSECV obtained by optimizing the calibration matrix of thebsorption spectra for the PLS-1 and PCR methods are shownn Table 3 indicating good accuracy and precision.
.3.3. PLS-1 versus PCRRecent studies involving the use of multivariate calibration
echniques for the multicomponent resolution of UV–vis dataevealed no significant difference between the PLS and PCRredictions. However, if one considers its theoretical advantagesnd optimal performance over a wide range of conditions, PLS-1s the method of choice [41].
.4. Analysis of pharmaceutical syrup
The proposed PLS-1, PCR and HPLC methods were appliedo the simultaneous determination of TH, GP, DP, MP, PP and BZn commercial syrup. Five replicates determination were made.atisfactory results were obtained for each compound in goodgreement with label claims (Table 4). No published method haseen reported for simultaneous determination of the six compo-ents of this mixture. So that the results of the proposed PLS-1nd PCR methods were compared with those of the proposedPLC method. Statistical comparison between the results waserformed with regards to accuracy and precision using Stu-ent’s t-test and F-ratio at 95% confidence level (Table 4). Theres no significant difference between the results.
The syrup contains sugar, saccharin, propylene glycol, straw-erry, tuttifruity, carnosin, citric acid and sodium citrate as syrupxcipients. The syrup sample was diluted 1:500 with mobile
428A
.El-G
indyetal./JournalofP
harmaceuticaland
Biom
edicalAnalysis
41(2006)
421–430
Table 8Application of standard addition technique to the analysis of TH, GP, DP, MP, PP and BZ by the proposed methods
Sample no. TH GP DP
Concentration (�g ml−1) % found of added Concentration (�g ml−1) % found of added Concentration (�g ml−1) % found of added
Claimed Added PLS-1 PCR HPLC Claimed Added PLS-1 PCR HPLC Claimed Added PLS-1 PCR HPLC
1 13.995 5.0 100.0 100.0 100.0 9.0 9 100.4 100.4 99.9 1.245 1.2 99.8 99.9 100.22 13.995 9.0 99.9 99.9 100.3 9.0 10 99.9 99.9 100.3 1.245 1.6 100.4 100.4 99.93 13.995 12.0 99.6 99.6 99.7 9.0 10.5 98.9 98.9 100.2 1.245 2 99.6 99.6 99.74 13.995 16.0 99.4 99.4 100.4 9.0 11 100.2 100.2 99.8 1.245 2.4 100.2 100.1 100.45 13.995 19.0 100.1 100.1 99.9 9.0 12 99.9 99.9 99.7 1.245 2.7 100.4 100.3 100.6
Meana 99.8 99.8 100.1 99.9 99.9 100.1 100.1 100.1 100.1
S.D.a 0.29 0.29 0.28 0.58 0.58 0.31 0.36 0.32 0.36
Sample no. MP PP BZ
Concentration (�g ml−1) % found of added Concentration (�g ml−1) % found of added Concentration (�g ml−1) % found of added
Claimed Added PLS-1 PCR HPLC Claimed Added PLS-1 PCR HPLC Claimed Added PLS-1 PCR HPLC
1 0.9 0.3 98.1 97.8 100.1 0.45 0.4 100.9 101.9 100.2 1.5 0.5 99.8 99.8 100.72 0.9 0.4 98.6 98.5 100.4 0.45 0.5 100.5 100.7 99.9 1.5 1 100.1 100.1 99.73 0.9 0.6 100.2 101.2 99.8 0.45 0.7 99.3 99.7 99.2 1.5 1.5 100.2 100.3 99.64 0.9 0.9 100.1 100.3 99.6 0.45 0.8 98.7 98.3 100.5 1.5 1.7 99.7 99.8 99.45 0.9 1.2 99.2 99.0 99.4 0.45 1.1 100.3 100.5 98.8 1.5 2 99.6 99.9 100.6
Meana 99.2 99.4 99.9 99.9 100.2 99.9 99.9 100.0 100.1
S.D.a 0.92 1.38 0.40 0.91 1.33 0.73 0.26 0.22 0.58
a Mean and S.D., percentage recovery from the added amount.

A. El-Gindy et al. / Journal of Pharmaceutical and Biomedical Analysis 41 (2006) 421–430 429
phase or 0.1 M hydrochloric acid for HPLC and spectropho-tometric methods, respectively. At this dilution, there is nointerference from excipients for both methods. The PLS-1 andPCR methods can be used for very complex mixtures since onlyknowledge of constituents of interest is required and they canbe used to predict samples with constituents not present in theoriginal calibration mixtures [42].
3.5. Validation of the methods
3.5.1. LinearityThe linearity of the HPLC method for determination of
TH, GP, DP, MP, PP and BZ was evaluated by analysing aseries of different concentrations of each compound. In thisstudy seven concentrations were chosen, ranging between 5.0and 33.0 �g ml−1 for TH, 3 and 21 �g ml−1 for GP, 1.2 and4.0 �g ml−1 for DP, 0.3 and 3.0 �g ml−1 for MP, 0.4 and2.0 �g ml−1 for PP and 0.5 and 4.0 �g ml−1 for BZ. Each con-centration was repeated three times; this approach will provideinformation on the variation in peak area between samples ofsame concentration. The linearity of the calibration graphs wasvalidated by the high value of the correlation coefficient and theintercept value, which was not statistically (P < 0.05) differentfrom zero (Table 5). Characteristic parameters for regressionequations of the HPLC method obtained by least squares treat-ment of the results were given in Table 5.
3
ilwdpvmtrc
3
ocrp
3
oiw
3
mt
PLS-1 and PCR models was achieved over set of nine syntheticmixtures of the six components. The concentrations of TH, GP,DP, MP, PP and BZ were falling within the ranges of calibra-tion matrix. The synthetic mixtures were analyzed according tothe previous procedures described under the proposed methods.Satisfactory results were obtained (Table 7), indicating the highselectivity of the proposed methods for simultaneous determi-nation of TH, GP, DP, MP, PP and BZ.
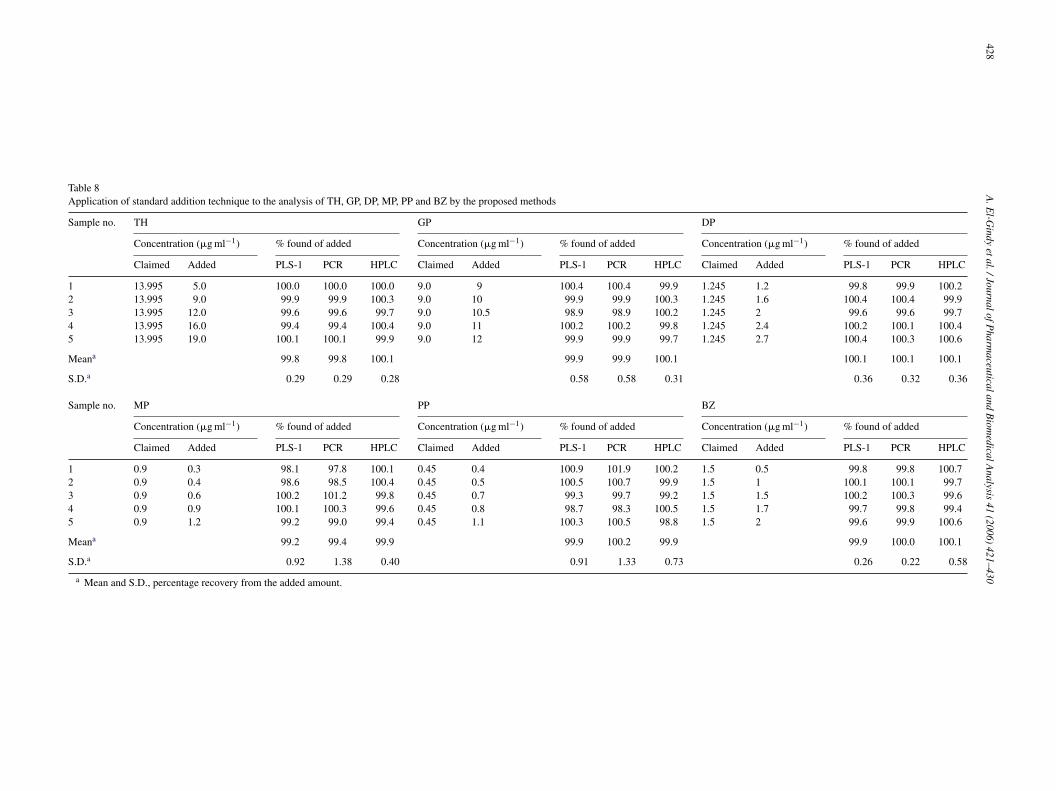
3.5.6. AccuracyThis study was performed by addition of known amounts of
the studied compounds to a known concentration of the com-mercial pharmaceutical syrup (standard addition method). Theresulting mixtures were analyzed and the results obtained werecompared with the expected results. The excellent recoveries ofstandard addition method (Table 8) suggested good accuracy ofthe proposed methods.
3.5.7. RobustnessVariation of pH of the 25 mM potassium dihydrogen phos-
phate of the mobile phase by ±0.1, variation of the percentage oforganic solvent by ±1% did not have significant effect on chro-matographic resolution in HPLC method. Variation of strengthof hydrochloric acid by ±0.02 M did not have significant effecton chemometric methods.
3
hcw
4
litwcba
aohmptbMpaPms
.5.2. PrecisionFor evaluation of the precision estimates, repeatability and
ntermediate precision were performed at three concentrationevels for each compound. The data for each concentration levelere evaluated by one-way ANOVA. A 8 days × 2 replicatesesign was performed. Statistical comparison of the results waserformed using the P-value of the F-test (Table 6). Three uni-ariate analyses of variance for each concentration level wereade. Since the P-value of the F-test is always greater than 0.05,
here is no statistically significant difference between the meanesults obtained from one level of day to another at the 95%onfidence level.
.5.3. RangeThe calibration range was established through consideration
f the practical range necessary, according to each compoundoncentration present in pharmaceutical product, to give accu-ate, precise and linear results. The calibration range of theroposed HPLC method was given in Table 5.
.5.4. Detection and quantitation limitsAccording to ICH recommendations [43] the approach based
n the S.D. of the response and the slope was used for determin-ng the detection and quantitation limits. The theoretical valuesere assessed practically and given in Table 5.
.5.5. SelectivityMethods selectivity was achieved by preparing nine synthetic
ixtures of the studied drugs at various concentrations withinhe linearity range for HPLC. The external validation of the
.5.8. StabilityThe studied compound solutions in the mobile phase or 0.1 M
ydrochloric acid exhibited no chromatographic or absorbancehanges for 4 h when kept at room temperature, and for 10 hhen stored refrigerated at 5 ◦C.
. Conclusion
For routine analytical purposes it is always of interest to estab-ish methods capable of analysing a large number of samplesn a short time period with due accuracy and precision. Spec-rophotometric techniques can generate large amounts of dataithin a short period of analysis; however, when coupled with
hemometrics tools, the quality of the spectral information cane markedly increased, converting this combined technique intopowerful and highly convenient analytical tool.
A comparative study of the use of HPLC and multivari-te calibration (PLS-1 and PCR) methods for the resolutionf six-component mixture of TH, GP, DP, MP, PP and BZas been accomplished, showing that multivariate calibrationethods provide, with adequate software support, a clear exam-
le of the high resolving power of this technique. Althoughhe HPLC method is more specific than the multivariate cali-ration methods, it needs expensive equipment and materials.ultivariate calibration methods are less expensive by com-
arison and they do not require sophisticated instrumentationnd any prior separation step. The proposed HPLC, PLS-1 andCR methods were found to be suitable for the routine deter-ination of TH, GP, DP, MP, PP and BZ in pharmaceutical
yrup.
430 A. El-Gindy et al. / Journal of Pharmaceutical and Biomedical Analysis 41 (2006) 421–430
References
[1] M.H. Abdel-Hay, M.S. El-Din, M.A. Abuirjeie, Analyst 117 (1992)157–160.
[2] M.S. Bispo, M.C.C. Veloso, H.L.C. Pinheiro, R.F.S. de Oliveira, J.O.N.Reis, J.B. de Andrade, J. Chromatogr. Sci. 40 (2002) 45–48.
[3] D. Boberic-Borojevic, D. Radulovic, D. Ivanovic, P. Ristic, J. Pharm.Biomed. Anal. 21 (1999) 15–22.
[4] A. Meyer, T. Ngiruwonsanga, G. Henze, Fresen. J. Anal. Chem. 356(1996) 284–287.
[5] J. Hu, Z. Wang, W. Weng, Yaowu Fenxi Zazhi 10 (1990) 97–99.[6] K.P.R. Shenoy, K.S. Krishnamurthy, I. Vasundhara, Indian Drugs 38
(2001) 428–432.[7] M. Vasudevan, S. Ravisankar, A. Sathiyanarayanan, R.S. Chandan, J.
Pharm. Biomed. Anal. 24 (2000) 25–31.[8] M. Vasudevan, S. Ravisankar, M. George, J. Ravi, Indian Drugs 37
(2000) 489–492.[9] Y.Q. Li, Z.X. Tian, W. Zhao, J.H. Zhu, Yaowu Fenxi Zazhi 20 (2000)
97–98.[10] L.A. Shervington, Anal. Lett. 30 (1997) 927–944.[11] T. Chen, J.R. Pacifico, R.E. Daly, J. Chromatogr. Sci. 26 (1988)
636–639.[12] M.L. Qi, P. Wang, J. Chen, Chromatographia 60 (2004) 105–108.[13] V.V. Vaidya, M. Khanolkar, J.N. Gadre, Indian Drugs 38 (2001) 16–20.[14] L. Carnevale, J. Pharm. Sci. 72 (1983) 196–198.[15] I.I. Hewala, Anal. Lett. 27 (1994) 71–93.[16] T.D. Wilson, W.G. Jump, W.C. Neumann, T. San Martin, J. Chromatogr.
641 (1993) 241–248.[17] C. Barbas, A. Garcia, L. Saavedra, M. Castro, J. Chromatogr. A 870
(2000) 97–103.[[
[[
[22] X.H. Xu, J.T. Stewart, J. Liq. Chromatogr. Relat. Technol. 23 (2000)1–13.
[23] A. Sachan, P. Trivedi, Indian Drugs 36 (1999) 735–738.[24] H. Tomankova, M. Vasatova, Cesk. Farm. 37 (1988) 255–259.[25] H. Tomankova, M. Vasatova, Pharmazie 44 (1989) 197–198.[26] A.F. Marchesini, M.R. Williner, V.E. Mantovani, J.C. Robles, H.C.
Goicoechea, J. Pharm. Biomed. Anal. 31 (2003) 39–46.[27] M.R. Gomez, R.A. Olsina, L.D. Martinez, M.F. Silva, J. Pharm. Biomed.
Anal. 30 (2002) 791–799.[28] H. Iturriaga, J. Coello, S. Maspoch, M. Porcel, Anal. Bioanal. Chem.
374 (2002) 33–38.[29] H.C. Goicoechea, A.C. Olivieri, Anal. Chim. Acta 453 (2002) 289–300.[30] H.C. Goicoechea, A.C. Olivieri, J. Pharm. Biomed. Anal. 20 (1999)
255–261.[31] L.Q. Zhang, X.H. Wu, X. Tang, X.L. Zhu, W.T. Su, Fenxi Kexue Xuebao
18 (2002) 318–320.[32] L.Q. Zhang, X.H. Wu, X. Tang, X.L. Zhu, W.T. Su, Guangpuxue Yu
Guangpu Fenxi 22 (2002) 427–429.[33] F.A. El-Yazbi, M.A. Korany, Spectrosc. Lett. 18 (1985) 543–553.[34] M.A. Korany, M. Bedair, F.A. El-Yazbi, Analyst 111 (1986) 41–44.[35] B.M. Wise, N.B. Gallagher, PLS-Toolbox Version 2.1, Eigenvector
Research Inc., 830 Wapato Lake road, Manson, WA 98831, 2000.[36] R.G. Brereton, Analyst 122 (1997) 1521–1529.[37] M. Blanco, J. Coello, F. Gonzalez, H. Iturriaga, S. Maspoch, J. Pharm.
Sci. 82 (1993) 834–837.[38] H. Martens, T. Naes, Multivariate Calibration, Wiley, Chichester, 1989.[39] A. Espinosa-Mansilla, F. Salinas, I. De Orbe Paya, Anal. Chim. Acta
313 (1995) 103–112.[40] D.M. Haaland, E.V. Thomas, Anal. Chem. 60 (1988) 1193–1202.[41] J.A. Murillo Pulgarin, A. Alanon Molina, P. Fernandez Lopez, Anal.
Chim. Acta 449 (2001) 179–187.[
[
18] J.P. Surmann, M. Glienke, Fresen. Z. Anal. Chem. 332 (1988) 820.19] M.L. Qi, P. Wang, L. Zhou, Y. Sun, Chromatographia 58 (2003)
183–186.20] H. Luo, L.J. Wang, J. Wang, Yaowu Fenxi Zazhi 22 (2002) 222–224.21] I. Caraballo, M. Fernandez Arevalo, M.-A. Holgado, J. Alvarez Fuentes,
A.-M. Rabasco, Drug Dev. Ind. Pharm. 21 (1995) 605–613.
42] K.R. Beebe, J.P. Randy, Seasholtz, Chemometric: A Practical Guide,Wiley/Interscience, New York, 1998.
43] The European Agency for the Evaluation of Medical Products. ICHTopic Q2B Note for Guidance on Validation of Analytical Procedures:Methodology GPMP/ICH/281/95, 1996.