Applebee, Arthur N. - ERIC
64
DOCUMENT RESUME ED 404 626 CS 012 722 AUTHOR Applebee, Arthur N.; And Others TITLE Who Reads Best? Factors Related to Reading Achievement in Grades 3, 7, and 11. The Nation's Report Card. INSTITUTION National Assessment of Educational Progress, Princeton, NJ. SPONS AGENCY Office of Educational Research and Improvement (ED), Washington, DC. REPORT NO ETS-RR-17-R-01; ISBN-0-88685-069-x PUB DATE Feb 88 CONTRACT NIE-G-83-0011 NOTE 63p. PUB TYPE Reports Research/Technical (143) EDRS PRICE MF01/PC03 Plus Postage. DESCRIPTORS Elementary Secondary Education; Family Environment; Grade 3; Grade 7; Grade 11; High Risk Students; Independent Reading; *Reading Achievement; Reading Habits; *Reading Instruction; Reading Research; *Student Attitudes; Teacher Behavior; Teaching Methods IDENTIFIERS National Assessment of Educational Progress ABSTRACT Describing the characteristics and attitudes of a nationally representative sample of 36,000 students in grades 3, 7, and 11, this report details the specific features of reading instruction, how students approach their reading tasks, student reading experiences, and the home and school supports to academic achievement. The report is based the National Assessment of Educational Progress's (NAEP) 1986 assessment of the reading achievement of American schoolchildren. It does not discuss trends over time as many NAEP reports do. Major findings of the report are: (1) students at all three grade levels had particular difficulty with tasks that require them to elaborate upon or defend their evaluations and interpretations of what they read; (2) poor readers reported doing less independent reading than good readers; (3) students reported that their teachers used a variety of instructional approaches to reading instruction; (4) poor readers reported that their teachers used a narrower range of approaches than were used with better readers; (5) poor readers reported using a narrower range of strategies than good readers; (6) students from historically at-risk populations continued to perform poorly relative to the national population at each grade level; and (7) reading proficiency was related to students' general literacy experiences. A procedural appendix is attached. (RS) *********************************************************************** Reproductions supplied by EDRS are the best that can be made from the original document. ***********************************************************************
-
Upload
khangminh22 -
Category
Documents
-
view
2 -
download
0
Transcript of Applebee, Arthur N. - ERIC

DOCUMENT RESUME
ED 404 626 CS 012 722
AUTHOR Applebee, Arthur N.; And Others
TITLE Who Reads Best? Factors Related to ReadingAchievement in Grades 3, 7, and 11. The Nation's
Report Card.
INSTITUTION National Assessment of Educational Progress,Princeton, NJ.
SPONS AGENCY Office of Educational Research and Improvement (ED),
Washington, DC.REPORT NO ETS-RR-17-R-01; ISBN-0-88685-069-xPUB DATE Feb 88
CONTRACT NIE-G-83-0011NOTE 63p.
PUB TYPE Reports Research/Technical (143)
EDRS PRICE MF01/PC03 Plus Postage.
DESCRIPTORS Elementary Secondary Education; Family Environment;Grade 3; Grade 7; Grade 11; High Risk Students;Independent Reading; *Reading Achievement; ReadingHabits; *Reading Instruction; Reading Research;*Student Attitudes; Teacher Behavior; TeachingMethods
IDENTIFIERS National Assessment of Educational Progress
ABSTRACTDescribing the characteristics and attitudes of a
nationally representative sample of 36,000 students in grades 3, 7,
and 11, this report details the specific features of reading
instruction, how students approach their reading tasks, studentreading experiences, and the home and school supports to academicachievement. The report is based the National Assessment ofEducational Progress's (NAEP) 1986 assessment of the readingachievement of American schoolchildren. It does not discuss trends
over time as many NAEP reports do. Major findings of the report are:
(1) students at all three grade levels had particular difficulty withtasks that require them to elaborate upon or defend their evaluations
and interpretations of what they read; (2) poor readers reported
doing less independent reading than good readers; (3) students
reported that their teachers used a variety of instructional
approaches to reading instruction; (4) poor readers reported that
their teachers used a narrower range of approaches than were used
with better readers; (5) poor readers reported using a narrower range
of strategies than good readers; (6) students from historicallyat-risk populations continued to perform poorly relative to thenational population at each grade level; and (7) reading proficiency
was related to students' general literacy experiences. A procedural
appendix is attached. (RS)
***********************************************************************Reproductions supplied by EDRS are the best that can be made
from the original document.***********************************************************************

U S DEPARTMENT OF EDUCATIONOffice of Educational Research and Improvement
EDUCATIONAL RESOURCES INFORMATIONCENTER (ERIC)
tfrThis document has been reproduced asreceived from the person or organizationoriginating it
0 Minor changes have been made toimprove reproduction quality
Points of view or opinions stated in thisdocument do not necessarily representofficial OERI position or policy
THE NATION'SREPORT
CARDmop
Tacters flawed wReadingAchievementin 4rades 3.7 and 11
BEST COPY AVAILABLE EDUCATIONAL TESTING SERVICE

THE NATION'SREPORT
CARD
Wwfleadsflest?Tatters lielaka wReadinyAchievement
in Grades 3.Z and 11
Arthur N. Applebee Judith A. Langer Ina V.S. Mullis
EDUCATIONAL TESTING SERVICE
February 1988
Report No: 17-R-01

2
CONTENTS
Chapter 1Overview 5
Chapter 2Reading Instruction 11
Chapter 3How Students Approach Their Reading Tasks 27
Chapter 4Reading Experiences 37
Chapter 5Home and School Support for Academic Achievement 45
Procedural Appendix 53
This report, No. 17-R-01, can be ordered from the National Assessment of Educational Progress atEducational Testing Service, Rosedale Road, Princeton, New Jersey 08541-0001.
Library of Congress, Catalog Card Number 88-60325
ISBN 0-88685-069-X
The work upon which this publication is based was performed pursuant to Grant No. NIE-G-83-0011 ofthe Office for Educational Research and Improvement. It does not, however, necessarily reflect the
views of that agency.
Educational Testing Service is an equal opportunity/affirmative action employer.
Educational Testing Service. ETS, and al, are registered trademarks of Educational Testing Service
4

ABOUT THIS REPORT
HIS REPORT describes the characteristics and attitudes ofcertain groups of students in relation to how well they can read.Perhaps more importantly, it details the specific features ofreading instruction, how students approach their reading tasks,
student reading experiences, and the home and school supports to academicachievement. It does not discuss trends over time as many NAEP reports do.*
The variety of possible uses of NAEP data and the multiple audiencesinterested in these findings define the characteristics, content, and format of
these reports.
We hope this report will be useful to teachers looking for evidence toconfirm their hunches about good instructional practice. Principals andreading supervisors may find in these pages clues to successes and failures intheir own schools and districts. Finally researchers in the field of reading maydiscover relationships that will suggest new paths to inquiry or supportconventional wisdom.
'See the Procedural Appendix for further discussion of this issue.
-' '", ,-.
5
Archie E. LapointeExecutive Director
3

i
I,t I1
Al

CH *TEOverview
rip
Nearly 36,000students partici-pated In thereading assess-ment ...
HIS REPORT is based on NAEP's 1986 national assessment ofthe reading achievement of American schoolchildren. Theassessment involved nationally representative samples of stu-dents in grades 3, 7, and 11 attending public and private schools
across the nation. Nearly 36,000 students participated in the reading assess-ment, which also examined a wide variety of background factors. The presentreport focuses on those background factors that are most closely related toreading instruction and reading performance, including demographic char-acteristics, instruction, reading strategies, reading experiences, academicorientation, and home influences.
Major Findings
The past two decades have seen considerable change in accepted assump-tions about reading instruction in American schools. Recommendations forgood teaching include moving from an overwhelming emphasis on basalreaders and workbooks toward a greater emphasis on comprehension strate-gies, a wider range of higher-quality reading materials, more independent
7
5

reading for children, and more opportunities for combining reading andwriting activities.* Such changes in schooling are neither universal nor fullyaccepted, but they provide a framework for the present discussion of instruc-tional approaches, reading strategies, reading experiences, and studentachievement at grades 3, 7, and 11. Several conclusions seem warranted fromthe results presented in the chapters that follow:
Students at all three grade levels have particular difficulty with tasks thatrequire them to elaborate upon or defend their evaluations and interpre-tations of what they have read. Continued attention to such skills must bea major priority in instruction.
Poor readers report doing less independent reading than good readers.But, in comparison with good readers, they seem to be even more limitedin their school reading experiences than in the reading they do on theirown. This suggests that poor readers could manage more varied schoolreading experiences than are currently provided by schools.
Students at each of the grade levels assessed report that their teachersuse a variety of instructional approaches designed to develop appropriatereading skills and strategies, before, during, and after reading.
However, poor readers report that their teachers use a narrower range ofapproaches than are used with better readers. The approaches that areused with poor readers are less likely to emphasize comprehension andcritical thinking, and more likely to focus on decoding strategies.
Perhaps as a result, poor readers report using a narrower range ofstrategies to guide their own reading. The approaches reported by theeleventh-grade poor readers were remarkably similar to those reported bytheir third-grade peers.
Results for various demographic subgroups within the population paral-lel those from earlier assessments. In particular, students from histori-cally at-risk populations continue to perform poorly relative to thenational population at each grade level. At grade 11, for example, averageproficiency levels for minority and disadvantaged urban students are onlyslightly above the seventh-grade level for students nationally.
Reading proficiency is also related to students' general literacy experi-ences. The more successful readers are likely to be enrolled in academi-cally oriented programs and advanced courses, to spend regular amountsof time on homework each day, and to have home support for reading.
'R. Anderson, E. Hiebert, J. Scott, and I. Wilkinson, Becoming a Nation of Readers: The Report of theCommission on Reading, The National Academy of Education, The National Institute of Education, and The
Center for the Study of Reading, 1985.
6
... poor readerscould managemore variedschool readingexperiencesthan are cur-rently providedby schools.

The Study
In order to measure students' proficiency, NAEP based the 1986 assess-ment on a wide range of reading materials and asked questions aboutstudents' use of a variety of reading skills and strategies. Thus, the passagesand questions in the assessment were diverse. The selections ranged fromsimple sentences expressing a single concept to complex articles aboutspecialized topics in science or social studies. They included stories and
poems as well as essays and reports, selections drawn from beginning readingbooks and from high school textbooks, and examples of train schedules andtelephone bills. Comprehension was assessed in a variety of ways, rangingfrom multiple-choice questions requiring simple identification of informa-tion to open-ended questions asking students to restructure and interpretwhat they had read and to write out their responses.
For the present report, NAEP used techniques based on item responsetheory to estimate performance at the three grade levels on a common scalethat ranges from 0 to 100, with a mean of 50 and a standard deviation of 10.
The scale is useful in making comparisons between grade levels and amongsubgroups in the population. (See the Procedural Appendix for further
information.)
NAEP assessments make it possible to examine relationships betweenstudent proficiency and a wide variety of background factors, relating perfor-mance to one or two variables at a time. These analyses, however, do not
-..,
9

reveal the underlying causes of these relationships, which may be influencedby a number of events. Therefore, the results are most useful when they areconsidered in the context of other knowledge about the educational system,such as trends in instruction, changes in the school-age population, andsocietal demands and expectations.
Results for the Nation and Demographic Subgroups
NAEP typically reports results separately for a variety of subgroupsdefined by such demographic factors as region of the country, gender, race/ethnicity, grade level, and size and type of community. Results for the nationand for these subgroups are displayed in TABLE 1.1.
Average Reading Proficiency for Studentsin Grades 3, 7, and 11 for the Nationand Subpopulations*
TABLE 1.1
Average Reading Proficiency
Grade 3 Grade 7 Grade 11
Nation 38.1 (0.2) 48.9 (0.1) 56.1 (0.2)
White 39.8 (0.2) 50.3 (0.1) 57.3 (0.2)
Black 33.4 (0.4) 45.2 (0.3) 51.5 (0.3)
Hispanic 33.2 (0.3) 44.4 (0.4) 51.3 (0.3)
Northeast 39.1 (0.3) 50.7 (0.3) 57.4 (0.5)Southeast 37.2 (0.3) 48.1 (0.2) 54.8 (0.3)Central 39.3 (0.4) 49.0 (0.2) 56.5 (0.5)West 36.9 (0.4) 48.0 (0.4) 55.4 (0.4)
Disadvantaged Urban 31.9 (0.5) 43.8 (0.4) 51.2 (0.6)Advantaged Urban 41.2 (0.5) 51.6 (0.4) 59.5 (0.5)
Male 37.3 (0.2) 47.5 (0.2) 54.5 (0.3)Female 38.9 (0.2) 50.3 (0.1) 57.7 (0.2)
Upper Quartile 47.4 (0.1) 58.2 (0.1) 67.3 (0.1)Lower Quartile 25.9 (0.1) 38.1 (0.1) 43.4 (0.1)
*Jackknifed standard errors are presented in parentheses.
Note: For this report, reading proficiency levels and percentages may look similar. Thus, wehave adopted the convention of presenting proficiency levels in boldface. These readingproficiency levels are on a different scale than the proficiency levels previously reportedby NAEP and should not be compared to those results. (See Procedural Appendix.)
8
10

The mostdistressingaspect of theseresults is therelatively poorperformance ofstudents fromat-risk minoritygroups andfrom disadvan-taged urbancommunities.
Overall, the data indicate an increase in reading proficiency from grade 3to 7, and again from grade 7 to 11. This pattern of improvement with gradelevel holds across each of the subgroups sampled.
Parallel to findings in previous assessments, however, at each of the gradelevels assessed, White students perform significantly better than their Blackand Hispanic peers; students from the Northeast and Central states performbetter than those from the Southeast and West; females perform somewhatbetter than males; and students from advantaged urban communities per-form better than those from disadvantaged urban communities. The mostdistressing aspect of these results is the relatively poor performance ofstudents from at-risk minority groups and from disadvantaged urban commu-nities. At grade 11, average proficiency levels for these groups (Blackand Hispanic students as well as students from disadvantaged urbancommunities) are only slightly above the seventh-grade level for all studentsnationally.
Table 1.1 also reports average reading proficiency levels for studentsdivided into upper and lower quartilesthose in the top 25 percent inperformance and those in the bottom 25 percent.
In these results, perhaps the most interesting feature is that the differ-ence in performance levels between the better and poorer readers remainsrelatively constant at each grade level. As in previous NAEP assessments, thissuggests that American schools continue to have difficulty in narrowing theperformance gap between better and poorer readers as they progress throughschool.*
Applebee, 1. Langer, and I. Mullis, Learning to Be Literate in America: Reading, Writing, andReasoning, National Assessment of Educational Progress, Educational Testing Service, 1987; The ReadingReport Card, Progress Toward Excellence in Our Schools: Trends in Reading over Four National Assess-ments, 1971-1984, National Assessment of Educational Progress, Educational Testing Service, 1985.
9


CHAPTER 2ReadingInstruction
... studentsmust learn toreason moreeffectively aboutwhat they read.
ECENT YEARS have seen an increased concern about the criti-cal reading abilities of our nation's students. Although theability to read thoughtfully has been a continuing goal ofreading instruction, a series of studies has indicated that stu-
dents of all ages are seldom thoughtfully engaged by what they read. Inresponse to such findings, a strong educational reform movement has arisen,taking as one of its goals that students must learn to reason more effectivelyabout what they read. They must develop the ability to synthesize, analyze,and extend their ideas and their knowledge.
A variety of research efforts extending over the past 15 years have helpedus to better understand the nature of the comprehension process and the
'A. Applebee, 1. Langer, and I. Mullis, The Reading Report Card, Progress Toward Excellence in ourSchools: Trends in Reading over Four National Assessments, 1971-1984, National Assessment of Educa-tional Progress, Educational Testing Service, 1985; Ernest Boyer, High School: A Report on SecondaryEducation in America, The Carnegie Foundation for the Advancement of Teaching Harper & Row, Publish-ers, New York, 1983; A Nation at Risk: The Imperative for Educational Reform, The National Commissionon Excellence in Education, April 1983.
13
11

ways it can be taught more effectively. The concept of reading as aninteractive process, with readers bringing meaning to the page as much asgetting meaning from the page, is now accepted in the world of practice aswell as research. From this perspective, effective reading instruction entailshelping students learn to orchestrate their knowledge of the content andtheir ways of making sense out of the printed word. In addition to interpret-ing the information they read based on what they already know, studentsneed to acquire a store of reading strategies from which they can select themost appropriate ones for a particular situation. At the same time, as theyread, they need to learn to monitor their developing understanding of a textto ensure that they will leave their reading experiences with the ability to use,describe, defend, or build upon what they have read.
Instructional Approaches:Before, During, and After Reading
To help students become critical readers, effective instruction focuses onthe comprehension process before, during, and after a reading experience.Thus, NAEP's 1986 reading assessment included questions about the fre-quency with which students were exposed to such instruction. Students wereasked to report how often they engaged in a variety of before-, during-, andafter-reading instructional activities. For before-reading activities, studentswere asked how often their teachers previewed the material, discussed newand difficult vocabulary, and read new and difficult parts of the text to thestudents before they read by themselves. For during-reading activities, stu-dents were asked the frequency with which they were given lists of questionsto think about and answer while reading. For after-reading activities, stu-dents reported on how frequently they were asked to think about, discuss,and support their opinions about the text, to relate ideas to one another, andto identify the main idea of the text after having completed reading.
Grade 3
Third graders' reports on teaching procedures are summarized in TABLE
2.1. Overall, approximately two-thirds of the students in grade 3 reportedthat their teachers tended to use each of the techniques described abovewhen giving them new things to read. Previewing or giving a generaloverview of the selection seems to be a particularly widespread activity inthird grade classrooms, with only 16 percent of the students reporting that
*Landscapes: A State-of-the-Art Assessment of Reading Comprehension Research, 1974-1984, Indiana
University, 1985; Handbook of Reading Research, P. D. Pearson, editor, New York: Longman, 1984; R.Anderson, E. Hiebert, J. Scott, and I. Wilkinson. Becoming A Nation of Readers: The Report of the
Commission on Reading, The National Academy of Education, The National Institute of Education, and The
Center for the Study of Reading. 1985.
12
14
Students wereasked to reporthow often theyengaged ina variety ofbefore-, during-,and after-read-ing Instructionalactivities.

they never engaged in such activities. As many as a quarter of the studentsclaimed that their teachers never pointed out hard words, however, and 31percent reported that their teacher never read new parts aloud. Nearly 40percent reported never having received guiding questions to answer whilethey were reading. While self-report data of this sort are often less reliable foryounger than older students, these results suggest that a considerablenumber of students may not be receiving as much instruction surroundingtheir reading experiences as might be desirable.
Percentage of Third-Grade StudentsReporting Frequency of Teaching Procedures*
TABLE 2.1
Before-Reading
Grade 3
AlmostAlwaysPercent
About Halfof the Time
PercentNever
Percent
Points out hard words 38.7 (1.2) 35.7 (0.8) 25.6 (1.2)Previews reading 39.1 (1.1) 45.1 (0.9) 15.8 (1.1)
Reads new partsaloud to class 33.1 (1.0) 35.4 (0.8) 31.5 (1.5)
During-Reading
Gives lists of questionsas you read 29.2 (1.2) 35.0 (1.0) 35.8 (1.4)
After-Reading
Tells how to find main idea 25.5 (0.8) 51.2 (0.7) 23.2 (1.2)
'Jackknifed standard errors are presented in parentheses.
Grades 7 and 11
Seventh and eleventh graders were also asked to report the frequencywith which their teachers used certain instructional techniques when givingstudents reading assignments. The results are displayed in TABLE 2.2.
13
15

Percentage of Seventh-Grade StudentsReporting Frequency of Teaching Procedures*
TABLE 2.2
Before-Reading
Grade 7
AlmostAlwaysPercent
About Halfof the Time
PercentNever
Percent
Points out hard words 32.6 (1.2) 46.0 (0.9) 21.5 (0.9)
Previews reading 44.7 (1.8) 46.3 (1.0) 9.0 (0.8)
Reads new partsaloud to class 41.2 (1.6) 45.7 (0.8) 13.2 (0.8)
During-Reading
Gives lists of questionsas you read 26.1 (1.4) 50.2 (1.0) 23.7 (1.1)
After-Reading
Tells how to find main idea 14.4 (0.9) 54.4 (0.9) 31.3 (1.3)
Asks how oneidea is like another 16.5 (0.8) 62.2 (1.0) 21.4 (1.1)
Asks your opinion 25.7 (1.2) 57.1 (1.0) 17.2 (1.1)
Asks you to support your idea 14.8 (1.0) 61.8 (0.8) 23.4 (1.3)
Has group discuss story 9.0 (0.7) 34.5 (0.7) 56.5 (1.8)
'Jackknifed standard errors are presented in parentheses.
For before-reading activities, there was an increase between grades 7 and11 in teachers' use of previewing the selection, and a decrease in readingaloud and in attention to highlighting difficult words.
After-reading activities were reported somewhat less frequently. Only 15percent of the seventh graders and 26 percent of the eleventh graders, forexample, reported that they "almost always" were asked to support theirideas. The majority of students did report that they were asked "about half ofthe time" to relate the ideas they were studying to one another, to expresstheir opinions, and to support their ideas. Nevertheless, because these activ-ities provide students with the greatest opportunity to ponder what they
14
16

Percentage of Eleventh-Grade StudentsReporting Frequency of Teaching Procedures*
TABLE 2.2(continued)
Before-Reading
Grade 11
AlmostAlwaysPercent
About Halfof the Time
PercentNever
Percent
Points out hard words 26.2 (1.7) 49.6 (1.1) 24.2 (1.3)
Previews reading 50.6 (1.2) 44.3 (0.8) 5.2 (0.7)
Reads new partsaloud to class 32.2 (1.3) 53.8 (0.9) 14.0 (1.1)
During-Reading
Gives lists of questionsas you read 27.7 (1.5) 56.4 (1.0) 15.9 (1.1)
After-Reading
Tells how to find main idea 8.5 (0.7) 58.0 (1.1) 33.5 (1.3)
Asks how oneidea is like another 26.3 (0.7) 62.8 (0.5) 10.9 (0.5)
Asks your opinion 39.5 (0.9) 51.8 (0.5) 8.7 (0.5)
Asks you to support your idea 26.2 (0.7) 58.0 (0.5) 15.8 (0.5)
Has group discuss story 11.9 (0.4) 43.1 (0.5) 45.1 (0.8)
*Jackknifed standard errors are presented in parentheses.
have read and link it to what they know, it is rather disappointing thatstudents did not report engaging in such thoughtful tasks more frequently.Results for grade 11 are somewhat more encouraging than those for grade 7,with students reporting more emphasis on each of these critical-thinkingactivities.
The least frequently used after-reading activity reported by the studentswas the opportunity to discuss what they had read in groups. More than 45percent of the students at grades 7 and 11 reported never having theopportunity to exchange ideas in group discussion, which can be a powerfulcontext for the development of higher-level thinking skills. Small groups are
15
17
difficult to manage, however, and some teachers may avoid using discussion
groups in large classes.
In general, students' responses to these questions about instructionalpractices suggest that, while teachers are using a variety of instructionalstrategies to assist students' comprehension at various stages of the readingexperience, even more emphasis on such activities may be desirable.
Supporting Studentswith Poorer Reading Performance
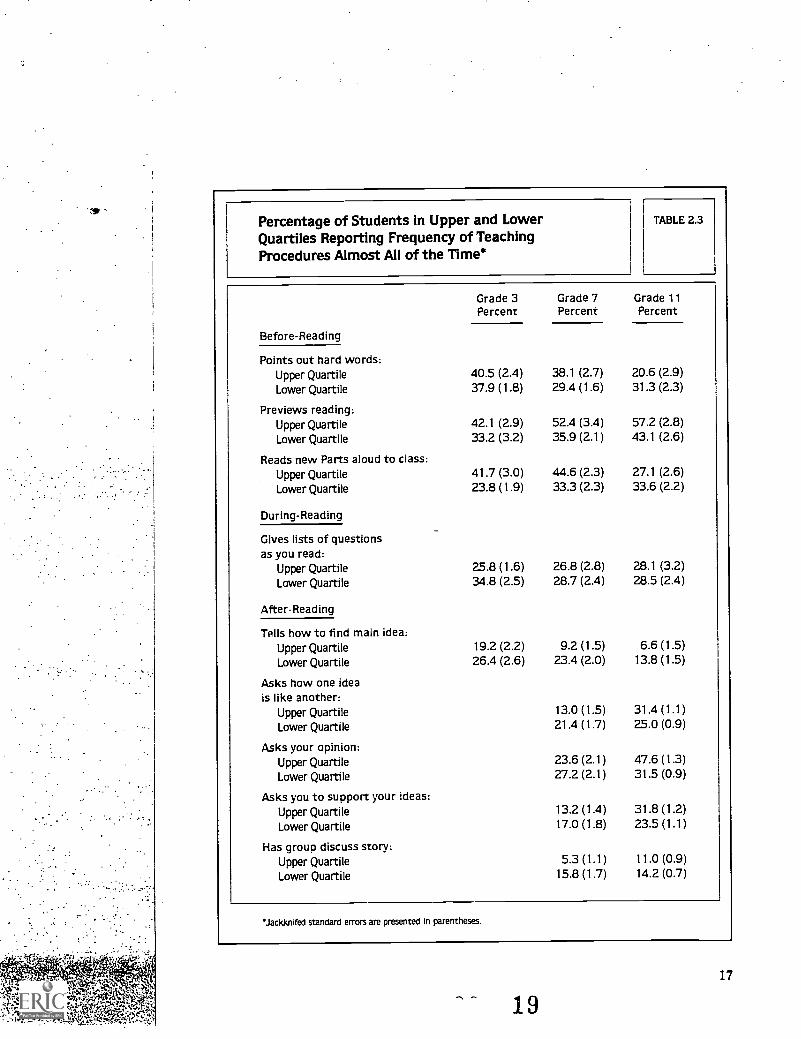
In addition to across-age comparisons, it is interesting to examine theinstruction received by higher- and lower-performing students within thesame age group. TABLE 2.3 displays students' reports about instructionalpractice separately for students in the upper and lower quartiles of achieve-ment in reading. The patterns that emerge are consistent with previousresearch indicating that poorer readers receive qualitatively different instruc-
tion from their higher-performing classmates.*
Students in the upper quartile were more likely to report before-readingactivities, although the patterns differed across the grade levels. It appearsthat in the elementary grades, teachers of betters readers are more likely topreview reading material and read new parts aloud to the classbothactivities which emphasize the meaning of the selection. At the middle-school level, better readers reported more exposure to all three types ofbefore-reading activities than did poorer readers. At the high-school level,better readers reported more previewing of material, while poorer readersindicated their teachers more frequently pointed out the hard words and read
new parts aloud.
.I. Cook-Gumperz, J. Gumperz, and H. D. Simons, Final Report on Schools- Home Ethnograthy Project,National Institute of Education, NIB -G-78 -0082, 1982; R. L Allington, "The Reading Instruction Provided
Readers of Differing Ability," Elementary School Journal, 1983, (pp.255-265).
16
18
... poorer read-ers receive quali-tatively differentinstruction ...
Percentage of Students in Upper and LowerQuartiles Reporting Frequency of TeachingProcedures Almost All of the Mine*
TABLE 2.3
Grade 3 Grade 7 Grade 11Percent Percent Percent
Before-Reading
Points out hard words:Upper Quartile 40.5 (2.4) 38.1 (2.7) 20.6 (2.9)
Lower Quartile 37.9 (1.8) 29.4 (1.6) 31.3 (2.3)
Previews reading:Upper Quartile 42.1 (2.9) 52.4 (3.4) 57.2 (2.8)
Lower Quartile 33.2 (3.2) 35.9 (2.1) 43.1 (2.6)
Reads new Parts aloud to class:Upper Quartile 41.7 (3.0) 44.6 (2.3) 27.1 (2.6)
Lower Quartile 23.8 (1.9) 33.3 (2.3) 33.6 (2.2)
During-Reading_
Gives lists of questionsas you read:
Upper Quartile 25.8 (1.6) 26.8 (2.8) 28.1 (3.2)
Lower Quartile 34.8 (2.5) 28.7 (2.4) 28.5 (2.4)
After-Reading
Tells how to find main idea:Upper Quartile 19.2 (2.2) 9.2 (1.5) 6.6 (1.5)
Lower Quartile 26.4 (2.6) 23.4 (2.0) 13.8 (1.5)
Asks how one ideais like another:
Upper Quartile 13.0 (1.5) 31.4 (1.1)
Lower Quartile 21.4 (1.7) 25.0 (0.9)
Asks your opinion:Upper Quartile 23.6 (2.1) 47.6 (1.3)
Lower Quartile 27.2 (2.1) 31.5 (0.9)
Asks you to support your ideas:Upper Quartile 13.2 (1.4) 31.8 (1.2)
Lower Quartile 17.0 (1.8) 23.5 (1.1)
Has group discuss story:Upper Quartile 5.3 (1.1) 11.0 (0.9)
Lower Quartile 15.8 (1.7) 14.2 (0.7)
'Jackknifed standard errors are presented in parentheses.
1917

In contrast, the use of during-reading activities ( in the form of lists ofquestions or study guides) seems similar for upper- and lower-quartile stu-dents, particularly at the two higher grade levels. However, at grade 3, therewas a tendency for students in the lower quartile to report being given moreduring-reading activities. It is possible that in the elementary grades, ques-tions to guide silent reading are used most often in remedial reading and withlower reading groups, while the before-reading activities that help preparestudents for what they will read are somewhat neglected.
After-reading instructional practices used with better and poorer readersalso tend to vary from grade to grade. The only practice asked about at grade3finding the main ideayielded very similar results for better and poorerreaders. In the upper grades, however, this became primarily a technique usedwith poorer readers. In grade 7, poorer readers generally reported more useof the after-reading activities about which they were asked, perhaps reflect-ing a continuing concern with reading instruction among middle- and junior-high-school students. By grade 11, however, the better readers were morelikely than the poorer readers to be asked what their opinions were, tosupport those opinions, and to indicate how one idea related to anotherallactivities that may reflect an increasing concern with fostering critical-think-ing abilities among these students.
In general, younger students and those in the lower quartiles reportedbeing exposed to different instructional procedures less frequently than didolder students and those in the upper quartiles. Older students and those inthe upper quartiles reported engaging in more before- and after-readingactivities than did their lower-performing classmates, and thus may havemore opportunities to use the knowledge and experiences they alreadypossess to enrich their reading experiences. They were also more likely to beasked to engage in thought-stretching activities after they have finished theirreading of the text. In contrast, their lower-performing classmates seemed toreport receiving more assistance in getting through the text. While this helpis useful, it may be unnecessarily limiting keeping students from alsobeginning to practice the very kinds of reading skills and strategies that areused by their higher-performing classmates.
Responding to Reading
In recent years, both researchers and practitioners have been devotingincreased attention to the links between reading and writing.* Reading andwriting are both activities in which students need to work on building deepermeaning and both call upon similar kinds of knowledge and strategies; goodreading and good writing go hand in hand. Further, writing has the potential
Composing and Comprehending, J. Jensen, editor, Urbana, Illinois, National Conference on Research inEnglish/ERIC, 1984; Convergences: Essays on Reading, Writing, and Literacy, B. Peterson, editor,National Council of Teachers of English, Urbana, Illinois, 1986.
18
2.0
By grade 11,however, thebetter readerswere more likelythan the poorerreaders to beasked what theiropinions were ...
In contrast, theirlower-perform-ing classmatesseemed toreport receivingmore assistanceIn getting
through the text.

to foster deeper and more critical thinking about what a student has read.When students are asked to analyze, interpret, or evaluate what they haveread (and to do so in writing), they must not only reason effectively but mustalso communicate their ideas in ways that others can understand. This sort ofcritical thinking is often perceived to be at the heart of an academic educa-tion. In spite of the importance of such skills, previous NAEP assessmentshave indicated that while the nation's students have the skills to derive asurface understanding of what they read, they have difficulty when asked todefend or elaborate upon this surface understanding.
To assess students' ability to read and respond critically, three tasks in the1986 reading assessment were designed to provide students with the oppor-tunity to read, think, and write; two were stories and one was an expositorypiece similar to the kind students read for social studies. The three tasks aredescribed briefly below:
"Eggplant" is a humorous piece. After reading it the stu-dents were asked to make predictions about characterreactions based on what they had read and then to supporttheir responses with details from the original story.
"Goods to Market" is an informative piece. Students wereasked to read this social studies passage and to makecomparisons between what they had read and their ownexperiences.
"Jacob," the third item, was given at all three grades. Thetext follows:
IP. Questions 9-13. A student wrote the following story for a school assignment. Thestory has been typed exactly as the student wrote it. Read the story and then answerthe questions based on it.
Paragraph"Jake! Hey Jacob! Come ride your bicycle with me!"
2 I was calling my brother, Jacob, to ask him to bicycle ride withme. I knew he loved bicycle riding almost as much as he lovedcandy, and cake, and ice cream. Why shouldn't I know! I've knownJacob since he was born five years ago.
3 "O.K. Sarah, I'll bike ride with you, but only if I can bring my StarWars action figures. They will protect us if a big dog comes; 'saidmy brother in a shaky voice. He's afraid of big dogs. He's afraid thedogs will bite him.
continued
`A. Applebee, I. Langer, and I. Mullis, Learning to Be Literate in America: Reading, Writing, andReasoning, National Assessment of Educational Progress, Educational Testing Service. 1987.
19
21

continued
4 "You can bring one action figure," I said. "If you bring any moreyou won't have a hand free to steer your bicycle with."
5 "O.K." Jacob answered once more. That's one of the things I loveabout my brother. He's so agreeable. In fact, just about the onlytime he gets mad is when he can't have dessert since he didn'thave dinner, or when my sister Rebecca and I tease him if he can'tdo something like climb a tree as high as us. Then he cries.
6 I hate it when Jacob cries.7 His mouth puckers up like he's kissing but then his lips quiver,
and his nose wrinkles up, and tears stream from his eyes, soakinghis brown glasses. His greenish-brown eyes look so sad.
8 When he looks like this I forget why I was teasing him and run upto him and stroke his short brown hair and big ears until he stopscrying.
9 "Sarah! Let's go," said my brother. He was getting tired of waitingfor me to stop dreaming so that we could start riding.
10 As I got on my big, tan bicycle, and Jacob got onto his small, blueone Jacob asked me, "When we get home can we draw on thesidewalk in chalk? I want to draw superheroes so they can give merides on their backs."
11 Jacob said this in the high, silly voice he gets when he's happy.
12 "Sure!" I told him.
13 Then we rode off down the street. Just my brother Jacob and I.
9. What do you think is the most important thing the author is trying to say?
10. Explain why you think so.
Students produced their responses under the usual constraints of testingrather than instructional conditionslimited time, no provision for revisingtheir work at some later time, and reading passages that were unfamiliar tothem. However, the passages included in the assessment are similar to thetype of reading material that students are given in school, making themrelatively familiar. As indicated in the following description of the evaluation
20 22BEST COPY AVAILABLE

... students hadgreat difficultyexpressing evenone substantivethought.
criteria for the Jacob task, NAEP's scoring reflected the complexity ofstudents' thinking. However, the criteria were lenient, and success at eventhe highest level did not require extensive understanding or a lengthyresponse. Still, students had great difficulty expressing even one substantive
thought.
For each reading passage, students' responses were evaluated holisticallybased on their overall success in responding to the questions asked and thedefense of their ideas using supporting evidence.
The following student response to the two open-ended questionsabout the Jacob passage is typical of answers that were rated together asinadequate:
9. The. q uTh 111" is t riA9 +0 d;5../
10. ,grcitise, sbry Ls tell'. ngahou f TiRco12.
9.
Responses that were rated as minimal either did not answer the question, ormade irrelevant, inappropriate, or overgeneralized comments. A typical exam-ple looked like this:
-A-Vists -\--N 2 Jr.; 5 --u%%{ +if\
-*0 i 5 -Jae\ e ,c3/erN61/4S an_ 4.-In
2321

10.
(lc le- -5°5; / / Lit T4A G S/cai C7# 0*e... a/to_ wie A .e is -ka(vy
In contrast, a satisfactory response included an interpretation or general-ization and one appropriate reason, such as:
46"Xe- 77CL.11-:5- 746, Jr4e.,
22
24

Responses that went beyond a single reason, stating an interpretation orgeneralization and providing at least two appropriate reasons or one elabo-rated reason, were rated as elaborated. A typical example follows:
kx-thul .
As in previous assessments, students at all ages had difficulty respondingto questions of this sort; results are summarized in TABLE 2.4. As many as 80
percent of the third graders wrote inadequate or minimal responses to theJacob item, and only 18 percent could produce a satisfactory response.Although the eleventh graders performed with greater success, 36 percentwrote inadequate or minimal responses, and only 22 percent wrote elabo-rated responses. This is disappointing, because the criteria for the elaboratedlevel required only that the student provide a brief elaborated explanation ortwo unelaborated reasonsa seemingly simple task for a reader who hadunderstood the passage.
23
25

Percentage of Students at Each Levelof Response in Writing Basedon Reading Passages
TABLE 2.4
Jacob
Grade 3Percent
Grade 7Percent
Grade 11Percent
Inadequate 70.0 (1.2) 36.7 (1.4) 20.8 (1.0)
Minimal 10.7 (1.0) 17.7 (0.9) 15.6 (0.9)
Satisfactory 18.5 (1.0) 38.1 (1.1) 41.3 (1.5)
Elaborated 0.8 (0.3) 7.5 (0.8) 22.3 (1.8)
Goods
No comparison 69.6 (1.5) 36.2 (1.4) 25.6 (1.4)
Unsatisfactory comparison 29.9 (1.5) 60.4 (1.4) 62.9 (1.6)
Minimal comparison 0.5 (0.2) 3.2 (0.5) 9.0 (1.1)
Satisfactory comparison 0.0 (0.0) 0.2 (0.2) 1.6 (0.4)
Elaborated comparison 0.0 (0.0) 0.0 (0.0) 0.9 (0.3)
Eggplant
Inadequate 16.6 (1.2) 5.8 (0.7)
Minimal 18.8 (1.1) 16.4 (0.9)
Satisfactory 50.4 (1.8) 58.1 (1.4)
Elaborated 14.3 (0.7) 19.7 (1.2)
24
26

Alt studentsneed to developeffective strate-gies for thinkingabout, elaborat-ing upon, and
communicatingwhat they havelearned.
Results for the other two passages were similarly poor, with the social-studies passage proving to be so difficult that 88 percent of the eleventhgraders responded at the minimal level or below. Students were apparentlyunable to relate what they had read to their everyday experiences and makea simple comparison.
These findings are disturbing, but not surprising. They parallel thefindings of earlier NAEP reading and writing assessments, which indicatedthat students in American schools can read with surface understanding, buthave difficulty when asked to think more deeply about what they have read,to defend or elaborate upon their ideas, and to communicate them inwriting.*
Once again, as in the past few assessments, the conclusion is clear.Reading instruction at all levels must be restructured to ensure that studentslearn to reason more effectively about what they have read. All students needto develop effective strategies for thinking about, elaborating upon, andcommunicating what they have learned.
A. Applebee, 1. Langer, and I. Mullis, Learning to Be Literate in America: Reading, Writing, andReasoning, National Assessment of Educational Progress, Educational Testing Service, 1987; The ReadingReport Card, Progress Toward Excellence in Our Schools: Trends in Reading over Four National Assess-ments, 1971-1984, National Assessment of Educational Progress, Educational TestingService, 1985.
27
25

ghelleadersglepertare
. '
. . -
It ,c
4,-
' Tfr.k-N

CHAPTEj 3How StudentsApproach TheirReading Tasks
... teachershave becomeIncreasinglyaware of theimportance ofproviding stu-dents with abroad array ofstrategies forguiding theirreading.
URING THE past decade, teachers have become increasinglyaware of the importance of providing students with a broadarray of strategies for guiding their reading. Teachers have alsobecome increasingly aware that reading involves much more
than a process of decoding. It also requires systematic attention to theprocess of comprehension.
Because of the importance of such strategies, a variety of questionsincluded in the assessment asked students about one or another aspect oftheir approach to reading. Results from these questions make it possible toexamine the extent to which students at different grades are developing anappropriate array of reading comprehension strategies, as well as to examinehow better and poorer readers are learning to go about their reading tasks.
To provide an overview of students' general approaches to their reading,
one question asked students what they thought about as they read.Responses to this open-ended question were then categorized to reflect thetypes of student answers. The results are summarized in TABLE 3.1.
29
27

3
What Students Think About When They Read*
Grade 3 Grade 7
Percent Proficiency Percent Proficiency
Comprehension 21.4 (0.7) 39.8 (0.4) 26.4 (0.9) 49.8 (0.5)Unfolding of plot 6.7 (0.6) 42.6 (0.9) 12.8 (0.9) 50.5 (0.5)Setting and characters 8.0 (0.7) 41.8 (0.8) 18.3 (0.9) 51.6 (0.4)Relating story.to self 10.5 (0.6) 41.7 (0.4) 18.3 (1.1) 51.4 (0.6)Construction of story 2.8 (0.4) 40.8 (1.0) 4.3 (0.4) 50.0 (1.1)Reaction to story 6.7 (0.7) 37.9 (0.8) 6.3 (0.8) 48.8 (0.7)Decoding 3.0 (0.5) 39.1 (1.6) 1.1 (0.4) 46.7 (2.1)
No response/Unrateable 43.7 23.4
Percent of Students
Grade 3 Grade 7
Upper_Quartile
LowerQuartile
UpperQuartile
LowerQuartile
Comprehension 25.9 (2.0) 11.4 (1.4) 28.1 (2.3) 20.7 (1.6)Unfolding of plot 11.2 (2.3) 2.1 (0.6) 16.1 (1.8) 8.2 (1.3)Setting and characters 11.9 (1.7) 3.4 (0.9) 25.3 (1.8) 9.3 (1.5)Relating story to self 17.3 (2.0) 4.5 (0.6) 25.6 (2.3) 10.6 (1.3)Construction of story 3.6 (0.9) 0.8 (0.4) 3.9 (1.2) 3.0 (0.7)Reaction to story 5.9 (1.1) 6.7 (1.4) 4.2 (0.8) 7.1 (2.5)Decoding 2.4 (0.7) 1.9 (0.5) 0.9 (0.4) 1.7 (0.7)
No response/Unrateable 24.5 68.6 11.1 43.3
'Jackknifed standard errors are presented in parentheses.
At each of the three grades, comprehension was the most frequentcategory of response (reflecting 28 percent of the students by grade 11).Other frequent responses involved particular aspects of comprehension, suchas an understanding of setting and characters, or attention to the relation-ships between what students were reading and their own experiences (Relat-ing Story to Self).
28
Differences in the responses of older and younger readers, as well as be-
30

TABLE 3.1
Grade 11
Percent Proficiency
27.9 (0.9) 56.5 (0.6)
9.9 (0.7) 55.1 (0.8)
23.2 (1.3) 58.1 (0.4)
23.7 (1.2) 58.1 (0.6)
8.7 (0.9) 57.0 (1.0)
4.3 (0.6) 53.8 (1.2)
0.6 (0.2) 57.9 (4.1)
20.2
Grade 11
UpperQuartile
LowerQuartile
31.1 (2.4) 24.1 (2.0)
8.2 (1.2) 11.7 (2.1)
31.1 (2.5) 13.4 (1.9)
30.8 (2.3) 13.9 (1.5)
10.3 (2.0) 6.5 (1.3)
2.5 (0.7) 6.8 (1.9)
0.9 (0.5) 0.5 (0.3)
9.3 39.2
tween those of better and poorer readers (upper and lower quartiles), are alsosummarized in TABLE 3.1. The most striking aspect of these comparisons isthat older and better readers seemed much more able to articulate what theythought about while they read. Older and better readers were more likely torespond to this question, and when they did respond, drew upon a broaderrange of responses than did younger and poorer readers. They seemed to havea greater awareness of their own reading processes-a factor which may alsohelp them manage their own reading strategies more effectively.
, 3129
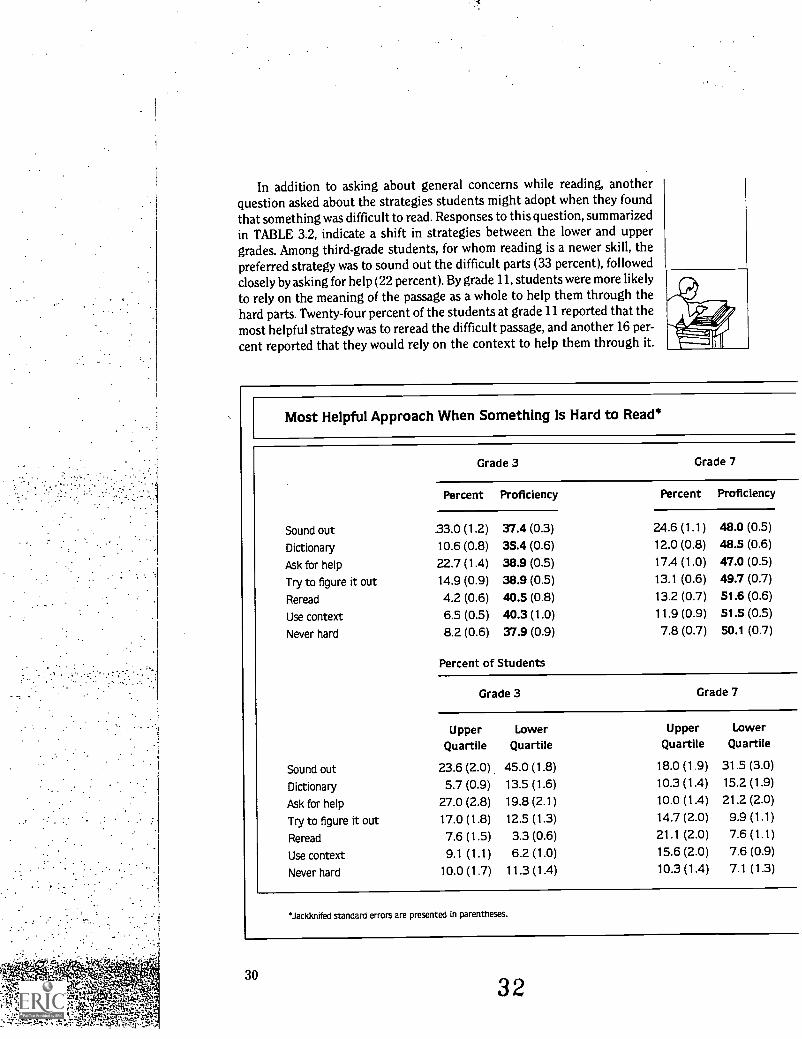
In addition to asking about general concerns while reading, anotherquestion asked about the strategies students might adopt when they foundthat something was difficult to read. Responses to this question, summarizedin TABLE 3.2, indicate a shift in strategies between the lower and uppergrades. Among third-grade students, for whom reading is a newer skill, thepreferred strategy was to sound out the difficult parts (33 percent), followedclosely by asking for help (22 percent). By grade 11, students were more likelyto rely on the meaning of the passage as a whole to help them through thehard parts. Twenty-four percent of the students at grade 11 reported that themost helpful strategy was to reread the difficult passage, and another 16 per-
cent reported that they would rely on the context to help them through it.
Most Helpful Approach When Something Is Hard to Read*
Grade 3 Grade 7
Percent Proficiency Percent Proficiency
Sound out 33.0 (1.2) 37.4 (0.3) 24.6 (1.1) 48.0 (0.5)
Dictionary 10.6 (0.8) 35.4 (0.6) 12.0 (0.8) 48.5 (0.6)
Ask for help 22.7 (1.4) 38.9 (0.5) 17.4 (1.0) 47.0 (0.5)
Try to figure it out 14.9 (0.9) 38.9 (0.5) 13.1 (0.6) 49.7 (0.7)
Reread 4.2 (0.6) 40.5 (0.8) 13.2 (0.7) 51.6 (0.6)
Use context 6.5 (0.5) 40.3 (1.0) 11.9 (0.9) 51.5 (0.5)
Never hard 8.2 (0.6) 37.9 (0.9) 7.8 (0.7) 50.1 (0.7)
Percent of Students
Grade 3 Grade 7
UpperQuartile
LowerQuartile
UpperQuartile
LowerQuartile
Sound out 23.6 (2.0) 45.0 (1.8) 18.0 (1.9) 31.5 (3.0)
Dictionary 5.7 (0.9) 13.5 (1.6) 10.3 (1.4) 15.2 (1.9)
Ask for help 27.0 (2.8) 19.8 (2.1) 10.0 (1.4) 21.2 (2.0)
Try to figure it out 17.0 (1.8) 12.5 (1.3) 14.7 (2.0) 9.9 (1.1)
Reread 7.6 (1.5) 3.3 (0.6) 21.1 (2.0) 7.6 (1.1)
Use context 9.1 (1.1) 6.2 (1.0) 15.6 (2.0) 7.6 (0.9)
Never hard 10.0 (1.7) 11.3 (1.4) 10.3 (1.4) 7.1 (1.3)
'Jackknifed standard errors are presented in parentheses.
3032

... sounding outwords was themost popularstrategy ...
When the responses of students in the upper and lower quartiles of eachgrade level are looked at separately, an interesting pattern emerges. At grade3, although there were some differences in the strategies reported by betterand poorer readers, the overall pattern for the two groups was very similar. inboth groups, sounding out words was the most popular strategy, followed byasking for help or trying to figure it out. The strategies adopted by the poorerreaders show only a little change across the grades (primarily, a slightincrease in the proportion who would rely on rereading or context and aslight decrease in the proportion sounding out words or willing to claim thatthey never found that parts were hard to read). For the good readers, on theother hand, there is considerable development in the approaches they
reported, with a shift toward a much greater reliance on theuse of context and rereading and away from sounding out orasking for help.
TABLE 3.2
Grade 11
Percent Proficiency
16.1 (0.9) 52.3 (0.5)
11.9 (0.8) 55.3 (0.9)
8.4 (0.8) 52.9 (0.9)
14.6 (1.0) 55.1 (0.7)
23.6 (1.3) 57.8 (0.6)
16.4 (0.8) 57.5 (0.7)
9.1 (0.7) 57.3 (1.0)
Grade 11
UpperQuartile
LowerQuartile
8.8 (1.7) 23.9 (2.6)
11.9 (2.1) 14.4 (1.8)
4.3 (1.4) 14.3 (1.9)
12.5 (1.8) 13.5 (2.3)
28.5 (2.8) 13.6 (1.7)
19.3 (2.1) 12.3 (1.7)
14.7 (2.1) 8.0 (1.1)
Such a pattern is consistent with recent studies that havesuggested 1) that young readers focus on smaller units oftext in their quest for meaning, but abandon this as they gainability to deal with larger text levels* and 2) that betterreaders are taught more effective reading strategies, whilepoorer readers are likely to have their old, less-effectivestrategies reinforced.**
'J. A. Langer, Children Reading and Writing, Ablex, Norwood, New Jersey, 1986
"R. L Allington, "The Reading Instruction Provided Readers of Differing Ability,"
Elementary School Journal, 1983, (pp. 255-265).
31

Purpose for Reading Stories
The final set of questions related to students' approaches to reading askedabout their purposes in reading stories, both in and out of school. Responsesto these questions showed some interesting differences between home andschool contexts for reading, as well as between better and poorer readers.
When they read for school, students focus on the pragmatic aspects oftheir reading (TABLE 3.3); they reported that they read primarily to learnsomething new or to answer questions about what they have read. Thebalance between these two purposes shifted somewhat across the grades,with learning receiving more emphasis in grade 3 than did answering ques-tions, while at grade 11 answering questions received more emphasis thanlearning. It appears that as students go through school, both those in theupper and lower quartiles increasingly read to answer particular questionsrather than for more general learning or relaxation.
32
... both those inthe upper andlower quartilesIncreasinglyread to answerparticular ques-tions rather thanfor more generallearning orrelaxation.
Purpose for Reading Stories in School*
Grade 3
Percent Proficiency
To learn something new 43.9 (1.5) 39.3 (0.3)To talk with friends about it 8.3 (0.6) 33.6 (0.6)To imagine myself in story 9.2 (0.6) 34.8 (0.9)To relax 8.0 (0.6) 36.3 (0.7)To answer questions about it 30.6 (1.3) 39.5 (0.5)
Percent of Students
Grade 3
UpperQuartile
LowerQuartile
To learn something new 48.9 (3.0) 33.9 (1.7)To talk with friends about it 2.3 (0.6) 13.5 (1.5)To imagine myself in story 5.0 (1.5) 14.5 (1.7)To relax 7.3 (1.0) 12.1 (1.7)To answer questions about it 36.5 (2.3) 26.0 (2.4)
'Jackknifed standard errors are presented in parentheses.
34

TABLE 3.3
Grade 7 Grade 11
40.6 (1.0) 48.8 (0.3)
4.5 (0.6) 44.2 (1.3)
6.6 (0.8) 46.1 (0.8)
6.1 (0.6) 46.6 (0.9)
42.2 (1.0) 49.9 (0.3)
32.1 (1.1) 57.6 (0.4)
2.0 (0.3) 50.4 (1.7)
1.7 (0.3) 48.4 (1.9)
4.5 (0.7) 55.5 (1.2)
59.6 (1.1) 57.4 (0.4)
Grade 7 Grade 11
UpperQuartile
LowerQuartile
UpperQuartile
LowerQuartile
39.7 (2.4) 37.0 (2.5) 34.4 (2.1) 29.1 (2.8)
2.4 (0.9) 9.2 (1.7) 0.3 (0.2) 4.7 (1.2)
4.5 (1.1) 10.4 (1.4) 0.8 (0.3) 4.9 (1.3)
4.3 (0.8) 8.7 (1.4) 3.4 (0.9) 6.6 (1.3)
49.1 (2.2) 34.8 (1.9) 59.2 (2.4) 54.8 (2.8)
3533

Out-of-school reading differed from in-school reading primarily in stu-dents' emphasis on reading in order to relax (TABLE 3.4). The proportion ofstudents claiming to read in order to relax or pass the time increased acrossthe grades, from 20 percent at grade 3 to 55 percent at grade 11. Thepercentage of students reporting that their out-of-school reading was doneprimarily to learn something new showed a parallel decrease, from 40 percentat grade 3 to 20 percent at grade 11. In this out-of-school reading, the betterreaders were more likely to emphasize reading to relax, while the poorerreaders were more likely to emphasize both reading to learn something newand reading to relax. However, a greater percent of poor readers reportedthat they did not read outside of school.
The results reported in this chapter suggest that most students arelearning to treat reading as a process of comprehension and to recognize thatit can serve a variety of purposes. For the more proficient readers, this isaccompanied by the development of a variety of meaning-making strategies
34
The proportionof studentsclaiming to readin order to relaxor pass the timeIncreased acrossthe grades ...
Purposes for Reading Stories Out of School*
Grade 3
Percent Proficiency
To learn something new 39.5 (1.3) 36.7 (0.4)
To talk with friends about it 5.3 (0.6) 33.3 (0.8)To imagine myself in story 12.4 (0.7) 39.9 (0.8)To relax 19.9 (1.1) 43.2 (0.4)Don't read out of school 22.8 (0.9) 36.4 (0.4)
Percent of Students
Grade 3
UpperQuartile
LowerQuartile
To learn something new 27.2 (1.8) 45.4 (2.3)To talk with friends about it 2.4 (0.9) 9.6 (1.3)To imagine myself in story 17.4 (2.2) 10.8 (1.6)
To relax 39.5 (2.7) 7.8 (1.5)Don't read out of school 13.5 (1.9) 26.4 (1.8)
'Jackknifed standard errors are presented in parentheses.
36

that may help them gain more effective control of the reading process. Forthe less proficient readers, however, there is less evidence of the developmentof a broader repertoire of reading strategies. The approaches reported by theeleventh-grade poor readers were remarkably similar to those reported bytheir third-grade peers.
Grade 7 Grade 11
Percent Proficiency Percent Proficiency
17.1 (0.8) 46.1 (0.6) 19.8 (1.0) 55.1 (0.5)4.4 (0.4) 45.6 (0.8) 2.3 (0.4) 50.5 (1.7)
16.2 (0.9) 48.8 (0.6) 8.2 (0.7) 57.2 (1.3)46.8 (1.3) 51.2 (0.2) 54.5 (1.3) 59.1 (0.4)
15.5 (1.0) 45.0 (0.5) 15.1 (1.3) 53.3 (0.8)
Grade 7 Grade 11
UpperQuartile
LowerQuartile
UpperQuartile
LowerQuartile
11.7 (1.6) 28.0 (1.7) 13.5 (2.0) 24.2 (2.8)
2.7 (1.0) 7.3 (1.1) 1.1 (0.5) 5.9 (1.5)13.9 (1.7) 13.1 (1.4) 8.1 (1.7) 9.4 (1.7)
64.8 (2.3) 23.7 (2.2) 67.6 (2.8) 33.8 (2.9)
6.9 (1.2) 27.9 (1.7) 9.6 (1.3) 26.7 (2.8)
, -
37
35

11% Op
IN-
Im
amm
a11
[101
11=
MIM
I=
OE
M00
111
Mal
ign
1172
ram
ow
amm
o.fl
e
111 I. P
grip
:Ma
.".'1
1:31
.; rt.f
.0
OM
B
Am
muo
mm
ire
Vgr
4;ii
r tA
ra.in
V?
s `'A
alk
t .:1
11W
aVA
Via
t.k.
wa
saw
.:411
,11- sa
Isal
F-...
"-a IS
SAS%
a--
,,,,,=
xle
.---
a-.
......
_T
rEal
atn-
mu
-ill
Ca
wav
alt
Ital
lIM
1I.
Wtn
.421
1`.`
----
-
.4fi
taaj
irin
tara
l74
.171
AW
Wla
1"-
T45
1"K
ak11
1111
1IIM
IIIS
a 11
:L
ILN
..MIR
S111
11.=
MM
S17.
=M
S11
1111
1111
%11
1"=
=ila
1161
1110
1111
1111
11M
ILsa
mol
ia
zum
aii
AIV
Ip%
SUM
lart
1111
1111
1111
1111
1111
1111
1111
=1
%am
IM
ILIL
IIL
SUSS
IMIM
ILIS
MIS
SIM
OIM
SVW
as m
mal
Mlif
tlair
mm
a
111.
TIM
MW
M&
"-A
VR
E-I
X
Zit%
Ira
OA
1111
111
MII
IISI
MI
aliP
IMIL
Is
410,
41.-
___A
IIM
UIV
WS
.A,III
IIMIN
IS
1811
1111
yve
ir.
.4aor
nann
iilin
dlim7
un-
,a41
8im
mom
aau
sam
at.
Ara
i.....
ames
taxi
ma
lici,,
detr
aira
nini
rair
its-f
ill
US ,,,
,...
rt..
......
...,..
...
.....
UR
RR
UU
..1 m
illso
mas
Pipm
soili
nvai
RIm
aial
Ilin
anin
tria
rdat
ralh
fisni
umas
Irm
s...
..-nr
.. 6
-=
ma
mum
mam
a m
rat u
mM
UE
RO
M u
ms WAWA UM
S %
SIM
S SS
IISI
AR
II11
1111
1111
1111
WIS
IIIL
IAL
S.
111S
SIM
S%I%
%
S %
WW
1%
WI
V S
LIM
Va
IMM
AT
IAM
Ito
ural
isus
saT
ircl
7CM
"'WA N=
'SU
ILIL
UO
Rsa
vaW
aval
IRS
12N
e%
1111
111%
1111
1111
111V
1111
111
asM
k U
M11
1111
111%
1C1
1111
1111
1111
ME
ILII
IP11
11
ILI%
ItkV
IIL
IIII
rew
assu
men
%M
IRnu
alva
mea
Ann
%11
1111
1011
1111
1111
111
1111
111
MIL
1111
1751
PIA
IMS
a.11
1111
1111
III
TM
ftr,
a-at
VrI
lL11
111.

CHA TER 4ReadingExperiences
They will alsodevelop theInterest andmotivation toread frequentlyand widely ontheir own.
F OUR schools are successful, students will develop the skillsnecessary to read a wide range of materials. They will also developthe interest and motivation to read frequently and widely on theirown. This chapter will consider the extent to which such goals are
being accomplished by examining students' reports about what and howoften they read. Because somewhat different questions were asked of thirdgraders than were asked of seventh and eleventh graders, third-grade resultswill be discussed separately.
Independent Reading at Grade 3
Third graders answered two general questions about the amount ofindependent reading they do. Results are summarized in TABLE 4.1.
39
37

Percentage of Students in Grade 3 ReportingIndependent Reading Experiences*
How often do you readon your own in school:
Daily Weekly Monthly Yearly
Nation 64.5 (1.2) 20.0 (1.0) 5.3 (0.6) 3.3 (0.3)
Upper Quartile 75.0 (2.4) 18.7 (2.1) 2.3 (0.6) 1.3 (0.5)Lower Quartile 56.6 (2.5) 19.0 (2.1) 9.2 (1.5) 4.3 (0.9)
How often do you readfor fun on your own time:
Nation 47.9 (1.2) 24.9 (1.1) 7.9 (0.8) 5.5 (0.5)
Upper Quartile 56.2 (2.4) 24.8 (2.1) 6.4 (1.2) 3.7 (0.9)Lower Quartile 47.6 (2.5) 17.1 (1.6) 9.3 (1.5) 7.0 (1.3)
*Jackknifed standard errors are presented in parentheses.
Overall, a considerable percentage of the students reported daily indepen-dent reading, both in school and for fun on their own time. Very few thirdgraders reported doing no independent reading at all, either in school(7 percent) or for fun on their own time (14 percent). There were dramaticdifferences, however, between the amount of independent reading reportedby the better and poorer students, particularly in school. In school, 73 percentof the better third-grade readers reported daily independent reading activi-ties, compared to only 57 percent of the third graders in the lowest quartile.On their own, 57 percent of the better readers reported daily independentreading, compared with 48 percent of the poorer readers.
These results reflect a dilemma. The poorer readers presumably havemore difficulty reading on their own and, therefore, are less likely to beencouraged to do so. Yet the fewer opportunities they have to read, the fewerare their chances to become better readers. It is interesting to note that thestudents' reports indicate more difference between good and poor readers inthe amount of independent reading they do in school than in the amountthey do on their own. It may be that expectations for the poorer readers are
38
40
The poorerreaders pre-sumably havemore difficultyreading on theirown and, there-fore, are lesslikely to beencouraged todo so.

sometimes set too low, asking them to read less than they might be capableof doing.
Variety of Materials
Students need to be encouraged not only to read frequently, but also toread a variety of different kinds of materials. Students' reports on theirreading experiences in grade 3 are summarized in TABLE 4.2.
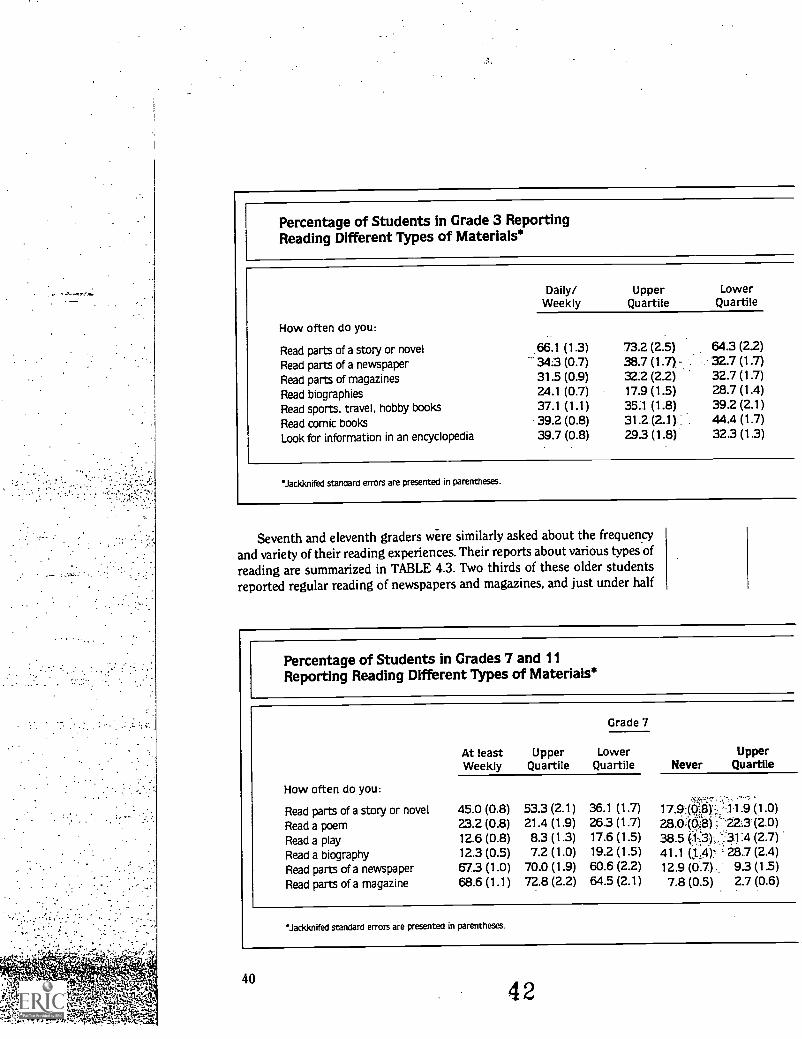
The results in Table 4.2 suggest that third graders' reading is dominatedby stories. This is not surprising since reading instruction, which constitutesa significant portion of the school day, relies largely on the use of the basalreader, which is story-based. Substantial proportions of students report thatthey never read such other materials as newspapers, magazines, biographies,or even comic books. In this case, the reports from the better studentssuggest that their reading experiences may be even less varied than those ofthe less-successful readers, who are somewhat more likely to report frequentreading of biographies and comic books.
41
39
Percentage of Students in Grade 3 ReportingReading Different Types of Materials*
How often do you:
Daily/Weekly
UpperQuartile
LowerQuartile
Read parts of a story or novel 66.1 (1.3) 73.2 (2.5) 64.3 (22)Read parts of a newspaper 34.3 (0.7) 38.7 (1.7)- 32.7 (1.7)
Read parts of magazines 31.5 (0.9) 322 (2.2) 32.7 (1.7)
Read biographies 24.1 (0.7) 17.9 (1.5) 28.7 (1.4)
Read sports, travel, hobby books 37.1 (1.1) 35.1 (1.8) 392 (2.1)
Read comic books 392 (0.8) 312 (2.1) 44.4 (1.7)
Look for information in an encyclopedia 39.7 (0.8) 29.3 (1.8) 32.3 (1.3)
*Jackknifed standard errors are presented in parentheses.
Seventh and eleventh graders were similarly asked about the frequencyand variety of their reading experiences. Their reports about various types ofreading are summarized in TABLE 4.3. Two thirds of these older studentsreported regular reading of newspapers and magazines, and just under half
Percentage of Students in Grades 7 and 11Reporting Reading Different Types of Materials*
How often do you:
At leastWeekly
UpperQuartile
Grade 7
LowerQuartile
Read parts of a story or novel 45.0 (0.8) 53.3 (2.1) 36.1 (1.7)
Read a poem 23.2 (0.8) 21.4 (1.9) 26.3 (1.7)
Read a play 12.6 (0.8) 8.3 (1.3) 17.6 (1.5)
Read a biography 12.3 (0.5) 7.2 (1.0) 19.2 (1.5)
Read parts of a newspaper 67.3 (1.0) 70.0 (1.9) 60.6 (2.2)
Read parts of a magazine 68.6 (1.1) 72.8 (2.2) 64.5 (2.1)
UpperNever Quartile
'11.9 (1.0)28-0011i3- '22:3(2.0)38.5 03),:.:31:4 (2.7)41.1 '28.7(2.4)12.9 (0.7) 9.3 (1.5)7.8 (0.5) 2.7 (0.6)
'Jackknifed standard errors are presented in parentheses.
40
42

TABLE 4.2
NeverUpper
QuartileLower
Quartile
20.1 (1.1) 14.1 (2.4) 23.6 (2.4)49.6 (1.0) 42.2 (2.7) 53.2 (2.5)44.0 (1.2) 36.9 (2.5) 46.6 (2.3)42.7 (1.4) 33.1 (2.9) 46.0 (2.1)35.8 (1.3) 27.3 (2.6) 39.1 (2.1)34.8 (1.2) 38.3 (3.0) 33.1 (1.6)36.4 (1.6) 24.3 (2.4) 42.7 (1.8)
reported regularly reading stories or novels. Other types of reading materi-als-poems, plays and biographies-remained relatively infrequent choices,even among the eleventh graders.
TABLE 4.3
LowerQuartile
At leastWeekly
UpperQuartile
LowerQuartile
Grade 11
UpperQuartile
LowerQuartileNever
23.0 (2.1) 10.6 (0.8) 2.2 (0.6) 21.6 (2.4)
37.6 (1.6) 47.6 (1.2) 60.9 (2.7) 32.0 (1.9) 16.8 (0.8) 7.5 (1.3) 24.5 (1.7)
43.8 (2.2) 27.7 (1.2) 28.5 (2.5) 24.9 (1.7) 34.7 (1.0) 24.1 (2.4) 41.8 (3.1)
53.6 (2.0) 8.3 (0.6) 6.5 (1.1) 11.6 (1.3) 40.3 (1.6) 30.3 (3.0) 49.8 (2.7)
21.5 (1.8) 7.5 (0.5) 4.7 (0.9) 10.1 (1.1) 3.6 (0.6) 3.0 (1.1) 4.9 (0.9)
15.4 (2.0) 86.4 (1.5) 88.1 (2.9) 81.0 (2.4) 2.8 (0.4) 1.2 (0.5) 5.6 (1.3)78.4 (1.5) 79.9 (2.3) 73.5 (2.3)
4341

To assess the relationship between reading proficiency and independentreading experiences, students' reports about various types of reading werecombined into a composite variable reflecting both frequency and variety.The relationship between this variable and average reading proficiency issummarized in FIGURE 4.1 for grades 7 and 11. At both grade levels, thegreater the breadth of materials students reported reading, the higherstudents' reading proficiency was likely to be. The factors shaping suchrelationships are likely to be complex. On the one hand, students who readmore will have more experience in reading and, thus, are more likely toemerge as better readers. On the other hand, better readers may be morelikely to read widely both on their own initiative and with the encouragementof their teachers.
Average Reading Proficiency for Studentsin Grades 7 and 11 by Frequency and Varietyof Reading Materials
FIGURE 4.1
70I.
55.360
GRADE
51.8
(0.2)11
57.8(0.2)
50 (0.5)
45.8(0.4)
48.3(0
49.9(0.1)
2)
40GRADE 7
LOW MEDIUM HIGH
Percentage of Students Reporting Frequency and Variety of Reading Materials
Grade 7 7.6 (0.6) 42.1 (1.1) 50.3 (1.0)
Grade 11 11.3 (0.8) 44.3 (1.1) 49.9 (0.1)
Using the Library
The library is a major resource in the development of students' readingabilities. It serves both as a source of reading materials and as a quiet refugewhere students can come to read without being interrupted. As part of theassessment of reading habits, students in grades 7 and 11 were asked severalquestions about their use of the library (see TABLE 4.4).
42
44

Percentage of Students in Grades 7 and 11 ReportingUsing the Library at Least Monthly*
TABLE 4.4
How often do yougo to the library to: Grade 7 Grade 11
Read on your ownNation 61.5 (1.3) 42.1 (1.4)
Upper Quartile 64.5 (4.0) 47.6 (4.6)Lower Quartile 58.4 (3.0) 39.8 (3.3)
Look up facts for schoolNation 60.1 (1.3) 56.1 (1.7)
Upper Quartile 66.2 (3.4) 65.1 (4.1)Lower Quartile 57.6 (3.5) 47.4 (3.5)
Find books on hobbiesNation 42.6 (1.1) 24.0 (1.1)
Upper Quartile 33.3 (3.0) 19.3 (2.2)Lower Quartile 50.2 (3.3) 29.9 (2.6)
Have a quiet place to readNation 47.6 (1.4) 36.1 (1.3)
Upper Quartile 39.6 (3.7) 38.6 (4.0)Lower Quartile 56.6 (3.2) 36.4 (3.1)
Take out booksNation 73.3 (1.2) 52.0 (1.3)
Upper Quartile 79.5 (3.8) 59.3 (3.7)Lower Quartile 69.0 (3.5) 42.2 (2.9)
'Jackknifed standard errors are presented in parentheses.
Seventh-gradestudentsreported fairlyregular use ofthe library.Some 73 per-cent reportedtaking books outat least monthly.
Seventh-grade students reported fairly regular use of the library. Some 73percent reported taking books out at least monthly, and another 60 to 62percent reported going to the library to read on their own or to look up factsfor school. At the same time, there were interesting differences between howbetter and poorer readers claimed to use the library. More of the seventh-grade readers in the top quartile reported using the library to read on theirown, to look up facts for school, and to take out books. On the other hand,many more of the seventh-grade readers in the bottom quartile reportedusing the library for a quiet place to read and to find books about theirhobbies.
In the eleventh grade, fewer students reported using the library for anypurpose, whether to read on their own, to take out books, or to look up factsfor school. However, similar to the results at grade 7, there were differencesbetween better and poorer readers in the ways they used the library, with thebetter readers reporting using the library more frequently for academicpurposes and the poorer readers using it more frequently to find out abouttheir hobbies.
4543

3
7375 w

TE rep 5Home and SchoolSupport for AcademicAchievement
N ADDITION to specific instructional activities that are designed
to foster reading achievement, a variety of other features of schooland home environments shape the general context within whichstudents learn to read. This chapter briefly examines the relation-
ships between reading proficiency and two clusters of variables; one reflect-
ing the emphasis on academic achievement within school and the otherreflecting home support for literacy. In both cases the results reported hereare consistent with those in previous assessments, as well as with results in
a long series of previous studies.*
Academic Climate within the School
Many recent calls for educational reform have stressed the need for amore academic emphasis throughout the school years. Such calls havepointed to the need for higher academic expectations and increased course-work for poor-performing and historically at-risk populations, as well as forhistorically high-achieving groups of students.
In this assessment, eleventh-grade students were asked whether theywere enrolled in a general, academic/college preparatory, or vocational/technical school program; they were also asked about their plans after high
"D. R. Durkin, Children Who Read Early, New York, Teacher's College Press, 1966; T. Raphael and R.
Reynolds, editors, Contexts of Literacy, New York, Longman, 1986; J. Chaff, "Literacy: Trends and Explana-
tions," Educational Researcher, 1983, (pp 3.5).
45
47

school (see TABLE 5.1). Nationally, some 52 percent claimed to be in anacademic or college preparatory program, and a nearly identical percentageplanned to go on to a four-year college. Over one half of the White students(54 percent) reported following a academic program, but the percentages ofBlack and Hispanic students enrolled were smaller (45 and 37 percent,respectively).
Average Reading Proficiency and Percentage of Studentsin Grade 11 in Various High-School Programs andTheir Plans After Graduation*
Program of Study
Academic
Percent Proficiency
Nation 51.9 (1.1) 59.6 (0.2)
White 54.2 (1.0) 60.6 (0.2)
Black 44.6 (2.0) 54.4 (0.4)Hispanic 36.8 (1.6) 54.7 (0.6)
Upper Quartile 78.0 (1.3) 66.1 (1.5)
Lower Quartile 27.4 (1.0) 46.6 (1.4)
PlansAfter High School
4-Year College 2-Year College
Percent Proficiency Percent Proficiency
Nation 52.5 (1.1) 60.1 (0.2) 20.7 (0.6) 54.8 (0.3)
White 53.1 (1.2) 61.2 (0.2) 20.9 (0.7) 55.7 (0.3)
Black 52.1 (1.9) 54.8 (0.5) 16.4 (1.2) 50.8 (0.6)Hispanic 38.2 (1.5) 55.8 (0.6) 26.9 (1.7) 51.1 (0.6)
Upper Quartile 78.1 (1.1) 66.2 (1.5) 12.3 (1.0) 63.9 (1.8)
Lower Quartile 27.5 (0.9) 47.1 (1.3) 24.0 (0.8) 45.9 (1.2)
'Jackknifed standard errors are presented in parentheses.
46 48

TABLE 5.1
General Voc./Tech.
Percent Proficiency Percent Proficiency
38.1 (0.9) 52.7 (0.2) 10.0 (0.5) 50.8 (0.3)
36.8 (0.9) 53.8 (0.3) 9.0 (0.5) 52.0 (0.4)
40.5 (1.6) 49.2 (0.4) 14.9 (1.9) 48.1 (0.5)
50.6 (2.0) 49.8 (0.5) 12.6 (2.0) 48.1 (1.1)
18.9 (1.3) 63.7 (2.1) 3.1 (0.3) 62.6 (2.5)
54.8 (1.2) 44.9 (1.8) 17.8 (1.1) 44.2 (0.9)
Work Other
Percent Proficiency Percent Proficiency
16.9 (0.6) 51.1 (0.3) 10.0 (0.5) 52.1 (0.2)
16.8 (0.7) 52.1 (0.3) 9.2 (0.5) 53.2 (0.3)
17.9 (1.2) 47.5 (0.5) 13.6 (1.0) 48.9 (0.6)
21.1 (1.2) 47.8 (0.6) 13.8 (1.0) 48.9 (1.0)
5.6 (0.6) 62.9 (2.4) 4.0 (0.4) 63.4 (2.3)
31.6 (0.9) 44.1 (0.7) 16.8 (1.1) 44.5 (0.8)
Eleventh graders were also asked about the coursework they had selectedin high school. The results, summarized in TABLE 5.2, indicate that thebetter readers were more likely to have taken more advanced coursework ina variety of subjects, including English, mathematics, and science. Nearlythree times more students in the top quartile than in the bottom quartilereported that they had enrolled in advanced coursework. Although these
47
49

patterns are hardly surprising, they bring to mind such questions as: Wouldthe lower-achieving students have done better if they had been enrolled inmore demanding courses in the first place? Does the pattern of courseselection and placement reflected in these data simply reinforce patterns oflow or under-achievement?
Percentages of Students in Grade 11Taking Various Courses*
TABLE 5.2
Current English Course
UpperQuartile
LowerQuartile
Percent Percent
Advanced Placement 27.5 (1.9) 6.7 (0.6)College Preparation 41.9 (2.3) 15.9 (0.7)General 29.0 (1.9) 64.0 (1.9)Remedial 0.3 (0.1) 5.0 (0.6)None 1.3 (0.4) 4.5 (0.5)
Highest Level of Math Course Taken
Calculus 13.5 (1.4) 2.2 (0.3)Algebra 2 63.9 (1.5) 23.6 (1.0)Geometry 11.9 (0.7) 12.4 (0.8)Algebra 7.8 (0.7) 22.6 (1.2)Pre-Algebra 2.8 (0.4) 37.6 (1.3)Other 0.2 (0.1) 1.6 (0.2)
Highest Level of Science Course Taken
Physics 11.5 (1.2) 2.6 (0.3)Chemistry 51.0 (1.5) 14.8 (0.9)Biology 30.4 (1.1) 55.6 (1.8)General Science 2.1 (0.2) 19.1 (1.9)Other 4.9 (0.6) 7.8 (0.6)
'Jackknifed standard errors are presented in parentheses.
The Influence of an Early Start
Another issue in discussions of academic emphasis concerns the age atwhich school experiences should begin. Two questions in the assessmentasked students about their own early school experiences, in particularwhether they had attended preschool, nursery, or daycare, and whether they
4850

... 90 percentreported thatthey hadattended
kindergarten.
had attended kindergarten. The results are summarized in TABLE 5.3. Aboutone half of the students at all three grade levels reported some type ofpreschool or daycare experience, and over 90 percent reported that they hadattended kindergarten. In general, reading proficiency levels were slightlyhigher for students who had had such experiences. The NAEP data provideno way to examine the quality of these experiences, however, or the economicfactors that may have an effect on why students attend such schools orcenters in the first place.
Average Reading Proficiency and Percentage ofStudents in Grades 3, 7, and 11 ReportingAttendance in Preschool, Nursery, or Daycare*
TABLE 5.3
Grade 3 Grade 7 Grade 11
Percent Proficiency Percent Proficiency Percent Proficiency
Nation _
Yes 56.2 (1.1) 39.4 (0.2) 53.8 (1.0) 50.0 (02) 47.6 (1.1) 57.3(0.2)No 31.9 (1.1) 36.7 (0.2) 36.6 (0.9) 48.0 (0.2) 45.8 (1.1) 55.5 (0.2)Don't Know 11.9 (0.4) 35.6 (0.3) 9.6 (0.4) 46.3 (0.3) 6.6 (0.2) 52.1 (0.5)
Average Reading Proficiency and Percentage of Students inGrades 3, 7, and 11 Reporting Attendance in Kindergarten*
Grade 3 Grade 7 Grade 11
Percent Proficiency Percent Proficiency Percent Proficiency
Nation
Yes 94.3 (0.4) 38.3 (0.2) 93.7 (0.5) 49.1 (0.1) 92.4 (0.5) 56.3 (0.2)No 4.3 (0.3) 34.4 (0.9) 5.0 (0.5) 45.8 (0.5) 6.5 (0.5) 53.4 (0.4)
'Jackknifed standard errors are presented in parentheses.
Time Spent on Homework
In addition to questions about early school experiences, course of study,and future plans, students were asked about the amount of time theytypically spend on homework each night for all their subjects. Their reportsare summarized in TABLE 5.4.
5149

In grades 7 and 11, 10 to 15 percent of the students reported that theywere not assigned homework or did not do it, and these students hadnoticeably lower reading proficiency levels than did their classmates whoreported regularly spending time on homework. For those who did home-work regularly, however, the amount of time associated with the highestlevels of reading proficiency varied somewhat with grade level. At grade 11,students who spent more than two hours per night on homework had thehighest average reading proficiency; at grade 7, the highest averages were forstudents who spent 1 to 2 hours; while at grade 3, there was not a strongrelationship between time spent on homework and reading proficiency.
At grade 11, stu-dents who spentmore than twohours per nighton homeworkhad the highestaverage readingproficiency ...
Average Reading Proficiency andPercentage of Students Reporting DifferentAmounts of Time Spent on Homework*
TABLE 5.4
Grade 3
Nation
Percent Proficiency
Have none 8.6 (0.8) 38.6 (0.5)15 minutes 33.7 (0.8) 37.8 (0.2)
A hour 26.9 (0.7) 39.5 (0.2)1 hour 16.9 (0.6) 37.7 (0.3)1 hour + 13.9 (0.6) 36.1 (0.4)
Grade 7
Have none 5.1 (0.5) 46.2 (0.7)
Don't do 5.6 (0.3) 44.7 (0.4)A hour 20.5 (0.6) 47.6 (0.2)
1 hour 40.2 (0.8) 49.7 (0.2)2 hours 19.9 (0.6) 50.2 (0.3)2 hours + 8.7 (0.4) 48.6 (0.4)
Grade 11
Have none 6.9 (0.5) 49.8 (0.4)
Don't do 9.3 (0.3) 52.8 (0.4)
A hour 18.0 (0.5) 55.6 (0.2)1 hour 33.7 (0.4) 56.4 (0.2)2 hours 19.9 (0.5) 5'7.8 (0.2)2 hours + 12.2 (0.5) 58.7 (0.4)
'Jackknifed standard errors are presented in parentheses.
50
52

Home Support for Reading
Closely related to high and consistent academic expectations at school isthe extent to which students experience a literacy-oriented environment athome. To what extent are books and other reading materials readily avail-able? How much interest is shown in students' school work? TABLE 5.5summarizes the results on a series of related questions.
Percentages of Students in Grades 3, 7, and 11Reporting Home Support for Reading*
TABLE 5.5
ReadingMaterialsIn the Home
Nation
Grade 3 Grade 7 Grade 11
Many" Few*** Many** Few*** Many" Few*"
Percent 28.8 (0.8) 40.1 (0.8) 47.1 (1.0) 22.8 (0.7) 62.1 (0.5) 13.4 (0.4)Proficiency 40.6 (0.2) 35.7 (0.2) 50.6 (0.1) 45.3 (0.3) 57.7 (0.2) 50.8 (0.3)
UpperQuartile
Percent 39.9 (1.3) 25.8 (1.1) 60.3 (1.3) 11.9 (0.6) 74.6 (1.0) 6.2 (0.5)Proficiency 47.8 (0.8) 45.9 (1.4) 57.3 (1.1) 55.3 (1.8) 65.8 (1.6) 63.6 (2.3)
LowerQuartile
Percent 18.8 (1.0) 54.9 (1.4) 33.8 (1.5) 36.7 (1.5) 47.9 (0.8) 24.7 (0.8)Proficiency 30.4 (1.4) 28.7 (1.1) 41.3 (1.3) 39.3 (0.9) 45.9 (1.1) 43.8 (0.7)
Someone Daily Never Daily Never Daily NeverAsks aboutSchoolworkNation
Percent 67.1 (0.8) 18.8 (0.6) 72.6 (0.8) 9.7 (0.4) 57.6 (0.5) 13.1 (0.4)Proficiency 38.5 (0.2) 36.7 (0.3) 49.0 (0.2) 47.5 (0.3) 56.5 (0.2) 54.0 (0.4)
UpperQuartile
Percent 71.3 (1.2) 14.5 (1.1) 74.0 (1.1) 7.9 (0.7) 60.0 (0.8) 9.9 (0.6)Proficiency 47.2 (0.9) 46.2 (1.2) 56.9 (1.2) 57.2 (1.1) 66.5 (1.6) 65.2 (1.8)
LowerQuartile
Percent 63.2 (1.5) (1.3) 71.5 (1.5) 12.3 (0.9) 53.2 (0.7) 17.1 (0.7)Proficiency 29.4 (1.2)
.21.829.2 (1.2) 40.6 (1.2) 39.9 (1.0) 45.5 (1.0) 44.2 (0.9)
'Jackknifed standard errors are presented in parentheses."Many is defined as including dictionaries. regular newspaper. encyclopedias. regular magazines, and at least 25 books in
the home."'Few is 3 or less of these.
51
53

Percentages of Students in Grades 3, 7, and 11Reporting Home Support for Reading*
TABLE 5.5(continued)
FamilyReadsStudentPapers
Nation
Grade 3 Grade 7 Grade 11
Always Never Always Never Always Never
Percent 55.8 (1.6) 15.2 (0.8) 29.7 (1.4) 18.5 (0.8) 16.0 (0.8) 32.1 (1.4)Proficiency 40.0 (0.4) 36.3 (0.5) 50.2 (0.4) 47.4 (0.4) 57.8 (0.7) 54.7 (0.6)
UpperQuartile
Percent 64.7 (2.5) 11.5 (1.4) 35.0 (3.0) 14.1 (1.4) 18.2 (2.0) 26.3 (2.3)Proficiency 46.9 (1.0) 45.9 (1.1) 57.3 (1.0) 56.4 (1.1) 66.8 (1.6) 66.1 (1.5)
LowerQuartile
Percent 37.6 (2.0) 20.2 (1.8) 26.1 (2.1) 23.9 (1.8) 11.9 (1.4) 39.9 (3.1)Proficiency 30.2 (1.4) 28.3 (1.2) 40.8 (1.3) 39.5 (1.0) 45.3 (1.6) 44.3 (0.6)
'Jackknifed standard errors are presented in parentheses.
As has been found in each of the previous NAEP reading assessments aswell as in many studies of reading acquisition, the more reading materialsavailable in the home, the better the students' reading proficiency levels arelikely to be. Similarly, students whose families pay more attention to school-work and papers are more likely to do well.
In general, the findings from these analyses of school and home supportfor reading and for general academic achievement indicate that students whohave more academically oriented and challenging experiences are more likelyto become proficient readers. While this is hardly a new finding, the dataremind us that we must continue to strive to provide such supportiveenvironments for all students, including those for whom such experiencesare not obviously and easily ready-at-hand.
5254
THE NATiON'SREPORT mrnm
CARD

OCEPEN iX
NAEP was cre-ated in 1969 toobtain compre-hensive and
dependablenational educa-tional achieve-ment data in auniform, scien-tific manner.
All exercisesundergo exten-sive reviews bysubject-matterand measure-ment special-ists, as well ascareful scrutinyto eliminate anypotential bias orlack of sensitiv-ity to particulargroups.
General Background
HE NATION'S Report Card, the National Assessment of Educa-tional Progress (NAEP), is an ongoing, congressionally man-dated project established to conduct national surveys of theeducational attainments of young Americans. Its primary goal is
to determine and report the status and trends over time in educationalachievement. NAEP was created in 1969 to obtain comprehensive anddependable national educational achievement data in a uniform, scientificmanner. Today, NAEP remains the only regularly conducted nationalsurvey of educational achievement at the elementary-, middle-, and high-school levels.
Since 1969, NAEP has assessed 9-year-olds, 13-year-olds and 17-year-oldsattending public and private school. In 1983, NAEP began sampling studentsby grade as well as by age. The results presented in this report are for studentsin grades 3, 7, and 11. In addition, NAEP periodically samples young adults.The subject areas assessed have included reading, writing, mathematics,science, and social studies, as well as citizenship, computer understanding,literature, art, music, and career development. Assessments were conductedannually through 1980 and have been conducted biennially since then.Recent assessments have included reading, writing, mathematics, science,computer understanding, literacy, literature, and U.S. history. In the 1987-88school year, NAEP will assess reading, writing, civics, U.S. history, andgeography. All subjects except career development and computer under-standing have been reassessed to determine trends in achievement over time.To date, NAEP has assessed approximately 1,300,000 young Americans.
From its inception, NAEP has developed assessments through a consen-sus process. Educators, scholars, and citizens representative of many diverseconstituencies and points of view design objectives for each subject areaassessment, proposing general goals they feel students should achieve in thecourse of their education. After careful reviews, the objectives are given toitem writers, who develop assessment questions appropriate to the objectives.
All exercises undergo extensive reviews by subject-matter and measure-ment specialists, as well as careful scrutiny to eliminate any potential bias or
53
55 BEST COPY AVAILABLE

lack of sensitivity to particular groups. They are then field tested, revised, andadministered to a stratified, multi-stage probability sample. The young peo-ple sampled are selected so that their assessment results may be generalizedto the entire national population. Once the data have been collected, scored,and analyzed, NAEP publishes and disseminates the results. Its purpose is toprovide information that will aid educators, legislators, and others to improveeducation in the United States.
To improve the utility of NAEP achievement results and provide anopportunity to examine policy issues, NAEP collects information aboutnumerous background issues; students, teachers, and school officials answer
a variety of questions about demographics, educationally related activitiesand experiences, attitudes, curriculum, and resources.
NAEP is supported by the U.S. Department of Education, Office ofEducational Research and Improvement, Center for Education Statistics. In1983, Educational Testing Service assumed the responsibility for the admin-istration of the project, which had previously been administered by theEducation Commission of the States. NAEP is governed by an independent,legislatively defined board, the Assessment Policy Committee.
Content of the 1986 Reading Assessment
The assessment contained a range of reading tasks that measured objec-
tives developed by nationally representative panels of reading specialists andeducators.* These objectives combined the work of two Learning AreaCommitteesthose from the 1983-84 and the 1985-86 reading assessments.Many people, including university professors, classroom teachers, legislators,
parents, and other interested individuals reviewed drafts of these objectives.
NAEP asked students to read prose passages or poems and answerquestions about them. The passages were drawn from a variety of fiction and
nonfiction genres. The questions about the passages included a range oftraditional multiple-choice items assessing reading comprehension. Thesequestions essentially asked students to locate specific information, to makeinferences based on information in two or more parts of a passage, and torecognize the main idea. Many of the questions measured reading for specific
information or general understanding. However, since relatively complexinterpretative and analytic reading skills are equally important, the assess-
ment also included some open-ended questions asking students to providewritten interpretations or short essays based on information that they hadread. Responses to these were scored by trained staff using guidelines thatfocused on the readers' understanding of the information in the passage and
their ability to use that information in conjunction with their own knowl-edge to present an elaboration or extension of what they had read.
NAEP Reading Objectives, 1986 and 1988 Assessments, The Nation's ReportCard, Educational Testing
Service, 1987.
54
56

3.
Groups of stu-dents wereassembled forassessmentsessions. witheach sessionlasting aboutone hour.
Sampling, Data Collection, and Scoring
The 1986 reading assessment was administered to students at age 9/grade 3, age 13/grade 7, and age 17/grade 11. For this assessment, birth-dateranges for eligible 9-, 13-, and 17-year-olds were defined as October 1 throughSeptember 30 for each age level. Thus, the modal grades for those age-eligiblestudents were 3, 7, and 11. NAEP conducted additional sampling of studentsin these three grade levels to provide nationally representative samples ofrespondents in grades 3, 7, and 11.
All NAEP assessments are based on a deeply stratified, three-stage sam-pling design. The first stage entails defining primary sampling units(PSUs) typically counties, but sometimes aggregates of small counties;classifying the PSUs into strata defined by region and community type; andrandomly selecting PSUs. For each age level, the second stage entails enu-merating, stratifying, and randomly selecting schools, both public and pri-vate, within each PSU selected at the first stage. The third stage involvesrandomly selecting students within a school for participation in NAEP. Somestudents sampled (less than 5 percent) are excluded because of limitedEnglish proficiency or severe handicap. In 1984, NAEP also began collectingdescriptive information about excluded students.
Groups of students were assembled for assessment sessions, with eachsession lasting about one hour. The 1986 assessment design was based on apowerful variant of matrix sampling called Balanced Incomplete Block (BIB)spiralling. As part of this design, for each subject area (mathematics, science,and computer competence as well as reading) the entire 1986 assessmentbattery was divided into blocks approximately 15 minutes each, and eachstudent was administered a booklet containing three blocks as well as asix-minute block of background questions common to all students. Sixblocks of reading assessment questions were administered at each age/gradelevel.
As part of the partial BIB design, each pair of blocks within a subject areaappeared in at least one assessment booklet. In addition, some blocks werepaired across subject areas. At age 9/grade 3, 52 booklets were prepared.Twenty-nine of the booklets contained one or more reading blocks, with eachof the six reading blocks appearing in six or seven booklets. Sixty-eightbooklets were assessed at age 13/grade 7, with 27 of them containing readingmaterials and each reading block appearing in six or seven different booklets.Reading items were included in 35 of the 96 booklets administered tostudents age 17/grade 11, with each reading block appearing seven times.
The spiralling part of the method cycles the booklets for administrationso that typically only a few students in any assessment session receive thesame booklet At each age/grade level, each block of exercises is adminis-
5755

tered to approximately 2,600 students, providing about 2,000 studentresponses to each item for the grade-level analyses reported herein. Across allthe booklets, the results contained in this report were based on 9,793 stu-dents at grade 3; 9,513 students at grade 7; and 16,510 students at grade 11.
The 1986 BIB assessment was conducted in February through May usinga well-trained, professional data collection staff. NAEP's subcontractorresponsible for data collection is Westat, Inc. Quality control is providedthrough site visits by NAEP and Westat staff members.
After open-ended scoring, the booklets were scanned and the informationtranscribed to the NAEP data base. These activities were conducted withparticular care given to quality control procedures.
Analysis and 1RT Scaling
After NAEP data were scored, they were weighted in accordance with thepopulation structure and adjusted for nonresponse. Analyses included com-puting the percentages of students giving various responses and using itemresponse theory (IRT) technology to estimate proficiency levels for the nationand various subpopulations. IRT methods were used to provide resultsaccording to the NAEP reading scale.
The main purpose of IRT analysis is to provide a common scale on whichperformance can be compared across groups and subgroups whether testedat the same time or a number of years apart. It allows NAEP to estimateperformance for any group or subgroup even though all respondents did nottake all the exercises in the NAEP pool. All three grade levels were placed onthe same proficiency scale, permitting comparisons across grade levels andsubpopulations.
IRT defines the probability of answering an item correctly as a mathemat-ical function of proficiency level or skill. NAEP's estimates of statisticsdescribing national and subgroup proficiency are computed as expectedvalues of the figures that would have been obtained had individual proficien-cies been observed, given the data that were in fact observedthat is,responses to reading exercises and background items. (For theoretical justi-fication of the procedures employed, see the ETS Research Bulletin "Infer-ences about latent variables from complex samples." For computationaldetails in the application of NAEP, see Implementing the New Design:1983-84 NAEP Technical Report.)
Why a Different Scale (0-100) for the 1986 Reading Data?
During the analysis process, it was noted that the results of the 1986reading assessment seemed to be out of line with previous NAEP reading
56
58
All three gradelevels wereplaced on thesame profi-ciency scale ...

assessment results.* In particular, they indicated precipitous declines inaverage reading proficiency at ages 17 and 9. The nature of these drops acrossonly a two-year period, taken in the context of only modest changes inreading proficiency across a succession of four-year periods since 1971, wassimply not believable. It seemed that such a marked drop in reading levelsduring only two years would have been noticed by teachers and otherprofessionals in education.
The belief that the results were anomalous was reinforced by examiningother indicators of achievement that would be expected to show similardeclines. No such declines were evident in the mathematics or scienceassessments administered at the same time. Nor were declines evident inindividual state assessments that would have been expected to move inparallel with national results.
We have made every effort to discover any procedural reasons for theseresults, opening up the problem to scrutiny by NAEP's Technical AdvisoryPanel, external experts, and the statistical staff at OERI. We have pursued avariety of hypotheses related to potential errors in the sampling, administra-tion, scoring, and scaling, without discovering any problems. Therefore, inconsultation with NAEP's Technical Advisory Panel, it was decided that the1986 reading assessment represents a valid reading test, although no longeranchored to the proficiency levels established in 1983-84. Thus, while it isappropriate to issue this cross-sectional report, it would not be appropriate touse these data to report trends in reading proficiency.
As a result of the inappropriateness of comparing these reading data withprevious NAEP reading data, the scale was changed from a 0-500 scale to a0-100 scale with a mean of 50 and a standard deviation of 10.
We have not, therefore, in this report, described the levels of readingthemselves as was done through the NAEP Reading Scale (in a metric of from0 to 500) in the last reading report. The Reading Scale will be used to trackthe students assessed in 1984 four years later, in the 1988 assessment. Whileit is our intention to eventually place the students assessed in 1986 on thisReading Scale, so comparisons in proficiency can be made with past years, theproblems we have encountered have caused us to delay issuance of an officialtrend report until we can conduct the studies necessary to make certain thatthe assessment we gave in 1986 can be validly compared with previous NAEPassessments. When there is an unprecedented change indicated for such ashort period (whether up or down, and in this case down) we believe NAEPshould probe deeply into the assessment's data and administration to identifyany possible problems in the assessment before we attribute the results to thestudents; to do otherwise would be irresponsible. The questions whichremain about the 1986 reading assessment have to do with the comparability
'The Reading Report Card: Progress Toward Excellence in Our Schools, Trends in Reading over Four
National Assessments, 1971.1984, National Assessment of Educational Progress, Educational Testing
Service, 1985.
57
59

of this assessment with the prior one, for purposes of measuring trend inproficiency, and not with the accuracy of the results with regard to measuringproficiencies in 1986. Thus, we are confident of the soundness of the resultsin this report.
For detailed information about the reading data problem, what has beendone to investigate the properties of the data, and the studies incorporatedinto the 1988 assessment, see The NAEP 1985-86 Reading Anomaly: ATechnical Report.
Estimating Variability in NAEP Measures
The standard error, computed using a jackknife replication procedure,provides an estimate of sampling reliability for NAEP measures. NAEP usesthe jackknife methodology to estimate the sampling variability of allreported statistics because conventional formulas for estimating standarderrors of sampling statistics are inappropriate for use with NAEP's complexsampling procedures. The standard error is composed of sampling error andother random error associated with the assessment of a specific item or set ofitems. Random error includes all possible nonsystematic error associatedwith administering specific exercise items to specific students in specificsituations. The estimated population mean ± 2 standard errors represents anapproximate 95 percent confidence interval. It can be said with about 95percent certainty that the performance of the population of interest is withinthis interval. (For a complete description of the jackknife methodology seeImplementing the New Design: The NAEP 1983-84 Technical Report.)
NAEP Reporting Groups
NAEP does not report results for individual students. It only reportsperformance for groups of students. In addition to national results, thisreport contains information about subgroups defined by region of the coun-try, sex, race/ethnicity, size and type ofcommunity, and achievement quartiles.Definitions of these groups follow.
Region
The country has been divided into fourregions: Northeast, Southeast, Central andWest. States included in each region areshown on the following map.
Gender
Results are reported for males andfemales.
58
60

Students atgrades 3 and 7were askedabout 30 ques-tions and thoseat grade 11approximately50 questionsabout theirschool experi-ences and theirhome environ-ment ...
Race/Ethnicity
Results are presented for Black, White, and Hispanic students. Results arebased on student self-reports of their racial/ethnic identity according to thefollowing categories: White, Black, Hispanic, Asian or Pacific Islander, Amer-ican Indian or Alaskan Native, and Other. The sample sizes were insufficientto permit separate reliable estimates for the additional subgroups defined byrace/ethnicity. However, all students are included in computing the nationalestimates of performance levels.
Size/Type of Community
Two extreme community types of special interest are defined by anoccupational profile of the area served by a school as well as by the size of thecommunity in which the school is located. This is the only reporting categorythat excludes a large number of respondents. Although over two-thirds donot fall into the classifications listed below and are not reported in thisbreakdown, their performance tends to be similar to that of the nation.
Advantaged-urban (high-metro) communities. Students in this groupattend schools in or around cities having a population greater than 200,000,where a high proportion of the residents are in professional or managerialpositions.
Disadvantaged-urban (low-metro) communities. Students in this groupattend schools in or around cities having a population greater than 200,000,where a high proportion of the residents are receiving government assistanceor are not regularly employed.
Quartiles
The upper quartile presents average performance for students who werein the top 25 percent on the proficiency level scale; the lower quartilepresents average performance for those in the bottom 25 percent.
Additional Background Factors
In addition to the standard NAEP reporting variables of region, gender,race/ethnicity, size and type of community, and the performance quartilevariable, NAEP asked all students a number of background questions. Stu-dents at grades 3 and 7 were asked about 30 questions and those at grade 11approximately 50 questions about their school experiences and their homeenvironment including reading materials in the home, level of parents'education, and the time spent on homework.
In addition, background questions specific to reading were included inthe reading blocks. Students at all three grade levels were asked questionsabout their coursework, their reading habits, and the type of instruction they
59

had received. In addition to containing the results of some of the individualquestions asked of all students and of some variables based on combiningresults to these questions, this report describes results for a composite atgrades 7 and 11"frequency and variety of reading materials."
NAEP initiated the process of developing composite variables by conduct-ing a factor analysis of the results to the background questions specific toreading. This information did suggest a factor at the two higher grade levelsassociated with reading experiences. Questions were identified and theWeighted Average Response Method (WARM) was then used to create thecomposite variable. An extension of the Average Response Method (ARM),the WARM technique is appropriate for constructing linear combinations ofresponses to background questions (i.e., factor scores) when not all sampledstudents have responded to all questions. (For further information about theARM and WARM methods, see Implementing the New Design: The NAEP1983-84 Technical Report.)
A Note About Interpretations
Interpreting the resultsattempting to put them into a "real world"context, advancing plausible explanations of effects, and suggesting possiblecourses of actionwill always be an art, not a science. No one can control allthe possible variables affecting a survey. Also, any particular change inachievement may be explained in many ways or perhaps not at all. Theinterpretative remarks in this report represent the professional judgments ofNAEP staff and consultants and must stand the tests of reason and thereader's knowledge and experience. The conjectures may not always becorrect, but they represent a way of stimulating the debate necessary toachieve a full understanding of the results and implement appropriate action.
ACKNOWLEDGMENTS
This report represents the culmination of effort by many experienced and knowledgeable peoplestaffand consultants who contributed their ideas, time, and energy to the development, conduct, and analysis ofNAEP's 1986 reading assessment. Some, because of particularly significant contributions, are specificallythanked below.
The operational aspects of the assessment were managed by Nancy Mead and the complex composition andprinting tasks were performed by Peter Stremic. Most of the sampling and data collection responsibility wasborne by WESTAT, Inc.. whose staff can only be characterized as very dedicated and extremely competenttechnically. Norma Norris supervised the scoring and created the data base.
Albert Beaton directs NAEP's analysis activities. The reading analyses reported herein were designed andmanaged by Rebecca Zwick and conducted by Laurie Barnett with assistance from Dave Freund. Consultationon scaling methods was provided by Robert Mislevy and Kathy Sheehan.
Special thanks for the production of this report are due to the many reviewers who suggested improve-ments. Kent Ashworth and Jan Askew coordinated the production efforts, Beverly Cisney provided word-processing services. Joyce Torrens and Janice Scillia managed composition and proofreading tasks, andJack Weaver designed and illustrated the report.
Finally and most importantly, NAEP is grateful for the contributions or the students and schooladministrators who cooperated so generously.
60 62
BEST COPY AvATLARTIR,

9076901 U28P25. 249386 Printed in U.S.A.

(9/92)
U.S. DEPARTMENT OF EDUCATIONOffice of Educational Research and Improvement (OEM)
Educational Resources information Center (ERIC)
NOTICE
REPRODUCTION BASIS
ERIC1
This document is covered by a signed "Reproduction Release(Blanket)" form (on file within the ERIC system), encompassing allor classes of documents from its source organization and, therefore,does not require a "Specific Document" Release form.
This document is Federally-funded, or carries its own permission toreproduce, or is otherwise in the public domain and, therefore, maybe reproduced by ERIC without a signed Reproduction Releaseform (either "Specific Document" or "Blanket").