Supplementary Appendix Table of contents - http;//links.lww.com
Upload
khangminh22Category
view
1download
0
AAppppeennddiixx TTaabbllee ooff CCoonntteennttss 11
Fish Division Program Detail Propagation Natural Production Marine Resources Interjurisdictional
22 Wildlife Division Program Detail
Game Habitat Conservation
33 State Police Enforcement Program Detail
44 Administration Program Detail
55 Debit Service Program Detail
66 Capital Improvement Program Detail
77 2011-13 Legislative Concepts
88
Legislative and Other Reports HB 3489 – Plan to Reform Department Operated
Fish Hatcheries on the Oregon Coast SB 545 – Pathogens in Hatcheries Cougar Management Plan Fish Screening Program Report Oregon Aquatic Invasive Species Prevention
Program Report

PROPAGATION
2011-13 Organization Chart
Positions = 276 FTE = 245.19
Oregon Department of Fish and Wildlife________________________________________________________________________________________________________________2011-13 Way and Means Presentation
Fish Division Program Detail________________________________________________________________________________________________________________
Appendix 1 - 1

Program and Activities The Fish Propagation program produces fish through hatchery production to augment natural production and provide fish for sport and commercial fisheries. Fish Propagation staff raise and release fish as directed by management programs developed by the Natural Production, Marine Resources, and Interjurisdictional programs. In 2007, about 50 million salmon, steelhead and trout were produced by 33 hatcheries and 22 remote rearing and fish collection facilities, including Salmon and Trout Enhancement Program (STEP) facilities and Clatsop Economic Development Committee (CEDC) facilities.
More than 70 percent of all fish caught by recreational anglers and 75 percent of salmon harvested commercially are hatchery-produced fish. This means hatcheries help generate much of the sizable economic impact the state receives from commercial and sport angling. Visiting a fish hatchery is a recreational opportunity for many Oregonians and nonresident tourists. More than 1.4 million visitors enjoy Oregon’s hatcheries annually. The Fish Propagation Program has four sections:
Fish Identification: Responsible for fish tagging, sampling, tag processing, data analysis and statistical evaluation.
Fish Health Services: Provides fish health services to all ODFW facilities selected and monitoring of private aquaculture facilities.
Hatchery Production: Manages the fish propagation process, which includes broodstock collection, rearing and liberation.
Propagation Operations: Provides administration and oversight of the program as well as biological and technical services. Provides engineering support and related construction management services.
Oregon Department of Fish and Wildlife________________________________________________________________________________________________________________2011-13 Way and Means Presentation
Fish Division Program Detail________________________________________________________________________________________________________________
Appendix 1 - 2

Issues Deferred Maintenance on Hatchery Facilities: ODFW completed a Deferred Maintenance Master Plan in 2006. The report identified
current, deferred, and projected maintenance needs for its hatchery and acclimation facilities. In 2007, ODFW received $1.464 million to begin addressing deferred maintenance needs on agency facilities.
Compliance with Clean Water Act: The ability of hatchery operators to comply with requirements of the Clean Water Act has been
hampered in many locations by less than optimum facility design. Maintaining 100 percent compliance in these locations requires using more resources and staffing to manage facility limitations.
Private Trout Production: ODFW continues to purchase privately produced trout for harvest at lakes and reservoirs throughout the state.
ODFW will work with private trout producers to purchase fish as funding becomes available.
Hatchery Management Policy: The Fish Hatchery Management Policy, which centralizes policies on hatchery operations, provides the basis for fish culture decisions. Continued development of conservation plans and hatchery management plans for each program will provide direction on when and where hatchery fish will be used in particular watersheds.
Fish Health Policy: ODFW continues to implement a Fish Health Management Policy to minimize the impact of fish diseases on the
state’s fish resources. The plan outlines measures designed to restrict the introduction, amplification, and dissemination of disease agents. This will be accomplished by controlling egg and fish movements and by prescribing a variety of preventive, therapeutic and disinfecting strategies at both agency and non-agency facilities. The increased workload and cost of fish health certification at privately owned facilities is currently unfunded. The agency is seeking federal grants to pay for the certifications.
Federal Funding: Mitchell Act funding increased slightly this funding cycle and is expected to be flat in the next cycle. The U.S. Army
Corps of Engineers (USACE) also provided some additional funds for the Willamette Valley facilities.
Oregon Department of Fish and Wildlife________________________________________________________________________________________________________________2011-13 Way and Means Presentation
Fish Division Program Detail________________________________________________________________________________________________________________
Appendix 1 - 3

Revenue Sources and Proposed Revenue Changes Fish Propagation is funded through a combination of General Fund, Other Funds, and Federal Funds. Other Funds revenue sources include recreational angling license and tag sales, contractual agreements with nonfederal agencies, housing rents, donations, and limited sales of surplus fish and eggs.
ODFW receives Federal Funds from the U.S. Department of Energy (Bonneville Power Administration), USACE, U.S. Department of Commerce (NOAA Fisheries-Mitchell Act), and the U.S. Department of Interior (Sports Fish Restoration Act and Lower Snake River Compensation Plan for the construction of hydropower dams). Matching fund requirements vary from zero to 50 percent.
Proposed Revenue Changes As discussed in the Revenues section of this document, ODFW received legislative approval to increase several of its fees in 2010. Some of these fees will offset inflation increases in current programs. Mitchell Act funding was increased slightly this funding cycle and is expected to be flat in the next cycle. The USACE also provided some additional funds for the Willamette Valley facilities. Most federal revenue sources continue to be flat or nearly flat funded as they have for the past several biennia. Proposed New Laws No new laws are proposed.
Expected Results from the 2011-2013 Budget Oregon Benchmark 85 (wild salmon and steelhead restoration): ODFW is limiting harvest of naturally-produced fish by implementing sport and commercial selective fisheries that target hatchery-produced fish. The agency is working to improve hatchery management by increasing the survival rate of released fish. ODFW is also implementing best management practices to ensure the conservation of both naturally-produced native fish and hatchery-produced fish in Oregon through responsible use of hatcheries. The agency will foster and sustain opportunities for sport, commercial and tribal anglers consistent with the conservation and sustainability of naturally-produced native fish population.
Oregon Department of Fish and Wildlife________________________________________________________________________________________________________________2011-13 Way and Means Presentation
Fish Division Program Detail________________________________________________________________________________________________________________
Appendix 1 - 4
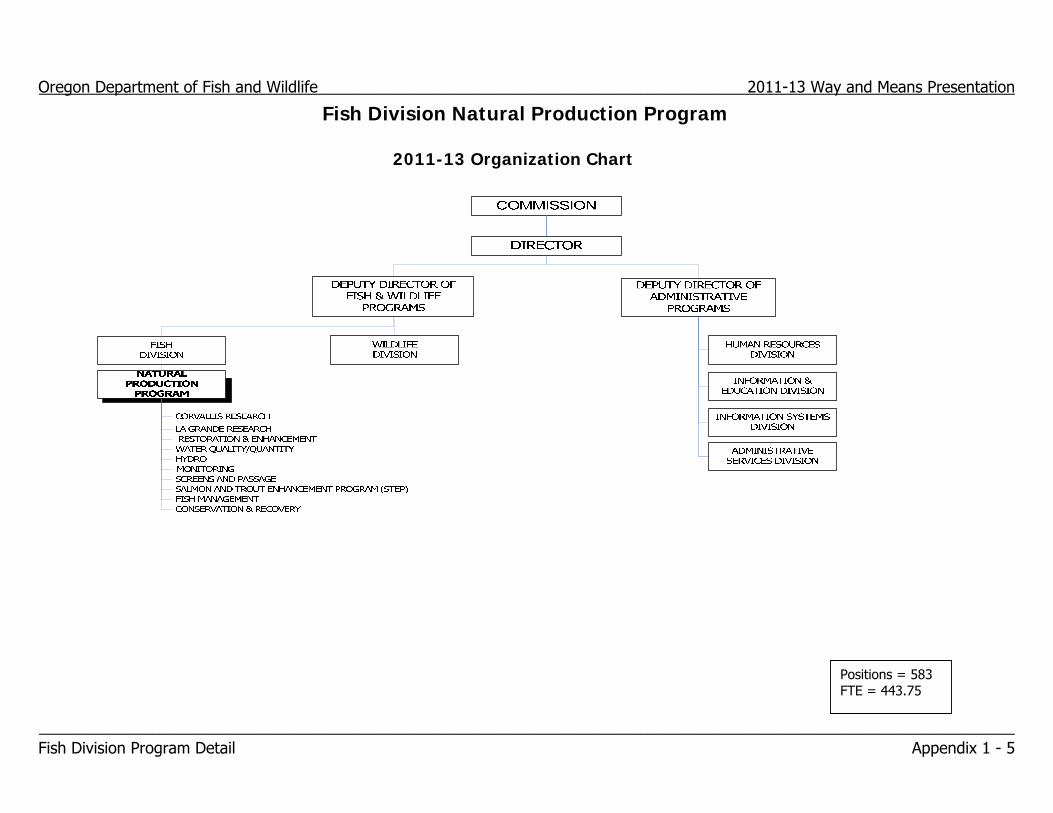
Fish Division Natural Production Program
2011-13 Organization Chart
Positions = 583 FTE = 443.75
Oregon Department of Fish and Wildlife________________________________________________________________________________________________________________2011-13 Way and Means Presentation
Fish Division Program Detail________________________________________________________________________________________________________________
Appendix 1 - 5

Program and Activities The Natural Production program is responsible for restoring and enhanceing natural habitat, maintaining water quality and quantity, inventorying and monitoring fish species, developing angling regulations, and developing fish conservation and management plans to restore and maintain fish populations to their natural levels. This program has 9 sections:
Corvallis Research: Responsible for field monitoring, research, and evaluation of Oregon’s native fish in the west side of the state. The program data is used to evaluate population trends and Endangered Species Act (ESA) impacts to listed species to manage both recreational and commercial fisheries within Oregon.
La Grande Research: Responsible for field monitoring, research, and evaluation of Oregon’s native fish in northeast Oregon. The program data is used to evaluate population trends and ESA impacts to listed species to manage both recreational and commercial fisheries within Oregon.
Restoration and Enhancement (R&E): This program has been moved into Capital Improvements and no longer exists in Natural Production.
Water Quality/Quantity: Coordinates with other state and federal agencies to address water quality and quantity issues associated with fish and wildlife and their habitats. It also provides data management services for ODFW’s fish, wildlife and habitat information needs.
Hydropower: Implements state and federal policies associated with the management, development and relicensing of small and large hydropower facilities statewide.
Monitoring: Field staff is responsible for conducting coastal stream surveys for returning salmonids. This monitoring is used to help manage Oregon’s recreational salmon fisheries.
Fish Screening and Passage: Provides technical and construction services to ensure fishways, screens or other forms of fish bypass facilities are in place to increase the survival of native fish species including ESA listed species listed. This section also provides cost share funding to assist landowners with the installation or repair of fishways and screens.
Oregon Department of Fish and Wildlife________________________________________________________________________________________________________________2011-13 Way and Means Presentation
Fish Division Program Detail________________________________________________________________________________________________________________
Appendix 1 - 6

Salmon and Trout Enhancement Program (STEP): STEP was authorized in 1981 to recruit and coordinate volunteers to help restore fish
habitat and native stocks of salmon, steelhead and trout to their historic levels of abundance. Staff is responsible for providing guidance and direction to STEP volunteers who have donated money, materials, equipment time and labor for stream habitat restoration work, fish and habitat surveys, and education projects. STEP volunteers have helped rear several million salmon, steelhead, and trout for release in streams and lakes throughout Oregon to enhance fish populations and associated fisheries.
Fish Management: Implements the rules, statutes, policies and management direction provided by the Oregon Fish and Wildlife Commission (Commission) and Oregon Legislature. This section also is responsible for developing angling regulations and fish conservation and management plans, conducting fish population inventories and monitoring program compliance with the federal and state ESA requirements.
Conservation & Recovery: Provides the staff responsible for implementing the Oregon Plan for Salmon and Watersheds. Staff leads or provides policy guidance and direction on development of state and federal conservation plans. Conservation and Recovery staff provided key leadership on the Oregon Plan Coastal Coho Assessment, Miller Lake Lamprey Conservation Plan, the Rogue Spring Chinook Conservation Plan, and is working with our federal partners in developing recovery plans in the Lower and Mid Columbia River and the Upper Willamette River for all listed species of salmon and steelhead. ODFW-lead recovery planning for all listed species should be completed by the end of the 2009-11 biennium. The Oregon Hatchery Research Center, which opened in October 2005, is involved with a variety of research related to differences that may exist between hatchery and wild steelhead, the mechanisms that may cause those differences and how to best manage those differences to maximize fishery benefits and minimize negative interactions with naturally-produced salmon and steelhead.
Issues
Federal Funding: Funding has been decreasing or flat during the past three biennia. This trend is expected to continue. No alternative funding sources are available to maintain the current service levels of these programs. As a result, the level of service in these programs will be reduced or discontinued if federal funding is not maintained or restored. The potential impact would be reduction or elimination of some commercial and recreational angling.
Completion and Implementation of Conservation and Recovery Plans: Since many plans have been or are nearing completion, funding is critical to effectively implement each plan in a manner that proves beneficial to fish and their surrounding environment.
Oregon Department of Fish and Wildlife________________________________________________________________________________________________________________2011-13 Way and Means Presentation
Fish Division Program Detail________________________________________________________________________________________________________________
Appendix 1 - 7

Revenue Sources and Proposed Revenue Changes Natural Production is funded through a combination of General Fund, Lottery Funds, Other Funds and Federal Funds. Lottery Funds are received through grants from the Oregon Watershed Enhancement Board. The Hydropower program is 100 percent funded through statutorily set dedicated fees assessed to hydropower facilities operating within the state. Federal Funds are received from various agencies for specific contracted work. These federal agencies include Bonneville Power Administration (BPA), U.S. Army Corps of Engineers (USACE), National Marine Fisheries Service, and U.S. Department of the Interior (primarily Sport Fish Restoration funds through the U.S. Fish and Wildlife Service [USFWS]). Matching requirements vary from zero to 33 percent.
Proposed Revenue Changes While most federal funds remain flat, ODFW did receive an increase from some funding agencies. Bonneville Power Administration (BPA) provided additional funds to perform work in the Columbia Basin related to the Columbia River Biological Opinion. USACE also provided additional funds to perform work in the Willamette Valley related to the Willamette Biological Opinion. ODFW received additional funds through OWEB from Pacific Coast Salmon Recovery Fund (PCSRF) and an increase in funding from the Pacific Salmon Commission for coastal chinook studies. Proposed New Laws No new laws are proposed. Expected Results from the 2011-13 Budget Oregon Benchmark 85 (wild salmon and steelhead restoration): Oregon’s strategy is to improve fish habitat and enhance water quality and fish passage so salmon and steelhead recovery will have the best possible chance given fluctuating ocean productivity. ODFW is focusing its efforts on studying the entire life cycle of salmon and steelhead. Better understanding of their life cycle and changes in population abundance will help guide ODFW’s future plans and efforts in restoring salmon and steelhead populations.
Oregon Department of Fish and Wildlife________________________________________________________________________________________________________________2011-13 Way and Means Presentation
Fish Division Program Detail________________________________________________________________________________________________________________
Appendix 1 - 8

Oregon Benchmark 88 (protected species): Slowing the drop in the percentage of Oregon’s native fish and wildlife species that are rated as healthy. The healthy percentage dropped in the last decade from 76 percent to an estimated 72 percent. This drop reflects increased numbers of species listed under the ESA and increasing pressure on habitats. Restoration efforts will slow this trend, but will not show their full benefits within this decade. ODFW continues its efforts to install screens to protect fish migrations, remove barriers to migration routes, and work to maintain adequate flows of water during critical times in fish life cycles. Much of this work requires cooperation and coordination with private landowners and other natural resource land and water managers.
Oregon Department of Fish and Wildlife________________________________________________________________________________________________________________2011-13 Way and Means Presentation
Fish Division Program Detail________________________________________________________________________________________________________________
Appendix 1 - 9

Fish Division Marine Resources Program
2011-13 Organization Chart
Positions = 131 FTE = 100.58
Oregon Department of Fish and Wildlife________________________________________________________________________________________________________________2011-13 Way and Means Presentation
Fish Division Program Detail________________________________________________________________________________________________________________
Appendix 1 - 10

Program and Activities The Marine Resources Program (MRP) manages the state’s marine fish, shellfish and related habitat. The program is based out of Newport with satellite offices in Astoria, Charleston, Corvallis and Brookings. MRP develops and implements Oregon's marine commercial and recreational fishery management programs; participates in state, regional and international (U.S.-Canada) fishery management programs through regional and international fishery management councils; and participates in Oregon's non-fishery marine resource management programs such as marine mammals, habitat assessments and marine spatial planning. MRP assesses marine species stock status through research and fishery monitoring. Staff conducts research to address marine resource management issues such as fishery bycatch or human-use impacts. Staff also gathers information on marine habitats, fishing activity and biological data from the fisheries; tracks and monitors commercial and recreational fish catches and activity in up to 12 ports along the Oregon coast; and studies the biology of marine organisms for use in resource management programs. MRP staff also develops, maintains, and analyzes fishery databases, and provides data to fishery management groups. This program is organized programmatically into four sections:
Resource Assessment and Management Section: Responsible for sport and commercial shellfish management, marine resources research, marine mammals, and habitat programs.
Fisheries Management Section: Responsible for developing programs
and administrative rules for Oregon Fish and Wildlife Commission (Commission) consideration and participating in regional fisheries councils. Both activities are necessary to conduct these fisheries. Section staff monitors fish population status and fishery management plans, gathers public input, and provides technical analyses, reports, and policy proposals necessary to protect, enhance and manage these fisheries.
Oregon Department of Fish and Wildlife________________________________________________________________________________________________________________2011-13 Way and Means Presentation
Fish Division Program Detail________________________________________________________________________________________________________________
Appendix 1 - 11

Data and Technical Services Section: Responsible for collection and management of all marine fisheries data. This section is responsible for the program’s technical data needs and long-term legacy data systems e.g., fish tickets; commercial fishery logbooks; Ocean Recreational Boat Sampling; Oregon’s component of the Pacific Fishery Information Network (PacFIN) and Recreational Fishery Information Network (RecFIN); groundfish commercial market sampling; species composition; ocean salmon coded wire tag data and halibut harvest; and other activities. This section supports other MRP projects with data system design, statistical analysis, data quality control, and project planning.
Program Administration Section: Oversees the entire budget, program and policy development process of the MRP. This section also includes
front office customer support, including full-service commercial and sport licensing sales. Marine Resources Program Budget Framework: The MRP budget historically has been divided into four categories: Marine Resources Operations, Ocean Salmon, Shellfish and Groundfish. The names of these historic budget categories do not fully reflect the activities within these areas. The activities assigned to these historical budget categories are explained below:
Groundfish: Funds monitoring and management of marine fisheries (all fish except salmon and shellfish). It funds port data collection and
overall marine data management, regional fishery management support and groundfish research. It also funds development of programs and administrative rules for Commission consideration necessary to conduct these fisheries and to protect, enhance and manage these fish stocks.
Shellfish: Funds management of sport and commercial shellfish fisheries and developing related programs (including development of the dedicated sport shellfish program) and administrative rules for Commission consideration. It funds monitoring of shellfish population status, gathering public input, technical analyses, reports, and policy proposals necessary to protect, enhance and manage shellfish fisheries. It also includes funds to support marine habitat monitoring, marine fishery research oversight and Nearshore Strategy implementation.
Ocean Salmon: Funds data collection for sport groundfish fisheries and sport and commercial ocean salmon fisheries, and assists the Columbia River Management Section in managing the ocean salmon fisheries. This budget category also funds data management and technical support for marine fisheries.
Marine Resources Operations: Funds overall policy development and administration, and oversight of the MRP. It also funds commercial and recreational licensing, the marine mammal program and the development of marine resource policy proposals for regional fishery management, Fish Division and Commission consideration.
Issues Oregon Nearshore Strategy Implementation: A cohesive management program is critical for nearshore species in Oregon because scientific
information is lacking to determine their status. The species are under high human-use pressure, and the public is demanding accountability in management of those species. During the 2005-07 biennium, MRP completed a Nearshore Resource Management Strategy which was adopted by
Oregon Department of Fish and Wildlife________________________________________________________________________________________________________________2011-13 Way and Means Presentation
Fish Division Program Detail________________________________________________________________________________________________________________
Appendix 1 - 12

the Commission. MRP began implementing the strategy in the 2007-09 biennium with a small two-person staff, but other demands on staff, such as reviewing wave energy proposals halted all work on Nearshore Strategy Implementation. The 2009-11 biennium saw additional demands placed on this small staff, such as the mandate for MRP to lead the marine reserve program for the state.
Groundfish, High Migratory Species (HMS), and Coastal Pelagic Species (CPS) Management: Management of species under the Pacific Fishery
Management Council (groundfish, HMS, and CPS) will include a number of challenges in the 2011-13 biennium and beyond. This includes evaluation of individual fishery quota management systems, continued development of innovative gear, or fishing modifications to increase fishing opportunity while reducing bycatch of non-target species. In addition, it is critical to keep up with fishery monitoring and data collection demands for quota management and stock assessments. Failure to do these essential activities could result in more restrictive recreational and commercial fishing opportunities. Marine spatial planning has become a top priority, and the collection and processing of historic logbook data to understand the location and value of fishery operations is essential to respond to cumulative regulation and ocean development proposals. Staff is needed to manage relatively new, large commercial fisheries such as sardines. This was a developmental fishery that matured and was placed into a significant limited entry fishery program. During the 2009-11 biennium, MRP faced new challenges in addressing new fishery program needs due to loss of funding for the Developmental Fisheries Program. Currently, there is no mechanism or funding to adequately support new fisheries.
MRP staff also provides support and intensive participation in all aspects of Pacific and North Pacific regional Fisheries Management Councils and the International Pacific Halibut Commission to ensure Oregon’s interests are fully represented. A significant challenge will be to balance program resources dedicated to sport and commercial groundfish monitoring and management against necessary program resource needs in other fisheries such as crab, shrimp, emerging and nearshore fisheries, which are state-managed fisheries. This will be done through efforts to increase federal funding for federal mandates, as well as review and make efforts to streamline management and enforcement regulations in state-managed marine fisheries, e.g., shrimp, Dungeness crab, nearshore species. ODFW received approval for two limited duration (LD) positions through a policy option package in 2009-11 to use Commercial Fish Funds to accomplish these goals.
Loss of Federal Funding in Recreational Marine Fishery Sampling Programs: The recreational fishery sampling and data collection program, funded
primarily with federal grants, is essential to quota management and data gathering for stock assessments. Federal grant reductions and continued flat funding, coupled with increased personal service and supply costs, have resulted in base program reductions and critical program cuts, holding staff vacancies open, and not purchasing critical supplies to cover shortfalls. These shortfalls have resulted in a reduction of personnel needed to meet increased fishery management demands. Without this data, it will be difficult for ODFW to present the scientific information necessary to justify maintaining or expanding commercial and recreational fisheries, putting Oregon’s valued ocean sport fisheries and its coastal communities at a disadvantage in the regional and state fishery management decision-making process. ODFW’s external Sportfish Advisory Committee strongly supports adequate funding of these programs. Additional license dollars will be used to backfill the federal grant reductions and restore the base program to its previous level.
Oregon Department of Fish and Wildlife________________________________________________________________________________________________________________2011-13 Way and Means Presentation
Fish Division Program Detail________________________________________________________________________________________________________________
Appendix 1 - 13

Developmental Fisheries Program: This commercial fishery program was created in 1995 to monitor new fisheries and flexible permits to test new commercial fisheries for economic and biological sustainability. It is primarily funded with General Fund monies and a dedicated fund for research using developmental fisheries landing fees. Funding has never been adequate to fully implement the program, and with the transfer of the clam and sardine fisheries out of the program, current landing tax revenue is insufficient to sustain it. During the 2007-09 biennium, ODFW received a one-time package to evaluate the Developmental Fisheries Program and propose more efficient and effective ways to implement it. A recent industry survey strongly supports the program revision and continuation of this developmental fishery program, if adequately funded to meet its intended goals. However, funding for this program was lost for the 2009-11 biennium.
Revenue Sources and Proposed Revenue Changes
General Fund supports much of the groundfish stock assessment and bycatch reduction work. It also provides match for several federal grants that support fishery monitoring.
Other Funds sources include revenue from the commercial landing taxes and license fees (Commercial Fish Fund), recreational angling and shellfish license revenue, and some minor contracts. Other Funds support portions of groundfish and shellfish fishery monitoring and policy tasks, and some of the program operations. Federal Fund sources include more than 20 separate federal contracts supporting the bulk of the groundfish, shrimp and ocean salmon fishery monitoring work, some groundfish and shrimp stock assessment work and some groundfish fishery policy work. Primary federal contracting agencies include NOAA Fisheries, U.S. Fish and Wildlife Service (USFWS) and Bonneville Power Administration (BPA). Proposed Revenue Changes The MRP is seeking additional funds from a variety of sources to fund the Nearshore Marine Management program and the pinniped predation study. The source of funding has not been determined.
Oregon Department of Fish and Wildlife________________________________________________________________________________________________________________2011-13 Way and Means Presentation
Fish Division Program Detail________________________________________________________________________________________________________________
Appendix 1 - 14

Proposed New Laws No new laws are proposed.
Expected Results from the 2011-13 Budget Benchmark 86 (marine species at risk): The condition of Oregon’s marine fisheries is mixed. Many stocks are in good shape, but some are vulnerable to over-fishing and other pressures. Healthy marine stocks are a key ingredient of a healthy environment. Many coastal communities depend on commercial fishing and seafood processing for economic survival as well as marine-related tourism and recreation. The 2011-13 budget continues management of the state’s marine resources to ensure resource conservation while providing and enhancing sustainable economic and recreational opportunities to residents and visitors to the Oregon coast. However, thorough monitoring and resource assessment efforts are needed to ensure orderly execution of fisheries and to identify any potential resource problems before they become crises. Current levels of monitoring, while satisfactory for some fisheries, are inadequate for others, and are just beginning for some fisheries.
Oregon Department of Fish and Wildlife________________________________________________________________________________________________________________2011-13 Way and Means Presentation
Fish Division Program Detail________________________________________________________________________________________________________________
Appendix 1 - 15

FISH DIVISION INTERJURISIDICTIONAL PROGRAM
2011-13 Organization Chart
Positions = 156 FTE = 104.63
Oregon Department of Fish and Wildlife________________________________________________________________________________________________________________2011-13 Way and Means Presentation
Fish Division Program Detail________________________________________________________________________________________________________________
Appendix 1 - 16

Program and Activities
The Interjurisdictional program provides leadership to all programs in the Fish Division and guidance to Fish programs within the regions, and represents ODFW’s policy decisions in state, regional, federal, tribal, international and other Interjurisdictional arenas. The program is also responsible for fish management in the mainstem Columbia River and for salmon management in the ocean. This involves working with others to develop and implement programs to protect, mitigate and recover fish populations, and to plan and implement fisheries. This work includes putting in place administrative rules necessary to conduct fisheries, and participating in state, regional, federal, tribal and international (US-Canada) forums, including regional and international fishery management councils. The Interjurisdictional program has three sections:
Columbia River and Ocean Salmon: This section works with others to plan and implement programs to protect, mitigate and recover fish populations in the Columbia River Basin. It also is responsible for planning and implementing Columbia River commercial and sport fisheries, and ocean salmon fisheries, including development of administrative rules necessary to conduct the fisheries. This section also serves as the scientific and technical lead in state efforts to minimize and mitigate the effects of hydropower development and operations on fish populations in the Columbia, Snake and Willamette river systems. Staff monitors fish population status and provides technical analyses and reports on measures necessary to protect, mitigate and enhance Columbia Basin fish. This section must also work with international, federal, other state, tribal, and local jurisdictions to manage Oregon’s fish populations for sustainability and economic and aesthetic benefits.
Interjurisdictional Operations: This section provides the overall
leadership, policy guidance, and budget and management direction for the Fish Division.
Regional Operations: This section provides the leadership,
planning, management, and direction for field implementation of Fish Division and agency programs within the four regions of the state.
Oregon Department of Fish and Wildlife________________________________________________________________________________________________________________2011-13 Way and Means Presentation
Fish Division Program Detail________________________________________________________________________________________________________________
Appendix 1 - 17

Issues
Fish Recovery and Conservation Planning: Federal recovery planning under the Endangered Species Act, state conservation planning under the
Northwest Power Act, Oregon Plan for Salmon and Watersheds, Oregon Conservation Strategy, and Native Fish Conservation Policy development and planning is ongoing and will continue into the foreseeable future. This has and will continue to place a heavy burden on program staff to provide technical and policy support, and affects the division’s discretionary use of state dollars for other management activities.
Federal Funding for Fish Protection and Mitigation: Federal funding for protection, mitigation and enhancement of fish and wildlife in the
Columbia Basin is likely to be reduced as a result of federal efforts to hold steady or reduce rates that the Bonneville Power Administration charges customers for electricity. This likely will mean reductions in agency programs for habitat protection and restoration, hatchery operations and maintenance, selective harvest management, and research, monitoring and evaluation.
Fisheries Restrictions: Fisheries restrictions associated with threatened and endangered salmon and steelhead will continue to constrain
access to healthy naturally produced stocks and hatchery fish, and may negatively affect license sales and revenues.
Oregon Department of Fish and Wildlife________________________________________________________________________________________________________________2011-13 Way and Means Presentation
Fish Division Program Detail________________________________________________________________________________________________________________
Appendix 1 - 18

Revenue Sources and Proposed Revenue Changes Other Funds revenue sources primarily include recreational angling license and tag sales and contractual agreements with nonfederal agencies. These agencies include the City of Portland, Pacific Coast Salmon Recovery Fund, Northwest Power and Conservation Council, and Columbia Basin Fish and Wildlife Authority. Federal Funds are received from various agencies for contractual agreements for specific work. These federal agencies include the Bonneville Power Administration, U.S. Army Corps of Engineers, NOAA Fisheries, and U.S. Department of the Interior (primarily Sport Fish Restoration funds). Matching requirements vary from 25 percent to 33 percent.
Proposed Revenue Changes No revenue changes are proposed.
Proposed New Laws
No new laws are proposed.
Expected Results from the 2011-13 Budget Oregon Benchmark 85 (wild salmon and steelhead restoration): The state’s strategy is to improve fish habitat, enhance water quality and improve fish passage so that salmon and steelhead recovery will have the best possible chance given ocean conditions. ODFW works closely with the federal government in mitigating dam-related issues affecting salmon, steelhead, sturgeon and shad. ODFW also works closely with tribal governments to meet and protect treaty obligations. Benchmark 88 (species protection): ODFW works with the federal government, tribal governments and adjoining states to manage fish species. Developing cooperative and reciprocating agreements is critical to protect, restore and enhance fish populations and their habitats.
Oregon Department of Fish and Wildlife________________________________________________________________________________________________________________2011-13 Way and Means Presentation
Fish Division Program Detail________________________________________________________________________________________________________________
Appendix 1 - 19

WILDLIFE MANAGEMENT PROGRAM
2011-13 Organization Chart
Positions = 153 FTE = 155.91
Oregon Department of Fish and Wildlife________________________________________________________________________________________________________________2011-13 Way and Means Presentation
Wildlife Division Program Detail________________________________________________________________________________________________________________
Appendix 2 - 1

Program and Activities The Wildlife Management program provides a variety of tasks and services related to game mammals, game birds, furbearers, damage and predators. Species inventories are conducted annually on game mammals and game birds. Furbearer, bear and cougar inventories are performed using harvest information and/or mandatory hunter and trapper check-ins. Primary research teams are located in southwest and northeast Oregon. On-going research is focused on elk, deer, cougar and bear. Additional research is conducted in conjunction with field staff, Oregon State University and other cooperators. Current projects include monitoring mountain quail reintroductions. Hunter surveys are conducted throughout the year. Field checks are conducted during hunting seasons to ensure compliance with regulations. Annual telephone hunter surveys for big game and upland birds provide information on statewide harvests. ODFW continues to implement a Hunter Harvest and Effort Survey system. Hunters can submit survey information either through the internet or by phone via an Interactive Voice Response system. Inventory, survey and research data are used to set harvest limits annually. Harvest regulations are published each November. The A&H Program (A&H), Regulated Hunt Areas (RHA) and the Upland Cooperative Access Program (UCAP), use cooperative agreements between ODFW, landowners, and corporations to allow public hunting on privately owned lands. Approximately 40,000 acres were in the RHA program in 2008, and about 105,000 acres were in UCAP. There are nearly 4.5 million acres of private land open for public access and over 96,000 acres of habitat have been improved through the A&H program. District staff responds to wildlife damage complaints and maintain records on all complaints including those involving mule deer, black-tailed deer, elk, antelope, bear and cougar. Landowners may be provided advice, repellents, hazing, fencing material and/or kill permits to address damage. Hunting seasons are often adjusted to assist with damage control. In some cases, habitat programs can be used to reduce or alleviate damage. Providing alternate food sources maintains the health of animals and reduces the damage to private property caused by foraging for food. These are discussed in more detail in the Habitat Resources Program.
Oregon Department of Fish and Wildlife________________________________________________________________________________________________________________2011-13 Way and Means Presentation
Wildlife Division Program Detail________________________________________________________________________________________________________________
Appendix 2 - 2

The Wildlife Management Program includes six sections: Game Management:
Species Inventories for deer, elk, pronghorn antelope, bighorn sheep, mountain goat, upland birds, and waterfowl are conducted annually. Furbearer, bear and cougar inventories are performed using harvest information and/or mandatory hunter and trapper check-ins.
Hunter Surveys (field checks) are conducted during hunting seasons to ensure compliance with regulations. Hunter harvest surveys for big game and upland birds provide information on statewide harvest. Hunter Surveys are being shifted from ODFW calling hunters to a mandatory hunter reporting system which allows hunters to report either by telephone using an interactive voice response system or over the internet. Furbearer harvest is monitored by the return of a mandatory harvest report.
Species Management includes Oregon’s first Black-tailed Deer Management Plan which was completed in 2008. Plans previously adopted by the Commission include those for bear, cougar, mule deer, elk, bighorn sheep and Rocky Mountain goats.
Harvest Regulations are set annually based on inventory, survey and research data. Game Bird Regulations are published each August. Big Game Regulations are published in November. Furbearer Regulations are set for a two-year period, but are reviewed annually in June/July.
Wildlife Diseases continue to be an issue of local and national concern. ODFW is active in national efforts to limit the spread of wildlife diseases. ODFW is monitoring annually for chronic wasting disease and highly pathogenic avian influenza.
Wildlife Research is being conducted primarily in northeast, south central and southwest Oregon. Projects include investigating elk calf survival, habitat selection by elk on managed lands, the movement of deer and elk in response to hunters and all terrain vehicles, black bear populations, pronghorn movement, mule deer, and mountain quail restoration.
Landowner Assistance is provided through a variety of programs to conduct habitat improvement projects. Hunting Access is provided through cooperative partnerships with private landowners and federal agencies.
Damage: This section is responsible for working with landowners to prevent and reduce wildlife damage to property including agricultural and timber crops, and to deal with nuisance wildlife and public health risks. Watershed staff responds to wildlife damage complaints and maintain records of those complaints. Advice, hazing and kill permits, and hunting seasons are some of the methods used to address damage problems. Wildlife Management Dedicated and Obligated Fund Oversight: This section is responsible for monitoring and use of dedicated and obligated funds for bighorn sheep, mountain goats, pronghorn antelope, wild turkeys, upland game birds and waterfowl. Dedicated funds are used for a variety of purposes including inventories, disease monitoring, research, and habitat projects. The funds also support hunter access programs such as Regulated Hunt Areas and the Upland Cooperative Access Program. This also includes the A&H Program, initiated in 1993, which provides wildlife habitat enhancement and improved hunter access to private lands. Those projects approved by the seven-member A&H Board are forwarded to the Commission for final approval. Dedicated funds are used for reintroduction of species such as Rocky Mountain goats and mountain quail to areas where numbers are very limited or nonexistent. Predator Control: This section is responsible for ensuring statutory compliance with ORS 610.020 to contribute to the cooperative predatory animal fund with the Oregon Department of Agriculture and participating counties.
Oregon Department of Fish and Wildlife________________________________________________________________________________________________________________2011-13 Way and Means Presentation
Wildlife Division Program Detail________________________________________________________________________________________________________________
Appendix 2 - 3

Regional Operations: This section provides overall leadership policy implementation and budget and management direction for the Wildlife Division. Restoration and Management: This section is responsible for administering the Pittman-Robertson Act and technical assistance throughout the state. Program staff is responsible for statewide habitat development, 16 major wildlife management areas, wildlife research and a technical assistance program.
Issues
Avian Influenza: ODFW has taken the lead in development and implementation of a monitoring program for early detection of Avian Influenza. This is part of a national effort and will be used by both federal and other state agencies to evaluate human health risks and appropriate responses.
Chronic Wasting Disease: In response to growing concerns about the potential spread of Chronic Wasting Disease (CWD) into Oregon, the
Commission continues to ban the importation of all live cervids, except reindeer originating in Oregon. This ban directly affects 42 Type 1 and Type 2 cervid permit holders. Additionally, importation of whole carcasses of hunter-killed cervids is banned from states and provinces where CWD has been found. Importation of boned meat, parts, hides and antlers still is allowed, as long as no portion of the brain or spinal cord is included. The spread of CWD, a disease similar to Mad Cow Disease, throughout much of the United States has focused national attention on containment and elimination of the disease. Efforts to develop live animal tests have been mixed, with no definitive live tests yet available for elk or deer.
Sage Grouse Conservation Planning: The sage grouse is an obligate sagebrush species that requires large tracts of sagebrush habitat for its
survival. Sage grouse historically occurred in at least 16 states and three provinces. The birds’ current range covers portions of 11 states including Oregon. The long-term trend in sage grouse abundance is declining throughout its range and is currently listed as “Precluded but Warranted” by the United States Fish and Wildlife Service (USFWS) under consideration for federal listing under the Endangered Species Act (ESA). Oregon is participating in an agreement among state and federal land and wildlife management agencies to implement a strategy for the conservation and management of sage grouse and their sagebrush habitats. This required developing a statewide conservation plan for sage grouse with two parts: 1) a population and habitat assessment, and 2) an implementation strategy. The population and habitat assessment identified the primary challenges and opportunities for sage grouse conservation in the state. To fulfill this mission, ODFW hired a full-time sage grouse biologist/conservation planner. ODFW is now working with local implementation teams to develop projects and identify funding sources for voluntary habitat work on both private and public lands.
Wildlife Restoration: ODFW has nearly completed its revision of 12 existing wildlife area management plans and the development of four new
plans for its 16 major wildlife areas. This effort began in fall, 2005.
Oregon Department of Fish and Wildlife________________________________________________________________________________________________________________2011-13 Way and Means Presentation
Wildlife Division Program Detail________________________________________________________________________________________________________________
Appendix 2 - 4

The final plan is scheduled for adoption in 2011. ODFW is implementing a Wildlife Area Access Fee program. Hunters will receive a free vehicle access permit with their annual hunting license. For those who do not purchase a license but wish to visit agency wildlife areas, a $7 daily permit or $22 annual permit will be available for purchase through existing license sales agents. The monies raised from the Access Fee program will go to operation, maintenance, and enhancements of agency-managed wildlife areas, providing a stable and dedicated source of non-federal funding.
Access & Habitat Program: With Legislative approval, ODFW increased the current license surcharge from $2 to $4 on all hunting licenses (excluding juvenile licenses) and extended the surcharge sunset until 2019. The number of applicants that must be considered for a Board appointment was recently changed from 15 to five.
Revenue Sources and Proposed Revenue Changes The Wildlife Management Program is funded with a combination of General Fund, Other Funds and Federal Funds. Other Funds are derived primarily from sales of hunting licenses, tags, and upland bird and waterfowl validations. Other Funds also are derived from the sale of upland bird and waterfowl stamps to collectors and the sale of waterfowl and upland bird prints. Funds are derived from the auction and/or raffle of deer, elk, pronghorn, bighorn sheep, and mountain goat tags. Funds derived from the sale of stamps, artwork, and auction and raffle tags are dedicated to the species or program providing the product or tag. Contractual agreements with nonfederal entities also provide Other Funds. Federal Funds are derived from contractual agreements with the USFWS and generally are matched 25 percent with Other Funds. The USFWS administers the Pittman-Robertson Act (Wildlife Restoration Program). A federal excise tax on the manufacture of firearms, archery equipment and ammunition is apportioned annually to all states based on a formula using state land area and the number of hunting licenses sold.
Oregon Department of Fish and Wildlife________________________________________________________________________________________________________________2011-13 Way and Means Presentation
Wildlife Division Program Detail________________________________________________________________________________________________________________
Appendix 2 - 5

Proposed Revenue Changes ODFW anticipates there may be another increase in Pittman-Robertson funds. Proposed New Laws
Penalties for failure to file mandatory report of harvest and effort: ODFW is in its second year of mandatory reporting of harvest and effort for big game and turkey hunts. Compliance continues to be low. Approximately 17 percent of tags were reported on for the 2008-09 season, and the number increased to 33 percent for the 2009-10 season. The reporting goal is 85 percent to ensure statistical reliability. If this is obtained, ODFW can discontinue the additional phone surveys to acquire accurate data, saving the agency an average of $15,000/year. ODFW does not have authority to charge a penalty fee for not reporting. This change will give ODFW authority to charge a penalty fee of up to $50 for those hunters that do not participate in the mandatory reporting of harvest and effort.
Authority to issue free big game tags: In addition to the request to penalize those who have not complied with mandatory reporting, ODFW would like to offer incentives for individuals who do comply with the mandatory reporting of hunter harvest and effort. Because reporting compliance continues to be low, ODFW is looking at ways to improve reporting rates. Initially, one of three extended season statewide tags would be offered for the hunter’s choice of pronghorn antelope, deer or elk. Three hunters will be drawn for this incentive.
License reinstatement: Currently, a hunting or angling license can be reinstated once the suspension timeframe is met. Often, there is a
restitution fee or other obligations that come with the suspension. Currently, these do no need to be met before the license is reinstated. This would entail amending ORS 497.415. The law states that a person may reapply for a license, tag or permit a certain number of years after their conviction (depending upon whether they were a first-time offender, etc.). The statute gives the person the right to reapply, regardless of whether they have paid any required restitution or met all the terms of the suspension. This proposed change would not allow a license to be reinstated until all the suspension terms are met.
Expected Results from the 2011-13 Budget Oregon Benchmark 87 (percent of monitored terrestrial species not at risk—plants, vertebrates, invertebrates): Game Program staff works with landowners to resolve damage complaints through various means including links to the habitat program. Full staffing lets the division continue to respond to landowners by developing strategies to address damage complaints, compile monthly summaries and implement long-term programs to reduce damage levels. These activities are tied to Oregon Benchmark 87 and KPM 10.
Oregon Department of Fish and Wildlife________________________________________________________________________________________________________________2011-13 Way and Means Presentation
Wildlife Division Program Detail________________________________________________________________________________________________________________
Appendix 2 - 6

Increased funding to maintain current service levels would allow for continued monitoring and assessment of population levels and species health of 100 percent of all big game, waterfowl and upland species. This relates to Oregon Benchmark 87 (percent of monitored terrestrial species not at risk). Significant work has continued to reestablish mountain quail in historical habitats in eastern Oregon. Washington and Idaho are now relocating mountain quail from Oregon. Game program and Information and Education Division staff continue efforts to retain hunters who have hunted in the past and recruit new hunters. Hunter education classes, Becoming an Outdoors Woman seminars, specialized Youth Day activities, reduced fees for youth licenses and a new Mentored Youth Hunter Program play a significant role in these recruiting efforts. Game Program staff continues working with the Habitat Resources program to improve wildlife population numbers through habitat improvement projects on both private and public lands. This activity is directly tied to KPM 1. Wildlife Area managers and headquarters habitat staff have nearly completed updating management plans for 16 wildlife areas across the state. The newly updated or adopted plans reflect ODFW’s continued commitment to maintain, protect, and enhance fish and wildlife populations on agency managed lands and to provide wildlife oriented recreational opportunities to the public. In addition, wildlife area staff will finish developing and will implement new five-year habitat management plans for five wildlife areas.
Oregon Department of Fish and Wildlife________________________________________________________________________________________________________________2011-13 Way and Means Presentation
Wildlife Division Program Detail________________________________________________________________________________________________________________
Appendix 2 - 7

WILDLIFE DIVISION HABITAT RESOURCES PROGRAM
2011-13 Organization Chart
Positions = 34 FTE = 35.25
Oregon Department of Fish and Wildlife________________________________________________________________________________________________________________2011-13 Way and Means Presentation
Wildlife Division Program Detail________________________________________________________________________________________________________________
Appendix 2 - 8

Program and Activities The Habitat Resources Program guides development and implementation of ODFW’s statewide goals and objectives for wildlife habitats, through division and field staff. The program’s objectives are to restore, enhance and maintain wildlife habitat to meet Oregon’s Wildlife Policy by: 1) improving habitat on state-owned wildlife areas or on other lands through cooperative partnerships; 2) developing management techniques; and 3) providing advice to agencies and land managers on habitat management. The program also restores and enhances depleted wildlife populations, and provides wildlife-oriented recreation. The Landowner Assistance and Interagency Coordination subprograms are implemented to achieve overall objectives. Landowner Assistance: Provides assistance to landowners for enhancement of private property for fish and wildlife habitat. This section includes the Wildlife Habitat Conservation and Management Subprogram, the Riparian Tax Incentive Subprogram and the Western Oregon Stream Restoration Subprogram (WOSRP). Interagency Coordination: Coordinates with other agencies to address land and water use issues associated with fish, wildlife and their habitat. This program includes coordination and technical assistance for state energy facility siting, transportation, forestry, land use, waterway alterations and natural resource damage assessment.
Oregon Department of Fish and Wildlife________________________________________________________________________________________________________________2011-13 Way and Means Presentation
Wildlife Division Program Detail________________________________________________________________________________________________________________
Appendix 2 - 9

Issues
Energy Development: Oregon continues to experience a substantial increase in new commercial energy project proposals, including wind energy, liquefied natural gas (LNG) import terminals and related pipelines, solar energy and electricity transmission. Many large commercial wind farms proposed on ridge crests south of the Columbia River in north central, northeastern and southeast Oregon could affect a number of wildlife species, particularly big game, grassland bird and bat species. There are three potential LNG import terminal locations and five potential natural gas pipelines identified for development across Oregon, all of which have already initiated the Federal Energy Regulatory Commission process. There are three large solar energy projects proposed in southeast Oregon. There are several large electric transmission lines proposed to move this new electricity through the energy grid. These projects could significantly impact wildlife, fish, and their habitat, including threatened and endangered (T&E) species.
State and Federal Forest Planning: ODFW is working to address fish and wildlife habitat management issues on state and federal forestlands in Oregon. ODFW provides technical assistance to the Oregon Department of Forestry (ODF) relating to the development and implementation of the Oregon Forest Practices Act and State Forest Management Plans. ODFW works with ODF to promote enhancement of fish and wildlife on state and private forestlands.
The US Forest Service (USFS) is beginning the process of rewriting all 13 Forest Management Plans (FMP) in Oregon encompassing approximately 16.4 million acres of public lands. The USFS will spend approximately five years re-writing all 13 FMPs. ODFW will provide advice and information to the BLM and USFS throughout their planning processes to enhance interdisciplinary capability.
Transportation Corridors and Wildlife Connectivity: ODFW is working with the Oregon Department of Transportation (ODOT) to develop a
statewide wildlife passage strategy. The strategy will focus on identifying wildlife crossing hotspots, key habitat linkages, and appropriate methods to improve passage and habitat permeability. A statewide strategic approach will enhance Oregon’s ability to reduce wildlife mortality, improve ecological connectivity of habitats bisected by highways, and improve safety for the traveling public. It will also reduce the economic burden from vehicle and property repairs, loss of human life and injuries, and costs incurred when delivery of goods and services are interrupted.
Wildlife/Land Use Interactions: Population growth experts predict Oregon’s human population will double within the next several decades. As Oregon’s human population grows, development pressures will continue to affect fish and wildlife and their habitat. ODFW is working with development interests and regulators to identify development methodologies that minimize or eliminate impacts to Oregon’s fish and wildlife resources.
Oregon Department of Fish and Wildlife________________________________________________________________________________________________________________2011-13 Way and Means Presentation
Wildlife Division Program Detail________________________________________________________________________________________________________________
Appendix 2 - 10

Revenue Sources and Proposed Revenue Changes The Habitat Resource Program is funded with a combination of General Fund, Other Funds and Federal Funds.
General Fund also serves as matching funds for some federal funds. Other Funds are derived from contractual agreements with nonfederal entities and license dollars. Federal Funds are administered through contractual agreements with the U.S. Fish and Wildlife Service (USFWS).
Proposed Revenue Changes Lottery Funds partially funded the WOSRP from the 2005-07 through 2009-11 biennia. However, shortfalls in lottery revenue have resulted in the elimination of lottery funding for the WOSRP, which has led to the elimination of 9 positions. Proposed New Laws
No new laws are proposed.
Expected Results from the 2011-13 Budget Staff works to provide technical assistance to landowners to enhance fish and wildlife populations and their habitats throughout Oregon. These efforts are integrated with the Oregon Plan for Salmon and Watersheds (specifically ODFW measure IVA6) and linked to Key Performance Measures 1, 2 and 3 by striving to maintain and enhance fish and wildlife habitat and reduce wildlife damage on private lands. These actions are directly related to Oregon Benchmarks 85, 86, 87 and 88. Interagency Coordination staff works to protect fish and wildlife habitats through technical assistance to agencies and landowners. These efforts are integrated with the Oregon Plan for Salmon and Watersheds (specifically ODFW measures IVA1, IVA6, IVA7, IVC6 and IVA5) and linked to Key Performance Measures 1 and 2 by striving to maintain and enhance fish and wildlife habitat directly related to Oregon Benchmarks 85, 86, 87 and 88.
Oregon Department of Fish and Wildlife________________________________________________________________________________________________________________2011-13 Way and Means Presentation
Wildlife Division Program Detail________________________________________________________________________________________________________________
Appendix 2 - 11

Landowner Assistance staff work with private landowners to protect, restore and/or enhance fish and wildlife habitat on private property. These efforts are directly tied to the Oregon Plan for Salmon and Watersheds (specifically ODFW measures IB3, IVA5, IVA6, IVB2, IVB4 and IVC6) and tied to Key Performance Measures 1 and 2 and directly related to Oregon Benchmarks 85, 86, 87 and 88.
Oregon Department of Fish and Wildlife________________________________________________________________________________________________________________2011-13 Way and Means Presentation
Wildlife Division Program Detail________________________________________________________________________________________________________________
Appendix 2 - 12

WILDLIFE DIVISION CONSERVATION PROGRAM
2011-13 Organization Chart
Positions = 24 FTE = 19.86
Oregon Department of Fish and Wildlife________________________________________________________________________________________________________________2011-13 Way and Means Presentation
Wildlife Division Program Detail________________________________________________________________________________________________________________
Appendix 2 - 13

Program and Activities In past legislative sessions, ODFW has been questioned on what Wildlife Diversity means. After an internal review and discussion with stakeholders, the Wildlife Diversity Program has been renamed as the Conservation Program. This new name is consistent with the goals and objectives outlined in the Oregon Conservation Strategy (Strategy). The Conservation Program provides a variety of tasks and services related to the protection and management of all nongame wildlife. Nongame wildlife represents 88 percent of the wildlife species in the state. ODFW staff and cooperators survey species through annual inventories and research. The Conservation Program coordinates conservation and management of threatened, endangered and sensitive species at the state level. ODFW consults with and offers advice to other state agencies and landowners regarding land management actions that may affect listed species. ODFW evaluates petitions to list or delist species on the state threatened and endangered species list to determine if listing or delisting is warranted. This program also includes the Landowner Incentive, BPA Wildlife Mitigation, State Wildlife Grants and the Section 6 Threatened and Endangered programs and a portion of the Marine Mammal Program. The Strategy was initiated for the conservation of species and habitats and was formally approved by the U.S. Fish and Wildlife Service (USFWS) in February 2006. The Strategy identifies species most at-risk but not yet federally listed under the Endangered Species Act. It identifies limiting factors and conservation issues and recommends voluntary actions to reverse the declines.
Oregon Department of Fish and Wildlife________________________________________________________________________________________________________________2011-13 Way and Means Presentation
Wildlife Division Program Detail________________________________________________________________________________________________________________
Appendix 2 - 14

The Conservation Program includes three sections: Marine Conservation: The Marine Conservation subprogram is shared with the Fish Division. This program focuses on research and inventory of marine mammals such as seals and sea lions. Population monitoring and food habit studies are used to identify impacts for various fish species and to determine the overall population health of these federally protected species. The program plays a key role in monitoring impacts of seals and sea lions on salmon in the Columbia River and the state’s coordinated efforts with Washington to manage the complex Columbia River salmon runs. Staff conducts studies and surveys of pinnipeds, seal and sea lion predation, and interactions of these animals with other important marine resources and human activities in the coastal zone. Conservation Planning: This section addresses the need for proactive, voluntary measures aimed at keeping species from becoming threatened or endangered (T&E) through the Strategy. The Strategy emphasizes an efficient and effective approach to conservation, building on existing efforts and developing new partnerships. It provides a “toolbox” for private landowners and public land managers, providing information on species, habitats, conservation issues; recommendations for action; and resources and assistance available to landowners. Staff coordinates with federal, state and private organizations and individuals to conduct inventories, monitor populations, support and oversee research, maintain data systems, and implement conservation and recovery programs. Staff evaluates state T&E species listing and delisting petitions under the Oregon Endangered Species Act (ESA) to determine if listing or delisting is warranted. This sub-program also oversees the importation, possession, confinement, transportation and sale of non-native species. It was established to prevent additional exotic (non-native) species from becoming established in the wild and harming Oregon’s native species. The adverse impact of invasive species is one of six Key Conservation Issues identified by the Strategy as impacting the health of fish, wildlife and their habitats. ODFW is working in partnership with the Oregon Invasive Species Council and others to prevent new invasive species from being released into the environment. They are also working to contain, manage and, where possible, control and eradicate those species causing or likely to cause ecological and economic damage. Staff is an ex officio member of the Oregon Invasive Species Council. Dedicated and Obligated Funds Oversight: Responsible for monitoring the use of dedicated and obligated funds designated for fish, wildlife and habitat projects.
These projects include: o Statewide Species Surveys: Program staff and cooperators survey species through annual inventories and research. Bald eagles,
peregrine falcons, snowy plovers, western pond turtles, amphibians, colonial water birds and other at-risk species are monitored. o Wildlife Viewing and Outreach: Program staff tries to foster public awareness, understanding and value for Oregon’s diverse wildlife and
their habitats through information about wildlife and viewing opportunities so Oregonians can learn about and enjoy the state’s wildlife resources. ODFW partners with agencies and non-governmental organizations and businesses to enhance wildlife watching opportunities.
Oregon Department of Fish and Wildlife________________________________________________________________________________________________________________2011-13 Way and Means Presentation
Wildlife Division Program Detail________________________________________________________________________________________________________________
Appendix 2 - 15

Issues
Population Monitoring: Current funding levels do not allow for adequate monitoring of Oregon’s diverse wildlife species. Only high-profile species, such as bald eagles and peregrine falcons, are consistently monitored by ODFW. Consequently, ODFW has been unable to be proactive in providing biological data used to evaluate species and population health, while assisting other state agencies and private landowners to ensure long-term stable habitats to prevent ESA listings. Future monitoring priorities are being addressed through the Fish and Wildlife Monitoring Team under the Strategy.
Federal Funding: The federal government continues to offer funding and special programs to assist the agency in research, monitoring
species and improving habitats. However, these programs frequently require between a 25 percent or 50 percent match of non-federal funds from the state.
Oregon Conservation Strategy: The Strategy, which was approved by the USFWS in February 2006, provides a blueprint for voluntary
actions on private and public lands to conserve at risk fish and wildlife species and their habitats. The Strategy identifies Conservation Opportunity Areas throughout Oregon, and details specific at-risk habitats and the species dependent upon them. Strategy implementation will require cooperative work by many partners to accomplish the overall goal of preventing new listings of at-risk species. The voluntary nature of the Strategy follows the successful outline of the Oregon Plan for Salmon and Watersheds by involving Oregonians at the grass roots level to cooperatively take action. Implementing the Strategy (and its marine component, the Nearshore Strategy) is one of seven top agency priorities. ODFW has made significant progress integrating Strategy priorities in its planning, monitoring, grant and management programs. ODFW began implementing conservation projects in 2007 and will continue to do so in partnership with conservation groups, sportsmen and the land management community. Strategy implementation is contingent upon Federal Funds (State Wildlife Grants) and state matching funds.
Nongame Tax Check-off: Legislative action will remove the Non-game Tax Check-off donations option found on Oregon tax forms in the 2011
tax year. This revenue is expected to decrease significantly to a minimal amount. In part, those funds are used to maintain two Conservation field staff and 0.5 FTE in Marine. To continue these critical positions, ODFW is proposing to replace lost Tax Check-Off donations with Federal Funds from the state wildlife grant program.
Wolf Management: Provides technical assistance of one FTE through U.S. Department of Agriculture, Wildlife Services to provide
monitoring, proactive management, depredation response and outreach to landowners.
Oregon Department of Fish and Wildlife________________________________________________________________________________________________________________2011-13 Way and Means Presentation
Wildlife Division Program Detail________________________________________________________________________________________________________________
Appendix 2 - 16

Revenue Sources and Proposed Revenue Changes The Conservation Program is funded with a combination of General Fund, Other Funds, and Federal Funds. Other Funds include non-game income tax check-off contributions, donations and interest income. These fund types are critical to the program for meeting federal match fund requirements. Tax check off revenue is expected to decrease to a minimal amount. Federal Funds are received primarily from the U.S. Department of the Interior for work on T&E species, some sensitive species and implementing the Strategy. There are also funds through contractual agreements with the Bonneville Power Administration. Proposed Revenue Changes Legislative action will remove the Non-game Tax Check-off donations option found on Oregon tax forms in the 2011 tax year. To continue funding critical Conservation positions, ODFW is proposing to replace reduced Tax Check-off donations with Federal Funds from the State Wildlife Grant Program. ODFW also must secure important matching funds to implement the Strategy, as discussed above. Proposed New Laws
Habitat Conservation Stamp: ODFW will implement a Habitat Conservation Stamp to provide matching funds for habitat and species restoration activities identified under the Strategy. The voluntary stamp validation would be available to individuals through ODFW’s Point of Sale agents across the state. The actual stamp would be available by contacting ODFW and receiving the stamp through the mail, similar to the upland bird and waterfowl stamps.
Oregon Department of Fish and Wildlife________________________________________________________________________________________________________________2011-13 Way and Means Presentation
Wildlife Division Program Detail________________________________________________________________________________________________________________
Appendix 2 - 17

Expected Results from the 2011-13 Budget Oregon Benchmark 87, (Percent of monitored terrestrial species not at risk—plants, vertebrates, invertebrates): Conservation Program staff work with landowners to resolve damage complaints through a variety of means. Many cases deal with urban landowners and the problems are addressed through education and advice. Current staffing levels do not allow for adequate service delivery across the state, which results in other division staff handling most complaints. These activities are tied to Oregon Benchmark 87 and Key Performance Measure 10. Funding at current service levels allows for maintenance of minimum monitoring and assessment of population levels and species health. Other critical species cannot be monitored under current funding levels, which limits the agency’s ability to provide basic biological assessments used to ensure long-term species survival. Oregon Benchmark 87 and Key Performance Measure 12 are designed to evaluate the agency’s monitoring of various species populations.
Oregon Department of Fish and Wildlife________________________________________________________________________________________________________________2011-13 Way and Means Presentation
Wildlife Division Program Detail________________________________________________________________________________________________________________
Appendix 2 - 18

State Police Enforcement Program and Activities
The Oregon Department of Fish and Wildlife will provide $22.32 million during the 2011-13 biennium to Oregon State Police (OSP) Fish and Wildlife Division. The primary mission of the OSP Fish and Wildlife Division is to ensure compliance with the laws and regulations that protect and enhance the long-term health and equitable use of Oregon’s fish and wildlife resources and the habitats upon which they depend. The OSP Fish and Wildlife Division is the single enforcement entity designated by law to protect fish and wildlife resources.
The OSP Fish and Wildlife Division enforce fish, wildlife and commercial fishing laws, and protects natural resources. The members of the OSP
Fish and Wildlife Division also enforce traffic, criminal, boating, livestock and environmental protection laws, and respond to emergency situations. The Superintendent of State Police and the Director of ODFW have formed a partnership through Cooperative Enforcement Planning so that enforcement efforts of the division are directed toward ODFW’s priorities and management goals.
Thirteen members of the OSP Fish and Wildlife Division are assigned to enforce laws directly relating to the Oregon Plan for Salmon and
Watersheds. Members are strategically assigned to locations where they can positively affect sensitive, threatened and endangered salmon, steelhead and resident fish populations.
Issues
The OSP Fish and Wildlife Division, as the single enforcement entity tasked with protecting fish and wildlife resources, has been hindered by limited officers available to meet a growing workload. An expanding population base desires to use a finite, and in some cases a declining, natural resource base. As a result, the protection of Oregon’s fish and wildlife resources is more critical than ever before. Increasingly, the division is called upon to investigate natural resource violations in such areas as fill and removal, water quality and quantity, water pollution and forest practices. These requests have resulted in partnerships with other natural resource agencies.
OSP’s strategic plan includes the Fish and Wildlife Division as an integral component. A division-specific strategic plan includes Cooperative
Enforcement Planning as a priority task.
The OSP strategic plan also is focused on additional training to enhance professionalism, increase funding for, and increase knowledge and use of, information systems.
Oregon Department of Fish and Wildlife________________________________________________________________________________________________________________2011-13 Way and Means Presentation
State Police Enforcement Program Detail________________________________________________________________________________________________________________
Appendix 3 - 1

Revenue Sources and Proposed Revenue Changes Historically, the OSP Fish and Wildlife Division received 100 percent Other Funds from ODFW through an Inter-Governmental Agreement. Other Funds are derived from the sales of hunting and fishing licenses and tags, and commercial fishing fees. This same funding will continue into the 2011-13 biennium.
Proposed New Laws
No new laws are proposed. Expected Results from the 2011-13 Budget Compliance rates are included as a performance measure for anadromous fish protection. This measure directly relates to the Oregon Benchmarks for quality of life, which includes Benchmark 85a (the percentage of key sub-basins in which wild salmon and steelhead populations are at target levels).
Oregon Department of Fish and Wildlife________________________________________________________________________________________________________________2011-13 Way and Means Presentation
State Police Enforcement Program Detail________________________________________________________________________________________________________________
Appendix 3 - 2

ADMINISTRATION
2011-13 Organization Chart
Positions = 131 FTE = 129.07
Oregon Department of Fish and Wildlife________________________________________________________________________________________________________________2011-13 Way and Means Presentation
Administrative Program Detail________________________________________________________________________________________________________________
Appendix 4 - 1

Programs and Activities The Administration budget for the Oregon Department of Fish and Wildlife includes the Oregon Fish and Wildlife Commission, Director’s Office, Commercial Fishery Permit Board, Administrative Services Division, Human Resources Division, Information and Education Division, and the Information Systems Division. The primary program tasks for each area are listed below. Fish and Wildlife Commission: The seven-member Oregon Fish and Wildlife Commission, as established by ORS 496.080, is appointed by the Governor. The Commission hires the agency director, sets policy and adopts administrative rules. Each Commissioner has a four-year term of office and is appointed subject to confirmation by the Oregon Senate. One Commission member is appointed from each of the state’s five Congressional districts, and one each from west and east of the Cascades. The Commission is required to hold at least one meeting per year in each of the state’s Congressional districts. Director’s Office: The Director’s Office consists of the ODFW director and two deputy directors. The agency director oversees agency operations and administration, and provides leadership for fish and wildlife programs, including watershed enhancement and ODFW’s role in implementing the Oregon Plan for Salmon and Watersheds and the Oregon Conservation Strategy. The director represents ODFW on the Governor’s Natural Resources Cabinet and before Oregon’s legislators and members of the U.S. Congressional delegation. The director also represents ODFW in cooperative efforts with other natural resource agencies within Oregon and throughout the United States, and with federal agencies such as the U.S. Fish and Wildlife Service, Bonneville Power Administration and the National Marine Fisheries Service. The director assists the Commission in setting policy and adopting administrative rules. The two deputy directors oversee the agency’s day-to-day activities. The deputy in charge of Fish and Wildlife Programs oversees the activities of the Fish and Wildlife divisions and the Northwest, Southwest, High Desert, and Northeast regions. The deputy in charge of Administration oversees the Administrative Services, Human Resources, Information and Education, and Information Services divisions.
Oregon Department of Fish and Wildlife________________________________________________________________________________________________________________2011-13 Way and Means Presentation
Administrative Program Detail________________________________________________________________________________________________________________
Appendix 4 - 2

Commercial Fishery Permit Board: The Commercial Fishery Permit Board, as established in ORS 508.755, is responsible for reviewing denials of permits for commercial fisheries that require permits, such as gillnet salmon, troll salmon, shrimp, roe herring and sea urchin. Upon review of a permit denial made by ODFW, the Board may authorize a waiver of permit requirements as deemed appropriate during the review process. Board members are appointed by the Oregon Fish and Wildlife Commission. Three Board members are chosen to represent the Columbia River gillnet salmon fishing industry, three to represent the Yaquina Bay roe herring fishing industry, three to represent the sea urchin commercial fishery, three to represent the ocean Dungeness crab fishing industry, and two to represent the public. Administrative Services:
Administration: Economic analysis and revenue forecast support for management of agency resources; support information security directives; and support internal audit requirements.
Budget Services: Develop, allocate and analyze ODFW biennial budget, and administer and monitor federal revenue contracts in coordination with program managers.
Contract Services: Provide technical support for contracts, grants, and purchases agency-wide including mobile communication devices; provide risk management services; and manage agency-wide fleet.
Fiscal Services: Process revenue and expenditures for ODFW programs; provide accounts receivable and payable services; process agency-wide payroll; oversee inventory and fixed assets; and prepare financial reports.
License Services: Issue computerized, mail-order and commercial licenses; respond to constituents’ questions on rules and license requirements; and provide support to 600 license agents.
Human Resources: Directs human resources, safety and health-related activities, equal employment opportunity, recruitment, position classification, labor relations, affirmative action, and workforce enhancement.
Oregon Department of Fish and Wildlife________________________________________________________________________________________________________________2011-13 Way and Means Presentation
Administrative Program Detail________________________________________________________________________________________________________________
Appendix 4 - 3

Information and Education:
Information Section: Respond to media and public inquiries regarding fish and wildlife management, Fish and Wildlife Commission decisions, and fishing and hunting regulation questions. Provide outreach and other support for the Oregon Conservation Strategy, Nearshore Strategy, the Oregon Plan for Salmon and Watersheds and other natural resource plans.
Marketing Section: Promote fishing, hunting, and wildlife viewing opportunities through website, e-mail, telephone, brochures, and other printed and electronic materials. Develop marketing efforts to promote and increase the sale of fishing and hunting licenses and participation in ODFW programs. Manage the agency’s social media presence, including Facebook, Twitter and YouTube.
Web/Graphics Section: Manage ODFW external and internal websites.
Education Section: Certify more than 5,000 students each year in safe firearms handling and practice, hunter ethics and responsibilities, and wildlife conservation through statewide Hunter Education program. Teach basic angling skills, angler ethics and aquatic stewardship to more than 5,000 youth each year through the statewide Angler and Aquatic Education program. Support dozens of Youth Angling Enhancement Program and Free Fishing Weekend events. Offer hands-on instruction in fishing, hunting, crabbing, clamming and other outdoor activities through the Outdoor Skills program. Coordinate the Mentored Youth Hunter Program which allows youth ages 9-13 to hunt without first taking a hunter education course.
Information Systems:
Help Desk Unit: Provide desktop computer support, Unisys mainframe operations, and other support services to employees throughout ODFW. Network Unit: Provide the technical support for the enterprise systems including all servers, office network connectivity, and security. Application Development Unit: Design, develop, and support custom business applications. Administration Unit: Provide guidance and support within the division and serve as the key liaison to both executive and field operations.
Oregon Department of Fish and Wildlife________________________________________________________________________________________________________________2011-13 Way and Means Presentation
Administrative Program Detail________________________________________________________________________________________________________________
Appendix 4 - 4

Issues Fiscal integrity is one of ODFW’s flagship principles. ODFW meets regularly with analysts from the Legislative Fiscal Office and the Budget and Management Division of DAS. ODFW moved monthly payroll and expenditure reports to an electronic format so staff has timely access to management data. ODFW is building additional electronic reporting tools for managers to better monitor budget information. Issues to be addressed in the current and for the next biennium include: improving website communications; implementing an online asset
management system; developing a grants management system; upgrading ODFW’s information systems infrastructure to better meet public service expectations; and developing better tools for managing accounts receivable and contract services.
Revenue Sources Revenue to support administration activities is generated from a mix of
General Fund, Other Funds and Federal Funds.
Other Funds include the sale of hunting and fishing licenses and tags, federal indirect cost recovery, and a small amount of donations and miscellaneous
revenue. Federal Funds are received from the U.S. Fish and Wildlife Service to support Hunter Education and Aquatic and Angler Education programs. Federal Funds are matched with in-kind volunteer hours.
Oregon Department of Fish and Wildlife________________________________________________________________________________________________________________2011-13 Way and Means Presentation
Administrative Program Detail________________________________________________________________________________________________________________
Appendix 4 - 5

Proposed Revenue Changes Several new, multimillion dollar, multi-year federal contracts have recently been established. This will increase federal indirect revenue to fund new staff needed to support these new contracts. One new position is the Human Resource Analyst 3 requested in policy option package 133. Proposed Revision to Laws
No new laws are proposed.
Oregon Department of Fish and Wildlife________________________________________________________________________________________________________________2011-13 Way and Means Presentation
Administrative Program Detail________________________________________________________________________________________________________________
Appendix 4 - 6

Debt Service
Programs and Activities The Debt Service budget for ODFW is used to repay monies borrowed for deferred maintenance projects. Projects include maintenance of Wildlife Area field offices, hatchery facilities and residences, and other ODFW owned property.
Oregon Department of Fish and Wildlife_______________________________________________________________________________________________________________2011-13 Ways and Means Presentation
Debt Service Program Detail________________________________________________________________________________________________________________
Appendix 5 - 1

CAPITAL IMPROVEMENT
2011-13 Organization Chart
Positions = 2 FTE = 2
Oregon Department of Fish and Wildlife________________________________________________________________________________________________________________2011-13 Way and Means Presentation
Capital Improvement________________________________________________________________________________________________________________
Appendix 6 - 1

CAPITAL IMPROVEMENT
Program and Activities The Capital Improvement budget is allocated among three program areas: Restoration and Enhancement, Deferred Maintenance, and Emergency Hatchery Maintenance. Restoration and Enhancement (R&E): On June 29, 1989, the Oregon Fisheries Restoration and Enhancement Act of 1989 (R&E) was signed into law. This act allowed ODFW to undertake a comprehensive program to restore state-owned fish hatcheries, enhance natural fish production, expand hatchery production, and provide additional public access to fishing waters. The R&E program provides increased sport recreational fishing opportunities, and supports and improves the commercial salmon fishery. To generate funding for the program, a $2 surcharge on all sport fishing licenses was dedicated to R&E along with all license revenues from commercial gillnetting and troll fishing licenses. Landing fees from the troll and gillnet fisheries were also dedicated to the R&E program. These surcharges and fees became effective January 1, 1990, and will continue through December 31, 2019 when the program sunsets. Program expenditures are allocated in the same proportion as the revenues received from surcharges. For example, the 2009-11 estimates of recreational fees account for 88 percent of the revenue generated while the commercial fees generate 12 percent. Thus, roughly 88 percent of funded projects provide direct benefits to recreational fisheries and 12 percent provide direct benefits to commercial fisheries. In 2009, the Legislature voted to increase the surcharge from $2 to $4 in 2010. This generated approximately $5.2 million for the program in the 2009-11 biennium. All revenues are dedicated exclusively to the R&E program. The R&E program is divided into two components — restoration and enhancement. Restoration projects generally fall into four categories: hatchery repairs, maintenance, and equipment; fish liberation equipment; fish ladders, screens and passage; and projects such as angler surveys and fish
Oregon Department of Fish and Wildlife________________________________________________________________________________________________________________2011-13 Way and Means Presentation
Capital Improvement________________________________________________________________________________________________________________
Appendix 6 - 2

population research and monitoring. Enhancement projects generally fall into the categories of angler access; public education; habitat improvement; new hatchery technology and equipment; new fishways or screens; and other projects such as invasive fish eradication and restroom construction. By statute, the R&E Board must recommend a “balanced mix of projects between restoration and enhancement.” Any public or private non-profit organization may request funds to implement fish restoration or enhancement projects. Program expenditures will be made in the same proportion as the revenues derived from the surcharges. ODFW currently estimates recreational fees account for 90 percent of the revenue generated while the commercial fees generate 10 percent. Thus, a majority of the projects undertaken will benefit the recreational fisheries. Deferred Maintenance ODFW owns 403 buildings valued under $1.0 million and six buildings valued over $1.0 million. These buildings total 773,417 square feet and have a replacement value in excess of $58 million. In addition, ODFW owns and operates land improvements valued at $24.2 million, leasehold improvements valued at $1.44 million, roads valued at $8.33 million, tunnels and bridges valued at $720,500, utility systems valued at $117.3 million, and docks, dikes, and dams valued at over $24.7 million. These assets are sited on more than 436,100 acres of agency owned or controlled land. The replacement value of these assets is estimated at over $262 million and represents a significant state investment in the agency over a number of years. As with all state agencies that own property or facilities, ODFW continues to have a backlog of facility maintenance. An exhaustive deferred maintenance field study was completed in 2002 and updated in February 2004. ODFW determined that a more detailed assessment of facility conditions was necessary to use that information as a management and budgetary tool. DLR Group Architecture and Planning was hired to perform a complete condition assessment of the majority of ODFW facilities. The Maintenance Master Plan was completed in December 2005 and identified deferred maintenance needs of $10.7 million. The 2007 Legislature authorized $1.4 million in Certificates of Participation and $0.7 million in federal fund housing revenue to finance projects to reduce the back log of deferred maintenance. The 2009 Legislature authorized $2.6 million in “Go Oregon” economic stimulus funding, and about half of this amount was used to fund deferred maintenance projects.
Sufficient funding is not presently available to eliminate the maintenance backlog. The challenge ODFW faces is to retire the hatchery maintenance backlog and modernize facilities to meet new management objectives. To date, little funding is available for these purposes. We continue to pursue partnership opportunities and look for ways to fund deferred maintenance projects from a wide variety of state, federal, tribal and non-profit organizations.
Oregon Department of Fish and Wildlife________________________________________________________________________________________________________________2011-13 Way and Means Presentation
Capital Improvement________________________________________________________________________________________________________________
Appendix 6 - 3

Emergency Hatchery Maintenance This program provides emergency repairs and maintenance for ODFW’s state-funded hatcheries. Funds for emergency projects are allocated by the Engineering and Facilities section within the Fish Division on a case by case basis to fund emergency repairs or maintenance that a hatchery facility may need to maintain production. Typical projects include repair or replacement of water distribution pumps, domestic and process water valves, pollution abatement line piping, and water diversion structures. Annuity Deferred Maintenance Account The Legislature established a $3.5 million account, allowing the interest to be used for maintenance at agency hatcheries and other agency owned facilities. Funds for these projects are allocated by the Engineering and Facilities section within the Fish Division on a case by case basis. The 2009 Legislature disappropriated $3.5 million from the account, leaving ODFW the accrued interest. In February 2010, the Legislature returned $1.5 million to the account after the U.S. Fish and Wildlife Service determined the original action was an inappropriate diversion of license funds. Revenue Sources and Proposed Revenue Changes Deferred Maintenance projects are funded as Other Funds from interest earnings from the Deferred Maintenance account. R&E projects are funded as Other Funds through license fees. Emergency Hatchery Maintenance projects are funded by the General Fund.
Oregon Department of Fish and Wildlife________________________________________________________________________________________________________________2011-13 Way and Means Presentation
Capital Improvement________________________________________________________________________________________________________________
Appendix 6 - 4

Capital Improvement
2011-13 Project Description Site Structure Less: Force Account
Work Expenditures Fund
Deferred Maintenance – Various Projects Retire the hatchery, wildlife area, and administrative facility deferred maintenance backlog and modernize facilities to meet new management objectives
0 403,634 0 403,634 Other
Emergency Hatchery Maintenance – Various Projects This program provides emergency repairs and maintenance for ODFW’s state-funded hatcheries. Funds for emergency projects are allocated by the Engineering and Facilities section within the Fish Division on a case by case basis to fund emergency repairs/maintenance that a hatchery facility cannot absorb within their existing operating budget.
0 161,334 0 161,334 General
Restoration and Enhancement – Various Projects A comprehensive program to restore state owned fish hatcheries, enhance natural fish production, expand hatchery production, and provide additional public access to fishing waters. The R&E program provides increased sport recreational fishing opportunities and supports and improves the commercial salmon fishery.
0 5,951,298 0 5,951,298 Other
Major Improvements – Marine Building Purchase ODFW proposes purchase of a building to alleviate office space constraints.
0 600,000 0 600,000 Other
Major Improvements – Willamette Falls Fish Ladder A project to repair failing expansion joints in the fish ladder. Work would include de-watering sections of the ladder, and installing elastomeric joint sealant.
0 600,000 0 600,000 Federal
Major Improvements – Clackamas Hatchery Intake
This is a project to design and construct an improved water intake and water delivery system for the Clackamas Fish Hatchery.
0 750,000 0 750,000 Other
Oregon Department of Fish and Wildlife________________________________________________________________________________________________________________2011-13 Way and Means Presentation
Capital Improvement________________________________________________________________________________________________________________
Appendix 6 - 5
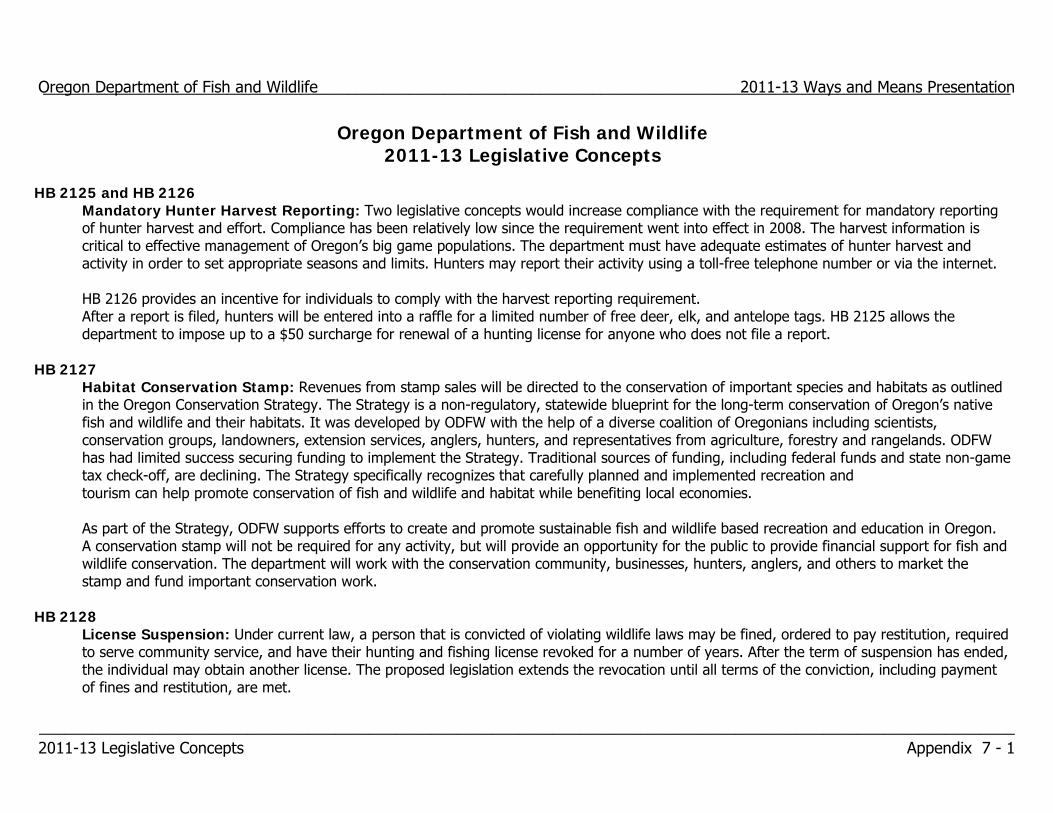
Oregon Department of Fish and Wildlife
2011-13 Legislative Concepts HB 2125 and HB 2126
Mandatory Hunter Harvest Reporting: Two legislative concepts would increase compliance with the requirement for mandatory reporting of hunter harvest and effort. Compliance has been relatively low since the requirement went into effect in 2008. The harvest information is critical to effective management of Oregon’s big game populations. The department must have adequate estimates of hunter harvest and activity in order to set appropriate seasons and limits. Hunters may report their activity using a toll-free telephone number or via the internet. HB 2126 provides an incentive for individuals to comply with the harvest reporting requirement. After a report is filed, hunters will be entered into a raffle for a limited number of free deer, elk, and antelope tags. HB 2125 allows the department to impose up to a $50 surcharge for renewal of a hunting license for anyone who does not file a report.
HB 2127
Habitat Conservation Stamp: Revenues from stamp sales will be directed to the conservation of important species and habitats as outlined in the Oregon Conservation Strategy. The Strategy is a non-regulatory, statewide blueprint for the long-term conservation of Oregon’s native fish and wildlife and their habitats. It was developed by ODFW with the help of a diverse coalition of Oregonians including scientists, conservation groups, landowners, extension services, anglers, hunters, and representatives from agriculture, forestry and rangelands. ODFW has had limited success securing funding to implement the Strategy. Traditional sources of funding, including federal funds and state non-game tax check-off, are declining. The Strategy specifically recognizes that carefully planned and implemented recreation and tourism can help promote conservation of fish and wildlife and habitat while benefiting local economies. As part of the Strategy, ODFW supports efforts to create and promote sustainable fish and wildlife based recreation and education in Oregon. A conservation stamp will not be required for any activity, but will provide an opportunity for the public to provide financial support for fish and wildlife conservation. The department will work with the conservation community, businesses, hunters, anglers, and others to market the stamp and fund important conservation work.
HB 2128 License Suspension: Under current law, a person that is convicted of violating wildlife laws may be fined, ordered to pay restitution, required to serve community service, and have their hunting and fishing license revoked for a number of years. After the term of suspension has ended, the individual may obtain another license. The proposed legislation extends the revocation until all terms of the conviction, including payment of fines and restitution, are met.
Oregon Department of Fish and Wildlife_______________________________________________________________________________________________________________2011-13 Ways and Means Presentation
2011-13 Legislative Concepts________________________________________________________________________________________________________________
Appendix 7 - 1

i December 14, 2010 HB 3489 Report
House Bill 3489 – Plan to Reform Department-Operated Fish Hatcheries on the Oregon Coast
Submitted by the Oregon Department of Fish and Wildlife December 14, 2010
The 75th Oregon legislature directed the Oregon Department of Fish and Wildlife (ODFW) to develop a plan for reforming department-operated fish hatcheries on the Oregon coast, and asked the department to report findings to the 76th legislative assembly on or before October 1, 2010. House Bill 3489 directed ODFW to do the following: SECTION 1. (1) The State Department of Fish and Wildlife shall develop a plan to reform operation of department-operated fish hatcheries on the Oregon coast.
(2) The plan shall include provisions for the evaluation of current coastal hatchery programs with respect to:
(a) Broodstock and production management strategies; (b) Hatchery infrastructure enhancement plans in support of management
strategies; (c) Hatchery effluent management and National Pollutant Discharge Elimination
system compliance recommendations; (d) Recommended strategies for the management of fish disease, and (e) Prioritization of deferred maintenance. (3) The department shall complete the plan and submit the plan to an interim
legislative committee related to environment and natural resources for review on or before October 1, 2010.

ii December 14, 2010 HB 3489 Report
Executive Summary
Acting on the direction received from the Legislature, ODFW assembled an internal team comprised of fish management, propagation, engineering, and fish health staff to develop this plan. The department-operated hatcheries considered in this plan are the Alsea, Bandon, Cedar Creek, Elk River, North Nehalem, Rock Creek, Salmon River, and Trask River Hatcheries; the Cole Rivers Hatchery was not considered in this plan as it is operated under an agreement with the Army Corps of Engineers as mitigation for lost fish production in the upper Rogue basin.
This plan is based on existing policies and plans, such as the Native Fish Conservation Policy (NFCP), the Fish Hatchery Management Policy (FHMP), the Fish Health Policy (FHP), Commission-adopted Conservation and Basin Plans, Hatchery Genetic Management Plans (HGMP), and the Oregon Plan for Salmon and Watersheds (OPSW). There is no comprehensive multi-species plan that provides a complete conservation and utilization framework from which ODFW can effectively reform the current programs. The current program largely reflects dated and hatchery-specific fish management objectives that do not encompass the collective needs across the Oregon Coast.
Based on the management and policy backdrop described above, ODFW offers the following Key Findings and Recommendations regarding reform of Oregon’s coastal hatchery programs.
Key Findings: 1. Overall ODFW continues to implement a strong program:
a. Despite long-standing budget challenges, ODFW hatchery managers and staff have met the fish management goals for their programs over the last decade:
i. Meeting production goals and providing diverse sport and commercial fisheries;
1. In 2009, the production goal for Oregon’s coastal hatcheries was 4,721,600 fish and the goal was met as follows:
a. Winter Steelhead 1,060,000 b. Summer Steelhead 290,000 c. Coho 260,000 d. Spring Chinook 705,000 e. Fall Chinook 1,993,600 f. Rainbow trout 413,850
Total 4,722,450 2. The most recent returns contributed 44,674 hatchery
salmon and steelhead to sport and commercial fisheries and 151,540 trout to sport fisheries.
ii. The cost to implement this program for the 2009-2011 biennium is estimated at $8,103,930 and is funded with a combination of general funds and license funds. These costs include hatchery

iii December 14, 2010 HB 3489 Report
operations and maintenance, engineering, Fish Health Services, fish marking, and fish liberation.
2. Aggressively managing to minimize fish health issues; a. ODFW Fish Health staff works continuously to reduce our reliance on
drugs and chemicals in fish culture practices by implementing new technology such as moist air incubators. While complete elimination of therapeutics (chemical use) will not be possible, reductions have been made and should continue to be made. Water supplies that are free of or have reduced pathogens can improve adult holding conditions and increase survival. ODFW continues to ensure that chemicals are not improperly discharged into receiving waters.
3. Being good stewards of local watersheds; a. All hatcheries reviewed have been in compliance with National Pollutant
Discharge Elimination System permits (NPDES) system since 2007. Compliance was met despite the lack of or undersized abatement ponds. It should be noted, however, that major increases in production may require construction or expansion of existing abatement ponds.
b. ODFW maintains a strong professional staff that has built lasting relationships in local communities; and has developed an army of volunteers, without which the hatcheries couldn’t get their work done.
4. ODFW has made significant progress addressing long-standing deferred maintenance needs at state-operated hatcheries;
a. Since 2005, ODFW has made significant investments in reducing the backlog ($2.1 million) of deferred maintenance needs at coastal hatcheries, through the judicious use of ODFW funds and supplemental funding from the Restoration and Enhancement Board.
b. ODFW believes the remaining deferred maintenance needs are relatively manageable ($1.1 million). The department has developed a priority list to address deferred maintenance and will seek to complete with existing budgets and additional requests to the R&E Board.
c. Continued investments must be made to ensure the long-term sustainability of the system.
5. Existing Programs Need Few Changes to Address Current Management Needs;
a. Evaluations of existing hatchery programs suggest few adjustments to broodstock sources and fish production are needed to meet current management strategies. Adjustment will be considered during the development of a multi-species coastal conservation plan, e.g., the release of Siletz wild stock smolts in the Yaquina drainage will need to be addressed. Broodstock goals and production goals are being met with existing facility and personnel. Additional infrastructure at existing facilities may be required to implement multi-species coastal species conservation plan.

iv December 14, 2010 HB 3489 Report
Based on these Key Findings, ODFW makes the following Key Recommendations for the reform of ODFW’s Coastal Hatcheries:
Key Recommendations: 1. Fully Fund the On-Going Operations, Maintenance and Monitoring
Needs of the Existing Program; a. The annual Operations and Maintenance needs of ODFW’s coastal
hatcheries have been chronically under-funded for decades. Operations and Maintenance has been eroded by ties to state general funds, and growth has not kept pace with the needs of the programs.
b. The basic monitoring of hatchery programs, as called for in ODFW’s Hatchery Management Policy, has not been fully funded, leaving managers unable to evaluate the performance of the programs and adaptively manage them as new information dictates.
i. ODFW’s analysis found that critical monitoring data for programmatic review and reform was inadequate for analysis of strays, natural production, and sport/commercial fisheries. For example, south coast fall Chinook programs would benefit from marking of hatchery releases to identify hatchery fish on the spawning grounds and to assess ocean harvest contributions. Current assessment of harvest relies on punch card data which is not robust enough to evaluate all harvest (ocean and mixed stock) contributions. Foundational to any reform plan is a robust program for evaluating efficiency and effectiveness of propagation programs.
2. To fully realize hatchery reform, ODFW needs to complete a Coastal Multi-Species Conservation Plan to serve as the conservation and fisheries framework for reform;
a. Aside from Rogue fall Chinook and Oregon Coast coho, which have Commission-approved fish conservation plans, most coastal hatchery programs are largely based on outdated and hatchery-specific fish management goals. ODFW needs coast-wide management plans for fall Chinook, winter/summer steelhead and chum salmon to provide the conservation framework to revise fish management goals to reflect the management and conservation needs of species management units as directed by the Native Fish Conservation Policy. As the result of these findings, in the fall of 2010 ODFW began development of a multi-species Coastal Conservation Plan, with the goal of completing this plan by December 2012. When this plan is complete, ODFW will have completed conservation plans for all the significant coastal salmonids. The focus will be establishing the conservation framework that drives fish management for these species going forward, with an emphasis on addressing the conservation, fisheries and subsequent hatchery opportunities associated with a comprehensive coastal management plan. Critical scientific uncertainties such as strays and genetic introgression issues will be addressed by the Oregon Hatchery Research Center.

v December 14, 2010 HB 3489 Report
3. The Time is Not Right for New Programs. a. Without the multi-species Coastal Conservation Plan outlined above,
ODFW has no reliable method to evaluate potential new hatchery/fishery opportunities and the conservation needs/risks associated with them. With a comprehensive plan, ODFW will have worked with the public to do the risk analysis and identify the trade-offs that might come with expanding existing programs in some places while reducing them in others.
b. In addition, without adequate resources to operate, maintain, and monitor existing programs, adding new programs will ultimately be a further drain on the existing system.
(2) The plan shall include provisions for the evaluation of current coastal hatchery programs with respect to:
a) Broodstock and production management strategies; ODFW raises winter and summer steelhead, fall and spring Chinook, coho salmon and rainbow trout at the eight coastal hatcheries. The following sections summarize our current broodstock and production management strategies by species/race at the coastal hatcheries.
Winter Steelhead Winter Steelhead are produced in seven of the eight coastal hatcheries plus the Cole Rivers Hatchery (federal mitigation hatchery). Smolts are released in fourteen coastal watersheds from thirteen individual populations. The annual production goal is 1.1 million smolts and since 2006, ODFW has released an average of 1.0 million smolts annually (Table 1). Annual harvest is estimated at 17,600 adults or 96.7% of the identified goal. The program provides an economic benefit on average of $3.98 for every dollar invested in production.
Summer Steelhead
Summer Steelhead are produced in three of the eight coastal hatcheries. Smolts are released in three coastal watersheds from three individual populations. The production goal is 290,000 smolts and since 2006, ODFW has released an average of 341,650 smolts annually (Table 2). Annual harvest is estimated at 4,408 adults or 62.4% of the goal. The program provides and economic benefit of $3.28 for every dollar invested in production.
Coho Salmon Coho are produced in four of the eight coastal hatcheries although coho produced at Salmon River are transferred and released in the Columbia River at Youngs Bay. Smolts are released in three coastal watersheds from three individual populations. The production goal is 260,000 smolts and since 2006, ODFW has released an average of 419,721 smolts annually (Table 3). Annual harvest is estimated at 4,836 adults or 127.9% of the goal. The program provides economic benefit of $2.93 for every dollar invested in production.

vi December 14, 2010 HB 3489 Report
Spring Chinook Salmon Spring Chinook are produced in three of the eight coastal hatcheries plus the Cole Rivers Hatchery (federal mitigation hatchery). Smolts are released in three coastal watersheds from three individual populations. The production goal is 705,000 smolts and since 2006, ODFW has released an average of 679,679 smolts annually (Table 4). Annual harvest is estimated at 5,777 adults or 44.8% of the goal. The program provides economic benefit of $1.53 for every dollar invested in production.
Fall Chinook Salmon Fall Chinook are produced in five of the eight coastal hatcheries. The Coos River and Coquille STEP programs were included in the analysis due to their significant contributions to production and harvest goals. Smolts are released in seven coastal watersheds from seven different populations. The production goal is 1.99 million smolts annually and since 2006, ODFW has released an average of 1.64 million smolts annually (Table 5). Annual harvest is estimated at 12,366 adults or 106.2% of the identified goal. The program provides economic benefit of $1.58 for every dollar invested in production.
Rainbow Trout Rainbow Trout are produced in six of the eight coastal hatcheries. Legal- and trophy-sized trout are released in 94 water bodies across the coastal watersheds. The majority of trout are production from ODFW domestic brood stock (Cape Cod) and few from a wild source in the Umpqua watershed. The annual production goal is 413,850 fish (Table 6) with an annual harvest goal of 165,720 fish.
(b) Hatchery infrastructure enhancement plans in support of management strategies; Hatchery infrastructure is currently supporting management strategies; however, repairs and enhancements would improve operations and increase the flexibility of the overall program as well as individual hatcheries. The level of enhancements ODFW ultimately recommends will depend on the outcome of the multi-species Coastal Conservation Plan.
Key elements in support of the current program might include: 1. Facilities:
a. Alsea Hatchery – a satellite facility in the Yaquina basin to provide for adult trapping and acclimation (Big Elk Creek).
b. Bandon Hatchery - multiple traps, weirs and acclimation sites in Coquille basin to more effectively manage broodstock collection and hatchery/wild interactions.
c. Cedar Creek Hatchery – improved weir, adult trapping, and passage at the Three Rivers site.
d. Trask Hatchery - Gold Creek hatchery weir 2. Fish Passage (design):
a. Alsea Hatchery b. Bandon/Coquille programs c. China Creek trap d. East Fork Trask diversion
3. Hatchery Screening (meeting screening criteria):

vii December 14, 2010 HB 3489 Report
a. Alsea Hatchery b. Cedar Creek Hatchery c. North Nehalem Hatchery d. Salmon River Hatchery e. Trask Hatchery
4. Hatchery Operations needs: a. Bandon Hatchery – Fish liberation truck b. North Nehalem Hatchery – backup generator replacement and jib crane
on lower fish trap c. Rock Creek Hatchery
i. Polymer coat two raceways and adult holding ponds ii. UV water treatment system
iii. Replace wood pens with aluminum iv. Shade cover for adult broodstock holding pen v. Predator covers
vi. Five new raceways vii. Intake design on North Umpqua
5. Salmon River—Replace adult holding pens
Most of these items will require an engineering design to estimate costs.
(c) Hatchery effluent management and National Pollutant Discharge Elimination System compliance recommendations;
Coastal Hatcheries has been in compliance with all NPDES requirements for the past 3 years. In order to ensure continued compliance with NPDES permits, the following preventive measures (estimated cost $147,100) should be implemented:
1. Alsea Hatchery - Repair cracks in settling pond asphalt (~$100,000) 2. Bandon Hatchery - Purchase portable pump and underground vacuum lines to move
waste and chemically-treated wastewaters from rearing ponds to abatement ponds (~$8,000)
3. Salmon River Hatchery - Excavation of the earthen abatement pond and proper disposal (~$1,600)
4. Trask Hatchery - Repair or replacement of the pollution abatement pond and rebuilding or installation of a liner in the pollution abatement pond at Trask Pond (~$37,500).
(d) Recommended strategies for the management of fish disease;
ODFW Fish Health Services recommends filtered and Ultraviolet-treated (UV) water supplies for egg incubation and early rearing at all coastal hatcheries. System size varies from 200 gallons per minute (gpm) to 700 gpm, depending on the hatchery. Secondary recommendations include a 3,000 gpm water treatment system for Elk River Hatchery, a 4,500 gpm system for Trask Hatchery, and a 1,400 gpm system for the Tuffy Creek facility. The department estimates it will cost $1.5 million to retrofit the eight coastal hatcheries with UV treatment systems; a value engineering review is required to determine final costs.

viii December 14, 2010 HB 3489 Report
Fish Health Services also supports experimenting with moist air incubation technology to further reduce the risk of pathogens along with reducing overall water use.
(e) Prioritization of deferred maintenance; ODFW has reduced the coastal hatcheries deferred maintenance list to approximately $1.1 million.
ODFW’s prioritized list of maintenance includes: 1. Safety - Hand rails if required by OSHA, $150,000. 2. Fish Culture - Water Valves replacement, $121,350
a. Alsea Hatchery - $20,000 b. Cedar Creek Hatchery - $36,350 c. North Nehalem Hatchery - $6,000 d. Rock Creek Hatchery - $36,000 e. Trask Hatchery - $23,000
3. Effluent Management - $180,000 a. Alsea Hatchery - seal coat cracked settling pond, $100,000 b. Bandon Hatchery – Pump and vacuum system, $8,000 c. Trask Hatchery - replace pond membrane and associated tasks, $72,000
4. Fish Culture - Raceway repairs - $620,000 a. Alsea Hatchery - $102,000 b. Bandon Hatchery - $20,000 c. North Nehalem Hatchery - $271,000 d. Rock Creek Hatchery (design) - $20,000 e. Salmon River Hatchery - $115,000 f. Trask Hatchery - $92,000
5. Screens – $100,000 6. Stream stabilization (Elk Creek intake) – $10,000
Table 1. Winter Steelhead Hatchery program summary Hatchery
Stock Purpose Harvest Goal
Harvest (est.)
Release Number
3-year average
Benefit/ Cost
Release location

ix December 14, 2010 HB 3489 Report
Goal ratio($) Alsea Siletz Harves
t 1,500 1,908 50,000 52,203 6.39 Palmer
Creek Alsea *Alsea
Hatchery/Wild
Harvest
2,400 2,325 120,000 150,547 4.87 Hatchery, Alsea River
Alsea *Alsea Wild Harvest
Na 201 20,000 20,533 1.71 Yaquina (Big Elk Cr.)
Bandon **Coos River Harvest
2,000 1,533 125,000 132,260 2.03 Millicoma (E/W Forks)& S. Fork Coos River
Bandon Coquille River & So. Fk. Coquille
Harvest
3,000 2,360 118,000 114,891 7.18 Coquille Tributaries (Ferry Cr.) S. Fork Coquille R
Bandon Ten Mile Lakes
Harvest
2,000 209 21,000 20,468 1.79 Eel, Saunders, and Tenmile creeks
Cedar Creek
Nestucca Hatchery/wild
Harvest
1,900 1,509 195,000 210,633 2.46 Nestucca Three Rivers Wilson*** Kilchis***
Elk River
Chetco Harvest
800 762 50,000 47,908 3.04 Chetco River
North Nehalem
N. FK. Nehalem
Harvest
1,300 1,498 130,000 135,296 2.01 N.F. Nehalem& Necanicum
Rock Creek
S. Umpqua Harvest
2,340 3,233 77,000 77,582 7.29 S. FK. Umpqua & Deer Creek
Trask Wilson River Harvest
1,000 2,109 100,000 144,991 4.99 Wilson
Summary 18,240 17,647
1,006,000
1,107,312
3.98
*Alsea hatchery stock is used as back-up source for the wild Alsea program. **Shipped to Cole Rivers Hatchery for incubation and rearing ***Released from Tuffy Creek facility
Table 2. Summer Steelhead Hatchery program summary

x December 14, 2010 HB 3489 Report
Hatchery
Stock Purpose Harvest Goal
Harvest (est.)
Release Number Goal
3-year average
Benefit/ Cost ratio($)
Release location
*Cedar Cr. & Salmon River
Siletz Harvest
2,400 1,419 80,000 67,343 3.69 Siletz River
Cedar Creek
Nestucca
Harvest
1,000 1,126 100,000
150,547 1.97 Nestucca, Three Rivers, S.Fk. Wilson River
Rock Creek
N. Umpqua
Harvest
5,000 1,503 110,000
123,762 4.19 N.F.Umpqua Galesville Reservoir
8,400 4,048 290,000
341,652 3.28
*adults are collected and spawned by Cedar Creek hatchery, eggs shipped to Salmon River for incubation and rearing

xi December 14, 2010 HB 3489 Report
Table 3. Coho coastal hatchery program summary Hatchery
Stock Purpose Harvest Goal
Harvest (est.)
Release Number Goal
3-year average
Benefit/ Cost ratio($)
Release location
*North Nehalem
N.Fk. Nehalem
Harvest
1,000 627 100,000 160,705 0.72 N.Fk. Nehalem
Rock Creek
S. Umpqua River
Harvest
2,400 3,320 60,000 105,695 6.83 Galesville, Umpqua, CowCreek
Rock Creek
**N. Umpqua River
Harvest
na na na na na N.F.Umpqua Galesville Reservoir
Salmon River
Big Creek
Harvest
na na na na na CFF Youngs Bay, Columbia R
Trask Trask River
Harvest
1,000 889 100,000
153,321 1.23 Trask River
4,400 4,836 260,000
419,721 2.93
*N. Fork and Fish Hawk groups are released at the same location and were averaged **Program is discontinued in 2012; release numbers reduced to 60,000 in s. Umpqua

xii December 14, 2010 HB 3489 Report
Table 4. Spring Chinook coastal hatchery program summary Hatchery
Stock Purpose Harvest Goal
Harvest (est.)
Release Number Goal
3-year average
Benefit/ Cost ratio($)
Release location
Cedar Creek
Nestucca
Harvest
825 921 110,000
116,402 1.59 Nestucca River, Three Rivers
Rock Creek
N. Umpqua River
Harvest
10,260 3,498 342,000
316,232 1.90 N.F.Umpqua Galesville Reservoir
Trask Trask River
Harvest
1,800 1,358 253,000
247,045 1.10 Wilson R., Trask River
12,885 5,777 705,000
679,679 1.53

xiii December 14, 2010 HB 3489 Report
Table 5. Fall Chinook coastal hatchery program summary Hatchery Stock Purpose Harves
t Goal
Harvest (est.)
Release Number Goal
3-year average
Benefit/ Cost ratio($)
Release location
Bandon Coos River
Harvest 205,000 Blossom Gulch, South Slough
Bandon Coos River
Harvest; STEP
4,000 4,026
800,000
760,767 0.75
Noble Creek, Millicoma River, Fourth Cr. Reservoir
Bandon Coquille
Harvest ;STEP
2,500 724 174,600 76,972 1.52 Cunningham Cr., Ferry Cr., Sevenmile Cr., Hall Cr
Elk River Elk River
Harvest 2,500 3,705 325,000 325,508 1.47 Elk River
Elk River Chetco Harvest 600 665 150,000 172,927 0.56 Chetco River, Ferry Creek
*North Nehalem/Trask
Trask Harvest 1,035 1,307 139,000 105,386 1.81 Necanicum R., Trask River
Salmon River Salmon River
Harvest 1,000 1,939 200,000 202,592 1.71 Salmon River
11,635 12,366
1,993,600
1,644,152
1.30
*adults are collected and spawned at Trask hatchery and 25,000 fish are produced at North Nehalem.

xiv December 14, 2010 HB 3489 Report
Table 6. Rainbow Trout coastal hatchery program summary Hatchery Stock Purpose Harvest
Goal
Harvest (est.)
Release Number Goal
3-year average
Benefit/ Cost ratio ($)
Release location
Alsea Cape Cod Triploid
Harvest 81,360 Na 203,400 unknown Mid-Coast (21), Coast Range (9), Cascade (7)
Bandon Cape Cod Triploid
Harvest 1,120 Na 2,800 unknown Coos-Coquille (6); trophy-sized
Elk River
Cape Cod Triploid
Harvest 3,000 Na 7,000 unknown South Coast (7)
North Nehalem
Cape Cod Triploid
Harvest 33,560 Na 83,950 unknown North Coast (18)
Rock Creek
Cape Cod Triploid
Harvest 23,040 Na 57,600 unknown Umpqua (13)
Rock Creek
Fish Creek
Harvest Suppl.
5,040 Na 12,600 unknown Umpqua (4)
Salmon River
Cape Cod Triploid
Harvest 18,600 Na 46,500 unknown North Coast (4), Mid Coast (5)
165,720 413,850

xv December 14, 2010 HB 3489 Report
TABLE OF CONTENTS Page No.
1. Introduction ................................................................................................................1
1.1 Background and Purpose ...................................................................................1
1.2 Evaluation Approach ..........................................................................................2
2. Review of ODFW Coastal Propagation Programs and Facilities ............................3
2.1 Summary for ODFW Coastal Hatchery Programs........................................3
2.1.1 ODFW Fall Chinook Programs .................................................................6
2.1.2 ODFW Spring Chinook Programs...........................................................20
2.1.3 ODFW Coho Programs ............................................................................27
2.1.4 ODFW Winter Steelhead Programs........................................................32
2.1.5 ODFW Summer Steelhead Programs .....................................................46
2.1.6 ODFW Trout Programs ...........................................................................49
2.2 A Review of the Economic Aspects of Oregon Department of Fish and Wildlife Coastal Hatcheries ....................................................................................51
2.2.1 Introduction..............................................................................................51
2.2.2 Literature Review ....................................................................................51
2.2.3 Economic Value Concepts Used in this Report ......................................52
2.2.4 Cost Benefit Analysis Approach..............................................................54
2.2.5 Steelhead Benefit-Cost Model .................................................................56
2.2.6 Spring Chinook Benefit Cost Model........................................................59
2.2.7 Fall Chinook Benefit-Cost Model............................................................60
2.2.8 Coho Evaluation Model ...........................................................................62
2.2.9 Trout Evaluation Model ..........................................................................63
2.2.10 Hatchery Cost-Benefit Models ..............................................................64
2.2.11 References ..............................................................................................73

xvi December 14, 2010 HB 3489 Report
2.3 Coastal Hatcheries General Evaluation..........................................................75
2.3.1 Alsea Hatchery Evaluation .....................................................................75
2.3.2 Bandon Hatchery Evaluation..................................................................76
2.3.3 Butte Falls Hatchery Evaluation............................................................78
2.3.4 Cedar Creek Hatchery Evaluation..........................................................80
2.3.5 Elk River Hatchery Evaluation...............................................................82
2.3.6 North Nehalem River Hatchery Evaluation...........................................84
2.3.7 Rock Creek Hatchery Evaluation............................................................85
2.3.8 Salmon River Hatchery Evaluation........................................................86
2.3.9 Trask River Hatchery Evaluation...........................................................88
2.4. Deferred Maintenance Status .........................................................................89
2.4.1 Alsea Hatchery.........................................................................................89
2.4.2 Bandon Hatchery .....................................................................................93
2.4.3 Butte Falls Hatchery ...............................................................................97
2.4.4 Cedar Creek Hatchery...........................................................................101
2.4.5 Elk River Hatchery ................................................................................103
2.4.6 North Nehalem River Hatchery............................................................108
2.4.7 Rock Creek Hatchery.............................................................................109
2.4.8 Salmon River Hatchery .........................................................................113
2.4.9 Trask River Hatchery ...........................................................................116
2.5 Recommendations...........................................................................................117
2.5.1 Alsea Hatchery Recommendations .......................................................117
2.5.2. Bandon Hatchery and Associated District Hatchery Programs Recommendations............................................................................................119
2.5.3 Butte Falls Hatchery Recommendations..............................................123
2.5.4 Cedar Creek Hatchery Recommendations............................................127

xvii December 14, 2010 HB 3489 Report
2.5.5 Elk River Hatchery Recommendations.................................................127
2.5.6 North Nehalem River Hatchery Recommendations ............................130
2.5.7 Rock Creek Hatchery Recommendations .............................................132
2.5.8 Salmon River Hatchery Recommendations..........................................134
2.5.9 Trask River Hatchery Recommendations.............................................134
2.5.10 Hatchery Program Assessment...........................................................136
2.5.11 Hatchery Research and Monitoring Program ....................................141
2.5.12 Monitoring and Evaluation Recommendations..................................141
3. Performance Criteria..............................................................................................156
3.1 Water Quality and Disease Prevention .........................................................156
3.1.1 General Review and Evaluation of Hatchery Effluent Quality..........156
3.1.2 Fish Health ..........................................................................................171
References ...............................................................................................................178
Appendices ...............................................................................................................182
Appendix A. General Description of Coastal Hatcheries ........................................182
A.1 Alsea Hatchery .........................................................................................182
A.2 Bandon Hatchery .....................................................................................184
A.3 Butte Falls Hatchery................................................................................187
A.4 Cedar Creek Hatchery .............................................................................190
A.5 Elk River Hatchery ..................................................................................192
A.6 North Nehalem River Hatchery ..............................................................194
A.7 Rock Creek Hatchery ...............................................................................196
A.8 Salmon River Hatchery............................................................................198
A.9 Trask River Hatchery ..............................................................................200
Appendix B. Fish Hatchery Management Policy ......................................................202

xviii December 14, 2010 HB 3489 Report
Appendix C. Fish Health Management Policy ...................................................218
Appendix D: Release and Recovery Data .............................................................227
Appendix E. Master Maintenance Plan...............................................................230
Appendix F. Proposed Modifications ...................................................................248
Appendix G. HB 3489 Working Group Contact List...........................................252
List of Tables ...............................................................................................................253
List of Figures..............................................................................................................259

1 December 14, 2010 HB 3489 Report
Oregon Department of Fish and Wildlife Coastal Hatcheries Evaluation (HB 3489)
1. Introduction 1.1 Background and Purpose
During the 2009 legislative session HB 3489 was proposed and passed directing the Oregon Department of Fish and Wildlife (ODFW) to develop a plan to reform the operation of department operated fish hatcheries on the Oregon coast. The environment that these hatcheries operate in dictates that they are managed not as simply production facilities for sport and commercial harvest augmentation but as an integral part of the ODFW fishery management program. The use of the hatchery as a tool has been defined in the Native Fish Conservation policy (NFCP). In 2003 The NFCP, the Fish Hatchery Management Policy (HMP) and the Fish Health management Policy (FHP) were adopted into rule by the Oregon Fish and Wildlife Commission. The NFCP provides a basis for managing hatcheries, fisheries, habitat, predators, competitors and pathogens in balance with sustainable production of naturally produced native fish. The use of the hatchery as a tool within specific watersheds is established by the NFCP while the HMP provides the foundation for management and reform.
Each hatchery must be regularly evaluated as to how well it meets established goals in a conservation plan now and into the future. Foundational to any reform program is a robust program for evaluating this efficiency and effectiveness of propagation operations in meeting current needs, consistent with conservation plans, basin plan, policies, Hatchery Genetic Management Plans (HGMP) and the 25 year plan. These plans and policies often require additional facilities or modification to existing facilities to efficiently accomplish the objectives.
While there have been and presently are numerous programs monitoring and evaluating federally funded hatchery programs in the Willamette basin, Columbia River and Northeast Oregon, the coastal hatchery programs that are funded by license dollars, general funds or a mix of both have been left behind. During the 1980’s and early 1990’s there was intense monitoring of coastal programs including both marking and creel census effort but that has decreased substantially. For example, funding cuts have eliminated over 90% of the coded wire tag (CWT) monitoring of stocks. In addition, Fish Propagation headquarters staff that had monitored and managed facilities, maintenance and nutrition programs have been eliminated. The loss of these in place programs and staff have led to ad hoc department teams or contracted consultants to evaluate coastal hatchery programs. The result has been a patchwork of information that has not provided valuable decision making tools.

2 December 14, 2010 HB 3489 Report
The purpose of this ODFW hatchery reform project is to develop a comprehensive plan for evaluating the coastal hatchery program and determine reform necessary to meet the existing ODFW NFCP, HMP, FHP, conservation plans, basin plans, HGMPs, Oregon Plan for Salmon and Watersheds and the 25 year Recreational Angling Enhancement Plan. As part of this task to develop a plan for reform, a working group of management and propagation staff was selected to reviewed and evaluate all of the state funded coastal hatcheries (Appendix G.).
The Development of a plan for reform is necessary for long range planning of facility design or modification, establishing scientifically defensible production goals, setting staffing levels and developing justifiable funding requests. One of the steps in this project is to establish what that reform plan will look like and the information needed to set that course to reform.
1.2 Evaluation Approach
In setting out to develop a plan for reform of coastal hatcheries, a team of ODFW staff including district biologists, hatchery coordinator, fish health specialists, economists, and headquarters staff biologists was brought together. The initial tasking was to review existing hatchery operations plans, basin plans, HGMPs and past hatchery evaluations to ensure that these source documents were consistent as they presented existing hatchery programs. Where there were inconsistencies these were corrected immediately
The subsequent tasks were to evaluate the efficiency and effectiveness of the coastal hatcheries in meeting their established goals, were operations compliant with the NFCP, HMP, FHP and existing plans, address the specific tasks in HB 3489 and evaluate the department’s ability to develop those requested strategies based on the information available. Salmon-Trout Enhancement Programs (STEP) were evaluated as they related to coastal hatcheries and meeting fishery management goals. Maintenance and facility improvement issues were evaluated by hatchery field staff based on the Master Maintenance Plan with recommendations provided. There was a review of the economic aspects of ODFW coastal hatcheries completed providing a picture of the value of these programs to Oregon and cost benefit ratio for each hatchery and stock.
The recommendations for operational and facility modification were developed for each hatchery and are found in specific hatchery recommendations and summary sections specific to fish health management, water quality and disease prevention, monitoring and evaluation, hatchery program assessment.
The Coastal Hatchery Evaluation document provides: • an assessment of each hatchery program by fish stock • an economic evaluation of the coastal hatcheries • an evaluation for each facility • recommendations for each facility • evaluation and recommendations for monitoring and evaluation programs

3 December 14, 2010 HB 3489 Report
• reports of onsite water quality and National Pollutant Discharge Elimination System (NPDES) compliance
• fish health evaluation and recommendation and reference documents were compiled as appendices to the review document
• deferred maintenance status and recommended improvements
As the review process developed, there were several major obstacles to quantifying a path to reform. With the exception of two indicator stocks at Elk River and Salmon River hatcheries, there has been no consistent program to evaluate contribution to the fishery in the other 29 salmon and steelhead programs at state funded coastal hatcheries. The ODFW conservation plans forming the basis for Hatchery Program Management Plans (HPMP) have not been completed. Developing reform recommendations proved a challenge to biologists in the absence of these conservation plans. The Master Maintenance Plan (MMP) which developed the list of deferred maintenance needed was primarily focused on facility condition without consideration for program reform and fish culture.
2. Review of ODFW Coastal Propagation Programs and Facilities 2.1 Summary for ODFW Coastal Hatchery Programs
ODFW has 31 Chinook, coho, and steelhead programs at State funded coastal hatcheries. In many instances the rearing of each life-stage (eggs, fry, fingerling, smolt) of any given stock is divided among multiple facilities due to logistical constraints (rearing space, equipment etc), or to facilitate acclimation to a given waterbody. The rearing history of each program is outlined in the discussion following this summary. The primary objective of ODFW’s coastal salmon and steelhead programs is to augment harvest in Oregon’s ocean and freshwater fisheries. Thus, programs that are associated with high levels of spawning ground escapement are undesirable. A number of factors affect the numbers of fish available to harvest from a given program. Many of these are beyond the control of the facility. For example, freshwater and ocean conditions play a major role in determining the strength of a given year class. Similarly, harvest regulations that are based on wild fish escapement forecasts can significantly curtail the harvest of hatchery fish, resulting in higher escapement and returns to the hatchery.
We evaluated each program for 1) contribution to ocean and freshwater fisheries, 2) escapement to spawning grounds, and 3) return to the hatchery. We used data from brood years 1995-2004 (coho), 1994-2003 (Chinook), and 1986-2005 (Steelhead). These represent the ten most recent brood years for which we have complete cohort data.
We did not attempt to evaluate the performance of fry releases. It is thought that the survival of these programs is generally low (McGie 1980; Nickelson et al. 1986; Solazzi et al. 1999; Theriault et al. 2010). For Chinook and coho smolt releases, we used coded-wire tag (CWT) data to estimate the number of fish from each brood year that were caught in ocean fisheries between Alaska to California (Sport and

4 December 14, 2010 HB 3489 Report
Commercial). Steelhead are not typically recovered in ocean fisheries. Ocean commercial and sport fisheries are typically well sampled so the expansions are relatively robust. However, the more restrictive fishing seasons in recent years have resulted in a decrease in the recovery of CWTs. Thus, the estimates of exploitation in fisheries that recover small numbers of CWTs are subject to a high degree of uncertainty.
For most freshwater Chinook, coho, and steelhead fisheries, ODFW does not consistently estimate the contribution of hatchery fish to harvest (but see note for Salmon River and Elk River below). Therefore, the estimates in this document are typically derived from punch card (voluntary reporting of angler harvest) data. The proportion of hatchery fish in the punch card catch estimates was based on the professional judgment of ODFW staff, scale data, or selective harvest of hatchery fish. Where two or more stocks of the same species were released in the same basin, angler harvest card data cannot be directly attributed to a particular stock, such as North Nehalem and Fishhawk stock winter steelhead released in the North Fork Nehalem. In these cases performance measures are calculated based on the release and return data combined for both stocks. Programs were associated with the hatchery from which the fish were reared and/or released. This method is associated with a high degree of uncertainty and appears to consistently overestimate harvest of fall Chinook. The factors causing this uncertainty are outlined in Section 2.6.11.
We estimated the numbers of fish returning to the hatchery using CWTs for Chinook and coho programs. For steelhead, we assigned the collection of fish at each hatchery to the respective brood year using scale data from the mid 1980’s and early 1990’s. In the Umpqua Basin, Winchester Dam counts (adjusted for harvest above the dam) were used in place of hatchery returns, because this is the broodstock collection site for Rock Creek hatchery and because only a small portion of the returning hatchery adults enter the trap at Rock Creek Hatchery. For programs that are released at acclimation sites we did not attempt to quantify hatchery returns because of a lack of adult collection.
We did not attempt to estimate the number of hatchery fish spawning on natural spawning grounds because the data currently collected is not sufficient to provide this level of resolution (but see note for Salmon River and Elk River below). Where data was available on the incidence of straying within a basin, it was included in a separate analysis.
The Salmon River and Elk River fall Chinook freshwater harvest and spawning ground escapement are sampled annually by ODFW as part of the monitoring program for the Pacific Salmon Treaty. Thus, we used these estimates (based on CWT recoveries) to assign freshwater harvest and straying for each brood year. These estimates are relatively robust.

5 December 14, 2010 HB 3489 Report
Figure 1. Approximate distribution of ODFW fall Chinook releases (Data from 2008 Production Planning Schedule)
Figure 2. Approximate distribution of ODFW spring Chinook salmon releases (Data from 2008 Production Planning schedule)

6 December 14, 2010 HB 3489 Report
Figure 3. Approximate distribution of ODFW Coho salmon releases (data from 2008 Production Planning Schedule)
2.1.1 ODFW Fall Chinook Programs 2.1.1.1 Trask Fall Chinook (Stock 34)
Trask stock adult fall Chinook are typically collected at the Trask Hatchery trap located on Gold Creek. During some low water years the Trask Hatchery trap, located on the Trask River, has been used to trap adult fall Chinook. Spawning, incubation, and rearing activities occur at Trask River Hatchery. Approximately 80,000 eyed-eggs are transferred to STEP hatchbox facilities or are used in classroom incubators. Approximately 100,000 eyed eggs are transferred to the Whiskey Creek STEP facility on Netarts Bay for eventual release into the Wilson and Trask rivers as unfed fry. Approximately 100,000 eyed eggs are transferred to the Miami Anglers STEP hatchbox program located on Minich Creek (Miami River tributary) for eventual release as unfed fry into the Miami and Kilchis rivers. Approximately 26,000 fingerlings are transferred from Trask Hatchery to North Fork Nehalem Hatchery for final rearing to smolt size. Approximately 25,000 smolts are eventually released into the Necanicum River. Rearing to smolt size for the remaining 113,000 fish occurs at Trask Hatchery for eventual direct volitional release into the Trask River. The smolt releases in the Necanicum and Trask Rivers were marked with a representative CWT group to provide information on their performance (see below). There is no information on the performance of the fry releases. The goal of this program is to provide hatchery fish for sport and commercial harvest in ocean and freshwater (FW) fisheries. In addition, this program provides educational opportunities to students and encourages volunteer involvement from the public via the Salmon and Trout Enhancement Plan (STEP). A portion of those activities includes the incubation of fall Chinook eggs and release of unmarked unfed fry. The primary purpose of the classroom incubator program is to teach students about salmonid life history and their habitat requirements.

7 December 14, 2010 HB 3489 Report
Necanicum Release: The majority of Trask stock smolts that are released into the Necanicum River are captured as adults in Alaska and British Columbia commercial fisheries (Tables 1 and 2). During the previous seven brood years for which we have complete cohort data, an average of 35 adults (range 15-49) were caught in Oregon marine and FW fisheries. The FW fisheries in this system are not sampled so harvest is calculated using punch card data and therefore is subject to considerable error. There is no hatchery or adult trapping facility on the Necanicum River so unharvested returning adults are likely to stray onto spawning grounds. However, there is no information regarding the number of hatchery fish that stray. Trask River release: The majority (~68%) of Trask stock fall Chinook smolts that are released into the Trask River are captured as adults in Oregon FW sport fisheries, specifically Tillamook Bay and rivers (Tables 3 and 4). The Alaska commercial fisheries account for approximately 19% of the harvest. During the previous ten brood years for which we have complete cohort data, an average of 682 adults (range 358-974) were caught in Oregon marine and FW fisheries. The FW fisheries in this basin are generally not sampled so harvest is calculated using punch card data and therefore is subject to considerable error. There is no comprehensive information regarding the number of hatchery fish that stray onto spawning grounds because there are no standard Chinook spawning surveys in the Trask River basin.

8 December 14, 2010 HB 3489 Report
Table 1. Estimated number of Necanicum Basin adult hatchery fall Chinook caught in ocean and freshwater (FW) fisheries, returning to the hatchery, or straying to spawning grounds. Estimates are based on coded-wire tag (CWT) recoveries.
Table 2. Estimate of harvest of Necanicum Basin adult hatchery fall Chinook among the four northwest states (Alaska, Washington, Oregon and California) and Canada (BC). Values represent the % of the total harvest caught in the respective regions.
State Brood Year AK BC WA OR CA
1994
1995
1996
1997 54 25 1 21 0
1998 59 17 1 23 0
1999 32 45 4 19 0
2000 57 19 4 20 0
2001 59 26 5 10 0
2002 59 23 3 14 0
2003 34 26 5 27 7
Average 51 26 3 19 1
Ocean Recoveries FW Recoveries total Oregon
Broodyear Number released AK BC WA OR CA sport commercial
Columbia gillnet
FW sport Hatchery Spawning Ground harvest catch
1994
1995
1996
1997 27900 92 42 1 5 0 16 124 0 31 UNK UNK 171 36
1998 26995 101 29 2 2 0 6 128 0 38 UNK UNK 172 40
1999 25989 81 114 9 0 0 45 160 4 45 UNK UNK 253 49
2000 25110 109 37 7 4 0 8 149 0 35 UNK UNK 192 39
2001 26240 208 92 19 6 0 28 297 0 30 UNK UNK 355 36
2002 25988 123 47 7 4 0 22 159 0 26 UNK UNK 207 30
2003 28104 19 15 3 0 4 0 40 0 15 UNK UNK 55 15
Average 26618 105 54 7 3 1 18 151 1 31 UNK UNK 201 35

9 December 14, 2010 HB 3489 Report
Table 3. Estimated number of Trask Basin adult hatchery fall Chinook caught in ocean and freshwater (FW) fisheries, returning to the hatchery, or straying to spawning grounds. Estimates are based on CWT recoveries.
Table 4. Distribution of harvest of Trask Basin adult hatchery fall Chinook among the four northwest states (Alaska, Washington, Oregon and California) and Canada (BC). Values represent the % of the total harvest caught in the respective regions.
State Brood Year AK BC WA OR CA
1994 20 7 0 73 0
1995 15 16 0 69 0
1996 19 1 0 80 0
1997 25 11 1 64 0
1998 17 8 0 74 1
1999 17 20 1 61 0
2000 31 17 3 49 0
2001 12 12 0 76 0
2002 34 26 0 40 0
2003 4 1 0 96 0
Average 19 12 0 68 0
Ocean Recoveries FW Recoveries total Oregon
Broodyear Number released AK BC WA OR CA sport commercial
Columbia gillnet
FW sport Hatchery
Spawning Ground harvest catch
1994 58217 141 50 0 28 0 40 179 0 500 293 UNK 719 528
1995 82655 79 86 0 7 0 30 142 0 353 639 UNK 525 359
1996 66986 86 6 0 4 0 4 91 0 354 171 UNK 449 358
1997 53296 233 101 5 52 0 143 249 0 547 476 UNK 939 599
1998 66190 173 80 0 12 7 12 260 0 724 389 UNK 996 736
1999 63252 226 262 14 54 0 138 419 0 739 968 UNK 1296 793
2000 116738 535 293 54 44 0 144 782 4 804 1868 UNK 1733 852
2001 113203 147 142 0 50 0 74 266 0 841 1794 UNK 1180 892
2002 113899 838 647 0 124 0 429 1180 0 850 3199 UNK 2459 974
2003 53239 27 5 0 7 0 7 32 0 720 81 UNK 760 727
Average 78768 249 167 7 38 1 102 360 0 643 988 UNK 1106 682

10 December 14, 2010 HB 3489 Report
2.1.1.2 Nestucca Fall Chinook (Stock 47) Nestucca stock fall Chinook adults are collected at Cedar Creek Hatchery’s Three Rivers trap located in the Nestucca River watershed. Adults may also be collected by seining below the trap facility, or by volunteer anglers. Adults are held and spawned at Cedar Creek Hatchery in November and early December. The eggs are incubated on site and fry are reared for a period until they are transferred to Rhoades Pond, a volunteer run rearing facility located 5.5 miles east of Hebo, off Highway 22. The fall Chinook are reared to the smolt stage at Rhoades Pond, then released into Three Rivers and the Nestucca River in September. The primary goal of this smolt rearing program is to provide hatchery produced fish for sport and commercial harvest in the ocean and sport harvest in the freshwater environment. Volunteer involvement in the Salmon Trout Enhancement Program (STEP) increases natural resource awareness and provides a volunteer base of individuals, and organizations, desiring to assist ODFW with natural resource program implementation activities.
Nestucca R Release: The release of Fall Chinook into the Nestucca has not been evaluated at present.
2.1.1.3 Salmon River Fall Chinook (Stock 36) All adult fall Chinook brood are collected and spawned at the Salmon River Hatchery. All eggs are incubated and reared at the Salmon River Hatchery up to smolt stage, which (200,000 smolts) are directly released from the hatchery into the Salmon River. The primary goal of the Salmon River fall Chinook program is to provide augmentation of sport and commercial fisheries for fall Chinook both in the ocean and in the Salmon River. These fish are also used as an indicator stock for the North Coast fall Chinook stocks in Oregon to develop ocean harvest management strategies between the US and Canada. Hatchery fall Chinook spawning in natural habitats of Salmon River are problematic. On average, about 60% of the naturally spawning fall Chinook in Salmon River are of hatchery origin. Salmon R Release: The majority of Salmon River stock smolts that are released into the Salmon River are captured as adults by Oregon FW sport and Alaskan commercial fisheries (Tables 5 and 6). During the previous ten brood years for which we have complete cohort data, an average of 1,012 adults (range 104-2,188) were caught in Oregon marine and FW fisheries. The FW fisheries and spawning grounds in this system are sampled as part of the Pacific Salmon Treaty monitoring program. Thus, our estimates of FW harvest and escapement rates are relatively

11 December 14, 2010 HB 3489 Report
Table 5. Estimated number of Salmon River adult hatchery fall Chinook caught in ocean and freshwater (FW) fisheries, returning to the hatchery, or straying to spawning grounds. Estimates are based on CWT recoveries.
Table 6. Distribution of harvest of Salmon River adult hatchery fall Chinook among the four northwest states (Alaska, Washington, Oregon and California) and Canada (BC). Values represent the % of the total harvest caught in the respective regions.
State Brood Year AK BC WA OR CA
1994 27 19 0 54 0
1995 31 12 0 57 0
1996 29 15 1 55 0
1997 29 13 0 57 0
1998 31 11 1 57 0
1999 27 16 0 56 0
2000 28 22 1 49 0
2001 32 26 1 41 0
2002 34 24 1 41 0
2003 27 26 0 47 0
Average 30 18 0 51 0
Ocean Recoveries FW Recoveries total Oregon
Broodyear Number released AK BC WA OR CA sport commercial
Columbia gillnet
FW sport Hatchery
Spawning Ground harvest catch
1994 205215 442 304 0 35 0 74 706 0 829 71 839 1609 864
1995 186780 214 81 0 26 0 47 273 0 362 55 591 683 388
1996 203986 247 127 6 24 0 69 335 0 440 70 956 844 465
1997 205489 790 365 7 128 0 214 1077 0 1432 150 2513 2723 1560
1998 198979 733 251 13 102 0 147 952 0 1232 116 1382 2331 1334
1999 199089 1040 634 18 238 0 331 1599 0 1950 125 2769 3881 2188
2000 207468 1020 787 32 111 6 358 1598 0 1686 169 2179 3641 1797
2001 208878 722 584 21 75 0 297 1104 0 857 106 980 2258 932
2002 199100 409 287 14 59 0 177 592 0 430 108 505 1199 489
2003 210935 59 58 0 3 0 20 101 0 101 50 365 222 104
Average 202592 568 348 11 80 1 174 834 0 932 102 1308 1939 1012

12 December 14, 2010 HB 3489 Report
robust for this stock. The coded wire tag data suggest that a large number of hatchery fish spawn in Salmon River each year. Surveys of both wild and hatchery fish indicate that, on average, about 60 % of the naturally spawning fall Chinook in Salmon River are of hatchery origin. The presence of such large numbers of hatchery fall Chinook spawning in natural habitats of Salmon River is of concern.
2.1.1.4 Smith River Fall Chinook (Stock 151) Smith River stock adult fall Chinook are collected at several sites throughout the lower Umpqua River. These include the STEP/Gardiner Creek facility; the Winchester Creek trap, located at River Mile (RM) 01 of the mainstem Umpqua River; The Mill Creek trap, on a tributary to the mainstem Umpqua at RM 24; the Smith River Falls trap, on a tributary to the Umpqua River at RM 12; and the North Fork Smith River trap. In addition, adults may be collected using tangle netting in Mill Creek, the lower Smith or Umpqua, and Winchester Creek, or, adults may be collected using hook-and-line in the lower Smith or Umpqua. All of the lower Umpqua River fall Chinook broodstock are held at the Gardiner-Reedsport-Winchester Bay (GRWB) facility, located west of highway 101, south of the town of Gardiner in Douglas County, Oregon. The fish are also spawned at this facility and the eggs are then incubated to the eyed egg stage. GRWB STEP has a propagation permit that allows the rearing of 100,000 presmolts. These fish are reared on site, until being transferred to the acclimation site in Salmon Harbor. They are normally released in mid-June. The program also transfers eyed eggs to Rock Creek Hatchery. The fish are then reared to smolt stage and transferred to one of several acclimation sites in the lower Umpqua. These include, the GRWB STEP acclimation site; the Winchester Bay acclimation site, at dock 4 of Salmon Harbor (RM 01 of the Umpqua River); or the Umpqua Estuary acclimation site, near RM 11 at the docks behind the Discovery Center Museum in Reedsport. The goal of this program is to provide fish for the intense and popular sport and commercial fall Chinook fishery in the ocean and Umpqua Estuary. Due to returning behavior of these program fish, this program also provides a significant fishery for bank anglers in Winchester Bay. Another important goal of this program is to educate and increase students/public awareness about salmon biology, life history and their habitat requirements. Umpqua R Release: The Rock Creek Hatchery portion of this program began in 2005; evaluation of the program cannot be completed until sufficient data on adult returns has been collected.
2.1.1.5 Coos River Fall Chinook (Stock 37) Coos River stock hatchery fall Chinook brood are collected at Morgan Creek, Millicoma Interpretive Center, and Noble Creek hatcheries. In addition, brood may also be collected using tangle-nets at tidewater on the Millicoma River, several locations on the East Fork Millicoma, and near the Millicoma Interpretive Center on the West Fork. Wild Coos adults are collected from two traps located near the head

13 December 14, 2010 HB 3489 Report
of tidewater at RM 10 on the South Fork Coos River (Dellwood) and at RM 3.5 on the West Fork Millicoma River. The fish are held and spawned at Morgan, Noble, and Millicoma hatcheries. All gametes are taken to Bandon Hatchery for fertilization and incubation to the eyed egg stage. Approximately 500,000 eggs are retained at Bandon Hatchery to be reared to presmolts for release into the Coos River Basin at Morgan Creek and Blossom Gulch acclimation sites. The balance of eyed eggs are distributed to the Millicoma Interpretive Center and Noble Creek for presmolt production and to multiple hatchbox sites and classroom aquaria that are sited throughout the basin. Bandon Hatchery rears 447,500 presmolts that are transferred to two sites to be acclimated. Morgan Creek and Blossom Gulch receive 247,500 and 200,000 presmolts respectively. These groups are acclimated on the average about two to three weeks. Volunteer facilities also rear presmolts for direct release or transfer. Morgan Creek has a production goal of 645,000 presmolts that are reared and released on station. Beginning with the 2003 brood year an additional 5,000 presmolts have been reared at Morgan Creek and transferred to the Charleston Pond (OIMB) to be acclimated and released at that site. The program at OIMB is primarily an education and interpretation project, but adult fish are susceptible to harvest in ocean and lower bay fisheries. At the Noble Creek facility, the production goal is to rear and release 600,000 presmolts. The primary purpose of this program is harvest augmentation using fish that are genetically and ecologically similar to wild populations. Another important goal of this program (STEP component) is to educate school students and public to increase awareness of salmonid biology, life history, and their habitat requirements. Coos R Releases: The majority of Coos River stock smolts and pre-smolts that are released into the lower Coos Basin are captured as adults in Oregon FW Sport and Alaskan and British Columbian commercial fisheries (Tables 7 and 8). During the previous ten brood years for which we have complete cohort data, an average of 1,446 adults (range 556-2,585) were caught in Oregon marine and FW fisheries. The FW fisheries in this system are not sampled so harvest is calculated using punch card data and therefore is subject to considerable error. There is no information regarding the number of hatchery fish that stray.
2.1.1.6 Coquille River Fall Chinook (Stock 44) Coquille stock fall Chinook brood are collected at Bandon Hatchery and Cunningham Creek facilities. In addition, adults may also be collected using tangle- nets in the Coquille River near Arago, the North Fork Coquille near LaVerne Park, and the South Fork Coquille near Gaylord. The broodstock are held at Bandon Hatchery for spawning. The majority of eggs are incubated at Bandon Hatchery,

14 December 14, 2010 HB 3489 Report
Table 7. Estimated number of Coos Basin adult hatchery fall Chinook caught in ocean and freshwater (FW) fisheries, returning to the hatchery, or straying to spawning grounds. Estimates are based on CWT recoveries.
Table 8. Distribution of harvest of Coos Basin adult hatchery fall Chinook among the four northwest states (Alaska, Washington, Oregon and California) and Canada (BC). Values represent the % of the total harvest caught in the respective regions.
State Brood Year AK BC WA OR CA
1994 26 15 4 56 0
1995 23 8 0 69 0
1996 20 1 1 78 0
1997 31 6 5 59 0
1998 28 13 4 55 0
1999 35 22 8 35 0
2000 22 22 4 52 0
2001 25 34 6 35 0
2002 28 46 9 17 0
2003 38 34 2 25 2
Average 27 20 4 48 0
Ocean Recoveries FW Recoveries total Oregon
Broodyear Number released AK BC WA OR CA sport commercial
Columbia gillnet
FW sport Hatchery
Spawning Ground harvest catch
1994 498189 255 145 39 0 0 0 440 0 556 395 UNK 995 556
1995 493572 234 81 0 29 0 9 335 0 675 1055 UNK 1018 704
1996 508029 227 14 8 54 0 46 257 0 850 596 UNK 1153 904
1997 528718 568 111 90 42 0 45 767 0 1049 2046 UNK 1860 1091
1998 488571 783 367 111 199 0 206 1253 0 1334 2931 UNK 2794 1533
1999 602468 2057 1331 458 443 0 328 3962 0 1657 7917 UNK 5948 2101
2000 393005 876 896 175 212 0 190 1969 0 1871 2840 UNK 4030 2083
2001 1193377 1888 2552 420 957 0 1122 4696 0 1628 7229 UNK 7446 2585
2002 1603456 3103 5002 941 703 0 2642 7105 0 1175 7330 UNK 10922 1877
2003 1298285 1536 1382 74 133 70 992 2203 0 897 2131 UNK 4092 1030
Average 760767 1153 1188 232 277 7 558 2299 0 1169 3447 UNK 4026 1446

15 December 14, 2010 HB 3489 Report
although 129,000 eyed eggs are incubated at Coquille High School, Blue Creek, Camas Valley Elementary School, and Powers Elementary School for educational purposes.
In January, a total of 170,000 eyed eggs are transferred from Bandon to Cole Rivers Hatchery for incubation and rearing to smolts. An additional 22,500 eyed eggs are transferred from Bandon and reared to presmolts at Coquille High School; and approximately 116,500 eyed eggs, also from Bandon, are reared and released as unfed fry by various educational and STEP programs. Current unfed fry programs and release numbers are:
Coquille High School—13,000 (educational—school hatchery) Archie Flood/Blue Creek—30,000 (STEP hatchbox) Camas Valley Elementary School—500 (educational—classroom
incubator) Powers Elementary School—500 (educational—classroom incubator) Powers High School—60,000 (educational—hatchbox) Myrtle Crest Elementary School—500 (educational—classroom incubator)
A total of ~154,600 smolts are raised at Cole Rivers Hatchery, transferred back to the Coquille River, acclimated, and released at four sites in the Coquille estuary. Approximately 80,000 smolts are acclimated and released into Sevenmile Creek (RM 2.5), 10,000 smolts are acclimated and released into Cunningham Creek (RM 24), and 10,000 smolts are acclimated and released from a holding pen in lower Ferry Creek (RM 1—Bandon Harbor). The smolts released at Seven Mile have a CWT group to provide an estimate of their performance. The remaining fish are not CWT so we have no estimate of their performance. The goal of this program is to provide hatchery fish for sport and commercial harvest that are genetically and ecologically similar to wild populations, while minimizing any potential adverse impacts to the wild population of this species or other species. Through its educational component at Coquille High School, Powers High School, and the elementary schools, this program also serves to increase student awareness of salmonid biology, life history, and their habitat requirements. Incubation and release of unfed fry at locations in the upper portion of the basin also serves to mitigate for the removal of wild fish from the population for the broodstock program. Coquille R Releases: The majority of Coquille River stock smolts that are released into the Coquille Basin (at the Seven Mile acclimation site) are captured as adults in Oregon FW Sport and Alaskan and British Columbian commercial fisheries (Tables 9 and 10). During the previous eight brood years for which we have complete cohort data, an average of 240 adults (range 121-527) were caught in Oregon marine and FW fisheries. The FW fisheries in this system are not sampled, so harvest is calculated using punch card data and therefore is subject to considerable error. There is no information regarding the number of hatchery fish that stray. In addition, the lack of adult collection at the acclimation sites prohibits a viable estimate of hatchery returns.

16 December 14, 2010 HB 3489 Report
Table 9. Estimated number of Coquille Basin adult hatchery fall Chinook caught in ocean and freshwater (FW) fisheries, returning to the hatchery, or straying to spawning grounds. Estimates are based on CWT recoveries.
Table 10. Distribution of harvest of Coquille Basin adult hatchery fall Chinook among the four northwest states (Alaska, Washington, Oregon and California) and Canada (BC). Values represent the % of the total harvest caught in the respective regions.
State Brood Year AK BC WA OR CA
1994 27 19 1 54 0
1995
1996
1997 33 18 2 47 0
1998 28 15 2 54 0
1999 31 32 2 35 0
2000 28 29 2 40 1
2001 29 43 6 22 0
2002 37 23 5 35 0
2003 47 32 7 13 0
Average 33 26 3 38 0
Ocean Recoveries FW Recoveries total Oregon
Broodyear Number released AK BC WA OR CA sport commercial
Columbia gillnet
FW sport Hatchery
Spawning Ground harvest catch
1994 31960 96 68 2 0 0 0 166 0 192 UNK UNK 358 192
1995
1996
1997 59405 134 73 7 41 0 64 191 0 149 UNK UNK 403 190
1998 54256 133 69 12 38 0 49 202 0 217 UNK UNK 468 255
1999 96200 422 423 22 188 0 111 945 0 286 UNK UNK 1341 474
2000 95255 373 385 22 203 13 239 757 0 324 UNK UNK 1320 527
2001 95466 489 740 101 76 0 267 1139 0 310 UNK UNK 1716 386
2002 91350 269 165 32 81 0 46 501 0 170 UNK UNK 717 251
2003 91887 433 297 63 6 0 83 716 0 115 UNK UNK 914 121
Average 76972 294 277 33 79 2 107 577 0 220 UNK UNK 724 240

17 December 14, 2010 HB 3489 Report
2.1.1.7 Elk River Fall Chinook (Stock 35) Elk stock fall Chinook brood are collected, held, and spawned at Elk River Hatchery, which is located in on the Elk River at RM 14. The eggs are also incubated and the fish reared to smolt stage onsite. All smolts are released from the hatchery. The goal of the Elk River fall Chinook program is to provide fish for commercial and sport fishing harvest, while minimizing any potential adverse impacts to the wild population of this species or other species. Elk R Release: The majority of Elk River stock smolts that are released into the Elk River are captured as adults in Oregon FW Sport and marine fisheries (Tables 11 and 12). During the previous ten brood years for which we have complete cohort data, an average of 2,516 adults (range 622-5,205) were caught in Oregon marine and FW fisheries. The FW fisheries and spawning grounds in this system are sampled for CWTs, providing robust estimates of harvest and straying.
2.1.1.8 Chetco River Fall Chinook (Stock 96) Chetco stock fall Chinook brood are collected from the Chetco River from October to December using beach seines and tangle nets. Adults are collected from throughout the run to maintain the genetic diversity of the population, and only Chetco River fall Chinook are used for broodstock. The adults are then transferred to Elk River Hatchery where they are held and spawned. The progeny are reared entirely at Elk River Hatchery until smolt stage, then transferred and released into the Chetco River in mid-September at RM 4.0 (Social Security Bar). This group has a CWT group to provide an estimate of their performance. The goal of the Chetco River fall Chinook program is to provide fish for commercial and sport fishing harvest, while minimizing any potential adverse impacts to the wild populations, particularly the Southern Oregon and Northern California Coasts (SONCC) Coho which is listed as a threatened population under the federal ESA. Chetco R Release: The majority of Chetco River stock smolts that are released into the Chetco Basin are captured as adults in Oregon FW Sport and Marine fisheries (Tables 13 and 14). During the previous ten brood years for which we have complete cohort data, an average of 499 adults (range 249-846) were caught in Oregon marine and FW fisheries. The FW fisheries in this system are not sampled, so harvest is calculated using punch card data and therefore is subject to considerable error. There is no information regarding the number of hatchery fish that stray. In addition, the lack of adult collection at the acclimation site prohibits a viable estimate of hatchery returns.

18 December 14, 2010 HB 3489 Report
Table 11. Estimated number of Elk River adult hatchery fall Chinook caught in ocean and freshwater (FW) fisheries, returning to the hatchery, or straying to spawning grounds. Estimates are based on CWT recoveries.
Table 12. Distribution of harvest of Elk River adult hatchery fall Chinook among the four northwest states (Alaska, Washington, Oregon and California) and Canada (BC). Values represent the % of the total harvest caught in the respective regions.
State Brood Year AK BC WA OR CA
1994 20 8 2 70 0
1995 13 6 1 80 0
1996 20 9 1 71 0
1997 15 12 4 69 0
1998 12 10 8 68 1
1999 16 16 6 62 1
2000 13 14 5 68 1
2001 17 25 4 53 1
2002 13 23 8 56 0
2003 12 10 8 70 1
Average 15 13 5 67 0
Ocean Recoveries FW Recoveries total Oregon
Broodyear Number released AK BC WA OR CA sport commercial
Columbia gillnet
FW sport Hatchery
Spawning Ground harvest catch
1994 325889 543 205 50 1008 5 70 1740 0 890 1235 1514 2700 1898
1995 321567 601 255 45 1877 0 41 2738 0 1824 2495 2342 4602 3701
1996 322931 173 78 9 324 0 11 573 0 298 430 353 882 622
1997 328270 1145 873 335 2939 8 221 5079 0 2266 3825 5697 7565 5205
1998 350870 876 756 614 2801 43 517 4574 0 2161 2514 3928 7252 4962
1999 327987 891 888 326 2194 38 218 4120 0 1352 1883 2373 5690 3546
2000 330883 444 502 160 1473 22 97 2503 0 901 1351 2359 3501 2374
2001 312650 278 415 75 617 11 131 1264 0 261 688 768 1656 877
2002 323358 244 443 146 665 8 123 1383 0 424 915 612 1930 1089
2003 310671 147 122 97 537 11 58 857 3 348 573 319 1266 888
Average 325508 534 454 186 1444 15 149 2483 0 1073 1591 2026 3705 2516

19 December 14, 2010 HB 3489 Report
Table 13. Estimated number of Chetco River adult hatchery fall Chinook caught in ocean and freshwater (FW) fisheries, returning to the hatchery, or straying to spawning grounds. Estimates are based on CWT recoveries.
Table 14. Distribution of harvest of Chetco River adult hatchery fall Chinook among the four northwest states (Alaska, Washington, Oregon and California) and Canada (BC). Values represent the % of the total harvest caught in the respective regions.
State Brood Year AK BC WA OR CA
1994 0 0 2 98 0
1995 0 0 0 81 19
1996 0 0 0 100 0
1997 0 0 1 88 11
1998 0 0 0 88 12
1999 0 0 0 48 52
2000 0 1 1 54 43
2001 0 0 6 94 0
2002 0 0 0 88 12
2003 0 0 0 65 35
Average 0 0 1 80 18
Ocean Recoveries FW Recoveries total Oregon
Broodyear Number released AK BC WA OR CA sport commercial
Columbia gillnet
FW sport Hatchery
Spawning Ground harvest catch
1994 165717 0 0 11 519 0 94 436 13 192 UNK UNK 736 725
1995 226309 0 0 0 355 121 258 218 0 149 UNK UNK 625 504
1996 233621 0 0 0 70 0 22 47 0 217 UNK UNK 287 287
1997 158208 0 0 9 437 91 227 311 0 286 UNK UNK 824 723
1998 164741 0 0 0 89 55 85 60 0 324 UNK UNK 469 413
1999 158150 0 0 0 110 456 98 468 0 310 UNK UNK 876 420
2000 156088 0 16 21 676 674 33 1354 0 170 UNK UNK 1556 846
2001 155941 0 0 33 428 0 33 429 0 115 UNK UNK 576 543
2002 153681 0 0 0 148 36 20 165 0 131 UNK UNK 315 279
2003 156810 0 0 0 145 135 99 181 0 104 UNK UNK 384 249
Average 172927 0 2 8 298 157 97 367 1 200 UNK UNK 665 499

20 December 14, 2010 HB 3489 Report
2.1.2 ODFW Spring Chinook Programs
2.1.2.1 Trask Spring Chinook (Stock 34) Trask stock spring Chinook brood are collected at trapping facilities at Trask Hatchery where they are also held and spawned. Approximately 50,000 eyed-eggs are transferred to STEP hatchbox facilities or are used in classroom incubators. In addition, approximately 110,000 eyed eggs are transferred to the Whiskey Creek STEP facility on Netarts Bay for rearing to fingerling or smolt size. Details of the Whiskey Creek spring Chinook program are covered in the Whiskey Creek Hatchery Stock-34 Spring Chinook Hatchery and Genetic Management Plan (HGMP). The remaining fish are reared to smolt size at Trask Hatchery, Trask Pond, and Tuffy Creek Pond. From Trask Hatchery, approximately 63,000 fingerlings are transferred to the Tuffy Creek facility and 120,000 are transferred to Trask Pond. Trask Hatchery retains approximately 70,000 fingerlings. Up to 40,000 fingerlings from the Whiskey Creek Stock 34 Spring Chinook program are eventually transferred to Trask Pond and mixed with the Trask Hatchery Stock 34 fingerlings. Therefore, subsequent releases from Trask Pond into the Trask and Wilson rivers include a mix of Trask Hatchery and Whiskey Creek Hatchery Stock 34 spring Chinook. Trask Hatchery volitionally releases ~70,000 smolts directly into the Trask River. In addition, ~120,000 Trask Pond smolts are transported and direct-released into the lower mainstem Trask River (usually at the Highway 101 boat ramp at RM 4.5). From Trask Hatchery, approximately 63,000 fingerlings are transferred to the Tuffy Creek facility (for eventual ~60,000 smolt release). Approximately 40,000 smolts from Trask Pond are also transported to the Wilson River either for direct release or acclimation at Hughey Creek acclimation pond located at ~RM 6.5 on the Wilson River. All fish transported from Trask Pond are a mix of Trask Hatchery (~120,000 smolts) and Whiskey Creek Hatchery (up to 40,000 smolts) Stock 34 spring Chinook. Spring Chinook smolts from the Tuffy Creek facility are generally released directly into the lower mainstem Wilson River (~60,000 released). The smolt releases into the Trask River and Wilson River were marked through 2009 with CWTs to allow assessment of the performance (see below). The primary goal of this program is to provide hatchery spring Chinook adults for sports harvest in the ocean and freshwater. In addition, this program provides educational opportunities to students and encourages volunteer involvement from the public with natural resources through STEP activities. Trask R Release: The majority of Trask stock smolts that are released into the Trask River are captured as adults in Oregon FW sport fisheries (Tables 15 and 16). During the previous ten brood years for which we have complete cohort data, an average of 660 adults (range 113-1,304) were caught in Oregon marine and FW fisheries. The FW fisheries in this system are not sampled so harvest is calculated using punch card data and therefore is subject to considerable error. The number of hatchery spring Chinook that stray onto spawning grounds in the Trask and Wilson basins is considered to be approximately 50% based on recent survey information

21 December 14, 2010 HB 3489 Report
Hatchery recoveries are likely an underestimate given the large number of fish that are released onsite. Wilson River release: The majority (~68%) of Trask stock smolts that are released into the Wilson River are captured as adults in Oregon FW sport fisheries (Tables 17 and 18). The Alaska commercial fishery also accounts for ~19% of the harvest. During the previous ten brood years for which we have complete cohort data, an average of 238 adults (range 358-974) were caught in Oregon marine and FW fisheries. The FW fisheries in this basin are generally not sampled so harvest is calculated using punch card data and therefore is subject to considerable error. . The number of hatchery spring Chinook that stray onto spawning grounds in the Trask and Wilson basins is considered to be approximately 50% based on recent survey information.
2.1.2.2 Nestucca Spring Chinook (Stock 47) Nestucca stock spring Chinook brood are collected, held, and spawned at Cedar Creek Hatchery. In some years, brood may also be collected by seining. Approximately 65,000 eggs may be transferred to the STEP program for use in streamside hatchboxes and classroom incubators. These fish are typically released as unfed fry. The remaining juveniles are reared to the smolt stage entirely at Cedar Creek Hatchery. Approximately 110,000 smolts are released from the hatchery. This group has been marked with a CWT to allow assessment of their performance. The goal of this program is to provide hatchery spring Chinook adults for recreational harvest in freshwater and ocean fisheries. In addition, the STEP program provides educational opportunities to students and encourages volunteer involvement from the public. Three R Release: The majority of Nestucca stock smolts that are released into the Nestucca Basin are captured as adults in Oregon FW sport fisheries (Tables 19 and 20). During the previous ten brood years for which we have complete cohort data, an average of 651 adults (range 152-1,338) were caught in Oregon marine and FW fisheries. The FW fisheries in this system are not sampled, so harvest is calculated using punch card data and therefore is subject to considerable error. The number of hatchery spring Chinook that stray onto spawning grounds in the Nestucca Basin is considered to be approximately 40% based on recent survey information.

22 December 14, 2010 HB 3489 Report
Table 15. Estimated number of Trask Hatchery adult hatchery spring Chinook caught in ocean and freshwater (FW) fisheries, returning to the hatchery, or straying to spawning grounds. Estimates are based on CWT recoveries.
Table 16. Distribution of harvest of Trask Hatchery adult hatchery spring Chinook among the four northwest states (Alaska, Washington, Oregon and California) and Canada (BC). Values represent the % of the total harvest caught in the respective regions.
State Brood Year AK BC WA OR CA
1994 22 0 0 78 0
1995 7 0 0 93 0
1996 6 0 1 93 0
1997 1 1 3 95 0
1998 16 18 8 59 0
1999 10 15 10 66 0
2000 11 24 6 59 0
2001 1 2 1 96 0
2002 13 17 4 66 0
2003 0 1 1 98 0
Average 9 8 3 80 0
Ocean Recoveries FW Recoveries total Oregon
Broodyear Number released AK BC WA OR CA sport commercial
Columbia gillnet
FW sport Hatchery
Spawning Ground harvest catch
1994 144298 39 0 0 49 0 21 67 0 89 135 UNK 176 138
1995 54468 9 0 0 8 0 7 10 0 105 26 UNK 122 113
1996 54227 9 0 2 10 0 6 15 0 129 19 UNK 150 140
1997 38367 4 4 11 47 0 14 52 0 335 34 UNK 401 382
1998 150875 198 226 97 144 0 70 596 0 596 172 UNK 1262 741
1999 144799 163 247 166 385 0 90 871 0 728 439 UNK 1689 1113
2000 147855 243 531 125 237 0 104 1031 0 1067 595 UNK 2202 1304
2001 39984 15 22 9 15 0 0 60 0 1145 95 UNK 1206 1160
2002 161224 183 241 61 173 0 77 582 0 766 747 UNK 1424 939
2003 83724 0 4 9 0 0 0 12 0 572 37 UNK 584 572
Average 101982 86 128 48 107 0 39 330 0 553 230 UNK 922 660

23 December 14, 2010 HB 3489 Report
Table 17. Estimated number of Trask Hatchery adult hatchery spring Chinook released in the Wilson River that are caught in ocean and freshwater (FW) fisheries, returning to the hatchery, or straying to spawning grounds. Estimates are based on CWT recoveries.
Table 18. Distribution of harvest of Trask Hatchery adult hatchery spring Chinook released in the Wilson River among the four northwest states (Alaska, Washington, Oregon and California) and Canada (BC). Values represent the % of the total harvest caught in the respective regions.
State Brood Year AK BC WA OR CA
1994 30 0 0 70 0
1995 39 0 0 61 0
1996 15 20 0 64 0
1997 10 10 0 80 0
1998 24 8 1 67 0
1999 15 21 11 53 0
2000 12 31 9 48 0
2001
2002 15 39 8 38 0
2003 7 12 0 81 0
Average 19 16 3 62 0
Ocean Recoveries FW Recoveries total Oregon
Broodyear Number released AK BC WA OR CA sport commercial
Columbia gillnet
FW sport Hatchery
Spawning Ground harvest catch
1994 109083 26 0 0 18 0 12 31 0 43 79 UNK 87 61
1995 199685 58 0 0 28 0 28 58 0 64 200 UNK 149 92
1996 194552 21 27 0 19 0 0 66 0 67 98 UNK 133 86
1997 206468 22 22 0 51 0 16 78 0 122 72 UNK 216 173
1998 104138 94 33 5 65 0 39 158 0 201 120 UNK 397 265
1999 101784 135 191 94 212 0 60 572 0 263 166 UNK 894 474
2000 107560 102 265 81 140 0 0 588 0 273 229 UNK 862 414
2001 UNK
2002 116388 136 347 68 124 0 130 545 0 207 553 UNK 882 331
2003 165909 21 36 0 14 0 0 72 0 229 226 UNK 300 243
Average 145063 68 102 28 75 0 32 241 0 163 194 UNK 436 238

24 December 14, 2010 HB 3489 Report
Table 19. Estimated number of Cedar Creek Hatchery adult hatchery spring Chinook caught in ocean and freshwater (FW) fisheries, returning to the hatchery, or straying to spawning grounds. Estimates are based on CWT recoveries.
Table 20. Distribution of harvest of Cedar Creek Hatchery adult hatchery spring Chinook among the four northwest states (Alaska, Washington, Oregon and California) and Canada (BC). Values represent the % of the total harvest caught in the respective regions.
State Brood Year AK BC WA OR CA
1994 10 0 6 83 0
1995 32 0 10 58 0
1996 27 8 11 54 0
1997 5 14 2 79 0
1998 6 21 5 68 0
1999 4 30 10 56 0
2000 3 23 4 71 0
2001 10 11 1 78 0
2002 9 8 3 80 0
2003 1 2 1 95 0
Average 11 12 5 72 0
Ocean Recoveries FW Recoveries total Oregon
Broodyear Number released AK BC WA OR CA sport commercial
Columbia gillnet
FW sport Hatchery
Spawning Ground harvest catch
1994 126327 22 0 14 21 0 15 42 0 155 164 UNK 212 176
1995 112312 85 0 27 24 0 24 111 0 128 145 UNK 263 152
1996 120651 107 31 46 23 0 22 186 0 197 189 UNK 405 220
1997 122222 21 64 8 24 0 21 97 0 324 104 UNK 441 348
1998 119800 63 238 56 164 0 30 491 0 611 62 UNK 1132 775
1999 113401 68 557 196 168 0 39 949 0 881 117 UNK 1869 1048
2000 119664 54 430 69 211 0 99 664 0 1127 19 UNK 1890 1338
2001 103969 122 136 15 76 0 13 336 0 899 31 UNK 1248 975
2002 110467 109 97 37 96 0 28 311 0 847 38 UNK 1186 943
2003 115206 8 12 8 0 0 8 21 0 536 10 UNK 564 536
Average 116402 66 156 48 81 0 30 321 0 571 88 UNK 921 651

25 December 14, 2010 HB 3489 Report
2.1.2.3 North Fork Umpqua River Spring Chinook (Stock 55) North Fork Umpqua stock spring Chinook brood are collected at Winchester Dam trap and as swim-ins to Rock Creek Fish Hatchery. The adults are spawned at Rock Creek Hatchery. The smolts are released volitionally from Rock Creek Hatchery’s rearing ponds into Rock Creek during October and February. Both release groups have a CWT group to allow assessment of post-release performance (see below). The goal of this program is to provide Chinook for the Umpqua River and North Umpqua River recreational fisheries, plus commercial and sport fisheries in the ocean. Fish which are not harvested are allowed to spawn naturally with naturally producing spring Chinook in the North Umpqua. To accomplish harvest and escapement goals, the ODFW has a goal of 4,000 to 7,000 spring Chinook adults annually passing Winchester Dam. To reach this goal, the program annually releases approximately 342,000 smolts. Rock Cr Release: The majority of North Fork Umpqua stock smolts that are released into the North Fork Umpqua River are captured as adults in Oregon FW sport fisheries (Tables 21 and 22). During the previous ten brood years for which we have complete cohort data, an average of 2,953 adults (range 883-6,404) were caught in Oregon marine and FW fisheries. The FW fisheries in this system are not sampled, so harvest is calculated using punch card data and therefore is subject to considerable error. Hatchery strays are monitored on spawning grounds in the upper Mainstem North Umpqua between Calf Creek and Soda Springs Dam. The stray rates have ranged from 16.4 to 8.9 from 2004 – 2009. In 2004 the hatchery program was decreased from 420,000 smolts to 340,000. Consequently hatchery strays since 2008 have been declining. Adult passage is also monitored at Winchester Dam. This count, less the upriver harvest, provides a good estimate of the number wild and hatchery escapement. Many of the hatchery chinook return to Rock Creek. In the future Rock Creek will have a new fish ladder that would allow sorting of hatchery fish if desired.

26 December 14, 2010 HB 3489 Report
Table 21. Estimated number of Umpqua Basin adult hatchery spring Chinook caught in ocean and freshwater (FW) fisheries, returning to the hatchery, or straying to spawning grounds. Estimates are based on CWT recoveries.
Table 22. Distribution of harvest of Umpqua Basin adult hatchery spring Chinook among the four northwest states (Alaska, Washington, Oregon and California) and Canada (BC). Values represent the % of the total harvest caught in the respective regions.
State Brood Year AK BC WA OR CA
1994 2 0 1 93 4
1995 7 3 1 85 4
1996 0 0 6 91 3
1997 0 2 3 94 1
1998 0 3 6 87 4
1999 0 2 3 86 9
2000 1 3 3 76 17
2001 1 4 3 90 2
2002 3 16 6 75 0
2003 0 15 19 58 7
Average 2 5 5 83 5
Ocean Recoveries FW Recoveries total Oregon
Broodyear Number released AK BC WA OR CA sport commercial
Columbia gillnet
FW sport
Hatchery and Spawning grounds harvest catch
1994 298844 32 0 10 483 57 80 503 0 822 3012 1405 1305
1995 308470 78 36 9 74 38 0 236 0 809 4862 1045 883
1996 247660 0 0 107 312 48 73 394 0 1226 8885 1693 1537
1997 404542 0 93 108 1821 53 151 1923 53 1873 13409 4000 3747
1998 399938 22 235 425 3165 301 569 3580 0 3239 15622 7387 6404
1999 424453 16 143 257 3376 687 454 4026 42 3498 12277 8019 6915
2000 144882 63 121 147 1272 780 209 2174 0 2318 9339 4701 3590
2001 400362 30 123 78 1052 66 71 1277 0 1607 5315 2955 2659
2002 265244 44 277 104 297 0 209 514 0 1005 895 1728 1302
2003 267924 0 310 398 330 148 97 1090 0 860 0 2047 1191
Average 316232 29 134 164 1218 218 191 1572 9 1726 7362 3498 2953

27 December 14, 2010 HB 3489 Report
2.1.3 ODFW Coho Programs 2.1.3.1 Nehalem/Fishhawk Coho (Stock 32/Stock 99)
Nehalem/Fishhawk stock coho brood are collected, held, and spawned at Nehalem Hatchery. Progeny are reared entirely at this facility until the smolt stage. The current goal is to release 100,000 smolts from the hatchery. The smolt release has been marked with CWTs to allow assessment of their performance (see below), but due to budget constraints this marking has been discontinued. The purpose of this program is to provide adult hatchery coho for harvest in ocean fisheries and in Nehalem Basin freshwater fisheries. North Fork Nehalem River Release: The majority of North Fork Nehalem/Fishhawk stock smolts that are released into the North Fork Nehalem River are captured in Oregon FW sport fisheries (Tables 23 and 24). During the previous ten brood years for which we have complete cohort data, an average of 530 adults (range 80-1,671) were caught in Oregon marine and FW fisheries. The FW fisheries in this system are not sampled, so harvest is calculated using punch card data and therefore is subject to considerable error. There is no information regarding the number of hatchery fish that stray onto spawning grounds.
2.1.3.2 Trask River Coho (Stock 34) Trask stock coho brood are collected, held, and spawned at Trask River Hatchery. Incubation and early rearing occurs at Trask River Hatchery. Approximately 135,000 to 140,000 fingerlings are transferred from Trask River Hatchery to Nehalem Hatchery for rearing to smolt size. Smolts are differentially marked to differentiate Trask stock from Nehalem stock before being transferred back to Trask River Hatchery and acclimated for up to a month before being direct released from the hatchery pond. The goal of this program is to provide hatchery fish for consumptive sport and commercial fisheries in the waters of Oregon in a manner that minimizes the risk of adverse effects to listed wild populations. Trask R Release: The majority of Trask stock smolts that are released into the Trask River are captured as adults in Oregon FW sport and marine fisheries (Tables 25 and 26). During the previous ten brood years for which we have complete cohort data, an average of 674 adults (range 98-2,372) were caught in Oregon marine and FW fisheries. The FW fisheries in this system are not sampled, so harvest is calculated using punch card data and therefore is subject to considerable error. There is no information regarding the number of hatchery fish that stray onto spawning grounds.

28 December 14, 2010 HB 3489 Report
Table 23. Estimated number of North Fork Nehalem Hatchery adult coho caught in ocean and freshwater (FW) fisheries, returning to the hatchery, or straying to spawning grounds. Estimates are based on CWT recoveries.
Table 24. Distribution of harvest of North Fork Nehalem Hatchery adult coho among the four northwest states (Alaska, Washington, Oregon and California) and Canada (BC). Values represent the % of the total harvest caught in the respective regions.
State Brood Year AK BC WA OR CA
1995 0 0 0 70 30
1996 0 0 4 90 6
1997 0 0 0 100 0
1998 0 0 8 91 1
1999 0 0 13 85 2
2000 0 0 19 81 0
2001 0 0 19 79 2
2002 0 0 11 89 0
2003 0 10 17 66 7
2004 0 0 28 61 11
Average 0 1 12 81 6
Ocean Recoveries FW Recoveries total Oregon
Broodyear Number released AK BC WA OR CA
sport
commercial
Columbia gillnet
FW sport Hatchery
Spawning Ground harvest catch
1995 576156 0 0 0 0 68 68 0 0 161 1621 UNK 228 161
1996 145229 0 0 18 27 27 72 0 0 394 1528 UNK 466 422
1997 160758 0 0 0 29 0 18 10 0 51 391 UNK 80 80
1998 157466 0 0 147 120 14 262 20 13 1539 4140 UNK 1832 1671
1999 153669 0 0 126 185 16 328 0 0 626 2200 UNK 954 811
2000 255803 0 0 258 467 0 686 40 0 660 1652 UNK 1386 1128
2001 101704 0 0 141 229 18 347 41 0 357 1438 UNK 745 586
2002 100652 0 0 29 24 0 36 18 4 217 1407 UNK 275 245
2003 103460 0 21 36 15 15 86 0 0 124 552 UNK 210 138
2004 106229 0 0 25 8 11 44 0 0 47 167 UNK 92 56
Average 186113 0 2 78 111 17 195 13 2 418 1510 UNK 627 530

29 December 14, 2010 HB 3489 Report
Table 25. Estimated number of Trask Hatchery adult coho caught in ocean and freshwater (FW) fisheries, returning to hatchery, or straying to spawning grounds. Estimates are based on CWT recoveries.
Table 26. Distribution of harvest of Trask Hatchery adult coho among the four northwest states (Alaska, Washington, Oregon and California) and Canada (BC). Values represent the % of the total harvest caught in the respective regions.
State Brood Year AK BC WA OR CA
1995 0 0 54 46 0
1996 12 0 36 52 0
1997 0 0 16 84 0
1998 0 0 17 81 2
1999 0 0 21 76 3
2000 0 0 31 69 0
2001 0 0 22 78 1
2002 0 0 10 90 0
2003 0 0 24 76 0
2004 0 0 3 91 7
Average 1 0 23 74 1
Ocean Recoveries FW Recoveries total Oregon
Broodyear Number released AK BC WA OR CA sport commercial
Columbia gillnet
FW sport Hatchery
Spawning Ground harvest catch
1995 144533 0 0 64 54 0 110 8 0 1 1624 UNK 119 54
1996 212525 32 0 96 133 0 229 32 0 5 4431 UNK 266 138
1997 189230 0 0 106 426 0 437 95 0 122 4671 UNK 653 547
1998 196385 0 0 508 1008 61 1492 85 0 1364 19728 UNK 2941 2372
1999 194634 0 0 320 268 45 633 0 0 903 11397 UNK 1535 1170
2000 201749 0 0 685 857 0 1508 34 0 659 5856 UNK 2201 1516
2001 96748 0 0 151 215 6 346 26 0 328 1776 UNK 701 543
2002 100382 0 0 17 7 0 24 0 0 148 1591 UNK 172 155
2003 103000 0 0 48 60 0 96 12 0 89 1220 UNK 197 150
2004 94020 0 0 3 20 8 27 3 0 79 156 UNK 109 98
Average 153321 3 0 200 305 12 490 29 0 370 5245 UNK 889 674

30 December 14, 2010 HB 3489 Report
2.1.3.3 North Fork Umpqua River Coho (Stocks 55) The North Umpqua coho (stock 55) was discontinued in 2005, except for a mitigation agreement with PacifiCorps. This agreement is for 80,000 coho eggs for an artificial egg deployment and habitat restoration research study. The brood for this program are collected from Winchester Dam. This program will require 80,000 eggs from BY 2009 through BY 2011. South Umpqua River Coho (Stock 18) The South Umpqua coho program is part of a mitigation program with Douglas County. The goal of this program is to release 60,000 smolts annually for commercial and recreational fishing. The brood are collected at the Happy Valley Trap (RM 18 S. Ump.) and at a fish trap at the base of Galesville Dam. Rock Creek Hatchery rears the smolts until they are transferred to an acclimation site at the base of Galesville Dam. According to spawning ground surveys conducted by Corvallis research, hatchery strays have declined from 11.3% to 7.1% from 2000 to 2009. The Umpqua has a hatchery-fish only harvest regulation.

31 December 14, 2010 HB 3489 Report
Table 27. Estimated number of Umpqua Basin adult coho caught in ocean and freshwater (FW) fisheries, returning to the hatchery, or straying to spawning grounds. Estimates are based on CWT recoveries.
Table 28. Distribution of harvest of Umpqua Basin adult coho in the four northwest states (Alaska, Washington, Oregon and California) and Canada (BC). Values represent the % of the total harvest caught in the respective regions.
State Brood Year AK BC WA OR CA
1995 0 0 2 97 1
1996 0 0 3 93 4
1997 0 0 2 98 0
1998 0 0 1 99 0
1999 0 0 1 99 0
2000 0 0 3 97 0
2001 0 0 8 91 1
2002 0 4 3 91 2
2003 0 0 2 97 1
2004 0 0 3 97 0
Average 0 0 3 96 1
Ocean Recoveries FW Recoveries total Oregon
Broodyear Number released AK BC WA OR CA sport commercial
Columbia gillnet
FW sport
Hatchery and spawning grounds harvest catch
1995 104773 0 0 15 13 8 36 0 0 877 4269 913 890
1996 143565 0 0 26 69 29 115 7 0 686 3566 809 755
1997 114138 0 0 40 221 0 247 14 11 1406 9572 1678 1637
1998 117703 0 0 78 278 24 368 12 0 13756 16142 14136 14034
1999 50219 0 0 20 31 0 52 0 0 1438 4349 1490 1470
2000 115178 0 0 144 867 0 968 43 0 4260 13535 5271 5127
2001 121797 10 0 257 923 30 1178 42 22 2093 7056 3335 3038
2002 110044 0 77 47 39 43 207 0 0 1576 9316 1783 1616
2003 111506 0 0 50 68 30 105 43 0 2420 7040 2568 2488
2004 68027 0 0 32 113 0 131 14 0 1077 2746 1222 1190
Average 105695 1 8 71 262 16 341 18 3 2959 7759 3320 3224

32 December 14, 2010 HB 3489 Report
2.1.4 ODFW Winter Steelhead Programs Note: There are no ocean fisheries for steelhead, therefore, we only report on freshwater catch in Oregon rivers and estuaries. In all instances the FW fisheries are not regularly sampled, so estimates are derived from punch cards. Thus, harvest estimates are subject to a high degree of uncertainty. In addition, there is no regular assessment that provides information on the number of hatchery winter steelhead that stray
2.1.4.1 Nehalem Winter Steelhead (Stock 32) Nehalem stock winter steelhead brood are collected, held, and spawned at Nehalem Hatchery. The progeny are also reared entirely onsite. Currently, approximately 90,000 smolts are released into the North Fork Nehalem River from the hatchery and 40,000 are released into the Necanicum River. The primary goal is to provide hatchery steelhead adults for recreational harvest in these basins. In addition, the program educates students about salmonid fish biology and their habitat requirements via the STEP program. North Fork Nehalem River and Necanicum River releases: During the past 10 years, the Nehalem winter steelhead program accounts for an average of 1,092 and 406 of the winter steelhead harvested in the Nehalem and Necanicum basins, respectively. Prior to the 2009 brood year, Nehalem hatchery utilized both stock 32 and stock 99 winter steelhead. Current production utilizes only stock 32.
2.1.4.2 Nestucca Winter Steelhead (Stock 47 and 47W) Beginning in November, Nestucca hatchery stock (47) adults return to the Three Rivers trap and are collected for broodstock and held until spawning in early January. Wild Nestucca broodstock (47W) adults are collected by angling beginning in mid December and running through April. Some wild stock fish are trapped in the Three Rivers trap. Currently these fish are passed above the weir to spawn naturally. Stock 47 adults are spawned at Cedar Creek Hatchery in January and eggs are incubated onsite. Approximately 85,000 stock 47 juveniles are transferred to Tuffy Creek Rearing Pond, (Trask Hatchery satellite facility), after marking at Cedar Creek. The performance of these fish is discussed in the following section. Stock 47W adults are live-spawned from throughout the collection period as they become ripe. All spawning, incubation and rearing take place at Cedar Creek Hatchery. The stock 47W program began with 2002 brood year.

33 December 14, 2010 HB 3489 Report
Table 29. Release numbers, FW harvest estimates, and hatchery returns for Nehalem winter steelhead (stock 32 and 99). Spawning grounds are not surveyed, so there is no data on stray rates.
Brood Nehalem Smolt
Necanicum Smolt
2-salt Return
Nehalem FW
Necanicum FW
Nehalem Hatchery
Year Release Release Year Sport * Sport * Return ** SGS
1996 92,747 45,092 1998-99 1,044 352 1,343 n.a.
1997 94,909 40,005 1999-00 1,249 439 1,060 n.a.
1998 87,215 39,043 2000-01 1,009 496 1,249 n.a.
1999 99,725 39,991 2001-02 1,809 734 2,762 n.a.
2000 98,195 40,062 2002-03 935 425 1,299 n.a.
2001 98,911 39,992 2003-04 1,518 596 2,009 n.a.
2002 89,608 40,016 2004-05 769 427 1,750 n.a.
2003 96,383 39,998 2005-06 844 313 2,251 n.a.
2004 93,959 40,001 2006-07 1,117 218 1,920 n.a.
2005 97,122 39,992 2007-08 629 57 1,393 n.a.
Average 94,877 40,419 1,092 406 1,704
* = Nehalem Basin Catch, based on punch card returns. The 1992-93 to 2008-09 run years are hatchery fish only fisheries with age comp based on an average of the 1983-84 to 1991-92 scale data.
** = Used average age composition from fishery scales to assign age to hatchery returns.
All releases in the Nestucca basin currently are a mix of 47 and 47W stock winter steelhead. All releases in the Wilson are a mix of 47 stock and 121W stock, (Wilson wild broodstock); all Kilchis releases are of the 47 stock. The primary goal is to provide hatchery steelhead adults for sports harvest in the Nestucca, Kilchis, and Wilson river basins. Nestucca River releases: During the past 10 years, the Nestucca winter steelhead program has accounted for an average of 1,509 of the winter steelhead harvested in the Nestucca basin based on angler punch card returns.

34 December 14, 2010 HB 3489 Report
Table 30. Release numbers, FW harvest estimates, and hatchery returns for Cedar Creek Hatchery winter steelhead from stock 47 and 47W (began with 2002 brood year). Spawning grounds are not surveyed, so there is no data on stray rates. Estimated Adult Hatchery STW (2-salt + 3-salt)
Brood Smolt 2-salt Return FW Hatchery
Year Release Year Sport * Return ** SGS
1996 99,883 1998-99 1,148 2,323 n.a.
1997 110,601 1999-00 1,285 1,385 n.a.
1998 106,254 2000-01 1,537 3,112 n.a.
1999 109,043 2001-02 2,281 5,164 n.a.
2000 121,977 2002-03 1,328 2,386 n.a.
2001 116,332 2003-04 1,973 2,169 n.a.
2002 100,768 2004-05 1,155 920 n.a.
2003 94,875 2005-06 1,514 749 n.a.
2004 118,647 2006-07 1,657 282 n.a.
2005 95,906 2007-08 1,208 273 n.a.
Average 107,429 1,509 1,876
* = Nestucca Basin Catch, based on punch card returns. The 1997-98 to 2008-09 run years are hatchery fish only fisheries with age comp based on an average of the 1983-84 to 1991-92 scale data.
** = Used average age composition from fishery scales to assign age to hatchery returns.
2.1.4.3 Nestucca (Stock 47) and Wilson (Stock 121W) Winter Steelhead (Tillamook Bay Releases)
Nestucca 47 stock: Beginning in November, Nestucca hatchery stock (47) adults return to the Three Rivers trap and are collected for broodstock and held until spawning in early January. Stock 47 adults are spawned at Cedar Creek Hatchery in January and eggs are incubated onsite. Approximately 85,000 stock 47 juveniles are transferred to Tuffy Creek Rearing Pond, (Trask Hatchery satellite facility on the South Fork Wilson River), after marking at Cedar Creek. Wilson (121W) stock: Most of the wild adult steelhead collected for broodstock are caught by anglers who have signed up to participate in the program. However, adults captured at the South Fork Wilson River trap or Trask Hatchery may also be used as broodstock. The adults are spawned at Trask Hatchery and the progeny are incubated and reared onsite. Smolts are acclimated and volitionally released at the Hughey Creek acclimation facility on the Wilson River (RM 7.0). Smolts are also direct-released into the Wilson River up to RM 27.

35 December 14, 2010 HB 3489 Report
All winter steelhead releases in the Wilson are a mix of 47 stock and 121W stock, (Wilson wild broodstock); all Kilchis releases are of the 47 stock. Hatchery winter steelhead smolts are released in the Wilson River to provide adults for freshwater harvest in the mark-select fishery. The goal of the 121W program is to use a locally-adapted wild winter steelhead broodstock source. This stock has been used to partially replace releases of stock 47. Stock 121W are late-returning/late-spawning wild steelhead whereas the historical hatchery winter steelhead (Stock 047) is an early-returning run. Use of in in-basin stock was meant to lessen overall risk to the existing wild population. It also is in line with the agency’s intention to move away from the use of out-of-basin stocks in hatchery programs. Wilson and Kilchis River releases: During the past 10 years, the Nestucca/Wilson winter steelhead program has accounted for an average of 2,109 of the winter steelhead harvested in the Tillamook basin.
Table 31. Release numbers, FW harvest estimates, and hatchery returns for Nestucca/Wilson stock winter steelhead. Spawning grounds are not surveyed, so there is no data on stray rates.
Estimated Adult Hatchery STW (2-salt + 3-salt)
Brood (47)
Smolt (121) Smolt
2-salt Return FW Hatchery
Year Release Release Year Sport* ** SGS
1996 128,721 1998-99 1,362 n.a. n.a.
1997 111,114 41,739 1999-00 1,862 n.a. n.a.
1998 106,778 20,505 2000-01 1,601 n.a. n.a.
1999 110,148 50,254 2001-02 2,809 n.a. n.a.
2000 137,519 34,070 2002-03 2,207 n.a. n.a.
2001 117,216 46,989 2003-04 2,268 n.a. n.a.
2002 82,548 29,033 2004-05 1,318 n.a. n.a.
2003 78,755 45,904 2005-06 1,809 n.a. n.a.
2004 34,473 67,990 2006-07 2,143 n.a. n.a.
2005 80,373 79,554 2007-08 3,710 n.a. n.a.
Average 98,765 46,226 2,109
* = Tillamook Basin Catch, based on punch card returns. The 1997-98 to 2008-09 run years are hatchery fish only fisheries with age comp based on an average of the 1983-84 to 1991-92 scale data.
** = Used average age composition from fishery scales to assign age to hatchery returns.

36 December 14, 2010 HB 3489 Report
2.1.4.4 Siletz Wild Winter Steelhead (Stock 33W) The Siletz wild winter steelhead brood are collected from the Siletz Falls and Palmer Creek traps and by anglers, then transported to Alsea Hatchery, where they are held, spawned, and reared to the smolt stage. The smolts are then transferred to a facility on Palmer Creek for acclimation and volitional release. The goal of this program is to provide for an average annual angler harvest of 1,500 hatchery winter steelhead in the Siletz basin, while minimizing interactions with wild fish. Siletz River release: During the past 10 years, the Siletz wild winter steelhead program has accounted for an average of 1,908 of the winter steelhead harvested in the Siletz basin. Recoveries of adult winter steelhead at the Schooner Cr Trap suggest that stray rates in that tributary are relatively low for fish released up-river into the Siletz (Table 33). Table 32. Release numbers, FW harvest estimates, and hatchery returns for Siletz wild stock winter steelhead. There is limited information on stray rates from spawning surveys and trap data.
Estimated Adult Hatchery STW (2-salt + 3-
salt)
Brood Smolt 2-salt Return FW Siletz
Year Release Year Sport * Trap ** SGS
1996 55,133 1998-99 1,547 495 n.a.
1997 52,599 1999-00 1,389 361 n.a.
1998 50,124 2000-01 1,676 482 n.a.
1999 56,622 2001-02 2,462 541 n.a.
2000 56,259 2002-03 1,417 528 n.a.
2001 53,280 2003-04 2,442 528 n.a.
2002 59,400 2004-05 1,890 753 n.a.
2003 28,554 2005-06 2,323 561 n.a.
2004 55,629 2006-07 1,884 348 n.a.
2005 54,431 2007-08 2,053 8 n.a.
Average 52,203 1,908 461
* = Siletz Basin Catch, based on punch card returns. The 1997-98 to 2008-09 run years are hatchery fish only fisheries with age comp based on an average of the 1983-84 to 1991-92 scale data.
** = Used average age composition from fishery scales to assign age to hatchery returns.

37 December 14, 2010 HB 3489 Report
Table 33. Numbers of adult winter steelhead caught in Schooner Creek Trap in the Siletz Basin. Out of basin marks refer to hatchery fish that have a fin clip not applied to fish released into the Siletz Basin (e.g. Ad clip only).
year site out of basin mark
in basin mark wild fish Total Number % stray
2009 Schooner Cr 5 0 61 66 7.58%2008 Schooner Cr 0 1 10 11 9.09%2007 Schooner Cr 1 4 28 33 15.15%2006 Schooner Cr 11 4 19 34 44.12%2005 Schooner Cr 2004 Schooner Cr 1 0 41 42 2.38%2003 Schooner Cr 26 1 45 72 37.50%2002 Schooner Cr 34 0 71 105 32.38%2001 Schooner Cr 21 1 52 74 29.73%
2.1.4.5 Alsea Winter Steelhead (Stock 43 and 43W)
Traditional (43) and Wild (43W) Alsea stock winter steelhead are collected at the Alsea Hatchery. In addition, 43W brood are collected by anglers and transported to the hatchery. All fish are spawned, incubated, and reared onsite. Smolts are released volitionally from the hatchery in early March. The goal of the Alsea smolt release group is to provide for an average annual angler harvest of 2,400 hatchery winter steelhead in the Alsea Basin, while minimizing interactions with wild fish. The goal for the Yaquina smolt release group is to provide hatchery fish for harvest in the Yaquina Basin while minimizing interactions with wild fish. Big Elk River release: During the past 10 years, the Alsea traditional wild winter steelhead program has accounted for an average of 201 of the winter steelhead harvested in the Yaquina basin. . Adult fish are counted at a trap site on Mill Creek, a tributary of the Yaquina R near tidewater. The percentage of hatchery fish at this site has ranged from 9-20% during the past decade. Of these, 0-80% have marks that were not applied to fish released in the Yaquina Basin suggesting that out of basin fish are be straying into the basin.

38 December 14, 2010 HB 3489 Report
Table 34. Release numbers, FW harvest estimates, and hatchery returns for Alsea stock winter steelhead released in Big Elk River. Spawning grounds are not surveyed, so there is no data on stray rates.
Estimated Adult Hatchery STW (2-salt + 3-
salt)
Brood Smolt 2-salt Return FW Hatchery
Year Release Year Sport * Trap ** SGS
1996 19,650 1998-99 192 n.a. n.a.
1997 18,899 1999-00 251 n.a. n.a.
1998 25,607 2000-01 211 n.a. n.a.
1999 20,918 2001-02 335 n.a. n.a.
2000 19,889 2002-03 171 n.a. n.a.
2001 21,692 2003-04 269 n.a. n.a.
2002 19,547 2004-05 147 n.a. n.a.
2003 14,894 2005-06 128 n.a. n.a.
2004 22,261 2006-07 153 n.a. n.a.
2005 21,973 2007-08 156 n.a. n.a.
Average 20,533 201
* = Yaquina Basin Catch, based on punch card returns. The 1997-98 to 2008-09 run years are hatchery fish only fisheries with age comp based on an average of the 1983-84 to 1991-92 scale data.
** = Used average age composition from fishery scales to assign age to hatchery returns. Alsea River release: During the past 10 years, the Alsea traditional and wild winter steelhead program has accounted for an average of 2,325 of the winter steelhead harvested in the Alsea basin (Table 35). Although there is no comprehensive assessment of stray rates for this program, winter steelhead are collected at three trap sites located downriver of the release site at Alsea Hatchery: Cascade Creek, Fall Creek, and Bohannon Falls. Since the program was modified to release all fish onsite at Alsea Hatchery, the majority of hatchery steelhead caught at these trap sites are of fish that were released into other basins (return years 2005/06 on Table 36). The total number of hatchery strays (in and out of basin) varies among years and ranges from 5-57% of the wild fish caught in the trap (note small sample sizes). In addition, a number of Ad-clipped (out-of-basin mark) winter steelhead are captured in the two traps at the Alsea Hatchery. The origin of these fish is currently unknown though genetic information collected from fish recovered at the Fall Creek Trap site in 2008 suggests that ~50% of those fish were of Alsea origin fish.

39 December 14, 2010 HB 3489 Report
Table 35. Release numbers, FW harvest estimates, and hatchery returns for Alsea stock winter steelhead released in the Alsea River. There is limited information on stray rates from trap data (see Table 36) and no information on the number of hatchery fish on spawning grounds.
Estimated Adult Hatchery STW (2-salt + 3-salt)
Brood (43)
Smolt (43W) Smolt
2-salt Return FW Hatchery
Year Release Release Year Sport* ** SGS
1996 125,958 1998-99 1,581 2,222 n.a.
1997 130,525 1999-00 1,627 1,696 n.a.
1998 125,358 2000-01 1,795 2,386 n.a.
1999 133,797 2001-02 3,088 5,174 n.a.
2000 129,995 2002-03 2,388 3,051 n.a.
2001 64,999 59,315 2003-04 4,156 3,683 n.a.
2002 89843 39,341 2004-05 2,284 2,462 n.a.
2003 75640 14,384 2005-06 2,154 3,111 n.a.
2004 43,315 89,037 2006-07 1,991 3,471 n.a.
2005 82,360 49,762 2007-08 2,181 3,106 n.a.
Average 100,179 50,368 2,325 3,036
* = Alsea Basin Catch, based on punch card returns. The 1997-98 to 2008-09 run years are hatchery fish only fisheries with age comp based on an average of the 1983-84 to 1991-92 scale data.
** = Used average age composition from fishery scales to assign age to hatchery returns.
Table 36. Numbers of adult winter steelhead caught in traps in the Alsea Basin. Out of basin marks refer to hatchery fish that have a fin clip not applied to fish released at Alsea Hatchery (e.g. Ad clip only).
Return year site
out of basin mark
in basin mark
not recorde
d wild fish
Total Numbe
r % stray 2009/10 Cascade Cr 4 0 11 15 26.67%2009/10 Fall Cr 31 2 97 130 25.38%2009/10 Bohannon Falls 5 0 82 87 5.75%2008/09 Cascade Cr 4 0 3 7 57.14%2008/09 Fall Cr 30 0 166 196 15.31%2008/09 Bohannon Falls 19 1 50 70 28.57%2007/08 Cascade Cr 1 0 7 8 12.50%2007/08 Fall Cr 14 0 114 128 10.94%2007/08 Bohannon Falls 0 0 4 40 44 9.09%2006/07 Cascade Cr 2 1 3 6 50.00%2006/07 Fall Cr 24 2 89 115 22.61%2006/07 Bohannon Falls 4 0 12 16 25.00%2005/06 Cascade Cr 12 2 17 31 45.16%2005/06 Fall Cr 17 0 50 67 25.37%2005/06 Bohannon Falls 0 0 10 59 69 14.49%

40 December 14, 2010 HB 3489 Report
2.1.4.6 South Umpqua Winter Steelhead (Stock 18) Cow Creek stock winter steelhead brood are collected at several locations. These include the Galesville Dam Trap, Canyon Creek Trap, and South Umpqua Falls Fishway. In addition, brood collection may be augmented by hook and line in the South Umpqua or tangle-netting between RM 0 to 70 on the South Umpqua. The adults are transferred to Rock Creek Hatchery for holding and spawning. The progeny are transferred to Cole Rivers Hatchery for their first year, then returned to Rock Creek. They are then transferred to several potential acclimation sites as 2-year old smolts. The acclimation sites include: the Canyonville Acclimation Facility, Seven Feathers Acclimation Facility, and Eastwood Elementary. All steelhead smolts were directly released into the South Umpqua between Canyonville and River Forks (RM 51 - RM 0) prior to 1999. The program has been doing 100% acclimation since 2002, thus stray rates to the North Umpqua have declined. A spawning ground survey was conducted in 2003 to document hatchery strays in tributaries within 10 miles above and 10 miles below Canyon Creek where over 90% of the smolts are acclimated. Less than 1% straying was documented. The program also annually monitors stray rates up at South Umpqua Falls where there has been less than 3% straying since 1999. Umpqua River releases: During the past 10 years, the South Umpqua winter steelhead program has accounted for an average of 3,233 of the winter steelhead harvested in the Umpqua basin.
2.1.4.7 Ten Mile Basin Winter Steelhead (Stock 88) The Tenmile winter steelhead stock broodstock are collected primarily through wild and hatchery returns to the Eel Lake Trap, which also functions as one of the smolt acclimation/release sites. Select anglers/STEP volunteers have also been authorized to collect wild steelhead while angling, and donate these fish to the Tenmile broodstock collection. The Tenmile winter steelhead stock was reared at Alsea Hatchery through the 1999 brood year. Due to straying concerns in the Alsea Basin, subsequent rearing has been at Cole Rivers Hatchery. Gametes are collected at the Eel Lake Trap site, and transported to Bandon Hatchery for fertilization and early incubation. Eyed eggs are transported to Cole Rivers Hatchery, for the remainder of incubation, ponding, and rearing to yearling smolts. Smolts are transported back to acclimation sites on Tenmile and Eel Creeks approximately three weeks prior to release in late April. The goal of the program is to provide adult returns primarily for harvest. The establishment of a localized broodstock was completed from 1999-2000 through 2002-2003. With that “re-founding”, Coos stock (37) steelhead releases in Tenmile Basin were discontinued. In founding the localized broodstock, the program used 100% wild broodstock for one typical life cycle length (four years for steelhead). The objective of this program is to produce adults that return to acclimation sites and are isolated as much as possible from natural spawning and rearing areas. Beginning in 2003-2004 hatchery adults were used in the broodstock, with a minimum target percentage of 30% wild steelhead to be incorporated each year.

41 December 14, 2010 HB 3489 Report
Table 37. Release numbers, FW harvest estimates, and hatchery returns for South Umpqua stock winter steelhead. Spawning grounds are not surveyed, so there is no data on stray rates.
Estimated Adult Hatchery STW (2-salt + 3-
salt)
Brood Smolt 2-salt Return FW Hatchery
Year Release Year Sport * Trap ** SGS
1996 86,229 1998-99 1,741 n.a. n.a.
1997 45,168 1999-00 1,586 n.a. n.a.
1998 103,524 2000-01 2,584 n.a. n.a.
1999 104,853 2001-02 2,551 n.a. n.a.
2000 83,080 2002-03 2,504 n.a. n.a.
2001 35,084 2003-04 3,416 n.a. n.a.
2002 135,823 2004-05 4,002 n.a. n.a.
2003 67,707 2005-06 5,258 n.a. n.a.
2004 106,076 2006-07 5,754 n.a. n.a.
2005 8,273 2007-08 2,931 n.a. n.a.
Average 77,582 3,233
* = Umpqua Basin Catch, based on punch card returns. The 1997-98 to 2008-09 run years are hatchery fish only fisheries with age comp based on an average of the 1983-84 to 1991-92 scale data.
** = Used average age composition from fishery scales to assign age to hatchery returns.

42 December 14, 2010 HB 3489 Report
Ten Mile Basin releases: During the past 10 years, the Ten Mile winter steelhead program has accounted for an average of 209 of the winter steelhead harvested in the Ten Mile lakes basin.
Table 38. Release numbers, FW harvest estimates, and hatchery returns for Ten Mile stock winter steelhead. Spawning grounds are not surveyed, so there is no data on stray rates.
Estimated Adult Hatchery STW (2-salt + 3-
salt)
Brood Smolt 2-salt Return FW Hatchery
Year Release Year Sport * Trap ** SGS
1996 15,983 1998-99 22 n.a. n.a.
1997 28,882 1999-00 36 n.a. n.a.
1998 15,988 2000-01 60 n.a. n.a.
1999 16,020 2001-02 295 n.a. n.a.
2000 15,593 2002-03 239 n.a. n.a.
2001 34,929 2003-04 361 n.a. n.a.
2002 13,601 2004-05 247 n.a. n.a.
2003 23,796 2005-06 447 n.a. n.a.
2004 25,815 2006-07 258 n.a. n.a.
2005 14,068 2007-08 128 n.a. n.a.
Average 20,468 209
* = Ten Mile Lakes Basin Catch, based on punch card returns. The 1997-98 to 2008-09 run years are hatchery fish only fisheries with age comp based on an average of the 1983-84 to 1991-92 scale data.
** = Used average age composition from fishery scales to assign age to hatchery returns.
2.14.8 Coos Basin Winter Steelhead (Stock 37) The Coos winter steelhead stock broodstock are collected from wild and hatchery returns to the Millicoma Interpretive Center (MIC) Trap, by trapping at a weir trap on the lower West Fork Millicoma River, by entanglement netting in multiple locations of the Millicoma and South Coos subbasins, and by angler donation. Adult brood are held and spawned at the MIC facility on the West Fork Millicoma River. Gametes are transferred to Bandon Hatchery for fertilization and incubation. Eyed eggs from Bandon Hatchery are transported to Cole Rivers Hatchery for rearing to acclimation-ready smolts, and to the Millicoma Interpretive Center for incubation to unfed fry. A total of 125,000 yearling smolts are released from acclimation sites at Big Creek, Hodges, Rodine, East Fork Millicoma, and West Fork Millicoma sites, after three weeks of acclimation. Unfed fry (40,000) are released into reaches above barriers that have been altered for improved passage.

43 December 14, 2010 HB 3489 Report
The goal of the smolt program is to provide fish for harvest that are genetically and ecologically similar to wild populations, to minimize any potential impacts to wild populations. Unfed fry are used as a “jumpstart” program to temporarily stock unseeded habitats in the Coos Basin. These releases are done for one typical life cycle length (4 yrs. for steelhead), in order to accelerate the pioneering of natural production in reaches that have recently been accessed by improved passage projects. Coos Basin releases: During the past 10 years, the Coos winter steelhead program has accounted for an average of 1,533 of the winter steelhead harvested in the Coos basin.
Table 39. Release numbers, FW harvest estimates, and hatchery returns for Coos stock winter steelhead. Spawning grounds are not surveyed, so there is no data on stray rates.
Estimated Adult Hatchery STW (2-salt + 3-
salt)
Brood Smolt 2-salt Return FW Hatchery
Year Release Year Sport * Trap ** SGS
1996 140,287 1998-99 1,411 620 n.a.
1997 137,492 1999-00 1,106 342 n.a.
1998 117,659 2000-01 1,077 478 n.a.
1999 140,268 2001-02 2,075 395 n.a.
2000 143,439 2002-03 1,369 527 n.a.
2001 113,707 2003-04 1,840 458 n.a.
2002 87,120 2004-05 1,558 230 n.a.
2003 193,778 2005-06 1,885 212 n.a.
2004 135,307 2006-07 1,736 668 n.a.
2005 113,545 2007-08 1,268 362 n.a.
Average 132,260 1,533 429
* = Coos Basin Catch, based on punch card returns. The 1997-98 to 2008-09 run years are hatchery fish only fisheries with age comp based on an average of the 1983-84 to 1991-92 scale data.
** = Used average age composition from fishery scales to assign age to hatchery returns.
2.1.4.9 Coquille Winter Steelhead (Stock 44 and Stock 144) The Coquille Winter Steelhead (North Fork/East Fork - stock 44 and South Fork - stock 144) brood are held and spawned at Bandon. The eggs are incubated on site and approximately 50,000 (stock 44) and 20,000 (stock 144) eyed eggs are transferred to STEP hatchboxes. The remaining fish are reared at Bandon Hatchery to the smolt stage. A total of 45,000 stock 44 smolts are transferred to two

44 December 14, 2010 HB 3489 Report
acclimation sites: Hantz Creek Acclimation site receives 25,000 fish that are released directly into Hantz Creek after acclimation. Approximately 20,000 smolts are released into the North Fork Coquille River after acclimation at Laverne Park. A total of 70,000 stock 144 smolts are reared at Bandon Hatchery, then transferred to two acclimation sites, Beaver Creek (40,000) and Woodward Creek (30,000). The goal of the smolt program is to provide fish primarily for harvest that are genetically and ecologically similar to wild populations, to minimize potential impacts to wild populations. The unfed fry program is used to establish populations of steelhead in unseeded habitats in the Coquille Basin, primarily those with recently corrected passage barriers. Coquille Basin release: During the past 10 years, the Coquille traditional and wild winter steelhead program has accounted for an average of 2,360 of the winter steelhead harvested in the Coquille basin.
Table 40. Release numbers, FW harvest estimates, and hatchery returns for Coquille stock winter steelhead. Spawning grounds are not surveyed, so there is no data on stray rates.
Estimated Adult Hatchery STW (2-salt + 3-salt)
Brood (44)
Smolt (144) Smolt
2-salt Return FW Hatchery
Year Release Release Year Sport* ** SGS
1996 60,314 69,715 1997-98 1,605 248 n.a.
1997 28,476 59,658 1998-99 1,653 191 n.a.
1998 26,038 64,614 1999-00 1,215 189 n.a.
1999 41,763 81,043 2000-01 1,627 143 n.a.
2000 47,045 48,699 2001-02 2,537 157 n.a.
2001 60,534 69,387 2002-03 2,106 221 n.a.
2002 48,199 71,776 2003-04 2,789 220 n.a.
2003 50,398 73,791 2004-05 2,267 100 n.a.
2004 49,202 77,778 2005-06 2,763 0 n.a.
2005 51,803 69,885 2006-07 3,120 0 n.a.
Average 45,570 69,321 2,360
* = Coquille Basin Catch, based on punch card returns. The 1997-98 to 2008-09 run years are hatchery fish only fisheries with age comp based on an average of the 1983-84 to 1991-92 scale data.
** = Used average age composition from fishery scales to assign age to hatchery returns. 2.1.4.10 Chetco Basin Winter Steelhead (Stock 96)
Wild and hatchery Chetco River winter steelhead are collected by tangle net and hook and line in the Chetco River between December and March. The adults are held and spawned at the Elk River Hatchery. The progeny are subsequently reared
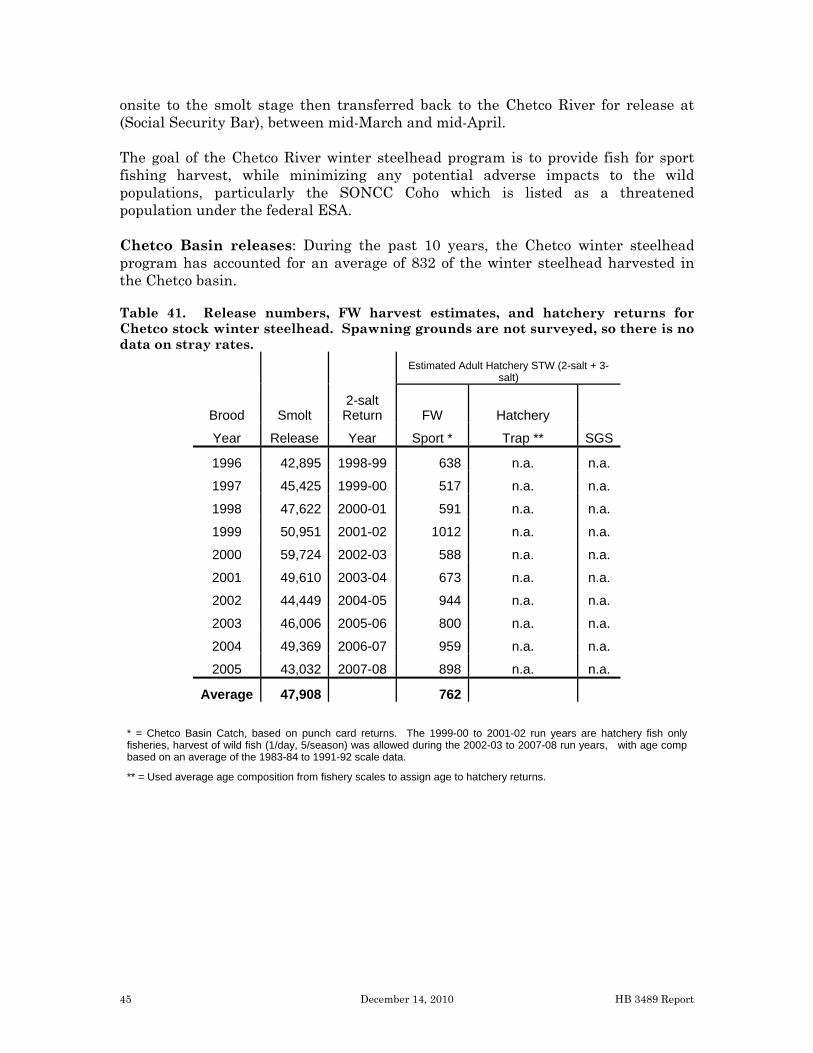
45 December 14, 2010 HB 3489 Report
onsite to the smolt stage then transferred back to the Chetco River for release at (Social Security Bar), between mid-March and mid-April. The goal of the Chetco River winter steelhead program is to provide fish for sport fishing harvest, while minimizing any potential adverse impacts to the wild populations, particularly the SONCC Coho which is listed as a threatened population under the federal ESA. Chetco Basin releases: During the past 10 years, the Chetco winter steelhead program has accounted for an average of 832 of the winter steelhead harvested in the Chetco basin.
Table 41. Release numbers, FW harvest estimates, and hatchery returns for Chetco stock winter steelhead. Spawning grounds are not surveyed, so there is no data on stray rates.
Estimated Adult Hatchery STW (2-salt + 3-
salt)
Brood Smolt 2-salt Return FW Hatchery
Year Release Year Sport * Trap ** SGS
1996 42,895 1998-99 638 n.a. n.a.
1997 45,425 1999-00 517 n.a. n.a.
1998 47,622 2000-01 591 n.a. n.a.
1999 50,951 2001-02 1012 n.a. n.a.
2000 59,724 2002-03 588 n.a. n.a.
2001 49,610 2003-04 673 n.a. n.a.
2002 44,449 2004-05 944 n.a. n.a.
2003 46,006 2005-06 800 n.a. n.a.
2004 49,369 2006-07 959 n.a. n.a.
2005 43,032 2007-08 898 n.a. n.a.
Average 47,908 762
* = Chetco Basin Catch, based on punch card returns. The 1999-00 to 2001-02 run years are hatchery fish only fisheries, harvest of wild fish (1/day, 5/season) was allowed during the 2002-03 to 2007-08 run years, with age comp based on an average of the 1983-84 to 1991-92 scale data.
** = Used average age composition from fishery scales to assign age to hatchery returns.

46 December 14, 2010 HB 3489 Report
2.1.5 ODFW Summer Steelhead Programs
2.1.5.1 Nestucca River Summer Steelhead (Stock 47) The Nestucca River stock summer steelhead brood are collected, held, and spawned at Cedar Creek Hatchery. The progeny are reared to the smolt stage onsite. Approximately 70,000 smolts are released into the Nestucca River and ~30,000 are transferred to the Wilson River for release. The goal of this program is to provide hatchery summer steelhead adults for recreational harvest in the Nestucca and Tillamook basins. In addition, the program provides educational opportunities for students and encourages volunteers. Nestucca R. and Wilson R. releases: During the past 10 years, the Nestucca summer steelhead program has accounted for an average of 619 of the summer steelhead harvested in the Nestucca Basin and 507 of the summer steelhead harvest in the Tillamook Basin.
Table 42. Release numbers, FW harvest estimates, and hatchery returns for Nestucca stock summer steelhead. Spawning grounds are not surveyed, so there is no data on stray rates.
Estimated Adult Hatchery STW (2-salt + 3-salt)
Brood Nestucca Smolt
Wilson Smolt
2-salt Return
Nestucca FW
Wilson FW
Nestucca Hatchery
Year Release Release Year Sport * Sport * Return ** SGS
1996 73,827 50,811 1998-99 418 264 606 n.a.
1997 67,997 50,201 1999-00 532 408 1,102 n.a.
1998 49,426 29,785 2000-01 441 322 984 n.a.
1999 69,467 30,298 2001-02 640 478 2,071 n.a.
2000 60,750 34,875 2002-03 648 558 2,283 n.a.
2001 62,719 41,067 2003-04 692 737 2,376 n.a.
2002 65,035 46,066 2004-05 781 775 3,159 n.a.
2003 44,241 36,253 2005-06 427 332 2,405 n.a.
2004 70,126 36,494 2006-07 437 389 920 n.a.
2005 69,837 47,091 2007-08 667 555 1,860 n.a.
Average 63,044 40,160 619 507 1,777
* = Nestucca Basin Catch, based on punch card returns. The 1997-98 to 2008-09 run years are hatchery fish only fisheries with age comp based on an average of the 1983-84 to 1991-92 scale data.
** = Used average age composition from fishery scales to assign age to hatchery returns.

47 December 14, 2010 HB 3489 Report
2.1.5.2 Siletz River Summer Steelhead (Stock 33)
This program collects hatchery summer steelhead adults from the Siletz Falls Trap for broodstock. The adults are held and spawned at Cedar Creek Hatchery. Eggs are incubated to the eyed stage at Cedar Creek and then transferred to the Salmon River Hatchery where the eggs are hatched and reared to smolt. The smolts are then transferred to the mainstem Siletz near Moonshine Park (RM 52.5) for release. The goal of this program is to provide for an average annual harvest of 2,400 hatchery summer steelhead while minimizing interactions with wild fish. Siletz R. release: During the past 10 years, the Siletz summer steelhead program has accounted for an average of 1,419 of the summer steelhead harvested in the Siletz basin. Although there is no regular survey of spawning grounds, point data from traps in Mill Creek (0-70 fish/year), Palmer Creek and Schooner Creek suggest that very few of these fish stray within the basin. The Siletz Falls trap location in the upper mainstem provides excellent attraction for fish, especially during the summer months when river conditions tend to be low and warm.
Table 43. Release numbers, FW harvest estimates, and hatchery returns for Siletz stock summer steelhead. Spawning grounds are not surveyed, so there is little data on stray rates.
Estimated Adult Hatchery STW (2-salt + 3-
salt)
Brood Smolt 2-salt Return FW Siletz Falls
Year Release Year Sport * Trap ** SGS
1996 79,770 1998-99 2,106 2,003 n.a.
1997 43,461 1999-00 1,110 1,851 n.a.
1998 81,228 2000-01 1,030 1,888 n.a.
1999 50,397 2001-02 949 2,195 n.a.
2000 77,674 2002-03 1,352 2,891 n.a.
2001 71,740 2003-04 2,240 5,140 n.a.
2002 70,993 2004-05 1,640 4,615 n.a.
2003 55,415 2005-06 1,310 2,590 n.a.
2004 72,029 2006-07 1,112 2,444 n.a.
2005 70,727 2007-08 1,343 1,271 n.a.
Average 67,343 1,419 2,689
* = Siletz Basin Catch, based on punch card returns. The 1997-98 to 2008-09 run years are hatchery fish only fisheries with age comp based on an average of the 1983-84 to 1991-92 scale data.
** = Used average age composition from fishery scales to assign age to trap returns.

48 December 14, 2010 HB 3489 Report
2.1.5.3 North Umpqua River Summer Steelhead (Stock 55) Returning adults are collected at Winchester Dam or Rock Creek Hatchery or as swim-ins to Rock Creek Hatchery. The adults are held and spawned at Rock Creek and transferred to Cole Rivers Hatchery for their first year. They are returned to Rock Creek and are primarily volitionally released from Rock Creek Hatchery. The program has in the past also released the smolts at Whistlers Bend (RM21) and Amacher Park (RM &). The goal of this program is to provide a significant number of hatchery-produced steelhead for recreational fishing in the Umpqua basin. When available, ~2,000 eggs are provided for classroom incubators as part of a STEP project to help educate school children about salmonid biology, critical life cycles, and habitat requirements North Umpqua R. release: During the past 10 years, the Umpqua summer steelhead program has accounted for an average of 1,503 of the summer steelhead harvested in the Umpqua basin.
Table 44. Release numbers, FW harvest estimates, and hatchery returns for Umpqua stock summer steelhead. Spawning grounds are not surveyed, so there is no data on stray rates.
Estimated Adult Hatchery STW (2-salt + 3-
salt)
Brood 1 yr
Smolt 2 yr
Smolt 2-salt Return FW
Winchester Dam counts
Year Release Release Year Sport * ** SGS
1996 172,584 1998-99 2,259 2,451 n.a.
1997 84,070 14,139 1999-00 1,172 1,300 n.a.
1998 105,451 23,614 2000-01 1,956 2,780 n.a.
1999 143,602 15,039 2001-02 2,228 2,287 n.a.
2000 83,427 74,937 2002-03 2,214 1,714 n.a.
2001 42,585 73,150 2003-04 1,505 2,017 n.a.
2002 33,506 91,591 2004-05 1,348 n.a.
2003 45,316 2005-06 1,061 n.a.
2004 38,462 24,852 2006-07 1,185 n.a.
2005 15,242 47,207 2007-08 762 n.a.
Average 79,881 43,179 1,503
* = Umpqua Basin Catch, based on punch card returns. The 1997-98 to 2008-09 run years are hatchery fish only fisheries with age comp based on an average of the 1983-84 to 1991-92 scale data.
** = Used average age composition from fishery scales to assign age to Winchester Dam counts.

49 December 14, 2010 HB 3489 Report
Monitoring Steelhead Stray Rates
As part of the Oregon Plan for Salmon and Watersheds, the Oregon Department of Fish and Wildlife (ODFW) initiated a project to monitor spawning winter steelhead (Oncorhynchus mykiss) in coastal Oregon streams in 2003. This project was designed to assess the yearly status and trend, presence of hatchery fish, and distribution of winter steelhead spawners in six coastal Monitoring Areas (MA) in two Distinct Population Segments (DPS). In 2008 the project was modified to assess status only at the DPS level. Given this change, ODFW can defensibly argue hatchery influence only at the monitoring area scale. In some systems (e.g. Siletz and Alsea) ODFW maintains adult traps and obtains annual point estimates of in- and out-of-basin strays for both winter and summer steelhead. However, a single trap site cannot account for the overall impacts of straying in a given basin. The pattern of straying is as important as the raw number or percentage of hatchery strays. Furthermore, it is difficult to know whether the fish caught in these traps are strays in the true sense, or whether they would have eventually returned to the site of release if given the opportunity.
2.1.6 ODFW Trout Programs
2.1.6.1 Cape Cod Rainbow Trout (Stock 72)
The goal of this program is to provide legal-sized and trophy-sized rainbow trout for release in lakes to meet statewide trout program objectives. Broodstock are maintained and eggs are collected at Roaring River Hatchery and distributed to other hatcheries as eyed eggs or fingerlings. Alsea Hatchery rears ~203,438 rainbow trout for release into Mid-Coast District and North Willamette District lakes. Production consists of 147,600 fish reared to a size of 3.0 fish/pound for release into various lakes from February to June. Trophy production consists of 55,838 fish reared to a size of 1.5 fish/pound or larger for release into various lakes from February to June. All of these fish are marked prior to release. Bandon Hatchery rears 2,800 rainbow trout for release into Coos-Coquille District lakes. Production consists of 750 fish reared to a size of 0.5 fish/pound and 1,250 fish reared to a size of 0.4 fish/pound for release into various Coos-Coquille District lakes from March to June. An additional 800 fish are reared to a size of 0.8 fish/pound for release into Bradley Lake in October. None of these fish are marked.
Elk River Hatchery rears 7,000 rainbow trout for release into South Coast District lakes. Production consists of 2,000 fish reared to a size of 3.0 fish/pound and 3,200 fish reared to a size of 2.8 fish/pound for release into various South Coast District lakes from April to August. Trophy production consists of 1,800 fish are reared to a size of 1.5 fish/pound or larger for release from April to June. None of these fish are marked.

50 December 14, 2010 HB 3489 Report
Nehalem Hatchery conducts rearing for ~83,950 rainbow trout for release into North Coast District lakes. This program also produces ~1,500 eggs for STEP classroom incubators. Production consists of 74,700 fish reared to a size of 2.8 fish/pound for release into various North Coast District lakes from March to June. An additional 7,700 fish are reared to a size of 1 fish/pound for release into various North Coast District lakes in June, July and September. Trophy production consists of 1,550 fish reared to a size of 0.5 fish/pound for release into various North Coast District lakes in mid-September. None of these fish are marked. Rock Creek Hatchery conducts rearing for ~57,600 rainbow trout for release into Umpqua District lakes. Production consists of 54,100 fish reared to a size of 2.4 fish/pound for release into various Umpqua District lakes from March to June. Trophy production consists of 3,500 fish reared to a size of 0.5 fish/pound for release into various Umpqua District lakes in late August. None of these fish are marked. Salmon River Hatchery rears ~46,500 rainbow trout for release into North Coast District and Mid-Coast District lakes. Production consists of 32,500 fish reared to a size of 3.0 fish/pound and 7,000 reared to a size of 2.0 for release into various lakes from March to April. Trophy production consists of 7,000 fish reared to a size of 1.0 fish/pound for release into various Mid-Coast District lakes in early June. 20,000 fish for release into Devil’s Lake are marked prior to release.
2.1.6.1 Fish Creek Rainbow Trout (Stock 551)
The goal of this program is to develop a hatchery broodstock similar to wild populations to minimize any potential impacts to wild populations for reseeding and angler harvest in water bodies in the North Umpqua High Cascade Basin. Wild fish are collected for broodstock from Fish Creek during the summer months and held at Rock Creek Hatchery until ready to spawn the following year. The hatchery rears 12,600 trout for stocking into various Umpqua District lakes. This program also produces 1,000 eyed eggs for Umpqua District STEP programs. Production consists of 8,600 fingerlings reared to a size of 30 fish/pound for stocking in various lakes in June and September, and 4,000 fish reared to a size of 3.0 fish/pound for stocking in Lemolo Reservoir in late August. None of these fish are marked.

51 December 14, 2010 HB 3489 Report
2.2 A Review of the Economic Aspects of Oregon Department of Fish and Wildlife Coastal Hatcheries
2.2.1 Introduction
The 75th Oregon Legislative Assembly passed House Bill 3489, which was focused on state-operated coastal hatcheries. Through legislative action in House Bill 3489, the Oregon Department of Fish and Wildlife (ODFW) was directed to develop a plan to reform operations of the hatcheries on the Oregon Coast. Aspects of this plan include broodstock and production strategies, needs assessment for hatchery infrastructure, compliance with the National Pollution Discharge Elimination System (NPDES), and disease management. The purpose of this section is to provide a framework with which to evaluate the economic impacts and benefits that these hatcheries provide to the citizens of Oregon. This review is focused on hatchery production, returns, and sport and commercial harvest of salmon, coho, steelhead, and trout. Facilities reviewed include Butte Falls, Elk River, Cedar Creek, Rock Creek, Alsea, Bandon, Salmon River, North Nehalem, and Trask River Hatcheries. For the purposes of this analysis, hatchery operations are defined as the collection of broodstock, spawning, rearing, release, and adult returns of fish stocks produced by ODFW hatchery facilities. Hatchery contributions to catch were estimated using coded wire tags that marked the fish according to their hatchery origins. In some fisheries, returned combined angling tags (punch cards) were the source of data. Ocean sampling of recreationally and commercially harvested Chinook and Coho salmon made it possible to estimate the impact on these fisheries from hatchery releases.
2.2.2 Literature Review
In the first review of hatcheries on the Columbia River, Worland, Wahle, and Zimmer (1969) estimate a net benefit of $1,917,003 in 1961 dollars from the hatchery-reared fall Chinook that are caught in the Ocean and Columbia River. The benefit to cost ratio is 2.3 to 1 when the net economic benefits are compared to the costs of operating fish hatcheries. This landmark study uses the value of $8.87 per fish to estimate the net benefits to sport anglers. This value was generated by an earlier study by Brown, Singh, and Castle (1964.) The researchers surveyed Oregon salmon and steelhead sport anglers to determine their willingness-to-pay for the ability to fish for these species.
More recently, a review of the hatcheries that are operated by the Mitchell Act found an overall benefit to cost ratio of 0.6 for the operation of hatcheries. Individual hatchery performance varied widely, however. One aspect of the benefit cost calculation that could substantially change the outcome is the survival rate of salmonids in the ocean. Survival rates are thought to be linked to ocean conditions, and complete understanding of survival outcomes and projections is not yet present in the scientific community.

52 December 14, 2010 HB 3489 Report
Passive use values that people hold for the hatchery contribution to salmon and steelhead runs could also contribute to the net benefits of hatchery releases. Bell, Huppert and Johnson (2003) find a mean willingness to pay for a high level of coho salmon enhancement of $25.39 per household to $120.50 per household for high-income respondents on the Oregon Coast. Low-income respondents were willing to pay an average of $24.48 to $78.94 for fisheries enhancements. This particular survey defined high fisheries enhancements as increases in run size of 100,000 fish each year. Respondents could have been reacting to personally held values of coho conservation for its own sake (passive use values) or the desire to fish for the species as recreation or work (use values.)
The previous hatchery review conducted by Dr. Chris Carter of ODFW in 1999 found a range of benefit-cost ratios for hatchery operations. The production of hatchery trout yielded net benefits ranging from $2,000 per 1,000 legal trout released to $9,000 per 1,000 legal trout released. This was based on an assumed catch rate of 1 fish per day in the trout fisheries and was estimated according to a range of catch rates (10% to 50% of stocked fish eventually caught by sport anglers.) Salmon and steelhead hatchery releases were estimated to have a benefit to cost ratio that varies according to the ocean survival rates of the hatchery released fish. A previous ODFW staff analysis for the Columbia River and Coastal hatcheries in 1990 was based on early to mid 80’s brood year CWT data. Trout programs had positive net benefits except for cutthroat production. Salmon and steelhead results were mixed. Although the average across hatcheries for each species (ChF, ChS, Coho, Steelhead, and Trout) was positive, some individual species/hatchery programs had costs that exceeded net benefits.
2.2.3 Economic Value Concepts Used in this Report ODFW and federal agencies fund hatcheries to generate and preserve the values that people hold for the fish species produced. Hatchery fish are intended to provide opportunities for commercial and recreational fishing as well as nonconsumptive recreational values including photography and art. There are two primary approaches to valuing fish resources. The first involves measuring the money generated in the general economy as a result of sport or commercial fishing activity. Anglers spend money associated with trips and equipment as a result of fishing opportunities. Commercial fish landings generate income for commercial fishers as well as the entities that process the fish. These cash flows ripple through the economy through the “multiplier process.” Ultimately, they increase income and employment in the sectors that serve the recreational and commercial fishing industry. A second approach to valuing a fishery involves money that never changes hands in the economy. Each person who chooses to fish for recreation participates because there is enjoyment in doing so. In most cases, some amount of money is also spent to participate in fishing. It is likely that the prices paid for fishing are equal to or smaller than the largest amount the angler would be willing to pay to participate. The difference between this “total willingness to pay” and the amount actually paid is the net economic value or “consumer surplus” or a measure of the benefits to the

53 December 14, 2010 HB 3489 Report
angler as they enjoy fishing, over and above the costs. This approach to measuring economic value is therefore called the “net economic value” approach. In most economic markets, the price is chosen to clear the market between buyers and sellers of goods and services. This means that the price the buyer wants to pay lines up with the costs of producing the product that the seller is willing to accept for the product. The price is a signal of the value of the product to society (to both buyers and sellers.) In the majority of cases, public goods such as the opportunity to catch more fish are not directly traded in economic markets. There is no price or signal to indicate the value to the public of these opportunities. If such a price existed, it would signal to the resource producer (or in some cases, the resource preserver) how much of the fishing opportunity should be provided. In the United States, the Public Trust Doctrine assigns ownership of fish and wildlife resources to the State or Federal Governments. Without a price signal, there is no indication of the value of the fishing opportunity to the public or how much should be provided. Economic analysis of the net benefits associated with fishing would therefore rely on non-market valuation techniques to estimate the value of the resource to the public. To complicate matters further, fishing opportunity is only one dimension of the value of the fishery resource. Non-use values such as existence values, ecosystem service values, or aesthetic values such as photography and art inspired by fish populations are also not traded on the free market. People value the existence of a fish species for its own sake or for the options to fish for the species in the future. Bequest values are related to the importance that is placed on passing down fish resources to the next generations. None of these values involve money changing hands, but that does not make them any less real. There is significant disagreement among economists on whether these nonuse values can be measured accurately, but these values find their expression qualitatively in environmental regulations and laws such as the federal Endangered Species Act. This net economic value approach to measuring economic values is generally the method employed in benefit cost analysis. The analysis is focused on economic surpluses created by a government project and how those surpluses compare to the cost of the project. A benefit-cost ratio is yielded from this type of analysis; any ratio over 1 indicates a project where benefits exceed costs. In this type of analysis, we can evaluate the conditions under which a project has a positive net benefit to society. This type of analysis can help decision-makers to answer the question of if/how hatcheries should be operated to benefit society within the context of overall fisheries policy and management. In contrast, a study of economic impacts is focused on monetary activity actually generated in the economy in response to a project or policy decision. Surveys measure direct levels of expenditures by recreational anglers to participate in the sport. These expenditures are processed in an input-output model such as IMPLAN to estimate the impacts on related sectors of the economy. Measures of business revenues, jobs, and personal income associated with the expenditures help decision-makers to evaluate the outcomes of programs. Through the “ripple effect” each expenditure will ultimately affect personal income through the business activity it generates. Similarly, economic activity is generated when a fish is landed and

54 December 14, 2010 HB 3489 Report
processed in the commercial fishery. The impact begins with a fish landing in the commercial fishing sector instead of the sporting equipment or tourism sector.
2.2.4 Cost Benefit Analysis Approach There are a number of variables that present a challenge when modeling the economic benefits of hatchery supplementation. These include biological and catch rate parameters that are often highly variable. ODFW staff biologists were involved in the development of economic information because it is driven by underlying assumptions about the social and biological elements of the fisheries. The economic models differ widely for trout, fall Chinook, spring Chinook, and Coho fisheries. All of the models are based on underlying values per recreational angler day and values for commercial harvest of the hatchery species. These are derived from existing economic studies and surveys. Therefore, the fist step to this analysis was to review existing studies on the value of recreational fishing per day that focus on each of the three species under review. Many studies on the net willingness to pay for a fishing trip include values per angler trip or angler day. The day estimates are then translated into the values per fish. The reader is cautioned that the values individuals hold for the fishing trip include all aspects of the trip, such as time with family and friends, time outdoors, and other elements that make trips enjoyable.
Table 45. Average value per salmon or steelhead caught in sport fisheries. LOCATION REF; DATE Average Value per Fish Caught
($) Average Value per Fish Caught (2009$)
Oregon / Washington
Olsen, Richards, and Scott; 1990
Ocean Salmon: 41.61
Coastal Salmon: 36.72
Coastal Steelhead: 64.06
Ocean Salmon: 63.25
Coastal Salmon: 55.83
Coastal Steelhead: 97.39
Rogue River Olsen, et al; 1994
Summer Steelhead: 82.00
Fall Chinook: 75.60
Winter Steelhead: 44.20
Spring Chinook: 63.60
Summer Steelhead: 124.67
Fall Chinook: 114.94
Winter Steelhead: 67.20
Spring Chinook: 96.69 Similar studies have been conducted on trout fisheries.

55 December 14, 2010 HB 3489 Report
Table 46. Average value per trout caught in sport fisheries. LOCATION REF; DATE METHOD $ per day $2009 per day
Idaho Gordon, Chapman & Bjornn; 1973
TCM 3.65
(1971)
16.48
Idaho Sorg & Loomis; 1986 TCM; CVM 25.55; 14.25
(1982)
52.72; 29.41
Montana Duffield, Loomis & Brooks; 1987
TCM 40.68 – 87.18
(1985)
75.02 – 160.77
Oregon Brown & Hay, 1987 CVM 12
(1980)
28.80
Oregon Waddington, Boyle & Cooper; (1994)
CVM 42
(1991)
62.50
USFWS Region 1 Boyle, Roach & Waddington (1998)
CVM 12
(1996)
15.58
The values per angler day are likely to differ according to the characteristics of individual fisheries. Values per angler day in this report are based on these studies, but no one study provides the exact value per angler day that can be applied to all of the trout fisheries supported by the coastal hatcheries. The analysis also includes existing hatchery production cost data. Costs per pound are evaluated for species, and combined with releases and catch rates to determine a cost/benefit ratio for each stock of fish. Estimated costs per pound in previous reports were prorated by present hatchery operation costs as they compare to past costs. In some cases, the number of fish released per pound has changed for species. In previous hatchery reviews, sport catch information was not available, so estimates were made over a range of assumed survival rates, recreational and commercial catch, and angler days. This information on harvest is available for this analysis, so the only assumptions that are necessary are those about angler days that are spent to catch the fish reported harvested. Parameters were estimated for the cost per fish and the net economic value for recreational angling for each species.
Table 47. Parameters for Economic Models - Salmon and Steelhead. Parameter Fall Chinook (13/lb) Spring Chinook
(10/lb) Steelhead Coho
Value per $19.58 $19.58 N/A $6.40

56 December 14, 2010 HB 3489 Report
Commercial Fish /1
Value Per Sport Fish – Ocean /2
$63.21 $63.21 $63.21
Value Per Sport Fish – Inland /3
$94.88 $126.50 $126.50 $63.21
Size at Release 13 per pound 10 per pound 6 per pound 15 per pound
Cost per Smolt /4
$4.39/lb/13
$0.33
$4.39/lb/10
$0.43
$4.39/lb/6
$0.72
$4.39/lb/15
$0.29
1 / Based on 1998 commercial values, preliminary
2 / Based on a value per day of $50 for ocean salmon in 1999, adjusted to 2009$ using the GDP Deflator and a catch rate of 1 per day
3 / May be too conservative for high-quality inland fall Chinook fisheries, based on a value of $75 per sport fish in 1999, adjusted to 2009$.
4 / Cost in 2007-2009 biennium were $4.34 per pound. Costs were adjusted to reflect inflation according to the Implicit Price Deflator for the Gross Domestic Product (109.764 in 2009 and 108.486 in 2008)
2.2.5 Steelhead Benefit-Cost Model
Harvest information was derived from the voluntary return of harvest cards. The total fish harvested generated a net benefit whether they were in the sport or commercial fishery. A value per fish caught was assigned to be $126.50 based on values per steelhead angler day of $20 to $70, and catch rates of 3 to 4 days per fish.

57 December 14, 2010 HB 3489 Report
Table 48. Steelhead Benefit/Cost Model
HATCHERY
Nestucca (47) -
Wilson R
Nestucca (47) -
Nestucca R
Siletz (33) -
Siletz R
Umpqua (55) - N
Fk. Umpqua
Nehalem (32) -
Necanicum R
Nehalem (32) N Fk. Nehalem
Nestucca R
(47/121) - Wilson
and Kilchis River
Nestucca R (47W) - Nestucca
R Siletz
(33W)
Alsea R (43) -
Big Elk Creek
Smolts 40,160 63,044 67,343 62,710 40,419 94,877 73,846 107,429 52,203 20,533
Total ocean harvest 0 0 0 0 0 0 0 0 0 0
Ocean commercial harvest 0 0 0 0 0 0 0 0 0 0
Ocean sport harvest 0 0 0 0 0 0 0 0 0 0
Freshwater harvest 507 619 1,419 1,503 406 1,092 2,109 1,509 1,908 201
Value of Hatchery Fish Harvest in Common Property Fisheries
Value per Commercial Fish
Value per Sport Fish - Ocean
Value per Sport Fish - Inland $126.50 $126.50 $126.50 $126.50 $126.50 $126.50 $126.50 $126.50 $126.50 $126.50
Total Value $64,136 $78,304 $179,504 $190,130 $51,359 $138,138 $266,789 $190,889 $241,362 $25,427
Cost per Smolt ($4.34/lb with 6 fish/lb) $0.73 $0.73 $0.73 $0.73 $0.73 $0.73 $0.73 $0.73 $0.73 $0.73
Total Cost $29,049 $45,602 $48,711 $545,360 $29,236 $68,628 $53,415 $77,707 $37,760 $14,852
B-C $35,087 $32,702 $130,793 $144,770 $22,123 $69,510 $213,374 $113,182 $203,602 $10,575
B/C $2.21 $1.72 $3.69 $4.19 $1.76 $2.01 $4.99 $2.46 $6.39 $1.71

58 December 14, 2010 HB 3489 Report
STEELHEAD BENEFIT/COST MODEL (CONTINUED)
HATCHERY
Alsea R (43/43W) -
N Fk. Alsea
Ten Mile (88) - Ten Mile Basin
Cow Creek 018 - S Fk. Umpqua R
Coos (37) - Coos Basin
Coquille (44/144) -
Coquille Basin
Chetco (96) - Chetco R Subtotal
Smolts 83,575 20,468 77,582 132,260 57,445 47,908
Total ocean harvest
Ocean commercial harvest
Ocean sport harvest
Freshwater harvest 2,325 209 3,233 1,533 2,360 762
Value of Hatchery Fish Harvest in Common Property Fisheries
Value per Commercial Fish
Value per Sport Fish - Ocean
Value per Sport Fish - Inland $126.50 $126.50 $126.50 $126.50 $126.50 $126.50
Total Value $294,113 $26,439 $408,975 $193,925 $298,540 $105,248 $2,753,273
Cost per Smolt ($4.34/lb with 6 fish/lb) $0.73 $0.73 $0.73 $0.73 $0.73 $0.73
Total Cost $60,452 $14,805 $56,117 $95,668 $41,551 $34,653 $753,570
B-C $233,660 $11,634 $352,857 $98,257 $256,988 $70,595 $1,999,707
B/C $4.87 $1.79 $7.29 $2.03 $7.18 $3.04

59 December 14, 2010 HB 3489 Report
2.2.6 Spring Chinook Benefit Cost Model
The benefit-cost model was applied to the Spring Chinook stocks released in the coastal hatchery system. Commercial and recreational catch estimates were derived from coded wire tag information and voluntary return of harvest cards. The fish were released at ~10 per pound with a cost of $4.34 per pound. The cost translates to $0.44 per smolt. Net economic values for a day of fishing were estimated at $63.25 in the ocean and $126.50 inland. These are based on the 1999 ODFW Hatchery Review figures with the values inflated to 2009 dollars. The value per commercial fish is based on an assumed average weight of 11 pounds per fish and recent ex-vessel prices for a commercially-caught fish.
Table 49. Spring Chinook Evaluation Model
HATCHERY Trask (34) - Trask River
Trask (34) - Wilson River
Nestucca (47) -
Nestucca River
Umpqua (55) -
Umpqua River, North
Fk. Subtotal
Smolts 101,982 145,063 116,402 316,232
Total ocean harvest 369 273 351 1,763
Ocean commercial harvest 330 241 321 1,572
Ocean sport harvest 39 32 30 191
Freshwater harvest 553 163 571 1,726
Value of Hatchery Fish Harvest in Common Property Fisheries
Value per Commercial Fish $19.58 $19.58 $19.58 $19.58
Value per Sport Fish - Ocean $63.25 $63.25 $63.25 $63.25
Value per Sport Fish - Inland $126.50 $126.50 $126.50 $126.50
Total Value $78,882.65 $27,362.28 $80,414.18 $261,199.51 $447,858.62
Cost per Smolt ($4.34/lb with 10 fish per pound) $0.44 $0.44 $0.44 $0.44
Total Cost $44,260.19 $62,957.34 $50,518.47 $137,244.69 $294,980.69
B-C $34,622.46 $(35,.595.0) $29,895.71 $123,954.82 $152,877.93
B/C 1.78 0.43 1.59 1.90

60 December 14, 2010 HB 3489 Report
2.2.7 Fall Chinook Benefit-Cost Model
The model evaluates 8 stocks of Fall Chinook releases. The net economic value for a sport fish is less than the $126.50 for a Spring Chinook, and was placed at $94.88 in inland sport fisheries. In the ocean, the value for a sport fish is estimated at $63.25. This may not be the case in select high-value inland Fall Chinook fisheries. These values are based on the ODFW hatchery review in 1999, and values have been inflated to 2009 dollars. Recent ex-vessel values have resulted in an estimate of $19.58 per commercially-caught fish.

61 December 14, 2010 HB 3489 Report
Table 50. Fall Chinook Evaluation Model.
HATCHERY
Trask (34) - Necanicum
R
Trask (34) -
Trask R Salmon
R (36) Yaquina
(146)
Coos (37) - Coos Basin
Coquille R. (44) - Coquille
R
Elk R (35) - Elk
R Chetco (96)
- Chetco Subtotal
Smolts 26,618 78,768 202,592 119,965 760,767 76,972 325,508 172,927
Total ocean harvest 169 462 1,008 932 2,847 684 2,632 464
Ocean commercial harvest 151 360 834 753 2,299 577 2,483 367
Ocean sport harvest 18 102 174 179 558 107 149 97
Freshwater harvest 31 643 932 N/A 1,169 220 1,073 200
Value of Hatchery Fish Harvest in Common Property Fisheries
Value per Commercial Fish $19.58 $19.58 $19.58 $19.58 $19.58 $19.58 $19.58 $19.58
Value per Sport Fish - Ocean $63.25 $63.25 $63.25 $63.25 $63.25 $63.25 $63.25 $63.25
Value per Sport Fish - Inland $94.88 $94.88 $94.88 $94.88 $94.88 $94.88 $94.88 $94.88
Total Value $7,036 $74,508 $115,763 $26,065 $191,223 $38,939 $159,848 $32,297 $645,680
Cost per Smolt ($4.34/lb with 13 fish/pound) $0.34 $0.34 $0.34 $0.34 $0.34 $0.34 $0.34 $0.34
Total Cost $8,886 $26,296 $67,635 $40,050 $253,979 $25,697 $108,670 $57,731 $588,944
B-C $(1,850) $48,212 $48,129 $(13,984) $(62,756) $13,242 $51,178 $(25,434) $56,736
B/C 0.79 2.83 1.71 0.65 0.75 1.52 1.47 0.56

62 December 14, 2010 HB 3489 Report
2.2.8 Coho Evaluation Model
Values per commercial fish are considered extra revenues to the vessels that would not be accrued if the hatchery releases were not in place. It is assumed throughout this analysis that vessels don’t incur additional costs to fish for hatchery fish. Angler values per day were assumed to be the same for ocean and inland fisheries. The values are based on the 1999 ODFW Hatchery Review and have been inflated to 2009 dollars. Commercial fish values are based on the most recent ex-vessel values.
Table 51. Coho Evaluation Model.
HATCHERY Nehalem (32) Fishhawk (99) Trask (34) Umpqua (55) Subtotal
Smolts 186,113 153,321 105,695
Total ocean harvest 208 519 359
Ocean commercial harvest 13 29 18
Ocean sport harvest 195 490 341
Freshwater harvest 418 370 2,959
Value of Hatchery Fish Harvest in Common Property Fisheries
Value per Commercial Fish $6.42 $6.42 $6.42
Value per Sport Fish - Ocean $63.25 $63.25 $63.25
Value per Sport Fish - Inland $63.25 $63.25 $63.25
Total Value $38,855.71 $54,581.18 $208,840.56 $302,277.45
Cost per Smolt ($4.34/lb, with 15 smolts/lb) $0.29 $0.29 $0.29
Total Cost $53,848.69 $44,360.88 $30.581.09 $128,790.66
B-C $(14,992.98) $10,220.30 $178,259.47
B/C 0.72 1.23 6.83

63 December 14, 2010 HB 3489 Report
2.2.9 Trout Evaluation Model
The review includes the three species of trout that are raised by the coastal hatcheries for release into lakes and streams. A review of the trout fisheries in the Florence area provided valuable information on the percentages of trout caught in this region. The study included three categories of lakes according to size and evaluated trout releases in 17 lakes through creel surveys. It was found that 31.2% of the trout were harvested. This is an average over all the lakes studied, but smaller lakes had higher catch rates when compared to larger lakes. It was assumed that one trout would be caught per angler day. Net economic values per fish were estimated at $25 according to the meta analysis conducted for the 1999 ODFW Hatchery Review. A factor of 1.298 brought this number up to 2009 dollars for inflation based on the GDP implicit price deflator.
Table 52. Trout Evaluation Model.
HATCHERY RAINBOW
TROUT (053) RAINBOW
TROUT (072) RAINBOW
TROUT (072T)
RAINBOW TROUT (551F)
Fish Released 45,902 111,318 315,269 7,807
Proportion Harvested 0.312 0.312 0.312 0.312
Fish Harvested 14,321 34,731 98,364 2,436
Value Per Sport Fish ($25.00 per fish x 1.298 to 2009$) $32.45 $32.45 $32.45 $32.45
Total Value $464,730 $1,127,028 $3,191,909 $79,041
Pounds of Fish Released 24,616 45,413 151,741 1,690
Cost per Pound $4.03 $4.03 $4.03 $4.03
Total Cost $99,202 $183,014 $611,516 $6,811
B-C $365,528 $944,014 $2,580,393 $72,230
B/C 4.685 6.158 5.220 11.605

64 December 14, 2010 HB 3489 Report
2.2.10 Hatchery Cost-Benefit Models
Values for the various types of stocks have been applied to hatchery release information.
Table 53. Alsea Hatchery Cost-Benefit Model
Rainbow Trout (072T)
Winter Steelhead (043& 043W) TOTAL
Fish Released 227,723 171,080
Proportion in ocean harvest 0 0
Proportion in ocean comml. harvest 0 0
Proportion in ocean sport harvest 0 0
Total ocean harvest 0 0
Ocean commercial harvest 0 0
Ocean sport harvest 0 0
Proportion in freshwater harvest 0.312 .014765
Freshwater harvest 71,050 2,526
Value of Hatchery Fish Harvest in Common Property Fisheries
Value per Commercial Fish
Value per Sport Fish - Ocean
Value per Sport Fish - Inland $ 32.45 $126.50
Total Value $2,305,558.74 $319,539.00 $2,625,097.70
Cost Operation and Maintenance $637,866.00
Annual Costs of Capital Improvement (6.61%) $42,162.94
Total Hatchery Costs in 2008 $680,028.94
Cost Adjustment to 2009$ (x 1.012) $688,189.29
B-C $1,936,908.50
B/C 3.814

65 December 14, 2010 HB 3489 Report
Table 54. Bandon Hatchery Cost-Benefit Model.
Rainbow Trout (072T)
Winter Steelhead (044 & 144) TOTAL
Fish Released 1,689 57,455
Proportion in ocean harvest 0 0
Proportion in ocean comml. harvest 0 0
Proportion in ocean sport harvest 0 0
Total ocean harvest 0 0
Ocean commercial harvest 0 0
Ocean sport harvest 0 0
Proportion in freshwater harvest 0.312 0.0132625
Freshwater harvest 527 762
Value of Hatchery Fish Harvest in Common Property Fisheries
Value per Commercial Fish
Value per Sport Fish - Ocean
Value per Sport Fish - Inland $32.45 $126.50
Total Value $17,100.11 $96,393.00 $113,493.11
Cost Operation and Maintenance $472,274.00
Annual Costs of Capital Improvement (6.61%) $31,217.31
Total Hatchery Costs in 2008 $503,491.31
Cost Adjustment to 2009$ (x 1.012) $509,533.21
B-C $(396,040.21)
B/C 0.223

66 December 14, 2010 HB 3489 Report
Table 55. Butte Falls Hatchery Cost-Benefit Model Rainbow Trout (072) TOTAL
Fish Released 28,452
Proportion in ocean harvest 0
Proportion in ocean comml. harvest 0
Proportion in ocean sport harvest 0
Total ocean harvest 0
Ocean commercial harvest 0
Ocean sport harvest 0
Proportion in freshwater harvest 0.312
Freshwater harvest 8,877
Value of Hatchery Fish Harvest in Common Property Fisheries
Value per Commercial Fish
Value per Sport Fish - Ocean
Value per Sport Fish - Inland $32.45
Total Value $288,059.43 $288,059.43
Cost Operation and Maintenance $484,580.00
Annual Costs of Capital Improvement (6.61%) $32,030.74
Total Hatchery Costs in 2008 $516,610.74
Cost Adjustment to 2009$ (x1.012) $522,810.07
B-C $(234,750.64)
B/C 0.551

67 December 14, 2010 HB 3489 Report
Table 56. Cedar Creek Hatchery Cost-Benefit Model
Rainbow Trout (072)
Rainbow Trout (072T)
Summer Steelhead (047)
Winter Steelhead (047& 047F) ChS (047) TOTAL
Fish Released 500 508 103,204 206,194 116,402
Proportion in ocean harvest 0 0 0 0 0.003015412
Proportion in ocean comml. harvest 0 0 0 0 0.002757685
Proportion in ocean sport harvest 0 0 0 0 0.000257728
Total ocean harvest 0 0 0 0 408
Ocean commercial harvest 0 0 0 0 321
Ocean sport harvest 0 0 0 0 30
Proportion in freshwater harvest 0.312 0.312 .0109104 0.0142826 0.004905414
Freshwater harvest 156 158 1,126 2,945 571
Value of Hatchery Fish Harvest in Common Property Fisheries
Value per Commercial Fish $19.58
Value per Sport Fish - Ocean $63.25
Value per Sport Fish - Inland $32.45 $32.45 $126.50 $126.50 $126.50
Total Value $5,062.20 $5,143.20 $142,439.00 $372,542.50 $80,414.18 $605,601.08
Cost Operation and Maintenance $525,119.00
Annual Costs of Capital Improvement (6.61%) $34,710.37
Total Hatchery Costs in 2008 $559,829.37
Cost Adjustment to 2009$ (x 1.012) $566,547.32
B-C $45,771.71
B/C 1.069

68 December 14, 2010 HB 3489 Report
Table 57. Elk River Hatchery Cost-Benefit Model
Rainbow Trout (072T)
Winter Steelhead (096) ChF (035) ChF (096) TOTAL
Fish Released 1,199 47,908 325,508 172,927
Proportion in ocean harvest 0 0 0.0080858 0.0026832
Proportion in ocean comml. harvest 0 0 0.007628 0.0021222
Proportion in ocean sport harvest 0 0 0.0004577 0.0005609
Total ocean harvest 0 0 2,632 464
Ocean commercial harvest 0 0 2,483 367
Ocean sport harvest 0 0 149 97
Proportion in freshwater harvest 0.312 0.0159054 0.0032963 0.0011623
Freshwater harvest 374 762 1,073 201
Value of Hatchery Fish Harvest in Common Property Fisheries
Value per Commercial Fish $19.58 $19.58
Value per Sport Fish - Ocean $63.25 $63.25
Value per Sport Fish - Inland $32.45 $126.50 $94.88 $94.88
Total Value $12,139.16 $96,393.00 $159,847.63 $32,391.99 $300,771.78
Cost Operation and Maintenance $681,040.00
Annual Costs of Capital Improvement (6.61%) $45,016.74
Total Hatchery Costs in 2008 $726,056.74
Cost Adjustment to 2009$ (x 1.012) $734,769.42
B-C $(433,997.64)
B/C 0.409

69 December 14, 2010 HB 3489 Report
Table 58. Nehalem Hatchery Cost-Benefit Model
Rainbow
Trout (072) Winter Steelhead
(032 & 099) Coho (032 &
099) ChF (034) TOTAL
Fish Released 82,366 135,296 186,113 26,618
Proportion in ocean harvest 0 0 0.0011176 0.0063866
Proportion in ocean comml. harvest 0 0 0.0000698 0.0057104
Proportion in ocean sport harvest 0 0 0.0010477 0.0006762
Total ocean harvest 0 0 208 170
Ocean commercial harvest 0 0 13 152
Ocean sport harvest 0 0 195 18
Proportion in freshwater harvest 0.312 0.011072 0.0022566 0.0011646
Freshwater harvest 25,698 1,498 420 31
Value of Hatchery Fish Harvest in Common Property Fisheries
Value per Commercial Fish $6.42 $19.58
Value per Sport Fish - Ocean $63.25 $63.25
Value per Sport Fish - Inland $32.45 $126.50 $63.25 $94.88
Total Value $833,906.33 $189,497.00 $38,982.21 $7,055.94 $1,069,441.40
Cost Operation and Maintenance $636,019.00
Annual Costs of Capital Improvement (6.61%) $42,040.86
Total Hatchery Costs in 2008 $678,059.86
Cost Adjustment to 2009$ (x 1.012) $686,196.57
B-C $383,244.50
B/C 1.558

70 December 14, 2010 HB 3489 Report
Table 59. Rock Creek Hatchery Cost-Benefit Model
Rainbow Trout (053)
Rainbow Trout (072T)
Rainbow Trout (551F)
Summer Steelhead (055) Coho (018) ChS (055) TOTAL
Fish Released 8,017 56,354 7,807 62,710 105,695 316,232
Proportion in ocean harvest 0 0 0 0 0.0034249 0.005575
Proportion in ocean comml. harvest 0 0 0 0 0.0001703 0.004971
Proportion in ocean sport harvest 0 0 0 0 0.0032262 0.0006039
Total ocean harvest 0 0 0 0 362 1,763
Ocean commercial harvest 0 0 0 0 18 1,572
Ocean sport harvest 0 0 0 0 341 191
Proportion in freshwater harvest 0.312 0.312 0.312 0.023967469 0.0279956 0.005458
Freshwater harvest 2,501 17,582 2,436 1,503 2,959 1,726
Value of Hatchery Fish Harvest in Common Property Fisheries
Value per Commercial Fish $6.42 $19.58
Value per Sport Fish - Ocean $63.25 $63.25
Value per Sport Fish - Inland $32.45 $32.45 $32.45 $126.50 $63.25 $126.50
Total Value $81,167.31 $570,550.44 $79,041.19 $190,129.50 $206,943.06 $261,199.51 $1,389,031.00
Cost Operation and Maintenance $835,840.00
Annual Costs of Capital Improvement (6.61%) $55,249.02
Total Hatchery Costs in 2008 $891,089.02
Cost Adjustment to 2009$ (x 1.012) $901,782.09
B-C $487,248.91
B/C 1.540

71 December 14, 2010 HB 3489 Report
Table 60. Salmon River Hatchery Cost-Benefit Model
Rainbow Trout (053)
Rainbow Trout (072T)
Summer Steelhead (033) ChF (036) TOTAL
Fish Released 37,885 27,796 67,343 202,592
Proportion in ocean harvest 0 0 0 0.0049755
Proportion in ocean comml. harvest 0 0 0 0.0041166
Proportion in ocean sport harvest 0 0 0 0.0008588
Total ocean harvest 0 0 0 1,008
Ocean commercial harvest 0 0 0 834
Ocean sport harvest 0 0 0 174
Proportion in freshwater harvest 0.312 0.312 0.0210712 0.0046003
Freshwater harvest 11,820 8,672 1,419 932
Value of Hatchery Fish Harvest in Common Property Fisheries
Value per Commercial Fish $19.58
Value per Sport Fish - Ocean $63.25
Value per Sport Fish - Inland $32.45 $32.45 $126.50 $94.88
Total Value $383,562.89 $281,417.82 $179,503.50 $115,763.38 $960,247.59
Cost Operation and Maintenance $546,730.00
Annual Costs of Capital Improvement (6.61%) $36,138.85
Total Hatchery Costs in 2008 $582,868.85
Cost Adjustment to 2009$ (x 1.012) $589,863.28
B-C $370,384.31
B/C 1.627

72 December 14, 2010 HB 3489 Report
Table 61. Trask Hatchery Cost-Benefit Model
Winter Steelhead (121F) Coho (034) ChF (034) ChS (034) TOTAL
Fish Released 46,226 153,321 78,768 247,045
Proportion in ocean harvest 0 0.003385 0.0058653 0.0025987
Proportion in ocean comml. harvest 0 0.0001891 0.0045703 0.0023113
Proportion in ocean sport harvest 0 0.0031959 0.0012949 0.0002873
Total ocean harvest 0 519 462 642
Ocean commercial harvest 0 29 360 571
Ocean sport harvest 0 490 102 71
Proportion in freshwater harvest 0.0145589 0.0024132 0.0081632 0.0028982
Freshwater harvest 673 370 643 716
Value of Hatchery Fish Harvest in Common Property Fisheries
Value per Commercial Fish $6.42 $19.58 $19.58
Value per Sport Fish - Ocean $63.25 $63.25 $63.25
Value per Sport Fish - Inland $126.50 $63.25 $94.88 $126.50
Total Value $85,134.5 $54,581.18 $74,508.14 $106,244.93 $320,468.75
Cost Operation and Maintenance $577,748.00
Annual Costs of Capital Improvement (6.61%) $38,189.14
Total Hatchery Costs in 2008 $615,937.14
Cost Adjustment to 2009$ (x 1.012) $623,328.39
B-C $(302,859.64)
B/C 0.514

73 December 14, 2010 HB 3489 Report
2.2.11 References
Bell, KP, Daniel Huppert, and Rebecca Johnson (2001) Willingness to Pay for Local Coho Salmon Enhancement in Coastal Communities. Marine Resource Economics 18, 15-21.
Boyle, K; Roach, B; Waddington, D (1998) 1996 Net Economic Values for Bass, Trout and Walleye Fishing, Deer, Elk and Moose Hunting, and Wildlife Watching. Addendum to the 1996 National Survey of Fishing, Hunting and Wildlife-Associated Recreation. U.S. Fish and Wildlife Service Report 96-2.
Brown, WG; AK Singh, and EN Castle (1965): An economic evaluation of the Oregon salmon and steelhead sport fishery. Journal of Wildlife Management 22(9), 266-279. (Tech. Bull. No. 78, Agricultural Experiment Station, Oregon State University, Corvallis)
Brown, G; Hay, M (1987): Net Economic Values for Deer and Waterfowl Hunting and Trout Fishing, 1980. U.S. Fish and Wildlife Service Working Paper No. 23.
Duffield, J; Loomis, J; Brooks, R (1987): The Net Economic Value of Fishing in Montana. Montana Department of Fish, Wildlife and Parks. August, 1987.
Gordon; Chapman, DW; Bjornn, TC (1973): Economic evaluation of sport fisheries- What they mean. Trans. Amer. Fish. Soc. 2, 293-311.
Olsen, Darryll, Jack Richards, and R. Douglas Scott. 1991. Existence and Sport Values for Doubling the Size of Columbia River Basin Salmon and Steelhead Runs. Rivers 2(1):44-56
Olsen, D; Richards, J; Scott RD (1990): A study of existence and sport values for doubling the size of the Columbia River basin salmon and steelhead runs. Columbia River and Tributaries study-73, North Pacific Division, U.S. Army COE, Portland, OR.

74 December 14, 2010 HB 3489 Report
Olsen, D; Richards, J; Carter, C; Jones, R; Baxter, R (1994): Rogue River sport fisheries economic valuation study progress report. The Rogue Valley Council of Governments, Oregon Dept. of Fish & Wildlife, U.S. BLM, U.S.D.A. Forest Service..
Sorg, CF; Loomis, JB (1986): Economic valuation of Idaho sport fisheries with an update on valuation techniques. North American Journal of Fisheries Management 6, 494-503.
Waddington, Boyle & Cooper; (1994): 1991 Net Economic Values for Bass, and Trout Fishing, Deer Hunting, and Wildlife Watching. Addendum to the 1991 National Survey of Fishing, Hunting and Wildlife-Associated Recreation. U.S. Fish and Wildlife Service Report 91-1.
Worlund, D.D., R.J. Wahle, and P.D. Zimmer (1969): Contribution of Columbia River hatcheries to harvest of fall Chinook salmon (Onchorhyncus tshawytscha). U.S. Fish and Wildlife Service Fisheries Bulletin 67: 361-391.

75
2.3 Coastal Hatcheries General Evaluation
2.3.1 Alsea Hatchery Evaluation
Alsea Hatchery is a diverse production facility. The hatchery utilizes a variety of raceways, circular tanks and adult trapping / brood ponds. There are two adult traps located on the grounds which are vital in collecting winter steelhead brood stock, limiting passage of hatchery steelhead into natural habitat upstream from the hatchery, monitoring hatchery winter steelhead returns and returns of wild steelhead and coho and Chinook salmon. The hatchery also assists the Oregon Hatchery Research Center at Fall Creek in research projects.
Alsea Hatchery provides the district with approximately 225,000 legal or larger rainbow trout for stocking in 22 coastal district lakes with minimal impacts to wild fish. These releases provide for very popular fisheries from Newport down to Florence and provide many residents and tourists with excellent angling opportunities. The hatchery also provides rainbow trout for several Willamette Valley and North Coast water bodies. The hatchery supports several stocks of winter steelhead which are stocked into the Alsea (120,000), Yaquina (20,000) and Siletz (50,000) rivers. These hatchery winter steelhead smolt releases provides anglers with excellent boat and bank angling opportunities from December through April. These are very popular fisheries and support a large contingent of anglers. Production goals are consistently met each year for all steelhead and rainbow stocks.
Passage/Screening Passage Selective Barrier On the Alsea, a concrete dam at intake located one-quarter mile upstream from the Hatchery is a barrier. A new fish ladder and sorting facility has been installed, which created a selective barrier. Wild winter steelhead, wild coho, wild fall Chinook and wild spring Chinook adults that enter the upper trap are passed upstream. Screening Fish screening criteria by the NOAA Fisheries for anadromous salmonids is for a perforated plate opening not to exceed 3/32 inch in diameter or a woven wire opening not to exceed 3/32-inch measured diagonally. The screening at Alsea Hatchery is 3/16-inch and does not meet NOAA Fisheries criteria. Legal Mandates and Commitments Legal Commitments/Treaty Obligations Alsea Hatchery has no legal, mitigation, or treaty obligations. There is research associated with this facility in collaboration with the Oregon Hatchery Research Center located at Fall Creek (Alsea). This research evaluates various performance attributes and treatments of both the rainbow trout and winter steelhead broodstocks from Alsea Hatchery.

76 December 14, 2010 HB 3489 Report
At the Alsea Hatchery, there are four propagation programs for this district: rainbow trout for stocking in coastal lakes, winter steelhead for the Alsea (two broodstocks), winter steelhead for the Yaquina and winter steelhead for the Siletz. HGMPs have been completed for all of these programs. Salmon Trout Enhancement (STEP) Program
• Alsea Wild Winter Steelhead Program (75,000 eggs) - STEP volunteers angling for broodstock
• Classroom Incubator Program - Eggs provided to 10 schools for classroom teaching units
• Stream Enrichment Program - Watershed Councils, schools and other volunteers participate
There is some peripheral STEP involvement; there will be minor impacts to the program if this facility closes.
2.3.2 Bandon Hatchery Evaluation
Bandon Hatchery is very unique in that production poundage is lower than most facilities, but egg production, distribution and diversity is very high. Currently nine different stocks of fish and/or eggs are handled at Bandon Hatchery. In the past several years, the hatchery was integral in several short-term conservation programs. For example, Floras Creek coho were collected, spawned, eggs incubated and transferred to a STEP hatchbox project for a three-year period. This program resulted in coho fry releases in sections of the stream determined to be suitable for supplementation. All hatchery programs in the Coos, Coquille, and Tenmile basins are dependent upon Bandon Hatchery. Past attempts at incubating eggs at various STEP facilities has not proved practical or cost effective. Additionally, the water supply at Bandon Hatchery is extremely reliable, and includes a state-of-the-art alarm system. Passage/Screening Passage Selective Barrier A pipe weir across Ferry Creek diverts fish up a short fishway into a collection pond. Some fish have passed the weir on extremely high water. This is not a concern since the intake dams are complete barriers. Fish are sorted and selectively put above the weir into the two short sections of creek that have good available spawning habitat.
Complete Barrier No anadromous fish can pass the two reservoir dam spillways. There are resident cutthroat in the reservoirs and upper creeks. Disease risk will increase with consideration of passage accommodation at the dams.
Screening Each intake is a 4-foot by 4-foot by 12-foot tower with 1/8-inch perforated aluminum screen on three sides of the tower. The water depth varies, but averages 10 feet

77 December 14, 2010 HB 3489 Report
deep. Because of the design and location, there is extremely low water velocity at the screens (1/8-inch per second). The reservoir water flow is usually near zero unless the creeks are at flood stage. The perforation size of the intake screens does not currently meet NOAA Fisheries criteria (3/32” openings); however this affects only resident fish, since anadromous fish cannot pass above the dams. Legal Commitments/Treaty Obligations Bandon Hatchery does not operate through any specific legal, mitigation, research studies, or treaty commitments. Fall Chinook production at Bandon Hatchery does contribute to the broad state commitments to the Pacific Salmon Treaty. There are easements for both the City of Bandon and cranberry growers to operate pump houses and pipelines. As stated above, there is a reversion clause for the land. Essentially, the clause states that in the event that ODFW discontinues fish rearing at the Bandon Hatchery, a significant portion of the land would revert back to the heirs of the original owners. About 15 years ago, there was an attempt by the heirs to obtain the land as a result of Bandon Hatchery being operated as a private facility for a few years in the early 1980s. An ODFW agreement with the private company provided for steelhead smolts to be reared in exchange for use of the facility. This fulfilled the obligation for rearing fish, and avoided implementation of the reversion clause.
Salmon Trout Enhancement Program (STEP) Bandon Hatchery is very much integral to local STEP projects, not only with regard to incubating eggs, but also assisting with facilities, brood collection and cooperative projects. No other ODFW hatchery has as high a level of involvement in so many different projects. Very substantial reductions to the STEP program in the Coos/Coquille/Tenmile District would result if the facility did not operate. Volunteers and agency staff have cooperatively constructed and operated five hatcheries and 19 acclimation sites over the past several years. The estimated capital investment (as of 2006) towards these STEP facilities was 2.5 million dollars. Volunteers expend thousands of dollars annually to operate these satellite stations. All eggs and many of the fish releases have their origin at Bandon Hatchery and its role in eyeing eggs for these diverse programs is instrumental to the perpetuation of these programs. Many of the programs include the use of a substantial number of naturally-produced adult salmonids for broodstock, and produce fish to augment existing fisheries.
• Stream Enrichment Program - Spawned carcasses (winter steelhead, coho, and fall Chinook) from
Bandon Hatchery are placed in a number of Coquille watershed streams.
• Hatchbox/Unfed Fry Program - Most of the hatchbox/unfed fry programs conducted in the district are
supplementation or habitat “jumpstart” projects. Volunteer cooperators receive eggs from Bandon Hatchery and produce unfed fry.

78 December 14, 2010 HB 3489 Report
• Classroom Incubator Program - Some eggs produced at Bandon Hatchery are also transferred to
classroom incubators. These projects are a popular educational tool. A total of 11 incubators were used in 12 different schools (2009 Annual District STEP Report).
2.3.3 Butte Falls Hatchery Evaluation
At full production Butte Falls Hatchery annually supplies over 750,000 rainbow trout, salmon and steelhead to benefit anglers in Southwest Oregon. Under normal operations production consists of 100,000 fall Chinook salmon smolts, 192,500 coho salmon smolts, 402,500 fingerling rainbow trout, and 77,120 legal rainbow trout. The diversity of production at the hatchery has benefited the Coquille and Umpqua watersheds with salmon and steelhead releases, along with trout releases targeting Coos County, Curry County, and some Rogue Valley waterbodies. Butte Falls Hatchery is ready to resume full production in 2010 after an outbreak of infectious hematopoietic necrosis virus (IHNV) occurred at the hatchery in 2006. It is believed that wild adult fish carrying IHNV that swam above the hatchery intake caused the viral outbreak. Butte Falls Hatchery has been virus free for three consecutive years, and is cleared for full production per ODFW Fish Health Management Policy this year. Program changes will mean somewhat different numbers and stocks of fish for future production at the hatchery. Prior to 2006 Butte Falls Hatchery regularly met production goals, and was the highest ranked facility among the nine coastal hatcheries, with top scores in economic analyses, passage and screening, and conservation ranking. The issue of fish passage and disease risk at the facility is discussed in more detail below. A key fact is that the occurrence of IHNV at Butte Falls Hatchery appears to be a relic of record returns of winter steelhead in the Rogue River at the turn of the century. Fish counting began at Gold Ray Dam in 1942. The top three returns of winter steelhead (hatchery and wild) recorded since 1942 occurred 2002-2004. Focusing on wild fish only, these years still remain among the highest returns ever recorded at Gold Ray: 2003—15,558 (3rd highest return); 2004—14,293 (6th highest return); 2002—11,046 (13th highest return). ODFW estimated that total returns to the river during three run years 1977/78-1979/80 averaged 43,000 wild winter steelhead (Effects of Lost Creek Dam on Winter Steelhead of the Rogue River, Phase 2 Completion Report, ODFW 1990); during this time the count of wild winter steelhead over Gold Ray Dam ranged between 4,226 and 6,783 fish. The bottom line is that winter steelhead were present in the watershed at very high levels at the time of the outbreak.

79 December 14, 2010 HB 3489 Report
Passage
A. Passage in the watershed A falls on South Fork Big Butte Creek is the namesake for the town of Butte Falls, Oregon. The falls is located at approximately rivermile 1.5, and the hatchery at approximately rivermile 2.5. Historical reports refer to the falls as a 15 foot drop. A habitat survey of the South Fork Big Butte completed by ODFW estimated the height of the falls at 3.5 meters/11.5 feet (1997 ODFW Aquatic Inventory Project Stream Report). Anadromous fish must pass Butte Falls in order to reach the upper South Fork and the hatchery water supply
Falls on South Fork Big Butte Creek
ODFW considered the falls a barrier to anadromous distribution for many years. Minor modifications have occurred over time, but passage of adult salmonids is still thought to occur primarily when flow conditions are ideal for passage. ODFW operated a downstream migrant smolt trap on South Fork Big Butte Creek to evaluate the level of anadromous fish production above the falls in 1999-2001. Despite operating the trap an average of 111 days each year, the total catch of steelhead ranged from 19-32 steelhead smolts and 48-106 smaller steelhead. Some coho fry were captured in 1999, and some coho smolts were captured in 2000. Based on the survey, the district determined that only a low level of production of steelhead occurs on the South Fork above the falls, and only periodic, minor coho production
B. Passage at the hatchery

80 December 14, 2010 HB 3489 Report
All native migratory fish species present in South Fork Big Butte Creek have excellent year-round opportunities to migrate by Butte Falls Hatchery. The investment in a new intake facility in 2003 ensures that the hatchery is in compliance with passage criteria. Screening
Currently there is a new screening and downstream migrant bypass facility at the hatchery intake structure. The investment was funded by the Restoration and Enhancement Program. It meets current NOAA Fisheries standards for fish screening and downstream migrant bypass.
Legal Mandates and Commitments
Legal Commitments/Treaty Obligations Before the 2006 IHNV outbreak, Butte Falls Hatchery fulfilled some of the mitigation obligations for Douglas County’s FERC License for lost coho habitat in the South Umpqua Basin. Fall Chinook production at Butte Falls hatchery also contributed to the broad state commitments to the Pacific Salmon Treaty.
Salmon Trout Enhancement (STEP) Program Prior to the 2006 IHNV outbreak Butte Falls Hatchery STEP commitments were as follows:
• Hatchbox programs for Coquille Basin fall Chinook and Umpqua Basin coho • Classroom incubator program for the Coquille and South Umpqua basins
2.3.4 Cedar Creek Hatchery Evaluation
Cedar Creek Hatchery provides production of ~110,000 spring Chinook, ~190,000 winter steelhead, and ~100,000 summer steelhead smolt for harvest in popular inland mark select sport fisheries on the North Coast, as well as sport and commercial ocean fisheries. The hatchery also provides spawning and rearing for important STEP programs such as the ~100,000 smolt Nestucca Anglers Rhoades Pond Fall Chinook Program. The hatchery regularly meets production goals for most stocks but has fallen below production needs for STEP fall Chinook in some years. The STEP fall Chinook broodstock collection partially relies upon fish collected by volunteer anglers to meet these production needs.
Passage/Screening Passage Selective Barrier When the weir panels on Three Rivers are in the upright position, the weir is a complete barrier to upstream adult/juvenile migration and downstream adult migration. Volitional adult fish passage occurs at high flows when the hydraulic

81 December 14, 2010 HB 3489 Report
barrier drops for safety reasons and during some other periods (primarily in the fall) when hatchery fish are generally not present in the system and the weir can be lowered Unmarked fall Chinook, winter steelhead, coho, chum, and cutthroat trout caught in the hatchery trap are manually passed up stream, The Coastal Spring Chinook Conservation Plan will address passage of unmarked spring Chinook above the hatchery weir. Unmarked summer steelhead are rare in the Three Rivers as they are considered to be not indigenous to the Nestucca Basin. The weir at the moth of Cedar Creek is a complete barrier to adult and juvenile upstream passage, but Cedar Creek is considered to be primarily a cutthroat trout stream. There are no barriers associated with the Rhoades Pond STEP program. Screening Fish screening on Three River and the primary water intakes on Cedar Creek are NOAA compliant. Auxiliary water supplies on Cedar Creek and the Rhoades Pond STEP facility are NOAA compliant. Legal Mandates and Commitments Legal Commitments/Treaty Obligations For winter steelhead on the Nestucca River, Cedar Creek is directed by OAR 635-500-5400 to: • Transition from the current non-local broodstock, to a local broodstock within an
interim period. • Maintain hatchery release of 110,000 smolts per year.
ODFW is in the process of completing the review of the two stocks relative to stray rates, fishery contribution, residualism, and other factors. Initial results suggest that the locally-derived wild broodstock steelhead out-performed the old Nestucca Hatchery stock relative to the performance metrics. The current program reflects the transition to use of mostly wild broodstock; however, Nestucca hatchery stock are still being utilized to provide angler opportunity early in the season (December-January). Final review of the program will likely occur concurrent with development of the Coastal Winter Steelhead Conservation Plan scheduled to begin in 2010.
Salmon Trout Enhancement Programs (STEP) Cedar Creek Hatchery is integral to the local STEP program. Current STEP commitments are as follows: • Fry for Nestucca Anglers fall Chinook rearing project at Rhoades Pond.
- Volunteers rear ~100,000 fall Chinook smolts for release into the Nestucca Basin
- Volunteers assist hatchery staff in collecting adults - Cedar Creek Hatchery staff hold and spawn adults - Cedar Creek Hatchery staff incubate and start fry on feed - Fish transferred to Rhoades Pond for rearing, marking, and release by STEP
volunteers. • Hatchbox program
- Fall Chinook (2 volunteers – ~50,000 eggs)

82 December 14, 2010 HB 3489 Report
- Spring Chinook (2 volunteers – ~65,000 eggs) • Classroom Incubator Program
- Eggs provided to several schools for classroom teaching units – ~1,500 +/- steelhead eggs, varies yearly with school/teacher involvement.
• Wild Winter Steelhead Program - Volunteers collect adults and deliver to hatchery - Cedar Creek Hatchery staff spawn, incubate, and rear the fish to smolt.
• Stream Enrichment Program - Cedar Creek Hatchery provides spring Chinook, fall Chinook, winter
steelhead, and summer steelhead carcasses for stream enrichment. - Watershed councils, schools, and other volunteers participate
2.3.5 Elk River Hatchery Evaluation
Elk River Hatchery annually produces 325,000 fall Chinook smolts for release in Elk River, 150,000 fall Chinook smolts for release in Chetco River, 50,000 winter steelhead smolts for release in the Chetco River, and 7,000 rainbow trout (6,200 legal, 800 trophy) for release into local lakes and ponds. The Elk River fall Chinook production goal is consistently met. Releases are directly into Elk River with primary objectives to 1) act as an indicator stock for Mid-Oregon Coast Chinook salmon in PST managed fisheries, 2) provide for a robust ocean terminal fishery in the Port Orford area, and 3) provide for a highly utilized recreational in-river fishery. Contribution to fisheries, based on coded-wire tag recoveries, averages 3,705 adults per brood. Approximately 67% are harvested in Oregon fisheries, primarily the commercial ocean terminal and in-river recreational fisheries. On average, approximately 59% of the naturally spawning fall Chinook in Elk River are of hatchery origin. The presence of such large numbers of naturally spawning hatchery fall Chinook has the potential to affect the productivity, and long-term viability, of the wild fall Chinook population. The Chetco River fall Chinook production goal is consistently met. Releases are directly into Chetco River. Historically the primary objective of the program was to supplement PFMC managed ocean fisheries. With the adoption of restrictive KMZ regulations beginning in 1991 the primary objectives were revised to 1) provide for a late season ocean terminal fishery in the Brookings area, and 2) provide for a highly utilized recreational in-river fishery. Contribution to fisheries, based on coded-wire tag recoveries (ocean) and punch cards (in-river) averages 665 adults per brood of which 80% are harvested in Oregon fisheries. On average, approximately 14% of the naturally spawning fall Chinook in the Chetco River are of hatchery origin. In recent years effort has been made to identify a logistically feasible acclimation site with the objectives being to increase the contribution to the fishery in the lower river, and reduce the proportion of hatchery-produced Chinook in the natural spawning population. Successful implementation of an acclimation site would potentially allow for an increase in production.

83 December 14, 2010 HB 3489 Report
The winter steelhead production goal has been met most years. Releases are directly into the Chetco River. The objective of the program is to supplement a popular winter steelhead fishery on the Chetco River. Contribution to the fishery, based on punch cards, averages 762 adults per brood. On average, approximately 14% of the naturally spawning winter steelhead in Chetco River are of hatchery origin (2003-2008 spawning surveys). The program has not met production goals several times in recent years due to higher than expected mortality in the raceways. Additional bird netting has been installed and additional grading implemented in order to address the presumed causes of the shortfall. Passage/Screening Passage No barrier exists to divert adults into the trap. Unmarked coho, unmarked chum, and unmarked steelhead collected in the hatchery trap are released. All marked coho and steelhead collected in the hatchery trap are destroyed. All Chinook are retained for broodstock. Screening Fish screening criteria by NOAA Fisheries for anadromous salmonids is for a perforated plate opening not to exceed 3/32 inch in diameter, or a woven wire opening not to exceed 3/32-inch measured diagonally, from April through October. The intake screening at Elk River Hatchery is 1/8-inch and does not meet NOAA Fisheries criteria; however, use of smaller mesh would be impractical given the nature of suspended debris in Elk River during freshet events. Legal Mandates and Commitments Legal Commitments/Treaty Obligations Elk River Hatchery operates through specific legislative direction to maintain an Oregon coastal salmon hatchery (ORS 506.213). The Elk River fall Chinook stock is a candidate indicator stock for U.S./Canada Treaty. Elk River Hatchery contributes towards broad state commitments in the local area. ODFW maintains and operates Elk River hatchery specifically to augment salmon fisheries in the Elk River, Chetco River, and Oregon ocean commercial and recreational fisheries. Elk River stock is a candidate exploitation rate indicator (ERI) stock for a proposed mid-Oregon Coast (MOC) Chinook aggregate (pending adoption by the Pacific Salmon Commission). The MOC includes coastal Chinook stocks from the Umpqua south to Elk River. The use of Elk River Chinook as an ERI stock allows annual estimates of the impacts of U.S.-Canada Salmon Treaty fisheries, both aggregate abundance-based management (AABM) and individual stock-based management (ISBM) fisheries, on MOC Chinook stocks and post-season assessment of management success at meeting escapement goals for MOC indicator stock basins. The U.S.-Canada Salmon Treaty requires that only stocks with a history of at least 20 years releasing a minimum of 200,000 marked smolts may be

84 December 14, 2010 HB 3489 Report
used as an indicator stock. Elk River stock was chosen as an ERI stock because of its similarity to other MOC Chinook stocks, the presence of a hatchery, and small size of the Elk River Basin. Due to its use as an indicator stock, estimates have been made for all Chinook returning to the Elk River system since 1986. Closure of Elk River Hatchery will result in the loss of this valuable program. Salmon Trout Enhancement (STEP) Program Elk River Hatchery is integral to the local STEP program. Current STEP commitments are as follows:
• Classroom Incubator Program o Eggs provided to six schools for classroom teaching units – ~2,200 +/-
fall Chinook eggs and 600 winter steelhead eggs. • Chetco Fall Chinook Program
o Volunteers assist with collection (seining) of broodstock for delivery to Elk River Hatchery
o Volunteers assist with experimental acclimation projects. In 2006 10,000 Chinook smolts were acclimated in Ferry Creek Reservoir.
• Chetco Winter Steelhead Program o Volunteers assist with collection (angling) of broodstock for delivery to
Elk River Hatchery • Stream Enrichment Program
o Elk River Hatchery provides fall Chinook carcasses for stream enrichment in Elk, Chetco, Euchre, and Brush Creek watersheds.
o Watershed councils, schools, and other volunteers participate • Wilderness Lakes Fish Stocking Program.
o Elk River Hatchery provides surplus Chetco winter steelhead for stocking Babyfoot and Vulcan lakes.
o Volunteers assist with stocking.
2.3.6 North Nehalem River Hatchery Evaluation North Nehalem Hatchery annually produces ~100,00 coho salmon smolts for release into the NF Nehalem River, ~130,000 winter steelhead smolts for release into the NF Nehalem and Necanicum Rivers, and ~25,000 fall Chinook for release into the Necanicum River, and ~83,950 trout for release into North Coast lakes. Nehalem Hatchery also provides rearing services for Trask Hatchery coho. Production goals for these programs are consistently met. Coho salmon production at NF Nehalem has been decreased to 100,000 over the recent past in order to meet objectives identified in the Oregon Coastal Coho Conservation Plan. The current production level of hatchery coho continues to provide important ocean sport and commercial angling opportunities. Releases of winter steelhead into the North Fork Nehalem provide for a popular recreational in-river fishery. The hatchery has provides a disabled anger platform that is highly utilized by the disabled community to catch hatchery coho and hatchery steelhead. Production of fall Chinook comes from Trask (34) stock fall Chinook from Trask Hatchery. Releases of fall Chinook into the Necanicum provide a small fishery for Chinook in the Necanicum basin. The rainbow trout production is consistently met and is the primary provider of stocked rainbow trout in North Coast lakes.

85 December 14, 2010 HB 3489 Report
Passage/Screening Passage Limited Barrier There are no barriers associated with North Nehalem Hatchery. Screening Nehalem River Hatchery is 1/8-inch and does not meet NOAA Fisheries criteria. Legal Mandates and Commitments
Legal Commitments/Treaty Obligations North Nehalem River Hatchery has no legal, mitigation, or treaty obligations. Salmon Trout Enhancement Program (STEP)
• Classroom incubators: 500 +/- steelhead eggs, varies yearly with school/teacher involvement.
Stream Enrichment Program
• North Nehalem River Hatchery provides coho and winter steelhead carcasses.
• Watershed councils, schools, and other volunteers participate in carcass distribution.
Commitments
• Provides rainbow trout utilized at the Disabled Fishing Day sponsored by the Tillamook Anglers at Whiskey Creek Hatchery.
• Provides rainbow trout utilized at Camp UKANDU on Smith Lake. This is a summer camp for kids with cancer.
• Provides legal trout for Free Fishing Day activities at Trask Hatchery, Hebo Lake (USFS sponsors activities), and Nedonna Pond where the Hatchery staff put on a program. Additionally, stocking schedules are arranged to provide releases of catchable trout into most District lakes immediately prior to Free Fishing Weekend.
2.3.7 Rock Creek Hatchery Evaluation
At full production, Rock Creek Hatchery annually supplies over 990,000 salmonids for recreational angling opportunity in the Mainstem, North and South Umpqua. The hatchery also produces over 50,000 trout for the area’s lakes and impoundments. While coho, Chinook and trout consistently meet production goals, steelhead are difficult to rear on site. Problems with steelhead rearing stem from warm water temperatures during the summer which can trigger a wide range of pathogens and diseases which affect steelhead when they are less than a year old.

86 December 14, 2010 HB 3489 Report
To compensate for this chronic problem the hatchery installed UV sterilization, ozone treatment and chilling capacity to its hatch house and moved the age 0 steelhead to Canadian troughs inside the hatch house. Rock Creek also sends a portion or all of its steelhead eggs to Cole Rivers Hatchery for rearing to age 1. Passage/Screening Passage All anadromous species have excellent year-round opportunities to migrate upstream in the North Umpqua. The bypass at Rock Creek includes a concrete dam, fishway, and intake. Currently, upstream fish passage is adequate at the dam except at extremely low flows or at very high flows. Fishway design plans have been completed to improve fish passage at all flows and reconstruction scheduled to begin this biennium. Screening NOAA Fisheries screening criteria for anadromous salmonids for vertical flat plate screens at the facility are being met. These criteria include the screen opening, face, position, surface, and the approach and sweeping velocity. Legal Commitments/Treaty Obligations Rock Creek Hatchery operates through special legislative direction and mitigation agreements. The Umpqua basin Chinook production also contributes to the broad state commitments to the Pacific Salmon Treaty. • Rock Creek Hatchery fulfills mitigation obligations for Douglas County’s
Galesville Dam FERC License for South Umpqua basin coho. • Rock Creek Hatchery also has a FERC mitigation agreement with PacifiCorp for
providing 80,000 wild coho eggs for a research study. The eggs will be used from 2009 – 2011.
• Rock Creek Hatchery also has a mitigation agreement with PacifiCorp for producing a native stock of rainbow trout. These trout will be used for stocking Diamond, Lemolo and other high Cascade lakes in the upper Umpqua basin.
STEP Programs Current STEP commitments are as follows: • Commission-approved hatchbox program for fall Chinook. • High lakes fish stocking program for Umpqua Basin. • Fall smolt releases of fall Chinook from eggs provided by the Gardiner-
Reedsport-Winchester Bay STEP program... • Professional technical assistance for the Umpqua basin STEP program. • Classroom Incubator Program for numerous classroom incubators in Douglas
County and the Eastwood Elementary School Hatchery on Deer Creek (South Umpqua.)
• In the future the hatchery will have an educational, “RockEd” classroom on site. Multiple learning opportunities will be available for teachers.
2.3.8 Salmon River Hatchery Evaluation

87 December 14, 2010 HB 3489 Report
Salmon River annually produces 200,000 fall Chinook smolts for release in Salmon River, 200,000 coho salmon presmolts for release in Youngs Bay, 80,000 summer steelhead smolts released in the Siletz River and 24,500 legal sized rainbow trout. The fall Chinook production goal is consistently met and is released directly into Salmon River with a primary objective to act as an indicator stock for Oregon north migrating Chinook salmon in the commercial fisheries off Alaskan and Canada. This program provides the state with valuable information on harvest levels of Oregon coastal Chinook populations in the northern sport and commercial ocean fisheries. This release also provides for a highly utilized and popular recreational in river fishery. The annual coho production is met consistently with a primary objective to supplement ocean recreational coho fisheries the commercial fishery in Youngs Bay on the lower Columbia. The summer steelhead production goal has been met most years. It provides the primary fishery for anadromous fish in the Mid-coast during the summer and the fishery could not be supported by the wild population. The brood stock is valuable for conservation due to its origin from the only wild summer steelhead population in the Oregon Coast Range. The rainbow trout production is consistently met, often exceeding fish size expectations, and is the primary provider of stocked rainbow trout for the Lincoln City area.
Passage/Screening Passage The electric barrier located above the hatchery intake is no longer in operation. The remaining structure includes a concrete apron that may restrict upstream passage during periods of low flows in late summer. Screening Fish screening criteria by NOAA Fisheries for anadromous salmonids is for a perforated plate opening not to exceed 3/32-inch in diameter or a woven wire opening not to exceed 3/32-inch measured diagonally. The screening at Salmon River Hatchery is 1/8-inch and does not meet NOAA Fisheries criteria. Legal Mandates and Commitments Legal Commitments/Treaty Obligations The Salmon River Hatchery operates through treaty obligations under the U.S.-Canadian Salmon Treaty. Fall Chinook from Salmon River Hatchery have been chosen as an indicator group to represent all north-migrating Oregon coastal fall Chinook in ocean harvest management under the U.S.-Canadian Salmon Treaty on salmon fisheries because of its similarity to other north-migrating Chinook stocks, the presence of a hatchery, and the small size of the Salmon River Basin. Due to its use as an indicator stock, estimates have been made for all Chinook returning to the Salmon River system since 1986.

88 December 14, 2010 HB 3489 Report
Salmon Trout Enhancement Program (STEP) STEP program needs could be met at another facility with moderate modifications. Current STEP involvement includes:
• Schooner Creek Fair - STEP Educational display with juvenile salmonids
• Stream Enrichment Program - Salmon River provides carcasses for distribution to selected streams - Watershed Councils, schools and other volunteers participate
• Summer Steelhead Program - Volunteers assist ODFW staff with Siletz trap operations
2.3.9 Trask River Hatchery Evaluation
Trask Hatchery annually produces ~100,000 coho salmon smolts for release into the Trask, ~245,000 spring Chinook for release into the Trask and Wilson rivers, ~113,000 fall Chinook for release into the Trask River, and ~100,000 Wilson River (121 stock) winter steelhead smolts for release into the Wilson River. Trask Hatchery also provides rearing and release for ~80,000 Nestucca (47 stock) winter steelhead (Wilson and Kilchis release) and ~30,000 summer steelhead (Wilson release). Production goals for these programs are consistently met. Coho salmon production at Trask Hatchery has been decreased to 100,000 over the recent past in order to meet objectives identified in the Oregon Coastal Coho Conservation Plan. The current production level of hatchery coho continues to provide important ocean sport and commercial angling opportunities. The spring Chinook program provides the only available fish for harvest as the wild population is small and the fishery is managed as a mark-select fishery. The fall Chinook program augments an extremely popular bay and river fishery. Releases of winter steelhead into the Wilson and Kilchis basins provide for popular recreational in-river fisheries. The Wilson River (121 stock) winter steelhead program, which began with the collection of adult brood stock during the 1996-97 return year, has grown to be an extremely popular fishery with Wilson River anglers..
Passage/Screening Passage Complete Barrier Gold Creek has two barriers: (1) a horizontal finger apron rack with a concrete foot and an associated fish ladder to the adult trap; and (2) a concrete barrier at the upper water intake. No anadromous fish are passed above the hatchery barriers on Gold Creek at this time. Cutthroat trout are present above barrier. Screening Trask River Hatchery and Tuffy Creek intake screens have 1/8th and 3/32 slotted plate which do not meet NOAA fish screening criteria. Trask Pond has 3/32 screens which do meet NOAA fish screening criteria.

89 December 14, 2010 HB 3489 Report
Legal Mandates and Commitments
Legal Commitments/Treaty Obligations Trask Hatchery has no legal, mitigation, or treaty obligations. There is no direct research associated with the facility. Salmon Trout Enhancement Program (STEP) Trask Hatchery is integral to the local STEP program. Hatchbox Program
• Fall Chinook (multiple volunteers – 280,000 fall Chinook; eggs total) • Spring Chinook (multiple volunteers – 65,000 spring Chinook eggs total)
Classroom Incubator Program • Eggs provided to five schools for classroom teaching units – 2,000 +/- Chinook
eggs; varies yearly with school/teacher involvement. Whiskey Creek Hatchery
• Volunteers raise 100,000 spring Chinook for release into the Trask and Wilson rivers.
• Trask River Hatchery staff trap, hold, and spawn adults. • Trask River Hatchery staff incubate eggs and transfer eyed eggs to Whiskey
Creek Hatchery. Trask hatchery staff conduct final rearing and release for a portion of the Whiskey Creek spring Chinook production
Stream Enrichment Program
• Trask River Hatchery provides spring Chinook, coho, and fall Chinook carcasses for distribution throughout the Tillamook Bay Basin.
• Watershed councils, schools, and other volunteers participate. Commitments
• Trask River Hatchery staff sponsor a Free Fishing Day event at the hatchery which targets youth angling. Trask Hatchery is also the site of an angling event for kids from the local YMCA.
2.4. Deferred Maintenance Status
2.4.1 Alsea Hatchery
The hatchery water is supplied from the North Fork Alsea River, upstream from the hatchery. The water is gravity fed into the site and low water flows are experienced during winter and summer months. For the most part, the intake area was updated in the mid-1970s and is operational. Aluminum bars were replaced 12 years ago and are in good condition. The hoist was replaced in 2008. The site drawings show a specific boundary line around the main portion of the hatchery totaling approximately 12.5 acres. Both the concrete paved vehicle areas and the concrete

90 December 14, 2010 HB 3489 Report
paved walked surfaces have some minor surface cracking and should be repaired before the damage escalates. In addition, there are gravel vehicle surfaces that need additional gravel. For the most part, the grating is in good condition; there were only a few instances of rusted or broken grating. All of the metal valves are leaking to some extent. There were only two 18” extra-large metal valves that were mentioned and they are at the intake area. The concrete rearing raceways are leaking and seeping water and the concrete is marginal. There are two settling ponds. The concrete settling pond is no longer used. It is too small, the sides are starting to bow out, sinkholes are developing and the entire pond is compromised. The other settling pond is an asphalt pond and it is in questionable condition. The pond has holes, cracks, leaks and the bottom is coming up. Generally, there is plenty of visitor parking and easy access around the site. Buildings: The following buildings were assessed as part of the maintenance master plan: Residence#1 (02001), Residence#2 (02002), Residence#3 (02003), Residence#4 (02004), Garage Tank and Storage Building (02011/02018), Hatchery Building (02013), Hatchery Office (02015), Cold Storage/Grinder Room (02016), Spawning Shed (02017), and Metal Storage Building (02019). The first residence, Residence #1 (02001), was built in 1948 and has a crawl space, wood framed walls, and wood siding. The wood siding needs to be scraped and repainted and the eaves have dry rotted. The residence has an asphalt-shingled roof and although both the roof and exterior roof drainage components were replaced in 1980, the roof is still in good condition. The windows were replaced in 2010. The concrete stairs are chipped down to the aggregate and need to be patched. The front porch is also original to 1948 and needs to be refinished. Residence #1(02001) is in very good shape and requires no repair work at this time. The wall surfaces are mostly wallboard, with a small application of wood paneling. The ceiling surfaces are primarily wallboard, with a minimal amount of adhered ceiling tile. All of the doors are original. The carpet was just replaced in 2003 and the resilient flooring in 2000. The casework is brand new, installed in 2005, along with the plumbing fixtures. The house has an oil-fired furnace and a wood stove for heating. The furnace is very old and inefficient and should be replaced with a heat pump. Eliminating the diesel furnace will eliminate the need for underground fuel storage tank associated with the furnace. This residence has an unattached free standing garage with a slab on grade construction. Slab is severely cracked in multiple locations due to ground settling. The building has a slight list to it resulting in multiple structural concerns. The second residence, Residence #2 (02002), was built in 1934 and has a crawl space, wood framed walls and wood siding. The resident mentioned that the floor joists are rotting and he has already had to do maintenance repair. The vertical structure seems to be in good condition, but the wood siding, trim and eaves needs to be scraped and repainted. The building has an asphalt-shingled roof and both the roof and the exterior roof drainage components were replaced in 1997, and everything seems to be in good condition. All of the wood doors are original and need to be

91 December 14, 2010 HB 3489 Report
phased out. In addition, the residence has little insulation and needs some form of insulation installed. The concrete stairs are chipped and cracked and need some minor repair. Residence #2 (02002) is also in good condition considering its age. The walls are mostly wallboard and wood paneling. The ceilings are all wallboard. The carpet was replaced in 2005 and resilient floor tile was replaced in 1995. The doors are all original, as is the casework. There is an oil furnace and a woodstove for heat. The furnace is inefficient and should be replaced with a heat pump. Eliminating the diesel furnace will eliminate the need fuel storage tank associated with the furnace. The water heater was replaced in 2004. The third residence, Residence #3 (02003), was built in 1934 and has a crawl space, wood framed walls and wood siding. The wood siding was replaced in 1987. The building has an asphalt shingled roof and exterior roof drainage components that were replaced in 2003. All of the wood doors are original to 1934 and should be eventually phased out. The house has little insulation and insulation in some form needs to be installed. Originally this was a two-family house that was converted into a single-family house. The interior is primarily surfaced with wallboard on the walls and ceilings. The carpet was replaced in 2005 and the resilient flooring was replaced in 1990. Both the casework and the doors are all original. The furnace is inefficient and should be replaced with a heat pump. Eliminating the diesel furnace will eliminate the need two underground fuel storage tanks associated with the furnace. There is a wood stove as well. The hot water heater was replaced in 1995. The fourth residence, Residence #4 (02004), was built in 1962 and has a crawl space, wood framed walls and wood siding. The wood siding is peeling and needs to be scraped and repainted. There is also some dry rot to the wood siding and the eaves are dry rotting as well, such that the roof accessories won’t stay attached to the building. The windows were replaced in 1993 and are in good condition. All of the doors are in bad shape and need to be replaced. The patio area was just refinished in 2004. Overall, the exterior building envelope seems to be in good shape. Residence #4 (02004) is in very good condition. All of the interior surfaces are in excellent condition. The carpeting was replaced in 2003. The flooring in the master bedroom and hall was replaced in 2009 but the rest of the house is in need of new flooring. The casework is original from 1962 as are the doors. The furnace is very old and inefficient and should be replaced with a heat pump. Eliminating the diesel furnace will eliminate the need for underground fuel storage tank associated with the furnace. The house has one wood stove installed in 2005. The hot water heater was replaced in 2005. The Garage and Tank Storage building (02011/02018) was listed as separate structures with separate numbers, but in reality it is one building with two separate interior spaces, one tank space and one storage space. The building was built in 1934 and is a slab-on-grade, wood framed and wood sided structure. The siding,

92 December 14, 2010 HB 3489 Report
windows, doors, roof and gutters were replaced in 2009. The Garage Tank and Storage Building has a completely unfinished interior original to 1934. The main Hatchery Building (02013) was built in 1934 and is a slab-on-grade, wood framed and cladded building envelope. Approximately 20% of the foundation walls are cracked, with multiple chipped areas. The siding, windows, doors and gutters were replaced in 2006. The metal roof has been replaced within the last fifteen years along with the exterior roof drainage components and is in very good shape. Within the Hatchery Building (02013), the finished interior spaces, like the building exteriors, vary in age and condition. In the main hatchery room and shop space, there is an original tongue and groove wood finish that is in good condition. The painted wood ceiling surfaces in these spaces are starting to deteriorate and need some repair work. The concrete floors are unfinished and show minor cracking. The space has two restrooms, one employee restroom and another ADA restroom that is only accessible from an exterior entrance. Both of the restrooms only have a ceiling height of 6’-1”, and are not up to current building codes. Other than that, both restrooms were remodeled in 1995 and are in good condition. The ADA restroom has some adhered ceiling tiles that are stained. Upstairs there is an unfinished attic which is used for storage, and two employee break room spaces. These spaces are in good shape. The Hatchery Office Building (02015) was built in 1934 and is only 306 ft2. It is a slab-on-grade, wood framed and cladded building envelope. Approximately 10% of the foundation walls are cracked and need to be repaired. The siding was replaced in 2006. The metal roof and exterior roof drainage components were replaced at the same time as the Hatchery Building, approximately fifteen years ago. The windows are in good condition and were also replaced within the last ten years. Overall the exterior building is in decent shape. The Hatchery Office (02015) has just one interior space that is in very good shape. The interior walls are wood paneling and exposed concrete and the ceiling surfaces are adhered tiles. The resilient flooring needs to be replaced. The space has an electric wall heater. The Cold Storage/Grinder Room building (02016) was built in 1934 and is a slab-on-grade, wood framed and cladded building envelope. The siding, windows, doors and gutters were replaced in 2006. The metal roof and exterior roof drainage components were replaced at the same time as the Hatchery and Office Buildings, approximately fifteen years ago. The Cold Storage/Grinder Room building (02016) has primarily three interior spaces, one for equipment storage, one for fish food storage, and the other is attic storage. For the most part, the finishes are exposed concrete. The remaining surfaces could use some cosmetic touch-ups such as repainting. This building does not have heat. The Spawning Shed (02017) was built in 1971 and is basically a shed type building that is open to the elements. It is a slab-on-grade and slab-below-grade structure

93 December 14, 2010 HB 3489 Report
and has about 50% foundation walls and 50% wood framed and wood cladded walls. The metal roof, exterior roof drainage components, window and door were replaced in 2008. The interior space is open to the elements and is completely unfinished. The Storage Building (02019) is a slab-on-grade metal storage shed that was erected in 1996. Nothing significant has been changed to the building since it was put on site in 1996. The interior is metal and is also unfinished. ADA: Alsea River Hatchery staff site are typically with tourists that come out to the hatchery and are available to assist any handicapped person get through the tour. The main Hatchery Building (02013) is not open to the general public unless a tour is being given. The site has two van-accessible parking spots with appropriate signage, one near the accessible restroom and site, and the other in the general parking area. No ramps or curb cuts are needed at the Alsea site. The entire path of travel consists of rough aggregate and is not completely accessible in all areas. Some of the aggregate is in better condition than other areas, but for the most part, the site pathways should be resurfaced. The Alsea site is primarily flat, although there are slight changes of grade and a proper assessment should be made before any upgrades are considered. The accessible route to the restroom is aggregate with a minimal amount of asphalt paving. The asphalt directly in front of the doorway to the restroom has a large depression that needs to be filled and resurfaced. The accessible route to the Hatchery Building (02013) is also aggregate with a minimal amount of concrete directly in front of the building. The Hatchery Building (02013) contains two spaces that are required to be compliant. The first space, the hatchery room, is only open to tours. Otherwise, it is not open to the general public. There are no major issues in regards to access. The Hatchery Building (02013) also contains an accessible restroom that has another exterior entrance, other than the hatchery door entrance. This entrance need to have the threshold modified, as it is too high. The main hatchery room has no major compliancy issues except that the concrete fish basins are 38” in height, and can not be modified because they are a part of the floor system. The fish basins create an observable event that would be difficult to view by a person in a wheelchair. As mentioned on the interior summary for the accessible restroom, the ceiling height is only 6’-1” and does not meet current standard building codes and needs to be modified. Otherwise, the interior space of the restroom is compliant.
2.4.2 Bandon Hatchery

94 December 14, 2010 HB 3489 Report
Engineering/Facilities Bandon Hatchery obtains its water supply from Ferry Creek and Geiger Creek. The intake at Ferry Creek has been replaced since 1925, and the intake screens at Geiger Creek have been replaced as well. The water from both sources is distributed to the site by gravity flow systems. Ponds There are ten ponds on the site, two of which have been used for abatement ponds. The concrete on each of the rearing ponds is primarily in good condition, but does have a few problems. Pond 06081 is cracking along the walls and floor. Ponds 06087, 06088, 06085, 06084 and 06082 have minor cracks along the walls. Pond 06080 has cracks along the walls and near the supply pipe. Ponds 06088 and 06087 have cracks along the floors, which are more substantial than the cracks found on the other ponds. The condition of the rearing ponds range from very good to poor, with all ponds being functional. Roads/Paths The developed areas of the grounds are in good condition overall. One main asphalt road leads to the parking on the site. This asphalt was installed in 2002 and is in excellent condition. Gravel roads lead to the residences as well as the intake. The gravel is in good condition with some areas of grass growing through the gravel. A small amount of asphalt sidewalks exist on the site. This asphalt was installed in 1985 and a portion of it is cracking along the surface. A new seal coat should be installed. A concrete sidewalk adjacent to Residence #1 (06065) is cracking and needs to be repaired. Buildings The following buildings were assessed as part of the maintenance master plan: Residence #1, Residence 4 (06068), Spawning Shed (06070), Rearing Tank Building (06071), Cold Storage Building (06072), Hatchery Building (06075), Shop Building (06077), and Storage Building (06079). Residence 1 (06065), built in 1929, consists of wood siding exterior walls on a slab on grade foundation. The siding was replaced in 1985 and is in good condition. The roof, replaced in 1992, is asphalt shingles and is in good condition as well. The windows were replaced in 2004, and the exterior metal doors in 2000. The garage door was replaced in 1990. A storage shed was also built for the house in 2005. The house is heated via an electric furnace, which is circulated through ductwork. The furnace was installed in 1984 and the ductwork is original to 1929. The power wiring was replaced in 1984 and currently there are no electrical problems in the house. New carpeting, vinyl flooring, and a bathroom renovation (including plumbing) were implemented in 2009. A porch attached to the back of the house was transitioned into an extension to the house in 1985. Residence 1's (06065) interior has a couple of problems where repairs are needed, but is in overall good condition. The ceiling upstairs is peeling and needs to be repainted. The casework in the kitchen was installed in 1950 and is in very poor

95 December 14, 2010 HB 3489 Report
condition. The doors and drawers do not close properly, and the wood is deteriorating. The water heater in the basement needs to be replaced. Residence 4 (06068), built in 1955, consists of wood siding exterior walls on a 4 ft. crawl space foundation. A couple of the studs on the north wall of the house were found to have some minor rotting. The roof was replaced in 1992 and is in good condition. The windows were replaced in 1985 and need to have the weather stripping replaced due to dry rotting. A deck was built in 1988, but removed in 2010. This will be replaced with a more practical patio. A storage shed was added in 2003. The heat for the house is generated via an electric furnace and is circulated through the house through ductwork. The electric furnace was installed in 1985, replacing the original oil furnace. Residence 4's (06068) interior is mostly original and is still in good condition. The carpeting was replaced in 2000 and is in good condition. A portion of the sheetrock around the windows was replaced recently. The cabinets are beginning to warp around the sink. Residence 2 (06066), was included in the scope to be inspected. The building, built in 1937, is currently in a very poor condition. It is uninhabitable and is only open on one side to allow access to the laundry room. The water is still hooked up to the building and the washer and dryer are used by hatchery hosts. The house is planned for demolition, but not presently scheduled for that project. Once demolished, a laundry facility needs to be installed. The Spawning Shed (06070), built in 1983, consists of wood siding exterior walls on a slab on grade foundation. The metal roof and siding are original to the building and are in good condition. There is no heat supplied to the building. The interior of this building is completely unfinished with no problems to report. The Rearing Tank Building (06071) (a.k.a. the "E Building"), was built in 1991. The building consists of wood siding exterior walls on a slab on grade foundation. The asphalt shingle roof and siding are original to the building and are in good condition. There is no heat supplied to the building. The interior of this building is completely unfinished with no problems to report. The Cold Storage Building (06072), built in 1953, consists of wood siding exterior walls on a slab on grade foundation. The siding is original to the building and is in good condition. The asphalt shingle roof was replaced in 1999 and is also in good condition. The exterior wood doors are original, and two of the doors need to be replaced due to deterioration. The only hardware the doors have is a metal latch to lock the door. Doorknobs and locks should be installed. The compressor for the cold storage was replaced in the late 1980's and has since been decommissioned. The building is no longer used to store moist food and instead is used as general storage. One interior space is heated via electric radiation. The interior of this building is completely unfinished with no problems to report. The Hatchery Building (06075), built in 1934, consists of wood exterior walls on a slab on grade foundation. The wood siding was replaced in 1995 and is in good condition. The asphalt shingle roof was also replaced in 1995 and is in good condition. Other items replaced in 1995 include the gutters, windows and wood

96 December 14, 2010 HB 3489 Report
exterior doors. Overall, the exterior of the Hatchery Building is in good condition. The only concern currently is the foundation appears to be settling at a faster rate on the north end of the building. There is no immediate action required for this but is something that needs to be documented and monitored. A portion of the building is heated via electric radiation and was installed in 1994. The Hatchery Building's (06075) interior is mostly unfinished and in good condition. The worn attic floor was covered in 2009. The office was refurbished in 1995 including new wood paneling for the walls, painted sheetrock for the ceiling and vinyl flooring. The lighting throughout the hatchery was replaced in 1993. The Shop Building (06077), built in 1978, consists of wood exterior walls on a slab on grade foundation. The roof was replaced in 2006. The building is heated by overhead electric radiation. The interior of this building is completely unfinished with no problems to report. The Storage Building (06079), built in 1998, consists of metal exterior walls on a slab on grade foundation. The metal roof is original to the building and is in good condition. The building is relatively new and has no problems to report. There is no heat supplied to the building. The interior of this building is completely unfinished with no problems to report. Ferry Creek Spillway proved to be inadequate in the “1964 Flood” and other recent major storm events. It is currently only 7’ wide and needs to be engineered and expanded. Although it has been repaired, it is deteriorating, leaks, and is causing undermining of the dam. Americans with Disabilities Act (ADA) Compliance and Public Accessibility There is adequate handicap-accessible parking at Bandon Hatchery. The parking is located adjacent to the Spawning Shed (06070). Paths leading from the parking area to the Spawning Shed and ponds are mostly ADA compliant. The specific portions of these paths that are not ADA compliant are: The path leading from the parking to the adjacent Public Restrooms is too steep. An ADA compliant path (concrete/asphalt/aggregate) should be installed leading directly to the restrooms. Another portion of the paths that is not compliant is at the Rearing Ponds (06080, 06081). The current path leading around the perimeter of these ponds is only 18". The path needs to be widened to at least 36". The final problem with the paths is at a ramp leading up to a walking bridge that crosses the creek. There is a 2" lip where the ramp meets the wooden bridge. This lip needs to be removed to make the path ADA compliant. The only building on the site that is open to the public is the Spawning Shed (06070), and there are no problems regarding ADA compliance with this building. Public Restrooms Public restrooms on the lower hatchery grounds are currently inadequate. Two portable, plastic restrooms are provided for public use. The lower grounds are within the floodplain of Ferry and Geiger creeks, and as such, the installation of permanent restrooms has been difficult to accomplish. There is a need for a site

97 December 14, 2010 HB 3489 Report
inspection by DEQ and County personnel, to assist in developing options for the installation of permanent restrooms.
2.4.3 Butte Falls Hatchery The site has ample guest parking and also features a large park area that can accommodate large gatherings. Recently brought back into full operation, the hatchery gravity intake structure was refurbished in 2004, and equipped with a compressed air screen cleaning system. Water is piped from the intake approximately 1/2 mile downstream to the hatchery. The pipe crosses over Butte Creek on a small bridge. The footings that the bridge pillars sit on have begun to wash out due to minor flooding. This bridge should be inspected by an engineer to determine if it is still structurally sound. Though functional, the site has several issues that need to be addressed. A majority of the concrete and paved surfaces are badly weathered, including vehicular and pedestrian surfaces. There is also a major drainage problem on the site. Periods of heavy rain create a wash that runs down the walkway of residence 15112 into a pool in the back yard. The rearing raceways are in a variety of conditions. Two raceways were refurbished in 2003 and are in excellent shape while some of the raceways dating from the 1930’s have crumbled into a state of uselessness. Additionally, the retaining wall located at the end of this set of raceways is failing and needs to be replaced. All other raceways, other than the two that are newly refurbished, have sections of severe cracking and deterioration. The valves used for water distribution to the raceways are being replaced in an on going process. In addition the settling ponds were slated for replacement in 2006. The domestic waterlines on site are undersized and routinely fail. Made up of old galvanized piping, the distribution lines often rust through and demand repair. The irrigation system on site is fed from the main intake pipe for the hatchery water system. Low pressure in the lines only allows for one sprinkler head to be used at a time. The site also has a number of underground storage tanks that are not in use. For many of the tanks the location, condition, and date abandoned are unknown. Many of the underground heating oil tanks were replaced with above ground units, a few of which should be evaluated for stability. Also of note was the inclusion of Residence 15110, which is no longer in use due to poor water quality. This residence is not located at the hatchery site, rather at a former egg-taking station on Butte Creek. Buildings

98 December 14, 2010 HB 3489 Report
The following buildings were included as part of the maintenance master plan: Hatchery Building (15014), Office Building (15028), Wood Shop (15034), Shop (15036), Storage Building (15037), Cold Storage/Grinder Room (15038), Residence #1 (15111), Residence #2 (15112), Residence #4 (15113), and Residence #5 (15114). The remaining buildings are associated with the above buildings: Storage (15029), Garage (15033), Garage (15039), Carport (15040), and Garage/Shop (15055). The Hatchery building (15014) is in excellent shape and requires no action at this time. The wood framed structure built on a slab on grade foundation with masonry walls has been well maintained. Recently resided with vinyl siding and having undergone a window replacement in 1994, the building envelope is in the best shape of any building on the site. The Hatchery Building recently had the main head pipe replaced. The unfinished walls and concrete floor are in good condition. The tank room has several built-in concrete tanks, which seep water onto the floor, though no cracks were apparent, thus an action item has not been indicated. The Office building (15028) is a wood framed structure on a crawlspace foundation. The building is currently not in use; however, staff would like to see it turned into a visitor’s center. In order for this to take place several issues will need to be remedied. The root system of an adjacent tree has undermined the foundation and cracked it, causing the whole structure to slope to the rear. In addition the roof and exterior paint are extremely weathered and a broken window needs to be fixed. The interior is quite small and has been divided into three rooms, a small restroom, office, and lobby area. The restroom is plumbed but staff has indicated that there is no need for the restroom any more and the fixtures can be decommissioned. All interior finishes are in good shape except for the vinyl floor, which is chipped and spreading at the seams. The Wood Shop (15034) is a large wood-framed structure with a slab on grade foundation and partial masonry walls. Functionally sound, the main structure is heated by wood stove and houses all of the woodworking equipment. There is a garage (15033) which is used for storage adjacent to the main building. The garage is structurally unsound due to a damaged foundation, requiring total replacement of the building. The structural integrity of the main building (15034) is sound, though it is showing its age. The chimney is crumbling and needs to be replaced, the window frames need to be repainted and sealed, and the concrete landings outside the main entrance have cracked laterally and need to be replaced. The Shop (15036) is a wood framed structure with a slab on grade foundation and partial masonry walls. It is currently being used for storage. The buildings exterior paint is blistered and peeling. The exterior walls and window frames need to be scraped and painted. The Storage building (15037) is a wood framed structure with a slab on grade foundation. Masonry walls rise 2’ above the foundation and meet with the wood

99 December 14, 2010 HB 3489 Report
frame. The structure serves as a storage area and visitor bathrooms. Though structurally intact, the building is in need of some repair. The exterior paint on the walls doors and windows is blistered and flaking off. The masonry walls are chipping and crumbling away, and one of the windows is broken. The interior consists of an unfinished storage area and two finished restrooms that have been added to the north end of the building. The storage area ceiling paint is flaking off in one-inch sections and needs to be repainted. The restrooms are in good condition, with the exception of one 1’x1’ hole that has been punched through the GWB finish in the west restroom. The Cold Storage & Grinder Room building (15038) is a combination of two wood-framed slab-on-grade structures with partial masonry walls. The building consists of the former grinding room and decommissioned freezers, which currently house a shower used as an emergency eyewash/shower and storage space. Both sections of the building are in good condition, however several window pains are cracked. All window frames need to be painted and sealed. The concrete pad outside the entrance is cracked laterally and wearing away. The doors need to be repainted. In addition the doors are not wide enough for the forklift to get through, requiring all food pallets be restacked by hand inside the storage area. The Cold Storage & Grinder Room building (15038) interior is in fair condition. The unfinished concrete floor requires no action, however the ceiling and walls in the grinding room are extremely weathered and the plaster and paint are peeling off in sheets. The decommissioned freezers have masonry walls and ceilings that are not in need of any action. Residence 1 (15111) is a three level wood framed full basement structure with a garage. One side of the building was recently resided with vinyl however the rest of the structure is still clad in the original cedar siding. In good condition overall, there are a few issues that need to be addressed, mainly in the basement area. Overall, the vertical structure is in great shape, however, the concrete stairs on the outside of the structure are weathered and need to be resurfaced. In addition, the garage has three broken windows and a cracked foundation. Residence 1 (15111) is currently being remodeled. The attic area has been finished in GWB, however the poor quality or original installation requires that it be re-taped and finished. Originally only one bedroom was in the attic, however a bathroom and bedroom have been recently added. The main floor has wood flooring throughout and aside from needing to be refinished in some areas is in good condition overall. The building sits atop a spring, which requires sump pumps be run constantly. The pumps keep up with the flow of spring water; however there have been instances where pump failure or drainage issues have led to knee-deep water accumulating in the basement. In addition the moist environment, both interior and exterior, has taken a toll on the basement windows, rotting out the wooden frames. The GWB in the basement bedroom suffers from the same shoddy installation job as the attic and

100 December 14, 2010 HB 3489 Report
needs to be refinished. Until there is a permanent solution to the flooding problem the degradation on interior finishes in the basement will be accelerated. Residence 2 (15112) is a wood framed structure with a crawlspace basement. The garage listed in conjunction with this structure has been converted to an enclosed storage shed. A deck has recently been added to the back of the building and a new fence encircles the yard. The structure is in good shape overall but suffers from a few minor issues including loose bricks at the top of the chimney, a broken window, and concrete patios that are worn and need to be resurfaced. As mentioned in the site summary, periods of heavy rain flood the back yard and create a wash running down the walkway leading to the building. In addition the storage shed has a few broken windows that need to be replaced and currently supports an ant infestation. Residence 2 (15112) has a carpeted main floor and a finished attic area. Most of the systems in the buildings interior are in good condition, however carpet is worn and frayed, the countertops in the kitchen are loosing their finish, and there may be some issues with the wiring. Although the wiring is still functional, staff indicated that an electrical inspector showed concern about the age of the wiring and recommended the building be rewired. Residence 3 (15110) is located off the main hatchery site and is no longer in use due to poor well water quality. The building is boarded up. An inspection of the interior was not possible, however staff indicated the finishes were in “good shape” when last they looked. Residence 4 (15113) is used as an office and is in excellent condition overall, requiring no action to the building envelope. Residence 4 (15113) is a one story residence with a laundry room, kitchen, living area, bathroom, and bedrooms that have been converted to office space. The main living area has hardwood flooring that has been painted over. The paint in this area is wearing off and the floor needs to be stripped and refinished or repainted. In addition the GWB is in need of a coat of paint throughout. Residence 5 (15114) is a wood framed structure on a crawl space foundation. Well maintained, only a few minor issues need to be addressed. Isolated areas of the painted cedar siding have begun to peel and need to be scraped and painted. A metal roof, installed in 1994, has an ongoing problem with the screws that fasten it in place. For unknown reasons the screws continually back completely out of the roof, requiring a regular screw maintenance routine every few months. As determined through the interview, the correct type of roofing screws was utilized. Residence 5 (15114), like the other residences on site, is in good condition overall. The building shares the same layout as residences built during the mid 50’s at Klamath Hatchery, Oak Springs Hatchery, and a few other hatchery sites. The upstairs interior GWB needs to be re-taped and finished, additional GWB finish work is needed in the garage. The wood stairs leading to the upper floor above the garage could also use a coat of paint.

101 December 14, 2010 HB 3489 Report
The main issue that demands the most attention in this residence is the electrical system. Although there is the system is currently working, the 100-amp service is undersized and the breaker for the water heater trips randomly. Currently the electrical capacity of the house appears to be low. ADA Butte Falls Hatchery is a very difficult site to maneuver around. The site terrain is all rough aggregate with steep grades and difficult to reach building locations. More parking areas are needed so access is more easily obtained. Re-grading the site is essential to accessibility and compliancy. Currently, I would suggest, if re-grading is not possible, then at least three more accessible parking spaces need to be distributed around the site to make travel more accommodating. The parking spaces need to be near the portable restroom, the old office, and the rearing raceways. There are three buildings that need to be ADA accessible, the office space (15113), the old office building (15028) and the portable restroom. The current hatchery office is located in an older residence and the exterior entrance is completely inaccessible. A ramp would have to be provided, as well as a new door, new threshold, etc. to make the space compliant. The old office space (15028) would need a modified threshold and a new handle for accessibility. Although the building is currently not open to be public, the intent is to turn the interior into an interpretive center. Even though the restroom facilities are not accessible, an ADA portable toilet is provided adjacent to the restroom building. The inaccessible restroom needs to have tactile directional signage.
2.4.4 Cedar Creek Hatchery The hatchery is located 1.5 miles east of Hebo on Highway 22 and is adjacent to Three Rivers. Cedar Creek Hatchery was established in 1925 and is comprised of three areas. In addition to the main hatchery area, there is the Three River Fish Trap, which is across Highway 22 from the hatchery, and a satellite facility at Rhoades pond, which is approximately three miles south on Highway 22. Rhoades Pond is not currently operated by ODFW; it is leased to a local angling group. The goal of this hatchery is to provide spring Chinook, fall Chinook, winter steelhead, and summer steelhead for consumptive fisheries on several coastal streams. Cedar Creek Hatchery has three intakes at the main hatchery – two at the hatchery and one across Highway 22 at the Three Rivers fish trap (29221). The upper and lower intakes are gravity feed systems, on Cedar Creek, and are original to the hatchery. The upper intake is coupled with a small sand trap. The intake at the Three Rivers fish trap has pumps and can be used to supply river water to the

102 December 14, 2010 HB 3489 Report
hatchery at times of low water. Another intake is at Rhoades pond, and is a simple diversion into an open culvert. Screening is in place with a fish bypass pipe back to the river. There are no valves, screen or other mechanics at the Rhoades Pond intake. The intakes are all functioning properly. Primary concerns at Cedar Creek are the replacement of faulty valves. Also, there is an apparent water pipe leak between the Three Rivers Fish Trap Building (29221) and the highway, which is evident when large amounts of water are diverted to the trap from the upper intakes. A pump station and pipeline were installed in 2008 that addressed most of the rearing pond effluent concerns. Waste water can now be diverted to a large, unused rearing lake for settling and dilution. The site utilities include electrical service and domestic water lines. The electrical service is provided to individual buildings by the local utility (i.e. there is no site-wide ODFW owned electrical distribution system). The electrical utility controls site distribution until the power lines terminate at a building meter. The domestic water for the facility is conditioned by a water softener system in a pump house near the Hatchery Building (29239). There were no reported problems with the domestic water system. Buildings: The buildings assessed at this site include: Utility Building (29229), Pole Barn #1 (29231), Pole Barn #2 (29233), Electrical Building (29238), Hatchery Building (29239), Cold Storage/Office Building (29249), Garage/Shed/Shop (29255), Residence #1 (29273/29251), Residence #2 (29274/29242), Residence #3 (29275), Residence #4 (29276), Spawning Building (29221), and Mobile Home-Silvercrest (29277). The Spawning Building (29221) at Three Rivers was built in 1970 and is in fair condition. The building covers and encloses the fish ladder and pools for fish trapping. The Pole Barn #1 (29231) at Rhodes is relatively new and is in good condition. The Cold Storage/Office Building (29249), Pump House (29223), and Pole Barn (29233) are newer buildings and in good condition. The offices in the Cold Storage/Office Building were remodeled in 2001. The roof was replaced in 2006. In general, the residences are in good condition as many have been remodeled in the last ten years. Residence 3 (29275) was relocated to the site in approximately 1947. Reportedly, the building originally had a flat roof. The structural support for an added gable roof is visible outside the building. It is not clear how or if this roof foundation is attached to the original foundation walls. Residence 3 (29275) was enlarged in 2001. In addition to the residences, older site buildings include the Hatchery Building (29239) and a Gas Shed (29237). These have been well-maintained and require only routine maintenance and upgrades. An above ground storage tank for gasoline was installed in 2009. The Residence #4 (29276) and garage at Rhodes pond have not been occupied for approximately six years and are showing evidence of rodent infestation and deterioration. Both of these buildings have deteriorated beyond repair.

103 December 14, 2010 HB 3489 Report
Life Safety: No life safety issues were reported. ADA: The driveways have rough surfaces of paved asphalt and gravel and do not provide accessible paths through the site. The asphalt paving does not actually extend to the Cold Storage/Office (29249) building, and the gravel path is not compliant. Since this building is the only public building and restroom on the site, paving should be extended to it and an ADA parking space should be provided. The site and route into the building require directional signage. A ramp has been recently constructed which allows visitors access to the building. The slope of the ramp is compliant but it is over 30 feet long and there is no landing. It appears that there is sufficient run to install a landing and still have compliant slope. The ramp also needs a handrail. The designated restroom in the building is accessible and complies with the review criteria.
2.4.5 Elk River Hatchery
Fish Rearing Water Supply: Overall condition very good.
Four, 40 hp line-shaft turbine pumps through a screened intake deliver the entire hatchery rearing water supply from Elk River. Although all intake pumps were refurbished in 1996, one of the intake pumps (#7) has damaged seals and should be refurbished soon. The intake alarm system, motor controls and switch gear were replaced in 1996 and 1997, and all are sound. The emergency generator switchgear was replaced in 1999 and is sound and reliable. The old wooden plank deck at the intake was replaced with gripstrut in 2006. Three of the four 12” plug valves were replaced in 2009. A leaking 24” blowout valve and pipeline system near the rearing ponds was replaced in 2010. Water supply headers from the intake to the rearing ponds are sound and do not leak.
Incubation Water Supply: Overall condition good to very good.
Incubation water supply is pumped from a sub-surface well with a 7.5 horsepower line-shaft turbine pump. The pump motor was replaced in 2008. The screened incubation headbox, pipelines, valves and alarm system are all sound. Fiberglass incubation stacks are original to the facility and should be replaced over time due to degradation.
Adult Collection and Holding Facilities: Overall condition very good.
Adult trap and holding facilities for Elk River fall Chinook salmon include a fish ladder, an alley-type trap and 10 separate aluminum-framed holding pens. Two of the rearing ponds (epoxy coated and fenced) are used during winter months as adult holding ponds for Chetco River fall Chinook salmon. A stand-alone building supplied with pathogen free well water houses the polyurethane-coated adult

104 December 14, 2010 HB 3489 Report
holding ponds for Chetco River winter steelhead. The 24” valve system in the distribution headbox near the fish ladder was refurbished in 2007. Intruder exclusion and an updated alarm system were installed at the spawn deck in 2008. The aluminum and wood framed trap outlet structure and all of the wooden fish ladder boards were replaced in 2010. All other valves, metal grated valve box covers and fish trap structures are sound.
Rearing Ponds: Overall condition good to very good.
Twenty four modified, concrete Burrows-type rearing ponds are on site. Fourteen of the ponds are original 1968 construction and ten more ponds were added in 1971. Rearing pond structure includes sound handrails, some chain-link fence, concrete and gripstrut walking surfaces and predator exclusion devices. Some minor cracks have occurred over the 40+ year use of these ponds, but they all remain useable and should be in service for many years without problems. The gripstrut center walkway was modified to allow easier access to rearing water supply valves in 2008. Some 4” rearing water supply valves leak slightly, but none require replacement. Rearing pond tilt-tubes were replaced over several years, and all are sound. Damaged dam boards are replaced as needed. Electrical circuits, circuit breakers and receptacles have been replaced over time and are sound.
Domestic Water System: Overall condition good to very good.
The domestic water system includes a submersible 7.5 hp pump in a sub-surface well which supplies approximately 300 gpm of filtered river water to a 2,500 gallon chlorinated storage tank. A 7.5 hp Grundfos booster pump, five pressure tanks and associated valves and piping deliver treated water to all hatchery buildings, three residences and a host site. The entire domestic water delivery system was upgraded in 1997 and is sound and reliable. Underground pipelines and valves, although useable, are original to the facility and should be replaced over time due to corrosion.
Buildings: Overall condition very good.
- Service Building (08030) was constructed in 1968 and consists of CMU exterior walls on a slab on grade foundation. This building houses the main hatchery electrical service panels, wood shop, tool and fabrication space, emergency water pump storage, domestic water system and the stock room. Interior walls are mostly painted concrete block, while the ceilings are painted fiberboard. Floors are all finished concrete. The fabrication space and wood shop are heated with 230 volt, 1500W ceiling mounted heaters. Since 1995 many physical and electrical upgrades have been accomplished including an improved hatchery alarm system, a 100 kVa transformer and emergency generator power supply to operate all hatchery buildings in the event of commercial power failure. The asphalt shingle roof was replaced in 2008. This building is sound and has no problems.

105 December 14, 2010 HB 3489 Report
- Hatchery Building (08031) was constructed in 1968 and consists of CMU exterior walls on a slab on grade foundation. This building houses the main offices, egg and fry incubation, feed storage, equipment storage and restrooms. The building is heated with original electric radiation. The interiors are painted cinder block or painted drywall. The feed storage freezer was converted to dry storage in 2006, but the upgraded chiller compressors are still on site and functional. The asphalt shingle roof was replaced in 2008. This building is sound and has no problems.
- Electrical Building (08036) was constructed in 1976 and consists of original wood siding exterior walls and ceiling on a slab on grade foundation. This “power shack” houses the transformer, switch gear, motor control and alarm system components for the intake water pumps, incubation well pump and domestic well pump. The asphalt shingle roof is original and is in good condition. Building interior is unfinished. This building is unheated, but is supplied with an automatic ventilation fan for higher ambient temperatures. This building is sound and has no problems.
- Generator Building (08047) was constructed in 1985 and consists of original wood siding exterior walls and ceiling on a slab on grade foundation. This building houses the 230kW emergency generator which powers all hatchery buildings and water pumps during commercial power failures, tool storage and the main service breakers for the Electrical Building. The wood siding and asphalt shingle roof are original and are in good condition. Building interior is insulated with fiberglass, and is heated with a 230 volt, 1500W electric heater. This building is sound and has no problems.
- Steelhead Building (08075) was constructed in 1999 and consists of original wood framed walls and roof on a slab on grade foundation. This building houses the polyurethane coated concrete ponds which are used for holding adult winter steelhead. The wood frame is covered with metal siding and a metal roof. Interior walls are painted plywood. Access is through a man-door and an overhead sliding garage door. The building is supplied with commercial power for lights and 120 volt receptacles, and with domestic water for wash-down as needed. The building is not heated. This building is sound and has no problems.
- Residences (08072, 08073 and 08074) were constructed in 1968 and consist of wood siding exterior walls on 4 ft. crawl space foundations. Wood siding is original to all. All roofs are asphalt shingles. All residences are heated with wood stoves. Maintenance recommendations and recent improvements and are as follows:
0872 Maintenance Needed: - Asphalt shingle roof (circa 1988) has been subjected to frequent high
wind and moss growth, and should be replaced before significant damage can occur
- Wall to wall carpet (circa 1995) is nearing the end of functional use - Rear sliding door should be replaced as soon as possible - Floor insulation must be installed as soon as possible

106 December 14, 2010 HB 3489 Report
Recent Improvements: - Windows were replaced in 1995 and are sound - Kitchen floor tile replaced in 1999 - Garage door was replaced in 2003 and is sound - Wood stove was replaced in 2003 - Vinyl flooring replaced in 2004 - Entire house painted in 2004 - Ceiling insulation was added in 2007 - Septic outflow pipe from the house was replaced in 2007 - Hot water heater replaced in 2008 - Garage walls and ceiling were insulated and sheet-rocked in 2008
08073 No Urgent Maintenance Needed
Recent Improvements: - Windows replaced in 1995 - Garage door replaced in 1999 - Wood stove replaced in 2003 - Storm doors were replaced in 2004 - Ceiling insulation installed in 2004 - Entire house painted in 2004 - Vinyl flooring replaced in 2005 - Water heater replaced in 2007 - Carpet replaced in 2007 - Asphalt shingle roof and steel gutters replaced in 2008 - Septic system serviced, then replaced in 2008
08074 Maintenance Needed: - Asphalt shingle roof (circa 1988) has been subjected to frequent high
wind and moss growth, and should be replaced before significant damage can occur
- Floor insulation must be installed as soon as possible
Recent Improvements: - Windows replaced in 1995 - Wall to wall carpet installed in 1996, still good

107 December 14, 2010 HB 3489 Report
- Vinyl floors replaced in 1999 - Wood stove replaced in 2000 - Garage door and opener replaced in 2003 - Sliding glass patio door replaced in 2004 - Entire house painted in 2004 - Storm doors replaced in 2005 - Septic tank serviced in 2005 - Hot water heater replaced in 2007 - Vapor barrier and borate treatment in 2009 - Aluminum gutters replaced in 2009
Life Safety
No issues to report.
ADA
Two locations on the site have accessible parking. Primary visitor parking is on the south side of the Hatchery Building (08031), and is ADA compliant; however, access to the office and hatchery building is not fully ADA compliant. The main entrance to the building is not accessible and the access ramp on the west side of the building is too steep and needs to be repaired and lengthened by 2’ to comply. While this building is open to the public, and the alternate entrance is accessible, no sign exists to direct visitors to the alternate accessible entrance.
Secondary parking on the west end of the facility is for access to the spawning shed. The visitor parking area is not marked with striping or designated with a sign. The only sign that points the public to this parking area is a sign attached to the stop sign reading “Disabled Drivers Only”.
Two interior spaces within the Hatchery Building (08031) are open to the public: the lobby and the restrooms. The lobby is an ADA compliant space, with access from the alternate entrance. The restrooms, accessed from the lobby, are not ADA compliant. Insufficient space prevents a wheelchair turn-around. In order to expand the restrooms a portion of the building, including the entrance, would have to be rebuilt. An ADA compliant sani-can has been installed outside the building as an alternative. While not considered a permanent solution, no plans to reconstruct an accessible restroom have been made. A possible solution would be to combine the men’s and women’s restroom into one larger unisex restroom. Currently, no signage inside the building directs the public to the sani-can outside.

108 December 14, 2010 HB 3489 Report
2.4.6 North Nehalem River Hatchery
The North Nehalem Hatchery was established in 1966. This hatchery is noted for the accessible public fishing platform, accessible restroom, and ample accessible parking. The hatchery takes water by pump from the North Nehalem River. According to staff, the condition of the rearing ponds is poor. There is evidence of settling and cracking in several of the ponds. North Nehalem has one intake, which is located on the North Nehalem River. It was installed in 1966 the same year the hatchery was established. It is a pumped intake, and to support this, there is an emergency back-up generator for the pumps in case of power failure. The intake has been described as being in good condition. Buildings The following buildings were assessed as part of the maintenance master plan: Residence #1 (04056), Pole Building (not shown on site map) (04060), Service Building (04070), Shop/Storage Building (04072), and Restroom Building (04088). There are four residences (04056, 04057, 04058, and 04059) all built by the same plan; they are in very good condition and many have been remodeled in the last five to ten years. All exhibit proof of frequent maintenance. According to staff, the septic fields are functioning properly. The hatchery buildings are also in good shape (04060, 04070, 04072, 04088). The oldest buildings were built in 1966, when the hatchery was established. New buildings were added in the 1990’s and 2001 (when the public accessible fishing area was constructed). Generally, the roofs for all the buildings have been well maintained, however, some of the roofs have reached the end of their typical life expectancy and will need to be replaced soon. Although the staff reported few roof leaks, there are large amounts of moss building up on some roofs. The moss needs be removed as a maintenance item. Systems The Service Building (04070) contains unit heaters which appear to be functioning properly. The Pole Building (04060) and the Shop/Storage Building only have electricity (i.e. no heat or plumbing). Since this is a pumped hatchery, there is a large emergency generator with associated electrical switchgear, panels and wiring. The generator was moved to the site from another location. The switch gear and generator are nearing the end of the expected life of these units. Upgrading to VFD motor controls will reduce the facility electrical consumption, and will likely pay for the initial investment with the consumption savings.

109 December 14, 2010 HB 3489 Report
The emergency generator is WWII vintage and was surplus from a naval ship. This vital system should be replaced with a newer dependable unit. Life Safety There are no life safety issues to report at this site. ADA North Nehalem Hatchery features an ADA accessible fishing platform. To support this accessible platform, there are 17 accessible parking spaces and an accessible restroom. There are two ramps from the parking area. One ramp leads to the public restroom, the other leads to the fishing platform. Both are ADA compliant with regard to slope, surface, landings and handrails. The rough condition of the asphalt paving constitutes a barrier to travel around the site and restricts visitor access to rearing ponds. Since the paved vehicular surfaces also serve as pedestrian circulation, these areas should be resurfaced to comply with ADA requirements. The Restroom Building (04088), adjacent to the parking area for the accessible fishing platform, was built in 2001 and meets ADA accessibility criteria. It is intended to serve as a public restroom for the entire site.
2.4.7 Rock Creek Hatchery Rock Creek Hatchery obtains its water supply from the North Umpqua River and Rock Creek. The water obtained from the Umpqua River is pumped to the site during the summer months, and water from Rock Creek is delivered year round through a gravity system. The intakes, North Umpqua pump station installed in 1978 and the Rock Creek gravity reconstructed in 1998, are concrete and are of sound integrity. The floor of the intake channel is wearing down, but is scheduled to be repaired in 2010. The upkeep of the intake channel is a priority and needs to be repaired approximately every 8-10 years. The current means of cleaning the intake screens is using the natural velocity of the water. A more efficient method would be to install a mechanical spray similar to those used at other hatcheries. A small portion of vehicular asphalt on the site is cracked along the surface and requires a new seal coat. There is an asphalt path leading to a deck open to the public, which looks over the river. The asphalt is cracked substantially along the entire path and needs to be replaced. All 52 of the small valves serving the older raceways are damaged and need to be replaced. The valve threads are damaged and difficult to turn, the valve stems are rusted and leaking, and some of the valves don’t turn at all. The six valves that are larger than 18” are: a 36” weir wheel valve (which needs replacing), a 36” supply line valve, a 20” blowout valve, a 40” butterfly valve and two 30” intake valves. Most of the rearing ponds/raceways are in good condition. One raceway (concrete) that was built in the 1940’s is cracking and chipping along the walls and floor. The aggregate is exposed due to the concrete wearing down. This makes cleaning the concrete considerably more difficult due to fish food and other particles of dirt getting caught in the aggregate. The concrete needs to be repaired/replaced where this is occurring.

110 December 14, 2010 HB 3489 Report
Buildings The following buildings were assessed as part of the maintenance master plan: Residence (10091), Residence (10092), Residence (10093), Residence (10094), Residence (10095), Generator Building (10122), Garage Building (10126), Pumphouse (10130), and Hatchery Building (10140). Residence (10091), built in 1957, consists of wood siding exterior walls on a slab on grade foundation. The siding is original to the building and is in good condition. The roof, replaced in 1995, was installed on top of sheathing that will need to be replaced soon. The storm doors were replaced in 2000. The house is heated via a heat pump and circulated through ductwork. The heat pump was installed in 1989 and is in good condition. The ductwork, original to the house, may need new tape at the joints. The interior space of Residence (10091) is in good condition with no problems to report. The carpeting and vinyl flooring were replaced in 1995. The rest of the interior finishes are original. Residence (10092), built in 1938, consists of concrete fiber siding walls on an 8 ft. foundation (basement). The siding was replaced in 2009. The roof, replaced in 1992, is asphalt shingles and is in good condition. The gutters were replaced at the same time as the roof. The storm doors were replaced in 1992, and a porch was added to the house in 2000. The treads are coming apart from the risers. The concrete path leading to the house is cracked and needs to be repaired. The house is heated via a heat pump that was installed in 1989 and is in good condition. The interior space of Residence (10093) is in good condition with no problems to report. The carpeting was replaced in 2000 and has been maintained well. The vinyl flooring was replaced in 1985. The rest of the interior finishes are original to the building. Residence (10094), built in 1948, consists of wood siding walls on a 4 ft. crawl space foundation. The walls are original to the building and are in good condition. The roof, replaced in 1992, is asphalt shingles and is in good condition. The gutters were replaced the same time as the roof. The storm doors were replaced in 1990. The exterior of the building overall is in good condition with new concrete fiber siding installed in 2007. The house is heated via a heat pump and circulated through ductwork. The heat pump was installed in 1989 and is in good condition. The house also has a wood stove that produces more than enough heat to keep the house comfortable in the winter. The interior space of Residence (10094) has a couple of issues, but overall is in good condition. A portion of the sheetrock in the house is cracking, mostly in the front bedroom. The cracks are located at the corners of the walls, and near the corners of windows. The carpeting, replaced in 2007 is in good condition. The bathroom was

111 December 14, 2010 HB 3489 Report
remodeled in 1998 and had wall finishes and toilet accessories replaced. The lighting was replaced in 1995. Residence (10095), built in 1962, consists of concrete fiber sided exterior walls on a slab on grade foundation. The siding was replaced in 2004 and is in good condition. The asphalt shingle roof was replaced in 1991 and is also in good condition. The only problem with moisture infiltration is at an exhaust vent that protrudes through the roof. The opening needs to be repaired to prevent further water infiltration. The house is heated via a heat pump and circulated through ductwork. Half of the power wiring was replaced in 1991; the other half is original to the building. The interior space of Residence (10095) has a couple of problems, but overall is in good condition. The kitchen was remodeled in 2010 with new cabinetry, floors, and countertops. The bathroom was completely renovated in 1999, including bathroom fixtures and accessories. The carpet was replaced in 1993 and has been maintained well. The wood paneling was replaced in 2001. The lighting was replaced in 1992. The rest of the interior finishes are original to the building. The Generator Building (10122), built in 1978, consists of CMU exterior walls on a slab on grade foundation. The roof, replaced in 1995, is asphalt shingles and is in good condition. The gutters were replaced the same time as the roof. A portion of the interior is supplied heat via electric radiation, which was installed in 1998. The building overall is in good condition. The interiors are all in good condition. The interior finishes were all replaced during a remodeling in 1998. The CMU blocks have minor cracks along the surface on the interior. The Garage Building (10126), built in 1937, consists of wood siding on a slab on grade foundation. The exterior walls are in good condition. The asphalt shingle roof and gutters, replaced in 1991, are in good condition as well. The building is not supplied with heat nor is it insulated. The interior is completely unfinished with no problems to report. The Domestic Pumphouse (10130), built in 1991, consists of wood panel walls on a slab on grade foundation. The exterior walls are in good condition. The roof is original to the building and is also in good condition. There is heat supplied to the building. The interior space is completely unfinished with no problems to report. The Hatchery Building (10140), built in 1948, consists of wood and CMU exterior walls on a slab on grade foundation. The wood siding was replaced with concrete fiber siding and new vinyl windows installed through out. The metal roof, replaced in 1980, is in good condition with no signs of moisture infiltration. The only other part of the exterior that has been replaced since 1948 is the rollup vehicular door, which was installed in 1999. Overall, the building is in fair condition. The building is heated via a boiler and radiators. The boiler was installed in 1956 is in good condition. The interiors of the Hatchery Building (10140) are mostly original and are in need of some repair. The interior walls of the shop space are sheetrock and need a new coat of paint. The exposed concrete slab ceiling in the shop also needs to be repainted.

112 December 14, 2010 HB 3489 Report
The hardware of an interior door in the shop needs to be replaced. In the office the wood floors need to be refinished and repainted. The hardware of the interior doors also needs to be replaced. The walls in the incubator room (metal and concrete) need to be repainted, as well as the exposed concrete ceiling. The interior doors need to be repainted as well. The unfinished concrete walls in the electrical room need to be repainted. The corridor walls and ceiling need to be repainted. Life Safety There are no life safety issues to report at this site. ADA Parking spots designated as handicap accessible are located adjacent to the pollution abatement pond. The parking surface is gravel and the unloading zone is not marked. In order to make the parking ADA compliant an asphalt pad with markings needs to be installed adjacent to the handicap accessible parking spots for an unloading area. A path leading from the parking area to the main access road needs to be installed as well. The main access road serves as an ADA compliant path leading to each of the rearing ponds, the holding pond adjacent to the Hatchery Building (10140), the fish ladder, and to the entrance of the path to the observation deck over the river. A portion of the main access road is at a slope of 1:14 for a stretch of 30’, making the path inaccessible. A ramp needs to be installed at this location or the asphalt needs to be re-graded to a 1:20 slope. The holding pond provides an opportunity for the public to view and feed fish. Most of the perimeter is an ADA compliant path, however a 40’ long portion of the path is loose earth and needs to be paved with asphalt. The concrete pond adjacent to the Hatchery Building (10140) is currently not handicap accessible. There is a change in elevation of 36” and the only means of accessing the pond is one set of steps. A ramp needs to be installed, and plans have already been made to begin this project. The only building on the site that is open to the public is the Generator Building (10122). A wood plank, most likely used to stop erosion, impedes the path to the entrance. The surface needs to be smoothed out to make the path ADA compliant. The entrance doors widths are more than 32” and there is more than 18” of clear space on the pull side. The threshold height is less than 1/4 “and the door closing force is less than 8”. The only problem with the entrance is the door has a knob, which is unable to be operated with a closed fist. The knob needs to be replaced with a handle. The bathrooms are the only interior spaces open to the public within the Generator Building (10122). There are a few problems with the ADA compliance of these spaces. The wheel chair turn around is only 42” diameter, as opposed to the required 60”. An electric radiation unit is slightly protruding into the path. The toilet stall is only 42” wide, as opposed to the required 60”. The handle on the door is not operable with a closed fist and needs to be replaced. There is only 27” clear

113 December 14, 2010 HB 3489 Report
below the lavatory rim, as opposed to the required 29”. There is one drinking fountain, without controls at the front, and is unable to be detected with a cane. An additional fountain needs to be installed at 36”.
2.4.8 Salmon River Hatchery
Not all deferred maintenance is required to operate facility, such as a new storage building. The Salmon River Hatchery was established in 1975. It is a relatively small and compact facility. Its proximity to Highway 18 and easy fishing access make it a popular visitor destination. In addition to the paving which needs to be replaced, the site drains poorly; a positive drainage system should be installed. There are recirculating pumps at the two larger rearing ponds. These are in good condition. Salmon River has one intake that is original to the hatchery. It is a pumped intake utilizing four pumps. The manager believes that the intake is poorly designed because an unnecessary amount of small and large debris is directed into the intake. The intake uses a traveling water screen to filter smaller debris (e.g. leaves) from the intake water. Electric service is provided to individual buildings by the switchgear in the Utility Building (21163). Utility company distribution terminates at a transformer adjacent to the utility building. Accomplishments: The hatchery has experienced many improvements which go towards bringing this facility up to current standards. Some of these were paid for through the deferred maintenance plan monies, Go-Oregon stimulus money, department funding paid for through Engineering, housing dollars, and R & E Grants. Deferred Maintenance: The Hatchery Building (21210) had its roof replaced. The original roof was of cedar shingle construction. It was replaced with 50 year shingles which are rated for winds of 110 mph and are resistant to algae and moss. Vents were added along with new gutters and downspouts. Residence (21209) received new hardy plank siding. House #21215 electrical panel was replaced; House #21209 received new carpets. House #21208 had a new bath tub module, and curved shower rod. House #21208 received a new wood burning stove, stove pipe, and cap, and houses #21208 and 21209 received built-in dishwashers. Go-Oregon: House #21216 was the big project completed with these funds. The Statler mobile home was removed due to its state of disrepair and replaced with a

114 December 14, 2010 HB 3489 Report
2009 Fleetwood manufactured home. Houses #21208 and 21209 received heat pumps. Engineering: The walkways on ponds 1 & 2 were deemed unsafe by Oregon OSHA and were therefore replaced. Intake screens were not up to the NOAA criteria and new ones were engineered, constructed, and installed to meet criteria. The hatchery intake pump #2 was rebuilt with a shaft oiling system to replace water lubrication. Pump #3 was rebuilt, including a new bowl, a stainless steel impeller and new electric motor. Pump #4 was rebuilt; pump #5 was rebuilt with a shaft oiling system, new bowl, stainless steel impeller and new electric motor. Pump#6 was completely replaced and a shaft oiling system installed. Housing Dollars: House #21209 carpets, windows, chimney, and water heater were replaced. Currently this house is having its kitchen remodeled with new cabinets, linoleum and some minor electrical work completed. R & E Grants: We have been successful in obtaining funds from the R & E Board to get needed items or projects completed. We have received a hydraulic trash pump and power unit for the purpose of cleaning the intake structure, money for designing a new adult collection pond/holding area, predator prevention nets over all rearing ponds and lake, and funds for a new Magic Valley 8” fish pump. Buildings: The following buildings were assessed as part of the maintenance master plan: Utility Building (21163), Residence #1(21208), Residence #2 (21209), Hatchery Building (21210), Mobile Home “Camelot” (21215) and Mobile Home “Statler” (21216). The “Statler” mobile home has since been replaced with a 2009 Fleetwood manufactured home. Residence #1 and #2 (21208 and 21209) are in good condition. All show proof of frequent maintenance, although there are some items (kitchen cabinets and other) that are due to be replaced. Residences (21208, 21209, and 21216) are heated with a combination of heat pumps and woodstoves. House #21209 is in need of some foundation work. The foundation has sunk down in one corner of the house and needs shoring. House #21208 should have its foundation raised by 1.5’ to prevent water from entering the house as happened in the 1999 flood. Vacant resident (21215) Camelot mobile home needs to be demolished and replaced with an on site pole-type structure. This could be a 60’ X 24’ X 14’ structure for the storage of equipment; there is a shortage of space to store equipment such as fish pumps, tractors, etc. The Hatchery Building (21210) is a sprawling facility housing offices, an apartment for a seasonal worker, incubation and spawning areas, visitors’ areas, research rooms, shops, storage and freezers. This building is in good condition; the primary requirements are to have the exterior painted and windows, lighting, and office updated. There is also a need to cut and excavate a trench the full length of the shop

115 December 14, 2010 HB 3489 Report
doors with sump pumps at each end to pump water out of the shop to prevent flood waters from entering and damaging equipment and structures. There was an off-site Pole Barn (21178-Demo) that was acquired in a land swap between ODFW and a nearby resident. The swap was intended to provide additional fishing access to the river, not additional land for the hatchery. The manager declared this building hazardous and an unattractive nuisance and it was demolished in 2009. Other Infrastructure:
Other infrastructure needs have been identified by the manager. 1. The domestic water line needs to be replaced. 2. Water delivery system that supplies water to rearing lakes, ponds, and
incubation, should be inspected. 3. Storm drainage system needs to be installed due to inadequate drainage. 4. Asphalt rearing ponds (21151) need to be resealed. 5. Asphalt surfaces need repaved. 6. Ponds 1 through 10 butterfly valves need replaced. 7. PVC intake manifolds on ponds 1 & 2 need to be replaced with aluminum. 8. Earthen abatement ponds need to be excavated. 9. Weir on Salmon River needs replaced and modified for more efficient fish
passage and flow directed into hatchery intake structure. 10. Update the adult collection/holding/sorting pond areas and make area not only
to hold broodstock, but in the off season a place where trout can be reared which would be in line with the 25 year plan for increased production of these species.
11. Heighten rearing ponds to prevent fish movement during high water events. 12. Replace or regalvanize grip strut. 13. Install chain link around intake structure and rail around fish ladder. 14. Install new dam boards at hatchery intake structure, fish ladder, and ponds,
preferably made of aluminum. These items listed are going to need to be addressed at some point in the future to bring this facility up to 21st century standards. Along with these recommendations, an attempt should be made to study the feasibility of some kind of water filtration/disinfection system due to increased scrutiny of drugs and chemicals used in the culture of our salmonids. Life Safety: No life safety issues were reported ADA: The rough asphalt-paved vehicular surfaces do not provide accessible paths throughout the site. Because the paved vehicular surfaces of the hatchery also serve as pedestrian circulation around the site (i.e. to the ponds), these surfaces are the first component of the accessibility path for a visitor. There are sufficient ADA-compliant parking spaces provided. There is a sloped sidewalk that provides access to the service building from the parking lot. The sidewalk has a slope of less than 1:20 so it is not considered to be a ramp and is not required to conform to the requirements of a ramp (handrails,

116 December 14, 2010 HB 3489 Report
landings). There is however an irregular and excessively high vertical transition between the sloped sidewalk from the parking lot and the flat sidewalk that leads to the visitor’s center. This transition averages 1 ½ inches and must be mitigated if the parking lot to visitors’ center path is to be compliant. The only building open to the public is the Hatchery Building (21210). The door at the entry to the visitor center requires approximately 12 pounds to open. This is excessive; the problem appears to be a combination of how the door fits in the frame and the operation of the closer. Two interiors in the Hatchery Building (21210) are open to the public. The interior of the visitor center has widows that allow visitors to view activities in both the incubation room and the spawning area. In addition, one restroom has been remodeled to be ADA compliant.
2.4.9 Trask River Hatchery The Trask Hatchery was originally established in 1916 and the site consists of two levels separated by approximately 300 yards of an asphalt/gravel road. For the most part, the main hatchery buildings and residences are located on the lower level at the site entry, and the intake, spawning shed, freezer and ponds are located at the upper level. Trask Hatchery as three gravity intakes originally constructed in 1927. Two are located on Gold Creek and the other is located on Mary’s Creek. With the exception of the valves that need to be replaced, the intakes are functioning properly. One significant problem is the deterioration of the asphalt paving. Although the asphalt has been patched and repaired in the past, it appears to have reached the end of its useful life and needs be resurfaced. The asphalt paving only extends 1/3 of the way into the upper site. Since the entire site is open to the public, the asphalt paving needs to be extended throughout the entire facility to provide an accessible surface. The water lines are in fair condition and numerous valves are reported to be leaking and beyond repair. The condition of the concrete ponds is described as good. The earth settling pond is in poor condition and needs to be replaced or at least lined with a membrane. Buildings: Residences that were inspected include Residence (29283), Residence (29284), Hatchery Building (29290), Storage Building (29306), Freezer Building (29324) and Spawning Shed (29330). Residence (29283) and Residence #3 (29284) are in generally good condition. Both show proof of frequent maintenance. The garage to Residence #2 (29283) is in very poor condition and most likely beyond repair.

117 December 14, 2010 HB 3489 Report
The Hatchery Building is also in good shape. It functions as a shop/office/staff room and incubation room. For the most part, the only issues that need to be addressed are the replacement of finishes and the replacement of a non-functional unit heater. Recent additions to the facility include a Freezer Building (29324) and a Spawning Shed (29330) that date from the mid 1980’s. The Freezer Building (29324) is a relatively new building and is in excellent condition. The Spawning Shed (29330) is open to a holding pond on one side. The building is in fair condition. Most of the roofs have either been recently installed or maintained properly and are in good condition. There are large moss accumulations on most of the roofs. The moss needs to be removed as a routine maintenance task. For all buildings, the heating systems are properly functioning unit heaters. Life Safety: No life safety issues were reported. ADA: The site has a single information kiosk and a portable toilet that are open to the public. In addition, the paved and graveled portions of the site around the rearing and holding ponds are considered open to the public. Neither the gravel nor asphalt paved surfaces are ADA compliant, and all surfaces need to be replaced. There are no compliant ADA parking or van parking spaces. In addition to the portable toilet, the Hatchery Building (29290) is also considered public. The threshold height at the entry is too high, and the office and restroom are two risers above the main hatchery floor level. Ramps will be required to make these paths accessible. In addition, the restroom is not compliant and if the intent is to use the portable toilet as an accessible restroom, appropriate signage must be provided.
2.5 Recommendations 2.5.1 Alsea Hatchery Recommendations
2.5.1.1 Water
Warm summer water can be problematic for the hatchery. The hatchery should continue to explore new technology that could improve water filtration, chilling, and re-use within the hatchery system. Drum lift and UV filtration should be incorporated for use during summer low flow periods.
2.5.1.2 Fish Passage Juvenile fish passage at the upper trap / water intake site can be problematic for down stream migrants, especially for juvenile Chinook during low summer flow

118 December 14, 2010 HB 3489 Report
periods. Design options should be explored to facilitate better juvenile down stream migration passage through the trap.
2.5.1.3 Intake Screen / Protection Fish screening criteria by NOAA Fisheries for anadromous salmonids is for screen openings not to exceed 3/32-inch in diameter and/or diagonally. The hatchery intake screen is 1/8 inch and does not meet NOAA Fisheries criteria. The intake screen should be retrofitted to meet NOAA Fisheries criteria. River bank erosion is occurring just upstream of the hatchery water intake and threatening an access road. Appropriate erosion control should take place to prevent damage from occurring to the water intake.
2.5.1.4 Release / Recapture Location Many anglers have voiced concerns in recent years over the lack of a consistent winter steelhead fishery in the mid to lower section of Alsea River. It is believed that because all the steelhead smolt releases occur directly from the hatchery located in the upper part of the basin that returning adults quickly migrate up river thereby only providing a short time period for a meaningful fishery in the mid to lower river. Exploration , evaluation and development of a lower to mid river smolt acclimation and adult recapture site should continue with the intent of spreading the fishery into the mid and lower Alsea River basin.
2.5.1.5 General Facilities Improvement Related Fish Management
Palmer Creek Acclimation / Trapping Facility: The Palmer Creek facility has been in full operation since 1998 and is a critical component for the implementation of the Siletz Basin hatchery program for winter steelhead. Activity includes the collection of returning adult hatchery steelhead and acclimation of juvenile steelhead prior to out-migration. There are two ponds located at the Palmer Creek that are used to acclimate the 50,000 juvenile winter steelhead. Over the years the ponds and raceways have become heavily silted in and are in need of maintenance to restore the proper depth and flow of water. This work would require the use of heavy equipment to dig out both ponds and raceways and relocate the sediment.
In addition, a seasonal picket weir is used to prevent upstream migration of returning adult hatchery winter steelhead in Palmer Creek and to direct them into an adult trap. The weir site is located in a floodplain with highly erodable soil types which makes weir stabilization, function and trapping difficult during rain events. A new semi permanent weir design (such as concrete footings) is needed for more effective adult steelhead collection and to prevent hatchery fish from spawning in natural habitat.

119 December 14, 2010 HB 3489 Report
2.5.2. Bandon Hatchery and Associated District Hatchery Programs Recommendations
2.5.2.1 Improvement of Broodstock Collection
Additional traps and or weirs for broodstock collection are needed in the Coquille Basin, where most broodstock are collected by in-river netting efforts. Very few swim-in fish are available for broodstock, because most releases are made at remote acclimation sites away from Bandon Hatchery. Netting efforts near our acclimation sites are suspect, due to the potential that unmarked adult fish may be the progeny of hatchery adults. Trap sites located geographically remote from acclimation/release sites are needed to obtain the annual wild component (target of 30% or greater) of our broodstock. There is a need for a better trap at Sevenmile to collect fall Chinook broodstock, including the need for a permanent easement with the private landowner. In-river traps in the South Fork and North Fork Coquille and/or tributaries would greatly improve our ability to meet broodstock collection goals for winter steelhead and fall Chinook. There is also a current and periodic need for replacement of broodstock collection equipment (e.g. dipnets, entanglement nets, pontoon boats, portable tanks, aerators). The intensive, seasonal nature of broodstock collection in multiple basins and for multiple fish species often strains our staffing level, and our ability to recruit suitable volunteers.
2.5.2.2 Improvement of Acclimation Many of our Chinook and steelhead acclimation sites are “primitive” or low-tech, which can be effective but also creates challenges. Specific needs are better screens, improvement of easements/agreement with landowners where necessary, accommodation of native fish passage needs during acclimations, and acclimation infrastructure that won’t be compromised during extreme weather events. Issues/challenges include in-channel vs. off-channel acclimation, site security, weather and water quality ranges during the acclimation period, and changing landowner attitudes. (See also Passage/Screening, below.)
For the Coquille winter steelhead HGMP, the Hantz Creek Acclimation site has been discontinued, and a replacement has not been developed. For the interim, this has caused us to make direct-stream release of the East Fork Coquille River steelhead smolts. Due to shifts in the angling effort between the East Fork and North Fork steelhead fisheries, we have shifted the 25,000/20,000smolt releases, respectively, to vice versa. In this HGMP, we identified the need for improved or additional acclimation sites and additional traps and/or adult broodstock holding ponds as “potential reforms and investments”. The acclimation of fall Chinook smolts at lower Ferry Creek (in the city of Bandon) was initiated a few years ago in attempt to develop a fishery in the Bandon harbor area, in much the same way that the Blossom Gulch acclimation has for the city of Coos Bay. This acclimation structure needs improvements in the keyway and dam boards that contain the fish for two weeks.
Temporary in-stream acclimation sites that are operated for two- to three-week acclimations do not provide upstream or downstream passage for native fish. In some cases, the acclimations are not during critical fish movement periods, and in other cases we have provided downstream outmigrant “flumes” that allow for native smolt emigration through our acclimation site. Nevertheless, there are temporary blockages

120 December 14, 2010 HB 3489 Report
that occur with the operation of acclimation sites. There is a need at some sites to either: (a) provide passage, or (b) develop an alternative acclimation site (e.g. create an out-of-stream acclimation rather than in-stream).
2.5.2.3 Passage/Screening There are two facility issues at Bandon Hatchery with regard to passage and screening: (a) the reservoir dams do not provide for fish passage upstream on Ferry and Geiger creeks, and (b) the screen perforations for Bandon Hatchery water intakes are 1/8’’ x ¾” slots, which does not meet NOAA Fisheries criteria. Given the impassable dam situation, anadromous fish are not at risk, but cutthroat and other native fishes inhabit the basins above the dams. The screening issue is one that is much more easily addressed than the passage issue. Replacing the current screen plates with those meeting NOAA Fisheries criteria can be logistically accomplished at moderate cost. Providing passage at the two reservoir dams would be a costly construction project, and would increase the risk of disease once anadromous adult salmonids were able to ascend upstream beyond the hatchery water supply intakes.
China Creek Trap, located on BLM property in the East Fork Coquille subbasin, has been assessed for repairs necessary due to deterioration and site changes that have altered juvenile fish passage conditions when the trap is not in use. ODFW Fish Passage engineers have agreed to visit the trap and develop options for retro-fitting and repairing the structure so that passage conditions will be improved. This trap is used primarily for wild winter steelhead broodstock collection.
2.5.2.4 Coho Smolt Production The coho smolt programs for the Coos and Coquille basins were discontinued and the only broodstock collection, spawning, and incubation that now occurs is for unfed fry releases to jumpstart unseeded habitat, especially where barriers have been recently removed, and only for one life cycle length (3 years for coho) in a given stream.. The smolt program was not discontinued for conservation reasons, but rather, due to issues with survival in the hatchery environment and low return to creel. Although we did conduct wild (unmarked) coho fisheries in 2009 in the Coos and Coquille basins, and perhaps will again in the future, the unfed fry releases do not currently have a harvest objective. In upcoming years, it is likely that we will re-evaluate the need to restore a hatchery coho smolt program in the Coos and Coquille basins for harvest augmentation. If wild coho populations flourish and wild coho fisheries continue to be viable in these systems, restoring a hatchery smolt program may not be necessary. Bandon Hatchery could accommodate the restoration of a hatchery coho smolt program, if accomplished as it was previously (i.e. rearing at Cole Rivers or Butte Falls hatcheries), and if coho production was traded-out for the increases in Chinook production that took place when the coho program was discontinued.
2.5.2.5 New Liberation Truck for Bandon Hatchery The liberation truck (Truck #63; circa 1985) currently shared by Bandon Hatchery and Elk River. Hatchery is wearing out and is in need of replacement. Its 2,000-gallon capacity is generally adequate for liberations around the District. Scheduling problems occur, especially in the spring time, when both hatcheries have intensive need for the truck in order to liberate trout, salmon, and steelhead to waters of their respective Districts. Logistically, and perhaps budget wise, it would be better for

121 December 14, 2010 HB 3489 Report
each hatchery to have a liberation truck so that scheduling would not be an issue, and time spent by hatchery personnel shuttling the shared truck between facilities would not be wasted.
2.5.2.6 Monitoring and Evaluation Major changes occurred in the Coos fall Chinook hatchery program, as a result of the 2005-06 STEP Propagation Project Review. Smolt and unfed fry production was eliminated toward a program entirely based on the release of spring presmolts. The Coos Chinook program now includes an intensive Monitoring and Evaluation Plan looking at contribution to fisheries, hatchery fish on natural spawning grounds, survival, the effectiveness of different strategies (e.g. acclimation vs. on-site rearing/release) and the effectiveness of different STEP facilities. The overall mark rate for Coos hatchery fall Chinook releases increased from 7-8% to over 30% with the new M&E Plan. The new Morgan Creek STEP facility was built in 2007, and began functioning that fall, including many improvements to fish cultural operations, reduced impacts to Morgan Creek, and reduced impacts to native fish. There is a need for long-term funding of monitoring and evaluation of hatchery programs. As Conservation Plans are developed, we anticipate a greater need to evaluate our hatchery programs in order to continue them under the NFCP. There is a need for greater monitoring to meet NFCP Interim Criteria (especially Hatchery Independence) pending the development of Conservation Plans. This especially applies to our steelhead programs, where ratios of hatchery fish on spawning grounds are not available. Funding for monitoring is currently grant-driven (e.g. R&E, SFR, PST) and “transient”, necessitating frequent re-application to entities that are reluctant to fund long-term projects.
It is anticipated that mark-selective fisheries will be more of the trend rather than exceptions as we move into the future. Also, marking to accommodate monitoring and evaluation will increase the need for facilities and funding. A dedicated marking trailer for the Coos-Coquille-Tenmile Fish District, housed at Bandon Hatchery would help us accomplish the marking requirements. Automated marking technology could accomplish this without the need for multiple additional staff. Temporary in-stream acclimation sites that are operated for two- to three-week acclimations do not provide upstream or downstream passage for native fish. In some cases, the acclimations are not during critical fish movement periods, and in other cases we have provided downstream outmigrant “flumes” that allow for native smolt emigration through our acclimation site. Nevertheless, there are temporary blockages that occur with the operation of acclimation sites.
The Bandon Hatchery operations plan and Coquille Chinook HGMP describes our “payback” program which exists primarily at the request of local STEP volunteers and anglers. The unfed fry release of up to 100,000 fry split between North and South forks was initiated about ten years ago due to the complaint that broodstock for the hatchery smolt program are collected from upriver-bound adult Chinook, while the smolt releases are made in lower tidewater where the primary fishery occurs. This release is presently occurring without evaluation.
An evaluation should be conducted to determine the justification (or lack thereof) of separating the Stock 44 and Stock 144 Coquille winter steelhead broodstocks. The initiation of this separation took place in the 1990’s, primarily due to perceived

122 December 14, 2010 HB 3489 Report
differences between fish returning to the South Fork Coquille vs. the North and East forks. The geology of the subbasins is different, with the South Fork being a hard-rock, volcanic formation, while the remainder of the basin was formed of uplifted, seafloor basalts overlain by thick deposits of sedimentary sandstone. Genetic samples were taken in the late 1990’s, but results were never received to justify the separation or return to a single Coquille broodstock.
This may be an evaluation that the Oregon Hatchery Research Center could help us design and conduct. Bandon Hatchery is able to continue with separate broodstocks without difficulty, but if that separation is not justified, the management of a single Coquille winter steelhead broodstock would simplify adult collection, holding, spawning, egg incubation, and rearing. The program would also likely benefit from increased numbers of family groups.
2.5.2.7 Chinook Spawning Channels The establishment of spawning channels is a concept that we’ve discussed that may benefit Chinook and chum salmon in the Coos system (considered to be gravel limited due to historic splash-damming). This approach has been implemented elsewhere in the Pacific Northwest, particularly in Washington and British Columbia. Our investigation of this concept has not gone very far as yet.
2.5.2.8 Consolidated Needs & Recommendations List:
Extend underground vacuum lines for pond cleaning. Acquisition of large (6”), trailer-mounted water pump for pathogen
treatment/abatement. Improve condition of the rearing ponds (cracks, pond bottoms). Concrete sidewalk cracks adjacent to Residence #1. Residence 1's interior repairs (upstairs ceiling paint peeling, kitchen
casework doors and drawers do not close properly and wood is deteriorating,, water heater replaced.)
Residence 4’s windows need to have the weather stripping replaced. Residence 4’s cabinets are beginning to warp around the sink. Residence 2 demolition. After Res. 2 is demolished, a laundry facility needs to be installed. Cold storage bldg.—two doors need replaced, doorknobs and locks
installed Ferry Creek Spillway—inadequate size; needs to be engineered and
expanded. Permanent restrooms for public use. ADA pathways at ponds and restrooms. Additional traps/weirs for broodstock collection in the Coquille Basin.

123 December 14, 2010 HB 3489 Report
Improve trap at Sevenmile including easement with landowner. Periodic replacement of broodstock collection equipment. Acclimation sites—
o better screens, o easements/agreements with landowners, o fish passage during acclimations, o infrastructure to withstand extreme weather/water flow ranges.
Improve keyway and damboards at lower Ferry Creek acclimation. China Creek Trap—juvenile fish passage, repair deterioration; Long-term funding for monitoring and evaluation of hatchery programs. Dedicated marking trailer for the Coos-Coquille-Tenmile Fish District. Evaluate justification of separate Stock 44 & 144 StW broodstocks. Funding for STEP fish food. STEP facility fish cultural and water quality equipment.
2.5.3 Butte Falls Hatchery Recommendations
2.5.3.1 Water Butte Falls Hatchery uses surface water from the South Fork Big Butte Creek. A low level of anadromous fish production has been documented in the creek above the falls at Butte Falls. While the risk of disease is not above that at any other surface water facility, and may be lower due to the falls, a water supply devoid of anadromous fish would reduce risk. No such option is known at this time.
2.5.3.2 Broodstock Collection Production of anadromous fish at Butte Falls Hatchery has been focused on providing assistance to programs outside the Rogue watershed, primarily the Coquille and Umpqua. Broodstock collection recommendations can be found for the entries for each program in this document. Trout production is the backbone of recreational fishing in Oregon and fish production at Butte Falls Hatchery. Preference surveys have documented the importance of hatchery rainbow trout for Oregon anglers. Decreases in trout production can have profound impacts for fish managers.
Broodstock collection in relation to trout fisheries is more correctly stated as stock management. Additional assistance is needed to help managers decide on issues surrounding the use of diploid versus triploid trout, and whether the use of other stocks can improve fishery contribution or address particular fishery management challenges.

124 December 14, 2010 HB 3489 Report
2.5.3.3 Monitoring and Evaluation Production of anadromous fish at Butte Falls Hatchery in recent years has been focused on providing assistance to programs outside the Rogue watershed, primarily the Coquille and Umpqua. Monitoring and evaluation recommendations can be found for the entries for each program in this document. Trout production is the backbone of recreational fishing in Oregon and fish production at Butte Falls Hatchery. Preference surveys have documented the importance of hatchery rainbow trout for Oregon anglers. Decreases in trout production can have profound impacts for fish managers. A creel report and angler preference survey conducted at Howard Prairie Reservoir will provide additional detail about the fishery as well as the fishery contribution of the different release strategies. It is important to note that the draft creel survey reports 34,500 angler trips to Howard Prairie Reservoir in 2009. This level of effort is near the post-treatment levels reported at the highly publicized Diamond Lake fishery in 2008 and 2009 (roughly 40-50K angler trips). Regular funding of creel surveys at stocked waterbodies would evaluate the contribution of trout programs to the fishery, and would facilitate adjustment of trout allocations when/where needed. Funding for more thorough studies aimed at evaluating fish management at individual waterbodies would allow a quicker response and help identify creative solutions to problems.
2.5.3.4 Production Butte Falls Hatchery is ready to resume full production in 2010 after an outbreak of infectious hematopoietic necrosis virus (IHNV) occurred at the hatchery in 2006. Program changes will mean somewhat different numbers and stocks of fish for future production at the hatchery.
2.5.3.4.1 Coho - Umpqua Stock 18
The Coquille Stock 44 coho program was eliminated in favor of additional production of fall chinook for the Coquille basin. Umpqua Coho stocks 18 and 55 were described in the 2003 HGMP as being incubated at Butte Falls for early rearing, with presmolts being shipped back to Rock Creek Hatchery. While production of stock 55 has been discontinued, production of stock 18 continues (60,000 smolts). These fish could be reared at Butte Falls Hatchery.
2.5.3.4.2 Fall Chinook—Coquille Stock 44
The current program is 154,600 smolts released at Sevenmile Creek (80k), Cunningham Creek (Coquille H. S. Science class—10K); lower Ferry Creek holding pen (10k); and the proposed Hall Creek acclimation site (up to 54.6k). At least 25% will be finmarked prior to release, and a portion of those will be marked ad-CWT. This program supports a highly successful and popular fall chinook fishery in the Coquille River. Creel surveys indicate a significant contribution to the fishery by these hatchery fish and a healthy naturally produced population. As stated in 2006, elimination of this program at Butte Falls Hatchery would reduce the fish available
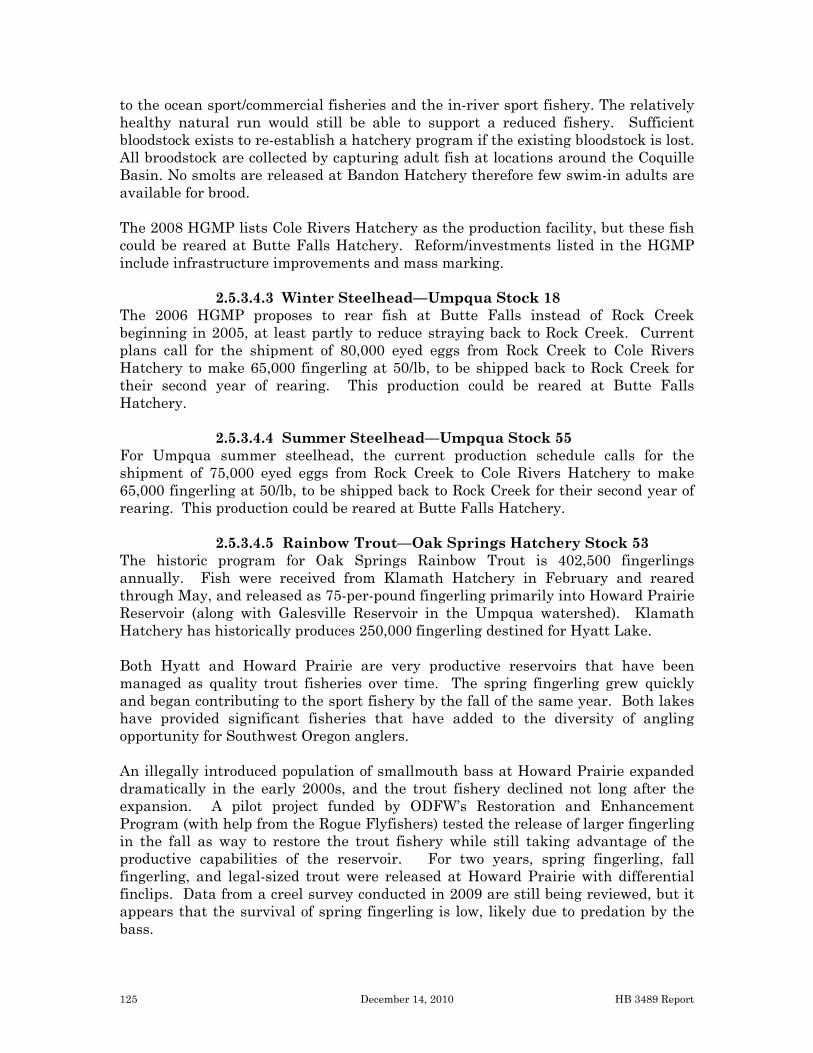
125 December 14, 2010 HB 3489 Report
to the ocean sport/commercial fisheries and the in-river sport fishery. The relatively healthy natural run would still be able to support a reduced fishery. Sufficient bloodstock exists to re-establish a hatchery program if the existing bloodstock is lost. All broodstock are collected by capturing adult fish at locations around the Coquille Basin. No smolts are released at Bandon Hatchery therefore few swim-in adults are available for brood. The 2008 HGMP lists Cole Rivers Hatchery as the production facility, but these fish could be reared at Butte Falls Hatchery. Reform/investments listed in the HGMP include infrastructure improvements and mass marking.
2.5.3.4.3 Winter Steelhead—Umpqua Stock 18 The 2006 HGMP proposes to rear fish at Butte Falls instead of Rock Creek beginning in 2005, at least partly to reduce straying back to Rock Creek. Current plans call for the shipment of 80,000 eyed eggs from Rock Creek to Cole Rivers Hatchery to make 65,000 fingerling at 50/lb, to be shipped back to Rock Creek for their second year of rearing. This production could be reared at Butte Falls Hatchery.
2.5.3.4.4 Summer Steelhead—Umpqua Stock 55
For Umpqua summer steelhead, the current production schedule calls for the shipment of 75,000 eyed eggs from Rock Creek to Cole Rivers Hatchery to make 65,000 fingerling at 50/lb, to be shipped back to Rock Creek for their second year of rearing. This production could be reared at Butte Falls Hatchery.
2.5.3.4.5 Rainbow Trout—Oak Springs Hatchery Stock 53
The historic program for Oak Springs Rainbow Trout is 402,500 fingerlings annually. Fish were received from Klamath Hatchery in February and reared through May, and released as 75-per-pound fingerling primarily into Howard Prairie Reservoir (along with Galesville Reservoir in the Umpqua watershed). Klamath Hatchery has historically produces 250,000 fingerling destined for Hyatt Lake. Both Hyatt and Howard Prairie are very productive reservoirs that have been managed as quality trout fisheries over time. The spring fingerling grew quickly and began contributing to the sport fishery by the fall of the same year. Both lakes have provided significant fisheries that have added to the diversity of angling opportunity for Southwest Oregon anglers. An illegally introduced population of smallmouth bass at Howard Prairie expanded dramatically in the early 2000s, and the trout fishery declined not long after the expansion. A pilot project funded by ODFW’s Restoration and Enhancement Program (with help from the Rogue Flyfishers) tested the release of larger fingerling in the fall as way to restore the trout fishery while still taking advantage of the productive capabilities of the reservoir. For two years, spring fingerling, fall fingerling, and legal-sized trout were released at Howard Prairie with differential finclips. Data from a creel survey conducted in 2009 are still being reviewed, but it appears that the survival of spring fingerling is low, likely due to predation by the bass.

126 December 14, 2010 HB 3489 Report
At this time production calls for the release of fall fingerling at Howard Prairie. Fish released at six to seven inches in length (eight fish per pound) in late September/early October appear to reach eight to ten inches in length by opening day of the following year. The production schedule lists a 100,000 fish release, but district staff estimates that a minimum of 150,000 are needed for the fishery. The district is attempting to fund the additional 50k through supplemental trout purchases under the 25 Year Recreational Angling Enhancement Plan. Plans call for the use of triploid trout when the fishery is stabilized at Howard Prairie. The fish for Howard Prairie are currently being produced at Cole Rivers Hatchery. Hatchery staff report that an additional 50K fall fingerling could be produced, but no more due to pond space limitations. Cole Rivers has successfully met production, but the perception among many anglers is that copepods on trout “began appearing” at Howard Prairie only after production switched from Butte Falls to Cole Rivers Hatchery. Copepods are common in rainbow trout in Lost Creek Reservoir upstream from the hatchery. The final creel report and the results of an angler preference survey will provide additional detail about the fishery at Howard Prairie Reservoir, as well as the fishery contribution of the different release strategies. It is important to note that the draft creel survey reports 34,500 angler trips to Howard Prairie Reservoir in 2009. This level of effort is near the post-treatment levels reported at the highly publicized Diamond Lake fishery in 2008 and 2009 (roughly 40-50K angler trips). It is easy to overlook the importance of sport fisheries for rainbow trout in the face of advocacy for anadromous and warmwater fisheries. The 2006 Oregon Angler Preference Survey reported that anglers who fished in Oregon over the previous 12 months fished primarily for rainbow trout (73%) compared to salmon in freshwater (33%), steelhead (30%), and warmwater fish (26%). Preliminary results from Howard Prairie show that anglers most often target trout (78%) at the reservoir. This stock consistently provides for a significant angling opportunity that would be drastically reduced if this program were eliminated.
2.5.3.4.6 Rainbow Trout—Cape Cod Hatchery Stock 72 Production of Roaring River stock rainbow is the primary duty at Butte Falls Hatchery. Under full production, most of the legals produced by Butte Falls Hatchery are stocked in the Tenmile Coos Coquille District (60,615). The next highest production is 55K trout at 12 fish per pound for Rock Creek Hatchery. Some additional legals are produced for the Rogue and South Coast districts, and some trophy trout are produced. The hatchery fishing pond has developed into a very popular fishery for the Butte Falls community. As stated for the previous stock, trout production is the backbone of recreational fishing in Oregon. Preference surveys have documented the importance of hatchery rainbow trout for Oregon anglers. Decreases in trout production can have profound impacts for fish managers.

127 December 14, 2010 HB 3489 Report
2.5.4 Cedar Creek Hatchery Recommendations
2.5.4.1 General Facilities Improvement Related Fish Management in the Basin
Three Rivers Weir and Trap: Three Rivers contains naturally-produced OCN Coho (ESA Threatened), fall Chinook, spring Chinook, winter steelhead, and coastal cutthroat trout. A concrete apron and stem wall with hydraulically operated picketed panels completely spans Three Rivers and allows ODFW to prevent upstream passage of hatchery-origin fish during most flow conditions. However, at high flows, the barrier is ineffective at blocking passage which results in passage of hatchery fish to upstream spawning areas. ODFW attempts to allow volitional passage of wild fish during a period in the fall by lowering the picketed panels, but this method of operation has been ineffective at most flow levels. In addition, the existing trap and ladder are not operable at high flows, and at low flow fish (hatchery and wild) tend to congregate in a pool directly below the barrier and not enter the ladder and trap. In aggregate, the design of the existing weir, trap, and ladder does not allow for efficient collection and removal of hatchery fish, and does not allow for effective volitional passage, or trap and pass, of wild fish to the considerable amount (17 miles) of upstream habitat. A conceptual design for improving the facility was developed in 2006 by TetraTech/KCM Inc. in conjunction with USFWS, NOAA Fisheries, and ODFW; however, ODFW has not been able to acquire the approximate $2 million for its construction. This project remains a high priority and is consistent with fish management needs for the basin.
2.5.4.2 Program Needs Spring Chinook Background: Cedar Creek Hatchery produces approximately 110,000 Nestucca River origin spring Chinook subyearling smolts for release into the Nestucca Basin and collects eggs for STEP hatch boxes and classroom incubators.. Potential Modification: Pending completion of Coastal Spring Chinook Conservation Plan, but will need funding to re-start CWT program. Facility Upgrades Needed: Pending completion of Coastal Spring Chinook Conservation Plan
2.5.5 Elk River Hatchery Recommendations
2.5.5.1 Buildings & Driveways
The Service, Hatchery, Electrical, Generator, and Steelhead buildings are generally in good condition, with no significant maintenance needs. The three residential buildings (08072, 08073, 08074) are all generally in good condition but 08072 and 08074 have various maintenance needs. Building 08072 maintenance needs include replacement of the asphalt shingle roof, carpet, and rear sliding door. In addition,

128 December 14, 2010 HB 3489 Report
floor insulation should be installed. Building 08074 maintenance needs include replacement of the asphalt shingle roof, floor insulation should also be installed.
The domestic water delivery system was upgraded in 1997 and is sound and reliable. However, underground pipelines and valves, although useable, are original to the facility and should be replaced due to corrosion. The asphalt driveway and hatchery surface areas are in good condition with the exception of minor deterioration of the asphalt along the edge of the drainage ditch.
2.5.5.2 Raceways
Twenty four modified, concrete Burrows-type rearing ponds are on site. Fourteen of the ponds are original 1968 construction and ten more ponds were added in 1971. Some minor cracks have occurred over the 40+ year use of these ponds, but they all remain useable and should be in service for many years without problems. Some 4” rearing water supply valves leak slightly, but none currently require replacement.
2.5.5.3 Adult Collection and Holding Facilities Adult trap and holding facilities for Elk River fall Chinook salmon include a fish ladder, an alley-type trap and 10 separate aluminum-framed holding pens. Two of the rearing ponds (epoxy coated and fenced) are used during winter months as adult holding ponds for Chetco River fall Chinook salmon. A stand-alone building supplied with pathogen free well water houses the polyurethane-coated adult holding ponds for Chetco River winter steelhead. The collection and holding facilities are all sound.
2.5.5.4 Water Presently Elk River Hatchery has adequate intake and meets discharge criteria. More stringent water quality or water conservation measures in the future should be anticipated. Thus the hatchery should continue to explore new technology that could improve water filtration, chilling, re-use within the hatchery system, and cleansing techniques for discharge, especially the design and construction of an abatement pond.
The fish rearing water supply is pumped from directly from Elk River. All intake pumps were refurbished in 1996. However, one of the intake pumps (#7) has damaged seals and should be refurbished.
The incubation water supply is pumped from a sub-surface well with a 7.5 horsepower line-shaft turbine pump. The screened incubation headbox, pipelines, valves and alarm system are all sound. Fiberglass incubation stacks are original to the facility and should be replaced due to degradation.
2.5.5.5 Broodstock Collection Elk River fall Chinook brood is collected onsite at the hatchery trap. Broodstock consists primarily of returning hatchery-produced Chinook. The only naturally-produced brood currently utilized in the program consists of wild Chinook that

129 December 14, 2010 HB 3489 Report
volitionally enter the hatchery trap. On average naturally-produced fall Chinook account for 3.5% of the broodstock. Additional broodstock collection methods need to be employed, likely tangle netting and/or seining lower Elk River, in order to meet broodstock goals identified in the HGMP. Brood collection of Chetco fall Chinook is accomplished by seining in the tidewater portion of the Chetco River. Seining is conducted by a SFR funded 3 person crew, with assistance from the STEP program. Collection goals for number of fish, age composition, and proportion of hatchery fish are easily attained on most years Brood collection of Chetco winter steelhead is accomplished by tangle netting in the lower 18 miles of the Chetco River. Tangle netting is conducted by a SFR funded 3 person crew. Tangle netting is supplemented with hook and line collection by local STEP volunteers. Collection goals for number of fish and proportion of hatchery fish are attained on most years.
2.5.5.6 Monitoring and Evaluation Elk River Fall Chinook (035):
Elk River fall Chinook have been intensively monitored since 1992 in order to meet Pacific Salmon Treaty criteria for an Exploitation Rate Indicator Stock. Monitoring includes coded-wire tagging 200,000 Chinook annually and conducting creel and spawning survey projects to recover returning tagged adults. The intensive monitoring allows for the estimation survival rates, spawning escapement (hatchery and wild), and exploitation (harvest) of Elk River fall Chinook.
Mass marking of the remaining Elk River fall Chinook production was implemented in 2007 (2006 brood). Continued mass marking is necessary to adequately monitor the proportion of hatchery-produced fall Chinook spawning in the Sixes River and is also necessary in order to collect wild broodstock from Elk River. Chetco River Fall Chinook (096): Monitoring currently consists of minimal spawning surveys. The surveys allow for the estimation of escapement and the proportion of hatchery-produced Chinook in the spawning population. Monitoring necessary to evaluate survival rates and/or contributions to fisheries is not currently conducted. Release of coded-wire tag groups and subsequent recovery of tags is necessary to evaluate survival and ocean contribution of hatchery produced Chetco fall Chinook. Coded-wire tagging is also necessary to evaluate the success of proposed changes in release strategy (including acclimation).
South Coast spawning surveys need to be conducted annually in order to assess escapement, stray rates, and efficacy of various release strategies.

130 December 14, 2010 HB 3489 Report
A creel program should be implemented periodically in order to assess the contribution of hatchery-produced fall Chinook to the in-river fishery. Mass marking of Chetco River fall Chinook production was implemented in 2007 (2006 brood). Continued mass marking is necessary to adequately monitor the proportion of hatchery-produced fall Chinook spawning in the Chetco River.
Chetco River Winter Steelhead (096):
Releases of Chetco winter steelhead have been mass marked with an adipose fin-clip since 1994 (1993 brood). The fin-clipping allows for the estimation of the proportion of hatchery-produced steelhead in the natural spawning population, based on observations from spawning surveys conducted by the OASIS Project and tangle net sampling. A creel program should be implemented periodically in order to assess the contribution of hatchery-produced winter steelhead to the fishery.
2.5.5.7 Liberation Truck The liberation truck (Truck #63; circa 1985) currently shared by Bandon Hatchery and Elk R. Hatchery is wearing-out and is in need of replacement. Scheduling problems occur, especially in the spring time, when both hatcheries have intensive need for the truck in order to liberate trout, salmon, and steelhead to waters of their respective Districts. Logistically it would be better for each hatchery to have a liberation truck so that scheduling would not be an issue, and time spent by hatchery personnel shuttling the shared truck between facilities would not be wasted.
2.5.5.8 Hatchery Residence Elk River Hatchery operates as a four man station. Since 1996, when a mobile home structure was condemned and destroyed, on site housing has consisted of three residences. With one employee living off site standby rotation falls to the other three employees. Replacing the fourth residence at Elk River Hatchery would improve staff efficiency and standby rotation.
2.5.5.9 Production No significant changes in the current production schedule are anticipated. The facilities at Elk River hatchery are sufficiently flexible to accommodate any potential changes in production as a result of ongoing conservation planning efforts.
2.5.6 North Nehalem River Hatchery Recommendations
2.5.6.1 General Facilities Improvement Related to Fish Management in the Basin None identified.

131 December 14, 2010 HB 3489 Report
2.5.6.2 Program Needs Coho Background: This 100,000 coho smolt program currently uses two broodstock sources in alternate years over the three year generation cycle (two years of NF Nehalem Stock 32 and one year of Fishhawk Stock 99). These broodstock are essentially locally founded from wild steelhead in the Nehalem Basin. Wild origin broodstock have not been integrated into the stock 99 program since at least 1995 and the stock 32 program since at least 1986. Potential Modification: The North Coast Watershed District (NCWD) will be conducting an assessment of the existing coho program at Nehalem Hatchery to determine the performance of each stock relative to management objectives. There is a general perception by Nehalem basin anglers that Nehalem hatchery coho do not contribute well to the bay and river fishery. If this is true, one potential action would be to investigate the feasibility of incorporating Nehalem Basin origin wild coho broodstock into the hatchery program. Facility Upgrades Needed: There are no needed improvements identified at this time other than general facility upgrades identified elsewhere in this report. Winter Steelhead Background: This 90,000 winter steelhead smolt program uses North Fork Nehalem (stock 32) hatchery broodstock originally derived from locally-founded wild steelhead. This program produces an additional 40,000 winter steelhead smolts for release into the Necanicum Basin. Potential Modification: The NCWD is currently assessing the feasibility of constructing an acclimation facility on the lower North Fork Nehalem River. The intent of this facility will be to acclimate a portion of the North Nehalem production prior to release in to the North Fork Nehalem River. Acclimation of smolts in the lower river prior to release may help hold fish in angling areas longer and prevent rapid migration and straying to areas upstream of Nehalem Hatchery. This program will be run primarily by the NCWD STEP Biologist and volunteers. Facility Upgrades Needed: There are no needed improvements identified at this time other than general facility upgrades identified elsewhere in this report. Fall Chinook Background: Nehalem Hatchery rears Trask origin (stock 34) fall Chinook fingerlings during the spring and summer for eventual release of 25,000 sub-yearling smolts into the Necanicum Basin. This program has been ongoing since the 1996 brood year and supplements a modest sport fishery in the Necanicum tidewater and river.

132 December 14, 2010 HB 3489 Report
Potential Modification: This program has never been directly evaluated to determine fishery benefits or to measure its effect on Necanicum Basin wild fall Chinook. The NCWD intends to conduct an evaluation of this program in the near future. Future modifications to the program, if warranted, could include establishment of locally-derived wild fall Chinook broodstock or total elimination of the Necanicum Fall Chinook program. Facility Upgrades Needed: There are no needed improvements identified at this time other than general facility upgrades identified elsewhere in this report.
2.5.7 Rock Creek Hatchery Recommendations 2.5.7.1 Buildings & Driveways
Vinyl windows and new siding should be installed in the residential and out buildings which have not yet been improved. Four of the residential buildings need to modernize the kitchens. The hatch house needs to be re-roofed and the building needs to be re-modeled. Presently, the hatchery uses the workshop area for spawning. Either a new workshop should be constructed or a spawning room so that the spawning area is a dedicated space. Additionally, office space in the hatch house needs to be improved to provide more desk/computer space and be more accessible to both the public and staff. A publicly accessible office will facilitate group check-ins and tours when the RockEd classroom is complete. There will also be an increasing demand on the restroom facilities at the hatchery with the RockEd classroom, thus the restrooms should be improved to meet ADA standards. Driveway and hatchery surface areas should receive a new coat of porous asphalt.
2.5.7.2 Raceways
All of the raceways should receive a concrete or rubberized coating to facilitate raceway cleaning and longevity plus reduce abrasions to fish. As needed, the concrete should also be refurbished or capped. Raceways 9 through 14 should be reconstructed to meet modern standards. All raceways should receive appropriate new valves and plumbing improvements to facilitate water flow, water conservation and fish health needs. Brood pen raceways need improved crowders and lifts for efficient sorting and handling of fish. Brood pens should also have covers installed for shading. Juvenile raceways should have predator covers installed.
2.5.7.3 Water Water intake and discharge will be one of the most limiting factors of hatchery operations in the future. Presently Rock Creek Hatchery has more than adequate intake and meets discharge criteria. Warm summer water is problematic for the hatchery, but continuing adjustments have allowed the hatchery to operate successfully. More stringent water quality or water conservation measures in the future should be anticipated. Thus the hatchery should continue to explore new technology that could improve water filtration, chilling, re-use within the hatchery system, and cleansing techniques for discharge.

133 December 14, 2010 HB 3489 Report
For more immediate water improvement, the hatchery should extend the North Umpqua intake screens to the water sheer to reduce sedimentation and filling with gravel. Treatment filtration and UV capacity should be updated in the hatch house and installed in the brood and steelhead juvenile raceways. Abatement ponds should be checked for future capacity needs and potential filtration systems.
2.5.7.4 Broodstock Collection Winchester Dam is the primary facility for collecting wild brood for the summer steelhead and spring Chinook hatchery programs. If the dam were removed, new methods of collecting wild brood to meet production goals would be necessary. A new fish ladder and sorting facility is scheduled to be built on Rock Creek, near the hatchery. This structure could be used for collecting hatchery brood, but few wild fish. Brood collection of South Umpqua fish is accomplished by using Canyon Creek, Galesville and South Umpqua Falls fishways. A temporary trap at Happy Valley is also used for collecting fall Chinook and wild coho. Hook and line methods are also successfully used for the South Umpqua programs. Brood goals are normally met unless there are unusual stream flows which impact the effectiveness of the traps or hook and line efforts.
2.5.7.5 Monitoring and Evaluation Rock Creek Hatchery and the STEP programs within the Umpqua basin have marked a high percentage of their fish for the last decade. This has allowed the basin to monitor hatchery stray rates and help track escapement. Much of the monitoring on the North Umpqua comes from the Winchester Dam fish counting station. However, the district also tracks hatchery strays by summer pool counts and spawning ground surveys.
Although the South Umpqua does not have a counting facility it has several fish ladders that are used for monitoring hatchery strays. Over 90% of the winter steelhead are acclimated to Canyon Creek. Thus the ladder at Canyon Creek can be used to document trends in run strength and the percentage of returning hatchery fish. Data such as age, length and sex ratios can also be collected. Spawning and snorkeling counts are also periodically used in the tributaries 10 miles above and below Canyon Creek to search for hatchery strays. In addition, South Umpqua Falls serves as an annual monitoring site to track hatchery strays. With South Umpqua coho, the acclimated hatchery fish return to the base of Galesville Dam which is the end of anadromy. Periodically, total counts are conducted at the Galesville fishway to document the number of returning hatchery fish. The district also uses coho spawning counts and hatchery strays at Winchester Dam for tracking coho straying rates and potential escapement.
2.5.7.6 Production The North Umpqua hatchery coho program was discontinued in 2006. This program failed to meet the stray rates for the NFCP and according to the Coho Conservation Plan put the population at risk. After the new fish ladder and sorting facility is constructed at Rock Creek, the department may conduct a review of this program to

134 December 14, 2010 HB 3489 Report
see if stray rates goals could be achieved and whether or not restoring the hatchery coho program would fulfill department and societal goals for angling opportunity and recreation. Trout production could be increased by 10,000 to 20,000 to provide a fall “lunker” program. It has been noted in the district that stocking large trout just before Labor Day at various lakes and impoundments is extremely popular.
2.5.8 Salmon River Hatchery Recommendations 2.5.8.1 Water
Warm summer water can be problematic for the hatchery. The hatchery should continue to explore new technology that could improve water filtration, chilling, and re-use within the hatchery system. Drum lift and UV filtration should be incorporated for use during summer low flow periods.
2.5.8.2 Screening
Fish screening criteria by the NOAA Fisheries for anadromous salmonids is for screen openings not to exceed 3/32-inch in diameter and/or diagonally. The hatchery intake screen is 1/8 inch and does not meet NOAA Fisheries criteria. The intake screen should be retrofitted to meet NOAA Fisheries criteria.
2.5.8.3 General Facilities Improvement Related Fish Management Siletz Falls Trapping Facility: The Siletz falls fish trap was built in the mid 1950’s and has been in full time operation since 1994. This trapping facility is a critical component to the implementation of the Siletz Basin hatchery programs for summer and winter steelhead. Summer steelhead brood stock are collected from this site and taken to Cedar Cr. Hatchery for spawning. Eggs are then transferred to the Salmon River Hatchery and reared to smolt for release into the Siletz River. The Siletz fish trapping facility includes a tower that houses two hydraulic winches and an engine used in transporting fish across the river from the trap to a transport truck. There is a need for the tower to be sand-blasted and repainted to maintain the structural integrity of the tower. Heavy cables are used to transport fish and people across the river safely and securely. The cable are worn and weathered and in need of replacement.
2.5.9 Trask River Hatchery Recommendations
2.5.9.1 General Facilities Improvement Related to Fish Management in the Basin
Gold Creek Weir: The hatchery weir on Gold Creek blocks all upstream fish passage. There is habitat upstream suitable for spawning and rearing of coastal cutthroat trout and winter steelhead. ODFW needs to evaluate the production

135 December 14, 2010 HB 3489 Report
potential for wild steelhead and cutthroat above the weir, and as consistent with existing or future management plans, consider passing wild steelhead and cutthroat above the weir. Any plans to pass wild fish will be accompanied by a cost:benefit analysis and a complete assessment of pathogen risks. Screening upgrades and water treatment facilities would be considered to be a necessary component of the analysis. East Fork Trask Water Diversion Dam: The East Fork Trask water diversion dam supplies water to Trask Pond, a satellite facility of Trask Hatchery. The steep pass fish ladder associated with the dam may be size selective and does not meet ODFW fish passage guidelines. The NCWD will potentially be undertaking a review of the fish passage at this site in association with meeting fish management objectives for the basin. Assistance will be required from ODFW Fish Passage and Screening program.
2.5.9.2 Program Needs Fall Chinook Background: (Issue #1) - The existing program produces 113,000 fall Chinook (Trask origin Stock 34) subyearling smolts for release into the Trask River. This program has been underway since the early 1900’s. Prior to mass marking which began with the 2007 brood year, some wild fall Chinook were likely incorporated into the hatchery broodstock. (Issue #2) - Trask Hatchery currently supplies up to 280,000 eyed-eggs for use in STEP unfed fry and classroom incubator programs. To increase fishery benefits and reduce competition with wild Chinook fry, the NCWD is currently exploring the feasibility of converting up to 100,000 of the unfed fry program to a hatchery subyearling smolt program. (Issue #3) – Loss of funding for CWT marking precludes are ability to monitor fishery contribution of this stock. Potential Modification: (Issue #1) - The NCWD will be investigating the need to begin purposefully integrating wild Chinook into this program. (Issue #2) – Ideally, any additional smolt fall Chinook releases would occur directly from Trask Hatchery so that returning adults could be captured and interaction with wild adults could be kept to a minimum. This will require use of acclimation space at Trask Hatchery, which when considered with other program needs, may be limited. (Issue #3) – Restore funding for CWT program. Facility Upgrades Needed: (Issue #1) - There are no needed improvements identified at this time other than general facility upgrades identified elsewhere in this report. (Issue #2) - May need to review use of available acclimation space and water supply needs and make modifications where feasible.

136 December 14, 2010 HB 3489 Report
Spring Chinook Background: Trask Hatchery produces approximately 245,000 Trask River origin spring Chinook subyearling smolts for release into the Trask and Wilson rivers and collects eggs STEP programs including 100,000 for the Whiskey Creek (STEP) facility. Modifications to these programs may be needed as action items are identified in the Coastal Spring Chinook Conservation Plan which will be completed by 2011. Potential Modification: Pending completion of Coastal Spring Chinook Conservation Plan but will need funding to re-start CWT program Facility Upgrades Needed: Pending completion of Coastal Spring Chinook Conservation Plan
2.5.10 Hatchery Program Assessment
ODFW has little capacity to evaluate whether state funded coastal hatchery programs are meeting their freshwater harvest objectives, or to evaluate the impact of the programs on wild stocks. The following areas highlight the basic research and monitoring needed to adequately assess the performance and impact of hatchery stocks. Hatchery Program Monitoring Stock Assessment: Coded-wire tags have typically been used to collect information on the harvest and escapement of a given release group of hatchery salmon. CWTs are recovered in sampling programs along the west coast of North America. The recovered tags are read under a microscope and assigned back to the release group. The number of tags recovered is then expanded to account for the sampling rate and the release group size to provide an estimate of fishery specific harvest or escapement. For most hatchery programs, with the exception of Salmon River and Elk River fall Chinook, ODFW does not typically sample CWTs in Freshwater fisheries or on the spawning grounds. This issue is addressed below. Since 2009 the coho stocks released by ODFW’s coastal hatcheries were not marked with CWT’s because of budget shortfalls. Beginning in 2010, long term funding that paid for marking the remaining production of Chinook was eliminated by NOAA. Thus, in 2010 there was no marking of Chinook or coho at state funded hatcheries (except Salmon River and Elk River fall Chinook).
Implications: Beginning with the 2009 brood-year, ODFW will have no data on the performance of each coho brood-year in the ocean fisheries. Similarly, if funding becomes available for FW fishery evaluation (see below) we will be unable to collect brood specific harvest data. Beginning with the 2010 brood-year, ODFW will have no data on the performance of each Chinook brood-year. Thus, ODFW will have no

137 December 14, 2010 HB 3489 Report
means of evaluating whether changes in Chinook or coho hatchery programs have an effect on program goals. Freshwater fishery (FW) monitoring. ODFW currently maintains hatchery releases of salmon or steelhead in 13 coastal basins. Of these, the freshwater fisheries in only two (Salmon River and Elk River fall Chinook) are sampled regularly to determine total harvest, mark rate, and collect CWTs. Implications: ODFW is unable to accurately assess the annual contribution of hatchery programs to freshwater harvest for the majority of programs. Similarly, ODFW is unable to assess the effect of program changes on FW harvest. Current evaluation methodology: To evaluate the harvest of a given brood-year in the freshwater fisheries ODFW biologists instead rely on punch card data. These cards are completed by anglers and returned voluntarily at the end of each angling season. Because the reporting is voluntary it is subject to several biases, outlined below: Calculating harvest from punch cards-likely error sources: To calculate brood specific freshwater harvest a variation of the following formula is applied Brood-year Harvest = Σ(((HY × PH)/P3)+((HY+1 × PH)/P4)+((HY+2 × PH)/P5)+((HY+3 × PH)/P6))) Where HY = total harvest in year Y PH = The proportion of hatchery fish in the total harvest for that year P3-6 = The proportion of age 3-6 fish in the total harvest for that year Total Harvest (HY): This value is generally estimated using punch cards. The returned punch card harvest data is expanded to account for the anglers that did not return cards. Potential sources of error:
Anglers mis-report the catch area (known to occur in several fisheries) Non-representation of all anglers in the returned cards –i.e. cards may
only be returned by successful anglers. Reporting may be inconsistent between basins Misreporting of species
The percentage of hatchery fish in the harvest (PH): Some fisheries only allow the retention of adipose clipped fish. In these cases the percentage of hatchery fish in the harvest is essentially 100%. For all other fisheries, the percentage must be estimated using punch card data. Since 2003, anglers have been asked to record a W for each unclipped fish that is caught. This distinction is used to estimate the number of clipped versus unclipped fish caught in the fishery. In addition, most hatchery programs have begun clipping the adipose fin on 100% of the production. This will improve the estimate of the percentage of hatchery fish in the harvest as there will no longer be a correction for the mark rate.

138 December 14, 2010 HB 3489 Report
Potential sources of error: Anglers may not recognize adipose clips Anglers fail to record W for unclipped fish
Age of the harvested fish (P3-6): This can be estimated using either FW CWT recoveries (from the hatchery, spawning grounds, and any fishery sampling) and assuming they are representative of the harvested fish, or by collecting scales from harvested fish. ODFW currently relies on scale data collected in the late 1980’s early 1990s to determine the age class structure of steelhead caught in FW fisheries, and CWT data to determine the age class of Chinook and coho. Potential sources of error Scale data:
Age class structure of the fish may have changed since last surveys due to changes in hatchery practices or environmental conditions.
Yearly age class structure may differ from average age class structure CWT data:
Lack of hatchery collection for many programs (associated with releases at acclimation sites) means that low numbers of CWT’s are collected in FW. Thus, the age class estimates have very wide confidence intervals.
Recently, cuts to the coastwide CWT program have meant that the majority of programs no longer have a representative release group. Thus, this data will no longer be available.
In the Salmon River and Elk River fall Chinook fisheries the punch card data consistently overestimate harvest (Figs. 4 and 5).

139 December 14, 2010 HB 3489 Report
0
500
1000
1500
2000
2500
3000
3500
4000
4500
1994 1995 1996 1997 1998 1999 2000 2001 2002 2003
Brood-year
Estim
ated
num
ber
of a
dults
har
vest
e
CWTPunch card
Figure 4. Comparison of harvest estimates in Salmon River freshwater fisheries based on punch card and CWT data. CWTs are collected during a creel program operated by ODFW under the PST.
0
500
1000
1500
2000
2500
3000
3500
4000
4500
1994 1995 1996 1997 1998 1999 2000 2001 2002 2003
Brood-year
Est
imat
ed n
umbe
r of a
dults
har
vest
e
CWTPunch card
Figure 5. Comparison of harvest estimates in Elk River freshwater fisheries based on punch card and CWT data. CWTs are collected during a creek program operated by ODFW under the PST. Conclusion: The uncertainty surrounding punch card estimates of FW harvest highlights the need for an independent assessment of harvest to ensure program goals are being met.

140 December 14, 2010 HB 3489 Report
Spawning grounds: For most populations, there is very little/no data on the number of hatchery fish present on spawning grounds. The Salmon River and Elk River fall Chinook spawning grounds are surveyed as part of the Pacific Salmon Treaty agreements. Based on CWT recoveries during the surveys, ODFW estimates that 319-5,697 adult fall Chinook strayed onto the spawning grounds for a given broodyear. For the remaining basins, ODFW’s OASIS project randomly surveys several coastal streams each year but there is no effort made to expand the recoveries as the scale of resolution (watershed) is too coarse. Implication: ODFW has little data to indicate the degree of straying for most coastal hatchery programs. Wild Broodstock Programs: The Oregon Department of Fish and Wildlife has implemented wild steelhead broodstock programs at many coastal hatcheries with the goal of improving angler opportunity and minimizing the impact of hatchery fish on wild stocks. However, there is little information with which to evaluate the success of the wild broodstock programs in terms of contribution to the fisheries and the impact on wild stocks. To manage these programs according to their objectives ODFW would like to conduct research into the following: Wild population:
Determine the population structure of each basin. Basins containing a single population would be managed differently from those contained more than one population.
Hatchery population
Evaluate the effect of capture, transport, and holding techniques on pre-spawning mortality.
Evaluate post-release behavior of hatchery stocks. Evaluate the relative harvest rates on hatchery production from wild-
origin and traditional hatchery stocks Evaluate the relative harvest rates of wild and traditional hatchery stocks Evaluate impacts from removing wild adults from the naturally spawning
population and determine rates of incidental catch-and-release mortality in fisheries.
Without this information ODFW has little means of knowing whether wild broodstock programs are meeting their fishery and conservation objectives. Artificial Selection: There has also been little evaluation of whether changes in hatchery practices or the use of multi-generation hatchery broodstocks have constrained fisheries (time and space), and whether such effects can be reversed. For example, several programs no longer release fish at acclimation sites to minimize the straying of returning adults. Anecdotal evidence suggests that this practice has resulted in spatially confined fisheries. ODFW would like to evaluate methods to extend run timing and fishing effort while minimizing the impact to wild populations. Similarly, there is concern that broodstock collection practices select for

141 December 14, 2010 HB 3489 Report
fish that migrate more rapidly through freshwater. ODFW would like to assess the differences in migratory behavior of wild and hatchery adult fish. Predator Attraction Hypothesis: Several studies have shown that large numbers of juvenile salmon (steelhead and coho) are consumed within the estuary after release. It is not clear whether this level of predation is consistent with historical (pre-human influence) levels. However, one hypothesis holds that the number of predators has increased as a result of the hatchery releases. If true, the survival of wild fish may also be affected. To address this issue ODFW would like to evaluate the following
Is the level of predation similar in river systems that have no hatchery influence relative to those with hatchery releases.
Can hatchery practices be modified to reduce predation, e.g. modify release timing.
2.5.11 Hatchery Research and Monitoring Program
ODFW currently has no staff dedicated to explicitly monitoring and evaluating coastal hatchery programs. Elements of some programs are monitored by several individuals but there is no cohesive program that covers the entire coast. In other regions (e.g. Willamette and North East Oregon), hatchery programs are intensively monitored by federally funded ODFW staff. For example, in the Willamette system (5 hatcheries) ODFW has 9 full time staff and an annual operating budget of ~ $894,000. This level of investment provides a baseline of data for evaluating the effect of program changes as well as the opportunity to experiment with improvements to the program. ODFW estimates that at least 2 FTE staff are required to ensure state funded hatchery programs are adequately monitored. These programs were monitored intensively in the 1980’s and early 1990’s. However, since that time budget cuts have eliminated the program. At a minimum one staff member should be dedicated to monitoring anadromous fish programs and one to freshwater fish programs at state run facilities. In addition, funding would ideally be available to cover program costs associated with experimentation and evaluation. This would improve our ability to develop research an monitoring programs that assess the effect of hatchery practices on harvest and straying. These positions would also work closely with the Oregon Hatchery Research center to ensure that facilities are adopting the most recent science in their operating procedures.
2.5.12 Monitoring and Evaluation Recommendations

142 December 14, 2010 HB 3489 Report
The ODFW has identified two basic needs for monitoring and evaluation of coastal hatchery programs: 1) Established programs should include a plan and associated funding for long term monitoring. 2) Changes in programs (e.g. broodstock, release sites etc) should include a plan for monitoring the effectiveness of the change and the likelihood of unintended consequences.
2.5.12.1 Long Term Monitoring
2.5.12.1.1 Chinook and coho salmon:
To monitor the survival, distribution of ocean catch, contribution to fisheries, and extent of straying in coastal releases of salmon smolts, the department recommends the use of coded wire tags. To be effective these releases must be associated with freshwater fishery and escapement sampling at the time the tagged fish return. Ideally, each program would be monitored on an annual basis. However, the cost of such intensive monitoring is likely to be prohibitive. Therefore, the department proposes to investigate using a rotating panel design to evaluate stock performance. A similar design is used by ODFW to evaluate habitat, juvenile production, and adult returns of salmon and steelhead (Stevens 2002)
Coded wire tags are used throughout the west coast of the US and Canada to provide information on survival and exploitation rates in fisheries. Historically, ODFW used CWT’s to monitor the majority of Chinook and coho smolt releases on the Oregon Coast. Within the last 5 years, reductions in funding have eliminated >90% of these programs. The utility of CWT data is dependant on a number of factors, including release group size, sampling rate, exploitation rate, and survival rate. Changes in the magnitude of any of these factors will dictate the inferences that can be made from a particular set of CWT return data. ODFW is currently reviewing the use of CWTs throughout the state. This workgroup will develop specific guidelines for release groups sizes and sampling programs that may be used to evaluate specific questions for coastal hatchery programs.
The following discussion highlights the factors that will be considered by ODFW when designing a CWT program for coastal hatchery Chinook and coho.
We conclude with recommendations for implementing a monitoring program based on two broad objectives:
Monitoring total harvest vs. hatchery return and fishery distribution Monitoring fishery specific exploitation
2.5.12.1.1a Factors affecting the uncertainty of CWT survival estimates:
A 2008 workgroup of the Pacific Salmon Commission (Pacific Salmon Commission Coded Wire Tag Workgroup. 2008. An action plan in response to Coded Wire Tag (CWT) Expert Panel Recommendations. Pacific Salmon

143 December 14, 2010 HB 3489 Report
Comm. Tech. Rep. No. 25: 170 p.) outlined a number of factors that contribute to uncertainty in CWT survival and exploitation estimates. The following discussion is taken directly from the workgroup review.
The principal factors that influence the uncertainty surrounding CWT-based estimates of exploitation rates (ERs) can be separated into two groups, factors affecting precision and those causing bias. In this section we focus on the following major factors affecting precision:
number of fished tagged, sample rates for fisheries and escapements, and uncertainty in estimates of total harvest or escapement used to calculate
sample expansion;
and those affecting the bias of estimates: sample coverage for fisheries and escapements, non-representative (non-systematic) sampling, and bias in catch or escapement estimates.
These factors can all be addressed during program planning or sample design. Thus, the quality of ER estimates can be changed and improved through efforts to improve tagging and sampling. The PSE used in the discussion below to represent uncertainty is a dimensionless statistic that expresses precision as a proportion of the estimated value:
The precision of the estimates of tagged fish and ERs depends on the number of tagged fish observed in the harvest or escapement (m), the sample rate (φ), and the precision of the estimate of the total catch or escapement being sampled (PSE(N)). The number of tags observed depends on the number of tags released and the sample rate, as well as survival of the tag group and ER in the fishery. The tag group size, sample rate, and PSE(N) are components of the sample design.
The estimate of tagged fish or ER become more precise with increasing number of tags observed. The average PSE for an estimate of ER of 10% is shown in Figure X1, where it is assumed that all fisheries are sampled at a rate of 20%, escapements at 100% and the total harvest is estimated either at a PSE(N) of 0 or 30%.. The trends in the figure are not linear, but the PSE(ER) decreases fastest as the number of tags increases from 0 to 10 tags, at which point an estimate of tagged fish (R) has a PSE of 30%. This level of uncertainty has been set as the maximum acceptable by at least two groups evaluating the precision of estimates of tagged fish and ERs, the Washington Joint State-Tribal Workgroup that developed the coho cohort analysis database (Marianna Alexandersdottir, personal communication) and the PSC CTC. Both groups set 10 observed tags per stock-specific cohort as a minimum number required in a fishery stratum to reliably estimate ERs. A fishery stratum could be fishery and period for coho salmon and fishery-period and age for Chinook salmon. As the number of observed tags increase beyond 10 the PSE(R) decreases

144 December 14, 2010 HB 3489 Report
asymptotically towards zero. When PSE(N) is greater than zero, i.e., harvest or escapement is estimated, then the PSE(R) is limited by the precision of the total, i.e., if PSE(N) is 30%, the PSE(R) cannot be smaller than 30% (Figure 6)
Figure 6. The precision (PSE) of the estimate of an ER of 10% versus the number of CWTs recovered in the fishery stratum for which the ER is being estimated, at two levels of precision for the estimate of total catch or escapement abundance (PSE(N)) being sampled (0%, or known without error, and 30%), given a 20% sampling rate in the fishery and 100% in the escapement.
Tag Group Release Size
Increasing the tag group size will increase the number of tagged fish recruiting to fisheries and escapement and consequently, the number of tagged fish in samples to calculate fishery parameters. The PSE for the estimate of a 10% ER decreases asymptotically as the size of the tag group increases (Figure 7). However, the survival of the group to return also affects the precision, as shown in Figure 7, as fewer tagged fish return for stocks with lower survival rates, resulting in less precise estimates of ERs. Survival to age 2 after release cannot be directly controlled through sample design, but as these tag groups are generally hatchery groups, hatchery practices can affect survivals. Therefore, hatchery stocks with low survivals require larger releases; if survivals are very low, they may not be good candidates for use as indicator stocks.

145 December 14, 2010 HB 3489 Report
Figure 7. The precision (PSE) of the estimate of an ER of 10% versus the number of CWTs released at two levels of survival to age 2 (1% and 0.5%), given a 20% sampling rate in the fishery and 100% in the escapement and knowledge of the total catch abundance without error (PSE(N)=0).
Sample Rates in Fisheries
The sample rate in fisheries is an important sample design factor. As sample rates increase, the number of tags used to estimate cohort size and ERs increases and the PSE for ERs decreases asymptotically (Figure 8). The examples illustrated in Figure 8 use a release group of 200,000 fish and average survival rates of 1%, which results in a cohort of 2,000 fish. Figure 8 shows the precision for ERs of 2.5% and 10%, assuming all total catches sampled were known and that all escapement returned to the hatchery and were sampled at 100%.

146 December 14, 2010 HB 3489 Report
Figure 8. The precision (PSE) of the estimate of an ER of 10% and 2.5% for a fishery versus the sampling rate in the fishery, given a 100% sampling rate in the escapement, knowledge of the total catch abundance without error (PSE(N)=0), a CWT release group size of 200,000, and a survival from release to age 2 of 1%.
Sampling Rates in Escapement
Over the last 20 years, there has been a general decrease in total ERs (due to increasing regulation of fisheries) for many stocks and increasing rates of escapement. Consequently, recoveries of CWTs in escapements are increasingly important to determine the precision of ER estimates because the escapement represents a larger proportion of the total cohort.
The proportion of the escapement that returns to a hatchery where it can be easily sampled and the proportion that are found on the spawning grounds are important factors affecting the precision of CWT-based estimates of ERs. The precision of the estimate of the ER depends on the proportion spawning outside the hatcheries, the sampling rate on natural spawning grounds where tagged fish are likely to be found, and uncertainty in estimates of total spawning escapement. If natural escapements are not sampled for CWTs, bias in estimation of ERs will be a major concern where significant numbers of hatchery fish are on the spawning grounds. Examination of Figure 9 shows the effect of spawning of tagged fish outside of the hatchery, where sampling rates are lower than in the hatchery. Given increasing total brood ER, the PSE of the total ER decreases as the ER increases, due to the increase in tags observed in the fisheries. When 100% of the escapement returns to the hatchery and is sampled at 100%, then the PSE(ER) rapidly falls to 10%. However, if all tagged fish in the escapement are in the natural spawning grounds, then the PSE(ER) does not decrease as rapidly as fewer tags are recovered in escapement (Figure 9).

147 December 14, 2010 HB 3489 Report
Figure 9. The precision (PSE) of the estimate of ER versus the magnitude of the ER estimate for the case where 100% of the escapement returns to the hatchery that has 100% sampling and the case where 100% goes to the spawning grounds that have a 5% sampling rate. A release size of 200,000 is used with survival to Age-2 of 1% and the fishery sampling rate is 20%.
2.5.12.1.1b. Monitoring survival and exploitation of Oregon coastal coho and Chinook.
The following is a general discussion of the likely tagging and sampling levels needed to accurately evaluate coastal programs, based on consideration of the factors identified above.
The majority of Oregon’s coastal Chinook and coho programs release 50-100,000 smolts annually. Ocean and terminal (Freshwater) ERs vary between 3-43% and 6-56%, respectively, of the total surviving fish (Table 53). Survival rates vary between 0.4 -10%. The survival of the North Umpqua coho releases is biased by dam counts of returning fish at Winchester Dam.
Table 62. Exploitation rates and survival of coho and Chinook stocks released by ODFW's coastal hatchery facilities. Note: Stocks which release <30,000 smolts,

148 December 14, 2010 HB 3489 Report
have no hatchery recoveries, or for which there are no freshwater fishery harvest estimates are not included.
Species Stock Release Basin
Brood years
Average smolt
release number
terminal ER
Ocean ER Escapement Survival
Coho Nehalem (32) Fishhawk (99) Nehalem 1995-2004 186,113 19.55% 9.71% 71% 1.15%
Coho Trask (34) Trask R 1995-2004 153,321 6.03% 8.47% 86% 4.00%
Coho Umpqua (55) Umpqua R, Nth Fk 1995-2004 105,695 26.71% 3.23% 70% 10.48%
Spring Chinook Trask (34) Trask R 1994-2003 101,982 48.03% 32.00% 20% 1.13%
Spring Chinook Trask (34) Wilson R
1994-2003 (excl 2001) 145,063 25.90% 43.33% 31% 0.43%
Spring Chinook Nestucca (47) Nestucca R 1994-2003 116,402 56.56% 34.75% 9% 0.87%
Spring Chinook Umpqua (55)
Umpqua R, Nth Fk 1994-2003 316,232 15.89% 16.23% 68% 3.43%
Fall Chinook Trask (34) Trask R 1994-2003 78,768 30.72% 22.07% 47% 2.66%
Fall Chinook Salmon R (36) Salmon R 1994-2003 202,592 27.16% 29.36% 43% 1.69%
Fall Chinook Coos (37) Coos Basin 1994-2003 760,767 15.65% 38.23% 46% 0.98%
Fall Chinook Elk R (35) Elk R 1994-2003 325,508 10.80% 26.49% 63% 3.05%
Under different scenarios of survival, exploitation, and release group size, we can calculate the sampling rate needed to return at least 20 tags (Fig 10)

149 December 14, 2010 HB 3489 Report
Given a release of 200,000
0%
10%
20%
30%
40%
50%
60%
70%
80%
90%
100%
0% 5% 10% 15% 20% 25% 30% 35% 40% 45% 50%Exploitation Rate
Min
imum
Sam
ple
Rat
eSurv = 0.1%Surv = 0.5%Surv = 1.0%Surv = 1.5%Surv = 2.0%Surv = 4.0%
Given a release of 100,000
0%
10%
20%
30%
40%
50%
60%
70%
80%
90%
100%
0% 5% 10% 15% 20% 25% 30% 35% 40% 45% 50%Exploitation Rate
Min
imum
Sam
ple
Rat
e
Surv = 0.1%Surv = 0.5%Surv = 1.0%Surv = 1.5%Surv = 2.0%Surv = 4.0%

150 December 14, 2010 HB 3489 Report
Given a release of 50,000
0%
10%
20%
30%
40%
50%
60%
70%
80%
90%
100%
0% 5% 10% 15% 20% 25% 30% 35% 40% 45% 50%Exploitation Rate
Min
imum
Sam
ple
Rate
Surv = 0.1%Surv = 0.5%Surv = 1.0%Surv = 1.5%Surv = 2.0%Surv = 4.0%
Given a release of 30,000
0%
10%
20%
30%
40%
50%
60%
70%
80%
90%
100%
0% 5% 10% 15% 20% 25% 30% 35% 40% 45% 50%Exploitation Rate
Min
imum
Sam
ple
Rat
e
Surv = 0.75%Surv = 0.5%Surv = 1.0%Surv = 1.5%Surv = 2.0%Surv = 4.0%
Figure 10. Minimum sampling rate for the evaluation of freshwater fishery impacts given an expected exploitation rate (2.5-50% of total recoveries), release group size (30,000-200,000), and survival estimate (0.1-4%). The estimates are based on the probability of recovering 20 tags in the fishery being >80%, thus giving a

151 December 14, 2010 HB 3489 Report
PSE of 30% in instances where the total harvest is known or is estimated with little bias.
Using the estimates of harvest and survival from Oregon’s coastal programs (Table 53) and the modeled data in Figure 10, we can calculate the release group size and sampling rate needed under different evaluation scenarios. In each of these scenarios we assume that 20 tags will be recovered in the strata of interest (e.g. ocean fisheries) to stay below a maximum PSE of 30% (ref above). Ocean fisheries are sampled at 20% per Pacific Salmon Treaty agreements.
Scenario 1: Monitor Ocean versus Freshwater exploitation, total survival, and the distribution of ocean harvest.
This monitoring program provides the most basic level of information and may be used to estimate the relative proportion of harvest in freshwater versus ocean, and the relative proportion of the release that is harvested versus escapes to the hatchery or spawning grounds. For the majority of Oregon’s coastal stocks this level of monitoring is adequate. Under this scenario ODFW is unable to determine point estimates of exploitation in specific ocean fisheries with any degree of confidence. The sampling rates in Table 54 are based on a minimum ER of 30% in freshwater (70% in ocean). A number of Oregon’s Chinook and coho are exploited at less than 30% in the terminal fishery. Therefore, tagging levels or sampling rates will have to be adjusted accordingly.
Table 63. Sampling rate in freshwater terminal fisheries given a range of release group sizes and survivals.
tag group size
30000 50000 100000
0.5 50% 32% 16%
1 27% 16% 8%
1.5 18% 11% 5%surv
ival
2 13% 8% 4%
Given the current ocean sampling rate (20%), average survival of coastal Chinook and coho stocks and ocean exploitation rates (Table 54), we typically expect to recover at least 20 tags in all ocean fisheries combined for release groups of >30,000. Where expected survival (harvest + escapement) is less than 1.5%, release group sizes of 30K are insufficient to meet the 30% PSE guideline for estimation of ocean harvest.

152 December 14, 2010 HB 3489 Report
Scenario 2: Monitor ocean fishery specific exploitation.
Given that the majority of ODFW’s coastal Chinook and coho programs release <100,000 smolts annually, it is unlikely we will be able to accurately determine exploitation in ocean fisheries that harvest 5% or less of the total harvest (given the current 20% sampling rate) (Table 55). For fall Chinook, estimates of fishery specific exploitation may be inferred from the Salmon River and Elk River fall Chinook programs which tag ~200,000 smolts annually. As mark Selective fisheries become more common it may become necessary to obtain more accurate estimates of exploitation of North migrating stocks off Washington, Canada, and Alaska.
Table 64. Tag group size to ensure sufficient recoveries in a fishery that harvests 1-20% of the total harvest given a survival range of 0.5-2%
Exploitation Rate
1% 5 10 20
0.5 2413461 482690 241344 120671
1 1206729 241344 120671 60334
1.5 804486 160895 80447 40222 surv
ival
2 603364 120671 60334 30166
Frequency of sampling:
Each of these monitoring programs could be run annually. However, the cost is likely to be prohibitive. As an alternative, candidate programs on the North and South Coast could be monitored annually, and the remaining programs would be evaluated periodically. The viability of this approach should be investigated given the changes in ocean conditions and fishery regulation that might impact comparisons among programs.
2.5.12.1.2 Steelhead:
Long term monitoring of steelhead releases from ODFW hatcheries should include provision for evaluating freshwater harvest, stray rates, and survival.
Harvest:
The majority of steelhead harvest occurs in freshwater in the basin of release. Given this, and the high cost of CWT programs, the department does not recommend the use of CWT’s for monitoring exploitation and survival. Instead, ODFW recommends

153 December 14, 2010 HB 3489 Report
investigating the relationship between total catch reported on harvest cards (returned by anglers each year) and total catch from a creel analysis. In addition, semi annual collections of scale data from harvested fish would allow the assignment of harvest to a particular brood-year. The relationship between harvest card data and creel harvest estimates may then be used to estimate total harvest in subsequent years based on harvest card data alone. Ideally, the utility of harvest cards would be evaluated periodically to account for changes in demographics and reporting accuracy.
Straying:
The percentage of hatchery origin steelhead spawning naturally in the wild poses a great deal of concern to fisheries managers. ODFW has a number of policies that set guidelines as to the percentage of stray hatchery fish permitted to spawn naturally in individual basins and subbasins. Thus, it is important for fisheries managers to know the numbers and distribution of hatchery strays spawning naturally in the wild. The department recommends monitoring stray rates in basins that release hatchery steelhead by conducting annual spawning ground surveys. These surveys would ideally be integrated with the current steelhead monitoring program but would provide additional funding to assess stray rates at the basin level.
2.5.12.2 Short-term Monitoring
The ODFW recommends that changes in coastal salmon and trout programs be evaluated for their effectiveness at meeting management goals. For example, changes in release site, release number, broodstock, and rearing practices should be evaluated to ensure they have the desired effect. Depending on the management goal monitoring may target any of the following:
Juveniles: Residualism of juveniles following release Survival of juveniles in freshwater Interaction of juveniles with wild fish Migratory behavior following release
Adults: Timing of return Contribution to harvest Stray rates Interactions with wild fish
Within this category ODFW currently recognizes a need for consistent evaluation of wild steelhead brood stock programs with respect to each of these factors. The following discussion outlines a research plan to quantify the utility of using wild steelhead broodstocks in place of traditional hatchery broodstocks.
2.5.12.2.1. Oregon Coast Steelhead Broodstock Management Research Plan

154 December 14, 2010 HB 3489 Report
The intention of this plan is to provide a comprehensive list of research questions that should be answered to provide managers with sufficient data to decide how to manage the hatchery steelhead programs on the Oregon coast for maximum harvest benefit while minimizing the impact to wild stocks.
2.5.12.2.1a Objective 1: Evaluate population structure of steelhead within each basin of interest
Background: To determine the potential impact of broodstock collection methods and offsite releases of hatchery-reared juveniles we must first understand the population structure of steelhead in each basin where hatchery fish are being released.
Task 1.1 Conduct mtDNA analysis of scale/tissue samples collected within each basin.
Task 1.2: Determine whether there are any sub-populations within the basin that warrant separate management actions.
2.5.12.2.1b Objective 2: Evaluate the phenotypic variation in adult migratory behavior.
Background: Within an adult population there may be several behavioral phenotypes, including fish that migrate rapidly versus slowly, fish that are aggressive versus passive, and fish that mature in the lower river versus the upper river. To determine whether current broodstock collection techniques bias the contribution of a subset of phenotypes towards future generations we must understand the variation in behavioral phenotypes within each basin. The use of this information will depend on management preferences for minimizing selection relative to wild traits, or maximizing selection relative to desirable traits for a fishery.
Sub-Objective 2.1: Evaluate the variation in freshwater residence timing of fish from the traditional and wild broodstocks and from wild fish caught in the lower river.
Task 2.2.1: Mark (radio tag) adult fish (hatchery and wild) in the lower river and document migratory behavior until spawning.
Task 2.2.2: Assess variation in the stage of maturity at entry to the river.
Task 2.2.3: Determine whether there are any predictors of migratory behavior during early FW residence
2.5.12.2.1c Objective 3: Evaluate the impact of collection techniques on fish health:
Background: Handling and holding induce considerable stress in both hatchery and wild fish. In addition, physical injury may result from handling that leads to

155 December 14, 2010 HB 3489 Report
infection. Both stress and disease lower the fitness of breeding individuals and may impact the fitness of resulting offspring.
Task 3.1: Measure the stress response in adults collected by angling or netting (F, Glu, Ions, Lactate)
Task 3.2 Measure physical injury as a result of angling or netting
Task 3.3: Measure post capture recovery, survival, and fitness in the holding facility
Sub-Objective 3.1: Evaluate methods to improve pre-spawning survival and health.
Task 3.1.1: Evaluate the efficacy of using anaesthetic during transport from the capture site to the holding facility
Task 3.1.2: Measure post capture recovery, survival, and fitness in alternative holding facilities (tanks vs. raceways vs. artifical streams)
2.5.12.2.1d Objective 4: Evaluate the likely effect of hatchery stocks on wild steelhead stocks within the basin
Background: To ensure the outcomes of management actions are consistent with the Native Fish Conservation Policy ODFW must determine the likely impact of hatchery releases (both traditional and wild broodstocks) on wild stocks.
Sub objective 4.1 Evaluate post-release behavior of hatchery stocks.
Task 4.1.1 Measure residualism, diet, competition with wild fish, timing of migration, and survival of juvenile hatchery fish to the ocean
Task 4.1.2 Measure adult survival and migratory behavior (migration rates, straying etc)
Sub objective 4.2: Evaluate the potential impact of strays on the fitness of wild stocks
Task 4.2.1 Estimate the likelihood of breeding with wild fish (linked to task 4.1.2)
X.2.1e Objective 5. Determine the relative contribution rate of hatchery broodstocks to freshwater fisheries.
Task 5.1: Conduct creel to estimate capture of wild vs. broodstock fish. (Linked to Task 4.1.2)

156 December 14, 2010 HB 3489 Report
3. Performance Criteria
3.1 Water Quality and Disease Prevention
3.1.1 General Review and Evaluation of Hatchery Effluent Quality
The quality of hatchery effluents may be affected by the presence of total suspended and settleable solids in effluents, and use of drugs and chemicals to treat eggs and fish. Hatchery effluents may gain temperature from the atmosphere particularly during the summer months. A settling or pollution abatement pond can minimize the concentrations of pollutants in hatchery effluents before discharge and comply with the NPDES permit limitations.
Temperature:
During summer months, cold water fish like salmon and trout may easily get stressed. On the contrary, pathogens at warmer environment get vigorous growth or multiplication causing more diseases to fish. Consequently, more drugs or chemicals are used to treat or control fish diseases and parasites, which eventually affect the effluent quality. Although effluent temperature is a reflection of the ambient temperature of supply water, yet it may gain a few decimal points of heat from the air through hatchery operations. The NPDES permits require that effluent temperature shall not exceed the maximum limitation of 77oF, although there are habitat specific temperature limitations during salmonids spawning, migration, and juvenile rearing (OAR 340-041-0028). The effluent temperatures in coastal hatcheries were monitored for a period of three years and it was observed that July and August were the highest temperature months. The three years average temperature in effluents of coastal hatcheries for the months of July and August is shown in Figure 11.

157 December 14, 2010 HB 3489 Report
50
52
54
56
58
60
62
64
66
68
Alse
a
Band
on
Butte
Fall
s
Cedar
Cre
ek
Elk R
iver
Nehale
m
Rock C
r.
Salm
on R
.
Tras
k R.
Tem
pera
ture
(oF)
Figure 11. Average effluent temperature (oF) measured between 3:00 pm and 5:00 pm for the months ofJuly and August, 2003-2005.
Analysis of three years’ temperature data from the hatchery outfalls and the mixing zones revealed that the small increase in temperature at the outfalls did not adversely affects the temperature at the mixing zone and also did not affect salmonids spawning, migration, and juvenile rearing in the receiving stream.
Formalin and Hydrogen Peroxide Use:
Formalin and hydrogen peroxide are the USFDA approved chemicals for use in aquaculture. These two chemicals are commonly used in hatcheries to control fungal and parasitic infections in eggs and fish. The NPDES permits require that chemically-treated wastewaters shall be sufficiently diluted as per manufacturers’ recommendation for safe disposal. A pollution abatement pond is helpful to sufficiently dilute the chemically treated wastewaters. Depending on the frequency and severity of fungal and/or parasitic infections, each facility uses these chemicals as prescribed by fish pathologists. The average quantity of formalin and hydrogen peroxide used to produce one pound of fish at each coastal hatchery is shown in Figure 12.

158 December 14, 2010 HB 3489 Report
0.000
0.020
0.040
0.060
0.080
0.100
0.120
0.140
Alse
a
Band
on
Butte
Fall
s
Ceda
r Creek
Elk R
iver
Neha
lem
Rock
Cr.
Salm
on R
.
Tras
k R.
Form
alin
and
H2O
2 (li
ters
)
Figure 12. Quantity (liters) of formalin and hydrogen peroxide used per pound of fish produced.
Use of Medication/Drug:
Use of medication and drugs to treat fish may also affect the quality of hatchery effluents although these are used as food ingredients in the form of medicated feed supplied by food manufacturers. Very little of these drugs may enter the rearing water. These are mainly the USFDA approved or INAD drugs. No monitoring is conducted to determine the concentrations of drugs in hatchery effluents because of their negligible quantity and also because the measurements would be expensive that require sophisticated technology. The average data of the last five years of medicated drugs use to produce one pound of fish at each hatchery is shown in Figure 13.

159 December 14, 2010 HB 3489 Report
00.5
11.5
22.5
33.5
44.5
Alsea
Bando
n
Butte F
alls
Cedar
Cree
k
Elk Rive
r
Nehale
m
Rock C
r.
Salmon
R.
Tras
k R.
Dru
gs (g
)
medication
Figure 13. Quantity of drugs used (g) used per pound of fish produced.
Water Flow/Discharge System: Almost in all ODFW operated fish hatcheries, water is supplied at the surface of pond’s head end and effluents too are discharged from surface level at the tail end over dam boards, which doesn’t create water current at the pond bottom level. Consequently, most of the solid wastes are accumulated or deposited on pond bottom and increase the risks of permit violation during cleaning operations. Deposition of solid wastes (uneaten food and fecal matter) may also create favorable environment for pathogens to grow and cause more diseases. A simple modification to the existing water discharge system by inserting a baffle in between screen and dam boards will create flow at the pond bottom level and redirect the effluent through the pond bottom (see Figure 14). This will to some extent be a self cleaning method where effluents will continuously carry solid wastes from the pond bottom and help maintain good water qualities for fish health and NPDES permit compliance during cleaning operations. The cost of modification would be negligible.

160 December 14, 2010 HB 3489 Report
Figure 14. Water outflow from the bottom of the pond.
Settling or Pollution Abatement Pond:
A settling or pollution abatement pond is a necessary component for fish hatchery. The abatement pond can be used to settle the solid wastes of hatchery effluents before discharge into receiving streams. Also, it is necessary to sufficiently dilute the chemically treated wastewaters. Some of the coastal hatcheries do have settling/pollution abatement ponds and others are either using one or more ponds to treat wastes or mix wastewaters with normal effluents from the entire rearing systems to dilute the solids and chemically treated wastewaters, to comply with the permit limits (Table 56). This is a difficult struggle for hatcheries with no proper abatement pond. Due to inadequate dilution capability at few facilities use of necessary chemicals for egg and/or fish treatments is restricted and thus affecting fish health.
Flow
Waterline
Baffle
Dam Boards
Pond Bottom
Screen
Water Inflow
Water Outflow

161 December 14, 2010 HB 3489 Report
Table 65. Status of pollution abatement ponds at coastal fish hatcheries. Name of Hatchery Status (Yes/No) Comment
Alsea Yes ok
Bandon Yes Two ponds used for pollution abatement, but wastewaters don’t flow to abatement by gravity. No land for new pond. Recommended for two sump pumps to pump wastes to abatement ponds.
Butte Falls No Recommended for a pond
Cedar Creek Yes ok
Elk River No Recommended for a pond
Nehalem No Recommended for a pond
Rock Creek Yes ok
Salmon River Yes An earthen pond with no outlet. Recommended for modification to prevent seepage to underground.
Trask River Hatchery
Trask Pond (Satellite)
Tuffy Creek (Satellite)
Two small ditches used as abatement pond.
None
None
Recommended for two enlarged abatement ponds to the two rearing sites.
Recommended for an abatement pond.
Recommended for an abatement pond.
NPDES Permit Compliance:
The NPDES permits require that hatchery discharges shall not exceed the following limitations:
• Total Suspended Solids Daily Maximum: 10 mg/L (normal operations)
• Total Suspended Solids Monthly Average: 5 mg/L (normal operation)
• Total Suspended Solids Daily Maximum: 15 mg/L (cleaning operations)
• Settleable Solids (monthly average): 0.1 ml/L (normal operation)
• Settleable Solids Daily Maximum: 0.2 ml/L (cleaning operations)
• Temperature Daily Maximum: 77oF (normal and cleaning operations)
• pH range: 6.0 – 9.0 (normal and cleaning operations)
• Chemicals: Be sufficiently diluted as per instructions of product labeling.

162 December 14, 2010 HB 3489 Report
The permits require that records of all monitoring data shall be retained for a period of three years from the date of sample, measurement or report. The past three years’ water quality monitoring data indicated that there were no reportable violations of the NPDES permits at any of the state funded coastal fish hatcheries (Table 57).
Table 66. NPDES permit violations at coastal hatcheries during the last three years.
Number of NPDES Permit Violations Name of Hatchery
2007 2008 2009
Alsea none none none
Bandon none none none
Butte Falls none none none
Cedar Creek none none none
Elk River none none none
Nehalem none none none
Rock Creek none none none
Salmon River none none none
Trask River none none none
Also, there were no violations of the NPDES permits in 2010 up to the time of writing this report. However, modifications to the existing pollution abatement ponds or settling ponds are necessary at few facilities to facilitate the dilution of chemically treated waste waters.
3.1.1.1 Alsea Hatchery Water Quantity/Quality and NPDES Permit Compliance
Water supply is gravity fed from the North Fork Alsea River. The Alsea facility water right is 47 cfs from the North Fork of the Alsea River. Low flows and low dissolved oxygen levels (as low as 4.5 ppm) occur in late summer; however, program goals can be met under these conditions. Some of the rearing ponds have rough floors which make pond cleaning operations difficult; and accumulation/deposition of uneaten feed and fecal wastes on rough floors may contribute to the proliferation pathogens.

163 December 14, 2010 HB 3489 Report
Alsea Hatchery has good water temperatures even in summer months (Figure 11), and uses low quantity of chemicals and drugs to produce each pound of fish (Figures 12 and 13). In rearing ponds, water is supplied at the surface of pond and discharged from the surface of pond’s tail end over dam boards, which doesn’t create water current at the pond bottom level. A simple modification to the water discharge system may help maintain good water qualities for fish health and NPDES permit compliance during cleaning operations, through self cleaning of ponds to some extent (see Figure 14. The facility has a large pollution abatement pond and can sufficiently dilute the chemically-treated wastewaters. It complies with the NPDES permit water quality standards. There were no violations of the NPDES permit during the last three years. Recommendations:
• The ponds with rough floors be coated to make them smooth to prevent trapping of wastes on pond bottom which will make pond cleaning easy, minimize growth of disease agents and chemical use.
• Spawning wastes e.g. eggs be captured through a filter and disposed of as solid wastes and liquid wastes (blood, ovarian fluids, and waste waters) be diverted to sand/gravel/soil filtration system or to septic system.
• Modification to the water discharge system is recommended (see Figure 14). • Use fish feed that has better conversion ratio and minimize waste production.
3.1.1.2 Bandon Hatchery Water Quantity/Quality and NPDES Permit Compliance
The hatchery's water rights are a combined 3.0 cfs from Ferry and Geiger Creeks. These two rights are senior to all other water rights on Ferry and Geiger Creeks. Water supply is gravity fed from reservoirs on Ferry and Geiger Creeks. Low flows occur during the late summer and early fall. Hatchery production and operation has been modified to fit this limiting factor. The City of Bandon shares the water supply and cranberry farmers pump from both above and below the hatchery. The City of Bandon funded and constructed a new intake that takes all domestic raw water from below the hatchery. As a result of the new City intake and coordination that occurs with cranberry growers, usable water for Bandon Hatchery is considerably more during the low flow period in the fall. Despite the low flows that occur each fall, water quality remains excellent. Bandon Hatchery has low water temperatures even in summer months (Figure 11). The mean year round temperature for the same period is 51.4 degrees. Rarely does the water temperature reach 60 degrees in the summer, or drop below 40 degrees in the winter. The facility uses very low quantity of chemicals and drugs to produce each pound of fish (Figures 12 and 13).

164 December 14, 2010 HB 3489 Report
In rearing ponds, water is supplied at the surface of pond (except pond #9 which has a baffle system) and effluents are discharged from the surface of pond’s tail end over dam boards, which doesn’t create water current at the pond bottom level. A simple modification to the water discharge system may help maintain good water qualities for fish health and NPDES permit compliance during cleaning operations, through self cleaning of ponds to some extent (see Figure 14). There are seven rearing ponds and one adult holding pond in use at Bandon Hatchery. The pond bottom surface is medium rough. The ODFW hatchery personnel and Engineers have assessed the hatchery grounds, and found no suitable site for a pollution abatement pond. Therefore, ponds #5 and #8 have served as abatement ponds, although originally not designed for pollution abatement. Over time, rearing practices have been adjusted and with proper selection of fish feed and rearing strategies, the hatchery meets all permit parameters. The biggest challenge for Bandon hatchery is to comply with the dilution requirements for formalin and hydrogen peroxide-treated chemical wastes, although these two chemicals are used very rarely in outside rearing ponds. Also, the abatement ponds (#5 and #8) do not receive all cleaning effluents by gravity. Therefore, provisions for two submerged pumps and underground vacuum lines for pumping of pond cleaning and chemically treated wastewaters from rearing ponds to the abatement ponds are necessary. Bandon Hatchery is in compliance with the NPDES permit and no violations of the permit were observed during the last three years. Recommendations:
• Provide provisions for two submerged pumps and underground vacuum lines to pump pond cleaning and chemically treated wastewaters from rearing ponds to abatement ponds.
• Ponds with rough floors be plastered to make them smooth to prevent trapping of wastes on pond bottom which will make pond cleaning easy, minimize growth of disease agents and chemical use.
• Spawning wastes e.g. eggs be captured through a filter and disposed of as solid wastes, and liquid wastes (blood, ovarian fluids, and waste waters) be diverted to sand/gravel/soil filtration system or to septic system.
• Modification to the water discharge system is recommended (see Figure 14). • Use fish feed that has better conversion ratio and minimize waste production.
3.1.1.3 Butte Falls Hatchery Water Quantity/Quality and NPDES Permit Compliance

165 December 14, 2010 HB 3489 Report
The Butte Falls Hatchery water supply is gravity fed from the south fork of Big Butte Creek. Water quantity is very consistent even during the driest years. Summer temperatures (Figure 11) and dissolved oxygen levels are generally not a problem because sufficient water flows exist during the summer and early fall. The facility uses low quantity of chemicals and drugs to produce each pound of fish at this facility (Figures 12 and 13). Some of the rearing ponds have rough floors and cracks which make pond cleaning operations difficult; and accumulation/deposition of uneaten feed and fecal wastes on rough floors may contribute to the proliferation pathogens. Water is supplied at the surface of pond and discharged from the surface of pond’s tail end over dam boards, which doesn’t create water current at the pond bottom level. A simple modification to the water discharge system may help maintain good water qualities for fish health and NPDES permit compliance during cleaning operations, due to self cleaning of ponds to some extent (see Figure 14). There is no pollution abatement pond at Butte Falls Hatchery, although there were no NPDES permit violations during the last three years. To settle the solid wastes from pond cleaning operations and to sufficiently dilute chemically-treated wastewaters a pollution abatement pond is necessary. The facility design modifications for pollution abatement, in the form of settling ponds, have been designed, but funding for these modifications has not been obtained. Recommendations:
• A settling or pollution abatement pond be constructed to comply with the NPDES permit requirements.
• The ponds with rough floors and cracks be plastered to make them smooth to prevent trapping of wastes on pond bottom which will make pond cleaning easy, minimize growth of disease agents and chemical use.
• Modification to the water discharge system is recommended (see Figure 14). • Use fish feed that has better conversion ratio and minimize waste production.
3.1.1.4 Cedar Creek Hatchery Water Quantity/Quality and NPDES Permit Compliance
Water supply is gravity fed from Cedar Creek and can be supplemented with pumps in summer months from Three Rivers if needed. Low flows and low-dissolved oxygen levels can occur in late summer; however, program goals can be met under these conditions. Compared to other coastal hatcheries Cedar Creek Hatchery enjoys the coldest water in summer months (Figure 6), but it receives high levels of siltation due to natural slides, particularly during winter periods of heavy rain and high flow. Sediment sources from storm events are similar to all coastal hatcheries and have made it difficult to comply with the NPDES permit in the past.

166 December 14, 2010 HB 3489 Report
Some of the rearing ponds at Cedar Creek have rough floors which make pond cleaning operations difficult; and accumulation/deposition of uneaten feed and fecal wastes on rough floors may contribute to the proliferation pathogens. In rearing ponds, water is supplied at the surface of pond and discharged from the surface of pond’s tail end over dam boards, which doesn’t create water current at the pond bottom level. A simple modification to the water discharge system may help maintain good water qualities for fish health and NPDES permit compliance during cleaning operations, due to self cleaning of ponds to some extent (see Figure 149). The facility has two pollution abatement ponds and there were no NPDES permit violations during the last three years. It uses very low to low quantity of chemicals and drugs to produce each pound of fish (Figures 12 and 13), and can sufficiently dilute all chemically-treated wastewaters. Recommendations:
• The ponds with rough floors be plastered to make them smooth to prevent trapping of wastes on pond bottom which will make pond cleaning easy, minimize growth of disease agents and chemical use.
• Spawning wastes e.g. eggs be captured through a filter and disposed of as solid wastes, and liquid wastes (blood, ovarian fluids, and waste waters) be diverted to sand/gravel/soil filtration system or to septic system.
• Modification to the water discharge system recommended (see Figure 14). • Use fish feed that has better conversion ratio and minimize waste production.
3.1.1.5 Elk River Hatchery Water Quantity/Quality and NPDES Permit Compliance
The supply water for Elk River Hatchery is pumped from the Elk River. Although low flows can occur in late summer of drought years, yet water supplies is more than sufficient and dissolved oxygen averages about 9.0+ ppm. Incubation or hatch house uses pathogen free ground water which naturally carries high dissolved oxygen and no additional oxygenation is required. Program goals are met easily, and supplementation and recirculation are never required. Elk River Hatchery effluents have the highest water temperature during summer months (Figure 6), which is a reflection of the ambient temperature of Elk River. There were no NPDES permit violations during the last three years. The burrows type ponds at Elk River are to some extent are self cleaning. Despite the highest water temperature in summer months it uses low quantity of chemicals and drugs to produce each pound of fish (Figures 12 and 13). Because of sufficient water in rearing ponds adequate dilution of chemically-treated wastewaters of a pond is successfully done through mixing with effluents from other ponds. There is no pollution abatement or settling pond at Elk River Hatchery. Necessary facility

167 December 14, 2010 HB 3489 Report
design modifications for pollution abatement, in the form of raceway cleanouts, have been designed and funding for these modifications is necessary. Recommendations:
• A settling or pollution abatement pond be constructed to comply with the NPDES permit requirements.
• A minor modification to the spawning building is necessary to capture the spawning wastes i.e., eggs be captured through a filter and disposed of as solid wastes, and liquid wastes (blood, ovarian fluids, and waste waters) be diverted to sand/gravel/soil filtration system or to septic system.
• Use fish feed that has better conversion ratio and minimize waste production.
3.1.1.6 North Nehalem River Hatchery Water Quantity/Quality and NPDES Permit Compliance
The water for North Nehalem Hatchery is 100 percent pumped from North Fork Nehalem River. Low flows and low dissolved oxygen levels occur in late summer; however, pumping reoxygenates the water. The water temperature at Nehalem Hatchery is relatively cold even in summer months (Figure 11). It has water rights of 23.52 cfs. Program goals can be met under these conditions. In rearing ponds, supply water is added to the surface of ponds and discharged through the surface of pond’s tail end over dam boards, which doesn’t create water current at the pond bottom level. A simple modification to the water discharge system may help maintain good water qualities for fish health and NPDES permit compliance through self cleaning of ponds to some extent (see Figure 14). Some of the rearing ponds have rough floors which make pond cleaning operations difficult; and accumulation/deposition of uneaten feed and fecal wastes on rough floors may contribute to the proliferation pathogens. Nehalem Hatchery has no pollution abatement pond, which is necessary to divert pond cleaning wastes to settle and sufficiently dilute the chemically-treated wastewaters. At Nehalem, spawning wastes are trapped and disposed of into the septic system. Also, the facility uses low quantity of chemicals and drugs to produce each pound of fish (Figures 12 and 13). There were no NPDES permit violations at Nehalem Hatchery during the last three years. Recommendations:
• A pollution abatement pond must be constructed at Nehalem hatchery. • Ponds with rough floors be plastered to make them smooth to prevent
trapping of wastes on pond bottom which will make pond cleaning easy, minimize growth of disease agents and chemical use.

168 December 14, 2010 HB 3489 Report
• Modification to the water discharge system is recommended (see Figure 14). • Use fish feed that has better conversion ratio and minimize waste production.
3.1.1.7 Rock Creek Hatchery Water Quantity/Quality and NPDES Permit Compliance
Water supply is gravity fed from Rock Creek during winter/spring on a 30 cfs water right and North Umpqua pumps in the summer/fall on a 25 cfs water right. High temperatures (occasionally 70 plus degrees Fahrenheit) occur in summer months (Figure 6) and large winter freshets, and virulent pathogen loads present challenging conditions; however, most program goals can be met under these conditions. North Umpqua and Rock Creek supply abundant amounts of water for single pass fish rearing. There is enough water in early summer for 24-hour flushing with hyper flows in steelhead raceways to control Ichthyophthirius (Ich) during the pathogens most virulent conditions, in most cases in lieu of formalin. Highest densities per gpm rearing flow occur in the fall with 7,200 gpm available for 60,000 pounds of fish, equating to 8.5 pounds of fish per gpm. Temperatures in the summer are high but manageable for fish rearing. Ponding options for the 15 concrete raceways, brood pens, and Canadian troughs are very flexible and have accommodated many production scenarios up to this point. R9-R15 can be divided bringing the total to 22 concrete rearing pens. The total rearing space for this facility is 150,000 cubic feet. Current annual production equals 124,575 pounds of fish reared. Densities are at 0.83 pounds of fish per cubic foot rearing space at release. The Rock Creek Hatchery has very high water temperature (Figure 11), and uses the highest quantity of chemicals and drugs to produce each pound of fish (Figures 12 and 13), suggesting higher occurrence of diseases and parasitic infestation. Some of the rearing ponds have rough floors which make pond cleaning operations difficult; and accumulation/deposition of uneaten feed and fecal wastes on rough floors may contribute to the proliferation pathogens. In rearing ponds, water is supplied at the surface of pond and discharged from the surface of pond’s tail end over dam boards, which doesn’t create water current at the pond bottom level. A simple modification to the water discharge system may help maintain good water qualities for fish health and NPDES permit compliance during cleaning operations, through self cleaning of ponds to some extent (see Figure 14). The facility has a pollution abatement pond and can sufficiently dilute the chemically-treated wastewaters. There were no NPDES permit violations during the last three years. Recommendations:
• All ponds with rough floors be plastered to make them smooth to prevent trapping of wastes on pond bottom which will make pond cleaning easy, minimize growth of disease agents and chemical use.
• Modification to the water discharge system is recommended (see Figure 14).

169 December 14, 2010 HB 3489 Report
• Minor modification to the spawning building to filter out solid wastes (eggs) for disposal, and the liquid wastes (blood, ovarian fluid, and wastewater) be diverted to sand/gravel/soil filtration system or to septic system.
• The two side by side located outfalls for normal and cleaning operations be combined to form a single outfall for better dilution of cleaning and chemically treated wastewaters.
• Use fish feed that has better conversion ratio and minimize waste production.
3.1.1.8 Salmon River Hatchery Water Quantity/Quality and NPDES Permit Compliance
Water supply is 100 percent pumped from the Salmon River. Low flows and low dissolved oxygen levels occur in late summer; however, pumping reoxygenates the water. Program goals can be met under these conditions. The Salmon River Hatchery has high water temperatures during summer months (Figure 11); yet it uses low quantity of chemicals and drugs to produce each pound of fish (Figures 12 and 13). In rearing ponds, supply water is added to the surface of ponds and discharged through the surface of pond’s tail end over dam boards, which doesn’t create water current at the pond bottom level. A simple modification to the water discharge system may help maintain good water qualities for fish health and NPDES permit compliance through self cleaning of ponds to some extent (see Figure 14). The pond bottoms are gradually becoming rough with age, which deserve attention for proper maintenance. The hatchery has a pollution abatement pond where pond cleaning and chemically treated wastewaters are pumped for settling and dilutions, respectively. The abatement pond has no outlet; consequently, the chemically treated wastewaters may seepage and contaminate the ground water. It is necessary that the abatement pond be enlarged and modified with asphalt floor bottom so that chemically treated wastewaters are sufficiently diluted before discharge. Spawning females are bled into totes and wastes are dumped for disposal. The facility is operated in compliance with NPDES permit requirements; and there were no violations of the NPDES permit during the last three years. Recommendations:
• The abatement pond be enlarged and modified with asphalt bottom and outlet pipe so that chemically treated wastewaters can be discharged after dilution and do not contaminate ground water through seepage.

170 December 14, 2010 HB 3489 Report
• Ponds with rough floors be plastered to make them smooth to prevent trapping of wastes on pond bottom which will make pond cleaning easy, minimize growth of disease agents and chemical use.
• Modification to the water discharge system is recommended (see Figure 9). • Use fish feed that has better conversion ratio and minimize waste production.
3.1.1.9 Trask River Hatchery Water Quantity/Quality and NPDES Permit Compliance
Trask Hatchery has two sources of gravity fed water supply: Gold Creek and Mary’s Creek. The water rights are for 9 cfs from Gold Creek and 1 cfs from Mary’s Creek. Mary’s Creek flow is used for egg incubation. Trask Hatchery has cold water temperatures even in summer months (Figure 11). There are also water rights of 9 cfs from the Trask River, which can be used in the summer, if needed. But it no longer pumps from the Trask River because of disease concerns. Sediment loads are manageable due to improving habitat in the watershed. Low flows and low dissolved oxygen levels occur in late summer; however, program goals can be met under these conditions.
In rearing ponds, supply water is added to the surface of ponds and discharged through the surface of pond’s tail end over dam boards, which doesn’t create water current at the pond bottom level. A simple modification to the water discharge system may help maintain good water qualities for fish health and NPDES permit compliance through self cleaning of ponds to some extent (see Figure 14). The upper 8 rearing ponds at Trask Hatchery are very old and do not have slope on pond bottoms. Also, the floors are rough which trap solid wastes (uneaten food and fecal matter) and are difficult to clean. These eight ponds require modification. There is a small earthen pollution abatement pond below these eight ponds, which needs to be enlarged and modified with asphalt floor to treat chemically treated wastes. The facility has another abatement pond below the lower two large rearing ponds but the volume is too small to dilute chemical wastes. Also, it has no asphalt floor. Consequently, the chemically treated wastes from this abatement pond may seepage and contaminate ground water. Modification to this abatement pond is necessary. Trask Hatchery uses low quantity of chemicals and drugs to produce each pound of fish (Figures 12 and 13); and there were no NPDES permit violation at Trask Hatchery during the last three years.
Trask Pond is a satellite facility of Trask Hatchery, which produces around 7,000 lbs of fish per year and doesn’t require a NPDES permit to operate. It is being operated using Best Management Practices to ensure it meets water quality standards. Trask Pond facility has abundant water of good quality. It has a small earthen abatement pond and in the past very little chemicals have been used at this facility.

171 December 14, 2010 HB 3489 Report
Tuffy Creek is another satellite facility of Trask Hatchery and is operated using Best Management Practices to ensure it meets water quality standards. It produces about 14,000 lbs of fish per year. It has abundant water of good quality. Tuffy Creek facility has no pollution abatement pond and therefore a pollution abatement pond is desirable at this facility. Recommendations: Trask Hatchery:
• The upper 8 ponds with rough floors be plastered to make them smooth, and the pond floors be improved to have sufficient slope for easy cleaning and discharge of wastewaters.
• Both upper and lower abatement ponds be enlarged to increase volume, to sufficiently dilute the chemically-treated wastewaters.
• Spawning wastes e.g. eggs be captured through a filter and disposed of as solid wastes, and liquid wastes (blood, ovarian fluids, and waste waters) be diverted to sand/gravel/soil filtration system or to septic system.
• Modification to the water discharge system is recommended (see Figure 14). • Use fish feed that has better conversion ratio and minimize waste production.
Trask Pond:
• The pollution abatement pond be enlarged. Tuffy Creek:
• A pollution abatement pond be constructed.
3.1.2 Fish Health
3.1.2.1 Review: Fish health issues at ODFW coastal hatcheries are generally driven by the type and quality of the water supply and by the presence of adult anadromous or resident fish. In the majority of cases, pathogen presence and possible subsequent outbreaks in hatchery populations originate from fish in the facility’s water supply. Fish in hatcheries with surface water supplies that harbor anadromous and/or resident fish are generally more prone to disease outbreaks, especially as water quantity and quality decrease and temperature increases in the summer and early fall months. Holding brood fish at a facility creates special requirements. In the case of anadromous adults, injections of antibiotics and multiple treatments for external fungus control may be required. Facilities that rear several salmonid species encounter more organism and disease outbreaks due of the inherent variability of fish species and their sensitivity to a variety of pathogens.

172 December 14, 2010 HB 3489 Report
Once parasitic, bacterial, and fungal diseases become established in a fish population, hatchery staff must attempt to control outbreaks with minimal loss in as short a period of time as possible. Water quality and quantity become very important in attempts to control specific pathogens. Increasing water temperatures and decreased flows where recirculation of water is necessary make treatments more difficult in many cases. The types of ponds used for rearing fish can create problems for control of certain parasites. On top of these difficulties, hatcheries must also adhere to fishery chemical label restrictions, Veterinary Feed Directives, extra label prescriptions, and to Oregon Department of Environmental Quality guidelines for effluent concentrations of discharged chemicals.
There are considerable benefits to having a clean water supply including healthier fish, reduced chemical use and reduced labor. There is some urgency in trying to reduce chemical use because of ever changing and stricter regulations on which and at what concentrations fisheries chemicals can be released in hatchery effluents.
3.1.2.2 General Recommendations: Coastal, as well as other hatcheries in the state should be progressing toward water supplies that are free of pathogens and capable of maintaining reasonable temperatures. In some cases this may mean the use of well water or treatment of surface water and water temperature control may also be necessary. Since freshets with muddy water events are common during the rainy season, water treatments performed by filtration and UV disinfection must be carried out on water that has been clarified through a settling pond in order for the system to be effective during these storm events. At a minimum, the highest quality water possible should be provided early rearing of fish when many of the species are the most susceptible to pathogens. Building, enlarging or improving abatement ponds will allow the use of approved chemical treatments and allow us to meet effluent guidelines for these chemicals and thus cause no harm to receiving waters. Continue to actively reduce our reliance on drugs and chemicals. While complete elimination of therapeutics will not be possible, reductions have been made and should continue to be made. Having water supplies that are free of pathogens and finding ways to improve holding conditions such as ponds that can be effectively cleaned would be helpful in this effort. While using therapeutants, we must continue to develop means to ensure that they are not improperly discharged into receiving waters. Explore ways to hold adult brood fish which would require minimal treatments and under optimal conditions. One such possibility is the use of reuse system with built in water treatment.
3.1.2.3 Hatchery-Specific Recommendations:
3.1.2.3.1 Alsea Hatchery

173 December 14, 2010 HB 3489 Report
The following fish health issues exist at Alsea Hatchery
• Surface water supply with limited numbers of passed adults; present water supply is limited and warm in summer and fall.
• Incubation and early rearing should be supplied with treated, pathogen and temperature controlled water.
• Wild adult steelhead are treated for fungus with hydrogen peroxide. • IHN virus has been isolated from returning adult steelhead. • CWD, trichodinids, Ichthyophthirius (Ich), bacterial gill disease and gill
amoeba are major pathogens of concern. With the exception of Ich outbreaks are seldom a serious and pathogens are treatable with formalin, hydrogen peroxide, Chloramine-T and antibiotics.
• The hatchery has an abatement pond providing satisfactory chemical dilutions for current DEQ standards.
• Occasional high water leading to extreme siltation events Specific Recommendations: Develop a filtered and UV treated water supply for the hatch house and early rearing. Provide system for chilling/heating clean water. Providing clean water would reduce chemical use for control of ectoparasites to a minimum. Eventually provide the entire hatchery with clean water.
3.1.2.3.2 Bandon Hatchery
The following fish health issues exist at Bandon Hatchery:
• Surface water supply with no anadromous adults but with some resident salmonids and other fish species present.
• Adults are not treated for fungus, thus there is no chemical use for this purpose.
• No significant fish losses have occurred for many years. • Chemical uses for parasite treatments are difficult to accomplish in outside
ponds due to insufficient water for proper chemical dilution and the absence of an abatement pond.
• Ichthyobodo and CWD are annual disease problems while Ichthyophthirius (Ich) can cause loss on some years. Ichthyobodo and Ich are treatable with formalin but difficult to treat in outside ponds because of the inability to properly dilute chemicals. Flushing the ponds has recently successfully treated Ich. CWD is treatable with antibiotics.
Specific Recommendations: Filtration and UV disinfection of incoming water would decrease incidence of ectoparasites and reduce or eliminate the need for treatments. This is critical since there is not sufficient water flow to meet present and future effluent standards for treatment chemicals in outside ponds. Treatment of incoming water could decrease the severity of CWD outbreaks as well.

174 December 14, 2010 HB 3489 Report
An abatement pond would allow the facility to meet chemical dilution effluent standards when treatments are required.
One need at Bandon Hatchery that would facilitate disease/parasite treatment with formalin would be the acquisition of a large (6”), trailer-mounted water pump. With this, ponds infested with Ichthyobodo or other external pathogens could be treated with formalin, and the effluent pumped to an empty pond for dissipation of the chemical. Then, the facility could comply with DEQ permit standards. Bandon Hatchery cannot currently use formalin in outside ponds, and must use hydrogen peroxide instead. If standards tighten for peroxide, as is being discussed, it may be difficult for Bandon Hatchery to meet standards.
3.1.2.3.3 Butte Falls Hatchery
The following fish health issues exist at Butte Falls Hatchery:
• Use of surface water (Willow Lake) in late summer and early fall • Anadromous adults, juveniles and resident fish are present in water supply. • No adults held at the facility. • No abatement pond. • Gyros, trichodinids, and cold-water disease (CWD) are the main disease
concerns. Ichthyophthirius (Ich) is occasionally a serious problem. Ich is treatable with formalin, while gyros and trichodinids are treatable with formalin or hydrogen peroxide. CWD is treatable with antibiotics.
• A recent major fish health issue has been due to outbreaks caused by IHN virus have seriously impacted the rearing programs over the last three years. The virus is believed to have originated in anadromous fish in the hatchery’s water source. There has been no virus detected for nearly 3 years.
Specific Recommendations: The facility needs to be protected from incoming pathogens in the water, either with water treatment such as filtration and UV disinfection, or as has been discussed, extending the intake pipe to a point above where any resident or anadromous fish are present (basically to the source spring). An abatement pond is needed to make chemical treatments/dilution easier to comply with DEQ regulations.
3.1.2.3.4 Cedar Creek Hatchery
The following fish health issues exist at Cedar Creek Hatchery:
• Surface water supply is limited. During summer and fall, the facility may require pumped water from Three Rivers when adult salmon are present and thus increase the further exposure to pathogens.

175 December 14, 2010 HB 3489 Report
• Chemical use for fungus treatment of adult steelhead during the 9 plus month holding period.
• Trichodinids and Ichthyophthirius (Ich) are the main disease concerns and are treatable with hydrogen peroxide and formalin. Ich treatments require the use of portable pumps to comply with DEQ requirements.
Specific Recommendations: Development of a spring or well water supply for the hatch house to reduce the silt problem in high water years. Water treatment (filtration and UV) for the rest of the hatchery would also be a major improvement for overall fish health quality as it would reduce treatments for fungus and parasite control. If future plans include releasing fish into habitat that supplies water to the hatchery, a water treatment system will be a necessity. Phase one of abatement water diversion has been completed and this allows some individual ponds to be treated with therapeutants that can be adequately diluted as per EPA requirements before entering receiving waters. However, increasing the size of the effluent line and supplying a direct line from all ponds to the abatement pump would vastly improve the current system. This would allow for easier pond treatments and fish in all ponds could then be treated and enable the facility to meet dilution requirements. Increasing the capacity and dilution capability of the abatement system will be important in subsequent years as future regulations regarding the safe use of chemicals and therapeutants will limit the amount of these chemicals allowed in hatchery effluent. Resurfacing of pond bottoms using contemporary materials would allow better cleaning, which would serve to decrease the environment conducive to problematic parasites and fungal growth. Reduction of fungus and parasites would reduce the treatments necessary to control these health problems.
3.1.2.3.5 Elk River Hatchery
The following fish health issues exist at Elk River Hatchery:
• Surface water supply has anadromous adults, juveniles and resident salmonids present.
• Chetco adult fall Chinook and winter steelhead are treated for fungus with hydrogen peroxide. Elk River adult fall Chinook not treated for fungus.
• IHN virus has been isolated at this facility in the past and in some cases created high loss events but it has not been detected for many years. Gill amoeba, Ichthyophthirius (Ich), CWD and furunculosis are the major pathogens of concern. Gill amoeba is treatable with hydrogen peroxide. Ich is currently treated with hydrogen peroxide. Furunculosis and CWD are treatable with antibiotics.
Specific Recommendations:

176 December 14, 2010 HB 3489 Report
Incoming water source needs to be protected from incoming pathogens with filtration and UV disinfection to increase fish health and decrease chemical use and discharge into the environment. Build an abatement pond to improve ability to treat fish when needed and comply with effluent dilution regulations.
3.1.2.3.6 North Nehalem River Hatchery
The following fish health issues exist at North Nehalem River Hatchery:
• Surface water supply is limited and has large numbers of anadromous adult fish present as well as resident fish.
• No chemical use for fungus treatment since adults are not treated. • Trichodinids, Gyrodactylus and Ichthyophthirius (Ich) are the primary
ectoparasites detected. All are treatable with formalin. • CWD and furunculosis are the main bacterial disease concerns and are
treatable with antibiotics. • During low flows, which typically occur during warm water temperatures,
water recirculation is required for adequate water flow. This increases exposure to ectoparasites and more frequent treatments.
Specific Recommendations: A clean and cool water source is essential for fish health; treatment of the water source with filtration and UV disinfection would reduce the need for treatment chemicals and increase the level of fish health.
3.1.2.3.7 Rock Creek Hatchery
The following fish health issues exist at Rock Creek Hatchery: • Surface water supply with anadromous adults and juveniles present. High water
temperatures in Rock Creek during the summer months necessitate pumping cooler water from the North Umpqua River during that time.
• Egg incubation and early rearing provided from an out of date filtration and disinfection system.
• Extremely high water temperatures even in water pumped from the Umpqua. • Severe siltation problems during high water events. • Adult fish held all months of the year are treated for fungus and for
Ichthyophthirius (Ich) during summer months when temperatures are extremely high.
• Ich, columnaris, CWD, and fungus are the main disease concerns. Ich is treatable with formalin, columnaris and CWD with antibiotics.
• Abatement system currently provides adequate dilution for chemicals used at the hatchery
• Ponds are old and need to be lined or resurfaced to increase efficiency of treatments and help reduce Ich.

177 December 14, 2010 HB 3489 Report
Specific Recommendations: Rock Creek Hatchery needs a clean temperature controlled water supply. Filtration and UV treatment in the hatch house and early rearing troughs has proven invaluable. However, the system needs to be updated and should include temperature control. The entire hatchery needs to have pathogen-free water. This would reduce chemical use tremendously. Ponds at the hatchery need to be re-built or re-lined to provide smooth surfaces for more efficient flushing and cleaning.
3.1.2.3.8 Salmon River Hatchery
The following fish health issues exist at Salmon River Hatchery:
• Surface water supply with many anadromous adult and juvenile fish present. • There is no chemical use for fungus treatment since adults are untreated. • CWD, furunculosis, Ichthyophthirius (Ich), gill amoeba, trichodinids, and
coho anemia disease (CAD) are the main disease concerns. CWD and furunculosis are treatable with antibiotics; Ich is treatable with formalin, and gill amoeba with formalin or hydrogen peroxide.
• Resident and anadromous fish in the present water supply has lead to several disease issues, some severe at times.
Specific Recommendations: Develop a clean water supply to the hatchery, or filtration and UV treatment for current water supply. A clean or treated water supply would diminish the necessity to treat raceways or ponds with chemicals and therapeutants. Increase abatement capacity to meet required chemical dilution standards. At this time it is possible to meet dilution requirements in the raceways onsite, however the larger asphalt ponds (9 and 10) are difficult to treat and maintain current dilution requirements. This situation could be alleviated by the expansion of the abatement pond and increasing the size of the effluent pipe from the abatement pump to the abatement pond itself. Because environmental concerns and dilution requirements will likely become more restrictive in the future, it will be imperative to have adequate treatment abatement to meet set standards when the need to use chemicals and therapeutants occurs. Leakage between some of the raceways is an ongoing problem. A permanent fix to these leaks, as well as resurfacing the raceway bottoms would greatly reduce the occurrence and spread of pathogens and subsequent disease problems.
3.1.2.3.9 Trask River Hatchery Complex The following pathology issues exist at Trask Hatchery facilities:

178 December 14, 2010 HB 3489 Report
Trask Hatchery
• Trask River water supply has many adult anadromous fish present. Fish will contract columnaris, furunculosis, Ichthyophthirius (Ich), and Dermocystidium in this water supply. Therefore, water supply use is limited to Gold Creek, which has no adults above the intake dam.
• Formalin is used for fungus treatments only on adult winter steelhead as per label instructions and meets dilution requirements.
• CWD, low-level furunculosis, Ichthyophthirius (Ich) and trichodinids are main disease concerns. CWD and furunculosis are treatable with antibiotics. Ich is treated with formalin and trichodinids with formalin or hydrogen peroxide.
Specific Recommendations: Recent improvements to the hatchery have increased early rearing capacity with a new building. This has improved the health of early rearing fish. Treatment of incoming water with filtration and UV would decrease need for chemical therapeutants. Trask Pond
• Water supply has many salmon and steelhead adults and juvenile fish present.
• In some years, spring Chinook juveniles must be treated for bacterial gill disease or gill amoeba with potassium permanganate, a chemical that currently is not directly regulated by the FDA. This treatment has not been necessary in recent years.
• In most years, fish are transferred out prior to developing disease problems. Specific Recommendations: Treatment of incoming water with filtration and UV would decrease need for chemical therapeutants. Tuffy Creek
• Trichodinids have caused problems but are treatable with hydrogen peroxide. Specific Recommendations: Treatment of incoming water with filtration and UV would decrease need for chemical therapeutants.
References
McGie, A.M. 1980. Analysis of relationships between hatchery coho salmon transplants and adult escapements in Oregon coastal watersheds. Information Report Series, Fisheries No. 80- 6, Oregon Department of Fish and Wildlife, Charleston, Oregon.

179 December 14, 2010 HB 3489 Report
Nickelson, T.E., Solazzi, M.F., and Johnson, S.L. 1986. Use of hatchery coho salmon (Oncorhynchus kisutch) presmolts to rebuild wild populations in Oregon coastal streams. Can. J. Fish. Aquat. Sci. 43(12): 2443–2449.
ODFW. 1990. Effects of Lost Creek Dam on Winter Steelhead of the Rogue River, Phase 2 Completion Report.
ODFW. 1997. Aquatic Inventory Project Stream Report. ODFW. Coastal Winter Steelhead Conservation Plan. ODFW. 2001. Hatchery Genetic and Management Plan: Coos River Coho Program
– Stock 37. ODFW. 2001. Hatchery Genetic and Management Plan: Coquille River Coho
Program – Stock 44. ODFW. 2001. Hatchery Genetic and Management Plan: Wilson River 121W StW. ODFW. 2003. Hatchery Genetic and Management Plan: Alsea Hatchery 43/43W
Alsea Stock Winter Steelhead. ODFW. 2003. Hatchery Genetic and Management Plan: Umpqua River Basin Coho
Program. ODFW. 2005. Hatchery Genetic and Management Plan: Coos River Winter
Steelhead Program. ODFW. 2005. Hatchery Genetic and Management Plan: Coquille River Steelhead
Program. ODFW. 2005. Hatchery Genetic and Management Plan: Tenmile Steelhead
Program. ODFW. 2005. Hatchery Genetic and Management Plan: Yaquina Bay Fall Chinook. ODFW. 2006. Hatchery Genetic and Management Plan: Chetco River Fall Chinook
Program. ODFW. 2006. Hatchery Genetic and Management Plan: Chetco River Winter
Steelhead Program. ODFW. 2006. Hatchery Genetic and Management Plan: Elk River Fall Chinook
Program. ODFW. 2006. Hatchery Genetic and Management Plan: Lower Umpqua Basin Fall
Chinook Program. ODFW. 2006. Hatchery Genetic and Management Plan: Umpqua River Spring
Chinook. ODFW. 2006. Hatchery Genetic and Management Plan: Salmon River Fall Chinook
Program. ODFW. 2006. Hatchery Genetic and Management Plan: Umpqua River Basin
Summer Steelhead. ODFW. 2008. Hatchery Genetic and Management Plan: Alsea Hatchery Rainbow
Trout.

180 December 14, 2010 HB 3489 Report
ODFW. 2008. Hatchery Genetic and Management Plan: Cedar Creek Hatchery/Rhoades Pond (STEP) Fall Chinook (Stock 047).
ODFW. 2008. Hatchery Genetic and Management Plan: Cedar Creek Hatchery Spring Chinook Program.
ODFW. 2008. Hatchery Genetic and Management Plan: Coos River Fall Chinook Program.
ODFW. 2008. Hatchery Genetic and Management Plan: Coquille River Fall Chinook Program.
ODFW. 2008. Hatchery Genetic and Management Plan: Nehalem Hatchery Coho Program.
ODFW. 2008. Hatchery Genetic and Management Plan: Nehalem Hatchery Winter Steelhead Program.
ODFW. 2008. Hatchery Genetic and Management Plan: Cedar Creek Hatchery 47 & 47W Stock Winter Steelhead.
ODFW. 2008. Hatchery Genetic and Management Plan: Siletz River Summer Steelhead.
ODFW. 2008. Hatchery Genetic and Management Plan: Tenmile Lakes Rainbow Trout Program.
ODFW. 2008. Hatchery Genetic and Management Plan: Trask Hatchery Coho Salmon Program.
ODFW. 2008. Hatchery Genetic and Management Plan: Trask Hatchery Fall Chinook Program.
ODFW. 2008. Hatchery Genetic and Management Plan: Trask Hatchery Spring Chinook Program.
ODFW. 2008. Hatchery Genetic and Management Plan: Trask Hatchery Winter Steelhead.
ODFW. 2008. Hatchery Genetic and Management Plan: Whiskey Creek Hatchery Spring Chinook – STEP.
ODFW. 2009. Hatchery Genetic and Management Plan: Cedar Creek Hatchery Summer Steelhead Program.
Solazzi, M.F., Nickelson, T.E., Johnson, S.L., and Rogers, J.D. 1999. Development and evaluation of techniques to rehabilitate Oregon’s wild salmonids. Oregon Department of Fish and Wildlife, Portland, Oregon. Available at http://nrimp.dfw.state.or.us/ crl/Reports/FinPro/study1a.pdf.
Stevens, D. L. 2002. Sampling design and statistical analysis methods for the integrated biological and physical monitoring of Oregon streams. Report No. OPSW-ODFW-2002-07, The Oregon Plan for Salmon and Watersheds, Oregon Department of Fish and Wildlife, Corvallis, OR.
Theriault, V., Moyer, G.R., and Banks, M.A. 2010. Survival and life history
characteristics among wild and hatchery coho salmon (Oncorhynchus

181 December 14, 2010 HB 3489 Report
kisutch) returns: how do unfed fry differ from smolt releases? Can. J. Fish. Aquat. Sci. 67: 486–497 (2010)

182
Appendices Appendix A. General Description of Coastal Hatcheries
A.1 Alsea Hatchery Alsea Hatchery is located at river mile 48.5 on the North Fork Alsea River off Highway 34, 15 miles west of Philomath, Oregon. The site is at an elevation of 380 feet, at latitude 44o 25’ 21” N (44.42278) and longitude 123o 33’ 57” W (123.5514). The hatchery land area is 25 acres. The hatchery water supply is from the North Fork Alsea River, located 2,300 feet upstream from the hatchery. The Alsea facility water right is 47 cfs. Water quality is good; however, low water flows are experienced during severe winter and summer conditions. Water temperatures range from 32o-73oF. The facility is staffed with 4.0 FTE's.
Table 67. Rearing facilities at Alsea Hatchery Unit Unit Unit Unit Unit Number Total Construction
Type Length Width Depth Volume Units Volume Material Age Condition Comment
(ft) (ft) (ft) (ft3) (ft3)
Adult Holding Pond 200 16 2.5 8,000 1 8,000 concrete 1938 fair
Adult Holding Pond 75 16 6 7,200 1 7,200 concrete 1974 fair Divided into 10 pens and one main holding area
Raceways 100 9 2.25 2,025 10 20,250 concrete 1938 poor not used - insufficient water
Raceways 100 20 4 8,000 20 160,000 concrete 1974 fair Pond 20 has reduced flow.
Circular Ponds 29 3 430 3 1,290 concrete 1938 poor Pond 33 used for truck fill
spout
Circular Tanks 9 3 4 fiberglass good for holding wild steelhead
brood
Canadian Troughs 16.5 3 2 99 4 396 fiberglass 1994 good
Deep Troughs 17.25 2 3 104 25 2,588 concrete 1938 fair 20 used for production, 5 used for egg/fry processing.
Vertical Incubators 168 1984 fair/poor 24 stacks of 8 trays; top trays used for silt settling.
Abatement Pond 310 110 5 170,500 1 170,500 asphalt 1974 fair Hatchery buildings include the following: Residence#1 (02001), Residence#2 (02002), Residence#3 (02003), Residence#4 (02004), Garage Tank and Storage Building (02011/02018), Incubation Building (02013), Hatchery Office (02015), Cold Storage/Grinder Room (02016), Spawning Shed (02017), and Metal Storage Building (02019). The Alsea Hatchery was originally constructed in 1936 A new alarm system was installed in 2001, and all rearing and incubation structures have alarms. The adult holding facilities do not have alarms. All structures utilized for rearing are in good

183 December 14, 2010 HB 3489 Report
condition. Trap facilities include an adult holding pond with ladder and trap constructed in the mid-1970s. A smaller adult holding facility which includes four Canadian troughs is used for holding wild broodstock. Construction of an additional ladder and trap facility has been completed at the intake diversion dam. All trap facilities are in good condition. The pollution abatement system includes a large asphalt pond and separate lines that allow for only pond cleaning effluent to be diverted to the pollution abatement pond. The system is more than adequate to meet DEQ permit requirements in relation to both hatchery effluent and chemical treatments. The water delivery system is gravity flow and includes a diversion dam and intake structure. The intake structure was modified following the 1996 flood. The intake will require modification of the screens to meet NMFS recommendations. The Alsea Hatchery facilities are used for adult collections, egg incubation, and rearing of rainbow trout and winter steelhead. The primary purpose of the facility is for sport fishery augmentation.
Table 68. Annual production at Alsea Hatchery Species Stock Eggs for STEP Legals/Trophy Smolts Rainbow Trout Cape Cod (72) 0 203,400 0 Winter Steelhead Siletz River wild (33W) 0 0 50,000 Winter Steelhead Alsea River (43) 1,500 0 80,000 Winter Steelhead Alsea River wild (43W) 0 0 60,000 Totals 1,500 203,400 190,000 Alsea Hatchery feeds approximately 240,000 pounds of feed per year. Most feeding is done by hand; some feeding is done with automatic feeders (bar feeders and Nielsen hopper feeders with spinners).

184 December 14, 2010 HB 3489 Report
A.2 Bandon Hatchery Bandon Hatchery is located one mile east of the City of Bandon. The site is at an elevation of approximately 98 feet above sea level, at latitude 43o 06’ 54” N (43.11611) and longitude 124o 23’ 03” W (124.3992). The hatchery water supply is obtained from two sources: Ferry Creek and Geiger Creek. Water from both sources is supplied by gravity. The hatchery's water rights are a combined 3.0 cfs from both creeks. Water temperatures range from 40o-65oF. The facility is staffed with 3.0 FTE's.
Table 69. Rearing facilities at Bandon Hatchery Unit Unit Unit Unit Unit Number Total Construction
Type Length Width Depth Volume Units Volume Material Age Condition Comment
(ft) (ft) (ft) (ft3) (ft3)
Adult Holding Pond 80 20 3.25 5200 1 5200 concrete 1950 poor spawning building built over first 20' of pond
Raceway 120 20 3.5 8400 1 8400 concrete 1950 fair
Raceway 110 20 3.67 8074 1 8074 concrete 1950 fair
Raceway 50 20 5.5 5500 1 5500 concrete 1937 poor used for settling pond for vacuum sludge
Raceway 45 15 2.5 1688 1 1688 concrete 1950 good
Raceway 100 20 3.5 7000 1 7000 concrete 1950 poor used as acclimation ponds
Raceways 100 20 3.5 7000 2 14000 concrete 1958 good
Troughs 16 3.2 2 102 2 205 concrete 1958 fair
Troughs 18 2.5 1.25 56 2 113 fiberglass 1985 good
Troughs 16 2.5 1.33 53 4 213 fiberglass 1991 good
Vertical incubators 16 1984 good 2 stacks of 8 trays, used for isolation system
Vertical incubators 448 2003 excellent 28 stacks of 16 trays Bandon Hatchery currently has egg isolation capabilities, incubation water chilling capabilities, and capacity and reliability to complete all production goals. With seven adult holding pens, multiple stocks and species of adults can be held at the same time and on short notice. Hatchery buildings include the following: Residence #1 (06065), Residence 4 (06068), Spawning Shed (06070), Rearing Tank Building (06071), Cold Storage Building (06072), Incubation Building (06075), Shop Building (06077), Storage Building (06079). Built in 1927, Bandon Hatchery has seen several changes in production strategies over the years. In the early years, cutthroat trout were the primary species reared. By the late 1970s, the emphasis was on anadromous fish. Because of limited water, large irrigation pumps recycled a high percentage of the water. This led to disease

185 December 14, 2010 HB 3489 Report
problems as well as high power bills. In 1979, the facility was leased to a private aquaculture company, which failed within about 3 years. ODFW resumed production in 1984 and is currently used for adult collection, egg incubation, and rearing of fall Chinook, coho, winter steelhead and rainbow trout. It serves as an integral facility for local STEP programs within the Coquille and Coos basins. Fish production in the 1970’s was 20,000 pounds with two permanent and one seasonal employee. Current production is 35,000 pounds annually with three permanent, full time employees. Eyed egg incubation is about 3,400,000 annually. Bandon Hatchery is comprised of three tracts of land totaling 32.7 acres: Tract A (15.4 acres) was purchased in 1924 for $1 and has a reversion to heirs’ clause if not used for fish culture for a period of two years. This creek section includes the hatchery building, fish weir and ladder, two residences, three other work buildings, all ten fish ponds, and the dam and intake for Geiger Creek Reservoir (the rest of the reservoir is on adjacent City of Bandon property). The condition of the rearing ponds ranges from very good to poor, with all ponds being functional. Tract B (6.7 acres) was purchased in 1926. This upper parcel contains one residence, feed building, shop, and two storage garages. Tract C (10 acres) was purchased in 1960. This is the location of the Ferry Creek Reservoir. The Department owns both Tracts B and C outright with no known reversion clauses. Bandon Hatchery is very unique in that production poundage is lower than most facilities, but egg production, distribution and diversity is very high. Currently eight different lot numbers of fish and/or eggs are handled at Bandon Hatchery. In the past several years, the hatchery was integral in several short-term conservation programs. For example, Floras Creek coho were collected, spawned, and eggs incubated and transferred to a STEP hatchbox project for a three-year period. This program resulted in coho fry releases in sections of the stream determined to be suitable for supplementation. All hatchery programs in the Coos and Coquille drainages are dependent upon Bandon Hatchery. Past attempts at incubating eggs at various STEP facilities has not proved practical or cost effective. Additionally, the water supply at Bandon Hatchery is extremely reliable, and includes a state-of-the-art alarm system. Table 70. Annual production at Bandon Hatchery Species Stock Eggs Fingerlings Smolts/Trophy Fall Chinook Coos River (37) 1,750,000 552,500 0 Fall Chinook Coquille River (44) 309,000 0 0 Coho Coos River (37) 50,000 0 0 Coho Coquille River (44) 40,000 0 0 Rainbow Trout Cape Cod (72) 0 0 2,800 Winter Steelhead Coos River (37) 221,000 0 0 Winter Steelhead Coquille River (44) 50,000 0 48,000 Winter Steelhead Ten Mile Lakes (88) 30,000 0 0
Winter Steelhead South Umpqua (144) 20,000 0 70,000
Totals 2,470,000 552,500 120,800

186 December 14, 2010 HB 3489 Report
Bandon Hatchery feeds approximately 29,000 pounds of feed per year. Mechanical belt feeders are used for the inside rearing troughs. All feeding of the outside ponds is done by hand.

187 December 14, 2010 HB 3489 Report
A.3 Butte Falls Hatchery Butte Falls Hatchery is located 35 miles northeast of Medford off Highway 62 on the Butte Falls Highway, one mile east of the town of Butte Falls. The site is approximately 2,500 feet above sea level, at latitude 42o 32’ 15” N (42.5375) and longitude 122o 33’ 11’ W (122.5531). Total land area is 14.6 acres. The titles have been researched. One section of the hatchery totally 10.4 acres is free of and clear of any reversion clause. A reversion cause would apply on the 4.2 acres of the former federal portion of the hatchery site (described below) which includes the most of the houses and buildings. The hatchery water is supplied by gravity flow (one of four state coastal hatcheries that do not require pumping) from an intake on Big Butte Creek, approximately 0.5 miles above the hatchery. The hatchery's water rights are 15.5 cfs from the South Fork of Big Butte Creek. Water temperatures range from 34o-67oF Under normal operations the facility is staffed with 3.0 FTE's.
Table 71. Rearing facilities at Butte Falls Hatchery Unit Unit Unit Unit Unit Number Total Construction
Type Length Width Depth Volume Units Volume Material Age Condition Comment
(ft) (ft) (ft) (ft3) (ft3)
Raceways 70 20 4 5,600 6 33,600 Concrete 1954 fair
Raceways 100 9.5 3 2,850 5 14,250 Concrete 2004 excellent
Raceways 40 10 2.5 1,000 2 2,000 Concrete 1929 poor
Raceways 100 10 2.5 2,500 6 15,000 Concrete 1929 poor 2 not usable, 2 usable for larger fish only
Circular Ponds 25 2 246 4 984 Concrete 1929 poor Not used for production
Troughs 16 2.5 1.5 60 36 2,160 Concrete 1944 good
Troughs 16 1.16 0.5 9 20 186 Aluminum 1987 good
Vertical incubators 104 fair 13 stacks of 8 trays each
Rearing Pond 100 100 6 1 Earthen 1954 fair not used for production
Hatchery buildings include the following: Incubation Building (15014), Office Building (15028), Wood Shop (15034), Shop (15036), Storage Building (15037), Garage/Shop (10533), Cold Storage/Grinder Room (15038), Residence #1 (15111) and Garage (15039), Residence #2 (15112) and Storage (15029), Residence #4 (15113) and Garage/Shop(15055), and Residence #5 (15114). Butte Falls Hatchery has been operated continuously at its present site since 1915. At that time, the Oregon Fish and Game Commission began rearing rainbow trout in earthen ponds using water from Big Butte Creek, which was diverted ½ mile upstream through a wooden flume. For this purpose, 10.4 acres of land were deeded to the State of Oregon by the Butte Falls Lumber Company. Water rights to 6,950 gpm from Big Butte Creek were established in 1923. In 1932, the U.S. Fish and Wildlife Service began construction of a hatchery on three acres of land adjacent

188 December 14, 2010 HB 3489 Report
to the state hatchery and began producing spring Chinook salmon. The water supply, which was shared with the State, was upgraded with the construction of a concrete intake structure and wooden staved pipeline. An egg taking station with adult collection and holding facilities was established at the same time at McCloud, Oregon, near the mouth of Big Butte Creek on the Rogue River. Chinook eggs were collected there and then transported back to the hatchery for incubation, rearing, and release into Big Butte Creek. The U.S. Fish and Wildlife Service turned over operation of these facilities to the Oregon Game Commission in 1941. The State has operated these facilities since that time, raising both trout and salmon at varying production levels. Later, during the 1950s and ‘60s, the wooden pipeline was replaced with steel and additional concrete rearing ponds were constructed. More recent investments in Butte Falls Hatchery have helped modernize the facility with funding from ODFW’s Fish Restoration and Enhancement Program. In 2003 the intake structure was completely remodeled to comply with all screening and downstream migrant standards and requirements, making Butte Falls the lone coastal hatchery meeting passage and screening requirements at this time. That same year an old rearing pond #13 was completely rebuilt and divided to create five 9’ X 100’ rearing ponds. A new state of the art alarm system has been installed in 2002. The overall condition of Butte Falls Hatchery structures, buildings and facilities ranges from poor to very good. Butte Falls Hatchery does require the construction of a settling pond in order to better meet new State and Federal water pollution control requirements. The new settling pond design is designed based on the most current technologies in pollution abatement, and is ready for construction. Approximately $500,000 is needed for this project. Under normal operations production consists of 100,000 fall Chinook salmon smolts, 192,500 coho salmon smolts, 402,500 fingerling rainbow trout, and 77,120 legal rainbow trout. Butte Falls Hatchery is ready to resume full production in 2010 after an outbreak of infectious hematopoietic necrosis virus (IHNV) occurred at the hatchery in 2006. It is believed that wild adult fish carrying IHNV that swam above the hatchery intake caused the viral outbreak. The ODFW Fish Health Management Policy restricts the transfer or release of fish from hatcheries at which certain disease outbreaks have occurred until it can be shown that susceptible fish stocks at the facility have been free of the specific disease for three consecutive years. Under these restrictions, fish infected with IHNV may only be released into waters in which the pathogen is endemic. Butte Falls Hatchery has been virus free for three consecutive years. Production during those years has been limited to small groups of rainbow trout kept on station to test for the presence of the virus. At full production, Butte Falls Hatchery feeds approximately 53,000 pounds of feed per year. Belt feeders are used for starting fry; all other feeding is done by hand.

189 December 14, 2010 HB 3489 Report
The hatchery has been funded 50% general fund and 50% other funds. Recently Butte Falls has been operating at a reduced capacity on other funds only. Beginning in 2007 Butte Falls Hatchery began operating as a satellite facility of Cole Rivers Hatchery. The manager of Cole M. Rivers Hatchery is also responsible for the management of Butte Falls Hatchery. In 2003 an old earthen rearing pond was resurrected into a trout fishing pond suitable for children and individuals needing universal access. The pond has become an extremely popular facility with as many as 200 – 300 people fishing per day on weekends.

190 December 14, 2010 HB 3489 Report
A.4 Cedar Creek Hatchery Cedar Creek Hatchery is located 1.5 miles east of Hebo off Highway 22, adjacent to Three Rivers, a Nestucca River tributary. The site is approximately 43 feet above sea level, at latitude 45o 12’ 57” N (45.21583) and longitude 123o 50’ 43” W (123.8453). The site encompasses 35.33 acres; all titles have been researched and are free and clear of any reversion clauses. Water source for the hatchery is by gravity from Cedar Creek and by pump from Three Rivers during low summer flows. Total current water rights are for 44.42 cfs from Cedar Creek and 6.20 cfs from Three Rivers. Water temperatures range from 35o-65oF The facility is operated with 3 FTE's.
Table 72. Rearing facilities at Cedar Creek Hatchery Unit Unit Unit Unit Unit Number Total Construction
Type Length Width Depth Volume Units Volume Material Age Condition Comment
(ft) (ft) (ft) (ft3) (ft3)
Adult Holding Ponds 94 20 4.5 8,460 2 16,920 concrete 1989 excellent
Abatement 450 135 6 696,000 1 696,000 asphalt 1984 good
Rearing Pond 280 80 4 87,000 1 87,000 asphalt 1999 good
Rearing Pond 35 20 3 2,100 1 2,100 concrete 1969 fair
Raceways 100 20 4 8,000 3 24,000 concrete 1979 good
Raceways 100 20 5 10,000 1 10,000 concrete 1974 fair
Raceways 100 20 4 8,000 2 16,000 concrete 1989 excellent center wall w/ removable
dividers
Troughs 16 1.2 0.58 11 12 134 aluminum 1979 good
Troughs 14 3 2.5 105 4 420 concrete 1974 good
Troughs 16 2.75 1.5 66 4 264 fiberglass 1999 excellent
Troughs 16 3 2.25 108 4 432 fiberglass 1999 excellent
Vertical Incubators 240 1984 good 15 stacks of 16 trays
Abatement Pond 8,000 concrete 1954 fair
Abatement Pond 24,624 concrete 1954 fair Can also pump to large asphalt
pond Hatchery buildings include the following: Utility Building (29229), Pole Barn #1 (29231), Pole Barn #2 (29233), Electrical Building (29238), Incubation Building (29239), Cold Storage/Office Building (29249), Garage/Shed/Shop (29255), Residence #1 (29273/29251), Residence #2 (29274/29242), Residence #3 (29275), Residence #4 (29276), Spawning Building (29221), and Mobile Home-Silvercrest (29277). Cedar Creek Hatchery has been continuously operated on its present site since 1914. The hatchery site was purchased on August 5, 1925, for $1,329, and was added to in 1951, 1958, 1969, 1972, and 1978. At current production levels, water quantity and quality are sustainable through the late summer months. The condition of the rearing facilities ranges from fair to good. Cedar Creek Hatchery has modified production in order to meet new state and federal water pollution control

191 December 14, 2010 HB 3489 Report
requirements. There is a weir and adult collecting facilities on Three Rivers and a weir on Cedar Creek. A satellite facility—Rhoades Pond—is owned by ODFW and is currently leased to the Nestucca Anglers; it has been used continuously for several years. It is currently the site of a STEP fall Chinook rearing project. The hatchery has been funded 100 percent from the Other Funds (i.e. license fees).
Table 73. Annual production at Cedar Creek Hatchery Species Stock Eggs for
STEP Eggs for
Salmon River Fingerlings Smolts/ Legals+
Fall Chinook Nestucca River (47) 50,000 0 105,000 0* Spring Chinook Nestucca River (47) 65,000 0 0 110,000 Summer Steelhead Siletz River (33) 0 120,000** 0 54,000**
Summer Steelhead Nestucca River (47) 0*** 0 0 100,000
Winter Steelhead Nestucca River (47) 2,000 0 85,000 40,000
Winter Steelhead
Nestucca River (47W) 0 0 0 70,000
Rainbow Trout Cape Cod (72) 0 0 0 600**** Totals 117,000 120,000 190,000 374,600 *Fingerlings provided to Rhoades Pond STEP for eventual smolt release in Three Rivers/Nestucca River ** 54 K go to Cedar Creek Hatchery to mix with 47 stock, 120K go to Salmon River for Siletz StS program. ***May use StS eggs for STEP if StW not available ****Trophy trout for various special events and Free Fishing Weekend Cedar Creek Hatchery feeds approximately 41,600 pounds of feed per year. The majority of the feeding is done by hand, but small automatic feeders are utilized during early rearing in the hatch house starter tanks before the fish are transferred to outside raceways. In some cases, the auto-feeders are used as a supplement to hand feeding after transfer.

192 December 14, 2010 HB 3489 Report
A.5 Elk River Hatchery Elk River Hatchery is located 7.5 miles upriver from Highway 101 just north and east of the City of Port Orford. Site is at an elevation of approximately 108 feet above sea level, at latitude 42o 44’ 20” N (42.73889) and longitude 124o 24’ 10” W (124.4028). The hatchery area is 13.2 acres; all titles have been researched and are free and clear of any reversion clauses. Incubation water supply is pumped from a sub-surface well with a 7.5 horsepower line-shaft turbine pump. Four, 40 hp line-shaft turbine pumps through a screened intake pump the entire hatchery rearing water supply from Elk River. Water rights are for 20.015 cfs. Water temperatures range from 39o-74oF The facility is staffed with 4 FTE’s.
Table 74. Rearing facilities at Elk River Hatchery Unit Unit Unit Unit Unit Number Total Construction
Type Length Width Depth Volume Units Volume Material Age Condition Comment
(ft) (ft) (ft) (ft3) (ft3)
Raceways 75 17 3 3,825 24 91,800 concrete 40 Good modified Burroughs ponds
Circular Ponds 14 2.5 385 1 385 fiberglass 25 Good
Vertical Incubators 560 Fair 35 stacks of 16 trays Hatchery buildings include the following: Service Building (08030), Incubation Building (08031), Electrical Building (08036), Generator Building (08047), three Residences (08072/08073/08074) with the same floor plan, and the Steelhead Building (08075). Elk River Fish Hatchery has been operated continuously on its present site since 1968. The hatchery was constructed on 21.5 acres (including easements) of donated land and was expanded in 1971. Adult trap and holding facilities for Elk River fall Chinook salmon include a fish ladder, an alley-type trap and 10 separate holding pens. Two of the rearing ponds (epoxy coated and fenced) are used during winter months as adult holding ponds for Chetco River fall Chinook salmon. A stand-alone building supplied with pathogen free well water houses the polyurethane-coated adult holding ponds for Chetco River winter steelhead. Considering the many improvements and upgrades since 1995, the overall condition of Elk River Hatchery structures, buildings, and facilities ranges from good to very good. Elk River Hatchery does not require upgrades to meet new state and federal water pollution control requirements. The hatchery has been funded 100 percent from the State’s General Fund.

193 December 14, 2010 HB 3489 Report
Table 75. Annual production at Elk River Hatchery Species Stock Eggs for
STEP Unfed Fry Fingerlings Smolts/Legals+
Fall Chinook Elk River (35) 700 200,000 0 325,000 Fall Chinook Chetco River (96) 1,500 0 0 150,000 Rainbow Trout Cape Cod (72) 0 0 0 7,000 Winter Steelhead Chetco River 600 0 4,500 50,000
Totals 2,800 200,000 4,500 532,000 Elk River Hatchery feeds approximately 35,000 pounds of feed per year; all feeding is done by hand.

194 December 14, 2010 HB 3489 Report
A.6 North Nehalem River Hatchery The North Nehalem Hatchery is located on the North Fork Nehalem River 12 miles east of the town of Nehalem on Highway 53. The site is at an elevation of 160 feet, at latitude 45o 39’ 41” N (45.8130) and longitude 123o 50’ 20” W (123.7745). Total land area is 26.2 acres. The hatchery water rights are 23.3 cfs pumped from the North Fork Nehalem River and 0.22 cfs gravity flow from Mile Post #8 spring, located across Highway 53 from the hatchery. North Fork Nehalem water temperatures range from 32o - 72o F; spring water temperatures range from 38o -53o F. Water quality is abundant from a single source. Ponding options and isolation ability are good, but some minor limits to flexibility exist. The facility is staffed with 3.5 FTE's.
Table 76. Rearing facilities at North Nehalem River Hatchery Unit Unit Unit Unit Unit Number Total Construction
Type Length Width Depth Volume Units Volume Material Age Condition Comment
(ft) (ft) (ft) (ft3) (ft3)
Adult Holding pond 50 26 3.2 3,328 1 3,328 concrete 1966 good
Raceways 75 16 2.5 3,000 20 60,000 concrete 1966 fair 1 raceway holds the 6
Canadians
Troughs 21 2.6 1.66 91 6 544 fiberglass 1988 good Canadian troughs
Trough 16 1.2 0.5 10 1 10 aluminum good picking trough
Circular Tanks 6 1.5 52 3 156 fiberglass
Vertical Incubators 255 fiberglass poor 17 stacks of 15 trays Hatchery buildings include the following: Residences #1 - #4 (04056, 04057, 04058, and 04059), Pole Building (04060), Service Building (04070), Shop/Storage Building (04072), and Restroom Building (04088). The Nehalem Hatchery has been continuously operated on its present site since 1966. The Hatchery was constructed in 1966, and replaced the old Nehalem Hatchery which was constructed in 1925 and located on Foley Creek, a tributary of the mainstem Nehalem River near the head of tidewater. Egg incubation and early rearing is accomplished by using pathogen-free water when available, which is diverted from a spring that is located across Highway 53 from the hatchery. The condition of the rearing facility is good with the exception of settling which is affecting some of the raceways and one building. In 1992, an angling platform was constructed at the hatchery to provide access for disabled anglers. This one-of-a-kind platform produces a high-harvest rate on surplus hatchery fish, by members of the disabled angling community. This is a popular facility, and was expanded to twice its original size in 2004. As of November 1, 2002, Trask River Hatchery became a satellite facility of Nehalem Hatchery. The manager of Nehalem Hatchery is also responsible for the management of Trask River Hatchery and its associated satellite facilities.

195 December 14, 2010 HB 3489 Report
Table 77. Annual production at North Nehalem River Hatchery Species Stock Fingerlings Smolts Legals/Trophy Fall Chinook Trask River (34) 0 25,000* 0
Coho NF Nehalem (32) / Fishhawk Lake (99)** 0 100,000 0
Coho Trask River (34) 0 100,000*** 0 Rainbow Trout Cape Cod (72) 0 0 83,950 Winter Steelhead NF Nehalem (32) 0 130,000 0 Totals 0 355,000 83,950 *Fingerlings transferred from Trask River Hatchery after marking. **Fishhawk Lake Stock 99 is reared every third year. ***Adults collected and spawned at TRH. Reared at NNH, then transferred back to TRH for acclimation/release Nehalem Hatchery feeds approximately 92,000 pounds of feed per year. Most feeding is done by hand; belt feeders are used for starting fry, and demand feeders are used for steelhead grow-out from September through April.

196 December 14, 2010 HB 3489 Report
A.7 Rock Creek Hatchery Rock Creek Hatchery is located on the North Umpqua River, 23 miles east of Roseburg, just off Highway 138. The site is at an elevation of approximately 820 feet above sea level, at latitude 43o 20’ 07” N (43.33528) and longitude 123o 00’ 05” W (123.0014). Total land area is 26.5 acres. The hatchery water supply is obtained from two sources: Rock Creek and the North Umpqua River. Water from Rock Creek is supplied by gravity; North Umpqua water is pumped during the summer months. Water rights are 30 cfs for Rock Creek and 25 cfs for the North Umpqua. Soda Springs adult pond is supplied from the North Umpqua at 4 cfs. Water temperatures range from 37o-70oF. The facility is staffed with 5 FTE's.
Table 78. Rearing facilities at Rock Creek Hatchery Unit Unit Unit Unit Unit Number Total Construction
Type Length Width Depth Volume Units Volume Material Age Condition Comment
(ft) (ft) (ft) (ft3) (ft3)
Holding Pond 135 26 3.5 12,285 1 12,285 concrete 1944 good
Raceways 145 20 4 11,600 6 69,600 concrete 1944 poor
Raceways 80 20 4.5 7,200 7 50,400 concrete 1979 good
Raceways 80 30 4.5 10,800 2 21,600 concrete 1979 good
Troughs 16 2 2 64 5 320 fiberglass 1994 good
Trough 16 2 3 96 1 96 fiberglass 2003 new
Vertical Incubators 300 1994 good 20 stacks of 15 trays
Abatement Pond 110 90 6 1 concrete w/ dirt bottom 1979 good
Hatchery buildings include the following: Residence (10091), Residence (10092), Residence (10093), Residence (10094), Residence (10095), Generator Building (10122), Garage Building (10126), Pumphouse (10130), and Incubation Building (10140). Construction of the original hatchery began in 1920 near the mouth of Rock Creek. In 1925, the salmon hatchery moved to a new site across from the trout hatchery which closed in 1943. The hatchery operated continuously until 1975 when the hatchery was closed due to the facility’s rearing problems related to summertime high temperatures and low flows in Rock Creek. The hatchery was reopened in 1979, after completion of $1.8 million improvements that provided a new summertime water supply via a pump station in the North Umpqua River, new concrete raceways, an effluent settling basin, and expanded domestic sewage treatment facilities. In 1982, another raceway was constructed with funds from Douglas County as mitigation for wild coho impacts from Galesville Dam, located on upper Cow Creek, tributary of the South Umpqua. A new fishway and collection facility was constructed in 1989, to meet the objectives and tasks included in the North Umpqua Fish Management Plan adopted by the OFWC in 1986. Further housing

197 December 14, 2010 HB 3489 Report
improvements and facility expansions, including much improved public road access and “host site”, were completed in 1991-92. The incubation facility was renovated in 1993 with a state-of-the-art water filtration system, ozone and UV sterilization system, water chillers, 20 stack incubators and five Canadian troughs. In 1997, a 245 kw emergency generator was installed as a backup system for the North Umpqua River pumping station. In 1998, the Rock Creek intake was completely reconstructed and the pumping station screens replaced to comply with current NMFS screening specifications. In 2004 the hatch house and raceways 9 through 15 were plumbed into the abatement pond to bring the hatcheries effluent into compliance with NPDES 300J permit regulations. The upgrade of the pumping station was completed in 2010. Table 79. Annual production at Rock Creek Hatchery
Species Stock Eggs for STEP
Eggs for Pacificorp Research
Fingerlings Smolts/ Legals+
Fall Chinook Cow Creek (18) 350,000 0 0 0 Fall Chinook Smith River (151) 0 0 0 70,000 Spring Chinook Umpqua River (55) 0 0 0 342,000 Coho Cow Creek (18) 0 0 0 60,000 Coho Umpqua River (55) 0 80,000 0 0 Rainbow Trout Cape Cod (72) 0 0 0 57,600 Rainbow Trout Fish Creek (551) 0 0 9,600 4,000 Summer Steelhead Umpqua River (55) 1,000 0 0 110,000
Winter Steelhead Cow Creek (18) 2,000 0 0 120,000 Winter Steelhead Umpqua River (55) 0 0 0 60,000 Totals 353,000 80,000 9,600 823,600 The Umpqua Watershed is unique to Oregon as the only watershed to be encompassed by an entire county (Douglas) and the only coastal ESU watershed to cut through the Oregon Coast Range and drain the Cascade mountain range. Rock Creek Hatchery production provides diverse year-round fishing opportunities on over 285 river miles of the Umpqua River Basin. Rock Creek Hatchery feeds approximately 142,500 pounds of feed per year. Belt feeders are used to feed fry in the Canadian troughs; all other feeding is done by hand.

198 December 14, 2010 HB 3489 Report
A.8 Salmon River Hatchery Salmon River Hatchery is located seven miles north of Lincoln City off Highway 18 near Otis. Site is at an elevation of 30 feet above sea level, at latitude 45o 01’ 02” N (45.02667) and longitude 123o 56’ 11” W (123.9503). Site area is 23.67 acres; all titles have been researched and are free and clear of any reversion clauses. The hatchery water supply is provided by five electric pumps on Salmon River. Water rights are for 30.03 cfs. Water temperatures range from 35o-73oF. The facility is staffed with 3.3 FTE's.
Table 80. Rearing facilities at Salmon River Hatchery Unit Unit Unit Unit Unit Number Total Construction
Type Length Width Depth Volume Units Volume Material Age Condition Comment
(ft) (ft) (ft) (ft3) (ft3)
Adult Holding Pond 88 31 4 10,912 1 10,912 concrete fair Future plans include rebuilding
entire
adults collection/handling/ sorting/
Adult Holding Pond 88 31 3 8,184 1 8,184 concrete fair spawning area.
Rearing Ponds 187 28 5 26,180 3 78,540 asphalt fair Needs resealing and new valves
Raceways 80 20 2.5 4,000 4 16,000 concrete 1988 fair Needs resealing and new valves
Raceways 80 10 2.5 2,000 2 4,000 concrete 1988 fair Needs resealing and new valves
Raceways 80 10 2.5 2,000 4 8,000 concrete 1976 fair Dividers between two ponds can be removed to make one 20'x80'
pond. Needs new intake manifolds and new valves
Rearing Troughs 21 2.67 1.5 84 2 168 aluminum 1981 good
Vertical Incubators 256 2003 excellent excellent
Vertical Incubators 64 1987 fair fair
Abatement Pond 1 earthen fair Needs to be excavated Hatchery buildings include the following: Utility Building (21163), Residence #1(21208), Residence #2 (21209), Incubation Building (21210), Mobile Home “Camelot” (21215) and Manufactured Home “Fleetwood”. The Salmon River Hatchery was constructed in 1975, and has been in continuous operation since that time. The Hatchery has been funded 100 percent under the State General Fund, but is currently funded with 50% State General Fund and 50% Other Fund. The condition of the rearing facilities is generally good. Some work would be required to address current needs before the site could be classified as in “very good” operational status.
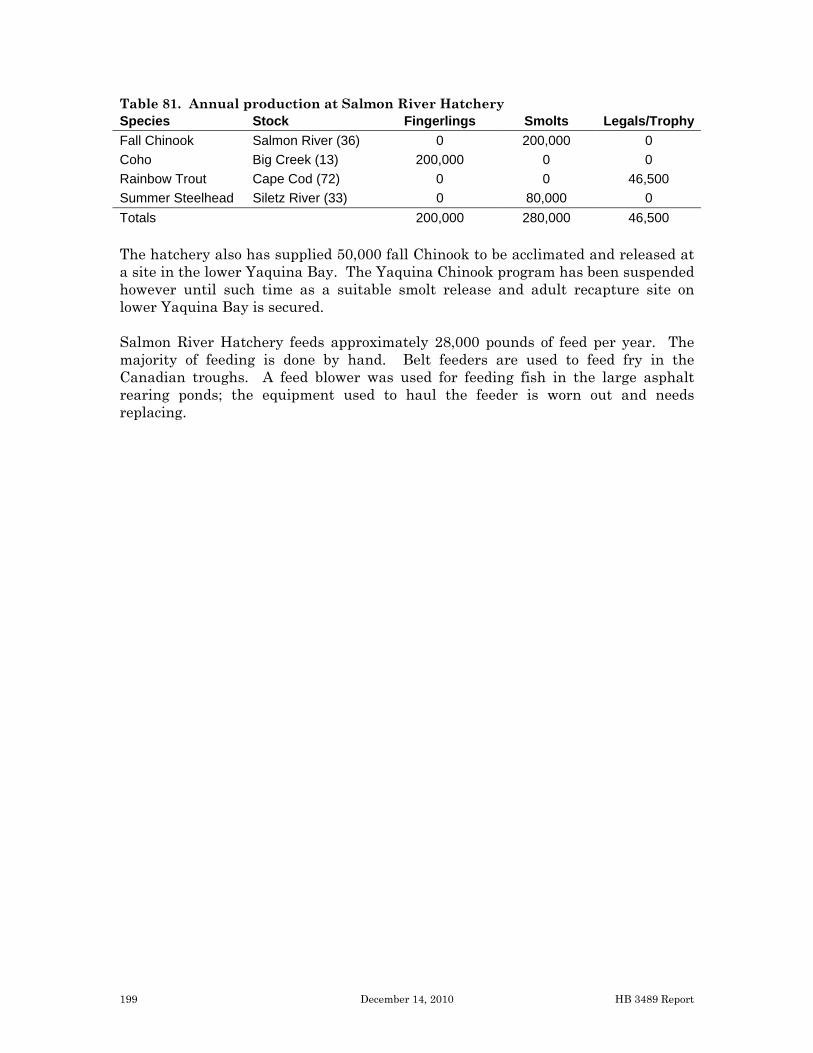
199 December 14, 2010 HB 3489 Report
Table 81. Annual production at Salmon River Hatchery Species Stock Fingerlings Smolts Legals/TrophyFall Chinook Salmon River (36) 0 200,000 0 Coho Big Creek (13) 200,000 0 0 Rainbow Trout Cape Cod (72) 0 0 46,500 Summer Steelhead Siletz River (33) 0 80,000 0 Totals 200,000 280,000 46,500 The hatchery also has supplied 50,000 fall Chinook to be acclimated and released at a site in the lower Yaquina Bay. The Yaquina Chinook program has been suspended however until such time as a suitable smolt release and adult recapture site on lower Yaquina Bay is secured. Salmon River Hatchery feeds approximately 28,000 pounds of feed per year. The majority of feeding is done by hand. Belt feeders are used to feed fry in the Canadian troughs. A feed blower was used for feeding fish in the large asphalt rearing ponds; the equipment used to haul the feeder is worn out and needs replacing.

200 December 14, 2010 HB 3489 Report
A.9 Trask River Hatchery Trask Hatchery is located on the Trask River eight miles east of Tillamook. The site encompasses 18.94 acres and is at an elevation of approximately 100 feet above sea level, at latitude 45o 25’ 53” N (45.43139) and longitude 123o 43’ 58” W (123.7328). All titles for Trask Hatchery have been researched and are free and clear of any reversion clauses. Trask Pond is located on the East Fork of the S. Fork Trask River, sixteen miles east of Tillamook on Trask River County Road. The site is at an elevation of approximately 420 feet, at latitude 45o 24’ 42” N (45.41167) and longitude 123o 35’ 45” W (123.5958). The site area is 32.88 acres. The Tuffy Creek facility is located approximately 22 miles east of Tillamook off Highway 6 at the South Fork Wilson River Forest Camp, and is operated in cooperation with the Oregon Department of Corrections. The main hatchery water supply is obtained from two sources: Gold Creek, and Mary’s Creek. The water right is for 9 cfs from Gold Creek and 1 cfs from Mary’s Creek. Water temperatures range from 35o-64oF. There is also a water right of 9 cfs from the Trask River that is unusable when needed in the summer due to intake location. Trask Pond is supplied by water form the East Fork of the South Fork Trask River. The water right is for 29.755 cfs. Water temperatures range from 33o-64oF. Tuffy Creek is supplied by water from the South Fork Wilson River. The water right is for 3 cfs. Water temperatures range from 32o-61oF. The facility is staffed with 4.25 FTE's.
Table 82. Rearing facilities at Trask River Hatchery and satellite facilities Unit Unit Unit Unit Unit Number Total Construction
Type Length Width Depth Volume Units Volume Material Age Condition Comment
(ft) (ft) (ft) (ft3) (ft3)
Adult Holding Pond 50 30 2.6 3,900 1 3,900 concrete Fair Pond T-9 Trask Hatchery
Adult Holding Pond 40 20 3.7 2,960 1 2,960 concrete Fair Pond T-3 Trask Hatchery
Rearing Pond 225 64 5 72,000 1 72,000 butyl liner 2006 good Trask Pond
Rearing Pond 120 35 3.5 14,700 1 14,700 asphalt 1988 Good Tuffy Creek
Raceways 100 30 3.5 10,500 2 21,000 concrete Good Pond 1&2 Trask Hatchery
Raceways 50 8 2.7 1,080 8 8,640 concrete Fair Ponds 5-12 Trask Hatchery
Raceway 142 30 2.4 10,224 1 10,224 concrete Fair Pond 13Trask Hatchery
Raceway 50 50 1.6 4,000 1 4,000 concrete Fair Pond 14 Trask Hatchery
Canadian Troughs 15 3 2.6 115 10 fiberglass Good CT-1-10 Trask Hatchery
Troughs 15 1.2 .6 10.8 4 43.2 fiberglass Good Trask Hatchery
Vertical Incubators 384 fiberglass poor Trask Hatchery
Vertical Incubators 176 plastic 2008 new Trask Hatchery
Vertical Incubators 112 Good Tuffy Creek Hatchery buildings include the following: Residence (29283), Residence (29284), Incubation Building (29290), Storage Building (29306), Freezer Building (29324)

201 December 14, 2010 HB 3489 Report
and Spawning Shed (29330). A 24ft by 48ft early rearing building and a 40ft by 60 ft storage building / shop were added in 2007. The Trask River Hatchery site was purchased on November 28, 1914, and was expanded in 1960, 1961, 1962, and 1976. The Trask River Hatchery has been continuously operated on its present sight since 1914. The East Fork Trask Pond (Trask Pond) began operations in 1971 as a satellite of Trask River Hatchery. Trask Pond is on property leased from the Oregon Department of Forestry (ODF). The Tuffy Creek satellite facility located at South Fork Prison Camp on the South Fork of the Wilson River was completed in 1989. Tuffy Creek operates under a Special Use Permit from ODF and is in partnership with ODF, Oregon Department of Corrections (ODC) and ODFW. In addition, Trask Hatchery supplies eyed eggs to the Whiskey Creek STEP facility (operated by Tillamook Anglers) and to STEP volunteers. The manager position at Trask was eliminated due to General Fund reductions; the facility is managed as a satellite of Nehalem Hatchery. The hatchery is funded 30.5 percent from the State’s General Fund and 69.5 percent other funds.
Table 83. Annual production at Trask River Hatchery Species Stock Eggs for STEP Fingerlings Smolts Fall Chinook Trask River (34) 280,000 26,000* 113,000 Spring Chinook Trask River (34) 156,000 183,000** 70,000 Coho Trask River (34) 20,000 140,000*** 100,000
Winter Steelhead Wilson River (121F) wild brood 0 0 100,000
Totals 456,000 349,000 383,000 *Fingerlings transferred to North Nehalem Hatchery for rearing and release in Necanicum R. **Fish transferred to Tuffy Cr. Pond (63K) and EF Trask Pond (120K) for eventual smolt releases in Wilson and Trask rivers. ***Fingerlings transferred to North Nehalem Hatchery for rearing, smolts transferred back for acclimation/release
Table 84. Annual production at Trask Pond Species Stock Eggs for STEP Fingerlings Smolts Spring Chinook Trask River (34) 0 0 160,000* Totals 0 0 160,000 *Includes 40K transferred in from Whiskey Cr. STEP and 120K from Trask River Hatchery
Table 85. Annual production at Tuffy Creek Species Stock Eggs for STEP Fingerlings Smolts Spring Chinook Trask River (34) 0 0 60,000 Winter Steelhead Trask River (34) 0 0 80,000 Totals 0 0 140,000 Trask River Hatchery and its satellite facilities feed approximately 43,000 pounds of feed per year. Feeding at Trask River Hatchery is done by hand, except for belt feeders used to start fry. Three automatic feeders were purchased for use at Trask Pond for feeding on weekends, holidays and furlough days.

202 December 14, 2010 HB 3489 Report
Appendix B. Fish Hatchery Management Policy 635-007-0542 Purpose of the Hatchery Management Policy (1) The purpose of the Hatchery Management Policy is to describe the hatchery tool and its range of applications. The Hatchery Management Policy also provides general fish culture and facility guidelines and measures to maintain genetic resources of native fish populations spawned or reared in captivity. This policy applies to all Department hatchery operations and programs including Salmon and Trout Enhancement Program (STEP) fish propagation projects (OAR 635-009-0090 through 635-009-0240) and Cooperative Salmon Hatchery Programs (OAR 635-009-0400 through 635-009-0455). (2) This policy describes best management practices that are intended to help ensure the conservation of both naturally produced native fish and hatchery produced fish in Oregon through the responsible use of hatcheries. The conservation of hatchery produced fish is important to maintain opportunities for fisheries and aid conservation of naturally produced native fish. (3) The Hatchery Management Policy complements and supports the Native Fish Conservation Policy OAR 635-007-0502 through 635-007-0506 and will be implemented through conservation plans developed for individual species management units, hatchery program management plans, or other formal agreements with management partners. The Hatchery Management Policy provides a foundation for the management and reform of hatcheries in Oregon, whereas the Native Fish Conservation Policy establishes the process for defining the specific use of the hatchery tool in specific watersheds. Stat. Auth.: ORS 496.012 and 496.138 Stats. Implemented: ORS 496.171, 496.172, 496.176, 496.182, 496.430, 496.435, 496.445, 496.450, and 496.455 Hist.: Adopted 5-9-03, ef. upon filing 635-007-0543 Hatchery Management Policy Goals (1) Foster and sustain opportunities for sport, commercial and tribal fishers consistent with the conservation of naturally produced native fish. (2) Contribute toward the sustainability of naturally produced native fish populations through the responsible use of hatcheries and hatchery-produced fish. (3) Maintain genetic resources of native fish populations spawned or reared in captivity. (4) Minimize adverse ecological impacts to watersheds caused by hatchery facilities and operations.

203 December 14, 2010 HB 3489 Report
Stat. Auth.: ORS 496.012 and 496.138 Stats. Implemented: ORS 496.171, 496.172, 496.176, 496.182, 496.430, 496.435, 496.445, 496.450, and 496.455 Hist.: Adopted 5-9-03, ef. upon filing 635-007-0544 Operating Principles for Hatchery Management (1) Hatchery management and reform will generally proceed from the following hatchery premise: The ideal hatchery removes as many random mortality effects as possible without having any other influence on the natural life or experience of native fish and their habitats. The hatchery premise has five main components that managers shall strive to incorporate into hatchery programs:
(a) Removing random mortality occurring in the natural environment; (b) simulating selective mortality operating in the natural environment; (c) minimizing artificial selection; (d) providing fish rearing and training experiences to reduce unnatural behaviors; and (e) minimizing ecological impacts associated with hatchery operations (e.g., competition and predation associated with release location and number, pathogen transfer and amplification, pollutants, passage barriers, over harvest of weak stocks in mixed stock fisheries).
(2) Success moving toward the premise in subsection (1) will be largely dependent on funding, research, program type, and facility or operating flexibility. (3) Hatchery program management plans shall be developed and implemented in consultation and cooperation with management partners and the public, and in coordination with native fish conservation policy plans at local and regional scales. (4) Hatchery programs shall be managed to provide optimum fishery and conservation benefits, based on the best available scientific information. Most programs will contribute toward fish management objectives primarily by raising fish for harvest while minimizing the impact on, or benefiting, fish that spawn naturally. (5) Hatchery facilities shall be operated to maximize fish quality and minimize adverse impacts to watersheds, consistent with fish management objectives, applicable permits and agreements. (6) Monitoring and evaluation shall be adequate to measure progress toward fish management and hatchery program objectives, contain risks within acceptable limits, and provide feedback for adaptive management.

204 December 14, 2010 HB 3489 Report
Stat. Auth.: ORS 496.012 and 496.138 Stats. Implemented: ORS 496.171, 496.172, 496.176, 496.182, 496.430, 496.435, 496.445, 496.450, and 496.455 Hist.: Adopted 5-9-03, ef. upon filing 635-007-0545 Hatchery Program Management Plans (1) The Department shall develop hatchery program management plans for all hatchery programs. Clear management objectives that describe the role and expectations for hatchery programs relative to species conservation, watershed health and fisheries shall be the foundation for all hatchery program management plans. A hatchery program management plan may be a Hatchery and Genetic Management Plan, a Lower Snake River Compensation Plan annual operating plan, an aspect of a conservation plan developed under the Native Fish Conservation Policy (OAR 635-007-0502 through -0506) or similar document which describes the program’s objectives, fish culture operations, facilities operations, and monitoring and evaluation, as more fully detailed in subsections (2) through (24) of this rule.
Planning and Coordination of Hatchery Programs
(2) When developing hatchery program management plans, the Department shall use the most up to date and reliable scientific information and seek the input and involvement of appropriate tribal, state and federal management partners, university programs and the public. (3) The Native Fish Conservation Policy (OAR 635-007-0502 through -0506) provides the primary process for planning and coordinating hatchery programs, but these programs shall also be coordinated with obligations arising in other forums (e.g., U.S. v. Oregon, Lower Snake River Compensation Plan, Pacific Salmon Treaty) to avoid inconsistency and duplication. (4) Coordination objectives include:
(a) efficient use of resources (including sharing of facilities, staff, equipment and supplies); (b) improved communication among managing entities to share information and experience, jointly resolve issues, and promote common objectives pursued at local and regional scales.
(5) Hatchery program management plans shall be submitted to and approved (or modified) by the Fish Division. The Fish Division may waive the requirement to include specific elements of a hatchery program management plan upon a determination that the requirement would provide no appreciable benefit to hatchery management or native fish conservation.

205 December 14, 2010 HB 3489 Report
(6) The Department shall continue to operate a hatchery program according to existing statutes, administrative rules, Commission directives, and binding agreements until that program’s plan is approved.
Hatchery Program Objectives and Types
(7) Hatchery program objectives and types shall be based on fish management objectives established via conservation plans (OAR 635-007-0505) or other binding agreements. Until conservation plans or other agreements are in place, hatchery program objectives and types will be based on existing statutes, rules, Commission directives and current management direction. (8) Hatchery program management plans shall include measurable criteria relating to the following general objectives:
(a) conservation and/or fishery benefits; (b)a net survival advantage (egg to adult) over naturally produced fish; (c) minimal adverse interactions (e.g., competition, predation, genetic introgression, and disease amplification) of hatchery programs with naturally produced native fish populations; (d) minimal adverse effects (e.g., water quality and quantity, solid and chemical wastes and fish passage) of hatchery facility operations on watershed health and native fish populations; and (e) sustainability of hatchery programs over time.
(9) Department hatchery programs will generally be distinguished as harvest or conservation hatchery programs. A single hatchery may have both harvest and conservation hatchery programs. If harvest and conservation programs are not distinguished, the Department shall clarify harvest and conservation objectives and their relative priorities. (10) Harvest hatchery programs operate to enhance or maintain fisheries without impairing naturally reproducing populations. Operations shall integrate hatchery and natural production systems (e.g., locally-derived hatchery broodstocks, rearing containers simulating natural characteristics) if necessary for conservation, within funding and facility constraints and consistent with fishery management objectives. Harvest hatchery programs shall also separate (e.g., temporally, spatially, visually) hatchery produced and naturally produced native fish in fisheries and on spawning grounds as necessary for conservation. The hatchery program management plan may be designated as one of the following harvest hatchery program types:
(a) Harvest augmentation, which is used to increase fishing and harvest opportunities where there is no mitigation program in place;

206 December 14, 2010 HB 3489 Report
(b) mitigation, which is used pursuant to an agreement to provide fishing and harvest opportunities lost as a result of habitat deterioration, destruction or migration blockage.
(11) Conservation hatchery programs operate to maintain or increase the number of naturally produced native fish without reducing the productivity (e.g., survival) of naturally produced fish populations. Conservation hatchery programs shall integrate hatchery and natural production systems to provide a survival advantage with minimal impact on genetic, behavioral and ecological characteristics of targeted populations. Implementation shall proceed with caution and include monitoring and evaluation to gauge success in meeting goals and control risks. Long-term conservation success shall be tied to remediating causes of the decline that resulted in the need for hatchery intervention. Once goals are met then the hatchery program will be discontinued. The hatchery program management plan may be designated as one of the following conservation hatchery program types:
(a) Supplementation, which routes a portion of an imperiled wild population through a hatchery for part of its life cycle to gain a temporary survival boost, or brings in suitable hatchery produced fish or naturally produced native fish from outside the target river basin to supplement the imperiled local population; (b) restoration, which outplants suitable non-local hatchery produced or naturally produced native fish to establish a population in habitat currently vacant for that native species using the best available broodstock; (c) captive brood, which takes a portion or all of an imperiled wild population into a protective hatchery environment for the entire life cycle to maximize survival and the number of progeny produced; (d) captive rearing, which takes a portion of an imperiled wild population into a protective hatchery environment for only that part of its life cycle that cannot be sustained in the wild; (e) egg banking, which temporarily removes a naturally produced native fish population from habitats that cannot sustain it and relocates the population to another natural or artificial area that can support the population; (f) cryopreservation, which freezes sperm from naturally produced native fish for later use in conservation hatchery programs; (g) experimental, which investigates and resolves uncertainties relating to the responsible use of hatcheries as a management tool for fish conservation and use.
Fish Culture Operations

207 December 14, 2010 HB 3489 Report
(12) Fish culture operations shall comply with fish health requirements of OAR 635-007-0549. (13) Broodstock selection and collection. Hatchery program management plans shall identify the broodstock best able to meet the objectives of the type of program in which the broodstock will be used.
a) For harvest hatchery programs, broodstock shall be used that best meet fishery objectives, consistent with conservation objectives to ensure risk to naturally produced native fish and their watersheds is within acceptable and clearly defined limits
(A) For some harvest hatchery programs, fishery and conservation objectives will be best met using existing hatchery broodstocks and managing for minimal spatial or temporal overlap of hatchery produced and naturally produced native fish in spawning areas. (B) For other harvest hatchery programs, fishery and conservation objectives will be best met using broodstocks derived from, or transitioning to, naturally produced native fish from the local watershed. This approach shall not be used if available data indicates the donor wild population will be impaired, or if conservation objectives are better met with existing hatchery broodstocks, or if hatchery programs are located in areas with too few naturally produced native fish to supply the hatchery broodstock;
(b) For conservation hatchery programs, broodstock shall be derived from the wild population targeted for hatchery intervention, or from nearby wild or hatchery populations with desired characteristics if the targeted wild population is extirpated or too depressed to provide brood fish; (c) Broodstock maintenance shall be consistent with the fishery and conservation objectives established for the hatchery program.
(A) Hatchery program management plans shall identify effective population size targets and other strategies to reduce risk of inbreeding depression, genetic drift and domestication for broodstocks developed under subsection (a)(A). (B) Hatchery program management plans shall identify target and allowable proportions of hatchery produced and naturally produced native fish incorporated into broodstocks developed under subsections (a)(B) and (b), consistent with conservation plan objectives.
(d) Broodstock collected shall represent the genetic variability of the donor stock by taking an unbiased representative sample with respect to run timing, size, gender, age and other traits important for long-term fitness of the population. The Fish Division may approve a deviation from this subsection if necessary to shift run timing and other characteristics of long-term hatchery broodstocks to better coincide with characteristics of wild populations in the watershed or to meet fish management

208 December 14, 2010 HB 3489 Report
goals. Hatchery program management plans shall explain the reason for any deviations; (e) Facilities and methods used to collect broodstock shall minimize stress and maximize survival of fish to spawning, consistent with management objectives.
(14) Disposition of adult hatchery produced fish returning to hatchery facilities. Adult hatchery produced fish returning to collection facilities shall be used to meet program objectives and, if available, provide other ecological, societal and program benefits, consistent with objectives for watershed health and native fish conservation.
(a) Hatchery programs will be managed to meet, but not exceed, program objectives for returning adult fish. Environmental variation and other factors outside of management control may result in significantly less or more fish than planned. (b) Adult hatchery produced fish returning to hatchery facilities shall be allocated among the categories of uses described in order of preference in subsections (c) and (d). The Department need not satisfy all potential uses within a category before providing fish to uses in lower categories. The Fish Division may approve additional uses or deviations from the stated order of preference to satisfy agreements with management partners, respond to unique situations or respond to unforeseen circumstances. (c) Order of preference for disposition of adult hatchery produced fish returning to or collected at harvest hatchery program facilities:
(A) meet broodstock needs for the program; (B) release live, spawned fish back into the wild if specified in management plans for species able to spawn more than once; (C) provide fish for tribal ceremonial and subsistence use; (D) provide additional fishing opportunities consistent with management plans (e.g., Fishery Management and Evaluation Plans); E) allow hatchery produced fish to spawn naturally at locations and in numbers identified in existing fish management plans or conservation plans developed through the process outlined in the Native Fish Conservation Policy (OAR 635-007-0505); (F) place carcasses in natural spawning and rearing areas to enhance nutrient recycling, consistent with Department of Environmental Quality requirements, management plans and pathology constraints identified in OAR 635-007-0549; (G) provide for experimental, scientific or educational uses identified in conservation plans, management plans or other Department agreements;

209 December 14, 2010 HB 3489 Report
(H) sell eggs and carcasses from selected facilities to provide revenues to support hatchery programs and facilities; (I) provide fish to charitable food share programs benefiting needy Oregonians; (J) provide fish for animal feed to animal rehabilitation shelters, zoos, or other such operations; (K) dispose of fish in a landfill or at a rendering plant.
(d) Order of preference for disposition of adult hatchery produced fish returning to or collected at conservation hatchery program facilities:
(A) Meet natural spawning objectives of the specific hatchery program as identified in conservation plans; (B) meet hatchery broodstock needs for the specified conservation hatchery program management plan; (C) release live, spawned fish back into the wild if specified in conservation plans for species able to spawn more than once; (D) place carcasses in natural spawning and rearing areas to enhance nutrient recycling, consistent with Department of Environmental Quality requirements, management plans and pathology constraints identified in OAR 635-007-0549; (E) provide fish for tribal ceremonial and subsistence use; (F) provide additional fishing opportunities consistent with fishery management plans (e.g., Fishery Management and Evaluation Plans). (G) provide for experimental, scientific or educational uses identified in conservation plans, management plans or other Department agreements; (H) sell eggs and carcasses to provide revenues to support hatchery programs and facilities; (I) provide fish to charitable food share programs benefiting needy Oregonians; (J) provide fish for animal feed to animal rehabilitation shelters, zoos, or other such operations; (K) dispose of fish in a landfill or at a rendering plant.
e) Department staff shall use standard, professionally accepted practices (such as sharp blow to head, electrical current or anesthetic overdose) to kill fish at hatchery facilities.

210 December 14, 2010 HB 3489 Report
(15) Spawning protocols.
(a) Hatchery program management plans shall include a description of the abundance, size, age structure, gender ratios, fecundity, fertility, and spawning pairings of the broodstock. (b) A 1:1 male-to-female spawning ratio (single pair mating, unpooled gametes) is preferred, although for harvest hatchery programs with large spawning populations (greater than 300 females) a 1:3 spawning ratio is acceptable. (c) For critically small populations, a matrix spawning strategy shall be used to enhance effective population size and reduce variability of survival among family units. (d) Conservation hatchery programs may use natural spawning within natural or engineered spawning channels in an attempt to mimic natural mate selection, gender ratio, age structure, spawn timing and preferred spawning area characteristics of wild populations.
(16) Incubation protocols.
(a) Incubation methods shall be selected to best meet program objectives, consistent with facility and funding constraints. These methods may include single bucket incubation (for isolation of a single female’s eggs), multiple vertical incubators, in-stream hatchboxes, or other methods suited to the available facilities. The Integrated Hatcheries Operations Team Policies and Procedures (IHOT 1995) provide acceptable, but not exclusive, guidance on water flows and egg-to-fry capacities for incubation systems. The hatchery program management plan shall include a description of and explanation for the incubation system identified in the plan. (b) The Department shall continue providing eggs for educational classroom incubators and in-stream incubators (e.g., hatch boxes) for selected stocks in selected watersheds associated with the Salmon and Trout Enhancement Program (STEP). All STEP incubator programs shall be consistent with existing management plans or new conservation plans and hatchery program management plans.
(17) Rearing protocols.
(a) Hatchery program management plans shall describe rearing facilities and methods selected for the program and specific rearing standards used to gauge success meeting program objectives. (b) Rearing capacity of hatchery programs shall be based on the number of fish that can be produced without adversely affecting fish growth and survivability necessary to meet program objectives.

211 December 14, 2010 HB 3489 Report
(c) Water replacement time and velocity shall be managed to provide adequate levels of dissolved oxygen and the reduction of metabolic waste products that are harmful to fish. (d) Experimental rearing techniques may be investigated at some hatcheries, particularly for conservation hatchery programs, to simulate natural rearing characteristics and fish behavior traits while ensuring adequate fish health, survival and production numbers to meet program objectives. (e) Fish food and feeding shall be managed to meet production objectives (e.g., fish number, size, growth rate, health and condition), minimize waste and maintain water quality. (f) The Department shall purchase the best fish feed products available for the best price while considering service delivery, maintenance of competition and innovation among fish feed vendors, and state preferences for recycled products. Qualifying feed manufacturers must monitor the accumulation of toxins in the fish feed they provide, and comply with standards specified by the Department. (g) The Department shall have standardized procedures for conducting feed trials comparing feed types and coordinate results among fish hatchery managers and STEP facility managers. The Department shall maintain a centralized database of fish feed purchases and fish feed trial results. (h) Hatchery programs may include an experimental feeding regime designed to simulate natural diets and feeding behavior (such as sub-surface feeding techniques) to align growth, physiology and maturity with natural schedules.
(18) Fish marking.
(a) Hatchery produced fish shall be marked as required to facilitate mixed stock fisheries, research, distinction of hatchery produced and naturally produced native fish throughout their life cycle as necessary for conservation, and evaluation of program objectives. (b) The Department shall use precise fish marking methods consistent with industry standards and management needs. Mark quality (e.g., fin excision, tag placement, tag retention) shall be monitored during the marking process and prior to fish releases.
(19) Fish transfers and releases.
(a) Hatchery program management plans shall specify targets for the number, size, quality, timing, location and release strategy of fish released, based on fish management objectives established for that program (e.g., native fish conservation plans, brood source objectives, production agreements, harvest management plans, mitigation agreements).

212 December 14, 2010 HB 3489 Report
(b) Hatchery program management plans shall include protocols to minimize stress and direct or delayed mortality associated with collecting, handling, loading, transporting and releasing fish. (c) The Fish Division may approve emergency contingency release plans in the event of unforeseen catastrophic events at a facility. (d) Transfer and release of any life stage of fish shall meet fish health requirements of OAR 635-007-0549.
(20) Predator control at hatchery facilities.
(a) Hatchery operations shall include strategies to reduce excessive loss of fish to predation and limit opportunities for predators to introduce pathogens to the rearing environment, within funding, facility and permit constraints. (b) Some hatchery programs, particularly conservation hatchery programs, may experiment with using natural predators to help avoid domestication, reduce deleterious traits and train hatchery produced fish to improve post-release survival and reduce behavioral differences between hatchery produced and naturally produced native fish.
Hatchery Facilities Operations
(21) Hatchery facility operations shall comply with fish health requirements of OAR 635-007-0549. (22) Hatchery program management plans shall describe hatchery facilities and operations to optimize fish culture operations, comply with fish health requirements described in OAR 635-007-0549, and comply with legal obligations concerning water rights, water use reporting, chemical use and reporting, fish passage and water quality standards (http://arcweb.sos.state.or.us/rules/OARS_600/OAR_690/690_tofc.html) (http://www.leg.state.or.us/ors/509.html)(http://www.deq.state.or.us/wq/wqpermit/Gen0300.pdf) (23) Reliable hatchery alarm and security systems shall be required as necessary to minimize risk of egg and fish mortalities caused by loss of water supplies or risk of vandalism and poaching. All hatchery incubation systems, rearing containers and adult fish facilities at Department hatcheries shall have alarm systems. Fish Division may grant exceptions for STEP hatch-box facilities or other temporary or remote facilities. (24) Hatchery water intakes and outfalls shall be screened to minimize the risk of unintended fish entering or escaping from the facility. Outfalls of fish rearing containers shall be double screened if used for fish from outside the basin that could jeopardize endemic stocks if escapes occurred.

213 December 14, 2010 HB 3489 Report
(25) The Department shall identify hatchery facility maintenance, modifications and upgrades necessary to comply with program objectives and other legal requirements. (26) Hatcheries shall provide informational signs and literature, guided tours as allowed by staffing constraints, and other programs to educate the public about fish and wildlife stewardship. (27) Additional provisions specific to hatchery trout programs.
(a) The Department shall continue hatchery production of nonanadromous rainbow trout for consumptive recreational fisheries as an important and popular fish management tool. (b) The Department shall reduce potential impacts to wild trout, char and steelhead in streams and maximize returns to the creel such as by rearing and releasing trout for target fisheries in standing water bodies (i.e., lakes, ponds, and reservoirs) and marking trout for targeted fisheries. (c) All trout the Department purchases for harvest augmentation from private sources must be genetically triploid, sterile rainbow trout.
Monitoring and Evaluation
(28) The purpose of hatchery monitoring and evaluation programs shall be to gauge success meeting hatchery program and fish management objectives, improve understanding of the reasons for success or failure, contain risks within acceptable limits, and provide feedback to modify operations through time (adaptive management). Clear management objectives that describe the role and expectations for hatcheries relative to species conservation, watershed health and fisheries shall be the foundation for all hatchery monitoring and evaluation programs. (29) Each hatchery program need not have its own individual monitoring and evaluation program if monitoring and evaluation on a landscape perspective provides adequate information to manage potential risks. The greater the uncertainty of the risks or results of a hatchery program, the greater the specificity of the monitoring and evaluation program must be. Each hatchery program management plan shall describe how the plan’s operations and objectives will be monitored and evaluated. (30) Monitoring and evaluation programs shall use generally accepted scientific procedures and gather multi-generational information to evaluate hatchery programs relative to measurable criteria developed through OAR 635-007-0545. (31) Monitoring hatchery produced fish and their performance may include, but is not limited to:
(a) Broodstock selection including but not limited to source, number, size, fecundity, life history, timing as percent of entire run, disease history, and disease treatment;

214 December 14, 2010 HB 3489 Report
(b) pre-release performance (e.g., survival, growth, disease) by life stage; (c) post-release survival to the adult life stage, catch distribution, fishery contributions, straying, and characteristics of adult fish (e.g., age structure, gender ratio, size, health). (d) production advantage provided by the hatchery relative to natural production; (e) water quality, flow and other physical conditions in the hatchery through the production cycle; (f) impacts of operation of the hatchery facilities on the adjacent habitats; (g) success of the hatchery program in meeting harvest and/or conservation program objectives. (h) cost-benefit analysis of hatchery performance.
(32) Monitoring and evaluation to assess impacts of the hatchery program on naturally produced native fish may include, but is not limited to:
(a) Impacts of broodstock selection on wild populations; (b) ecological interactions of hatchery produced and naturally produced native fish resulting in changes to phenotypic, genotypic, behavioral and survival characteristics; (c) timing, location and relative number of hatchery produced fish spawning naturally; (d) success of maintaining long-term fitness of wild populations; (e) reproductive success and fitness of hatchery produced fish in the natural environment; and (f) success maintaining or enhancing natural genetic variation and life history characteristics within and among wild populations.
(33) Results and evaluation of hatchery monitoring programs shall be compiled at intervals adequate to track success, contain risks and provide feedback for adaptive management. Monitoring results shall be made available to management partners and the public.
(34) Hatchery monitoring and evaluation programs shall complement and coordinate with specific research addressing key uncertainties about hatchery operations, uses and consequences. Research priorities shall focus on developing hatchery strategies that minimize the risk or maximize the benefit of hatchery actions to naturally produced native fish populations.

215 December 14, 2010 HB 3489 Report
Stat. Auth.: ORS 496.012 and 496.138 Stats. Implemented: ORS 496.171, 496.172, 496.176, 496.182, 496.430, 496.435, 496.445, 496.450, and 496.455 Hist.: Adopted 5-9-03, ef. upon filing
635-007-0547
Fish Hatchery Record Keeping
(1) Hatchery managers shall provide the following records for their operations:
(a) All Adult Transaction (AAT) records for all adults handled at the facility. (b) hatchery Mark Recovery Sampling forms to record adult fish sampled for coded-wire tags; (c) Egg and Fry Records (EFR) for all eggs and fry handled at each facility; (d) Monthly Ponded Fish Reports (MPR) for all fish being reared at each facility; (e) Fish Loss Report/Investigation when 1,000 or more juvenile fish or 10 or more adult fish are accidentally lost in a single incident; (f) Predator Mortality Report to document any fish predators that may die at the hatchery facility; (g) Fish Liberation Reports (FLR) for all juvenile fish released or transported into or out of all Department fish hatchery facilities; (h) Coded-Wire Tag Release Reports for all juvenile fish released with coded-wire tags; (i) chemical use, waste discharge monitoring, purchasing, budgets, hazardous materials, safety, vehicles, equipment, maintenance and alarm logs.
(2) Hatchery records will be stored in retrievable databases.
(3) The Fish Division may add to or waive the requirements of subsection (1) as necessary to avoid paperwork yet assure proper documentation of hatchery programs.
(4) Fish health documentation shall be maintained by the fish health section.
(5) Each hatchery manager will write a monthly report describing program-specific hatchery activities, either in the form of a hatchery monthly progress report or in the district monthly report for STEP activities.
6) The Department will produce annual reports, from the data collected with the above records and reports, summarizing all the information regarding adult fish transactions, fish eggs transactions and fish releases.

216 December 14, 2010 HB 3489 Report
(7) The Department shall make hatchery operating costs information available on a fiscal year or biennium basis. Stat. Auth.: ORS 496.012 and 496.138. Implemented: ORS 496.171, 496.172, 496.176, 496.182, 496.430, 496.435, 496.445, 496.450, and 496.455 Hist.: Adopted 5-9-03, ef. upon filing 635-007-0548 Training of Fish Hatchery Personnel (1) Fish Division, regional managers, or hatchery managers shall develop training programs for staff to assure awareness of and compliance with hatchery program management plans, to keep staff abreast of new scientific and technological developments and to encourage and support staff career development. (2) Each hatchery shall establish a training schedule for its staff and maintain training records. Stat. Auth.: ORS 496.012 and 496.138 Stats. Implemented: ORS 496.171, 496.172, 496.176, 496.182, 496.430, 496.435, 496.445, 496.450, and 496.455 Hist.: Adopted 5-9-03, ef. upon filing
Definitions Aquaria species: means those fish commonly sold in the pet store trade for use in home aquaria. "Aquaria" are any tanks, pools, ponds, bowls or other containers intended for and capable of holding or maintaining live fish and from which there is no outfall to any waters of this state. Brood stock: means a group of fish, generally from the same population, which are held and eventually artificially spawned to provide a source of fertilized eggs for hatchery programs. Cooperative Salmon Hatchery Project: means a fish propagation enhancement project authorized under OAR 635-009-0400 through OAR 635-009-0455. Department: means the Oregon Department of Fish and Wildlife. Disease: means problems caused by infectious agents, such as parasites or pests, and by other conditions that impair the performance of the body or one of its parts. Fish Hatchery: means a facility at which adult broodstock are held, or where eggs are collected and incubated, or where eggs are hatched, or where fish are reared.

217 December 14, 2010 HB 3489 Report
Hatchery produced fish: means a fish incubated or reared under artificial conditions for at least a portion of its life. Hatchery production system: means the fish, facilities and operations associated with collecting, spawning, incubating, rearing, distributing and releasing hatchery produced fish. Hatchery Program: means a program in which a specified hatchery population is planted in a specified geographical location. Native fish: means indigenous to Oregon, not introduced. This includes both naturally produced and hatchery produced fish. Naturally produced: means fish that reproduce and complete their full life cycle in natural habitats. Natural production system: means the fish and environment associated with completing the life-cycles of naturally produced fish populations. Operation plan: means an action plan developed by the Department that generally addresses how the objectives in a management plan for harvest or production of a species shall be attained. Operation plan: means an action plan developed by the Department that generally addresses how the objectives in a management plan for harvest or production of a species shall be attained. Production: means the number or pounds of fish raised in a hatchery or resulting from natural spawning and rearing in freshwater, estuarine, or ocean habitats; also used in reference to harvest. Propagation of fish: means the spawning, incubating, and/or rearing of fish by a human for sale, release or other uses. Propagation of fish: means the spawning, incubating, and/or rearing of fish by a human for sale, release or other uses. Random mortality: means fish mortality that generally does not affect the genotypic or phenotypic traits of fish populations. Selective mortality: means fish mortality that generally affects the genotypic and phenotypic traits of fish populations.

218 December 14, 2010 HB 3489 Report
Appendix C. Fish Health Management Policy 635-007-0960 Purpose The purpose of the Fish Health Management Policy is to describe measures that minimize the impact of fish diseases on the state’s fish resources. This policy applies to all Department hatchery operations and programs, including Salmon and Trout Enhancement Program (STEP), fish propagation projects (OAR 635-009-0090 through 635-009-0240), Cooperative Salmon Hatchery Programs (OAR 635-0090400 through 635-009-0455), and to all other persons importing, transporting, releasing, or rearing non-aquaria species in this state, including, but not limited to persons operating private fish rearing facilities and research facilities. Stat: Auth.: ORS 496, ORS 497, ORS 498, ORS 506 and ORS 508 Stats. Implemented: ORS 496, ORS 497, ORS 498, ORS 506 and ORS 508 Hist.: 635-007-0965 Policy The Department must restrict the introduction, amplification, and dissemination of disease agents in hatchery- produced fish (hatchery-produced stock or naturally-produced native stock) and in natural environments by controlling egg and fish movements and by prescribing a variety of preventative, therapeutic, and disinfecting strategies to control the spread of disease agents in fish populations of the state. This entails inspecting and detecting disease agents from fish in all hatchery facilities and natural environments. It also entails containing and treating disease agents to minimize impacts on fish populations. Stat: Auth.: ORS 496, ORS 497, ORS 498, ORS 506 and ORS 508 Stats. Implemented: ORS 496, ORS 497, ORS 498, ORS 506 and ORS 508 Hist.: 635-007-0970 Fish Disease and Pathogen Categories (1) “Category I” or "Emergency" fish disease agents are those for which there is no known treatment and that have not been determined to occur in Oregon as of September 1, 2003. Disease agents in this category are the European strain of Viral Hemorrhagic Septicemia (VHS), Onchorhyncus masou virus (OMV) and Channel Catfish Virus (CCV). Disease agents may be added to this category as they are identified. (2) “Category II” or "Certifiable" disease agents can be highly contagious, may cause catastrophic losses and do not have a known cure. Disease agents in this category are the North American strain of Viral Hemorrhagic Septicemia (VHS), Infectious

219 December 14, 2010 HB 3489 Report
Hematopoietic Necrosis Virus (IHN), Infectious Pancreatic Necrosis Virus (IPN), Infectious Salmon Anemia (ISA), Spring Viremia of Carp (SVC), Myxobolus cerebralis (whirling disease), and Piscirickettsia salmonis. Disease agents may be added to this category as they are identified in state waters or may be moved to a more or less strict category as disease concerns change. (3) “Category III” or “Reportable” disease agents may be enzootic in populations or watersheds but are not necessarily of such concern as to prevent all transfer or release of fish. This category includes drug resistant strains of fish disease agents otherwise falling in Category IV. Disease agents in this category are Erythrocytic Inclusion Body Syndrome (EIBS virus), Viral Erythrocytic Necrosis Virus (VEN), sturgeon iridovirus, Renibacterium salmoninarum (bacterial kidney disease), Flavobacterium psychrophilum (cold water disease), Aeromonas salmonicida (furunculosis disease), Yersinia ruckeri (enteric red mouth disease), drug resistant strains of bacterial disease agents, Tetracapsuloides bryosalmonae (Proliferative Kidney Disease), Ceratomyxa shasta (ceratomyxosis), and Nucleospora salmonis. Disease agents may be added to this category as they are identified in state waters or may be moved to a more or less strict category as disease concerns change. (4) “Category IV” or “Historical“ disease agents are those associated with a particular area, water body, or facility either in Oregon or in another state or country in which fish are raised or where a disease agent is associated with an intermediate non-fish host. This category also includes Category I through III diseases if previously found at a particular facility but no longer occurring there. Disease agents in this category are flatworms, round worms, tapeworms, ciliated and flagellated parasites, myxosporean (other than Myxobolus cerebralis, Tetracapsuloides bryosalmonae and Ceratomyxa shasta), microsporidian parasites (other than Nucleospora salmonis), fungal agents, bacterial agents, transient viral agents, and other classes of infectious agents not previously listed. Disease agents may be added to this category as they are identified in state waters or may be moved to a stricter category as disease concerns change. Stat: Auth.: ORS 496, ORS 497, ORS 498, ORS 506 and ORS 508 Stats. Implemented: ORS 496, ORS 497, ORS 498, ORS 506 and ORS 508 Hist.: 635-007-0975 Import, Export or Transfer of Pathogens and Diseases (1) The Department may allow a transfer or release fish if the disease agent has not occurred within the past three years of fish rearing, fish are appropriately treated to prevent disease transmission before transfer, or if the disease agent also occurs in the receiving waters. (2) No person may import, export, or transfer susceptible fish from a site or area where a Category I disease agent has been found until the Department has determined that the site or area is acceptable and has issued a valid Fish Transport Permit pursuant to OAR 635-007-0600. One of the Department’s fish health specialists may make the required

220 December 14, 2010 HB 3489 Report
determination and provide a memorandum to Fish Division. 3) The Department may authorize a person to import, export, or transfer fish that have or are from a station or area with a recent or continuing history of Category II disease agent by issuing a Fish Transport Permit. The Department must restrict the import, transfer, or release of fish from facilities in which Category II disease agents have been detected within the life cycle of a fish species or that have not been eliminated by effective treatment to only those areas where that disease is already endemic. The Department must restrict the transfer or release of fish that may expand the geographic distribution of disease agents in this category. (4) The Department must restrict the import, transfer, and release of fish from facilities in which Category III disease agents have been detected within the life cycle of a fish species or that have not been eliminated by effective treatment to only those areas where that disease is already endemic. (5) Fish from facilities with a history of, but no current occurrence of Category I through III diseases will be treated as if they were in Category IV. The Department may issue a Fish Transport Permit for transfer or release of fish with the presence of disease agents in this category if the disease agent has not occurred within the past three years of fish rearing, the fish are appropriately treated for disease before transfer, or the disease agent occurs in the receiving waters. The Department may deny a Fish Transport Permit to transfer or import fish from facilities where Category III and IV diseases agents have been identified until acceptable treatment or improved history record (three years without disease detection) requirements have been met through appropriate fish health examinations. Stat: Auth.: ORS 496, ORS 497, ORS 498, ORS 506 and ORS 508 Stats. Implemented: ORS 496, ORS 497, ORS 498, ORS 506 and ORS 508 Hist.: 635-007-0980 Additional Reference Material for Fish Disease Management Guidelines for inspection of fish for diseases are found in the Integrated Hatchery Operation Team Policies and Procedures for Columbia Basin Anadromous Salmonid Hatcheries (IHOT 1995), American Fisheries Society Fish Health Blue Book (AFS-FHS Suggested procedures for the detection and identification of certain finfish and shellfish pathogens. 5th ed., 2002, Fish Health Section, American Fisheries Society), the inspection manual of this reference may be found at http://fisheries.fws.gov/FHC/handbook.htm), the Fish Health Protection Regulations Manual of Compliance of Canada, 1984 and the Pacific Northwest Fish Health Protection Committee Model Comprehensive Fish Health Protection Program (September 1989), http://www.efw.bpa.gov/Environment/EW/EWP/DOCS/REPORTS/HATCHERY/A60629.pdf Stat: Auth.: ORS 496, ORS 497, ORS 498, ORS 506 and ORS 508 Stats. Implemented: ORS 496, ORS 497, ORS 498, ORS 506 and ORS 508 Hist.:

221 December 14, 2010 HB 3489 Report
635-007-0985 Inspection and Detection of Disease Agents at the Department’s Facilities (1) The Facility Manager must ensure that inspections are performed on all fish stocks no more than six weeks before fish are released or transferred to other locations in the state and on any fish to be imported into the state. The Department’s Fish Health Services must maintain a database of fish health examination results. (2) The Facility Manager must complete a Fish Liberation Report for the import, export, or transfer of live fish or eggs in Oregon before moving any fish or eggs. (3) The Facility Manager must ensure regular monitoring of all fish by a Department fish health specialist. Appropriate fish tissues must be screened for the presence of parasitic and bacterial agents and viral examinations of appropriate organs and lesions of moribund or dead fish depending on disease signs on affected fish. (4) Examinations for Myxobolus cerebralis, agent of whirling disease, must be conducted annually on 60 salmonid fish held for a minimum of 180 days at each facility. In cases where multiple water supplies exist, fish reared in each supply must be sampled. 5) The Facility Manager must direct the treatment or destruction of fish infected with any disease agent, whether listed in these rules or not, that may adversely affect the health of the fish of this state. The Department’s Fish Division will determine whether the affected fish must be destroyed. (6) If fish loss exceeds 0.1 percent per day over five consecutive days in any rearing or incubation container, then the Facility Manager must:
(a) Have an examination promptly performed on live and dead fish from each pond of concern by a Department fish health specialist and, if the fish health specialist determines it is necessary, from the entire facility. (b) Notify in writing by E-mail, fax, or equivalent means the Department’s Regional Office and Fish Division of the location, extent, and probable cause of such losses and provide written documentation of a planned Department-approved treatment regimen to control the fish disease agent. (c) Fish Health Services must maintain a copy of the disease examination record after completing appropriate tests.
Stat: Auth.: ORS 496, ORS 497, ORS 498, ORS 506 and ORS 508 Stats. Implemented: ORS 496, ORS 497, ORS 498, ORS 506 and ORS 508 Hist.: 635-007-0990

222 December 14, 2010 HB 3489 Report
Inspection and Detection of Disease Agents at Non-Department Facilities (1) No person may import, export, release, or transfer live fish or fish eggs in Oregon without a Fish Transport Permit issued pursuant to OAR 635-007-0600. (2) Except as provided in section (3) of this rule, any group of live fish or eggs found to have been imported into or transferred within Oregon without a Fish Transport Permit is subject to seizure and destruction by the Department. 3) The Department, in its discretion, may direct the Facility Manager to undertake immediate steps to obtain proper, up-to-date fish health examinations from the original source of fish or eggs, and to have fish inspected for fish disease agents by a fish health specialist acceptable to the Department. Such fish or eggs must not be released or moved to any other facility until the owner has obtained a completed disease examination report from the fish health specialist. The Facility Manager is responsible for the costs of the inspection required by this rule. (4) Except for fish reared for release under a private salmon hatchery permit pursuant to ORS 508.700, before importing any fish the Facility Manager must obtain an annual health examination of broodstock from which fish are to be imported and a copy of relevant fish health examinations of the lot of fish to be imported. If a facility has not previously exported fish to Oregon, the Facility Manager must also obtain a five-year fish-health history of stocks held at the facility and a description of the water supply source. Examinations for IHNV, IPNV, and VHSV must be conducted for salmonid broodstock. An examination for Myxobolus cerebralis, as described in section (5) of this rule, must also be conducted on salmonid fish. Depending on the fish species, examinations for culturable viruses and specific bacterial and parasitic agents must be conducted for non-salmonid broodstock. The above-listed examinations must be performed by a fish health specialist acceptable to the Department. However, the Department may issue a Fish Transport Permit to import live fish into this state without the examination report if the Department finds:
(a) The fish eggs or larvae would mature to a stage at which they cannot be safely transported before a disease examination could take place or results are complete; and (b) The fish or eggs are held in a facility approved by the Department until the permit holder can obtain a completed disease examination report.
(5) Examinations for Myxobolus cerebralis, agent of whirling disease, must be conducted annually on 60 fish held for a minimum of 180 days at each facility. In cases where multiple water supplies exist, fish reared in each supply must be sampled. (6) Fish Health Services must maintain a database of fish health examination results. (7) Any fish found to be infected with a disease agent that the Department determines may adversely affect the health of the fish of this state must be treated or destroyed at the Facility Manager’s expense as directed by the Department or may be sold for human

223 December 14, 2010 HB 3489 Report
consumption, if appropriate. (8) If fish loss exceeds 0.1 percent per day over five consecutive days in any rearing or incubation container, the Facility Manager, Facility Permittee, or Fish Propagation Licensee must:
(a) Have an examination promptly performed on live and dead fish from each pond of concern by a fish health specialist acceptable to the Department and, if required by the Department, from the entire facility. b) Notify in writing by E-mail, fax, or equivalent means the Department’s Fish Division at its Headquarters and Fish Health Services laboratories in Corvallis, Clackamas and La Grande of the location, extent, and probable cause of such losses and provide written documentation of a treatment regimen planned to control the fish disease; and (c) Provide Fish Health Services a copy of the disease examination record within seven business days after completion of appropriate tests.
(9) Failure to comply with these rules is grounds for the revocation of any Fish Propagation License, Cooperative Salmon Hatchery Agreement, or Fish Transport Permit. Stat: Auth.: ORS 496, ORS 497, ORS 498, ORS 506 and ORS 508 Stats. Implemented: ORS 496, ORS 497, ORS 498, ORS 506 and ORS 508 Hist.: 635-007-0995 Containment and Treatment of Fish Disease Agents (1) The Department may approve the transfer or release of fish or issue a Fish Transport Permit with special conditions, depending on the disease history of the shipping station or watershed, the current disease inspection report, or the susceptibility of fish to disease agents endemic in the watershed to which the fish would be shipped. (2) The Oregon exporter and importer (recipient) are responsible for getting the required permits and complying with all regulations concerning transporting fish within Oregon and importing fish to Oregon from any other state, province, or country. (3) The annual examination (station check) of salmonids sampled at a particular hatchery for M. cerebralis must meet Oregon’s requirements for M. cerebralis import or transfer of fish from that facility to or within Oregon. (4) If the Department determines that live fish have a disease agent that may affect fish in Oregon, the fish may not be transported from one watershed to another within this state or exported from this state without the Department’s written consent. The Department may restrict or prohibit a person from transporting infected fish or fish suspected of being

224 December 14, 2010 HB 3489 Report
infected to or from certain watersheds or areas within watersheds of the state. (5) The Department may authorize a person to transfer salmonids from any waters of the state or other states without a health inspection to a facility approved by the Department for scientific study pursuant to the objectives of projects acceptable to the Department. (6) Fish at all Department facilities must be treated so as to reduce the amplification of disease agents. Protocols listed in sub-paragraphs (a)-(c) are required for all Department facilities and are recommended for privately operated fish facilities to minimize the amplification of disease agents within their facilities.
(a) When fish disease agents are detected, preventative and therapeutic strategies must be implemented to reduce the impact of such disease agents on both hatchery-reared and naturally-reared native fish populations. (b) Sanitation protocols:
(A) Eggs must be disinfected or water-hardened in buffered iodophor. Eggs must be disinfected after collection and, if transferred to a new facility, they must also be disinfected upon arrival. Imported eggs and their shipping containers must be disinfected at the approved destination using methods acceptable to the Department’s fish health specialists. (A list of acceptable disinfecting agents and methods is available from the Department). (B) Disinfection footbaths or other means of disinfection must be provided at the incubation facility's entrance and exit areas for sanitizing footwear, raingear, and equipment while embryos are incubating in the facility. (C) Equipment and rain gear used in broodstock handling or spawning must be sanitized after leaving the adult area and before being used in other rearing units or the hatch-house building. (D) Equipment used to collect dead fish must be sanitized before being used in another pond, or equipment must be designated for each specific pond. (E) Dead fish must be disposed of promptly and in a manner that will prevent the introduction of disease agents to waters of the State. (F) Rearing units must be cleaned on a regular basis by vacuuming, brushing, or flushing. All equipment used for this purpose must be disinfected before being moved to a different pond. (G) Equipment used to transfer eggs or fish among facilities, including fish liberation tankers, must be sanitized before being used with any other fish lot or at any other location. Disinfecting and disinfected water must be disposed of in an approved manner. (H) Rearing units must be sanitized after removing fish and before introducing a

225 December 14, 2010 HB 3489 Report
new fish stock either by thoroughly cleaning the unit and using a disinfectant or by cleaning it and leaving it to dry for a minimum of three days. (I) Use of pathogen-free water is preferable, especially for egg incubation and early fish rearing.
(c) Preventative and therapeutic fish health strategies must be implemented at all facilities in consultation with the Department’s personnel to avoid or reduce disease agents and fish losses. Fish health strategies may include the following:
(A) Modifying hatchery practices such as water temperature, feeding or cleaning regimes, egg culling operations, isolating containers of infected fish, and using a different water supply; (B) Changing release strategies, if approved by the Department’s Fish Division; (C) Destroying fish if the disease agent is untreatable and an epizootic event is likely, or where an exotic or non-endemic disease agent is detected, if approved by Fish Division; (D) Increasing water releases from reservoirs when possible to increase flows and reduce water temperature. (E) Treating fish with federally approved chemicals or drugs from one of the following categories:
(i) FDA-labeled and approved for use on food fish; (ii) Allowed by the FDA as an Investigational New Animal Drug; (iii) Obtained by extra-label prescriptions from veterinarians; (iv) Allowed by the FDA as low regulatory priority or deferred regulatory status; (v) Chemicals not allowed on food fish but approved by the FDA through the US Fish and Wildlife Service for fish listed under the federal Endangered Species Act.
(7) In order to continue improving the Department’s expertise in fish health, the Department must develop and maintain partnerships with fish health specialists from other state and federal agencies, universities, and management partners. Stat: Auth.: ORS 496, ORS 497, ORS 498, ORS 506 and ORS 508 Stats. Implemented: ORS 496, ORS 497, ORS 498, ORS 506 and ORS 508 Hist.: 635-007-1000 Carcasses for Stream Enrichment

226 December 14, 2010 HB 3489 Report
(1) Before approving the use of fish carcasses or fish components for stream enrichment programs, the Fish Division must determine that the use is consistent with the Department of Environmental Quality’s requirements. (2) The Department must review the disease history of the hatchery and particular fish stock, current fish health testing results, geographic location and history of fish disease, and presence of disease agents in the receiving stream and watershed as a whole in order to minimize the risk of introducing or disseminating disease agents into the receiving waters. (3) Only fish that are killed as excess brood or that survive to spawn may be used for carcass distribution. (4) Carcasses must be placed in the originating river basin or where identified in hatchery program management plans or other operational or conservation plans. (5) The Fish Division may stop carcass distribution if pathogen levels increase in spawned adult fish during the spawning period. Stat: Auth.: ORS 496, ORS 497, ORS 498, ORS 506 and ORS 508 Stats. Implemented: ORS 496, ORS 497, ORS 498, ORS 506 and ORS 508 Hist.:

227
Appendix D: Release and Recovery Data
Table 86. Summary of release and recovery data for ODFW coastal salmon and steelhead programs. Release Information Average number recovered in Ocean Fisheries Average number recovered in FW
Species Hatchery Stock Release Basin
Brood years
Average smolt
release number AK BC WA OR CA Sport
Commer-cial
Col Gillnet
FW Sport Hatchery
Spawning Grounds
Dam count
Total Harvest
OR catch
Coho Nehalem Nehalem (32) Fishhawk (99)
Nehalem 1995-2004
186,113 0 2 78 111 17 195 13 2 418 1,510 UNK 627 530
Coho Nehalem Trask (34) Trask R 1995-2004 153,321 3 0 200 305 12 490 29 0 370 5,245 UNK 889 674
Coho Rock Creek Umpqua (55)
Umpqua R, N Fk
1995-2004 105,695 1 8 71 262 16 341 18 3 2,959 UNK UNK 7,759 3,320 3,224
Spring Chinook Trask Trask (34) Trask R
1994-2003 101,982 86
128 48 107 0 39 330 0 553 230 UNK 922 660
Spring Chinook Trask Trask (34) Wilson R
1994-2003 (excl 2001) 145,063 68
102 28 75 0 32 241 0 163 194 UNK 436 238
Spring Chinook Cedar Creek
Nestucca (47) Nestucca R
1994-2003 116,402 66
156 48 81 0 30 321 0 571 88 UNK 921 651
Spring Chinook Rock Creek
Umpqua (55)
Umpqua R, Nth Fk
1994-2003 316,232 29
134 164
1,218
218 191 1,572 9 1,726 UNK UNK 7,362 3,498 2,953
Fall Chinook Trask Trask (34)
Necanicum R
1994-2003 26,618
105 54 7 3 1 18 151 1 31 UNK UNK 201 35
Fall Chinook Trask Trask (34) Trask R
1994-2003 78,768
249
167 7 38 1 102 360 0 643 988 UNK 1,106 682
Fall Chinook Salmon R
Salmon R (36) Salmon R
1994-2003 202,592
568
348 11 80 1 174 834 0 932 102 1,308 1,939 1,012
Fall Chinook Salmon R
Yaquina (146) Yaquina R
1994-2003 119,965
538
358 1 36 0 179 753 0 UNK UNK UNK 933 UNK
Fall Chinook Bandon Coos (37) Coos Basin
1994-2003 760,767
1,153
1,188
232 277 7 558 2,299 0 1,169 3,447 UNK 4,026 1,446

228 December 14, 2010 HB 3489 Report
Release Information Average number recovered in Ocean Fisheries Average number recovered in FW
Fall Chinook
Bandon/Butte Falls
Coquille R (44) Coquille R
1994 & 1997-2003 76,972 294 277 33 79 2 107 577 0 220 UNK UNK 724 240
Fall Chinook Elk R Elk R (35) Elk R
1994-2003 325,508 534 454 186
1,444 15 149 2,483 0 1,073 1,591 2,026 3,705 2,516
Fall Chinook Elk R Chetco (96) Chetco R
1994-2003 172,927 0 2 8 298 157 97 367 1 200 UNK UNK 665 499
Summer Steelhead Cedar Creek
Nestucca (47) Wilson R
1996-2005 40,160 NA NA NA NA NA NA 507 NA UNK 507 507
Summer Steelhead Cedar Creek
Nestucca (47)
Nestucca R
1996-2005 63,044 NA NA NA NA NA NA 619 1,796 UNK 619 619
Summer Steelhead Salmon River Siletz (33) Siletz R
1996-2005 67,343 NA NA NA NA NA NA 1,419 NA UNK 2,689 1,419 1,419
Summer Steelhead Rock Creek
Umpqua (55)
Umpqua R Nth Fk
1996-2005 62,710 NA NA NA NA NA NA 1,503 NA UNK 1,503 1,503
Winter Steelhead Nehalem
Nehalem (32)
Necanicum R
1996-2005 40,419 NA NA NA NA NA NA 406 NA UNK 406 406
Winter Steelhead Nehalem
Nehalem (32)
Nehalem R Nth Fk
1996-2005 94,877 NA NA NA NA NA NA 1,092 1,704 UNK 1,092 1,092
Winter Steelhead
Cedar Creek/Trask
Nestucca R (47/121)
Wilson and Kilchis R
1996-2005 73,846 NA NA NA NA NA NA 2,109 NA UNK 2,109 2,109
Winter Steelhead Cedar Creek
Nestucca R (47W)
Nestucca R
1996-2005 107,429 NA NA NA NA NA NA 1,509 1,876 UNK 1,509 1,509
Winter Steelhead Alsea Siletz (33W) Siletz R
1996-2005 52,203 NA NA NA NA NA NA 1,908 NA UNK 461 1,908 1,908
Winter Steelhead Alsea Alsea R (43) Big Elk Cr
1996-2005 20,533 NA NA NA NA NA NA 201 NA UNK 201 201
Winter Steelhead Alsea
Alsea R (43/43W)
Alsea R, Nth Fk
1996-2005 83,575 NA NA NA NA NA NA 2,325 3,036 UNK 2,325 2,325
Winter Steelhead Bandon
Ten Mile (88)
Ten Mile Basin
1996-2005 20,468 NA NA NA NA NA NA 209 NA UNK 209 209
Winter Steelhead
Butte Falls/Rock Creek
Cow Creek 018
Umpqua R S Fk
1996-2005 77,582 NA NA NA NA NA NA 3,233 NA UNK 3,233 3,233

229 December 14, 2010 HB 3489 Report
Release Information Average number recovered in Ocean Fisheries Average number recovered in FW
Winter Steelhead Bandon Coos (37) Coos Basin
1996-2005 132,260 NA NA NA NA NA NA 1,533 UNK UNK 1,533 1,533
Winter Steelhead Bandon
Coquille (44/144)
Coquille Basin
1996-2005 57,445 NA NA NA NA NA NA 2,360 NA UNK 2,360 2,360
Winter Steelhead Elk River
Chetco (96) Chetco R
1996-2005 47,908 NA NA NA NA NA NA 832 NA UNK 832 832

230
Appendix E. Master Maintenance Plan
Table 87. All deferred maintenance items at ODFW coastal hatcheries Site Name Site / Building System # System Name Repair Amt Comment Alsea Hatchery Alsea Hatchery Site - Alsea Hatchery - Site # : AlsH
Alsea Hatchery Site - Alsea Hatchery - Site # : AlsH 1051 PAVED VEHICLE SURFACES - CONCRETE $ 121.00
The concrete vehicular surfaces haand deterioration such as surface
Alsea Hatchery Site - Alsea Hatchery - Site # : AlsH 1052 PAVED VEHICLE SURFACES - GRAVEL $ 9,518.00
The gravel vehicle surface areas hneed to be filled and graded.
Alsea Hatchery Site - Alsea Hatchery - Site # : AlsH 1061 PAVED WALKS/SURFACES - CONCRETE $ 544.00
The concrete walk surfaces exhibitholes.
Alsea Hatchery Site - Alsea Hatchery - Site # : AlsH 1400 GRATING $ 100.00 A few areas of grating are beginnin Alsea Hatchery Site - Alsea Hatchery - Site # : AlsH 1410 METAL VALVES - SMALL 2-6" $ 5,441.00 A majority of the small valves are b
Alsea Hatchery Site - Alsea Hatchery - Site # : AlsH 1411 METAL VALVES - MEDIUM 7-11" $ 4,200.00 A majority of the medium valves arbe repaired.
Alsea Hatchery Site - Alsea Hatchery - Site # : AlsH 1412 METAL VALVES - LARGE 12-18" $ 7,329.00 A majority of the large valves are lrepaired.
Alsea Hatchery Site - Alsea Hatchery - Site # : AlsH 1413 METAL VALVES - X-LARGE >18" $ 1,832.00 A majority of the x-large valves arebe repaired.
Alsea Hatchery Site - Alsea Hatchery - Site # : AlsH 1420 REARING RACEWAY - CONCRETE $ 101,244.00 A majority of the concrete rearing rand seeping.
Alsea Hatchery Site - Alsea Hatchery - Site # : AlsH 1431 SETTLING PONDS - ASPHALT $ 69,380.00 Approximately 50% of the asphalt cracked, leaking and settling unev
Alsea Hatchery Building - Residence 1 (1948) - Building # : AlsH-02001
Alsea Hatchery Building - Residence 1 (1948) - Building # : AlsH-02001 2050 WOOD, VINYL, OR ALUM WALLS $ 2,621.00
The eaves are dry rotting and needreplaced/repaired accordingly. 100needs to be scraped and repaint
Alsea Hatchery Building - Residence 1 (1948) - Building # : AlsH-02001 2190 EXTERIOR STAIRS - CONCRETE $ 100.00 10% of the exterior concrete stairsthe aggregate.
Alsea Hatchery Building - Residence 1 (1948) - Building # : AlsH-02001 2222 PORCHES WITH ROOFS $ 122.00 20% of the porch needs to be repa Alsea Hatchery Building - Residence 2 5Rooms (1934) - Building # : AlsH-02002 Alsea Hatchery Building - Residence 2 5Rooms (1934) - Building # : AlsH-02002 2010 CRAWL SPACE / 4 FT FOUNDATION $ 4,925.00 The floor joists are rotted and need Alsea Hatchery Building - Residence 2 5Rooms (1934) - Building # : AlsH-02002 2050 WOOD, VINYL, OR ALUM WALLS $ 547.00 Part of the eaves are dry rotted an
Alsea Hatchery Building - Residence 2 5Rooms (1934) - Building # : AlsH-02002 2190 EXTERIOR STAIRS - CONCRETE $ 100.00 Approximately 10% of the exterior cracked and chipping. They need t
Alsea Hatchery Building - Residence 3 (1934) - Building # : AlsH-02003
Alsea Hatchery Building - Residence 3 (1934) - Building # : AlsH-02003 4023 CEILING SURFACES - GWB $ 404.00 The kitchen ceiling has some dry rrepaired.

231 December 14, 2010 HB 3489 Report
Site Name Site / Building System # System Name Repair Amt Comment
Alsea Hatchery Building - Residence w/3 Bdrm + Garage (1962) - Building # : AlsH-02004 2050 WOOD, VINYL, OR ALUM WALLS $ 2,856.00
The wood walls need to be scrapeeaves are dryrotted and the roof acoff because of
Alsea Hatchery Building - Residence w/3 Bdrm + Garage (1962) - Building # : AlsH-02004 3040
HOT & COLD WATER DISTRIBUTION - GALVANIZED $ 112.00 Much of the piping is rusted and ne
Alsea Hatchery Building - Hatchery (1934) - Building # : AlsH-02013
Alsea Hatchery Building - Hatchery (1934) - Building # : AlsH-02013 4022 CEILING SURFACES - ADHERED TILES $ 100.00
Approximately 20% of the adheredneed to be replaced or repainted.
Alsea Hatchery Building - Hatchery (1934) - Building # : AlsH-02013 4023 CEILING SURFACES - GWB $ 247.00 A small portion of the ceiling surfacrotting. The surface needs to be re
Alsea Hatchery Building - Hatchery Offices (1634) - Building # : AlsH-02015
Alsea Hatchery Building - Hatchery Offices (1634) - Building # : AlsH-02015 2040 VERTICAL STRUCTURE $ 153.00 There is visible cracking on the coand leaking may become a problem
Bandon Hatchery Bandon Hatchery Site - Bandon Hatchery - Site # : BndH
Bandon Hatchery Site - Bandon Hatchery - Site # : BndH 1060 PAVED WALKS/SURFACES - ASPHALT $ 100.00 Portions of the asphalt walkways asurface, requiring a new seal coat.
Bandon Hatchery Site - Bandon Hatchery - Site # : BndH 1061 PAVED WALKS/SURFACES - CONCRETE $ 100.00
Replace a small percentage of concracking and chipping.
Bandon Hatchery Site - Bandon Hatchery - Site # : BndH 1290 SANITARY LINES $ 1,200.00 The lines are deteriorating and nee
Bandon Hatchery Site - Bandon Hatchery - Site # : BndH 1400 GRATING $ 100.00 A small percentage of the metal grneed to be replaced.
Bandon Hatchery Site - Bandon Hatchery - Site # : BndH 1412 METAL VALVES - LARGE 12-18" $ 880.00 The valve stem of one large valve operate. The valve stem needs to
Bandon Hatchery Site - Bandon Hatchery - Site # : BndH 1420 REARING RACEWAY - CONCRETE $ 15,577.00 Some of the concrete walls and flocracked and need to be patched.
Bandon Hatchery Building - Residence 1 (1929) - Building # : BndH-06065
Bandon Hatchery Building - Residence 1 (1929) - Building # : BndH-06065 4011 WALL SURFACE - GWB $ 680.00 A portion of the interior walls are crepainted.
Bandon Hatchery Building - Residence 1 (1929) - Building # : BndH-06065 4023 CEILING SURFACES - GWB $ 215.00 The GWB ceilings need patchworkminor cracking exists.
Bandon Hatchery Building - Residence 1 (1929) - Building # : BndH-06065 4040 DOORS & FRAMES $ 3,860.00
The doors throughout the house ahardware is no longer functioning pthe hardware. The
Bandon Hatchery Building - Residence 1 (1929) - Building # : BndH-06065 4070 CASEWORK $ 4,200.00
The casework needs replacing. Thand the drawers do not open/closeis built out of p
Bandon Hatchery Building - Cold Storage Building (1953) - Building # : BndH-06072 Bandon Hatchery Building - Cold Storage Building (1953) - Building # : BndH-06072 2171 WOOD DOORS $ 1,142.00 Two wood doors are damaged and

232 December 14, 2010 HB 3489 Report
Site Name Site / Building System # System Name Repair Amt Comment
Bandon Hatchery Building - Cold Storage Building (1953) - Building # : BndH-06072 4011 WALL SURFACE - GWB $ 469.00 Portions of the plaster walls are crdamaged plaster.
Bandon Hatchery Building - Hatchery (1934) - Building # : BndH-06075 Bandon Hatchery Building - Shop Metal (1978) - Building # : BndH-06077
Bandon Hatchery Building - Shop Metal (1978) - Building # : BndH-06077 2171 WOOD DOORS $ 348.00 The hardware is busted and the doproperly. Replace the hardware a
Butte Falls Hatchery Butte Falls Hatchery Site - Butte Falls Hatchery - Site # : BtFH
Butte Falls Hatchery Site - Butte Falls Hatchery - Site # : BtFH 1050 PAVED VEHICLE SURFACES - ASPHALT $ 640.00
The asphalt surfaces in the drivewcracking and need to be resurface
Butte Falls Hatchery Site - Butte Falls Hatchery - Site # : BtFH 1051 PAVED VEHICLE SURFACES - CONCRETE $ 2,382.00
The concrete driveways were instalarge spans of time. Some drivewfalling apart and a
Butte Falls Hatchery Site - Butte Falls Hatchery - Site # : BtFH 1061 PAVED WALKS/SURFACES - CONCRETE $ 755.00
Portions of the older pathways areroot systems. Replace the cracketripping hazard a
Butte Falls Hatchery Site - Butte Falls Hatchery - Site # : BtFH 1191 LANDSCAPE RETAINING WALL - WOOD $ 10,994.00
The railroad retaining wall Northwe15007 is rotting and falling apart areplaced.
Butte Falls Hatchery Site - Butte Falls Hatchery - Site # : BtFH 1201 DRAINAGE - SURFACE RUNOFF $ 18,034.00 In times of heavy rain, water runs dbuilding 15112 and ponds in back
Butte Falls Hatchery Site - Butte Falls Hatchery - Site # : BtFH 1260 WATER LINES $ 31,677.00
There are major problems with thefrequent leaks. The damaged portto be replaced
Butte Falls Hatchery Site - Butte Falls Hatchery - Site # : BtFH 1410 METAL VALVES - SMALL 2-6" $ 18,048.00 30 valves are old/worn out and neeButte Falls Hatchery Site - Butte Falls Hatchery - Site # : BtFH 1411 METAL VALVES - MEDIUM 7-11" $ 3,000.00 2 valves are old/worn out and needButte Falls Hatchery Site - Butte Falls Hatchery - Site # : BtFH 1412 METAL VALVES - LARGE 12-18" $ 10,000.00 3 valves are old/worn out and needButte Falls Hatchery Site - Butte Falls Hatchery - Site # : BtFH 1413 METAL VALVES - X-LARGE >18" $ 7,000.00 2 extra large valves do not fully clo
Butte Falls Hatchery Site - Butte Falls Hatchery - Site # : BtFH 1420 REARING RACEWAY - CONCRETE $ 59,376.00
The majority of the raceways are udegraded. The concrete is chippinneed to be patched
Butte Falls Hatchery Site - Butte Falls Hatchery - Site # : BtFH 1432 SETTLING PONDS - EARTH $ 11,250.00 Settling ponds are not working proin 2006.
Butte Falls Hatchery Building - Office (3 room) (1937) - Building # : BtFH-15028
Butte Falls Hatchery Building - Office (3 room) (1937) - Building # : BtFH-15028 2040 VERTICAL STRUCTURE $ 1,170.00
Building is leaning 2” to the back dthe foundation. The structure needleveled out
Butte Falls Hatchery Building - Office (3 room) (1937) - Building # : BtFH-15028 2081 ASPHALT OR FIBERGLASS SHINGLES $ 1,529.00
The roof is extremely weathered aare covered with moss, cracking &needs to be replaced

233 December 14, 2010 HB 3489 Report
Site Name Site / Building System # System Name Repair Amt Comment Butte Falls Hatchery Building - Office (3 room) (1937) - Building # : BtFH-15028 2150 SMALL WINDOWS (<15) $ 625.00 The window is broken and needs t
Butte Falls Hatchery Building - Office (3 room) (1937) - Building # : BtFH-15028 4033 RESILIENT FLOORING $ 1,096.00 The floor is chipped and the seamneeds to be replaced.
Butte Falls Hatchery Building - Storage/Wood Shop Building (1937) - Building # : BtFH-15034
Butte Falls Hatchery Building - Storage/Wood Shop Building (1937) - Building # : BtFH-15034 2100 CHIMNEYS $ 3,300.00
The chimney for the wood stove isand needs to be replaced.
Butte Falls Hatchery Building - Storage/Wood Shop Building (1937) - Building # : BtFH-15034 2221 PATIOSWITHOUT ROOFS $ 100.00
The cement landings outside of thecracked laterally and needs to be r
Butte Falls Hatchery Building - Storage/Wood Shop Building (1937) - Building # : BtFH-15034 2240 GARAGE $ 46,209.00
The 3 car garage on the end, buildA tree root has broken the foundatunsafe. T
Butte Falls Hatchery Building - Shop - Building # : BtFH-15036
Butte Falls Hatchery Building - Shop - Building # : BtFH-15036 2050 WOOD, VINYL, OR ALUM WALLS $ 860.00 The paint on the exterior walls is pThe walls need to be scraped and
Butte Falls Hatchery Building - Shop - Building # : BtFH-15036 2150 SMALL WINDOWS (<15) $ 711.00
The window frames are weatheredframes need to be scraped and reprotting.
Butte Falls Hatchery Building - Storage Building (2 restrooms) - Building # : BtFH-15037
Butte Falls Hatchery Building - Storage Building (2 restrooms) - Building # : BtFH-15037 2050 WOOD, VINYL, OR ALUM WALLS $ 769.00
The painted exterior walls are seveto be scraped & repainted.
Butte Falls Hatchery Building - Storage Building (2 restrooms) - Building # : BtFH-15037 2051 MASONRY WALLS $ 266.00
The walls are chipping/crumbling aresurfaced/reinforced.
Butte Falls Hatchery Building - Storage Building (2 restrooms) - Building # : BtFH-15037 2150 SMALL WINDOWS (<15) $ 178.00
The windows are lacking paint andweathered. The windows are scracalked.
Butte Falls Hatchery Building - Storage Building (2 restrooms) - Building # : BtFH-15037 2151 MEDIUM WINDOWS (15>30 SF) $ 1,447.00 The windows are broken and requ
Butte Falls Hatchery Building - Storage Building (2 restrooms) - Building # : BtFH-15037 2171 WOOD DOORS $ 115.00
The paint is worn off and the hardwdoor needs to be scraped/painted hardware needs to be r
Butte Falls Hatchery Building - Storage Building (2 restrooms) - Building # : BtFH-15037 4011 WALL SURFACE - GWB $ 100.00
There is a 1'X1' hole in the restrooneeds to be repaired.
Butte Falls Hatchery Building - Storage Building (2 restrooms) - Building # : BtFH-15037 4023 CEILING SURFACES - GWB $ 228.00
The paint is peeling off the wood pfor the ceiling. The panels need torepainted.
Butte Falls Hatchery Building - Cold Storage & Grinder Room - Building # : BtFH-15038
Butte Falls Hatchery Building - Cold Storage & Grinder Room - Building # : BtFH-15038 2150 SMALL WINDOWS (<15) $ 1,245.00
Several window panes are crackedreplaced. The frames need to be sto prevent rotting.

234 December 14, 2010 HB 3489 Report
Site Name Site / Building System # System Name Repair Amt Comment
Butte Falls Hatchery Building - Cold Storage & Grinder Room - Building # : BtFH-15038 2151 MEDIUM WINDOWS (15>30 SF) $ 889.00
Several window panes are crackedreplaced. The frames need to be sto prevent rotting.
Butte Falls Hatchery Building - Cold Storage & Grinder Room - Building # : BtFH-15038 2171 WOOD DOORS $ 695.00
The paint is peeling off of the doorsmall to drive a forklift through for food pa
Butte Falls Hatchery Building - Cold Storage & Grinder Room - Building # : BtFH-15038 2221 PATIOSWITHOUT ROOFS $ 1,380.00
Concrete pad in front of building isand needs to be replaced.
Butte Falls Hatchery Building - Cold Storage & Grinder Room - Building # : BtFH-15038 4011 WALL SURFACE - GWB $ 1,757.00
The GWB walls in the grinder spacrefinished. The paint and plaster apeeling off.
Butte Falls Hatchery Building - Cold Storage & Grinder Room - Building # : BtFH-15038 4023 CEILING SURFACES - GWB $ 2,699.00
The GWB ceiling in the grinder sparefinished. The paint and plaster apeeling off.
Butte Falls Hatchery Building - Residence 1 (1928) - Building # : BtFH-15111 Butte Falls Hatchery Building - Residence 1 (1928) - Building # : BtFH-15111 2020 BASEMENT / 8 FT FOUNDATION $ 60,462.00 The basement floods due to a spri
Butte Falls Hatchery Building - Residence 1 (1928) - Building # : BtFH-15111 2150 SMALL WINDOWS (<15) $ 3,645.00 The basement windows are leakinrotting, and need to be replaced.
Butte Falls Hatchery Building - Residence 1 (1928) - Building # : BtFH-15111 2190 EXTERIOR STAIRS - CONCRETE $ 210.00 The stairs are cracked/chipping awpatched and resealed.
Butte Falls Hatchery Building - Residence 1 (1928) - Building # : BtFH-15111 2240 GARAGE $ 4,248.00 The garage foundation is cracked broken.
Butte Falls Hatchery Building - Residence 1 (1928) - Building # : BtFH-15111 4011 WALL SURFACE - GWB $ 1,075.00
The GWB in the attic & basement needs to be taped and finished. Tto do these repai
Butte Falls Hatchery Building - Residence 1 (1928) - Building # : BtFH-15111 4023 CEILING SURFACES - GWB $ 709.00
GWB in attic & basement is poorlytaped and finished. The resident hrepairs.
Butte Falls Hatchery Building - Residence 1 (1928) - Building # : BtFH-15111 4032 WOOD FLOORS $ 1,849.00 Approximately 50% of the wood flostained and need to be refinished.
Butte Falls Hatchery Building - Residence 2 (1936) - Building # : BtFH-15112
Butte Falls Hatchery Building - Residence 2 (1936) - Building # : BtFH-15112 2100 CHIMNEYS $ 100.00 The bricks are loose at the top of tto be repaired/secured.
Butte Falls Hatchery Building - Residence 2 (1936) - Building # : BtFH-15112 2150 SMALL WINDOWS (<15) $ 100.00 The window is broken and needs t
Butte Falls Hatchery Building - Residence 2 (1936) - Building # : BtFH-15112 2221 PATIOSWITHOUT ROOFS $ 204.00
Concrete surfaces vary in age andsections are severely worn or cracthe worn areas.
Butte Falls Hatchery Building - Residence 2 (1936) - Building # : BtFH-15112 2230 STORAGE SHEDS $ 2,725.00 The storage shed has 2 broken wiinfestation.
Butte Falls Hatchery Building - Residence 2 (1936) - Building # : BtFH-15112 4011 WALL SURFACE - GWB $ 100.00 Some of the walls need to be repa
Butte Falls Hatchery Building - Residence 2 (1936) - Building # : BtFH-15112 4031 CARPET $ 2,221.00 The carpet is worn, frayed and stareplaced.

235 December 14, 2010 HB 3489 Report
Site Name Site / Building System # System Name Repair Amt Comment
Butte Falls Hatchery Building - Residence 2 (1936) - Building # : BtFH-15112 4070 CASEWORK $ 923.00 The finishing on the kitchen counteand not repairable. The counterto
Butte Falls Hatchery Building - Residence 2 (1936) - Building # : BtFH-15112 4230 ELECTRICAL PANEL & WIRING $ 6,921.00
Wiring is varies in age and portionThough no major issues at this timinspector suggested
Butte Falls Hatchery Building - Residence 4 (1948) - Building # : BtFH-15113
Butte Falls Hatchery Building - Residence 4 (1948) - Building # : BtFH-15113 4011 WALL SURFACE - GWB $ 234.00 The GWB surface is weathered anrepainted.
Butte Falls Hatchery Building - Residence 4 (1948) - Building # : BtFH-15113 4032 WOOD FLOORS $ 100.00 The interior wood floors are worn drefinished and repainted.
Butte Falls Hatchery Building - Residence #5 - Building # : BtFH-15114
Butte Falls Hatchery Building - Residence #5 - Building # : BtFH-15114 2050 WOOD, VINYL, OR ALUM WALLS $ 672.00 The paint is peeling in isolated areto be scraped and repainted.
Butte Falls Hatchery Building - Residence #5 - Building # : BtFH-15114 2240 GARAGE $ 4,248.00 The garage door needs a new spriThe hardware needs to be replace
Butte Falls Hatchery Building - Residence #5 - Building # : BtFH-15114 4011 WALL SURFACE - GWB $ 1,270.00
The garage interior walls are in newalls upstairs are poorly finished. retaped, san
Butte Falls Hatchery Building - Residence #5 - Building # : BtFH-15114 4023 CEILING SURFACES - GWB $ 247.00 The upstairs ceiling surface is pooto be retaped, sanded and repainte
Butte Falls Hatchery Building - Residence #5 - Building # : BtFH-15114 4230 ELECTRICAL PANEL & WIRING $ 109.00
100 amp service to the house box garage. The breaker for the waterPossible upgrade
Cedar Creek Hatchery Cedar Creek Hatchery Site - Cedar Creek Hatchery - Site # : CDCH Cedar Creek Hatchery Site - Cedar Creek Hatchery - Site # : CDCH 1410 METAL VALVES - SMALL 2-6" $ 2,100.00 Valves are leaking and should be rCedar Creek Hatchery Site - Cedar Creek Hatchery - Site # : CDCH 1411 METAL VALVES - MEDIUM 7-11" $ 14,250.00 Valves are leaking and should be rCedar Creek Hatchery Site - Cedar Creek Hatchery - Site # : CDCH 1412 METAL VALVES - LARGE 12-18" $ 15,000.00 Valves are leaking and should be rCedar Creek Hatchery Site - Cedar Creek Hatchery - Site # : CDCH 1413 METAL VALVES - X-LARGE >18" $ 5,000.00 Valves are leaking and should be rCedar Creek Hatchery Building - Utility Building (1950) - Building # : CDCH-29229 Cedar Creek Hatchery Building - Utility Building (1950) - Building # : CDCH-29229 2150 SMALL WINDOWS (<15) $ 897.00 Four small windows need to be regCedar Creek Hatchery Building - Utility Building (1950) - Building # : CDCH-29229 2171 WOOD DOORS $ 348.00 Exterior door needs to be rehung. Cedar Creek Hatchery Building - Hatchery - Building # : CDCH-29239 Cedar Creek Hatchery Building - Hatchery - Building # : CDCH-29239 2151 MEDIUM WINDOWS (15>30 SF) $ 1,200.00 Three windows need to be reglazeCedar Creek Hatchery Building - Hatchery - Building # : CDCH-29239 2171 WOOD DOORS $ 695.00 Rehang to function properly in fram
Cedar Creek Hatchery Building - Hatchery - Building # : CDCH-29239 4022 CEILING SURFACES - ADHERED TILES $ 1,625.00
40% of the wood ceiling panels areand need to be replaced.
Cedar Creek Hatchery Building - Garage/Shed/Shop @ Rhodes (1978) - Building # : CDCH-29255
Rhoades Pond garage/shed building has been abandoned for 10 years
Decision has been made to condebuilding.
Cedar Creek Hatchery Building - Residence (prefab) (1947) - Building # : CDCH-29273

236 December 14, 2010 HB 3489 Report
Site Name Site / Building System # System Name Repair Amt Comment Cedar Creek Hatchery Building - Residence (prefab) (1947) - Building # : CDCH-29273 2050 WOOD, VINYL, OR ALUM WALLS $ 578.00 The wood siding needs minor repa
Cedar Creek Hatchery Building - Residence (prefab) (1947) - Building # : CDCH-29273 2141 ROOF DRAINAGE - EXTERIOR $ 100.00 Replace and re-install damaged gusections.
Cedar Creek Hatchery Building - Residence (prefab) (1947) - Building # : CDCH-29273 2171 WOOD DOORS $ 348.00 One exterior door needs to be re-hin the frame.
Cedar Creek Hatchery Building - Residence (prefab) (1947) - Building # : CDCH-29273 2174 STORM / SCREEN DOORS $ 278.00 One storm door is missing hardwascreen.
Cedar Creek Hatchery Building - Residence Manager's (1924) - Building # : CDCH-29274
Cedar Creek Hatchery Building - Residence Manager's (1924) - Building # : CDCH-29274 2020 BASEMENT / 8 FT FOUNDATION $ 27,691.00 Foundation walls are leaking and n
Cedar Creek Hatchery Building - Residence Manager's (1924) - Building # : CDCH-29274 2190 EXTERIOR STAIRS - CONCRETE $ 373.00 Concrete is spalling at exterior sta
Cedar Creek Hatchery Building - Residence @ Rhodes Pond (1978) - Building # : CDCH-29276
Rhoades Pond residence has been abandoned for 10 years
Decision has been made to condebuilding.
Cedar Creek Hatchery Building - Residential Mobile Home-Silvercrest (1983) - Building # : CDCH-29277
Elk River Hatchery Elk River Hatchery Site - Elk River Hatchery - Site # : ElkRH
Elk River Hatchery Site - Elk River Hatchery - Site # : ElkRH 1050 PAVED VEHICLE SURFACES - ASPHALT $ 109,998.00
The asphalt throughout the site is many areas that need to be totally the asphalt n
Elk River Hatchery Site - Elk River Hatchery - Site # : ElkRH 1052 PAVED VEHICLE SURFACES - GRAVEL $ 1,116.00
A portion of the gravel road has ruwith gravel and compacted.
Elk River Hatchery Site - Elk River Hatchery - Site # : ElkRH 1260 DOMESTIC WATER LINES $ 16,341.00
The underground piping is originalhave been found throughout. At lereplaced.
Elk River Hatchery Building - Residence 1 - Building # : ElkRH-08072
Elk River Hatchery Building - Residence 1 - Building # : ElkRH-08072 2050 WOOD, VINYL, OR ALUM WALLS $ 1,634.00 A small portion of the exterior wallsbe replaced.
Elk River Hatchery Building - Residence 1 - Building # : ElkRH-08072 2060 FLOOR INSULATION $ 2,780.00 Most of the house had floor insulatThe portion that did not needs insu
Elk River Hatchery Building - Residence 1 - Building # : ElkRH-08072 2173 GLASS SLIDING DOORS $ 300.00 Entire door should be replaced witframed sliding door assembly.
Elk River Hatchery Building - Residence 1 - Building # : ElkRH-08072 4031 CARPET AND PAD $ 1,094.00 A portion of the carpeting is stainereplaced.
Millicoma Facility STEP
Millicoma Facility STEP Building - Office/Bathroom/Spawning/Storage(1992) - Building # : Milli-06510

237 December 14, 2010 HB 3489 Report
Site Name Site / Building System # System Name Repair Amt Comment
Millicoma Facility STEP Building - Office/Bathroom/Spawning/Storage(1992) - Building # : Milli-06510 2220 DECKS WITH RAILING $ 288.00
The transition from the wood rampis pulling up and the wood planks nCurrently the
Millicoma Facility STEP Building - Office/Bathroom/Spawning/Storage(1992) - Building # : Milli-06510 4011 WALL SURFACE - GWB $ 523.00
The painted sheetrock walls in thepeeling/scratched and need to be
Millicoma Facility STEP Building - Shop (1996) - Building # : Milli-06514
Millicoma Facility STEP Building - Shop (1996) - Building # : Milli-06514 2171 WOOD DOORS $ 695.00 The wood doors need to be paintehinges also need to be replaced.
Morgan Creek Hatch-STEP Morgan Creek Hatch-STEP Site - Morgan Creek Hatch-STEP - Site # : MrgCH
Morgan Creek Hatch-STEP Site - Morgan Creek Hatch-STEP - Site # : MrgCH 1061 PAVED WALKS/SURFACES - CONCRETE $ 100.00
A percentage of the concrete walkneeds to be replaced.
Morgan Creek Hatch-STEP Site - Morgan Creek Hatch-STEP - Site # : MrgCH 1410 METAL VALVES - SMALL 2-6" $ 600.00 The one valve on the site is damagMorgan Creek Hatch-STEP Building - Spawn/Storage/Office - Building # : MrgCH-06526
Morgan Creek Hatch-STEP Building - Spawn/Storage/Office - Building # : MrgCH-06526 4023 CEILING SURFACES - GWB $ 106.00 The gypsum ceiling in the Spawninand peeling paint. The surface ne
Noble Creek Hatchery-STEP Noble Creek Hatchery-STEP Building - Hatchery/Spawning (1989) - Building # : NblCH-06540
Noble Creek Hatchery-STEP Building - Hatchery/Spawning (1989) - Building # : NblCH-06540 2150 SMALL WINDOWS (<15) $ 1,157.00
A percentage of the window frameto be replaced.
Noble Creek Hatchery-STEP Building - Hatchery/Spawning (1989) - Building # : NblCH-06540 4023 CEILING SURFACES - GWB $ 465.00
Gypsum Ceiling is scuffed and peeneeds to be repainted.
North Nehalem Hatchery North Nehalem Hatchery Site - North Nehalem Hatchery - Site # : NNH
North Nehalem Hatchery Site - North Nehalem Hatchery - Site # : NNH 1050 PAVED VEHICLE SURFACES - ASPHALT $ 79,580.00
Asphalt paving shows considerablevidence of repaired potholes, craThe site needs to
North Nehalem Hatchery Site - North Nehalem Hatchery - Site # : NNH 1400 GRATING $ 888.00 Grating shows signs of rust and coneeds to be removed and re-galva
North Nehalem Hatchery Site - North Nehalem Hatchery - Site # : NNH 1420 REARING RACEWAY - CONCRETE $ 270,176.00 Concrete has settled and cracked.to be replaced.
North Nehalem Hatchery Building - Service Building w/Freezer Room (1966) - Building # : NNH-04070
North Nehalem Hatchery Building - Service Building w/Freezer Room (1966) - Building # : NNH-04070 2081
ASPHALT OR FIBERGLASS SHINGLES $ 1,609.00
A portion of the asphalt shingles aevidence of water infiltration. The replaced.
North Nehalem Hatchery Building - Service Building w/Freezer Room (1966) - Building # : NNH-04070 4023 CEILING SURFACES - GWB $ 100.00 Repair and replace damaged ceilin

238 December 14, 2010 HB 3489 Report
Site Name Site / Building System # System Name Repair Amt Comment
North Nehalem Hatchery Building - Service Building w/Freezer Room (1966) - Building # : NNH-04070 4210 LIGHTING FIXTURES $ 171.00 Replace non-functional lighting fixt
North Nehalem Hatchery Building - Shop/Storage Building (1968) - Building # : NNH-04072
North Nehalem Hatchery Building - Shop/Storage Building (1968) - Building # : NNH-04072 2081 ASPHALT OR FIBERGLASS SHINGLES $ 7,586.00
The shingles are worn or missing. leaking. The roof needs to be repl
North Nehalem Hatchery Building - Shop/Storage Building (1968) - Building # : NNH-04072 2141 ROOF DRAINAGE - EXTERIOR $ 328.00 Sections of the gutter need to be rreconnected.
North Nehalem Hatchery Building - Shop/Storage Building (1968) - Building # : NNH-04072 2150 SMALL WINDOWS (<15) $ 224.00 Repair and repaint frames, reglazeRock Creek Hatchery Rock Creek Hatchery Site - Rock Creek Hatchery - Site # : RCH
Rock Creek Hatchery Site - Rock Creek Hatchery - Site # : RCH 1050 PAVED VEHICLE SURFACES - ASPHALT $ 520.00
A small percentage of the vehicle acracking and needs to be resealeddeterioration
Rock Creek Hatchery Site - Rock Creek Hatchery - Site # : RCH 1060 PAVED WALKS/SURFACES - ASPHALT $ 450.00
A large portion of the walkway aspobservation deck is cracked substareplaced.
Rock Creek Hatchery Site - Rock Creek Hatchery - Site # : RCH 1410 METAL VALVES - SMALL 2-6" $ 31,200.00
All of the small valves serving the damaged and need replacing. Thethe valves are rusting
Rock Creek Hatchery Site - Rock Creek Hatchery - Site # : RCH 1413 METAL VALVES - X-LARGE >18" $ 4,800.00 A 3' weir wheel valve is broken and
Rock Creek Hatchery Site - Rock Creek Hatchery - Site # : RCH 1420 REARING RACEWAY - CONCRETE $ 20,948.00
One portion of the raceways was bshowing signs of its age. The conthe aggregate
Rock Creek Hatchery Building - Residence (1957) - Building # : RCH-10091 Rock Creek Hatchery Building - Residence (1948) - Building # : RCH-10092 Rock Creek Hatchery Building - Residence 4 (1949) - Building # : RCH-10093
Rock Creek Hatchery Building - Residence 4 (1949) - Building # : RCH-10093 2190 EXTERIOR STAIRS - CONCRETE $ 261.00 A portion of the concrete stairs is cbe repaired.
Rock Creek Hatchery Building - Residence 5 (1948) - Building # : RCH-10094 Rock Creek Hatchery Building - Residence 1 (1962) - Building # : RCH-10095 Rock Creek Hatchery Building - Hatchery Building (1948) - Building # : RCH-10140
Rock Creek Hatchery Building - Hatchery Building (1948) - Building # : RCH-10140 4011 WALL SURFACE - GWB $ 452.00 Walls have experienced extreme arepainted.
Rock Creek Hatchery Building - Hatchery Building (1948) - Building # : RCH-10140 4032 WOOD FLOORS $ 770.00
The wood floors in the upstairs offimost of the paint has chipped awa100% of the fl
Rock Creek Hatchery Building - Hatchery Building (1948) - Building # : RCH-10140 4040 DOORS & FRAMES $ 891.00
Several doors need their hardwareDoors and frames (2) in incubator repainted.

239 December 14, 2010 HB 3489 Report
Site Name Site / Building System # System Name Repair Amt Comment Salmon River Hatchery Salmon River Hatchery Site - Salmon River Hatchery - Site # : SRH
Salmon River Hatchery Site - Salmon River Hatchery - Site # : SRH 1050 PAVED VEHICLE SURFACES - ASPHALT $ 32,080.00 Driveway is damaged and needs to
Salmon River Hatchery Site - Salmon River Hatchery - Site # : SRH 1061 PAVED WALKS/SURFACES - CONCRETE $ 343.00
Sections of the concrete walk are dbe replaced.
Salmon River Hatchery Site - Salmon River Hatchery - Site # : SRH 1201 DRAINAGE - SURFACE RUNOFF $ 4,536.00 The surface runoff at the site is inadrainage system needs to be insta
Salmon River Hatchery Site - Salmon River Hatchery - Site # : SRH 1410 METAL VALVES - SMALL 2-6" $ 5,488.00 Valve seals are leaking and need tSalmon River Hatchery Site - Salmon River Hatchery - Site # : SRH 1411 METAL VALVES - MEDIUM 7-11" $ 100.00 Valve seals are leaking and need tSalmon River Hatchery Site - Salmon River Hatchery - Site # : SRH 1412 METAL VALVES - LARGE 12-18" $ 458.00 Valve seals are leaking and need t
Salmon River Hatchery Site - Salmon River Hatchery - Site # : SRH 1420 REARING RACEWAY - CONCRETE $ 113,449.00 Expansion joint filler needs to be recracked and needs to be patched.
Salmon River Hatchery Building - Residence (1975) - Building # : SRH-21209
Salmon River Hatchery Building - Hatchery/Office/Apt./Freezer/Shop - Building # : SRH-21210
Salmon River Hatchery Building - Hatchery/Office/Apt./Freezer/Shop - Building # : SRH-21210 2050 WOOD, VINYL, OR ALUM WALLS $ 1,276.00
Wood siding is weathered and neereplaced/repainted.
Salmon River Hatchery Building - Hatchery/Office/Apt./Freezer/Shop - Building # : SRH-21210 2150 SMALL WINDOWS (<15) $ 551.00 Three small windows need to be re
Salmon River Hatchery Building - Hatchery/Office/Apt./Freezer/Shop - Building # : SRH-21210 2170 METAL DOORS $ 1,092.00
Four doors need to be re-hung to oframes.
Salmon River Hatchery Building - Hatchery/Office/Apt./Freezer/Shop - Building # : SRH-21210 2210
BUILDING MOUNTED EXTERIOR SITE LIGHTS $ 1,490.00 Repair or replace two non-function
Salmon River Hatchery Building - Hatchery/Office/Apt./Freezer/Shop - Building # : SRH-21210 4011 WALL SURFACE - GWB $ 485.00 Repair and repaint damaged walls
Salmon River Hatchery Building - Hatchery/Office/Apt./Freezer/Shop - Building # : SRH-21210 4023 CEILING SURFACES - GWB $ 417.00
Stained ceiling panels need to be rto be retaped.
Salmon River Hatchery Building - Hatchery/Office/Apt./Freezer/Shop - Building # : SRH-21210 4033 RESILIENT FLOORING $ 3,252.00 Replace resilient flooring in office a
Salmon River Hatchery Building - Hatchery/Office/Apt./Freezer/Shop - Building # : SRH-21210 4040 DOORS & FRAMES $ 297.00 One door is missing hardware.
Salmon River Hatchery Building - Hatchery/Office/Apt./Freezer/Shop - Building # : SRH-21210 4070 CASEWORK $ 417.00 Countertop needs to be repaired.
Salmon River Hatchery Building - Hatchery/Office/Apt./Freezer/Shop - Building # : SRH-21210 4111 ELECTRIC RADIATION $ 1,280.00 One unit heater needs to be replac
Salmon River Hatchery Building - Hatchery/Office/Apt./Freezer/Shop - Building # : SRH-21210 4210 LIGHTING FIXTURES $ 1,666.00 Replace non-functional fixture

240 December 14, 2010 HB 3489 Report
Site Name Site / Building System # System Name Repair Amt Comment
Salmon River Hatchery Building - Residence Mobile Home Camelot (1978) - Building # : SRH-21215
Salmon River Hatchery Building - Residence Mobile Home Camelot (1978) - Building # : SRH-21215 2171 WOOD DOORS $ 765.00
Exterior door needs to be re-hung the frame.
Salmon River Hatchery Building - Residence Mobile Home Camelot (1978) - Building # : SRH-21215 2192 EXTERIOR STAIRS - WOOD $ 115.00 Treads are worn and need to be re
Trask Hatchery Trask Hatchery Site - Trask Hatchery - Site # : TraskH
Trask Hatchery Site - Trask Hatchery - Site # : TraskH 1050 PAVED VEHICLE SURFACES - ASPHALT $ 82,930.00
The asphalt surface is showing sigalligatoring. The base appears to condition. The damage
Trask Hatchery Site - Trask Hatchery - Site # : TraskH 1300 SANITARY PUMPS $ 964.00 The sanitary pump sporadically mamaintenance issue.
Trask Hatchery Site - Trask Hatchery - Site # : TraskH 1410 METAL VALVES - SMALL 2-6" $ 3,000.00 The valves are corroding and leakbelieves replacement is necessary
Trask Hatchery Site - Trask Hatchery - Site # : TraskH 1411 METAL VALVES - MEDIUM 7-11" $ 12,000.00 The valves are corroding and leakbelieves replacement is necessary
Trask Hatchery Site - Trask Hatchery - Site # : TraskH 1412 METAL VALVES - LARGE 12-18" $ 5,025.00 The valves are corroding and leakbelieves replacement is necessary
Trask Hatchery Site - Trask Hatchery - Site # : TraskH 1420 REARING RACEWAY - CONCRETE $ 91,300.00 The raceway concrete is cracking to be replaced.
Trask Hatchery Site - Trask Hatchery - Site # : TraskH 1432 SETTLING PONDS - EARTH $ 7,500.00 The earth settling pond is not functto be replaced or a membrane line
Trask Hatchery Building - Residence #2 (1950) - Building # : TraskH-29283
Trask Hatchery Building - Residence #2 (1950) - Building # : TraskH-29283 2240 GARAGE $ 4,248.00 The roof, siding and door to the gaThe garage needs to be repaired a
Trask Hatchery Building - Residence #3 (1950) - Building # : TraskH-29284 Trask Hatchery Building - Residence #3 (1950) - Building # : TraskH-29284 2050 WOOD, VINYL, OR ALUM WALLS $ 229.00 The rake boards are deteriorating.
Trask Hatchery Building - Residence #3 (1950) - Building # : TraskH-29284 2081 ASPHALT OR FIBERGLASS SHINGLES $ 168.00 The sheathing is deteriorating and
Trask Hatchery Building - Residence #3 (1950) - Building # : TraskH-29284 2180 EXTERIOR COVERED AREAS $ 3,604.00 The roof is leaking at the covered
Trask Hatchery Building - Residence #3 (1950) - Building # : TraskH-29284 2240 GARAGE $ 2,124.00 The siding is damaged and needs repaired/repainted.
Trask Hatchery Building - Residence #3 (1950) - Building # : TraskH-29284 4011 WALL SURFACE - GWB $ 117.00 Repair and repaint minor wall damTrask Hatchery Building - Residence #3 (1950) - Building # : TraskH-29284 4023 CEILING SURFACES - GWB $ 100.00 Repair and repaint minor ceiling daTrask Hatchery Building - Residence #3 (1950) - Building # : TraskH-29284 4031 CARPET $ 1,796.00 The carpeting in the back room ne
Trask Hatchery Building - Residence #3 (1950) - Building # : TraskH-29284 4040 DOORS & FRAMES $ 297.00 The door needs to be re-hung to fuframe.
Trask Hatchery Building - Hatchery (1977) - Building # : TraskH-29290 Site Name Site / Building System # System Name Repair Amt Comment

241 December 14, 2010 HB 3489 Report
Trask Hatchery Building - Hatchery (1977) - Building # : TraskH-29290 2150 SMALL WINDOWS (<15) $ 897.00 The windows need to be reglazed,repainted.
Trask Hatchery Building - Hatchery (1977) - Building # : TraskH-29290 4011 WALL SURFACE - GWB $ 100.00 Repair and repaint minor wall dam
Trask Hatchery Building - Hatchery (1977) - Building # : TraskH-29290 4033 RESILIENT FLOORING $ 1,972.00 The flooring in the office, change rworn and needs to be replaced.
Trask Hatchery Building - Hatchery (1977) - Building # : TraskH-29290 4040 DOORS & FRAMES $ 594.00 The door needs to be re-hung to fuframe.
Trask Hatchery Building - Storage House @ Upper Hatchery (1950) - Building # : TraskH-29306
Trask Hatchery Building - Storage House @ Upper Hatchery (1950) - Building # : TraskH-29306 2100 CHIMNEYS $ 360.00 The chimney needs to be repointe
Trask Hatchery Building - Storage House @ Upper Hatchery (1950) - Building # : TraskH-29306 2141 ROOF DRAINAGE - EXTERIOR $ 120.00 Clean, repair and reattach non-fun
Trask Hatchery Building - Storage House @ Upper Hatchery (1950) - Building # : TraskH-29306 2171 WOOD DOORS $ 850.00 Rehang door to function in frame
Trask Hatchery Building - Freezer/Thawing Building (1989) - Building # : TraskH-29324
Trask Hatchery Building - Freezer/Thawing Building (1989) - Building # : TraskH-29324 4011 WALL SURFACE - GWB $ 230.00 Repair and repaint minor wall dam
Trask Hatchery Building - Shed Spawning @ Upper Pond (1985) - Building # : TraskH-29330
Trask Hatchery Building - Shed Spawning @ Upper Pond (1985) - Building # : TraskH-29330 2081
ASPHALT OR FIBERGLASS SHINGLES $ 100.00 Replace missing shingles
Trask Hatchery Building - Shed Spawning @ Upper Pond (1985) - Building # : TraskH-29330 2141 ROOF DRAINAGE - EXTERIOR $ 100.00
Portion of the gutters is damaged agutters need to be repaired.
Trask Rearing Ponds Trask Rearing Ponds Site - Trask Rearing Ponds - Site # : TraskP
Trask Rearing Ponds Site - Trask Rearing Ponds - Site # : TraskP 1052 PAVED VEHICLE SURFACES - GRAVEL $ 4,302.00
The road has potholes and ruts anfilled/compacted.
Trask Rearing Ponds Site - Trask Rearing Ponds - Site # : TraskP 1410 METAL VALVES - SMALL 2-6" $ 1,172.00 The metal valves can no longer beto be replaced.
Trask Rearing Ponds Site - Trask Rearing Ponds - Site # : TraskP 1412 METAL VALVES - LARGE 12-18" $ 1,800.00 The metal valves can no longer beto be replaced.
Trask Rearing Ponds Site - Trask Rearing Ponds - Site # : TraskP 1420 REARING RACEWAY - CONCRETE $ 30,000.00 Elk damaged the membrane in theempty. Replace the membrane.
Trask Rearing Ponds Site - Trask Rearing Ponds - Site # : TraskP 1432 SETTLING PONDS - EARTH $ 8,050.00 Settling pond is in poor condition alined with membrane.
Trask Rearing Ponds Building - Refrigerator Shed & Slab (1965) - Building # : TraskP-29344
Site Name Site / Building System # System Name Repair Amt Comment

242 December 14, 2010 HB 3489 Report
Trask Rearing Ponds Building - Refrigerator Shed & Slab (1965) - Building # : TraskP-29344 2083 METAL ROOF $ 127.00 Metal roof is leaking and needs to
Trask Rearing Ponds Building - Garage and Office (1970) - Building # : TraskP-29345
Trask Rearing Ponds Building - Garage and Office (1970) - Building # : TraskP-29345 2050 WOOD, VINYL, OR ALUM WALLS $ 2,277.00
There is weather damage to the wApproximately 40% of the siding nand painted.
Trask Rearing Ponds Building - Garage and Office (1970) - Building # : TraskP-29345 2081 ASPHALT OR FIBERGLASS SHINGLES $ 5,415.00
Numerous shingles are missing anwater damage to the ceiling insidereplaced.
Trask Rearing Ponds Building - Garage and Office (1970) - Building # : TraskP-29345 2141 ROOF DRAINAGE - EXTERIOR $ 314.00 The gutter and leader componentsneed to be replaced.
Trask Rearing Ponds Building - Garage and Office (1970) - Building # : TraskP-29345 2150 SMALL WINDOWS (<15) $ 1,157.00 The glazing and framing are severto be replaced.
Trask Rearing Ponds Building - Garage and Office (1970) - Building # : TraskP-29345 2180 EXTERIOR COVERED AREAS $ 3,211.00 Covered storage leaks and shows deterioration. The covered storage
Trask Rearing Ponds Building - Garage and Office (1970) - Building # : TraskP-29345 4013 WALL SURFACE - WOOD PANELING $ 2,435.00 The particle board finish has experand needs to be replaced.
Trask Rearing Ponds Building - Garage and Office (1970) - Building # : TraskP-29345 4023 CEILING SURFACES - GWB $ 960.00 The particle board finish has experand needs to be replaced.
Trask Rearing Ponds Building - Garage and Office (1970) - Building # : TraskP-29345 4032 WOOD FLOORS $ 392.00 Floor is damaged and needs to beTrask Rearing Ponds Building - Garage and Office (1970) - Building # : TraskP-29345 4070 CASEWORK $ 3,574.00 Casework is worn/damaged and nTrask Rearing Ponds Building - Garage and Office (1970) - Building # : TraskP-29345 4210 LIGHTING FIXTURES $ 927.00 Dysfunctional light fixtures need to
Trask Rearing Ponds Building - Residence Mobile Home Mcminville (1986) - Building # : TraskP-29347
Trask Rearing Ponds Building - Residence Mobile Home Mcminville (1986) - Building # : TraskP-29347 2050 WOOD, VINYL, OR ALUM WALLS $ 484.00
There is damage to the lower sidinThe siding needs to be repaired/re
Trask Rearing Ponds Building - Residence Mobile Home Mcminville (1986) - Building # : TraskP-29347 4022
CEILING SURFACES - ADHERED TILES $ 532.00
Ceiling tiles have experienced watbe replaced. (Water infiltrated roofrepaired).
Trask Rearing Ponds Building - Residence Mobile Home Mcminville (1986) - Building # : TraskP-29347 4031 CARPET $ 2,106.00 Replace living room carpet.
Trask Rearing Ponds Building - Residence Mobile Home Mcminville (1986) - Building # : TraskP-29347 4033 RESILIENT FLOORING $ 1,554.00 Replace kitchen and bathroom res
Trask Rearing Ponds Building - Residence Mobile Home Mcminville (1986) - Building # : TraskP-29347 4040 DOORS & FRAMES $ 817.00
Doors need to be re-hung and framrepaired.
Tuffy Creek Hatchery Tuffy Creek Hatchery Site - Tuffy Creek Hatchery - Site # : TfyCrH
Tuffy Creek Hatchery Site - Tuffy Creek Hatchery - Site # : TfyCrH 1260 WATER LINES $ 711.00 The water lines are damaged at thneed to be repaired.
Tuffy Creek Hatchery Building - Incubation Building (1990) - Building # : TfyCrH-29559 Site Name Site / Building System # System Name Repair Amt Comment

243 December 14, 2010 HB 3489 Report
Tuffy Creek Hatchery Building - Incubation Building (1990) - Building # : TfyCrH-29559 2171 WOOD DOORS $ 348.00 The door to the incubation buildingfunctions properly in the frame.
Total $1,665,344.00

244
Table 88. Deferred maintenance - health and safety items only. Site Name Site / Building System # System Name Repair Amt Comment
Butte Falls Hatchery Building - Storage/Wood Shop Building (1937) - Building # : BtFH-15034 2240 GARAGE $46,209.00
The 3 car garage on the end, building #15033, is failing. A tree root has broken the foundation and the structure is unsafe. The entire structure needs to be replaced.
Butte Falls Hatchery Building - Residence 2 (1936) - Building # : BtFH-15112 4230
ELECTRICAL PANEL & WIRING $6,921.00
Wiring is varies in age and portions are not grounded. Though no major issues at this time the electrical inspector suggested the house be re-wired.
Butte Falls Hatchery Building - Residence #5 - Building # : BtFH-15114 4230
ELECTRICAL PANEL & WIRING $109.00
100 amp service to the house box is located in the garage. The breaker for the water heater trips randomly. Possible upgrade needed, however a further research needs be performed to confirm what action is necessary.
Butte Falls Hatchery Site - Butte Falls Hatchery - Site # : BtFH 1061
PAVED WALKS/SURFACES - CONCRETE $755.00
Portions of the older pathways are cracking due to tree root systems. Replace the cracked sections that pose tripping hazard and/or weathered sections.
Millicoma Facility
Building - Office/Bathroom/Spawning/Storage(1992) - Building # : Milli-06510 2220 DECKS WITH RAILING $ 288.00
The transition from the wood ramp to the asphalt sidewalk is pulling up and the wood planks need to be replaced. Currently the lip is a safety hazard and an ADA issue. A portion of the railing is also damaged and needs replacing.
TOTAL $54,282.00

245 December 14, 2010 HB 3489 Report
Table 89. Deferred maintenance - high priority items only Site Name Site / Building System # System Name Repair Amt Comment
Alsea Hatchery Building - Residence 1 (1948) - Building # : AlsH-02001 2050
WOOD, VINYL, OR ALUM WALLS $2,621.00
The eaves are dry rotting and need to be replaced/repaired accordingly. 100% of the wood siding needs to be scraped and repaint
Alsea Hatchery Building - Residence 2 5Rooms (1934) - Building # : AlsH-02002 2010
CRAWL SPACE / 4 FT FOUNDATION $4,925.00 The floor joists are rotted and need to be replaced.
Alsea Hatchery Building - Residence 2 5Rooms (1934) - Building # : AlsH-02002 2050
WOOD, VINYL, OR ALUM WALLS $547.00
Part of the eaves are dry rotted and need to be replaced.
Alsea Hatchery
Building - Residence w/3 Bdrm + Garage (1962) - Building # : AlsH-02004 2050
WOOD, VINYL, OR ALUM WALLS $2,856.00
The wood walls need to be scraped and repainted. The eaves are dryrotted and the roof accessories keep falling off because of
Alsea Hatchery
Building - Garage Tank and Storage (1934) includes 02018 - Building # : AlsH-02011 2050
WOOD, VINYL, OR ALUM WALLS $2,771.00
The entire building needs to scraped and repainted.
Bandon Hatchery Site - Bandon Hatchery - Site # : BndH 1290 SANITARY LINES $1,200.00
The lines are deteriorating and need to be replaced.
Bandon Hatchery Site - Bandon Hatchery - Site # : BndH 1420
REARING RACEWAY - CONCRETE $15,577.00
Some of the concrete walls and floors of the raceways are cracked and need to be patched.
Butte Falls Hatchery Site - Butte Falls Hatchery - Site # : BtFH 1050
PAVED VEHICLE SURFACES - ASPHALT $640.00
The asphalt surfaces in the driveways are worn and cracking and need to be resurfaced.
Butte Falls Hatchery Site - Butte Falls Hatchery - Site # : BtFH 1051
PAVED VEHICLE SURFACES - CONCRETE $2,382.00
The concrete driveways were installed in sections over large spans of time. Some driveways are cracked and falling apart and a
Butte Falls Hatchery Site - Butte Falls Hatchery - Site # : BtFH 1061
PAVED WALKS/SURFACES - CONCRETE $755.00
Portions of the older pathways are cracking due to tree root systems. Replace the cracked sections that pose tripping hazard a
Butte Falls Hatchery Site - Butte Falls Hatchery - Site # : BtFH 1191
LANDSCAPE RETAINING WALL - WOOD $10,994.00
The railroad retaining wall Northwest of ponds 15005-15007 is rotting and falling apart and needs to be replaced.
Butte Falls Hatchery Site - Butte Falls Hatchery - Site # : BtFH 1201
DRAINAGE - SURFACE RUNOFF $18,034.00
In times of heavy rain, water runs down walkways of building 15112 and ponds in back yard.
Butte Falls Hatchery Site - Butte Falls Hatchery - Site # : BtFH 1260 WATER LINES $31,677.00
There are major problems with the old piping, including frequent leaks. The damaged portions of the piping need to be replaced

246 December 14, 2010 HB 3489 Report
Site Name Site / Building System # System Name Repair Amt Comment
Butte Falls Hatchery Site - Butte Falls Hatchery - Site # : BtFH 1420
REARING RACEWAY - CONCRETE $59,376.00
The majority of the raceways are useable but extremely degraded. The concrete is chipping and crumbling and need to be patched
Butte Falls Hatchery Building - Office (3 room) (1937) - Building # : BtFH-15028 2040
VERTICAL STRUCTURE $1,170.00
Building is leaning 2” to the back due to roots degrading the foundation. The structure needs to be reinforced and leveled out
Butte Falls Hatchery Building - Office (3 room) (1937) - Building # : BtFH-15028 4033
RESILIENT FLOORING $1,096.00
The floor is chipped and the seams are pulling apart. It needs to be replaced.
Butte Falls Hatchery Building - Cold Storage & Grinder Room - Building # : BtFH-15038 2171 WOOD DOORS $695.00
The paint is peeling off of the door. The door is also too small to drive a forklift through for loading and unloading food pa
Butte Falls Hatchery Building - Cold Storage & Grinder Room - Building # : BtFH-15038 2221
PATIOSWITHOUT ROOFS $1,380.00
Concrete pad in front of building is crumbling/falling apart and needs to be replaced.
Butte Falls Hatchery Building - Cold Storage & Grinder Room - Building # : BtFH-15038 4011
WALL SURFACE - GWB $1,757.00
The GWB walls in the grinder space need to be refinished. The paint and plaster are cracking and peeling off.
Butte Falls Hatchery Building - Residence 2 (1936) - Building # : BtFH-15112 2100 CHIMNEYS $100.00
The bricks are loose at the top of the chimney and need to be repaired/secured.
Butte Falls Hatchery Building - Residence 2 (1936) - Building # : BtFH-15112 4230
ELECTRICAL PANEL & WIRING $6,921.00
Wiring is varies in age and portions are not grounded. Though no major issues at this time the electrical inspector suggested
Butte Falls Hatchery Building - Residence #5 - Building # : BtFH-15114 4230
ELECTRICAL PANEL & WIRING $109.00
100 amp service to the house box is located in the garage. The breaker for the water heater trips randomly. Possible upgrade
Cedar Creek Hatchery Site - Cedar Creek Hatchery - Site # : CDCH 1411
METAL VALVES - MEDIUM 7-11" $14,250.00 Valves are leaking and should be replaced.
Cedar Creek Hatchery Site - Cedar Creek Hatchery - Site # : CDCH 1412
METAL VALVES - LARGE 12-18" $15,000.00 Valves are leaking and should be replaced.
Cedar Creek Hatchery Site - Cedar Creek Hatchery - Site # : CDCH 1413
METAL VALVES - X-LARGE >18" $5,000.00 Valves are leaking and should be replaced.
Elk River Hatchery Site - Elk River Hatchery - Site # : ElkRH 1413
METAL VALVES - X-LARGE >18" $907.00
One valve is damaged at the valve stem and is leaking. The valve stem needs to be repaired/replaced accordingly.
North Nehalem Hatchery
Site - North Nehalem Hatchery - Site # : NNH 1420
REARING RACEWAY - CONCRETE $270,176.00
Concrete has settled and cracked. The concrete needs to be replaced.

247 December 14, 2010 HB 3489 Report
Site Name Site / Building System # System Name Repair Amt Comment
Rock Creek Hatchery Site - Rock Creek Hatchery - Site # : RCH 1060
PAVED WALKS/SURFACES - ASPHALT $450.00
A large portion of the walkway asphalt area leading to the observation deck is cracked substantially and needs to be replaced.
Rock Creek Hatchery Site - Rock Creek Hatchery - Site # : RCH 1420
REARING RACEWAY - CONCRETE $20,948.00
One portion of the raceways was built in the 1940’s and is showing signs of its age. The concrete is cracking and the aggregate
Salmon River Hatchery Site - Salmon River Hatchery - Site # : SRH 1201
DRAINAGE - SURFACE RUNOFF $4,536.00
The surface runoff at the site is inadequate. A storm drainage system needs to be installed.
Trask Hatchery Site - Trask Hatchery - Site # : TraskH 1050
PAVED VEHICLE SURFACES - ASPHALT $22,930.00
The asphalt surface is showing signs of cracks and alligatoring. The base appears to be in satisfactory condition. The damage
Trask Rearing Ponds
Building - Residence Mobile Home Mcminville (1986) - Building # : TraskP-29347 2050
WOOD, VINYL, OR ALUM WALLS $484.00
There is damage to the lower siding and corner boards. The siding needs to be repaired/repainted.
Trask Rearing Ponds
Building - Residence Mobile Home Mcminville (1986) - Building # : TraskP-29347 4022
CEILING SURFACES - ADHERED TILES $532.00
Ceiling tiles have experienced water damage and need to be replaced. (Water infiltrated roof, roof has since been repaired).
Trask Rearing Ponds
Building - Residence Mobile Home Mcminville (1986) - Building # : TraskP-29347 4031 CARPET $2,106.00 Replace living room carpet.
Trask Rearing Ponds
Building - Residence Mobile Home Mcminville (1986) - Building # : TraskP-29347 4033
RESILIENT FLOORING $1,554.00 Replace kitchen and bathroom resilient flooring.
Trask Rearing Ponds
Building - Residence Mobile Home Mcminville (1986) - Building # : TraskP-29347 4040 DOORS & FRAMES $817.00
Doors need to be re-hung and frames need to be repaired.
TOTAL $527,793.0
0

248 December 14, 2010 HB 3489 Report
Appendix F. Proposed Modifications Table 90. Proposed modifications and maintenance items
Site Name Site / Building System Name Repair Amt Comment
Bandon Hatchery Site - Bandon Hatchery - Site # : BndH ADA COMPLIANT WALKWAYS $ 30,000.00 Most of the existing walkways are narrow and
unsafe.
Bandon Hatchery Site - Bandon Hatchery - Site # : BndH PUBLIC/EMPLOYEE RESTROOMS $ 75,000.00 To include sinks for personal sanitation, sump,
sewage pump and drainfield.
Bandon Hatchery Site - Bandon Hatchery - Site # : BndH NOAA-APPROVED SCREENS FOR FERRY AND
GEIGER CREEK INTAKES $ 7,000.00
The existing aluminum screens are 1/8” mesh and need to be replaced with 3/32” mesh
screens.
Bandon Hatchery Site - Bandon Hatchery - Site # : BndH WIDEN/REPAIR FERRY CREEK SPILLWAY $ 45,000.00
This old spillway is in very poor condition. It isn’t nearly wide enough and leaks. It was
scheduled for replacement in 1965.
Bandon Hatchery Site - Bandon Hatchery - Site # : BndH ALUMINUM ADULT PEN DIVIDERS $ 40,000.00 Existing ones are wood and in need of constant
repair
Bandon Hatchery Site - Bandon Hatchery - Site # : BndH PUMP SYSTEM FOR TREATING PONDS $ 8,000.00
Bandon Hatchery needs a system to pump pond water with chemicals to an empty pond
after treatment so that it can be metered slowly, thus meeting DEQ regulations.
Cedar Creek Hatchery Site – Cedar Creek Hatchery – Site # :
CDCH PONDS $ 1,000.00 Install gratings at outlet ends of Ponds 9, 10 &
11 a safety measure
Cedar Creek Hatchery Site – Cedar Creek Hatchery – Site # :
CDCH PONDS $ 28,320.00 Refurbish Ponds 9, 10 & 11 and level bottoms
within 10-15 years
Cedar Creek Hatchery Site – Cedar Creek Hatchery – Site # :
CDCH PONDS $ 2,200.00 Replace cleaning valve in Pond 9 within 1-5
years
Cedar Creek Hatchery Site – Cedar Creek Hatchery – Site # :
CDCH PONDS $ 18,785.00 Refurbish Ponds 2A and 8 and level bottoms
within 5-10 years
Cedar Creek Hatchery Site – Cedar Creek Hatchery – Site # :
CDCH WATER LINES $ 30.000.00 Replace main water line from Hatchery Building
within 5-10 years
Cedar Creek Hatchery Site – Cedar Creek Hatchery – Site # :
CDCH WEIR $ 50,000.00 Replace temporary wooden weir in Cedar
Creek with permanent weir within 5-10 years
Cedar Creek Hatchery Building – Domestic Water Building ROOF $ 1,750.00 Replace roof with metal roof within 1-5 years
Cedar Creek Hatchery Building – Domestic Water Building ROOF DRAINAGE - EXTERIOR $ 300.00 Replace gutters within 1-5 years
Cedar Creek Hatchery Building - Hatchery - Building # : CDCH-
29239 WINDOWS $ 3,795.00 Replace with vinyl windows within 1-5 years
Cedar Creek Hatchery Building - Hatchery - Building # : CDCH-
29239 WOOD, VINYL, OR ALUM WALLS $ 3,000.00 Paint within 1-5 years

249 December 14, 2010 HB 3489 Report
Site Name Site / Building System Name Repair Amt Comment
Cedar Creek Hatchery Building - Hatchery - Building # : CDCH-
29239 ROOF DRAINAGE - EXTERIOR $ 513.00 Replace gutters within 1-5 years
Cedar Creek Hatchery Building - Hatchery - Building # : CDCH-
29239 ROOF $ 8,280.00 Replace with metal roof within 10-15 years
Cedar Creek Hatchery Building -Office Building (1950) - Building #
: CDCH-29249 WINDOWS $ 1,171.00 Replace with vinyl windows within 1-5 years
Cedar Creek Hatchery Building -Office Building (1950) - Building #
: CDCH-29249 ROOF $ 2386.00 Replace existing metal roof on lean-to within 1-
5 years
Cedar Creek Hatchery Building -Shop Building (1950) - Building #
: CDCH-29229 WOOD, VINYL, OR ALUM WALLS $ 1,950.00 Paint within 1-5 years
Elk River Hatchery Site - Elk River Hatchery - Site # : ElkRH INTAKE PUMP $ 12,000 The pump seals are damaged and need to be
repaired.
Elk River Hatchery Site - Elk River Hatchery - Site # : ElkRH EGG INCUBATOR STACKS $ 65,000 Old fiberglass incubators are deteriorating and
need replacement.
Elk River Hatchery Building - Residence 3 - Building # :
ElkRH-08074 FLOOR INSULATION $ 2,780.00
Most of the house had floor insulation installed in 1993. The portion that did not needs
insulation installed.
Elk River Hatchery Building - Residence 1 - Building # :
ElkRH-08072 ROOF $ 12,000 Roofing needs replacing due to storm damage
and moos growth
Elk River Hatchery Building - Residence 3 - Building # :
ElkRH-08074 ROOF $ 12,000 Roofing needs replacing due to storm damage
and moos growth
North Nehalem Hatchery Site - North Nehalem Hatchery - Site # :
NNH EMERGENCY POWER Replace WWII era gen-set. Replace soft starts
with VFD.
North Nehalem Hatchery Site - North Nehalem Hatchery - Site # :
NNH STORAGE TANKS Replace underground storage tanks with
above-ground storage tanks
North Nehalem Hatchery Site - North Nehalem Hatchery - Site # :
NNH CRANE Install jib crane at lower fish trap
North Nehalem Hatchery Building - Service Building w/Freezer
Room (1966) - Building # : NNH-04070 ROOF Replace roof
Rock Creek Hatchery Site - Rock Creek Hatchery - Site # : RCH REARING RACEWAY - CONCRETE $ 40,000.00 Apply polymer coating to concrete raceways 7
and 8 to help control pathogens and algae
Rock Creek Hatchery Site - Rock Creek Hatchery - Site # : RCH BROOD POND - CONCRETE $ 30,000.00 Apply polymer coating to concrete brood pond
to help control pathogens and algae
Rock Creek Hatchery Site - Rock Creek Hatchery - Site # : RCH UV DISINFECTION SYSTEM $ 50,000.00
Purchase and install UV disinfection and filter for Raceways 7 and 8 water supply.
Improvement would relieve a large portion of chemical use and pathogen infection.

250 December 14, 2010 HB 3489 Report
Site Name Site / Building System Name Repair Amt Comment
Rock Creek Hatchery Site - Rock Creek Hatchery - Site # : RCH UV DISINFECTION SYSTEM $ 50,000.00
Purchase and install UV disinfection and filter for brood pond water supply. Improvement would relieve a large portion of chemical use
and pathogen infection.
Rock Creek Hatchery Site - Rock Creek Hatchery - Site # : RCH UV DISINFECTION SYSTEM $ 50,000.00 Upgrade hatchery building filter and UV to
larger capacity.
Rock Creek Hatchery Site - Rock Creek Hatchery - Site # : RCH BROOD PENS $ 40,000.00 Rep[lace wooden pen structures with aluminum
pen structures
Rock Creek Hatchery Building - Residence (1957) - Building # :
RCH-10091 KITCHEN REMODEL $ 20,000.00 Replace cabinets, counter tops, sinks, floor,
dishwasher
Rock Creek Hatchery Building - Residence (1948) - Building # :
RCH-10092 KITCHEN REMODEL $ 20,000.00 Replace cabinets, counter tops, sinks, floor,
dishwasher
Rock Creek Hatchery Building - Residence 4 (1949) - Building # :
RCH-10093 KITCHEN REMODEL $ 20,000.00 Replace cabinets, counter tops, sinks, floor,
dishwasher
Rock Creek Hatchery Building - Residence 5 (1948) - Building # :
RCH-10094 KITCHEN REMODEL $ 20,000.00 Replace cabinets, counter tops, sinks, floor,
dishwasher
Rock Creek Hatchery Building - Hatchery Building (1948) -
Building # : RCH-10140 ROOF AND DORMERS $ 100,000.00 Replace hatchery roof and expand office space
Rock Creek Hatchery Building - Hatchery Building (1948) -
Building # : RCH-10140 SIDING $ 20,000.00 Replace siding with concrete fiber and paint
Rock Creek Hatchery Building - Hatchery Building (1948) -
Building # : RCH-10140 WINDOWS $ 5,000.00 Replace window with energy efficient vinyl-
frame windows
Salmon River Hatchery Site - Salmon River Hatchery - Site # :
SRH METAL VALVES - MEDIUM 4-10" $ 4720.00 Valve seals leak and handles are broken
Salmon River Hatchery Site - Salmon River Hatchery - Site # :
SRH HATCHERY SUPPLY LINES $ Inspect hatchery water lines to rearing ponds, lakes, adult collection ponds and incubation.
Salmon River Hatchery Site - Salmon River Hatchery - Site # :
SRH REARING PONDS – ASPHALT $ Ponds 9 & 10 asphalt has large cracks in wall
and bottoms and needs to be resealed.
Salmon River Hatchery Site - Salmon River Hatchery - Site # :
SRH REARING PONDS – CONCRETE $ 5,000.00 Replace PVC intake manifolds with aluminum
material.
Salmon River Hatchery Site - Salmon River Hatchery - Site # :
SRH ABATEMENT POND – EARTHEN $ 1,600.00 Excavate earthen pollution abatement pond.
Salmon River Hatchery Site - Salmon River Hatchery - Site # :
SRH WEIR $ Replace existing weir and modify for fish
passage & flow direction into hatchery intake.
Salmon River Hatchery Site - Salmon River Hatchery - Site # :
SRH ADULT COLLECTION/HOLDING/SORTING PONDS $ 250,000.00
update holding pond area according to "SALMON RIVER HATCHERY ADULT FISHWAY & RACEWAY HANDLING IMPROVEMENTS" DESIGN STUDY.

251 December 14, 2010 HB 3489 Report
Site Name Site / Building System Name Repair Amt Comment
Salmon River Hatchery Site - Salmon River Hatchery - Site # :
SRH CONCRETE RACEWAYS & ASPHALT PONDS Raise height of pond sides to prevent fish
escape during high water events
Salmon River Hatchery Site - Salmon River Hatchery - Site # :
SRH POND WALKWAYS $ Replace or re-galvanize grip strut
Salmon River Hatchery Site - Salmon River Hatchery - Site # :
SRH INTAKE STRUCTURE $ Install chain link fence around intake structure
and add rails around rest of fish ladder.
Salmon River Hatchery Site - Salmon River Hatchery - Site # :
SRH DAM BOARDS $ Replace wooden dam boards with aluminum
dam boards
Trask Hatchery Building - Hatchery (1977) - Building # :
TraskH-29290 FOUNDATION Replace foundation of office/incubation building
Trask Hatchery Site – Trask Hatchery – Site # : TraskH RACEWAYS Replace drain system for upper raceways
Trask Hatchery Building – Residence – Bldg # : 29283 STRUCTURE Replace old manager’s house (condemned)
Trask Hatchery Building - Residence STRUCTURE Replace storage building/garage at supervisor’s
house

252
Appendix G. Coastal Hatchery Reform –HB 3489 Working Group Contact List
Name Phone Email Tony Amandi 541-737-1855 [email protected] Craig Banner 541-737-1857 [email protected] Christine Broniak 503-947-6161 [email protected] Bob Buckman 541-265-8306 [email protected] Guy Chilton 503-947-6249 [email protected] Shaun Clements 541-757-4263 [email protected] Confer 541-247-7605 [email protected] Charlie Corrarino 503-947-6213 [email protected] Manny Farinas 541-757-4186 [email protected] Mike Gray 541-888-5515 [email protected] Laura Jackson 541-440-3353 [email protected] Jerry Jones 541-737-6041 [email protected] John Kaufman 541-737-1853 [email protected] Chris Knutsen 503-842-2741 [email protected] M.A. Latif 503-947-6248 [email protected] Bill Otto 971-673-6006 [email protected] Scott Patterson 503-947-6218 [email protected] Russ Stauff 541-826-8774 [email protected] John Thorpe 503-947-6212 [email protected] Dan Vandyke 541-826-8774 [email protected] Tim Walters 541-440-3353 [email protected]

253 December 14, 2010 HB 3489 Report
LIST OF TABLES
Page No
Table 1. Estimated number of Necanicum Basin adult hatchery fall Chinook caught in ocean and freshwater (FW) fisheries, returning to the hatchery, or straying to spawning grounds. Estimates are based on coded-wire tag (CWT) recoveries..............................................................................................................8
Table 2. Estimate of harvest of Necanicum Basin adult hatchery fall Chinook among the four northwest states (Alaska, Washington, Oregon and California) and Canada (BC). Values represent the % of the total harvest caught in the respective regions. ........................................................................8
Table 3. Estimated number of Trask Basin adult hatchery fall Chinook caught in ocean and freshwater (FW) fisheries, returning to the hatchery, or straying to spawning grounds. Estimates are based on CWT recoveries. ..........................9
Table 4. Distribution of harvest of Trask Basin adult hatchery fall Chinook among the four northwest states (Alaska, Washington, Oregon and California) and Canada (BC). Values represent the % of the total harvest caught in the respective regions. ...............................................................................................9
Table 5. Estimated number of Salmon River adult hatchery fall Chinook caught in ocean and freshwater (FW) fisheries, returning to the hatchery, or straying to spawning grounds. Estimates are based on CWT recoveries. ........................11
Table 6. Distribution of harvest of Salmon River adult hatchery fall Chinook among the four northwest states (Alaska, Washington, Oregon and California) and Canada (BC). Values represent the % of the total harvest caught in the respective regions. .............................................................................................11
Table 7. Estimated number of Coos Basin adult hatchery fall Chinook caught in ocean and freshwater (FW) fisheries, returning to the hatchery, or straying to spawning grounds. Estimates are based on CWT recoveries. ........................14
Table 8. Distribution of harvest of Coos Basin adult hatchery fall Chinook among the four northwest states (Alaska, Washington, Oregon and California) and Canada (BC). Values represent the % of the total harvest caught in the respective regions. .............................................................................................14
Table 9. Estimated number of Coquille Basin adult hatchery fall Chinook caught in ocean and freshwater (FW) fisheries, returning to the hatchery, or straying to spawning grounds. Estimates are based on CWT recoveries. ........................16
Table 10. Distribution of harvest of Coquille Basin adult hatchery fall Chinook among the four northwest states (Alaska, Washington, Oregon and California) and Canada (BC). Values represent the % of the total harvest caught in the respective regions. ......................................................................16

254 December 14, 2010 HB 3489 Report
Table 11. Estimated number of Elk River adult hatchery fall Chinook caught in ocean and freshwater (FW) fisheries, returning to the hatchery, or straying to spawning grounds. Estimates are based on CWT recoveries. ........................18
Table 12. Distribution of harvest of Elk River adult hatchery fall Chinook among the four northwest states (Alaska, Washington, Oregon and California) and Canada (BC). Values represent the % of the total harvest caught in the respective regions. .............................................................................................18
Table 13. Estimated number of Chetco River adult hatchery fall Chinook caught in ocean and freshwater (FW) fisheries, returning to the hatchery, or straying to spawning grounds. Estimates are based on CWT recoveries. ........................19
Table 14. Distribution of harvest of Chetco River adult hatchery fall Chinook among the four northwest states (Alaska, Washington, Oregon and California) and Canada (BC). Values represent the % of the total harvest caught in the respective regions. .............................................................................................19
Table 15. Estimated number of Trask Hatchery adult hatchery spring Chinook caught in ocean and freshwater (FW) fisheries, returning to the hatchery, or straying to spawning grounds. Estimates are based on CWT recoveries. .....22
Table 16. Distribution of harvest of Trask Hatchery adult hatchery spring Chinook among the four northwest states (Alaska, Washington, Oregon and California) and Canada (BC). Values represent the % of the total harvest caught in the respective regions. ......................................................................22
Table 17. Estimated number of Trask Hatchery adult hatchery spring Chinook released in the Wilson River that are caught in ocean and freshwater (FW) fisheries, returning to the hatchery, or straying to spawning grounds. Estimates are based on CWT recoveries. .........................................................23
Table 18. Distribution of harvest of Trask Hatchery adult hatchery spring Chinook released in the Wilson River among the four northwest states (Alaska, Washington, Oregon and California) and Canada (BC). Values represent the % of the total harvest caught in the respective regions...................................23
Table 19. Estimated number of Cedar Creek Hatchery adult hatchery spring Chinook caught in ocean and freshwater (FW) fisheries, returning to the hatchery, or straying to spawning grounds. Estimates are based on CWT recoveries............................................................................................................24
Table 20. Distribution of harvest of Cedar Creek Hatchery adult hatchery spring Chinook among the four northwest states (Alaska, Washington, Oregon and California) and Canada (BC). Values represent the % of the total harvest caught in the respective regions. ......................................................................24
Table 21. Estimated number of Umpqua Basin adult hatchery spring Chinook caught in ocean and freshwater (FW) fisheries, returning to the hatchery, or straying to spawning grounds. Estimates are based on CWT recoveries. .....26

255 December 14, 2010 HB 3489 Report
Table 22. Distribution of harvest of Umpqua Basin adult hatchery spring Chinook among the four northwest states (Alaska, Washington, Oregon and California) and Canada (BC). Values represent the % of the total harvest caught in the respective regions. ......................................................................26
Table 23. Estimated number of North Fork Nehalem Hatchery adult coho caught in ocean and freshwater (FW) fisheries, returning to the hatchery, or straying to spawning grounds. Estimates are based on CWT recoveries. ........................28
Table 24. Distribution of harvest of North Fork Nehalem Hatchery adult coho among the four northwest states (Alaska, Washington, Oregon and California) and Canada (BC). Values represent the % of the total harvest caught in the respective regions. ......................................................................28
Table 25. Estimated number of Trask Hatchery adult coho caught in ocean and freshwater (FW) fisheries, returning to hatchery, or straying to spawning grounds. Estimates are based on CWT recoveries. .........................................29
Table 26. Distribution of harvest of Trask Hatchery adult coho among the four northwest states (Alaska, Washington, Oregon and California) and Canada (BC). Values represent the % of the total harvest caught in the respective regions. ...............................................................................................................29
Table 27. Estimated number of Umpqua Basin adult coho caught in ocean and freshwater (FW) fisheries, returning to the hatchery, or straying to spawning grounds. Estimates are based on CWT recoveries. .........................................31
Table 28. Distribution of harvest of Umpqua Basin adult coho in the four northwest states (Alaska, Washington, Oregon and California) and Canada (BC). Values represent the % of the total harvest caught in the respective regions.............................................................................................................................31
Table 29. Release numbers, FW harvest estimates, and hatchery returns for Nehalem winter steelhead (stock 32 and 99). Spawning grounds are not surveyed, so there is no data on stray rates.....................................................33
Table 30. Release numbers, FW harvest estimates, and hatchery returns for Cedar Creek Hatchery winter steelhead from stock 47 and 47W (began with 2002 brood year). Spawning grounds are not surveyed, so there is no data on stray rates. .........................................................................................................34
Table 31. Release numbers, FW harvest estimates, and hatchery returns for Nestucca/Wilson stock winter steelhead. Spawning grounds are not surveyed, so there is no data on stray rates.....................................................35
Table 32. Release numbers, FW harvest estimates, and hatchery returns for Siletz wild stock winter steelhead. There is limited information on stray rates from spawning surveys and trap data.......................................................................36

256 December 14, 2010 HB 3489 Report
Table 33. Numbers of adult winter steelhead caught in Schooner Creek Trap in the Siletz Basin. Out of basin marks refer to hatchery fish that have a fin clip not applied to fish released into the Siletz Basin (e.g. Ad clip only)...............37
Table 34. Release numbers, FW harvest estimates, and hatchery returns for Alsea stock winter steelhead released in Big Elk River. Spawning grounds are not surveyed, so there is no data on stray rates.....................................................38
Table 35. Release numbers, FW harvest estimates, and hatchery returns for Alsea stock winter steelhead released in the Alsea River. There is limited information on stray rates from trap data (see Table 36) and no information on the number of hatchery fish on spawning grounds.....................................39
Table 36. Numbers of adult winter steelhead caught in traps in the Alsea Basin. Out of basin marks refer to hatchery fish that have a fin clip not applied to fish released at Alsea Hatchery (e.g. Ad clip only). .........................................39
Table 37. Release numbers, FW harvest estimates, and hatchery returns for South Umpqua stock winter steelhead. Spawning grounds are not surveyed, so there is no data on stray rates. .........................................................................41
Table 38. Release numbers, FW harvest estimates, and hatchery returns for Ten Mile stock winter steelhead. Spawning grounds are not surveyed, so there is no data on stray rates. .......................................................................................42
Table 39. Release numbers, FW harvest estimates, and hatchery returns for Coos stock winter steelhead. Spawning grounds are not surveyed, so there is no data on stray rates. ............................................................................................43
Table 40. Release numbers, FW harvest estimates, and hatchery returns for Coquille stock winter steelhead. Spawning grounds are not surveyed, so there is no data on stray rates. .........................................................................44
Table 41. Release numbers, FW harvest estimates, and hatchery returns for Chetco stock winter steelhead. Spawning grounds are not surveyed, so there is no data on stray rates. ............................................................................................45
Table 42. Release numbers, FW harvest estimates, and hatchery returns for Nestucca stock summer steelhead. Spawning grounds are not surveyed, so there is no data on stray rates. .........................................................................46
Table 43. Release numbers, FW harvest estimates, and hatchery returns for Siletz stock summer steelhead. Spawning grounds are not surveyed, so there is little data on stray rates. ...................................................................................47
Table 44. Release numbers, FW harvest estimates, and hatchery returns for Umpqua stock summer steelhead. Spawning grounds are not surveyed, so there is no data on stray rates. .........................................................................48
Table 45. Average value per salmon or steelhead caught in sport fisheries. ............54

257 December 14, 2010 HB 3489 Report
Table 46. Average value per trout caught in sport fisheries. .....................................55
Table 47. Parameters for Economic Models - Salmon and Steelhead. ......................55
Table 48. Steelhead Benefit/Cost Model......................................................................57
Table 49. Spring Chinook Evaluation Model ..............................................................59
Table 50. Fall Chinook Evaluation Model...................................................................60
Table 51. Coho Evaluation Model................................................................................62
Table 52. Trout Evaluation Model...............................................................................63
Table 53. Alsea Hatchery Cost-Benefit Model ............................................................64
Table 54. Bandon Hatchery Cost-Benefit Model. .......................................................65
Table 55. Butte Falls Hatchery Cost-Benefit Model...................................................66
Table 56. Cedar Creek Hatchery Cost-Benefit Model ................................................67
Table 57. Elk River Hatchery Cost-Benefit Model .....................................................68
Table 58. Nehalem Hatchery Cost-Benefit Model ......................................................69
Table 59. Rock Creek Hatchery Cost-Benefit Model ..................................................70
Table 60. Salmon River Hatchery Cost-Benefit Model...............................................71
Table 61. Trask Hatchery Cost-Benefit Model............................................................72
Table 62. Exploitation rates and survival of coho and Chinook stocks released by ODFW's coastal hatchery facilities. Note: Stocks which release <30,000 smolts, have no hatchery recoveries, or for which there are no freshwater fishery harvest estimates are not included. ...................................................147
Table 63. Sampling rate in freshwater terminal fisheries given a range of release group sizes and survivals. ...............................................................................151
Table 64. Tag group size to ensure sufficient recoveries in a fishery that harvests 1-20% of the total harvest given a survival range of 0.5-2% ............................152
Table 65. Status of pollution abatement ponds at coastal fish hatcheries. .............161
Table 66. NPDES permit violations at coastal hatcheries during the last three years. ................................................................................................................162
Table 67. Rearing facilities at Alsea Hatchery .........................................................182
Table 68. Annual production at Alsea Hatchery.......................................................183

258 December 14, 2010 HB 3489 Report
Table 69. Rearing facilities at Bandon Hatchery......................................................184
Table 70. Annual production at Bandon Hatchery...................................................185
Table 71. Rearing facilities at Butte Falls Hatchery................................................187
Table 72. Rearing facilities at Cedar Creek Hatchery..............................................190
Table 73. Annual production at Cedar Creek Hatchery...........................................191
Table 74. Rearing facilities at Elk River Hatchery...................................................192
Table 75. Annual production at Elk River Hatchery................................................193
Table 76. Rearing facilities at North Nehalem River Hatchery ..............................194
Table 77. Annual production at North Nehalem River Hatchery............................195
Table 78. Rearing facilities at Rock Creek Hatchery ...............................................196
Table 79. Annual production at Rock Creek Hatchery.............................................197
Table 80. Rearing facilities at Salmon River Hatchery............................................198
Table 81. Annual production at Salmon River Hatchery .........................................199
Table 82. Rearing facilities at Trask River Hatchery and satellite facilities..........200
Table 83. Annual production at Trask River Hatchery ............................................201
Table 84. Annual production at Trask Pond .............................................................201
Table 85. Annual production at Tuffy Creek ............................................................201
Table 86. Summary of release and recovery data for ODFW coastal salmon and steelhead programs..........................................................................................227
Table 87. All deferred maintenance items at ODFW coastal hatcheries ................230
Table 88. Deferred maintenance - health and safety items only. ............................244
Table 89. Deferred maintenance - high priority items only .....................................245
Table 90. Proposed modifications and maintenance items ......................................248

259 December 14, 2010 HB 3489 Report
LIST OF FIGURES
No. Title Page No
Figure 1. Approximate distribution of ODFW fall Chinook releases (Data from 2008 Production Planning Schedule)...........................................................................5
Figure 2. Approximate distribution of ODFW spring Chinook salmon releases (Data from 2008 Production Planning schedule)..........................................................5
Figure 3. Approximate distribution of ODFW Coho salmon releases (data from 2008 Production Planning Schedule)...........................................................................6
Figure 4. Comparison of harvest estimates in Salmon River freshwater fisheries based on punch card and CWT data. CWTs are collected during a creel program operated by ODFW under the PST. .................................................139
Figure 5. Comparison of harvest estimates in Elk River freshwater fisheries based on punch card and CWT data. CWTs are collected during a creek program operated by ODFW under the PST. ................................................................139
Figure 6. The precision (PSE) of the estimate of an ER of 10% versus the number of CWTs recovered in the fishery stratum for which the ER is being estimated, at two levels of precision for the estimate of total catch or escapement abundance (PSE(N)) being sampled (0%, or known without error, and 30%), given a 20% sampling rate in the fishery and 100% in the escapement.......144
Figure 7. The precision (PSE) of the estimate of an ER of 10% versus the number of CWTs released at two levels of survival to age 2 (1% and 0.5%), given a 20% sampling rate in the fishery and 100% in the escapement and knowledge of the total catch abundance without error (PSE(N)=0). ...................................145
Figure 8. The precision (PSE) of the estimate of an ER of 10% and 2.5% for a fishery versus the sampling rate in the fishery, given a 100% sampling rate in the escapement, knowledge of the total catch abundance without error (PSE(N)=0), a CWT release group size of 200,000, and a survival from release to age 2 of 1%. ..................................................................................................146
Figure 9. The precision (PSE) of the estimate of ER versus the magnitude of the ER estimate for the case where 100% of the escapement returns to the hatchery that has 100% sampling and the case where 100% goes to the spawning grounds that have a 5% sampling rate. A release size of 200,000 is used with survival to Age-2 of 1% and the fishery sampling rate is 20%. .....................147
Figure 10. Minimum sampling rate for the evaluation of freshwater fishery impacts given an expected exploitation rate (2.5-50% of total recoveries), release group size (30,000-200,000), and survival estimate (0.1-4%). The estimates are based on the probability of recovering 20 tags in the fishery being >80%,

260 December 14, 2010 HB 3489 Report
thus giving a PSE of 30% in instances where the total harvest is known or is estimated with little bias.................................................................................150
Figure 11. Average effluent temperature (oF) measured between 3:00 pm and 5:00 pm for the months ofJuly and August, 2003-2005. ........................................157
Figure 12. Quantity (liters) of formalin and hydrogen peroxide used per pound of fish produced. ...................................................................................................158
Figure 13. Quantity of drugs used (g) used per pound of fish produced..................159
Figure 14. Water outflow from the bottom of the pond. ...........................................160

Senate Bill 545 – Pathogens in Hatcheries Oregon Department of Fish and Wildlife’s
Report to the Legislature
December 1, 2010 The seventy-fifth Oregon legislative assembly directed the Oregon Department of Fish and Wildlife (ODFW) to conduct a study of fish hatcheries for purposes relating to environmental impact and fiscal feasibility of producing trout that are free or almost free of pathogens, and directs ODFW to report findings to the 76th legislative assembly on or before February 1, 2011. The Legislation directed ODFW to do the following: SECTION 1. { + (1) The State Department of Fish and Wildlife shall, utilizing information available on the effective date of this 2009 Act, conduct a study of fish hatcheries and make a report of its findings. The report must: (a) Summarize the environmental impact of producing trout that carry pathogens. (b) Summarize the environmental impact of producing trout that carry pathogens in a hatchery that also produces salmon and other species of fish. (c) Summarize the impact on trout production resulting from the production, in the same hatchery, of salmon that carry pathogens. (d) Summarize the environmental benefits of producing hatchery trout in a pathogen-free environment. (e) Evaluate the risks associated with pathogens carried by trout produced by state-owned hatcheries. (f) Compare the feasibility of producing trout that are free, or almost free, of pathogens at state-owned hatcheries with the feasibility of producing trout that are free, or almost free, of pathogens at Desert Springs Trout Farm. (g) Compare the capacity of state-owned hatcheries to produce trout with the capacity of Desert Springs Trout Farm to produce trout. (h) Assess, with an emphasis on reducing pathogens, the potential costs and benefits of incorporating the Desert Springs Trout Farm into this state's trout production program after considering: (A) Fish health; (B) Environmental impacts; (C) Fish production quality, quantity and flexibility; (D) Fish distribution, holding, redistribution and release; and (E) Anticipated necessary facility modifications and upgrades. (2) The department shall submit the report required by subsection (1) of this section to the interim legislative committees on environment and natural resources in the manner provided in ORS 192.245 on or before February 1, 2010. + }

Draft ODFW SB 545 Report Page 2 12/1/2010
Executive Summary As directed by the Oregon Legislature in Senate Bill 545, ODFW conducted a study on fish pathogens in ODFW trout hatcheries, the cost/benefits of raising in pathogen-free water, and the feasibility of incorporating the Desert Springs Trout Farm (DSTF) into the state’s trout production program. When discussing fish pathogens and their impact on hatchery fish and the waters of the state, it is critical to stress the difference between the presence of a pathogen and the disease state that pathogens may cause. Fish can be reared at hatcheries and be disease-free but not necessarily pathogen-free, as the pathogens originate naturally from the water bodies and environment associated with the hatchery. There are a variety of pathogens that can cause disease in fish that rear in both natural and hatchery environments. The most frequently encountered pathogens are endemic to fish populations in state waters and can be detected at background levels in populations of naturally- produced and hatchery-reared fish. ODFW concludes that the impact of fish pathogens from ODFW hatcheries on recreational fishing opportunities and native fish populations is minimal. Implementation of the protocols in ODFW’s Hatchery Management and Fish Health Management Policies ensures that the transfer of fish pathogens from a hatchery to waters of the state is minimized due to strict fish transfer protocols and monthly fish health examinations prior to transfer or release. Adherence to the Fish Health Management Policy also minimizes the effects of fish disease amplification. ODFW operates a large, complex hatchery system to meet broad public demands and diverse fish management needs, such as sport and commercial harvest enhancement, recovery of ESA-listed species and meeting federal and tribal mitigation obligations. The public expects ODFW hatcheries to be managed using the best available science, provide significant public interfaces and to produce fish for recreational and commercial fisheries. Public expectations include:
• The production of unique stocks of salmon, steelhead and trout statewide, to provide diverse fisheries while maintaining the genetic integrity of hatchery-produced fish;
• ODFW hatcheries trap, hold, and spawn adults to collect eggs from over 87 unique stocks of salmon, steelhead, and trout. The fish culture practice of using unique hatchery stocks is essential to meeting ODFW’s fish management goals.
• ODFW’s hatcheries “meet-and-greet” approximately 1.4 million visitors annually, providing park-like hatcheries for fish viewing, picnics, nature walks, and public education.
In order to compare and contrast the costs and benefits associated with ODFW and commercial hatcheries, we must first understand that the two systems have very different management objectives. ODFW hatcheries are designed and managed to produce of a diversity of species; the result is our hatcheries are less productive in order to meet a diverse set of demands. Commercial hatcheries such as DSTF are managed and designed to maximize productivity and minimizes the diversity of species produced. These inherent differences create somewhat of an “apples and oranges” conundrum in comparing the two types of systems, such as:
• Commercial hatcheries typically allocate all their water resource to maximize production; in contrast, ODFW’s hatcheries typically allocate water for adult trapping, brood stock holding, incubation, and production. Therefore, commercial hatcheries can produce more fish per unit volume of water.

Draft ODFW SB 545 Report Page 3 12/1/2010
• Commercial hatcheries typically rear a single or few species of fish; in contrast, ODFW hatcheries rear multiple species of salmon, steelhead, and trout at the same facility. Single species propagation results in a significant reduction in the amount of segregation required, with commercial hatcheries loading raceways to maximize production. ODFW hatcheries produce a diversity of fish, which reduces their overall productive capacity.
• With a constant source of springwater, commercial hatcheries can produce fish throughout the year, allowing the hatchery to operate near maximum carrying capacity year-round. In contrast, ODFW hatcheries are managed to meet a diversity of production needs that does not maximize production.
• Hatchery design is also a significant factor in comparing pounds of production per cfs (cubic feet/second) from a commercial hatchery and ODFW hatcheries. For example, DSTF has averaged 12,415 pounds of trout/cfs compared to 2,815 pounds/cfs at ODFW hatcheries in recent years.
In these differences lies the “apples and oranges” challenge ODFW faced when developing cost comparisons among the two programs. In addition, rearing trout is not the primary objective at most ODFW hatcheries. ODFW’s salmon and steelhead hatcheries that produce trout are either “valued-added” by producing trout inexpensively (e.g., $0.60/pound at Cole Rivers, $0.75/pound at Irrigon) or are in close proximity to release locations (e.g., Elk River and Bandon). We developed three different methods to assess the cost of producing trout at state hatcheries, with the average cost/pound ranging from $2.88/pound to $3.61/pound. Focusing our cost-comparison with DSTF to the nine ODFW hatcheries that primarily produce resident salmonids (brook trout, Atlantic salmon, brown trout, kokanee, and rainbow trout are > 50% of pounds produced) yielded an average cost of $3.29/pound, with costs ranging from $2.16/pound at Roaring River to $4.78/pound at Wizard Falls. This cost comparison excludes the cost of “park-like” maintenance, public use, and brood stock management at ODFW facilities. These costs are comparable to the average price ($2.96/pound) ODFW paid for rainbow trout purchased from private producers in the 2009-11 biennium. Details of the cost comparisons are found in the body of the report. DSTF has a scarce and valuable commodity; its artesian spring water. DSTF provides high quality legal-sized and trophy-sized trout at similar cost to what it costs ODFW to produce a comparable product. The benefits of producing trout at the DSTF include quality water for starting fry, fingerlings, and legal-sized trout, and the ability to produce trophy-sized trout in 12-16 months. The primary challenges to integrating DSTF into ODFW’s trout program are the distance between Desert Springs and the receiving water bodies and the large number of stocking trips necessary to meet angler demands, especially on holiday weekends. A more feasible approach to incorporating DSTF into ODFW’s trout production program is to use their hatchery to produce large groups of smaller fish (~7 inches) that are transferred to state hatcheries for grow-out and distribution and producing trophy-size fish (> 1 pound) trout in 14-16 months. DSTF costs to produce a pound of fish with profit were quoted at $3.40/pound (DSTF memo, November 10, 2010). Our analysis shows that to incorporate DSTF into ODFW’s trout production program with no new resources would require ODFW to close two medium-sized state hatcheries. Doing this would result in ODFW significantly reducing their capacity to meet the diverse fish management needs of the existing program to simply replace existing trout production. There would be no net gain in production and a loss of program flexibility. After careful consideration, ODFW concludes that without new fiscal resources we would be far better off investing the

Draft ODFW SB 545 Report Page 4 12/1/2010
$400,000/biennium we have allocated to private trout purchases to achieve the approach described above. One where private trout hatcheries serve as a “farm team” to support the early rearing and trophy fish needs of the state’s overall trout program.

Draft ODFW SB 545 Report Page 5 12/1/2010
Background on Fish Pathogens in Hatcheries
The ODFW fish propagation program produces and releases approximately 45 million fish each year. The department operates 32 hatcheries and 20 satellite hatcheries rearing 87 different stocks of salmon, steelhead, char and resident trout (See ODFW Annual Fish Propagation Report, http://www.dfw.state.or.us/fish/hatchery/docs/2009%20Fish%20Propagation%20Annual%20Report.pdf). When discussing pathogens and their impact on hatchery fish and the waters of the state, it is critical to stress the difference between the presence of a pathogen and the disease state that such a pathogen may cause. Fish can be reared at hatcheries and be disease-free but not necessarily pathogen-free, as pathogens originate from the natural environment/water. There are a variety of organisms that can cause disease in fish that rear in both natural and hatchery environments. The most frequently encountered pathogens are endemic to fish populations in state waters and can be detected in populations of naturally produced and hatchery fish. While some pathogens are specific to salmonids, there are many that can also affect non-salmonid species as well. These naturally produced fish populations that, when present in hatchery water supplies, can serve as pathogen sources for hatchery fish.
The management of ODFW fish hatcheries and the health of stocks being raised in them is guided by the principles and rules outlined in the ODFW’s Fish Hatchery Management Policy (http://www.dfw.state.or.us/fish/nfcp/rogue_river/docs/hatchery_mgmt.pdf) and the Fish Health Management Policy (http://www.dfw.state.or.us/fish/hatchery/docs/fish_mgmt_policy.pdf). These policies describe best management practices to ensure the conservation of both naturally produced native fish and hatchery produced fish in Oregon and list measures that minimize the impact of fish diseases on the state’s fish resources through appropriate rearing strategies. The very good fish health status of ODFW hatchery stocks is due to closely following our guiding policies, regular monitoring of fish health and proactive approaches to control problems as they arise.
The ODFW’s fish pathologists routinely conduct fish health examinations of production fish. In 2009 examinations for a variety of pathogens were completed. Exams were performed for parasitic, fungal and bacterial pathogens (1,725 exams comprising 23,489 fish), for viral pathogens (583 exams comprising 11,142 fish), for bacterial kidney disease (143 exams comprising 7,119 fish), for Myxobolus cerebralis (162 exams comprising 3,380 fish). In addition the staff provides fish health evaluations for fish collected from natural environment (129 exams comprising 1,482 fish in 2009). Though there are few incidence of disease that occurred in naturally reared fish populations in the State of Oregon, such events were rapidly investigated and the cause(s) of death determined. Fish pathogens and the diseases they may cause have had considerable impacts through the course of fish propagation in this state and throughout the Northwest. Fish health is regularly monitored in our hatcheries with results of the examinations archived in a fish health database. All spawning stocks of fish are monitored on an annual basis with 100% of some stocks being examined as needed for fish health management reasons. Health of all stocks is also examined before transfer or release. Depending on examination results, Fish Health Services staff provides recommendations to fisheries managers to reduce the impacts that detected pathogens may have on hatchery and naturally reared fish. Strict protocols for the examination, importation and transfer of fish stocks give us the ability to resolve fish health constraints and avoid major threats of pathogen movements, transmission or introductions. In order to respond rapidly to changes or introduction of pathogens that might negatively impact Oregon’s valuable fish populations, continued surveillance of fish health of both hatchery and naturally reared fish populations is essential.

Draft ODFW SB 545 Report Page 6 12/1/2010
Monitoring fish health at ODFW hatcheries and STEP hatcheries requires a great deal of effort. Travel, supplies and regular examination of fish stocks including brood fish examination at spawning are costs associated with the fish health program and must be considered when examining the effort ODFW puts into providing a healthy fish product at release. Our Fish Health Services program has been a leader in the fish health field and is highly regarded by staff in federal, tribal, university, private and other state’s fish health programs. Fish health specialists from other agencies often communicate with our staff to discuss issues of mutual concern and to achieve resolution of fish health problems.
It is very difficult to produce pathogen-free fish, using natural waters containing fish pathogens. Our hatchery and fish health programs strive to achieve this goal but in reality this goal is unattainable as many of our hatcheries have to use open or surface waters where pathogens originate from the naturally reared fish species and transmit to the hatchery population. In addition, some pathogens are transmitted from the female parent through the eggs to the hatching fish and thus are present in the population.
When necessary, therapeutants that prevent loss and reduce the amplification of pathogens in fish stocks are used as per Food and Drug Administration (FDA) labels and guidelines of regulatory agencies. Strategies to control pathogens without the use of drugs or chemicals include use of pathogen-free water in early rearing when fish are usually most susceptible to pathogens, or where available, for the entire rearing period, culling of eggs from infected parents, and vaccinations. Formalin (Parasite-S) or hydrogen peroxide is used as needed under strict FDA labels and Oregon DEQ regulations to control parasites or external fungi. During the labeling process, the FDA examined impacts of formalin and hydrogen peroxide treated water on receiving streams prior to its approval for use in fish. Managing infectious diseases in fish populations is dependent on the type of pathogen, the fish species affected, environmental conditions (water temperature, water quality) and available therapeutants that are approved for the situation. This may be further complicated by species sensitivity and life stages of fish to chemicals or constraints placed on the use of the therapeutants by label instructions (such as dilution requirements for effluents for safe disposal) or specific DEQ guidelines. In the case of adult fish, it may be necessary to inject them with antibiotics to keep them alive for spawning and antibiotics may be fed to juvenile fish undergoing bacterial epidemia. The best way to control fish pathogens is to avoid them. Unfortunately, this is not easily achieved, as the availability of “pathogen-free” water is limited. Improved fish culture techniques such as reducing fish densities, flushing ponds, reducing handling events and stress, culling eggs from infected parents and vaccination against specific pathogens are all methods of controlling pathogens that do not require chemicals and are currently practiced at ODFW’s fish hatcheries. These operations require a great deal of staff time, supplies and effort but these costs are easily offset by the reduction in fish loss and chemical use normally associated with these pathogens. It is of utmost importance that fish examinations continue at current levels at our hatcheries and in natural waters to ensure that all fish resources in the waters of the state are protected from introduction or inadvertent transmission of native or introduced pathogenic organisms.

Draft ODFW SB 545 Report Page 7 12/1/2010
The remainder of this report directly addressed the questions put forth in SB 545.
SECTION 1. (1) The State Department of Fish and Wildlife shall, utilizing information
available on the effective date of this 2009 Act, conduct a study of fish hatcheries and make
a report of its findings. The report must:
(a) Summarize the environmental impact of producing trout that carry pathogens.
Response (a). To quantify the environmental impacts of producing trout is difficult, as both hatchery- and naturally-produced fish are usually infected with naturally occurring pathogens. The following bullets briefly summarize the source of pathogens and possible environmental impacts of producing trout that carry pathogens:
• Fish and fish pathogens have co-evolved for tens of thousands of years even without the existence of any hatchery activities
• The natural environment is the source of pathogens and both hatchery and wild populations may be infected with naturally occurring pathogens, therefore, it is difficult to produce pathogen-free fish using surface waters that carry fish pathogens
• Fish that harbor pathogens are not necessarily in a diseased state and may not affect the environment or other populations
• Research findings suggest that naturally produced fish in natural environments also harbor fish pathogens (see Table 1)
• Hatchery produced fish typically have fewer fish pathogens at release due to preventive measures, treatments, and fish culture practices which minimize the adverse environmental impacts
• Hatchery produced fish have a higher likelihood to amplify a fish pathogen once infected, probably due to stress in hatchery environment (water quality and rearing density of cultured fish)
• Pathogens that cause diseases may exert a higher mortality rate in the hatchery environment than in natural environment possibly due to stress and proximity of fish to one another in rearing containers. Nevertheless, high loss events may also occur in naturally reared populations of fish as well, without any hatchery influence.
• Pathogenic effect is density dependent; and since wild fish rear at very low density pathogenic impacts of hatchery produced trout on wild fish is negligible to none
• Fish reared in surface water will have the same pathogens ubiquitous to the watershed and no new strains of pathogens are created or generated due to trout production
• Hatchery reared and released fish shall expose the receiving environment to their pathogens, but most of the pathogens do not survive without the host fish, and therefore, release of pathogens to the environment does not necessarily equate with transmission. In order to survive and proliferate, the pathogens must come in contact with another host of low resistance/immunity within a finite amount of time at favorable environmental condition.

Draft ODFW SB 545 Report Page 8 12/1/2010
Table 1. Fish pathogens detected in wild fish collected from various Oregon watersheds, 1992-2007. Watershed Parasites Virus Bacteria Deschutes Long Tom Crooked R.
Trematodes, Chloromyxum sp. Gyrodactylus, Nematodes, Myxobolus spp., Copepods, eye fluke, Dactylogyrus, Cestode plerocercoids, Neascus, Sanguinicola, Nanophyetus, Capillaria, Ichthyophthirius, Protrocephalus (tapeworm), Diplostomulum, Trichodinella
Flavobacterium columnare (Columnaris), Flavobacterium spp. Renibacterium salmoninarum (BKD) A. hydrophilic
Klamath Trichodinella, Trichophrya, Trematodes, , Proteocephalus plerocercoid, Chloromyxum, Gyrodactylus, Nematode, Myxobolus spp., Copepods, Diplostomulum spathaceum (eye fluke) Dactylogyrus, Cestode, Neascus (black spot), Henneguya, Sanguinicola, Nanophyetus, Capillaria
Infectious Hemato-poietic Necrosis (IHN)
Columnaris, Flavobacterium spp., BKD, Aeromonads and Pseudomonads, Furunculosis, Flavobacteria(bacterial gill) Aeromonas hydrophila
Umpqua Ichthyophthirius multifiliis Columnaris Rogue Ichthyophthirius multifiliis, Gyrodactylus,
Dactylogyrus, Trichodinella,Trichodina, Scyphidia, Myxobolus spp.
BKD
McKenzie Metazoans, Trematodes, copepods, Diphilobothrium, cestodes, eye fluke, Nanophyetus, Myxobolus spp., plerocercoid, Capillaria
BKD, Columnaris
Santiam Metazoans, Trematodes, copepods, hookworms, Henneguya, Dactylogyrus, Nanophyetus, Myxobolus spp., plerocercoid, Capillaria, Trichodinella, Trichodina, Nematode
BKD
Willamette Cestode, Chloromyxum, Trichophrya, trematode, Nematode, Dactylogyrus, eye fluke, tapeworm, Myxobolus spp., Crepidostomum, glochidia
BKD, Columnaris
Coquille Trematodes, Dactylogyrus, Myxobolus spp., Lerneae, Nanophyetus
John Day Myxobolus spp., black spot, Ichthyophthirius, tapeworm, Diplostomulum, Nematode, Trichodinella, Nanophyetus, Gyrodactylus
Columnaris, BKD, Flavobacterium spp. Aeromonads, Pseudomonas, Furunculosis, bacterial gill A. hydrophila, Yersinia ruckeri (enteric redmouth)
Nehalem Trichodinella, Gyrodactylus, Trichodina, Trematodes, Myxobolus spp.,
BKD
Misc. Ocean Tributaries
Trichodinella, Gyrodactylus, Trichodina, Glugea, Dactylogyrus, Cestodes, Nematodes, Crepidostomum, Loma, Capillaria, Trematodes, Ichthyophthirius, Nanophyetus
Siletz Trichodinids, Trichodinella, Crepidostomum, Trematodes,
BKD, Columnaris

Draft ODFW SB 545 Report Page 9 12/1/2010
Gyrodactylus, Dactylogyrus, tapeworms, Henneguya, Chilodonella, Ichthyobodo (Costia), Myxobolus spp., Ichthyophthirius, Chloromyxum
Siuslaw Myxidium, Glochidia, Trichodina, Trematode, blackspot, Crepidostomum, Nanophyetus,
Columnaris, BKD, Aeromonads, Pseudomonas
Yaquina Myxobolus spp., Dactylogyrus, Trichophrya, trematodes, eye fluke, tapeworm
Umatilla River
Myxobolus spp. spores, Neascus (black spot), Trichodina, Gyrodactylus, strigeid trematodes, Nematode (threadworm)
BKD, Columnaris, APS,
Walla Walla Aeromonas salmonicida, P. fluorescens, APS, All juvenile BKD ELISA values ≤ 0.229 OD units.
Imnaha Myxobolus cerebralis, Ceratomyxa shasta APS, BKD, Aeromonas salmonicida, Yersinia ruckeri
Grande Ronde
Myxobolus cerebralis, Trichodina, Epistylis, Ambiphrya, Gyrodactylus, Trematodes, Nematodes (threadworm), Dermocystidium sp., Neascus (black spot), Cestode, Crepidostomum, gill copepods, Ceratomyxa shasta, Myxidium sporoblasts, Hexamita
IHNV Aeromonas salmonicida, BKD, APS, Yersinia ruckeri
Powder Trichophyra, Epistylis, Apiosoma, Cestodes (Proteocephalus sp.), Myxbobulus spp. Spores, Nematodes, trematodes, Crepidostomum, Gyrodactylidae, Hexamiata, Myxidium sporoblasts,
Columnaris, APS, elevated Rs antigen by ELISA (up to 0.981 OD units) but not confirmed BKD.
Burnt Nematode, Cestode, Crepidostomum, Epistylis, Apiosoma, Hexamita
Some elevated Rs antigen by ELISA (up to 0.302 OD units) but not confirmed BKD.
(b) Summarize the environmental impact of producing trout that carry pathogens in a
hatchery that also produces salmon and other species of fish.
Response (b). The environmental impact is not well understood, but expected to be low. A concern is expressed that hatchery effluents (waste may imply release of fecal and other materials) contain pathogens that may infect naturally reared fish downstream of the facility. Though the effluents do contain some level of organisms released from fish, there has never been an outbreak of disease below any ODFW hatcheries. No loss or detectable effect has ever been documented in natural fish below hatcheries undergoing viral, bacterial or parasitic outbreaks. Papers published in journals address the risk of pathogen transmission by its ability to multiply and remain viable in water, how long it can survive without a host and more importantly, the number of organisms required to cause infection (Stephen and Iwama 2000, LaPatra et al. 2001). In cases where this has been studied, pathogens rapidly decrease in numbers outside the host and thus reduce the possibility of transmission to other hosts.

Draft ODFW SB 545 Report Page 10 12/1/2010
A valid concern has been demonstrated with Myxobolus cerebralis. Fish in a private hatchery were positive for the parasites which resulted in positive finding of spores in tubiflex (spp.) worm, an intermediate host, downstream of the facility. Follow up sampling showed no evidence of Myxobolus cerebralis downstream after fish were removed from the facility.
Another point of contention is that naturally reared fish are exposed to pathogens and possible infection by coming into contact or through co-habitation with released hatchery fish. During recent examinations of hatchery rainbow in Prineville Reservoir, gill amoeba was detected in the fish. Some of these fish drop below the reservoir into the Crooked River. Examination of some of this hatchery released population and native redband rainbow resulted in finding gill amoeba in the hatchery fish but none in the native rainbow in spite of the native fish residing below the reservoir and cohabitating with the infected hatchery rainbow. Scientific studies dealing with IHN virus have shown that even when fish are released during a viral epizootic and tracked downriver no virus was detected in naturally reared fish even though the hatchery fish continue to be a carrier (Foote et al. 2000). Infection due to exposure to a pathogen is dependent on various factors including the health status of the host, the number of pathogens and their ability to infect fish and the environmental conditions that affect both the host and the pathogen (LaPatra 2003). Speculation is made that once a fish, whether from a hatchery or a natural environment, is exposed to a pathogen it becomes a carrier, sometimes life long and that, in the case of anadromous fish, can then expose and infect fish during both its ocean and return migrations with the pathogen. Multiple studies, including one by ODFW at Elk River Hatchery, have never been able to detect the presence of IHN virus in fish released after epizootics in their smolt stage and later as returning adults. Some pathogens such as the causative agents of Bacterial Coldwater Disease (CWD) and Bacterial Kidney Disease (BKD) are known to be transferred from the female through the egg (vertical transmission) but in most cases the fry and juveniles do not become infected and if infected, not diseased. The ongoing BKD culling programs in several salmon stocks in Oregon have reduced the incidence and severity of this pathogen and have also reduced antibiotic usage for its control. Spring Chinook populations in the Grande Ronde basin (NE Oregon) have been supplemented with progeny of BKD positive smolts. Hoffnagle et al. (2009) reported that supplementing these streams has not increased the prevalence of BKD in the native stocks. Preliminary research indicates that a similar program may someday become feasible for achieving some control of CWD. ODFW will continue to evaluate the influence of hatchery operation on the incidence of pathogen in receiving waters.
(c) Summarize the impact on trout production resulting from the production, in the same
hatchery, of salmon that carry pathogens.
Response (c). The impact on trout production in hatcheries that produce both trout and salmon is minimal with good Fish Culture practices. Good Fish Culture practices segregate salmon and trout with each species reared with their own inflowing water source to prevent water to water contact between fish species. Some pathogens can be detected in both salmon and trout species, such as IHN, but the pathogen may be more “virulent” in one species. The result is that one species can exhibit mortality (disease) while the other species remains healthy. Not all pathogens are present in both salmon and trout species. For example, Gyrodactylus is primarily a parasite of trout whereas BKD is primarily a pathogen of salmon

Draft ODFW SB 545 Report Page 11 12/1/2010
(d) Summarize the environmental benefits of producing hatchery trout in a pathogen-free
environment.
Response (d). The primary environmental benefits of rearing trout in a “pathogen-free” environment are:
• Increased flexibility on transfers and release locations • Reduced risk of transfer of “exotic” pathogens into new water bodies, • Reduced amplification of fish pathogens in the hatchery environment even at high rearing
density in a raceway, • Minimal use of drugs and chemicals to treat fish, and • Higher mean fish survival rates to release.
Note: the term “pathogen-free” is often applied to hatcheries using spring or well water. These water sources may have extremely low or non-detectable fish pathogens, but rarely are they pathogen-free of environmental bacteria. The benefit of hatcheries on these water sources is that they are at low risk for fish pathogen exposure, but pathogens can easily enter a facility through parent stocks. The agents of BKD and CWD, and IHN virus can be transferred via the egg (IHNV transfer has been implicated in a few instances but never scientifically confirmed). The parasites, such as trematodes, cestodes, nematodes and many of the external parasites and bacteria and virus can be transferred via birds and small mammals because of their random predation in different ponds.
(e) Evaluate the risks associated with pathogens carried by trout produced by state-owned hatcheries. Response (e). The risk of fish pathogens transferred by hatchery trout to fish in the same or other watersheds is low due to strict, careful and intensely managed transfer protocols between hatcheries and watersheds, along with regular fish health testing prior to transfer or release. Adherence to the Fish Health Management Policy has minimized the effects of fish disease amplification. Hatcheries--Trout brood stock or eggs are produced at hatcheries with “pathogen-free” (Class A-1) or low fish pathogen water sources (Class A-2). Fish or eggs may be produced at Class A-1 and Class A-2 hatcheries and transferred to ground water source hatcheries (Class B) for grow-out and local distribution. The pathogens the trout encounter at the hatchery are ubiquitous to the watershed; therefore, reducing or eliminating the risk of transferring new pathogens to the environment below the hatchery. For example, eggs are hatched at Irrigon Hatchery (Class A-1) where fry are reared to fingerlings (10fpp or ~6.5 inches) and transferred to Wallowa Hatchery (Class B) for grow-out and local distribution. Table 2. ODFW trout production hatchery classifications
Class A-1 Wizard Falls Irrigon Klamath Oak Springs Class A-2 Cole Rivers Roaring River Willamette Fall River
Alsea Bandon Butte Falls Elk River Leaburg Class B Nehalem Salmon River So. Santiam Rock Creek Wallowa Note: Hatcheries with multiple water sources may have multiple classifications; however, hatcheries were classified based on final rearing status. Fish pathogen examinations --The fish health staff conducts examinations of production fish (2,613 total examinations in 2009) and provides fish health evaluations for fish collected from natural areas (1,482 fish in 2009). Disease outbreaks that occur in naturally reared fish

Draft ODFW SB 545 Report Page 12 12/1/2010
populations are rapidly investigated and the cause(s) of death determined. Disease outbreaks in naturally reared fish are rarely detected, especially in events where low numbers of fish are diseased and die. In these situations, predators and scavengers remove the affected fish before the loss can be detected. Fish pathogens and the diseases they may cause have had considerable impacts through the course of fish propagation in this state and throughout the Northwest. Fish health information with results of examinations generated from regular monitoring at our hatcheries is archived in a fish health database. All spawning stocks of fish are monitored on an annual basis with 100% of some stocks being examined as needed for fish health management reasons. All stocks are also examined before transfer or release. Depending on examination results Fish Health Service staffs provide recommendations to fisheries managers to reduce the impacts that detected pathogens may have on hatchery and naturally reared fish. Strict guidelines for the examination, importation and transfer of fish stocks give us the ability to resolve fish health constraints and avoid major threats of pathogen movements or introductions. In order to respond rapidly to changes or introduction of pathogens that might negatively impact Oregon’s valuable fish populations, continual surveillance of hatchery and naturally reared fish populations is essential. (f) Compare the feasibility of producing trout that are free, or almost free, of pathogens at
state-owned hatcheries with the feasibility of producing trout that are free, or almost free,
of pathogens at Desert Springs Trout Farm.
Response (f). State hatcheries produce multiple species. The primary purpose of many hatcheries is to produce Chinook, steelhead or coho with secondary purposes of STEP or trout programs. Raceway space and water is managed to rear and scatter plant trout in local water bodies without affecting salmon/steelhead programs. Trout are value added to many of these hatchery programs, and the cost of these programs is difficult to calculate as a percentage of pounds of production. Comparing Desert Springs Trout Farm to comparable state-operated hatcheries is difficult since Desert Springs produces rainbow trout while state-operated hatcheries produce multiple species and life stages (i.e., fingerling trout for air stocking; domestic and local populations). In addition, state-operated hatcheries have public benefits other than fish production. ODFW provides the following information on a cost comparison between privately owned commercial trout hatcheries and ODFW-operated trout hatcheries:
1. The scope of the discussion focuses the comparison exclusively on the costs of producing trout.
ODFW hatcheries are multiple-use hatcheries which provide three primary benefits:
• The production of fish (salmon, steelhead, and trout) that provide for recreational fisheries while minimizing adverse genetic and ecological impacts to naturally-produced wild fish populations; and
• The collection of eggs from unique stocks/populations of salmon, steelhead and trout statewide, to provide for diverse fisheries while maintaining the genetic quality of hatchery-produced fish; and
• Provide significant information and education opportunities to the public.
Instead of using past approaches of “lumping” all hatchery costs into the cost of producing a pound of fish, the cost of hatchery operations was partitioned so we could quantify the true costs of producing hatchery trout at ODFW hatcheries. The actual cost of producing a pound of trout can only be determined after accounting for the cost of public outreach activities and the cost of

Draft ODFW SB 545 Report Page 13 12/1/2010
fish trapping, holding, and spawning of unique stocks or populations to meet ODFW’s diverse fish management objectives. The primary goals of these specific programs or activities are not intended to produce large quantities of fish at minimal cost and at profit, like a commercial hatchery would. Neither of these activities has “pounds” of production associated with them, but is vitally important to the success of ODFW’s hatchery program, by minimizing adverse impacts of hatchery programs on wild fish, helping conserve and restoring wild populations, while providing diverse recreational benefits to Oregonians. For example:
• ODFW’s hatcheries “meet-and-greet” approximately 1.4 million visitors annually, providing park-like hatcheries for fish viewing, picnics, nature walks, and public education among other outdoor activities.
• ODFW’s hatcheries trap, hold, and spawn adults to collect eggs from over 150 unique populations of fish. The fish culture practice of using a unique hatchery stocks is essential to meeting ODFW’s fish management goals. Providing eggs for these programs as well as for outreach and fish restoration activities through programs such as STEP accrue costs which should not be tied to producing a pound of trout.
2. The following elements reflect our evaluation of how to partition the costs associated with ODFW’s hatchery operations budget:
• Facility maintenance for public benefits: To maintain a hatchery for public use, we routinely staff them with a minimum of one Fish and Wildlife Technician. This cost is accrued when the facility is fully operational or is in “moth ball” status. The total cost is conservatively estimated using the salary of a FW Technician at Step-2 (with benefits) at $3,880/month ($93,120/biennium). Note: This cost was not subtracted from all federally- funded hatcheries where the primary purpose of the facility is the production of salmon and steelhead.
• Broodstock Management: These costs are estimated based on the number of months needed to complete adult trapping, number of trapping sites, spawning activities, and duration of egg incubation in support of ODFW’s diverse broodstock management program. The cost included the salary of a FW Tech at Step-2 (with benefits) or $3,880/month. Months of service were multiplied by 1.25 to cover staff‘s services required during weekends and while on-call. For Roaring River Hatchery, months were multiplied by 1.5 to cover the staff required for the high volume of eggs produced (>15 million/biennium). For example, a program with 2 months of trapping, 1 month of spawning, and 3 months of incubation would cost 6 x 1.25 = 7.5 months. Estimated cost would equal 7.5 months x $3,880 = $29,100 for egg production.
• Fish Production: Trout production costs were estimated based on the percent of total pounds of fish produced at each facility that were trout. Marking costs for anadromous fish production are not included as they are unrelated to trout production.
• Using this approach, the state’s cost to produce and stock trout was estimated at $2.88/pound in the 2007-09 biennium (Table 3).

Draft ODFW SB 545 Report Page 14 12/1/2010
Table 3. ODFW’s hatchery budgets, maintenance costs, and costs for adult collection, egg production, total trout production, and cost per pound of trout production (2007-09). Hatchery Total budget
spent Facility Maintenance
Brood Eggs costs
Cost/ 1,000 eggs
Production Cost
Trout Costs
Trout lbs.
Cost/ Pound
Alsea $766,341 $93,120 87,300 $136 $585,921 $423,996 191,525 $2.26 Bandon $511,092 $93,120 $213,400 $31 $204,572 $24,344 7,282 $3.34 Butte Falls $224,761 $93,120 $0 $0 $131,641 $131,641 37,201 $3.54 Cole Rivers $167,492 $0 $0 $0 $167,492 $167,492 277,365 $0.60 Elk River $740,678 $93,120 $116,400 $44 $589,358 $52,453 9,437 $5.56 Fall River $572,434 $93,120 $116,400 $41 $362,914 $362,914 103,225 $3.52 Irrigon $83,248 $0 $0 $0 $83,248 $83,248 110,926 $0.75 Klamath $658,472 $93,120 $15,520 $97 $549,832 $549,832 130,816 $4.20 **Leaburg $1,531,842 $93,100 $0 $0 $1,438,742 $863,245 187,194 $2.92 **Willamette $1,873,554 $93,100 $58,200 $7 $1,722,254 $585,566 309,203 $2.92 Nehalem $750,984 $93,120 $97,000 $88 $560,864 $286,041 74,958 $3.82 Oak Springs $849,382 $93,120 $116,400 $19 $639,862 $639,862 233,930 $2.74 Roaring River $744,703 $93,120 $139,680 $8 $511,903 $342,975 158,730 $2.16 Rock Creek $960,429 $93,120 $252,200 $71 $615,109 $128,558 60,235 $2.13 Salmon River $546,789 $93,120 $31,040 $59 $422,626 $122,562 30,143 $4.07 South Santiam $4,249 $0 $0 $0 $4,249 $4,249 1,500 $2.42 Wizard Falls $687,612 $93,120 $120,280 $48 $474,212 $474,212 108,309 $4.78 Wallowa $49,213 $0 $0 $0 $49,213 $49,213 13,064 $3.76 Transportation (NE, NW, SW, HD)
$948,444 $474,222
Fish Health $125,000 $5,891,625 2,045,043 $2.88 **Leaburg and Willamette hatcheries have shared responsibility for trout production and the cost was averaged.
An alternative approach to estimating ODFW’s cost to produce trout is to simply use total hatchery cost over pounds of production, resulting in an average cost of $3.61 per pound (Table 4). However, this approach is not a very useful tool in estimating realistic costs for trout production and minimizes the benefits of the diverse programs ODFW implements, such as STEP programs, large-scale fry and fingerling programs, along with the significant public use of state hatcheries. For example, Bandon Hatchery is an anadromous salmon hatchery. Its primary purpose is to collect salmon and steelhead adults, incubate eggs, transfer eggs or fry to STEP hatcheries, and release smolts for anadromous production; trout are a secondary task. The benefit of utilizing Bandon for a put-and-take trout program is a reduction in transportation costs and added flexibility to release dates for local water bodies. Pragmatism is lost in the simple cost/pound approach.

Draft ODFW SB 545 Report Page 15 12/1/2010
Table 4. Oregon hatchery costs for trout production in 2007-09 biennium. Hatchery Trout lbs.
2007-09 biennium
Total budget spent
Proportion trout production
Cost/lb. trout
comments
Alsea 191,525 $766,341 $567,092 $2.98
Bandon 7,282 $511,092 $61,331 $8.10
Butte Falls 37,201 $224,761 $224,761 $6.04
Cole Rivers 277,365 $167,492 $167,492 $0.60 3.6M Federal contract
Elk River 9,437 $740,678 $66,661 $7.06
Fall River 103,225 $572,434 $572,434 $5.55 Irrigon 110,926 $83,248 $83,248 $0.75 1.8M Federal contract
Klamath 130,816 $658,472 $658,472 $5.03 *Leaburg 187,194 $1,531,842 $919,105 $4.91 Federal contract
*Willamette 309,203 $1,873,554 $637,008 $2.06 2.6M Federal contract
Nehalem 74,958 $750,984 $383,002 $5.15
Oak Springs 233,930 $849,382 $849,382 $3.63 Roaring River 158,730 $744,703 $498,951 $3.14 Rock Creek 60,235 $960,429 $201,690 $3.34
Salmon River 30,143 $546,789 $158,569 $5.34
South Santiam 1,500 $4,249 $4,249 $2.42 1.4M Federal contract
Wizard Falls 108,309 $687,612 $687,612 $6.35 Wallowa 13,064 $49,213 $49,213 $3.76 0.94M Federal contract
Fish Transportation (NE, NW, SW, HD
$948,444 $474,222 ~half the budget is allocated to trout
Fish Health $125,000
2,045,043 $7,389,494 $3.61 *Note: Leaburg has funded Willamette hatchery to produce rainbow trout. It is reasonable to combine expense to estimate the cost per pound ($3.13). To further refine our analysis of ODFW’s cost to produce trout is to focus the analysis on the state hatcheries whose primary purpose is trout production. ODFW has nine hatcheries that produce primarily resident salmonids or trout, producing 75% of the trout (pounds) in the state system. We reported the total hatchery budget or dollars spent from hatcheries in the 2007-09 biennium (Table 5). Trout or resident salmonid production was determined as the percent of total pounds of fish produced. For federal funded programs, the direct spending was used. The state’s cost to produce and stock trout was estimated at $3.29/pound in 2007-09 biennium. This compares to the average contract price cost of ~$2.96 from private producers (Table 8). DSTF reported their cost to produce a pound of trout with profit at $3.40 (November 10, 2010 memo).

Draft ODFW SB 545 Report Page 16 12/1/2010
Table 5. Nine ODFW’s trout hatchery budgets, maintenance costs, and costs for adult collection, egg production, total trout production, and cost per pound of trout production (2007-09). Hatchery Total budget
spent Facility Maintenance
Brood Eggs costs
Cost/ 1,000 eggs
Production Cost
Trout Costs
Trout lbs.
Cost/ Pound
Alsea $766,341 $93,120 87,300 $136 $585,921 $423,996 191,525 $2.26 Fall River $572,434 $93,120 $116,400 $41 $362,914 $362,914 103,225 $3.52 Klamath $658,472 $93,120 $15,520 $97 $549,832 $549,832 130,816 $4.20 *Leaburg $1,531,842 $93,100 $0 $0 $1,438,742 $863,245 187,194 $2.92 *Willamette $1,873,554 $93,100 $58,200 $7 $1,722,254 $585,566 309,203 $2.92 N. Nehalem $750,984 $93,120 $97,000 $88 $560,864 $286,041 74,958 $3.82 Oak Springs $849,382 $93,120 $116,400 $19 $639,862 $639,862 233,930 $2.74 Roaring River $744,703 $93,120 $139,680 $8 $511,903 $342,975 158,730 $2.16 Wizard Falls $687,612 $93,120 $120,280 $48 $474,212 $474,212 108,309 $4.78 Transportation (NE, NW, SW, HD)
$948,444 $267,111
Fish Health $125,000 $4,920,754 1,497,890 $3.29
*Leaburg and Willamette hatcheries have shared responsibility for trout production and the cost was averaged. Transportation was estimated at 25% of the total fish liberation budget
3. The following analysis describes ODFW cost of purchasing commercial trout reared in private hatcheries during the 2009-11 biennium. As of November 1, 2010, ODFW had purchased of a total of 297,630 trout from private hatcheries for release into Oregon water bodies during 2009-11. The total weight of the fish purchased was approximately 130,000 pounds and would cost approximately $2.96/pound, including profit (Table 6). Table 6. Summary of the number of fish contracted for in 2009-11 releases from private hatcheries and cost per pound of trout purchase. Number Size (fish
per pound) Weight Total cost Cost per
pound Fingerling 50,000 15.00 3,334 $19,237 5.77 Legal-size 205,550 2.42 84,912 $253,725 2.99 Trophy-size 42,080 0.99 42,555 $114,269 2.69 Totals 297,630 2.28 130,801 $387,230 2.96 Note: Fingerling size is approximately 4 – 6 inches, legal size is 9 – 12 inches, and trophy ~1 pound or larger 4. Using three different analytical methods, ODFW concluded that the cost to produce trout at state hatcheries was similar to the cost of purchasing trout from private hatcheries. (g) Compare the capacity of state-owned hatcheries to produce trout with the capacity of
Desert Springs Trout Farm to produce trout.
Response (g) Production capacities of commercial hatcheries such as Desert Springs are difficult to compare to ODFW production hatcheries:

Draft ODFW SB 545 Report Page 17 12/1/2010
1. Commercial hatcheries typically allocate all their water resource to production; in contrast, ODFW hatcheries typically allocate water resource for brood stock holding, incubation, and production. Therefore, commercial hatcheries can produce more fish on a given unit of water.
2. Commercial hatcheries typically rear a single or few species of fish. In contrast, ODFW hatcheries rear multiple species of salmon, steelhead, and trout. Result is a significant reduction in amount of segregation required in commercial operations and raceways can be loaded to maximum capacities. ODFW hatcheries produce fish for management objectives that may result in production below raceway capacity. For example, each raceway can rear 50,000 fish, but the management goal is 170,000 smolts. Therefore, four raceways are required but fish are reared at 85% of capacity.
3. Commercial hatcheries can produce fish throughout the year. This allows the facility to operate near maximum carrying capacity using all the available water year around. Commercial models result in production of nearly 35,000 pounds of fish per cfs of inflowing water (59oF). ODFW production is based on needs; for example, maintain genetic quality of fish for better survival, adaptation, minimum interactions, and restoration of the evolutionary significant populations which are either threatened or endangered or extirpated from their native habitats. For example, Irrigon Hatchery steelhead smolts are reared for a single release (single crop) in the spring at a size that maximizes survival of smolts after release to return as adults. Therefore, Irrigon only operates near maximum carrying capacity for a few months of the year not utilizing all the available water for the majority of the year. These activities or productions can’t be compared to any commercial hatchery hatcheries and productions. Also, state-owned hatcheries have to maintain optimum growth curve of fish that are similar to natural production with regard to fish size and time of release to facilitate their easy out-migration.
4. Hatchery design is a significant factor in comparing pounds of production per cfs from Desert Springs and Oregon hatcheries. Oregon hatcheries were designed with the objective of rearing multiple species and segregation of fish. The design is single use or double pass of inflowing water. The majority of containers (raceways and ponds) were constructed parallel to each other. The benefits to this design allows for separate inflowing water to each raceway, ability to segregate and isolate species and stocks from each other, minimize the risks of horizontal transmission of disease agents, and rear fish with higher water quality (lower NH3, C02, etc.) and effluent discharge complies with the Oregon water quality standards. In contrast, commercial hatcheries are designed with multiple pass of inflowing water, where, containers are constructed in series below each other to maximize the use of available oxygen from inflowing water and discharge effluents with low dissolved oxygen, higher CO2 and NH3 which will adversely affect the receiving stream and its biota. The benefits to this design are increased production per cfs inflowing water and lower construction costs. The drawbacks are less flexibility in the segregation, number of rearing stocks and species, fish in upstream raceways spread pathogens to fish rearing down stream, poor water quality at the outflow, and less program flexibility.
Desert Springs has averaged 178,774 pounds of production from 2005 through 2009 (Table 7). Their water right is 14.4 cfs, which equates to 12,415 pounds of fish per cfs.
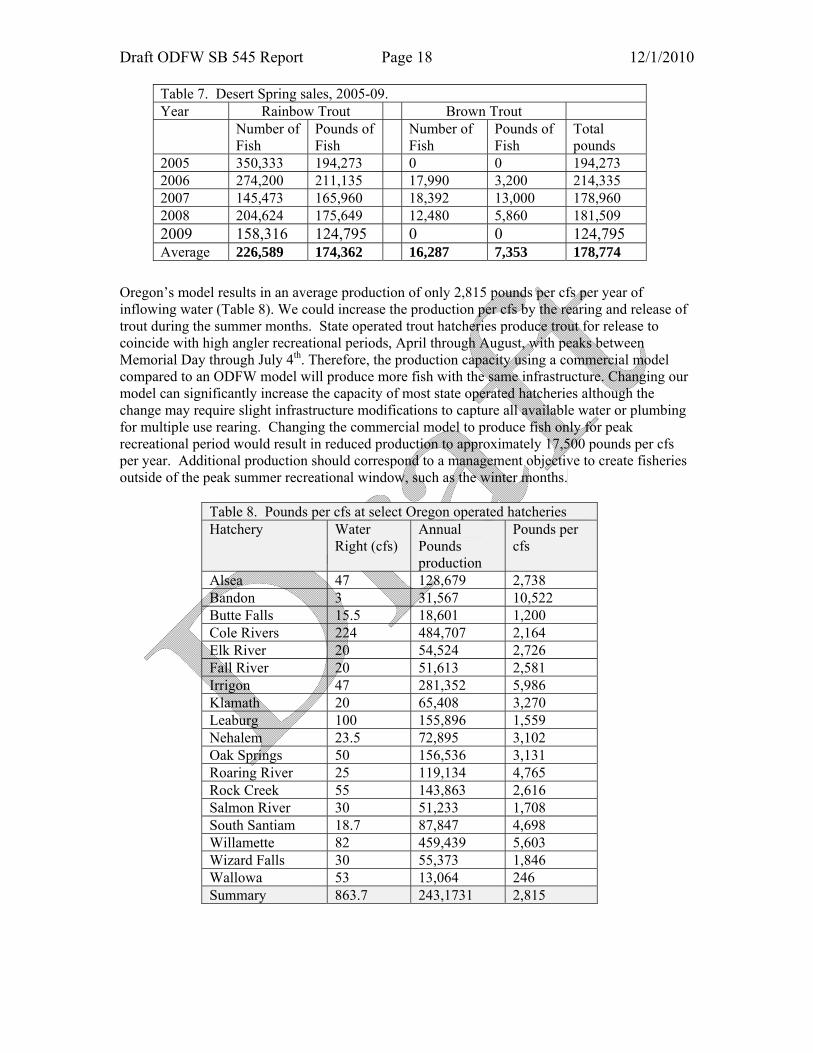
Draft ODFW SB 545 Report Page 18 12/1/2010
Table 7. Desert Spring sales, 2005-09. Year Rainbow Trout Brown Trout Number of
Fish Pounds of Fish
Number of Fish
Pounds of Fish
Total pounds
2005 350,333 194,273 0 0 194,273 2006 274,200 211,135 17,990 3,200 214,335 2007 145,473 165,960 18,392 13,000 178,960 2008 204,624 175,649 12,480 5,860 181,509 2009 158,316 124,795 0 0 124,795 Average 226,589 174,362 16,287 7,353 178,774
Oregon’s model results in an average production of only 2,815 pounds per cfs per year of inflowing water (Table 8). We could increase the production per cfs by the rearing and release of trout during the summer months. State operated trout hatcheries produce trout for release to coincide with high angler recreational periods, April through August, with peaks between Memorial Day through July 4th. Therefore, the production capacity using a commercial model compared to an ODFW model will produce more fish with the same infrastructure. Changing our model can significantly increase the capacity of most state operated hatcheries although the change may require slight infrastructure modifications to capture all available water or plumbing for multiple use rearing. Changing the commercial model to produce fish only for peak recreational period would result in reduced production to approximately 17,500 pounds per cfs per year. Additional production should correspond to a management objective to create fisheries outside of the peak summer recreational window, such as the winter months.
Table 8. Pounds per cfs at select Oregon operated hatcheries Hatchery Water
Right (cfs) Annual Pounds production
Pounds per cfs
Alsea 47 128,679 2,738 Bandon 3 31,567 10,522 Butte Falls 15.5 18,601 1,200 Cole Rivers 224 484,707 2,164 Elk River 20 54,524 2,726 Fall River 20 51,613 2,581 Irrigon 47 281,352 5,986 Klamath 20 65,408 3,270 Leaburg 100 155,896 1,559 Nehalem 23.5 72,895 3,102 Oak Springs 50 156,536 3,131 Roaring River 25 119,134 4,765 Rock Creek 55 143,863 2,616 Salmon River 30 51,233 1,708 South Santiam 18.7 87,847 4,698 Willamette 82 459,439 5,603 Wizard Falls 30 55,373 1,846 Wallowa 53 13,064 246 Summary 863.7 243,1731 2,815

Draft ODFW SB 545 Report Page 19 12/1/2010
(h) Assess, with an emphasis on reducing pathogens, the potential costs and benefits of incorporating the Desert Springs Trout Farm into this state’s trout production program after considering: (A) Fish health;
Response (A) Fish health: Incorporating Desert Springs Trout Farm into the state-wide system would add extra costs for fish health monitoring. Estimated biennial costs for fish health monitoring may be as high as $50,000 (3 months Microbiologists, vehicle rental, fuel, travel, supplies). The benefits to incorporating an additional Class A-1 Hatchery such as Desert Springs include:
• Class A-1 facility • Less chemical use • Higher average fish survival rates • Increased fish production • Fish produced can be transferred state-wide • State-wide program flexibility
The cons include:
• Facility redesign and modifications required to rear rainbow trout in larger lots sizes (>250,000)
• Remote location of the facility • Fish distribution costs • Single or few species production
(B) Environmental impacts; Response (B) Environmental impacts: Environmental impact due to fish pathogens is not well understood and difficult to assess since fish pathogens are ubiquitous to hosts in their environments. There are limited data describing adverse effects created by ubiquitous fish pathogens carried by hatchery fish that are released in natural environments. One study reported no evidence of increasing prevalence of diseases (e.g., BKD) in northeast Oregon from releases of spring Chinook from Lookingglass Hatchery a Class-B facility (Hoffnagle et al. 2009). The concern is that hatchery operations can potentially amplify and concentrate fish pathogens and parasites that could affect wild populations. In general, fish demonstrate good health when reared at statewide hatcheries, which indicates potential for minimal to low-level transmission of any agents they harbor to natural population. Documentation of fish health status is accomplished through monthly and pre-liberation fish health examinations. There are several diseases of concern including bacterial kidney disease (BKD) and infectious hematopoietic necrosis (IHN). Vertical transmission (parent to progeny) of IHN can be prevented by the prudent fish culture practice of draining coelomic fluid at spawning and disinfecting eggs in iodophor. Prudent fish health actions of culling eggs from females with higher levels of Renibacterium salmoninarum antigens have helped with controlling BKD. Horizontal transmission (fish to fish) can not be prevented in Class-B hatcheries. Fish that reside above hatchery intakes provide opportunity to transfer pathogens from the environment to the hatchery fish. The benefit of Class A-1 hatcheries (Desert Springs) production is the elimination of pathogens that may be transferred from the natural environment to the hatchery production. Pathogens can

Draft ODFW SB 545 Report Page 20 12/1/2010
still be transferred to these hatcheries via eggs (parent) or through avian or other fish predator interactions. An additional benefit is the flexibility of transferring and releasing fish statewide. It is not expected that incorporating Desert Springs Hatchery into the statewide system would save or add costs to the agency in regards to environmental impacts, but would improve flexibility of transferring fish. (C) Fish production quality, quantity and flexibility;
Response (C). Commercially produced fish typically have poor gill quality due to high density rearing, maximum pound loading per unit of water inflow, high feed rates, and warm water temperatures which promotes growth but creates concerns for elevated levels of NH3 and CO2 and bacterial gill disease. Poor gill quality can impair the ability of fish to exchange gases and thus create concerns for post release survival. It’s unclear if this would be an issue for Desert Springs although it would be a concern due to their hatchery design using multiple pass raceways. To lessen the concern, production would be managed around 100,000 to 120,000 pounds annually. Additional raceways with independent inflowing water would be considered to increase flexibility or production. Hatcheries of this size are normally funded with approximately $400,000 annually for rearing and fish health services. Despite the concerns we’ve raised above, our experience with trout purchased from DSTF has been they are of high quality. Desert Springs could provide flexibility to the state-wide system. Fish could be reared to legal or trophy size for direct release or transferred as fingerlings to other hatcheries for grow-out and local releases.
(D) Fish distribution, holding, redistribution and release; and
Response (D). Fish distribution will be problematic and expensive. Additional miles are estimated in (Table 10). To estimate additional miles and hours, it was assumed that:
1) Trout production would be reallocated from Bandon, Butte Falls, Elk River, Nehalem, Salmon River, and Rock Creek to Desert Springs; 2) A total of 110,500 pounds stocked annually; 3) 1 trip is 1,000 pounds; 4) Additional mileage was calculated from Silver Lake (Desert Springs) to the listed hatcheries only; 5) Driving durations were estimated at 50 miles/hour plus 1 additional hour per trip for releasing fish.
Table 10. Estimated additional stocking miles and hours for fish liberations Annual
Production Est. trips
Distance (round trip)
Total Miles
Total Hours
Bandon 3,700 4 504 2016 44 Butte Falls 19,000 19 292 5548 120 Elk River 4,800 5 550 2750 60 Nehalem 38,000 38 630 23940 517 Salmon River 15,000 15 538 8070 173 Rock Creek 30,000 30 238 7140 1090 Totals 110,500 111 49,464 2004

Draft ODFW SB 545 Report Page 21 12/1/2010
(E) Anticipated necessary facility modifications and upgrades.
Response (E). Anticipated facility modifications and upgrades would primarily expand the incubation and early rearing capacity and minor construction on the head boxes to regulate flows. DSTF infrastructure includes:
• Grounds ~890 acres • 14.26 cfs for fish culture (measured 8.88 CFS Oct. 11, 2010) • 17.8 cfs undeveloped water right • Elevation 4,000 feet • Water temperature 60 F • Infrastructure includes 2 residences, office, feed storage/shop, incubation and first
feeding room, wash shed and cement pad • Inside Rearing (could be expanded)
– Incubation ~170,000 eyed eggs – First feeding vats (8 units) - ~200 cubic feet total
• Outside Rearing – 1 pass (8 units) – 7,800 cubic feet – 2 pass (4 units) – 7,800 cubic feet – 3-10 passes (32 units) – 52,000 cubic feet – 11-14 passes (12 units) – 19,500 cubic feet – 15-16 passes (2 units dirt ponds with liners) - ~25,000 cubic feet
Modification to incubation and early rearing may be required to produce larger groups of fish. DSTF would benefit with minor modifications ($500/) to their head boxes to control flow between the two banks of raceways. This relatively simple fix would decrease the risk of fish downstream of the head box screens being stranded due to dewatering. (2) The department shall submit the report required by subsection (1) of this section to the interim legislative committees on environment and natural resources in the manner provided in ORS 192.245 on or before February 1, 2010. + }

Oregon Cougar Management Plan Evaluation of cougar removal on human safety concerns, livestock damage complaints, and elk cow: calf ratios in Oregon Mark T. Kirsch, Oregon Department of Fish and Wildlife, 73471 Mytinger Lane, Pendleton, OR
97801, USA Steve P. Cherry, Oregon Department of Fish and Wildlife, P.O. Box 363, Heppner, OR, 97836
USA Phillip J. Milburn, Oregon Department of Fish and Wildlife, 3814 Clark Blvd, Ontario, OR
97914, USA Mark A. Vargas, Oregon Department of Fish and Wildlife, 1495 E. Gregory Rd, Central Point,
OR 97502, USA Bruce K. Johnson, Oregon Department of Fish and Wildlife, 1401 Gekeler Lane, La Grande, OR
97850, USA DeWaine H. Jackson, Oregon Department of Fish and Wildlife, 4192 N. Umpqua
Highway, Roseburg, OR 97470, USA Thomas L. Thornton, Oregon Department of Fish and Wildlife, 3406 Cherry Ave. NE, Salem,
OR 97303, USA Donald G. Whittaker, Oregon Department of Fish and Wildlife, 3406 Cherry Ave. NE, Salem,
OR 97303, USA ABSTRACT The Oregon Department of Fish and Wildlife (ODFW) developed the 2006 Oregon Cougar Management Plan (CMP) to guide cougar management in Oregon. The CMP addresses human safety (including pets), livestock depredation, and conflict with other big game species using proactive, adaptive management strategies. To assess effects of administrative cougar removal, three target areas were chosen to evaluate effects of cougar removal on major categories of conflict: human safety concerns in Jackson County (SW Oregon), livestock depredation in the Beulah Wildlife Management Unit (WMU; SE Oregon), and elk predation in the Heppner WMU (NE Oregon). Administrative cougar removals were designed to supplement removals related to hunter-harvest and complaints. From January 2007 to April 2009, 101 cougars were administratively removed from the three areas at a total cost of $310,501, of which $201,522 were expenses for new ODFW seasonal employees, supplies and services, and contracts with USDA Wildlife Services. No state general funds, tax dollars or federal funds were used for implementing cougar removal in target areas. All funds used for target area implementation were ODFW license fee dollars. ODFW employees took 60 percent of all cougars administratively removed and 66% of the cougars were removed using dogs trained to pursue cougars. Cougar removal in the Jackson County Target Area did not fully address human safety-related conflict. Cougar removal in the Beulah Target Areas reduced cougar–livestock conflicts. Cougar removal in the Heppner Target Area positively affected elk populations. ODFW will continue to monitor Cougar Target Areas to determine the effectiveness of administratively removing cougars, and whether observed treatment effects on livestock depredation and elk calf recruitment will provide long-term benefits in the Beulah and Heppner Target Areas, respectively.

ODFW Oregon Cougar Management Plan Page 2
September 3, 2010
INTRODUCTION Cougar (Puma concolor) populations across North America have fluctuated dramatically during historic times. From the early period of European settlement through the mid-1960s, cougars were nearly extirpated primarily by state, provincial, or federal agricultural agencies. During the mid-1960s, varying but generally short periods of complete cougar protection were implemented and cougar management was transferred to respective state or provincial wildlife management agencies. With subsequent application of science-based wildlife management practices, most agency managers believe cougar populations are more robust now than at any time in recent history (Beausoleil and Martorello 2005).
The successful recovery of cougar populations in western North America presents significant challenges for management agencies. Highly valued as a hunted game species, cougars also have the potential to come into conflict with humans. Cougars can cause direct conflict through depredation on livestock and pets. Although rare, cougars have attacked humans (Beier 1991), and cougar predation can impact wildlife populations. People interested in cougars and cougar management tend to have strong and often conflicting opinions, values, desires, and objectives relative to cougars. The spectrum of values and desires ranges from complete protection or preservation of cougars via hunting prohibitions or highly restrictive regulations to aggressive cougar management for reducing conflict and improving other big game populations. Consequently, cougar management is often controversial, and opposing public desires can lead to highly emotional and politically charged decision processes. Within this dynamic arena, agencies and associated decision makers must evaluate relevant biological information, assess the foregoing influences, and pursue management approaches appropriate for their specific situation (Shroufe 2006).
Throughout western North America, hunting and hunters played a major role in the history of cougar management. Initially, unregulated hunting, extensive use of poisons, bounties, and a general “kill-on-sight” philosophy resulted in near extirpation of many cougar populations. However, in many states it also was hunters that secured protection for cougars and transferred cougar management to state wildlife management agencies. Today, hunting is a primary cougar management tool and hunters carry the majority of the financial burden for cougar management via the purchase of hunting licenses and tags. However, cougar mortality due solely to harvest by licensed hunters does not appear to have kept pace with modeled population growth and has not been sufficient to reduce conflict between cougars and people, livestock, or other wildlife populations. In Oregon, cougar management is guided by Oregon’s Wildlife Policy (ORS 496.012) which directs the Oregon Fish and Wildlife Commission to maintain all species of wildlife at optimum levels, to provide optimum recreational benefits, and to regulate wildlife populations in a manner compatible with the primary uses of the land. Legal status, management, and population levels of cougars in Oregon have undergone significant changes since the mid-1800s. Cougars may have been extirpated by 1970 had they not been placed under management of the Oregon Department of Fish and Wildlife (ODFW) as a game mammal in 1967. Since 1967, cougar management has varied from closed seasons (no public hunting), to controlled hunting with dogs allowed in selected areas during specific times, to a harvest quota system with unlimited tag availability for year-round hunting with the use of dogs prohibited. A 1994 ballot measure (Measure 18) eliminated the public use of dogs for cougar

ODFW Oregon Cougar Management Plan Page 3
September 3, 2010
Figure 1. Cougar Management zones and location of cougar target areas in Oregon.
hunting. In 1995, ODFW established six cougar management zones to administer hunting seasons (Figure 1). Cougars are currently managed under the 2006 Cougar Management Plan (CMP) adopted by the Commission.
Oregon is not immune to the challenge of factoring human dimensions and values into management strategies. From 1990 to 2003, Oregon’s human population grew 24.4 percent (U.S. Census Bureau 2005). Statewide cougar populations also increased during that period from about 2,600 to about 5,100 (Keister and Van Dyke 2002, Oregon Department of Fish and Wildlife unpublished data). Increased human development and increasing cougar populations have led to higher than desired conflict levels in rural, suburban, and urban settings. Average annual number of cougars killed due to livestock depredation and human safety concerns for the period 1995–2003 was 117 (Table 1). This is a five-fold increase compared to 23 cougars killed per year due to livestock depredation and human safety concerns during 1987–1994. ODFW has statutory responsibility to address cougar-human conflicts. Although there has not been a documented fatal human attack by a cougar in Oregon, there are numerous examples of situations where cougars and humans have come into very close contact and cougar behaviors suggest there is a valid safety concern. Some Oregon residents have expressed concerns about potential cougar attacks. Human safety concerns include situations where cougars appear accustomed to human activity and development, and are often seen during daylight hours in close proximity to houses and people. Oregon Revised Statutes (ORS 498.166) allow any person to take a cougar that is posing a threat to human safety, without first obtaining a permit from ODFW. Pet losses due to cougars in populated areas are considered a human safety concern because of the close association between pets and humans. Cougars killed for human safety concerns must be reported to ODFW immediately. Cougars killed in response to human safety concerns are the second highest cause of non-hunting mortality for Oregon cougars (Table 1). Statewide, human

ODFW Oregon Cougar Management Plan Page 4
September 3, 2010
safety concerns reported to ODFW increased to a high of 651 in 1999 and although declining since 1999, continue to be a concern (Table 1).
Table 1. Trend in reported conflict and associated cougar mortality in Oregon, 1994-2008. Reported Conflicts Non-hunting cougar mortality
Year Livestock
Depredation Human Safety Other Total
Livestock Depredation
Human Safety Othera Total
1994 223 331 0 554 29 11 20 601995 285 446 11 742 41 22 12 751996 309 531 0 840 64 34 25 1231997 316 482 0 798 82 20 18 1201998 372 582 0 954 93 20 17 1301999 421 651 0 1072 91 39 25 1552000 369 517 56 942 120 27 17 1642001 330 471 28 829 97 27 21 1452002 336 409 20 765 111 25 35 1712003 320 369 8 697 111 28 25 1642004 149 371 27 547 95 28 35 1582005 185 376 92 653 125 28 30 1832006 175 226 67 468 106 26 32 1642007 177 211 57 445 115 21 41 1772008 157 277 57 491 108 23 52 183a Includes all other causes of mortality such as cougar-vehicle collisions, unknown causes, etc.
Ranching and farming are important components of Oregon’s economy and addressing cougar livestock conflicts is an essential part of cougar management. As the cougar population increased and the human population expanded into rural and suburban areas, potential for cougar-livestock conflicts increased. Cougars rarely cause damage to land or crops; most damage occurs when cougars take or attempt to take livestock. Oregon Revised Statutes (ORS 498.012) allow landowners (or lawful occupants) to take any cougar that is causing damage, is a public nuisance, or poses a public health risk on property they own or lawfully occupy, without first obtaining a permit from ODFW. Landowners may kill the cougar(s) causing the damage using dogs and/or with the aid of bait (ORS 498.164(4)). All cougars killed for livestock depredation must be reported to ODFW immediately. The majority of livestock depredation complaints resulting in cougar control actions are verified because the carcass or kill site is used for trapping or as the starting site for pursuit with hounds. Cougar complaints involving livestock are generally addressed by USDA Wildlife Services in counties that participate in the program or by landowners or their agents in non-participating counties. The leading cause of non-hunting mortality for cougars in Oregon is removal of cougars in areas experiencing livestock depredation, which peaked at 125 cougars killed in 2005 (Table 1). Cougar-livestock conflicts reported to ODFW increased to a high of 421 in 1999 and continue to be a concern (Table 1). In accordance with Oregon’s Wildlife Policy (ORS 496.012), management objectives for elk include specific population sex and age ratios. In northeast Oregon, elk (Cervus elaphus) calf: cow ratios have declined since the early 1990s in eight Wildlife Management Units (WMUs). Elk

ODFW Oregon Cougar Management Plan Page 5
September 3, 2010
populations declined (Oregon Department of Fish and Wildlife 2003b) even as numbers of elk hunters and harvest have been reduced in an effort to maintain elk populations at established Management Objectives (MO). In the Wenaha and Sled Springs WMUs calf survival was as low as 25% and cougars were responsible for 69 percent of the radio-collared elk calf mortalities, while pregnancy rates of adult cows were high (Rearden 2005). Thus there is increasing evidence that cougar predation may limit some ungulate populations in some situations (Edelmann 2003, Harrison 1989, Hayes et al. 2000, Mathews and Coggins 1997, Myers et al. 1998, Rearden 2005, Wehausen 1996). ACTIONS TAKEN ODFW developed and the Oregon Fish and Wildlife Commission adopted in October 2006 the 2006 Oregon Cougar Management Plan (CMP) to guide management of cougar in Oregon during 2006–2011 (Oregon Department of Fish and Wildlife 2006). The purpose of the CMP is to maintain cougar population levels while managing cougar conflicts with humans, livestock, and other big game mammal populations. Five objectives were adopted that address the broad range of public concerns regarding cougars in Oregon. Objective 1 established as ODFW policy the maintenance of a statewide population of cougars that is self-sustaining and assures the widespread existence of cougars in Oregon. Objective 2 established maximum threshold levels for non-hunting cougar mortality associated with human safety, pet safety, and livestock depredation. Objectives 3 and 4 established maximum threshold levels for reported conflicts associated with human safety concerns, and livestock depredation, respectively. The focus of the CMP objectives is to reduce conflicts with cougar while maintaining a healthy statewide cougar population. Objective 5 established criteria whereby action may be taken to improve populations of other big game mammals. Specific criteria for other big game mammal populations (specifically, ungulates such as deer and elk) are based on minimum recruitment levels needed for population maintenance. Since its development, the CMP has garnered a great deal of interest and scrutiny. A number of local interest groups criticized the CMP and associated objectives whereas other groups supported the CMP and desired broader implementation. As a result of the dramatically different opinions and desires, the Oregon Legislative Assembly also began actively monitoring cougar management and implementation of the CMP. ODFW frequently provides updates on management activities and progress directly to the Oregon Legislature.
The CMP was similar in design and scope to several other species-specific management plans developed by ODFW. However, a new component of the CMP was to utilize proactive, adaptive strategies to manage cougar in Oregon. One adaptive management strategy developed was to administratively remove cougars in areas where reliance on licensed cougar hunters proved ineffective at addressing chronic conflicts related to human safety, livestock depredation, or population dynamics of ungulates. In November 2006, ODFW selected three target areas to evaluate the efficacy of administratively removing cougars due to human safety concerns, livestock depredation, and elk population recruitment impacts from November 2006 to April 2009 (Figure 1). The Jackson County Target Area was selected due to a large number of complaints related to human safety. The Beulah Target Area was selected due to a high number

ODFW Oregon Cougar Management Plan Page 6
September 3, 2010
of cougar-livestock conflicts. The Heppner Target Area was selected due to elk cow: calf ratios much lower than desired and believed to be the result of cougar predation.
Utilizing published research, data collected during routine cougar management activities, estimates of cougar density based on zone-specific cougar population models, and habitat characteristics of each area (Keister and Van Dyke 2002, Oregon Department of Fish and Wildlife unpublished data), an annual cougar removal objective was established for each target area (Table 2). The annual removal objective was determined based on the number of additional mortalities needed in the area to cause a decline in cougar density based on the zone-specific population model (Keister and Van Dyke 2002). Administrative cougar removals occurred primarily during November–April each year unless otherwise noted and all cougars were lethally removed. Data or samples collected from all known cougar mortalities in the target area included date, method of take, location (UTM), gender, reproductive status if female, lactation status, and a tooth for age analysis. Animals were classified into three age classes by gender: juvenile (< 1 yr old), sub-adult (1-2 yr old), and adult ( 3 yr old). Age class was based primarily on cementum analysis (Trainer and Matson 1989) and secondarily using gum line recession (Laundre et al. 2000). Ages of cougars removed were compared between sources of mortality and gender in the areas using Analysis of Variance (Proc GLM, SAS Institute Inc. 1985). Administratively removed animals were made available to educational institutions when possible. Table 2. Location, purpose, size, annual objective, and activity dates for three cougar removal areas in Oregon, 2006-2009.
Target Area Name
General Location
Management Zone Purpose
Area (mi2)
2007 Cougar Densitya
Cougar Removal Objective
Timing of Activity
Jackson County
SW Oregon B
Reduce human safety/pet concerns
1,123 12.3 24/year Year-round
Heppner NE Oregon E
Improve ungulate recruitment
1,189 10.6 30/year Year-round
Beulah Unit SE Oregon F Reduce livestock depredation
1,175 3.2 12/year Year-round
a Number of cougars per 100 square miles. All known cougar mortalities and all reported cougar conflicts within each target area and for the encompassing management zone were monitored. Criteria to measure success of reducing conflict associated with human safety concerns or livestock depredation were primarily a reduction in cougar mortality resulting from those types of conflicts and secondarily, a reduction in the number of reported complaints received. Criteria to measure elk recruitment were based on spring calf:cow ratios estimated during annual trend counts and population modeling used to determine attainment of established population objectives. Additionally, each target area was paired with a control area where no administrative removals occurred. Control areas were selected based on having similar cougar densities, human demographics, livestock grazing practices, and or ungulate populations This allowed for an additional comparison of the results from the target areas after removal of cougars.

ODFW Oregon Cougar Management Plan Page 7
September 3, 2010
Cougar populations were monitored primarily using sex-age data collected during mandatory check-in within the target area, within the entire management zone, and cougar population modeling for the management zone. There are limited data on proactively removing cougars to accomplish specific management goals. Nevada (Ashman et al. 1983) uses a harvest rate of 30 percent for management of cougar populations. Alberta regulates cougar harvest to be <10 percent of the population (Pall 1984, as reported in Lindzey et al. 1992). Harvest records for both Nevada and Alberta indicated that cougar populations were not declining. However, accurately assessing cougar population size and subsequent harvest rates relative to population size is not logistically feasible at large spatial scales. Anderson and Lindzey (2005) manipulated a cougar population in Wyoming and found cougar harvest composition can be used to adaptively monitor cougar populations where sex and age data are collected from harvested cougars. By monitoring the proportion of adult females in the total known mortality, cougar population trends can be inferred: when the proportion of adult females in the total mortality exceeds 25 percent for a given area, the cougar population is likely declining (Anderson and Lindzey 2005). Based on this evidence and the knowledge that Oregon cougar harvest was < 14 percent of the modeled population estimates for any zone-year combination, we assumed that increased, proactive removal in target areas would not significantly reduce the cougar population in any given zone. When the proportion of adult females in the total mortality exceeds 45 percent, the resultant decline in a local cougar population is likely precipitous (Anderson and Lindzey 2005). Consistent with the CMP, our objective was to increase the 3-yr average percent adult females in the total mortality in each target area to 40–45%, while maintaining a 3-yr average percent adult females in the total take for the zone at no more than 25–35%. JACKSON COUNTY TARGET AREA Study Area The Jackson County Target Area was selected specifically to evaluate the efficacy and feasibility of increasing cougar mortality near human habitation to reduce cougar-human conflicts to acceptable levels. Jackson County was selected due to the relatively high number of non-hunting cougar mortalities and reported conflicts related to human safety concerns, the proximity of cougars (and cougar habitat) to an urban environment (Medford-Central Point, OR), and the rural nature of surrounding areas. The 1,123-mile2 area is in the south central part of Cougar Management Zone B: Southwest Cascades located in Jackson County, southwest Oregon (Figure 2). The Jackson County Target Area encompassed portions of three WMUs: Rogue, Applegate, and Evans Creek. Non-hunting cougar mortality in Zone B associated with either livestock depredation or human safety concerns ranged from 12 cougars in 1994 to 43 cougars in 2003, averaging 32 cougars killed annually since 1994. As stated in the CMP, ODFW desires to have non-hunting mortality associated with livestock and human safety concerns at or below 11 cougars killed in Zone B. Reported cougar conflicts in Zone B peaked in 1999 at 379 complaints and have averaged 245 complaints per year since 1994. The desired level for reported conflicts related to human safety concerns in Zone B is 84.

ODFW Oregon Cougar Management Plan Page 8
September 3, 2010
Figure 2. Location and land ownership of Jackson County Cougar Target Area.
ODFW began Jackson County Target Area management activities in December 2006 using foot-hold traps and snares to administratively remove cougars. In November 2007, USDA Wildlife Services was contracted to use trained pursuit dogs in addition to traps and snares, and in 2009,
ODFW assisted USDA Wildlife Services with administrative removal actions. As a control comparison, data from Jackson County Target Area were compared to equivalent data from Josephine County, which has a similar cougar population, habitat conditions, and human populations. Results Between December 2006 and April 2009, 12 male and 12 female cougars were administratively removed (six, seven, and 11 during winters 2006-07, 2007-08, and 2008-09 respectively). The spatial distribution of the removals within the target area was not uniform, as most cougars were removed from larger land-ownership parcels located near the outer edges of the target area (Figure 3). ODFW removed six cougars during the first winter of activity (2006–2007), Wildlife

ODFW Oregon Cougar Management Plan Page 9
September 3, 2010
Services removed 16 cougars in winters of 2007–2008 and 2008–2009; and ODFW removed an additional two cougars during winter 2009. Twelve cougars were removed using traps or snares and 12 cougars were removed using trained dogs. Twenty cougars were removed from private lands and four were removed from public land. Average ages of all known cougar mortality in the target area were not statistically different either between sexes (P=0.16) or between sources of mortality (P=0.93) (Table 3).
Table 3. Age class and average age by gender for all known cougar mortalities in the Jackson County Target Area vicinity, Oregon, 2006 –2009. Age class based on gum recession for 27 animals pending confirmation with cementum analysis. Female Male
Mortality Source Juvenile Sub-Adult Adult Ave. Age Juvenile Sub-Adult Adult
Ave. Age
Administrative Removal 5 3 4 3.08 3 4 5 2.42Hunting 0 6 5 2.82 1 4 5 3.13Human-Pet Safety 1 1 0 0.50 0 3 0 1.03Livestock Depredation 0 3 4 4.81 0 5 4 2.60Other 1 0 1 2.67 0 5 0 1.75Total 7 13 14 3.30 4 21 14 2.26
Figure 3. Distribution of known cougar mortalities in the Jackson County Cougar Target Area and vicinity, southwestern Oregon, 2006–2009.

ODFW Oregon Cougar Management Plan Page 10
September 3, 2010
Non-hunting cougar mortality associated with livestock depredation and human safety concerns within the target area prior to implementing administrative cougar removal was seven cougars in 2003, 10 in 2004, and seven in 2005, respectively. In the Josephine County control area, non-hunting mortality was zero cougars in 2003, four cougars in 2004, and zero in 2005, respectively. During and after administrative removal, non-hunting cougar mortality (not including administrative removals) in the target area was six cougars in 2006, six in 2007 and eight in 2008, respectively. Corresponding non-hunting mortality in the Josephine County control area was zero in 2006, zero in 2007 and two in 2008, respectively. An additional 21 cougars were killed in the target area by hunters (Table 3). During years that include the administrative removal period, there were 48, 40, and 70 combined human safety, pets/livestock/other conflicts reported within the target area, respectively, and 12, 23, and 34 conflicts reported in the Josephine County control area in 2006, 2007 and 2008, respectively. At the zone level, combined non-hunting cougar mortality associated with livestock and human safety concerns (32, 36, and 38 cougars for 2006, 2007, and 2008, respectively) remained higher than the annual objective of 11 established in the Cougar Management Plan. The number of reported cougar conflicts in Zone B related to human or pet safety initially decreased from 127 in 2005, to 58 in 2006, but subsequently increased to 113 in 2008. Number of reported conflicts remains higher than the annual objective of 84 established in the Cougar Management Plan. The 3-yr average percent of adult females in the total mortality within the target area was 21% (23, 18, and 21 percent for winters 2006–2007, 2007–2008, and 2008–2009, respectively). For Zone B the 3-yr average percent of adult females in the total mortality was 17% (18, 16, and 17 percent for 2006, 2007, and 2008 respectively). Population modeling indicated cougar population for Zone B initially decreased from 1,529 in 2006 to 1,478 in 2007 but remained essentially stable at 1,476 in 2008. The total mortality quota for Zone B (165) was not met during the administrative removal period. Discussion Compared to the time period 2003–2005, the number of cougars killed in the Jackson County Target Area because of livestock or human safety concerns declined by only four cougars during the three years of target area implementation. Reported conflicts for human safety concerns were highly variable across the three years. Non-hunting mortality was less in the Josephine County control area but a similar trend was observed for reported conflicts.
ODFW was not able to achieve its annual cougar removal objective for the Jackson County Target Area. Only 25 percent (6 of 24 cougars) of the desired cougar removal objective was achieved in 2006–2007 and 29 percent (7 of 24) of the desired cougar removal objective was achieved in 2007–08. The number of administrative cougar removals increased in 2008–2009 but still only 46 percent (11 of 24) of the desired objective were removed. According to county tax records, 57.6 percent of all parcels identified within the target area boundary (excluding areas within incorporated city limits) were less than five acres in size with 93 percent of all ownerships less than 50 acres in size. Additionally, privately owned properties with potentially differing land management priorities (e.g. livestock production, commercial timber, rural housing development) were interspersed among parcels of public property in a checkerboard fashion. The

ODFW Oregon Cougar Management Plan Page 11
September 3, 2010
matrix of small private ownerships within the target area prevented adequate access for effective cougar removal. Contacting landowners to obtain permission to access these small private ownerships proved very difficult, making it nearly impossible to use pursuit with trained dogs to address human safety concerns. Additionally, because of potential capture of pets or disturbance by humans, foot hold traps and snares were rarely used. Thus removal activity in the Jackson County Target Area did not appear to decrease conflict related to human safety concerns in Cougar Zone B, likely due to the difficulties attaining cougar removal objectives. For Zone B, both the modeled cougar population estimate (1,476–1,529) and the low proportion of adult females in the total mortality for Zone B (16–18 percent) suggest the cougar population was not over-exploited. BEULAH TARGET AREA Study Area The Beulah Target Area was selected to evaluate the efficacy and feasibility of increasing cougar mortality near areas of livestock production to reduce livestock depredation by cougars. The Beulah Target Area has a history of cougar-livestock conflict. Non-hunting cougar mortality associated with either livestock depredation or human safety concerns increased from one removed in 1995 to 21 in 2003, and has averaged 11 through 2009. As stated in the CMP, the desired objective is for non-hunting mortality associated with livestock and human safety concerns not to exceed 11 cougars killed in Zone F annually. Reported cougar conflicts in Zone F increased from 14 in 1994 to 41 in 1999, and has averaged 24 complaints per year. The desired level for reported conflicts related to livestock depredation in Zone F is 27 annually. This 1,175-mile2 target area is located in Cougar Management Zone F: Southeast Oregon, in the Beulah WMU in Malheur County (Figure 4). The target area is a mix of public and privately held rangelands (57 percent public) interspersed with small parcels of irrigated hay fields. Cattle, sheep and horses are the primary livestock species and grazing occurs on both public and private land. Grazing rotations follow an elevation gradient with livestock concentrated at lower elevations during winter. Vegetation in the Beulah Target Area consists of open conifer forest on the western edge transitioning to sagebrush steppe in the east. Beulah Target Area provides quality year-round habitat for mule deer, elk and pronghorn antelope (Antilocapra americana). In addition, the target area includes most of the primary winter range for deer, elk, and pronghorn antelope that summer at higher elevations in the Beulah WMU and surrounding WMUs. The combination of a large ungulate prey base in proximity to livestock production areas likely contributes to the relatively high number of cougar-livestock conflicts. The Malheur River WMU was selected as a comparison area for analysis. The Malheur River WMU is located immediately west of Beulah WMU, and is similar in size, terrain, and habitat composition. Livestock grazing practices and land ownership also are similar. The Malheur River WMU is 69 percent publicly owned. No administrative cougar removal occurred in the Malheur River WMU during 2006–2009 but cougar hunting was allowed and response to individual cougar related conflicts did occur.

ODFW Oregon Cougar Management Plan Page 12
September 3, 2010
Figure 4. Location and land ownership of Beulah Target Area.
ODFW began Beulah Target Area management activities in December 2006 but cougar removal was hampered by weather conditions and difficulty finding trained personnel during winter 2006–2007. Consequently, little effort was expended and no cougars were administratively removed during the first year. USDA Wildlife Services personnel were contracted to conduct target area removal activities during winters 2007–2008 and 2008–2009. An annual removal objective of 12 cougars was established by extrapolating modeled cougar density estimates for the cougar management zone. Removal objectives were re-evaluated each year. Traps and snares were selected as the primary removal tools, but trained hounds were used when access and tracking conditions would permit. Results Between 2006 and 2009, 15 male and nine female cougars were administratively removed (zero, 12, and 12 for winters 2006-07, 2007-08, and 2008-09, respectively), all by USDA Wildlife Services. Distribution of cougar removals within the target area was not uniform (Figure 5) but was concentrated around private agricultural lands. Sixteen cougars were removed using traps or snares, seven were removed using trained dogs, and one was tracked and removed without hounds. Thirteen cougars were removed from private land and 11 were removed from public land. Average ages of all known cougar mortality in the Beulah Target Area were not statistically different either between sexes (P=0.58) or between sources of mortality (P=0.34) (Table 4). Prior to implementation of Beulah Target Area (2004–2006), 13 non-hunting mortalities occurred in both the Beulah WMU and the Malheur River WMU. During the administrative removal period, non-hunting mortality dropped to five in the Beulah WMU, all within the Beulah Target Area, but remained relatively unchanged at 10 in the Malheur River WMU. Similar

ODFW Oregon Cougar Management Plan Page 13
September 3, 2010
Figure 5. Distribution of known cougar mortalities in the Beulah Unit Cougar Target Area, Oregon, 2006–2009.
results were observed for reported cougar-livestock conflicts. Reported conflict in Beulah WMU decreased from 16 prior to administrative cougar removals to three during administrative removals. In the Malheur River WMU, eight and six livestock depredation conflicts were reported respectively in the pre-removal and removal periods.
Table 4. Age class and average age by gender for all known cougar mortalities in the Beulah Target Area, Oregon, 2006 –2009. Age class based on gum recession for 19 animals pending confirmation with cementum analysis. Female Male
Mortality Source Juvenile Sub-Adult Adult Ave. Age Juvenile Sub-Adult Adult
Ave. Age
Administrative Removal 0 4 5 3.89 0 3 12 4.20Hunting 0 2 3 3.20 1 2 3 2.91Human-Pet Safety 0 0 0 0 0 0 Livestock Depredation 1 2 1 3.25 2 0 0 0.00Other 0 0 0 0 1 1 2.50Total 1 8 9 3.56 3 6 16 3.44
During 2006 and 2007, non-hunting cougar mortality associated with livestock depredation and human safety concerns (12, 12, and nine for 2006, 2007, and 2008, respectively) remained higher than the annual objective of 11 established in the CMP for Zone F in two of three years. Since 2005 livestock related cougar complaints have declined from 18 in 2005 to six in 2008, which met the conflict threshold of 27 or less established in the CMP. The average percent of adult females in the total mortality for Beulah Target Area after two years was 24% (32 and 16 percent for winters 2007–2008 and 2008–2009, respectively). Similarly, percent of adult females in the total mortality for Zone F after two years was 29% (32 and 25 percent for 2007 and 2008, respectively). The modeled cougar population trend for the zone remained relatively stable during the administrative cougar removal period (852 and 868 for 2007 and 2008, respectively).

ODFW Oregon Cougar Management Plan Page 14
September 3, 2010
Discussion Documented trends in cougar–livestock conflict in Beulah WMU provided evidence that increasing cougar mortality near livestock concentrations may reduce cougar-livestock conflicts. Prior to administratively removing cougars, 13 (0.36/mo) non-hunting mortalities occurred in Beulah WMU. During target area implementation, only five (0.18/mo) non-hunting cougar mortalities occurred. Reported cougar-livestock conflicts showed a similar pattern: 16 reported prior to cougar removal whereas only three were reported during target area implementation. These trends were not apparent in the Malheur River WMU. After cougar removal, both parameters were less than conflict threshold values established in the CMP. Thus, administrative cougar removal activity in the Beulah Target Area appeared to reduce cougar-livestock conflict in Zone F: SE Oregon. For Zone F, the modeled cougar population estimate (852 and 868 for 2007 and 2008, respectively), and the proportion of adult females in the total mortality within the target area (16–32 percent) and for Zone F (18–32 percent) suggest the total mortality may have been sufficient to cause a decline in the cougar population during winter 2007, but not a precipitous decline. HEPPNER TARGET AREA Study Area The Heppner Target Area was selected because of the large decrease in elk calf:cow ratios believed to be from cougar predation. Since 2000, elk calf: cow ratios declined in the Heppner Target Area from long-term averages of 35-40 calves per 100 cows to < 20 calves per 100 cows (Table 5). Calf ratios have been below 23 calves per 100 cows for three years (2004–2006), and elk populations have been below population objectives since 2003 (three years), thus meeting the criteria for a target area as established in the CMP. Observed bull ratios in the Heppner Target Area have been below management objective for seven of the eight years (Table 5). Non-hunting mortality associated with livestock depredation and human safety concerns continues to be much higher than 13 as established in the CMP for Zone E.
Table 5. Trends in bull elk ratio and calf elk ratio in the Heppner Target Area and Ukiah WMU, Oregon, 2000–2009. Heppner Target Area Ukiah WMU
Year LCLb
Bulls: 100
Cows UCLb LCL
Calves: 100
Cows UCL LCL
Bulls: 100
Cows UCL LCL
Calves: 100
Cows UCL2000 9.8 9.9 10.0 34.1 36.5 38.9 8.8 10 11.2 26.4 28.0 29.62001 8.9 9.0 9.1 32.6 35.2 37.8 8.0 9 10.0 23.7 25.0 26.42002 7.2 7.4 7.5 28.1 30.4 32.7 7.9 9 10.1 31.4 33.0 34.62003a 8 27 5.0 6 7.0 22.4 24.0 25.62004 5.4 5.5 5.6 16.3 18.0 19.6 7.8 9 10.2 22.3 24.0 25.72005 5.6 5.7 5.8 18.8 21.2 23.6 3.2 4 4.8 17.5 19.0 20.52006 9.8 10.0 10.1 15.5 17.1 18.7 7.9 9 10.1 17.6 19.0 20.42007 5.1 5.2 5.3 13.6 15.1 16.7 9.0 10 11.0 11.2 13.0 14.12008 7.0 7.1 7.1 28.3 29.9 31.4 8.3 9 9.7 15.1 16.0 16.92009 8.7 8.8 8.9 27.9 29.4 30.9 9.3 10 10.7 10.3 11.0 11.7a No count data available. Estimates based on modeling. b LCL and UCL are lower and upper 95% confidence limits, respectively.

ODFW Oregon Cougar Management Plan Page 15
September 3, 2010
The 1,189-mile2 Heppner Target Area encompasses 80 percent of the Heppner WMU and includes portions of Morrow, Grant, Umatilla and Wheeler counties in north central Oregon (Figure 6). The target area includes the entire Heppner WMU except for the Ritter Area south and east of the North Fork of the John Day River.
Removal activities began in the Heppner Target Area in January 2007. The initial annual removal objective of 30 cougars was established based on extrapolation of modeled cougar density estimates for the cougar management zone to the target area. Removal objectives were re-evaluated annually. During the first two years of implementation (July 2006–June 2007 and July 2007–June 2008) attempts were made to remove 30 cougars per year from the target area, primarily during winter months. Based on the number of cougars removed during the first two winters, and in response to the improved elk calf:cow ratios, the removal objective was reduced to 20 during the third year of implementation (July 2008- March 2009) as part of the adaptive management component of target area implementation. Elk populations were surveyed in the Heppner Target Area after each treatment year (winter) to monitor population response to cougar removals. Surveys were conducted using routine and customary helicopter surveys during March or April. Elk data from the Heppner Target Area were compared to the neighboring Ukiah WMU which has experienced a similar decline in elk population and elk calf ratios (Table 5). Results During 2006–2009, 53 cougars (26 male, 27 female) were removed (20, 22, and 11 for winter 2006-07, 2007-08, and 2008-09, respectively), all by ODFW personnel. Between 55 and 73 percent of the annual objective was removed. Most cougars (48) were removed using trained dogs but five were captured using traps or snares. Thirty-two cougars were removed from public
Figure 6. Location and land ownership of Heppner Unit Cougar Target Area.

ODFW Oregon Cougar Management Plan Page 16
September 3, 2010
land and 21 were removed from private lands. During the implementation period, hunters killed an additional 28 cougars, one cougar was taken for livestock depredation, and one was killed illegally in the Heppner Target Area (Table 6). No cougars were killed as a result of human safety concerns during the same period in the Heppner Target Area. Distribution of cougar removals within the target area was not uniform (Figure 7) but instead was concentrated on elk winter ranges. Average ages of all known cougar mortality in the target area were not statistically different either between sexes (P=0.21) or among sources of mortality (P=0.95) (Table 6). Table 6. Age class and average age by gender for all known cougar mortalities in the Heppner Target Area, Oregon, 2006 –2009. Age class based on gum recession for 13 animals pending confirmation with cementum analysis. Female Male
Mortality Source Juvenile Sub-Adult Adult Ave. Age Juvenile Sub-Adult Adult
Ave. Age
Administrative Removal 5 10 12 3.69 7 5 14 3.60Hunting 1 10 7 3.38 0 4 6 2.98Human-Pet Safety 0 0 0 0 0 0 Livestock Depredation 0 1 0 2.00 0 0 0 Other (Illegal Kill) 0 0 1 4.00 0 0 0
Total 6 21 20 3.54 7 9 20 3.42
Elk populations in the Heppner Target Area did not respond immediately. However, in 2008 calf ratios increased 76 percent from 17:100 cows in 2006 (95% CI = 15–19:100 cows) to 29:100 cows in 2009 (95% CI = 28–31:100 cows) (Table 5). Bull ratios remain below established management objective for the Heppner Target Area after three years of cougar removals. Observed calf ratios in the Ukiah WMU (control site) did not have the increase during 2008 as observed in the Heppner Target Area. Ukiah WMU calf ratios were 13 calves: 100 cows, 16 calves: 100 cows, and 11 calves: 100 cows for 2007, 2008, and 2009, respectively (Table 5). The 3-yr average percent of adult female cougar in the total mortality for Heppner Target Area was 22% (26, 23, and 17 percent for winters 2006–2007, 2007–2008, and 2008–2009, respectively). In Zone E: Blue Mountains, the 3-yr average percent adult females in the total mortality was 20% (18, 23, and 20 percent for 2006, 2007, and 2008 respectively). Modeled cougar population trend for Zone E suggests only a slight decline during the administrative cougar removal period (1,618, 1,587, and 1,572 for 2006, 2007, and 2008, respectively). Discussion The objective for Heppner Target Area was to increase the elk calf ratio to 31–35 calves: 100 cows. Administrative cougar removal appears to have had the desired effect on the elk calf ratio. Above-average snowfall occurred during winters 2007–2008 and 2008–2009. For winter 2008–2009, cumulative snowfall at the Heppner recording station was at least 3 times that of normal (Figure 8). Radio telemetry data from ODFW studies suggest that during winters with above-average snowfall, elk from neighboring units (Ukiah, Starkey, Desolation and Northside) migrate into Heppner Target Area to escape the snow cover (Wilt 1986). In 2008 and 2009 observed Heppner Target Area total elk counts were much higher than normal years and likely included over 1,000 elk from neighboring WMUs. Considering observed 2009 calf ratio

ODFW Oregon Cougar Management Plan Page 17
September 3, 2010
Figure 7. Distribution of known cougar mortalities in the Heppner Unit Cougar Target Area, Oregon, 2006–2009.
estimates for the Ukiah, Desolation, Northside, and Ritter portion of the Heppner WMUs (not part of the target area) of 11, 16, 22, and 12 respectively, it is likely the influx of elk from these WMUs lowered observed calf ratio estimates for resident elk in the Heppner Target Area.
Heppner WMU is one of the most popular units for hunting elk in Oregon (Johnson and Moore 1992). In 1995 when the Heppner WMU elk population was at or near management objective, there were 7,198 reported elk hunters in Heppner WMU (3,295 controlled elk hunters and 3,903 general season hunters; ODFW unpublished data). During the 2008 elk seasons, there were 5,693 reported elk hunters (1,425 controlled elk hunters and 4,268 general season elk hunters; ODFW unpublished data). This is a difference of 1,505 hunters between elk populations at MO or below MO. Assuming that the observed 30 calves per 100 cows are recruited into the Heppner Target Area elk population, and assuming that the there are approximately 2,246 cow elk in the Heppner Target Area, approximately 600 elk have been added to the population. Of these about half will be bulls available for harvest in subsequent years. If improved calf ratios and resulting elk population trends continue, it is possible that elk hunting opportunities will subsequently increase to levels observed when elk populations were at or near MO in the Heppner WMU.

ODFW Oregon Cougar Management Plan Page 18
September 3, 2010
The cougar population within Heppner Target Area likely decreased as a result of administrative removals. The number of days of effort per cougar removed increased from 4.3 days/cougar in 2006–2007 to 8.3 days/cougar during 2008–2009. The average age of female cougars taken in the Heppner Target Area also appears to have declined from 4.7 during the first year to 2.9 (note that cougars killed during 2008–2009 are still pending age confirmation with cementum analysis). While the overall cougar population likely declined in Heppner Target Area, the presence of cougar sign (i.e. tracks observed of adult and young of the year) found during removal activities throughout the year suggests a healthy, viable population of cougars persists in the target area. Additionally, licensed hunters continue to encounter cougars while hunting other big game species. Conversely, the cougar population within Cougar Management Zone E appears unaffected. The proportion of adult females in the total mortality both within the target area (17–26 percent) and throughout Zone E (18–23 percent) were well below the 40 to 45 percent that would be indicative of a heavy exploitation rate (Anderson and Lindzey 2005). COST Through April 2009, 101 cougars were removed from the three target Areas. ODFW employees took 60 percent of all cougars killed through administrative actions in the target areas and 2/3 of the cougars were taken using trained dogs. Total cost of implementing target area cougar
Figure 8. Annual winter snowfall at the Heppner, Oregon recording station, 1975–2009.
Heppner Winter Snowfall
0
5
10
15
20
25
30
35
40
45
1975 -1976
1978 -1979
1981 -1982
1984 -1985
1987 -1988
1990 -1991
1993 -1994
1996 -1997
1999 -2000
2002 -2003
2005 -2006
2008 -2009
Winter (Oct - Mar)
Cum
ulat
ive
Snow
fall
(Inc
hes) Observed Average

ODFW Oregon Cougar Management Plan Page 19
September 3, 2010
removal for three years was $310,501 (Table 7). During the first year, ODFW personnel salary accounted for 78 percent of target area implementation costs. As target area activities progressed and staff became more efficient, salary costs declined. Existing employee salaries are shown as part of implementation costs. Although existing employee salaries are real costs because employees working on target area activities are not addressing other district biologist duties, they do not represent additional expenditures to ODFW. Therefore, the real, additional cost to ODFW for implementing target area cougar removal was $201,522. No state general funds (tax dollars) or federal funds were used for implementing cougar removal in target areas. All funds used for target area implementation were ODFW license fee dollars.
Table 7. Cost of implementing and conducting cougar removals in 3 cougar target areas in Oregon, winters 2006–2007, 2007–2008, and 2008–2009. Target Area Expenditure 06-07 07-08 08-09 TotalAll Existing Costsa $65,074 $34,064 $9,841 $108,979 Additional Costsb $48,091 $81,763 $71,668 $201,522 Totalc $113,165 $115,827 $81,509 $310,501 Jackson County
Existing Employee Salaries $16,918 $0 $0 $16,918New Employee Salaries $0 $0 $0 $0
Supplies & Servicesd $4,181 $40,000 $30,000 $74,181 Jackson Cnty. Sub-Total $21,099 $40,000 $30,000 $91,099 East Beulah
Existing Employee Salaries $4,656 $0 $0 $4,656New Employee Salaries $7,200 $0 $0 $7,200
Supplies & Servicesd $8,010 $18,251 $21,915 $48,176 E. Beulah Sub-Total $19,866 $18,251 $21,915 $60,032 Heppner WMU
Existing Employee Salaries $43,500 $34,064 $9,841 $87,405New Employee Salaries $15,500 $18,250 $16,858 $50,608
Supplies & Services $13,200 $5,262 $2,895 $21,357 Heppner Sub-Total $72,200 $57,576 $29,594 $159,370 All Existing Employee Salaries $65,074 $34,064 $9,841 $108,979 New Employee Salaries $22,700 $18,250 $16,858 $57,808 Supplies & Services $25,391 $63,513 $54,810 $143,714 Totalc $113,165 $115,827 $81,509 $310,501a Includes existing employee salaries for all Target Areas combined. b Includes new employee salaries and supplies & services for all Target Areas combined. c Total Expenditure for all three target Areas. d Contract with USDA Wildlife Services during 2007-2009.

ODFW Oregon Cougar Management Plan Page 20
September 3, 2010
CONCLUSIONS The odds of a human being attacked or injured by a cougar are extremely low: More people are injured or killed annually by rattlesnakes, bees, and dogs than by cougars (Beier 1991). However, this does not diminish the fact that when a person is injured or killed by a cougar, the incident is a very serious situation requiring an immediate and intensive response by the wildlife management agencies. Circumstances leading to legitimate human safety concerns can be broken down into three categories: (1) situations where cougars appear to be accustomed to human activity and development, (2) cougars are seen frequently during daylight hours in close proximity to houses and people, and (3) pets are lost due to cougars in populated areas. It is reasonable to take actions preventing or minimizing the potential for these situations to escalate into incidents resulting in the injury or death of a human in Oregon due to cougars. The efforts of ODFW to reduce human safety concerns due to cougars were not successful largely because of land ownership patterns in the Jackson County Target Area and the inability to remove the target number of animals annually. The methods ODFW used to attempt administrative removal of cougars in the urban-rural interface to reduce cougar-human conflict will likely not work in other areas with similar land-ownership patterns without an extensive outreach program to landowners to provide permission to access their properties. The same challenges encountered by ODFW are likely to be encountered by licensed cougar hunters in these areas. Thus, public hunting may have little effect for decreasing levels of conflict in situations where cougars and cougar habitat are in close proximity to an urban environment. Based on the 2005 two-year average value for beef cows and the market year average calf price (USDA National Agricultural Statistics Service 2006), cattle producers in Oregon lost an estimated $721,750 in potential revenue due to feline depredation (including cougars and bobcats). The efforts of ODFW to administratively remove cougars from an area with high levels of livestock depredation reduced livestock related conflict in the area during the removal period, supporting the hypothesis that increased cougar mortality near areas of livestock concentrations can reduce cougar-livestock conflicts. Cattle production is a significant factor for Malheur County (US Department of Agriculture 2007). Aggressive, focused cougar removal may be a viable option for reducing livestock depredation and subsequently benefiting the livestock producer in Malheur County by reducing economic loss and potentially minimizing livestock protection costs. Hunting provides an important source of income for many rural economies such as found in the Heppner WMU (Dean Runyan Associates 2009). Hunting in the Heppner WMU contributed an estimated $1,720,000 to portions of Grant, Wheeler, Morrow, and Umatilla Counties during 2008 from hunters throughout the state of Oregon. Further, residents that hunted within 50 miles of the Heppner WMU spent an estimated $184,444. Based on data collected on hunters traveling to the Starkey WMU (ODFW unpublished data) inflated to 2008 values, elk hunters spend an estimated $430.95 per trip to hunt elk in northeastern Oregon. Given that there are approximately 1,505 fewer elk hunters in the Heppner WMU compared to when elk populations were at or near MO, this represents a loss of $647,150 of income to local rural counties. Administrative cougar removal in an area of high predation rates on ungulates resulted in increased survival of calf elk as measured by end-of-winter calf to cow ratios during the removal period. Improvements in elk populations and subsequent increases in elk hunting opportunity in Heppner WMU will benefit economies that rely on this resource.

ODFW Oregon Cougar Management Plan Page 21
September 3, 2010
Cougars are still present in these target areas, but there is no verifiable information on what percentage of the cougar population in each target area was removed. For example, if it is assumed that cougar density was 15 adult and sub-adult cougars per 100 mi2 in the Heppner Target Area, there would have been 178 cougars in the target area. If none of the subadult and adult cougars killed by administrative removal or hunters (n = 70, Table 6) immigrated into the Heppner Target Area, the cougar population was reduced by 41 percent. However, it is highly likely that some of the cougars killed immigrated into the target area during this work and the percentage reduction in the cougar population was likely less. Based on the fecundity of cougars, the calf to cow ratio for elk will likely begin to decline in 2010 as the cougar population increases with all other factors held constant. Cougar populations in the Beulah Target Area are likely to respond in a similar manner and livestock depredation may potentially increase again in the future. We found varying efficacy when using administrative removal of cougars as authorized in the CMP for the three specific types of cougar-human conflicts. Continued monitoring of cougar-livestock conflicts and measuring calf to cow ratios will be required to determine duration of the effects observed during this administrative removal. RECOMMENDATIONS Four of six cougar management zones are above the desired maximum threshold criteria for non-hunting cougar mortality (Table 8) indicating that conflict with cougars continues to be higher than desired as specified in the CMP. Therefore, ODFW proposes continued implementation of target areas consistent with the CMP. For Beulah Target Area, one more year of cougar removal is required to more adequately evaluate the data (Figure 9). ODFW also proposes implementation of four new target areas as described below. Two new target areas will be for elk, and two for mule deer. Ukiah Target Area The Ukiah Target Area was selected to improve the elk population because the ratio of calves:100 cows has been below 23:100 since 2005 (5 years) and the elk population has been below management objective since 2004 (6 years). Additionally, data from Ukiah WMU were used as comparison for evaluating the Heppner Target Area. Combining analysis of three years data from Ukiah with that already collected from Heppner will strengthen analyses for this region of northeastern Oregon. The 883-mile2 Ukiah WMU is in Cougar Management Zone E: Blue Mountains and includes land primarily in Umatilla County. Target area activities will occur primarily on elk winter ranges within the forested portions of the unit. Cougar removal methods and elk population monitoring will be consistent with those implemented for the Heppner Target Area. Personnel hired to implement the Heppner Target Area will be maintained to implement the Ukiah Target Area. Using estimated cougar density for the zone and habitat characteristics of each area, the initial cougar removal objective will be 35/year. As part of the adaptive management component of target area implementation, the removal objective will be evaluated annually based on the number of cougars removed by hunters, the responses of elk calf: cow ratios, and for other conflicts. Elk population data will be compared back to information collected in Heppner

ODFW Oregon Cougar Management Plan Page 22
September 3, 2010
through continued monitoring in that target area to evaluate success of cougar removal actions in the Ukiah. Wenaha Target Area The Wenaha WMU Target Area also was selected for elk population improvement because the ratio of calves: 100 cows has been below 23:100 for three years and the elk population has been well below management objective nine of ten years (Table 9). The 420-mile2 Wenaha WMU Target Area is also in Cougar Management Zone E: Blue Mountains and includes portions of Union and Wallowa counties. Cougars will be removed year round with most activity during winter using hounds and snares on elk winter ranges. Elk surveys will be conducted using routine
Table 8. Observed and desired values for non-hunting cougar mortality, number of reported human safety conflicts, and number of reported livestock conflicts due to cougars in Oregon 2004-2009. Cougar Mortality Human Safety / Pets Livestock Depredation Zone Year Observed Objective Complaints Objective Complaints ObjectiveA 2004 39 15 159 191 47 102 2005 35 15 135 191 73 102 2006 26 15 91 191 56 102 2007 37 15 64 191 69 102 2008 35 15 90 191 57 102B 2004 38 11 122 84 59 69 2005 38 11 129 84 48 69 2006 32 11 60 84 63 69 2007 36 11 78 84 67 69 2008 36 11 114 84 64 69C 2004 10 5 20 28 12 24 2005 4 5 19 28 9 24 2006 10 5 14 28 8 24 2007 4 5 16 28 8 24 2008 4 5 21 28 15 24D 2004 5 5 19 20 4 12 2005 26 5 24 20 16 12 2006 27 5 18 20 13 12 2007 24 5 7 20 12 12 2008 16 5 4 20 14 12E 2004 19 13 46 22 12 25 2005 33 13 64 22 23 25 2006 25 13 37 22 22 25 2007 23 13 31 22 12 25 2008 31 13 47 22 16 25F 2004 12 11 8 54 16 27 2005 17 11 9 54 18 27 2006 12 11 9 54 13 27 2007 12 11 14 54 3 27 2008 9 11 7 54 2 27

ODFW Oregon Cougar Management Plan Page 23
September 3, 2010
Figure 9. Cougar Management zones and location of new cougar target areas in Oregon.
helicopter surveys during March or April. Volunteer agents already in place will be used to implement cougar removals. Using estimated cougar density for the zone and habitat characteristics of the area, the initial cougar removal objective will be 20 cougars/year. As part of the adaptive management component of target area implementation, the removal objective will be evaluated annually based on the number of cougars removed and in response to elk calf: cow ratios. Elk population data will be compared to data collected in the Mt Emily WMU to evaluate success of cougar removal in the Wenaha WMU.
Steens Mountain Target Area Steens Mountain Target Area was selected to address declining mule deer populations. Steens Mountain WMU was selected for more intensive management as part of Oregon’s Mule Deer Initiative (MDI). Along with the need for some habitat improvements, cougar predation has been suggested as a probable cause of the deer population decline during development of a management plan for MDI. Consistent with the CMP, deer populations have been < 60 percent of population management objective for over three years (Table 10). Removal activities in the 1,572 mile2 Steens Mountain Target Area will focus on mule deer winter ranges within Steens Mountain WMU and a small portion of the Juniper WMU in Cougar Management Zone F: Southeast Oregon in Harney County. Malheur National Wildlife Refuge is not included in the target area boundary.

ODFW Oregon Cougar Management Plan Page 24
September 3, 2010
Cougars will be removed using existing USDA-Wildlife Services personnel in Burns, OR. Using estimated cougar density for the zone and habitat characteristics of each area, the initial cougar removal objective will be 20 cougars/year. As part of the adaptive management component of target area implementation, the removal objective will be evaluated annually based on the number of cougars removed and observed responses in mule deer populations. Mule deer populations will be monitored using routine and customary helicopter and ground surveys during March or April. Additional effort also may be required to obtain more rigorous population estimates. Mule deer population data will be compared to data from Beatys Butte and Trout Creek Mtns to evaluate success of the actions. Resident bighorn sheep populations potentially benefiting from cougar removal will also be monitored for responses to administrative cougar removals.
Table 9. Trends in elk population and calf elk ratio in the Ukiah and Wenaha WMUs Oregon, 2000–2009. Ukiah WMU Wenaha WMU
Year Population MO Calves:
100 Cows Population MO Calves:
100 Cows 2000 5,500 5,000 28 1,100 4,250 12 2001 5,600 5,000 25 1,150 4,250 14 2002 5,100 5,000 33 1,400 4,250 15 2003 5,000 5,000 24 1,400 4,250 20 2004 4,800 5,000 24 1,450 4,250 16 2005 4,300 5,000 19 1,600 4,250 20 2006 4,100 5,000 19 1,600 4,250 30 2007 4,000 5,000 13 1,550 4,250 13 2008 4,000 5,000 16 1,500 4,250 16 2009 4,000 5,000 11 1,100 4,250 18
Table 10. Trends in mule deer population, deer fawn ratio, and buck ratio in the Steens Mountain and Warner WMUs Oregon, 2000–2009. Steens Mountain WMU Warner WMU
Year Population
% of MO
(11,000)
Bucks:100
Does
Fawns:100
Does Population
% of MO
(5,500)
Bucks:100
Does Fawns:10
0 Does 2000 5,150 47% 25 67 2,562 47% 21 49 2001 6,200 56% 31 44 no data 19 66 2002 5,900 54% 22 65 1,328 24% 22 41 2003 5,600 51% 24 55 2,136 39% 13 55 2004 5,500 50% 34 44 1,630 30% 15 56 2005 5,000 45% 51 55 2,270 41% 18 70 2006 4,000 36% 29 69 1,036 19% 24 48 2007 4,300 39% 47 59 2,958 54% 14 37 2008 3,850 35% 29 35 2,389 43% 15 50 2009 3,700 34% 28 68 no data

ODFW Oregon Cougar Management Plan Page 25
September 3, 2010
Warner Target Area Warner Target Area also was selected to address declining mule deer populations. Warner WMU was selected for more intensive management as part of Oregon’s Mule Deer Initiative (MDI). Along with the need for some habitat improvements, cougar predation has been suggested as a probable cause of the deer population decline during development of a management plan for MDI. Consistent with the CMP, deer populations have been <60% of population management objective for over three years (Table 10). The 960 mile2 Warner Target Area focuses on mule deer winter ranges within the WMU in Cougar Management Zone F: Southeast Oregon in Lake County. Cougars will be removed using volunteer agents in place for Lake County. Using estimated cougar density for the zone and habitat characteristics of each area, the initial cougar removal objective will be 14 cougars/year. As part of the adaptive management component of target area implementation, the removal objective will be evaluated annually based on the number of cougars removed and observed responses in mule deer populations. Mule deer populations will be monitored using routine and customary helicopter and ground surveys during March or April. Additional effort also may be required to obtain more rigorous population estimates. Mule deer population data will be compared to data from the Beatys Butte and Interstate WMUs to evaluate success of the actions. Use of Volunteer Agents In 2007, the Oregon Legislative Assembly enacted HB 2971 which authorizes ODFW to appoint agents for assistance in their official duties pursuing black bear and/or cougar with dogs subject to the department’s direction and control. In January 2008, the Commission adopted rules for implementing HB 2971 allowing ODFW to utilize volunteers to address conflict with cougars or bears using trained dogs. Individuals wishing to be an agent for ODFW must apply and complete a rigorous screening process demonstrating they posess the necessary skills and equipment, and do not have any criminal history. Further, agents completing the screening must undergo extensive training prior to conducting any activities. Once training is completed, agents can only work under a signed agreement with ODFW that details all activities and locations where actions can be taken. Because these agents are volunteers for ODFW but have a very specialized skill needed by the department, their use will result in a significant cost savings when these agents are used to implement target area removals. LITERATURE CITED Anderson, C.R., and F.G. Lindzey. 2005. Experimental evaluation of population trend and
harvest composition in a Wyoming cougar population. Wildlife Society Bulletin 33(1):179-188.
Ashman, D.L.., G.L. Christensen, M.L. Hess, G.K. Tsukamoto, and M.S. Wickersham. 1983. The mountain lion in Nevada. Nevada Dep. Wildl. P-R Proj. W-48-15. 75pp.
Beausoleil, R. A., and D. A. Martorello, editors. 2005. Proceedings of the eighth mountain lion workshop. Washington Department of Fish and Wildlife, Olympia, USA.

ODFW Oregon Cougar Management Plan Page 26
September 3, 2010
Beier, P. 1991. Cougar attacks on humans in the United States and Canada. Wildlife Society Bulletin 19:403–412.
Dawn, D. 2002. Cougar management in the western United States: an analysis of hunting harvest strategies. Thesis, San Jose State University, San Jose, USA.
Edelmann, F. B. 2003. Wintering mule deer ecology in the reservoir reach of the Hells Canyon Hydroelectric Complex. Technical Report E 3.2-32. Idaho Power Company, Boise, Idaho, USA. 194 pp.
Harrison, A. 1989. Predators and prey--a case of imbalance. Forest Research West. June 1989. 5pp.
Hayes, C. L., E. S. Rubin, M. C. Jorgensen, R. A. Botta, and W. M. Boyce. 2000. Mountain lion predation of bighorn sheep in the Peninsular Ranges, California. Journal of Wildlife Management 64:954-959.
Johnson, R. L., and E. Moore. 1992. Oregon elk hunter study. Oregon State University Unpublished Report, Corvallis, Oregon, USA. 53 pp.
Keister, G. P. Jr. and W. A. Van Dyke. 2002. A predictive population model for cougars in Oregon. Northwest Science. 76(1):15-25.
Laundre, J. W., L. Hernandez, D. Streubel, K. Altendorf, and C. L. Gonzalez. 2000. Aging mountain lions using gum line recession. Wildlife Society Bulletin 28(4):963–966.
Lindzey, F.G., W.D. Van Sickle, S. P. Laing, and C.S. Mecham. 1992. Cougar population response to manipulation in southern Utah. Wild. Soc. Bull. 20:224-227.
Mathews, P. E., V. L. Coggins. 1997. Movements and mortality of mule deer in the Wallowa Mountains. Pages 78-88 in J. C. deVos, Jr. ed. Proceedings of the 1997 Deer/Elk Workshop. Rio Rico, Arizona. Arizona Game and Fish Department, Phoenix, Arizona, USA.
Myers, W. L., B. Lyndaker, P. E. Fowler, and W. Moore. 1998. Investigations of calf elk mortalities in southeast Washington: study completion report. Washington Department of Fish and Wildlife, Olympia, Washington, USA.
Oregon Department of Fish and Wildlife. 2003b. Oregon’s elk management plan. Salem, Oregon, USA. 58 pp.
ODFW 2006 Oregon CMP
Pall, O. 1984. Alberta status report. Pages 1-8 in J. Roberson and F. Lindzey, eds. Proc. second mountain lion workshop. Utah Div. Wildl. Resour., Salt Lake City.
Rearden, S. N. 2005. Juvenile survival and birth-site selection of Rocky Mountain elk in northeastern Oregon. Thesis. Oregon State University, Corvallis, Oregon, USA. 105pp.

ODFW Oregon Cougar Management Plan Page 27
September 3, 2010
Runyan, D. 2009. Fishing, Hunting, Wildlife Viewing, and Shell fishing in Oregon, 2008. Dean Runyan Associates, Portland, Oregon, USA. 70 pp.
SAS Institute Inc. 1985. SAS procedures guide for personal computers, version 6. SAS Institute Inc, Cary, North Carolina, USA.
Shroufe, D. 2006. Western Association of Fish and Wildlife Agencies comment on the Cougar Management Guidelines – first edition. Wildlife Society Bulletin 34:1479.
Trainer, C. E., and G. Matson. 1989. Age determination in cougar from cementum annuli counts of tooth sections (Abstract Only), in R. H. Smith, ed. Proceedings of the Third Mountain Lion Workshop. Prescott, Arizona, USA. 88pp
US Census Bureau. 2005. Oregon Quick Facts. http://quickfacts.census.gov/qfd/states/41000.html. Downloaded 10 May 2005.
US Department of Agriculture. 2007. 2007 Census of agriculture. (http://www.agcensus.usda.gov/Publications/2007/Online_Highlights/County_Profiles/Oregon/cp41045.pdf Downloaded 31 August 2009.
USDA National Agricultural Statistics Service. 2006. Cattle and calf death loss. www.nass.usda.gov/id. Downloaded 31 August 2009.
Wehausen, J. D. 1996. Effects of mountain lion predation on bighorn sheep in the Sierra Nevada and Granite Mountains of California. Wildlife Society Bulletin 24:471-479.
Wilt, D. 1986. Elk herd delineation . Wildlife Research Report Number 16. Oregon Department of Fish and Wildlife. 32 pp.

Fish Screening Program Economic Incentives for Water Users to Protect Fish
2009-2011
Report to the Legislature
Prepared by the Oregon Department of Fish and Wildlife

Letter from the Director
Oregon Department of Fish and Wildlife 1
Greetings! Welcome to the Fish Screening Program's 2011 legislative report. Since 1991, the Program has provided cost share incentives and technical assistance to encourage water users to voluntarily install fish-friendly screens at their water diversions. Fish screens prevent fish from entering irrigation diversions, municipal systems, or industrial intakes.
The Program's cost share opportunities and tax credit are very successful and popular. The cost share assists the water user with the expense of installing a fish screen. The water user may also qualify for a tax credit of up to $5,000. Since 2000, these incentives have resulted in the voluntary installation of over 1,000 fish-friendly screens throughout the state.
The cost share program's $3.9 million Measure 66 funds have leveraged nearly $1.4 million in match to date in the 2009-2011 biennium. Projects are located throughout the state and benefit both small and large water users. Valuable partnerships have been forged with water users who volunteer to cost share projects.
The benefits of fish screens are clear. Over ninety-eight percent of young salmon and steelhead survive an encounter with a properly designed fish screen. Oregon's sport and commercial fisheries are improved and fish screens are a critical component of native fish restoration. Fish screens help achieve both sustainable agriculture and sustainable fisheries.
Thousands of water diversions remain unscreened in Oregon, placing fish at risk. While the Fish Screening Program has made great progress, there is still a lot of work to do. This report reflects the cooperative efforts of many partners to address the issue. Please join us in celebrating their accomplishments.
Sincerely,
Roy Elicker, Director
Roy Elicker, Director
Oregon Department of Fish and Wildlife

Background
2 Oregon Department of Fish and Wildlife
History
Highly popular and cost-effective, this is one of the top fish screening programs in the nation. Its directive is to share the cost of installing fish screens with water users. The cost share includes monetary, engineering, and design assistance, as well as a tax credit.
The Fish Screening Program was adopted in 1995 after a 4-year pilot program and is directed by ORS 496.141 to report to the Joint Committee on Ways and Means. A fish passage component of the Program reports to the Legislature separately.
This report covers the time period of July 1, 2009 to December 31, 2010.
How The Fish Screening Program Benefits Water Users, Fisheries and Anglers
Water users receive financial incentives to install fish screens.
Juvenile and adult fish are not prevented from upstream and downstream migration.
Fish populations increase providing anglers with more fishing opportunities.
What is a Fish Screen?
Water from streams and rivers is redirected for irrigation, power, drinking water and other uses. Diversions used to redirect the water also pull fish into pumps, irrigation canals and fields — reducing survival and preventing migration. Fish screens are fish-friendly devices placed at the diversion entrance. They allow diverted water to pass through while preventing fish from entering.
The Benefit of Fish Screens at Water Diversions
Over 98% of young salmon survive an encounter with a properly designed screen.
Prevents fish from entering places they should not be (like an irrigation system).
Improves the protection, survival, and restoration of native fish.
Achieves both sustainable agriculture and sustainable fisheries.
The Fish Screening Program has installed over 1,000 screens throughout Oregon since 2000.

Cost Share Program
Oregon Department of Fish and Wildlife 3
Incentives
Incentives in the form of cost share and a tax credit encourage water users to voluntarily screen their diversions. As a result, nearly 1,000 fish screens have been installed throughout Oregon since 2000.
Cost Share Grants Water users can receive financial help to install a fish screen by cost sharing their project with ODFW. Water user match can include cash, other grants or in-kind services. There are two cost share opportunities:
Measure 66 Lottery Funds (M66) Used to cost share up to 60% up to $75K for a new fish screen or up to 100% for replacement.
Fisheries Restoration and Irrigation Mitigation Act (FRIMA) Provides 65% cost share to irrigation diversion projects that have a local, state, tribal or federal sponsor or co-applicant. The 35% matching funds must be non-federal. FRIMA has provided more than $4 million in federal cost share funds to Oregon for screening and passage projects since 2001.
M66 and FRIMA can be combined as long as the water user contributes at least 10% of the costs. While FRIMA has been authorized by the U.S. Legislature, no new funding has been allocated since 2007.
Oregon State Tax Credit Water users may be eligible for a tax credit of 50%, up to $5,000, of the cost of installing a new screen. The screen does not need to be cost shared or installed by ODFW; any newly installed fish screen may be eligible. The water user is allowed to take the tax credit over a five-year period.
Application Process
Approval Water users apply for cost share funding to install a screen at their pump or gravity diversion. Once approved, the water user and ODFW enter into a grant agreement. Costs incurred before approval are not eligible for reimbursement.
Review and Inspection Screen projects can be installed by ODFW or the water user.
ODFW ensures that state and federal criteria are met by reviewing project designs.
ODFW inspects and certifies the project once installed.
Reimbursement After the project is inspected and certified the applicant is reimbursed for their portion and may be eligible for a tax credit up to $5,000.
$599,772 in State tax credits have been granted since 1995.

Budget Analysis
4 Oregon Department of Fish and Wildlife
Summary Budget information provided is for the Fish Screening and Passage Program. A fish passage component of the Program reports activities to the Legislature separately.
General Funds (GF) used for screen maintenance have been eliminated, greatly reducing the Agency’s ability to repair and maintain fish screens.
The FRIMA Program was reauthorized in 2009; however, the Federal Legislature has not appropriated any new funds.
$1.4 million additional funds were leveraged through the Program’s cost share funds.
OR BienniumM66 CapitalM66 Operations & CoordinationPassage SurchargeScreens SurchargeMiscellaneousCalendar YearBPAFederal Fiscal YearBORFRIMAMAUSFWS
2007$1M
$3.3M$838K
Funds Received
2009
2010Unknown
2010$1M
2007-09
$289K$608K
$206K$0
2009-11
$1.4M$621K
$4M
$0
$383K
2008
$676K$0
20092007$250K$250K
2008$1M
Unknown$0 $0 Unknown
$49K
2011
2011$1M
$0Unknown$1.7M $1.4M $1.6M
$175K $196K $23K Unknown$1.6M
Key to Program Funding
Fund Name BOR Bureau of Reclamation BPA Bonneville Power Administration
FRIMA Fisheries Restoration & Irrigation Mitigation Act
M66 Measure 66 Lottery Funds MA Mitchell Act Passage Surcharge
ODFW Sport Fishing License Surcharge for Fish Passage Activities
Screens Surcharge ODFW Sport Fishing License Surcharge for Fish Screening Activities
USFWS US Fish & Wildlife Service Funding Cycles
The Program’s state and federal funding cycles vary and overlap, resulting in a complex budget.

Budget Analysis
Oregon Department of Fish and Wildlife 5
Program Budget Allocations
$4,0
40,7
53
$935
,017
$0
$433
,106
$0 $0
$1,7
87,4
33
$238
,131
$3,3
35,5
34
$0
$4,0
00,0
00
$837
,503
$0
$621
,161
$500
,000
$175
,000
$2,1
49,7
96
$1,0
58,2
75
$3,1
77,0
25
$0
$3,3
08,6
40
$608
,164
$289
,640
$1,4
53,7
73
$48,
600
$219
,599
$2,0
45,8
15
$0
$187
,529
$3,1
88,9
27
$0
$500,000
$1,000,000
$1,500,000
$2,000,000
$2,500,000
$3,000,000
$3,500,000
$4,000,000
$4,500,000
$5,000,000
M66
Cap
ital
M66
Ope
ratio
ns&
Coo
rdin
atio
n
Pass
age
Surc
harg
e
Scre
ens
Surc
harg
e
BO
R
USF
WS
BPA
FRIM
A
MA
Mis
cella
neou
s
2005-20072007-20092009-2011
MA 28.0%
BPA 18.0%
Miscellaneous 1.8%M66 Operations & Coordination 5.3%
USFWS 1.9%
Screens Surcharge 12.8%
Passage Surcharge 2.5%
BOR 0.4%
M66 Capital 29.1%
Comparison of 2005-2007, 2007-2009 and 2009-2011 Allocations This comparison of the current and previous biennia illustrates where funding was decreased and increased.
2009-2011 Fish Screening and Passage Program Allocations
Allocations total $11,383,859.

Budget Analysis
6 Oregon Department of Fish and Wildlife
State Funding State funds fluctuate every biennium. Sport fishing license surcharge is dependant upon license sales; lottery funds are revenue dependant, and general fund dollars were eliminated.
Measure 66 State Lottery Funds (M66) Administered by Oregon Watershed Enhancement Board (OWEB) Capital $3,930,945 Operations $656,619 Total $4,587,564 The majority of the Program's cost share is funded by M66. Funds are used toward engineering and construction of fish screens and limited program support.
Although M66 allows for up to 35% operational funds along with 65% capital construction funds, the cost share program receives far less than the 35% allowed. This biennium, the cost share Program received just 15.5% M66 operational funds. Originally this was not an issue since GF made up the difference, but GF has been eliminated resulting in a lack of operational funds.
75-Cent Sport Fishing Surcharge (Surcharge) $1,453,773 A 75-cent surcharge on Oregon sport fishing licenses is dedicated to carrying out the provisions of the Fish Screening Program. This includes project supplies, fish screen maintenance, administrative assistance, inventory work, and the Fish Screening Task Force.

Budget Analysis
Oregon Department of Fish and Wildlife 7
FRIMA is authorized through 2014, but no new funding has been allocated since 2007.
Federal Funding
Federal funding is dependant on the renewal of grants. Funds are allocated in a federal fiscal year cycle with the exception of BPA, which is granted per calendar year.
Mitchell Act (MA) Administered by National Oceanic & Atmospheric Administration (NOAA) Fisheries
$3.2 million Mitchell Act provides the major source of funding for fish protection through screening in the Columbia River Basin. In Oregon, MA funds have funded over 750 fish screens and provided for their maintenance. All of these screens are located on streams where ESA protected fish are located.
MA funding has decreased significantly since 1993. Meanwhile, costs for personnel, materials and transportation have increased substantially.
Due to the reduction of MA funding, the Program is having a difficult time merely maintaining the existing MA facilities. The construction of new screening and passage facilities with MA funds has been eliminated. Most of the screens have been put on a reduced maintenance schedule resulting in considerable loss of fish at some diversion sites.
Bonneville Power Administration (BPA) $1 million BPA funds are used for the installation of new screens and replacement of some fish screens in the Columbia River Basin constructed under the MA program (see above). The screens being replaced are worn out or do not meet current criteria.
Fisheries Restoration and Irrigation Mitigation Act (FRIMA) Administered by U.S. Fish and Wildlife Service (USFWS) $0 FRIMA provides up to 65% cost share to irrigation diversion projects that have a local, state, tribal or federal sponsor or co-applicant. The 35% matching funds must be non-federal.
Since 2001, FRIMA provided $4 million to Oregon for 17 screening, 14 passage, and 2 inventory projects. More than 2,500 cfs of water has been screened.
FRIMA provides critical funding for larger screening projects that otherwise would not be completed due to limited state, local, and private funding. Funds are often combined with state funds to increase the assistance available to water users. An important benefit of FRIMA is the ability to use FRIMA funds to conduct much needed inventory work to identify diversions needing fish screening.
The FRIMA Program was reauthorized by the Federal Legislature in 2009, but no new funding has been allocated since 2007.
Mitchell Act Fish Screens and Passage Program
Allocations
$1,400,000
$1,600,000$1,800,000$2,000,000$2,200,000$2,400,000
1994
1997
2000
2003
2006
2009
Fiscal Year
Allo
catio
n
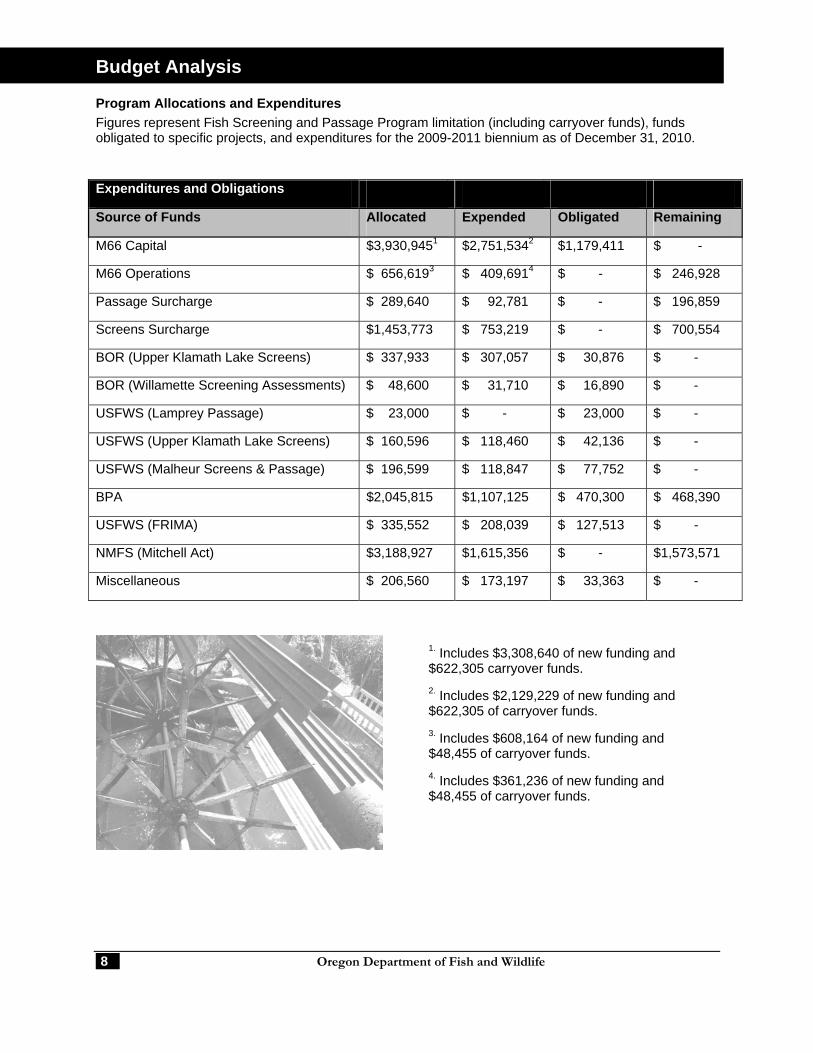
Budget Analysis
8 Oregon Department of Fish and Wildlife
Program Allocations and Expenditures Figures represent Fish Screening and Passage Program limitation (including carryover funds), funds obligated to specific projects, and expenditures for the 2009-2011 biennium as of December 31, 2010.
Expenditures and Obligations
Source of Funds Allocated Expended Obligated Remaining
M66 Capital $3,930,9451 $2,751,5342 $1,179,411 $ -
M66 Operations $ 656,6193 $ 409,6914 $ - $ 246,928
Passage Surcharge $ 289,640 $ 92,781 $ - $ 196,859
Screens Surcharge $1,453,773 $ 753,219 $ - $ 700,554
BOR (Upper Klamath Lake Screens) $ 337,933 $ 307,057 $ 30,876 $ -
BOR (Willamette Screening Assessments) $ 48,600 $ 31,710 $ 16,890 $ -
USFWS (Lamprey Passage) $ 23,000 $ - $ 23,000 $ -
USFWS (Upper Klamath Lake Screens) $ 160,596 $ 118,460 $ 42,136 $ -
USFWS (Malheur Screens & Passage) $ 196,599 $ 118,847 $ 77,752 $ -
BPA $2,045,815 $1,107,125 $ 470,300 $ 468,390
USFWS (FRIMA) $ 335,552 $ 208,039 $ 127,513 $ -
NMFS (Mitchell Act) $3,188,927 $1,615,356 $ - $1,573,571
Miscellaneous $ 206,560 $ 173,197 $ 33,363 $ -
1. Includes $3,308,640 of new funding and $622,305 carryover funds. 2. Includes $2,129,229 of new funding and $622,305 of carryover funds. 3. Includes $608,164 of new funding and $48,455 of carryover funds. 4. Includes $361,236 of new funding and $48,455 of carryover funds.

Budget Analysis
Oregon Department of Fish and Wildlife 9
Contractor and Supplier Expenditures
The Program uses private contractors when possible during all phases of a project: inventory and assessment work, engineering and design, fabrication, and construction. They generate work and income in communities throughout the state and help the Program install more fish screens than is possible with limited staff.
Screens designed by Program engineers are constructed by private contractors.
Program engineers review plans prepared by private consultants
Water users are encouraged to purchase pump screens and components directly from their local irrigation vendors and contractors.
Water User Match
In-kind Water User match can be in-kind construction or installation related materials, equipment or labor included in the cost of the project. $157,414 worth of in-kind was contributed by 20 water users toward the installation of 30 screens.
Cash Water users can also provide match by purchasing materials, hiring contractors or paying ODFW for their portion of the project.
Personnel
Personnel are located in Salem headquarters and at four screen shops where projects are constructed. The challenge is to install and maintain fish screens throughout Oregon through the management of multiple funding streams. $4,979,493 in Personal Service was expended as of December 31, 2010.
Personnel FTE Location FTE Central Point 11 Enterprise 6 John Day 28 The Dalles 11 Salem 14
Total 70 FTE

Other Program Activities
10 Oregon Department of Fish and Wildlife
Research and Development
Program engineers and fish screen technicians continue to develop innovative fish screen technology, improving effectiveness and efficiency. Providing power for screen operation and adequate cleaning is key to screen effectiveness.
Alternative Power Sources Program engineers continue to investigate the potential use of alternative power sources for fish screens including paddle wheel, hydrogen fuel cell, and solar technologies.
Water Intake Control System
An electrical control system was installed to allow up to 60 cfs of water to be diverted from Upper Klamath Lake through three head gates and six fish screens. The water user inputs the amount of water needed for operations, and the head gates automatically adjust to allow that amount of water to flow through the intake pipes. The system adjusts to ensure uniform water flow which helps the screens operate within fish screening criteria.
The system is able to monitor for water level, flow, and temperature. It is also able to detect if a problem exists with the head gate, debris is caught on a screen, or the water is freezing. If an issue is detected, the system will notify the user with a message on the input screen; however, the system could be upgraded to notify the user in a variety of ways including sounding an alarm, sending an e-mail, or sending a page.
With minimal training, the water user has been able to operate the system allowing them to get the water they need to irrigate their fields while protecting fish.
The control system was developed for this large traveling belt screen facility, but the system could be customized for future use at a variety of screen types and sizes.
Control System Electrical Panel
User Interface
Traveling Belt Fish Screens

Other Program Activities
Oregon Department of Fish and Wildlife 11
Maintenance
Maintenance of fish screens and passage structures is an important part of the Program. Screens that are not maintained by the Program are often left un-repaired, reducing their effective lifespan and diminishing the State's return on investment. ORS 498.306(5) requires that ODFW provide major maintenance for screens it cost shares on diversions less than 30 cfs.
Measure 66, the Program's major funding source for new screen construction, cannot be used for maintenance. The Program does not receive enough major maintenance funding, and past elimination of General Fund dollars has worsened the problem.
The situation will only intensify as the Program continues to cost share additional screens.
The Role of the Fish Screening Task Force
The Fish and Wildlife Commission appoints a seven-member citizen task force to advise the Department regarding fish screening policy, funding and technology issues. The Task Force is made up of one public-at-large, three agriculture, and three fishing and fish conservation representatives.
Task Force Members
Representing Agriculture Gordon Summers is a retired physician who
now resides at his family ranch in Halfway. He has worked with fish screens, on his property and others, for more than 10 years. Dr. Summers has been involved with irrigation ditch companies and the Eagle Valley SWCD.
Mike Britton is Manager of the North Unit Irrigation District. He works with the agricultural and natural resources communities to improve fisheries while sustaining irrigated agriculture.
Reed Stewart has over 25 years of experience in the irrigation industry and is the Irrigation Division Manager for Pendleton Grain Growers, Inc. He is active in several agricultural organizations throughout Oregon.
Representing Fishing and Fish Conservation Jeff Oveson is the Executive Director of the
Grande Ronde Model Watershed. He brings together diverse stakeholders to complete habitat projects on private and public lands.
Lynden Brown is a retired high school biology teacher. She is interested in fish issues and wants to insure viable fisheries for the future.
Tony Brauner is a retired high school education and CEO of an intrastate trucking firm. He is a licensed fishing guide and is actively involved with fish habitat and conservation work.
Representing Public-at-Large Mark Wharry is an engineer with over 10
years experience working on fish screening and passage projects in the Pacific Northwest.

Other Program Activities
12 Oregon Department of Fish and Wildlife
Program Success So far this biennium, 127 fish screens have been installed protecting 301.16 cfs of water. An additional 35 projects are planned for installation by the end of June 2011. The cooperative water users installing these projects have contributed nearly $1.4 million in matching funds.
Fish screens come in a wide range of types and sizes including pump, rotary drum, traveling belt, and panel screens. The projects featured here represent the challenges posed by various locations and the diverse nature of fish screen designs.
CFS or 'cubic feet per second' refers to the amount of water being screened. 1 cfs = 448.83 gallons per minute. The amount of water screened and number of projects installed are the primary measurements used to track Program success.
Projects are located throughout the state benefiting both small and large water users. Valuable partnerships have been forged with water users who volunteer to cost share projects.
Screens Installed by House District
District # Installed cfs
1 7 6.342 4 16.653 1 0.604 2 1.455 1 8.707 2 1.0510 1 0.2211 4 2.2215 3 4.3216 2 4.4517 10 5.0418 4 2.7323 22 27.8424 3 3.4725 2 1.3432 2 2.8651 1 2.0053 1 1.1254 1 5.9955 9 24.8956 1 60.0057 10 29.0259 20 29.0460 14 59.82
Total 127 301.16
Screens Installed by Senate District
District # Installed cfs
1 11 22.992 3 2.053 1 8.704 2 1.055 1 0.226 4 2.228 5 8.779 14 7.7712 25 31.3113 2 1.3416 2 2.8626 1 2.0027 2 7.1128 10 84.8929 10 29.0230 34 88.86
Total 127 301.16
1 cfs = 448.83 gallons per minute.
The amount of water screened and number of projects installed are used to track Program success.

Fish Screens Installed July 1, 2009 to December 31, 2010
Oregon Department of Fish and Wildlife 13
County Name
House District
Senate District
Basin Project Title Stream Flow Rate
Project #
Baker 60 30 Powder Nash Ditch Company Eagle Creek 21.76 09-0028
Baker 60 30 Powder Melhorn Clear Creek 17.00 09-0033
Benton 16 8 Willamette Hathaway Pump #1 Willamette River 2.01 02-0282
Benton 23 12 Willamette Smith Pump #1 Middle Channel 1.78 02-0285
Benton 23 12 Willamette Smith Pump #2 Booneville Channel 1.78 02-0286
Benton 23 12 Willamette Smith Pump #3 Middle Channel 1.78 02-0287
Benton 23 12 Willamette Smith Pump #4 Booneville Channel 1.78 02-0288
Benton 23 12 Willamette Smith Pump #5 Clark Slough 1.78 02-0289
Benton 23 12 Willamette Smith Pump #6 Clark Slough 1.78 02-0290
Benton 23 12 Willamette Smith Pump #7 Clark Slough 1.78 02-0291
Benton 23 12 Willamette Smith Pump #8 Clark Slough 1.78 02-0292
Benton 23 12 Willamette Deer Haven Pump #1 Willamette River 0.67 02-0300
Benton 23 12 Willamette Deer Haven Pump #2 Long Tom River 0.88 02-0301
Benton 23 12 Willamette Funke Pump #1 W.F. Booneville Channel 0.89 02-0304
Benton 23 12 Willamette Funke Pump #2 W.F. Booneville Channel 0.94 02-0305
Benton 23 12 Willamette Deer Haven Pump #3 Long Tom River Slough 1.67 02-0313
Benton 23 12 Willamette Horning W. Buxbaum Long Tom River 1.30 02-0321
Benton 23 12 Willamette Horning N. Buxbaum Long Tom River 0.78 02-0322
Benton 23 12 Willamette Horning Crist Pump Willamette River 1.07 02-0323
Benton 23 12 Willamette Stroda Pump #1 Long Tom River 1.67 02-0329
Clackamas 51 26 Willamette Patterson Nursery Pump Eagle Creek 2.00 02-0281
Clackamas 18 9 Willamette Schmid Pump Pudding River 0.33 02-0284
Clackamas 18 9 Willamette Shadrin Pump Butte Creek 0.44 02-0328
Coos 1 1 South Coast Groves Elk Creek 0.58 17-0041
Coos 1 1 South Coast Geaney Coquille River 0.43 17-0044
Crook 55 28 Deschutes Teaters Pump Site Crooked River 1.50 05-0080
Crook 55 28 Deschutes Downing Pump Mill Creek 0.55 05-0092
Crook 55 28 Deschutes Wolf Creek #2 Wolf Creek 1.20 05-0094

Fish Screens Installed July 1, 2009 to December 31, 2010
14 Oregon Department of Fish and Wildlife
County Name
House District
Senate District
Basin Project Title Stream Flow Rate
Project #
Crook 55 28 Deschutes River Run Ranch #2 Crooked River 0.95 05-0096
Curry 1 1 South Coast McKenzie #3 Floras Creek 1.10 17-0047
Deschutes 54 27 Deschutes Old Mill Screen Deschutes River 5.99 05-0079
Deschutes 53 27 Deschutes Leithauser Ditch Whychus Creek 1.12 05-0095
Douglas 2 1 Umpqua Cow Creek Irrigation Company Cow Creek 8.90 16-0051
Douglas 2 1 Umpqua Tri-City Water & Sanitary Authority
South Umpqua River 4.87 16-0118
Douglas 1 1 Umpqua Epp/Kalmen Morgan Creek 0.67 16-0134
Douglas 7 4 Umpqua Wassom North Umpqua River 0.16 16-0143
Douglas 2 1 Umpqua Johns Cow Creek 2.60 16-0147
Douglas 1 1 Umpqua Smith (Richard) Lookingglass Creek 0.29 16-0148
Douglas 1 1 Umpqua Heinze #1 Lookingglass Creek 1.38 16-0174
Douglas 1 1 Umpqua Heinze #2 Lookingglass Creek 1.89 16-0175
Grant 60 30 John Day Upper Mchaley John Day River 5.55 06-0152
Grant 59 30 John Day Granite Boulder #2 Granite Boulder Creek 1.20 06-0216
Grant 59 30 John Day Granite Boulder #3 Granite Boulder Creek 1.20 06-0217
Grant 59 30 John Day Granite Boulder #4 Granite Boulder Creek 0.85 06-0218
Grant 60 30 John Day Larson Berry Creek 1.20 06-0244
Grant 60 30 John Day Mills Little Pine Creek 1.56 06-0279
Grant 60 30 John Day Ellison Little Pine Creek 1.98 06-0280
Grant 60 30 John Day Winegar Jeff Davis Creek 2.03 06-0294
Grant 59 30 John Day Warm Springs Tribes Vincent Creek 1.20 06-0297
Grant 60 30 John Day Hilliard Little Pine Creek 1.00 06-0301
Grant 60 30 John Day Reed #1 Canyon Creek 0.71 06-0303
Grant 60 30 John Day Stimac Pump Canyon Creek 0.43 06-0306
Grant 59 30 John Day Blanchet Pump John Day River 0.62 06-0309
Grant 60 30 John Day Lassen East Fork Canyon Creek 0.69 06-0310
Grant 59 30 John Day Rixen Pump South Fork John Day River 0.36 06-0332
Grant 59 30 John Day Johnson Pump South Fork John Day River 0.72 06-0443
Grant 59 30 John Day Vote Pump #3 Cupper Creek 0.05 06-0446

Fish Screens Installed July 1, 2009 to December 31, 2010
Oregon Department of Fish and Wildlife 15
County Name
House District
Senate District
Basin Project Title Stream Flow Rate
Project #
Grant 59 30 John Day Durkheimer Pump John Day River 0.84 06-0462
Grant 60 30 Malheur Burns Paiute Tribe Lake Creek 1.20 10-0031
Harney 60 30 Malheur Van Drewsey Grazing Association Wolf Creek 4.00 10-0033
Jackson 5 3 Rogue Offenbacher-Fowler Ditch Applegate River 8.70 15-0025
Jackson 4 2 Rogue Rose Rogue River 0.85 15-0369
Jackson 2 1 Rogue Edwards Evans Creek 0.28 15-0404
Jackson 55 28 Rogue Bowers Rogue River 0.06 15-0432
Josephine 4 2 Rogue Gaither West Fork Williams Creek 0.60 15-0430
Josephine 3 2 Rogue Mackenzie Applegate River 0.60 15-0495
Klamath 56 28 Klamath Running Y - Geary Caledonia Canal 60.00 14-0008
Lake 55 28 Goose & Summer Lakes Farr #2 Deep Creek 2.90 13-0036
Lake 55 28 Goose & Summer Lakes Taylor Ranch #2 Honey Creek 7.50 13-0041
Lake 55 28 Goose & Summer Lakes Taylor Ranch #3 Honey Creek 3.23 13-0042
Lake 55 28 Goose & Summer Lakes Williams Ditch Cottonwood Creek 7.00 13-0049
Lane 17 9 Willamette Byler Pump Coast Fork Willamette River 0.48 02-0273
Lane 11 6 Willamette Schluckebier Pump Unnamed slough 1.00 02-0295
Lane 11 6 Willamette Schutte Pump #1 Middle Fork Willamette River 0.44 02-0316
Lane 11 6 Willamette Schutte Pump #2 Middle Fork Willamette River 0.44 02-0317
Lane 10 5 Willamette Evans Timber Pump Eber Creek 0.22 02-0318
Lane 7 4 Willamette Kintigh Pump Row River 0.89 02-0326
Lane 11 6 Willamette Lamont Pump McKenzie River 0.34 02-0330
Linn 17 9 Willamette Van Essen Pump #1 South Santiam River 0.47 02-0274
Linn 17 9 Willamette Van Essen Pump #2 South Santiam River 0.12 02-0275
Linn 17 9 Willamette Van Essen Pump #3 South Santiam River 0.40 02-0276
Linn 17 9 Willamette Van Essen Pump #4 South Santiam River 0.50 02-0277
Linn 17 9 Willamette Van Essen Pump #5 South Santiam River 0.16 02-0278
Linn 17 9 Willamette Van Essen Pump #7 South Santiam River 1.00 02-0279
Linn 16 8 Willamette Hathaway Pump #2 Willamette River 2.44 02-0283

Fish Screens Installed July 1, 2009 to December 31, 2010
16 Oregon Department of Fish and Wildlife
County Name
House District
Senate District
Basin Project Title Stream Flow Rate
Project #
Linn 15 8 Willamette Gray Pump #1 Willamette River 1.44 02-0306
Linn 15 8 Willamette Gray Pump #2 Willamette River 1.44 02-0307
Lane 11 6 Willamette Schluckebier Pump Unnamed slough 1.00 02-0295
Lane 11 6 Willamette Schutte Pump #1 Middle Fork Willamette River 0.44 02-0316
Lane 11 6 Willamette Schutte Pump #2 Middle Fork Willamette River 0.44 02-0317
Linn 15 8 Willamette Gray Pump #3 Willamette River 1.44 02-0308
Linn 17 9 Willamette Steagall Pump South Santiam River 0.13 02-0311
Marion 18 9 Willamette Netter Pump Pudding River 1.55 02-0280
Marion 18 9 Willamette DeSantis Pump Powers Creek 0.41 02-0293
Marion 23 12 Willamette McGill Pump #1 Marion Creek 0.17 02-0309
Marion 23 12 Willamette McGill Pump #2 Sidney Ditch 0.45 02-0310
Marion 23 12 Willamette Meyer Pump #1 Unnamed Stream 0.89 02-0314
Marion 23 12 Willamette Meyer Pump #2 Sidney Ditch 1.00 02-0315
Marion 25 13 Willamette Niehus Pump Willamette River 0.67 02-0319
Marion 25 13 Willamette Niehus Trust Pump Willamette River 0.67 02-0320
Marion 17 9 Willamette Koenig Pump #1 Alder Creek 0.89 02-0324
Marion 17 9 Willamette Koenig Pump #2 North Santiam River 0.89 02-0325
Marion 23 12 Willamette Meyer Pump #3 Sidney Power Ditch 1.22 02-0327
Morrow 57 29 John Day Anson Wright Park Rock Creek 1.65 06-0323
Sherman 59 30 John Day Weedman Pump John Day River 0.72 06-0307
Tillamook 32 16 North Coast Pacific City Screen Horn Creek 2.70 01-0035
Tillamook 32 16 North Coast Sliman Pump Little Nestucca River 0.16 01-0036
Union 57 29 Grand Ronde Ladd Marsh Wildlife Area Ladd Creek Pickup Ditch 2.03 08-0040
Union 57 29 Grand Ronde Galloway Pump Indian Creek 3.58 08-0041
Union 57 29 Grand Ronde West Pump Grande Ronde River 4.72 08-0043
Union 57 29 Grand Ronde Rudd Pump #1 Grande Ronde River 4.17 08-0044
Union 57 29 Grand Ronde Rudd Pump #2 Grande Ronde River 3.30 08-0045
Union 57 29 Grand Ronde Huber Pump Willow Creek 1.14 08-0046

Fish Screens Installed July 1, 2009 to December 31, 2010
Oregon Department of Fish and Wildlife 17
County Name
House District
Senate District
Basin Project Title Stream Flow Rate
Project #
Union 57 29 Grand Ronde Delint #1 State Ditch 1.70 08-0047
Union 57 29 Grand Ronde Delint # 2 Grande Ronde River 4.45 08-0048
Union 57 29 Grand Ronde Delint # 5 Grande Ronde River 2.28 08-0050
Wheeler 59 30 John Day 007 Ranch Pump #1 John Day River 2.50 06-0018
Wheeler 59 30 John Day 007 Ranch #3 Unnamed Stream 1.60 06-0059
Wheeler 59 30 John Day Hash Knife Ranch # 1 Bridge Creek 4.85 06-0126
Wheeler 59 30 John Day Vanier #1 Birch Creek 1.20 06-0258
Wheeler 59 30 John Day Vanier #2 Birch Creek 1.20 06-0259
Wheeler 59 30 John Day Marks Mountain Creek 3.00 06-0292
Wheeler 59 30 John Day Perry Bridge Creek 1.13 06-0318
Wheeler 59 30 John Day Polvi Gable Creek 2.70 06-0319
Wheeler 59 30 John Day 007 Ranch Pump #2 Bridge Creek 1.30 06-0431
Wheeler 59 30 John Day 007 Ranch Pump #3 Bridge Creek 1.80 06-0439
Yamhill 24 12 Willamette Christensen Pump South Yamhill River 1.47 02-0294
Yamhill 24 12 Willamette Rohde Pump #1 Lambert Slough 1.00 02-0331
Yamhill 24 12 Willamette Rohde Pump #2 Lambert Slough 1.00 02-0332
127 Total Projects Total CFS 301.16

18Project Summary
18 Oregon Department of Fish and Wildlife
Located near the Old Mill District in Bend, this screen protects redband trout from being diverted into a storage pond.
Project Number: S-05-0079 Project Name: Old Mill Screen
Project Type: 5.99 cfs vertical panel wiper screen
Completion Date: September 2009 Stream: Deschutes River Basin: Deschutes Basin Water Use: Water from this diversion is used for irrigation, fire suppression
& aesthetic value.
Project Description: This project installed a fish screen at a previously unscreened diversion near the Old Mill District on the Deschutes River in Bend. The landowner provided the concrete work, handrails, and electrical hookups. The screen was fabricated and installed by the Program’s The Dalles Screen Shop.
Project Location: The site is located in Bend, in Deschutes County, Oregon.
Cost Breakdown: ODFW: $ 9,515 Water User: $ 6,343 Total: $15,858
Fish Species Affected: Redband Trout and other non-game native fish

Highlighted Projects
Oregon Department of Fish and Wildlife 19
This photo was taken just after construction, prior to the irrigation season. Once the screen is operational, the drum will be solar powered.
Project Number: S-05-0094 Project Name: Wolf Creek #2
Project Type: 0.72 cfs solar rotary drum screen
Completion Date: October 2009 Stream: Wolf Creek Basin: Deschutes Basin Water Use: Water from this diversion is used for irrigation.
Project Description: This project screened a previously unscreened diversion that delivers water for irrigation. The District Biologist identified this as a high priority project because the Wolf Creek watershed hosts the strongest population of an important population of redband trout in the Beaver Creek subbasin. The screen was fabricated and installed by the Program’s The Dalles Screen Shop.
Cost Breakdown: ODFW: $ 9,098 Water User: $ 6,065 Total: $15,163
Project Location: The site is near Paulina, in Crook County, Oregon.
Fish Species Affected: Redband Trout and other non-game native fish

20Project Summary
20 Oregon Department of Fish and Wildlife
When the water in Whychus Creek rises, water will flow thru this screen into an irrigation ditch.
Project Number: S-05-0095 Project Name: Leithauser Screen
Project Type: 1.12 cfs vertical passive panel screen
Completion Date: October 2009 Stream: Whychus Creek Basin: Deschutes Basin Water Use: Water from this diversion is used for irrigation.
Project Description: This project installed a passive panel screen on a previously unscreened diversion within the City of Sisters. Screening at this site was a priority to protect native resident redband trout and contributed to ongoing efforts to successfully reintroduce summer steelhead and spring chinook into Whychus Creek. The new screen was fabricated and installed by the Program’s The Dalles Screen Shop.
Project Location: The site is in Sisters, in Deschutes County, Oregon. Cost Breakdown: ODFW: $2,070 Water User: $1,302 Total: $3,372
Fish Species Affected: Redband Trout; Steelhead; Chinook, Salmon, and other non-game native fish

Project Summary
Oregon Department of Fish and Wildlife 21
The screen was fabricated in the John Day Screen Shop and delivered onsite ready for installation.
Project Number: S-06-0126 Project Name: Hash Knife Ranch #1
Project Type: 4.85 cfs paddle wheel driven rotary drum screen
Completion Date: August 2010 Stream: Bridge Creek Basin: John Day Basin Water Use: Water from this diversion is used for irrigation.
Project Description: This was part of a larger project to consolidate two water diversions, replace two non-criteria fish screens, and install a fish passage structure. Both of the old style rotary drum screens that were replaced were undersized and did not meet current fish screening criteria. The new dual bay screen provides water for irrigation. This was a high priority project that protects threatened summer steelhead and other fish. The project was fabricated and installed by the Program’s John Day Screen Shop. Project Location: The site is near Mitchell, in Wheeler County, Oregon.
Cost Breakdown: ODFW: $31,538 Bonneville Power Administration: $ 4,358 Total: $35,896
Fish Species Affected: Steelhead, Redband Trout, Pacific Lamprey, and other non-game native fish.

22Project Summary
22 Oregon Department of Fish and Wildlife
This pump screen replaced a worn out screen that had fish inside.
Project Number: S-08-0041 Project Name: Galloway Pump Replacement Project Type: 3.58 cfs pump screen
Completion Date: August 2010 Stream: Indian Creek Basin: Grande Ronde Basin Water Use: Water from this diversion is used for irrigation. Project Description: In 1997, the Program installed a concrete diversion structure to prevent the need for an annual push up dam and installed a pump screen. The diversion structure is still in good condition, but the screen had worn out. The
bearings, rollers, and baffle systems were worn and there were several three inch holes in the screening material. The Program’s Enterprise Screen Shop replaced the worn screen with a new Sure-Flo brand pump screen, which was purchased from a local supplier. Project Location: The site is located near Elgin, in Union County, Oregon.
Cost Breakdown: ODFW: $ 2,612 Total: $ 2,612
Fish Species Affected: Spring Chinook, Summer Steelhead, Bull Trout, and other non-game native fish.

Project Summary
Oregon Department of Fish and Wildlife 23
Fish are protected from entering the large diversion by this three bay rotary drum screen.
Project Number: S-09-0033 Project Name: Melhorn
Project Type: 17 cfs rotary drum screen
Completion Date: July 2010 Stream: Clear Creek Basin: Powder Basin Water Use: Water from this diversion is used for domestic, irrigation, and
stock water. Project Description: This screen was installed at a large unscreened diversion. A triple bay rotary drum screen was constructed by the Program’s John Day shop. ODFW partnered with the
landowner and Eagle Valley Soil and Water Conservation District to complete the installation. Project Location: The site is located northeast of Halfway, in Baker County, Oregon.
Cost Breakdown: ODFW: $40,624 Water User: $27,082 Total: $67,706
Fish Species Affected: Redband and Bull Trout and other non-game native fish.

24Project Summary
24 Oregon Department of Fish and Wildlife
The head gate structure provides important flow adjustment to the screen. Proper flows are important for screens to work properly.
Project Number: S-10-0031 Project Name: Burns Paiute Tribe
Project Type: 1.2 cfs rotary drum screen
Completion Date: August 2009 Stream: Lake Creek Basin: Malheur Basin Water Use: Water from this diversion is used for irrigation.
Project Description: The Burns Paiute Tribe diverts water for irrigation. The diversion site is located on US Forest Service property in the Malheur National Forest. The diversion was previously unscreened. This high priority new screen was installed in a habitat area occupied by ESA listed bull trout. Partnering with the Tribe and US Forest Service, ODFW’s John Day Screen Shop fabricated and installed the screen and head gate structure. Project Location: The site is approximately 30 miles from John Day, in Grant County, Oregon. Cost Breakdown: ODFW: $15,012 Water User: $10,008 Total: $25,020
Fish Species Affected: Brook, Bull, and Redband Trout and other non-game native fish.

Project Summary
Oregon Department of Fish and Wildlife 25
Horizontal Fish Screen
Project Number: S-10-0033 Project Name: Van Drewsey Grazing Association
Project Type: 4 cfs horizontal flat plate screen
Completion Date: August 2009 Stream: Wolf Creek Basin: Malheur Basin Water Use: Water from this diversion is used for irrigation. Project Description: This project screened a previously unscreened diversion with a Farmers Conservation Alliance (FCA) horizontal fish screen. Horizontal fish screens have no moving parts. All of the diverted water flows over the screen. Bypass water, fish, and debris stay on top of the screen and are returned to the river while the irrigation water drops thru the screen.
This project was phase 6 of a much larger project to protect fish in the Wolf Creek Drainage. The larger project included placement of large woody debris, head cut stabilization, culvert replacement, and riparian fencing. This diversion, located within the Malheur National Forest, provides water for two different water users. This project was installed by the Program’s John Day Screen Shop in partnership with FCA, US Forest Service, and the water users. Project Location: The site is near Drewsey, in Harney County, Oregon.
Cost Breakdown: ODFW: $19,029 Water User: $12,686 Total: $31,715
Fish Species Affected: Redband trout and other non-game native fish.

26Project Summary
26 Oregon Department of Fish and Wildlife
Six traveling belt screens provide water needed for irrigation.
Project Number: S-14-0008 Project Name: Running Y - Geary
Project Type: 60 cfs traveling belt screens
Completion Date: November 2010 Stream: Caledonia Canal at Klamath Lake Basin: Klamath Basin Water Use: Water from this diversion is used for irrigation.
Project Description: This project installed a state of the art screen system at a previously unscreened diversion at the confluence of Caledonia Canal and Klamath Lake. The screen system includes six traveling belt screens, head gates, and an electronic control system. The Program’s Central Point Screen Shop; US Bureau of Reclamation; US Fish and Wildlife Service; and Running Y Ranch, the water user, were all instrumental in the design and construction of this project. Project Location: The site is near Klamath Falls, in Klamath County, Oregon.
Cost Breakdown: Water User: $ 91,187 ODFW Measure 66: $ 199,986 ODFW License Surcharge $ 15,447 US Fish & Wildlife Service $ 118,000 Bureau of Reclamation $ 433,134 Total: $ 857,754
Fish Species Affected: Klamath Largescale, Lost River, and Shortnose Sucker; Redband Trout; and other native fish.
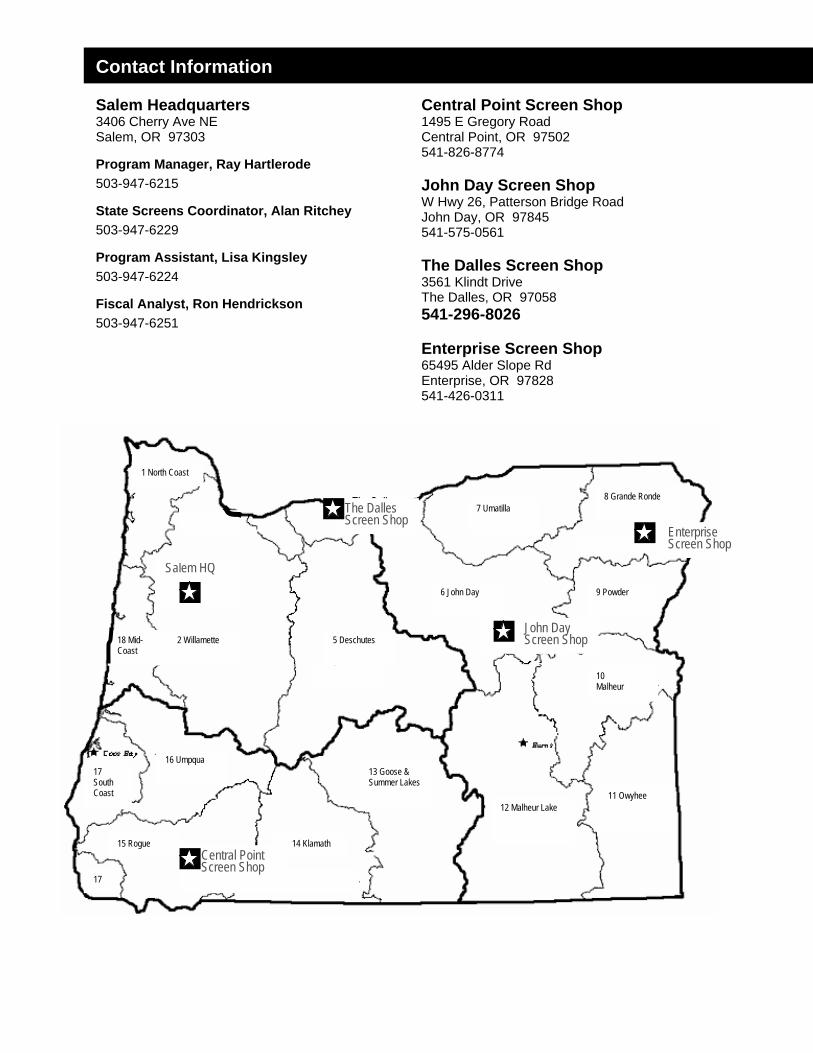
Contact Information
Salem Headquarters 3406 Cherry Ave NE Salem, OR 97303
Program Manager, Ray Hartlerode 503-947-6215
State Screens Coordinator, Alan Ritchey 503-947-6229
Program Assistant, Lisa Kingsley 503-947-6224
Fiscal Analyst, Ron Hendrickson 503-947-6251
Central Point Screen Shop 1495 E Gregory Road Central Point, OR 97502 541-826-8774
John Day Screen Shop W Hwy 26, Patterson Bridge Road John Day, OR 97845 541-575-0561
The Dalles Screen Shop 3561 Klindt Drive The Dalles, OR 97058 541-296-8026
Enterprise Screen Shop 65495 Alder Slope Rd Enterprise, OR 97828 541-426-0311
The Dalles Screen Shop
Enterprise Screen Shop
14 Klamath
13 Goose & Summer Lakes
12 Malheur Lake
10 Malheur
11 Owyhee
9 Powder
8 Grande Ronde 7 Umatilla
6 John Day
5 Deschutes
2 Willamette
15 Rogue
17
17 South Coast
18 Mid-Coast
1 North Coast
John Day Screen Shop
Salem HQ
Central Point Screen Shop
16 Umpqua

Oregon Department of Fish and Wildlife
3406 Cherry Ave NE Salem, OR 97303
Printed on recycled paper with soy ink

1
Oregon Aquatic Invasive Species Prevention Program
2010 Program Report
Prepared by:
Glenn Dolphin – Oregon Marine Board
Rick Boatner – Oregon Department of Fish & Wildlife
February 2011

2
Program Background
In 2001, to respond to the growing threat of invasive species to the state of Oregon, the Oregon Invasive Species Council (OISC) was created by the Oregon State Legislature. The mission of the Council is to conduct a coordinated and comprehensive effort to keep invasive species out of Oregon and to eliminate, reduce, or mitigate the impacts of invasive species that are already established. In 2001, Portland State University (PSU) developed an Oregon Aquatic Nuisance Species Management Plan, which was the first step to define activities in the state that address the impacts of aquatic invasive species (AIS). By 2007, an extremely destructive fresh water invasive species called the quagga mussel (Dreissena bugensis), was detected in Lake Mead, Nevada. As a result of this infestation many Western States implemented programs to protect water bodies against the spread of this highly destructive species. Most of these efforts focused on establishing recreational boat inspection stations and implementing early detection and rapid response (EDRR) strategies.
The OISC requested that the Oregon Department of Fish and Wildlife (ODFW), the Oregon State Marine Board (OSMB), the Oregon Department of Agriculture (ODA), and PSU jointly lead the development of a state plan to address the growing threat and spread of the quagga mussel. Initially the plan included developing boat inspection stations along the borders of the state’s main highways and to require trailered watercraft to stop for an AIS inspection. A program budget was submitted to the 2009 Oregon Legislative Assembly to create the infrastructure to build border inspection stations and to staff them at an adequate level for intercepting watercraft before entering the state. After the budget was submitted, Oregon State Police with a determination from the State Attorney General’s office deemed mandatory check stations an unreasonable search under the Oregon Constitution.
The Legislature then proposed a different approach in June 2009 for ODFW and OSMB to develop a boat permit program modeled after Idaho who implemented their program in April 2009. This approach established a new user fee on boats (both motorized and non-motorized) and would use the funds to implement a state-wide prevention program. This new dedicated program would fund mobile boat inspection teams, public education and outreach efforts and implement other related activities to protect Oregon against AIS. This new approach for a state-wide program was reflected in House Bill 2220. Developed alongside this effort was another new law, House Bill 2583 making it illegal to launch a boat in Oregon waters with any aquatic species attached to the exterior and/or any aquatic invasive species located within the interior of a boat.

3
Program Rulemaking
After public hearings and several committee work sessions, House Bills 2220 and 2583 were approved by the House and Senate and signed by the Governor in June and July 2009. OSMB, ODA, and ODFW subsequently wrote and implemented program rules for implementation on January 1, 2010.
The following are the OSMB program statutes and rules:
830.560 – Launching boat with aquatic invasive species prohibited
830.565 – Boat permit required
830.570 – Board to issue permit; fees
830.575 – Fees for permit
830.580 – Rules; contracting services
830.585 – Aquatic Invasive Species Prevention Fund
250-010-0650 – Aquatic Invasive Species Prevention Permit – Rules
The following are the ODFW program rules:
635-059-0000 – Purpose and General Information
635-059-0010 – Aquatic Invasive Species Reporting Information
635-059-0050 – Allowable Blind Material for boats
The following are the ODA program statutes:
570.855 – Watercraft check stations
570.860 – Report of prevention efforts
570.865 – Penalty for transporting aquatic invasive species
Program Goal
To protect Oregon against the introduction and spread of aquatic invasive species. Quagga and Zebra mussels (Dreissena polymorpha), along with Hydrilla (Hydrilla verticillata) are among the top species of concern to keep out of the state. Species like Eurasian watermilfoil (Myriophyllum spicatum) and New Zealand Mudsnails (Potamopyrgus antipodarum) already contaminate some Oregon waterbodies and need to be contained at current locations.

4
Agency Roles
Oregon State Marine Board
As the state agency in charge of managing recreational boating, OSMB has the lead role to implement the Aquatic Invasive Species Permit Program (AISPP) for boats. This permit program is the funding mechanism that supports all of the activities outlined in this annual report. All permit fees are deposited into the Aquatic Invasive Species Prevention Fund, established in the State Treasury and is separate and distinct from the General Fund. Revenue is appropriated to the OSMB for administering the AIS program. Monthly deposits are then made to ODFW from the fund to support their activities.
The AIS coordinator for the OSMB is engaged in public education and outreach activities about the requirements of the permit program and other AIS topics. The coordinator develops and distributes printed material (brochures, posters, signs, etc.) to state-wide partners, including recreational watersport businesses. Coordination and law enforcement training is also an OSMB and ODFW shared activity. County Sheriff Deputies and Oregon State Police Troopers are contracted with the OSMB and ODFW to enforce their respective agency regulations.

5
Oregon Department of Fish and Wildlife
As the state agency in charge of managing fish and wildlife resources, ODFW has the primary responsibility to implement the boat inspection stations. Check stations are staffed by trained ODFW employees that have the necessary skills and equipment to decontaminate watercraft, if needed. Inspectors also engage with the public in education and outreach efforts. This can be in the form of providing printed materials at the check stations, attending boating events to provide information, teaching watercraft inspection workshops or attending public meetings to speak about the program. In addition, ODFW inspectors also sample water bodies for the presence of targeted aquatic species.
The AIS coordinator for ODFW manages the inspection teams and determines their work locations and schedules. The coordinator participates in education and outreach activities to the public and is also involved with state-wide projects to manage species of concern and implement strategies that address eradication, control or containment of AIS.
The AIS Prevention Program for the 2010 season comprised of ten Aquatic Invasive Species Technicians (AIST). The technicians were divided into five teams (two people/team) stationed in Clackamas, Salem, Central Point, Madras and La Grande (Figure 1). Watercraft Inspection Teams (WIT) typically worked four, ten-hour days, Wednesday through Saturday. A normal work week was split between roadside inspections (e.g. highway rest areas and waysides) and boat ramp inspections throughout the state.
Each AIST completed the 100th Meridian Initiative Watercraft Inspection Level 1 training course and nine AIST’s completed the 100th Meridian Initiative Watercraft Inspection and Decontamination Level 2 course at Lake Mead, Nevada. The training at Lake Mead gave each AIST the opportunity and experience to decontaminate boats infested with quagga mussels, and to witness their effects on the environment.
2010 Program Activities
Boat permit program
Since January 1, 2010, all motorized boats (regardless of length) and non-motorized boats 10ft in length or longer, are required to purchase and carry an aquatic invasive species prevention permit. Oregon registered motorboats pay a $5 surcharge every two years when they pay their biannual registration. Their registration decals serve as proof of payment into the program. Non-motorized boats 10ft in length or longer are required to purchase an annual $5 permit and carry it onboard while boating. These non-

6
motorized permits are transferable between boats and the name on the permit doesn’t have to match the person using it. Out-of-state visitors using non-motorized boats pay the same $5 annual fee as Oregon residents. However, non-resident motorboat operators are required to purchase a $20 annual permit. These permits purchased by non-resident boaters are also transferable to use on other boats in the same category. During 2010, these permits were issued on water proof paper and available for purchase either through an ODFW license agent (ex. sporting goods stores), from an OSMB registration agent (ex. boating store), the OSMB office in Salem, an ODFW field office, or online through the ODFW website. A $2 agent fee was charged by all of the agents selling permits. The exceptions were the OSMB Salem office or select REI stores (for members only).
Businesses in Oregon that either rent non-motorized boats to the public (referred to as liveries) or river guides using manually powered watercraft for group-guided activities, are able to buy permits for their boats at a special discounted rate, depending on how many boats the business owns. The discounted rates were devised because of the large number of boats that some liveries and guides own and also to mirror a discount system that motorized boat liveries follow for rented boats.
Education and Outreach
To introduce the new AIS permit program to the public, the OSMB developed a communications and outreach plan in October 2009. New printed materials were designed and produced for statewide distribution. Website pages were developed and notices were sent to register motor boat owners. The OSMB also researched and identified as many boat clubs as possible (both motorized and non-motorized) and sent them a letter outlining the new state laws. In January 2010, the Portland Boat Show was one of the key outreach venues to communicate to boaters about the new AIS program and all of the new print materials were showcased. In addition, ODFW licensing agents (approximately 475 in total) were sent the new program materials to distribute to the public. Boat liveries and guides were also notified by mail about the discount rate available to them for permits. Over the course of the 2010 boating season, the OSMB also had 35 other recreational businesses (non-ODFW agents) purchase permit books to re-sell to the public. These dealers were sent print materials for distribution to their customers.
Billboards were posted on Oregon interstate highways in four locations from April – September 2010. Artwork was shared by the Idaho Department of Agriculture who manages that state’s AIS prevention program. As a strategy both Oregon and Idaho agreed to keep a consistent message and share graphics for highway billboards to reinforce the message to the public. Idaho posted billboards in numerous locations during 2009 and 2010.

7
In addition to printed materials, the OSMB designed a new boat ramp sign for boating access sites around the state. A distribution plan was developed to post the signs at high-risk water bodies for a possible quagga or zebra mussel infestation (based on water chemistry, location and boater use). Because of a limited first-year program budget, the sign purchases have been done in phases.
The first signs (summer 2010) were distributed to eastern Oregon boat ramps. A second printing (Fall 2010) was targeted towards Willamette Valley, southern
Oregon and Columbia River sites. An anticipated third printing (Spring 2011) will be targeted to coastal facilities. A fourth printing (Summer 2011) will be done if needed to fill-in any gaps in
coverage.
The primary message in all of the newly designed outreach materials is “Clean, Drain, Dry”. This message is being replicated through partnerships with all of the western states as they create new materials for communicating the AIS message to the public. To facilitate this activity all western states AIS coordinators participate in the “Western Regional Panel on Aquatic Nuisance Species”. This group is coordinated by the U.S. Fish and Wildlife Service. The consistent messaging will help the public understand the call for action and more effectively prevent the spread of AIS by cleaning their recreational gear.
During 2010 additional AIS boat ramp sign concepts have been discussed. For example: developing a sign specifically for non-motorized boat access sites and a sign that could be posted at a water body that contains a specific invasive species to inform the public of its presence. These concepts will be further explored during 2011 and may depend on available funding for implementation.
Highway Signage
In June of 2010, the OSMB signed an interagency agreement with the Oregon Department of Transportation (ODOT) to design, construct and install informational signs on highways at border locations leading into the state. These signs inform non-residents transporting boats into Oregon of the requirement to purchase an AIS permit. A total of 18 locations were identified for installation. During the 2010 fiscal year ten of these signs were installed, with the remaining eight to be installed during 2011.

8
Public presentations and events
In 2010, OSMB and ODFW were invited to give AISPP presentations to many groups, organizations, clubs and other public events throughout the state. These contacts provided face-to-face opportunities to explain the program and its environmental benefits. Skeptics were often in attendance at these presentations, providing a great educational opportunity. Overall there was a broad base of support for the efforts of the AISPP once it was fully explained. Shown in the table below is the breakdown of events attended during 2010.
Training
Level 1 – Watercraft Inspection Training (WIT) for Zebra and Quagga Mussels
A special training course has been offered for free over the past couple of years to the public and government agencies upon request. This Level 1, WIT is a 3.5 hour class teaching students about the biology of aquatic invasive species of concern to Oregon (and those already present in the state), the specifics of the new AIS permit program and the techniques used to perform a watercraft inspection for zebra and/or quagga
Table 1. Public Presentations and Events - 2010
Lead Agency
Meeting Presentations
Public events
ODFW 33 15
OSMB 14 4

9
mussel contamination. Upon completion of this training, students earn a certificate of completion. This Level 1 course has been taught annually over the last three years. During 2008 and 2009, a partnership formed between the OSMB, ODFW and PSU using existing resources to train and educate people about AIS. During 2010 with the implementation of the new AISPP, ODFW has taken a lead role in implementing these trainings.
Training instructors have all gone through a Level 2 WIT class held at Lake Mead, Nevada each year. The Level 2 course is a two-day, hands-on program teaching students how to identify what a quagga mussel contaminated boat looks like and how to use a portable pressure washer unit with hot water (140o F) to perform a boat decontamination. Lake Mead is the training location because it is contaminated with the quagga mussels (since 2007) and students are able to see what an infested boat looks like. A summary of the Level 1 trainings held in Oregon is outlined below in Table 2.
Table 2. Oregon Level 1 Watercraft Inspection Trainings
Year Number of Trainings Number of Students
2008 6 92
2009 9 149
2010 11 233
Totals 26 474
Media Coverage
Oregon has come a long way during the past four years raising awareness about AIS to Oregonians. Much awareness came from a 2008 broadcast called “A Silent Invasion”. OISC partnered with Oregon Public Broadcasting (OPB) to produce this Oregon Field Guide segment. This hour long documentary aired on OPB several times throughout 2008. A complimentary invasive species information and reporting website was also developed (www.oregoninvasiveshotline.org) along with the documentary. In 2009, OPB won the prestigious DuPont-Columbia Journalism Award for “The Silent Invasion”.
Unfortunately, the invasive species issue is hard for the public to understand. Upon passage of the AISPP law the media often focused on the new fee and its unpopularity. A few editorials even criticized the entire program concept. Therefore the education piece of the program is one of, if not the most important element of the overall program and will continue to be a major focus of efforts in 2011.

10
To monitor media coverage the OSMB collects and documents boating related print media articles. From August 2009 to December 2010, there were 60 AISPP articles written in 31 different Oregon newspapers. During this same time period, the OSMB produced seven press releases and ODFW produced four. Both agency AIS coordinators were also interviewed for radio and TV news stories broadcasted in the Portland and Eugene markets.
In April of 2010 the OSMB and ODFW AIS coordinators worked with Grant McOmie (an outdoor reporter for the NBC news affiliate KGW Channel 8 in Portland) to produce a television story about the new AISPP. The TV segment was shown on a weekly “Grant’s Getaway” news clip, posted on the Travel Oregon website and on the OSMB website. The show provided a great opportunity to talk about the merits of the program and demonstrated a proper boat inspection to the public.
Watercraft Inspection Team Activity
Roadside Inspection Sites
Watercraft Inspection Teams conducted inspections at the following state-wide rest areas: Wilsonville, Santiam, Ogden, Chemult, Baker Valley and Midland. Additionally, inspections were performed off I-84 at Farewell Bend, near Idaho and the I-5 Port of Entry near Ashland (Figure 2). Inspections were also conducted at the request of watercraft owners at their personal residence or at a designated location.
Watercraft Inspection Teams conducted 681 voluntary inspections at eight sites (Table 3) and an additional 14 inspections at the request of watercraft owners. To gain compliance data, when visibility permitted, WIT’s recorded the number of watercraft that drove by an inspection site without stopping. On days when observations were possible, WIT’s inspected 422 watercraft and observed 1,155 trailered watercraft pass the inspection sites; resulting in a 27% compliance rate for the voluntary inspection stations.
Table 3. Location and number of ODFW roadside watercraft inspections.
Inspection station location Number of inspections Baker Valley Rest Area 115 Chemult Rest Area 29 I-5 Port of Entry, Ashland 145 Midland Rest Area 4 Ogden Rest Area 26 Farewell Bend 8 Santiam Rest Area 109 Wilsonville Rest Area 245

11
All roadside inspection sites were identified by three 48”x48” orange reflective diamond shape signs with 6-8 inch lettering. The signs were placed along the highway in succession at 2,640 ft (.5 mi), 1,500 ft (.28 mi.) and 1000 ft (.18 mi.) before an off-ramp. The first sign read “Boat Inspection Ahead”, the second “Boat Inspection Next Right” and the third “Boat Inspection” with a directional arrow pointing to the inspection station. The signs were designed and displayed in accordance with Oregon Department of Transportation protocols.
Boat Ramp Inspection Sites
Watercraft Inspection Teams completed 2,157 boat inspections at 48 boat ramps throughout Oregon. Inspection stations were set up at several additional boat ramps; however, inspections did not occur due to a lack of launch activity (e.g. boats launched prior to the WIT’s arrival or no boats launched).
Table 4. Summary of ODFW boat ramp inspections by location and county.
Location Number of inspections County
Applegate Reservoir 28 Jackson Brownlee Reservoir 36 Baker Bully Creek Reservoir 1 Malheur Columbia River, Boardman 3 Morrow Columbia River, Chinook Landing 362 Multnomah Columbia River, Columbia Slough 32 Multnomah Columbia River, Gleason Ramp 6 Multnomah Columbia River, Hat Rock 2 Umatilla Columbia River, Hood River Marina 13 Hood Columbia River, McNary 18 Umatilla Columbia River, Umatilla 24 Umatilla Crane Prairie Reservoir 5 Deschutes Deschutes River, Heritage Park 2 Wasco Detroit Lake 207 Linn Devils Lake 8 Lincoln Diamond Lake 344 Douglas Dorena Lake 4 Lane Eel Lake 1 Coos Emigrant Lake 81 Jackson Fern Ridge Lake 16 Lane Fish Lake 13 Jackson Foster Reservoir 6 Linn Green Peter Lake 25 Linn

12
Henry Hagg Lake 93 Washington Howard Prairie Lake 106 Jackson John Day River, Le Page Park 20 Sherman Lake Billy Chinook 16 Jefferson Lake of the Woods 11 Klamath Lava Lake 1 Deschutes Lost Creek Reservoir 181 Jackson Olallie Lake 3 Jefferson Owyhee Reservoir 78 Malheur Paulina Lake 1 Deschutes Phillip Reservoir 1 Baker Prineville Reservoir 6 Crook Selmac Lake 13 Josephine Siltcoos Lake 1 Lane Ten Mile Lake 30 Coos Thief Valley Reservoir 3 Baker Timothy Lake 16 Clackamas Triangle Lake 4 Lane Unity Lake 3 Baker Wallowa Lake 104 Wallowa Wickup Reservoir 1 Deschutes Willamette River, Rogers Landing 26 Yamhill Willamette River, Wallace Marine Park 66 Polk Willamette River, Willamette Park 135 Multnomah Woahink Lake 1 Lane
.
Summary of Inspections
The five teams completed 2,852 watercraft inspections with eighty percent of the watercraft inspected being registered in Oregon, 7% Washington, 6% California, 4% Idaho and the remaining 3% included 23 other states and British Columbia (BC). Watercraft from 19 of the 27 states and BC came from states infested with quagga or zebra mussels (Table 4). The WITs conducted 19 decontaminations: five with hot water/high pressure and 14 physical removals of AIS. Teams did not observe any boats with quagga or zebra mussels. The five hot water decontaminations were necessary due to either New Zealand mudsnails presence, heavy aquatic fouling and marine organisms attached to boat hulls (i.e. barnacles, mussels, seaweed). Eurasian watermilfoil and other plant material accounted for 12 of the 14 physical removals of AIS with the remaining two decontaminations being marine mussels found on boat hulls and trim tabs.

13
Table 5. Watercraft inspected by state and invasive mussel presence.
State or Province Number of watercraft inspections
Zebra or quagga mussels present in home state.
Alaska 1 no Arizona 17 yes – quagga British Columbia 2 no California 174 yes – both Colorado 6 yes – both Florida 6 no Idaho 102 no Illinois 3 yes – both Indiana 1 yes – both Louisiana 1 yes – zebra Maryland 1 yes – zebra Michigan 4 yes – both Minnesota 1 yes – both Missouri 1 yes – both Montana 11 no Nevada 11 yes – quagga New Mexico 1 yes – zebra North Dakota 1 yes – zebra Ohio 2 yes – both Oklahoma 1 yes – zebra Oregon 2,266 no Tennessee 1 yes – zebra Texas 5 yes – zebra Utah 4 yes – both Virginia 2 no Washington 198 no Wisconsin 1 yes - both Wyoming 2 no
Decontamination Equipment
ODFW purchased five, self-contained decontamination trailers, one for each WIT. Each trailer contains a water heater that can heat water temperatures in excess of 140oF and a pressure washer, capable of sustaining water pressure at 3,000 psi. The decontamination units meet or exceed all of the standards for watercraft decontamination of quagga/zebra mussels according to the 100th Meridian Initiatives standards. Four of the trailers have one, 180 gallon water tank and the other trailer has two, 250 gallon water tanks. Each trailer also contain a catch basin tarp (10’x 26’x2’’

14
with round foam walls) to capture any water during a watercraft decontamination and a siphon pump to recapture the water for proper disinfection and disposal.
Outreach and Education
All public contacts served as educational opportunities regardless of an individual’s boating habits. Watercraft Inspection Teams set-up a “booth” at their inspection site to distribute AISPP and aquatic invasive species information. The teams were also involved in giving presentations to fishing and hunting groups, State Park fireside talks and professional and civic organizations. Additionally, WITs had display booths at other public events throughout the state (e.g. Wallowa Watershed Festival, Deschutes County Fair, Turkey Rama Days, Race for The River, RiverFest and the Oregon State Fair).
Law Enforcement Activities
With any new law there is a certain amount of time needed for the public to learn of its existence and become aware of how to comply. This was especially true with the non-motorized boating community and out-of-state residents boating in Oregon. Even with all of the education and outreach activities already discussed in this report, a significant percentage of non-motorized boaters contacted on the water during 2010 by law enforcement officers (LEO) were not aware of the permit requirement.
Boat Permit Compliance
Compliance with the boat permit requirement by Oregon registered motor boats ($5 biennial surcharge) was relatively easy. Boaters cannot complete their registration renewal process until all required fees are paid. The same is now true in 2011 with any licensed boat guide. These are businesses that take the public out on guided trips and must renew their guide license with the OSMB every year. Starting in 2011 the $5 per boat surcharge for any non-motorized boats owned by a guide business, will be automatically included with their renewal process.

15
Another group of boats that saw high compliance rates were the non-motorized boat liveries and members of boating clubs. These organized groups of boaters were much easier to reach and therefore learned of the permit requirements early in the year. The casual non-motorized boater that only uses their boat a few times per year, or the active boater who is not part of an organized group was much harder to reach. When the OSMB asked law enforcement agencies to report an estimate on the compliance rate with non-motorized boaters, in July they reported less than 50% compliance. Early in 2010 the OSMB requested LEO’s focus on education instead of citations until after the Memorial Day weekend. Even after this, LEO’s primarily focused on educating boaters of the permit requirement. Throughout the 2010 boating season there was a mix of citations and warnings issued, however, many more warnings were issued than citations. It should be noted not all of the warnings given in the state were reported to the OSMB. Shown below is the breakdown of reported citations and warnings made by County Sheriff Marine Patrol Deputies.
In addition to the reported enforcement activity in table eight, two county sheriff departments’ implemented “fix-it-tickets”. This is a process where marine patrol deputies would issue boaters a citation for no AIS permit but offer them the opportunity to report to court with a newly purchased permit and have the citation dismissed. This gains compliance with the boater and doesn’t penalize them with a citation. Polk County deputies issued these tickets to 28 non-motorized boaters and Malheur County deputies issued these to 18 non-resident motorized boaters.
County marine patrol deputies also performed boat inspections for AIS and attended events to speak to the public about the new program. Statewide deputies logged 12.5 hours during 2010 with this activity.
The Fish and Wildlife Division of the Oregon State Police (OSP) was also very active during 2009 and 2010 with AIS activities. The OSP troopers kept track of hours spent
Table 6. AIS Boat Permit Enforcement Activity (reported)
Boat Category Warnings Citations
Non-motorized 25 7
Non-resident motorized 11 3
Total 36 10

16
on AIS activities and also the number of boater contacts made. Shown below is a summary of their work broken down by AIS category.
Table 7. OSP Reported AIS Activity
July 1, 2009 - December 31, 2009 Hours Boater
Contacts # Not in
Compliance Zebra/Quagga Mussels 21 5 0 Non-native Fish Introductions 14.5 0 0 Invasive Aquatic Species - Other 20.5 23 1 Total 56 28 1
January 1, 2010 - December 31, 2010 Hours Boater
Contacts # Not in
Compliance Zebra/Quagga Mussels 27 74 0 Non-native Fish Introductions 13 5 1 Invasive Aquatic Species - Other 273.25 265 58 Invasive Plants 17.5 13 0 AIS Boat Inspections 47 Total 377.75 357 59
Biennium Total 433.75 385 60
In addition to the above reported activity the SW region of OSP implemented AIS action plans for both 2009 and 2010. These action plans focused enforcement efforts on helping to prevent the spread of AIS. One focus area was to prevent the transportation of live fish into the state by educating boaters and anglers through enforcement saturations at various lakes and reservoirs in Jackson County during high peak use times. These action plans also focused on conducting saturation patrols on I-5 to monitor and inspect vehicles coming into Oregon with boats that might be transporting AIS. The following table summarizes the activity during these planned activities.
Table 8. OSP Action Plan Activities
HoursBoater
ContactsAIS Boat Exams
# of Citations
# of Warnings
2009 Action Plan 115 170 47 0 20 2010 Action Plan 140 312 139 0 39 Total 255 482 186 0 59

17
As shown with all the reported activity above, throughout the year many different LEO’s (county sheriff marine patrol deputies and state police fish & wildlife troopers) have taken the time in addition to their normal river patrols to assist with AIS activities. This has included interacting with the public at sportsman shows and county fairs, to assisting ODFW with operating boat inspection stations and speaking at meetings to stakeholders. In addition, OSP included a featured story about the AISPP in their on-line monthly newsletter in June 2010. These dedicated LEO’s are on the front-lines interacting with the public and sometimes in very hostile circumstances. They have done an outstanding job during the first year serving as advocates of a program some see as unnecessary. Their service is greatly appreciated in so many different ways.
Online Inspection Reporting Database
In 2009 the OSMB implemented a new management tool allowing all LEO’s enforcing boating laws to document their work into a secure on-line reporting database. This new database created opportunities to better track state-wide enforcement activities and to have citations, warnings, patrol hours and locations of enforcement activity more quickly accessible and more readily available for summary reports. With the success of this system it was decided to have a new section built that could be made available to the ODFW AIS boat inspectors. This would allow inspectors to enter in their field data for easy tracking and management. This collected data consists of: boat inspection location, name of inspector, type of watercraft, owners contact information, last waterbody visited and if the inspected boat was clean or contaminated with AIS. If a boat is found to be contaminated with AIS it is cleaned on-site and more detailed information is collected with regards to the specific AIS found. This database is very valuable as it documents all of the work done inspecting boats around the state. AIS program coordinators can easily use the stored information to help with management decisions and track the spread of AIS. The creation of this database was started in late summer 2010 and completed several months later. Therefore, the database was not available to the AIS inspectors during the summer boating season but all of the summer data was entered prior to this report being written. Future plans are for AIS inspectors to enter in data on either a daily or weekly schedule so program managers can have access to recently collected data and run reports upon request.
Program Financial Statement
The funds collected from the sale of permits are deposited directly into the Aquatic Invasive Species Prevention Fund established in the State Treasury, separate and distinct from the General Fund. The OSMB administers this fund and transfers a portion of the monies collected to ODFW on a monthly basis. During the year collected monthly

18
revenues were being split by the three partner agencies. The ODFW and OSMB each received 40% and OSP 20%.
The first influx of revenue into the AISP Fund started with the biennial renewal of Oregon motorized boat registrations during November and December 2009. The OSMB has approximately 178,000 registered motor boats that renew their registration on a two year cycle. Approximately 89,000 of these boats renew each year. Renewal notices are sent to boaters in November of the year their registration expires. Following this renewal notice a large group of boaters usually renew their registrations before the end of their expiration year.
Table 9. Permits sold and Revenue Collected from Nov. 2009- Dec. 2010
In addition to reporting the program budget, it’s also relevant to document the amount of permits sold. When making comparisons between the different permit categories, it’s important to note that not all of the boaters using Oregon’s waterways knew of the permit requirement. In the categories of non-motorized and out-of-state motorized this is especially true. These two categories represented boaters that were not previously required to have any interaction with the OSMB for boating in Oregon prior to the AIS boat permit requirement. As stated in the law enforcement section, the non-motorized boat permit compliance rate was only around 50%. With more outreach and education activities planned in 2011, it is hoped that compliance rates will rise significantly during the coming year and consequently the revenue raised from that category will increase. Table five shows the amount of permits sold, taking into consideration the discount pricing rate for permits sold in bulk to non-motorized boat businesses (guides and liveries).
With the limited first year funding it was important to prioritize the expenditures for the program. Startup costs were high as was expected to purchase equipment (both field
Category Permits Revenue
Oregon Motorized 149,554 $747,770
Non-Motorized 45,594 $219,889
Out-of –State Motorized 3,388 $67,760
Interested Earned $2,084
Program Total 198,536 $1,037,503

19
and office) for new staff. In addition, certain program elements were either phased in slowly throughout the year or planned for implementation during the second year. The following list summarizes the major accomplishments of the program within the first year.
Funded Program Accomplishments:
Staffing:
ODFW – 1 AIS coordinator + 10 seasonal boat inspectors
OSMB – 1 AIS coordinator + 1 accounting technician + 1 information systems specialist
In addition all employees were fully equipped with office supplies (computers, desks, etc.).
Education and Outreach:
Printed and distributed 62,000 rack cards, 40,000 brochures and 800 posters.
Printed and have in storage ready for distribution in 2011 an additional 50,000 rack cards and 40,000 brochures.
Printed 30,000 inspection station rack cards for ODFW staff distribution.
Designed, constructed and distributed 150 boat ramp signs to Eastern Oregon boat ramp managers.
Ordered and have in storage an additional 150 boat ramp signs ready for distribution to Willamette Valley boat ramp managers during winter 2011.
Contracted with the ODOT to construct and install 10 highway informational signs.
Purchased quagga mussel encrusted educational displays (from Lake Mead NV) for ODFW boat inspection stations and public events (i.e. boat and sportsman shows).
Gave 47 program presentations to groups and attended 19 public events.
Organized 11 level 1 WIT trainings and certified 233 students.

20
Special Projects:
Contracted with a database designer to develop an on-line AIS reporting system for ODFW inspectors.
Contributed financial support to an OISC project for a new state-wide, all taxa, invasive species database that will include GIS mapping elements.
ODFW Boat Inspection program:
Purchased five mobile boat decontamination units. Purchased roadside inspection station supplies consisting of temporary highway
signs, tent canopy with publication display table and identifying sign banner. Equipped inspectors with all the necessary boat inspection tools including boat
wash water containment mats. Conducted 2,852 boat inspections statewide from 28 different states.
Stakeholders Committee
Based on comments received from the public during the summer boating season, the OSMB decided to convene a stakeholders committee to help strategize improvements for the future of the permit program. Representatives on the committee included: ODFW, OSMB, NW Outboard Trailer Sailors Boat Club, Non-motorized boat rental business, Polk County Marine Patrol Deputy, NW Rafters Association, North Santiam Watershed Council, OISC, NW Steelheaders and PSU. This committee was convened on September 24th 2010 and included 14 members; the agenda is included with this report as appendix B. The group made the following recommendations for improvement to the program:
Improve the delivery of the permit purchasing process and offer more options to non-motorized boaters.
Develop an OSMB purchasing system to accommodate more permit sales and offer permits for sale with no agent fee.
Offer non-motorized boaters the option to purchase a two year permit. This was proposed to be a Tyvek “raft tag” and/or a sticker.
Maintain the transferability of the non-motorized permits to use on multiple watercraft.
Offer a permit with no printed personal information on it.
Make available a one year Tyvek “raft tag” permit to non-motorized boat liveries.

21
Include the permit fees for boats owned by licensed guides into their annual business license renewal. Have the current system of issuing either Tyvek “raft tags” or stickers as proof of payment into the program and not require guides to carry additional paper permits.
In addition to the above recommendations, the OSMB had several minor housekeeping items to correct in the program rules and proposed to also include federally owned boats to the permit exemption list (state, county and city owned boats are already exempted from requiring a permit to operate). Consequently, the AISPP permit rules were opened up for public comment during the month of December with a public hearing held on December 29th 2010 as required by state law. In total there were five written comments received with the majority of them in favor of OSMB offering a two year permit. No members of the public attended the hearing held at the OSMB office.
January 2011 Update:
At the OSMB quarterly Board meeting on January 13th 2011 the staff recommendations for changes to the permit program rules were approved. All of the bulleted program recommendations outlined by the stakeholders committee are to be implemented. As of January 31st the OSMB had placed an order for new permit Tyvek tags to be printed and made available for sale to the public by mid-February. These permit tags will be offered as either a one or two year permit. Stickers will not be made available in 2011 but if adequate demand is documented, they will be considered for a 2012 printing.
Program Future Needs
As stated earlier in this report, a percentage of the non-motorized and non-resident motorized boat owners are still not aware of the new AIS permit requirement. A high priority for all the partner agencies will be to continue with a focus on educating the public about the program. Most of the public’s confusion about the program is because they don’t understand why the state has implemented the permit fee and how the collected funds are used. This annual report and the documented activity during 2010 will be used to further the efforts to inform the public about the AIS threat to Oregon and how the state is moving forward to prevent future infestations.
Because the funding source for all the programs activity comes completely from the sale of the AISPP, low compliance rates from non-motorized and non-resident motorized boats has caused the projected revenue levels to be less than originally expected. This has consequently caused the 2011 boat inspection activities planned by ODFW to be scaled back. In addition, because revenue levels are still unknown the OSMB has spent its portion of the budget very conservatively. Several planned activities were not implemented in 2010 for this reason (ex. establishing a grant program for AIS prevention and outreach activities and helping to fund county sheriff AIS work). If

22
compliance rates rise as a result of increased outreach activities and more presence from law enforcement officers, then a more complete program can be implemented by the partner agencies.
Another program need is to address the lack of authority by the state to implement mandatory watercraft inspection stations. During the 2010 inspection season 73% of the vessels being towed on Oregon roadways did not stop for the volunteer inspection stations set-up at roadside locations. This creates a problem because an AIS contaminated boat can be driven into Oregon, by-pass an inspection station and then launch in a waterbody, consequently spreading an environmentally damaging species. Of the vessels inspected, 26 states were represented (not including Oregon); 19 of those states currently have quagga or zebra mussel infestations. At the very least, management zones should be implemented where watercraft are required to stop and be inspected at the 18 points of entry into Oregon. The ability to conduct mandatory watercraft inspections at entry points would considerably improve the odds of identifying and decontaminating infested vessels before launching into Oregon waters. Employing mandatory inspections at points of entry would also help protect our neighboring states, just as they are already doing for Oregon.
During 2011 the OSMB, ODFW and OSP will continue to explore the options available under current state laws to try and implement a mandatory inspection program if deemed to be a legal activity.
Acknowledgements:
The Oregon Department of Fish and Wildlife would like to thank our Aquatic Invasive Species Technicians: Roger Allen, John Bingham, Jamie Crafton, Sam Dodenhoff, Becky Hill, Hayden Howell III, Lynn Lampkins, Dirk Patterson, Martyne Reesman and Jason Teem. A special thanks to Holly Truemper, ODFW Assistant District Fish Biologist and staff for conducting Diamond Lake inspections. Additional thanks to the Oregon Department of Transportation and Oregon Travel Information Council for granting us permission to use their rest areas as inspection sites. We would like to especially thank Eric Rickerson and Art Martin of ODFW, for providing guidance and support throughout 2010.
The Oregon State Marine Board would like to thank Randy Henry, OSMB Policy and Planning Analyst for leading the work to write and implement the AISPP boat permit program rules. In addition, thank you to the Oregon Invasive Species Council and all its members for their support during the 2009 legislative session, and to all the members of the AISPP stakeholders committee for reviewing and making suggestions to improve the permit program.
Copyright © 2022 FDOKUMEN