Appendix L: Urban Decay Analysis - City of Atascadero
75
City of Atascadero - Del Rio Road Commercial Area Specific Plan Draft EIR Michael Brandman Associates F:\Brandman\Projects\36220001\3 - Draft EIR\released\36220001 Sec99-00 Appendix Dividers.doc Appendix L: Urban Decay Analysis
-
Upload
khangminh22 -
Category
Documents
-
view
2 -
download
0
Transcript of Appendix L: Urban Decay Analysis - City of Atascadero
City of Atascadero - Del Rio Road Commercial Area Specific Plan Draft EIR
Michael Brandman Associates F:\Brandman\Projects\36220001\3 - Draft EIR\released\36220001 Sec99-00 Appendix Dividers.doc
Appendix L: Urban Decay Analysis

URBAN DECAY ANALYSIS FOR
DEL RIO SPECIFIC PLAN AREA IN CITY OF ATASCADERO, CA
Prepared for: Michael Brandman Associates
Prepared by: Bay Area Economics
December 2010
Table of Contents Introduction and Summary of Findings......................................................................1
Background and Study Purpose ................................................................................................ 1 Project Description .................................................................................................................... 1 Study Methodology ................................................................................................................... 2 Findings Regarding Urban Decay ............................................................................................. 3 Report Organization .................................................................................................................. 6
Demographic Overview................................................................................................7 Definition of Market Area ......................................................................................................... 7 Population Trends.................................................................................................................... 10 Household Trends.................................................................................................................... 12 Resident Income ...................................................................................................................... 13
Inventory of Existing Competitive Retail ..................................................................14 Overview of Existing Retail Real Estate Market..................................................................... 14 Overview of Primary Market Area Retail Nodes .................................................................... 15 Inventory by Type of Store ..................................................................................................... 19
Retail Sales Analysis ..................................................................................................23 Retail Sales Trends in San Luis Obispo County and Cities in the Market Areas.................... 23 Per Capita Taxable Retail Sales .............................................................................................. 28 Estimated Retail Sales in the Market Areas ............................................................................ 31 Leakage Analysis for the Primary Market Area...................................................................... 35
Impacts of Proposed Project on Existing Retail Outlets.........................................38 Overview ................................................................................................................................. 38 Estimated Sales at Project Opening......................................................................................... 39 Potential Capture of Leakage by Proposed Project ................................................................. 40
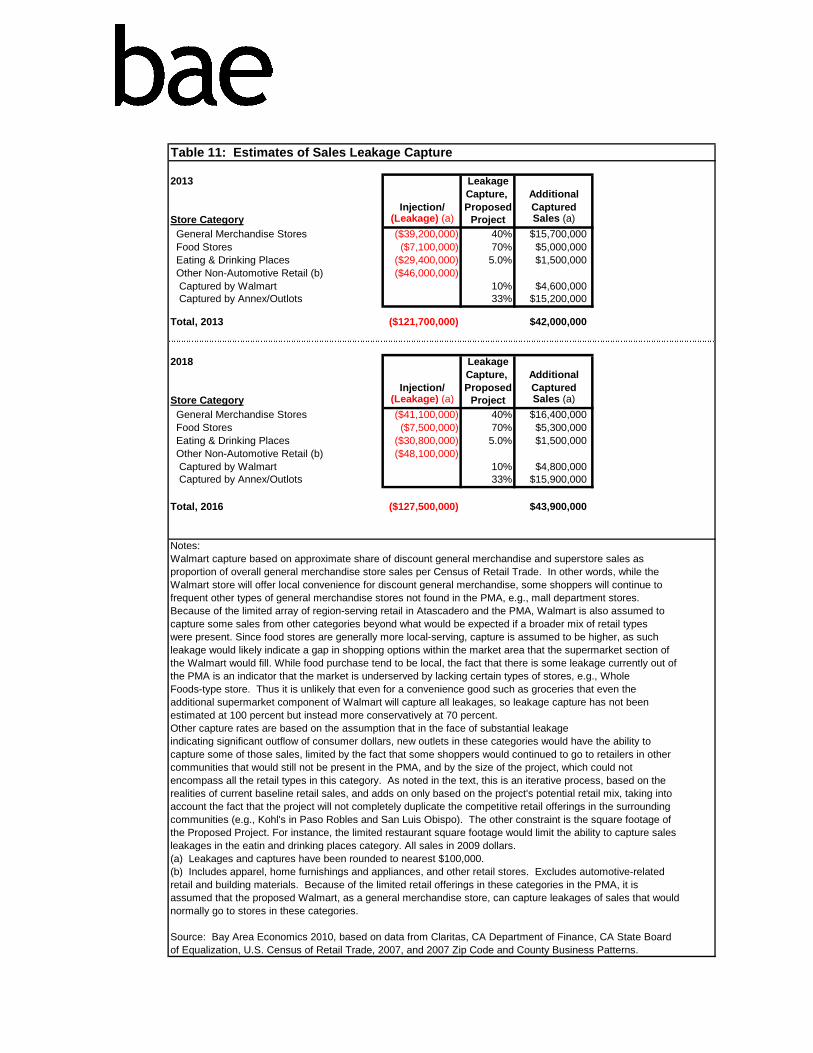
Table 11: Estimates of Sales Leakage Capture
2013 LeakageCapture, Additional
Injection/ Proposed CapturedStore Category (Leakage) (a) Project Sales (a) General Merchandise Stores ($39,200,000) 40% $15,700,000 Food Stores ($7,100,000) 70% $5,000,000 Eating & Drinking Places ($29,400,000) 5.0% $1,500,000 Other Non-Automotive Retail (b) ($46,000,000) Captured by Walmart 10% $4,600,000 Captured by Annex/Outlots 33% $15,200,000
Total, 2013 ($121,700,000) $42,000,000
2018 LeakageCapture, Additional
Injection/ Proposed CapturedStore Category (Leakage) (a) Project Sales (a) General Merchandise Stores ($41,100,000) 40% $16,400,000 Food Stores ($7,500,000) 70% $5,300,000 Eating & Drinking Places ($30,800,000) 5.0% $1,500,000 Other Non-Automotive Retail (b) ($48,100,000) Captured by Walmart 10% $4,800,000 Captured by Annex/Outlots 33% $15,900,000
Total, 2016 ($127,500,000) $43,900,000
Notes:Walmart capture based on approximate share of discount general merchandise and superstore sales asproportion of overall general merchandise store sales per Census of Retail Trade. In other words, while theWalmart store will offer local convenience for discount general merchandise, some shoppers will continue tofrequent other types of general merchandise stores not found in the PMA, e.g., mall department stores. Because of the limited array of region-serving retail in Atascadero and the PMA, Walmart is also assumed tocapture some sales from other categories beyond what would be expected if a broader mix of retail typeswere present. Since food stores are generally more local-serving, capture is assumed to be higher, as suchleakage would likely indicate a gap in shopping options within the market area that the supermarket section ofthe Walmart would fill. While food purchase tend to be local, the fact that there is some leakage currently out ofthe PMA is an indicator that the market is underserved by lacking certain types of stores, e.g., WholeFoods-type store. Thus it is unlikely that even for a convenience good such as groceries that even theadditional supermarket component of Walmart will capture all leakages, so leakage capture has not beenestimated at 100 percent but instead more conservatively at 70 percent.Other capture rates are based on the assumption that in the face of substantial leakageindicating significant outflow of consumer dollars, new outlets in these categories would have the ability tocapture some of those sales, limited by the fact that some shoppers would continued to go to retailers in othercommunities that would still not be present in the PMA, and by the size of the project, which could notencompass all the retail types in this category. As noted in the text, this is an iterative process, based on therealities of current baseline retail sales, and adds on only based on the project's potential retail mix, taking intoaccount the fact that the project will not completely duplicate the competitive retail offerings in the surroundingcommunities (e.g., Kohl's in Paso Robles and San Luis Obispo). The other constraint is the square footage ofthe Proposed Project. For instance, the limited restaurant square footage would limit the ability to capture salesleakages in the eatin and drinking places category. All sales in 2009 dollars.(a) Leakages and captures have been rounded to nearest $100,000.(b) Includes apparel, home furnishings and appliances, and other retail stores. Excludes automotive-relatedretail and building materials. Because of the limited retail offerings in these categories in the PMA, it isassumed that the proposed Walmart, as a general merchandise store, can capture leakages of sales that wouldnormally go to stores in these categories.
Source: Bay Area Economics 2010, based on data from Claritas, CA Department of Finance, CA State Boardof Equalization, U.S. Census of Retail Trade, 2007, and 2007 Zip Code and County Business Patterns.
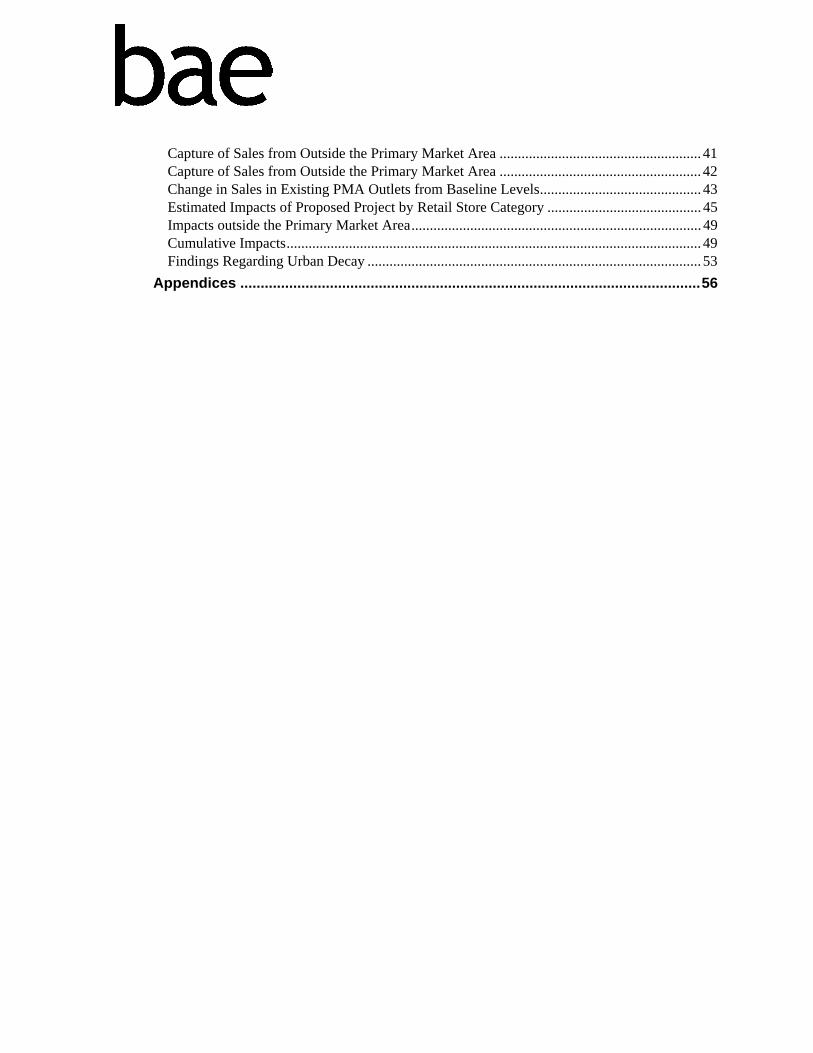
Capture of Sales from Outside the Primary Market Area ....................................................... 41 Capture of Sales from Outside the Primary Market Area ....................................................... 42 Change in Sales in Existing PMA Outlets from Baseline Levels............................................ 43 Estimated Impacts of Proposed Project by Retail Store Category .......................................... 45 Impacts outside the Primary Market Area............................................................................... 49 Cumulative Impacts................................................................................................................. 49 Findings Regarding Urban Decay ........................................................................................... 53
Appendices .................................................................................................................56
1
INTRODUCTION AND SUMMARY OF FINDINGS Background and Study Purpose The City of Atascadero (the “City”) is current completing an EIR for the Del Rio Specific Plan Area (the “Proposed Project”), which includes 260,460 square feet of new retail development on various parcels at or near the intersection of El Camino Real and Del Rio Road. The Proposed Project includes commercial as well as residential uses. The City has retained Michael Brandman Associates to complete an Environmental Impact Report (“EIR”). Michael Brandman Associates has retained Bay Area Economics (“BAE”) to undertake a market impact analysis for the retail portion of this project as part of the EIR process, since economic impacts could conceivably lead to urban decay, a potentially significant environmental impact. In this context, urban decay would result only if all of the following occurred: (1) the project results in an economic impact so severe that stores might close as a result; (2) buildings and/or properties, rather than being reused within a reasonable time, would remain vacant; and (3) such vacancies would cause the buildings and/or properties to deteriorate, and lead to the physical decline of the buildings and/or nearby real estate. The business closures and vacancies would have to be significant enough in scale (i.e., in terms of the total square footage affected and/or the loss of key “anchor” tenants) that they would be presumed to lead to significant physical deterioration. Physical deterioration includes, but is not limited to, abandoned buildings and commercial sites, boarded doors and windows, long-term unauthorized use of properties and parking lots, extensive gang or offensive graffiti painted on buildings, dumping of refuse or overturned dumpsters on properties, dead trees or shrubbery, extensive litter, uncontrolled weed growth, and homeless encampments. It should be noted that BAE’s analysis uses the most recently available information at the time of analysis (July/August 2010). This represents a reasonable effort to establish baseline conditions per CEQA. BAE recognizes that over the course of the EIR process, conditions may change rapidly, especially in the current economic environment; BAE attempts to take that into consideration, but future economic conditions may vary from those assumed here. Project Description The Proposed Project as specified for this analysis covers only the retail/commercial component of the project. The largest single component is a Walmart store assumed at 129,560 square feet inclusive of its outdoor garden center. The Walmart site includes two outlots with the potential for an additional 5,000 square feet of building space of unspecified commercial usage. The remainder of the commercial development is the “Annex,” which includes an additional 120,900 square feet of retail/commercial space which is largely unspecified as to tenant mix. The development plan is outlined in Table 1, with detail provided for the internal layout of the Walmart in Appendix A. The supermarket-equivalent space inside the Walmart is estimated at a gross area of 34,000 square feet, including grocery sales, support, and an allocation of stockroom
2
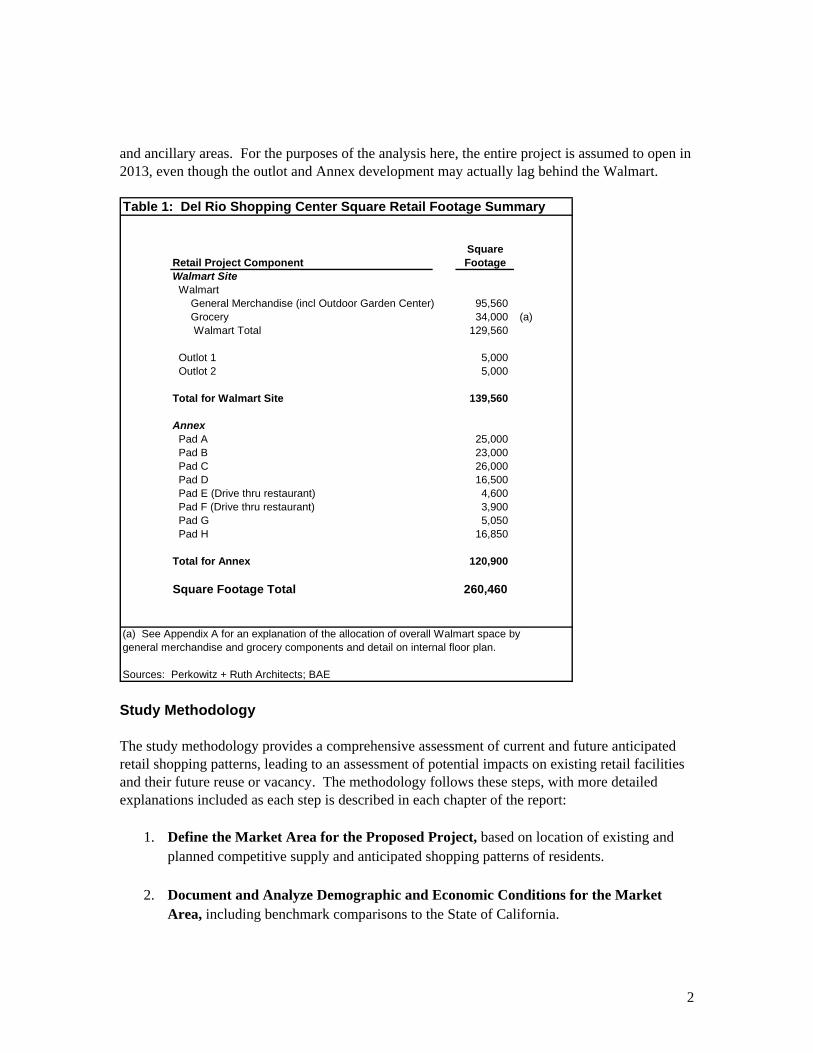
and ancillary areas. For the purposes of the analysis here, the entire project is assumed to open in 2013, even though the outlot and Annex development may actually lag behind the Walmart. Table 1: Del Rio Shopping Center Square Retail Footage Summary
SquareRetail Project Component FootageWalmart Site Walmart General Merchandise (incl Outdoor Garden Center) 95,560 Grocery 34,000 (a) Walmart Total 129,560
Outlot 1 5,000 Outlot 2 5,000
Total for Walmart Site 139,560
Annex Pad A 25,000 Pad B 23,000 Pad C 26,000 Pad D 16,500 Pad E (Drive thru restaurant) 4,600 Pad F (Drive thru restaurant) 3,900 Pad G 5,050 Pad H 16,850
Total for Annex 120,900
Square Footage Total 260,460
(a) See Appendix A for an explanation of the allocation of overall Walmart space bygeneral merchandise and grocery components and detail on internal floor plan.
Sources: Perkowitz + Ruth Architects; BAE Study Methodology The study methodology provides a comprehensive assessment of current and future anticipated retail shopping patterns, leading to an assessment of potential impacts on existing retail facilities and their future reuse or vacancy. The methodology follows these steps, with more detailed explanations included as each step is described in each chapter of the report:
1. Define the Market Area for the Proposed Project, based on location of existing and planned competitive supply and anticipated shopping patterns of residents.
2. Document and Analyze Demographic and Economic Conditions for the Market Area, including benchmark comparisons to the State of California.
3
3. Document and Analyze Existing Retail Space, including key competitive supply and existing vacancies.
4. Document and Evaluate Existing Retail Sales Trends, in order to understand local market area characteristics and variations within the market area or by store category.
5. Estimate Existing Sales Trends and Leakage Out of the Market Area, specifically for the retail categories potentially impacted by the Proposed Project.
6. Estimate Impact of Proposed Project on Market Area Sales, including when the project opens in 2013, and again in 2018 as population in the market area grows.
7. Estimate the Impacts of the Proposed Project on Existing Stores, based on any potential decline in sales for existing stores, as well as the effects of future growth and increased demand in the market area.
8. Assess the Potential for Urban Decay It should be noted that the methodology is based on an actual total sales approach, using estimated actual retail sales as the most reliable indicator of potential sales and resulting potential impacts on existing stores, in turn leading to possible urban decay. BAE relies on estimates of actual sales rather than inventories of existing store space (i.e., supply), due to the variability of existing supply information, the variability of individual store owners choosing to operate oversized or undersized stores relative to their profit margins, and other factors affecting supply of space such as sudden vacancies unrelated to dwindling demand for merchandise (e.g., lost their lease, death in the family, over-leveraged other assets resulting in store closure, etc.). Findings Regarding Urban Decay Urban decay depends on a causal chain as follows:
• The project results in an economic impact so severe that stores might close as a result; • Buildings and/or properties, rather than being reused within a reasonable time, would
remain vacant; and • Such vacancies would be significant enough in scale (in terms of total square footage
affected and/or the loss of key “anchor” tenants”) and duration to cause the buildings and/or properties to deteriorate, and lead to the physical decline of the buildings and/or nearby real estate. The business closures and vacancies would have to be significant enough in scale (i.e., in terms of the total square footage affected and/or the loss of key “anchor” tenants) that they would be presumed to lead to significant physical deterioration. Physical deterioration includes, but is not limited to, abandoned buildings and commercial sites, boarded doors and windows, long-term unauthorized use of properties and parking lots, extensive gang or offensive graffiti painted on buildings, dumping of refuse or overturned dumpsters on properties, dead trees or shrubbery, extensive litter, uncontrolled weed growth, and homeless encampments.
4
Project Alone The analysis here finds that that the first link in this chain, store closure, is not a likely result from the Proposed Project alone, so the causal chain to urban decay does not exist. Outside the PMA, any impacts from additional sales capture would be spread among many outlets spread across the large retail bases in Paso Robles, San Luis Obispo city, and elsewhere, with no potential for closure indicated for any particular retail outlet. Furthermore, existing vacant retail spaces in Atascadero appear to be well-maintained, even for spaces vacant for extended periods. Thus, while the market will be see some short-term readjustments in response to the Proposed Project, long-term vacancy and urban decay are not seen as a likely outcome. It is important to note that City of Atascadero enforces various ordinances related to property maintenance which would further reduce the potential for urban decay. The City actively prohibits conditions which would result in urban decay through its Municipal Code, including but not limited to Section 5-14, which deals with graffiti, Section 6-7, which prohibits the storage of abandoned or dismantled vehicles, Section 6-13, which prohibits vegetative growth or refuse accumulations which become public safety hazards, and Section 8-7, which covers building code violations. The Code provides for the declaration of deteriorating conditions as a public nuisance, and provides enforcement and abatement as generally described in Title 12, which provides for hearings and fines for noncompliance. The City’s Community Development Director has confirmed with BAE that the City actively enforces its ordinances with respect to properties with the kinds of physical conditions linked to urban decay.
1
Additionally, the City’s Community Redevelopment Agency provides resources to maintain and improve physical conditions in the City’s commercial areas, particularly the Downtown. The Agency’s Project Area comprises the Downtown and most of the El Camino Real retail corridor through the City, including the site of the Proposed Project development. The Agency has a Downtown Revitalization Plan which includes a Streetscape Project, assistance for the Colony Square project, and funding for graffiti removal. The City also maintains an Office of Economic Development, which assists in the recruitment and expansion of commercial businesses within the City limits. The OED is comprised of key staff members from each of the City's seven departments. The OED has completed the following projects in the past 18 months, indicating a proactive stance toward improving the retail environment and staving off physical decline:
• Downtown commercial building façade improvement grant program. • Building permit fee reduction program for businesses in the Redevelopment Agency area. • Relocation of Cowgirl Café restaurant after they lost their lease, to a vacant restaurant
space at 8300 El Camino Real. • Assistance provided to Auto Zone to find location. Auto Zone is in the process of
moving into 8195 El Camino Real to occupy a building that was vacated when Hollywood Video closed.
1 Personal communication with Warren Frace, Community Development Director for City of Atascadero,
August 26, 2010.
5
BAE’s own area tour indicates that commercial and retail properties in Atascadero, including vacant properties, are generally well maintained. Site reconnaissance around the area found little evidence of blighted buildings, marred by broken windows, graffiti, rubbish, overgrown vegetation, or other indicators of urban decay. This suggests that both property owners and local government are vigilant about preventing physical deterioration of the community. The notable deteriorated property in Atascadero is the 1.7-acre La Plaza site Downtown as discussed in the Inventory of Existing Competitive Retail above. However, site conditions relate largely to a fire at the property rather than being the result of economic conditions resulting in abandonment. In fact, there is currently a development proposal put forward for this site, the La Plaza project as noted in Appendix F. Another factor that would tend to lessen the potential for urban decay is the likelihood of market corrections as future conditions evolve. Retail spaces such as those in the Proposed Project, are often not developed without commitment from potential tenants. Without those commitments, developers will either cancel or delay projects, often due to the inability to obtain financing. With the exception of Walmart, BAE was not provided with information indicating any tenant commitments for the outlots or the Annex portions of the Proposed Project; in the absence of those commitments the project may not move forward on the schedule assumed here, and the parcels may remain vacant for a longer period of time. In Atascadero, an example of a site that has remained vacant until project commitments are secured can be found in the Home Depot Center, which has had an undeveloped parcel available for several years. However, a vacant parcel such as this does not constitute urban decay. While a tight market might lead to limited re-tenanting in retail uses, in any market there are often retailers trying to enter the market that see vacant spaces in a down market as an opportunity. For example, following the closure of Mervyns’ stores nationally, Kohl’s has chosen to reuse their vacant spaces in many markets, including Lodi, Ukiah, Eureka, and Capitola. Forever 21 re-tenanted a vacant Gottschalks in San Luis Obispo (as well as in other cities). Also in San Luis Obispo, the former Circuit City space in Irish Hills Plaza has provided an opportunity for the New Frontiers Natural Foods to relocate and expand from their current location. As noted previously, in Atascadero itself restaurant and retail users (e.g., Autozone, Cowgirl Café) have shown continued re-tenanting of vacant space even in the short period between BAE’s site tour and this analysis. Thus, even in the current economic climate, there are opportunities for re-tenanting of spaces that continue to be well-maintained and available in the market, reinforcing the likelihood that property owners will not let vacant spaces physically deteriorate. In the event of an owner’s failure to maintain vacated properties in a condition suitable for releasing, past experience indicates that the City of Atascadero will prevent physical deterioration from occurring through active and aggressive enforcement of its Code provisions relating to the abatement of public nuisances due to lack of property maintenance and management. The City of Atascadero has demonstrated its commitment to preventing physical deterioration of commercial properties within the City through its successful enforcement efforts to date, as well as through the actions of its Redevelopment Agency. Based on its past performance and policy commitments, it is reasonable to expect that the City will not allow commercial properties which may become vacant to deteriorate physically.
6
Cumulative Impacts None of the planned and proposed spaces include supermarket or large discount general merchandise store space, so the additional planned and proposed projects do not make it any more likely that a store in these sectors would face closure. Based on the above analysis, there is the potential for overall sales at existing retail outlets in the PMA to decrease in 2013 by 14 percent from baseline levels but improve to an overall estimated decrease of eight percent by 2018 due to a modest increase in the area population. It is not possible, however, to state with certainty that particular outlets or centers are going to be impacted by store closures since much of the tenant mix in the Proposed Project and the other reasonably foreseeable competitive projects is unknown, and in fact, the level of long term loss is such that existing outlets on the whole might survive without closure. The current market shows that there are retailers seeking space for re-tenanting and that even under current conditions, re-tenanting is occurring in the Atascadero area. Additionally, market corrections such as a longer buildout period for the Proposed Project are likely in response to an increase in the available existing inventory. Finally, based on its past performance and policy commitments as discussed above, it is reasonable to expect that the City will not allow commercial properties that may become vacant under cumulative conditions to deteriorate physically such that urban decay would result. Report Organization This report contains the following sections, providing background information and addressing issues of concern: this Introduction and Summary of Findings; Demographic Overview; Inventory of Existing Competitive Retail; Retail Sales Analysis; and Impacts of Proposed Project on Existing Retail Outlets.
7
DEMOGRAPHIC OVERVIEW This section presents background information on current and projected demographic conditions in the City of Atascadero and nearby communities in San Luis Obispo County making up the Proposed Project’s Primary and Secondary Market Areas. Developing a demographic profile of these areas will help in identifying key factors influencing future retail sales in the areas, and to assess the potential impacts of the Proposed Project and any other planned retail projects on existing retail outlets and centers. This discussion will consider the data available in light of current economic context, i.e., the unsettled national and world economies. Data sources considered include the U.S. Census Bureau, the San Luis Obispo Council of Governments, the California State Department of Finance, and Claritas, a private vendor providing estimates of current and future demographic conditions. Definition of Market Area A market area is the geographic region that encompasses most of a retail outlet’s customers. BAE defined the Market Areas for the Proposed Project, based on:
• Physical tour of Atascadero and surrounding areas of San Luis Obispo County • Mapping of existing nearby general merchandise and other competing retail nodes in
nearby locales • Mapping of proposed sites for key planned and proposed competitive retail facilities • An understanding based on experience of retail shopping patterns, particularly for
discount general merchandise and grocery items, as well as the general anticipated shopping patterns of residents
The Proposed Project presents a rather complex situation with respect to defining its market area. The anchor Walmart store will largely determine the customer base for this center. Typically, the market area for a Walmart can be defined based on the location of other nearby Walmarts as well as natural barriers such as gaps between population centers. In the case of this project, the nearest Walmarts are to the north in Paso Robles and to the south in Arroyo Grande. However, neither of these stores is slated to carry a full line of groceries (i.e., a broad array of food items including fresh meats/seafood and produce), so the planned Atascadero store will provide a broader retail mix. As a result, some shoppers will be attracted to this store even though it is not the closest Walmart; in the case of Paso Robles, where the existing Walmart is near the south end of town, and the Atascadero Walmart would only be a few minutes farther away, some shoppers might elect to drive past the Paso Robles store to go to Atascadero. These shoppers would also have to drive by the Target in Paso Robles to reach this proposed store. Thus, while some capture can be assumed, it may be limited due to the existing discount store options in Paso Robles, as well as the broad range of other retail shopping available in that city. As a result, BAE has segmented the secondary market area into northern and southern components, with the northern component consisting of Paso Robles and areas of the County to the north beyond Paso Robles. This area is designated as the Secondary Market Area North (“SMA-N”)
8
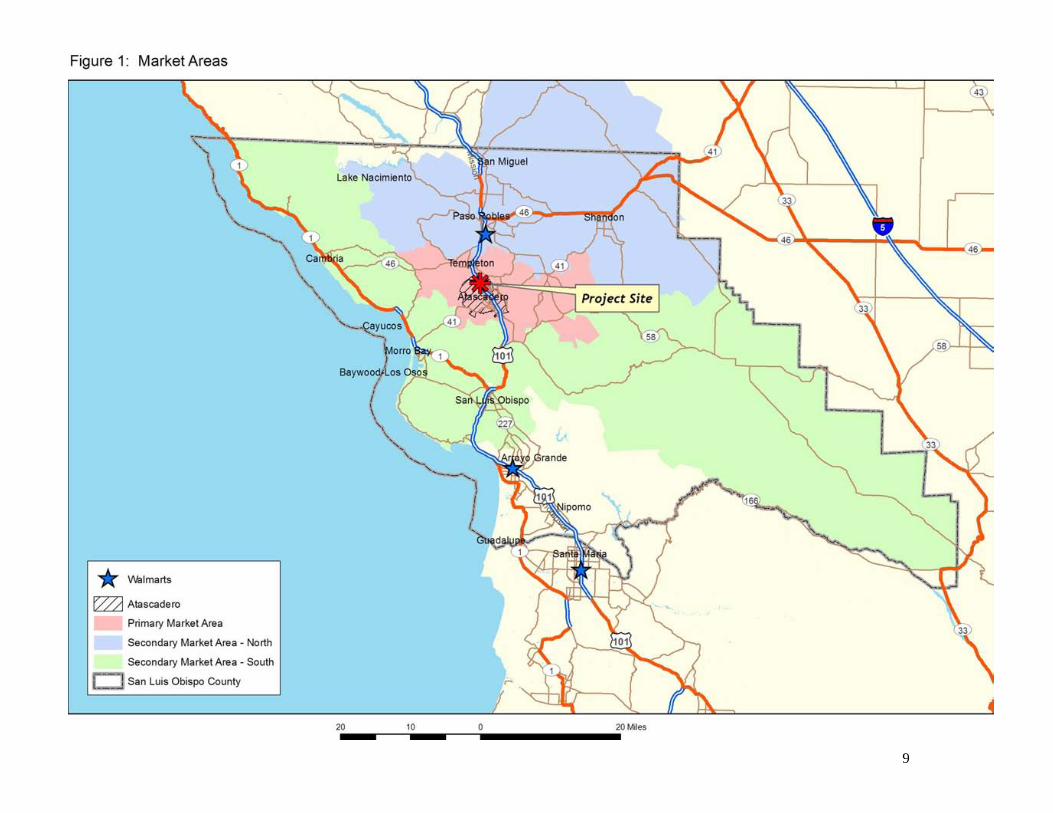
To the south, the Arroyo Grande store is over 30 miles distant, but San Luis Obispo is approximately halfway between the two stores, and while San Luis Obispo currently has no general merchandise discount stores, a Target store is under construction and will be open before the Proposed Project. There is also a Costco, the only warehouse club store in San Luis Obispo County. Additionally to the south and west are the coastal communities including Baywood-Los Osos, Morro Bay, and other communities to the north on State Highway 1. These communities have limited retail, with the mix focused on stores providing everyday items and specialty retail driven by tourism. The proposed store in Atascadero will be the closest Walmart to Morro Bay, and will be a similar distance from the other coastal communities as either the Walmart in Paso Robles or the Walmart in Arroyo Grande (although farther away than the Target in San Luis Obispo city. Further complicating the analysis, San Luis Obispo city, while not offering a Walmart, offers a wide array of other region-serving retail, and is closer to some of these communities than any of the existing or planned Walmarts. Nevertheless, the Atascadero Walmart should attract some shoppers from both San Luis Obispo city and these coastal communities. The combination of San Luis Obispo city and the coastal communities extending from Baywood-Los Osos north to the Monterey County line constitute the southern component of the secondary market area for the Proposed Project, designated as the Secondary Market Area South (“SMA-S”). Beyond these communities to the south, the existing Walmart and other retail in the Arroyo Grande area and beyond in Santa Maria, as well as the greater distances, will effectively limit the attraction of the Proposed Project to potential shoppers. Monterey County directly to the north of the Secondary Market Areas (“SMAs”) is very lightly populated and provides its own retail shopping farther north in Salinas and the Monterey Bay Area, serving the population centers of that County. The Primary Market Area (“PMA”), where the Proposed Project has the potential to attract a higher proportion of shoppers as it is clearly the closest Walmart, is defined as the City of Atascadero and the unincorporated community of Templeton not far to the north of the project site, as well as surrounding rural areas. The market areas have been defined based on Zip Code boundaries, in a split of the market areas as discussed above, and provide a good basis for data analysis due to the availability of data on retail outlets from Zip Code Business Patterns. These areas are shown in Figure 1. As shown, the boundaries of these Zip Codes extend beyond the areas discussed above, but these additional areas are largely unpopulated and have no significant retail concentrations, so their inclusion should not materially affect the analysis.
9
10
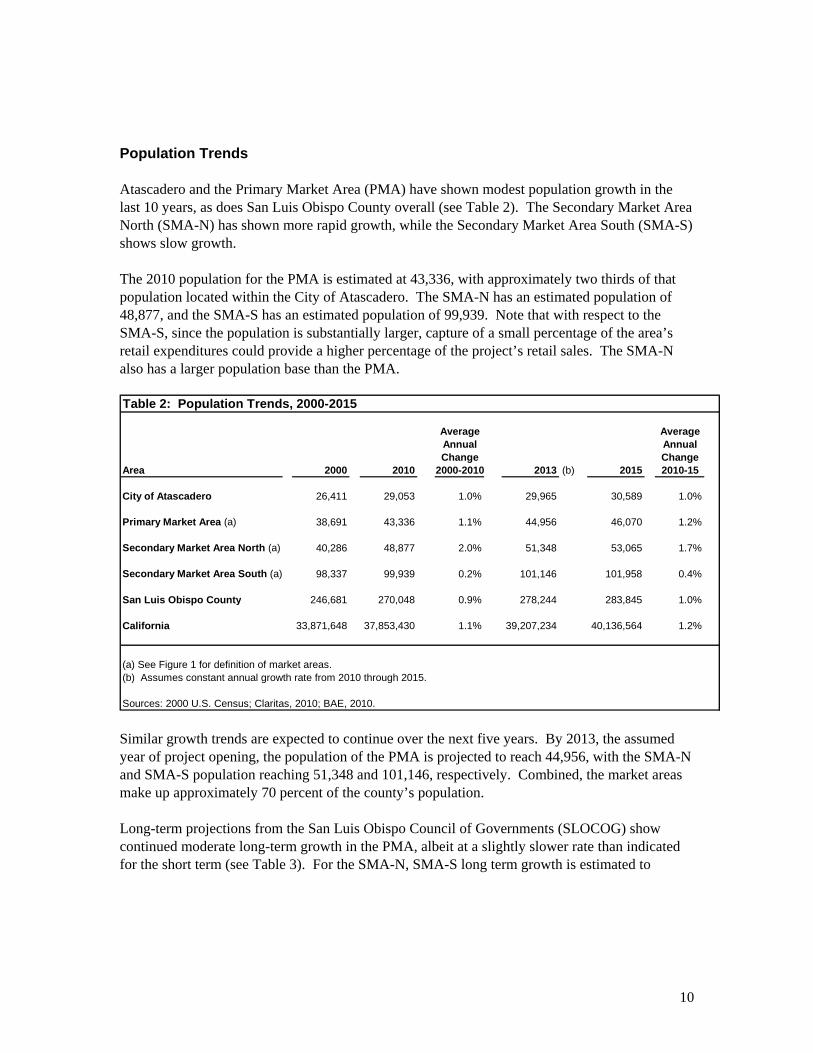
Population Trends Atascadero and the Primary Market Area (PMA) have shown modest population growth in the last 10 years, as does San Luis Obispo County overall (see Table 2). The Secondary Market Area North (SMA-N) has shown more rapid growth, while the Secondary Market Area South (SMA-S) shows slow growth. The 2010 population for the PMA is estimated at 43,336, with approximately two thirds of that population located within the City of Atascadero. The SMA-N has an estimated population of 48,877, and the SMA-S has an estimated population of 99,939. Note that with respect to the SMA-S, since the population is substantially larger, capture of a small percentage of the area’s retail expenditures could provide a higher percentage of the project’s retail sales. The SMA-N also has a larger population base than the PMA. Table 2: Population Trends, 2000-2015
Average AverageAnnual AnnualChange Change
Area 2000 2010 2000-2010 2013 (b) 2015 2010-15
City of Atascadero 26,411 29,053 1.0% 29,965 30,589 1.0%
Primary Market Area (a) 38,691 43,336 1.1% 44,956 46,070 1.2%
Secondary Market Area North (a) 40,286 48,877 2.0% 51,348 53,065 1.7%
Secondary Market Area South (a) 98,337 99,939 0.2% 101,146 101,958 0.4%
San Luis Obispo County 246,681 270,048 0.9% 278,244 283,845 1.0%
California 33,871,648 37,853,430 1.1% 39,207,234 40,136,564 1.2%
(a) See Figure 1 for definition of market areas.(b) Assumes constant annual growth rate from 2010 through 2015.
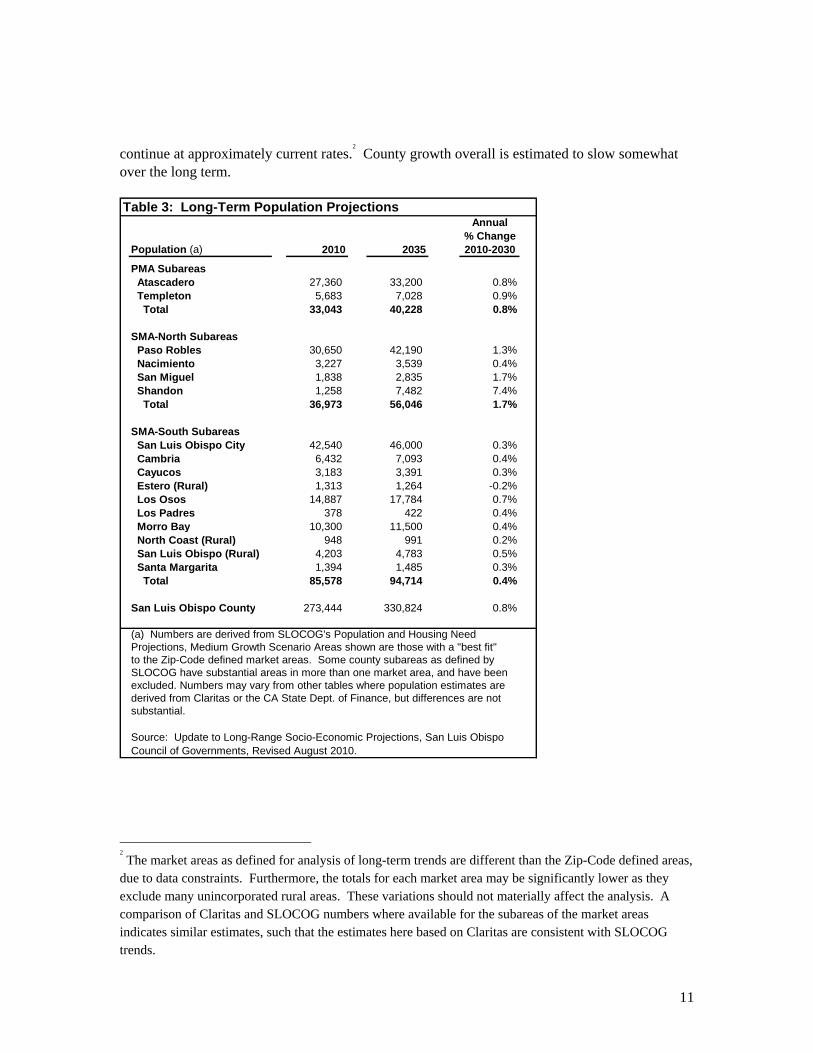
Sources: 2000 U.S. Census; Claritas, 2010; BAE, 2010. Similar growth trends are expected to continue over the next five years. By 2013, the assumed year of project opening, the population of the PMA is projected to reach 44,956, with the SMA-N and SMA-S population reaching 51,348 and 101,146, respectively. Combined, the market areas make up approximately 70 percent of the county’s population. Long-term projections from the San Luis Obispo Council of Governments (SLOCOG) show continued moderate long-term growth in the PMA, albeit at a slightly slower rate than indicated for the short term (see Table 3). For the SMA-N, SMA-S long term growth is estimated to
11
continue at approximately current rates.2 County growth overall is estimated to slow somewhat
over the long term. Table 3: Long-Term Population Projections
Annual% Change
Population (a) 2010 2035 2010-2030
PMA Subareas Atascadero 27,360 33,200 0.8% Templeton 5,683 7,028 0.9% Total 33,043 40,228 0.8%
SMA-North Subareas Paso Robles 30,650 42,190 1.3% Nacimiento 3,227 3,539 0.4% San Miguel 1,838 2,835 1.7% Shandon 1,258 7,482 7.4% Total 36,973 56,046 1.7%
SMA-South Subareas San Luis Obispo City 42,540 46,000 0.3% Cambria 6,432 7,093 0.4% Cayucos 3,183 3,391 0.3% Estero (Rural) 1,313 1,264 -0.2% Los Osos 14,887 17,784 0.7% Los Padres 378 422 0.4% Morro Bay 10,300 11,500 0.4% North Coast (Rural) 948 991 0.2% San Luis Obispo (Rural) 4,203 4,783 0.5% Santa Margarita 1,394 1,485 0.3% Total 85,578 94,714 0.4%
San Luis Obispo County 273,444 330,824 0.8%
(a) Numbers are derived from SLOCOG's Population and Housing NeedProjections, Medium Growth Scenario Areas shown are those with a "best fit"to the Zip-Code defined market areas. Some county subareas as defined bySLOCOG have substantial areas in more than one market area, and have beenexcluded. Numbers may vary from other tables where population estimates arederived from Claritas or the CA State Dept. of Finance, but differences are notsubstantial.
Source: Update to Long-Range Socio-Economic Projections, San Luis ObispoCouncil of Governments, Revised August 2010.
2 The market areas as defined for analysis of long-term trends are different than the Zip-Code defined areas,
due to data constraints. Furthermore, the totals for each market area may be significantly lower as they exclude many unincorporated rural areas. These variations should not materially affect the analysis. A comparison of Claritas and SLOCOG numbers where available for the subareas of the market areas indicates similar estimates, such that the estimates here based on Claritas are consistent with SLOCOG trends.
12
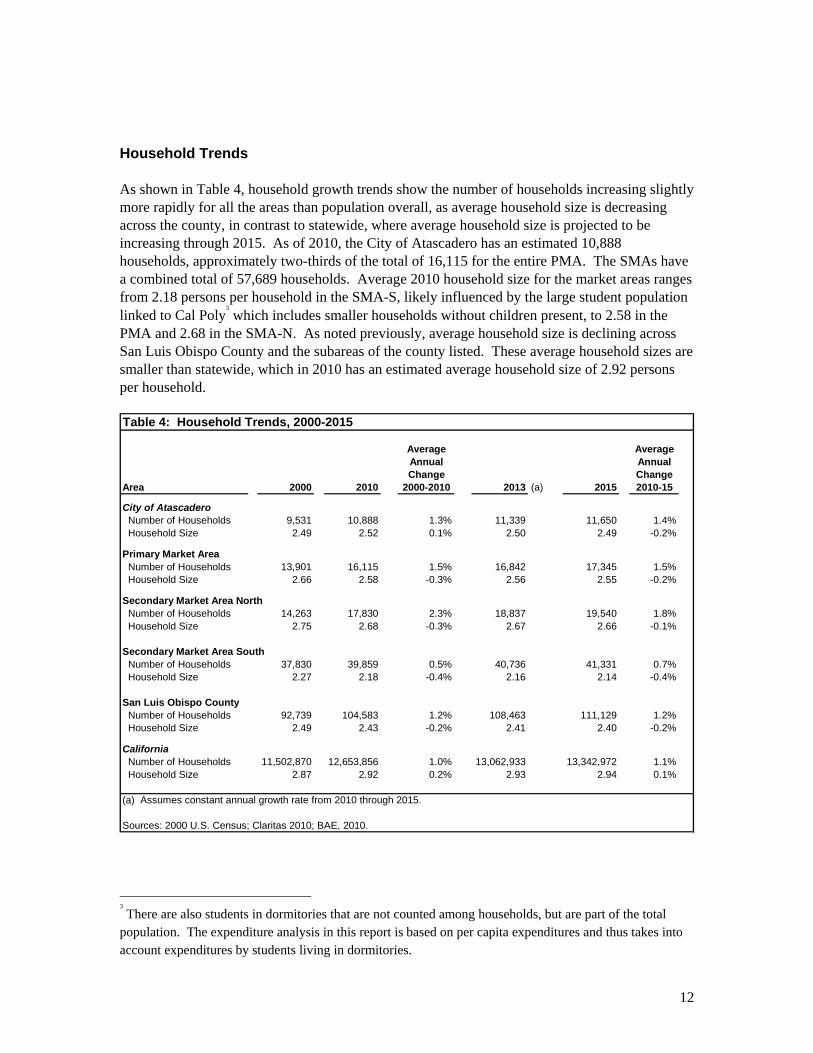
Household Trends As shown in Table 4, household growth trends show the number of households increasing slightly more rapidly for all the areas than population overall, as average household size is decreasing across the county, in contrast to statewide, where average household size is projected to be increasing through 2015. As of 2010, the City of Atascadero has an estimated 10,888 households, approximately two-thirds of the total of 16,115 for the entire PMA. The SMAs have a combined total of 57,689 households. Average 2010 household size for the market areas ranges from 2.18 persons per household in the SMA-S, likely influenced by the large student population linked to Cal Poly
3 which includes smaller households without children present, to 2.58 in the
PMA and 2.68 in the SMA-N. As noted previously, average household size is declining across San Luis Obispo County and the subareas of the county listed. These average household sizes are smaller than statewide, which in 2010 has an estimated average household size of 2.92 persons per household. Table 4: Household Trends, 2000-2015
Average AverageAnnual AnnualChange Change
Area 2000 2010 2000-2010 2013 (a) 2015 2010-15
City of Atascadero Number of Households 9,531 10,888 1.3% 11,339 11,650 1.4% Household Size 2.49 2.52 0.1% 2.50 2.49 -0.2%
Primary Market Area Number of Households 13,901 16,115 1.5% 16,842 17,345 1.5% Household Size 2.66 2.58 -0.3% 2.56 2.55 -0.2%
Secondary Market Area North Number of Households 14,263 17,830 2.3% 18,837 19,540 1.8% Household Size 2.75 2.68 -0.3% 2.67 2.66 -0.1%
Secondary Market Area South Number of Households 37,830 39,859 0.5% 40,736 41,331 0.7% Household Size 2.27 2.18 -0.4% 2.16 2.14 -0.4%
San Luis Obispo County Number of Households 92,739 104,583 1.2% 108,463 111,129 1.2% Household Size 2.49 2.43 -0.2% 2.41 2.40 -0.2%
California Number of Households 11,502,870 12,653,856 1.0% 13,062,933 13,342,972 1.1% Household Size 2.87 2.92 0.2% 2.93 2.94 0.1%
(a) Assumes constant annual growth rate from 2010 through 2015.
Sources: 2000 U.S. Census; Claritas 2010; BAE, 2010.
3 There are also students in dormitories that are not counted among households, but are part of the total
population. The expenditure analysis in this report is based on per capita expenditures and thus takes into account expenditures by students living in dormitories.
13
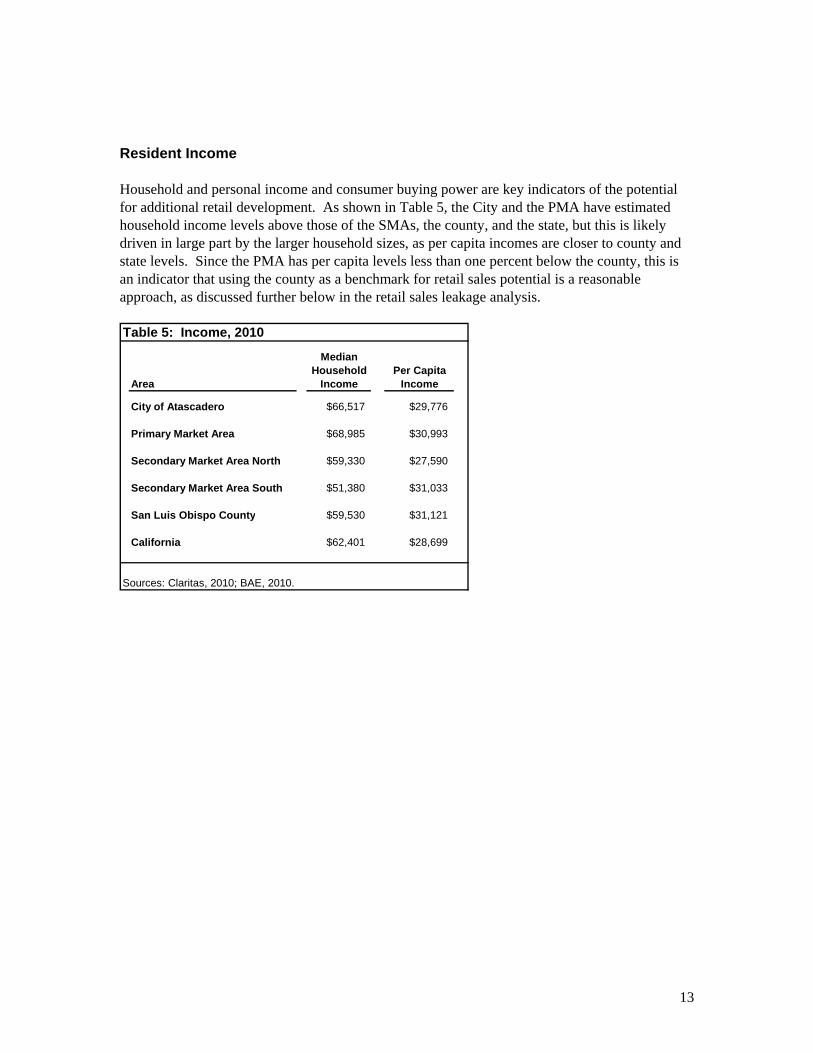
Resident Income Household and personal income and consumer buying power are key indicators of the potential for additional retail development. As shown in Table 5, the City and the PMA have estimated household income levels above those of the SMAs, the county, and the state, but this is likely driven in large part by the larger household sizes, as per capita incomes are closer to county and state levels. Since the PMA has per capita levels less than one percent below the county, this is an indicator that using the county as a benchmark for retail sales potential is a reasonable approach, as discussed further below in the retail sales leakage analysis. Table 5: Income, 2010
MedianHousehold Per Capita
Area Income Income
City of Atascadero $66,517 $29,776
Primary Market Area $68,985 $30,993
Secondary Market Area North $59,330 $27,590
Secondary Market Area South $51,380 $31,033
San Luis Obispo County $59,530 $31,121
California $62,401 $28,699
Sources: Claritas, 2010; BAE, 2010.
14
INVENTORY OF EXISTING COMPETITIVE RETAIL This chapter profiles existing retail space in the Primary Market Area, including retail centers, Downtown Atascadero, and other supply potentially competitive with the Proposed Project. The profile is based on an area tour, interviews with brokers handling retail properties, and additional research including online searches and contacts with store operators and city staff. Overview of Existing Retail Real Estate Market In any retail market, existing retail space is vacated on a regular basis due to functional obsolescence or the general cycle of retail closures and openings over time. For instance, until recently there has been a long-term trend in the supermarket industry toward larger stores and consolidation, with older stores reused by “second generation” tenants such as dollar stores, furniture outlets, and even non-retail uses such as fitness centers.
4 Thus any retail market is likely
to have a certain amount of vacant space due to normal turnover and changes in retailing, and vacancies alone do not necessarily indicate urban decay or physical deterioration. Following is an analysis of overall retail estate conditions in the region, based in part on interviews with brokers handling retail properties and on an area tour. The retail areas of the PMA are almost entirely situated along old Highway 101, El Camino Real in Atascadero and, to a very limited degree, Main Street in Templeton. In Atascadero, El Camino Real from Santa Rosa Avenue through the Downtown is a long strip largely composed of retail and commercial centers as well as stand-alone retail and commercial uses. The larger centers are anchored by supermarkets; all of the City’s existing supermarkets are on El Camino Real south of Downtown. North of Downtown, the retail is more scattered, with various free-standing uses and centers between Downtown and the northern boundary of the City. In Templeton, there is a limited amount of retail along Main Street, as well as the only substantial retail center in the PMA not in the El Camino Real/Main Street corridor, the Vineyard Center anchored by Trader Joe’s on Rossi Road near the Vineyard Drive exit from Highway 101. For a listing of major retail centers in Atascadero and Templeton, see Appendix H. As part of its analysis, BAE contacted real estate brokers active in the local retail market.
5
According to these brokers, retail leasing activity in Atascadero has been slow, as might be expected under current conditions. Many vacancies have attracted little or no interest. Atascadero has limited space of a size large enough to be attractive to large national tenants, and in fact the most sought-after spaces currently are smaller spaces ranging from less than 1,000 square feet up to 3,000 square feet, with local “mom & pop” businesses, especially restaurants, being the most likely tenants. One broker stated that the city lacked spaces in the 10,000 square-foot range, and the brokers noted that much of the retail is in aging smaller strip centers. Stand- 4 More recently, niche grocery stores such as Trader Joe’s, Fresh & Easy, Grocery Outlet, and ethnic
supermarkets have started to occupy smaller spaces that are either new or that have been vacated by supermarket chain stores, in some cases subdividing the supermarket space and only using a portion of it. 5 See Appendix B for a list of brokers interviewed.
15
alone properties with good parking and high visibility on El Camino Real are also seen as more attractive. While none of the brokers tracked all properties in the PMA, vacancy estimates ranged from 10 percent up to 40 percent, with most estimates in the 10 to 20 percent range; the high end estimates were from a broker focused on Downtown. While some brokers indicated that vacancies were higher than usual currently, others noted that the limited number of additions to the overall retail inventory over the last few years even as the area has experienced modest growth in demand has kept vacancies down. Some also stated that Atascadero has tended to have chronically higher vacancies than surrounding cities, and many of the vacancies noted by these brokers were in fact vacancies of well over one year. Overall, the retail in Atascadero is seen as largely being local-serving, with shoppers venturing to nearby Paso Robles and elsewhere for major shopping trips. While some indicated that individual businesses could be impacted by the presence of Walmart, most brokers stated that overall it would improve the retail climate in the City and help in attracting larger national-tenants, especially to the north end of town, as more shoppers stay in town, and the City develops more of an ability to attract shoppers from outlying communities such as Morro Bay. Overview of Primary Market Area Retail Nodes The discussion that follows puts PMA retail centers in three major geographic categories: El Camino Real south of Downtown; Downtown Atascadero; and Other Key Retail Centers. El Camino Real South of Downtown This area contains the bulk of Atascadero’s existing retail development, including over a dozen shopping centers of various sizes as well as many free-standing businesses. The larger centers are anchored by the City’s four existing supermarkets, and the City’s three consumer-oriented drug stores are all located in this area.
6 Also along this strip are two major hardware/home
improvement businesses, and numerous other retail outlets, restaurants, and service businesses. Based on estimates from various sources, at the time of BAE’s area tour there were approximately 525,000 square feet in the inventoried centers, with approximately 75,000 square feet of vacant space (see Appendix G for details), for a vacancy rate of approximately 14 percent.
7
These vacancies range in size from less than 1,000 square feet to the recently vacated Rite Aid space of 21,000 square feet. Vacancies are scattered along the corridor. Vacancies in this area appear to be well-maintained in tenant-ready condition, and the market is still active, as several spaces that were vacant at the time of BAE’s area tour have since been re-tenanted. For instance, 6 Further discussion of supermarkets and general merchandise stores, including these drug stores, is found
later in this chapter. 7 Note that this vacancy rate is based on an inventory that is not all-inclusive, since the source data is not
all-inclusive with respect to square footages for free-standing retail properties. For instance it excludes the two hardware stores, and other freestanding businesses. While most of these other properties appear occupied, at the time of BAE’s area tour there were also some free-standing vacancies, including the former Wendy’s and Carl’s Jr. restaurant pads. Overall, while a precise rate is not known for these free-standing spaces, on the ground observation indicates that the vacancy is not substantially different than for the space in centers.
16
the small 8195 El Camino Real center had several vacancies, including a former Hollywood Video and restaurant, but this center is again fully leased, with an Autozone store coming in, according to City staff.
8 Additionally, the Cowgirl Café, which lost the lease at its downtown
location to another restaurant, has relocated to a vacant restaurant space at 8300 El Camino Real. Downtown Atascadero Downtown Atascadero has a number and variety of retail offerings. As in many older downtown districts, the mix of establishments has evolved toward small specialty retail, restaurants, entertainment, and business and personal services. This has been in response to regional competition dating back to the development of strip centers and the earliest malls, as major shopping trips for both convenience and comparison goods has shifted away from downtown areas throughout the U.S. For the purposes of the analysis here, this area is roughly bordered by Mercedes Avenue/Highway 41, Highway 101, extending to the northwest on El Camino Real to Rosario Avenue to include Virginia Plaza, and by Lewis Avenue/South Mall/Capistrano Avenue. The core area of the Downtown is on El Camino Real, Traffic Way, and Entrada Avenue. The uses consist largely of small independent retailers, restaurants, and service-oriented businesses. The Carlton Hotel is the “landmark” commercial building of the area. The area also includes the currently vacant historic City Hall as well the building currently housing city offices. The Carlton is a key anchor structure; at the time of BAE’s area tour in the summer of 2010, the first-floor restaurant and lounge had recently closed because of financial difficulties, but the restaurant re-opened in October 2010. Key businesses include Mobley’s Moto X and Boardshop, a sporting goods shop specializing in motocross and surfing equipment, and Grisanti Hardware. Other businesses include a mix of service businesses, specialty shops, and galleries. The Downtown area currently has a large number of vacancies, especially on the southwest side of El Camino Real, where the width of El Camino Real and traffic serve to isolate the area from the remainder of Downtown, and businesses are stretched along El Camino Real sandwiched between the street and Highway 101 rather than being in a more pedestrian-friendly configuration on city blocks.
9 These include two former restaurants
10 and the property southeast of the former
Jack-in-the-Box that is in disrepair and fenced off following a structure fire a few years ago that destroyed the largest building on site. While this property could properly be described as being in urban decay if it were abandoned with no prospects for future development, it is currently for sale or lease. In fact, a development proposal for the 1.7-acre site, which consists of multiple parcels, 8 Based on personal communication with Jim Lewis, Assistant City Manager, and Warren Frace,
Community Development Director. 9 BAE did not attempt to estimate total square footages for the scattered properties Downtown, but
vacancies here appear higher than the 14 percent estimated for the centers on El Camino Real south of Downtown. 10
One of these restaurant spaces, a former Denny’s, will be re-tenanted by a Bob’s Big Boy, according to local news reports from November 2010. (“Lon Allan: Bob's Big Boy to open in Atascadero,” SanLuisObispo.com/The Tribune, November 22, 2010, http://www.sanluisobispo.com/2010/11/22/1380132/more-tasty-news-for-atascadero.html.) This location, across the street from the Colony Square Development, is well situated to capture business from patrons of the theater complex.
17
is currently under review by the City. The broker representing the property stated that the remaining buildings are in some cases heavily damaged, and would have to be removed for any re-use of the property. There are other vacancies scattered throughout the Downtown area. Most of these properties appear to be well-maintained. One property (the former Hardwoods Showroom) had a boarded-up window at the time of BAE’s area tour, and one property on the strip near Mobley’s appears to have substantial water damage in the interior, but the exterior front façade is still in good condition. There is also a major development project underway, the Colony Square development at the corner of Mercedes Avenue and El Camino Real. This project upon completion is slated to include a ten-screen state-of-the art movie complex, 75,000 square feet of retail/restaurant space, office space, housing, and a parking structure, in an effort to create a strong destination attraction in Downtown Atascadero. The project has a compact “New Urbanist” design, rather than being a sprawling suburban shopping center with a large open parking lot. Currently, the movie complex and a first phase of retail are under construction. As noted above, the broker handling the retail leasing reports strong interest from several restaurant chains. This project is likely to create a dynamic for the Downtown very different from current conditions, if it is successful in attracting patrons and shoppers. The additional foot traffic in the area would prove beneficial for all of the Downtown area, and the development of this project confirms the shift of Downtown Atascadero to a business niche not directly competitive with the offerings proposed for the Del Rio Specific Plan Area. Other Key Retail Centers There are several other major retail nodes worth noting in Atascadero and Templeton. These include the Kmart Center, Mission Oaks, the Home Depot Center, the Vineyard Center, and downtown Templeton. While there are other nodes, they tend to be either scattered outlets of smaller stand-alone retailers or restaurants, or centers focused more on service businesses than retail. The Kmart Center totals slightly less than 85,000 square feet, including the 67,322 square-foot Kmart. Vacancies are currently estimated at 6,842 square feet, or eight percent of the center total (albeit a substantial portion of the non-anchor space). While some of this space has been vacant for an extended period, it is well-maintained. The Kmart store is the PMA’s only large discount general merchandise store, and would be a direct competitor to the proposed Walmart.
11
The approximately 20,000 square-foot San Jacinto Centre contains a specialty pharmacy and other non-retail businesses and is thus not seen as competitive in the mainstream retail market. There were no vacancies noted in the center at the time of BAE’s area tour. Mission Oaks is directly across El Camino Real from the proposed Walmart site and totals approximately 83,000 square feet. This center was originally built as an outlet center, but currently suffers from high vacancy, including a space of over 20,000 square feet formerly occupied by Office Depot for little more than a year. Tenants in this center include Big Lots, 11
See further discussion below focused on general merchandise stores.
18
Game Stop, Big 5, Famous Footwear, Dollar Tree, as well as some smaller tenants such as Subway. The center contains one other vacant space in addition to the former Office Depot. The vacant spaces appear to be well-maintained; the broker contacted regarding this center indicated that prospects for leasing would improve upon approvals and completion of the Walmart. At the very north end of Atascadero is the 142,000 square-foot Home Depot center. The anchor store makes up over two-thirds of the building area, with Staples occupying a separate building of approximately 15,000 square feet. There are two other outbuildings, one with 8,000 square feet of available space. There is one unbuilt pad space, as well as another vacant lot available for an additional phase of development. In Templeton, there is the recently opened Vineyard Center with Trader Joe’s and several other small tenants. This 21,306 square-foot center has two vacant spaces totaling 2,868 square feet. Downtown Templeton has a hardware store and limited other retail and restaurants in smaller historic structures along Main Street. Many of the outlets appear to be visitor-oriented.
19
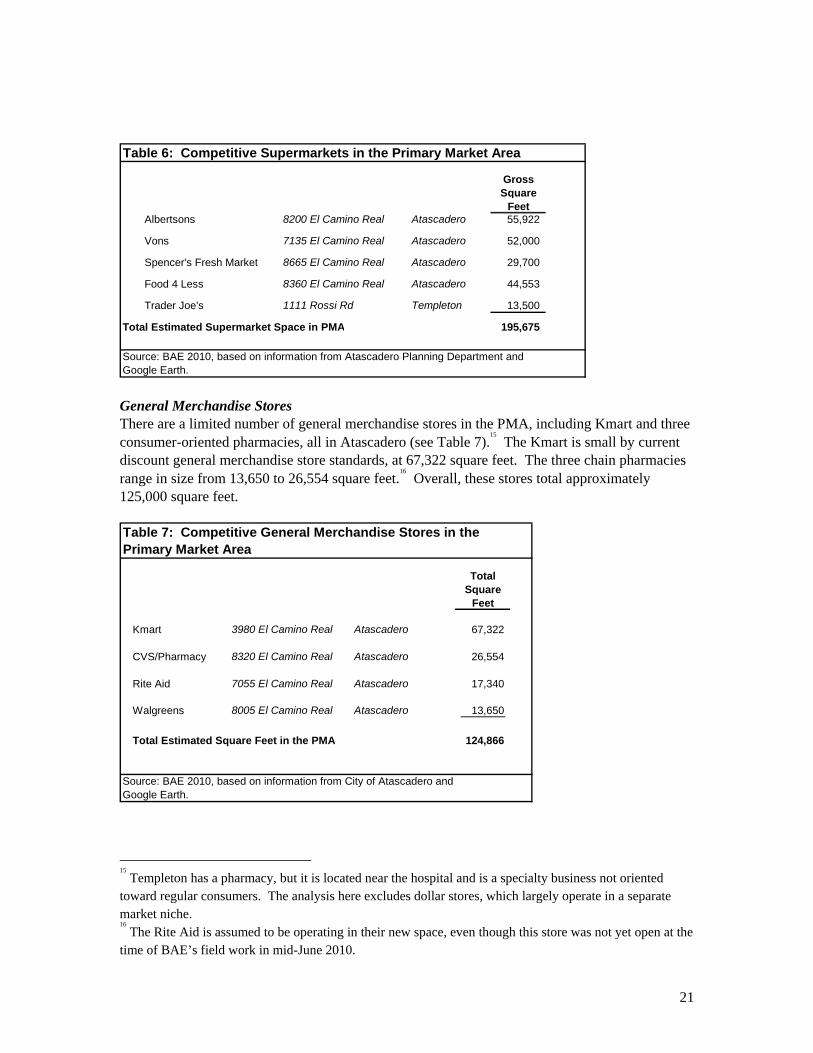
Inventory by Type of Store The Proposed Project has the potential to capture some of the substantial retail leakages as discussed below, but it will also capture sales from its most direct competitors in the PMA, especially the established supermarkets and general merchandise outlets. Following is a discussion of key competitors in the categories of food stores and general merchandise stores in the PMA, with a brief discussion of retail in other sectors. The analysis with respect to Walmart impacts focuses on larger competitors, stores that are functionally similar to that proposed store. For example, any smaller food stores such as convenience stores and specialty food stores are assumed to have a level of sales that already accounts for supermarket-type competition; an additional large supermarket-equivalent space is unlikely to draw a substantial number of shoppers away from these smaller food stores, which survive by focusing on a different market niche than major supermarkets, such as convenience or specialty goods. Furthermore, vacancies in small non-anchor spaces are unlikely to lead to closure of adjacent businesses and result in urban decay, since these vacancies in scattered smaller stores alone are less likely to result in a “downward spiral” to urban decay than the loss of the major anchor of a shopping center or district that serves to attract customers to the smaller ancillary businesses. The retail market responds regularly to scattered small vacancies as part of the normal business cycle, so vacancy of any smaller retail space is far less likely to lead to urban decay. Food Stores The Proposed Project would include space equivalent in function and layout to a supermarket, so the existing supermarkets in the PMA would be directly competitive with the Walmart, and would be most likely to be impacted by the Proposed Project as a result. At the time of analysis in July/August 2010, there were five supermarkets operating within the PMA, four in Atascadero and one in Templeton, as shown in Table 6. These include Albertsons, Vons, Spencer’s Fresh Market, and Food 4 Less in Atascadero, and Trader Joe’s in Templeton. The Albertsons and Vons are conventional national chain supermarkets, of approximately 56,000 and 52,000 square feet, respectively. The Food 4 Less is a 44,553 square-foot warehouse-style store that is part of a national brand, but with regional ownership.
12 Spencer’s is a small regional chain with five
stores, four in San Luis Obispo County and one in Santa Maria; the Atascadero store is approximately 30,000 square feet. Trader Joe’s is an expanding California-based chain with three stores in San Luis Obispo County, and numerous stores throughout the state and elsewhere. Trader Joe’s stores tend to be smaller than conventional supermarkets at less than 15,000 square feet, and offers unique brands and items often not found in other supermarkets at relatively low cost. Trader Joe’s stores typically have much higher sales per square foot than conventional supermarkets. The Templeton store is no exception, with extremely strong sales in a space estimated at 13,500 square feet. Overall, these stores total slightly less than 200,000 square feet of gross retail space. All of these stores appear to be well-maintained and clean. These stores dominate the food store category in the area; there are few other food stores of any size in the PMA. 12
The Food 4 Less in Atascadero is owned by PAQ, Inc, of Stockton, which owns 12 Food 4 Less stores in the Central Valley and San Luis Obispo County. Nationally, Kroger, a major national chain, owns many Food 4 Less-branded stores.
20
To determine sales for these stores in order to assess current performance, BAE contacted store representatives. None of the stores contacted was willing to share sales figures, which are usually considered proprietary, although some respondents shared impressions of their general sales strength and overall market conditions. Alternatively, BAE relied on the following: site visits to get a sense of overall traffic; data from Trade Dimensions, a vendor of store-by-store retail sales data acquired through various means including industry insiders; and published retail sales data for the food store category. Published taxable sales data and Zip Code Business patterns as well as the 2007 Census of Retail Trade provided a sense of the overall sales levels. BAE estimates the overall sales at these existing directly competitive supermarkets at approximately $90 million to $100 million annually, or approximately $460 to $510 per square foot.
13 This is in the range of
the median annual sales per square foot of $486 for supermarkets in super community/community shopping centers from Dollars & Cents of Shopping Centers/The SCORE 2008.
14 Trader Joe’s is
skewing this average upward, with annual sales likely greater than $1,000 per square foot. For the remaining markets, the Albertsons, Vons, and Food 4 Less are estimated to have sales in a range around the Dollars & Cents median, with Spencer’s sales at a somewhat lower level. However, as a smaller regional store, Spencer’s may have a lower hurdle rate for profitability, and as noted, the median is not a measure of profitability nor should it ever be applied as a “break-even” benchmark. Profitability information can vary considerably by individual store as well as company based on a broad range of factors including rent, financing, and labor costs. This is indicated by the broad range in sales per square foot for supermarkets. For instance, based on data derived from a survey by the HdL Companies on taxable retail sales by store type, total annual sales per square foot for various types of supermarkets in California are estimated to range from $130 to $811 (see Appendix H).
13
It should be noted that due to nondisclosure agreements, BAE cannot publish the individual store sales estimates from Trade Dimensions, which are estimates in any case rather than precise statements of sales levels. The overall estimate here should be taken as having some level of imprecision rather than as exact estimates of sales, and are not based on disclosure of individual store sales by store management in any case. 14
Published by Urban Land Institute/International Council of Shopping Centers, 2008. Note that there appears to be some variability in this estimate over time; only two years earlier, the preceding version of this publication listed the same data point as $392. The substantial change between the 2006 and 2008 publications may relate in part to sampling and data collection issues (total sample size of stores was in the 125 to 150 stores range) rather than such a large increase in sales.
21
Table 6: Competitive Supermarkets in the Primary Market Area
GrossSquare
FeetAlbertsons 8200 El Camino Real Atascadero 55,922
Vons 7135 El Camino Real Atascadero 52,000
Spencer's Fresh Market 8665 El Camino Real Atascadero 29,700
Food 4 Less 8360 El Camino Real Atascadero 44,553
Trader Joe's 1111 Rossi Rd Templeton 13,500
Total Estimated Supermarket Space in PMA 195,675
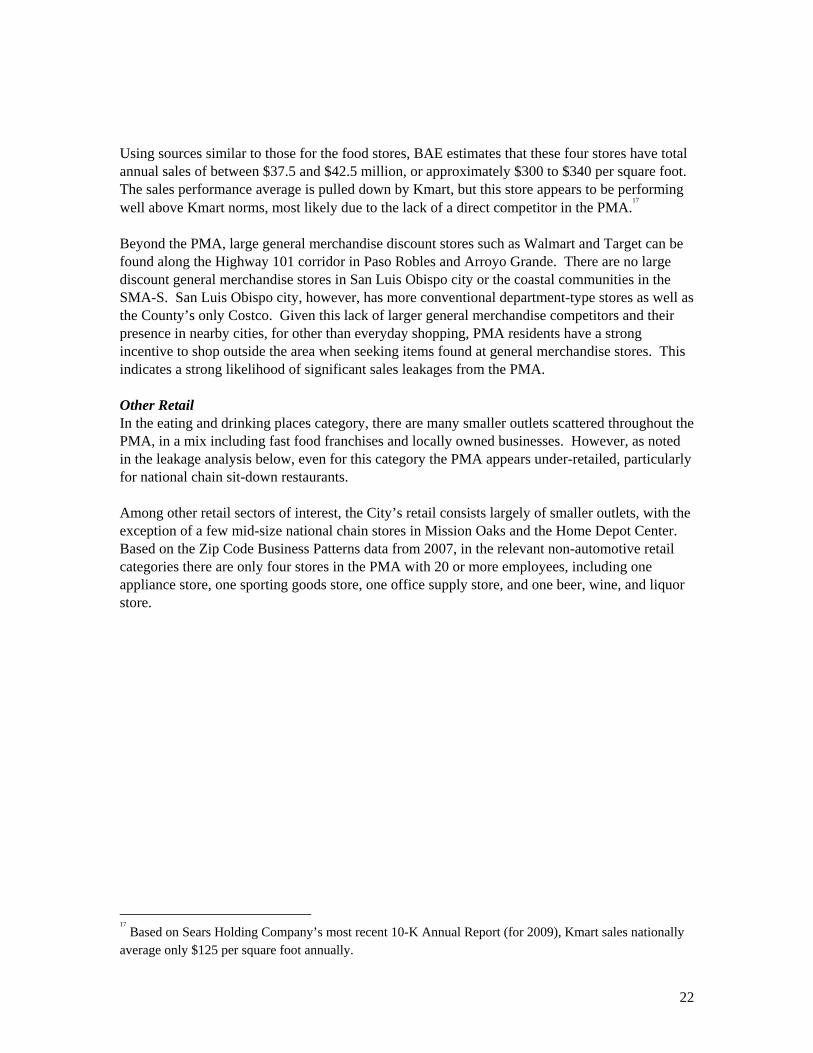
Source: BAE 2010, based on information from Atascadero Planning Department andGoogle Earth. General Merchandise Stores There are a limited number of general merchandise stores in the PMA, including Kmart and three consumer-oriented pharmacies, all in Atascadero (see Table 7).
15 The Kmart is small by current
discount general merchandise store standards, at 67,322 square feet. The three chain pharmacies range in size from 13,650 to 26,554 square feet.
16 Overall, these stores total approximately
125,000 square feet.
TotalSquare
Feet
Kmart 3980 El Camino Real Atascadero 67,322
CVS/Pharmacy 8320 El Camino Real Atascadero 26,554
Rite Aid 7055 El Camino Real Atascadero 17,340
Walgreens 8005 El Camino Real Atascadero 13,650
Total Estimated Square Feet in the PMA 124,866
Source: BAE 2010, based on information from City of Atascadero andGoogle Earth.
Table 7: Competitive General Merchandise Stores in the Primary Market Area
15
Templeton has a pharmacy, but it is located near the hospital and is a specialty business not oriented toward regular consumers. The analysis here excludes dollar stores, which largely operate in a separate market niche. 16
The Rite Aid is assumed to be operating in their new space, even though this store was not yet open at the time of BAE’s field work in mid-June 2010.
22
Using sources similar to those for the food stores, BAE estimates that these four stores have total annual sales of between $37.5 and $42.5 million, or approximately $300 to $340 per square foot. The sales performance average is pulled down by Kmart, but this store appears to be performing well above Kmart norms, most likely due to the lack of a direct competitor in the PMA.
17
Beyond the PMA, large general merchandise discount stores such as Walmart and Target can be found along the Highway 101 corridor in Paso Robles and Arroyo Grande. There are no large discount general merchandise stores in San Luis Obispo city or the coastal communities in the SMA-S. San Luis Obispo city, however, has more conventional department-type stores as well as the County’s only Costco. Given this lack of larger general merchandise competitors and their presence in nearby cities, for other than everyday shopping, PMA residents have a strong incentive to shop outside the area when seeking items found at general merchandise stores. This indicates a strong likelihood of significant sales leakages from the PMA. Other Retail In the eating and drinking places category, there are many smaller outlets scattered throughout the PMA, in a mix including fast food franchises and locally owned businesses. However, as noted in the leakage analysis below, even for this category the PMA appears under-retailed, particularly for national chain sit-down restaurants. Among other retail sectors of interest, the City’s retail consists largely of smaller outlets, with the exception of a few mid-size national chain stores in Mission Oaks and the Home Depot Center. Based on the Zip Code Business Patterns data from 2007, in the relevant non-automotive retail categories there are only four stores in the PMA with 20 or more employees, including one appliance store, one sporting goods store, one office supply store, and one beer, wine, and liquor store.
17
Based on Sears Holding Company’s most recent 10-K Annual Report (for 2009), Kmart sales nationally average only $125 per square foot annually.
23
RETAIL SALES ANALYSIS This section examines retail trends in Atascadero and the market areas. Data from the incorporated cities within the market areas are presented, along with comparative data from San Luis Obispo County and California. The analysis presents an overview of retail sales, and then focuses on the key categories of food stores and general merchandise stores that represent the primary competition with the Proposed Project’s major component, the Walmart store. A discussion of sales in other key retail store categories is also presented. A leakage analysis for the Primary Market Area is undertaken to identify the relative strength of major retail sectors, in comparison to each other and to the county overall. The primary source of information on general retail expenditures in California is the taxable retail sales data published by the State Board of Equalization (SBOE). SBOE publishes Taxable Sales in California, a quarterly and annual publication that reports taxable sales by major store categories by city and county. With adjustments made to take into account nontaxable sales such as food and prescriptions, this source usually offers the best baseline data for jurisdictions for which it is available. The most recent published annual data available at the time of this analysis were from 2008; additionally data from the first two quarters of 2009 are available, but SBOE has undertaken a major reclassification of businesses that makes comparisons with earlier data and a continued time series difficult if not impossible. The lag in data reporting must be taken into consideration, especially in light of the currently unsettled economic climate. Because of the limitations with SBOE data with respect to availability for unincorporated areas which make up a large portion of all the Market Areas, the leakage analysis itself utilizes estimates based on Zip Code and County Business Patterns employment data benchmarked to adjusted data on sales per employee from the 2007 Census of Retail Trade, with adjustments by category made based on crosschecks with the Census of Retail Trade and SBOE data. Retail Sales Trends in San Luis Obispo County and Cities in the Market Areas The following section presents SBOE-derived retail sales data from Atascadero, San Luis Obispo city, and Paso Robles, which are the incorporated places within the market areas for which the state publishes retail sales data by major store category,
18 and which, based on the location of
residents as well as most retail outlets, account for a large proportion of the retail sales in the PMA and the SMAs. For comparative purposes sales data from San Luis Obispo County and the State of California are also presented. All data are presented in constant 2009 dollars, based on the California Consumer Price Index. Taxable sales have been adjusted for the general merchandise and food store categories based on a factor derived from a comparison of taxable sales as reported by SBOE and total retail sales as reported by the Census of Retail Trade. Finally, the static estimate based on Zip Code Business Patterns is presented and discussed; this estimate relies on the most recent data available from that source, from 2007. 18
Data for Morro Bay are not published by retail store category.
24
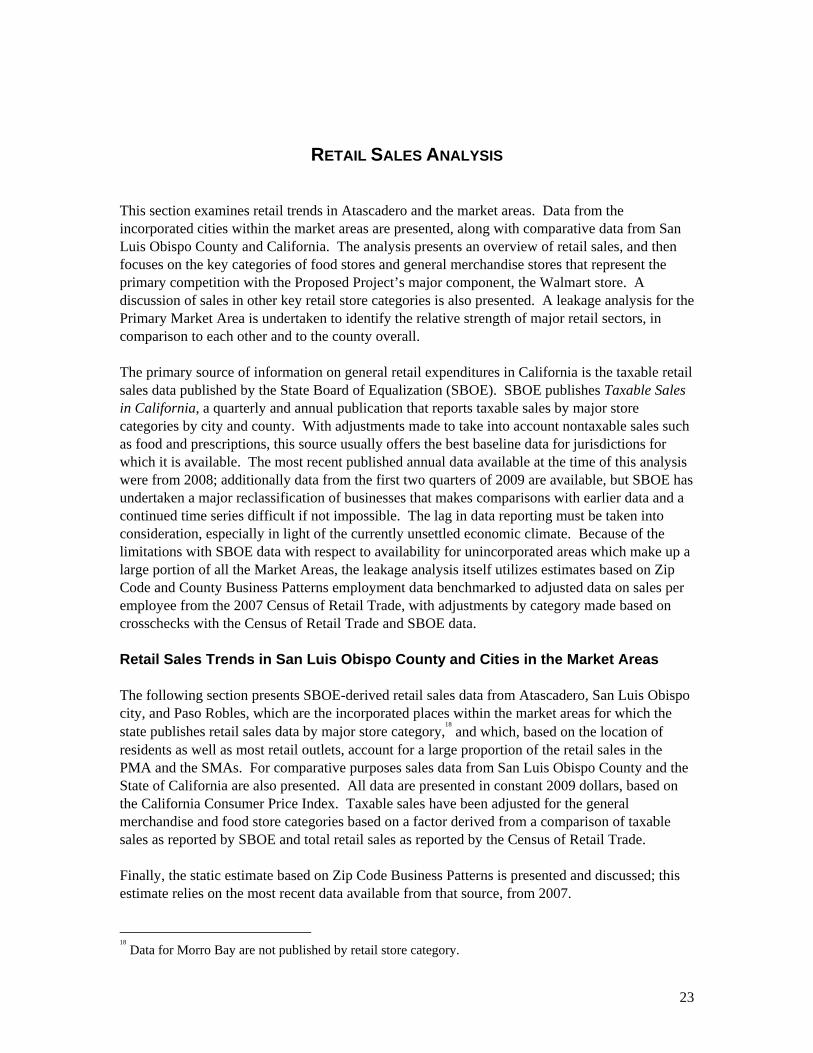
Atascadero Over the 2000 through 2009 period,
19 overall inflation-adjusted retail sales
20 in Atascadero were
relatively stable through 2006, after which sales entered a period of substantial decline (see Figure 2). In constant dollars, sales in the most recent four quarters were only 84 percent of 2000 sales and only 73 percent of peak-year sales in 2005. These declines occurred despite a gradual increase in population over the period, indicating the impacts of the ongoing recession. For the most recent annual period, overall retail sales were estimated at $304 million, or $10,668 per capita. In comparison to Paso Robles and San Luis Obispo city, these are relatively low sales levels. Figure 2: Atascadero Retail Sales and Population Trends
Notes: Population data from State Department of Finance. May vary from other sources. Taxable retail sales data havebeen adjusted for nontaxable items. All sales shown in 2009 dollars. For details, see Appendix C.
Sources: Bay Area Economics 2010, based on sources as noted in Appendix C.
-
5,000
10,000
15,000
20,000
25,000
30,000
35,000
40,000
45,000
50,000
$0
$50,000
$100,000
$150,000
$200,000
$250,000
$300,000
$350,000
$400,000
$450,000
$500,000
Total Retail Sales ($000) Population
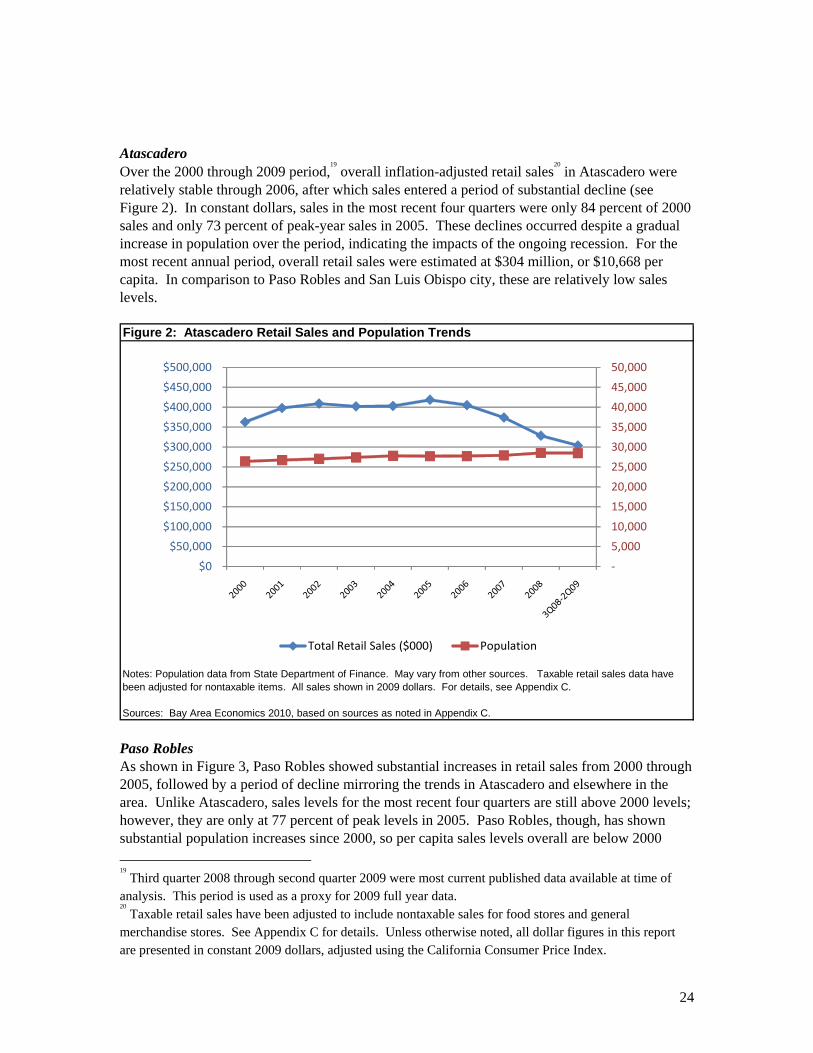
Paso Robles As shown in Figure 3, Paso Robles showed substantial increases in retail sales from 2000 through 2005, followed by a period of decline mirroring the trends in Atascadero and elsewhere in the area. Unlike Atascadero, sales levels for the most recent four quarters are still above 2000 levels; however, they are only at 77 percent of peak levels in 2005. Paso Robles, though, has shown substantial population increases since 2000, so per capita sales levels overall are below 2000 19
Third quarter 2008 through second quarter 2009 were most current published data available at time of analysis. This period is used as a proxy for 2009 full year data. 20
Taxable retail sales have been adjusted to include nontaxable sales for food stores and general merchandise stores. See Appendix C for details. Unless otherwise noted, all dollar figures in this report are presented in constant 2009 dollars, adjusted using the California Consumer Price Index.
25
levels. Per capita sales levels are approximately twice levels in Atascadero, an indicator that PMA residents are shopping in nearby Paso Robles. For the most recent annual period, total retail sales in Paso Robles are estimated at $571 million, or $19,018 per capita. Figure 3: Paso Robles Retail Sales and Population Trends
Notes: Population data from State Department of Finance. May vary from other sources. Taxable retail sales data havebeen adjusted for nontaxable items. All sales shown in 2009 dollars. For details, see Appendix C.
Sources: Bay Area Economics 2010, based on sources as noted in Appendix C.
-
10,000
20,000
30,000
40,000
50,000
60,000
70,000
80,000
$0
$100,000
$200,000
$300,000
$400,000
$500,000
$600,000
$700,000
$800,000
Total Retail Sales ($000) Population
City of San Luis Obispo In San Luis Obispo city, inflation-adjusted retail sales increased through 2006,
21 after which they
sharply declined in the same fashion as in Atascadero and Paso Robles (see Figure 4). Nevertheless, sales are still above 2000 levels, and are at 83 percent of peak-year 2006 levels. These increases occurred even though the city population has been almost unchanged since 2000, and as a result, per capita sales actually increased over the decade, unlike the other geographies being discussed in this analysis. Additionally, per capita sales in the city are even higher than for Paso Robles, indicating the City’s position as the prime retail destination in the County. For the most recent annual period, total retail sales are estimated at $1.07 billion, or $23,892 per capita.
21
Much of the increase in 2006 was due to a substantial jump in general merchandise store sales. The Costco in San Luis Obispo city opened in September 2005.

26
Figure 4: City of San Luis Obispo Retail Sales and Population Trends
Notes: Population data from State Department of Finance. May vary from other sources. Taxable retail sales data havebeen adjusted for nontaxable items. All sales shown in 2009 dollars. For details, see Appendix C.
Sources: Bay Area Economics 2010, based on sources as noted in Appendix C.
-
20,000
40,000
60,000
80,000
100,000
120,000
140,000
160,000
$0
$200,000
$400,000
$600,000
$800,000
$1,000,000
$1,200,000
$1,400,000
Total Retail Sales ($000) Population
San Luis Obispo County Trends in San Luis Obispo County are similar to those for the City of San Luis Obispo, as shown in Figure 5. Retail sales increased annually from 2000 through 2006, after which a decline ensued. Total sales in the most recent reported annual period were $3.22 billion, down from $3.98 billion in 2006, but slightly higher than in 2000. Annual per capita sales also peaked in 2006, and have since declined to $11,920, 93 percent of the level in 2000. As context, Atascadero’s share of countywide total retail sales in 2009 is estimated at nine percent, with the City having 11 percent of the County’s population. Per capita sales in Atascadero are 88 percent of Countywide levels.

27
Figure 5: San Luis Obispo County Retail Sales and Population Trends
Notes: Population data from State Department of Finance. May vary from other sources. Taxable retail sales data havebeen adjusted for nontaxable items. All sales shown in 2009 dollars. For details, see Appendix C.
Sources: Bay Area Economics 2010, based on sources as noted in Appendix C.
-
50,000
100,000
150,000
200,000
250,000
300,000
350,000
400,000
450,000
$0
$500,000
$1,000,000
$1,500,000
$2,000,000
$2,500,000
$3,000,000
$3,500,000
$4,000,000
$4,500,000
Total Retail Sales ($000) Population
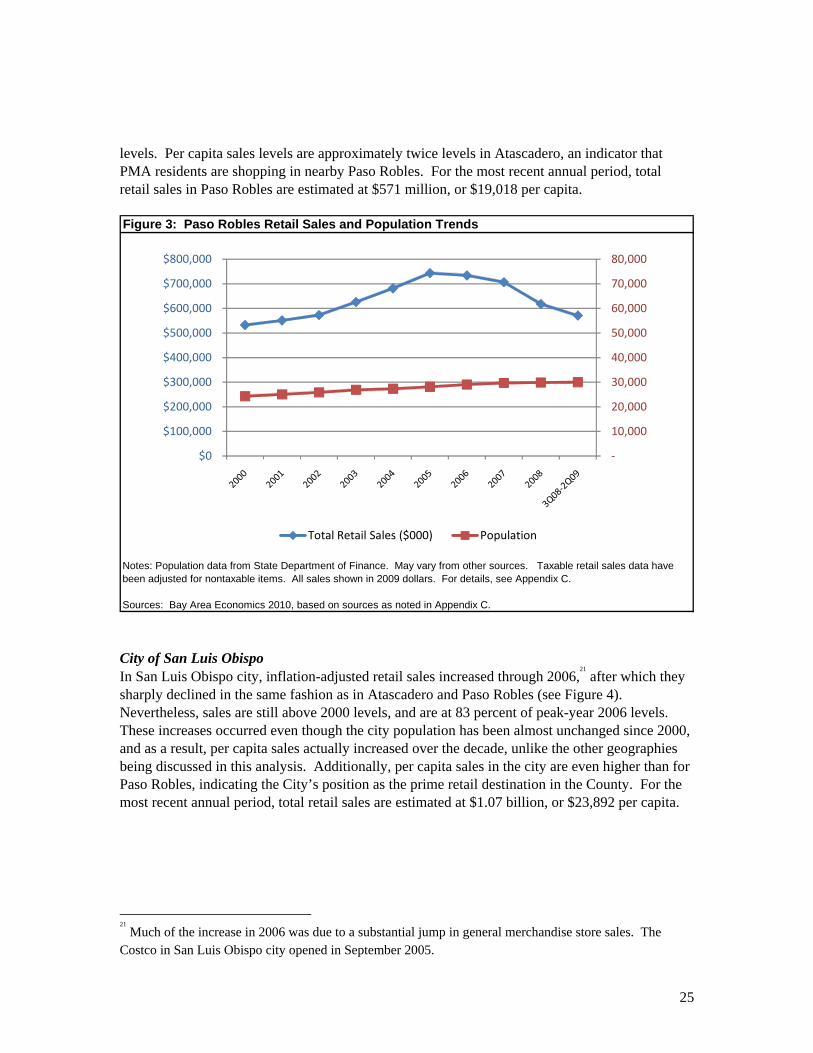
California As shown in Figure 6, retail sales levels for California were relatively flat from 2000 through 2002, reflecting the dot-com bust and post 9/11 decline, effects of which were apparently not as greatly felt in San Luis Obispo County, which continued to show increase during that period. Statewide sales then increased through 2005, with declines since that year. Annual estimated sales of $385 million for the most recent four quarters reported are only slightly above inflation-adjusted 2000 levels, even though the population of the state increased by 13 percent in the same period. As a result, annual per capita sales are only 79 percent of 2000 levels, at $10,071.
28
Figure 6: California Retail Sales and Population Trends
Notes: Population data from State Department of Finance. May vary from other sources. Taxable retail sales data havebeen adjusted for nontaxable items. All sales shown in 2009 dollars. For details, see Appendix C.
Sources: Bay Area Economics 2010, based on sources as noted in Appendix C.
-
10,000,000
20,000,000
30,000,000
40,000,000
50,000,000
60,000,000
$0
$100,000,000
$200,000,000
$300,000,000
$400,000,000
$500,000,000
$600,000,000
Total Retail Sales ($000) Population
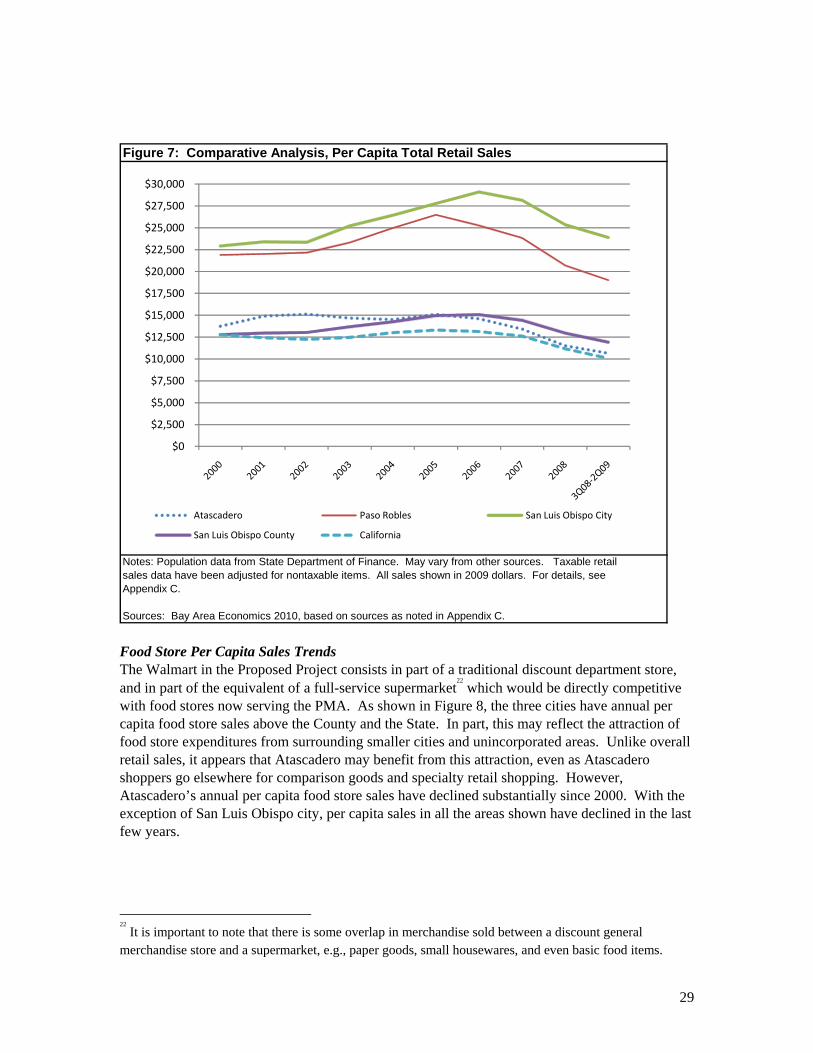
Per Capita Taxable Retail Sales Total Per Capita Retail Sales Per capita retail sales are an indicator of the relative strength of a locale as a retail destination; other factors being equal, higher per capita sales relative to a larger benchmark area point toward attraction of shoppers from outside the area, and lower per capita sales indicate that local shoppers are going elsewhere to make their purchases. As shown in Figure 7, inflation-adjusted annual per capita sales declined for all of the geographies over the 2000 through 2009 period, with the exception of San Luis Obispo city, which nevertheless showed a substantial decline from peak levels in 2006. Atascadero and San Luis Obispo County generally track together in a range from $10,000 to $15,000 per capita. Paso Robles and San Luis Obispo city, however, show per capita sales in a much higher range. This difference cannot be attributed to income differences, as annual per capita income for all the geographies falls in a range from approximately $27,500 to $31,000. In fact, Atascadero and the PMA have higher median household incomes than the other areas, and the SMA-S, which includes San Luis Obispo City, has the lowest household income levels. Thus the higher per capita retail sales for the two cities are likely an indicator of retail sales attraction for those locales.
29
Figure 7: Comparative Analysis, Per Capita Total Retail Sales
Notes: Population data from State Department of Finance. May vary from other sources. Taxable retailsales data have been adjusted for nontaxable items. All sales shown in 2009 dollars. For details, seeAppendix C.
Sources: Bay Area Economics 2010, based on sources as noted in Appendix C.
$0
$2,500
$5,000
$7,500
$10,000
$12,500
$15,000
$17,500
$20,000
$22,500
$25,000
$27,500
$30,000
Atascadero Paso Robles San Luis Obispo City
San Luis Obispo County California
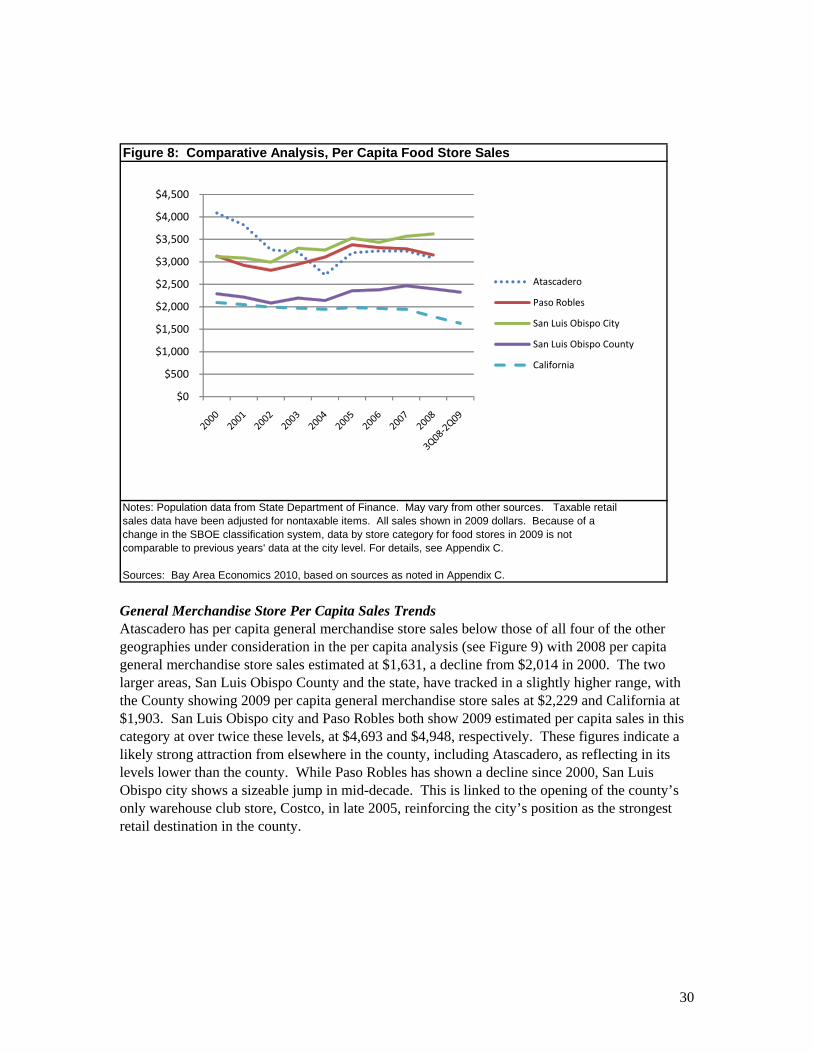
Food Store Per Capita Sales Trends The Walmart in the Proposed Project consists in part of a traditional discount department store, and in part of the equivalent of a full-service supermarket
22 which would be directly competitive
with food stores now serving the PMA. As shown in Figure 8, the three cities have annual per capita food store sales above the County and the State. In part, this may reflect the attraction of food store expenditures from surrounding smaller cities and unincorporated areas. Unlike overall retail sales, it appears that Atascadero may benefit from this attraction, even as Atascadero shoppers go elsewhere for comparison goods and specialty retail shopping. However, Atascadero’s annual per capita food store sales have declined substantially since 2000. With the exception of San Luis Obispo city, per capita sales in all the areas shown have declined in the last few years.
22
It is important to note that there is some overlap in merchandise sold between a discount general merchandise store and a supermarket, e.g., paper goods, small housewares, and even basic food items.
30
Figure 8: Comparative Analysis, Per Capita Food Store Sales
Notes: Population data from State Department of Finance. May vary from other sources. Taxable retailsales data have been adjusted for nontaxable items. All sales shown in 2009 dollars. Because of achange in the SBOE classification system, data by store category for food stores in 2009 is notcomparable to previous years' data at the city level. For details, see Appendix C.
Sources: Bay Area Economics 2010, based on sources as noted in Appendix C.
$0
$500
$1,000
$1,500
$2,000
$2,500
$3,000
$3,500
$4,000
$4,500
Atascadero
Paso Robles
San Luis Obispo City
San Luis Obispo County
California
General Merchandise Store Per Capita Sales Trends Atascadero has per capita general merchandise store sales below those of all four of the other geographies under consideration in the per capita analysis (see Figure 9) with 2008 per capita general merchandise store sales estimated at $1,631, a decline from $2,014 in 2000. The two larger areas, San Luis Obispo County and the state, have tracked in a slightly higher range, with the County showing 2009 per capita general merchandise store sales at $2,229 and California at $1,903. San Luis Obispo city and Paso Robles both show 2009 estimated per capita sales in this category at over twice these levels, at $4,693 and $4,948, respectively. These figures indicate a likely strong attraction from elsewhere in the county, including Atascadero, as reflecting in its levels lower than the county. While Paso Robles has shown a decline since 2000, San Luis Obispo city shows a sizeable jump in mid-decade. This is linked to the opening of the county’s only warehouse club store, Costco, in late 2005, reinforcing the city’s position as the strongest retail destination in the county.
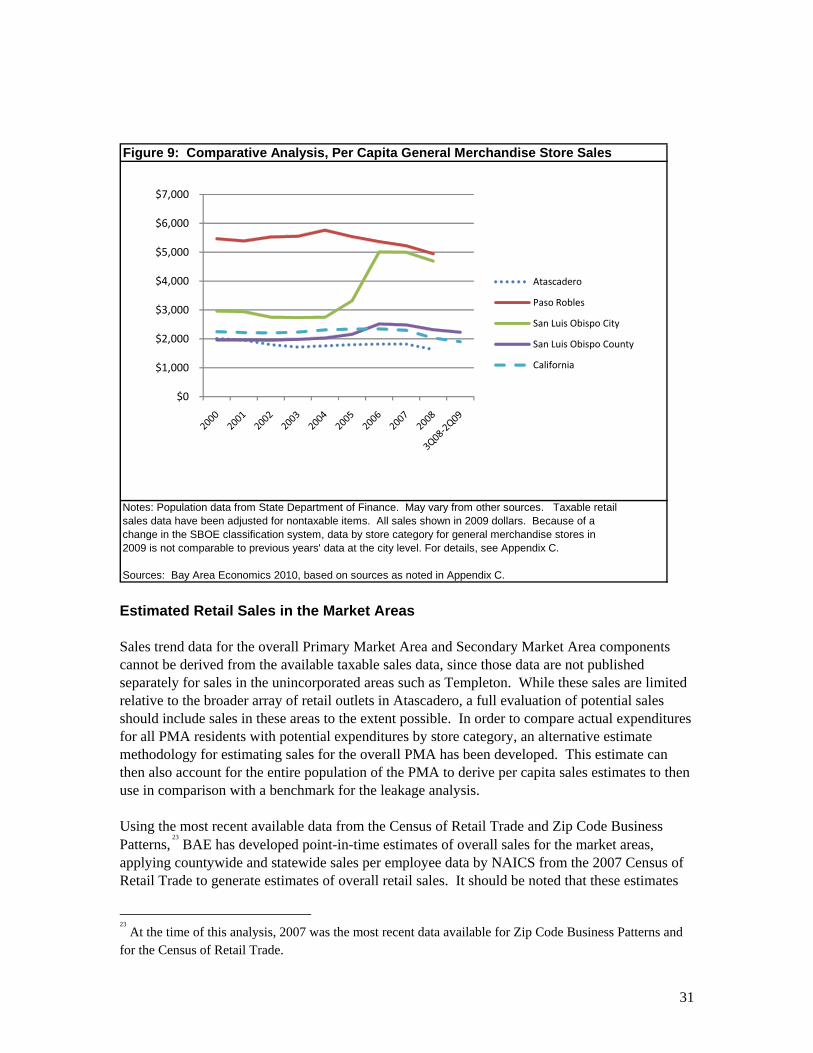
31
Figure 9: Comparative Analysis, Per Capita General Merchandise Store Sales
Notes: Population data from State Department of Finance. May vary from other sources. Taxable retailsales data have been adjusted for nontaxable items. All sales shown in 2009 dollars. Because of achange in the SBOE classification system, data by store category for general merchandise stores in2009 is not comparable to previous years' data at the city level. For details, see Appendix C.
Sources: Bay Area Economics 2010, based on sources as noted in Appendix C.
$0
$1,000
$2,000
$3,000
$4,000
$5,000
$6,000
$7,000
Atascadero
Paso Robles
San Luis Obispo City
San Luis Obispo County
California
Estimated Retail Sales in the Market Areas Sales trend data for the overall Primary Market Area and Secondary Market Area components cannot be derived from the available taxable sales data, since those data are not published separately for sales in the unincorporated areas such as Templeton. While these sales are limited relative to the broader array of retail outlets in Atascadero, a full evaluation of potential sales should include sales in these areas to the extent possible. In order to compare actual expenditures for all PMA residents with potential expenditures by store category, an alternative estimate methodology for estimating sales for the overall PMA has been developed. This estimate can then also account for the entire population of the PMA to derive per capita sales estimates to then use in comparison with a benchmark for the leakage analysis. Using the most recent available data from the Census of Retail Trade and Zip Code Business Patterns,
23 BAE has developed point-in-time estimates of overall sales for the market areas,
applying countywide and statewide sales per employee data by NAICS from the 2007 Census of Retail Trade to generate estimates of overall retail sales. It should be noted that these estimates
23
At the time of this analysis, 2007 was the most recent data available for Zip Code Business Patterns and for the Census of Retail Trade.
32
should be considered as approximate, since the exact employment numbers for each store are not available; instead, the published data group stores into an employment class size.24 However, the availability of SBOE and Economic Census data for the same period (2007) made refinements possible based on cross-checking the Zip Code-derived estimates against the other sources and making adjustments accordingly, so these the figures should reasonably estimate the order of magnitude of overall retail sales by category. For the purposes of the analysis here, the estimated retail sales have been grouped into six categories: general merchandise stores, food stores, eating and drinking places, building materials, other non-automotive retail,
25 and automotive and gas stations. The first two categories
cover the anchor Walmart store, and eating and drinking places and non-automotive remainder category covers other potential uses for the outlots and the Annex. The building materials category has been excluded since the PMA appears to already show attraction in this category due in large part to the presence of Home Depot (as well as the two large hardware stores on El Camino Real south of Downtown), so further attraction of sales in this category is deemed unlikely. The auto-related category includes uses largely inappropriate for the proposed project. To the extent that any potential uses in these categories (e.g., auto parts store) have been excluded, the leakage and capture analysis that follows is conservative. As shown in Table 8, project-suitable retail sales for the PMA are estimated at approximately $274 million in 2007.
26 Overall, project-suitable annual per capita sales in the Primary Market
Area are estimated at $6,541, approximately two-thirds of countywide levels of $9,552. This is a very strong indicator that residents of the PMA are doing much of their retail spending elsewhere, especially given the relatively high levels in the nearby SMAs. By category, PMA general merchandise store per capita sales were only 58 percent of countywide levels, with annual per capita sales of only $1,316 contrasted with $2,271 for San Luis Obispo County. The SMA-N area, which includes Paso Robles, shows extremely high per capita sales at $3,257. The SMA-S area is also slightly above countywide levels at $2,559. Given the lack of discount general merchandise stores in San Luis Obispo city, these sales levels may be driven in large part by the presence of Costco, along with some more traditional departments stores such as Sears. Food store sales are a form of convenience shopping, where shoppers go to stores frequently and closer to home; thus leakages of food store sales are typically minimal. This is reflected in the food store per capita sales for the PMA, which are less than 10 percent below county levels and 24
For example, one store size category in the Zip Code Business Patterns ranges from 25 to 49 employees; estimates are based on a central point in this range, since the exact number of employees is unknown. 25
This category includes stores selling apparel, home furnishings and appliances, and other stores specializing in electronics, computers, jewelry, office supplies, and other items. 26
2007 estimated sales have been inflation-adjusted to 2009 dollars. Project-suitable retail sales include retails sales for the major store categories that might be found in the Proposed Project. As a result, automotive, service station, and building materials have been excluded from the sales estimate, since in large part these categories would not be appropriate for the project as proposed.
33
are above statewide levels. Even for this more local-serving store category, however, the SMAs show strong per capita sales. For eating and drinking places, the PMA per capita sales levels are only two-thirds of countywide levels, and are also below statewide levels. The SMAs show strong per capita sales in this category, yet another indicator of their regional sales attraction strength. For the other non-automotive retail category, which consists in large part of comparison shopping-oriented specialty retail stores, per capita sales in the PMA are well below countywide and statewide levels. For this category, the SMA-N area per capita sales are also below countywide levels, while the SMA-S area has extremely strong per capita sales. Overall, these figures show how the PMA generally has weak sales relative to the county, and especially relative to the surrounding SMAs. It appears that the SMAs are pulling retail sales out of Atascadero and the PMA; this will be explored more fully in the following retail sales leakage analysis.
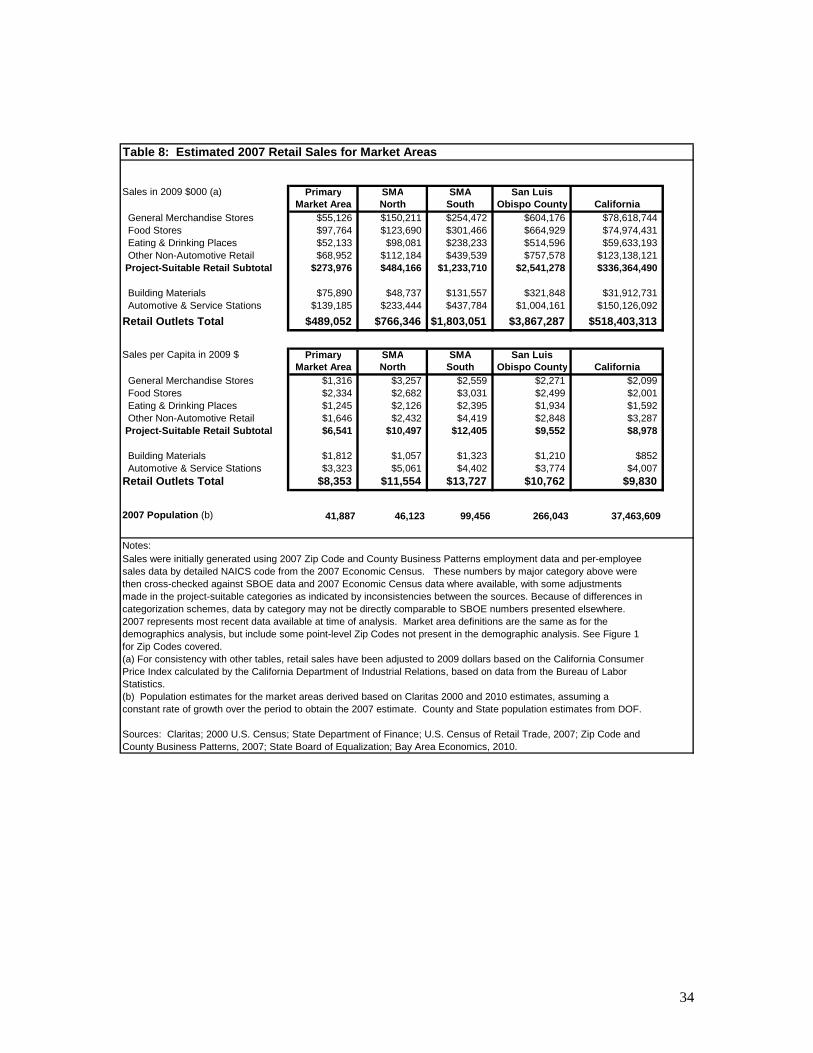
34
Table 8: Estimated 2007 Retail Sales for Market Areas
Sales in 2009 $000 (a) Primary SMA SMA San LuisMarket Area North South Obispo County California
General Merchandise Stores $55,126 $150,211 $254,472 $604,176 $78,618,744 Food Stores $97,764 $123,690 $301,466 $664,929 $74,974,431 Eating & Drinking Places $52,133 $98,081 $238,233 $514,596 $59,633,193 Other Non-Automotive Retail $68,952 $112,184 $439,539 $757,578 $123,138,121 Project-Suitable Retail Subtotal $273,976 $484,166 $1,233,710 $2,541,278 $336,364,490
Building Materials $75,890 $48,737 $131,557 $321,848 $31,912,731 Automotive & Service Stations $139,185 $233,444 $437,784 $1,004,161 $150,126,092Retail Outlets Total $489,052 $766,346 $1,803,051 $3,867,287 $518,403,313
Sales per Capita in 2009 $ Primary SMA SMA San LuisMarket Area North South Obispo County California
General Merchandise Stores $1,316 $3,257 $2,559 $2,271 $2,099 Food Stores $2,334 $2,682 $3,031 $2,499 $2,001 Eating & Drinking Places $1,245 $2,126 $2,395 $1,934 $1,592 Other Non-Automotive Retail $1,646 $2,432 $4,419 $2,848 $3,287 Project-Suitable Retail Subtotal $6,541 $10,497 $12,405 $9,552 $8,978
Building Materials $1,812 $1,057 $1,323 $1,210 $852 Automotive & Service Stations $3,323 $5,061 $4,402 $3,774 $4,007Retail Outlets Total $8,353 $11,554 $13,727 $10,762 $9,830
2007 Population (b) 41,887 46,123 99,456 266,043 37,463,609
Notes:Sales were initially generated using 2007 Zip Code and County Business Patterns employment data and per-employeesales data by detailed NAICS code from the 2007 Economic Census. These numbers by major category above werethen cross-checked against SBOE data and 2007 Economic Census data where available, with some adjustmentsmade in the project-suitable categories as indicated by inconsistencies between the sources. Because of differences incategorization schemes, data by category may not be directly comparable to SBOE numbers presented elsewhere. 2007 represents most recent data available at time of analysis. Market area definitions are the same as for thedemographics analysis, but include some point-level Zip Codes not present in the demographic analysis. See Figure 1for Zip Codes covered.(a) For consistency with other tables, retail sales have been adjusted to 2009 dollars based on the California ConsumerPrice Index calculated by the California Department of Industrial Relations, based on data from the Bureau of LaborStatistics. (b) Population estimates for the market areas derived based on Claritas 2000 and 2010 estimates, assuming aconstant rate of growth over the period to obtain the 2007 estimate. County and State population estimates from DOF.
Sources: Claritas; 2000 U.S. Census; State Department of Finance; U.S. Census of Retail Trade, 2007; Zip Code andCounty Business Patterns, 2007; State Board of Equalization; Bay Area Economics, 2010.
35
Leakage Analysis for the Primary Market Area Overview of Methodology Retail leakage analysis compares actual retail sales in an area with some benchmark that provides a measure of the potential sales generated by that area's residents. If sales levels are below the predicted level, the area may be able to support increased sales, either through the opening of new outlets targeting those leakages or a repositioning of existing outlets such that they could capture that leakage. A lower-than-predicted sales volume is a strong indicator that consumers are traveling outside the area to shop; thus, the sales are “leaking” out of the study area. Conversely, if the area shows more sales than would be expected from the area's characteristics, there are sales “injections” into the study area. Often, an injection of sales indicates that the study area is serving as the regional shopping destination for a broader area. On the other hand, if an area shows substantial leakage, it may be due to the presence of a region-serving retail node outside but near the study area capturing those “leaked” sales. In such a case, the study area itself may not have sufficient population to support the region-serving retail, so those sales cannot necessarily expect to be captured within the study area. There are a number of factors that can be used to predict sales levels, with the two most important factors being the number of persons in the area and the disposable income available to that population. Additional factors influencing retail spending in an area include household type, age of population, number of workers in the area (i.e., daytime population), tourism expenditures, tenure patterns (owner vs. renter), and cultural factors. As noted above, the PMA has overall per capita sales below county and statewide levels for the major retail categories under consideration. This alone, however, does not indicate that the PMA is “leaking” sales to other locales; for instance, lower income levels could account in part for differing local spending patterns, and shopping patterns may vary due to consumer preferences as well as the retail options available locally. However, the PMA and the SMAs show per capita incomes similar to those countywide and statewide; while there are some variations in household income due to variations in household size by subarea, San Luis Obispo County is relatively homogenous in terms of consumer profile, compared to a larger urban area that might include substantial communities segregated by income and other characteristics. San Luis Obispo County is also relatively isolated from other large shopping nodes and is also a relatively isolated commute shed, and as such its consumer expenditures are relatively self-contained. Since the PMA has per capita income levels very similar to those countywide (see Table 5 above), the County is used here as the benchmark to assess sales leakage levels. Primary Market Area Sales Potential As a result, the comparison of the PMA to the County as discussed above provides the initial leakage analysis. The per capita comparison of the PMA to the County is repeated as the first step in Table 9. The low per capita sales for the PMA relative to the County are a good indicator that the PMA is leaking retail sales to surrounding communities.
36
The next step in the leakage analysis has been to apply an adjustment multiplier to take into account the decline in sales since 2007, the year for which the initial per capita sales estimates have been generated in Table 8 above. This multiplier is based on a comparison of countywide taxable retail sales in 2007 to sales in the most recent four quarters reported, adjusted for inflation to constant 2009 dollars. These multipliers vary by retail store type; not surprisingly, since food items are a daily necessity, food store sales have not declined as much on a percentage basis as other categories.
27
High levels of leakage across the project-relevant retail categories are confirmed by the analysis results shown in Table 9. The PMA shows substantial leakages across all major categories or grouped categories of sales relevant to the Proposed Project. For each of the general merchandise stores, eating and drinking places, as well as the catch-all other non-automotive retail sales categories, over one-third of potential sales from PMA residents are occurring elsewhere. Overall, for the key categories the PMA has estimated leakages of approximately $117 million in 2010, approximately one-third of the estimated potential sales. As the PMA undergoes modest growth, under current retail conditions, these leakages would grow to an estimated $122 million in 2013 and $127 million in 2018. The proportion of leakages and injections are assumed to remain constant, with increases in the absolute numbers as overall retail sales grow due to population increase, assuming no additional new retail development. This assumption allows the existing retailers to gain sales, while assuming the propensity for leakages will remain constant given no change in the retail mix. The proposed Walmart could capture a substantial portion of the general merchandise store leakage, and given the general lack of major specialty retailers in the PMA, the Walmart could also capture some sales that would normally go to these other store types (e.g., apparel) in a market area with more shopping options. The pads assumed for restaurants could absorb some of the leakages in the eating and drinking places category. Other unspecified outlet types on the outlots and in the Annex could also capture sales from the non-automotive category.
27
The procedure here is conservative in that it adjusts expected sales downward to reflect current recessionary conditions. It is possible that economic conditions will improve by 2013 when the Proposed Project is assumed to open, which might cause sales to increase above current lows.
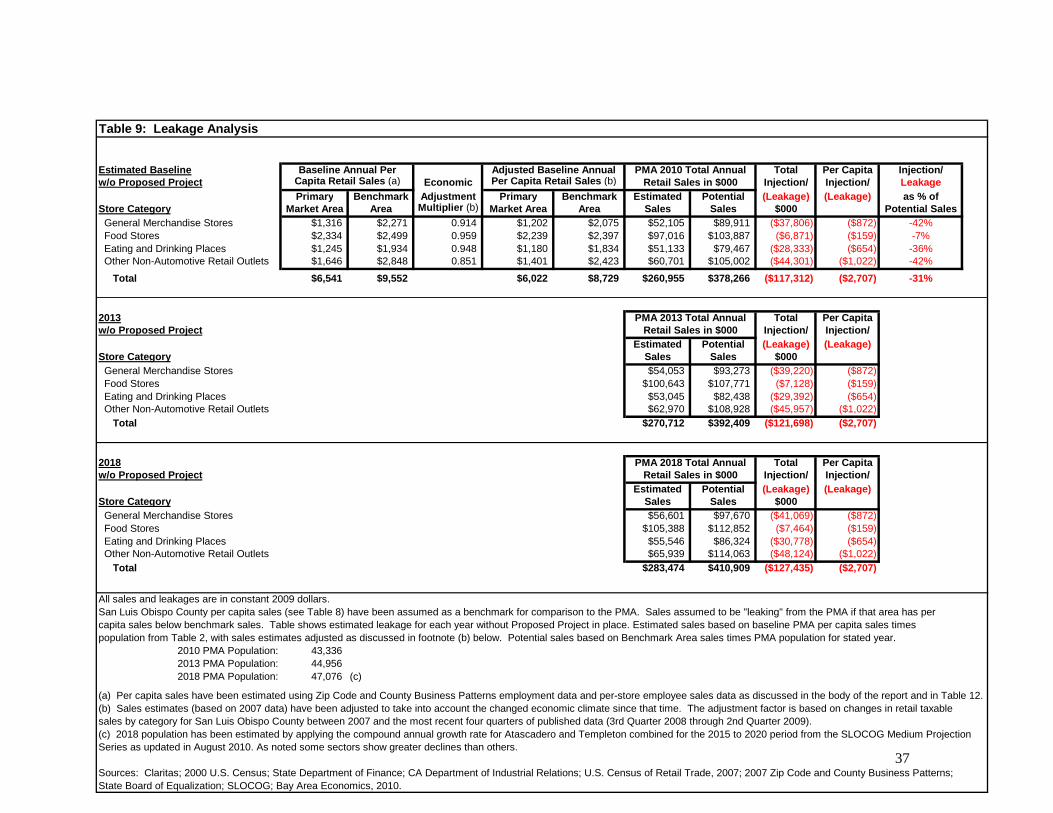
37
Table 9: Leakage Analysis
Estimated Baseline Baseline Annual Per Adjusted Baseline Annual PMA 2010 Total Annual Total Per Capita Injection/w/o Proposed Project Capita Retail Sales (a) Economic Per Capita Retail Sales (b) Retail Sales in $000 Injection/ Injection/ Leakage
Primary Benchmark Adjustment Primary Benchmark Estimated Potential (Leakage) (Leakage) as % ofStore Category Market Area Area Multiplier (b) Market Area Area Sales Sales $000 Potential Sales General Merchandise Stores $1,316 $2,271 0.914 $1,202 $2,075 $52,105 $89,911 ($37,806) ($872) -42% Food Stores $2,334 $2,499 0.959 $2,239 $2,397 $97,016 $103,887 ($6,871) ($159) -7% Eating and Drinking Places $1,245 $1,934 0.948 $1,180 $1,834 $51,133 $79,467 ($28,333) ($654) -36% Other Non-Automotive Retail Outlets $1,646 $2,848 0.851 $1,401 $2,423 $60,701 $105,002 ($44,301) ($1,022) -42%
Total $6,541 $9,552 $6,022 $8,729 $260,955 $378,266 ($117,312) ($2,707) -31%
2013 PMA 2013 Total Annual Total Per Capitaw/o Proposed Project Retail Sales in $000 Injection/ Injection/
Estimated Potential (Leakage) (Leakage)Store Category Sales Sales $000 General Merchandise Stores $54,053 $93,273 ($39,220) ($872) Food Stores $100,643 $107,771 ($7,128) ($159) Eating and Drinking Places $53,045 $82,438 ($29,392) ($654) Other Non-Automotive Retail Outlets $62,970 $108,928 ($45,957) ($1,022) Total $270,712 $392,409 ($121,698) ($2,707)
2018 PMA 2018 Total Annual Total Per Capitaw/o Proposed Project Retail Sales in $000 Injection/ Injection/
Estimated Potential (Leakage) (Leakage)Store Category Sales Sales $000 General Merchandise Stores $56,601 $97,670 ($41,069) ($872) Food Stores $105,388 $112,852 ($7,464) ($159) Eating and Drinking Places $55,546 $86,324 ($30,778) ($654) Other Non-Automotive Retail Outlets $65,939 $114,063 ($48,124) ($1,022) Total $283,474 $410,909 ($127,435) ($2,707)
All sales and leakages are in constant 2009 dollars.San Luis Obispo County per capita sales (see Table 8) have been assumed as a benchmark for comparison to the PMA. Sales assumed to be "leaking" from the PMA if that area has percapita sales below benchmark sales. Table shows estimated leakage for each year without Proposed Project in place. Estimated sales based on baseline PMA per capita sales timespopulation from Table 2, with sales estimates adjusted as discussed in footnote (b) below. Potential sales based on Benchmark Area sales times PMA population for stated year.
2010 PMA Population: 43,336 2013 PMA Population: 44,956 2018 PMA Population: 47,076 (c)
(a) Per capita sales have been estimated using Zip Code and County Business Patterns employment data and per-store employee sales data as discussed in the body of the report and in Table 12.(b) Sales estimates (based on 2007 data) have been adjusted to take into account the changed economic climate since that time. The adjustment factor is based on changes in retail taxablesales by category for San Luis Obispo County between 2007 and the most recent four quarters of published data (3rd Quarter 2008 through 2nd Quarter 2009).(c) 2018 population has been estimated by applying the compound annual growth rate for Atascadero and Templeton combined for the 2015 to 2020 period from the SLOCOG Medium ProjectionSeries as updated in August 2010. As noted some sectors show greater declines than others.
Sources: Claritas; 2000 U.S. Census; State Department of Finance; CA Department of Industrial Relations; U.S. Census of Retail Trade, 2007; 2007 Zip Code and County Business Patterns;State Board of Equalization; SLOCOG; Bay Area Economics, 2010.
38
IMPACTS OF PROPOSED PROJECT ON EXISTING RETAIL OUTLETS Overview This chapter evaluates the impacts on sales at existing retail outlets with the Proposed Project in place. The impacts of the Proposed Project alone are considered first, followed by a discussion of cumulative impacts, which takes into consideration other under-construction and reasonably foreseeable proposed retail projects in the PMA as well as potentially relevant projects in the SMAs. The chapter concludes with findings on urban decay. The retail store categories where potential impacts are the greatest focus of concern are supermarkets and general merchandise, because Walmart, the anchor tenant of the Proposed Project, would compete directly with both of these store types. While the other tenants are unknown at this time, some of the space may be used for restaurant pads, so the impacts in this sector will also be considered. Finally, all other non-automotive retail will be considered. As compared to vacancies in scattered smaller stores, economic impacts resulting in the closure of major supermarkets and larger general merchandise stores are more likely to lead to urban decay, especially if they anchor centers with other smaller retailers present. Vacancies in scattered smaller stores alone are less likely to result in a “downward spiral” to urban decay than the loss of the major anchor of a shopping center or district. Where closure occurs in a diffuse manner, the likelihood of a cumulative effect leading to urban decay is unlikely. Moreover, the retail market responds regularly to scattered small vacancies as part of the normal business cycle, so vacancy of any smaller retail space is far less likely to lead to urban decay. The following analysis looks at two points in time: the assumed year of project opening in 2013, and five years thereafter in 2018. The project opening year, 2013, is the first year where there would be potential sales impacts, and a point five years later, in 2018, represents a look at conditions beyond that point taking into account expected population growth and economic changes. Basing the analysis on a five-year timeline is appropriate because projected recovery over this period or sooner would provide strong incentives for owners to maintain vacated properties in good condition and so that they are suitable for releasing, even if there is some amount of lag time in the reuse process. Thus, if potential retail sales return to baseline 2010 levels or exceed them within five years of project opening, the likelihood is that a vacant space would be kept in good order by the owner through the recovery period, or re-tenanted within a reasonable amount of time such that property owners would maintain their properties and not allow them to fall into disrepair.
28 At the same time, any store closures would not necessarily
result immediately upon the opening of the Proposed Project, but if they occur at all, would occur over a period of several years as competing businesses determined whether they could survive in 28
Since sales would increase gradually over time in an area such as the PMA with continued gradual long-term population increase, any vacant properties would re-absorb gradually, meaning that the potential for rental and the motivation to keep a property in usable condition would not just be a function of sales levels five years after opening.
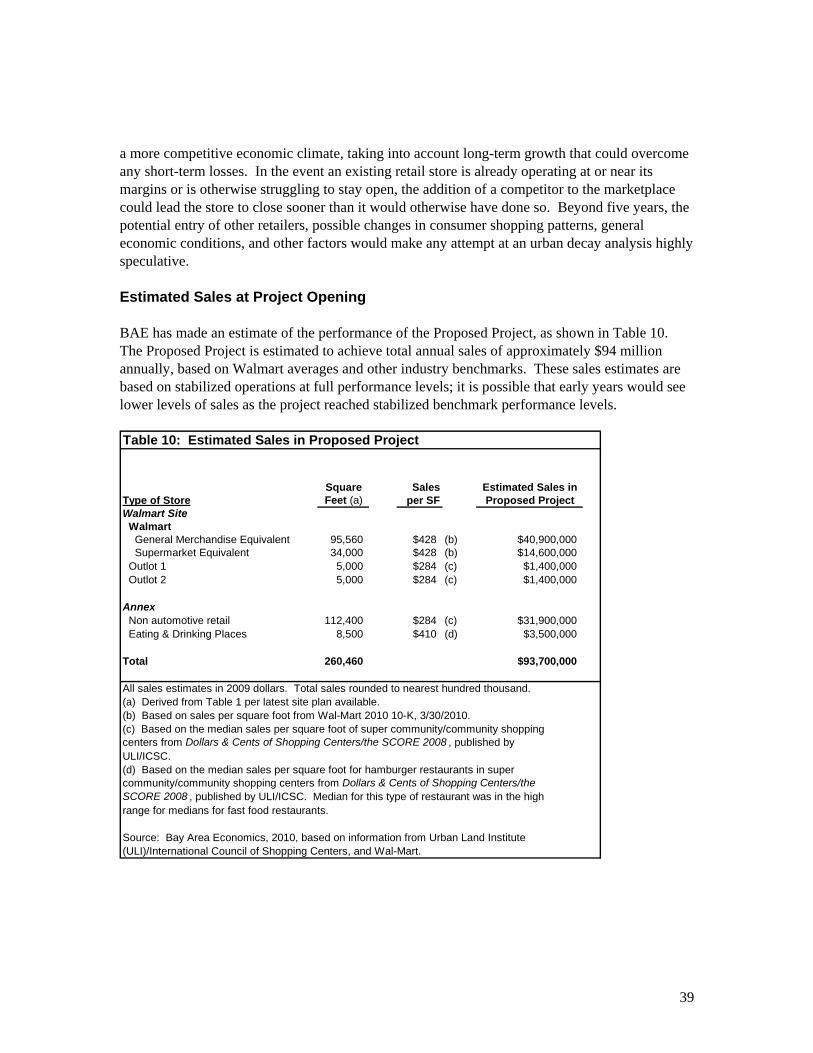
39
a more competitive economic climate, taking into account long-term growth that could overcome any short-term losses. In the event an existing retail store is already operating at or near its margins or is otherwise struggling to stay open, the addition of a competitor to the marketplace could lead the store to close sooner than it would otherwise have done so. Beyond five years, the potential entry of other retailers, possible changes in consumer shopping patterns, general economic conditions, and other factors would make any attempt at an urban decay analysis highly speculative. Estimated Sales at Project Opening BAE has made an estimate of the performance of the Proposed Project, as shown in Table 10. The Proposed Project is estimated to achieve total annual sales of approximately $94 million annually, based on Walmart averages and other industry benchmarks. These sales estimates are based on stabilized operations at full performance levels; it is possible that early years would see lower levels of sales as the project reached stabilized benchmark performance levels. Table 10: Estimated Sales in Proposed Project
Square Sales Estimated Sales inType of Store Feet (a) per SF Proposed ProjectWalmart Site Walmart General Merchandise Equivalent 95,560 $428 (b) $40,900,000 Supermarket Equivalent 34,000 $428 (b) $14,600,000 Outlot 1 5,000 $284 (c) $1,400,000 Outlot 2 5,000 $284 (c) $1,400,000
Annex Non automotive retail 112,400 $284 (c) $31,900,000 Eating & Drinking Places 8,500 $410 (d) $3,500,000
Total 260,460 $93,700,000
All sales estimates in 2009 dollars. Total sales rounded to nearest hundred thousand.(a) Derived from Table 1 per latest site plan available. (b) Based on sales per square foot from Wal-Mart 2010 10-K, 3/30/2010.(c) Based on the median sales per square foot of super community/community shoppingcenters from Dollars & Cents of Shopping Centers/the SCORE 2008 , published byULI/ICSC.(d) Based on the median sales per square foot for hamburger restaurants in supercommunity/community shopping centers from Dollars & Cents of Shopping Centers/theSCORE 2008 , published by ULI/ICSC. Median for this type of restaurant was in the highrange for medians for fast food restaurants.
Source: Bay Area Economics, 2010, based on information from Urban Land Institute(ULI)/International Council of Shopping Centers, and Wal-Mart.
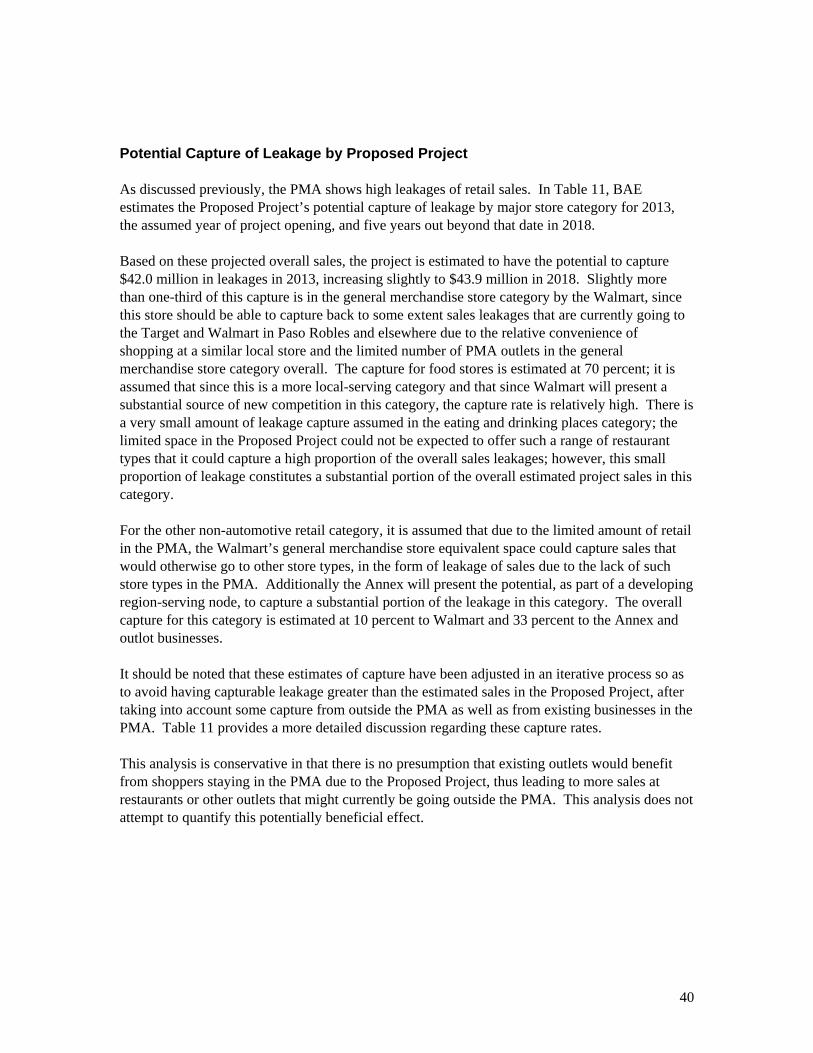
40
Potential Capture of Leakage by Proposed Project As discussed previously, the PMA shows high leakages of retail sales. In Table 11, BAE estimates the Proposed Project’s potential capture of leakage by major store category for 2013, the assumed year of project opening, and five years out beyond that date in 2018. Based on these projected overall sales, the project is estimated to have the potential to capture $42.0 million in leakages in 2013, increasing slightly to $43.9 million in 2018. Slightly more than one-third of this capture is in the general merchandise store category by the Walmart, since this store should be able to capture back to some extent sales leakages that are currently going to the Target and Walmart in Paso Robles and elsewhere due to the relative convenience of shopping at a similar local store and the limited number of PMA outlets in the general merchandise store category overall. The capture for food stores is estimated at 70 percent; it is assumed that since this is a more local-serving category and that since Walmart will present a substantial source of new competition in this category, the capture rate is relatively high. There is a very small amount of leakage capture assumed in the eating and drinking places category; the limited space in the Proposed Project could not be expected to offer such a range of restaurant types that it could capture a high proportion of the overall sales leakages; however, this small proportion of leakage constitutes a substantial portion of the overall estimated project sales in this category. For the other non-automotive retail category, it is assumed that due to the limited amount of retail in the PMA, the Walmart’s general merchandise store equivalent space could capture sales that would otherwise go to other store types, in the form of leakage of sales due to the lack of such store types in the PMA. Additionally the Annex will present the potential, as part of a developing region-serving node, to capture a substantial portion of the leakage in this category. The overall capture for this category is estimated at 10 percent to Walmart and 33 percent to the Annex and outlot businesses. It should be noted that these estimates of capture have been adjusted in an iterative process so as to avoid having capturable leakage greater than the estimated sales in the Proposed Project, after taking into account some capture from outside the PMA as well as from existing businesses in the PMA. Table 11 provides a more detailed discussion regarding these capture rates. This analysis is conservative in that there is no presumption that existing outlets would benefit from shoppers staying in the PMA due to the Proposed Project, thus leading to more sales at restaurants or other outlets that might currently be going outside the PMA. This analysis does not attempt to quantify this potentially beneficial effect.
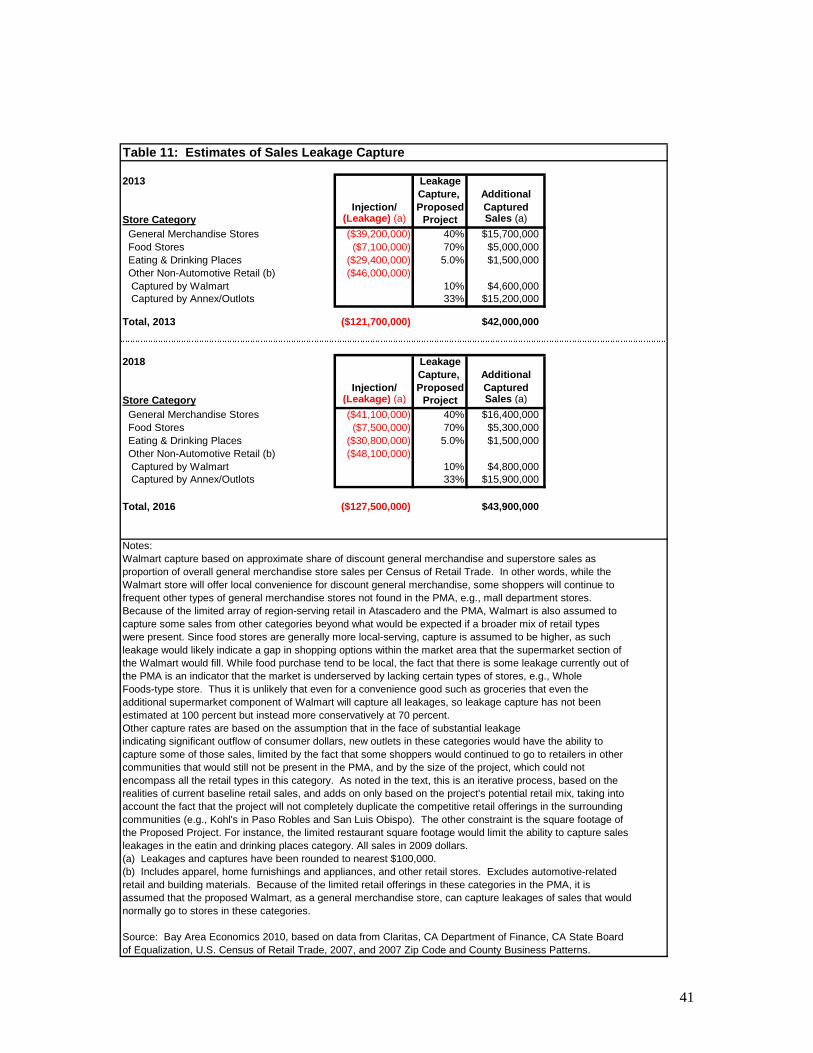
41
Table 11: Estimates of Sales Leakage Capture
2013 LeakageCapture, Additional
Injection/ Proposed CapturedStore Category (Leakage) (a) Project Sales (a) General Merchandise Stores ($39,200,000) 40% $15,700,000 Food Stores ($7,100,000) 70% $5,000,000 Eating & Drinking Places ($29,400,000) 5.0% $1,500,000 Other Non-Automotive Retail (b) ($46,000,000) Captured by Walmart 10% $4,600,000 Captured by Annex/Outlots 33% $15,200,000
Total, 2013 ($121,700,000) $42,000,000
2018 LeakageCapture, Additional
Injection/ Proposed CapturedStore Category (Leakage) (a) Project Sales (a) General Merchandise Stores ($41,100,000) 40% $16,400,000 Food Stores ($7,500,000) 70% $5,300,000 Eating & Drinking Places ($30,800,000) 5.0% $1,500,000 Other Non-Automotive Retail (b) ($48,100,000) Captured by Walmart 10% $4,800,000 Captured by Annex/Outlots 33% $15,900,000
Total, 2016 ($127,500,000) $43,900,000
Notes:Walmart capture based on approximate share of discount general merchandise and superstore sales asproportion of overall general merchandise store sales per Census of Retail Trade. In other words, while theWalmart store will offer local convenience for discount general merchandise, some shoppers will continue tofrequent other types of general merchandise stores not found in the PMA, e.g., mall department stores. Because of the limited array of region-serving retail in Atascadero and the PMA, Walmart is also assumed tocapture some sales from other categories beyond what would be expected if a broader mix of retail typeswere present. Since food stores are generally more local-serving, capture is assumed to be higher, as suchleakage would likely indicate a gap in shopping options within the market area that the supermarket section ofthe Walmart would fill. While food purchase tend to be local, the fact that there is some leakage currently out ofthe PMA is an indicator that the market is underserved by lacking certain types of stores, e.g., WholeFoods-type store. Thus it is unlikely that even for a convenience good such as groceries that even theadditional supermarket component of Walmart will capture all leakages, so leakage capture has not beenestimated at 100 percent but instead more conservatively at 70 percent.Other capture rates are based on the assumption that in the face of substantial leakageindicating significant outflow of consumer dollars, new outlets in these categories would have the ability tocapture some of those sales, limited by the fact that some shoppers would continued to go to retailers in othercommunities that would still not be present in the PMA, and by the size of the project, which could notencompass all the retail types in this category. As noted in the text, this is an iterative process, based on therealities of current baseline retail sales, and adds on only based on the project's potential retail mix, taking intoaccount the fact that the project will not completely duplicate the competitive retail offerings in the surroundingcommunities (e.g., Kohl's in Paso Robles and San Luis Obispo). The other constraint is the square footage ofthe Proposed Project. For instance, the limited restaurant square footage would limit the ability to capture salesleakages in the eatin and drinking places category. All sales in 2009 dollars.(a) Leakages and captures have been rounded to nearest $100,000.(b) Includes apparel, home furnishings and appliances, and other retail stores. Excludes automotive-relatedretail and building materials. Because of the limited retail offerings in these categories in the PMA, it isassumed that the proposed Walmart, as a general merchandise store, can capture leakages of sales that wouldnormally go to stores in these categories.
Source: Bay Area Economics 2010, based on data from Claritas, CA Department of Finance, CA State Boardof Equalization, U.S. Census of Retail Trade, 2007, and 2007 Zip Code and County Business Patterns.
42
Capture of Sales from Outside the Primary Market Area While the PMA will account for the majority of shoppers for the Proposed Project, market area boundaries are not absolute, and as discussed above in the section discussion the market area definitions, the situation with respect to the Proposed Project is fairly complex, due to the lack of a Walmart to the south in San Luis Obispo city although Target will be operating by 2013, the proximity of the Paso Robles store that does not carry a full line of groceries, and the general lack of region-serving retail in the coastal communities to the west. Furthermore, the designated Secondary Market Areas, especially the SMA-S, contain larger populations than the PMA, so even a small proportional capture of their population could contribute a substantial market share to the Proposed Project. Based on these various factors and the general nature of retail market areas where shoppers from farther away tend to make up smaller portions of shoppers for a given project,
29 BAE has estimated a proportion of project sales generated by the SMAs at 30 percent.
The greater share of this is presumed to come from the San Luis Obispo city area and the coastal areas where there is no Walmart. The SMA-S has over twice the population base as the PMA, so even a limited capture of sales generated by residents of the SMA-S would benefit sales at the Proposed Project greatly. Some of this 30 percent capture would also come from outside the PMA and SMAs, for instance from in-commuters or travelers on Highway 101. As shown in Table 12, the resulting estimated capture of sales from outside the PMA is approximately $28.1 million annually. Slightly less than half this capture is by the general merchandise component of the Walmart, with a slightly smaller proportion captured by the non-restaurant annex and outlot stores. Approximately $4.3 million would be captured by the grocery component of Walmart, with the remainder, approximately $1.1 million, captured by the restaurants.
29
The Shopping Center Development Handbook describes a primary market area as holding 70 to 80 percent of a center's customers, with a secondary market area holding an additional 15 to 20 percent, or 85 to 100 percent for the combined areas. (Shopping Center Development Handbook, Urban Land Institute, 1999).
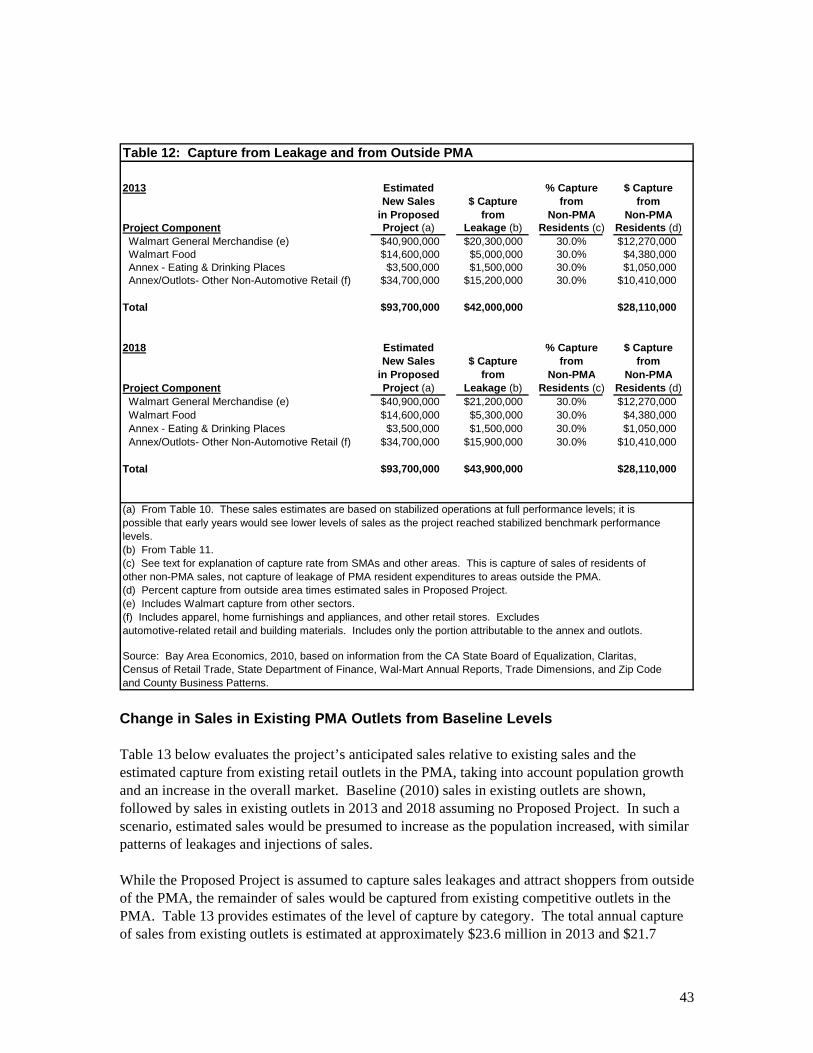
43
Table 12: Capture from Leakage and from Outside PMA
2013 Estimated % Capture $ CaptureNew Sales $ Capture from from
in Proposed from Non-PMA Non-PMAProject Component Project (a) Leakage (b) Residents (c) Residents (d) Walmart General Merchandise (e) $40,900,000 $20,300,000 30.0% $12,270,000 Walmart Food $14,600,000 $5,000,000 30.0% $4,380,000 Annex - Eating & Drinking Places $3,500,000 $1,500,000 30.0% $1,050,000 Annex/Outlots- Other Non-Automotive Retail (f) $34,700,000 $15,200,000 30.0% $10,410,000
Total $93,700,000 $42,000,000 $28,110,000
2018 Estimated % Capture $ CaptureNew Sales $ Capture from from
in Proposed from Non-PMA Non-PMAProject Component Project (a) Leakage (b) Residents (c) Residents (d) Walmart General Merchandise (e) $40,900,000 $21,200,000 30.0% $12,270,000 Walmart Food $14,600,000 $5,300,000 30.0% $4,380,000 Annex - Eating & Drinking Places $3,500,000 $1,500,000 30.0% $1,050,000 Annex/Outlots- Other Non-Automotive Retail (f) $34,700,000 $15,900,000 30.0% $10,410,000
Total $93,700,000 $43,900,000 $28,110,000
(a) From Table 10. These sales estimates are based on stabilized operations at full performance levels; it ispossible that early years would see lower levels of sales as the project reached stabilized benchmark performancelevels.(b) From Table 11.(c) See text for explanation of capture rate from SMAs and other areas. This is capture of sales of residents ofother non-PMA sales, not capture of leakage of PMA resident expenditures to areas outside the PMA.(d) Percent capture from outside area times estimated sales in Proposed Project.(e) Includes Walmart capture from other sectors.(f) Includes apparel, home furnishings and appliances, and other retail stores. Excludesautomotive-related retail and building materials. Includes only the portion attributable to the annex and outlots.
Source: Bay Area Economics, 2010, based on information from the CA State Board of Equalization, Claritas,Census of Retail Trade, State Department of Finance, Wal-Mart Annual Reports, Trade Dimensions, and Zip Codeand County Business Patterns. Change in Sales in Existing PMA Outlets from Baseline Levels Table 13 below evaluates the project’s anticipated sales relative to existing sales and the estimated capture from existing retail outlets in the PMA, taking into account population growth and an increase in the overall market. Baseline (2010) sales in existing outlets are shown, followed by sales in existing outlets in 2013 and 2018 assuming no Proposed Project. In such a scenario, estimated sales would be presumed to increase as the population increased, with similar patterns of leakages and injections of sales. While the Proposed Project is assumed to capture sales leakages and attract shoppers from outside of the PMA, the remainder of sales would be captured from existing competitive outlets in the PMA. Table 13 provides estimates of the level of capture by category. The total annual capture of sales from existing outlets is estimated at approximately $23.6 million in 2013 and $21.7
44
million in 2018. This capture is assumed to decline due to increased capture from leakage in order to reach stabilized sales levels. However, these numbers shown represent sales that would be captured in each category that year, but as shown, sales at existing outlets (in the absence of the Proposed Project) would have grown in later years from current baseline levels due to population growth; taking into account this “natural” increase, the net estimated changes from baseline current sales levels (which are most relevant in assessing impacts) are shown in the last two columns, expressed in dollars and as a percent of category sales in Table 13. For existing outlets, in 2013 general merchandise store sales are estimated to decline by 12 percent from baseline levels and food store sales by two percent. However, due to PMA growth and the limited additions for outlets in the category, existing eating and drinking places are estimated to show a slight increase in sales by 2013 even with the Proposed Project in operation. For the remaining non-automotive retail category, sales in 2013 are estimated to decline by 11 percent. The total net loss of sales in existing outlets from baseline 2010 levels is estimated at $13.8 million in 2013, or five percent of baseline sales. Between 2013 and 2018, as the area population grows, losses are reversed in the food store category, and the losses for general merchandise stores and other non-automotive retail decline. Overall, in 2018 sales at existing outlets are projected to be at approximately baseline levels even with the Proposed Project in place.
30
30
It is important to note that these changes track with population increase, and the losses would be declining over time and in the case of food stores, reversing well before 2018.
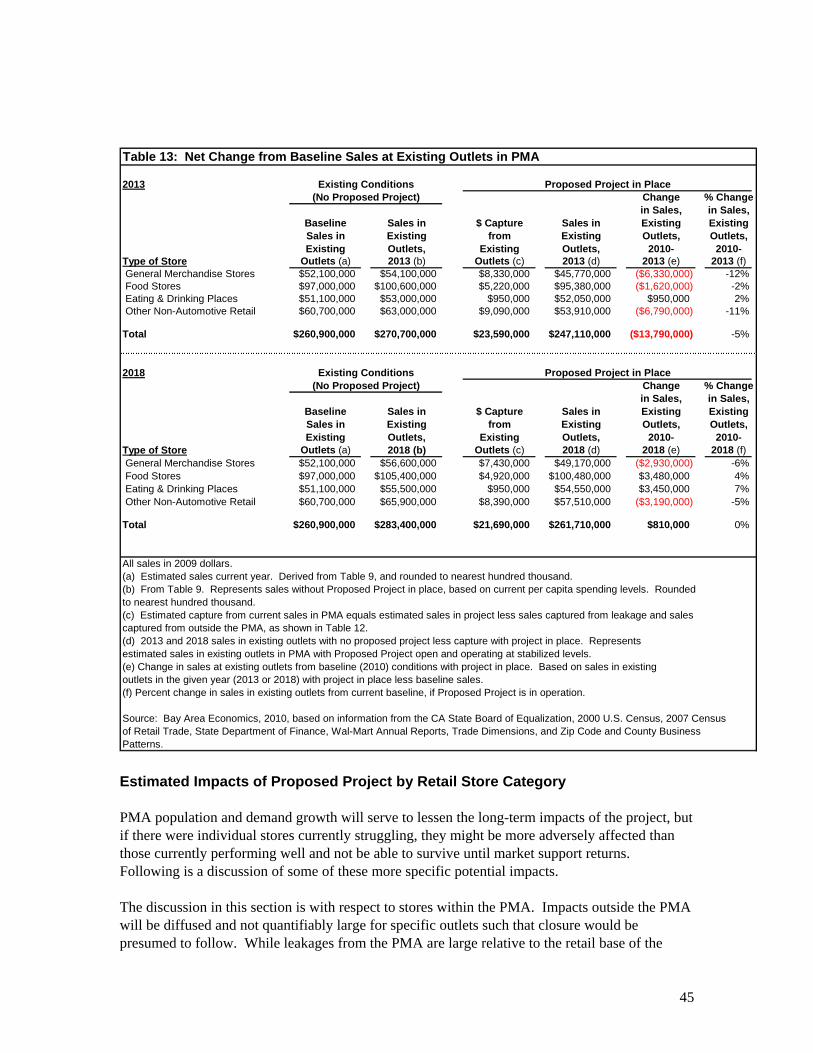
45
Estimated Impacts of Proposed Project by Retail Store Category PMA population and demand growth will serve to lessen the long-term impacts of the project, but if there were individual stores currently struggling, they might be more adversely affected than those currently performing well and not be able to survive until market support returns. Following is a discussion of some of these more specific potential impacts. The discussion in this section is with respect to stores within the PMA. Impacts outside the PMA will be diffused and not quantifiably large for specific outlets such that closure would be presumed to follow. While leakages from the PMA are large relative to the retail base of the
Table 13: Net Change from Baseline Sales at Existing Outlets in PMA
2013 Existing Conditions Proposed Project in Place(No Proposed Project) Change % Change
in Sales, in Sales,Baseline Sales in $ Capture Sales in Existing ExistingSales in Existing from Existing Outlets, Outlets,Existing Outlets, Existing Outlets, 2010- 2010-
Type of Store Outlets (a) 2013 (b) Outlets (c) 2013 (d) 2013 (e) 2013 (f) General Merchandise Stores $52,100,000 $54,100,000 $8,330,000 $45,770,000 ($6,330,000) -12% Food Stores $97,000,000 $100,600,000 $5,220,000 $95,380,000 ($1,620,000) -2% Eating & Drinking Places $51,100,000 $53,000,000 $950,000 $52,050,000 $950,000 2% Other Non-Automotive Retail $60,700,000 $63,000,000 $9,090,000 $53,910,000 ($6,790,000) -11%
Total $260,900,000 $270,700,000 $23,590,000 $247,110,000 ($13,790,000) -5%
2018 Existing Conditions Proposed Project in Place(No Proposed Project) Change % Change
in Sales, in Sales,Baseline Sales in $ Capture Sales in Existing ExistingSales in Existing from Existing Outlets, Outlets,Existing Outlets, Existing Outlets, 2010- 2010-
Type of Store Outlets (a) 2018 (b) Outlets (c) 2018 (d) 2018 (e) 2018 (f) General Merchandise Stores $52,100,000 $56,600,000 $7,430,000 $49,170,000 ($2,930,000) -6% Food Stores $97,000,000 $105,400,000 $4,920,000 $100,480,000 $3,480,000 4% Eating & Drinking Places $51,100,000 $55,500,000 $950,000 $54,550,000 $3,450,000 7% Other Non-Automotive Retail $60,700,000 $65,900,000 $8,390,000 $57,510,000 ($3,190,000) -5%
Total $260,900,000 $283,400,000 $21,690,000 $261,710,000 $810,000 0%
All sales in 2009 dollars.(a) Estimated sales current year. Derived from Table 9, and rounded to nearest hundred thousand.(b) From Table 9. Represents sales without Proposed Project in place, based on current per capita spending levels. Roundedto nearest hundred thousand.(c) Estimated capture from current sales in PMA equals estimated sales in project less sales captured from leakage and salescaptured from outside the PMA, as shown in Table 12.(d) 2013 and 2018 sales in existing outlets with no proposed project less capture with project in place. Representsestimated sales in existing outlets in PMA with Proposed Project open and operating at stabilized levels.(e) Change in sales at existing outlets from baseline (2010) conditions with project in place. Based on sales in existingoutlets in the given year (2013 or 2018) with project in place less baseline sales. (f) Percent change in sales in existing outlets from current baseline, if Proposed Project is in operation.
Source: Bay Area Economics, 2010, based on information from the CA State Board of Equalization, 2000 U.S. Census, 2007 Censusof Retail Trade, State Department of Finance, Wal-Mart Annual Reports, Trade Dimensions, and Zip Code and County BusinessPatterns.
46
PMA, they are smaller relative to the larger retail concentrations of the SMAs, particular to the south where many residents are likely doing their out-of-PMA shopping. Overall PMA retail sales are estimated to make up only 13 percent of the County’s retail sales. Further discussion of impacts outside the PMA can be found in the section following this one. Food Stores As noted above, the estimated reduction from baseline sales in existing stores in this category in 2013 is estimated at approximately two percent, or $1.6 million.
31 Due to area population growth,
this loss reverses, with existing stores slightly exceeding baseline sales before 2018 even with the Proposed Project in place. Since none of these stores are in the immediate neighborhood of the Proposed Project, with the four large supermarkets clustered south of Downtown, proximity should not be a factor with respect to impacts within the PMA. Additionally, with respect to store type, Walmart promotes its low prices as would a grocery warehouse store, but is functionally more like a conventional supermarket, so that it would be speculative to assume the impacts would be focused on a particular store. Furthermore, the percentage losses relative to total baseline food store sales are not so great that these losses, evenly distributed, would cause store closure. Applying the estimated loss in food store sales to the supermarkets in the PMA, the estimated average annual sales per square foot currently estimated at $460 to $510 would only decline to approximately $450 to $500, still in the range of the median annual sales per square foot of $486 for supermarkets in super community/community shopping centers from Dollars & Cents of Shopping Centers/The SCORE 2008.
32
Additionally, based on BAE’s site visits observing customer traffic and on the confidential Trade Dimensions data, none of these stores appears to be marginal currently with respect to sales performance such that a small percentage loss would lead to closure. Finally, PMA population growth should allow existing stores to recover to above baseline sales levels within a few years even with the Proposed Project in place. As a result, BAE estimates that the Proposed Project will not result in the closure of any existing supermarkets in the PMA. Distance should lessen impacts on food stores in the SMAs and elsewhere, as capture of sales from these areas will be very limited on a per store basis, with approximately $9.4 million combined in leakage capture and non-PMA resident capture spread widely among many stores (more than 25 in the SMA, based on Trade Dimensions’ inventory); as a result the opening of the Proposed Project cannot be seen as likely to result in the closure of existing food stores outside the PMA. 31
This minimal loss is due in part to PMA growth between 2010 and 2013, which should backfill some of the losses from baseline sales levels. 32
Published by Urban Land Institute/International Council of Shopping Centers, 2008. Note that there appears to be some variability in this estimate over time; only two years earlier, the preceding version of this publication listed the same data point as $392. The substantial change between the 2006 and 2008 publications may relate in part to sampling and data collection issues (total sample size of stores was in the 125 to 150 stores range) rather than such a large increase in sales.
47
General Merchandise Stores The largest component of the Proposed Project is the Walmart’s general merchandise store equivalent space; overall losses from baseline levels for the area’s existing general merchandise are estimated at 12 percent, or $6.3 million in 2013 (see Table 13 above). This declines to six percent, or $2.9 million, by 2018. The primary PMA competitor in this category is the Kmart. However, as noted above, the Kmart in Atascadero, perhaps due to its position as the only store of its type in town, is performing well above Kmart averages; even if all of the overall PMA losses were attributed to this store, available data indicate it would still have sales above the Kmart national performance average of approximately $125 per square foot. While this is far below the Walmart sales per square foot average $428 nationally (as shown in Table 10), Kmart continues to operate successfully at this level of sales. While the chain downsized substantially several years ago as it went through bankruptcy, in recent years, store closures have been very limited, with most of the closures being superstore operations. In California, Kmart has 99 stores (as of end of FY 2009/January 30 2010), only two stores fewer (one a superstore) than at the end of FY 2007. Kmart continues to operate stores in the same market as Walmart in many California communities, including Salinas, Arroyo Grande, and Santa Maria. Part of this may be due to Kmart typically occupying older locations, as they do in Atascadero, with lower occupancy costs than Walmart or Target, such that the can operate their stores profitably at a lower sales level. Even if the entire estimated decline in baseline sales in 2013 in the general merchandise category as shown in Table 13 were attributed to the Kmart, sales would likely still be in the range of the $125 per square foot national average for Kmart. As a result, the analysis indicates that the Atascadero Kmart, while impacted by the Proposed Project, is not likely to face closure. The other competitive general merchandise stores in the PMA are the three chain drug stores. These stores, however, compete by offering a more convenient shopping experience than the larger discount stores, and in other regions have survived in the face of the existing big box outlets in the retail market, and thus are not seen as candidates for closure due to Proposed Project impacts. Sometimes these stores even seek to locate in the same center as a Walmart store in order to benefit from the substantial traffic that anchor store generates.
33
Outside the PMA, there are multiple large discount and other general merchandise stores in Paso Robles and San Luis Obispo city and beyond. The capture by the Proposed Project’s Walmart is likely to come at the expense of these other large discount stores, particularly the Walmarts in Paso Robles and Arroyo Grande, but site visits and other available data indicate these stores are performing at strong sales levels, and the recapture by the Proposed Project of leakages from the PMA to these stores likely will not result in closure of these outlets. Outside the PMA, the local-serving pharmacies in other cities are not seen as competitive with the Proposed Project and thus not at risk of closure. 33
For example, a chain drugstore has proposed to locate in the same center as a proposed new Walmart (expansion/relocation) in Lodi.
48
Eating and Drinking Places The PMA has substantial leakage of sales in this category, but the amount of capture for the Proposed Project is limited by the fact that there will be limited restaurant space in the Proposed Project. As a result, even with the Proposed Project fully open, existing restaurants are assumed to show a small two percent increase in baseline sales in 2013. Furthermore, because this sector is not concentrated in a few large outlets, it would not possible to state which specific outlets, if any, would be impacted to the point of closure, since impacts might be spread among the existing outlets in such a way that no closures would be likely. Additional growth in demand before 2018 is estimated to lead to sales in existing outlets well above baseline levels even with the Proposed Project in place. Also, as the project attracts additional shoppers to Atascadero from outside the PMA, these shoppers might also visit existing restaurants in the City more frequently. Thus there is sufficient demand such that short-term or long-term closures of eating and drinking places in the PMA are not a likely outcome. Other Store Types The leakage analysis indicates PMA residents are currently doing over 40 percent of their shopping in the other non-automotive retail category, which includes apparel, home furnishings/appliances, and specialty retail, outside the PMA. This is due in large part to the lack of comparison-good shopping options within the PMA, and the wide range of retail available in nearby Paso Robles and San Luis Obispo. The Proposed Project is assumed to have 122,400 square feet of retail in this category.
34
Sales losses in this catch-all category show an estimated decline of eleven percent in existing outlet sales in 2013 from baseline levels, decreasing to a loss of only five percent in 2018. Given these limited levels of long-term losses, and the lack of knowledge regarding specific tenants, it would be speculative to conclude that long-term store closure would result. Furthermore, given the minimal losses, and the overall retail sales gains, even if specific outlets faced short-term closure, overall demand should lead to re-tenanting of vacant space. It should also be noted that this analysis is somewhat conservative, in only assuming synergistic capture impacts for the Proposed Project itself, but if the Proposed Project is successful in keeping local shoppers in Atascadero, it likely will lead to additional capture of sales leakages by existing retail outlets throughout Atascadero, including Downtown.
34
To simplify the analysis, it has been assumed that this space would not be occupied by general merchandise stores, food stores, or eating and drinking places. If this were to occur, sales losses and gains would largely be shifted between categories such that the overall net change in baseline sales would be similar to that calculated here. Given the size of the available pads, it is unlikely that the shifting of a space into one of these categories would increase the risk of store closure. For example, any additional food store would likely be a small specialty store operating in a different and/or complementary niche to the Walmart anchor store, similar to the way the small fish market in the Trader Joe’s center in Templeton is complementary to that anchor store.
49
Impacts outside the Primary Market Area Outside the Primary Market Area, any impacts from additional sales capture would be spread among many outlets in the much larger retail base in the SMA, with no predictable or likely potential for closure indicated for any particular retail outlet. For example, distance should lessen impacts on food stores in the SMAs and elsewhere, as capture of sales from these areas will be very limited on a per store basis, with approximately $9.4 million combined in leakage capture and non-PMA resident capture spread widely among many stores (more than 25 in the SMA, based on Trade Dimensions’ inventory); as a result the opening of the Proposed Project cannot be seen as likely to result in the closure of existing food stores outside the PMA. Overall, the SMAs are estimated to have retail sales of approximately $2.6 billion annually (see Table 8 above); the proposed project’s capture from outside the PMA is estimated at approximately three percent of this amount in 2013, a negligible change such that store closures could not reasonably be stated to result, especially since additional population growth in the SMA would tend to continue to push overall sales in the SMAs upward. Distance should lessen impacts on food stores in the SMAs and elsewhere, as capture of sales from these areas will be very limited on a per store basis, with approximately $9.4 million combined in leakage capture and non-PMA resident capture spread widely among many stores (more than 25 in the SMA, based on Trade Dimensions’ inventory); as a result the opening of the Proposed Project cannot be seen as likely to result in the closure of existing food stores outside the PMA. Cumulative Impacts Per CEQA, the cumulative analysis for the proposed project must take into account other reasonably foreseeable projects in the PMA or elsewhere that might, in combination with the Proposed Project, result in cumulatively significant impacts. To be potentially considered in the cumulative analysis are projects which have been approved but not yet completed, and projects for which development applications have been filed, and may also include other potential projects which may have been announced but not yet formally proposed to the approving agency. Additionally, the analysis should consider whether projects beyond the PMA might result in cumulatively significant impacts. Planned and Proposed Developments Appendix F provides information gathered from the jurisdictions in the PMA regarding other reasonably foreseeable retail development projects. Within the PMA but excluding the Proposed Project, there are a total of slightly more than 150,000 square feet of reasonably foreseeable retail in the pipeline. There are other retail projects or components of projects with some level of approval, but these have either been put on hold indefinitely or no actual projects have been put forth and thus they cannot be considered reasonably foreseeable in the time frame of this analysis. Most of the planned and proposed retail is in the City of Atascadero, totaling approximately 120,000 square feet. One of the projects is the relocation of the existing Rite Aid; this relocation
50
occurred subsequent to BAE’s field work, but prior to the completion of this report. While the new space is occupied, the vacated existing space represents a large additional vacancy, and is treated here as part of the pipeline cumulative supply. The two other large projects are Colony Square and the Tractor Supply center at the south end of Atascadero. Colony Square, currently under construction, represents an effort to revitalize the Downtown area by creating an entertainment destination as well as providing a mixed use project with restaurants, retail, and limited residential uses. A first phase is currently under construction, including the movie theater complex and approximately 15,000 square feet of retail space. Based on conversations with City staff, additional phases of the project, while approved, are unlikely to be constructed in the next several years due to market conditions, so the additional square footage is not considered reasonably foreseeable for this analysis in 2013 or 2018. The other large project is the Tractor Supply in the Dove Creek Commercial Center. The bulk of this project is approximately 40,000 square feet (half indoors and half outdoors) for a Tractor Supply, a chain providing farm and garden supply-related items. The analysis here conservatively assumes that the remainder of the 60,000 square feet will also be in use by 2013, even though the development of the entire center is somewhat speculative. The remaining reasonably foreseeable new retail space in Atascadero is scattered in several projects largely on or near the El Camino Real corridor. There are three projects proposed outside Atascadero, two in Templeton and one in the small unincorporated town of Creston, totaling approximately 33,000 square feet. As currently proposed, none of these projects includes supermarket-equivalent space. Beyond the PMA, the key development of interest is the Target store in San Luis Obispo. As noted above in the discussion regarding the market area definitions, this store will serve to limit the capture by the Proposed Project from the SMA-S, providing an alternative discount general merchandise store. It is assumed in all of BAE’s analysis that this store will be open prior to the Proposed Project. Other projects outside the PMA should not have a substantial impact on retail conditions within the PMA, especially since San Luis Obispo city and Paso Robles already offer a broad array of retail options that serve to limit capture from the SMAs by the Proposed Project. Any developments beyond the SMA are unlikely to affect market conditions relevant to the analysis here. Analysis Table 14 assesses the cumulative impacts of all the reasonably foreseeable planned and proposed competitive retail space in the PMA, as specified above. Under the assumed scenario, the total new space including the Proposed Project would capture an estimated 14 percent of baseline non-automotive retail sales in the PMA in 2013; between 2013 and 2018, however, the sales generated by continued modest increases in population would lead to a decline in capture to an estimated eight percent. It is assumed here that these projects are all completed prior to the opening of the Proposed Project in 2013, so the PMA will have to absorb this additional square footage as well as the Proposed Project. Colony Square will provide additional competition for existing restaurants and specialty stores, but as part of a larger project including the theaters, it will also serve to re-capture sales leakages and draw additional consumers from the SMAs and beyond to Atascadero and its Downtown. The Tractor Supply has been included here, even though it may impact the
51
building materials sector, which includes garden supply stores, more than the types of retail in this analysis; however, including it here effectively accounts for potential overall sales losses and impacts in that retail sector. Aside from these projects, the specific retailers for the pipeline projects are largely unknown, and thus the impacts on particular outlets are also uncertain. As currently proposed, none of the planned and proposed spaces are suitable for a supermarket or large discount general merchandise, so the additional planned and proposed projects do not make it any more likely that a store in these sectors would face closure. Overall, much of the Proposed Project itself as well as some of the planned and proposed space does not have specified retail types, so estimated impacts on specific retail sectors other than those noted here would be speculative.
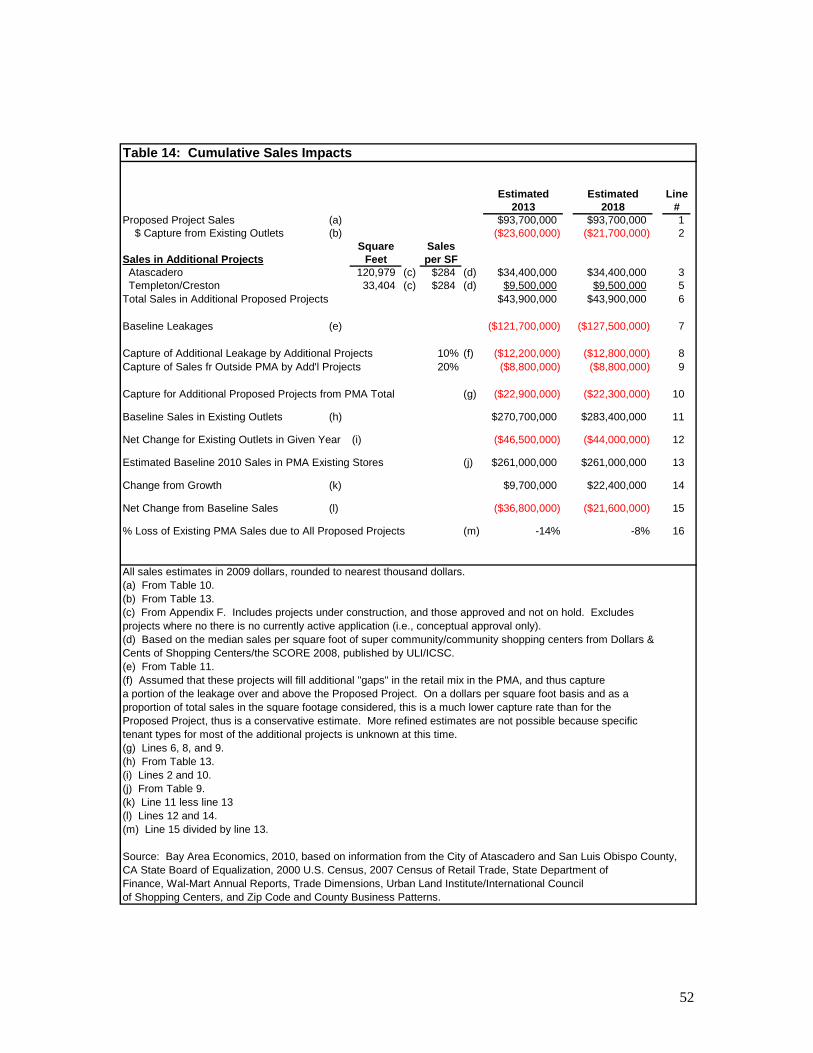
52
Table 14: Cumulative Sales Impacts
Estimated Estimated Line2013 2018 #
Proposed Project Sales (a) $93,700,000 $93,700,000 1 $ Capture from Existing Outlets (b) ($23,600,000) ($21,700,000) 2
Square SalesSales in Additional Projects Feet per SF Atascadero 120,979 (c) $284 (d) $34,400,000 $34,400,000 3 Templeton/Creston 33,404 (c) $284 (d) $9,500,000 $9,500,000 5 Total Sales in Additional Proposed Projects $43,900,000 $43,900,000 6
Baseline Leakages (e) ($121,700,000) ($127,500,000) 7
Capture of Additional Leakage by Additional Projects 10% (f) ($12,200,000) ($12,800,000) 8 Capture of Sales fr Outside PMA by Add'l Projects 20% ($8,800,000) ($8,800,000) 9
Capture for Additional Proposed Projects from PMA Total (g) ($22,900,000) ($22,300,000) 10
Baseline Sales in Existing Outlets (h) $270,700,000 $283,400,000 11
Net Change for Existing Outlets in Given Year (i) ($46,500,000) ($44,000,000) 12
Estimated Baseline 2010 Sales in PMA Existing Stores (j) $261,000,000 $261,000,000 13
Change from Growth (k) $9,700,000 $22,400,000 14
Net Change from Baseline Sales (l) ($36,800,000) ($21,600,000) 15
% Loss of Existing PMA Sales due to All Proposed Projects (m) -14% -8% 16
All sales estimates in 2009 dollars, rounded to nearest thousand dollars.(a) From Table 10.(b) From Table 13.(c) From Appendix F. Includes projects under construction, and those approved and not on hold. Excludesprojects where no there is no currently active application (i.e., conceptual approval only).(d) Based on the median sales per square foot of super community/community shopping centers from Dollars &Cents of Shopping Centers/the SCORE 2008, published by ULI/ICSC.(e) From Table 11.(f) Assumed that these projects will fill additional "gaps" in the retail mix in the PMA, and thus capturea portion of the leakage over and above the Proposed Project. On a dollars per square foot basis and as aproportion of total sales in the square footage considered, this is a much lower capture rate than for theProposed Project, thus is a conservative estimate. More refined estimates are not possible because specifictenant types for most of the additional projects is unknown at this time.(g) Lines 6, 8, and 9.(h) From Table 13.(i) Lines 2 and 10.(j) From Table 9.(k) Line 11 less line 13(l) Lines 12 and 14.(m) Line 15 divided by line 13.
Source: Bay Area Economics, 2010, based on information from the City of Atascadero and San Luis Obispo County,CA State Board of Equalization, 2000 U.S. Census, 2007 Census of Retail Trade, State Department ofFinance, Wal-Mart Annual Reports, Trade Dimensions, Urban Land Institute/International Councilof Shopping Centers, and Zip Code and County Business Patterns.
53
The cumulative analysis indicates the potential for sales in existing Atascadero retail outlets to decrease in 2013 by 14 percent from baseline levels but improve to an overall estimated decrease of eight percent by 2018 due to a modest increase in the area population, putting some existing businesses at increased risk of closure. However, because much of the pipeline supply, including in the Proposed Project itself, does not have specified tenants of particular retail types, impacts on specific outlets cannot be estimated with any reasonable level of precision. Furthermore, it is possible that the estimated eight percent decrease in retail sales in the affected sectors could be absorbed by existing outlets without closure. Findings Regarding Urban Decay As stated in the Introduction to this study, urban decay depends on a causal chain as follows:
• The project results in an economic impact so severe that stores might close as a result; • Buildings and/or properties, rather than being reused within a reasonable time, would
remain vacant; and • Such vacancies would be significant enough in scale (in terms of total square footage
affected and/or the loss of key “anchor” tenants”) and duration to cause the buildings and/or properties to deteriorate, and lead to the physical decline of the buildings and/or nearby real estate. The business closures and vacancies would have to be significant enough in scale (i.e., in terms of the total square footage affected and/or the loss of key “anchor” tenants) that they would be presumed to lead to significant physical deterioration. Physical deterioration includes, but is not limited to, abandoned buildings and commercial sites, boarded doors and windows, long-term unauthorized use of properties and parking lots, extensive gang or offensive graffiti painted on buildings, dumping of refuse or overturned dumpsters on properties, dead trees or shrubbery, extensive litter, uncontrolled weed growth, and homeless encampments.
Project Alone The analysis here finds that that the first link in this chain, store closure, is not a likely result from the Proposed Project alone, so the causal chain to urban decay does not exist. Outside the PMA, any impacts from additional sales capture would be spread among many outlets spread across the large retail bases in Paso Robles, San Luis Obispo city, and elsewhere, with no potential for closure indicated for any particular retail outlet. Furthermore, existing vacant retail spaces in Atascadero appear to be well-maintained, even for spaces vacant for extended periods. Thus, while the market will be see some short-term readjustments in response to the Proposed Project, long-term vacancy and urban decay are not seen as a likely outcome. It is important to note that City of Atascadero enforces various ordinances related to property maintenance which would further reduce the potential for urban decay. The City actively prohibits conditions which would result in urban decay through its Municipal Code, including but not limited to Section 5-14, which deals with graffiti, Section 6-7, which prohibits the storage of abandoned or dismantled vehicles, Section 6-13, which prohibits vegetative growth or refuse accumulations which become public safety hazards, and Section 8-7, which covers building code violations. The Code provides for the declaration of deteriorating conditions as a public nuisance, and provides enforcement and abatement as generally described in Title 12, which provides for
54
hearings and fines for noncompliance. The City’s Community Development Director has confirmed with BAE that the City actively enforces its ordinances with respect to properties with the kinds of physical conditions linked to urban decay.
35
Additionally, the City’s Community Redevelopment Agency provides resources to maintain and improve physical conditions in the City’s commercial areas, particularly the Downtown. The Agency’s Project Area comprises the Downtown and most of the El Camino Real retail corridor through the City, including the site of the Proposed Project development. The Agency has a Downtown Revitalization Plan which includes a Streetscape Project, assistance for the Colony Square project, and funding for graffiti removal. The City also maintains an Office of Economic Development, which assists in the recruitment and expansion of commercial businesses within the City limits. The OED is comprised of key staff members from each of the City's seven departments. The OED has completed the following projects in the past 18 months, indicating a proactive stance toward improving the retail environment and staving off physical decline:
• Downtown commercial building façade improvement grant program. • Building permit fee reduction program for businesses in the Redevelopment Agency area. • Relocation of Cowgirl Café restaurant after they lost their lease, to a vacant restaurant
space at 8300 El Camino Real. • Assistance provided to Auto Zone to find location. Auto Zone is in the process of
moving into 8195 El Camino Real to occupy a building that was vacated when Hollywood Video closed.
BAE’s own area tour indicates that commercial and retail properties in Atascadero, including vacant properties, are generally well maintained. Site reconnaissance around the area found little evidence of blighted buildings, marred by broken windows, graffiti, rubbish, overgrown vegetation, or other indicators of urban decay. This suggests that both property owners and local government are vigilant about preventing physical deterioration of the community. The notable deteriorated property in Atascadero is the 1.7-acre La Plaza site Downtown as discussed in the Inventory of Existing Competitive Retail above. However, site conditions relate largely to a fire at the property rather than being the result of economic conditions resulting in abandonment. In fact, there is currently a development proposal put forward for this site, the La Plaza project as noted in Appendix F. Another factor that would tend to lessen the potential for urban decay is the likelihood of market corrections as future conditions evolve. Retail spaces such as those in the Proposed Project, are often not developed without commitment from potential tenants. Without those commitments, developers will either cancel or delay projects, often due to the inability to obtain financing. With the exception of Walmart, BAE was not provided with information indicating any tenant commitments for the outlots or the Annex portions of the Proposed Project; in the absence of those commitments the project may not move forward on the schedule assumed here, and the parcels may remain vacant for a longer period of time. In Atascadero, an example of a site that 35
Personal communication with Warren Frace, Community Development Director for City of Atascadero, August 26, 2010.
55
has remained vacant until project commitments are secured can be found in the Home Depot Center, which has had an undeveloped parcel available for several years. However, a vacant parcel such as this does not constitute urban decay. While a tight market might lead to limited re-tenanting in retail uses, in any market there are often retailers trying to enter the market that see vacant spaces in a down market as an opportunity. For example, following the closure of Mervyns’ stores nationally, Kohl’s has chosen to reuse their vacant spaces in many markets, including Lodi, Ukiah, Eureka, and Capitola. Forever 21 re-tenanted a vacant Gottschalks in San Luis Obispo (as well as in other cities). Also in San Luis Obispo, the former Circuit City space in Irish Hills Plaza has provided an opportunity for the New Frontiers Natural Foods to relocate and expand from their current location. As noted previously, in Atascadero itself restaurant and retail users (e.g., Autozone, Cowgirl Café) have shown continued re-tenanting of vacant space even in the short period between BAE’s site tour and this analysis. Thus, even in the current economic climate, there are opportunities for re-tenanting of spaces that continue to be well-maintained and available in the market, reinforcing the likelihood that property owners will not let vacant spaces physically deteriorate. In the event of an owner’s failure to maintain vacated properties in a condition suitable for releasing, past experience indicates that the City of Atascadero will prevent physical deterioration from occurring through active and aggressive enforcement of its Code provisions relating to the abatement of public nuisances due to lack of property maintenance and management. The City of Atascadero has demonstrated its commitment to preventing physical deterioration of commercial properties within the City through its successful enforcement efforts to date, as well as through the actions of its Redevelopment Agency. Based on its past performance and policy commitments, it is reasonable to expect that the City will not allow commercial properties which may become vacant to deteriorate physically. Cumulative Impacts None of the planned and proposed spaces include supermarket or large discount general merchandise store space, so the additional planned and proposed projects do not make it any more likely that a store in these sectors would face closure. Based on the above analysis, there is the potential for a decrease in overall sales at existing retail outlets in the PMA. It is not possible, however, to state with certainty that particular outlets or centers are going to be impacted by store closures since much of the tenant mix in the Proposed Project and the other reasonably foreseeable competitive projects is unknown, and in fact, the level of long term loss is such that existing outlets on the whole might survive without closure. The current market shows that there are retailers seeking space for re-tenanting and that even under current conditions, re-tenanting is occurring in the Atascadero area. Additionally, market corrections such as a longer buildout period for the Proposed Project are likely in response to an increase in the available existing inventory. Finally, based on its past performance and policy commitments as discussed above, it is reasonable to expect that the City will not allow commercial properties that may become vacant under cumulative conditions to deteriorate physically such that urban decay would result.

56
APPENDICES
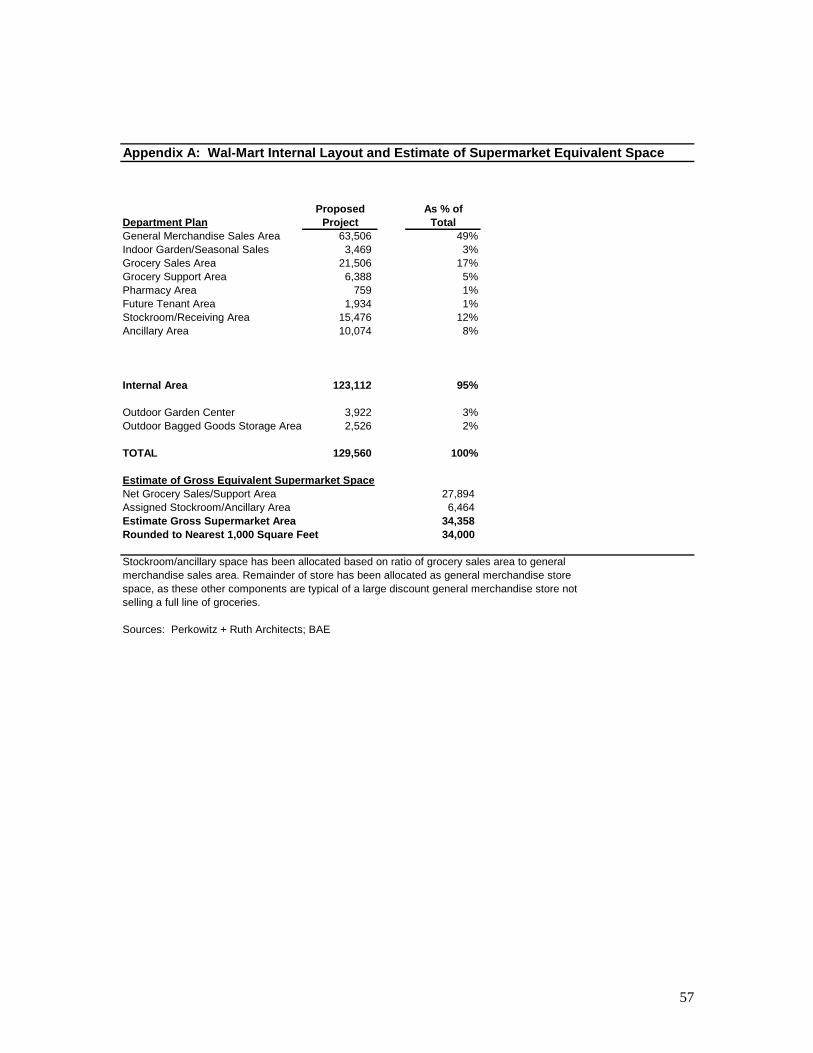
57
Appendix A: Wal-Mart Internal Layout and Estimate of Supermarket Equivalent Space
Proposed As % ofDepartment Plan Project TotalGeneral Merchandise Sales Area 63,506 49%Indoor Garden/Seasonal Sales 3,469 3%Grocery Sales Area 21,506 17%Grocery Support Area 6,388 5%Pharmacy Area 759 1%Future Tenant Area 1,934 1%Stockroom/Receiving Area 15,476 12%Ancillary Area 10,074 8%
Internal Area 123,112 95%
Outdoor Garden Center 3,922 3%Outdoor Bagged Goods Storage Area 2,526 2%
TOTAL 129,560 100%
Estimate of Gross Equivalent Supermarket SpaceNet Grocery Sales/Support Area 27,894 Assigned Stockroom/Ancillary Area 6,464 Estimate Gross Supermarket Area 34,358 Rounded to Nearest 1,000 Square Feet 34,000
Stockroom/ancillary space has been allocated based on ratio of grocery sales area to generalmerchandise sales area. Remainder of store has been allocated as general merchandise storespace, as these other components are typical of a large discount general merchandise store notselling a full line of groceries.
Sources: Perkowitz + Ruth Architects; BAE
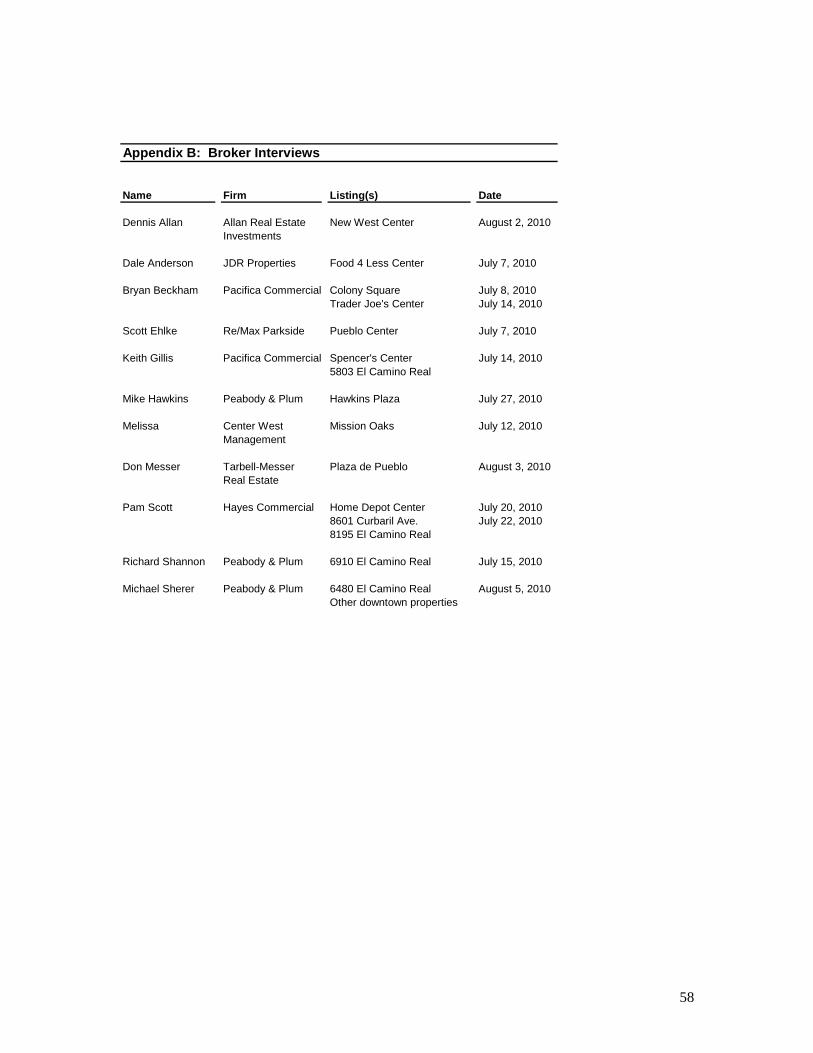
58
Appendix B: Broker Interviews
Name Firm Listing(s) Date
Dennis Allan Allan Real Estate New West Center August 2, 2010Investments
Dale Anderson JDR Properties Food 4 Less Center July 7, 2010
Bryan Beckham Pacifica Commercial Colony Square July 8, 2010Trader Joe's Center July 14, 2010
Scott Ehlke Re/Max Parkside Pueblo Center July 7, 2010
Keith Gillis Pacifica Commercial Spencer's Center July 14, 20105803 El Camino Real
Mike Hawkins Peabody & Plum Hawkins Plaza July 27, 2010
Melissa Center West Mission Oaks July 12, 2010Management
Don Messer Tarbell-Messer Plaza de Pueblo August 3, 2010Real Estate
Pam Scott Hayes Commercial Home Depot Center July 20, 20108601 Curbaril Ave. July 22, 20108195 El Camino Real
Richard Shannon Peabody & Plum 6910 El Camino Real July 15, 2010
Michael Sherer Peabody & Plum 6480 El Camino Real August 5, 2010Other downtown properties
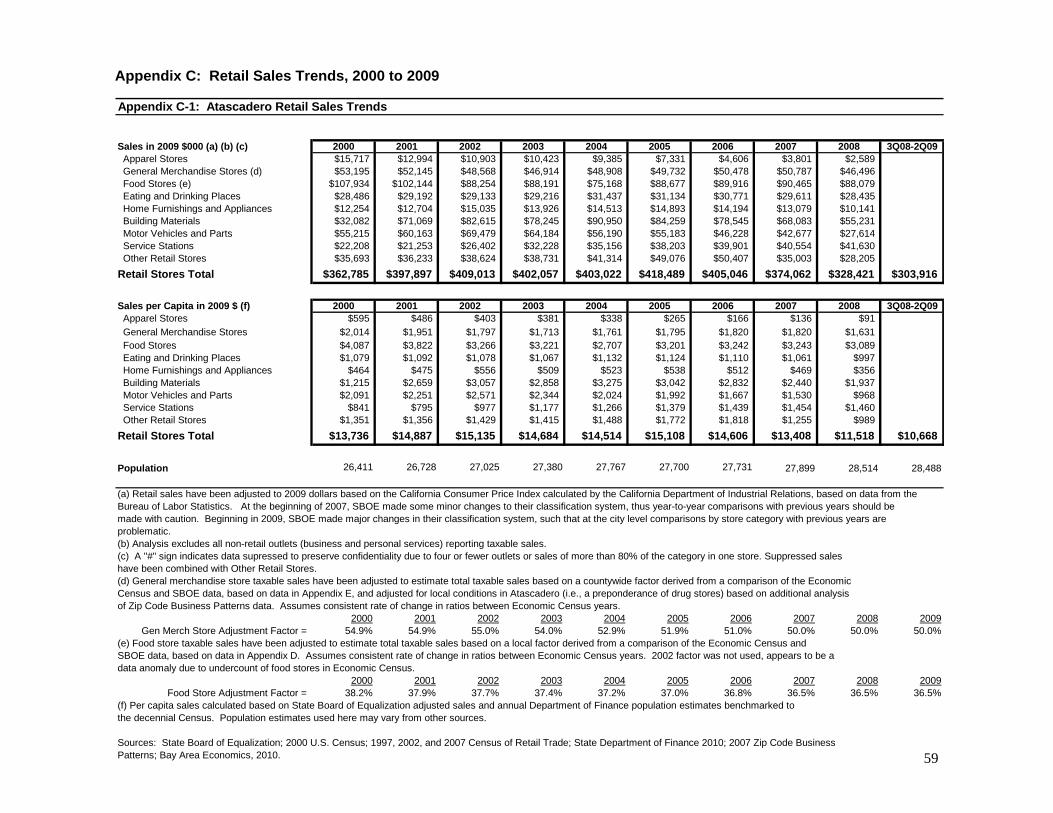
59
Appendix C: Retail Sales Trends, 2000 to 2009
Appendix C-1: Atascadero Retail Sales Trends
Sales in 2009 $000 (a) (b) (c) 2000 2001 2002 2003 2004 2005 2006 2007 2008 3Q08-2Q09 Apparel Stores $15,717 $12,994 $10,903 $10,423 $9,385 $7,331 $4,606 $3,801 $2,589 $2,539 General Merchandise Stores (d) $53,195 $52,145 $48,568 $46,914 $48,908 $49,732 $50,478 $50,787 $46,496 $42,611 Food Stores (e) $107,934 $102,144 $88,254 $88,191 $75,168 $88,677 $89,916 $90,465 $88,079 $89,029 Eating and Drinking Places $28,486 $29,192 $29,133 $29,216 $31,437 $31,134 $30,771 $29,611 $28,435 $28,807 Home Furnishings and Appliances $12,254 $12,704 $15,035 $13,926 $14,513 $14,893 $14,194 $13,079 $10,141 $8,999 Building Materials $32,082 $71,069 $82,615 $78,245 $90,950 $84,259 $78,545 $68,083 $55,231 $53,118 Motor Vehicles and Parts $55,215 $60,163 $69,479 $64,184 $56,190 $55,183 $46,228 $42,677 $27,614 $20,156 Service Stations $22,208 $21,253 $26,402 $32,228 $35,156 $38,203 $39,901 $40,554 $41,630 $34,699 Other Retail Stores $35,693 $36,233 $38,624 $38,731 $41,314 $49,076 $50,407 $35,003 $28,205 $23,959Retail Stores Total $362,785 $397,897 $409,013 $402,057 $403,022 $418,489 $405,046 $374,062 $328,421 $303,916
Sales per Capita in 2009 $ (f) 2000 2001 2002 2003 2004 2005 2006 2007 2008 3Q08-2Q09 Apparel Stores $595 $486 $403 $381 $338 $265 $166 $136 $91 General Merchandise Stores $2,014 $1,951 $1,797 $1,713 $1,761 $1,795 $1,820 $1,820 $1,631 Food Stores $4,087 $3,822 $3,266 $3,221 $2,707 $3,201 $3,242 $3,243 $3,089 Eating and Drinking Places $1,079 $1,092 $1,078 $1,067 $1,132 $1,124 $1,110 $1,061 $997 Home Furnishings and Appliances $464 $475 $556 $509 $523 $538 $512 $469 $356 Building Materials $1,215 $2,659 $3,057 $2,858 $3,275 $3,042 $2,832 $2,440 $1,937 Motor Vehicles and Parts $2,091 $2,251 $2,571 $2,344 $2,024 $1,992 $1,667 $1,530 $968 Service Stations $841 $795 $977 $1,177 $1,266 $1,379 $1,439 $1,454 $1,460 Other Retail Stores $1,351 $1,356 $1,429 $1,415 $1,488 $1,772 $1,818 $1,255 $989Retail Stores Total $13,736 $14,887 $15,135 $14,684 $14,514 $15,108 $14,606 $13,408 $11,518 $10,668
Population 26,411 26,728 27,025 27,380 27,767 27,700 27,731 27,899 28,514 28,488
(a) Retail sales have been adjusted to 2009 dollars based on the California Consumer Price Index calculated by the California Department of Industrial Relations, based on data from theBureau of Labor Statistics. At the beginning of 2007, SBOE made some minor changes to their classification system, thus year-to-year comparisons with previous years should bemade with caution. Beginning in 2009, SBOE made major changes in their classification system, such that at the city level comparisons by store category with previous years areproblematic.(b) Analysis excludes all non-retail outlets (business and personal services) reporting taxable sales.(c) A "#" sign indicates data supressed to preserve confidentiality due to four or fewer outlets or sales of more than 80% of the category in one store. Suppressed saleshave been combined with Other Retail Stores.(d) General merchandise store taxable sales have been adjusted to estimate total taxable sales based on a countywide factor derived from a comparison of the EconomicCensus and SBOE data, based on data in Appendix E, and adjusted for local conditions in Atascadero (i.e., a preponderance of drug stores) based on additional analysisof Zip Code Business Patterns data. Assumes consistent rate of change in ratios between Economic Census years.
2000 2001 2002 2003 2004 2005 2006 2007 2008 2009Gen Merch Store Adjustment Factor = 54.9% 54.9% 55.0% 54.0% 52.9% 51.9% 51.0% 50.0% 50.0% 50.0%
(e) Food store taxable sales have been adjusted to estimate total taxable sales based on a local factor derived from a comparison of the Economic Census andSBOE data, based on data in Appendix D. Assumes consistent rate of change in ratios between Economic Census years. 2002 factor was not used, appears to be adata anomaly due to undercount of food stores in Economic Census.
2000 2001 2002 2003 2004 2005 2006 2007 2008 2009Food Store Adjustment Factor = 38.2% 37.9% 37.7% 37.4% 37.2% 37.0% 36.8% 36.5% 36.5% 36.5%
(f) Per capita sales calculated based on State Board of Equalization adjusted sales and annual Department of Finance population estimates benchmarked tothe decennial Census. Population estimates used here may vary from other sources.
Sources: State Board of Equalization; 2000 U.S. Census; 1997, 2002, and 2007 Census of Retail Trade; State Department of Finance 2010; 2007 Zip Code BusinessPatterns; Bay Area Economics, 2010.
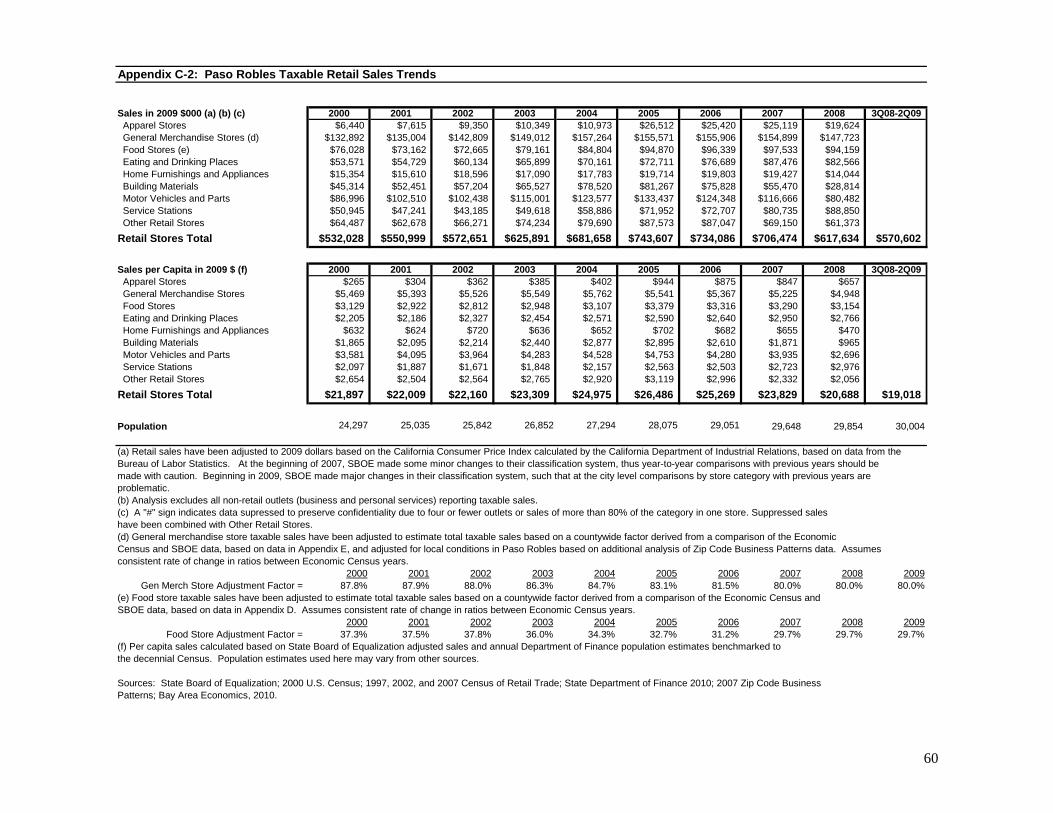
60
Appendix C-2: Paso Robles Taxable Retail Sales Trends
Sales in 2009 $000 (a) (b) (c) 2000 2001 2002 2003 2004 2005 2006 2007 2008 3Q08-2Q09 Apparel Stores $6,440 $7,615 $9,350 $10,349 $10,973 $26,512 $25,420 $25,119 $19,624 $17,945 General Merchandise Stores (d) $132,892 $135,004 $142,809 $149,012 $157,264 $155,571 $155,906 $154,899 $147,723 $141,525 Food Stores (e) $76,028 $73,162 $72,665 $79,161 $84,804 $94,870 $96,339 $97,533 $94,159 $94,573 Eating and Drinking Places $53,571 $54,729 $60,134 $65,899 $70,161 $72,711 $76,689 $87,476 $82,566 $79,310 Home Furnishings and Appliances $15,354 $15,610 $18,596 $17,090 $17,783 $19,714 $19,803 $19,427 $14,044 $13,654 Building Materials $45,314 $52,451 $57,204 $65,527 $78,520 $81,267 $75,828 $55,470 $28,814 $26,023 Motor Vehicles and Parts $86,996 $102,510 $102,438 $115,001 $123,577 $133,437 $124,348 $116,666 $80,482 $71,843 Service Stations $50,945 $47,241 $43,185 $49,618 $58,886 $71,952 $72,707 $80,735 $88,850 $76,675 Other Retail Stores $64,487 $62,678 $66,271 $74,234 $79,690 $87,573 $87,047 $69,150 $61,373 $49,052Retail Stores Total $532,028 $550,999 $572,651 $625,891 $681,658 $743,607 $734,086 $706,474 $617,634 $570,602
Sales per Capita in 2009 $ (f) 2000 2001 2002 2003 2004 2005 2006 2007 2008 3Q08-2Q09 Apparel Stores $265 $304 $362 $385 $402 $944 $875 $847 $657 General Merchandise Stores $5,469 $5,393 $5,526 $5,549 $5,762 $5,541 $5,367 $5,225 $4,948 Food Stores $3,129 $2,922 $2,812 $2,948 $3,107 $3,379 $3,316 $3,290 $3,154 Eating and Drinking Places $2,205 $2,186 $2,327 $2,454 $2,571 $2,590 $2,640 $2,950 $2,766 Home Furnishings and Appliances $632 $624 $720 $636 $652 $702 $682 $655 $470 Building Materials $1,865 $2,095 $2,214 $2,440 $2,877 $2,895 $2,610 $1,871 $965 Motor Vehicles and Parts $3,581 $4,095 $3,964 $4,283 $4,528 $4,753 $4,280 $3,935 $2,696 Service Stations $2,097 $1,887 $1,671 $1,848 $2,157 $2,563 $2,503 $2,723 $2,976 Other Retail Stores $2,654 $2,504 $2,564 $2,765 $2,920 $3,119 $2,996 $2,332 $2,056Retail Stores Total $21,897 $22,009 $22,160 $23,309 $24,975 $26,486 $25,269 $23,829 $20,688 $19,018
Population 24,297 25,035 25,842 26,852 27,294 28,075 29,051 29,648 29,854 30,004
(a) Retail sales have been adjusted to 2009 dollars based on the California Consumer Price Index calculated by the California Department of Industrial Relations, based on data from theBureau of Labor Statistics. At the beginning of 2007, SBOE made some minor changes to their classification system, thus year-to-year comparisons with previous years should bemade with caution. Beginning in 2009, SBOE made major changes in their classification system, such that at the city level comparisons by store category with previous years areproblematic.(b) Analysis excludes all non-retail outlets (business and personal services) reporting taxable sales.(c) A "#" sign indicates data supressed to preserve confidentiality due to four or fewer outlets or sales of more than 80% of the category in one store. Suppressed saleshave been combined with Other Retail Stores.(d) General merchandise store taxable sales have been adjusted to estimate total taxable sales based on a countywide factor derived from a comparison of the EconomicCensus and SBOE data, based on data in Appendix E, and adjusted for local conditions in Paso Robles based on additional analysis of Zip Code Business Patterns data. Assumesconsistent rate of change in ratios between Economic Census years.
2000 2001 2002 2003 2004 2005 2006 2007 2008 2009Gen Merch Store Adjustment Factor = 87.8% 87.9% 88.0% 86.3% 84.7% 83.1% 81.5% 80.0% 80.0% 80.0%
(e) Food store taxable sales have been adjusted to estimate total taxable sales based on a countywide factor derived from a comparison of the Economic Census andSBOE data, based on data in Appendix D. Assumes consistent rate of change in ratios between Economic Census years.
2000 2001 2002 2003 2004 2005 2006 2007 2008 2009Food Store Adjustment Factor = 37.3% 37.5% 37.8% 36.0% 34.3% 32.7% 31.2% 29.7% 29.7% 29.7%
(f) Per capita sales calculated based on State Board of Equalization adjusted sales and annual Department of Finance population estimates benchmarked tothe decennial Census. Population estimates used here may vary from other sources.
Sources: State Board of Equalization; 2000 U.S. Census; 1997, 2002, and 2007 Census of Retail Trade; State Department of Finance 2010; 2007 Zip Code BusinessPatterns; Bay Area Economics, 2010.
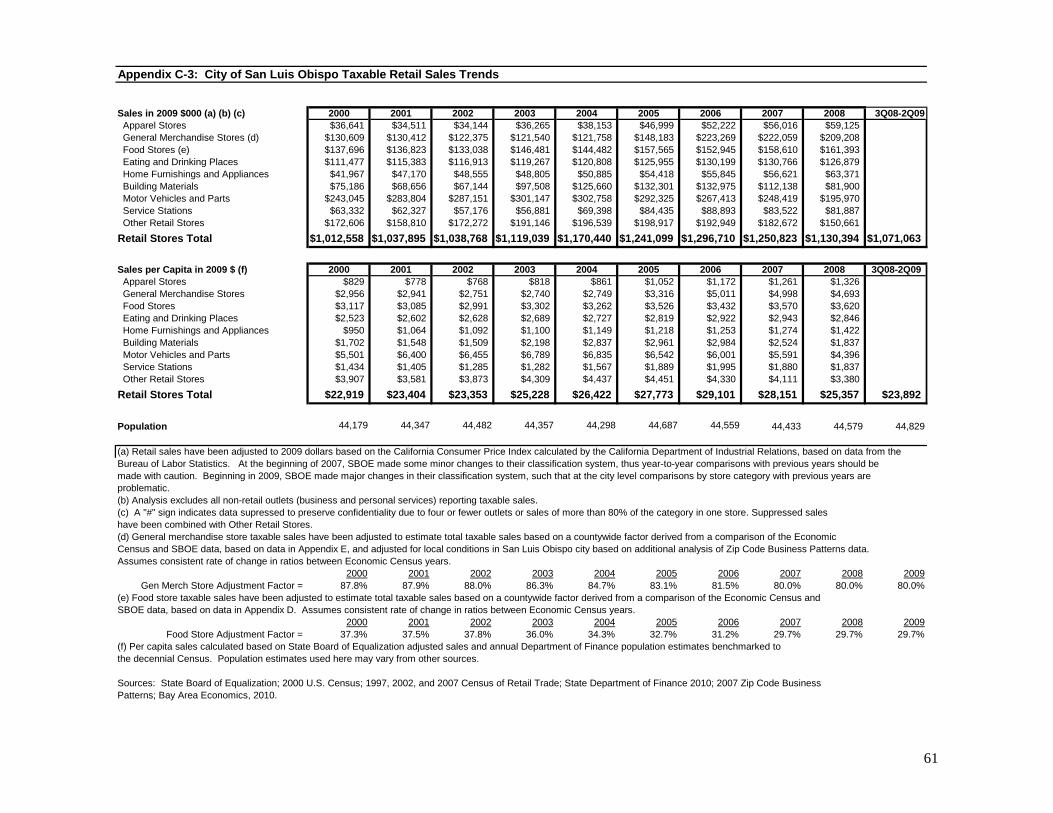
61
Appendix C-3: City of San Luis Obispo Taxable Retail Sales Trends
Sales in 2009 $000 (a) (b) (c) 2000 2001 2002 2003 2004 2005 2006 2007 2008 3Q08-2Q09 Apparel Stores $36,641 $34,511 $34,144 $36,265 $38,153 $46,999 $52,222 $56,016 $59,125 $69,610 General Merchandise Stores (d) $130,609 $130,412 $122,375 $121,540 $121,758 $148,183 $223,269 $222,059 $209,208 $187,911 Food Stores (e) $137,696 $136,823 $133,038 $146,481 $144,482 $157,565 $152,945 $158,610 $161,393 $175,876 Eating and Drinking Places $111,477 $115,383 $116,913 $119,267 $120,808 $125,955 $130,199 $130,766 $126,879 $126,077 Home Furnishings and Appliances $41,967 $47,170 $48,555 $48,805 $50,885 $54,418 $55,845 $56,621 $63,371 $73,229 Building Materials $75,186 $68,656 $67,144 $97,508 $125,660 $132,301 $132,975 $112,138 $81,900 $72,487 Motor Vehicles and Parts $243,045 $283,804 $287,151 $301,147 $302,758 $292,325 $267,413 $248,419 $195,970 $162,440 Service Stations $63,332 $62,327 $57,176 $56,881 $69,398 $84,435 $88,893 $83,522 $81,887 $75,554 Other Retail Stores $172,606 $158,810 $172,272 $191,146 $196,539 $198,917 $192,949 $182,672 $150,661 $127,879Retail Stores Total $1,012,558 $1,037,895 $1,038,768 $1,119,039 $1,170,440 $1,241,099 $1,296,710 $1,250,823 $1,130,394 $1,071,063
Sales per Capita in 2009 $ (f) 2000 2001 2002 2003 2004 2005 2006 2007 2008 3Q08-2Q09 Apparel Stores $829 $778 $768 $818 $861 $1,052 $1,172 $1,261 $1,326 General Merchandise Stores $2,956 $2,941 $2,751 $2,740 $2,749 $3,316 $5,011 $4,998 $4,693 Food Stores $3,117 $3,085 $2,991 $3,302 $3,262 $3,526 $3,432 $3,570 $3,620 Eating and Drinking Places $2,523 $2,602 $2,628 $2,689 $2,727 $2,819 $2,922 $2,943 $2,846 Home Furnishings and Appliances $950 $1,064 $1,092 $1,100 $1,149 $1,218 $1,253 $1,274 $1,422 Building Materials $1,702 $1,548 $1,509 $2,198 $2,837 $2,961 $2,984 $2,524 $1,837 Motor Vehicles and Parts $5,501 $6,400 $6,455 $6,789 $6,835 $6,542 $6,001 $5,591 $4,396 Service Stations $1,434 $1,405 $1,285 $1,282 $1,567 $1,889 $1,995 $1,880 $1,837 Other Retail Stores $3,907 $3,581 $3,873 $4,309 $4,437 $4,451 $4,330 $4,111 $3,380Retail Stores Total $22,919 $23,404 $23,353 $25,228 $26,422 $27,773 $29,101 $28,151 $25,357 $23,892
Population 44,179 44,347 44,482 44,357 44,298 44,687 44,559 44,433 44,579 44,829
(a) Retail sales have been adjusted to 2009 dollars based on the California Consumer Price Index calculated by the California Department of Industrial Relations, based on data from theBureau of Labor Statistics. At the beginning of 2007, SBOE made some minor changes to their classification system, thus year-to-year comparisons with previous years should bemade with caution. Beginning in 2009, SBOE made major changes in their classification system, such that at the city level comparisons by store category with previous years areproblematic.(b) Analysis excludes all non-retail outlets (business and personal services) reporting taxable sales.(c) A "#" sign indicates data supressed to preserve confidentiality due to four or fewer outlets or sales of more than 80% of the category in one store. Suppressed saleshave been combined with Other Retail Stores.(d) General merchandise store taxable sales have been adjusted to estimate total taxable sales based on a countywide factor derived from a comparison of the EconomicCensus and SBOE data, based on data in Appendix E, and adjusted for local conditions in San Luis Obispo city based on additional analysis of Zip Code Business Patterns data. Assumes consistent rate of change in ratios between Economic Census years.
2000 2001 2002 2003 2004 2005 2006 2007 2008 2009Gen Merch Store Adjustment Factor = 87.8% 87.9% 88.0% 86.3% 84.7% 83.1% 81.5% 80.0% 80.0% 80.0%
(e) Food store taxable sales have been adjusted to estimate total taxable sales based on a countywide factor derived from a comparison of the Economic Census andSBOE data, based on data in Appendix D. Assumes consistent rate of change in ratios between Economic Census years.
2000 2001 2002 2003 2004 2005 2006 2007 2008 2009Food Store Adjustment Factor = 37.3% 37.5% 37.8% 36.0% 34.3% 32.7% 31.2% 29.7% 29.7% 29.7%
(f) Per capita sales calculated based on State Board of Equalization adjusted sales and annual Department of Finance population estimates benchmarked tothe decennial Census. Population estimates used here may vary from other sources.
Sources: State Board of Equalization; 2000 U.S. Census; 1997, 2002, and 2007 Census of Retail Trade; State Department of Finance 2010; 2007 Zip Code BusinessPatterns; Bay Area Economics, 2010.
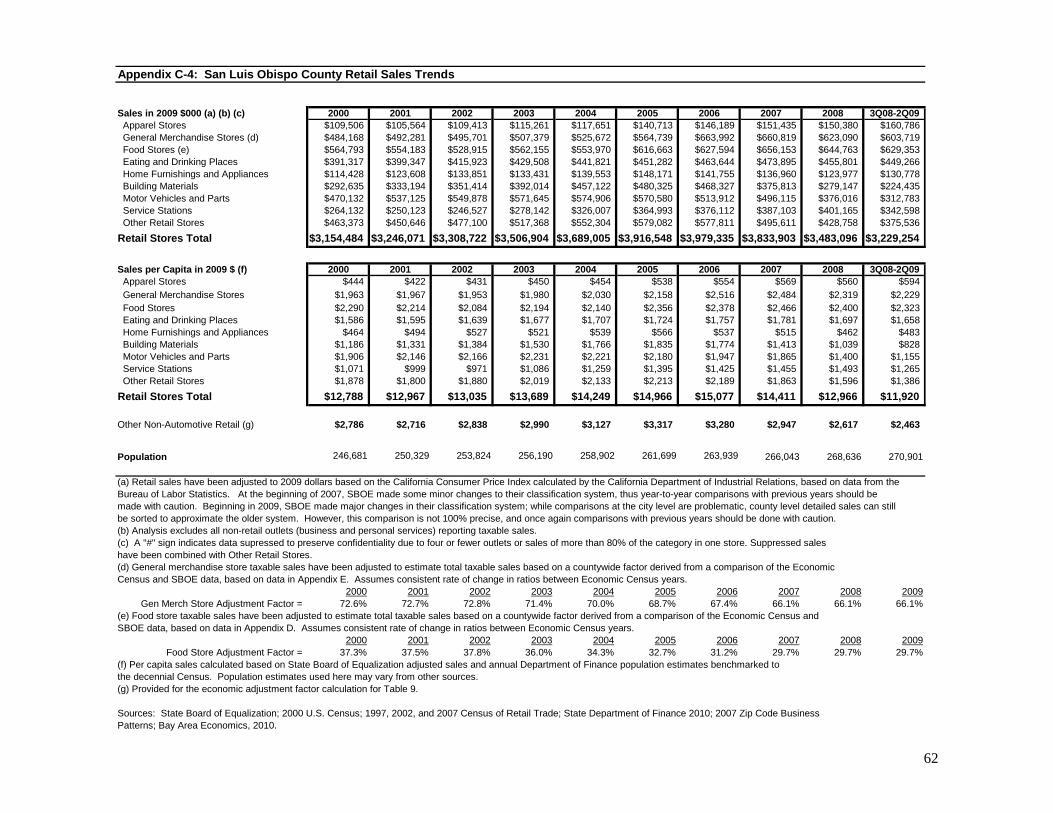
62
Appendix C-4: San Luis Obispo County Retail Sales Trends
Sales in 2009 $000 (a) (b) (c) 2000 2001 2002 2003 2004 2005 2006 2007 2008 3Q08-2Q09 Apparel Stores $109,506 $105,564 $109,413 $115,261 $117,651 $140,713 $146,189 $151,435 $150,380 $160,786 General Merchandise Stores (d) $484,168 $492,281 $495,701 $507,379 $525,672 $564,739 $663,992 $660,819 $623,090 $603,719 Food Stores (e) $564,793 $554,183 $528,915 $562,155 $553,970 $616,663 $627,594 $656,153 $644,763 $629,353 Eating and Drinking Places $391,317 $399,347 $415,923 $429,508 $441,821 $451,282 $463,644 $473,895 $455,801 $449,266 Home Furnishings and Appliances $114,428 $123,608 $133,851 $133,431 $139,553 $148,171 $141,755 $136,960 $123,977 $130,778 Building Materials $292,635 $333,194 $351,414 $392,014 $457,122 $480,325 $468,327 $375,813 $279,147 $224,435 Motor Vehicles and Parts $470,132 $537,125 $549,878 $571,645 $574,906 $570,580 $513,912 $496,115 $376,016 $312,783 Service Stations $264,132 $250,123 $246,527 $278,142 $326,007 $364,993 $376,112 $387,103 $401,165 $342,598 Other Retail Stores $463,373 $450,646 $477,100 $517,368 $552,304 $579,082 $577,811 $495,611 $428,758 $375,536Retail Stores Total $3,154,484 $3,246,071 $3,308,722 $3,506,904 $3,689,005 $3,916,548 $3,979,335 $3,833,903 $3,483,096 $3,229,254
Sales per Capita in 2009 $ (f) 2000 2001 2002 2003 2004 2005 2006 2007 2008 3Q08-2Q09 Apparel Stores $444 $422 $431 $450 $454 $538 $554 $569 $560 $594 General Merchandise Stores $1,963 $1,967 $1,953 $1,980 $2,030 $2,158 $2,516 $2,484 $2,319 $2,229 Food Stores $2,290 $2,214 $2,084 $2,194 $2,140 $2,356 $2,378 $2,466 $2,400 $2,323 Eating and Drinking Places $1,586 $1,595 $1,639 $1,677 $1,707 $1,724 $1,757 $1,781 $1,697 $1,658 Home Furnishings and Appliances $464 $494 $527 $521 $539 $566 $537 $515 $462 $483 Building Materials $1,186 $1,331 $1,384 $1,530 $1,766 $1,835 $1,774 $1,413 $1,039 $828 Motor Vehicles and Parts $1,906 $2,146 $2,166 $2,231 $2,221 $2,180 $1,947 $1,865 $1,400 $1,155 Service Stations $1,071 $999 $971 $1,086 $1,259 $1,395 $1,425 $1,455 $1,493 $1,265 Other Retail Stores $1,878 $1,800 $1,880 $2,019 $2,133 $2,213 $2,189 $1,863 $1,596 $1,386Retail Stores Total $12,788 $12,967 $13,035 $13,689 $14,249 $14,966 $15,077 $14,411 $12,966 $11,920
Other Non-Automotive Retail (g) $2,786 $2,716 $2,838 $2,990 $3,127 $3,317 $3,280 $2,947 $2,617 $2,463
Population 246,681 250,329 253,824 256,190 258,902 261,699 263,939 266,043 268,636 270,901
(a) Retail sales have been adjusted to 2009 dollars based on the California Consumer Price Index calculated by the California Department of Industrial Relations, based on data from theBureau of Labor Statistics. At the beginning of 2007, SBOE made some minor changes to their classification system, thus year-to-year comparisons with previous years should bemade with caution. Beginning in 2009, SBOE made major changes in their classification system; while comparisons at the city level are problematic, county level detailed sales can stillbe sorted to approximate the older system. However, this comparison is not 100% precise, and once again comparisons with previous years should be done with caution.(b) Analysis excludes all non-retail outlets (business and personal services) reporting taxable sales.(c) A "#" sign indicates data supressed to preserve confidentiality due to four or fewer outlets or sales of more than 80% of the category in one store. Suppressed saleshave been combined with Other Retail Stores.(d) General merchandise store taxable sales have been adjusted to estimate total taxable sales based on a countywide factor derived from a comparison of the EconomicCensus and SBOE data, based on data in Appendix E. Assumes consistent rate of change in ratios between Economic Census years.
2000 2001 2002 2003 2004 2005 2006 2007 2008 2009Gen Merch Store Adjustment Factor = 72.6% 72.7% 72.8% 71.4% 70.0% 68.7% 67.4% 66.1% 66.1% 66.1%
(e) Food store taxable sales have been adjusted to estimate total taxable sales based on a countywide factor derived from a comparison of the Economic Census andSBOE data, based on data in Appendix D. Assumes consistent rate of change in ratios between Economic Census years.
2000 2001 2002 2003 2004 2005 2006 2007 2008 2009Food Store Adjustment Factor = 37.3% 37.5% 37.8% 36.0% 34.3% 32.7% 31.2% 29.7% 29.7% 29.7%
(f) Per capita sales calculated based on State Board of Equalization adjusted sales and annual Department of Finance population estimates benchmarked tothe decennial Census. Population estimates used here may vary from other sources.(g) Provided for the economic adjustment factor calculation for Table 9.
Sources: State Board of Equalization; 2000 U.S. Census; 1997, 2002, and 2007 Census of Retail Trade; State Department of Finance 2010; 2007 Zip Code BusinessPatterns; Bay Area Economics, 2010.
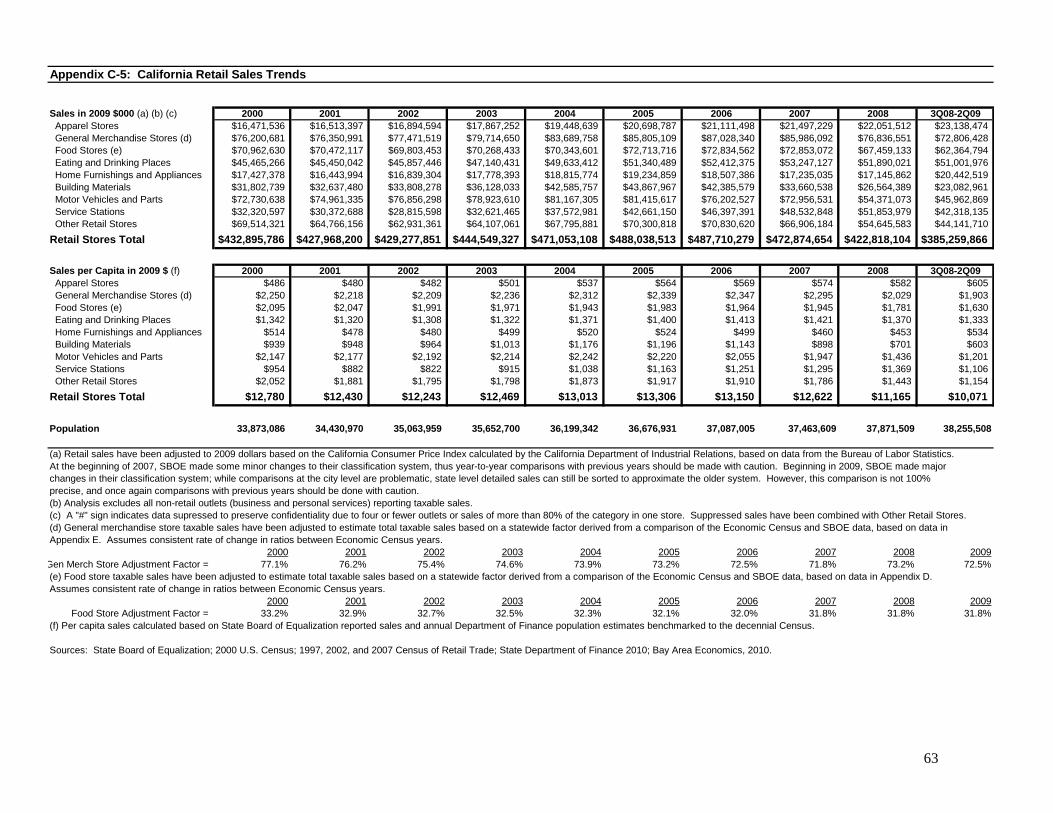
63
Appendix C-5: California Retail Sales Trends
Sales in 2009 $000 (a) (b) (c) 2000 2001 2002 2003 2004 2005 2006 2007 2008 3Q08-2Q09 Apparel Stores $16,471,536 $16,513,397 $16,894,594 $17,867,252 $19,448,639 $20,698,787 $21,111,498 $21,497,229 $22,051,512 $23,138,474 General Merchandise Stores (d) $76,200,681 $76,350,991 $77,471,519 $79,714,650 $83,689,758 $85,805,109 $87,028,340 $85,986,092 $76,836,551 $72,806,428 Food Stores (e) $70,962,630 $70,472,117 $69,803,453 $70,268,433 $70,343,601 $72,713,716 $72,834,562 $72,853,072 $67,459,133 $62,364,794 Eating and Drinking Places $45,465,266 $45,450,042 $45,857,446 $47,140,431 $49,633,412 $51,340,489 $52,412,375 $53,247,127 $51,890,021 $51,001,976 Home Furnishings and Appliances $17,427,378 $16,443,994 $16,839,304 $17,778,393 $18,815,774 $19,234,859 $18,507,386 $17,235,035 $17,145,862 $20,442,519 Building Materials $31,802,739 $32,637,480 $33,808,278 $36,128,033 $42,585,757 $43,867,967 $42,385,579 $33,660,538 $26,564,389 $23,082,961 Motor Vehicles and Parts $72,730,638 $74,961,335 $76,856,298 $78,923,610 $81,167,305 $81,415,617 $76,202,527 $72,956,531 $54,371,073 $45,962,869 Service Stations $32,320,597 $30,372,688 $28,815,598 $32,621,465 $37,572,981 $42,661,150 $46,397,391 $48,532,848 $51,853,979 $42,318,135 Other Retail Stores $69,514,321 $64,766,156 $62,931,361 $64,107,061 $67,795,881 $70,300,818 $70,830,620 $66,906,184 $54,645,583 $44,141,710Retail Stores Total $432,895,786 $427,968,200 $429,277,851 $444,549,327 $471,053,108 $488,038,513 $487,710,279 $472,874,654 $422,818,104 $385,259,866
Sales per Capita in 2009 $ (f) 2000 2001 2002 2003 2004 2005 2006 2007 2008 3Q08-2Q09 Apparel Stores $486 $480 $482 $501 $537 $564 $569 $574 $582 $605 General Merchandise Stores (d) $2,250 $2,218 $2,209 $2,236 $2,312 $2,339 $2,347 $2,295 $2,029 $1,903 Food Stores (e) $2,095 $2,047 $1,991 $1,971 $1,943 $1,983 $1,964 $1,945 $1,781 $1,630 Eating and Drinking Places $1,342 $1,320 $1,308 $1,322 $1,371 $1,400 $1,413 $1,421 $1,370 $1,333 Home Furnishings and Appliances $514 $478 $480 $499 $520 $524 $499 $460 $453 $534 Building Materials $939 $948 $964 $1,013 $1,176 $1,196 $1,143 $898 $701 $603 Motor Vehicles and Parts $2,147 $2,177 $2,192 $2,214 $2,242 $2,220 $2,055 $1,947 $1,436 $1,201 Service Stations $954 $882 $822 $915 $1,038 $1,163 $1,251 $1,295 $1,369 $1,106 Other Retail Stores $2,052 $1,881 $1,795 $1,798 $1,873 $1,917 $1,910 $1,786 $1,443 $1,154Retail Stores Total $12,780 $12,430 $12,243 $12,469 $13,013 $13,306 $13,150 $12,622 $11,165 $10,071
Population 33,873,086 34,430,970 35,063,959 35,652,700 36,199,342 36,676,931 37,087,005 37,463,609 37,871,509 38,255,508
(a) Retail sales have been adjusted to 2009 dollars based on the California Consumer Price Index calculated by the California Department of Industrial Relations, based on data from the Bureau of Labor Statistics. At the beginning of 2007, SBOE made some minor changes to their classification system, thus year-to-year comparisons with previous years should be made with caution. Beginning in 2009, SBOE made majorchanges in their classification system; while comparisons at the city level are problematic, state level detailed sales can still be sorted to approximate the older system. However, this comparison is not 100%precise, and once again comparisons with previous years should be done with caution.(b) Analysis excludes all non-retail outlets (business and personal services) reporting taxable sales.(c) A "#" sign indicates data supressed to preserve confidentiality due to four or fewer outlets or sales of more than 80% of the category in one store. Suppressed sales have been combined with Other Retail Stores.(d) General merchandise store taxable sales have been adjusted to estimate total taxable sales based on a statewide factor derived from a comparison of the Economic Census and SBOE data, based on data inAppendix E. Assumes consistent rate of change in ratios between Economic Census years.
2000 2001 2002 2003 2004 2005 2006 2007 2008 2009Gen Merch Store Adjustment Factor = 77.1% 76.2% 75.4% 74.6% 73.9% 73.2% 72.5% 71.8% 73.2% 72.5%(e) Food store taxable sales have been adjusted to estimate total taxable sales based on a statewide factor derived from a comparison of the Economic Census and SBOE data, based on data in Appendix D. Assumes consistent rate of change in ratios between Economic Census years.
2000 2001 2002 2003 2004 2005 2006 2007 2008 2009Food Store Adjustment Factor = 33.2% 32.9% 32.7% 32.5% 32.3% 32.1% 32.0% 31.8% 31.8% 31.8%
(f) Per capita sales calculated based on State Board of Equalization reported sales and annual Department of Finance population estimates benchmarked to the decennial Census.
Sources: State Board of Equalization; 2000 U.S. Census; 1997, 2002, and 2007 Census of Retail Trade; State Department of Finance 2010; Bay Area Economics, 2010.
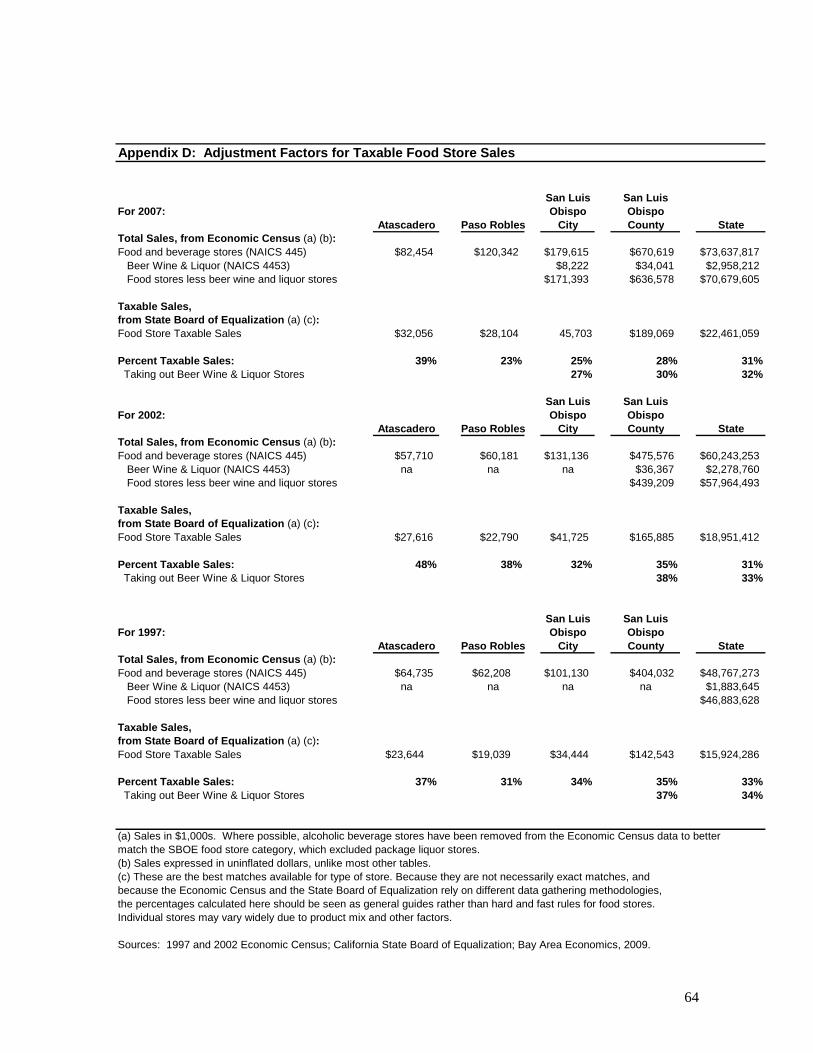
64
Appendix D: Adjustment Factors for Taxable Food Store Sales
San Luis San LuisFor 2007: Obispo Obispo
Atascadero Paso Robles City County StateTotal Sales, from Economic Census (a) (b): Food and beverage stores (NAICS 445) $82,454 $120,342 $179,615 $670,619 $73,637,817 Beer Wine & Liquor (NAICS 4453) $8,222 $34,041 $2,958,212 Food stores less beer wine and liquor stores $171,393 $636,578 $70,679,605
Taxable Sales, from State Board of Equalization (a) (c):Food Store Taxable Sales $32,056 $28,104 45,703 $189,069 $22,461,059
Percent Taxable Sales: 39% 23% 25% 28% 31% Taking out Beer Wine & Liquor Stores 27% 30% 32%
San Luis San LuisFor 2002: Obispo Obispo
Atascadero Paso Robles City County StateTotal Sales, from Economic Census (a) (b): Food and beverage stores (NAICS 445) $57,710 $60,181 $131,136 $475,576 $60,243,253 Beer Wine & Liquor (NAICS 4453) na na na $36,367 $2,278,760 Food stores less beer wine and liquor stores $439,209 $57,964,493
Taxable Sales, from State Board of Equalization (a) (c):Food Store Taxable Sales $27,616 $22,790 $41,725 $165,885 $18,951,412
Percent Taxable Sales: 48% 38% 32% 35% 31% Taking out Beer Wine & Liquor Stores 38% 33%
San Luis San LuisFor 1997: Obispo Obispo
Atascadero Paso Robles City County StateTotal Sales, from Economic Census (a) (b): Food and beverage stores (NAICS 445) $64,735 $62,208 $101,130 $404,032 $48,767,273 Beer Wine & Liquor (NAICS 4453) na na na na $1,883,645 Food stores less beer wine and liquor stores $46,883,628
Taxable Sales, from State Board of Equalization (a) (c):Food Store Taxable Sales $23,644 $19,039 $34,444 $142,543 $15,924,286
Percent Taxable Sales: 37% 31% 34% 35% 33% Taking out Beer Wine & Liquor Stores 37% 34%
(a) Sales in $1,000s. Where possible, alcoholic beverage stores have been removed from the Economic Census data to bettermatch the SBOE food store category, which excluded package liquor stores.(b) Sales expressed in uninflated dollars, unlike most other tables.(c) These are the best matches available for type of store. Because they are not necessarily exact matches, andbecause the Economic Census and the State Board of Equalization rely on different data gathering methodologies,the percentages calculated here should be seen as general guides rather than hard and fast rules for food stores.Individual stores may vary widely due to product mix and other factors.
Sources: 1997 and 2002 Economic Census; California State Board of Equalization; Bay Area Economics, 2009.
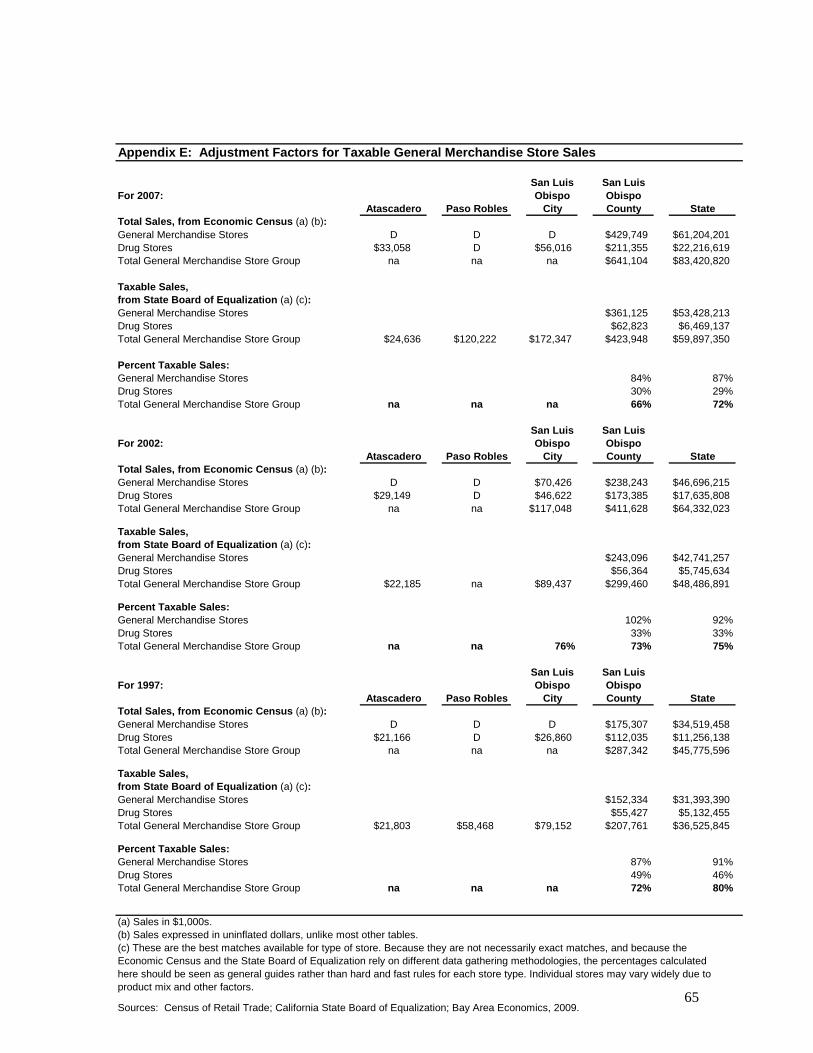
65
Appendix E: Adjustment Factors for Taxable General Merchandise Store Sales
San Luis San LuisFor 2007: Obispo Obispo
Atascadero Paso Robles City County StateTotal Sales, from Economic Census (a) (b): General Merchandise Stores D D D $429,749 $61,204,201Drug Stores $33,058 D $56,016 $211,355 $22,216,619Total General Merchandise Store Group na na na $641,104 $83,420,820
Taxable Sales, from State Board of Equalization (a) (c):General Merchandise Stores $361,125 $53,428,213Drug Stores $62,823 $6,469,137Total General Merchandise Store Group $24,636 $120,222 $172,347 $423,948 $59,897,350
Percent Taxable Sales:General Merchandise Stores 84% 87%Drug Stores 30% 29%Total General Merchandise Store Group na na na 66% 72%
San Luis San LuisFor 2002: Obispo Obispo
Atascadero Paso Robles City County StateTotal Sales, from Economic Census (a) (b): General Merchandise Stores D D $70,426 $238,243 $46,696,215Drug Stores $29,149 D $46,622 $173,385 $17,635,808Total General Merchandise Store Group na na $117,048 $411,628 $64,332,023
Taxable Sales, from State Board of Equalization (a) (c):General Merchandise Stores $243,096 $42,741,257Drug Stores $56,364 $5,745,634Total General Merchandise Store Group $22,185 na $89,437 $299,460 $48,486,891
Percent Taxable Sales:General Merchandise Stores 102% 92%Drug Stores 33% 33%Total General Merchandise Store Group na na 76% 73% 75%
San Luis San LuisFor 1997: Obispo Obispo
Atascadero Paso Robles City County StateTotal Sales, from Economic Census (a) (b): General Merchandise Stores D D D $175,307 $34,519,458Drug Stores $21,166 D $26,860 $112,035 $11,256,138Total General Merchandise Store Group na na na $287,342 $45,775,596
Taxable Sales, from State Board of Equalization (a) (c):General Merchandise Stores $152,334 $31,393,390Drug Stores $55,427 $5,132,455Total General Merchandise Store Group $21,803 $58,468 $79,152 $207,761 $36,525,845
Percent Taxable Sales:General Merchandise Stores 87% 91%Drug Stores 49% 46%Total General Merchandise Store Group na na na 72% 80%
(a) Sales in $1,000s.(b) Sales expressed in uninflated dollars, unlike most other tables.(c) These are the best matches available for type of store. Because they are not necessarily exact matches, and because theEconomic Census and the State Board of Equalization rely on different data gathering methodologies, the percentages calculatedhere should be seen as general guides rather than hard and fast rules for each store type. Individual stores may vary widely due toproduct mix and other factors.
Sources: Census of Retail Trade; California State Board of Equalization; Bay Area Economics, 2009.
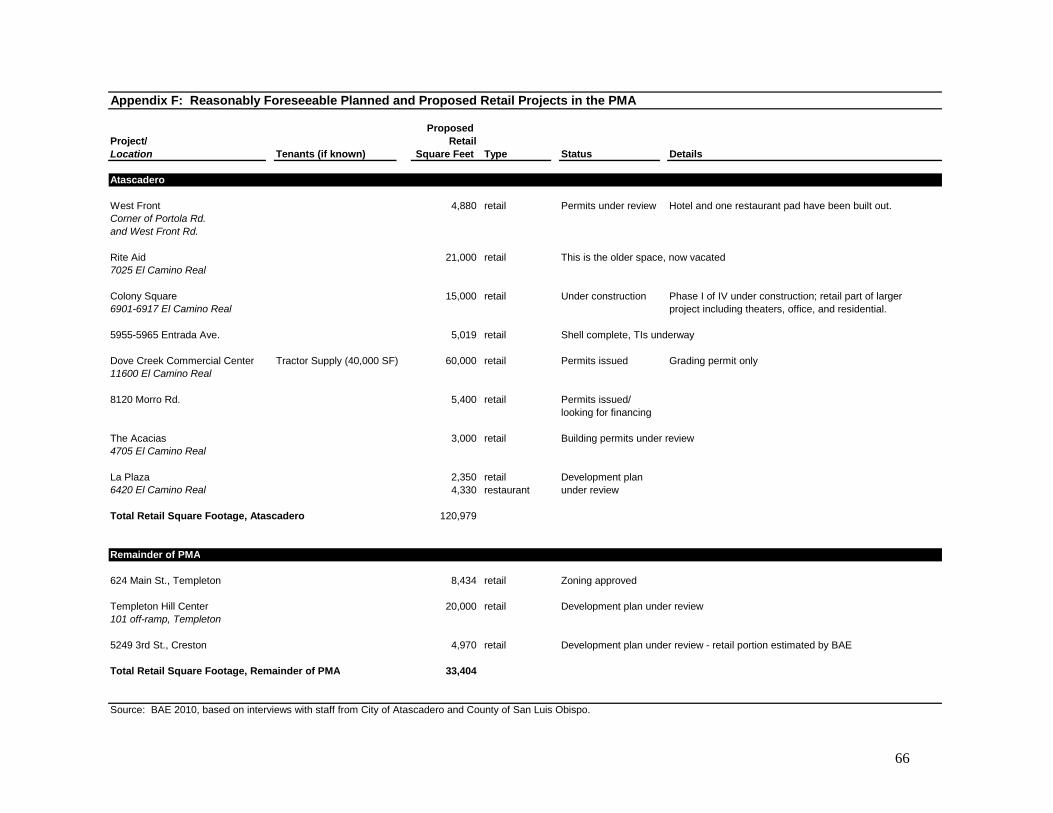
66
Appendix F: Reasonably Foreseeable Planned and Proposed Retail Projects in the PMA
Proposed Project/ RetailLocation Tenants (if known) Square Feet Type Status Details
Atascadero
West Front 4,880 retail Permits under review Hotel and one restaurant pad have been built out.Corner of Portola Rd.and West Front Rd.
Rite Aid 21,000 retail This is the older space, now vacated7025 El Camino Real
Colony Square 15,000 retail Under construction Phase I of IV under construction; retail part of larger6901-6917 El Camino Real project including theaters, office, and residential.
5955-5965 Entrada Ave. 5,019 retail Shell complete, TIs underway
Dove Creek Commercial Center Tractor Supply (40,000 SF) 60,000 retail Permits issued Grading permit only11600 El Camino Real
8120 Morro Rd. 5,400 retail Permits issued/looking for financing
The Acacias 3,000 retail Building permits under review4705 El Camino Real
La Plaza 2,350 retail Development plan 6420 El Camino Real 4,330 restaurant under review
Total Retail Square Footage, Atascadero 120,979
Remainder of PMA
624 Main St., Templeton 8,434 retail Zoning approved
Templeton Hill Center 20,000 retail Development plan under review101 off-ramp, Templeton
5249 3rd St., Creston 4,970 retail Development plan under review - retail portion estimated by BAE
Total Retail Square Footage, Remainder of PMA 33,404
Source: BAE 2010, based on interviews with staff from City of Atascadero and County of San Luis Obispo.
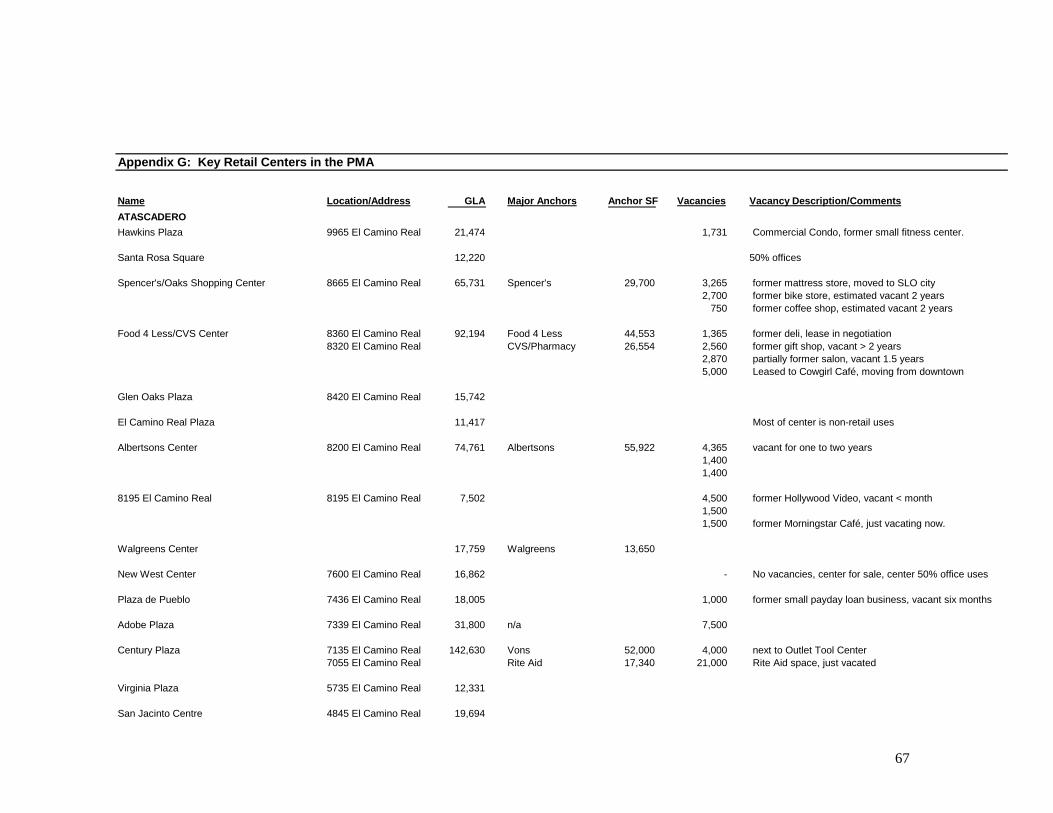
67
Appendix G: Key Retail Centers in the PMA
Name Location/Address GLA Major Anchors Anchor SF Vacancies Vacancy Description/CommentsATASCADEROHawkins Plaza 9965 El Camino Real 21,474 1,731 Commercial Condo, former small fitness center.
Santa Rosa Square 12,220 50% offices
Spencer's/Oaks Shopping Center 8665 El Camino Real 65,731 Spencer's 29,700 3,265 former mattress store, moved to SLO city2,700 former bike store, estimated vacant 2 years
750 former coffee shop, estimated vacant 2 years
Food 4 Less/CVS Center 8360 El Camino Real 92,194 Food 4 Less 44,553 1,365 former deli, lease in negotiation8320 El Camino Real CVS/Pharmacy 26,554 2,560 former gift shop, vacant > 2 years
2,870 partially former salon, vacant 1.5 years5,000 Leased to Cowgirl Café, moving from downtown
Glen Oaks Plaza 8420 El Camino Real 15,742
El Camino Real Plaza 11,417 Most of center is non-retail uses
Albertsons Center 8200 El Camino Real 74,761 Albertsons 55,922 4,365 vacant for one to two years1,400 1,400
8195 El Camino Real 8195 El Camino Real 7,502 4,500 former Hollywood Video, vacant < month1,500 1,500 former Morningstar Café, just vacating now.
Walgreens Center 17,759 Walgreens 13,650
New West Center 7600 El Camino Real 16,862 - No vacancies, center for sale, center 50% office uses
Plaza de Pueblo 7436 El Camino Real 18,005 1,000 former small payday loan business, vacant six months
Adobe Plaza 7339 El Camino Real 31,800 n/a 7,500
Century Plaza 7135 El Camino Real 142,630 Vons 52,000 4,000 next to Outlet Tool Center7055 El Camino Real Rite Aid 17,340 21,000 Rite Aid space, just vacated
Virginia Plaza 5735 El Camino Real 12,331
San Jacinto Centre 4845 El Camino Real 19,694
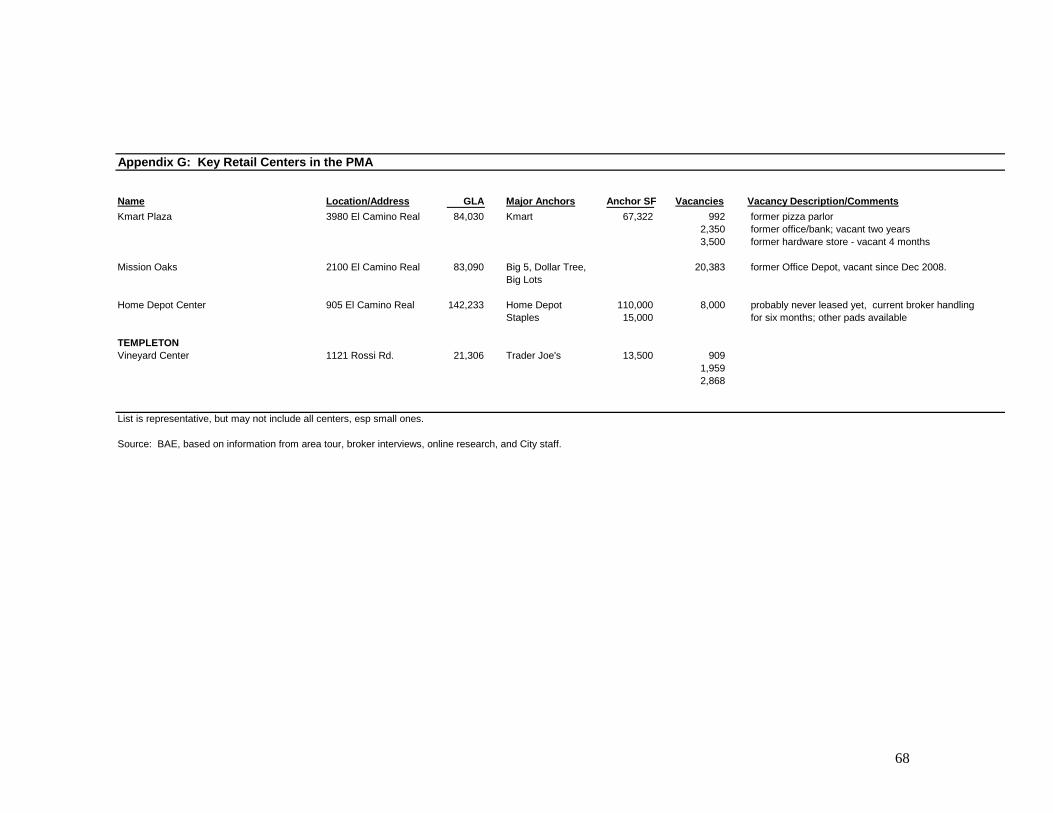
68
Appendix G: Key Retail Centers in the PMA
Name Location/Address GLA Major Anchors Anchor SF Vacancies Vacancy Description/CommentsKmart Plaza 3980 El Camino Real 84,030 Kmart 67,322 992 former pizza parlor
2,350 former office/bank; vacant two years3,500 former hardware store - vacant 4 months
Mission Oaks 2100 El Camino Real 83,090 Big 5, Dollar Tree, 20,383 former Office Depot, vacant since Dec 2008.Big Lots
Home Depot Center 905 El Camino Real 142,233 Home Depot 110,000 8,000 probably never leased yet, current broker handlingStaples 15,000 for six months; other pads available
TEMPLETONVineyard Center 1121 Rossi Rd. 21,306 Trader Joe's 13,500 909
1,959 2,868
List is representative, but may not include all centers, esp small ones.
Source: BAE, based on information from area tour, broker interviews, online research, and City staff.
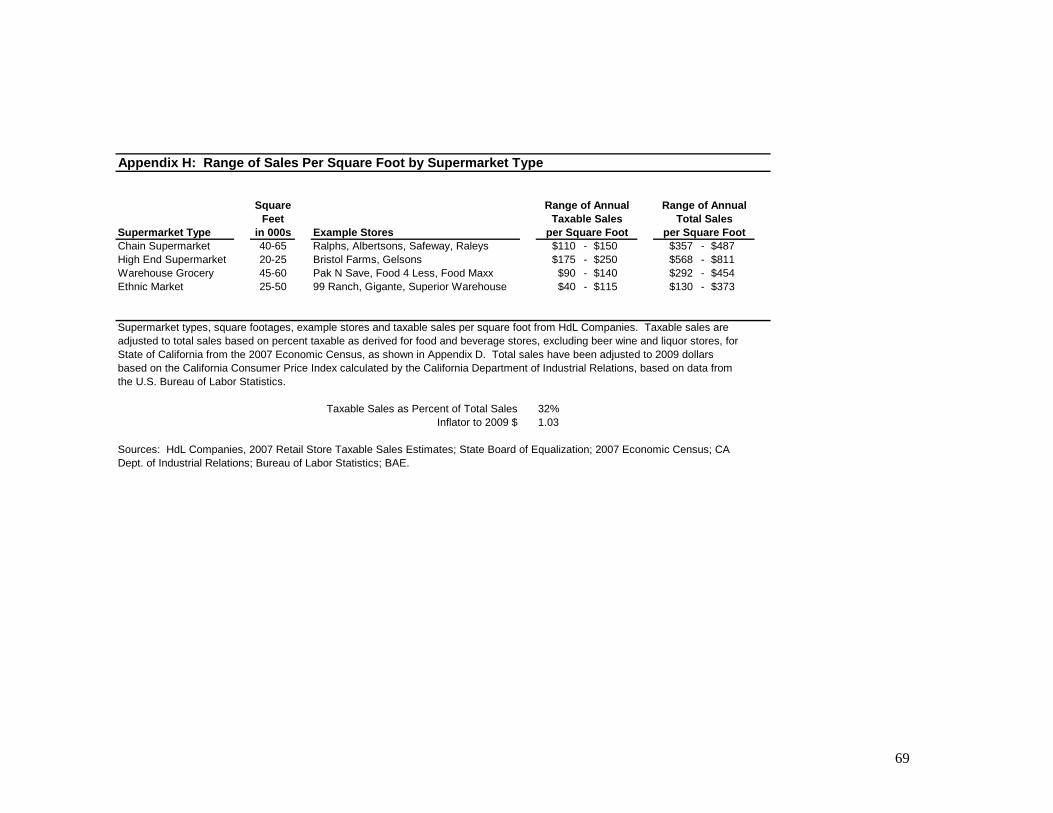
69
Appendix H: Range of Sales Per Square Foot by Supermarket Type
Square Range of Annual Range of AnnualFeet Taxable Sales Total Sales
Supermarket Type in 000s Example Stores per Square Foot per Square FootChain Supermarket 40-65 Ralphs, Albertsons, Safeway, Raleys $110 - $150 $357 - $487High End Supermarket 20-25 Bristol Farms, Gelsons $175 - $250 $568 - $811Warehouse Grocery 45-60 Pak N Save, Food 4 Less, Food Maxx $90 - $140 $292 - $454Ethnic Market 25-50 99 Ranch, Gigante, Superior Warehouse $40 - $115 $130 - $373
Supermarket types, square footages, example stores and taxable sales per square foot from HdL Companies. Taxable sales areadjusted to total sales based on percent taxable as derived for food and beverage stores, excluding beer wine and liquor stores, forState of California from the 2007 Economic Census, as shown in Appendix D. Total sales have been adjusted to 2009 dollarsbased on the California Consumer Price Index calculated by the California Department of Industrial Relations, based on data fromthe U.S. Bureau of Labor Statistics.
Taxable Sales as Percent of Total Sales 32%Inflator to 2009 $ 1.03
Sources: HdL Companies, 2007 Retail Store Taxable Sales Estimates; State Board of Equalization; 2007 Economic Census; CADept. of Industrial Relations; Bureau of Labor Statistics; BAE.