Appendix A Emissions Inventory - Kentucky Energy and ...
253
Kentucky Energy and Environment Cabinet Kentucky Division for Air Quality ------------------------------------------- Appendix A Emissions Inventory Appendix A - 1 Kentucky Regional Haze 5-Year Periodic Report SIP Revision, September 2014
-
Upload
khangminh22 -
Category
Documents
-
view
0 -
download
0
Transcript of Appendix A Emissions Inventory - Kentucky Energy and ...

Kentucky Energy and Environment Cabinet
Kentucky Division for Air Quality
-------------------------------------------
Appendix A Emissions Inventory
Appendix A - 1 Kentucky Regional Haze 5-Year Periodic Report SIP Revision, September 2014

[This page intentionally left blank.]
Appendix A - 2 Kentucky Regional Haze 5-Year Periodic Report SIP Revision, September 2014
SEMAP 2007 Emissions Inventory
Documentation
Appendix A - 3 Kentucky Regional Haze 5-Year Periodic Report SIP Revision, September 2014
Development of the Point Source Emission Inventory for 2007
in the SESARM Region (Version 1.10a)
Prepared for: John Hornback
Executive Director, Southeastern States Air Resource Managers, Inc. 526 Forest Parkway, Suite F Forest Park, GA 30297-6140.
(404) 361-4000, FAX (404) 361-2411 [email protected]
Prepared by:
AMEC E&I, Inc.
404 SW 140th Terrace Newberry, FL 32669
(352) 333-6617, FAX (352) 333-6622 wrbarnard@ AMEC.com
Mark Diblin Senior Principal
William R. Barnard Senior Principal
AMEC Project No.: 6066-09-0326.02 Contract No.: S-2009-06-02
March 27, 2012
Appendix A - 4 Kentucky Regional Haze 5-Year Periodic Report SIP Revision, September 2014
Development of Point Source Emission Inventory for 2007 Southeastern States Air Resource Managers, Inc. AMEC Project No.: 6066-09-0326.02 January 18, 2012
i AMEC
Table of Contents 1.0 ANNUAL 2007 INVENTORY FOR POINT SOURCES .......................................................... 1
1.1 INTRODUCTION ............................................................................................................... 1
1.2 INITIAL DATA SOURCES AND QA REVIEW .................................................................... 2 1.2.1 State Submittals and Conversion into a NIF Database ............................................. 2
1.2.1.1 Alabama ................................................................................................................ 5 1.2.1.2 Alabama – Jefferson County ................................................................................. 5 1.2.1.3 Florida ................................................................................................................... 6 1.2.1.4 Georgia .................................................................................................................. 6 1.2.1.5 Kentucky ................................................................................................................ 6 1.2.1.6 Kentucky – Jefferson County................................................................................. 6 1.2.1.7 Mississippi ............................................................................................................. 7 1.2.1.8 North Carolina ....................................................................................................... 7 1.2.1.9 North Carolina – Buncombe County ...................................................................... 7 1.2.1.10 North Carolina – Forsyth County ....................................................................... 8 1.2.1.11 North Carolina – Mecklenburg County .............................................................. 8 1.2.1.12 South Carolina ................................................................................................... 9 1.2.1.13 Tennessee ....................................................................................................... 10 1.2.1.14 Tennessee – Davidson County ....................................................................... 10 1.2.1.15 Tennessee – Hamilton County ........................................................................ 10 1.2.1.16 Tennessee – Knox County .............................................................................. 10 1.2.1.17 Tennessee – Shelby County ........................................................................... 10 1.2.1.18 Virginia ............................................................................................................. 11 1.2.1.19 West Virginia ................................................................................................... 11
1.3 EPA CAMD HOURLY EMISSION DATA ......................................................................... 11
1.4 PM AUGMENTATION ..................................................................................................... 12
1.4.1 Initial QA and Remediation of PM Pollutants .......................................................... 14 1.4.2 Updating of PM Factor Ratios ................................................................................. 15 1.4.3 PM Emission Calculations ....................................................................................... 15 1.4.4 PM Emission Results .............................................................................................. 17
1.5 EMISSION RELEASE POINT QA CHECKS .................................................................... 18
1.5.1 QA Checks and Gap-Filling for Location Coordinates ............................................. 18 1.5.2 QA Checks and Gap-Filling for Emission Release Parameters .............................. 19
1.6 STATE REVIEW OF INITIAL VERSION .......................................................................... 22
1.6.1 Alabama .................................................................................................................. 22 1.6.2 Alabama – Jefferson County ................................................................................... 22 1.6.3 Florida ..................................................................................................................... 22 1.6.4 Georgia .................................................................................................................... 23 1.6.5 Kentucky .................................................................................................................. 24 1.6.6 Kentucky – Jefferson County .................................................................................. 25 1.6.7 Mississippi ............................................................................................................... 25 1.6.8 North Carolina ......................................................................................................... 25 1.6.9 North Carolina – Buncombe County ........................................................................ 26 1.6.10 North Carolina – Forsyth County ......................................................................... 26
Appendix A - 5 Kentucky Regional Haze 5-Year Periodic Report SIP Revision, September 2014
Development of Point Source Emission Inventory for 2007 Southeastern States Air Resource Managers, Inc. AMEC Project No.: 6066-09-0326.02 January 18, 2012
ii AMEC
1.6.11 North Carolina – Mecklenburg County ................................................................ 26 1.6.12 South Carolina ..................................................................................................... 26 1.6.13 Tennessee ........................................................................................................... 27 1.6.14 Tennessee – Davidson County ........................................................................... 28 1.6.15 Tennessee – Hamilton County ............................................................................ 28 1.6.16 Tennessee – Knox County .................................................................................. 28 1.6.17 Tennessee – Shelby County ............................................................................... 28 1.6.18 Virginia ................................................................................................................ 28 1.6.19 West Virginia ....................................................................................................... 29
1.7 STAKEHOLDER REVIEW .............................................................................................. 29
1.7.1 Alabama .................................................................................................................. 29 1.7.2 Florida ..................................................................................................................... 29 1.7.3 Georgia .................................................................................................................... 30 1.7.4 Kentucky .................................................................................................................. 30 1.7.5 North Carolina ......................................................................................................... 30 1.7.6 Tennessee ............................................................................................................... 30
1.8 IDENTIFICATION OF EGU AND NONEGU POINT SOURCES ...................................... 30
1.9 FINAL S/L AGENCY QA REVIEW ................................................................................... 31
1.9.1 Kentucky .................................................................................................................. 32 1.9.2 North Carolina ......................................................................................................... 32 1.9.3 North Carolina – Forsyth County ............................................................................. 32 1.9.4 South Carolina ......................................................................................................... 32 1.9.5 Virginia .................................................................................................................... 32 1.9.6 West Virginia ........................................................................................................... 32
1.10 2007 POINT SOURCE EMISSION SUMMARY ........................................................... 70 1.11 DATA FILES ................................................................................................................ 79 1.12 REFERENCES ............................................................................................................ 80
List of Exhibits
Exhibit 1 – Summary of Initial Point Source Submittals Exhibit 2 – PM Compound Descriptions Exhibit 3 – PM Compounds Reported in Initial State Submittals Exhibit 4 – PM Cases and Steps Required to Augment PM Emissions Exhibit 5 – Comparison of PM Emissions from the Initial S/L Data Submittals and Version 1.1 of
the SEMAP 2007 Point Source Inventory Exhibit 6 – Stack Parameter Data Replacement Matrix Exhibit 7 – 2002 and 2007 Point Source CO Emissions by State Exhibit 8 – 2007 Point Source CO Emissions by Category Exhibit 9 – 2002 and 2007 Point Source NH3 Emissions by State Exhibit 10 – 2007 Point Source NH3 Emissions by Category Exhibit 11 – 2002 and 2007 Point Source NOx Emissions by State Exhibit 12 – 2007 Point Source NOx Emissions by Category Exhibit 13 – 2002 and 2007 Point Source PM10-PRI Emissions by State Exhibit 14 – 2007 Point Source PM10-PRI Emissions by Category Exhibit 15 – 2002 and 2007 Point Source PM25-PRI Emissions by State Exhibit 16 – 2007 Point Source PM25-PRI Emissions by Category
Appendix A - 6 Kentucky Regional Haze 5-Year Periodic Report SIP Revision, September 2014
Development of Point Source Emission Inventory for 2007 Southeastern States Air Resource Managers, Inc. AMEC Project No.: 6066-09-0326.02 January 18, 2012
iii AMEC
Exhibit 17 – 2002 and 2007 Point Source SO2 Emissions by State Exhibit 18 – 2007 Point Source SO2 Emissions by Category Exhibit 19 – 2002 and 2007 Point Source VOC Emissions by State Exhibit 20 – 2007 Point Source VOC Emissions by Category List of Acronyms and Abbreviations
Acronym Description AMEC AMEC Environment & Infrastructure, Inc. CAMD Clean Air Markets Division of EPA CAP Criteria Air Pollutant CEM Continuous Emission Monitoring System CE Control Equipment (NIF table) CERR Consolidated Emission Reporting Rule CO Carbon Monoxide EGU Electric Generating Unit EM Emission (NIF table) EP Emission Process (NIF table) EPA U.S. Environmental Protection Agency ER Emission Release (NIF table) EU Emission Unit (NIF table) LATLON Latitude / Longitude MANE-VU Mid-Atlantic/Northeast Visibility Union MARAMA Mid-Atlantic Regional Air Management Association NAAQS National Ambient Air Quality Standards NEI National Emission Inventory NH3 Ammonia NIF3.0 National Emission Inventory Input Format Version 3.0 nonEGU Non Electric Generating Unit NOx Oxides of Nitrogen PE Period (NIF table) PM Particulate Matter PM-CON Primary PM, Condensable portion only (all < 1 micron) PM-FIL Primary PM, Filterable portion only
PM-PRI Primary PM, includes filterables and condensables PM-PRI= PM-FIL + PM-CON
PM10-FIL Primary PM10, Filterable portion only
PM10-PRI Primary PM10, includes filterables and condensables, PM10- PRI = PM0-FIL + PM-CON
PM25-FIL Primary PM2.5, Filterable portion only
PM25-PRI Primary PM2.5, includes filterables and condensables PM25-PRI= PM25-FIL + PM-CON
QA Quality Assurance QAPP Quality Assurance Project Plan SCC Source Classification Code SEMAP Southeastern Modeling, Analysis, and Planning
Appendix A - 7 Kentucky Regional Haze 5-Year Periodic Report SIP Revision, September 2014
Development of Point Source Emission Inventory for 2007 Southeastern States Air Resource Managers, Inc. AMEC Project No.: 6066-09-0326.02 January 18, 2012
iv AMEC
Acronym Description SESARM Southeastern State Air Resource Managers, Inc. SMOKE Sparse Matrix Operator Kernel Emissions (modeling system) SI Site (NIF Table) SIC Standard Industrial Classification code SIP State Implementation Plan S/L State/Local
SO 2 Sulfur Dioxide
TR Transaction (NIF Table) TSD Technical Support Document UTM Universal TransMercator VISTAS Visibility Improvement State and Tribal Association of the Southeast VOC Volatile Organic Compounds
Appendix A - 8 Kentucky Regional Haze 5-Year Periodic Report SIP Revision, September 2014
Development of Point Source Emission Inventory for 2007 Southeastern States Air Resource Managers, Inc. AMEC Project No.: 6066-09-0326.02 January 18, 2012
1 AMEC
1.0 ANNUAL 2007 INVENTORY FOR POINT SOURCES
1.1 INTRODUCTION
In 2009, the Southeastern State Air Resource Managers, Inc. (SESARM) initiated a new Southeastern Modeling, Analysis, and Planning (SEMAP) project. The SEMAP project addresses the next phase of ozone, fine particle, and regional haze assessment obligations through funding from two grants awarded by the U.S. Environmental Protection Agency (EPA). This technical support document (TSD) explains the data sources, methods, and results for preparing the 2007 criteria air pollutant (CAP) and ammonia (NH3) emission inventory for point sources for the Southeastern U.S. The region includes Alabama, Florida, Georgia, Kentucky, Mississippi, North Carolina, South Carolina, Tennessee, Virginia, and West Virginia. In general, point sources in this inventory are sources classified as major sources under the Title V permitting program and sources required to submit hourly emissions data to EPA under various Clean Air Act programs. Some State and local agencies included smaller sources in the point source inventory. The inventory includes annual emissions for sulfur dioxide (SO
2), oxides of nitrogen (NOx), volatile organic compounds (VOC), carbon monoxide (CO), ammonia (NH3), and five components of particulate matter (PM). The inventory also includes particulate matter (PM) emissions, categorized as filterable, condensable, or total. Filterable emissions are generally considered to be the particles that are trapped by the glass fiber filter in the front half of a Reference Method 5 or Method 17 sampling train. Vapors and particles less than 0.3 microns pass through the filter. Condensable particulate matter is material that is emitted in the vapor state which later condenses to form homogeneous and/or heterogeneous aerosol particles. The PM species in the inventory are categorized as: all filterable and condensable particles with an aerodynamic diameter less than or equal to a nominal 10 and 2.5 micrometers (i.e., PM10-PRI and PM25-PRI); filterable particles with an aerodynamic diameter less than or equal to a nominal 10 and 2.5 micrometers (i.e., PM10-FIL and PM25-FIL); and condensable particles (PM-CON). Note that PM10-PRI equals the sum of PM10-FIL and PM-CON, and PM25-PRI equals the sum of PM25-FIL and PM-CON. The EPA has provided guidance on developing emission inventories to be used with models and other analyses for demonstrating attainment of air quality goals for ozone, fine particles, and regional haze (EPA 2005, EPA 2007). According to the EPA guidance, there are potentially two different base year emissions inventories. One is the base case inventory which represents the actual emissions for the meteorological period that is being modeled. This inventory is generally used for model performance evaluations. The second potential base year inventory is called the baseline inventory, which is generally used as the basis for projecting emissions to the future. The base case inventory may include day specific information (e.g. hourly continuous emission monitoring data for point sources) that USEPA considers not appropriate for using in future year projections. Therefore, the baseline inventory may need to replace the day specific emissions with average or “typical” emissions (for certain types of sources). However, while a “typical” EGU inventory was prepared and submitted to SEMAP for review and comment, it was never finalized. As a consequence, for the 2007 SEMAP point source inventory, the base case and baseline inventories are one in the same. As indicated above, a “typical” year inventory for EGU sources was prepared as part of the base year point source development effort. That inventory was provided to the states for review, but AMEC never received any comments back from that review. Thus the “typical” EGU inventory was never finalized or put into NIF format. The inventory contained 3-year average SO2, NOx, and heat input for each unit that reports data to CAMD.
Appendix A - 9 Kentucky Regional Haze 5-Year Periodic Report SIP Revision, September 2014
Development of Point Source Emission Inventory for 2007 Southeastern States Air Resource Managers, Inc. AMEC Project No.: 6066-09-0326.02 January 18, 2012
2 AMEC
The inventory went through several rounds of quality assurance (QA) reviews by State and local (S/L) agencies, as well as a review by stakeholders. Numerous corrections and improvements were made to the inventory. Updated versions of the inventory were released throughout the inventory development process to facilitate S/L agency and stakeholder review. The following summarizes the different versions of the inventory:
Version 1.1, released April 2010. S/L agency submittals were compiled into this initial version of the inventory, emissions for units reporting to EPA’s Clean Air Markets Division (CAMD) were analyzed, and the PM emissions were augmented to provide a complete set of PM species. Sections 1.2, 1.3, and 1.4 of this report describe the work done to prepare Version 1.1.
Version 1.2, not released. This version was used internally and included updates to stack parameters as described in Section 1.5 of this report.
Version 1.3, released May 18, 2010. This version contained the updates and corrections to the inventory specified by S/L agencies as described in Section 1.6. This version was released for Stakeholder review.
Version 1.4, not released. This version was used internally and included updates to classify units into electric generating units (EGUs) and nonEGUs according to the classification scheme discussed in Section 1.7. It also included updates and corrections based upon stakeholder review, as well as additional review by S/L agencies, as described in Section 1.8.
Version 1.5, released September 2, 2010. This version removed extraneous or incomplete information that was not needed for air quality modeling, such as emissions of hazardous air pollutants and emissions for non-annual averaging times. This version was provided to SEMAP for use in preparing emission density maps and bubble plots that were provided to S/L agencies for final QA of source locations and emission values.
Version 1.6, released October 20, 2010. This version included updates provided by S/L agencies after their review of the emission density maps and bubble plots.
Version 1.7, released December 7, 2010. This version included emission updates to two facilities in Kentucky and replaced geographic coordinates with latitude and longitude for all sources (in previous versions, the geographic coordinates were a mixture of latitude/longitude and UTM coordinates, depending on the agency).
Version 1.8, released January 26, 2001. This version included revisions to the documentation and data files to respond to comments from EPA Region 4 dated November 10, 2011. The main revision to the data files was to delete facilities in North Carolina that had permanently shutdown prior to 2007 but were inadvertently included in the 2007 inventory with non-zero emissions.
State-level emission summaries of the 2007 point source inventory, referred to as Version 1.10a are provided in Section 1.10. Final deliverables are described in Section 1.11.
1.2 INITIAL DATA SOURCES AND QA REVIEW
Version 1.1 of the 2007 point source inventory was developed using data submitted by State and local agencies in the region, as well as data from the CAMD hourly emission monitoring database. 1.2.1 State Submittals and Conversion into a NIF Database
Each S/L agency collects point source data according to EPA approved procedures that are included in each State’s point source emission inventory quality assurance project plan with accompanying
Appendix A - 10 Kentucky Regional Haze 5-Year Periodic Report SIP Revision, September 2014

Development of Point Source Emission Inventory for 2007 Southeastern States Air Resource Managers, Inc. AMEC Project No.: 6066-09-0326.02 January 18, 2012
3 AMEC
standard operating procedures. These plans and procedures are updated on a continuing basis and are available upon request. States were requested to submit 2007 data for those major sources that they would normally submit to EPA during the 3-year requirements of the Consolidated Emission Reporting Rule (CERR). Some S/L agencies were able to submit a complete set of data representing 2007. Other S/L agencies were only able to submit 2007 data for very large sources. In this case, inventories for other years were used to create a complete 2007 point source inventory. In a few other cases, the S/L agency submittal was supplemented with data from EPA’s 2005-based modeling platform (EPA 2009c). S/L agencies prepare point source emission inventory files in a variety of formats – some use the NEI Input Format (NIF) while others used different formats. Exhibit 1 summarizes the data sources and formats for the S/L agency point source submittals with additional explanatory notes provided in the following sections. As noted in Exhibit 1, a few S/L agencies provided emissions data for a year other than 2007. Georgia was the only State that requested that a linear projection from 2005/2008 to 2007 be made when both 2005 and 2008 were available. There result of this interpolation for Georgia showed that for sources where 2007 were not available, the emissions changed very little between 2005 and 2007. Other S/L agencies indicated that 2005, 2006, or 2008 emissions data should be considered representative of 2007 for modeling purposes. This recommendation appears to be reasonable, given the small amount of emissions associated with the facilities where 2007 were not available (i.e., 97 percent of the point source NOx emissions and 99 percent of the SO
2 emissions are 2007 data). It was decided that spending limited resources to obtain and apply appropriate growth factors to project these emissions from 2005/2006/2008 to 2007 would provide an almost unnoticeable improvement to the SEMAP 2007 inventory. Also note that some S/L agencies submitted many more facilities than were included in the 2002 VISTAS inventory, while others submitted fewer facilities. An explanation of the reason why the number of facilities differs between 2002 and 2007 is provided for each S/L agency in the following sub-sections. SESARM’s area source contractor has developed procedures to reconcile the point and area source inventories to both (1) ensure that emissions minor point sources that are included the point source inventory are not double counted in the area source inventory and (2) that emissions from minor point source sources that are not in the point source inventory are included in the area source inventory. After the each S/L submittal was formatted into a standard NIF database, AMEC Environment & Infrastructure, Inc. (AMEC) performed an initial review of the S/L inventories using EPA’s Basic Format and Content Checker tool (EPA 2004). The tool was used to verify the data was in the correct format, to check for referential integrity and duplicate record issues, and to check certain fields for proper valid codes and ranges. Only minor issues were identified and were resolved by AMEC without the need for assistance from the S/L agencies. Following this initial QA review, these individual inventory files were consolidated into a single data set. Additional QA activities identified in the Quality Assurance Project Plan (SESARM 2009) were carried out and documented in the remainder of this document.
Appendix A - 11 Kentucky Regional Haze 5-Year Periodic Report SIP Revision, September 2014
Development of Point Source Emission Inventory for 2007 Southeastern States Air Resource Managers, Inc. AMEC Project No.: 6066-09-0326.02 January 18, 2012
4 AMEC
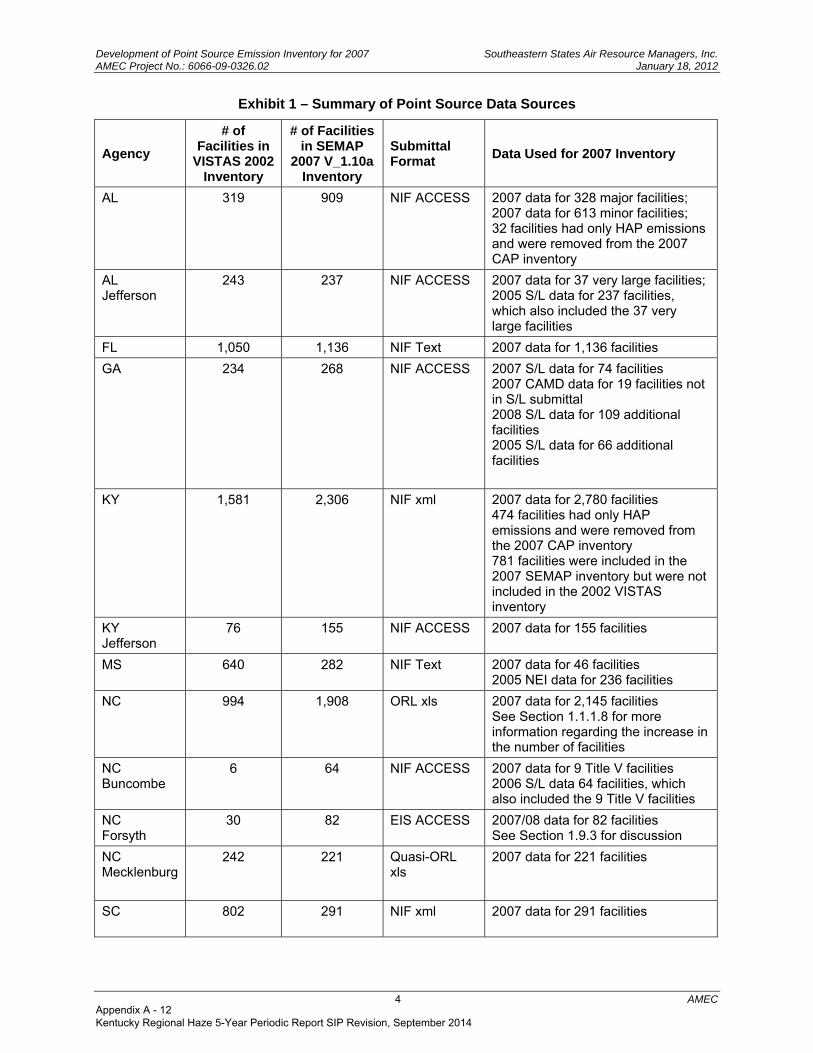
Exhibit 1 – Summary of Point Source Data Sources
Agency
# of Facilities in
VISTAS 2002 Inventory
# of Facilities in SEMAP
2007 V_1.10aInventory
Submittal Format
Data Used for 2007 Inventory
AL 319 909 NIF ACCESS 2007 data for 328 major facilities; 2007 data for 613 minor facilities; 32 facilities had only HAP emissions and were removed from the 2007 CAP inventory
AL Jefferson
243 237 NIF ACCESS 2007 data for 37 very large facilities; 2005 S/L data for 237 facilities, which also included the 37 very large facilities
FL 1,050 1,136 NIF Text 2007 data for 1,136 facilities
GA 234 268 NIF ACCESS 2007 S/L data for 74 facilities 2007 CAMD data for 19 facilities not in S/L submittal 2008 S/L data for 109 additional facilities 2005 S/L data for 66 additional facilities
KY 1,581 2,306 NIF xml 2007 data for 2,780 facilities 474 facilities had only HAP emissions and were removed from the 2007 CAP inventory 781 facilities were included in the 2007 SEMAP inventory but were not included in the 2002 VISTAS inventory
KY Jefferson
76 155 NIF ACCESS 2007 data for 155 facilities
MS 640 282 NIF Text 2007 data for 46 facilities 2005 NEI data for 236 facilities
NC 994 1,908 ORL xls 2007 data for 2,145 facilities See Section 1.1.1.8 for more information regarding the increase in the number of facilities
NC Buncombe
6 64 NIF ACCESS 2007 data for 9 Title V facilities 2006 S/L data 64 facilities, which also included the 9 Title V facilities
NC Forsyth
30 82 EIS ACCESS 2007/08 data for 82 facilities See Section 1.9.3 for discussion
NC Mecklenburg
242 221 Quasi-ORL xls
2007 data for 221 facilities
SC
802 291 NIF xml 2007 data for 291 facilities
Appendix A - 12 Kentucky Regional Haze 5-Year Periodic Report SIP Revision, September 2014

Development of Point Source Emission Inventory for 2007 Southeastern States Air Resource Managers, Inc. AMEC Project No.: 6066-09-0326.02 January 18, 2012
5 AMEC
Agency
# of Facilities in
VISTAS 2002 Inventory
# of Facilities in SEMAP
2007 V_1.10aInventory
Submittal Format
Data Used for 2007 Inventory
TN 373 232 NIF xls 2007 data for 166 Type A and other facilities 2005 NEI data for 66 facilities
TN Davidson
201 205 NIF Text 2007 data for 205 facilities
TN Hamilton
220 177 Quasi-ORL xls
2007 data for 177 facilities
TN Knox
11 8 NIF ACCESS 2007 data for 8 facilities
TN Shelby
35 29 NIF xls 2008 S/L data for 29 facilities
VA
762 801 NIF ACCESS 2007 data for 801 facilities
WV
192 177 NIF ACCESS 2007 data for 177 facilities
1.2.1.1 Alabama Alabama’s initial submittal contained two National Emission Inventory (NEI) Input Format (NIF) ACCESS database files. The first contained 2007 emissions data for 328 major sources, while the second contained 2007 emission data for 613 minor sources. AMEC merged the major source file with the minor source found and identified 10 facilities that were in both files. We used the data from the 2007 major source file and deleted the data from the minor source file to ensure that there was no double counting of emissions for these 10 facilities. Alabama ensured that the minor source emissions that were included in the point source file were not double counted in the area source file. Another contractor reconciled the point and area source inventories and Alabama reviewed the results on a per category basis to ensure that double counting did not occur. There were numerous records flagged for out-of-range values for stack parameters or location coordinates, or inconsistencies between the flow rate and velocity. These cases are discussed later in this document. A large increase in VOC and PM emissions from 2002 to 2007 was identified. Alabama investigated this problem and identified a serious problem in their data conversion process. New Emission (EM) and Control Equipment (CE) tables were provided in May 2010 to correct this problem. 1.2.1.2 Alabama – Jefferson County Jefferson County submitted two NIF ACCESS database files. The first contained 2007 emissions data for 37 very large sources, while the second contained 2005 emission data for 237 sources. AMEC merged the 2007 very large source file with the 2005 file and identified that the 37 very large facilities were in both files. We used the data from the 2007 file and deleted the corresponding facilities from the 2005 file to ensure no double counting of emissions. AMEC did not project 2005 emission data to 2007, as the 2005 data was considered to be representative of 2007. Jefferson County submitted emissions data for a large number of hazardous air pollutants. Since these pollutants are not needed for regional ozone and fine particle modeling, they were stripped from the EM and CE tables.
Appendix A - 13 Kentucky Regional Haze 5-Year Periodic Report SIP Revision, September 2014
Development of Point Source Emission Inventory for 2007 Southeastern States Air Resource Managers, Inc. AMEC Project No.: 6066-09-0326.02 January 18, 2012
6 AMEC
The EPA’s Basic Format and Content Checker identified several relational widow/orphan issues. These were caused by the Emission Unit ID and Emission Release Point ID being reversed in the EP table for some records. AMEC made the necessary corrections to the NIF EP table to ensure that all NIF EM records had a match in the NIF Emission Unit (EU), Emission Process (EP), and EM tables. The flow rates provided in the NIF Emission Release (ER) table were reported in cubic feet per minute. The NIF specifications require that this field be reported in cubic feet per second. AMEC recalculated the flow rate by dividing the flow rate provided by Jefferson County by 60. 1.2.1.3 Florida Florida submitted NIF tables in ASCII text format with 2007 emissions data for 1,139 facilities. There were numerous records flagged for out-of-range values for stack parameters or location coordinates, or inconsistencies between the flow rate and velocity by the EPA’s Basic Format and Content Checker. These cases are discussed later in Section 1.5 of this document. Otherwise the data passed all of the QA checks. 1.2.1.4 Georgia Georgia submitted three NIF ACCESS database files. The first contained 2007 emissions data for 74 very large sources. The second file contained 2008 emission data for 109 additional facilities. And the third file contained 2005 data for 69 additional facilities. AMEC merged the three files using the 2007 data when available, the 2008 data where 2007 data were not available, and 2005 data as a last resort. We used the data from the 2007 file and deleted the corresponding facilities from the 2008/2005 files to ensure no double counting of emissions. No significant issues were identified by EPA’s Basic Format and Content Checker. No projecting of 2005 emissions to 2007 or back casting of 2008 emissions to 2007 was done during the initial processing of the submittals. See Section 1.6.4 for a discussion of how 2007 emissions were subsequently estimated for the final SEMAP inventory when only 2005 or 2008 data were available. 1.2.1.5 Kentucky Kentucky submitted an xml file that was loaded into an ACCESS database with NIF tables with 2007 emissions data for 2,780 facilities. There were approximately 474 facilities in Kentucky’s submittal that had only HAP emissions (i.e., emissions were zero for all criteria air pollutants at the facility) and were removed from the 2007 inventory. An additional 781 facilities were included in the 2007 SEMAP inventory but were not included in the 2002 VISTAS inventory. These additional facilities in the 2007 SEMAP inventory were generally very small sources, and the aggregate NOx emissions from these 781 small facilities totaled only 805 tons per year. The EPA’s Basic Format and Content Checker identified several relational widow issues, that is, there were SI, ER, EU, EP, PE and CE records with no corresponding emissions data in the EM file. These widow records were removed from the SI, ER, EU, EP, PE, and CE tables. The flow rates provided in the ER table were reported in cubic feet per minute. The NIF specifications require that this field be reported in cubic feet per second. AMEC recalculated the flow rate by dividing the flow rate provided by Kentucky by 60. There were numerous records flagged for out-of-range values for stack parameters or location coordinates, or inconsistencies between the flow rate and velocity by the EPA’s Basic Format and Content Checker. These cases are discussed later in Section 1.5 of this document. 1.2.1.6 Kentucky – Jefferson County Jefferson County submitted two NIF ACCESS databases containing 2007 emissions data – one file contained criteria air pollutants and the other file contained hazardous air pollutants. Only the
Appendix A - 14 Kentucky Regional Haze 5-Year Periodic Report SIP Revision, September 2014
Development of Point Source Emission Inventory for 2007 Southeastern States Air Resource Managers, Inc. AMEC Project No.: 6066-09-0326.02 January 18, 2012
7 AMEC
criteria air pollutant file was processed. Jefferson County’s submittal passed all of checks made by the EPA’s Basic Format and Content Checker. 1.2.1.7 Mississippi Mississippi submitted NIF tables in ASCII text format with 2007 emissions data for 45 facilities. Mississippi’s submittal passed all of checks made by the EPA’s Basic Format and Content Checker. Mississippi’s 2007 submittal was supplemented with data from EPA’s 2005-based modeling platform (EPA 2009c). The data were provided in SMOKE ORL format, converted into a NIF database, and merged with Mississippi’s submittal. We used the data from Mississippi’s 2007 file and deleted the corresponding facilities from the 2005 EPA file to ensure no double counting of emissions. Mississippi decided to include 236 facilities from the 2005 NEI from the 2007 SEMAP inventory. At this time, AMEC did not perform any projecting of 2005 data to 2007. No significant issues were identified by EPA’s Basic Format and Content Checker. 1.2.1.8 North Carolina North Carolina submitted a SMOKE one-record-per-line (ORL) file with 2007 data for 2,145 facilities. AMEC converted the ORL file to a NIF database. There was no control information in the ORL file, so we were not able to create a NIF CE table. There were numerous records flagged for out-of-range values for stack parameters or location coordinates, or inconsistencies between the flow rate and velocity by the EPA’s Basic Format and Content Checker. These cases are discussed later in Section 1.5 of this document. Otherwise the data passed all of the QA checks. A large increase in VOC emissions from 2002 to 2007 was identified. North Carolina investigated this problem and identified a serious problem in their data conversion process. New EM and CE tables were provided in May 2010 to correct this problem. The 2007 SEMAP inventory contains many more sources than were included in the 2002 VISTAS inventory. There are three reasons to explain the large increase in the number of facilities in the 2007 inventory versus the 2002 inventory:
There are some new permit sources added since 2002;
There were about 163 facilities in NC’s initial submittal that were permanently closed between 2002 and 2006 that were inadvertently left in the 2007 inventory with non-zero emissions. These facilities were removed from the 2007 SEMAP inventory; and
Most the new facilities in 2007 are due to the following reason: 2002 was the year NC changed the emission reporting system. From 1993 to 2002, all non-title V sources reported their emission once every three years (1993, 1996, 1999, and 2002). Since 2002, NC changed the emission reporting system from once every three years to once every five year and each facility reports their emission the year their permit expired. So the 2007 point source emission inventory is much more inclusive compared to 2002 emission inventory, which only included the facilities reported during the year of 2002, not all facilities that operated in 2002.
1.2.1.9 North Carolina – Buncombe County Buncombe County submitted two NIF ACCESS database files. The first contained 2007 emissions data for 9 Title V facilities, while the second contained 2006 emission data for 65 facilities. AMEC merged the 2007 Title V source file with the 2006 file and verified that the 9 Title V facilities were in both files. We used the data from the 2007 file for the Title V facilities and deleted the corresponding facilities from the 2006 file to ensure no double counting of emissions. We also deleted all records
Appendix A - 15 Kentucky Regional Haze 5-Year Periodic Report SIP Revision, September 2014
Development of Point Source Emission Inventory for 2007 Southeastern States Air Resource Managers, Inc. AMEC Project No.: 6066-09-0326.02 January 18, 2012
8 AMEC
for Snider Tire (Facility ID 0861) which ceased operation in 2006 and did not operate in 2007. AMEC did not project the 2006 emissions to 2007, as the 2006 emissions are considered to be representative of 2007. There were several records flagged for out-of-range values for stack parameters or location coordinates, or inconsistencies between the flow rate and velocity by the EPA’s Basic Format and Content Checker. These cases are discussed later in Section 1.5 of this document. Otherwise the data passed all of the QA checks. 1.2.1.10 North Carolina – Forsyth County Forsyth County provided 2008 data for 84 facilities in an EIS-formatted ACCESS database. The data is actually a mix of 2008, 2007 and previous year data, but Forsyth County indicated that the submittal is representative of calendar year 2007. AMEC performed data reformatting a number of data augmentation steps to create reasonably complete NIF tables, as follows:
SI Table – relevant fields from the “FacilitySite” ACCESS table were mapped to NIF SI table fields.
ER Table – relevant fields from the “ReleasePoint” ACCESS table were mapped to NIF ER table fields. The flow rate in the “Release Point” table was in cubic feet per minute. The NIF specifications require that this field be reported in cubic feet per second. AMEC recalculated the flow rate by dividing the flow rate provided by 60. There were no stack-level geographic coordinates in the “ReleasePoint GeographicCoordinates” ACCESS table. However, there were facility-level coordinates for some facilities in the “FacilitySiteGeographicCoordinates” ACCESS table, and these were used for all emission release points associated with the facility. Where a facility match could not be made, we substituted the county centroid for the geographic coordinates (longitude -80.24, latitude 36.114).
EU Table – relevant fields from the “EmissionUnit” ACCESS table were mapped to NIF EU table fields.
EP Table – relevant fields from the “EmissionProcess” ACCESS table were mapped to NIF EP table fields. The emission release point identifier was obtained from the “ReleasePointApportionment” ACCESS table.
PE Table – relevant fields from the “EmissionProcess” ACCESS table were mapped to NIF PE table fields.
CE Table – no information on control equipment was provided.
EM Table – relevant fields from the “Emissions” ACCESS table were mapped to NIF ER table fields. The emission release point identifier was obtained from the “ReleasePointApportionment” ACCESS table.
There were several records flagged for out-of-range values for stack parameters or location coordinates, or inconsistencies between the flow rate and velocity by the EPA’s Basic Format and Content Checker. These cases are discussed later in Section 1.5 of this document. Otherwise the data passed all of the QA checks. 1.2.1.11 North Carolina – Mecklenburg County Mecklenburg County provided 2007 emissions data for 539 facilities in a spreadsheet that contained a limited number of NIF fields. AMEC performed data reformatting and a number of data augmentation steps to create reasonably complete NIF tables, as follows:
Appendix A - 16 Kentucky Regional Haze 5-Year Periodic Report SIP Revision, September 2014
Development of Point Source Emission Inventory for 2007 Southeastern States Air Resource Managers, Inc. AMEC Project No.: 6066-09-0326.02 January 18, 2012
9 AMEC
SI Table – only the facility id# and facility name were provided; we obtained the SIC code from the VISTAS 2002 B&F inventory where we were able to match facilities.
ER Table – the submittal did not contain any stack parameters and the geographic coordinates were in NC State Planar coordinates, not UTM coordinates or latitude/longitude as required by the NIF specification. To fill in the geographic coordinates, we obtained the latitude and longitude from the VISTAS 2002 B&F inventory where we were able to match facilities. Where a facility match could not be made, we substituted the county centroid for the geographic coordinates (longitude -80.789, latitude 35.252). Stack parameters for the Stage I gasoline distribution facilities were assigned a fugitive release height of 10 feet. Stack parameters for all other sources will be filled in according to the gap-filling procedures discussed later in Section 1.5 of this document.
EU Table – the submittal only contained the unit description, all other EU non-key data elements were left blank.
EP Table – the submittal only contained SCC and the process description, all other EP non-key data elements were left blank.
PE Table – we filled in the PE table with the PE key identifiers, and added the startdate of 20070101 and end date of 20071231. All other PE non-key data elements were left blank.
CE Table – no control information was provided, so the CE table is blank.
EM Table – the submittal contained annual emissions for all criteria air pollutants and ammonia.
After reformatting the spreadsheet into NIF tables, we ran the EPA’s Basic Format and Content Checker and did not detect any QA issues other than the missing stack parameters. Mecklenburg County initially included 319 Stage I gasoline stations in the point source inventory. For consistency with other counties in North Carolina (where Stage I emissions are included in the area source inventory) and to avoid double counting, these gasoline stations were removed from the point source inventory. 1.2.1.12 South Carolina South Carolina submitted an xml file that was loaded into an ACCESS database with NIF tables with 2007 emissions data for 293 facilities. The EPA’s Basic Format and Content Checker identified that certain EM records associated with facility ID 2320-0034 (NAN YA Plastics) were assigned to FIPS 45041 (Florence County) while other NIF records associated with this plant were associated with FIPS 45089 (Williamsburg County). AMEC changed the FIPS to 45089 for the records in the EM table to resolve this orphan issue. Geographic coordinates in the ER table were not changed. The flow rates provided in the ER table were reported in cubic feet per minute. The NIF specifications require that this field be reported in cubic feet per second. AMEC recalculated the flow rate by dividing the flow rate provided by South Carolina by 60. South Carolina’s 2007 submittal included many fewer facilities than were in the VISTAS 2002 inventory. South Carolina reviewed data from EPA’s 2005-based modeling platform. South Carolina decided that the sources that were included in the 2002 but not in the 2007 inventory were predominantly minor sources, and that the use of EPA’s 2005 NEI data was not appropriate for use in the 2007 SEMAP inventory.
Appendix A - 17 Kentucky Regional Haze 5-Year Periodic Report SIP Revision, September 2014

Development of Point Source Emission Inventory for 2007 Southeastern States Air Resource Managers, Inc. AMEC Project No.: 6066-09-0326.02 January 18, 2012
10 AMEC
1.2.1.13 Tennessee Tennessee submitted two spreadsheets with NIF tables for all counties except the four local program counties. The first file contained 2007 emissions data for 45 very large sources (i.e., Type A sources), while the second contained 2007 emission data for additional smaller facilities. AMEC merged the two files and checked for duplicate facilities. One facility – JW Aluminum (Facility ID 47113-0010) – was found in both submittals. Only the Type A submittal for this facility was used to avoid double counting of emissions. Tennessee submitted emissions data for a large number of hazardous air pollutants. Since these pollutants are not needed for regional ozone and fine particle modeling, they were stripped from the EM and CE tables. The EPA’s Basic Format and Content Checker identified several relational widow/orphan issues. AMEC made the necessary corrections to the NIF tables to ensure that all EM records had a match in the EU, EP, PE and EM tables. Tennessee’s 2007 submittals were supplemented with data from EPA’s 2005-based modeling platform. These data were downloaded from EPA’s ftp site (file name: 2005v4CAPHAP_orl_point.zip). The data were provided in SMOKE ORL format, converted into a NIF database, and merged with Tennessee’s submittal. We used the data from Tennessee’s 2007 files and deleted the corresponding facilities from the 2005 EPA file to ensure no double counting of emissions. At this time, AMEC did not perform any projecting of 2005 data to 2007. No significant issues were identified by EPA’s Basic Format and Content Checker. An additional 280 facilities were added during this augmentation process. 1.2.1.14 Tennessee – Davidson County Davidson County submitted NIF tables in ASCII text format with 2007 emissions data for 205 facilities. There were numerous records flagged for out-of-range values for stack parameters or location coordinates, or inconsistencies between the flow rate and velocity by the EPA’s Basic Format and Content Checker. These cases are discussed later in Section 1.5 of this document. Otherwise the data passed all of the QA checks. 1.2.1.15 Tennessee – Hamilton County Hamilton County provided data representative of 2007 for 177 facilities in a spreadsheet that contained the NIF fields needed for regional air quality modeling. AMEC performed data reformatting to create reasonably complete NIF tables. The data passed all of the QA checks. 1.2.1.16 Tennessee – Knox County Knox County submitted a NIF ACCESS database containing 2007 emissions data for 9 facilities. There were a few records flagged for out-of-range values for stack parameters or location coordinates, or inconsistencies between the flow rate and velocity by the EPA’s Basic Format and Content Checker. These cases are discussed later in Section 1.5 of this document. Otherwise the data passed all of the QA checks. 1.2.1.17 Tennessee – Shelby County Shelby County submitted a spreadsheet with NIF tables for 29 facilities with 2008 emissions data. The 2008 was considered representative of 2007 for all sources except the TVA Allen Plant (Facility ID 47157-00528), for which we used the 2007 annual SO
2 and NOx emissions as reported in EPA’s CAMD database. Shelby County submitted emissions data for a large number of hazardous air pollutants. Since these pollutants are not needed for regional ozone and fine particle modeling, they were stripped from the EM and CE tables.
Appendix A - 18 Kentucky Regional Haze 5-Year Periodic Report SIP Revision, September 2014
Development of Point Source Emission Inventory for 2007 Southeastern States Air Resource Managers, Inc. AMEC Project No.: 6066-09-0326.02 January 18, 2012
11 AMEC
The EPA’s Basic Format and Content Checker identified several relational widow/orphan issues. AMEC made the necessary corrections to the NIF tables to ensure that all EM records had a match in the EU, EP, PE and EM tables. 1.2.1.18 Virginia Virginia submitted a NIF ACCESS database containing 2007 emissions data for 801 facilities. Since Virginia is participating with MARAMA in developing a regional modeling inventory for the northeastern States, Virginia’s data has already undergone considerable QA review and updating. As part of the MARAMA inventory development process, Virginia provided emissions data for a number of additional distributed generation units. Virginia’s submittal to MARAMA was subjected to the QA and PM augmentation procedures described in this report. Virginia has accepted the MARAMA 2007 point source inventory for use in the SEMAP 2007 point source modeling inventory. 1.2.1.19 West Virginia West Virginia submitted a NIF ACCESS database containing 2007 emissions data for 177 facilities. West Virginia’s submittal passed all of checks made by the EPA’s Basic Format and Content Checker with the exception of some of the stack parameter values. There were numerous records flagged for out-of-range values for stack parameters or location coordinates, or inconsistencies between the flow rate and velocity by the EPA’s Basic Format and Content Checker. These cases are discussed later in Section 1.5 of this document.
1.3 EPA CAMD HOURLY EMISSION DATA
The second source of data was the hourly emission data reported to EPA by facilities to comply with various provisions of the Clean Air Act. AMEC downloaded the 2007 CAMD annual inventory containing NOx and SO
2 emissions, heat input data and other information from the CAMD web site (EPA 2009a). AMEC prepared an initial crosswalk file to match facilities and units in the CAMD inventory to facilities and units in the 2007 SEMAP inventory. In the CAMD inventory, the Office of Regulatory Information Systems (ORIS) identification (ID) code identifies unique facilities and the unit ID identifies unique boilers and internal combustion engines (i.e., turbines and reciprocating engines). AMEC also downloaded the 2007 CAMD hourly inventory containing hourly NOx and SO
2 emissions and heat input data from the CAMD website (EPA 2009b). AMEC summed the hourly emissions to the annual level (or 6-month level for 6-month reporting units) by emission unit. The summed hourly data was compared to the annual summary data, which matched in virtually all case. This check was made because SEMAP is considering using the actual 2007 hourly data rather than average temporal profiles in the next round of regional air quality modeling. As a starting point for developing the CAMD-to-NIF crosswalk, AMEC obtained and used the CAMD-to-NIF crosswalk that was developed for the VISTAS Best & Final inventory (VISTAS, 2007). This file was useful for matching many facilities and units. However, in many other cases either the CAMD unit identifier changed or the facility and unit identifiers in the S/L database changed. For example, the facility IDs in West Virginia’s 2002 VISTAS database were a 4-digit field, while the facility IDs in the 2007 SEMAP inventory are a 5-digit field. In Kentucky, the facility IDs in the 2002 VISTAS database consisted of the five-digit FIPS code followed by a 5-digit facility ID, while the facility IDs in the 2007 SEMAP inventory consisted of only the 5-digit facility ID. In North Carolina, nearly all unit IDs changed between 2002 and 2007. AMEC prepared an Excel Workbook file for each S/L agency with linkages between the CAMD identifiers and the S/L agency identifiers and a comparison between the CAMD annual summary
Appendix A - 19 Kentucky Regional Haze 5-Year Periodic Report SIP Revision, September 2014
Development of Point Source Emission Inventory for 2007 Southeastern States Air Resource Managers, Inc. AMEC Project No.: 6066-09-0326.02 January 18, 2012
12 AMEC
emissions, the annual emissions summed from the hourly CAMD database, and annual emissions reported in the S/L inventory. This spreadsheet matched the CAMD unit-level IDs (ORISID and UNITID) with corresponding NIF table IDs (FIPS, SITE ID, EU ID, EP ID, ER ID). Emissions were shown as obtained from (1) the CAMD unit level file, (2) the sum of the CAMD hourly emission file, and (3) the State submitted NIF tables. Note that the CAMD Emissions are reported at the unit level while the NIF emissions are reported at the Unit/Process/Stack level. AMEC added three fields to the NIF EP table to facilitate the linkage to the CAMD database. We added fields to store the CAMD ORISID, CAMD Unit ID, and CAMD number of reporting months. AMEC prepared a CAMD-to-NIF crosswalk spreadsheet for each State. S/L agencies were asked to review this list and verify that (1) the linkages are correct, (2) there are no large sources missing from the CAMD-to-NIF crosswalk, and (3) there are not any large discrepancies between the emissions reported to CAMD and the emissions reported in the SEMAP database. There are three types of possible linkages:
CAMD facility has no match in NIF SI facility table. The emissions from these facilities reported to CAMD are small, and initially accounted for about 0.5% of the NOx and 0.07% of the SO
2 emissions in the CAMD database.
CAMD unit could not be matched in NIF. The emissions from these facilities reported to CAMD were small, accounting for about 0.9% of the NOx and 0.007% of the SO
2 emissions in the CAMD database. Most of the units that could not be matched at the unit level are either peaking units or industrial sources such as paper mills or chemical plants. In addition, there were several instances where multiple CAMD units match to a single NIF record (i.e., units are grouped in the NIF tables but reported individually in the CAMD database).
CAMD unit matches with a single NIF record or CAMD unit matches with multiple NIF records (in many cases, the NIF tables include multiple records for different fuel types). The emissions from these units reported to CAMD account for about 98.6% of the NOx and 99.9% of the SO
2 emissions in the CAMD database. In most cases the sum of the emissions from the matching NIF records are generally very close to the CAMD unit level emissions; and S/L agencies verified that linkages were correct.
As another QA check, AMEC compiled a list of sources with EGU SCCs of 1-01-xxx-xx and 2-01-xxx-xx in the S/L agency NIF tables that could not be linked to the CAMD CEM table to help resolve some of the linkage issues noted above. S/L agencies made significant efforts to improve the crosswalk between the CAMD identifiers and the S/L agency identifiers.
1.4 PM AUGMENTATION
PM compounds may be reported in several forms, as identified in Exhibit 2. Exhibit 3 provides a count of the number of annual NIF EM table records in each agency’s NIF Submittal by type of PM compound. The PM augmentations process gap-fills missing PM pollutant complements. We generated emission estimates for filterable and primary PM-2.5, filterable and primary PM-10 and condensable PM if emission estimates for those species were missing from the S/L agency submittal .For example, if a S/L agency provided only PM10-PRI emissions, the PM augmentation process filled in estimates for PM-CON, PM10-FIL, PM25-PRI, and PM25-FIL. The PM augmentation process is essentially the same process used in developing the 2002 VISTAS Best and Final inventory and is virtually identical to the EPA methodology used for the 2002 NEI (EPA 2006a). The steps in the PM augmentation process were as follows:
Appendix A - 20 Kentucky Regional Haze 5-Year Periodic Report SIP Revision, September 2014
Development of Point Source Emission Inventory for 2007 Southeastern States Air Resource Managers, Inc. AMEC Project No.: 6066-09-0326.02 January 18, 2012
13 AMEC
Step 1: Initial QA and remediation of S/L provided PM pollutants;
Step 2: Updating of PM factor ratios previously developed for MARAMA based on factors from the Factor Information and Retrieval Data System and the EPA PM Calculator;
Step 3: Implementation of the ratios developed in step 2;
Step 4: Presentation of PM augmentation results to S/L agencies for review and comment; and
Step 5: Updates to augmented values in cases where the S/L agency was able to obtain source-specific data.
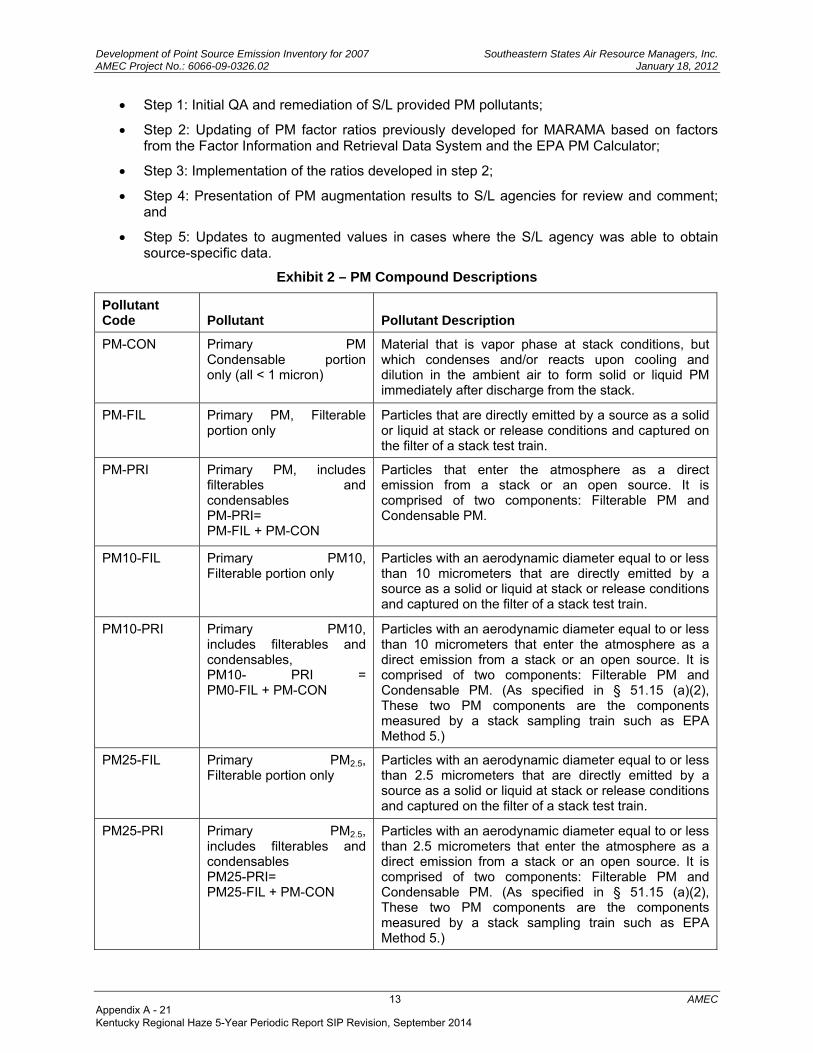
Exhibit 2 – PM Compound Descriptions
Pollutant Code Pollutant Pollutant Description
PM-CON Primary PMCondensable portiononly (all < 1 micron)
Material that is vapor phase at stack conditions, but which condenses and/or reacts upon cooling and dilution in the ambient air to form solid or liquid PM immediately after discharge from the stack.
PM-FIL Primary PM, Filterableportion only
Particles that are directly emitted by a source as a solid or liquid at stack or release conditions and captured on the filter of a stack test train.
PM-PRI Primary PM, includesfilterables andcondensables PM-PRI= PM-FIL + PM-CON
Particles that enter the atmosphere as a direct emission from a stack or an open source. It is comprised of two components: Filterable PM and Condensable PM.
PM10-FIL Primary PM10,Filterable portion only
Particles with an aerodynamic diameter equal to or less than 10 micrometers that are directly emitted by a source as a solid or liquid at stack or release conditions and captured on the filter of a stack test train.
PM10-PRI Primary PM10,includes filterables andcondensables, PM10- PRI =PM0-FIL + PM-CON
Particles with an aerodynamic diameter equal to or less than 10 micrometers that enter the atmosphere as a direct emission from a stack or an open source. It is comprised of two components: Filterable PM and Condensable PM. (As specified in § 51.15 (a)(2), These two PM components are the components measured by a stack sampling train such as EPA Method 5.)
PM25-FIL Primary PM2.5,Filterable portion only
Particles with an aerodynamic diameter equal to or less than 2.5 micrometers that are directly emitted by a source as a solid or liquid at stack or release conditions and captured on the filter of a stack test train.
PM25-PRI Primary PM2.5,includes filterables andcondensables PM25-PRI= PM25-FIL + PM-CON
Particles with an aerodynamic diameter equal to or less than 2.5 micrometers that enter the atmosphere as a direct emission from a stack or an open source. It is comprised of two components: Filterable PM and Condensable PM. (As specified in § 51.15 (a)(2), These two PM components are the components measured by a stack sampling train such as EPA Method 5.)
Appendix A - 21 Kentucky Regional Haze 5-Year Periodic Report SIP Revision, September 2014

Development of Point Source Emission Inventory for 2007 Southeastern States Air Resource Managers, Inc. AMEC Project No.: 6066-09-0326.02 January 18, 2012
14 AMEC
Exhibit 3 – PM Compounds Reported in Initial State Submittals
Number of Annual EM Records in S/L Agency’s Initial NIF Submittal
Agency PM- CON
PM- FIL
PM- PRI
PM10- FIL
PM10- PRI
PM25- FIL
PM25- PRI
AL 0 4,748 0 2,918 0 2,035 0
AL Jefferson 0 318 0 631 0 626 0
FL 0 3,576 0 3,672 0 0 0
GA 0 137 2,912 0 1,869 0 1,285
KY 0 0 29,856 0 29,859 0 99
KY Jefferson 20 0 222 20 222 20 214
MS1 413 56 3,073 429 3,251 429 3,251
NC 0 0 0 0 9,120 0 5,800
NC Buncombe 26 40 63 40 63 40 58
NC Forsyth 12 4 408 23 381 5 210
NC Mecklenburg 0 0 0 0 613 0 309
SC1 1,241 409 6,645 1,439 5,992 1,422 4,224
TN1 2,274 3,175 1,258 2,811 2,560 2,641 2,441
TN Davidson 0 0 0 0 775 0 649
TN Hamilton 0 0 394 0 279 0 332
TN Knox 0 0 0 0 15 0 1
TN Shelby 57 189 79 70 279 63 99
VA2 5,238 0 0 5,238 5,241 5,238 5,241
WV 167 2,138 802 1,814 737 1,586 691
1) Includes PM records from EPA’s 2005-based modeling inventory, which have already been augmented by EPA
2) Virginia’s PM augmentation was previously performed using an identical augmentation process during the development of the 2007 regional emission inventory for the Northeast/Mid-Atlantic States
1.4.1 Initial QA and Remediation of PM Pollutants
Prior to executing the PM augmentation process, we first reviewed the data for inconsistencies. If values are found to be inconsistent, they were replaced. The consistency checks and replacement actions are as follows:
1. If PM10-PRI >0 and PM25-PRI > PM10-PRI (and PM10-FIL, PM25-FIL and PM-CON are null or 0), then set PM25-PRI = PM10-PRI.
2. If PM10-FIL > 0 and PM25-FIL > PM10-FIL (and PM10-PRI, PM25-PRI and PM-CON are null or 0), then set PM25-FIL = PM10-FIL.
3. If PM10-PRI >0 and PM10-FIL > PM10-PRI (and PM25-PRI, PM25-FIL and PM-CON are null or 0), then set PM10-FIL = PM10-PRI.
Appendix A - 22 Kentucky Regional Haze 5-Year Periodic Report SIP Revision, September 2014

Development of Point Source Emission Inventory for 2007 Southeastern States Air Resource Managers, Inc. AMEC Project No.: 6066-09-0326.02 January 18, 2012
15 AMEC
4. If PM25-PRI > 0 and PM25-FIL > PM25-PRI (and PM10-PRI, PM10-FIL and PM-CON are null or 0), then set PM25-FIL = PM25-PRI.
The consistency checks revealed very few occurrences of inconsistencies, and when inconsistencies did occur, the emission values were very small. As a result, S/L agencies were not asked to review this information and provide corrections because the inconsistencies did not involve significant emission sources. The replacement actions above were appropriate for an inventory used for regional air quality modeling. 1.4.2 Updating of PM Factor Ratios
The augmentation steps require the use of ratios developed from available emissions and particle size distribution data. These ratios are needed when only one PM term is available, and two or more terms need to be augmented. Examples of how we used the PM ratios are shown below:
PM-FIL × RatioCON/FIL = PM-CON
PM-PRI × RatioCON/PRI = PM-CON
PM-CON × RatioFIL/CON = PM-FIL
PM-CON × RatioPRI/CON = PM-PRI
A table of PM compound ratios was developed utilizing the table developed for the MANE-VU 2002 inventory (MARAMA, 2006). This table is keyed by SCC, primary control device, and secondary control device and provides the ratios listed in the above equations. We updated this table to include SCC, primary control device, and secondary control device codes found in the 2007 SEMAP inventory that were not contained in the 2002 MANE-VU inventory. 1.4.3 PM Emission Calculations
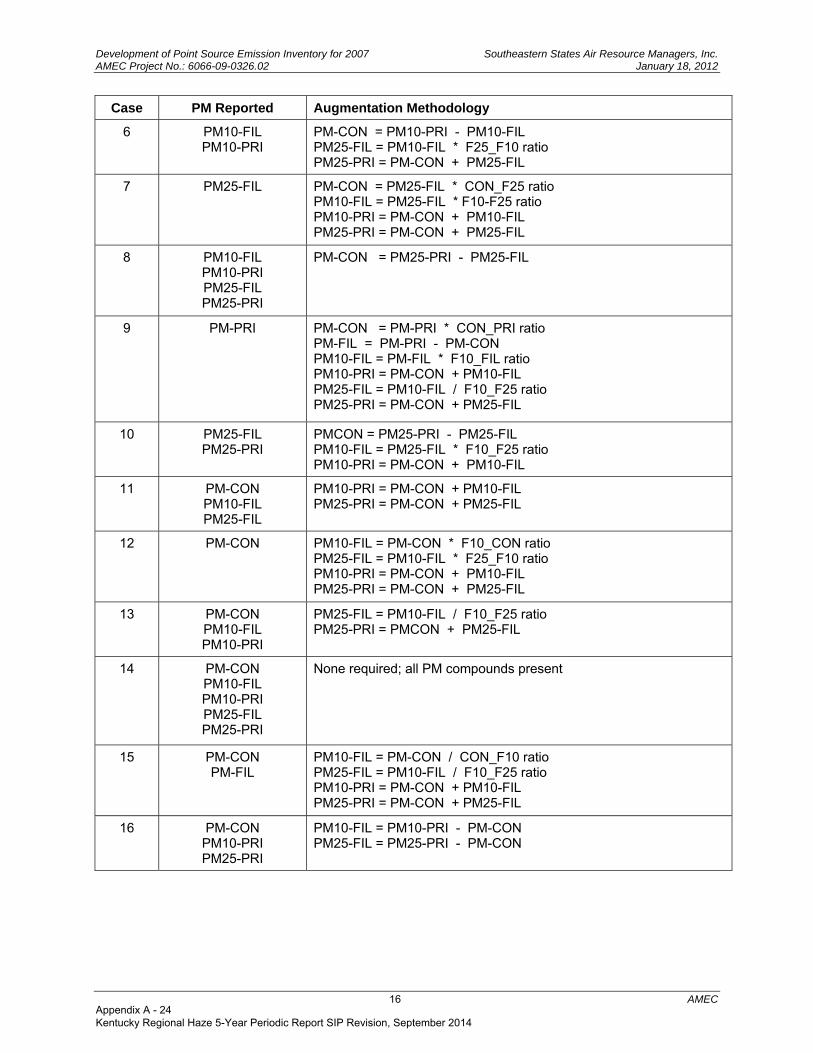
The gap-filling requires that the data be analyzed and separated into cases. The cases determine which math steps and ratios of PM terms will be applied. Exhibit 4 shows the various cases and the augmentation method that was applied.
Exhibit 4 – PM Cases and Required Steps to Augment PM Emissions
Case PM Reported Augmentation Methodology
1 PM25-PRI PM-CON = PM25-PRI * CON_P25 ratio PM25-FIL = PM25-PRI - PM-CON PM10-FIL = PM25-FIL * F10_F25 ratio PM10-PRI = PM-CON + PM10-FIL
2 PM10-PRI PM-CON = PM10-PRI * CON_P10 ratio PM10-FIL = PM10-PRI - PM-CON PM25-FIL = PM10-FIL / F10_F25 ratio PM25-PRI = PM-CON + PM25-FIL
3 PM25-PRI PM10-PRI
PM-CON = PM10-PRI * CON_P10 ratio PM10-FIL = PM10-PRI - PM-CON PM25-FIL = PM25-PRI - PM-CON
4 PM10-FIL PM-CON = PM-CON * CON_F10 ratio PM10-PRI = PM-CON + PM10-FIL PM25-FIL = PM10-FIL / F10_F25 ratio PM25-PRI = PM-CON + PM25-FIL
5 PM10-FIL PM25-FIL
PM-CON = PM10-FIL * CON_F10 ratio PM10-PRI = PM-CON + PM10-FIL PM25-PRI = PM-CON + PM25-FIL
Appendix A - 23 Kentucky Regional Haze 5-Year Periodic Report SIP Revision, September 2014
Development of Point Source Emission Inventory for 2007 Southeastern States Air Resource Managers, Inc. AMEC Project No.: 6066-09-0326.02 January 18, 2012
16 AMEC
Case PM Reported Augmentation Methodology
6 PM10-FIL PM10-PRI
PM-CON = PM10-PRI - PM10-FIL PM25-FIL = PM10-FIL * F25_F10 ratio PM25-PRI = PM-CON + PM25-FIL
7 PM25-FIL PM-CON = PM25-FIL * CON_F25 ratio PM10-FIL = PM25-FIL * F10-F25 ratio PM10-PRI = PM-CON + PM10-FIL PM25-PRI = PM-CON + PM25-FIL
8 PM10-FIL PM10-PRI PM25-FIL PM25-PRI
PM-CON = PM25-PRI - PM25-FIL
9 PM-PRI PM-CON = PM-PRI * CON_PRI ratio PM-FIL = PM-PRI - PM-CON PM10-FIL = PM-FIL * F10_FIL ratio PM10-PRI = PM-CON + PM10-FIL PM25-FIL = PM10-FIL / F10_F25 ratio PM25-PRI = PM-CON + PM25-FIL
10 PM25-FIL PM25-PRI
PMCON = PM25-PRI - PM25-FIL PM10-FIL = PM25-FIL * F10_F25 ratio PM10-PRI = PM-CON + PM10-FIL
11 PM-CON PM10-FIL PM25-FIL
PM10-PRI = PM-CON + PM10-FIL PM25-PRI = PM-CON + PM25-FIL
12 PM-CON PM10-FIL = PM-CON * F10_CON ratio PM25-FIL = PM10-FIL * F25_F10 ratio PM10-PRI = PM-CON + PM10-FIL PM25-PRI = PM-CON + PM25-FIL
13 PM-CON PM10-FIL PM10-PRI
PM25-FIL = PM10-FIL / F10_F25 ratio PM25-PRI = PMCON + PM25-FIL
14 PM-CON PM10-FIL PM10-PRI PM25-FIL PM25-PRI
None required; all PM compounds present
15 PM-CON PM-FIL
PM10-FIL = PM-CON / CON_F10 ratio PM25-FIL = PM10-FIL / F10_F25 ratio PM10-PRI = PM-CON + PM10-FIL PM25-PRI = PM-CON + PM25-FIL
16 PM-CON PM10-PRI PM25-PRI
PM10-FIL = PM10-PRI - PM-CON PM25-FIL = PM25-PRI - PM-CON
Appendix A - 24 Kentucky Regional Haze 5-Year Periodic Report SIP Revision, September 2014
Development of Point Source Emission Inventory for 2007 Southeastern States Air Resource Managers, Inc. AMEC Project No.: 6066-09-0326.02 January 18, 2012
17 AMEC
Case PM Reported Augmentation Methodology
17 PM-FIL PM10-FIL = PM-FIL * F10_FIL ratio PM_CON = PM10-FIL * CON_F10 ratio PM25-FIL = PM10-FIL / F10_F25 ratio PM10-PRI = PM-CON + PM10-FIL PM25-PRI = PM-CON + PM25-FIL
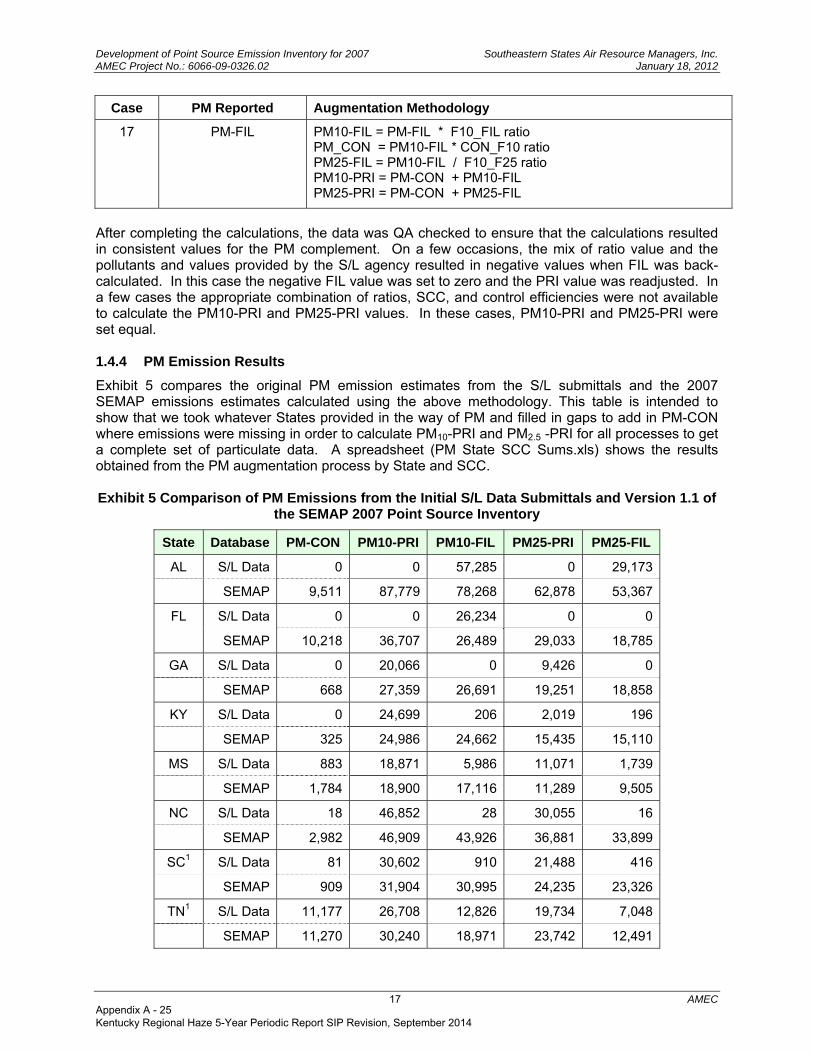
After completing the calculations, the data was QA checked to ensure that the calculations resulted in consistent values for the PM complement. On a few occasions, the mix of ratio value and the pollutants and values provided by the S/L agency resulted in negative values when FIL was back-calculated. In this case the negative FIL value was set to zero and the PRI value was readjusted. In a few cases the appropriate combination of ratios, SCC, and control efficiencies were not available to calculate the PM10-PRI and PM25-PRI values. In these cases, PM10-PRI and PM25-PRI were set equal. 1.4.4 PM Emission Results
Exhibit 5 compares the original PM emission estimates from the S/L submittals and the 2007 SEMAP emissions estimates calculated using the above methodology. This table is intended to show that we took whatever States provided in the way of PM and filled in gaps to add in PM-CON where emissions were missing in order to calculate PM10-PRI and PM2.5 -PRI for all processes to get a complete set of particulate data. A spreadsheet (PM State SCC Sums.xls) shows the results obtained from the PM augmentation process by State and SCC. Exhibit 5 Comparison of PM Emissions from the Initial S/L Data Submittals and Version 1.1 of
the SEMAP 2007 Point Source Inventory
State Database PM-CON PM10-PRI PM10-FIL PM25-PRI PM25-FIL
AL S/L Data 0 0 57,285 0 29,173
SEMAP 9,511 87,779 78,268 62,878 53,367
FL S/L Data 0 0 26,234 0 0
SEMAP 10,218 36,707 26,489 29,033 18,785
GA S/L Data 0 20,066 0 9,426 0
SEMAP 668 27,359 26,691 19,251 18,858
KY S/L Data 0 24,699 206 2,019 196
SEMAP 325 24,986 24,662 15,435 15,110
MS S/L Data 883 18,871 5,986 11,071 1,739
SEMAP 1,784 18,900 17,116 11,289 9,505
NC S/L Data 18 46,852 28 30,055 16
SEMAP 2,982 46,909 43,926 36,881 33,899
SC1 S/L Data 81 30,602 910 21,488 416
SEMAP 909 31,904 30,995 24,235 23,326
TN1 S/L Data 11,177 26,708 12,826 19,734 7,048
SEMAP 11,270 30,240 18,971 23,742 12,491
Appendix A - 25 Kentucky Regional Haze 5-Year Periodic Report SIP Revision, September 2014

Development of Point Source Emission Inventory for 2007 Southeastern States Air Resource Managers, Inc. AMEC Project No.: 6066-09-0326.02 January 18, 2012
18 AMEC
State Database PM-CON PM10-PRI PM10-FIL PM25-PRI PM25-FIL
VA2 S/L Data 4,783 19,203 14,419 14,888 10,105
SEMAP 4,783 19,203 14,419 14,875 10,092
WV S/L Data 129 6,444 7,507 4,462 3,398
SEMAP 3,904 13,736 9,833 9,173 5,269
1) Includes PM records from EPA’s 2005-based modeling inventory, which have already been augmented by EPA
2) Virginia’s PM augmentation was previously performed using an identical augmentation process during the development of the 2007 inventory for the Northeast/Mid-Atlantic States
1.5 EMISSION RELEASE POINT QA CHECKS
Stack parameters are an important component of an emission inventory used for regional air quality modeling. Careful QA was required to ensure that the point source emissions were properly located both horizontally and vertically on the modeling grid. This section describes the procedures used to quality assure, augment, and where necessary, revise, stack parameters using standardized procedures to identify and correct stack data errors. These procedures were implemented within the NIF file itself, and are based on the QA procedures built into SMOKE that are designed to catch missing or out-of-range stack parameters. 1.5.1 QA Checks and Gap-Filling for Location Coordinates
The emission release (ER) point record is used to report the location and relevant physical attributes of the emission release point. Location coordinates must be reported to identify where emissions are released to the ambient air, via a stack or non-stack (e.g., fugitive release). If a non-stack, or fugitive release, coordinates may be reported for the general location of the emission release point. In the ER record, location data may be reported as x and y coordinates from either of two coordinate systems - Latitude / Longitude (LATLON), or Universal TransMercator (UTM). X and Y coordinates reported as Latitude and Longitude must be reported in the decimal degree format specified. X and Y coordinates reported as UTM Easting and UTM Northing, must be reported in kilometers. In order to comply with the EPA data standard for Latitude/Longitude, any UTM data received in the SESARM files was processed by the AMEC Team and converted to, and stored as Latitude Measure and Longitude Measure in decimal degrees. All conversions of UTM to LATLON were conducting use a spreadsheet developed by the University of Wisconsin - Green Bay (Dutch 2005). This spreadsheet tool allowed for batch conversion of UTM data to decimal degree format and was configured for WGS 84 DATUM. While errors using this spreadsheet are typically a few meters, rarely 10 or more, the accuracy of the conversion is limited to the accuracy of the initial UTM data. A degree latitude/longitude is about 111,000 meters. Thus, to achieve roughly one-meter accuracy you need coordinates accurate to five decimal places. Four places will give you 10 meters accuracy and three will give you 100 meter accuracy. This accuracy could not be improved with the originally provided UTM coordinates, so all conversions should be checked for reasonableness. Once all conversions were made to LATLON decimal degrees (also the requirement of the SMOKE emissions processing system), reasonableness checks were conducted on each release point relative to county centroids and min/max coordinates associated with the FIPS codes assigned to each stack. If a stack was found to exist outside of the western-, eastern-, northern- or southern-most boundary of the county (based on SMOKE’s county lat/lon file), the point was flagged for additional review. These flagged sources were then mapped with GIS software to determine their placement relative to the FIPS County associated with the stack. If a source was found to be
Appendix A - 26 Kentucky Regional Haze 5-Year Periodic Report SIP Revision, September 2014
Development of Point Source Emission Inventory for 2007 Southeastern States Air Resource Managers, Inc. AMEC Project No.: 6066-09-0326.02 January 18, 2012
19 AMEC
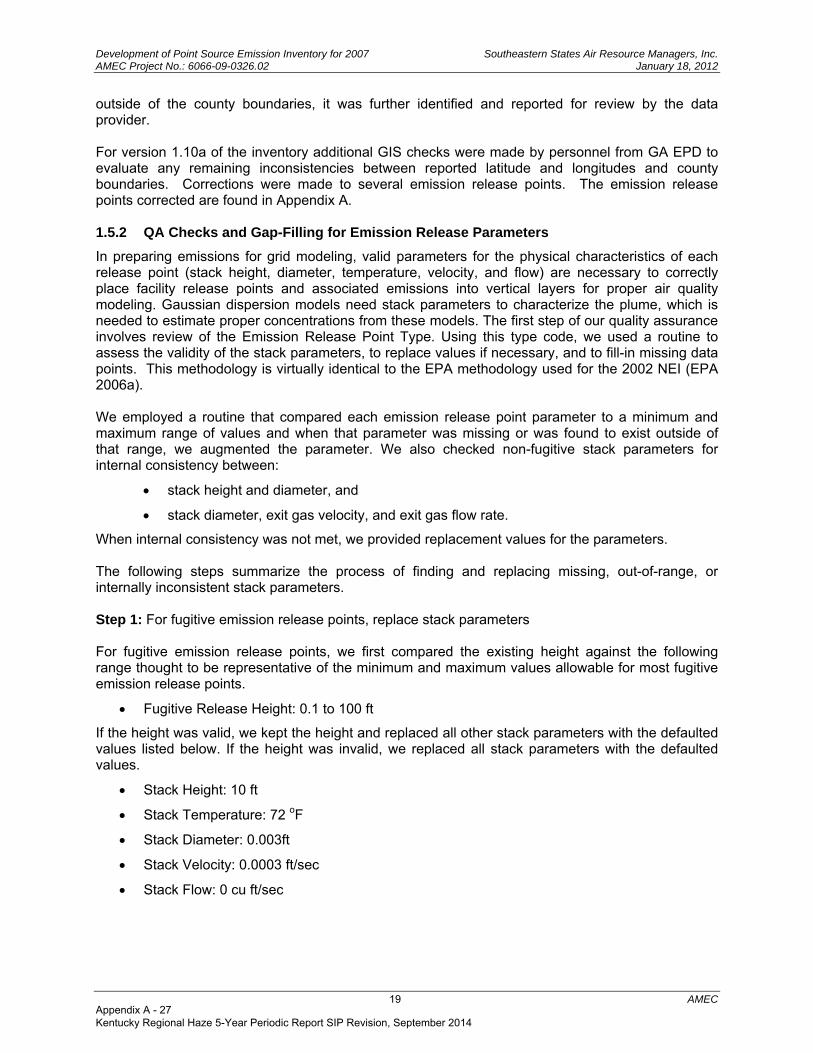
outside of the county boundaries, it was further identified and reported for review by the data provider. For version 1.10a of the inventory additional GIS checks were made by personnel from GA EPD to evaluate any remaining inconsistencies between reported latitude and longitudes and county boundaries. Corrections were made to several emission release points. The emission release points corrected are found in Appendix A. 1.5.2 QA Checks and Gap-Filling for Emission Release Parameters
In preparing emissions for grid modeling, valid parameters for the physical characteristics of each release point (stack height, diameter, temperature, velocity, and flow) are necessary to correctly place facility release points and associated emissions into vertical layers for proper air quality modeling. Gaussian dispersion models need stack parameters to characterize the plume, which is needed to estimate proper concentrations from these models. The first step of our quality assurance involves review of the Emission Release Point Type. Using this type code, we used a routine to assess the validity of the stack parameters, to replace values if necessary, and to fill-in missing data points. This methodology is virtually identical to the EPA methodology used for the 2002 NEI (EPA 2006a). We employed a routine that compared each emission release point parameter to a minimum and maximum range of values and when that parameter was missing or was found to exist outside of that range, we augmented the parameter. We also checked non-fugitive stack parameters for internal consistency between:
stack height and diameter, and
stack diameter, exit gas velocity, and exit gas flow rate.
When internal consistency was not met, we provided replacement values for the parameters. The following steps summarize the process of finding and replacing missing, out-of-range, or internally inconsistent stack parameters. Step 1: For fugitive emission release points, replace stack parameters For fugitive emission release points, we first compared the existing height against the following range thought to be representative of the minimum and maximum values allowable for most fugitive emission release points.
Fugitive Release Height: 0.1 to 100 ft
If the height was valid, we kept the height and replaced all other stack parameters with the defaulted values listed below. If the height was invalid, we replaced all stack parameters with the defaulted values.
Stack Height: 10 ft
Stack Temperature: 72 oF
Stack Diameter: 0.003ft
Stack Velocity: 0.0003 ft/sec
Stack Flow: 0 cu ft/sec
Appendix A - 27 Kentucky Regional Haze 5-Year Periodic Report SIP Revision, September 2014
Development of Point Source Emission Inventory for 2007 Southeastern States Air Resource Managers, Inc. AMEC Project No.: 6066-09-0326.02 January 18, 2012
20 AMEC
Step 2: For non-fugitive emission release points, find out-of-range or missing stack parameters For non-fugitive emission release points, we first compared existing stack parameters against a set of the following ranges thought to be representative of the minimum and maximum values allowable for most emission release points.
Stack Height: 0.1 to 1000 ft
Stack Temperature: 50 to 1,800 oF
Stack Diameter: 0.1 to 50 ft
Stack Velocity: 0.1 to 560 ft/sec
Stack Flow: 0.001 to 1,100,000 ft3/sec
First we identified missing or out-of range parameters. Then we evaluated the source category to determine if out-of-range parameters were plausible. If any parameter was missing or out-of range, the parameter was replaced using the procedures described in Step 4. If all parameters were found to exist within the bounds of the emission release point ranges, we proceeded to Step 3. Step 3: For non-fugitive emission release points, find inconsistencies in stack parameters We determined any inconsistencies in stack parameters by conducting the following two steps.
A. For stack diameter, we compared the stack diameter to the stack height. For nonfugitive emission release points, the stack height may not be less than stack diameter.
B. We determined the internal consistency between diameter, velocity and flow rate using the following equation.
Stack Flow [cu ft/sec] = (Π [Pi] * (Stack Diameter [ft] / 2) ^ 2) * Stack Velocity [ft/sec] If the calculated flow and the reported flow are within 10 % of one another, then internal consistency was assumed to be valid. If all parameters were found to exist within the bounds of the emission release point ranges in Step 2, and the consistency checks (A) and (B) in Step 3 were satisfied, no additional steps were taken. If any parameter was missing or out-of range, or if the parameters failed the internal consistency tests, the parameter was replaced using the procedures described in Step 4. Step 4: Replace stack parameters for non-fugitive emission release points The first step in replacing stack parameters was to determine if there are problems with stack height or diameter. Because stack height and diameter are the physical parameters that are most easily measured or estimated, when there are problems with these parameters, then the entire set of stack parameters are deemed questionable. If either height or diameter were missing or out-of range, or if the stack diameter was greater than stack height, then all five parameters were defaulted using national default sets of physical parameter data contained in the 2002 NEI Stack Parameter Default file (EPA 2006b). No additional steps were taken once all five parameters were defaulted. If stack height and diameter did not need replacement, then velocity and flow rate were evaluated next. If velocity and flow rate were not internally consistent, we conducted QA on the flow rate to determine if it was reported in cubic feet per minute rather than cubic feet per second as required in the reporting to EPA. We corrected flow rates reported in cubic feet per minute to cubic feet per second and then evaluated the flow rate and velocity for internal consistency. If the internal consistency was not met for velocity, flow rate, and diameter, Exhibit 6 provides instructions on how we replaced missing, out-
Appendix A - 28 Kentucky Regional Haze 5-Year Periodic Report SIP Revision, September 2014
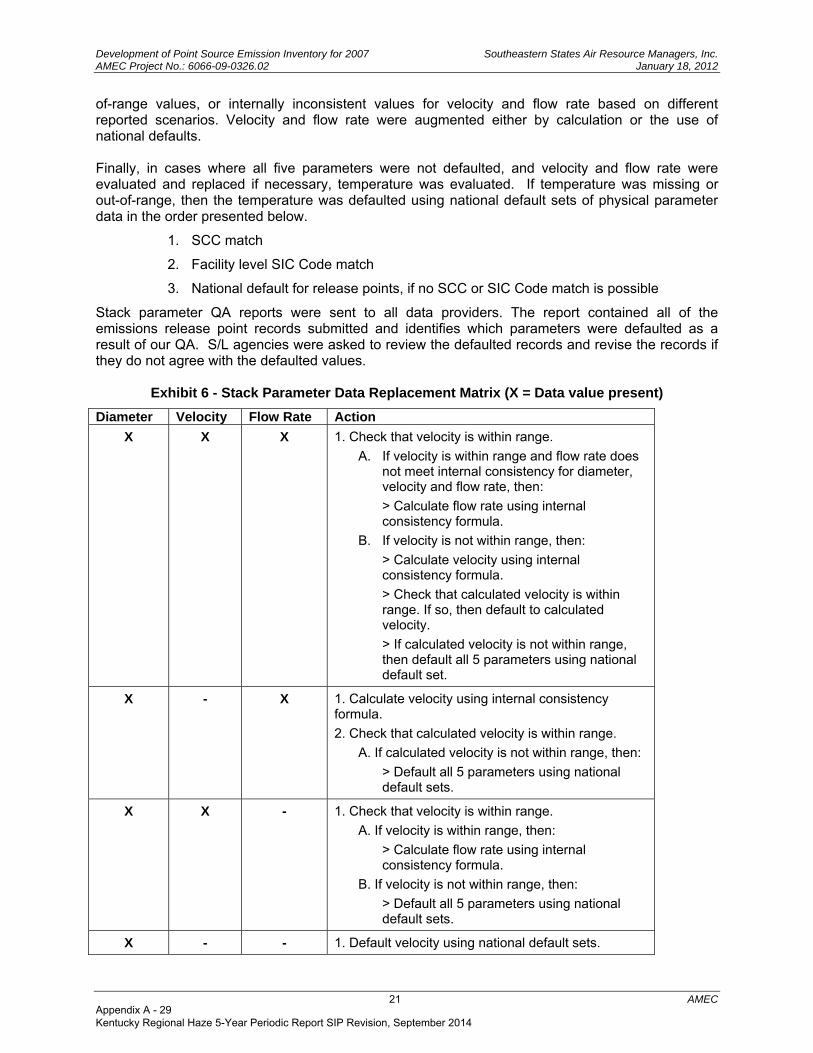
Development of Point Source Emission Inventory for 2007 Southeastern States Air Resource Managers, Inc. AMEC Project No.: 6066-09-0326.02 January 18, 2012
21 AMEC
of-range values, or internally inconsistent values for velocity and flow rate based on different reported scenarios. Velocity and flow rate were augmented either by calculation or the use of national defaults. Finally, in cases where all five parameters were not defaulted, and velocity and flow rate were evaluated and replaced if necessary, temperature was evaluated. If temperature was missing or out-of-range, then the temperature was defaulted using national default sets of physical parameter data in the order presented below.
1. SCC match
2. Facility level SIC Code match
3. National default for release points, if no SCC or SIC Code match is possible
Stack parameter QA reports were sent to all data providers. The report contained all of the emissions release point records submitted and identifies which parameters were defaulted as a result of our QA. S/L agencies were asked to review the defaulted records and revise the records if they do not agree with the defaulted values.
Exhibit 6 - Stack Parameter Data Replacement Matrix (X = Data value present)
Diameter Velocity Flow Rate Action
X X X 1. Check that velocity is within range.
A. If velocity is within range and flow rate does not meet internal consistency for diameter, velocity and flow rate, then:
> Calculate flow rate using internal consistency formula.
B. If velocity is not within range, then:
> Calculate velocity using internal consistency formula.
> Check that calculated velocity is within range. If so, then default to calculated velocity.
> If calculated velocity is not within range, then default all 5 parameters using national default set.
X - X 1. Calculate velocity using internal consistency formula.
2. Check that calculated velocity is within range.
A. If calculated velocity is not within range, then:
> Default all 5 parameters using national default sets.
X X - 1. Check that velocity is within range.
A. If velocity is within range, then:
> Calculate flow rate using internal consistency formula.
B. If velocity is not within range, then:
> Default all 5 parameters using national default sets.
X - - 1. Default velocity using national default sets.
Appendix A - 29 Kentucky Regional Haze 5-Year Periodic Report SIP Revision, September 2014
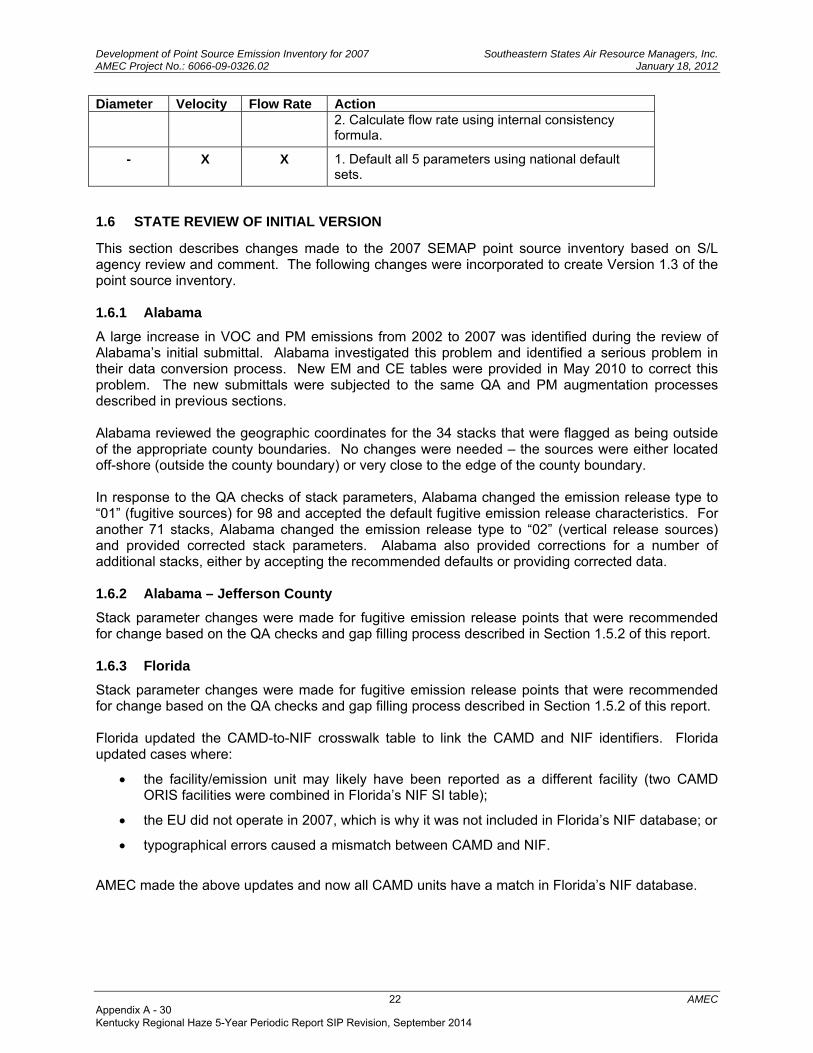
Development of Point Source Emission Inventory for 2007 Southeastern States Air Resource Managers, Inc. AMEC Project No.: 6066-09-0326.02 January 18, 2012
22 AMEC
Diameter Velocity Flow Rate Action 2. Calculate flow rate using internal consistency formula.
- X X 1. Default all 5 parameters using national default sets.
1.6 STATE REVIEW OF INITIAL VERSION
This section describes changes made to the 2007 SEMAP point source inventory based on S/L agency review and comment. The following changes were incorporated to create Version 1.3 of the point source inventory. 1.6.1 Alabama
A large increase in VOC and PM emissions from 2002 to 2007 was identified during the review of Alabama’s initial submittal. Alabama investigated this problem and identified a serious problem in their data conversion process. New EM and CE tables were provided in May 2010 to correct this problem. The new submittals were subjected to the same QA and PM augmentation processes described in previous sections. Alabama reviewed the geographic coordinates for the 34 stacks that were flagged as being outside of the appropriate county boundaries. No changes were needed – the sources were either located off-shore (outside the county boundary) or very close to the edge of the county boundary. In response to the QA checks of stack parameters, Alabama changed the emission release type to “01” (fugitive sources) for 98 and accepted the default fugitive emission release characteristics. For another 71 stacks, Alabama changed the emission release type to “02” (vertical release sources) and provided corrected stack parameters. Alabama also provided corrections for a number of additional stacks, either by accepting the recommended defaults or providing corrected data. 1.6.2 Alabama – Jefferson County
Stack parameter changes were made for fugitive emission release points that were recommended for change based on the QA checks and gap filling process described in Section 1.5.2 of this report. 1.6.3 Florida
Stack parameter changes were made for fugitive emission release points that were recommended for change based on the QA checks and gap filling process described in Section 1.5.2 of this report. Florida updated the CAMD-to-NIF crosswalk table to link the CAMD and NIF identifiers. Florida updated cases where:
the facility/emission unit may likely have been reported as a different facility (two CAMD ORIS facilities were combined in Florida’s NIF SI table);
the EU did not operate in 2007, which is why it was not included in Florida’s NIF database; or
typographical errors caused a mismatch between CAMD and NIF.
AMEC made the above updates and now all CAMD units have a match in Florida’s NIF database.
Appendix A - 30 Kentucky Regional Haze 5-Year Periodic Report SIP Revision, September 2014

Development of Point Source Emission Inventory for 2007 Southeastern States Air Resource Managers, Inc. AMEC Project No.: 6066-09-0326.02 January 18, 2012
23 AMEC
1.6.4 Georgia
Georgia specified that 2008 emissions data should be backcasted to 2007 or and 2005 emissions data should be projected to 2007. The backcasting of 2008 emissions and projecting of 2005 emissions was performed in the following manner:
Facilities with 2007 emissions do not get changed;
For facilities with 2005 and 2008 emissions (but no 2007 emissions), 2007 emissions were estimated based on a linear interpolation between facility level 2005 and 2008 emissions on a pollutant-by-pollutant basis to calculate facility level 2007 emissions. A scaling factor was then calculated as the ratio of reported 2008 emissions to interpolated 2007 emissions, which was used to create to scale back 2008 reported emissions to 2007 at the emission process level.
For facilities with only 2008 data (no 2007 or 2005 data available), we used the SIC growth factors from the VISTAS Best&Final inventory to backcast 2008 reported emissions to 2007. The VISTAS SIC growth factors were used to calculate a scaling factor which was used to scale back 2008 reported emissions to 2007 at the emission process level.
For facilities with only 2005 data (no 2007 or 2008 data available), we used the SIC growth factors from the VISTAS Best&Final inventory to project 2005 reported emissions to 2007. The VISTAS SIC growth factors were used to calculate a scaling factor which was used to project 2005 reported emissions to 2007 at the emission process level.
After the above backcasting and projecting was performed, additional adjustments were made for facilities where only 2005 data were available and the facility did not operate in 2007 or operated for only part of 2007. Facilities that did not operate in 2007 were removed from the NIF files. For facilities that operated for part of 2007, the 2005 emissions were approximated for 2007 by multiply the 2005 emissions by a scaling factor of the number of days the facility operated in 2007 divided 365 days of full year operation. Also, the end date in the NIF EM and PE tables were changed to reflect the actual date that the facility ceased operation. These facilities were:
FIPS PLANTID FACILITY NAME DATE
SHUTDOWN SCALING FACTOR
13159 15900011 Georgia-Pacific Corp Panelboard 15-Aug-07 0.62
13045 04500008 Southwire Co, Copper Division 7-Mar-07 0.18
13121 12100364 Ford Motor Co Atlanta Assembly 1-Dec-07 0.92
13121 12100004 General Shale Brick 28-Mar-07 0.24
13175 17500047 Victor Forstmann, Inc. 1-Apr-07 0.25
13081 08100019 Lasco Bathware 6-Nov-07 0.85
13089 08900031 Siemens Energy & Auto 1-Sep-06 0.00
13241 24100001 Rabun Apparel, Inc. Not operated in
2007 0.00
13261 26100005 Textron Automotive Company 1-Feb-07 0.08
The following facilities reported emissions data to CAMD but were not in Georgia’s NIF submittal:
FIPSST FIPSCNTY PLANTID ORISID FACILITY NAME
13 147 14700021 70454 HARTWELL ENERGY FACILITY
Appendix A - 31 Kentucky Regional Haze 5-Year Periodic Report SIP Revision, September 2014
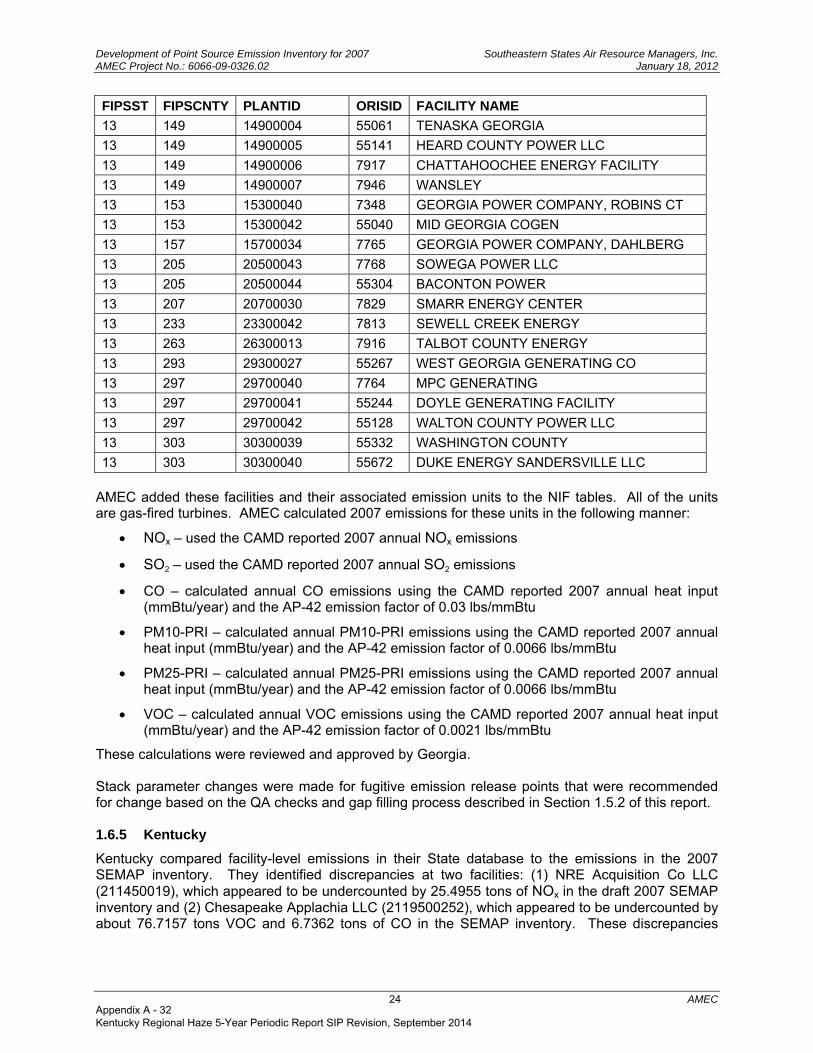
Development of Point Source Emission Inventory for 2007 Southeastern States Air Resource Managers, Inc. AMEC Project No.: 6066-09-0326.02 January 18, 2012
24 AMEC
FIPSST FIPSCNTY PLANTID ORISID FACILITY NAME
13 149 14900004 55061 TENASKA GEORGIA
13 149 14900005 55141 HEARD COUNTY POWER LLC
13 149 14900006 7917 CHATTAHOOCHEE ENERGY FACILITY
13 149 14900007 7946 WANSLEY
13 153 15300040 7348 GEORGIA POWER COMPANY, ROBINS CT
13 153 15300042 55040 MID GEORGIA COGEN
13 157 15700034 7765 GEORGIA POWER COMPANY, DAHLBERG
13 205 20500043 7768 SOWEGA POWER LLC
13 205 20500044 55304 BACONTON POWER
13 207 20700030 7829 SMARR ENERGY CENTER
13 233 23300042 7813 SEWELL CREEK ENERGY
13 263 26300013 7916 TALBOT COUNTY ENERGY
13 293 29300027 55267 WEST GEORGIA GENERATING CO
13 297 29700040 7764 MPC GENERATING
13 297 29700041 55244 DOYLE GENERATING FACILITY
13 297 29700042 55128 WALTON COUNTY POWER LLC
13 303 30300039 55332 WASHINGTON COUNTY
13 303 30300040 55672 DUKE ENERGY SANDERSVILLE LLC
AMEC added these facilities and their associated emission units to the NIF tables. All of the units are gas-fired turbines. AMEC calculated 2007 emissions for these units in the following manner:
NOx – used the CAMD reported 2007 annual NOx emissions
SO 2 – used the CAMD reported 2007 annual SO
2 emissions
CO – calculated annual CO emissions using the CAMD reported 2007 annual heat input (mmBtu/year) and the AP-42 emission factor of 0.03 lbs/mmBtu
PM10-PRI – calculated annual PM10-PRI emissions using the CAMD reported 2007 annual heat input (mmBtu/year) and the AP-42 emission factor of 0.0066 lbs/mmBtu
PM25-PRI – calculated annual PM25-PRI emissions using the CAMD reported 2007 annual heat input (mmBtu/year) and the AP-42 emission factor of 0.0066 lbs/mmBtu
VOC – calculated annual VOC emissions using the CAMD reported 2007 annual heat input (mmBtu/year) and the AP-42 emission factor of 0.0021 lbs/mmBtu
These calculations were reviewed and approved by Georgia. Stack parameter changes were made for fugitive emission release points that were recommended for change based on the QA checks and gap filling process described in Section 1.5.2 of this report. 1.6.5 Kentucky
Kentucky compared facility-level emissions in their State database to the emissions in the 2007 SEMAP inventory. They identified discrepancies at two facilities: (1) NRE Acquisition Co LLC (211450019), which appeared to be undercounted by 25.4955 tons of NOx in the draft 2007 SEMAP inventory and (2) Chesapeake Applachia LLC (2119500252), which appeared to be undercounted by about 76.7157 tons VOC and 6.7362 tons of CO in the SEMAP inventory. These discrepancies
Appendix A - 32 Kentucky Regional Haze 5-Year Periodic Report SIP Revision, September 2014
Development of Point Source Emission Inventory for 2007 Southeastern States Air Resource Managers, Inc. AMEC Project No.: 6066-09-0326.02 January 18, 2012
25 AMEC
were identified and resolved, so that now the Kentucky database and the SEMAP 2007 are in agreement. Kentucky provided updated latitude and longitude data for 677 stacks that were identified as being located outside of the county boundaries. Stack parameter changes for the stack diameter, flow rate, and velocity were made for fugitive emission release points that were recommended for change based on the QA checks and gap filling process described in Section 1.5.2 of this report. We retained Kentucky’s values for stack height and exit gas temperature. 1.6.6 Kentucky – Jefferson County
Jefferson County updated the coordinates of emission release points for large and medium-sized point sources. Large sources are those with Title V operating permits. Medium-sized sources are those with synthetic minor operating permits. Most of these emission release points will match those reported in the 2007 National Emissions Inventory (NEI). Many of these coordinates were digitized using a geographic information system (GIS) in early April 2010. Others (those showing fewer significant digits in the UTM coordinates) were obtained by other means, usually by interpolation on USGS 1:24 000 scale paper maps. Generally the ones that were corrected were those that were found to be the most inaccurate as seen in the GIS. The 2007 SEMAP inventory was updated with this new location information. 1.6.7 Mississippi
In preparing the initial version of the 2007 SEMAP point source inventory, AMEC added facilities from EPA’s 2005 NEI that were not included in Mississippi’s 2007 submittal. Mississippi reviewed the facilities that were added and indicated that much of the data for the 2005 NEI facilities was for very small sources, contained dated emissions data, had some double-counting of sources, contained data for airports (which are included in the SEMAP nonroad inventory) and did not reliably represent emissions in 2007. As a result, Mississippi decided to remove most of the facilities added from the 2005 NEI from the 2007 SEMAP inventory. The emissions from these sources will be accounted for in the inventories for area and nonroad sectors. Mississippi provided updated latitude and longitude data for 15 stacks that were identified as being located outside of the county boundaries. Mississippi approved the stack parameter changes for the stacks that were recommended for change based on the QA checks and gap filling process described in Section 1.5.2 of this report. Most of these changes affected fugitive emission sources with a emission release point of “9999”. These stacks were updated to change the emission release type to “01 – fugitive” and to use the default fugitive emission release stack parameters described in Section 1.5.2. Mississippi reviewed the CAMD-to-NIF crosswalk and updated several linkages to correctly map CAMD identifiers to NIF. Three facilities (BTEC New Albany ORIS 13213, Natchez ORIS 2052, and AP Holdings Southhaven ORIS 55219) are currently shut down and did not operate in 2007. Choctaw Gas generation (ORIS 55634), and RRI Energy (ORIS 55706), are newer and were not completely represented in Mississippi’s original submittal. Mississippi provided the necessary stack data for modeling for both of these facilities. 1.6.8 North Carolina
A large increase in VOC emissions from 2002 to 2007 was identified during the review of North Carolina’s initial submittal. North Carolina investigated this problem and identified a serious problem in their data conversion process. A new spreadsheet table was provided in May 2010 to correct this problem. AMEC converted the spreadsheet file a NIF database. The new submittals were subjected to the same QA and PM augmentation processes described in previous sections.
Appendix A - 33 Kentucky Regional Haze 5-Year Periodic Report SIP Revision, September 2014
Development of Point Source Emission Inventory for 2007 Southeastern States Air Resource Managers, Inc. AMEC Project No.: 6066-09-0326.02 January 18, 2012
26 AMEC
North Carolina reviewed the geographic coordinates for the stacks that were flagged as being outside of the appropriate county boundaries. The new submittal mentioned in the previous paragraph contained corrections to the flagged latitude and longitude issues. NC has reviewed the recommended stack replacement parameters and agreed to accept all of the recommendations based on the SCC code. In addition, Duke Energy provided additional corrections for stack parameters for 2007. For the Marshall Steam Plant, new FGD stacks were installed in May 2007 (combined stack for Units 1&2), March 2007 (Unit 3) and May 2006 (Unit 4). For other plants (Belews Creek, Cliffside, and G.G. Allen), new stacks will become operational after 2007. 1.6.9 North Carolina – Buncombe County
Buncombe County approved the stack parameter changes for the stacks that were recommended for change based on the QA checks and gap filling process described in Section 1.5.2 of this report. In a few cases, Buncombe County updated the original stack parameters for certain stacks and requested that the updated stack data be used. The geographic coordinates were inadvertently truncated (not rounded) to 1/100th of a degree during the compilation of the initial SEMAP inventory. This problem was corrected in Version 1.3. Buncombe County compared a sampling of the 2007 SEMAP inventory to what they had submitted and found them to be in agreement. 1.6.10 North Carolina – Forsyth County
Forsyth County reviewed the data in the SEMAP 2007 inventory and emissions data for the more significant processes, i.e. the highest emitting sources. The emissions for all pollutants except PM for the processes they reviewed matched their data. The PM emissions did not match the data they provided data in a few cases. The reason for this difference is due to correcting inconsistencies in the reported PM data during the PM augmentation process. For example, the Corn Products International facility (ID 3706700732, emission point ES062C, process ID 62C-W had reported PM-CON emissions of 11.58 tons but PM10-PRI emissions of only 3.41 tons. Since PM-CON cannot be greater than PM10-PRI, the PM10-PRI value was replaced during the PM augmentation process. Forsyth County provided the mission facility name (Wake Forest University) for Facility ID 3706700003. The geographic coordinates were incorrect for many facilities. These have been replaced for all facilities in Forsyth County. 1.6.11 North Carolina – Mecklenburg County
Mecklenburg County approved the stack parameter changes for the stacks that were recommended for change based on the QA checks and gap filling process described in Section 1.5.2 of this report. 1.6.12 South Carolina
In preparing the initial version of the 2007 SEMAP point source inventory, AMEC added facilities from EPA’s 2005 NEI that were not included in South Carolina’s 2007 submittal. South Carolina reviewed the facilities that were added and indicated that much of the data for the 2005 NEI facilities was for very small sources, contained dated emissions data, had some double-counting of sources, contained data for airports (which are included in the SEMAP nonroad inventory) and did not reliably represent emissions in 2007. As a result, South Carolina decided to remove many of the facilities
Appendix A - 34 Kentucky Regional Haze 5-Year Periodic Report SIP Revision, September 2014
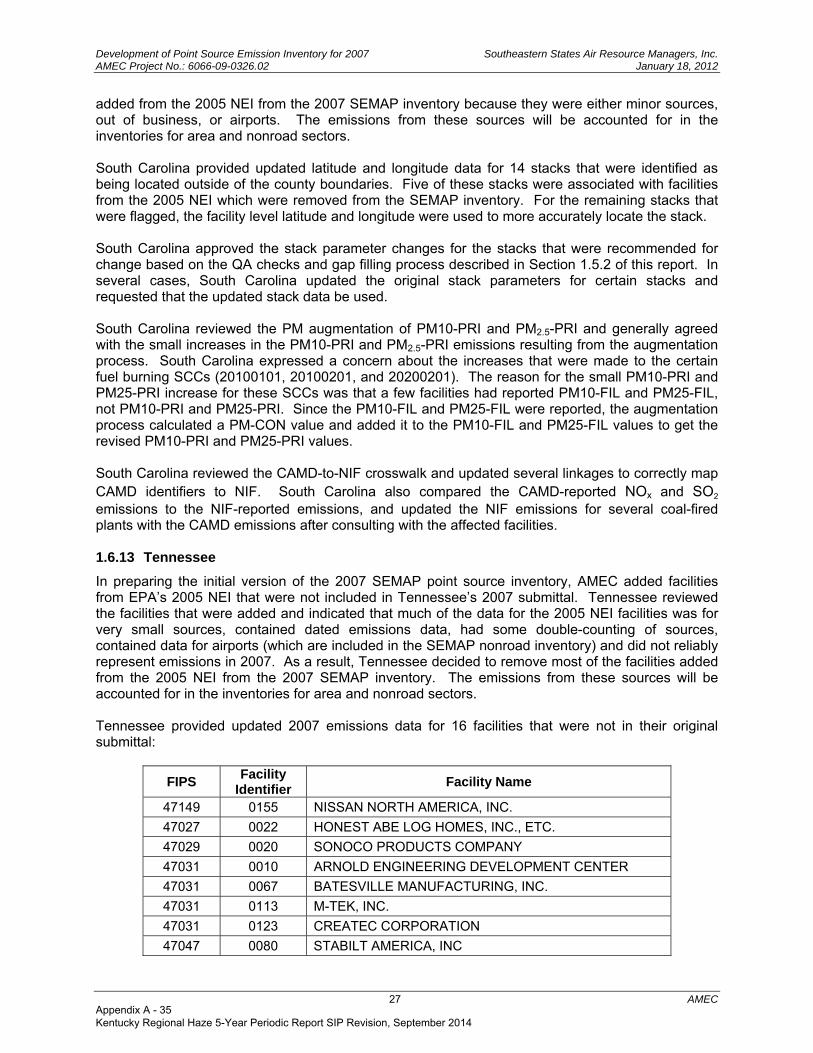
Development of Point Source Emission Inventory for 2007 Southeastern States Air Resource Managers, Inc. AMEC Project No.: 6066-09-0326.02 January 18, 2012
27 AMEC
added from the 2005 NEI from the 2007 SEMAP inventory because they were either minor sources, out of business, or airports. The emissions from these sources will be accounted for in the inventories for area and nonroad sectors. South Carolina provided updated latitude and longitude data for 14 stacks that were identified as being located outside of the county boundaries. Five of these stacks were associated with facilities from the 2005 NEI which were removed from the SEMAP inventory. For the remaining stacks that were flagged, the facility level latitude and longitude were used to more accurately locate the stack. South Carolina approved the stack parameter changes for the stacks that were recommended for change based on the QA checks and gap filling process described in Section 1.5.2 of this report. In several cases, South Carolina updated the original stack parameters for certain stacks and requested that the updated stack data be used. South Carolina reviewed the PM augmentation of PM10-PRI and PM2.5-PRI and generally agreed with the small increases in the PM10-PRI and PM2.5-PRI emissions resulting from the augmentation process. South Carolina expressed a concern about the increases that were made to the certain fuel burning SCCs (20100101, 20100201, and 20200201). The reason for the small PM10-PRI and PM25-PRI increase for these SCCs was that a few facilities had reported PM10-FIL and PM25-FIL, not PM10-PRI and PM25-PRI. Since the PM10-FIL and PM25-FIL were reported, the augmentation process calculated a PM-CON value and added it to the PM10-FIL and PM25-FIL values to get the revised PM10-PRI and PM25-PRI values. South Carolina reviewed the CAMD-to-NIF crosswalk and updated several linkages to correctly map CAMD identifiers to NIF. South Carolina also compared the CAMD-reported NOx and SO
2 emissions to the NIF-reported emissions, and updated the NIF emissions for several coal-fired plants with the CAMD emissions after consulting with the affected facilities. 1.6.13 Tennessee
In preparing the initial version of the 2007 SEMAP point source inventory, AMEC added facilities from EPA’s 2005 NEI that were not included in Tennessee’s 2007 submittal. Tennessee reviewed the facilities that were added and indicated that much of the data for the 2005 NEI facilities was for very small sources, contained dated emissions data, had some double-counting of sources, contained data for airports (which are included in the SEMAP nonroad inventory) and did not reliably represent emissions in 2007. As a result, Tennessee decided to remove most of the facilities added from the 2005 NEI from the 2007 SEMAP inventory. The emissions from these sources will be accounted for in the inventories for area and nonroad sectors. Tennessee provided updated 2007 emissions data for 16 facilities that were not in their original submittal:
FIPS Facility
Identifier Facility Name
47149 0155 NISSAN NORTH AMERICA, INC.
47027 0022 HONEST ABE LOG HOMES, INC., ETC.
47029 0020 SONOCO PRODUCTS COMPANY
47031 0010 ARNOLD ENGINEERING DEVELOPMENT CENTER
47031 0067 BATESVILLE MANUFACTURING, INC.
47031 0113 M-TEK, INC.
47031 0123 CREATEC CORPORATION
47047 0080 STABILT AMERICA, INC
Appendix A - 35 Kentucky Regional Haze 5-Year Periodic Report SIP Revision, September 2014
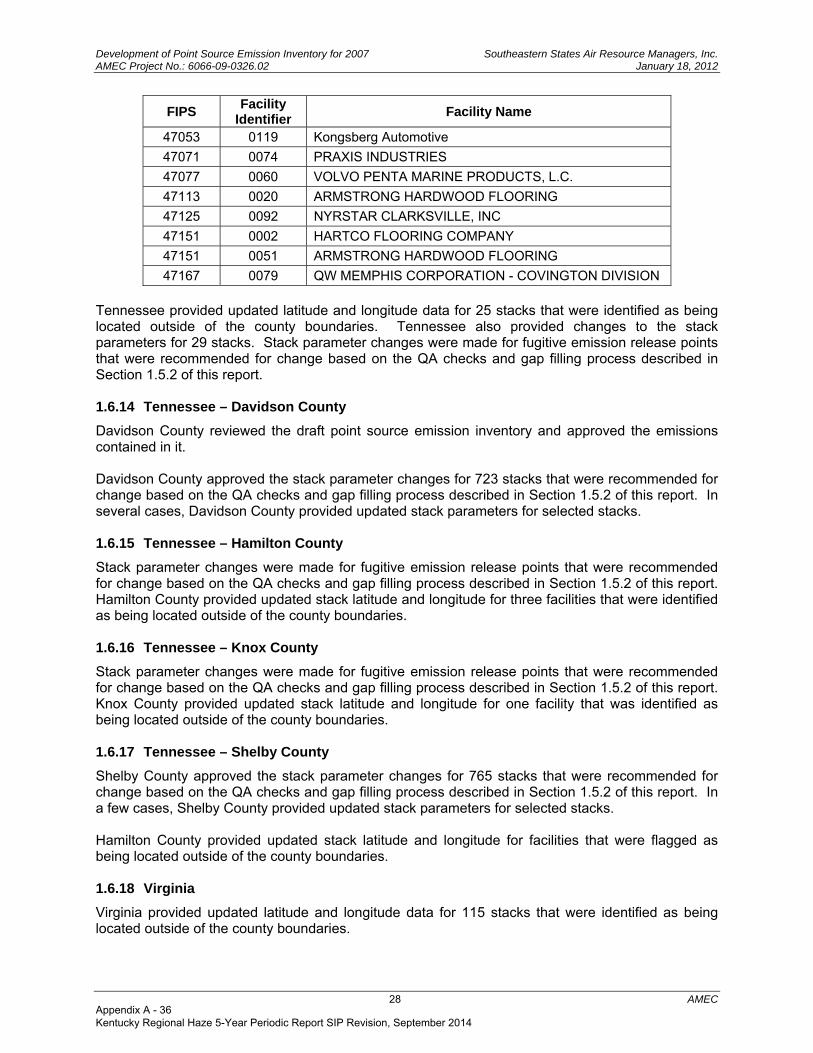
Development of Point Source Emission Inventory for 2007 Southeastern States Air Resource Managers, Inc. AMEC Project No.: 6066-09-0326.02 January 18, 2012
28 AMEC
FIPS Facility
Identifier Facility Name
47053 0119 Kongsberg Automotive
47071 0074 PRAXIS INDUSTRIES
47077 0060 VOLVO PENTA MARINE PRODUCTS, L.C.
47113 0020 ARMSTRONG HARDWOOD FLOORING
47125 0092 NYRSTAR CLARKSVILLE, INC
47151 0002 HARTCO FLOORING COMPANY
47151 0051 ARMSTRONG HARDWOOD FLOORING
47167 0079 QW MEMPHIS CORPORATION - COVINGTON DIVISION
Tennessee provided updated latitude and longitude data for 25 stacks that were identified as being located outside of the county boundaries. Tennessee also provided changes to the stack parameters for 29 stacks. Stack parameter changes were made for fugitive emission release points that were recommended for change based on the QA checks and gap filling process described in Section 1.5.2 of this report. 1.6.14 Tennessee – Davidson County
Davidson County reviewed the draft point source emission inventory and approved the emissions contained in it. Davidson County approved the stack parameter changes for 723 stacks that were recommended for change based on the QA checks and gap filling process described in Section 1.5.2 of this report. In several cases, Davidson County provided updated stack parameters for selected stacks. 1.6.15 Tennessee – Hamilton County
Stack parameter changes were made for fugitive emission release points that were recommended for change based on the QA checks and gap filling process described in Section 1.5.2 of this report. Hamilton County provided updated stack latitude and longitude for three facilities that were identified as being located outside of the county boundaries. 1.6.16 Tennessee – Knox County
Stack parameter changes were made for fugitive emission release points that were recommended for change based on the QA checks and gap filling process described in Section 1.5.2 of this report. Knox County provided updated stack latitude and longitude for one facility that was identified as being located outside of the county boundaries. 1.6.17 Tennessee – Shelby County
Shelby County approved the stack parameter changes for 765 stacks that were recommended for change based on the QA checks and gap filling process described in Section 1.5.2 of this report. In a few cases, Shelby County provided updated stack parameters for selected stacks. Hamilton County provided updated stack latitude and longitude for facilities that were flagged as being located outside of the county boundaries. 1.6.18 Virginia
Virginia provided updated latitude and longitude data for 115 stacks that were identified as being located outside of the county boundaries.
Appendix A - 36 Kentucky Regional Haze 5-Year Periodic Report SIP Revision, September 2014

Development of Point Source Emission Inventory for 2007 Southeastern States Air Resource Managers, Inc. AMEC Project No.: 6066-09-0326.02 January 18, 2012
29 AMEC
Virginia approved the stack parameter changes for 540 stacks that were recommended for change based on the QA checks and gap filling process described in Section 1.5.2 of this report. The only exception was for the Jewel Coke Company (ID 51027-00004, stacks 1 and 3), where Virginia requested that the original stack exhaust gas temperatures of 1500 degrees Fahrenheit be retained. As part of the development of a 2007 inventory for the Mid-Atlantic and Northeast States directed by MARAMA, Virginia developed and approved the 2007 CAMD-to-NIF crosswalk and the 2007 emission values for all sources. 1.6.19 West Virginia
West Virginia approved the stack parameter changes for 540 stacks that were recommended for change based on the QA checks and gap filling process described in Section 1.5.2 of this report. There were four exceptions (Aker Plastics 5400300026, Gratech International 5403300001, Monongahela Power Harrison 5403300015, DuPont Belle 5403900001) where West Virginia requested that the original stack parameters for certain stacks be retained. West Virginia reviewed the locations for the seven facilities flagged as being outside of the county boundaries and provided updated stack latitude and longitude for these facilities. West Virginia reviewed the draft emission inventory and confirmed that all point source facilities are represented in the inventory, that the PM augmentation procedure produced reasonable results, and the 2007 emissions in the SEMAP inventory agreed with the data they submitted. West Virginia reviewed the CAMD-to-NIF crosswalk and identified the linkage between CAMD and NIF identifiers for the Union Carbide Corporation (5403900003) boilers B25, B26, and B27. West Virginia approved all other linkages between CAMD and NIF identifiers.
1.7 STAKEHOLDER REVIEW
S/L agencies provided access to Version 1.3 of the 2007 point source inventory and solicited input from various stakeholders including EPA, the regulated community, academia, environmental groups, and the general public. This section documents the changes made to Version 1.3 based on S/L agency review of stakeholder comments as well as any additional updates or corrections identified by the S/L agencies. 1.7.1 Alabama
The National Lime Association requested consideration of a modification to PM emissions data for one of their facilities in Alabama (Unimin Lime Corporation, Calera Plant). The request was reviewed by State staff and the suggested correction was justified and made. 1.7.2 Florida
Lakeland Electric requested that the SO 2 and NOx emission values from the EPA CAMD submittal
be used instead of the values reported to the State. The CAMD represent the emissions more accurately that the State submittal for two plants (Plant IDs 1050004 and 1050003). Florida agreed to make these changes. Tampa Electric reviewed the database and suggested several corrections. Most of the changes are due to the installation and operation of the SCR control devices on Big Bend units 1-4. Tampa Electric also evaluated filterable and condensable PM emissions for all of its major generating units and provided better, unit specific, emission rates for these units where available. Finally, Tampa
Appendix A - 37 Kentucky Regional Haze 5-Year Periodic Report SIP Revision, September 2014

Development of Point Source Emission Inventory for 2007 Southeastern States Air Resource Managers, Inc. AMEC Project No.: 6066-09-0326.02 January 18, 2012
30 AMEC
Electric provided some corrections to stack exhaust gas parameters. Florida agreed to make all of these changes. Southern Company indicated that the inventory stack data for Crist plant reflects the current scrubbed stack parameters, not the operating parameters in 2007. Appropriate stack parameters for 2007 were submitted and reviewed/approved by Florida. 1.7.3 Georgia
Georgia reviewed the emissions values and stack parameters for the Georgia Power facilities in the State. Georgia provided updated PM and NH3 emissions data for all Georgia Power facilities. The revised PM emission values included condensable emissions which were previously missing from the inventory. Georgia also provided updated stack parameters for selected Georgia Power stacks. Georgia also identified a number of emission units where the PM2.5 emissions were greater than the PM10 emissions. The source of this error was investigated and identified, and revisions were made to correct this error. 1.7.4 Kentucky
Kentucky identified that the PM point source emissions originally submitted for all Kentucky counties, excluding Jefferson County, should be considered as filterable PM emissions. The original submittal contained pollutant codes (PM-PRI, PM10-PRI, PM25-PRI) that represent the sum of filterable and condensable emissions. These should have been reported as filterable only (PM-FIL, PM10-FIL, PM25-FIL). AMEC changed the pollutant codes to represent filterable emissions only, and re-ran the PM augmentation process described previously in Section 1.4 to add condensable emissions to the filterable emissions. Kentucky reviewed and approved the revised PM emissions, except for a few EGUs. Kentucky worked with these utilities in obtaining updated PM emissions data that included both filterable and condensable emissions. These changes to the EGU PM emissions are discussed further in Section 1.9. 1.7.5 North Carolina
Duke Energy indicated that the SCC for Marshall Units 1&2 were 10200202 and 10200502 (industrial boiler, coal and oil) but should be 10100202 and 10100502 (electric generation boiler, coal and oil). Duke Energy requested that the SCC be changed as that will impact how boilers are grouped by category for various regulatory and emission projection scenarios. 1.7.6 Tennessee
Tennessee identified three facilities (APAC-TN Harrison Construction Division, Dyersburg Compressor Station, Kimberly Clark Corporation) that had duplicate entries in the emission inventory. AMEC investigated this issue and identified the error. The duplicate entries were removed. Tennessee also provided updated 2007 emissions data for the CalsonicKansei North America -Lewisburg Operations facility.
1.8 IDENTIFICATION OF EGU AND NONEGU POINT SOURCES
States were asked to classify units in the 2007 SEMAP emissions inventory as either EGU or nonEGU for emission projection purposes. Emission projections for EGU point sources are being developed by the Eastern Regional Technical Advisory Committee (ERTAC). The emissions from point sources classified as nonEGUs will be projected using the methods and data developed by SEMAP.
Appendix A - 38 Kentucky Regional Haze 5-Year Periodic Report SIP Revision, September 2014

Development of Point Source Emission Inventory for 2007 Southeastern States Air Resource Managers, Inc. AMEC Project No.: 6066-09-0326.02 January 18, 2012
31 AMEC
Most, but not all, of the units that are required to report hourly emissions to EPA’s Clean Air Markets Division (CAMD) are considered to be EGUs. CAMD implements EPA’s rule found in Volume 40 Part 75 of the Code of Federal Regulations (CFR), which requires an hourly accounting of emissions from each affected unit - i.e., sources participating in an emissions cap and trade program under the Acid Rain Control Program, the NOx Budget Trading Program, or the Clean Air Interstate Rule. The following guidance was provided to States to determine whether a unit that reports to CAMD should be classified as an EGU or nonEGU: For the ERTAC process, a unit should only be considered EGU if it meets the following criteria:
An EGU sells most of the power generated to the electrical grid;
An EGU burns mostly commercial fuel. Commercial fuel in this case means natural gas, oil, and coal. Wood would not be considered as commercial fuel because some states have them as renewable, therefore, to prevent double counting, unless it's already in the CAMD database, units that burn wood and other renewable sources (depending on each state's own definition) should not be considered as EGU.
The following units were NOT considered as EGU for the purpose of projection emissions:
A unit that generates power for a facility but occasionally sells to the grid;
Emergency generators;
Distributed generation units.
S/L agencies were provided with a list of units that report to CAMD as well as a list of units with an electric generating unit SCC (1-01-xxx-xx or 2-01-xxx-xx). From these lists, S/L agencies identified units that should be classified as EGUs and those that should be classified as nonEGUs. A few States also identified units with SCCs beginning with 1-01 or 2-01 that do not report to CAMD but which should be classified as EGUs; however, for emission projection purposes these units will be processed using the nonEGU projection methodology developed by SEMAP. AMEC added a flag to the NIF EP table to identify each unit according to the following classification scheme:
EGU-CAMD are combustion units that report hourly emissions to the CAMD database and have been classified as EGUs by the S/L agency;
EGU-nonCAMD are combustion units with SCC starting with 101 or 201 that are not contained in CAMD database;
nonEGU-CAMD are combustion units that report hourly emissions to the CAMD database and have been classified as nonEGUs by the S/L agency; and
nonEGU-nonCAMD are all other point sources not classified above.
The above flags allow for sources to be categorized in different ways for emission projection and emission reporting purposes.
1.9 FINAL S/L AGENCY QA REVIEW
Two final QA checks were made. The first check was for S/L agencies to verify the PM emissions data for coal- and oil-fired units included PM condensable emissions in addition to PM filterable emissions. The second check was for S/L agencies to verify the location and emission values for certain sources via review of emission bubble plots prepared by another SEMAP contractor. This section documents the changes made based on these final QA checks. In addition, the documentation was revised to address comments provided by EPA Region 4.
Appendix A - 39 Kentucky Regional Haze 5-Year Periodic Report SIP Revision, September 2014
Development of Point Source Emission Inventory for 2007 Southeastern States Air Resource Managers, Inc. AMEC Project No.: 6066-09-0326.02 January 18, 2012
32 AMEC
1.9.1 Kentucky
Kentucky coordinated the review of PM emissions with utilities in the Commonwealth and provided updated PM condensable emissions for the following units:
Duke Energy East Bend (21-015-00029) Unit 2;
TVA Shawnee (21-145-00006) Units 1 through 10;
TVA Paradise (21-177-00006) Units 1, 2, and 3; and
Kentucky Energy Reid/Henderson (21-233-00001) Units H1 and H2
1.9.2 North Carolina
Both Duke Energy and Progress Energy submitted information to confirm that the PM2.5-PRI and PM10-PRI emission estimates for its facilities do include both filterable and condensable values. 1.9.3 North Carolina – Forsyth County
In its original submittal, Forsyth County submitted a mix of 2007 and 2008 emission data. After further reviewing the 2007 and 2008 data, Forsyth County identified several revisions to make the data more representative of 2007. One facility (VP Buildings, Inc., Plant ID 00488) that shut down in 2008 was omitted for the initial submittal and was added to the SEMAP 2007 inventory. The only other significant change was the addition of the coal boilers at R.J. Reynolds Tobacco Company (Plant ID 00039) to the SEMAP 2007 inventory that were shut down in 2008. Some additional relatively minor corrections were made as well. 1.9.4 South Carolina
South Carolina confirmed that the PM condensable emissions are included in the PM10-PRI and PM2.5-PRI data provided for coal- and oil-fired EGUs. 1.9.5 Virginia
Virginia confirmed that the PM condensable emissions are included in the PM10-PRI and PM2.5-PRI data provided for coal- and oil-fired EGUs. 1.9.6 West Virginia
After reviewing the emission density maps and emission bubble plots, West Virginia submitted revisions to the geographic coordinates at three facilities (54-009-00012 Impress USA, 54-021-00001 Columbia Gas Glenville, 54-057-00008 Newpage Corporation). 1.9.7 Changes for Version 1.9 of the Point Source Inventory
The information presented above relates to Version 1.8 of the point source inventory. This section documents the changes to Version 1.8 of the SEMAP point source emission inventory to create Version 1.9. The purpose of these revisions were to resolve significant differences in emissions as reported by States in Version 1.8 and the emissions as reported in the Clean Air Market Division’s hourly emission database. Each change that was made is identified along with the CAMD and SEMAP unit identifiers:
CAMD_ID = Plant ORIS / Boiler ID
SEMAP_ID = FIPS county code / PlantID / PointID / ProcessID
Several States have indicated that they would like to the SEMAP inventory to be updated to reflect the CAMD NOx and SO
2 emissions. These changes have not yet been made pending the resolution of the potential adjustments to the CAMD emissions to account for overly conservative missing data
Appendix A - 40 Kentucky Regional Haze 5-Year Periodic Report SIP Revision, September 2014
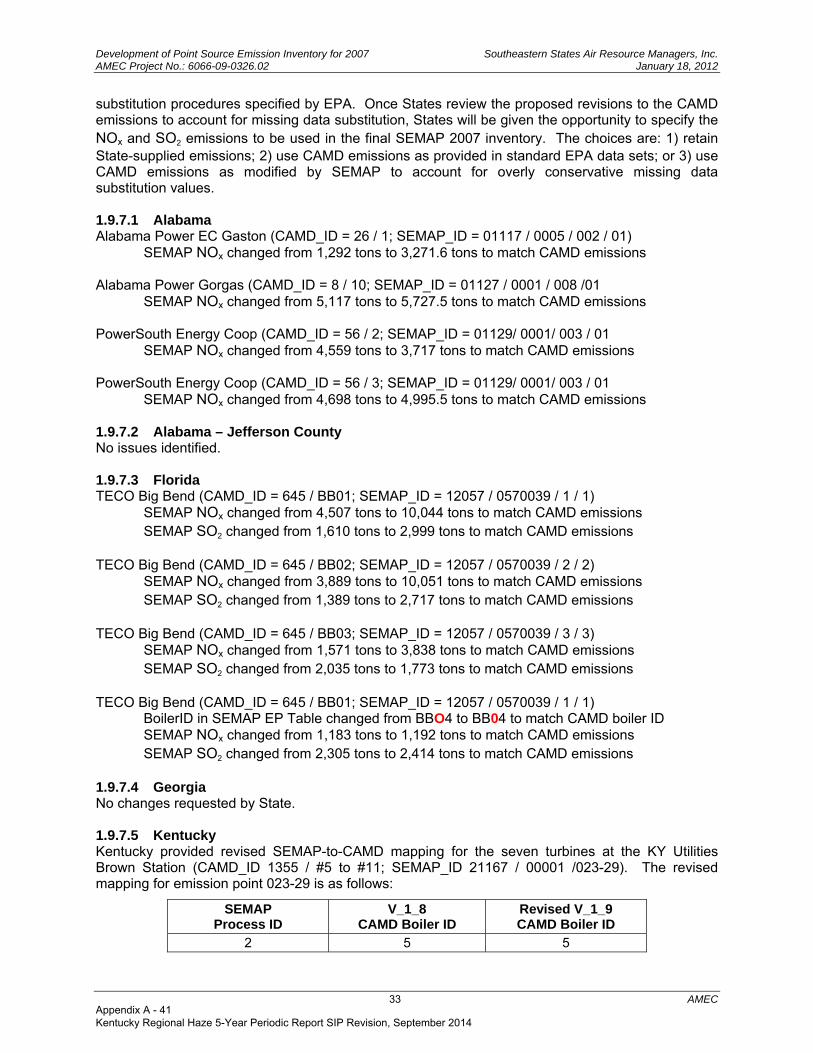
Development of Point Source Emission Inventory for 2007 Southeastern States Air Resource Managers, Inc. AMEC Project No.: 6066-09-0326.02 January 18, 2012
33 AMEC
substitution procedures specified by EPA. Once States review the proposed revisions to the CAMD emissions to account for missing data substitution, States will be given the opportunity to specify the NOx and SO
2 emissions to be used in the final SEMAP 2007 inventory. The choices are: 1) retain State-supplied emissions; 2) use CAMD emissions as provided in standard EPA data sets; or 3) use CAMD emissions as modified by SEMAP to account for overly conservative missing data substitution values. 1.9.7.1 Alabama Alabama Power EC Gaston (CAMD_ID = 26 / 1; SEMAP_ID = 01117 / 0005 / 002 / 01) SEMAP NOx changed from 1,292 tons to 3,271.6 tons to match CAMD emissions Alabama Power Gorgas (CAMD_ID = 8 / 10; SEMAP_ID = 01127 / 0001 / 008 /01 SEMAP NOx changed from 5,117 tons to 5,727.5 tons to match CAMD emissions PowerSouth Energy Coop (CAMD_ID = 56 / 2; SEMAP_ID = 01129/ 0001/ 003 / 01 SEMAP NOx changed from 4,559 tons to 3,717 tons to match CAMD emissions PowerSouth Energy Coop (CAMD_ID = 56 / 3; SEMAP_ID = 01129/ 0001/ 003 / 01 SEMAP NOx changed from 4,698 tons to 4,995.5 tons to match CAMD emissions 1.9.7.2 Alabama – Jefferson County No issues identified. 1.9.7.3 Florida TECO Big Bend (CAMD_ID = 645 / BB01; SEMAP_ID = 12057 / 0570039 / 1 / 1) SEMAP NOx changed from 4,507 tons to 10,044 tons to match CAMD emissions
SEMAP SO 2 changed from 1,610 tons to 2,999 tons to match CAMD emissions
TECO Big Bend (CAMD_ID = 645 / BB02; SEMAP_ID = 12057 / 0570039 / 2 / 2) SEMAP NOx changed from 3,889 tons to 10,051 tons to match CAMD emissions
SEMAP SO 2 changed from 1,389 tons to 2,717 tons to match CAMD emissions
TECO Big Bend (CAMD_ID = 645 / BB03; SEMAP_ID = 12057 / 0570039 / 3 / 3) SEMAP NOx changed from 1,571 tons to 3,838 tons to match CAMD emissions
SEMAP SO 2 changed from 2,035 tons to 1,773 tons to match CAMD emissions
TECO Big Bend (CAMD_ID = 645 / BB01; SEMAP_ID = 12057 / 0570039 / 1 / 1) BoilerID in SEMAP EP Table changed from BBO4 to BB04 to match CAMD boiler ID SEMAP NOx changed from 1,183 tons to 1,192 tons to match CAMD emissions
SEMAP SO 2 changed from 2,305 tons to 2,414 tons to match CAMD emissions
1.9.7.4 Georgia No changes requested by State. 1.9.7.5 Kentucky Kentucky provided revised SEMAP-to-CAMD mapping for the seven turbines at the KY Utilities Brown Station (CAMD_ID 1355 / #5 to #11; SEMAP_ID 21167 / 00001 /023-29). The revised mapping for emission point 023-29 is as follows:
SEMAP Process ID
V_1_8 CAMD Boiler ID
Revised V_1_9 CAMD Boiler ID
2 5 5
Appendix A - 41 Kentucky Regional Haze 5-Year Periodic Report SIP Revision, September 2014
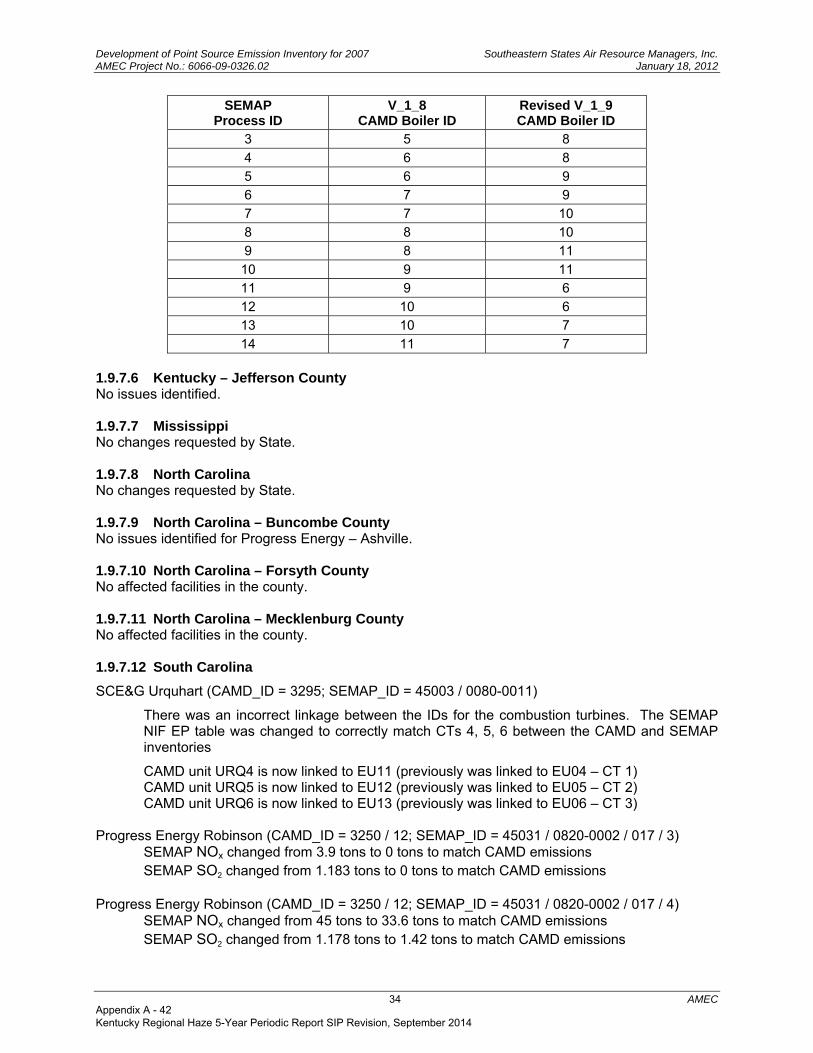
Development of Point Source Emission Inventory for 2007 Southeastern States Air Resource Managers, Inc. AMEC Project No.: 6066-09-0326.02 January 18, 2012
34 AMEC
SEMAP Process ID
V_1_8 CAMD Boiler ID
Revised V_1_9 CAMD Boiler ID
3 5 8
4 6 8
5 6 9
6 7 9
7 7 10
8 8 10
9 8 11
10 9 11
11 9 6
12 10 6
13 10 7
14 11 7 1.9.7.6 Kentucky – Jefferson County No issues identified. 1.9.7.7 Mississippi No changes requested by State. 1.9.7.8 North Carolina No changes requested by State. 1.9.7.9 North Carolina – Buncombe County No issues identified for Progress Energy – Ashville. 1.9.7.10 North Carolina – Forsyth County No affected facilities in the county. 1.9.7.11 North Carolina – Mecklenburg County No affected facilities in the county. 1.9.7.12 South Carolina
SCE&G Urquhart (CAMD_ID = 3295; SEMAP_ID = 45003 / 0080-0011)
There was an incorrect linkage between the IDs for the combustion turbines. The SEMAP NIF EP table was changed to correctly match CTs 4, 5, 6 between the CAMD and SEMAP inventories
CAMD unit URQ4 is now linked to EU11 (previously was linked to EU04 – CT 1) CAMD unit URQ5 is now linked to EU12 (previously was linked to EU05 – CT 2) CAMD unit URQ6 is now linked to EU13 (previously was linked to EU06 – CT 3)
Progress Energy Robinson (CAMD_ID = 3250 / 12; SEMAP_ID = 45031 / 0820-0002 / 017 / 3) SEMAP NOx changed from 3.9 tons to 0 tons to match CAMD emissions
SEMAP SO 2 changed from 1.183 tons to 0 tons to match CAMD emissions
Progress Energy Robinson (CAMD_ID = 3250 / 12; SEMAP_ID = 45031 / 0820-0002 / 017 / 4) SEMAP NOx changed from 45 tons to 33.6 tons to match CAMD emissions
SEMAP SO 2 changed from 1.178 tons to 1.42 tons to match CAMD emissions
Appendix A - 42 Kentucky Regional Haze 5-Year Periodic Report SIP Revision, September 2014
Development of Point Source Emission Inventory for 2007 Southeastern States Air Resource Managers, Inc. AMEC Project No.: 6066-09-0326.02 January 18, 2012
35 AMEC
Progress Energy Robinson (CAMD_ID = 3250 / 13; SEMAP_ID = 45031 / 0820-0002 / 018 / 3) SEMAP NOx changed from 18.3 tons to 0 tons to match CAMD emissions
SEMAP SO 2 changed from 0.847 tons to 0 tons to match CAMD emissions
Progress Energy Robinson (CAMD_ID = 3250 / 13; SEMAP_ID = 45031 / 0820-0002 / 018 / 4) SEMAP NOx changed from 42.4 tons to 31.31 tons to match CAMD emissions
SEMAP SO 2 changed from 1.108 tons to 1.05 tons to match CAMD emissions
Santee Cooper Rainey (CAMD_ID = 7834 / CT1A; SEMAP_ID = 45007 / 0200-0144 / 001 / 1) SEMAP NOx changed from 218.17 tons to 19.71 tons to match CAMD emissions Santee Cooper Rainey (CAMD_ID = 7834 / CT1B; SEMAP_ID = 45007 / 0200-0144 / 001 / 3) SEMAP NOx changed from 218.17 tons to 19.71 tons to match CAMD emissions Santee Cooper Rainey (CAMD_ID = 7834 / CT2A; SEMAP_ID = 45007 / 0200-0144 / 002 / 1) SEMAP NOx changed from 33.40 tons to 16.29 tons to match CAMD emissions Santee Cooper Rainey (CAMD_ID = 7834 / CT2B; SEMAP_ID = 45007 / 0200-0144 / 002 / 3) SEMAP NOx changed from 32.40 tons to 18.21 tons to match CAMD emissions Santee Cooper Rainey (CAMD_ID = 7834 / CT3; SEMAP_ID = 45007 / 0200-0144 / 003 / 1) SEMAP NOx changed from 0.072 tons to 4.4 tons to match CAMD emissions Santee Cooper Rainey (CAMD_ID = 7834 / CT4; SEMAP_ID = 45007 / 0200-0144 / 003 / 2) SEMAP NOx changed from 0.060 tons to 5.13 tons to match CAMD emissions Santee Cooper Rainey (CAMD_ID = 7834 / CT5; SEMAP_ID = 45007 / 0200-0144 / 003 / 3) SEMAP NOx changed from 0.078 tons to 4.79 tons to match CAMD emissions SCE&G Hagood (CAMD_ID = 3285 / HAG4; SEMAP_ID = 45019 / 0560-0029 / 001 / 2) SEMAP NOx changed from 21.1 tons to 31.28 tons to match CAMD emissions
SEMAP SO 2 changed from 34.5 tons to 1.22 tons to match CAMD emissions
1.9.7.13 Tennessee U.S. DOE, Y-12 PLANT (CAMD_ID = 880055 / 31&32&34; SEMAP_ID 47001 / 0020 / 002)
CAMD units 31, 32, and 34 had no match in the SEMAP inventory. Tennessee provided the SEMAP identifiers to provide the correct linkage between CAMD and SEMAP. The NIF EP table was changed to provide the cross-reference between CAMD and SEMAP identifiers.
Bowater Calhoun (CAMD_ID = 50956 / 11& 12; SEMAP_ID = 47107 / 0012 / 015) CAMD reports two coal-fired boilers #11 and #12. In SEMAP, there is only one emission point -015 – that is a coal fired boiler. To improve the match between CAMD and SEMAP, new records were created in the SEMAP database to disaggregate emissions from boilers #11 and #12 into individual records using the NOx and SO
2 emissions data provided by Tennessee.
TVA Cumberland (CAMD_ID = 3399 / A1; SEMAP_ID = 47161 / 0011 / 003 / 01) The SEMAP inventory reported 15.3 tons of NOx for Auxiliary boiler A1 , which was based on allowable emissions and is conservative. For 2007, based on a tested NOx rate of 0.067lb/mmBtu and fuel usage of 132317 gallons of #2 oil, NOx emissions for Auxiliary boiler A1 changed to 0.6 ton.
Appendix A - 43 Kentucky Regional Haze 5-Year Periodic Report SIP Revision, September 2014
Development of Point Source Emission Inventory for 2007 Southeastern States Air Resource Managers, Inc. AMEC Project No.: 6066-09-0326.02 January 18, 2012
36 AMEC
TVA Cumberland (CAMD_ID = 3399 / A2; SEMAP_ID = 47161 / 0011 / 004 / 01)
The SEMAP inventory reported 15.3 tons of NOx for Auxiliary boiler A2, which was based on allowable emissions and is conservative. This unit was not in service in 2007 and does not show up in CAMD for 2007. It did not become operational until 2008. Boiler A2 was inadvertently included in the 2007 SEMAP emission database submittal. All emissions for this unit were changed to 0 for the 2007 SEMAP inventory.
1.9.7.14 Tennessee – Davidson County (Nashville) Eastman Chemical (CAMD_ID = 50481 / 83-23 & 83-24; SEMAP_ID = 47163 / 0003 / 020101)
In the SEMAP V1_8 inventory, the two boilers #23 and #24 were included as a group with boilers #11-22. To improve the match between CAMD and SEMAP, new records were created in the SEMAP database to disaggregate emissions from boilers #23 and #24 into individual records using the NOx and SO
2 emissions data provided by Tennessee. Eastman Chemical (CAMD_ID = 50481 / 253-25, 253-26, 253-27, 253-28 and 253-29; SEMAP_ID = 47163 / 0003 / 021520)
In the SEMAP V1_8 inventory, the five boilers #25 to #29 were grouped together as a single emission point. To improve the match between CAMD and SEMAP, new records were created in the SEMAP database to disaggregate emissions for each boiler #25 to #29 into individual records using the NOx and SO
2 emissions data provided by Tennessee. Eastman Chemical (CAMD_ID = 50481 / 325-30 & 325-31; SEMAP_ID = 47163 / 0003 / 261501)
In the SEMAP V1_8 inventory, the two boilers #30 and #31 were grouped together as a single emission point. To improve the match between CAMD and SEMAP, new records were created in the SEMAP database to disaggregate emissions for each boiler #30 to #31 into individual records using the NOx and SO
2 emissions data provided by Tennessee.
1.9.7.15 Tennessee – Hamilton County (Chattanooga) No affected facilities in the county. 1.9.7.16 Tennessee – Knox County (Knoxville) No affected facilities in the county. 1.9.7.17 Tennessee – Shelby County (Memphis) No issues identified. 1.9.7.18 Virginia Virginia provided detailed comments on how to create hourly emissions for each unit in CAMD. No specific changes were requested to the SEMAP inventory. 1.9.7.19 West Virginia No changes requested by State. 1.9.8 Changes for Version 1.10a of the Point Source Inventory
This section documents the changes to Version 1.9 of the SEMAP point source emission inventory to create Version 1.10a. The purpose of these revisions were to resolve significant differences in emissions as reported by States in Version 1.9 and the CEMs emissions as reported in the Clean Air Market Division’s hourly emission database. Each change that was made is identified along with the CAMD and SEMAP unit identifiers:
CAMD_ID = Plant ORIS / Boiler ID
Appendix A - 44 Kentucky Regional Haze 5-Year Periodic Report SIP Revision, September 2014
Development of Point Source Emission Inventory for 2007 Southeastern States Air Resource Managers, Inc. AMEC Project No.: 6066-09-0326.02 January 18, 2012
37 AMEC
SEMAP_ID = FIPS county code / PlantID / PointID / ProcessID
These changes were made because a number of States have indicated that they would like to have the SEMAP inventory updated to reflect the CAMD NOx and SO
2 emissions from CEMS data. These changes had not been made in version 1.9 because of potential adjustments to the CAMD emissions to account for overly conservative missing data substitution procedures specified by EPA. Once States were allowed to review the proposed revisions to the CAMD emissions to account for missing data substitution, they were given the opportunity to specify the NOx and SO
2 emissions to be used in the final SEMAP 2007 inventory. The choices were: 1) retain State-supplied emissions; 2) use CAMD emissions as provided in standard EPA data sets; or 3) use CAMD emissions as modified by SEMAP to account for overly conservative missing data substitution values. In addition to the changes requested for the CEMS data, there were other changes made as a result of consultation with the States. Those changes are listed separately. Finally, a number of emission release points were identified as having incorrect latitude/longitude values. The final portion of this section details the emission release points that were modified and the new latitude/longitude values. The information below identifies those facilities that had their emissions changed as a result of the CEMS review.
Appendix A - 45 Kentucky Regional Haze 5-Year Periodic Report SIP Revision, September 2014

Development of Point Source Emission Inventory for 2007 Southeastern States Air Resource Managers, Inc. AMEC Project No.: 6066-09-0326.02 January 18, 2012
38 AMEC
1.9.8.1 Alabama County FIPS
Facility Name
Facility ID
Point ID
Process ID orisid blrid6
Pollutant Code Emissions
01001 Southern Power Company 0010 001 01 7897 1A NOX 42.6310
01001 Southern Power Company 0010 001 01 7897 1A SO2 2.0580
01001 Southern Power Company 0010 002 01 7897 1B NOX 42.8550
01001 Southern Power Company 0010 002 01 7897 1B SO2 2.0840
01001 Southern Power Company 0010 003 01 7897 2A NOX 37.7570
01001 Southern Power Company 0010 003 01 7897 2A SO2 1.5300
01001 Southern Power Company 0010 004 01 7897 2B NOX 33.3530
01001 Southern Power Company 0010 004 01 7897 2B SO2 1.4720
01001 Tenaska Alabama II Partners LP 0009 001 01 55440 CTGDB1 NOX 14.5440
01001 Tenaska Alabama II Partners LP 0009 001 01 55440 CTGDB1 SO2 0.5460
01001 Tenaska Alabama II Partners LP 0009 002 01 55440 CTGDB2 NOX 12.6970
01001 Tenaska Alabama II Partners LP 0009 002 01 55440 CTGDB2 SO2 0.4900
01001 Tenaska Alabama II Partners LP 0009 003 01 55440 CTGDB3 NOX 11.2240
01001 Tenaska Alabama II Partners LP 0009 003 01 55440 CTGDB3 SO2 0.4670
01001 Tenaska Alabama Partners LP 0008 001 01 55271 CT1 NOX 15.9050
01001 Tenaska Alabama Partners LP 0008 001 01 55271 CT1 SO2 0.7310
01001 Tenaska Alabama Partners LP 0008 002 01 55271 CT2 NOX 10.4360
01001 Tenaska Alabama Partners LP 0008 002 01 55271 CT2 SO2 0.6860
01001 Tenaska Alabama Partners LP 0008 003 01 55271 CT3 NOX 11.0180
01001 Tenaska Alabama Partners LP 0008 003 01 55271 CT3 SO2 0.5670
01015 Calhoun Power Company I LLC Generating Station 0073 001 01 55409 CT1 NOX 19.5250
01015 Calhoun Power Company I LLC Generating Station 0073 001 01 55409 CT1 SO2 0.5460
01015 Calhoun Power Company I LLC Generating Station 0073 002 01 55409 CT2 NOX 20.0920
01015 Calhoun Power Company I LLC Generating Station 0073 002 01 55409 CT2 SO2 0.5270
01015 Calhoun Power Company I LLC Generating Station 0073 003 01 55409 CT3 NOX 22.8750
01015 Calhoun Power Company I LLC Generating Station 0073 003 01 55409 CT3 SO2 0.6000
01015 Calhoun Power Company I LLC Generating Station 0073 004 01 55409 CT4 NOX 21.9610
01033 TVA 0010 009 01 47 1 NOX 3,103.4850
01033 TVA 0010 009 01 47 1 SO2 5,786.8300
01033 TVA 0010 009 01 47 2 NOX 2,880.0630
01033 TVA 0010 009 01 47 2 SO2 5,339.8070
01033 TVA 0010 009 01 47 3 NOX 3,104.7600
Appendix A - 46 Kentucky Regional Haze 5-Year Periodic Report SIP Revision, September 2014
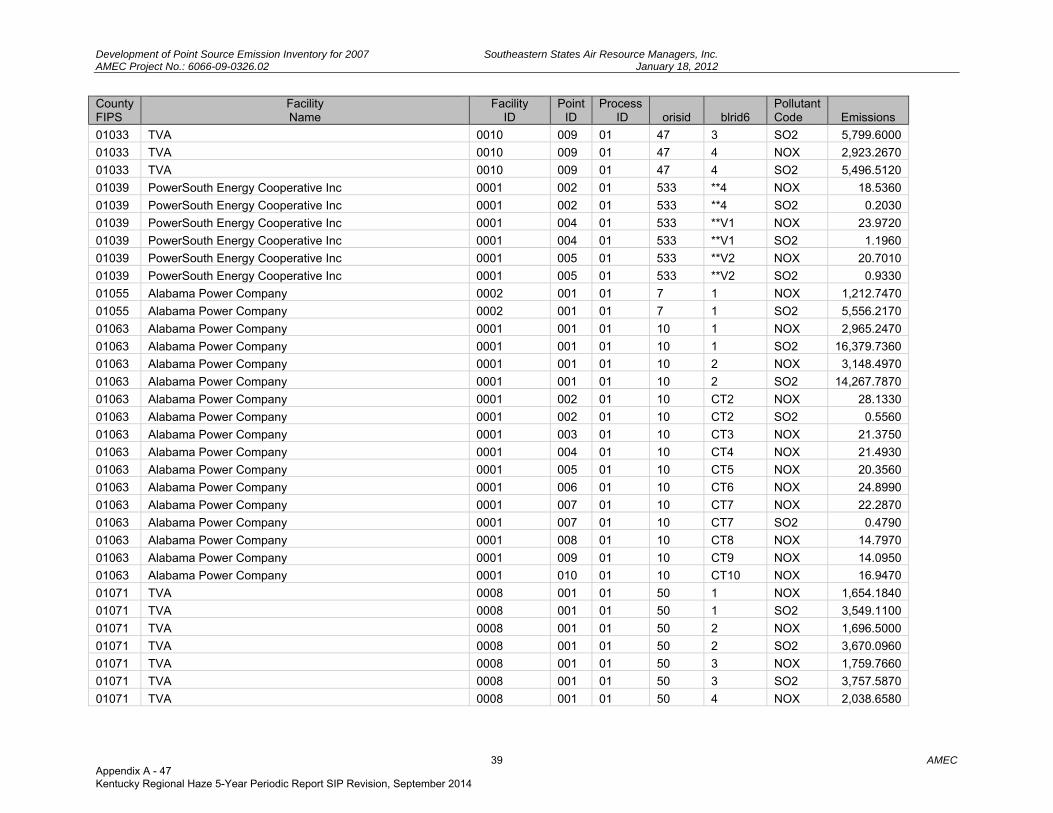
Development of Point Source Emission Inventory for 2007 Southeastern States Air Resource Managers, Inc. AMEC Project No.: 6066-09-0326.02 January 18, 2012
39 AMEC
County FIPS
Facility Name
Facility ID
Point ID
Process ID orisid blrid6
Pollutant Code Emissions
01033 TVA 0010 009 01 47 3 SO2 5,799.6000
01033 TVA 0010 009 01 47 4 NOX 2,923.2670
01033 TVA 0010 009 01 47 4 SO2 5,496.5120
01039 PowerSouth Energy Cooperative Inc 0001 002 01 533 **4 NOX 18.5360
01039 PowerSouth Energy Cooperative Inc 0001 002 01 533 **4 SO2 0.2030
01039 PowerSouth Energy Cooperative Inc 0001 004 01 533 **V1 NOX 23.9720
01039 PowerSouth Energy Cooperative Inc 0001 004 01 533 **V1 SO2 1.1960
01039 PowerSouth Energy Cooperative Inc 0001 005 01 533 **V2 NOX 20.7010
01039 PowerSouth Energy Cooperative Inc 0001 005 01 533 **V2 SO2 0.9330
01055 Alabama Power Company 0002 001 01 7 1 NOX 1,212.7470
01055 Alabama Power Company 0002 001 01 7 1 SO2 5,556.2170
01063 Alabama Power Company 0001 001 01 10 1 NOX 2,965.2470
01063 Alabama Power Company 0001 001 01 10 1 SO2 16,379.7360
01063 Alabama Power Company 0001 001 01 10 2 NOX 3,148.4970
01063 Alabama Power Company 0001 001 01 10 2 SO2 14,267.7870
01063 Alabama Power Company 0001 002 01 10 CT2 NOX 28.1330
01063 Alabama Power Company 0001 002 01 10 CT2 SO2 0.5560
01063 Alabama Power Company 0001 003 01 10 CT3 NOX 21.3750
01063 Alabama Power Company 0001 004 01 10 CT4 NOX 21.4930
01063 Alabama Power Company 0001 005 01 10 CT5 NOX 20.3560
01063 Alabama Power Company 0001 006 01 10 CT6 NOX 24.8990
01063 Alabama Power Company 0001 007 01 10 CT7 NOX 22.2870
01063 Alabama Power Company 0001 007 01 10 CT7 SO2 0.4790
01063 Alabama Power Company 0001 008 01 10 CT8 NOX 14.7970
01063 Alabama Power Company 0001 009 01 10 CT9 NOX 14.0950
01063 Alabama Power Company 0001 010 01 10 CT10 NOX 16.9470
01071 TVA 0008 001 01 50 1 NOX 1,654.1840
01071 TVA 0008 001 01 50 1 SO2 3,549.1100
01071 TVA 0008 001 01 50 2 NOX 1,696.5000
01071 TVA 0008 001 01 50 2 SO2 3,670.0960
01071 TVA 0008 001 01 50 3 NOX 1,759.7660
01071 TVA 0008 001 01 50 3 SO2 3,757.5870
01071 TVA 0008 001 01 50 4 NOX 2,038.6580
Appendix A - 47 Kentucky Regional Haze 5-Year Periodic Report SIP Revision, September 2014

Development of Point Source Emission Inventory for 2007 Southeastern States Air Resource Managers, Inc. AMEC Project No.: 6066-09-0326.02 January 18, 2012
40 AMEC
County FIPS
Facility Name
Facility ID
Point ID
Process ID orisid blrid6
Pollutant Code Emissions
01071 TVA 0008 001 01 50 4 SO2 4,357.2980
01071 TVA 0008 001 01 50 5 SO2 2,834.6960
01071 TVA 0008 001 01 50 6 NOX 1,823.3140
01071 TVA 0008 001 01 50 6 SO2 3,934.9880
01071 TVA 0008 002 01 50 7 NOX 3,694.2000
01071 TVA 0008 002 01 50 7 SO2 6,518.6660
01071 TVA 0008 003 01 50 8 NOX 3,646.9630
01071 TVA 0008 003 01 50 8 SO2 4,100.9450
01073 ALABAMA POWER COMPANY (MILLER POWER PLANT) 0107300011 101 1 6002 1 NOX 5,772.4190
01073 ALABAMA POWER COMPANY (MILLER POWER PLANT) 0107300011 101 1 6002 1 SO2 16,967.2890
01073 ALABAMA POWER COMPANY (MILLER POWER PLANT) 0107300011 102 1 6002 2 NOX 5,682.3080
01073 ALABAMA POWER COMPANY (MILLER POWER PLANT) 0107300011 102 1 6002 2 SO2 15,760.1930
01073 ALABAMA POWER COMPANY (MILLER POWER PLANT) 0107300011 103 1 6002 3 NOX 5,446.4410
01073 ALABAMA POWER COMPANY (MILLER POWER PLANT) 0107300011 103 1 6002 3 SO2 13,515.0930
01073 ALABAMA POWER COMPANY (MILLER POWER PLANT) 0107300011 104 1 6002 4 NOX 5,160.8730
01073 ALABAMA POWER COMPANY (MILLER POWER PLANT) 0107300011 104 1 6002 4 SO2 13,285.2740
01081 Southern Power Company 0036 001 01 7710 1A NOX 36.0060
01081 Southern Power Company 0036 001 01 7710 1A SO2 1.8460
01081 Southern Power Company 0036 002 01 7710 1B NOX 34.5010
01081 Southern Power Company 0036 002 01 7710 1B SO2 1.8220
01081 Southern Power Company 0036 003 01 7710 2A NOX 40.4660
01081 Southern Power Company 0036 003 01 7710 2A SO2 2.1160
01081 Southern Power Company 0036 004 01 7710 2B NOX 37.2160
01081 Southern Power Company 0036 004 01 7710 2B SO2 2.1160
01097 Alabama Power Company 1001 001 01 3 1 NOX 1,484.2650
01097 Alabama Power Company 1001 001 01 3 1 SO2 4,814.7100
01097 Alabama Power Company 1001 001 01 3 2 NOX 1,653.9850
01097 Alabama Power Company 1001 001 01 3 2 SO2 5,244.4200
01097 Alabama Power Company 1001 001 01 3 3 NOX 2,834.0110
01097 Alabama Power Company 1001 001 01 3 3 SO2 8,907.2170
01097 Alabama Power Company 1001 002 01 3 4 NOX 3,000.1140
01097 Alabama Power Company 1001 002 01 3 4 SO2 10,938.6620
01097 Alabama Power Company 1001 003 01 3 5 SO2 21,362.0720
Appendix A - 48 Kentucky Regional Haze 5-Year Periodic Report SIP Revision, September 2014
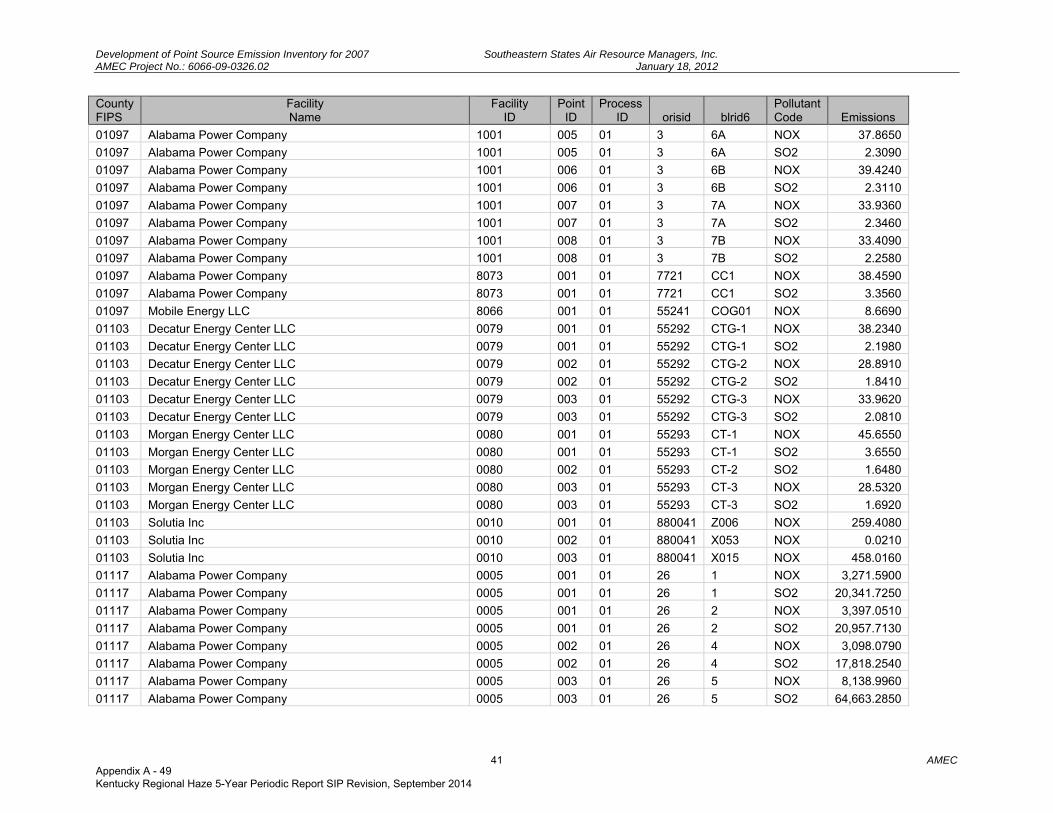
Development of Point Source Emission Inventory for 2007 Southeastern States Air Resource Managers, Inc. AMEC Project No.: 6066-09-0326.02 January 18, 2012
41 AMEC
County FIPS
Facility Name
Facility ID
Point ID
Process ID orisid blrid6
Pollutant Code Emissions
01097 Alabama Power Company 1001 005 01 3 6A NOX 37.8650
01097 Alabama Power Company 1001 005 01 3 6A SO2 2.3090
01097 Alabama Power Company 1001 006 01 3 6B NOX 39.4240
01097 Alabama Power Company 1001 006 01 3 6B SO2 2.3110
01097 Alabama Power Company 1001 007 01 3 7A NOX 33.9360
01097 Alabama Power Company 1001 007 01 3 7A SO2 2.3460
01097 Alabama Power Company 1001 008 01 3 7B NOX 33.4090
01097 Alabama Power Company 1001 008 01 3 7B SO2 2.2580
01097 Alabama Power Company 8073 001 01 7721 CC1 NOX 38.4590
01097 Alabama Power Company 8073 001 01 7721 CC1 SO2 3.3560
01097 Mobile Energy LLC 8066 001 01 55241 COG01 NOX 8.6690
01103 Decatur Energy Center LLC 0079 001 01 55292 CTG-1 NOX 38.2340
01103 Decatur Energy Center LLC 0079 001 01 55292 CTG-1 SO2 2.1980
01103 Decatur Energy Center LLC 0079 002 01 55292 CTG-2 NOX 28.8910
01103 Decatur Energy Center LLC 0079 002 01 55292 CTG-2 SO2 1.8410
01103 Decatur Energy Center LLC 0079 003 01 55292 CTG-3 NOX 33.9620
01103 Decatur Energy Center LLC 0079 003 01 55292 CTG-3 SO2 2.0810
01103 Morgan Energy Center LLC 0080 001 01 55293 CT-1 NOX 45.6550
01103 Morgan Energy Center LLC 0080 001 01 55293 CT-1 SO2 3.6550
01103 Morgan Energy Center LLC 0080 002 01 55293 CT-2 SO2 1.6480
01103 Morgan Energy Center LLC 0080 003 01 55293 CT-3 NOX 28.5320
01103 Morgan Energy Center LLC 0080 003 01 55293 CT-3 SO2 1.6920
01103 Solutia Inc 0010 001 01 880041 Z006 NOX 259.4080
01103 Solutia Inc 0010 002 01 880041 X053 NOX 0.0210
01103 Solutia Inc 0010 003 01 880041 X015 NOX 458.0160
01117 Alabama Power Company 0005 001 01 26 1 NOX 3,271.5900
01117 Alabama Power Company 0005 001 01 26 1 SO2 20,341.7250
01117 Alabama Power Company 0005 001 01 26 2 NOX 3,397.0510
01117 Alabama Power Company 0005 001 01 26 2 SO2 20,957.7130
01117 Alabama Power Company 0005 002 01 26 4 NOX 3,098.0790
01117 Alabama Power Company 0005 002 01 26 4 SO2 17,818.2540
01117 Alabama Power Company 0005 003 01 26 5 NOX 8,138.9960
01117 Alabama Power Company 0005 003 01 26 5 SO2 64,663.2850
Appendix A - 49 Kentucky Regional Haze 5-Year Periodic Report SIP Revision, September 2014
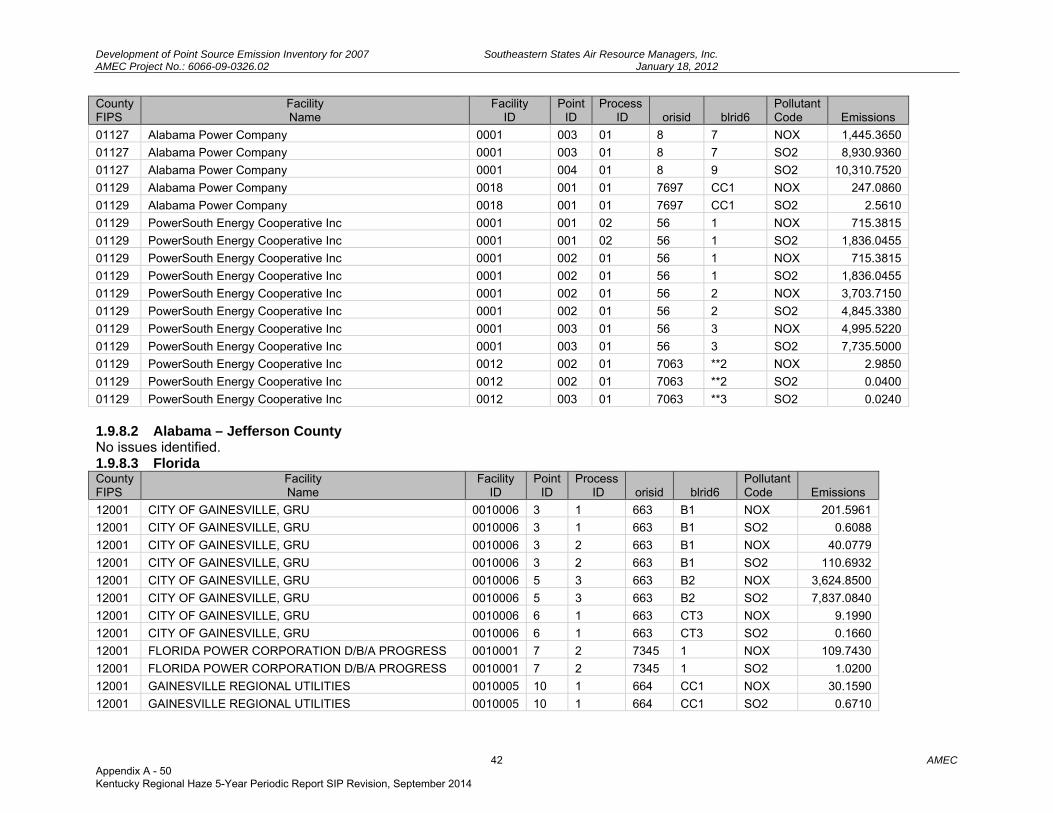
Development of Point Source Emission Inventory for 2007 Southeastern States Air Resource Managers, Inc. AMEC Project No.: 6066-09-0326.02 January 18, 2012
42 AMEC
County FIPS
Facility Name
Facility ID
Point ID
Process ID orisid blrid6
Pollutant Code Emissions
01127 Alabama Power Company 0001 003 01 8 7 NOX 1,445.3650
01127 Alabama Power Company 0001 003 01 8 7 SO2 8,930.9360
01127 Alabama Power Company 0001 004 01 8 9 SO2 10,310.7520
01129 Alabama Power Company 0018 001 01 7697 CC1 NOX 247.0860
01129 Alabama Power Company 0018 001 01 7697 CC1 SO2 2.5610
01129 PowerSouth Energy Cooperative Inc 0001 001 02 56 1 NOX 715.3815
01129 PowerSouth Energy Cooperative Inc 0001 001 02 56 1 SO2 1,836.0455
01129 PowerSouth Energy Cooperative Inc 0001 002 01 56 1 NOX 715.3815
01129 PowerSouth Energy Cooperative Inc 0001 002 01 56 1 SO2 1,836.0455
01129 PowerSouth Energy Cooperative Inc 0001 002 01 56 2 NOX 3,703.7150
01129 PowerSouth Energy Cooperative Inc 0001 002 01 56 2 SO2 4,845.3380
01129 PowerSouth Energy Cooperative Inc 0001 003 01 56 3 NOX 4,995.5220
01129 PowerSouth Energy Cooperative Inc 0001 003 01 56 3 SO2 7,735.5000
01129 PowerSouth Energy Cooperative Inc 0012 002 01 7063 **2 NOX 2.9850
01129 PowerSouth Energy Cooperative Inc 0012 002 01 7063 **2 SO2 0.0400
01129 PowerSouth Energy Cooperative Inc 0012 003 01 7063 **3 SO2 0.0240 1.9.8.2 Alabama – Jefferson County No issues identified. 1.9.8.3 Florida County FIPS
Facility Name
Facility ID
Point ID
Process ID orisid blrid6
Pollutant Code Emissions
12001 CITY OF GAINESVILLE, GRU 0010006 3 1 663 B1 NOX 201.5961
12001 CITY OF GAINESVILLE, GRU 0010006 3 1 663 B1 SO2 0.6088
12001 CITY OF GAINESVILLE, GRU 0010006 3 2 663 B1 NOX 40.0779
12001 CITY OF GAINESVILLE, GRU 0010006 3 2 663 B1 SO2 110.6932
12001 CITY OF GAINESVILLE, GRU 0010006 5 3 663 B2 NOX 3,624.8500
12001 CITY OF GAINESVILLE, GRU 0010006 5 3 663 B2 SO2 7,837.0840
12001 CITY OF GAINESVILLE, GRU 0010006 6 1 663 CT3 NOX 9.1990
12001 CITY OF GAINESVILLE, GRU 0010006 6 1 663 CT3 SO2 0.1660
12001 FLORIDA POWER CORPORATION D/B/A PROGRESS 0010001 7 2 7345 1 NOX 109.7430
12001 FLORIDA POWER CORPORATION D/B/A PROGRESS 0010001 7 2 7345 1 SO2 1.0200
12001 GAINESVILLE REGIONAL UTILITIES 0010005 10 1 664 CC1 NOX 30.1590
12001 GAINESVILLE REGIONAL UTILITIES 0010005 10 1 664 CC1 SO2 0.6710
Appendix A - 50 Kentucky Regional Haze 5-Year Periodic Report SIP Revision, September 2014
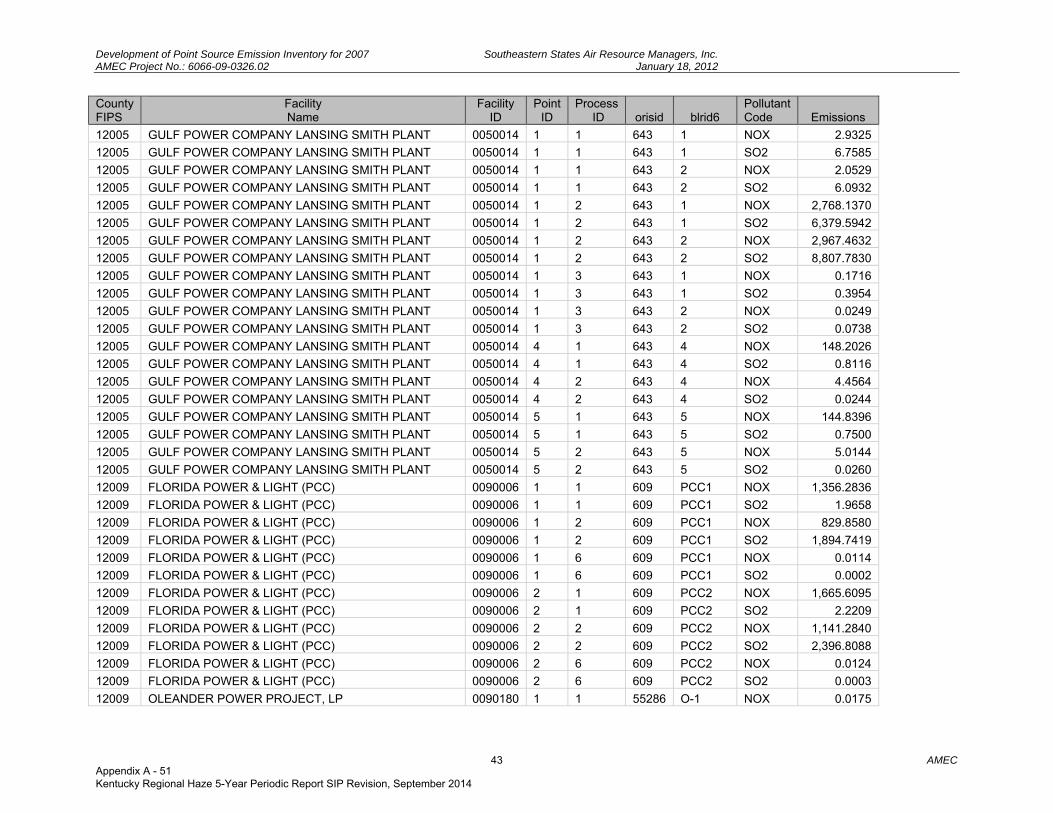
Development of Point Source Emission Inventory for 2007 Southeastern States Air Resource Managers, Inc. AMEC Project No.: 6066-09-0326.02 January 18, 2012
43 AMEC
County FIPS
Facility Name
Facility ID
Point ID
Process ID orisid blrid6
Pollutant Code Emissions
12005 GULF POWER COMPANY LANSING SMITH PLANT 0050014 1 1 643 1 NOX 2.9325
12005 GULF POWER COMPANY LANSING SMITH PLANT 0050014 1 1 643 1 SO2 6.7585
12005 GULF POWER COMPANY LANSING SMITH PLANT 0050014 1 1 643 2 NOX 2.0529
12005 GULF POWER COMPANY LANSING SMITH PLANT 0050014 1 1 643 2 SO2 6.0932
12005 GULF POWER COMPANY LANSING SMITH PLANT 0050014 1 2 643 1 NOX 2,768.1370
12005 GULF POWER COMPANY LANSING SMITH PLANT 0050014 1 2 643 1 SO2 6,379.5942
12005 GULF POWER COMPANY LANSING SMITH PLANT 0050014 1 2 643 2 NOX 2,967.4632
12005 GULF POWER COMPANY LANSING SMITH PLANT 0050014 1 2 643 2 SO2 8,807.7830
12005 GULF POWER COMPANY LANSING SMITH PLANT 0050014 1 3 643 1 NOX 0.1716
12005 GULF POWER COMPANY LANSING SMITH PLANT 0050014 1 3 643 1 SO2 0.3954
12005 GULF POWER COMPANY LANSING SMITH PLANT 0050014 1 3 643 2 NOX 0.0249
12005 GULF POWER COMPANY LANSING SMITH PLANT 0050014 1 3 643 2 SO2 0.0738
12005 GULF POWER COMPANY LANSING SMITH PLANT 0050014 4 1 643 4 NOX 148.2026
12005 GULF POWER COMPANY LANSING SMITH PLANT 0050014 4 1 643 4 SO2 0.8116
12005 GULF POWER COMPANY LANSING SMITH PLANT 0050014 4 2 643 4 NOX 4.4564
12005 GULF POWER COMPANY LANSING SMITH PLANT 0050014 4 2 643 4 SO2 0.0244
12005 GULF POWER COMPANY LANSING SMITH PLANT 0050014 5 1 643 5 NOX 144.8396
12005 GULF POWER COMPANY LANSING SMITH PLANT 0050014 5 1 643 5 SO2 0.7500
12005 GULF POWER COMPANY LANSING SMITH PLANT 0050014 5 2 643 5 NOX 5.0144
12005 GULF POWER COMPANY LANSING SMITH PLANT 0050014 5 2 643 5 SO2 0.0260
12009 FLORIDA POWER & LIGHT (PCC) 0090006 1 1 609 PCC1 NOX 1,356.2836
12009 FLORIDA POWER & LIGHT (PCC) 0090006 1 1 609 PCC1 SO2 1.9658
12009 FLORIDA POWER & LIGHT (PCC) 0090006 1 2 609 PCC1 NOX 829.8580
12009 FLORIDA POWER & LIGHT (PCC) 0090006 1 2 609 PCC1 SO2 1,894.7419
12009 FLORIDA POWER & LIGHT (PCC) 0090006 1 6 609 PCC1 NOX 0.0114
12009 FLORIDA POWER & LIGHT (PCC) 0090006 1 6 609 PCC1 SO2 0.0002
12009 FLORIDA POWER & LIGHT (PCC) 0090006 2 1 609 PCC2 NOX 1,665.6095
12009 FLORIDA POWER & LIGHT (PCC) 0090006 2 1 609 PCC2 SO2 2.2209
12009 FLORIDA POWER & LIGHT (PCC) 0090006 2 2 609 PCC2 NOX 1,141.2840
12009 FLORIDA POWER & LIGHT (PCC) 0090006 2 2 609 PCC2 SO2 2,396.8088
12009 FLORIDA POWER & LIGHT (PCC) 0090006 2 6 609 PCC2 NOX 0.0124
12009 FLORIDA POWER & LIGHT (PCC) 0090006 2 6 609 PCC2 SO2 0.0003
12009 OLEANDER POWER PROJECT, LP 0090180 1 1 55286 O-1 NOX 0.0175
Appendix A - 51 Kentucky Regional Haze 5-Year Periodic Report SIP Revision, September 2014
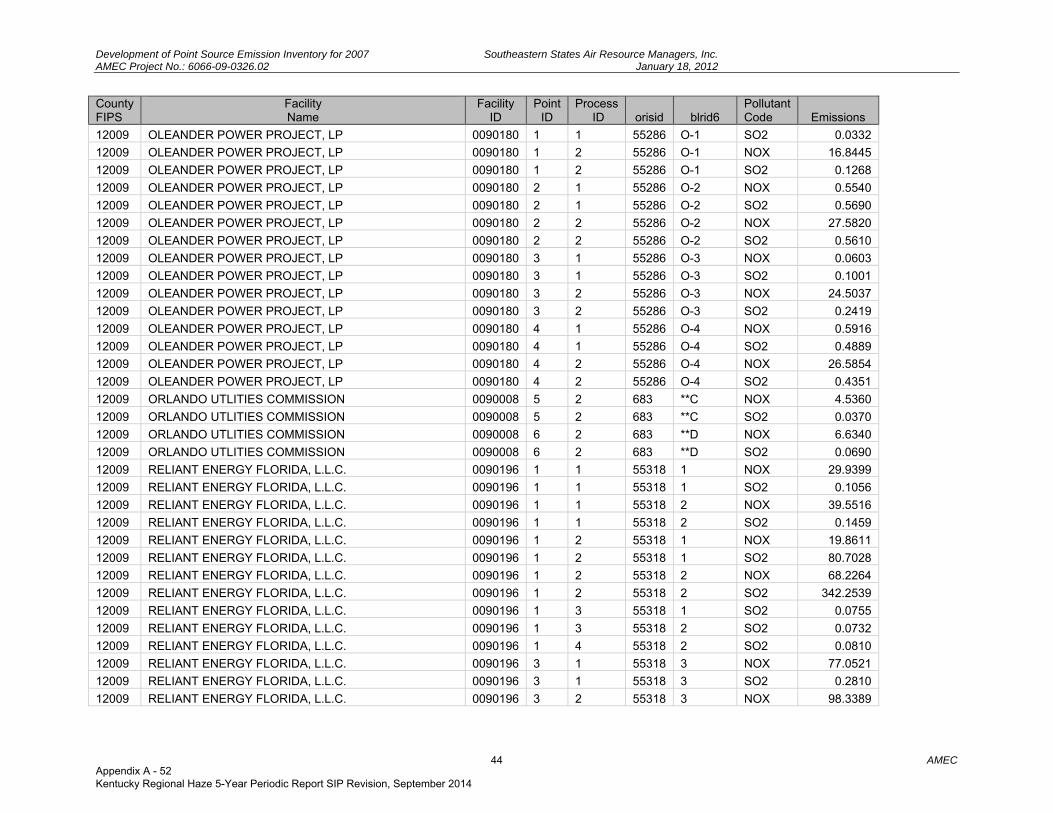
Development of Point Source Emission Inventory for 2007 Southeastern States Air Resource Managers, Inc. AMEC Project No.: 6066-09-0326.02 January 18, 2012
44 AMEC
County FIPS
Facility Name
Facility ID
Point ID
Process ID orisid blrid6
Pollutant Code Emissions
12009 OLEANDER POWER PROJECT, LP 0090180 1 1 55286 O-1 SO2 0.0332
12009 OLEANDER POWER PROJECT, LP 0090180 1 2 55286 O-1 NOX 16.8445
12009 OLEANDER POWER PROJECT, LP 0090180 1 2 55286 O-1 SO2 0.1268
12009 OLEANDER POWER PROJECT, LP 0090180 2 1 55286 O-2 NOX 0.5540
12009 OLEANDER POWER PROJECT, LP 0090180 2 1 55286 O-2 SO2 0.5690
12009 OLEANDER POWER PROJECT, LP 0090180 2 2 55286 O-2 NOX 27.5820
12009 OLEANDER POWER PROJECT, LP 0090180 2 2 55286 O-2 SO2 0.5610
12009 OLEANDER POWER PROJECT, LP 0090180 3 1 55286 O-3 NOX 0.0603
12009 OLEANDER POWER PROJECT, LP 0090180 3 1 55286 O-3 SO2 0.1001
12009 OLEANDER POWER PROJECT, LP 0090180 3 2 55286 O-3 NOX 24.5037
12009 OLEANDER POWER PROJECT, LP 0090180 3 2 55286 O-3 SO2 0.2419
12009 OLEANDER POWER PROJECT, LP 0090180 4 1 55286 O-4 NOX 0.5916
12009 OLEANDER POWER PROJECT, LP 0090180 4 1 55286 O-4 SO2 0.4889
12009 OLEANDER POWER PROJECT, LP 0090180 4 2 55286 O-4 NOX 26.5854
12009 OLEANDER POWER PROJECT, LP 0090180 4 2 55286 O-4 SO2 0.4351
12009 ORLANDO UTLITIES COMMISSION 0090008 5 2 683 **C NOX 4.5360
12009 ORLANDO UTLITIES COMMISSION 0090008 5 2 683 **C SO2 0.0370
12009 ORLANDO UTLITIES COMMISSION 0090008 6 2 683 **D NOX 6.6340
12009 ORLANDO UTLITIES COMMISSION 0090008 6 2 683 **D SO2 0.0690
12009 RELIANT ENERGY FLORIDA, L.L.C. 0090196 1 1 55318 1 NOX 29.9399
12009 RELIANT ENERGY FLORIDA, L.L.C. 0090196 1 1 55318 1 SO2 0.1056
12009 RELIANT ENERGY FLORIDA, L.L.C. 0090196 1 1 55318 2 NOX 39.5516
12009 RELIANT ENERGY FLORIDA, L.L.C. 0090196 1 1 55318 2 SO2 0.1459
12009 RELIANT ENERGY FLORIDA, L.L.C. 0090196 1 2 55318 1 NOX 19.8611
12009 RELIANT ENERGY FLORIDA, L.L.C. 0090196 1 2 55318 1 SO2 80.7028
12009 RELIANT ENERGY FLORIDA, L.L.C. 0090196 1 2 55318 2 NOX 68.2264
12009 RELIANT ENERGY FLORIDA, L.L.C. 0090196 1 2 55318 2 SO2 342.2539
12009 RELIANT ENERGY FLORIDA, L.L.C. 0090196 1 3 55318 1 SO2 0.0755
12009 RELIANT ENERGY FLORIDA, L.L.C. 0090196 1 3 55318 2 SO2 0.0732
12009 RELIANT ENERGY FLORIDA, L.L.C. 0090196 1 4 55318 2 SO2 0.0810
12009 RELIANT ENERGY FLORIDA, L.L.C. 0090196 3 1 55318 3 NOX 77.0521
12009 RELIANT ENERGY FLORIDA, L.L.C. 0090196 3 1 55318 3 SO2 0.2810
12009 RELIANT ENERGY FLORIDA, L.L.C. 0090196 3 2 55318 3 NOX 98.3389
Appendix A - 52 Kentucky Regional Haze 5-Year Periodic Report SIP Revision, September 2014
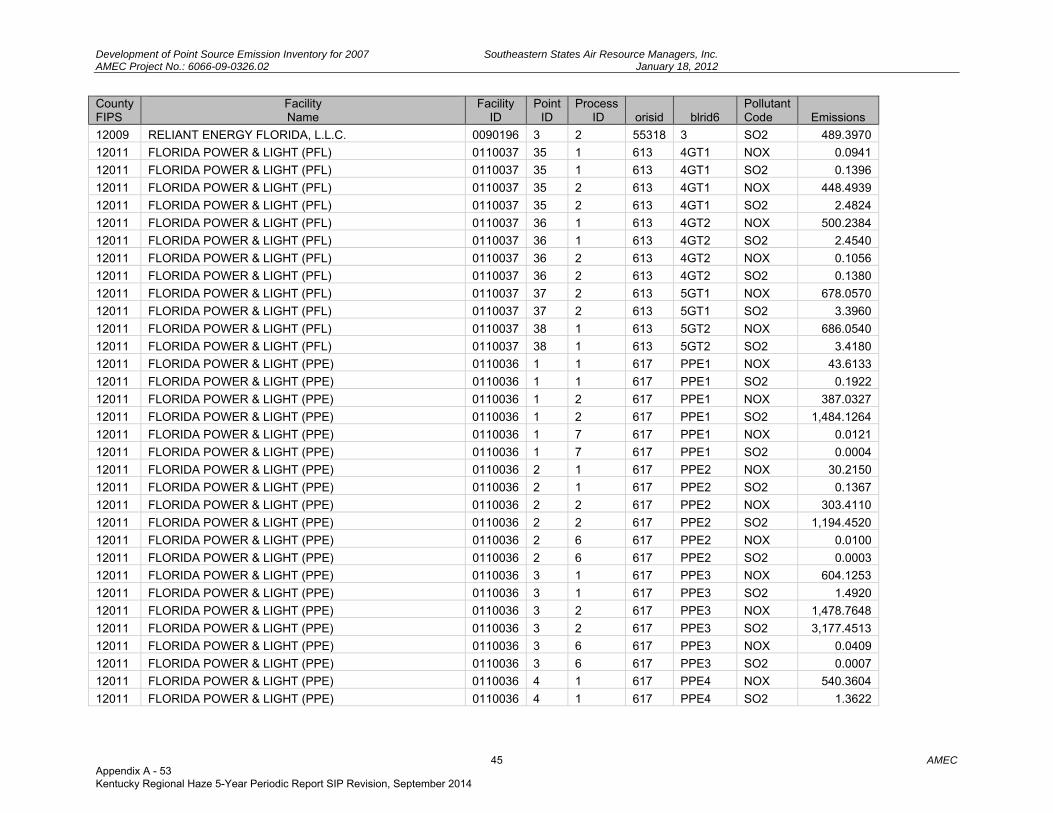
Development of Point Source Emission Inventory for 2007 Southeastern States Air Resource Managers, Inc. AMEC Project No.: 6066-09-0326.02 January 18, 2012
45 AMEC
County FIPS
Facility Name
Facility ID
Point ID
Process ID orisid blrid6
Pollutant Code Emissions
12009 RELIANT ENERGY FLORIDA, L.L.C. 0090196 3 2 55318 3 SO2 489.3970
12011 FLORIDA POWER & LIGHT (PFL) 0110037 35 1 613 4GT1 NOX 0.0941
12011 FLORIDA POWER & LIGHT (PFL) 0110037 35 1 613 4GT1 SO2 0.1396
12011 FLORIDA POWER & LIGHT (PFL) 0110037 35 2 613 4GT1 NOX 448.4939
12011 FLORIDA POWER & LIGHT (PFL) 0110037 35 2 613 4GT1 SO2 2.4824
12011 FLORIDA POWER & LIGHT (PFL) 0110037 36 1 613 4GT2 NOX 500.2384
12011 FLORIDA POWER & LIGHT (PFL) 0110037 36 1 613 4GT2 SO2 2.4540
12011 FLORIDA POWER & LIGHT (PFL) 0110037 36 2 613 4GT2 NOX 0.1056
12011 FLORIDA POWER & LIGHT (PFL) 0110037 36 2 613 4GT2 SO2 0.1380
12011 FLORIDA POWER & LIGHT (PFL) 0110037 37 2 613 5GT1 NOX 678.0570
12011 FLORIDA POWER & LIGHT (PFL) 0110037 37 2 613 5GT1 SO2 3.3960
12011 FLORIDA POWER & LIGHT (PFL) 0110037 38 1 613 5GT2 NOX 686.0540
12011 FLORIDA POWER & LIGHT (PFL) 0110037 38 1 613 5GT2 SO2 3.4180
12011 FLORIDA POWER & LIGHT (PPE) 0110036 1 1 617 PPE1 NOX 43.6133
12011 FLORIDA POWER & LIGHT (PPE) 0110036 1 1 617 PPE1 SO2 0.1922
12011 FLORIDA POWER & LIGHT (PPE) 0110036 1 2 617 PPE1 NOX 387.0327
12011 FLORIDA POWER & LIGHT (PPE) 0110036 1 2 617 PPE1 SO2 1,484.1264
12011 FLORIDA POWER & LIGHT (PPE) 0110036 1 7 617 PPE1 NOX 0.0121
12011 FLORIDA POWER & LIGHT (PPE) 0110036 1 7 617 PPE1 SO2 0.0004
12011 FLORIDA POWER & LIGHT (PPE) 0110036 2 1 617 PPE2 NOX 30.2150
12011 FLORIDA POWER & LIGHT (PPE) 0110036 2 1 617 PPE2 SO2 0.1367
12011 FLORIDA POWER & LIGHT (PPE) 0110036 2 2 617 PPE2 NOX 303.4110
12011 FLORIDA POWER & LIGHT (PPE) 0110036 2 2 617 PPE2 SO2 1,194.4520
12011 FLORIDA POWER & LIGHT (PPE) 0110036 2 6 617 PPE2 NOX 0.0100
12011 FLORIDA POWER & LIGHT (PPE) 0110036 2 6 617 PPE2 SO2 0.0003
12011 FLORIDA POWER & LIGHT (PPE) 0110036 3 1 617 PPE3 NOX 604.1253
12011 FLORIDA POWER & LIGHT (PPE) 0110036 3 1 617 PPE3 SO2 1.4920
12011 FLORIDA POWER & LIGHT (PPE) 0110036 3 2 617 PPE3 NOX 1,478.7648
12011 FLORIDA POWER & LIGHT (PPE) 0110036 3 2 617 PPE3 SO2 3,177.4513
12011 FLORIDA POWER & LIGHT (PPE) 0110036 3 6 617 PPE3 NOX 0.0409
12011 FLORIDA POWER & LIGHT (PPE) 0110036 3 6 617 PPE3 SO2 0.0007
12011 FLORIDA POWER & LIGHT (PPE) 0110036 4 1 617 PPE4 NOX 540.3604
12011 FLORIDA POWER & LIGHT (PPE) 0110036 4 1 617 PPE4 SO2 1.3622
Appendix A - 53 Kentucky Regional Haze 5-Year Periodic Report SIP Revision, September 2014
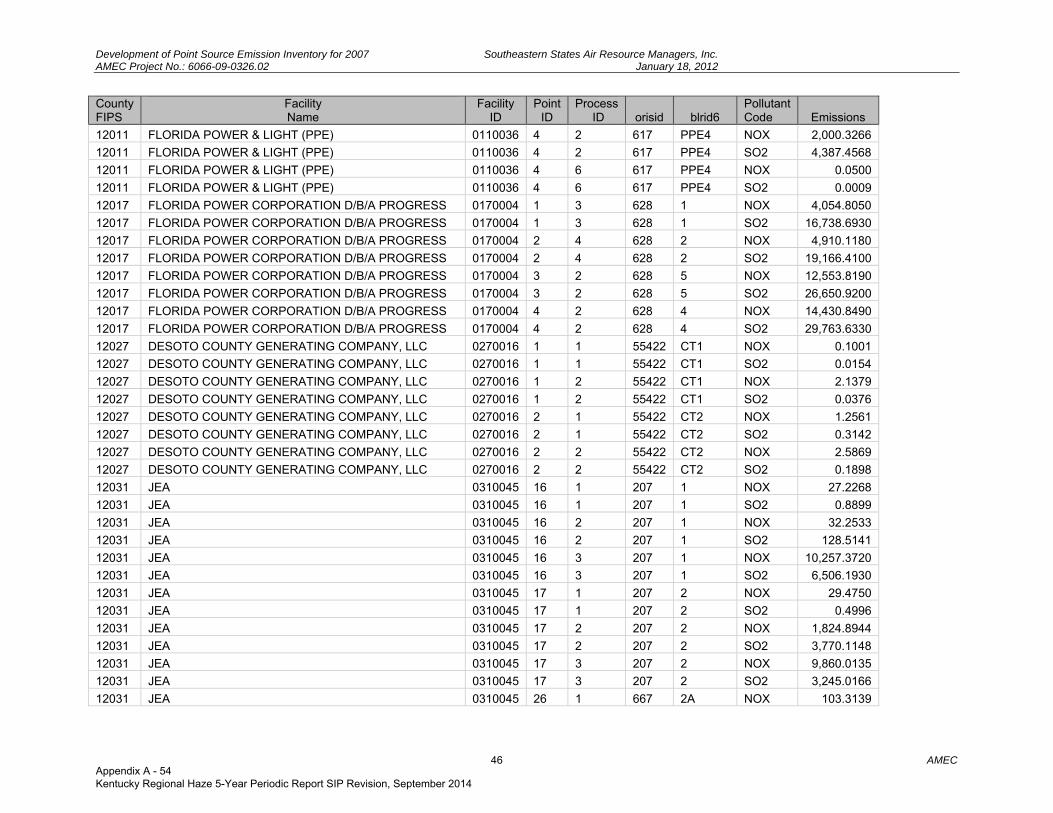
Development of Point Source Emission Inventory for 2007 Southeastern States Air Resource Managers, Inc. AMEC Project No.: 6066-09-0326.02 January 18, 2012
46 AMEC
County FIPS
Facility Name
Facility ID
Point ID
Process ID orisid blrid6
Pollutant Code Emissions
12011 FLORIDA POWER & LIGHT (PPE) 0110036 4 2 617 PPE4 NOX 2,000.3266
12011 FLORIDA POWER & LIGHT (PPE) 0110036 4 2 617 PPE4 SO2 4,387.4568
12011 FLORIDA POWER & LIGHT (PPE) 0110036 4 6 617 PPE4 NOX 0.0500
12011 FLORIDA POWER & LIGHT (PPE) 0110036 4 6 617 PPE4 SO2 0.0009
12017 FLORIDA POWER CORPORATION D/B/A PROGRESS 0170004 1 3 628 1 NOX 4,054.8050
12017 FLORIDA POWER CORPORATION D/B/A PROGRESS 0170004 1 3 628 1 SO2 16,738.6930
12017 FLORIDA POWER CORPORATION D/B/A PROGRESS 0170004 2 4 628 2 NOX 4,910.1180
12017 FLORIDA POWER CORPORATION D/B/A PROGRESS 0170004 2 4 628 2 SO2 19,166.4100
12017 FLORIDA POWER CORPORATION D/B/A PROGRESS 0170004 3 2 628 5 NOX 12,553.8190
12017 FLORIDA POWER CORPORATION D/B/A PROGRESS 0170004 3 2 628 5 SO2 26,650.9200
12017 FLORIDA POWER CORPORATION D/B/A PROGRESS 0170004 4 2 628 4 NOX 14,430.8490
12017 FLORIDA POWER CORPORATION D/B/A PROGRESS 0170004 4 2 628 4 SO2 29,763.6330
12027 DESOTO COUNTY GENERATING COMPANY, LLC 0270016 1 1 55422 CT1 NOX 0.1001
12027 DESOTO COUNTY GENERATING COMPANY, LLC 0270016 1 1 55422 CT1 SO2 0.0154
12027 DESOTO COUNTY GENERATING COMPANY, LLC 0270016 1 2 55422 CT1 NOX 2.1379
12027 DESOTO COUNTY GENERATING COMPANY, LLC 0270016 1 2 55422 CT1 SO2 0.0376
12027 DESOTO COUNTY GENERATING COMPANY, LLC 0270016 2 1 55422 CT2 NOX 1.2561
12027 DESOTO COUNTY GENERATING COMPANY, LLC 0270016 2 1 55422 CT2 SO2 0.3142
12027 DESOTO COUNTY GENERATING COMPANY, LLC 0270016 2 2 55422 CT2 NOX 2.5869
12027 DESOTO COUNTY GENERATING COMPANY, LLC 0270016 2 2 55422 CT2 SO2 0.1898
12031 JEA 0310045 16 1 207 1 NOX 27.2268
12031 JEA 0310045 16 1 207 1 SO2 0.8899
12031 JEA 0310045 16 2 207 1 NOX 32.2533
12031 JEA 0310045 16 2 207 1 SO2 128.5141
12031 JEA 0310045 16 3 207 1 NOX 10,257.3720
12031 JEA 0310045 16 3 207 1 SO2 6,506.1930
12031 JEA 0310045 17 1 207 2 NOX 29.4750
12031 JEA 0310045 17 1 207 2 SO2 0.4996
12031 JEA 0310045 17 2 207 2 NOX 1,824.8944
12031 JEA 0310045 17 2 207 2 SO2 3,770.1148
12031 JEA 0310045 17 3 207 2 NOX 9,860.0135
12031 JEA 0310045 17 3 207 2 SO2 3,245.0166
12031 JEA 0310045 26 1 667 2A NOX 103.3139
Appendix A - 54 Kentucky Regional Haze 5-Year Periodic Report SIP Revision, September 2014
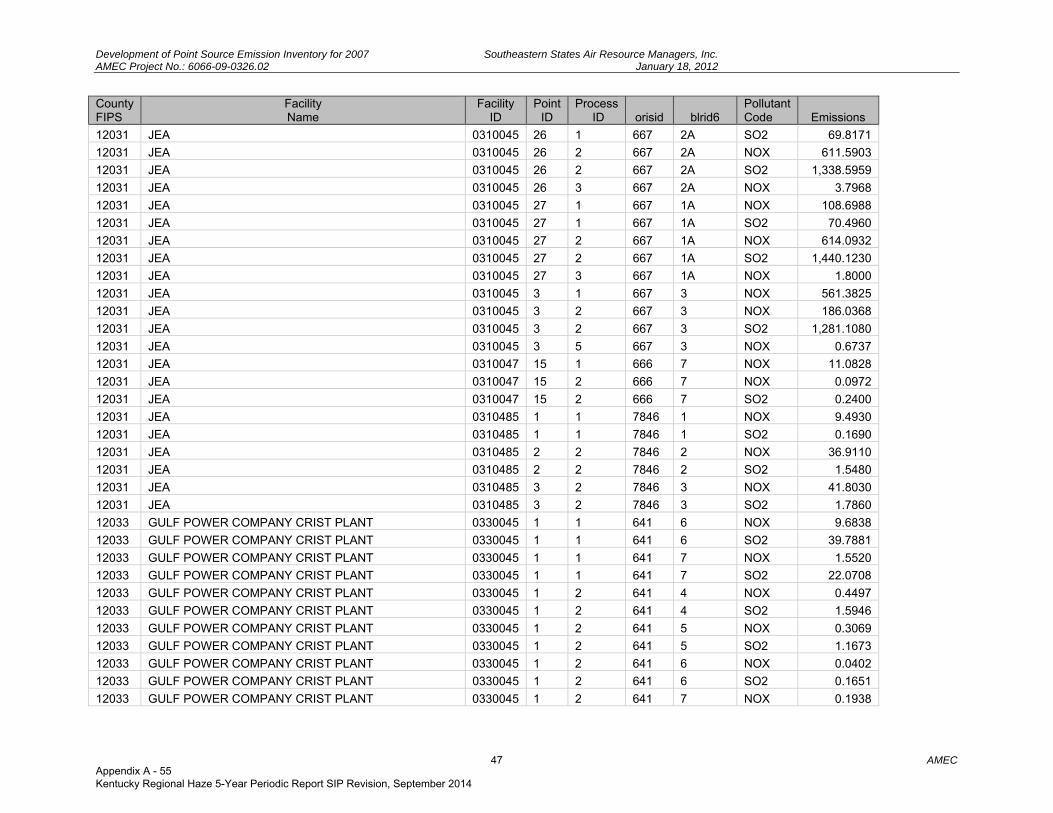
Development of Point Source Emission Inventory for 2007 Southeastern States Air Resource Managers, Inc. AMEC Project No.: 6066-09-0326.02 January 18, 2012
47 AMEC
County FIPS
Facility Name
Facility ID
Point ID
Process ID orisid blrid6
Pollutant Code Emissions
12031 JEA 0310045 26 1 667 2A SO2 69.8171
12031 JEA 0310045 26 2 667 2A NOX 611.5903
12031 JEA 0310045 26 2 667 2A SO2 1,338.5959
12031 JEA 0310045 26 3 667 2A NOX 3.7968
12031 JEA 0310045 27 1 667 1A NOX 108.6988
12031 JEA 0310045 27 1 667 1A SO2 70.4960
12031 JEA 0310045 27 2 667 1A NOX 614.0932
12031 JEA 0310045 27 2 667 1A SO2 1,440.1230
12031 JEA 0310045 27 3 667 1A NOX 1.8000
12031 JEA 0310045 3 1 667 3 NOX 561.3825
12031 JEA 0310045 3 2 667 3 NOX 186.0368
12031 JEA 0310045 3 2 667 3 SO2 1,281.1080
12031 JEA 0310045 3 5 667 3 NOX 0.6737
12031 JEA 0310047 15 1 666 7 NOX 11.0828
12031 JEA 0310047 15 2 666 7 NOX 0.0972
12031 JEA 0310047 15 2 666 7 SO2 0.2400
12031 JEA 0310485 1 1 7846 1 NOX 9.4930
12031 JEA 0310485 1 1 7846 1 SO2 0.1690
12031 JEA 0310485 2 2 7846 2 NOX 36.9110
12031 JEA 0310485 2 2 7846 2 SO2 1.5480
12031 JEA 0310485 3 2 7846 3 NOX 41.8030
12031 JEA 0310485 3 2 7846 3 SO2 1.7860
12033 GULF POWER COMPANY CRIST PLANT 0330045 1 1 641 6 NOX 9.6838
12033 GULF POWER COMPANY CRIST PLANT 0330045 1 1 641 6 SO2 39.7881
12033 GULF POWER COMPANY CRIST PLANT 0330045 1 1 641 7 NOX 1.5520
12033 GULF POWER COMPANY CRIST PLANT 0330045 1 1 641 7 SO2 22.0708
12033 GULF POWER COMPANY CRIST PLANT 0330045 1 2 641 4 NOX 0.4497
12033 GULF POWER COMPANY CRIST PLANT 0330045 1 2 641 4 SO2 1.5946
12033 GULF POWER COMPANY CRIST PLANT 0330045 1 2 641 5 NOX 0.3069
12033 GULF POWER COMPANY CRIST PLANT 0330045 1 2 641 5 SO2 1.1673
12033 GULF POWER COMPANY CRIST PLANT 0330045 1 2 641 6 NOX 0.0402
12033 GULF POWER COMPANY CRIST PLANT 0330045 1 2 641 6 SO2 0.1651
12033 GULF POWER COMPANY CRIST PLANT 0330045 1 2 641 7 NOX 0.1938
Appendix A - 55 Kentucky Regional Haze 5-Year Periodic Report SIP Revision, September 2014
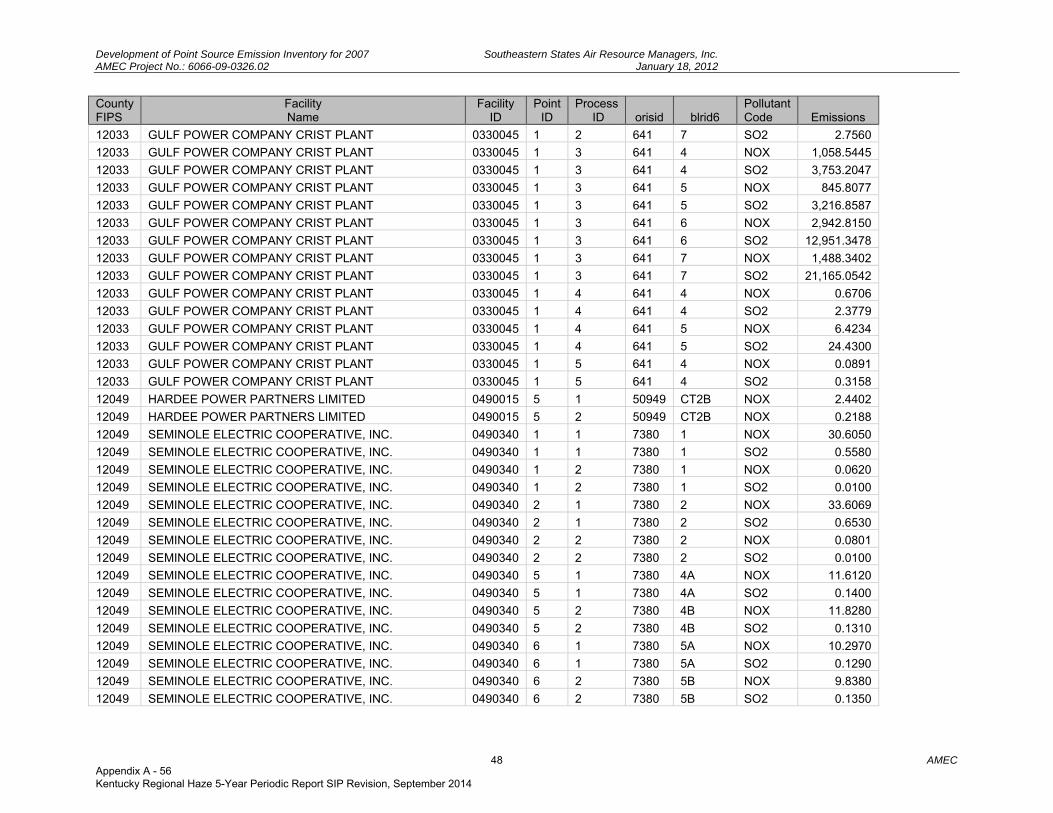
Development of Point Source Emission Inventory for 2007 Southeastern States Air Resource Managers, Inc. AMEC Project No.: 6066-09-0326.02 January 18, 2012
48 AMEC
County FIPS
Facility Name
Facility ID
Point ID
Process ID orisid blrid6
Pollutant Code Emissions
12033 GULF POWER COMPANY CRIST PLANT 0330045 1 2 641 7 SO2 2.7560
12033 GULF POWER COMPANY CRIST PLANT 0330045 1 3 641 4 NOX 1,058.5445
12033 GULF POWER COMPANY CRIST PLANT 0330045 1 3 641 4 SO2 3,753.2047
12033 GULF POWER COMPANY CRIST PLANT 0330045 1 3 641 5 NOX 845.8077
12033 GULF POWER COMPANY CRIST PLANT 0330045 1 3 641 5 SO2 3,216.8587
12033 GULF POWER COMPANY CRIST PLANT 0330045 1 3 641 6 NOX 2,942.8150
12033 GULF POWER COMPANY CRIST PLANT 0330045 1 3 641 6 SO2 12,951.3478
12033 GULF POWER COMPANY CRIST PLANT 0330045 1 3 641 7 NOX 1,488.3402
12033 GULF POWER COMPANY CRIST PLANT 0330045 1 3 641 7 SO2 21,165.0542
12033 GULF POWER COMPANY CRIST PLANT 0330045 1 4 641 4 NOX 0.6706
12033 GULF POWER COMPANY CRIST PLANT 0330045 1 4 641 4 SO2 2.3779
12033 GULF POWER COMPANY CRIST PLANT 0330045 1 4 641 5 NOX 6.4234
12033 GULF POWER COMPANY CRIST PLANT 0330045 1 4 641 5 SO2 24.4300
12033 GULF POWER COMPANY CRIST PLANT 0330045 1 5 641 4 NOX 0.0891
12033 GULF POWER COMPANY CRIST PLANT 0330045 1 5 641 4 SO2 0.3158
12049 HARDEE POWER PARTNERS LIMITED 0490015 5 1 50949 CT2B NOX 2.4402
12049 HARDEE POWER PARTNERS LIMITED 0490015 5 2 50949 CT2B NOX 0.2188
12049 SEMINOLE ELECTRIC COOPERATIVE, INC. 0490340 1 1 7380 1 NOX 30.6050
12049 SEMINOLE ELECTRIC COOPERATIVE, INC. 0490340 1 1 7380 1 SO2 0.5580
12049 SEMINOLE ELECTRIC COOPERATIVE, INC. 0490340 1 2 7380 1 NOX 0.0620
12049 SEMINOLE ELECTRIC COOPERATIVE, INC. 0490340 1 2 7380 1 SO2 0.0100
12049 SEMINOLE ELECTRIC COOPERATIVE, INC. 0490340 2 1 7380 2 NOX 33.6069
12049 SEMINOLE ELECTRIC COOPERATIVE, INC. 0490340 2 1 7380 2 SO2 0.6530
12049 SEMINOLE ELECTRIC COOPERATIVE, INC. 0490340 2 2 7380 2 NOX 0.0801
12049 SEMINOLE ELECTRIC COOPERATIVE, INC. 0490340 2 2 7380 2 SO2 0.0100
12049 SEMINOLE ELECTRIC COOPERATIVE, INC. 0490340 5 1 7380 4A NOX 11.6120
12049 SEMINOLE ELECTRIC COOPERATIVE, INC. 0490340 5 1 7380 4A SO2 0.1400
12049 SEMINOLE ELECTRIC COOPERATIVE, INC. 0490340 5 2 7380 4B NOX 11.8280
12049 SEMINOLE ELECTRIC COOPERATIVE, INC. 0490340 5 2 7380 4B SO2 0.1310
12049 SEMINOLE ELECTRIC COOPERATIVE, INC. 0490340 6 1 7380 5A NOX 10.2970
12049 SEMINOLE ELECTRIC COOPERATIVE, INC. 0490340 6 1 7380 5A SO2 0.1290
12049 SEMINOLE ELECTRIC COOPERATIVE, INC. 0490340 6 2 7380 5B NOX 9.8380
12049 SEMINOLE ELECTRIC COOPERATIVE, INC. 0490340 6 2 7380 5B SO2 0.1350
Appendix A - 56 Kentucky Regional Haze 5-Year Periodic Report SIP Revision, September 2014
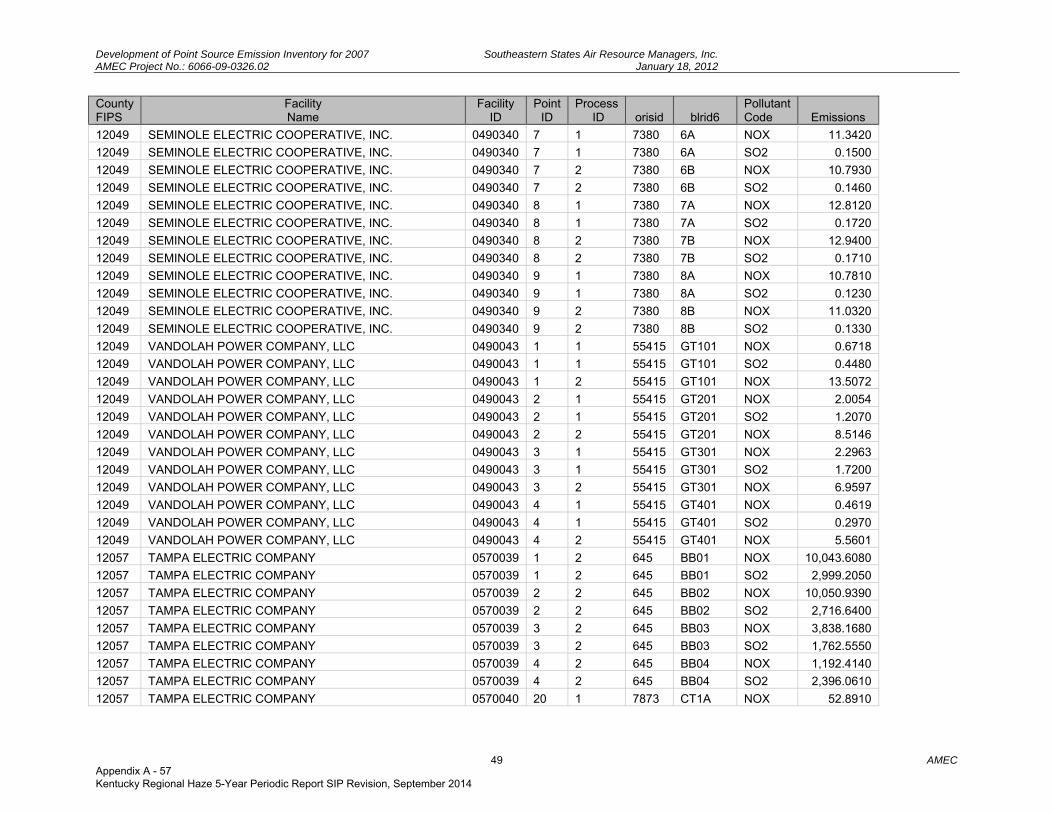
Development of Point Source Emission Inventory for 2007 Southeastern States Air Resource Managers, Inc. AMEC Project No.: 6066-09-0326.02 January 18, 2012
49 AMEC
County FIPS
Facility Name
Facility ID
Point ID
Process ID orisid blrid6
Pollutant Code Emissions
12049 SEMINOLE ELECTRIC COOPERATIVE, INC. 0490340 7 1 7380 6A NOX 11.3420
12049 SEMINOLE ELECTRIC COOPERATIVE, INC. 0490340 7 1 7380 6A SO2 0.1500
12049 SEMINOLE ELECTRIC COOPERATIVE, INC. 0490340 7 2 7380 6B NOX 10.7930
12049 SEMINOLE ELECTRIC COOPERATIVE, INC. 0490340 7 2 7380 6B SO2 0.1460
12049 SEMINOLE ELECTRIC COOPERATIVE, INC. 0490340 8 1 7380 7A NOX 12.8120
12049 SEMINOLE ELECTRIC COOPERATIVE, INC. 0490340 8 1 7380 7A SO2 0.1720
12049 SEMINOLE ELECTRIC COOPERATIVE, INC. 0490340 8 2 7380 7B NOX 12.9400
12049 SEMINOLE ELECTRIC COOPERATIVE, INC. 0490340 8 2 7380 7B SO2 0.1710
12049 SEMINOLE ELECTRIC COOPERATIVE, INC. 0490340 9 1 7380 8A NOX 10.7810
12049 SEMINOLE ELECTRIC COOPERATIVE, INC. 0490340 9 1 7380 8A SO2 0.1230
12049 SEMINOLE ELECTRIC COOPERATIVE, INC. 0490340 9 2 7380 8B NOX 11.0320
12049 SEMINOLE ELECTRIC COOPERATIVE, INC. 0490340 9 2 7380 8B SO2 0.1330
12049 VANDOLAH POWER COMPANY, LLC 0490043 1 1 55415 GT101 NOX 0.6718
12049 VANDOLAH POWER COMPANY, LLC 0490043 1 1 55415 GT101 SO2 0.4480
12049 VANDOLAH POWER COMPANY, LLC 0490043 1 2 55415 GT101 NOX 13.5072
12049 VANDOLAH POWER COMPANY, LLC 0490043 2 1 55415 GT201 NOX 2.0054
12049 VANDOLAH POWER COMPANY, LLC 0490043 2 1 55415 GT201 SO2 1.2070
12049 VANDOLAH POWER COMPANY, LLC 0490043 2 2 55415 GT201 NOX 8.5146
12049 VANDOLAH POWER COMPANY, LLC 0490043 3 1 55415 GT301 NOX 2.2963
12049 VANDOLAH POWER COMPANY, LLC 0490043 3 1 55415 GT301 SO2 1.7200
12049 VANDOLAH POWER COMPANY, LLC 0490043 3 2 55415 GT301 NOX 6.9597
12049 VANDOLAH POWER COMPANY, LLC 0490043 4 1 55415 GT401 NOX 0.4619
12049 VANDOLAH POWER COMPANY, LLC 0490043 4 1 55415 GT401 SO2 0.2970
12049 VANDOLAH POWER COMPANY, LLC 0490043 4 2 55415 GT401 NOX 5.5601
12057 TAMPA ELECTRIC COMPANY 0570039 1 2 645 BB01 NOX 10,043.6080
12057 TAMPA ELECTRIC COMPANY 0570039 1 2 645 BB01 SO2 2,999.2050
12057 TAMPA ELECTRIC COMPANY 0570039 2 2 645 BB02 NOX 10,050.9390
12057 TAMPA ELECTRIC COMPANY 0570039 2 2 645 BB02 SO2 2,716.6400
12057 TAMPA ELECTRIC COMPANY 0570039 3 2 645 BB03 NOX 3,838.1680
12057 TAMPA ELECTRIC COMPANY 0570039 3 2 645 BB03 SO2 1,762.5550
12057 TAMPA ELECTRIC COMPANY 0570039 4 2 645 BB04 NOX 1,192.4140
12057 TAMPA ELECTRIC COMPANY 0570039 4 2 645 BB04 SO2 2,396.0610
12057 TAMPA ELECTRIC COMPANY 0570040 20 1 7873 CT1A NOX 52.8910
Appendix A - 57 Kentucky Regional Haze 5-Year Periodic Report SIP Revision, September 2014
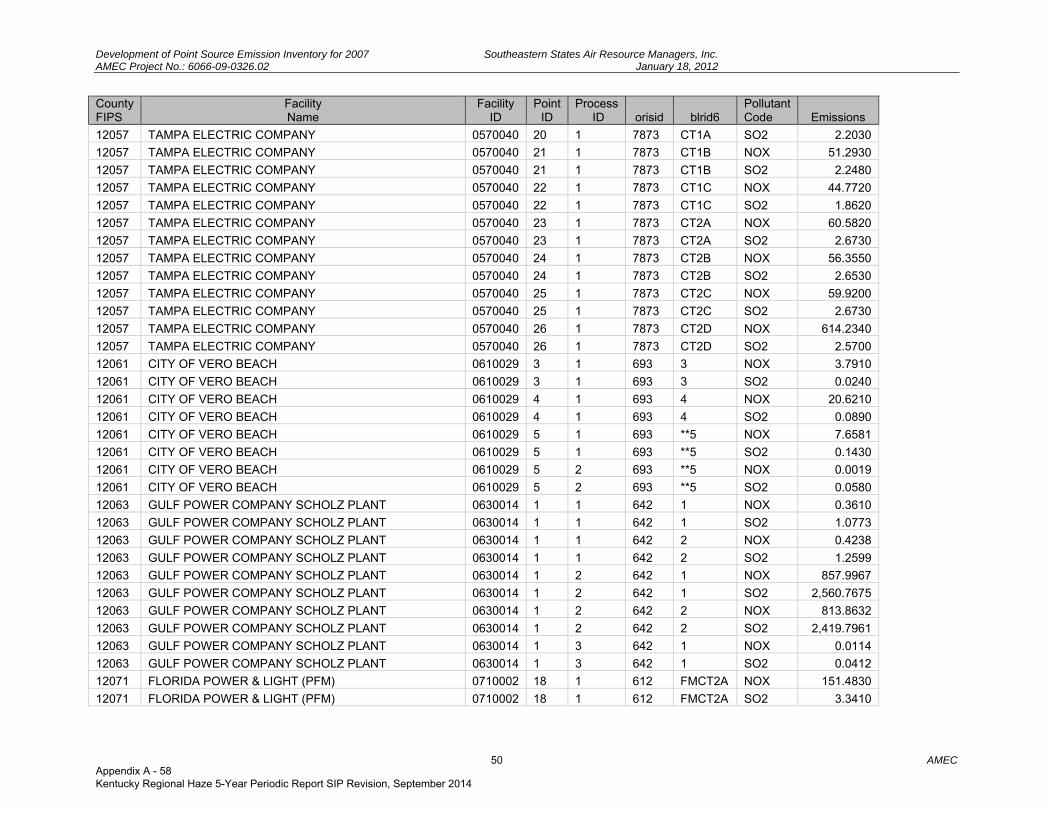
Development of Point Source Emission Inventory for 2007 Southeastern States Air Resource Managers, Inc. AMEC Project No.: 6066-09-0326.02 January 18, 2012
50 AMEC
County FIPS
Facility Name
Facility ID
Point ID
Process ID orisid blrid6
Pollutant Code Emissions
12057 TAMPA ELECTRIC COMPANY 0570040 20 1 7873 CT1A SO2 2.2030
12057 TAMPA ELECTRIC COMPANY 0570040 21 1 7873 CT1B NOX 51.2930
12057 TAMPA ELECTRIC COMPANY 0570040 21 1 7873 CT1B SO2 2.2480
12057 TAMPA ELECTRIC COMPANY 0570040 22 1 7873 CT1C NOX 44.7720
12057 TAMPA ELECTRIC COMPANY 0570040 22 1 7873 CT1C SO2 1.8620
12057 TAMPA ELECTRIC COMPANY 0570040 23 1 7873 CT2A NOX 60.5820
12057 TAMPA ELECTRIC COMPANY 0570040 23 1 7873 CT2A SO2 2.6730
12057 TAMPA ELECTRIC COMPANY 0570040 24 1 7873 CT2B NOX 56.3550
12057 TAMPA ELECTRIC COMPANY 0570040 24 1 7873 CT2B SO2 2.6530
12057 TAMPA ELECTRIC COMPANY 0570040 25 1 7873 CT2C NOX 59.9200
12057 TAMPA ELECTRIC COMPANY 0570040 25 1 7873 CT2C SO2 2.6730
12057 TAMPA ELECTRIC COMPANY 0570040 26 1 7873 CT2D NOX 614.2340
12057 TAMPA ELECTRIC COMPANY 0570040 26 1 7873 CT2D SO2 2.5700
12061 CITY OF VERO BEACH 0610029 3 1 693 3 NOX 3.7910
12061 CITY OF VERO BEACH 0610029 3 1 693 3 SO2 0.0240
12061 CITY OF VERO BEACH 0610029 4 1 693 4 NOX 20.6210
12061 CITY OF VERO BEACH 0610029 4 1 693 4 SO2 0.0890
12061 CITY OF VERO BEACH 0610029 5 1 693 **5 NOX 7.6581
12061 CITY OF VERO BEACH 0610029 5 1 693 **5 SO2 0.1430
12061 CITY OF VERO BEACH 0610029 5 2 693 **5 NOX 0.0019
12061 CITY OF VERO BEACH 0610029 5 2 693 **5 SO2 0.0580
12063 GULF POWER COMPANY SCHOLZ PLANT 0630014 1 1 642 1 NOX 0.3610
12063 GULF POWER COMPANY SCHOLZ PLANT 0630014 1 1 642 1 SO2 1.0773
12063 GULF POWER COMPANY SCHOLZ PLANT 0630014 1 1 642 2 NOX 0.4238
12063 GULF POWER COMPANY SCHOLZ PLANT 0630014 1 1 642 2 SO2 1.2599
12063 GULF POWER COMPANY SCHOLZ PLANT 0630014 1 2 642 1 NOX 857.9967
12063 GULF POWER COMPANY SCHOLZ PLANT 0630014 1 2 642 1 SO2 2,560.7675
12063 GULF POWER COMPANY SCHOLZ PLANT 0630014 1 2 642 2 NOX 813.8632
12063 GULF POWER COMPANY SCHOLZ PLANT 0630014 1 2 642 2 SO2 2,419.7961
12063 GULF POWER COMPANY SCHOLZ PLANT 0630014 1 3 642 1 NOX 0.0114
12063 GULF POWER COMPANY SCHOLZ PLANT 0630014 1 3 642 1 SO2 0.0412
12071 FLORIDA POWER & LIGHT (PFM) 0710002 18 1 612 FMCT2A NOX 151.4830
12071 FLORIDA POWER & LIGHT (PFM) 0710002 18 1 612 FMCT2A SO2 3.3410
Appendix A - 58 Kentucky Regional Haze 5-Year Periodic Report SIP Revision, September 2014
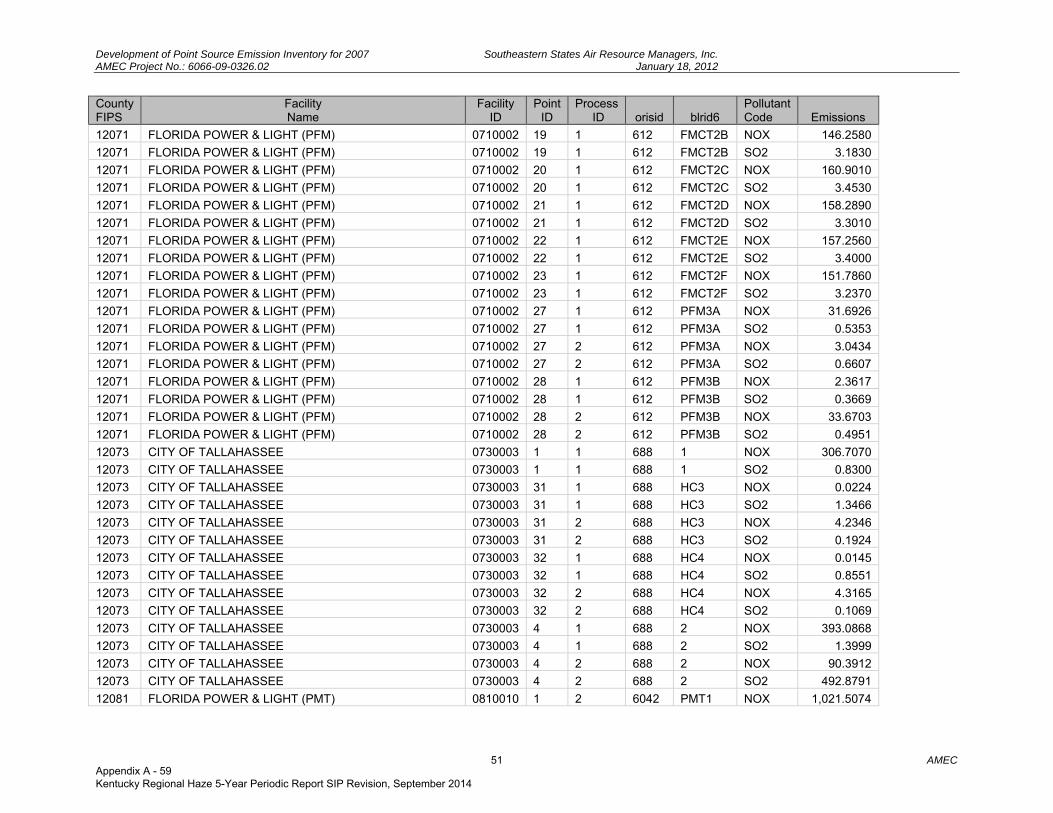
Development of Point Source Emission Inventory for 2007 Southeastern States Air Resource Managers, Inc. AMEC Project No.: 6066-09-0326.02 January 18, 2012
51 AMEC
County FIPS
Facility Name
Facility ID
Point ID
Process ID orisid blrid6
Pollutant Code Emissions
12071 FLORIDA POWER & LIGHT (PFM) 0710002 19 1 612 FMCT2B NOX 146.2580
12071 FLORIDA POWER & LIGHT (PFM) 0710002 19 1 612 FMCT2B SO2 3.1830
12071 FLORIDA POWER & LIGHT (PFM) 0710002 20 1 612 FMCT2C NOX 160.9010
12071 FLORIDA POWER & LIGHT (PFM) 0710002 20 1 612 FMCT2C SO2 3.4530
12071 FLORIDA POWER & LIGHT (PFM) 0710002 21 1 612 FMCT2D NOX 158.2890
12071 FLORIDA POWER & LIGHT (PFM) 0710002 21 1 612 FMCT2D SO2 3.3010
12071 FLORIDA POWER & LIGHT (PFM) 0710002 22 1 612 FMCT2E NOX 157.2560
12071 FLORIDA POWER & LIGHT (PFM) 0710002 22 1 612 FMCT2E SO2 3.4000
12071 FLORIDA POWER & LIGHT (PFM) 0710002 23 1 612 FMCT2F NOX 151.7860
12071 FLORIDA POWER & LIGHT (PFM) 0710002 23 1 612 FMCT2F SO2 3.2370
12071 FLORIDA POWER & LIGHT (PFM) 0710002 27 1 612 PFM3A NOX 31.6926
12071 FLORIDA POWER & LIGHT (PFM) 0710002 27 1 612 PFM3A SO2 0.5353
12071 FLORIDA POWER & LIGHT (PFM) 0710002 27 2 612 PFM3A NOX 3.0434
12071 FLORIDA POWER & LIGHT (PFM) 0710002 27 2 612 PFM3A SO2 0.6607
12071 FLORIDA POWER & LIGHT (PFM) 0710002 28 1 612 PFM3B NOX 2.3617
12071 FLORIDA POWER & LIGHT (PFM) 0710002 28 1 612 PFM3B SO2 0.3669
12071 FLORIDA POWER & LIGHT (PFM) 0710002 28 2 612 PFM3B NOX 33.6703
12071 FLORIDA POWER & LIGHT (PFM) 0710002 28 2 612 PFM3B SO2 0.4951
12073 CITY OF TALLAHASSEE 0730003 1 1 688 1 NOX 306.7070
12073 CITY OF TALLAHASSEE 0730003 1 1 688 1 SO2 0.8300
12073 CITY OF TALLAHASSEE 0730003 31 1 688 HC3 NOX 0.0224
12073 CITY OF TALLAHASSEE 0730003 31 1 688 HC3 SO2 1.3466
12073 CITY OF TALLAHASSEE 0730003 31 2 688 HC3 NOX 4.2346
12073 CITY OF TALLAHASSEE 0730003 31 2 688 HC3 SO2 0.1924
12073 CITY OF TALLAHASSEE 0730003 32 1 688 HC4 NOX 0.0145
12073 CITY OF TALLAHASSEE 0730003 32 1 688 HC4 SO2 0.8551
12073 CITY OF TALLAHASSEE 0730003 32 2 688 HC4 NOX 4.3165
12073 CITY OF TALLAHASSEE 0730003 32 2 688 HC4 SO2 0.1069
12073 CITY OF TALLAHASSEE 0730003 4 1 688 2 NOX 393.0868
12073 CITY OF TALLAHASSEE 0730003 4 1 688 2 SO2 1.3999
12073 CITY OF TALLAHASSEE 0730003 4 2 688 2 NOX 90.3912
12073 CITY OF TALLAHASSEE 0730003 4 2 688 2 SO2 492.8791
12081 FLORIDA POWER & LIGHT (PMT) 0810010 1 2 6042 PMT1 NOX 1,021.5074
Appendix A - 59 Kentucky Regional Haze 5-Year Periodic Report SIP Revision, September 2014
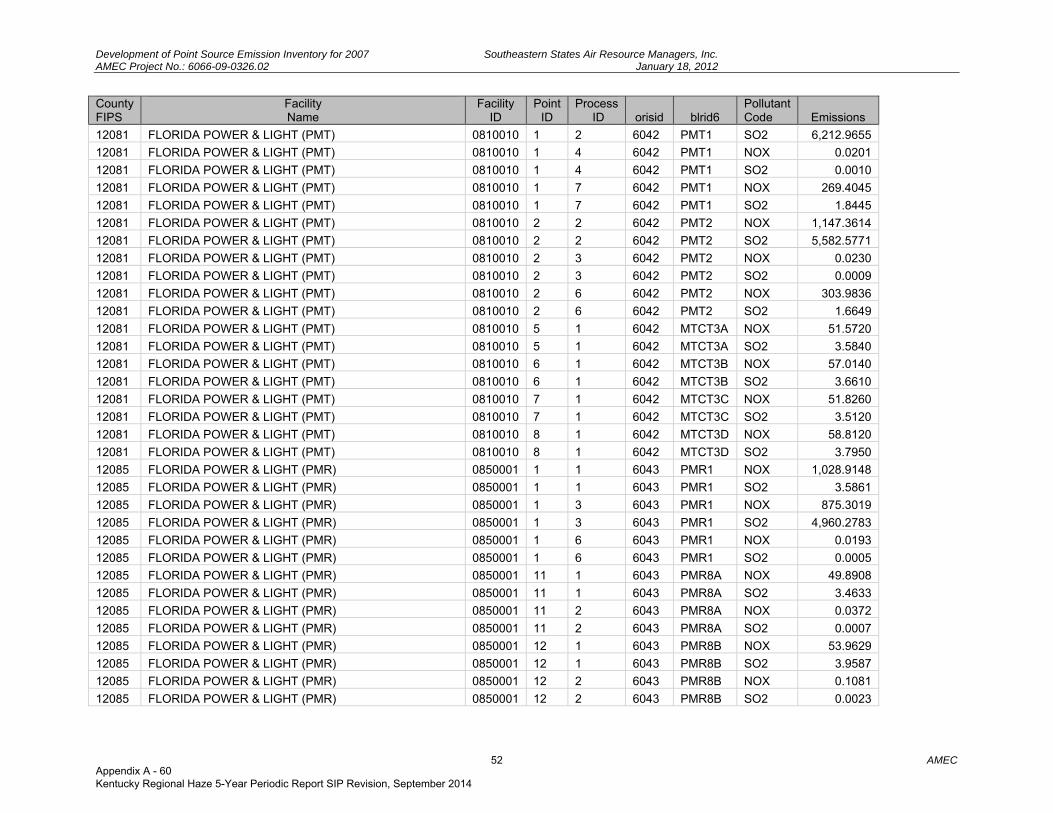
Development of Point Source Emission Inventory for 2007 Southeastern States Air Resource Managers, Inc. AMEC Project No.: 6066-09-0326.02 January 18, 2012
52 AMEC
County FIPS
Facility Name
Facility ID
Point ID
Process ID orisid blrid6
Pollutant Code Emissions
12081 FLORIDA POWER & LIGHT (PMT) 0810010 1 2 6042 PMT1 SO2 6,212.9655
12081 FLORIDA POWER & LIGHT (PMT) 0810010 1 4 6042 PMT1 NOX 0.0201
12081 FLORIDA POWER & LIGHT (PMT) 0810010 1 4 6042 PMT1 SO2 0.0010
12081 FLORIDA POWER & LIGHT (PMT) 0810010 1 7 6042 PMT1 NOX 269.4045
12081 FLORIDA POWER & LIGHT (PMT) 0810010 1 7 6042 PMT1 SO2 1.8445
12081 FLORIDA POWER & LIGHT (PMT) 0810010 2 2 6042 PMT2 NOX 1,147.3614
12081 FLORIDA POWER & LIGHT (PMT) 0810010 2 2 6042 PMT2 SO2 5,582.5771
12081 FLORIDA POWER & LIGHT (PMT) 0810010 2 3 6042 PMT2 NOX 0.0230
12081 FLORIDA POWER & LIGHT (PMT) 0810010 2 3 6042 PMT2 SO2 0.0009
12081 FLORIDA POWER & LIGHT (PMT) 0810010 2 6 6042 PMT2 NOX 303.9836
12081 FLORIDA POWER & LIGHT (PMT) 0810010 2 6 6042 PMT2 SO2 1.6649
12081 FLORIDA POWER & LIGHT (PMT) 0810010 5 1 6042 MTCT3A NOX 51.5720
12081 FLORIDA POWER & LIGHT (PMT) 0810010 5 1 6042 MTCT3A SO2 3.5840
12081 FLORIDA POWER & LIGHT (PMT) 0810010 6 1 6042 MTCT3B NOX 57.0140
12081 FLORIDA POWER & LIGHT (PMT) 0810010 6 1 6042 MTCT3B SO2 3.6610
12081 FLORIDA POWER & LIGHT (PMT) 0810010 7 1 6042 MTCT3C NOX 51.8260
12081 FLORIDA POWER & LIGHT (PMT) 0810010 7 1 6042 MTCT3C SO2 3.5120
12081 FLORIDA POWER & LIGHT (PMT) 0810010 8 1 6042 MTCT3D NOX 58.8120
12081 FLORIDA POWER & LIGHT (PMT) 0810010 8 1 6042 MTCT3D SO2 3.7950
12085 FLORIDA POWER & LIGHT (PMR) 0850001 1 1 6043 PMR1 NOX 1,028.9148
12085 FLORIDA POWER & LIGHT (PMR) 0850001 1 1 6043 PMR1 SO2 3.5861
12085 FLORIDA POWER & LIGHT (PMR) 0850001 1 3 6043 PMR1 NOX 875.3019
12085 FLORIDA POWER & LIGHT (PMR) 0850001 1 3 6043 PMR1 SO2 4,960.2783
12085 FLORIDA POWER & LIGHT (PMR) 0850001 1 6 6043 PMR1 NOX 0.0193
12085 FLORIDA POWER & LIGHT (PMR) 0850001 1 6 6043 PMR1 SO2 0.0005
12085 FLORIDA POWER & LIGHT (PMR) 0850001 11 1 6043 PMR8A NOX 49.8908
12085 FLORIDA POWER & LIGHT (PMR) 0850001 11 1 6043 PMR8A SO2 3.4633
12085 FLORIDA POWER & LIGHT (PMR) 0850001 11 2 6043 PMR8A NOX 0.0372
12085 FLORIDA POWER & LIGHT (PMR) 0850001 11 2 6043 PMR8A SO2 0.0007
12085 FLORIDA POWER & LIGHT (PMR) 0850001 12 1 6043 PMR8B NOX 53.9629
12085 FLORIDA POWER & LIGHT (PMR) 0850001 12 1 6043 PMR8B SO2 3.9587
12085 FLORIDA POWER & LIGHT (PMR) 0850001 12 2 6043 PMR8B NOX 0.1081
12085 FLORIDA POWER & LIGHT (PMR) 0850001 12 2 6043 PMR8B SO2 0.0023
Appendix A - 60 Kentucky Regional Haze 5-Year Periodic Report SIP Revision, September 2014
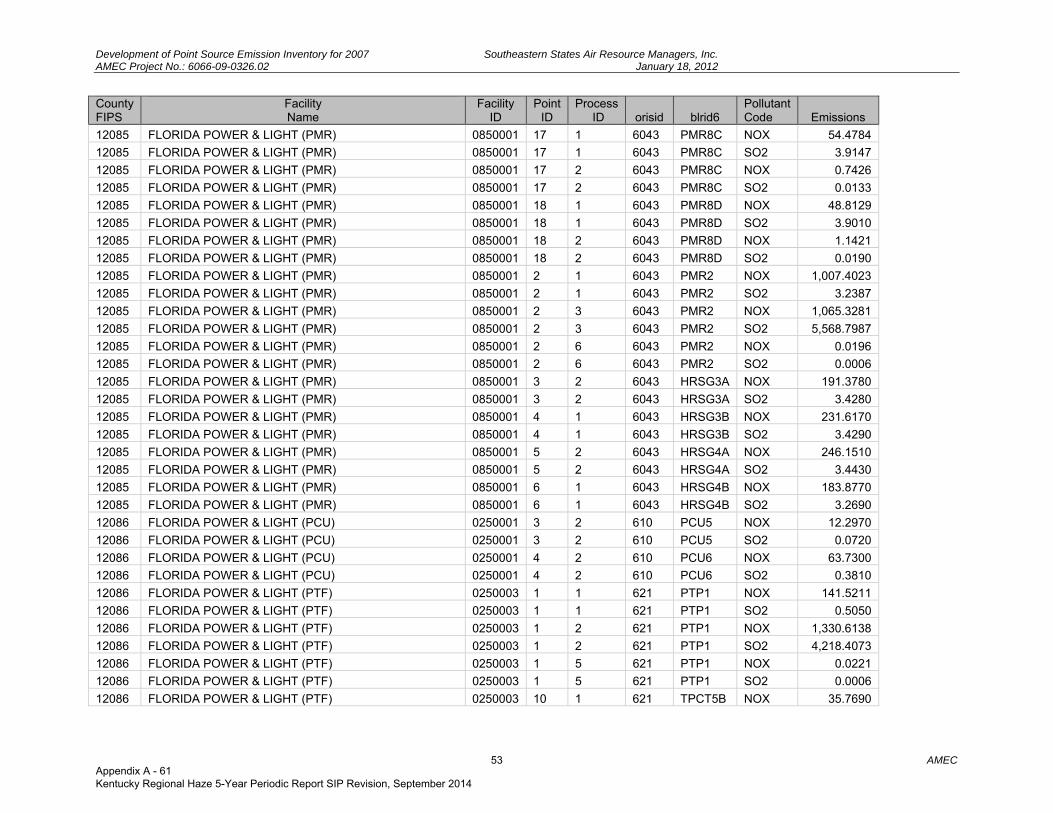
Development of Point Source Emission Inventory for 2007 Southeastern States Air Resource Managers, Inc. AMEC Project No.: 6066-09-0326.02 January 18, 2012
53 AMEC
County FIPS
Facility Name
Facility ID
Point ID
Process ID orisid blrid6
Pollutant Code Emissions
12085 FLORIDA POWER & LIGHT (PMR) 0850001 17 1 6043 PMR8C NOX 54.4784
12085 FLORIDA POWER & LIGHT (PMR) 0850001 17 1 6043 PMR8C SO2 3.9147
12085 FLORIDA POWER & LIGHT (PMR) 0850001 17 2 6043 PMR8C NOX 0.7426
12085 FLORIDA POWER & LIGHT (PMR) 0850001 17 2 6043 PMR8C SO2 0.0133
12085 FLORIDA POWER & LIGHT (PMR) 0850001 18 1 6043 PMR8D NOX 48.8129
12085 FLORIDA POWER & LIGHT (PMR) 0850001 18 1 6043 PMR8D SO2 3.9010
12085 FLORIDA POWER & LIGHT (PMR) 0850001 18 2 6043 PMR8D NOX 1.1421
12085 FLORIDA POWER & LIGHT (PMR) 0850001 18 2 6043 PMR8D SO2 0.0190
12085 FLORIDA POWER & LIGHT (PMR) 0850001 2 1 6043 PMR2 NOX 1,007.4023
12085 FLORIDA POWER & LIGHT (PMR) 0850001 2 1 6043 PMR2 SO2 3.2387
12085 FLORIDA POWER & LIGHT (PMR) 0850001 2 3 6043 PMR2 NOX 1,065.3281
12085 FLORIDA POWER & LIGHT (PMR) 0850001 2 3 6043 PMR2 SO2 5,568.7987
12085 FLORIDA POWER & LIGHT (PMR) 0850001 2 6 6043 PMR2 NOX 0.0196
12085 FLORIDA POWER & LIGHT (PMR) 0850001 2 6 6043 PMR2 SO2 0.0006
12085 FLORIDA POWER & LIGHT (PMR) 0850001 3 2 6043 HRSG3A NOX 191.3780
12085 FLORIDA POWER & LIGHT (PMR) 0850001 3 2 6043 HRSG3A SO2 3.4280
12085 FLORIDA POWER & LIGHT (PMR) 0850001 4 1 6043 HRSG3B NOX 231.6170
12085 FLORIDA POWER & LIGHT (PMR) 0850001 4 1 6043 HRSG3B SO2 3.4290
12085 FLORIDA POWER & LIGHT (PMR) 0850001 5 2 6043 HRSG4A NOX 246.1510
12085 FLORIDA POWER & LIGHT (PMR) 0850001 5 2 6043 HRSG4A SO2 3.4430
12085 FLORIDA POWER & LIGHT (PMR) 0850001 6 1 6043 HRSG4B NOX 183.8770
12085 FLORIDA POWER & LIGHT (PMR) 0850001 6 1 6043 HRSG4B SO2 3.2690
12086 FLORIDA POWER & LIGHT (PCU) 0250001 3 2 610 PCU5 NOX 12.2970
12086 FLORIDA POWER & LIGHT (PCU) 0250001 3 2 610 PCU5 SO2 0.0720
12086 FLORIDA POWER & LIGHT (PCU) 0250001 4 2 610 PCU6 NOX 63.7300
12086 FLORIDA POWER & LIGHT (PCU) 0250001 4 2 610 PCU6 SO2 0.3810
12086 FLORIDA POWER & LIGHT (PTF) 0250003 1 1 621 PTP1 NOX 141.5211
12086 FLORIDA POWER & LIGHT (PTF) 0250003 1 1 621 PTP1 SO2 0.5050
12086 FLORIDA POWER & LIGHT (PTF) 0250003 1 2 621 PTP1 NOX 1,330.6138
12086 FLORIDA POWER & LIGHT (PTF) 0250003 1 2 621 PTP1 SO2 4,218.4073
12086 FLORIDA POWER & LIGHT (PTF) 0250003 1 5 621 PTP1 NOX 0.0221
12086 FLORIDA POWER & LIGHT (PTF) 0250003 1 5 621 PTP1 SO2 0.0006
12086 FLORIDA POWER & LIGHT (PTF) 0250003 10 1 621 TPCT5B NOX 35.7690
Appendix A - 61 Kentucky Regional Haze 5-Year Periodic Report SIP Revision, September 2014

Development of Point Source Emission Inventory for 2007 Southeastern States Air Resource Managers, Inc. AMEC Project No.: 6066-09-0326.02 January 18, 2012
54 AMEC
County FIPS
Facility Name
Facility ID
Point ID
Process ID orisid blrid6
Pollutant Code Emissions
12086 FLORIDA POWER & LIGHT (PTF) 0250003 10 1 621 TPCT5B SO2 3.1969
12086 FLORIDA POWER & LIGHT (PTF) 0250003 10 2 621 TPCT5B NOX 2.0180
12086 FLORIDA POWER & LIGHT (PTF) 0250003 10 2 621 TPCT5B SO2 0.0171
12086 FLORIDA POWER & LIGHT (PTF) 0250003 11 1 621 TPCT5C NOX 33.7770
12086 FLORIDA POWER & LIGHT (PTF) 0250003 11 1 621 TPCT5C SO2 3.1308
12086 FLORIDA POWER & LIGHT (PTF) 0250003 11 2 621 TPCT5C NOX 1.5910
12086 FLORIDA POWER & LIGHT (PTF) 0250003 11 2 621 TPCT5C SO2 0.0132
12086 FLORIDA POWER & LIGHT (PTF) 0250003 12 1 621 TPCT5D NOX 36.6023
12086 FLORIDA POWER & LIGHT (PTF) 0250003 12 1 621 TPCT5D SO2 3.1652
12086 FLORIDA POWER & LIGHT (PTF) 0250003 12 2 621 TPCT5D NOX 2.3227
12086 FLORIDA POWER & LIGHT (PTF) 0250003 12 2 621 TPCT5D SO2 0.0158
12086 FLORIDA POWER & LIGHT (PTF) 0250003 2 1 621 PTP2 NOX 164.9627
12086 FLORIDA POWER & LIGHT (PTF) 0250003 2 1 621 PTP2 SO2 0.4923
12086 FLORIDA POWER & LIGHT (PTF) 0250003 2 2 621 PTP2 NOX 1,369.4790
12086 FLORIDA POWER & LIGHT (PTF) 0250003 2 2 621 PTP2 SO2 3,630.8972
12086 FLORIDA POWER & LIGHT (PTF) 0250003 2 5 621 PTP2 NOX 0.0212
12086 FLORIDA POWER & LIGHT (PTF) 0250003 2 5 621 PTP2 SO2 0.0005
12086 FLORIDA POWER & LIGHT (PTF) 0250003 9 1 621 TPCT5A NOX 33.0220
12086 FLORIDA POWER & LIGHT (PTF) 0250003 9 1 621 TPCT5A SO2 3.1901
12086 FLORIDA POWER & LIGHT (PTF) 0250003 9 2 621 TPCT5A NOX 1.7790
12086 FLORIDA POWER & LIGHT (PTF) 0250003 9 2 621 TPCT5A SO2 0.0149
12087 KEYS ENERGY SERVICES 0870003 11 1 6584 CT4 NOX 1.4310
12087 KEYS ENERGY SERVICES 0870003 11 1 6584 CT4 SO2 1.4650
12095 ORLANDO COGEN LIMITED, L.P. 0950203 1 1 54466 1 NOX 216.1960
12095 ORLANDO COGEN LIMITED, L.P. 0950203 1 1 54466 1 SO2 2.3110
12095 ORLANDO UTILITIES COMMISSION 0950137 1 2 564 1 NOX 10.3839
12095 ORLANDO UTILITIES COMMISSION 0950137 1 2 564 1 SO2 6.0272
12095 ORLANDO UTILITIES COMMISSION 0950137 1 3 564 1 NOX 6,043.7010
12095 ORLANDO UTILITIES COMMISSION 0950137 1 3 564 1 SO2 4,603.3644
12095 ORLANDO UTILITIES COMMISSION 0950137 1 4 564 1 NOX 114.3215
12095 ORLANDO UTILITIES COMMISSION 0950137 1 5 564 1 NOX 0.4436
12095 ORLANDO UTILITIES COMMISSION 0950137 1 5 564 1 SO2 1.2395
12095 ORLANDO UTILITIES COMMISSION 0950137 2 2 564 2 NOX 2.1343
Appendix A - 62 Kentucky Regional Haze 5-Year Periodic Report SIP Revision, September 2014
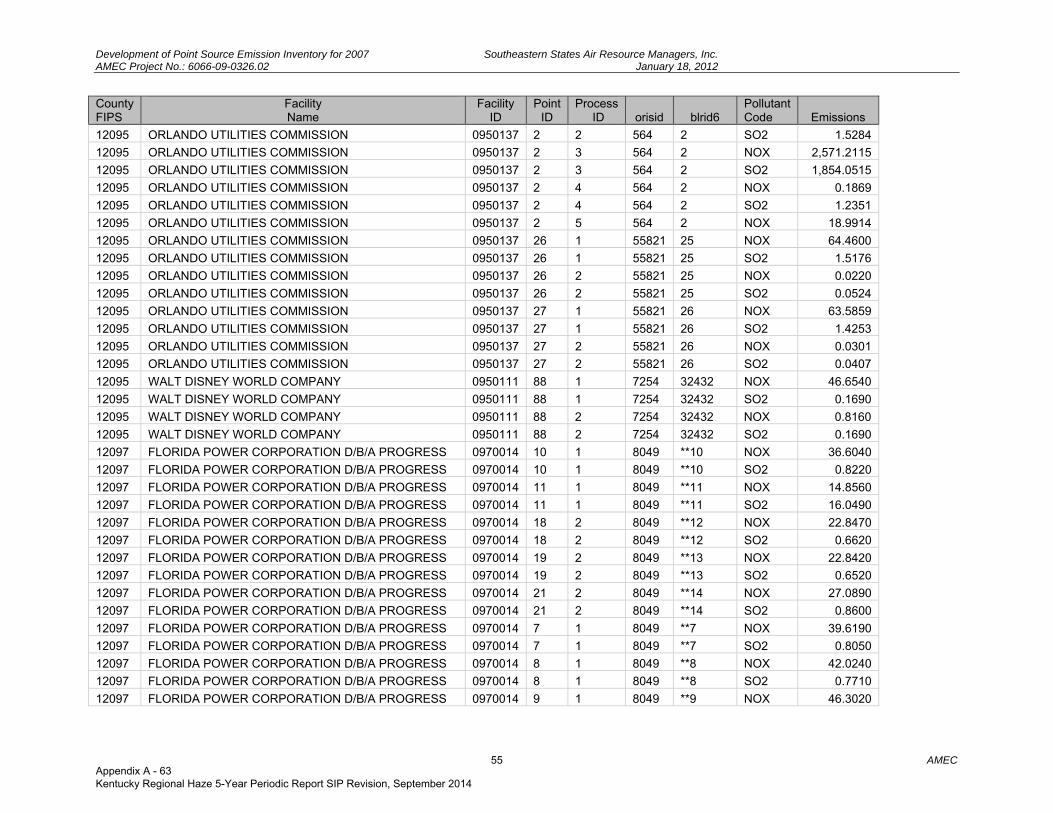
Development of Point Source Emission Inventory for 2007 Southeastern States Air Resource Managers, Inc. AMEC Project No.: 6066-09-0326.02 January 18, 2012
55 AMEC
County FIPS
Facility Name
Facility ID
Point ID
Process ID orisid blrid6
Pollutant Code Emissions
12095 ORLANDO UTILITIES COMMISSION 0950137 2 2 564 2 SO2 1.5284
12095 ORLANDO UTILITIES COMMISSION 0950137 2 3 564 2 NOX 2,571.2115
12095 ORLANDO UTILITIES COMMISSION 0950137 2 3 564 2 SO2 1,854.0515
12095 ORLANDO UTILITIES COMMISSION 0950137 2 4 564 2 NOX 0.1869
12095 ORLANDO UTILITIES COMMISSION 0950137 2 4 564 2 SO2 1.2351
12095 ORLANDO UTILITIES COMMISSION 0950137 2 5 564 2 NOX 18.9914
12095 ORLANDO UTILITIES COMMISSION 0950137 26 1 55821 25 NOX 64.4600
12095 ORLANDO UTILITIES COMMISSION 0950137 26 1 55821 25 SO2 1.5176
12095 ORLANDO UTILITIES COMMISSION 0950137 26 2 55821 25 NOX 0.0220
12095 ORLANDO UTILITIES COMMISSION 0950137 26 2 55821 25 SO2 0.0524
12095 ORLANDO UTILITIES COMMISSION 0950137 27 1 55821 26 NOX 63.5859
12095 ORLANDO UTILITIES COMMISSION 0950137 27 1 55821 26 SO2 1.4253
12095 ORLANDO UTILITIES COMMISSION 0950137 27 2 55821 26 NOX 0.0301
12095 ORLANDO UTILITIES COMMISSION 0950137 27 2 55821 26 SO2 0.0407
12095 WALT DISNEY WORLD COMPANY 0950111 88 1 7254 32432 NOX 46.6540
12095 WALT DISNEY WORLD COMPANY 0950111 88 1 7254 32432 SO2 0.1690
12095 WALT DISNEY WORLD COMPANY 0950111 88 2 7254 32432 NOX 0.8160
12095 WALT DISNEY WORLD COMPANY 0950111 88 2 7254 32432 SO2 0.1690
12097 FLORIDA POWER CORPORATION D/B/A PROGRESS 0970014 10 1 8049 **10 NOX 36.6040
12097 FLORIDA POWER CORPORATION D/B/A PROGRESS 0970014 10 1 8049 **10 SO2 0.8220
12097 FLORIDA POWER CORPORATION D/B/A PROGRESS 0970014 11 1 8049 **11 NOX 14.8560
12097 FLORIDA POWER CORPORATION D/B/A PROGRESS 0970014 11 1 8049 **11 SO2 16.0490
12097 FLORIDA POWER CORPORATION D/B/A PROGRESS 0970014 18 2 8049 **12 NOX 22.8470
12097 FLORIDA POWER CORPORATION D/B/A PROGRESS 0970014 18 2 8049 **12 SO2 0.6620
12097 FLORIDA POWER CORPORATION D/B/A PROGRESS 0970014 19 2 8049 **13 NOX 22.8420
12097 FLORIDA POWER CORPORATION D/B/A PROGRESS 0970014 19 2 8049 **13 SO2 0.6520
12097 FLORIDA POWER CORPORATION D/B/A PROGRESS 0970014 21 2 8049 **14 NOX 27.0890
12097 FLORIDA POWER CORPORATION D/B/A PROGRESS 0970014 21 2 8049 **14 SO2 0.8600
12097 FLORIDA POWER CORPORATION D/B/A PROGRESS 0970014 7 1 8049 **7 NOX 39.6190
12097 FLORIDA POWER CORPORATION D/B/A PROGRESS 0970014 7 1 8049 **7 SO2 0.8050
12097 FLORIDA POWER CORPORATION D/B/A PROGRESS 0970014 8 1 8049 **8 NOX 42.0240
12097 FLORIDA POWER CORPORATION D/B/A PROGRESS 0970014 8 1 8049 **8 SO2 0.7710
12097 FLORIDA POWER CORPORATION D/B/A PROGRESS 0970014 9 1 8049 **9 NOX 46.3020
Appendix A - 63 Kentucky Regional Haze 5-Year Periodic Report SIP Revision, September 2014
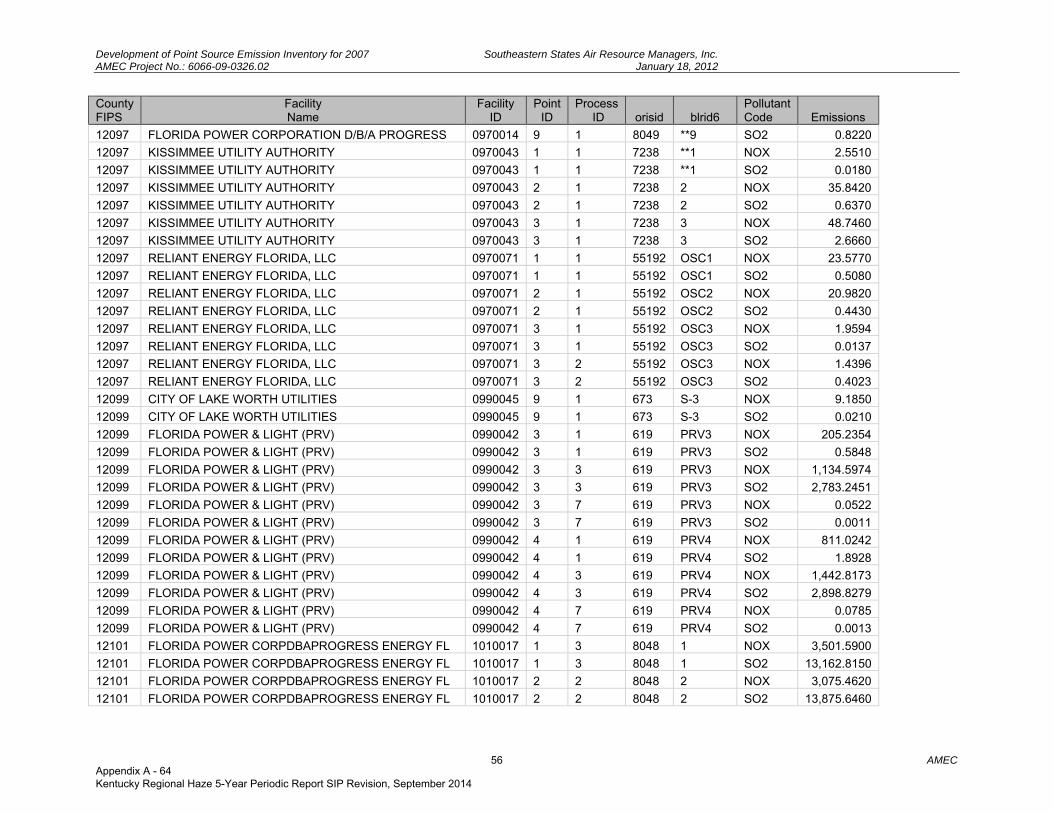
Development of Point Source Emission Inventory for 2007 Southeastern States Air Resource Managers, Inc. AMEC Project No.: 6066-09-0326.02 January 18, 2012
56 AMEC
County FIPS
Facility Name
Facility ID
Point ID
Process ID orisid blrid6
Pollutant Code Emissions
12097 FLORIDA POWER CORPORATION D/B/A PROGRESS 0970014 9 1 8049 **9 SO2 0.8220
12097 KISSIMMEE UTILITY AUTHORITY 0970043 1 1 7238 **1 NOX 2.5510
12097 KISSIMMEE UTILITY AUTHORITY 0970043 1 1 7238 **1 SO2 0.0180
12097 KISSIMMEE UTILITY AUTHORITY 0970043 2 1 7238 2 NOX 35.8420
12097 KISSIMMEE UTILITY AUTHORITY 0970043 2 1 7238 2 SO2 0.6370
12097 KISSIMMEE UTILITY AUTHORITY 0970043 3 1 7238 3 NOX 48.7460
12097 KISSIMMEE UTILITY AUTHORITY 0970043 3 1 7238 3 SO2 2.6660
12097 RELIANT ENERGY FLORIDA, LLC 0970071 1 1 55192 OSC1 NOX 23.5770
12097 RELIANT ENERGY FLORIDA, LLC 0970071 1 1 55192 OSC1 SO2 0.5080
12097 RELIANT ENERGY FLORIDA, LLC 0970071 2 1 55192 OSC2 NOX 20.9820
12097 RELIANT ENERGY FLORIDA, LLC 0970071 2 1 55192 OSC2 SO2 0.4430
12097 RELIANT ENERGY FLORIDA, LLC 0970071 3 1 55192 OSC3 NOX 1.9594
12097 RELIANT ENERGY FLORIDA, LLC 0970071 3 1 55192 OSC3 SO2 0.0137
12097 RELIANT ENERGY FLORIDA, LLC 0970071 3 2 55192 OSC3 NOX 1.4396
12097 RELIANT ENERGY FLORIDA, LLC 0970071 3 2 55192 OSC3 SO2 0.4023
12099 CITY OF LAKE WORTH UTILITIES 0990045 9 1 673 S-3 NOX 9.1850
12099 CITY OF LAKE WORTH UTILITIES 0990045 9 1 673 S-3 SO2 0.0210
12099 FLORIDA POWER & LIGHT (PRV) 0990042 3 1 619 PRV3 NOX 205.2354
12099 FLORIDA POWER & LIGHT (PRV) 0990042 3 1 619 PRV3 SO2 0.5848
12099 FLORIDA POWER & LIGHT (PRV) 0990042 3 3 619 PRV3 NOX 1,134.5974
12099 FLORIDA POWER & LIGHT (PRV) 0990042 3 3 619 PRV3 SO2 2,783.2451
12099 FLORIDA POWER & LIGHT (PRV) 0990042 3 7 619 PRV3 NOX 0.0522
12099 FLORIDA POWER & LIGHT (PRV) 0990042 3 7 619 PRV3 SO2 0.0011
12099 FLORIDA POWER & LIGHT (PRV) 0990042 4 1 619 PRV4 NOX 811.0242
12099 FLORIDA POWER & LIGHT (PRV) 0990042 4 1 619 PRV4 SO2 1.8928
12099 FLORIDA POWER & LIGHT (PRV) 0990042 4 3 619 PRV4 NOX 1,442.8173
12099 FLORIDA POWER & LIGHT (PRV) 0990042 4 3 619 PRV4 SO2 2,898.8279
12099 FLORIDA POWER & LIGHT (PRV) 0990042 4 7 619 PRV4 NOX 0.0785
12099 FLORIDA POWER & LIGHT (PRV) 0990042 4 7 619 PRV4 SO2 0.0013
12101 FLORIDA POWER CORPDBAPROGRESS ENERGY FL 1010017 1 3 8048 1 NOX 3,501.5900
12101 FLORIDA POWER CORPDBAPROGRESS ENERGY FL 1010017 1 3 8048 1 SO2 13,162.8150
12101 FLORIDA POWER CORPDBAPROGRESS ENERGY FL 1010017 2 2 8048 2 NOX 3,075.4620
12101 FLORIDA POWER CORPDBAPROGRESS ENERGY FL 1010017 2 2 8048 2 SO2 13,875.6460
Appendix A - 64 Kentucky Regional Haze 5-Year Periodic Report SIP Revision, September 2014
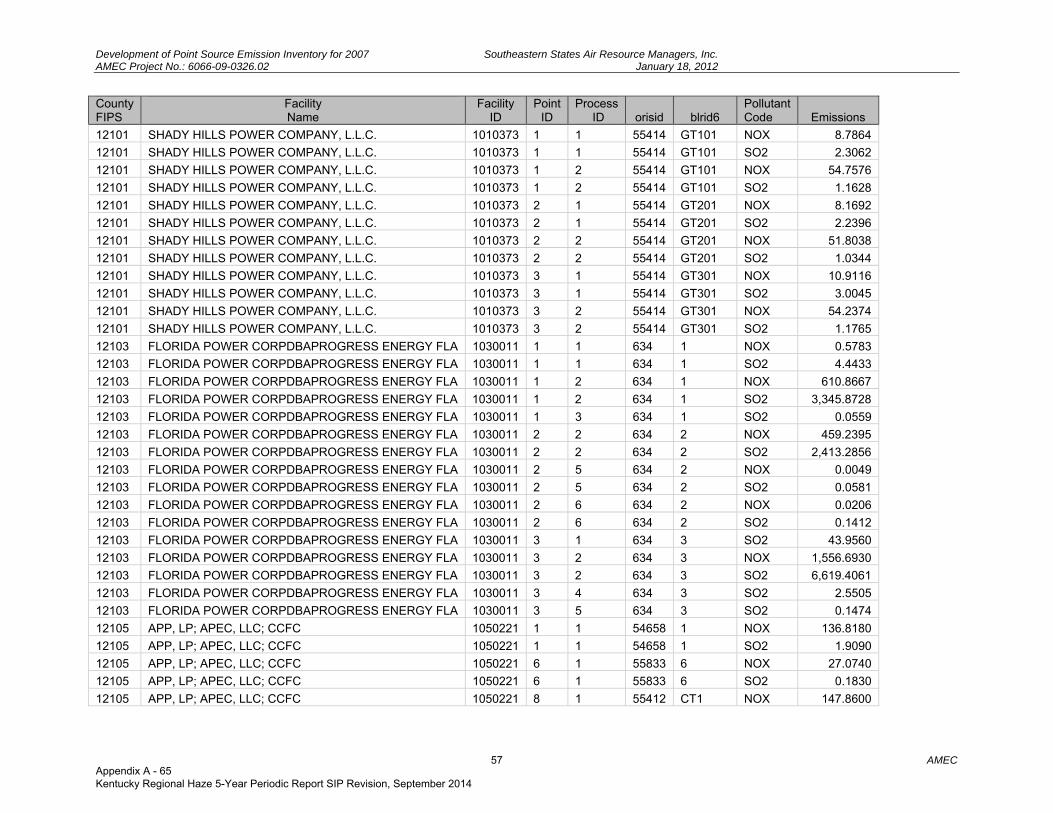
Development of Point Source Emission Inventory for 2007 Southeastern States Air Resource Managers, Inc. AMEC Project No.: 6066-09-0326.02 January 18, 2012
57 AMEC
County FIPS
Facility Name
Facility ID
Point ID
Process ID orisid blrid6
Pollutant Code Emissions
12101 SHADY HILLS POWER COMPANY, L.L.C. 1010373 1 1 55414 GT101 NOX 8.7864
12101 SHADY HILLS POWER COMPANY, L.L.C. 1010373 1 1 55414 GT101 SO2 2.3062
12101 SHADY HILLS POWER COMPANY, L.L.C. 1010373 1 2 55414 GT101 NOX 54.7576
12101 SHADY HILLS POWER COMPANY, L.L.C. 1010373 1 2 55414 GT101 SO2 1.1628
12101 SHADY HILLS POWER COMPANY, L.L.C. 1010373 2 1 55414 GT201 NOX 8.1692
12101 SHADY HILLS POWER COMPANY, L.L.C. 1010373 2 1 55414 GT201 SO2 2.2396
12101 SHADY HILLS POWER COMPANY, L.L.C. 1010373 2 2 55414 GT201 NOX 51.8038
12101 SHADY HILLS POWER COMPANY, L.L.C. 1010373 2 2 55414 GT201 SO2 1.0344
12101 SHADY HILLS POWER COMPANY, L.L.C. 1010373 3 1 55414 GT301 NOX 10.9116
12101 SHADY HILLS POWER COMPANY, L.L.C. 1010373 3 1 55414 GT301 SO2 3.0045
12101 SHADY HILLS POWER COMPANY, L.L.C. 1010373 3 2 55414 GT301 NOX 54.2374
12101 SHADY HILLS POWER COMPANY, L.L.C. 1010373 3 2 55414 GT301 SO2 1.1765
12103 FLORIDA POWER CORPDBAPROGRESS ENERGY FLA 1030011 1 1 634 1 NOX 0.5783
12103 FLORIDA POWER CORPDBAPROGRESS ENERGY FLA 1030011 1 1 634 1 SO2 4.4433
12103 FLORIDA POWER CORPDBAPROGRESS ENERGY FLA 1030011 1 2 634 1 NOX 610.8667
12103 FLORIDA POWER CORPDBAPROGRESS ENERGY FLA 1030011 1 2 634 1 SO2 3,345.8728
12103 FLORIDA POWER CORPDBAPROGRESS ENERGY FLA 1030011 1 3 634 1 SO2 0.0559
12103 FLORIDA POWER CORPDBAPROGRESS ENERGY FLA 1030011 2 2 634 2 NOX 459.2395
12103 FLORIDA POWER CORPDBAPROGRESS ENERGY FLA 1030011 2 2 634 2 SO2 2,413.2856
12103 FLORIDA POWER CORPDBAPROGRESS ENERGY FLA 1030011 2 5 634 2 NOX 0.0049
12103 FLORIDA POWER CORPDBAPROGRESS ENERGY FLA 1030011 2 5 634 2 SO2 0.0581
12103 FLORIDA POWER CORPDBAPROGRESS ENERGY FLA 1030011 2 6 634 2 NOX 0.0206
12103 FLORIDA POWER CORPDBAPROGRESS ENERGY FLA 1030011 2 6 634 2 SO2 0.1412
12103 FLORIDA POWER CORPDBAPROGRESS ENERGY FLA 1030011 3 1 634 3 SO2 43.9560
12103 FLORIDA POWER CORPDBAPROGRESS ENERGY FLA 1030011 3 2 634 3 NOX 1,556.6930
12103 FLORIDA POWER CORPDBAPROGRESS ENERGY FLA 1030011 3 2 634 3 SO2 6,619.4061
12103 FLORIDA POWER CORPDBAPROGRESS ENERGY FLA 1030011 3 4 634 3 SO2 2.5505
12103 FLORIDA POWER CORPDBAPROGRESS ENERGY FLA 1030011 3 5 634 3 SO2 0.1474
12105 APP, LP; APEC, LLC; CCFC 1050221 1 1 54658 1 NOX 136.8180
12105 APP, LP; APEC, LLC; CCFC 1050221 1 1 54658 1 SO2 1.9090
12105 APP, LP; APEC, LLC; CCFC 1050221 6 1 55833 6 NOX 27.0740
12105 APP, LP; APEC, LLC; CCFC 1050221 6 1 55833 6 SO2 0.1830
12105 APP, LP; APEC, LLC; CCFC 1050221 8 1 55412 CT1 NOX 147.8600
Appendix A - 65 Kentucky Regional Haze 5-Year Periodic Report SIP Revision, September 2014
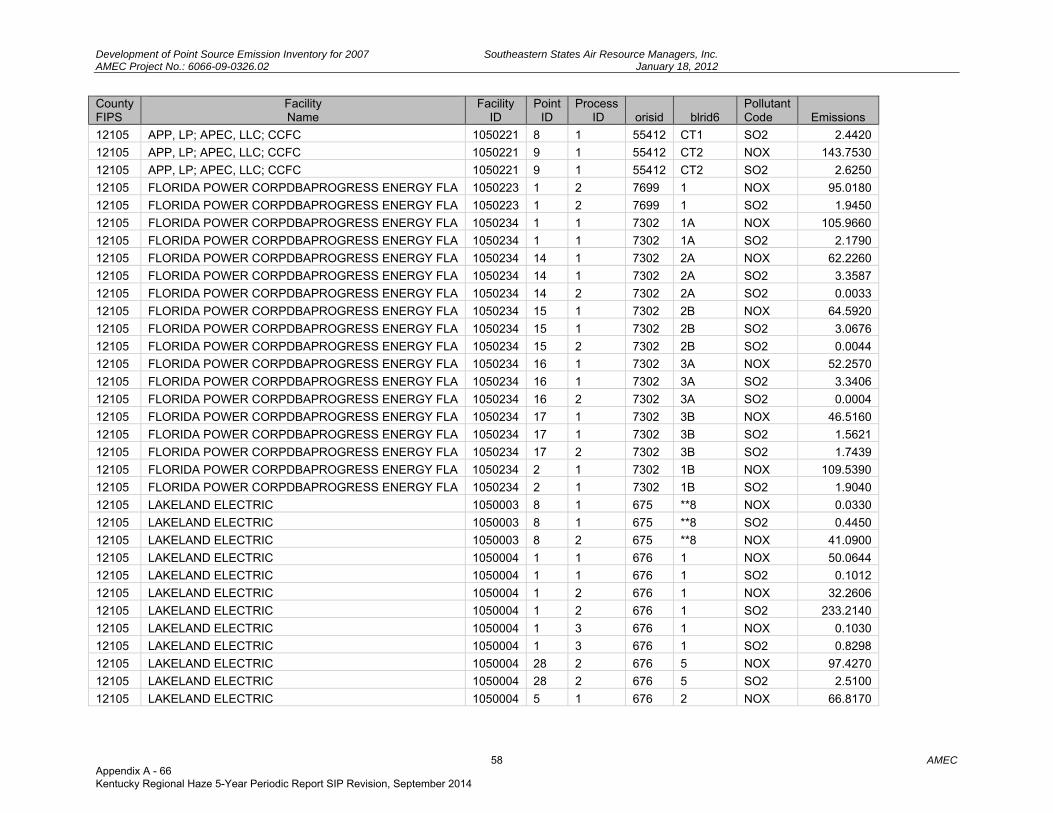
Development of Point Source Emission Inventory for 2007 Southeastern States Air Resource Managers, Inc. AMEC Project No.: 6066-09-0326.02 January 18, 2012
58 AMEC
County FIPS
Facility Name
Facility ID
Point ID
Process ID orisid blrid6
Pollutant Code Emissions
12105 APP, LP; APEC, LLC; CCFC 1050221 8 1 55412 CT1 SO2 2.4420
12105 APP, LP; APEC, LLC; CCFC 1050221 9 1 55412 CT2 NOX 143.7530
12105 APP, LP; APEC, LLC; CCFC 1050221 9 1 55412 CT2 SO2 2.6250
12105 FLORIDA POWER CORPDBAPROGRESS ENERGY FLA 1050223 1 2 7699 1 NOX 95.0180
12105 FLORIDA POWER CORPDBAPROGRESS ENERGY FLA 1050223 1 2 7699 1 SO2 1.9450
12105 FLORIDA POWER CORPDBAPROGRESS ENERGY FLA 1050234 1 1 7302 1A NOX 105.9660
12105 FLORIDA POWER CORPDBAPROGRESS ENERGY FLA 1050234 1 1 7302 1A SO2 2.1790
12105 FLORIDA POWER CORPDBAPROGRESS ENERGY FLA 1050234 14 1 7302 2A NOX 62.2260
12105 FLORIDA POWER CORPDBAPROGRESS ENERGY FLA 1050234 14 1 7302 2A SO2 3.3587
12105 FLORIDA POWER CORPDBAPROGRESS ENERGY FLA 1050234 14 2 7302 2A SO2 0.0033
12105 FLORIDA POWER CORPDBAPROGRESS ENERGY FLA 1050234 15 1 7302 2B NOX 64.5920
12105 FLORIDA POWER CORPDBAPROGRESS ENERGY FLA 1050234 15 1 7302 2B SO2 3.0676
12105 FLORIDA POWER CORPDBAPROGRESS ENERGY FLA 1050234 15 2 7302 2B SO2 0.0044
12105 FLORIDA POWER CORPDBAPROGRESS ENERGY FLA 1050234 16 1 7302 3A NOX 52.2570
12105 FLORIDA POWER CORPDBAPROGRESS ENERGY FLA 1050234 16 1 7302 3A SO2 3.3406
12105 FLORIDA POWER CORPDBAPROGRESS ENERGY FLA 1050234 16 2 7302 3A SO2 0.0004
12105 FLORIDA POWER CORPDBAPROGRESS ENERGY FLA 1050234 17 1 7302 3B NOX 46.5160
12105 FLORIDA POWER CORPDBAPROGRESS ENERGY FLA 1050234 17 1 7302 3B SO2 1.5621
12105 FLORIDA POWER CORPDBAPROGRESS ENERGY FLA 1050234 17 2 7302 3B SO2 1.7439
12105 FLORIDA POWER CORPDBAPROGRESS ENERGY FLA 1050234 2 1 7302 1B NOX 109.5390
12105 FLORIDA POWER CORPDBAPROGRESS ENERGY FLA 1050234 2 1 7302 1B SO2 1.9040
12105 LAKELAND ELECTRIC 1050003 8 1 675 **8 NOX 0.0330
12105 LAKELAND ELECTRIC 1050003 8 1 675 **8 SO2 0.4450
12105 LAKELAND ELECTRIC 1050003 8 2 675 **8 NOX 41.0900
12105 LAKELAND ELECTRIC 1050004 1 1 676 1 NOX 50.0644
12105 LAKELAND ELECTRIC 1050004 1 1 676 1 SO2 0.1012
12105 LAKELAND ELECTRIC 1050004 1 2 676 1 NOX 32.2606
12105 LAKELAND ELECTRIC 1050004 1 2 676 1 SO2 233.2140
12105 LAKELAND ELECTRIC 1050004 1 3 676 1 NOX 0.1030
12105 LAKELAND ELECTRIC 1050004 1 3 676 1 SO2 0.8298
12105 LAKELAND ELECTRIC 1050004 28 2 676 5 NOX 97.4270
12105 LAKELAND ELECTRIC 1050004 28 2 676 5 SO2 2.5100
12105 LAKELAND ELECTRIC 1050004 5 1 676 2 NOX 66.8170
Appendix A - 66 Kentucky Regional Haze 5-Year Periodic Report SIP Revision, September 2014

Development of Point Source Emission Inventory for 2007 Southeastern States Air Resource Managers, Inc. AMEC Project No.: 6066-09-0326.02 January 18, 2012
59 AMEC
County FIPS
Facility Name
Facility ID
Point ID
Process ID orisid blrid6
Pollutant Code Emissions
12105 LAKELAND ELECTRIC 1050004 5 1 676 2 SO2 0.3880
12105 LAKELAND ELECTRIC 1050004 5 2 676 2 NOX 3.7260
12105 LAKELAND ELECTRIC 1050004 5 2 676 2 SO2 10.3390
12105 LAKELAND ELECTRIC 1050004 6 3 676 3 NOX 5,229.7091
12105 LAKELAND ELECTRIC 1050004 6 3 676 3 SO2 7,205.7910
12105 LAKELAND ELECTRIC 1050004 6 4 676 3 NOX 1.9460
12105 LAKELAND ELECTRIC 1050004 6 4 676 3 SO2 0.0140
12105 LAKELAND ELECTRIC 1050004 6 9 676 3 NOX 12.6179
12105 LAKELAND ELECTRIC 1050004 6 9 676 3 SO2 17.3910
12105 ORANGE COGENERATION LIMITED PARTNERSHIP 1050231 1 1 54365 1 NOX 41.1760
12105 ORANGE COGENERATION LIMITED PARTNERSHIP 1050231 1 1 54365 1 SO2 0.5030
12105 ORANGE COGENERATION LIMITED PARTNERSHIP 1050231 2 1 54365 2 NOX 37.9090
12105 ORANGE COGENERATION LIMITED PARTNERSHIP 1050231 2 1 54365 2 SO2 0.4620
12105 POLK POWER PARTNERS, L.P. 1050217 1 1 54426 1 NOX 66.7060
12105 POLK POWER PARTNERS, L.P. 1050217 1 1 54426 1 SO2 1.0840
12105 TAMPA ELECTRIC COMPANY 1050233 1 2 7242 **1 NOX 396.4470
12105 TAMPA ELECTRIC COMPANY 1050233 1 2 7242 **1 SO2 1,069.8370
12105 TAMPA ELECTRIC COMPANY 1050233 10 2 7242 **3 NOX 16.6730
12105 TAMPA ELECTRIC COMPANY 1050233 10 2 7242 **3 SO2 0.5210
12105 TAMPA ELECTRIC COMPANY 1050233 13 1 7242 **4 NOX 13.3070
12105 TAMPA ELECTRIC COMPANY 1050233 13 1 7242 **4 SO2 0.2560
12105 TAMPA ELECTRIC COMPANY 1050233 14 1 7242 **5 NOX 11.9230
12105 TAMPA ELECTRIC COMPANY 1050233 14 1 7242 **5 SO2 0.2200
12105 TAMPA ELECTRIC COMPANY 1050233 9 1 7242 **2 NOX 12.6590
12105 TAMPA ELECTRIC COMPANY 1050233 9 1 7242 **2 SO2 0.3090
12107 FLORIDA POWER & LIGHT (PPN) 1070014 3 1 6246 HRSG11 NOX 421.6841
12107 FLORIDA POWER & LIGHT (PPN) 1070014 3 1 6246 HRSG11 SO2 0.6413
12107 FLORIDA POWER & LIGHT (PPN) 1070014 3 2 6246 HRSG11 NOX 0.1289
12107 FLORIDA POWER & LIGHT (PPN) 1070014 3 2 6246 HRSG11 SO2 0.1167
12107 FLORIDA POWER & LIGHT (PPN) 1070014 4 1 6246 HRSG12 NOX 468.8591
12107 FLORIDA POWER & LIGHT (PPN) 1070014 4 1 6246 HRSG12 SO2 0.6618
12107 FLORIDA POWER & LIGHT (PPN) 1070014 4 2 6246 HRSG12 NOX 0.1419
12107 FLORIDA POWER & LIGHT (PPN) 1070014 4 2 6246 HRSG12 SO2 0.1192
Appendix A - 67 Kentucky Regional Haze 5-Year Periodic Report SIP Revision, September 2014
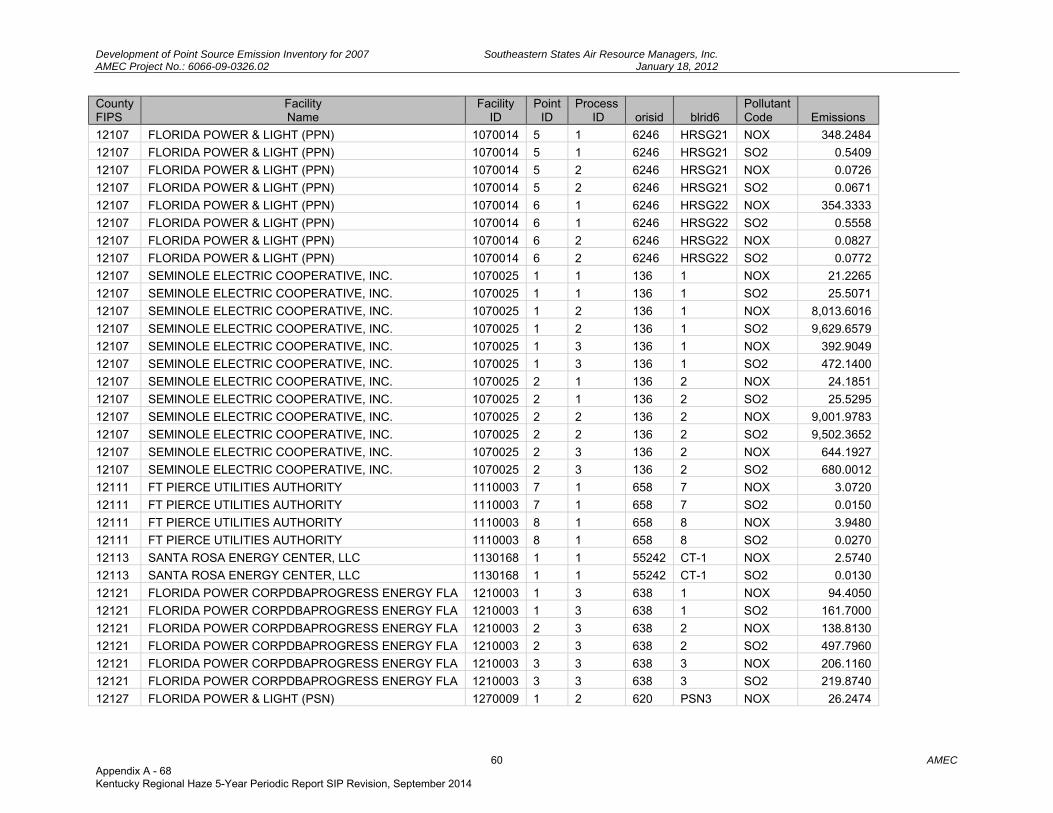
Development of Point Source Emission Inventory for 2007 Southeastern States Air Resource Managers, Inc. AMEC Project No.: 6066-09-0326.02 January 18, 2012
60 AMEC
County FIPS
Facility Name
Facility ID
Point ID
Process ID orisid blrid6
Pollutant Code Emissions
12107 FLORIDA POWER & LIGHT (PPN) 1070014 5 1 6246 HRSG21 NOX 348.2484
12107 FLORIDA POWER & LIGHT (PPN) 1070014 5 1 6246 HRSG21 SO2 0.5409
12107 FLORIDA POWER & LIGHT (PPN) 1070014 5 2 6246 HRSG21 NOX 0.0726
12107 FLORIDA POWER & LIGHT (PPN) 1070014 5 2 6246 HRSG21 SO2 0.0671
12107 FLORIDA POWER & LIGHT (PPN) 1070014 6 1 6246 HRSG22 NOX 354.3333
12107 FLORIDA POWER & LIGHT (PPN) 1070014 6 1 6246 HRSG22 SO2 0.5558
12107 FLORIDA POWER & LIGHT (PPN) 1070014 6 2 6246 HRSG22 NOX 0.0827
12107 FLORIDA POWER & LIGHT (PPN) 1070014 6 2 6246 HRSG22 SO2 0.0772
12107 SEMINOLE ELECTRIC COOPERATIVE, INC. 1070025 1 1 136 1 NOX 21.2265
12107 SEMINOLE ELECTRIC COOPERATIVE, INC. 1070025 1 1 136 1 SO2 25.5071
12107 SEMINOLE ELECTRIC COOPERATIVE, INC. 1070025 1 2 136 1 NOX 8,013.6016
12107 SEMINOLE ELECTRIC COOPERATIVE, INC. 1070025 1 2 136 1 SO2 9,629.6579
12107 SEMINOLE ELECTRIC COOPERATIVE, INC. 1070025 1 3 136 1 NOX 392.9049
12107 SEMINOLE ELECTRIC COOPERATIVE, INC. 1070025 1 3 136 1 SO2 472.1400
12107 SEMINOLE ELECTRIC COOPERATIVE, INC. 1070025 2 1 136 2 NOX 24.1851
12107 SEMINOLE ELECTRIC COOPERATIVE, INC. 1070025 2 1 136 2 SO2 25.5295
12107 SEMINOLE ELECTRIC COOPERATIVE, INC. 1070025 2 2 136 2 NOX 9,001.9783
12107 SEMINOLE ELECTRIC COOPERATIVE, INC. 1070025 2 2 136 2 SO2 9,502.3652
12107 SEMINOLE ELECTRIC COOPERATIVE, INC. 1070025 2 3 136 2 NOX 644.1927
12107 SEMINOLE ELECTRIC COOPERATIVE, INC. 1070025 2 3 136 2 SO2 680.0012
12111 FT PIERCE UTILITIES AUTHORITY 1110003 7 1 658 7 NOX 3.0720
12111 FT PIERCE UTILITIES AUTHORITY 1110003 7 1 658 7 SO2 0.0150
12111 FT PIERCE UTILITIES AUTHORITY 1110003 8 1 658 8 NOX 3.9480
12111 FT PIERCE UTILITIES AUTHORITY 1110003 8 1 658 8 SO2 0.0270
12113 SANTA ROSA ENERGY CENTER, LLC 1130168 1 1 55242 CT-1 NOX 2.5740
12113 SANTA ROSA ENERGY CENTER, LLC 1130168 1 1 55242 CT-1 SO2 0.0130
12121 FLORIDA POWER CORPDBAPROGRESS ENERGY FLA 1210003 1 3 638 1 NOX 94.4050
12121 FLORIDA POWER CORPDBAPROGRESS ENERGY FLA 1210003 1 3 638 1 SO2 161.7000
12121 FLORIDA POWER CORPDBAPROGRESS ENERGY FLA 1210003 2 3 638 2 NOX 138.8130
12121 FLORIDA POWER CORPDBAPROGRESS ENERGY FLA 1210003 2 3 638 2 SO2 497.7960
12121 FLORIDA POWER CORPDBAPROGRESS ENERGY FLA 1210003 3 3 638 3 NOX 206.1160
12121 FLORIDA POWER CORPDBAPROGRESS ENERGY FLA 1210003 3 3 638 3 SO2 219.8740
12127 FLORIDA POWER & LIGHT (PSN) 1270009 1 2 620 PSN3 NOX 26.2474
Appendix A - 68 Kentucky Regional Haze 5-Year Periodic Report SIP Revision, September 2014

Development of Point Source Emission Inventory for 2007 Southeastern States Air Resource Managers, Inc. AMEC Project No.: 6066-09-0326.02 January 18, 2012
61 AMEC
County FIPS
Facility Name
Facility ID
Point ID
Process ID orisid blrid6
Pollutant Code Emissions
12127 FLORIDA POWER & LIGHT (PSN) 1270009 1 2 620 PSN3 SO2 0.0450
12127 FLORIDA POWER & LIGHT (PSN) 1270009 1 3 620 PSN3 NOX 102.4412
12127 FLORIDA POWER & LIGHT (PSN) 1270009 1 3 620 PSN3 SO2 301.3209
12127 FLORIDA POWER & LIGHT (PSN) 1270009 1 5 620 PSN3 NOX 0.0044
12127 FLORIDA POWER & LIGHT (PSN) 1270009 1 5 620 PSN3 SO2 0.0001
12127 FLORIDA POWER & LIGHT (PSN) 1270009 10 1 620 SNCT4A NOX 162.9600
12127 FLORIDA POWER & LIGHT (PSN) 1270009 10 1 620 SNCT4A SO2 3.2870
12127 FLORIDA POWER & LIGHT (PSN) 1270009 11 1 620 SNCT4B NOX 164.9690
12127 FLORIDA POWER & LIGHT (PSN) 1270009 11 1 620 SNCT4B SO2 3.2720
12127 FLORIDA POWER & LIGHT (PSN) 1270009 12 1 620 SNCT4C NOX 165.9270
12127 FLORIDA POWER & LIGHT (PSN) 1270009 12 1 620 SNCT4C SO2 3.3120
12127 FLORIDA POWER & LIGHT (PSN) 1270009 13 1 620 SNCT4D NOX 164.2300
12127 FLORIDA POWER & LIGHT (PSN) 1270009 13 1 620 SNCT4D SO2 3.2140
12127 FLORIDA POWER & LIGHT (PSN) 1270009 14 1 620 SNCT5A NOX 159.9210
12127 FLORIDA POWER & LIGHT (PSN) 1270009 14 1 620 SNCT5A SO2 3.2940
12127 FLORIDA POWER & LIGHT (PSN) 1270009 15 1 620 SNCT5B NOX 169.2910
12127 FLORIDA POWER & LIGHT (PSN) 1270009 15 1 620 SNCT5B SO2 3.3520
12127 FLORIDA POWER & LIGHT (PSN) 1270009 16 1 620 SNCT5C NOX 176.7560
12127 FLORIDA POWER & LIGHT (PSN) 1270009 16 1 620 SNCT5C SO2 3.5150
12127 FLORIDA POWER & LIGHT (PSN) 1270009 17 1 620 SNCT5D NOX 147.2680
12127 FLORIDA POWER & LIGHT (PSN) 1270009 17 1 620 SNCT5D SO2 2.9870
12127 FLORIDA POWER CORPORATION D/B/A PROGRESS 1270028 15 1 6046 **7 NOX 25.0110
12127 FLORIDA POWER CORPORATION D/B/A PROGRESS 1270028 15 1 6046 **7 SO2 7.8710
12127 FLORIDA POWER CORPORATION D/B/A PROGRESS 1270028 16 1 6046 **8 NOX 24.7430
12127 FLORIDA POWER CORPORATION D/B/A PROGRESS 1270028 16 1 6046 **8 SO2 7.8890
12127 FLORIDA POWER CORPORATION D/B/A PROGRESS 1270028 17 1 6046 **9 NOX 21.1780
12127 FLORIDA POWER CORPORATION D/B/A PROGRESS 1270028 17 1 6046 **9 SO2 7.2580
12127 FLORIDA POWER CORPORATION D/B/A PROGRESS 1270028 18 1 6046 **10 NOX 12.8920
12127 FLORIDA POWER CORPORATION D/B/A PROGRESS 1270028 18 1 6046 **10 SO2 27.7750
12129 TALLAHASSEE CITY PURDOM GENERATING STA. 1290001 14 2 689 8 NOX 0.0095
12129 TALLAHASSEE CITY PURDOM GENERATING STA. 1290001 14 2 689 8 SO2 0.6976
12129 TALLAHASSEE CITY PURDOM GENERATING STA. 1290001 14 3 689 8 NOX 155.9895
12129 TALLAHASSEE CITY PURDOM GENERATING STA. 1290001 14 3 689 8 SO2 3.3884
Appendix A - 69 Kentucky Regional Haze 5-Year Periodic Report SIP Revision, September 2014

Development of Point Source Emission Inventory for 2007 Southeastern States Air Resource Managers, Inc. AMEC Project No.: 6066-09-0326.02 January 18, 2012
62 AMEC
County FIPS
Facility Name
Facility ID
Point ID
Process ID orisid blrid6
Pollutant Code Emissions
12129 TALLAHASSEE CITY PURDOM GENERATING STA. 1290001 7 1 689 7 NOX 65.7000
12129 TALLAHASSEE CITY PURDOM GENERATING STA. 1290001 7 1 689 7 SO2 0.1650 1.9.8.4 Georgia County FIPS
Facility Name
Facility ID
Point ID
Process ID orisid blrid6
Pollutant Code Emissions
13015 Ga Power Company - Plant Bowen 01500011 S1 1 703 1BLR NOX 3,551.5650
13015 Ga Power Company - Plant Bowen 01500011 S2 1 703 2BLR NOX 4,843.6210
13015 Ga Power Company - Plant Bowen 01500011 S3 1 703 3BLR NOX 5,702.3250
13015 Ga Power Company - Plant Bowen 01500011 S4 1 703 4BLR NOX 4,357.2060
13051 Ga Power Company - Plant Kraft 05100006 CS1 1 733 1 NOX 1,149.0060
13051 Ga Power Company - Plant Kraft 05100006 CS1 1 733 2 NOX 1,033.9480
13051 Ga Power Company - Plant Kraft 05100006 CS1 1 733 2 SO2 1,878.7780
13051 Ga Power Company - Plant Kraft 05100006 CS1 1 733 3 NOX 2,049.3030
13051 Ga Power Company - Plant Kraft 05100006 CS1 1 733 3 SO2 3,622.6650
13051 Ga Power Company - Plant Kraft 05100006 CS1 2 733 4 NOX 80.5700
13051 Ga Power Company - Plant Kraft 05100006 CS1 2 733 4 SO2 124.1710
13067 Ga Power Company - Plant McDonough/Atkinson 06700003 ST1M 1 710 MB1 NOX 2,257.2080
13067 Ga Power Company - Plant McDonough/Atkinson 06700003 ST1M 1 710 MB1 SO2 13,983.3410
13067 Ga Power Company - Plant McDonough/Atkinson 06700003 ST1M 1 710 MB2 SO2 14,554.9210
13077 Ga Power Company - Plant Yates 07700001 ST1 1 728 Y2BR NOX 1,528.4600
13077 Ga Power Company - Plant Yates 07700001 ST1A 1 728 Y1BR NOX 1,426.7150
13077 Ga Power Company - Plant Yates 07700001 ST2 1 728 Y4BR NOX 1,612.0040
13077 Ga Power Company - Plant Yates 07700001 ST2 1 728 Y4BR SO2 9,213.6580
13077 Ga Power Company - Plant Yates 07700001 ST2 1 728 Y5BR NOX 1,432.3790
13077 Ga Power Company - Plant Yates 07700001 ST2 1 728 Y5BR SO2 8,636.7830
13095 Ga Power Company - Plant Mitchell 09500002 ST3 1 727 3 NOX 1,985.0730
13103 Effingham County Power, LLC 10300012 S2 CTG2 55406 2 NOX 42.4840
13103 Ga Power Co Plt Mcintosh 10300003 S1 1 6124 1 NOX 2,092.3980
13115 Ga Power Company - Plant Hammond 11500003 ST2 1 708 4 NOX 4,176.1840
13127 Ga Power Company - Plant McManus 12700004 ST01 2 715 1 NOX 18.4800
13127 Ga Power Company - Plant McManus 12700004 ST01 2 715 2 NOX 27.5130
13149 Ga Power Company - Plant Wansley 14900001 ST01 1 6052 1 NOX 5,831.9880
13149 Ga Power Company - Plant Wansley 14900001 ST02 1 6052 2 NOX 8,026.3610
Appendix A - 70 Kentucky Regional Haze 5-Year Periodic Report SIP Revision, September 2014
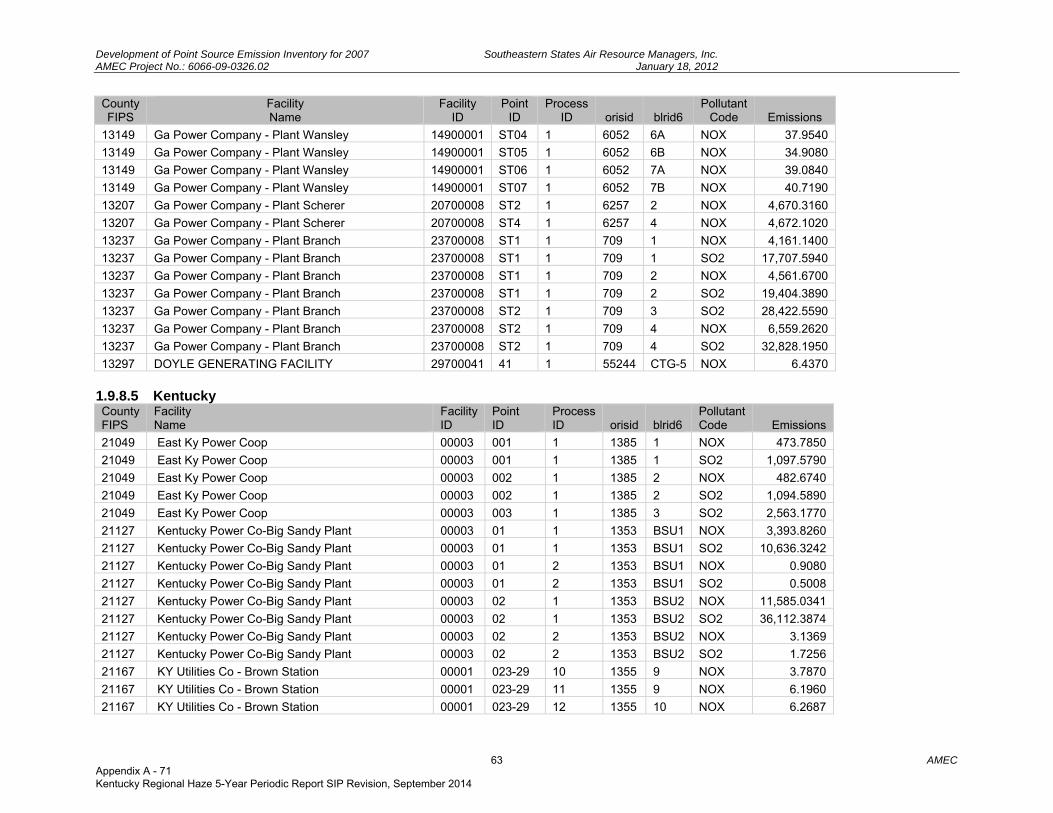
Development of Point Source Emission Inventory for 2007 Southeastern States Air Resource Managers, Inc. AMEC Project No.: 6066-09-0326.02 January 18, 2012
63 AMEC
County FIPS
Facility Name
Facility ID
Point ID
Process ID orisid blrid6
Pollutant Code Emissions
13149 Ga Power Company - Plant Wansley 14900001 ST04 1 6052 6A NOX 37.9540
13149 Ga Power Company - Plant Wansley 14900001 ST05 1 6052 6B NOX 34.9080
13149 Ga Power Company - Plant Wansley 14900001 ST06 1 6052 7A NOX 39.0840
13149 Ga Power Company - Plant Wansley 14900001 ST07 1 6052 7B NOX 40.7190
13207 Ga Power Company - Plant Scherer 20700008 ST2 1 6257 2 NOX 4,670.3160
13207 Ga Power Company - Plant Scherer 20700008 ST4 1 6257 4 NOX 4,672.1020
13237 Ga Power Company - Plant Branch 23700008 ST1 1 709 1 NOX 4,161.1400
13237 Ga Power Company - Plant Branch 23700008 ST1 1 709 1 SO2 17,707.5940
13237 Ga Power Company - Plant Branch 23700008 ST1 1 709 2 NOX 4,561.6700
13237 Ga Power Company - Plant Branch 23700008 ST1 1 709 2 SO2 19,404.3890
13237 Ga Power Company - Plant Branch 23700008 ST2 1 709 3 SO2 28,422.5590
13237 Ga Power Company - Plant Branch 23700008 ST2 1 709 4 NOX 6,559.2620
13237 Ga Power Company - Plant Branch 23700008 ST2 1 709 4 SO2 32,828.1950
13297 DOYLE GENERATING FACILITY 29700041 41 1 55244 CTG-5 NOX 6.4370 1.9.8.5 Kentucky County FIPS
Facility Name
Facility ID
Point ID
Process ID orisid blrid6
Pollutant Code Emissions
21049 East Ky Power Coop 00003 001 1 1385 1 NOX 473.7850
21049 East Ky Power Coop 00003 001 1 1385 1 SO2 1,097.5790
21049 East Ky Power Coop 00003 002 1 1385 2 NOX 482.6740
21049 East Ky Power Coop 00003 002 1 1385 2 SO2 1,094.5890
21049 East Ky Power Coop 00003 003 1 1385 3 SO2 2,563.1770
21127 Kentucky Power Co-Big Sandy Plant 00003 01 1 1353 BSU1 NOX 3,393.8260
21127 Kentucky Power Co-Big Sandy Plant 00003 01 1 1353 BSU1 SO2 10,636.3242
21127 Kentucky Power Co-Big Sandy Plant 00003 01 2 1353 BSU1 NOX 0.9080
21127 Kentucky Power Co-Big Sandy Plant 00003 01 2 1353 BSU1 SO2 0.5008
21127 Kentucky Power Co-Big Sandy Plant 00003 02 1 1353 BSU2 NOX 11,585.0341
21127 Kentucky Power Co-Big Sandy Plant 00003 02 1 1353 BSU2 SO2 36,112.3874
21127 Kentucky Power Co-Big Sandy Plant 00003 02 2 1353 BSU2 NOX 3.1369
21127 Kentucky Power Co-Big Sandy Plant 00003 02 2 1353 BSU2 SO2 1.7256
21167 KY Utilities Co - Brown Station 00001 023-29 10 1355 9 NOX 3.7870
21167 KY Utilities Co - Brown Station 00001 023-29 11 1355 9 NOX 6.1960
21167 KY Utilities Co - Brown Station 00001 023-29 12 1355 10 NOX 6.2687
Appendix A - 71 Kentucky Regional Haze 5-Year Periodic Report SIP Revision, September 2014
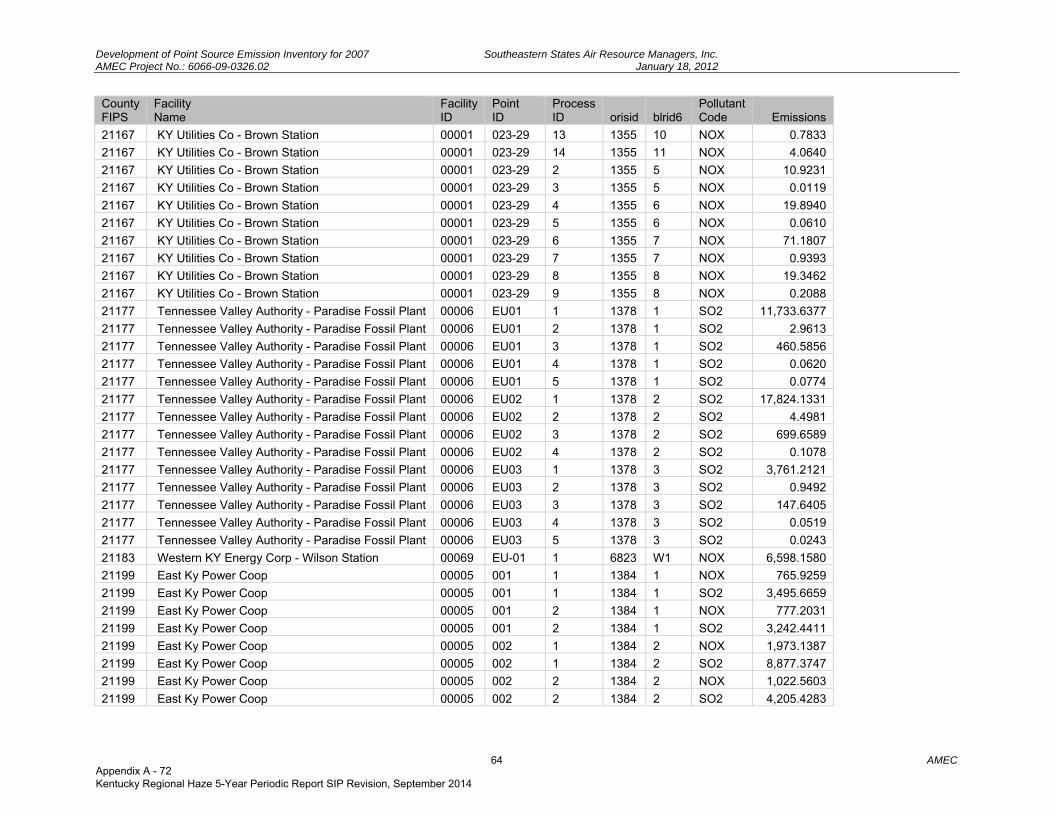
Development of Point Source Emission Inventory for 2007 Southeastern States Air Resource Managers, Inc. AMEC Project No.: 6066-09-0326.02 January 18, 2012
64 AMEC
County FIPS
Facility Name
Facility ID
Point ID
Process ID orisid blrid6
Pollutant Code Emissions
21167 KY Utilities Co - Brown Station 00001 023-29 13 1355 10 NOX 0.7833
21167 KY Utilities Co - Brown Station 00001 023-29 14 1355 11 NOX 4.0640
21167 KY Utilities Co - Brown Station 00001 023-29 2 1355 5 NOX 10.9231
21167 KY Utilities Co - Brown Station 00001 023-29 3 1355 5 NOX 0.0119
21167 KY Utilities Co - Brown Station 00001 023-29 4 1355 6 NOX 19.8940
21167 KY Utilities Co - Brown Station 00001 023-29 5 1355 6 NOX 0.0610
21167 KY Utilities Co - Brown Station 00001 023-29 6 1355 7 NOX 71.1807
21167 KY Utilities Co - Brown Station 00001 023-29 7 1355 7 NOX 0.9393
21167 KY Utilities Co - Brown Station 00001 023-29 8 1355 8 NOX 19.3462
21167 KY Utilities Co - Brown Station 00001 023-29 9 1355 8 NOX 0.2088
21177 Tennessee Valley Authority - Paradise Fossil Plant 00006 EU01 1 1378 1 SO2 11,733.6377
21177 Tennessee Valley Authority - Paradise Fossil Plant 00006 EU01 2 1378 1 SO2 2.9613
21177 Tennessee Valley Authority - Paradise Fossil Plant 00006 EU01 3 1378 1 SO2 460.5856
21177 Tennessee Valley Authority - Paradise Fossil Plant 00006 EU01 4 1378 1 SO2 0.0620
21177 Tennessee Valley Authority - Paradise Fossil Plant 00006 EU01 5 1378 1 SO2 0.0774
21177 Tennessee Valley Authority - Paradise Fossil Plant 00006 EU02 1 1378 2 SO2 17,824.1331
21177 Tennessee Valley Authority - Paradise Fossil Plant 00006 EU02 2 1378 2 SO2 4.4981
21177 Tennessee Valley Authority - Paradise Fossil Plant 00006 EU02 3 1378 2 SO2 699.6589
21177 Tennessee Valley Authority - Paradise Fossil Plant 00006 EU02 4 1378 2 SO2 0.1078
21177 Tennessee Valley Authority - Paradise Fossil Plant 00006 EU03 1 1378 3 SO2 3,761.2121
21177 Tennessee Valley Authority - Paradise Fossil Plant 00006 EU03 2 1378 3 SO2 0.9492
21177 Tennessee Valley Authority - Paradise Fossil Plant 00006 EU03 3 1378 3 SO2 147.6405
21177 Tennessee Valley Authority - Paradise Fossil Plant 00006 EU03 4 1378 3 SO2 0.0519
21177 Tennessee Valley Authority - Paradise Fossil Plant 00006 EU03 5 1378 3 SO2 0.0243
21183 Western KY Energy Corp - Wilson Station 00069 EU-01 1 6823 W1 NOX 6,598.1580
21199 East Ky Power Coop 00005 001 1 1384 1 NOX 765.9259
21199 East Ky Power Coop 00005 001 1 1384 1 SO2 3,495.6659
21199 East Ky Power Coop 00005 001 2 1384 1 NOX 777.2031
21199 East Ky Power Coop 00005 001 2 1384 1 SO2 3,242.4411
21199 East Ky Power Coop 00005 002 1 1384 2 NOX 1,973.1387
21199 East Ky Power Coop 00005 002 1 1384 2 SO2 8,877.3747
21199 East Ky Power Coop 00005 002 2 1384 2 NOX 1,022.5603
21199 East Ky Power Coop 00005 002 2 1384 2 SO2 4,205.4283
Appendix A - 72 Kentucky Regional Haze 5-Year Periodic Report SIP Revision, September 2014
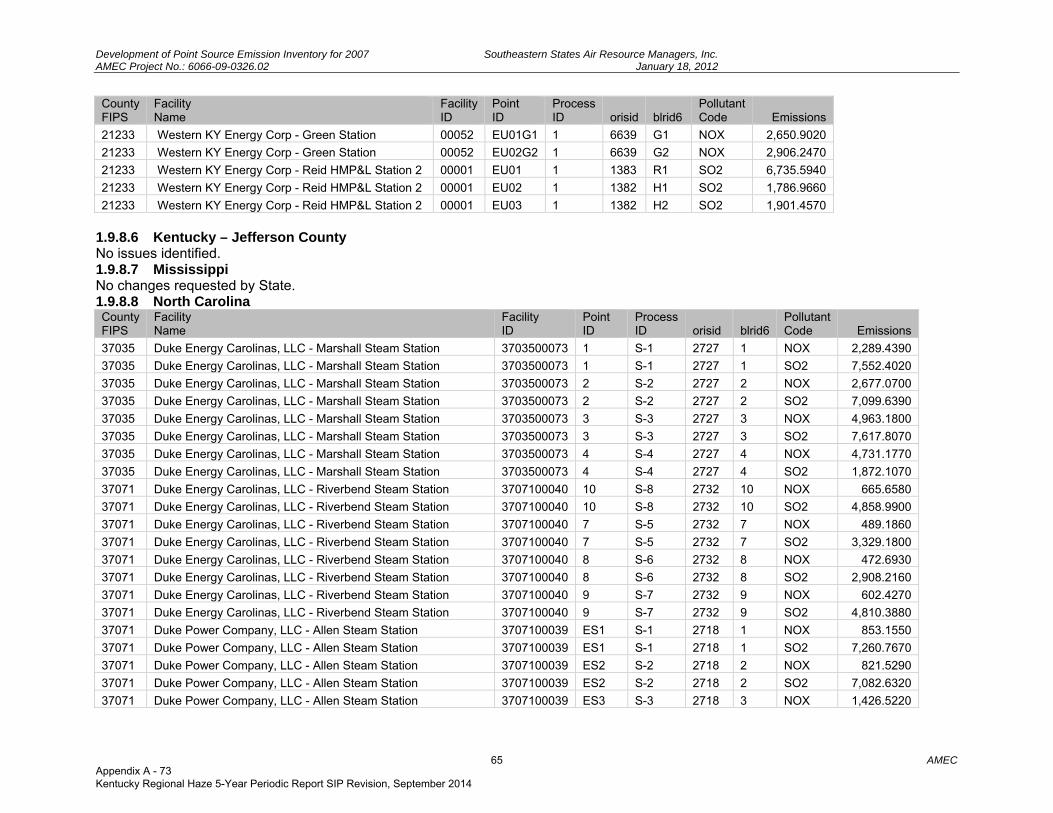
Development of Point Source Emission Inventory for 2007 Southeastern States Air Resource Managers, Inc. AMEC Project No.: 6066-09-0326.02 January 18, 2012
65 AMEC
County FIPS
Facility Name
Facility ID
Point ID
Process ID orisid blrid6
Pollutant Code Emissions
21233 Western KY Energy Corp - Green Station 00052 EU01G1 1 6639 G1 NOX 2,650.9020
21233 Western KY Energy Corp - Green Station 00052 EU02G2 1 6639 G2 NOX 2,906.2470
21233 Western KY Energy Corp - Reid HMP&L Station 2 00001 EU01 1 1383 R1 SO2 6,735.5940
21233 Western KY Energy Corp - Reid HMP&L Station 2 00001 EU02 1 1382 H1 SO2 1,786.9660
21233 Western KY Energy Corp - Reid HMP&L Station 2 00001 EU03 1 1382 H2 SO2 1,901.4570 1.9.8.6 Kentucky – Jefferson County No issues identified. 1.9.8.7 Mississippi No changes requested by State. 1.9.8.8 North Carolina County FIPS
Facility Name
Facility ID
Point ID
Process ID orisid blrid6
Pollutant Code Emissions
37035 Duke Energy Carolinas, LLC - Marshall Steam Station 3703500073 1 S-1 2727 1 NOX 2,289.4390
37035 Duke Energy Carolinas, LLC - Marshall Steam Station 3703500073 1 S-1 2727 1 SO2 7,552.4020
37035 Duke Energy Carolinas, LLC - Marshall Steam Station 3703500073 2 S-2 2727 2 NOX 2,677.0700
37035 Duke Energy Carolinas, LLC - Marshall Steam Station 3703500073 2 S-2 2727 2 SO2 7,099.6390
37035 Duke Energy Carolinas, LLC - Marshall Steam Station 3703500073 3 S-3 2727 3 NOX 4,963.1800
37035 Duke Energy Carolinas, LLC - Marshall Steam Station 3703500073 3 S-3 2727 3 SO2 7,617.8070
37035 Duke Energy Carolinas, LLC - Marshall Steam Station 3703500073 4 S-4 2727 4 NOX 4,731.1770
37035 Duke Energy Carolinas, LLC - Marshall Steam Station 3703500073 4 S-4 2727 4 SO2 1,872.1070
37071 Duke Energy Carolinas, LLC - Riverbend Steam Station 3707100040 10 S-8 2732 10 NOX 665.6580
37071 Duke Energy Carolinas, LLC - Riverbend Steam Station 3707100040 10 S-8 2732 10 SO2 4,858.9900
37071 Duke Energy Carolinas, LLC - Riverbend Steam Station 3707100040 7 S-5 2732 7 NOX 489.1860
37071 Duke Energy Carolinas, LLC - Riverbend Steam Station 3707100040 7 S-5 2732 7 SO2 3,329.1800
37071 Duke Energy Carolinas, LLC - Riverbend Steam Station 3707100040 8 S-6 2732 8 NOX 472.6930
37071 Duke Energy Carolinas, LLC - Riverbend Steam Station 3707100040 8 S-6 2732 8 SO2 2,908.2160
37071 Duke Energy Carolinas, LLC - Riverbend Steam Station 3707100040 9 S-7 2732 9 NOX 602.4270
37071 Duke Energy Carolinas, LLC - Riverbend Steam Station 3707100040 9 S-7 2732 9 SO2 4,810.3880
37071 Duke Power Company, LLC - Allen Steam Station 3707100039 ES1 S-1 2718 1 NOX 853.1550
37071 Duke Power Company, LLC - Allen Steam Station 3707100039 ES1 S-1 2718 1 SO2 7,260.7670
37071 Duke Power Company, LLC - Allen Steam Station 3707100039 ES2 S-2 2718 2 NOX 821.5290
37071 Duke Power Company, LLC - Allen Steam Station 3707100039 ES2 S-2 2718 2 SO2 7,082.6320
37071 Duke Power Company, LLC - Allen Steam Station 3707100039 ES3 S-3 2718 3 NOX 1,426.5220
Appendix A - 73 Kentucky Regional Haze 5-Year Periodic Report SIP Revision, September 2014
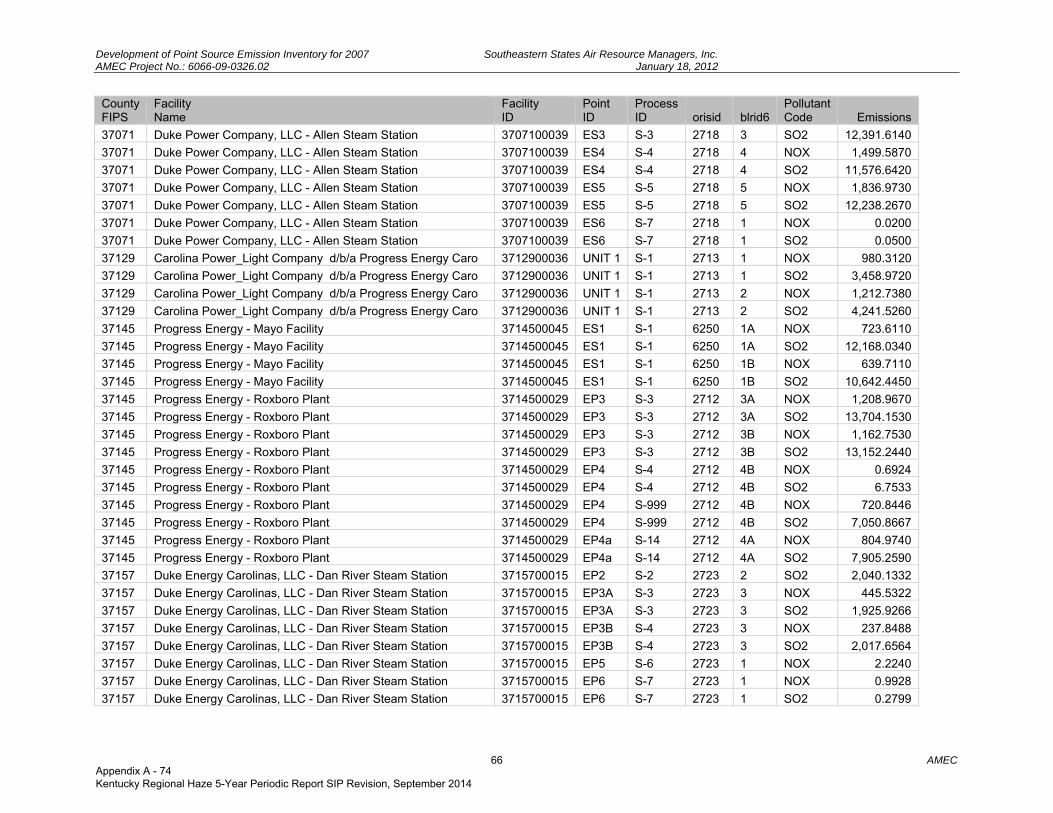
Development of Point Source Emission Inventory for 2007 Southeastern States Air Resource Managers, Inc. AMEC Project No.: 6066-09-0326.02 January 18, 2012
66 AMEC
County FIPS
Facility Name
Facility ID
Point ID
Process ID orisid blrid6
Pollutant Code Emissions
37071 Duke Power Company, LLC - Allen Steam Station 3707100039 ES3 S-3 2718 3 SO2 12,391.6140
37071 Duke Power Company, LLC - Allen Steam Station 3707100039 ES4 S-4 2718 4 NOX 1,499.5870
37071 Duke Power Company, LLC - Allen Steam Station 3707100039 ES4 S-4 2718 4 SO2 11,576.6420
37071 Duke Power Company, LLC - Allen Steam Station 3707100039 ES5 S-5 2718 5 NOX 1,836.9730
37071 Duke Power Company, LLC - Allen Steam Station 3707100039 ES5 S-5 2718 5 SO2 12,238.2670
37071 Duke Power Company, LLC - Allen Steam Station 3707100039 ES6 S-7 2718 1 NOX 0.0200
37071 Duke Power Company, LLC - Allen Steam Station 3707100039 ES6 S-7 2718 1 SO2 0.0500
37129 Carolina Power_Light Company d/b/a Progress Energy Caro 3712900036 UNIT 1 S-1 2713 1 NOX 980.3120
37129 Carolina Power_Light Company d/b/a Progress Energy Caro 3712900036 UNIT 1 S-1 2713 1 SO2 3,458.9720
37129 Carolina Power_Light Company d/b/a Progress Energy Caro 3712900036 UNIT 1 S-1 2713 2 NOX 1,212.7380
37129 Carolina Power_Light Company d/b/a Progress Energy Caro 3712900036 UNIT 1 S-1 2713 2 SO2 4,241.5260
37145 Progress Energy - Mayo Facility 3714500045 ES1 S-1 6250 1A NOX 723.6110
37145 Progress Energy - Mayo Facility 3714500045 ES1 S-1 6250 1A SO2 12,168.0340
37145 Progress Energy - Mayo Facility 3714500045 ES1 S-1 6250 1B NOX 639.7110
37145 Progress Energy - Mayo Facility 3714500045 ES1 S-1 6250 1B SO2 10,642.4450
37145 Progress Energy - Roxboro Plant 3714500029 EP3 S-3 2712 3A NOX 1,208.9670
37145 Progress Energy - Roxboro Plant 3714500029 EP3 S-3 2712 3A SO2 13,704.1530
37145 Progress Energy - Roxboro Plant 3714500029 EP3 S-3 2712 3B NOX 1,162.7530
37145 Progress Energy - Roxboro Plant 3714500029 EP3 S-3 2712 3B SO2 13,152.2440
37145 Progress Energy - Roxboro Plant 3714500029 EP4 S-4 2712 4B NOX 0.6924
37145 Progress Energy - Roxboro Plant 3714500029 EP4 S-4 2712 4B SO2 6.7533
37145 Progress Energy - Roxboro Plant 3714500029 EP4 S-999 2712 4B NOX 720.8446
37145 Progress Energy - Roxboro Plant 3714500029 EP4 S-999 2712 4B SO2 7,050.8667
37145 Progress Energy - Roxboro Plant 3714500029 EP4a S-14 2712 4A NOX 804.9740
37145 Progress Energy - Roxboro Plant 3714500029 EP4a S-14 2712 4A SO2 7,905.2590
37157 Duke Energy Carolinas, LLC - Dan River Steam Station 3715700015 EP2 S-2 2723 2 SO2 2,040.1332
37157 Duke Energy Carolinas, LLC - Dan River Steam Station 3715700015 EP3A S-3 2723 3 NOX 445.5322
37157 Duke Energy Carolinas, LLC - Dan River Steam Station 3715700015 EP3A S-3 2723 3 SO2 1,925.9266
37157 Duke Energy Carolinas, LLC - Dan River Steam Station 3715700015 EP3B S-4 2723 3 NOX 237.8488
37157 Duke Energy Carolinas, LLC - Dan River Steam Station 3715700015 EP3B S-4 2723 3 SO2 2,017.6564
37157 Duke Energy Carolinas, LLC - Dan River Steam Station 3715700015 EP5 S-6 2723 1 NOX 2.2240
37157 Duke Energy Carolinas, LLC - Dan River Steam Station 3715700015 EP6 S-7 2723 1 NOX 0.9928
37157 Duke Energy Carolinas, LLC - Dan River Steam Station 3715700015 EP6 S-7 2723 1 SO2 0.2799
Appendix A - 74 Kentucky Regional Haze 5-Year Periodic Report SIP Revision, September 2014
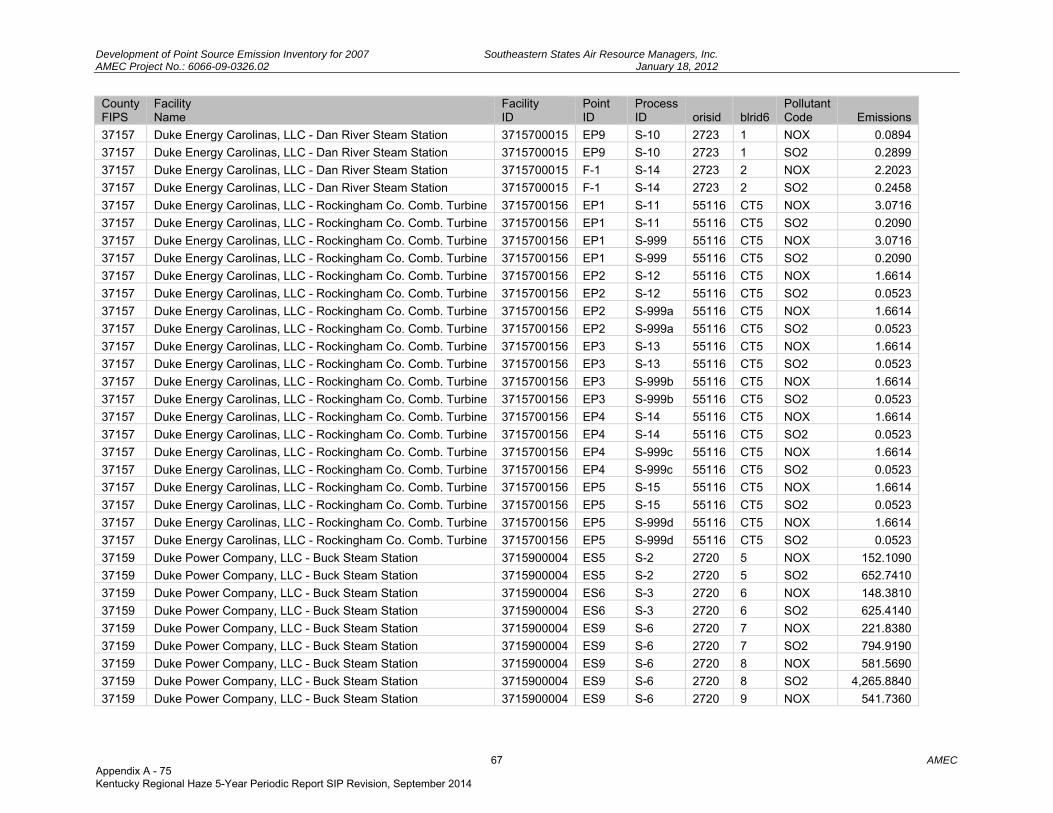
Development of Point Source Emission Inventory for 2007 Southeastern States Air Resource Managers, Inc. AMEC Project No.: 6066-09-0326.02 January 18, 2012
67 AMEC
County FIPS
Facility Name
Facility ID
Point ID
Process ID orisid blrid6
Pollutant Code Emissions
37157 Duke Energy Carolinas, LLC - Dan River Steam Station 3715700015 EP9 S-10 2723 1 NOX 0.0894
37157 Duke Energy Carolinas, LLC - Dan River Steam Station 3715700015 EP9 S-10 2723 1 SO2 0.2899
37157 Duke Energy Carolinas, LLC - Dan River Steam Station 3715700015 F-1 S-14 2723 2 NOX 2.2023
37157 Duke Energy Carolinas, LLC - Dan River Steam Station 3715700015 F-1 S-14 2723 2 SO2 0.2458
37157 Duke Energy Carolinas, LLC - Rockingham Co. Comb. Turbine 3715700156 EP1 S-11 55116 CT5 NOX 3.0716
37157 Duke Energy Carolinas, LLC - Rockingham Co. Comb. Turbine 3715700156 EP1 S-11 55116 CT5 SO2 0.2090
37157 Duke Energy Carolinas, LLC - Rockingham Co. Comb. Turbine 3715700156 EP1 S-999 55116 CT5 NOX 3.0716
37157 Duke Energy Carolinas, LLC - Rockingham Co. Comb. Turbine 3715700156 EP1 S-999 55116 CT5 SO2 0.2090
37157 Duke Energy Carolinas, LLC - Rockingham Co. Comb. Turbine 3715700156 EP2 S-12 55116 CT5 NOX 1.6614
37157 Duke Energy Carolinas, LLC - Rockingham Co. Comb. Turbine 3715700156 EP2 S-12 55116 CT5 SO2 0.0523
37157 Duke Energy Carolinas, LLC - Rockingham Co. Comb. Turbine 3715700156 EP2 S-999a 55116 CT5 NOX 1.6614
37157 Duke Energy Carolinas, LLC - Rockingham Co. Comb. Turbine 3715700156 EP2 S-999a 55116 CT5 SO2 0.0523
37157 Duke Energy Carolinas, LLC - Rockingham Co. Comb. Turbine 3715700156 EP3 S-13 55116 CT5 NOX 1.6614
37157 Duke Energy Carolinas, LLC - Rockingham Co. Comb. Turbine 3715700156 EP3 S-13 55116 CT5 SO2 0.0523
37157 Duke Energy Carolinas, LLC - Rockingham Co. Comb. Turbine 3715700156 EP3 S-999b 55116 CT5 NOX 1.6614
37157 Duke Energy Carolinas, LLC - Rockingham Co. Comb. Turbine 3715700156 EP3 S-999b 55116 CT5 SO2 0.0523
37157 Duke Energy Carolinas, LLC - Rockingham Co. Comb. Turbine 3715700156 EP4 S-14 55116 CT5 NOX 1.6614
37157 Duke Energy Carolinas, LLC - Rockingham Co. Comb. Turbine 3715700156 EP4 S-14 55116 CT5 SO2 0.0523
37157 Duke Energy Carolinas, LLC - Rockingham Co. Comb. Turbine 3715700156 EP4 S-999c 55116 CT5 NOX 1.6614
37157 Duke Energy Carolinas, LLC - Rockingham Co. Comb. Turbine 3715700156 EP4 S-999c 55116 CT5 SO2 0.0523
37157 Duke Energy Carolinas, LLC - Rockingham Co. Comb. Turbine 3715700156 EP5 S-15 55116 CT5 NOX 1.6614
37157 Duke Energy Carolinas, LLC - Rockingham Co. Comb. Turbine 3715700156 EP5 S-15 55116 CT5 SO2 0.0523
37157 Duke Energy Carolinas, LLC - Rockingham Co. Comb. Turbine 3715700156 EP5 S-999d 55116 CT5 NOX 1.6614
37157 Duke Energy Carolinas, LLC - Rockingham Co. Comb. Turbine 3715700156 EP5 S-999d 55116 CT5 SO2 0.0523
37159 Duke Power Company, LLC - Buck Steam Station 3715900004 ES5 S-2 2720 5 NOX 152.1090
37159 Duke Power Company, LLC - Buck Steam Station 3715900004 ES5 S-2 2720 5 SO2 652.7410
37159 Duke Power Company, LLC - Buck Steam Station 3715900004 ES6 S-3 2720 6 NOX 148.3810
37159 Duke Power Company, LLC - Buck Steam Station 3715900004 ES6 S-3 2720 6 SO2 625.4140
37159 Duke Power Company, LLC - Buck Steam Station 3715900004 ES9 S-6 2720 7 NOX 221.8380
37159 Duke Power Company, LLC - Buck Steam Station 3715900004 ES9 S-6 2720 7 SO2 794.9190
37159 Duke Power Company, LLC - Buck Steam Station 3715900004 ES9 S-6 2720 8 NOX 581.5690
37159 Duke Power Company, LLC - Buck Steam Station 3715900004 ES9 S-6 2720 8 SO2 4,265.8840
37159 Duke Power Company, LLC - Buck Steam Station 3715900004 ES9 S-6 2720 9 NOX 541.7360
Appendix A - 75 Kentucky Regional Haze 5-Year Periodic Report SIP Revision, September 2014

Development of Point Source Emission Inventory for 2007 Southeastern States Air Resource Managers, Inc. AMEC Project No.: 6066-09-0326.02 January 18, 2012
68 AMEC
County FIPS
Facility Name
Facility ID
Point ID
Process ID orisid blrid6
Pollutant Code Emissions
37159 Duke Power Company, LLC - Buck Steam Station 3715900004 ES9 S-6 2720 9 SO2 3,921.5680
37159 Duke Power Company, LLC - Buck Steam Station 3715900004 ES9C S-9 2720 5 NOX 0.5180
37161 Duke Energy Carolinas, LLC - Cliffside Steam Station 3716100028 1 S-1 2721 1 NOX 229.6902
37161 Duke Energy Carolinas, LLC - Cliffside Steam Station 3716100028 1 S-1 2721 1 SO2 715.4729
37161 Duke Energy Carolinas, LLC - Cliffside Steam Station 3716100028 2 S-2 2721 2 NOX 279.2990
37161 Duke Energy Carolinas, LLC - Cliffside Steam Station 3716100028 2 S-2 2721 2 SO2 996.3330
37161 Duke Energy Carolinas, LLC - Cliffside Steam Station 3716100028 3 S-3 2721 3 NOX 478.6000
37161 Duke Energy Carolinas, LLC - Cliffside Steam Station 3716100028 3 S-3 2721 3 SO2 1,586.2770
37161 Duke Energy Carolinas, LLC - Cliffside Steam Station 3716100028 4 S-4 2721 4 NOX 512.3110
37161 Duke Energy Carolinas, LLC - Cliffside Steam Station 3716100028 4 S-4 2721 4 SO2 1,632.6250
37161 Duke Energy Carolinas, LLC - Cliffside Steam Station 3716100028 5 S-5 2721 1 NOX 3.5932
37161 Duke Energy Carolinas, LLC - Cliffside Steam Station 3716100028 5 S-5 2721 1 SO2 11.8032
37161 Duke Energy Carolinas, LLC - Cliffside Steam Station 3716100028 5 S-5 2721 5 NOX 995.8110
37161 Duke Energy Carolinas, LLC - Cliffside Steam Station 3716100028 5 S-5 2721 5 SO2 22,623.2250
37161 Duke Energy Carolinas, LLC - Cliffside Steam Station 3716100028 Misc. S-10 2721 2 NOX 0.0600
37161 Duke Energy Carolinas, LLC - Cliffside Steam Station 3716100028 Misc. S-10 2721 2 SO2 0.0100
37169 Duke Energy Carolinas, LLC - Belews Creek Steam Station 3716900004 EP1 S-1 8042 1 NOX 1,300.6860
37169 Duke Energy Carolinas, LLC - Belews Creek Steam Station 3716900004 EP1 S-1 8042 1 SO2 38,355.6980
37169 Duke Energy Carolinas, LLC - Belews Creek Steam Station 3716900004 EP2 S-2 8042 2 NOX 2,119.9732
37169 Duke Energy Carolinas, LLC - Belews Creek Steam Station 3716900004 EP2 S-2 8042 2 SO2 48,031.7700
37169 Duke Energy Carolinas, LLC - Belews Creek Steam Station 3716900004 F-1 S-12 8042 2 NOX 0.1598
37169 Duke Energy Carolinas, LLC - Belews Creek Steam Station 3716900004 F-1 S-12 8042 2 SO2 0.0300 1.9.8.9 North Carolina – Buncombe County No affected facilities in the county. 1.9.8.10 North Carolina – Forsyth County No affected facilities in the county. 1.9.8.11 North Carolina – Mecklenburg County No affected facilities in the county.
Appendix A - 76 Kentucky Regional Haze 5-Year Periodic Report SIP Revision, September 2014

Development of Point Source Emission Inventory for 2007 Southeastern States Air Resource Managers, Inc. AMEC Project No.: 6066-09-0326.02 January 18, 2012
69 AMEC
1.9.8.12 South Carolina
County FIPS
Facility Name
Facility ID
Point ID
Process ID orisid blrid6
Pollutant Code Emissions
45021 BROAD RIVER ENERGY LLC 0600-0076 1 1 55166 CT-1 NOX 37.4070
45021 BROAD RIVER ENERGY LLC 0600-0076 1 1 55166 CT-1 SO2 0.6130
45021 BROAD RIVER ENERGY LLC 0600-0076 2 3 55166 CT-2 NOX 27.9370
45021 BROAD RIVER ENERGY LLC 0600-0076 2 3 55166 CT-2 SO2 0.4210
45021 BROAD RIVER ENERGY LLC 0600-0076 3 5 55166 CT-3 NOX 43.5220
45021 BROAD RIVER ENERGY LLC 0600-0076 3 5 55166 CT-3 SO2 0.6590
45021 CHEROKEE COGENERATION 0600-0060 1 1 55043 CCCP1 NOX 26.8170
45021 CHEROKEE COGENERATION 0600-0060 1 1 55043 CCCP1 SO2 0.5540
45053 SCE&G JASPER 1360-0026 1 1 55927 CT01 NOX 30.4640
45053 SCE&G JASPER 1360-0026 1 1 55927 CT01 SO2 1.5710
45053 SCE&G JASPER 1360-0026 2 1 55927 CT02 NOX 37.6330
45053 SCE&G JASPER 1360-0026 2 1 55927 CT02 SO2 2.2380
45053 SCE&G JASPER 1360-0026 3 1 55927 CT03 NOX 33.1860
45053 SCE&G JASPER 1360-0026 3 1 55927 CT03 SO2 1.6040 1.9.8.13 Tennessee No affected facilities. 1.9.8.14 Tennessee – Davidson County (Nashville) No affected facilities in the county. 1.9.8.15 Tennessee – Hamilton County (Chattanooga) No affected facilities in the county. 1.9.8.16 Tennessee – Knox County (Knoxville) No affected facilities in the county. 1.9.8.17 Tennessee – Shelby County (Memphis) No issues identified. 1.9.8.18 Virginia No issues identified. 1.9.8.19 West Virginia No changes requested by State as a result of the CEMS review. West Virginia did submit revised records for 70 emission release points for PM10-PRI and PM25-PRI. Those records were inserted into the database at the time that the other CEM related changes were made.
Appendix A - 77 Kentucky Regional Haze 5-Year Periodic Report SIP Revision, September 2014
Development of Point Source Emission Inventory for 2007 Southeastern States Air Resource Managers, Inc. AMEC Project No.: 6066-09-0326.02 January 18, 2012
70 AMEC
1.9.8.20 Latitude/Longitude Changes Appendix A lists the State/County FIPS code, the State Facility ID, the Name of the Facility, the Emission Release point ID and the new Latitude and Longitude for those records that were replaced based on the quality assurance of latitude and longitude values performed by GA EPD staff as part of the Version 1.10a update.
1.10 2007 POINT SOURCE EMISSION SUMMARY
This section presents State-level summaries of the annual point source emissions by pollutant in the 2007 SEMAP version 1.10a inventory and compares the emissions to the 2002 VISTAS Best and Final inventory. For most States and pollutants, point source emissions have decreased from 2002 to 2007. Exhibit 7 shows that CO emissions in the SEMAP region have decreased by about 30 percent between 2002 and 2007. Exhibit 8 shows that most of the point source CO emissions (about 81 percent) come from nonEGUs that are not required to report emissions to CAMD. Exhibit 9 shows that NH3 emissions in the SEMAP region have remained about the same in 2002 and 2007, although NH3 emissions increased substantially in some States while decreasing in others. Exhibit 10 shows that most of the point source NH3 emissions (about 90 percent) come from nonEGUs that are not required to report emissions to CAMD. Exhibit 11 shows that NOx emissions have decreased by about 26 percent between 2002 and 2007. All States showed a decrease in NOx emissions from point sources. Exhibit 12 shows that about 69 percent of the point source NOx emissions come from EGUs that are required to report emissions to CAMD. Another 28 percent of the NOx emissions result from nonEGUs that are not required to report emissions to CAMD. Exhibit 13 shows that PM10-PRI emissions in the SEMAP region have decreased by about 7 percent between 2002 and 2007, although PM10-PRI emissions increased substantially in some States while decreasing in others. Exhibit 14 shows that about 46 percent of the point source PM10-PRI emissions come from EGUs that are required to report emissions to CAMD. Another 53 percent of the PM10-PRI emissions result from nonEGUs that are not required to report emissions to CAMD. For PM, the emissions presented in Exhibit 13 show the values initially used for WV based on the data submitted as described in section 1.9.8.19. After modeling had already been conducted, WV indicated that they believed that the values used in version 1.9 of the inventory were actually correct and requested that the emissions be changed. Since modeling had already been performed, SEMAP decided to replace the data in the inventory files but did not perform new modeling runs. Appendix B shows the differences between the version 1.9 and version 1.10a inventories for the records that WV initially asked to be revised. Exhibit 15 shows that PM25-PRI emissions in the SEMAP region have decreased by about 3 percent between 2002 and 2007, although PM25-PRI emissions increased substantially in some States while decreasing in others. Exhibit 16 shows that about 45 percent of the point source PM25-PRI emissions come from EGUs that are required to report emissions to CAMD. Another 54 percent of the PM25-PRI emissions result from nonEGUs that are not required to report emissions to CAMD. Exhibit 17 shows that SO
2 emissions in the SEMAP region have decreased by about 15 percent
between 2002 and 2007. All States except Georgia showed a decrease in SO 2 emissions. Exhibit
18 shows that most of the point source SO 2 emissions (about 87 percent) come from EGUs that are
required to report emissions to CAMD. Another 11 percent of the SO 2 emissions result from
nonEGUs that are not required to report emissions to CAMD.
Appendix A - 78 Kentucky Regional Haze 5-Year Periodic Report SIP Revision, September 2014
Development of Point Source Emission Inventory for 2007 Southeastern States Air Resource Managers, Inc. AMEC Project No.: 6066-09-0326.02 January 18, 2012
71 AMEC
Exhibit 19 shows that VOC emissions in the SEMAP region have decreased by about 21 percent between 2002 and 2007. Exhibit 20 shows that nearly all of the point source VOC emissions (about 97 percent) result from nonEGUs that are not required to report emissions to CAMD. The reasons for the differences between 2002 and 2007 are many and vary by State, facility, and pollutant. Examples include: 1) new controls added between 2002 and 2007; 2) change in emission factors or source test data; 3) inclusion of PM condensables that were not included in 2002; 4) more {or less} facilities in 2002 inventory than in 2007 inventory; 5) new sources that came online between 2002 and 2007; 6) different fuels used in 2007 than in 2002; 7) industry specific economic growth or contraction between 2002 and 2007; 8) facility or emission unit closures; and 9) errors in 2002 inventory.
Appendix A - 79 Kentucky Regional Haze 5-Year Periodic Report SIP Revision, September 2014
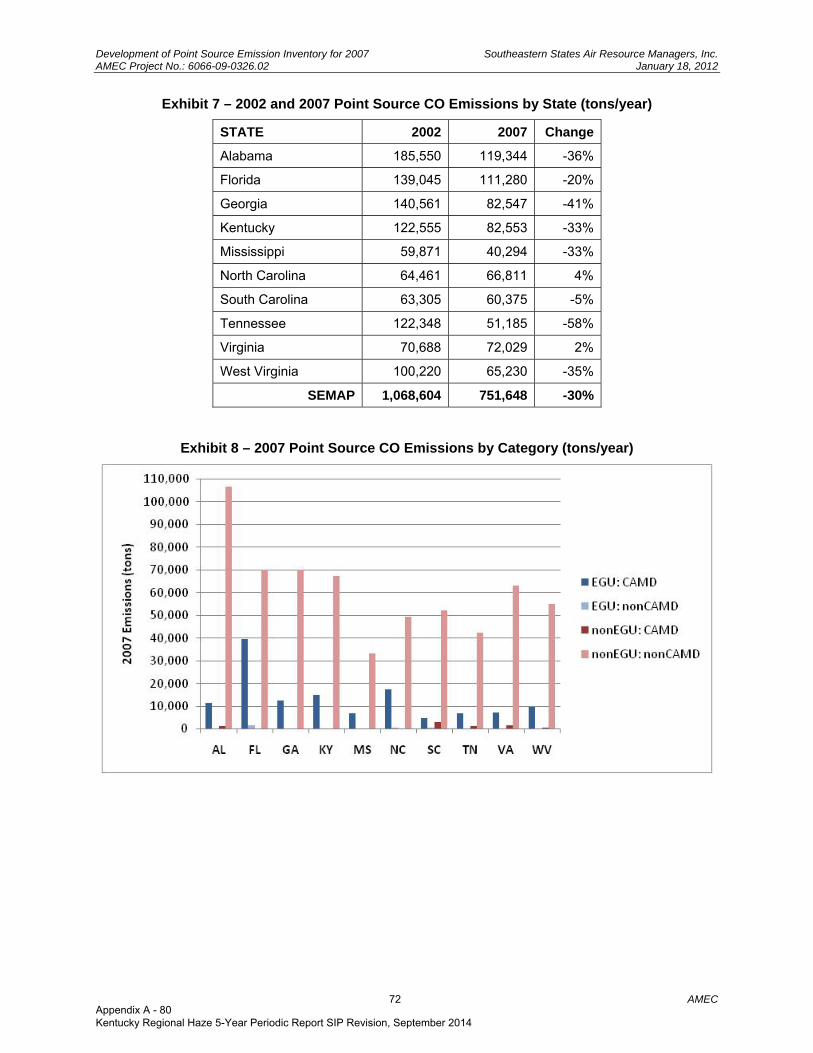
Development of Point Source Emission Inventory for 2007 Southeastern States Air Resource Managers, Inc. AMEC Project No.: 6066-09-0326.02 January 18, 2012
72 AMEC
Exhibit 7 – 2002 and 2007 Point Source CO Emissions by State (tons/year)
STATE 2002 2007 Change
Alabama 185,550 119,344 -36%
Florida 139,045 111,280 -20%
Georgia 140,561 82,547 -41%
Kentucky 122,555 82,553 -33%
Mississippi 59,871 40,294 -33%
North Carolina 64,461 66,811 4%
South Carolina 63,305 60,375 -5%
Tennessee 122,348 51,185 -58%
Virginia 70,688 72,029 2%
West Virginia 100,220 65,230 -35%
SEMAP 1,068,604 751,648 -30%
Exhibit 8 – 2007 Point Source CO Emissions by Category (tons/year)
Appendix A - 80 Kentucky Regional Haze 5-Year Periodic Report SIP Revision, September 2014
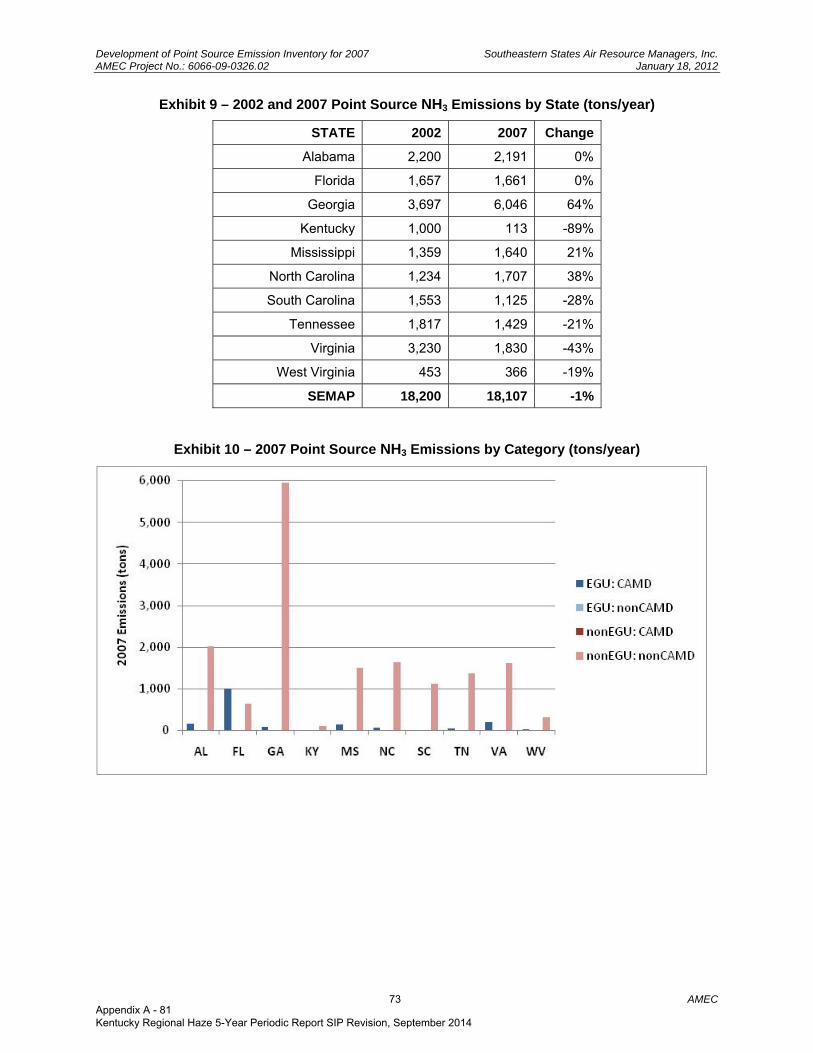
Development of Point Source Emission Inventory for 2007 Southeastern States Air Resource Managers, Inc. AMEC Project No.: 6066-09-0326.02 January 18, 2012
73 AMEC
Exhibit 9 – 2002 and 2007 Point Source NH3 Emissions by State (tons/year)
STATE 2002 2007 Change
Alabama 2,200 2,191 0%
Florida 1,657 1,661 0%
Georgia 3,697 6,046 64%
Kentucky 1,000 113 -89%
Mississippi 1,359 1,640 21%
North Carolina 1,234 1,707 38%
South Carolina 1,553 1,125 -28%
Tennessee 1,817 1,429 -21%
Virginia 3,230 1,830 -43%
West Virginia 453 366 -19%
SEMAP 18,200 18,107 -1%
Exhibit 10 – 2007 Point Source NH3 Emissions by Category (tons/year)
Appendix A - 81 Kentucky Regional Haze 5-Year Periodic Report SIP Revision, September 2014

Development of Point Source Emission Inventory for 2007 Southeastern States Air Resource Managers, Inc. AMEC Project No.: 6066-09-0326.02 January 18, 2012
74 AMEC
Exhibit 11 – 2002 and 2007 Point Source NOx Emissions by State (tons/year)
STATE 2002 2007 Change
Alabama 244,348 197,963 -19%
Florida 302,834 237,473 -22%
Georgia 196,767 154,041 -22%
Kentucky 237,209 210,213 -11%
Mississippi 104,661 98,183 -6%
North Carolina 196,782 100,379 -49%
South Carolina 130,394 81,220 -38%
Tennessee 221,652 144,763 -35%
Virginia 147,300 112,938 -23%
West Virginia 277,589 188,629 -32%
SEMAP 2,059,536 1,525,801 -26%
Exhibit 12 – 2007 Point Source NOx Emissions by Category (tons/year)
Appendix A - 82 Kentucky Regional Haze 5-Year Periodic Report SIP Revision, September 2014
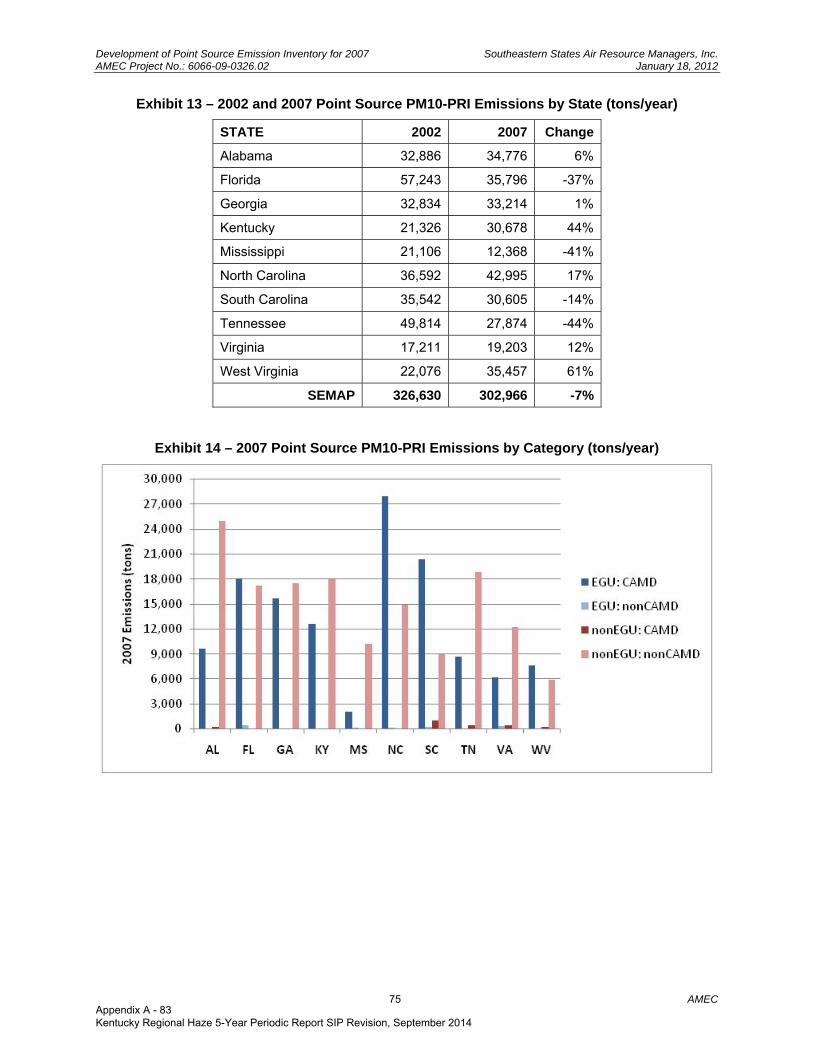
Development of Point Source Emission Inventory for 2007 Southeastern States Air Resource Managers, Inc. AMEC Project No.: 6066-09-0326.02 January 18, 2012
75 AMEC
Exhibit 13 – 2002 and 2007 Point Source PM10-PRI Emissions by State (tons/year)
STATE 2002 2007 Change
Alabama 32,886 34,776 6%
Florida 57,243 35,796 -37%
Georgia 32,834 33,214 1%
Kentucky 21,326 30,678 44%
Mississippi 21,106 12,368 -41%
North Carolina 36,592 42,995 17%
South Carolina 35,542 30,605 -14%
Tennessee 49,814 27,874 -44%
Virginia 17,211 19,203 12%
West Virginia 22,076 35,457 61%
SEMAP 326,630 302,966 -7%
Exhibit 14 – 2007 Point Source PM10-PRI Emissions by Category (tons/year)
Appendix A - 83 Kentucky Regional Haze 5-Year Periodic Report SIP Revision, September 2014
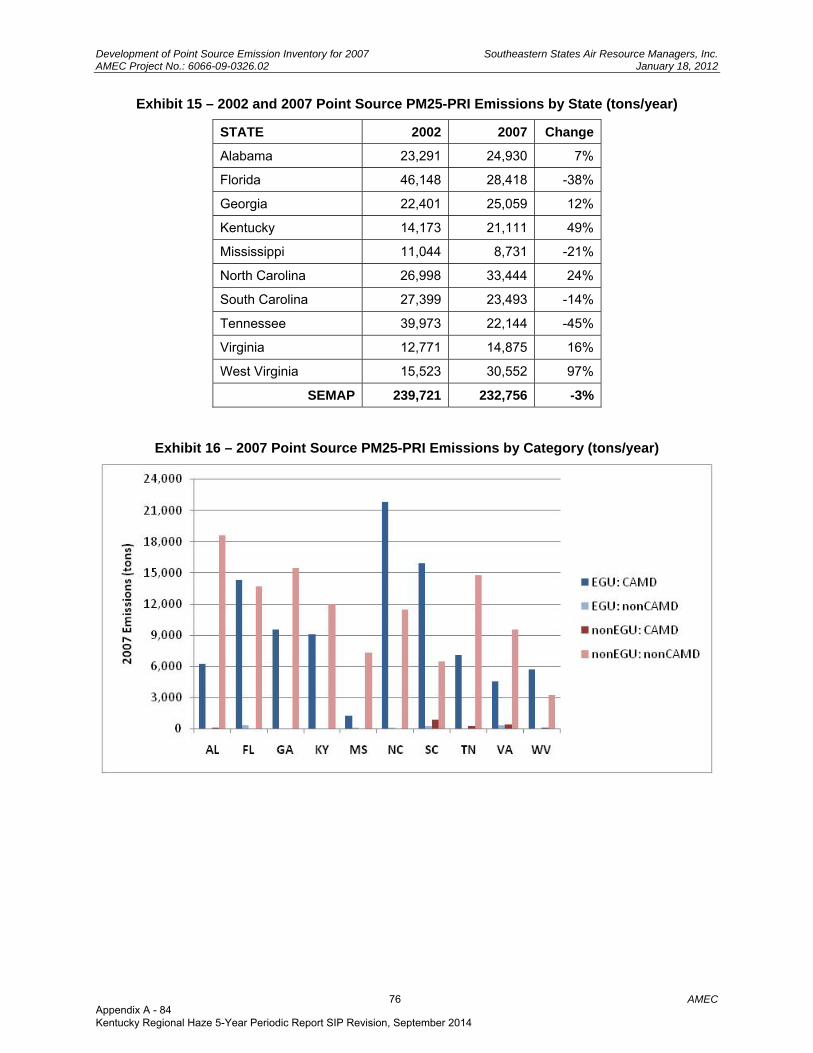
Development of Point Source Emission Inventory for 2007 Southeastern States Air Resource Managers, Inc. AMEC Project No.: 6066-09-0326.02 January 18, 2012
76 AMEC
Exhibit 15 – 2002 and 2007 Point Source PM25-PRI Emissions by State (tons/year)
STATE 2002 2007 Change
Alabama 23,291 24,930 7%
Florida 46,148 28,418 -38%
Georgia 22,401 25,059 12%
Kentucky 14,173 21,111 49%
Mississippi 11,044 8,731 -21%
North Carolina 26,998 33,444 24%
South Carolina 27,399 23,493 -14%
Tennessee 39,973 22,144 -45%
Virginia 12,771 14,875 16%
West Virginia 15,523 30,552 97%
SEMAP 239,721 232,756 -3%
Exhibit 16 – 2007 Point Source PM25-PRI Emissions by Category (tons/year)
Appendix A - 84 Kentucky Regional Haze 5-Year Periodic Report SIP Revision, September 2014
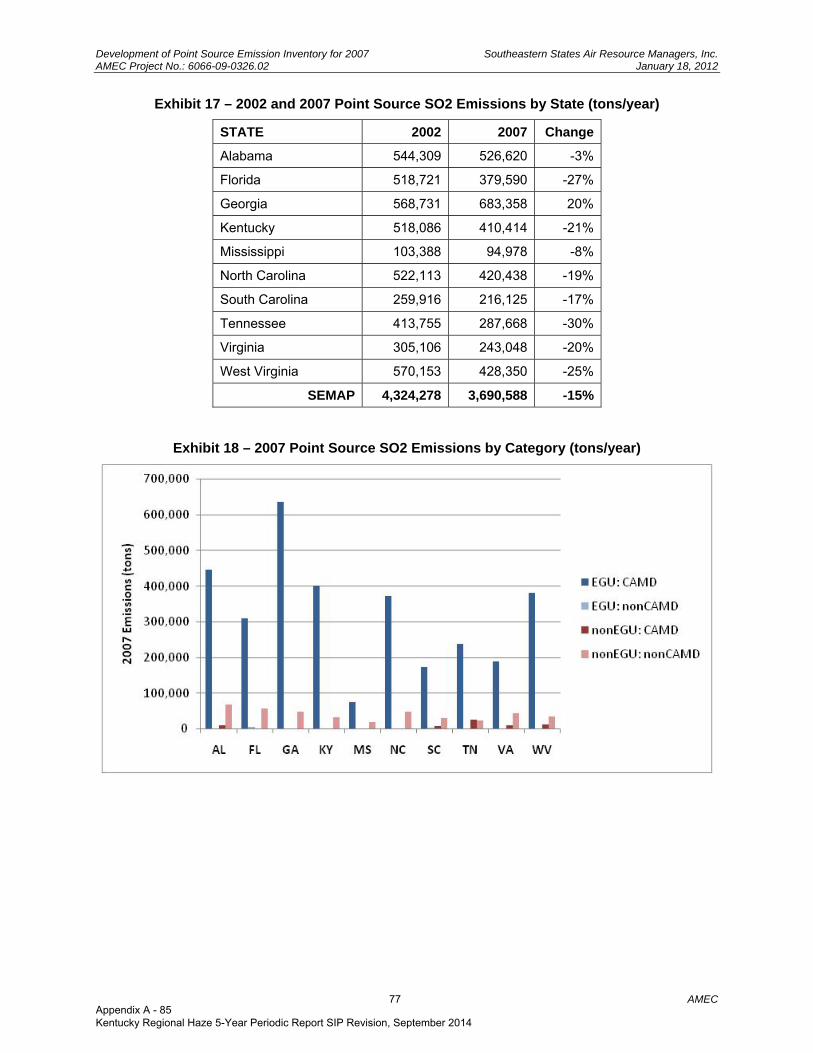
Development of Point Source Emission Inventory for 2007 Southeastern States Air Resource Managers, Inc. AMEC Project No.: 6066-09-0326.02 January 18, 2012
77 AMEC
Exhibit 17 – 2002 and 2007 Point Source SO2 Emissions by State (tons/year)
STATE 2002 2007 Change
Alabama 544,309 526,620 -3%
Florida 518,721 379,590 -27%
Georgia 568,731 683,358 20%
Kentucky 518,086 410,414 -21%
Mississippi 103,388 94,978 -8%
North Carolina 522,113 420,438 -19%
South Carolina 259,916 216,125 -17%
Tennessee 413,755 287,668 -30%
Virginia 305,106 243,048 -20%
West Virginia 570,153 428,350 -25%
SEMAP 4,324,278 3,690,588 -15%
Exhibit 18 – 2007 Point Source SO2 Emissions by Category (tons/year)
Appendix A - 85 Kentucky Regional Haze 5-Year Periodic Report SIP Revision, September 2014
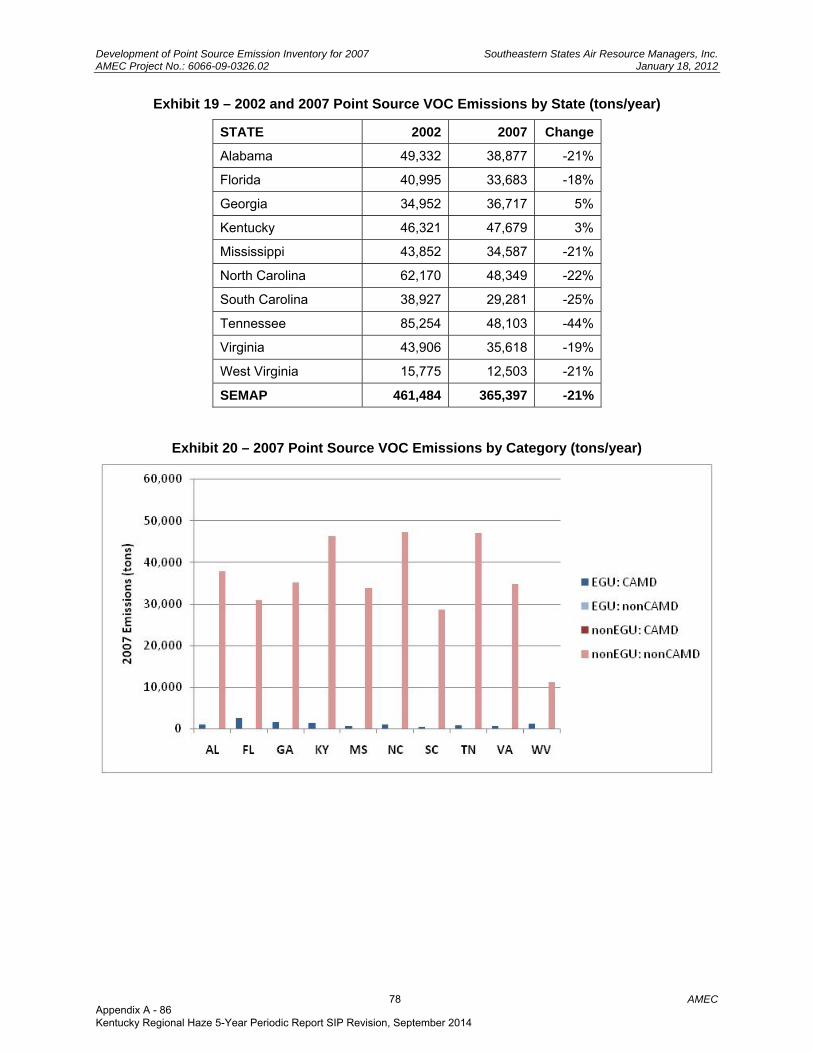
Development of Point Source Emission Inventory for 2007 Southeastern States Air Resource Managers, Inc. AMEC Project No.: 6066-09-0326.02 January 18, 2012
78 AMEC
Exhibit 19 – 2002 and 2007 Point Source VOC Emissions by State (tons/year)
STATE 2002 2007 Change
Alabama 49,332 38,877 -21%
Florida 40,995 33,683 -18%
Georgia 34,952 36,717 5%
Kentucky 46,321 47,679 3%
Mississippi 43,852 34,587 -21%
North Carolina 62,170 48,349 -22%
South Carolina 38,927 29,281 -25%
Tennessee 85,254 48,103 -44%
Virginia 43,906 35,618 -19%
West Virginia 15,775 12,503 -21%
SEMAP 461,484 365,397 -21%
Exhibit 20 – 2007 Point Source VOC Emissions by Category (tons/year)
Appendix A - 86 Kentucky Regional Haze 5-Year Periodic Report SIP Revision, September 2014
Development of Point Source Emission Inventory for 2007 Southeastern States Air Resource Managers, Inc. AMEC Project No.: 6066-09-0326.02 January 18, 2012
79 AMEC
1.11 DATA FILES
These files are accessible on the MACTEC ftp site in the following location:
Address: ftp.mactec.com Login ID: externalclient Password: sen382 Folder: /Outgoing/SEMAP Point V_1_10
NIF 3.0 ACCESS Database with the 8 NIF tables: SEMAP 2007 Point NIF V_1_10a.zip
Annual point source files in SMOKE ORL format are being prepared under SEMAP’s emission modeling contract.
Appendix A - 87 Kentucky Regional Haze 5-Year Periodic Report SIP Revision, September 2014
Development of Point Source Emission Inventory for 2007 Southeastern States Air Resource Managers, Inc. AMEC Project No.: 6066-09-0326.02 January 18, 2012
80 AMEC
1.12 REFERENCES
Dutch 2005. Steven Dutch, Natural and Applied Sciences, University of Wisconsin - Green Bay. Converting UTM to Latitude and Longitude (Or Vice Versa). Downloaded March 2009, last updated 19 April 2005. http://www.uwgb.edu/dutchs/UsefulData/UTMFormulas.HTM
EPA 2004. U.S. Environmental Protection Agency. Basic Format and Content Checker. Version Date 052604. Software no longer available on EPA web site.
EPA 2005. U.S. Environmental Protection Agency. Emissions Inventory Guidance for Implementation of Ozone and Particulate Matter National Ambient Air Quality Standards (NAAQS) and Regional Haze Regulations. EPA-454/R-05-001. August 2005. http://www.epa.gov/ttn/chief/eidocs/eiguid/eiguidfinal_nov2005.pdf
EPA 2006a. U.S. Environmental Protection Agency. NEI Quality Assurance and Data Augmentation for Point Sources. February, 2006. . ftp://ftp.epa.gov/EmisInventory/2002finalnei/documentation/point/augmentation_point/2002nei_qa_augmentation_report0206.pdf
EPA 2006b. U.S. Environmental Protection Agency. 2002 NEI Stack Parameter Default. ftp://ftp.epa.gov/EmisInventory/2002finalnei/documentation/augmentation_point_sector/ .
EPA 2007. U.S. Environmental Protection Agency. Guidance on the Use of Models and Other Analyses for Demonstrating Attainment of Air Quality Goals for Ozone, PM2.5, and Regional Haze. EPA -454/B-07-002. April 2007. http://www.epa.gov/ttn/scram/guidance/guide/final-03-pm-rh-guidance.pdf
EPA 2009a. U.S. Environmental Protection Agency. Clean Air Markets – Data and Maps Web Site; Unit Level Emissions Query for 2007. File downloaded on October 8, 2009. http://camddataandmaps.epa.gov/gdm/index.cfm?fuseaction=emissions.wizard
EPA 2009b. U.S. Environmental Protection Agency. Clean Air Markets – Emissions Data in SMOKE Format for 2007. File (hour_unit_2007.zip) downloaded on October 8, 2009. http://camddataandmaps.epa.gov/gdm/index.cfm?fuseaction=emissions.prepacksmoke
EPA 2009c. U.S. Environmental Protection Agency. 2005 National Emissions Inventory Data & Documentation. file name: 2005v4CAPHAP_orl_point.zip. June 2009. ftp://ftp.epa.gov/EmisInventory/2005v4/2005emis
MARAMA 2006. Mid-Atlantic Regional Air Management Association. Technical Support Documentation for 2002 MANE-VU SIP Modeling Inventories, Version 3. November 20, 2006. http://www.marama.org/technical-center/emissions-inventory/2002-inventory-and-projections/mane-vu-2002-emissions-inventory
SESARM 2009. Southeastern States Air Resource Managers, Inc. Point Source, On-Road, and Fire Base Year, Future Year, and Control Strategy Emissions Inventories – Quality Assurance Project Plan. August 2009.
VISTAS 2007. Visibility Improvement State and Tribal Association of the Southeast. Documentation of the Base G 2002 Base Year, 2009, and 2018 Emission Inventories for the Visibility Improvement State and Tribal Association of the Southeast. February 2007. http://www.vistas-sesarm.org/documents/VISTABF2003-20-2008.pdf
Appendix A - 88 Kentucky Regional Haze 5-Year Periodic Report SIP Revision, September 2014

Appendix A: Facilities with Updated Latitude and Longitude Information
Appendix A - 89 Kentucky Regional Haze 5-Year Periodic Report SIP Revision, September 2014
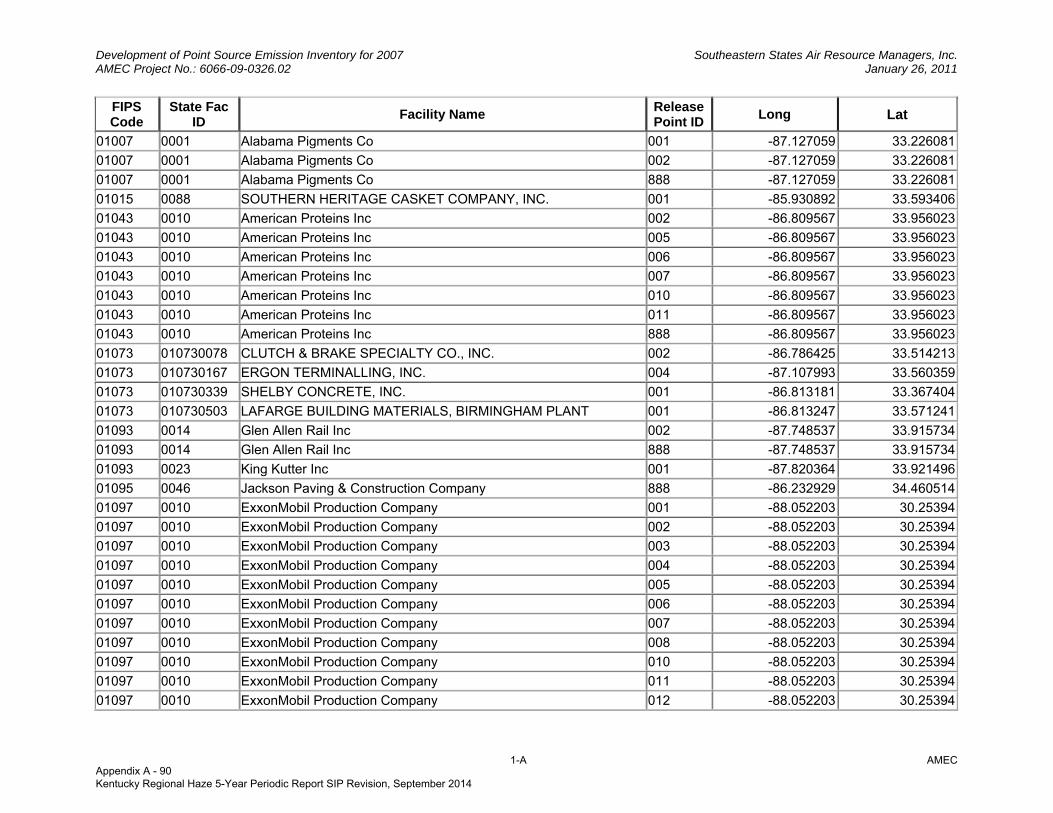
Development of Point Source Emission Inventory for 2007 Southeastern States Air Resource Managers, Inc. AMEC Project No.: 6066-09-0326.02 January 26, 2011
1-A AMEC
FIPS Code
State Fac ID Facility Name Release
Point IDLong Lat
01007 0001 Alabama Pigments Co 001 -87.127059 33.226081
01007 0001 Alabama Pigments Co 002 -87.127059 33.226081
01007 0001 Alabama Pigments Co 888 -87.127059 33.226081
01015 0088 SOUTHERN HERITAGE CASKET COMPANY, INC. 001 -85.930892 33.593406
01043 0010 American Proteins Inc 002 -86.809567 33.956023
01043 0010 American Proteins Inc 005 -86.809567 33.956023
01043 0010 American Proteins Inc 006 -86.809567 33.956023
01043 0010 American Proteins Inc 007 -86.809567 33.956023
01043 0010 American Proteins Inc 010 -86.809567 33.956023
01043 0010 American Proteins Inc 011 -86.809567 33.956023
01043 0010 American Proteins Inc 888 -86.809567 33.956023
01073 010730078 CLUTCH & BRAKE SPECIALTY CO., INC. 002 -86.786425 33.514213
01073 010730167 ERGON TERMINALLING, INC. 004 -87.107993 33.560359
01073 010730339 SHELBY CONCRETE, INC. 001 -86.813181 33.367404
01073 010730503 LAFARGE BUILDING MATERIALS, BIRMINGHAM PLANT 001 -86.813247 33.571241
01093 0014 Glen Allen Rail Inc 002 -87.748537 33.915734
01093 0014 Glen Allen Rail Inc 888 -87.748537 33.915734
01093 0023 King Kutter Inc 001 -87.820364 33.921496
01095 0046 Jackson Paving & Construction Company 888 -86.232929 34.460514
01097 0010 ExxonMobil Production Company 001 -88.052203 30.25394
01097 0010 ExxonMobil Production Company 002 -88.052203 30.25394
01097 0010 ExxonMobil Production Company 003 -88.052203 30.25394
01097 0010 ExxonMobil Production Company 004 -88.052203 30.25394
01097 0010 ExxonMobil Production Company 005 -88.052203 30.25394
01097 0010 ExxonMobil Production Company 006 -88.052203 30.25394
01097 0010 ExxonMobil Production Company 007 -88.052203 30.25394
01097 0010 ExxonMobil Production Company 008 -88.052203 30.25394
01097 0010 ExxonMobil Production Company 010 -88.052203 30.25394
01097 0010 ExxonMobil Production Company 011 -88.052203 30.25394
01097 0010 ExxonMobil Production Company 012 -88.052203 30.25394
Appendix A - 90 Kentucky Regional Haze 5-Year Periodic Report SIP Revision, September 2014
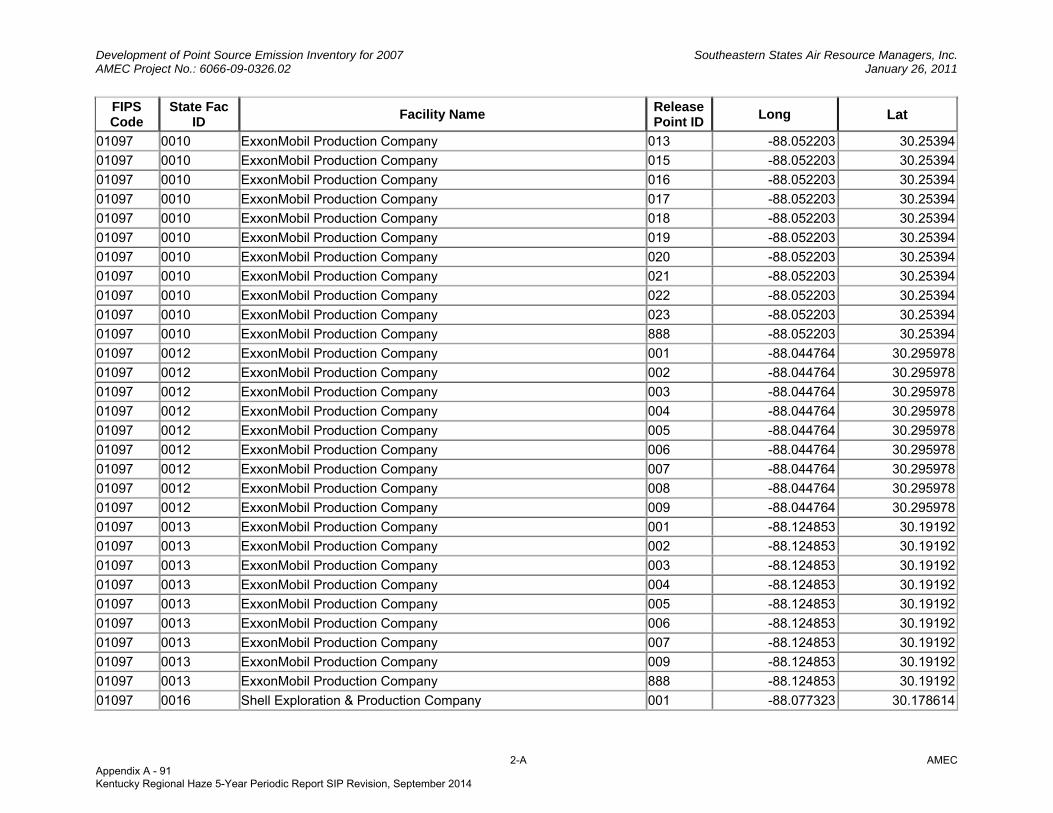
Development of Point Source Emission Inventory for 2007 Southeastern States Air Resource Managers, Inc. AMEC Project No.: 6066-09-0326.02 January 26, 2011
2-A AMEC
FIPS Code
State Fac ID Facility Name Release
Point IDLong Lat
01097 0010 ExxonMobil Production Company 013 -88.052203 30.25394
01097 0010 ExxonMobil Production Company 015 -88.052203 30.25394
01097 0010 ExxonMobil Production Company 016 -88.052203 30.25394
01097 0010 ExxonMobil Production Company 017 -88.052203 30.25394
01097 0010 ExxonMobil Production Company 018 -88.052203 30.25394
01097 0010 ExxonMobil Production Company 019 -88.052203 30.25394
01097 0010 ExxonMobil Production Company 020 -88.052203 30.25394
01097 0010 ExxonMobil Production Company 021 -88.052203 30.25394
01097 0010 ExxonMobil Production Company 022 -88.052203 30.25394
01097 0010 ExxonMobil Production Company 023 -88.052203 30.25394
01097 0010 ExxonMobil Production Company 888 -88.052203 30.25394
01097 0012 ExxonMobil Production Company 001 -88.044764 30.295978
01097 0012 ExxonMobil Production Company 002 -88.044764 30.295978
01097 0012 ExxonMobil Production Company 003 -88.044764 30.295978
01097 0012 ExxonMobil Production Company 004 -88.044764 30.295978
01097 0012 ExxonMobil Production Company 005 -88.044764 30.295978
01097 0012 ExxonMobil Production Company 006 -88.044764 30.295978
01097 0012 ExxonMobil Production Company 007 -88.044764 30.295978
01097 0012 ExxonMobil Production Company 008 -88.044764 30.295978
01097 0012 ExxonMobil Production Company 009 -88.044764 30.295978
01097 0013 ExxonMobil Production Company 001 -88.124853 30.19192
01097 0013 ExxonMobil Production Company 002 -88.124853 30.19192
01097 0013 ExxonMobil Production Company 003 -88.124853 30.19192
01097 0013 ExxonMobil Production Company 004 -88.124853 30.19192
01097 0013 ExxonMobil Production Company 005 -88.124853 30.19192
01097 0013 ExxonMobil Production Company 006 -88.124853 30.19192
01097 0013 ExxonMobil Production Company 007 -88.124853 30.19192
01097 0013 ExxonMobil Production Company 009 -88.124853 30.19192
01097 0013 ExxonMobil Production Company 888 -88.124853 30.19192
01097 0016 Shell Exploration & Production Company 001 -88.077323 30.178614
Appendix A - 91 Kentucky Regional Haze 5-Year Periodic Report SIP Revision, September 2014
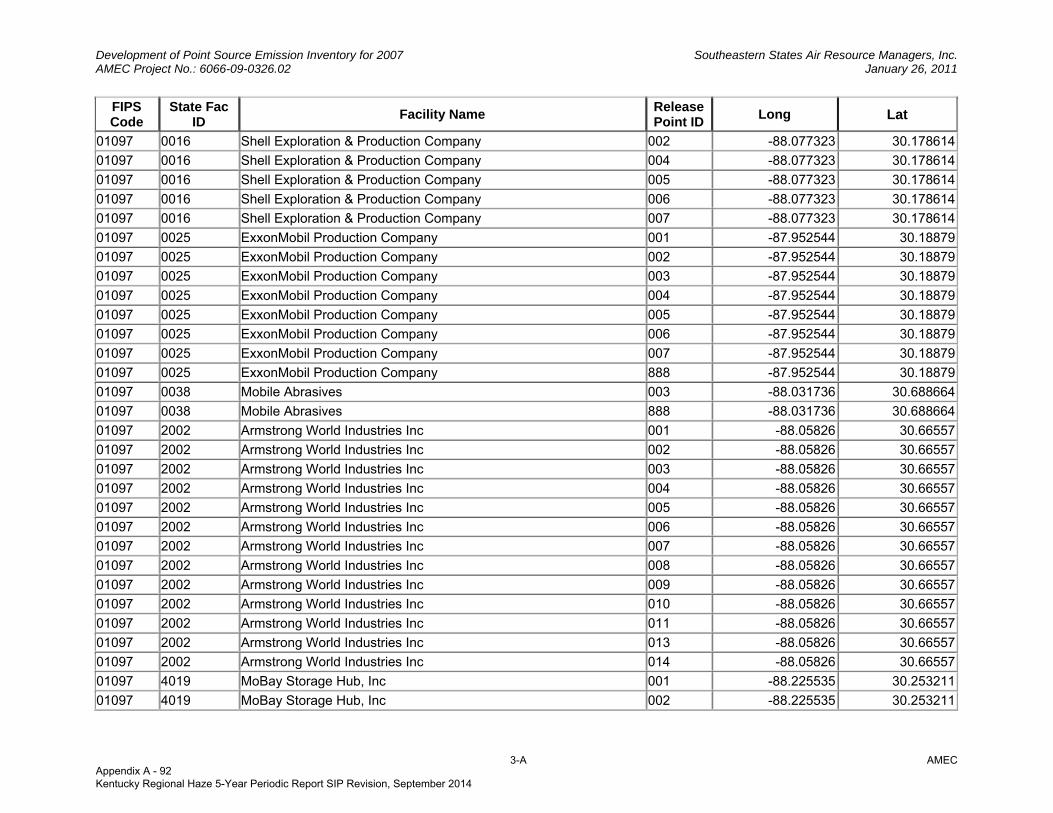
Development of Point Source Emission Inventory for 2007 Southeastern States Air Resource Managers, Inc. AMEC Project No.: 6066-09-0326.02 January 26, 2011
3-A AMEC
FIPS Code
State Fac ID Facility Name Release
Point IDLong Lat
01097 0016 Shell Exploration & Production Company 002 -88.077323 30.178614
01097 0016 Shell Exploration & Production Company 004 -88.077323 30.178614
01097 0016 Shell Exploration & Production Company 005 -88.077323 30.178614
01097 0016 Shell Exploration & Production Company 006 -88.077323 30.178614
01097 0016 Shell Exploration & Production Company 007 -88.077323 30.178614
01097 0025 ExxonMobil Production Company 001 -87.952544 30.18879
01097 0025 ExxonMobil Production Company 002 -87.952544 30.18879
01097 0025 ExxonMobil Production Company 003 -87.952544 30.18879
01097 0025 ExxonMobil Production Company 004 -87.952544 30.18879
01097 0025 ExxonMobil Production Company 005 -87.952544 30.18879
01097 0025 ExxonMobil Production Company 006 -87.952544 30.18879
01097 0025 ExxonMobil Production Company 007 -87.952544 30.18879
01097 0025 ExxonMobil Production Company 888 -87.952544 30.18879
01097 0038 Mobile Abrasives 003 -88.031736 30.688664
01097 0038 Mobile Abrasives 888 -88.031736 30.688664
01097 2002 Armstrong World Industries Inc 001 -88.05826 30.66557
01097 2002 Armstrong World Industries Inc 002 -88.05826 30.66557
01097 2002 Armstrong World Industries Inc 003 -88.05826 30.66557
01097 2002 Armstrong World Industries Inc 004 -88.05826 30.66557
01097 2002 Armstrong World Industries Inc 005 -88.05826 30.66557
01097 2002 Armstrong World Industries Inc 006 -88.05826 30.66557
01097 2002 Armstrong World Industries Inc 007 -88.05826 30.66557
01097 2002 Armstrong World Industries Inc 008 -88.05826 30.66557
01097 2002 Armstrong World Industries Inc 009 -88.05826 30.66557
01097 2002 Armstrong World Industries Inc 010 -88.05826 30.66557
01097 2002 Armstrong World Industries Inc 011 -88.05826 30.66557
01097 2002 Armstrong World Industries Inc 013 -88.05826 30.66557
01097 2002 Armstrong World Industries Inc 014 -88.05826 30.66557
01097 4019 MoBay Storage Hub, Inc 001 -88.225535 30.253211
01097 4019 MoBay Storage Hub, Inc 002 -88.225535 30.253211
Appendix A - 92 Kentucky Regional Haze 5-Year Periodic Report SIP Revision, September 2014
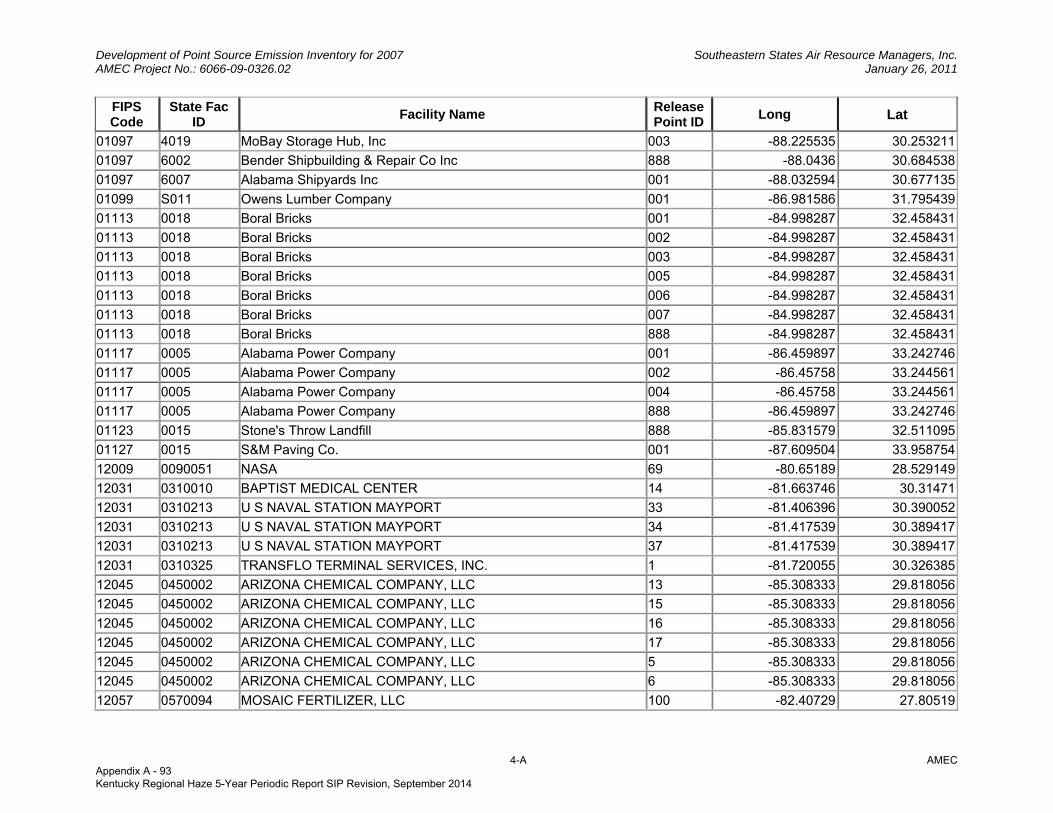
Development of Point Source Emission Inventory for 2007 Southeastern States Air Resource Managers, Inc. AMEC Project No.: 6066-09-0326.02 January 26, 2011
4-A AMEC
FIPS Code
State Fac ID Facility Name Release
Point IDLong Lat
01097 4019 MoBay Storage Hub, Inc 003 -88.225535 30.253211
01097 6002 Bender Shipbuilding & Repair Co Inc 888 -88.0436 30.684538
01097 6007 Alabama Shipyards Inc 001 -88.032594 30.677135
01099 S011 Owens Lumber Company 001 -86.981586 31.795439
01113 0018 Boral Bricks 001 -84.998287 32.458431
01113 0018 Boral Bricks 002 -84.998287 32.458431
01113 0018 Boral Bricks 003 -84.998287 32.458431
01113 0018 Boral Bricks 005 -84.998287 32.458431
01113 0018 Boral Bricks 006 -84.998287 32.458431
01113 0018 Boral Bricks 007 -84.998287 32.458431
01113 0018 Boral Bricks 888 -84.998287 32.458431
01117 0005 Alabama Power Company 001 -86.459897 33.242746
01117 0005 Alabama Power Company 002 -86.45758 33.244561
01117 0005 Alabama Power Company 004 -86.45758 33.244561
01117 0005 Alabama Power Company 888 -86.459897 33.242746
01123 0015 Stone's Throw Landfill 888 -85.831579 32.511095
01127 0015 S&M Paving Co. 001 -87.609504 33.958754
12009 0090051 NASA 69 -80.65189 28.529149
12031 0310010 BAPTIST MEDICAL CENTER 14 -81.663746 30.31471
12031 0310213 U S NAVAL STATION MAYPORT 33 -81.406396 30.390052
12031 0310213 U S NAVAL STATION MAYPORT 34 -81.417539 30.389417
12031 0310213 U S NAVAL STATION MAYPORT 37 -81.417539 30.389417
12031 0310325 TRANSFLO TERMINAL SERVICES, INC. 1 -81.720055 30.326385
12045 0450002 ARIZONA CHEMICAL COMPANY, LLC 13 -85.308333 29.818056
12045 0450002 ARIZONA CHEMICAL COMPANY, LLC 15 -85.308333 29.818056
12045 0450002 ARIZONA CHEMICAL COMPANY, LLC 16 -85.308333 29.818056
12045 0450002 ARIZONA CHEMICAL COMPANY, LLC 17 -85.308333 29.818056
12045 0450002 ARIZONA CHEMICAL COMPANY, LLC 5 -85.308333 29.818056
12045 0450002 ARIZONA CHEMICAL COMPANY, LLC 6 -85.308333 29.818056
12057 0570094 MOSAIC FERTILIZER, LLC 100 -82.40729 27.80519
Appendix A - 93 Kentucky Regional Haze 5-Year Periodic Report SIP Revision, September 2014
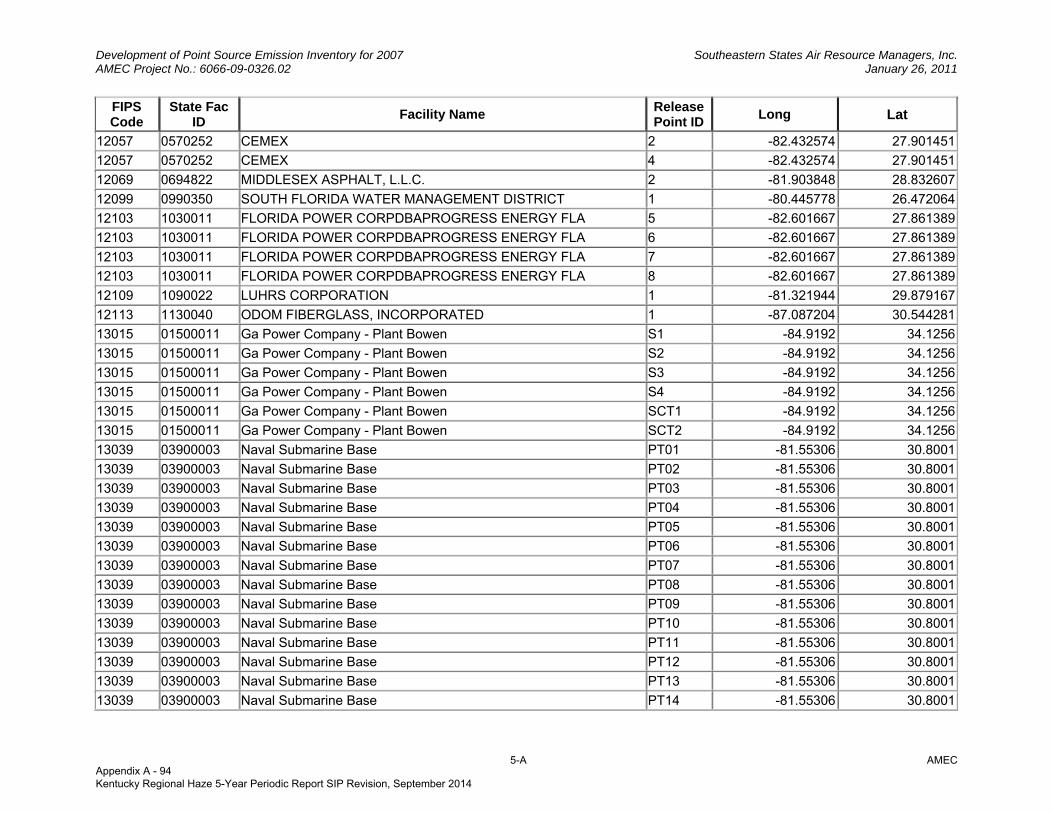
Development of Point Source Emission Inventory for 2007 Southeastern States Air Resource Managers, Inc. AMEC Project No.: 6066-09-0326.02 January 26, 2011
5-A AMEC
FIPS Code
State Fac ID Facility Name Release
Point IDLong Lat
12057 0570252 CEMEX 2 -82.432574 27.901451
12057 0570252 CEMEX 4 -82.432574 27.901451
12069 0694822 MIDDLESEX ASPHALT, L.L.C. 2 -81.903848 28.832607
12099 0990350 SOUTH FLORIDA WATER MANAGEMENT DISTRICT 1 -80.445778 26.472064
12103 1030011 FLORIDA POWER CORPDBAPROGRESS ENERGY FLA 5 -82.601667 27.861389
12103 1030011 FLORIDA POWER CORPDBAPROGRESS ENERGY FLA 6 -82.601667 27.861389
12103 1030011 FLORIDA POWER CORPDBAPROGRESS ENERGY FLA 7 -82.601667 27.861389
12103 1030011 FLORIDA POWER CORPDBAPROGRESS ENERGY FLA 8 -82.601667 27.861389
12109 1090022 LUHRS CORPORATION 1 -81.321944 29.879167
12113 1130040 ODOM FIBERGLASS, INCORPORATED 1 -87.087204 30.544281
13015 01500011 Ga Power Company - Plant Bowen S1 -84.9192 34.1256
13015 01500011 Ga Power Company - Plant Bowen S2 -84.9192 34.1256
13015 01500011 Ga Power Company - Plant Bowen S3 -84.9192 34.1256
13015 01500011 Ga Power Company - Plant Bowen S4 -84.9192 34.1256
13015 01500011 Ga Power Company - Plant Bowen SCT1 -84.9192 34.1256
13015 01500011 Ga Power Company - Plant Bowen SCT2 -84.9192 34.1256
13039 03900003 Naval Submarine Base PT01 -81.55306 30.8001
13039 03900003 Naval Submarine Base PT02 -81.55306 30.8001
13039 03900003 Naval Submarine Base PT03 -81.55306 30.8001
13039 03900003 Naval Submarine Base PT04 -81.55306 30.8001
13039 03900003 Naval Submarine Base PT05 -81.55306 30.8001
13039 03900003 Naval Submarine Base PT06 -81.55306 30.8001
13039 03900003 Naval Submarine Base PT07 -81.55306 30.8001
13039 03900003 Naval Submarine Base PT08 -81.55306 30.8001
13039 03900003 Naval Submarine Base PT09 -81.55306 30.8001
13039 03900003 Naval Submarine Base PT10 -81.55306 30.8001
13039 03900003 Naval Submarine Base PT11 -81.55306 30.8001
13039 03900003 Naval Submarine Base PT12 -81.55306 30.8001
13039 03900003 Naval Submarine Base PT13 -81.55306 30.8001
13039 03900003 Naval Submarine Base PT14 -81.55306 30.8001
Appendix A - 94 Kentucky Regional Haze 5-Year Periodic Report SIP Revision, September 2014
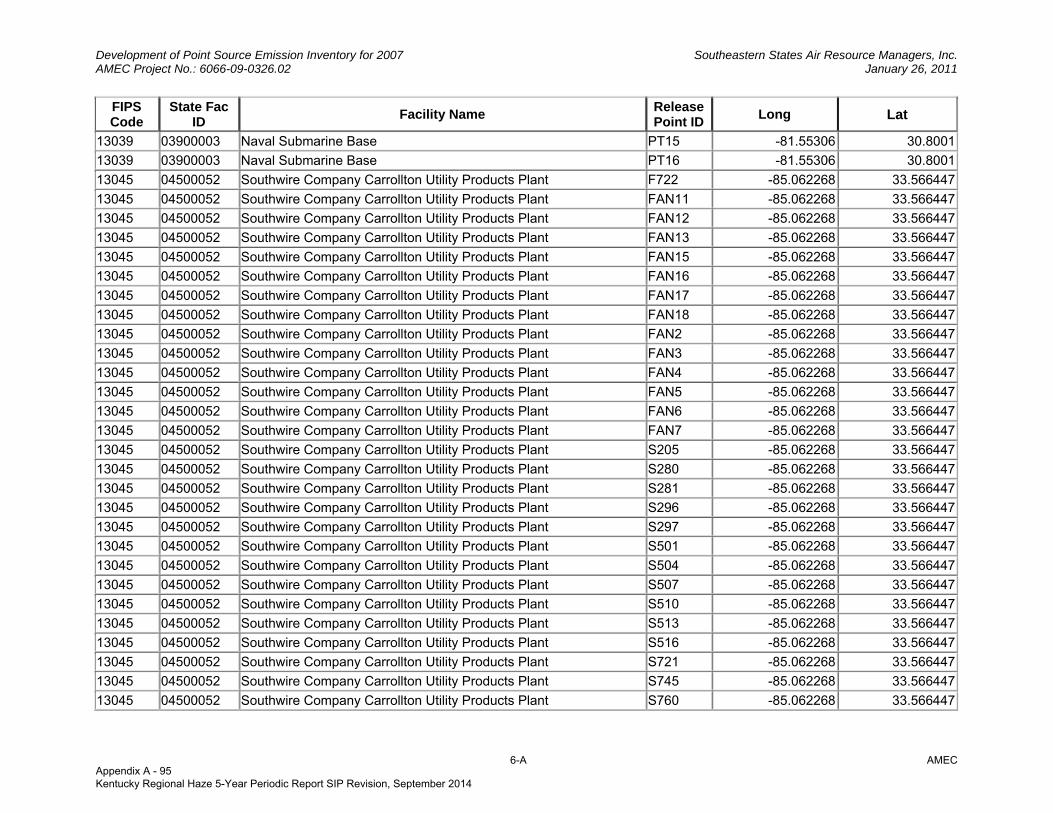
Development of Point Source Emission Inventory for 2007 Southeastern States Air Resource Managers, Inc. AMEC Project No.: 6066-09-0326.02 January 26, 2011
6-A AMEC
FIPS Code
State Fac ID Facility Name Release
Point IDLong Lat
13039 03900003 Naval Submarine Base PT15 -81.55306 30.8001
13039 03900003 Naval Submarine Base PT16 -81.55306 30.8001
13045 04500052 Southwire Company Carrollton Utility Products Plant F722 -85.062268 33.566447
13045 04500052 Southwire Company Carrollton Utility Products Plant FAN11 -85.062268 33.566447
13045 04500052 Southwire Company Carrollton Utility Products Plant FAN12 -85.062268 33.566447
13045 04500052 Southwire Company Carrollton Utility Products Plant FAN13 -85.062268 33.566447
13045 04500052 Southwire Company Carrollton Utility Products Plant FAN15 -85.062268 33.566447
13045 04500052 Southwire Company Carrollton Utility Products Plant FAN16 -85.062268 33.566447
13045 04500052 Southwire Company Carrollton Utility Products Plant FAN17 -85.062268 33.566447
13045 04500052 Southwire Company Carrollton Utility Products Plant FAN18 -85.062268 33.566447
13045 04500052 Southwire Company Carrollton Utility Products Plant FAN2 -85.062268 33.566447
13045 04500052 Southwire Company Carrollton Utility Products Plant FAN3 -85.062268 33.566447
13045 04500052 Southwire Company Carrollton Utility Products Plant FAN4 -85.062268 33.566447
13045 04500052 Southwire Company Carrollton Utility Products Plant FAN5 -85.062268 33.566447
13045 04500052 Southwire Company Carrollton Utility Products Plant FAN6 -85.062268 33.566447
13045 04500052 Southwire Company Carrollton Utility Products Plant FAN7 -85.062268 33.566447
13045 04500052 Southwire Company Carrollton Utility Products Plant S205 -85.062268 33.566447
13045 04500052 Southwire Company Carrollton Utility Products Plant S280 -85.062268 33.566447
13045 04500052 Southwire Company Carrollton Utility Products Plant S281 -85.062268 33.566447
13045 04500052 Southwire Company Carrollton Utility Products Plant S296 -85.062268 33.566447
13045 04500052 Southwire Company Carrollton Utility Products Plant S297 -85.062268 33.566447
13045 04500052 Southwire Company Carrollton Utility Products Plant S501 -85.062268 33.566447
13045 04500052 Southwire Company Carrollton Utility Products Plant S504 -85.062268 33.566447
13045 04500052 Southwire Company Carrollton Utility Products Plant S507 -85.062268 33.566447
13045 04500052 Southwire Company Carrollton Utility Products Plant S510 -85.062268 33.566447
13045 04500052 Southwire Company Carrollton Utility Products Plant S513 -85.062268 33.566447
13045 04500052 Southwire Company Carrollton Utility Products Plant S516 -85.062268 33.566447
13045 04500052 Southwire Company Carrollton Utility Products Plant S721 -85.062268 33.566447
13045 04500052 Southwire Company Carrollton Utility Products Plant S745 -85.062268 33.566447
13045 04500052 Southwire Company Carrollton Utility Products Plant S760 -85.062268 33.566447
Appendix A - 95 Kentucky Regional Haze 5-Year Periodic Report SIP Revision, September 2014
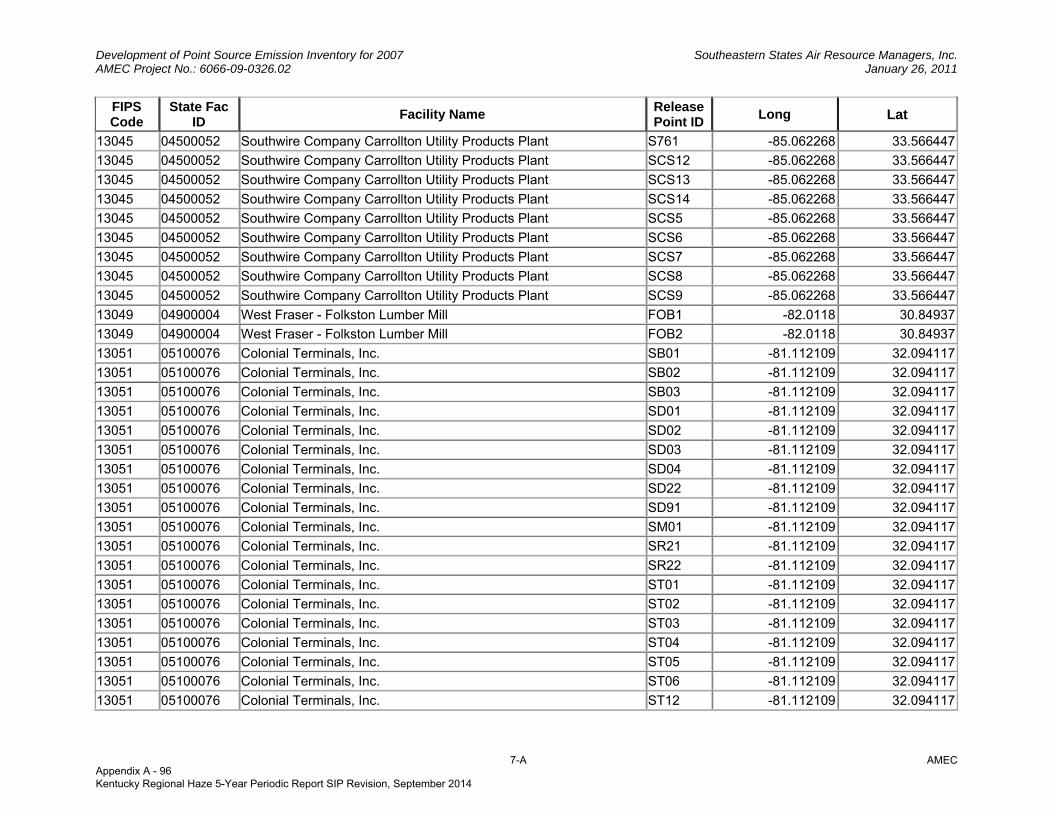
Development of Point Source Emission Inventory for 2007 Southeastern States Air Resource Managers, Inc. AMEC Project No.: 6066-09-0326.02 January 26, 2011
7-A AMEC
FIPS Code
State Fac ID Facility Name Release
Point IDLong Lat
13045 04500052 Southwire Company Carrollton Utility Products Plant S761 -85.062268 33.566447
13045 04500052 Southwire Company Carrollton Utility Products Plant SCS12 -85.062268 33.566447
13045 04500052 Southwire Company Carrollton Utility Products Plant SCS13 -85.062268 33.566447
13045 04500052 Southwire Company Carrollton Utility Products Plant SCS14 -85.062268 33.566447
13045 04500052 Southwire Company Carrollton Utility Products Plant SCS5 -85.062268 33.566447
13045 04500052 Southwire Company Carrollton Utility Products Plant SCS6 -85.062268 33.566447
13045 04500052 Southwire Company Carrollton Utility Products Plant SCS7 -85.062268 33.566447
13045 04500052 Southwire Company Carrollton Utility Products Plant SCS8 -85.062268 33.566447
13045 04500052 Southwire Company Carrollton Utility Products Plant SCS9 -85.062268 33.566447
13049 04900004 West Fraser - Folkston Lumber Mill FOB1 -82.0118 30.84937
13049 04900004 West Fraser - Folkston Lumber Mill FOB2 -82.0118 30.84937
13051 05100076 Colonial Terminals, Inc. SB01 -81.112109 32.094117
13051 05100076 Colonial Terminals, Inc. SB02 -81.112109 32.094117
13051 05100076 Colonial Terminals, Inc. SB03 -81.112109 32.094117
13051 05100076 Colonial Terminals, Inc. SD01 -81.112109 32.094117
13051 05100076 Colonial Terminals, Inc. SD02 -81.112109 32.094117
13051 05100076 Colonial Terminals, Inc. SD03 -81.112109 32.094117
13051 05100076 Colonial Terminals, Inc. SD04 -81.112109 32.094117
13051 05100076 Colonial Terminals, Inc. SD22 -81.112109 32.094117
13051 05100076 Colonial Terminals, Inc. SD91 -81.112109 32.094117
13051 05100076 Colonial Terminals, Inc. SM01 -81.112109 32.094117
13051 05100076 Colonial Terminals, Inc. SR21 -81.112109 32.094117
13051 05100076 Colonial Terminals, Inc. SR22 -81.112109 32.094117
13051 05100076 Colonial Terminals, Inc. ST01 -81.112109 32.094117
13051 05100076 Colonial Terminals, Inc. ST02 -81.112109 32.094117
13051 05100076 Colonial Terminals, Inc. ST03 -81.112109 32.094117
13051 05100076 Colonial Terminals, Inc. ST04 -81.112109 32.094117
13051 05100076 Colonial Terminals, Inc. ST05 -81.112109 32.094117
13051 05100076 Colonial Terminals, Inc. ST06 -81.112109 32.094117
13051 05100076 Colonial Terminals, Inc. ST12 -81.112109 32.094117
Appendix A - 96 Kentucky Regional Haze 5-Year Periodic Report SIP Revision, September 2014
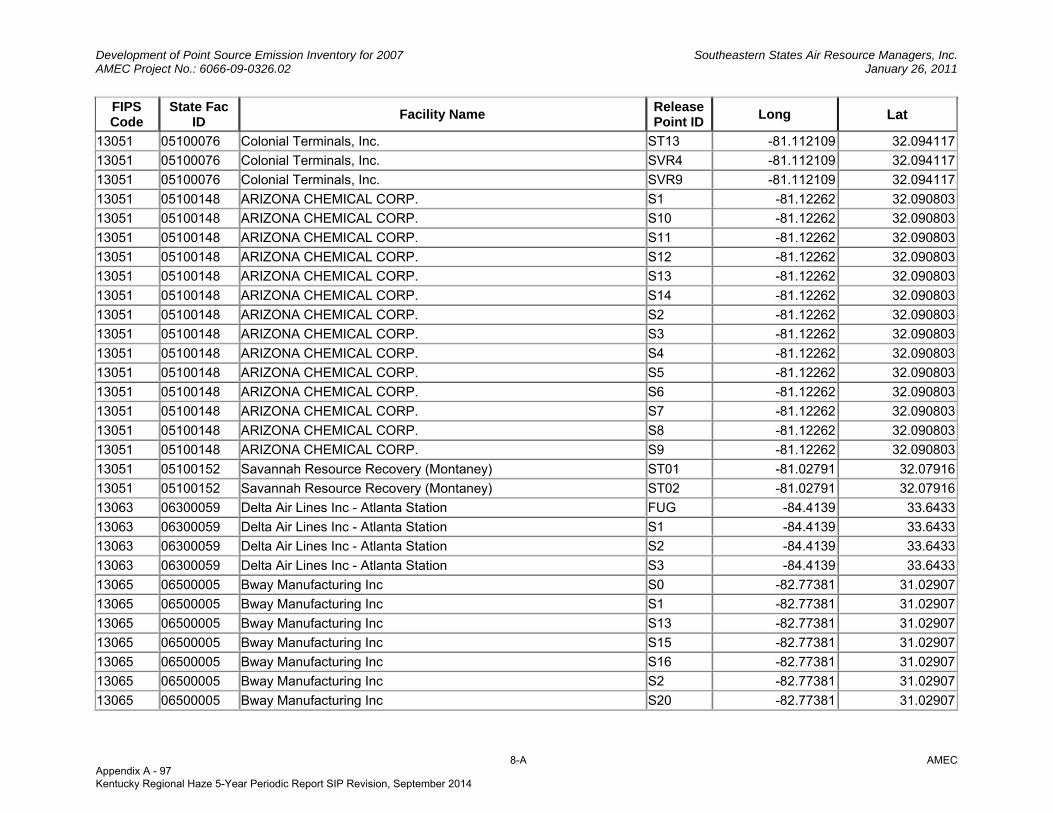
Development of Point Source Emission Inventory for 2007 Southeastern States Air Resource Managers, Inc. AMEC Project No.: 6066-09-0326.02 January 26, 2011
8-A AMEC
FIPS Code
State Fac ID Facility Name Release
Point IDLong Lat
13051 05100076 Colonial Terminals, Inc. ST13 -81.112109 32.094117
13051 05100076 Colonial Terminals, Inc. SVR4 -81.112109 32.094117
13051 05100076 Colonial Terminals, Inc. SVR9 -81.112109 32.094117
13051 05100148 ARIZONA CHEMICAL CORP. S1 -81.12262 32.090803
13051 05100148 ARIZONA CHEMICAL CORP. S10 -81.12262 32.090803
13051 05100148 ARIZONA CHEMICAL CORP. S11 -81.12262 32.090803
13051 05100148 ARIZONA CHEMICAL CORP. S12 -81.12262 32.090803
13051 05100148 ARIZONA CHEMICAL CORP. S13 -81.12262 32.090803
13051 05100148 ARIZONA CHEMICAL CORP. S14 -81.12262 32.090803
13051 05100148 ARIZONA CHEMICAL CORP. S2 -81.12262 32.090803
13051 05100148 ARIZONA CHEMICAL CORP. S3 -81.12262 32.090803
13051 05100148 ARIZONA CHEMICAL CORP. S4 -81.12262 32.090803
13051 05100148 ARIZONA CHEMICAL CORP. S5 -81.12262 32.090803
13051 05100148 ARIZONA CHEMICAL CORP. S6 -81.12262 32.090803
13051 05100148 ARIZONA CHEMICAL CORP. S7 -81.12262 32.090803
13051 05100148 ARIZONA CHEMICAL CORP. S8 -81.12262 32.090803
13051 05100148 ARIZONA CHEMICAL CORP. S9 -81.12262 32.090803
13051 05100152 Savannah Resource Recovery (Montaney) ST01 -81.02791 32.07916
13051 05100152 Savannah Resource Recovery (Montaney) ST02 -81.02791 32.07916
13063 06300059 Delta Air Lines Inc - Atlanta Station FUG -84.4139 33.6433
13063 06300059 Delta Air Lines Inc - Atlanta Station S1 -84.4139 33.6433
13063 06300059 Delta Air Lines Inc - Atlanta Station S2 -84.4139 33.6433
13063 06300059 Delta Air Lines Inc - Atlanta Station S3 -84.4139 33.6433
13065 06500005 Bway Manufacturing Inc S0 -82.77381 31.02907
13065 06500005 Bway Manufacturing Inc S1 -82.77381 31.02907
13065 06500005 Bway Manufacturing Inc S13 -82.77381 31.02907
13065 06500005 Bway Manufacturing Inc S15 -82.77381 31.02907
13065 06500005 Bway Manufacturing Inc S16 -82.77381 31.02907
13065 06500005 Bway Manufacturing Inc S2 -82.77381 31.02907
13065 06500005 Bway Manufacturing Inc S20 -82.77381 31.02907
Appendix A - 97 Kentucky Regional Haze 5-Year Periodic Report SIP Revision, September 2014

Development of Point Source Emission Inventory for 2007 Southeastern States Air Resource Managers, Inc. AMEC Project No.: 6066-09-0326.02 January 26, 2011
9-A AMEC
FIPS Code
State Fac ID Facility Name Release
Point IDLong Lat
13065 06500005 Bway Manufacturing Inc S3 -82.77381 31.02907
13065 06500005 Bway Manufacturing Inc S9 -82.77381 31.02907
13067 06700032 Marathon Petroleum Company LLC - Powder Springs Terminal FUG -84.63048 33.86302
13067 06700032 Marathon Petroleum Company LLC - Powder Springs Terminal VCS -84.63048 33.86302
13073 07300003 Quebecor World Kri Inc. FUG -82.11791 33.54336
13073 07300003 Quebecor World Kri Inc. S1 -82.11791 33.54336
13073 07300003 Quebecor World Kri Inc. S10 -82.11791 33.54336
13073 07300003 Quebecor World Kri Inc. S11 -82.11791 33.54336
13073 07300003 Quebecor World Kri Inc. S12 -82.11791 33.54336
13081 08100054 Norbord Georgia Inc S001 -83.80222 31.96606
13081 08100054 Norbord Georgia Inc S003 -83.80222 31.96606
13081 08100054 Norbord Georgia Inc S004 -83.80222 31.96606
13081 08100054 Norbord Georgia Inc S010 -83.80222 31.96606
13081 08100054 Norbord Georgia Inc S011 -83.80222 31.96606
13081 08100054 Norbord Georgia Inc S012 -83.80222 31.96606
13081 08100054 Norbord Georgia Inc S013 -83.80222 31.96606
13081 08100054 Norbord Georgia Inc S063 -83.80222 31.96606
13089 08900085 Magellan Terminal Holdings, L.P. - Doraville I Terminal FUG -84.269934 33.91519
13089 08900085 Magellan Terminal Holdings, L.P. - Doraville I Terminal S1 -84.269934 33.91519
13089 08900128 Transmontaigne Terminaling Inc CGLK -84.273961 33.916841
13089 08900128 Transmontaigne Terminaling Inc FUG -84.273961 33.916841
13089 08900128 Transmontaigne Terminaling Inc ST8501 -84.273961 33.916841
13089 08900128 Transmontaigne Terminaling Inc ST8502 -84.273961 33.916841
13089 08900128 Transmontaigne Terminaling Inc ST8504 -84.273961 33.916841
13089 08900128 Transmontaigne Terminaling Inc ST8505 -84.273961 33.916841
13089 08900128 Transmontaigne Terminaling Inc ST8506 -84.273961 33.916841
13089 08900128 Transmontaigne Terminaling Inc ST8507 -84.273961 33.916841
13089 08900128 Transmontaigne Terminaling Inc ST8509 -84.273961 33.916841
13089 08900128 Transmontaigne Terminaling Inc ST8510 -84.273961 33.916841
13089 08900128 Transmontaigne Terminaling Inc ST8515 -84.273961 33.916841
Appendix A - 98 Kentucky Regional Haze 5-Year Periodic Report SIP Revision, September 2014
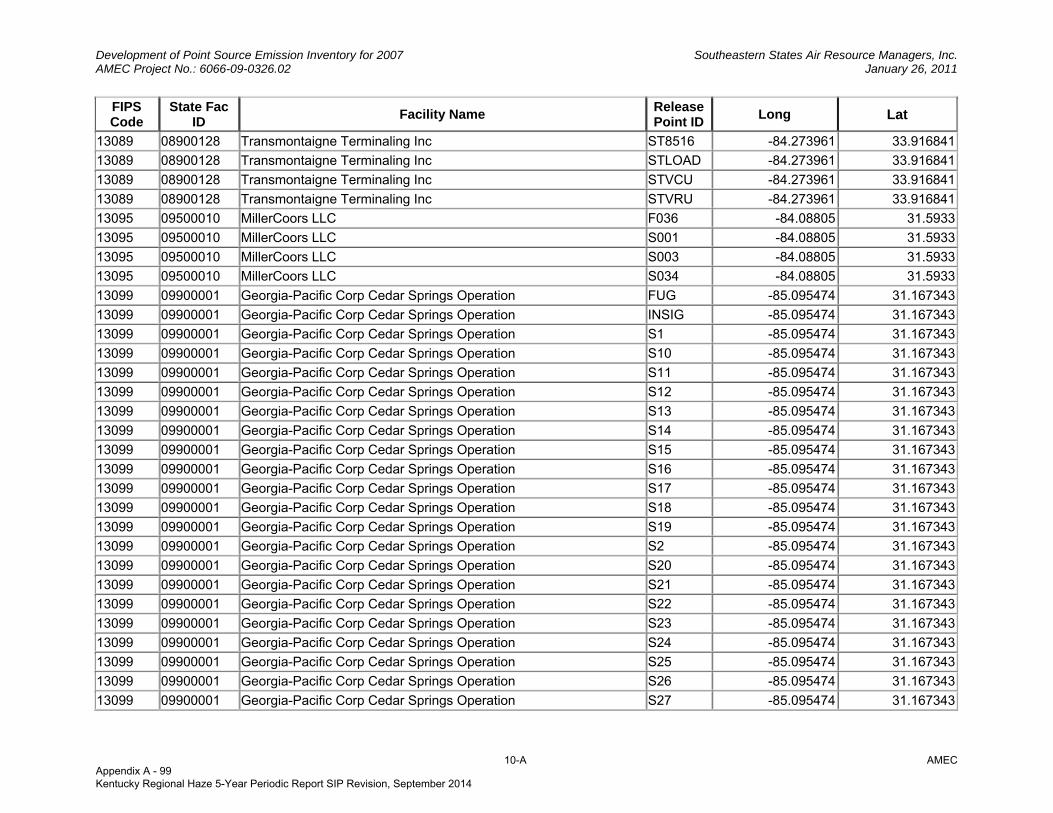
Development of Point Source Emission Inventory for 2007 Southeastern States Air Resource Managers, Inc. AMEC Project No.: 6066-09-0326.02 January 26, 2011
10-A AMEC
FIPS Code
State Fac ID Facility Name Release
Point IDLong Lat
13089 08900128 Transmontaigne Terminaling Inc ST8516 -84.273961 33.916841
13089 08900128 Transmontaigne Terminaling Inc STLOAD -84.273961 33.916841
13089 08900128 Transmontaigne Terminaling Inc STVCU -84.273961 33.916841
13089 08900128 Transmontaigne Terminaling Inc STVRU -84.273961 33.916841
13095 09500010 MillerCoors LLC F036 -84.08805 31.5933
13095 09500010 MillerCoors LLC S001 -84.08805 31.5933
13095 09500010 MillerCoors LLC S003 -84.08805 31.5933
13095 09500010 MillerCoors LLC S034 -84.08805 31.5933
13099 09900001 Georgia-Pacific Corp Cedar Springs Operation FUG -85.095474 31.167343
13099 09900001 Georgia-Pacific Corp Cedar Springs Operation INSIG -85.095474 31.167343
13099 09900001 Georgia-Pacific Corp Cedar Springs Operation S1 -85.095474 31.167343
13099 09900001 Georgia-Pacific Corp Cedar Springs Operation S10 -85.095474 31.167343
13099 09900001 Georgia-Pacific Corp Cedar Springs Operation S11 -85.095474 31.167343
13099 09900001 Georgia-Pacific Corp Cedar Springs Operation S12 -85.095474 31.167343
13099 09900001 Georgia-Pacific Corp Cedar Springs Operation S13 -85.095474 31.167343
13099 09900001 Georgia-Pacific Corp Cedar Springs Operation S14 -85.095474 31.167343
13099 09900001 Georgia-Pacific Corp Cedar Springs Operation S15 -85.095474 31.167343
13099 09900001 Georgia-Pacific Corp Cedar Springs Operation S16 -85.095474 31.167343
13099 09900001 Georgia-Pacific Corp Cedar Springs Operation S17 -85.095474 31.167343
13099 09900001 Georgia-Pacific Corp Cedar Springs Operation S18 -85.095474 31.167343
13099 09900001 Georgia-Pacific Corp Cedar Springs Operation S19 -85.095474 31.167343
13099 09900001 Georgia-Pacific Corp Cedar Springs Operation S2 -85.095474 31.167343
13099 09900001 Georgia-Pacific Corp Cedar Springs Operation S20 -85.095474 31.167343
13099 09900001 Georgia-Pacific Corp Cedar Springs Operation S21 -85.095474 31.167343
13099 09900001 Georgia-Pacific Corp Cedar Springs Operation S22 -85.095474 31.167343
13099 09900001 Georgia-Pacific Corp Cedar Springs Operation S23 -85.095474 31.167343
13099 09900001 Georgia-Pacific Corp Cedar Springs Operation S24 -85.095474 31.167343
13099 09900001 Georgia-Pacific Corp Cedar Springs Operation S25 -85.095474 31.167343
13099 09900001 Georgia-Pacific Corp Cedar Springs Operation S26 -85.095474 31.167343
13099 09900001 Georgia-Pacific Corp Cedar Springs Operation S27 -85.095474 31.167343
Appendix A - 99 Kentucky Regional Haze 5-Year Periodic Report SIP Revision, September 2014

Development of Point Source Emission Inventory for 2007 Southeastern States Air Resource Managers, Inc. AMEC Project No.: 6066-09-0326.02 January 26, 2011
11-A AMEC
FIPS Code
State Fac ID Facility Name Release
Point IDLong Lat
13099 09900001 Georgia-Pacific Corp Cedar Springs Operation S28 -85.095474 31.167343
13099 09900001 Georgia-Pacific Corp Cedar Springs Operation S29 -85.095474 31.167343
13099 09900001 Georgia-Pacific Corp Cedar Springs Operation S3 -85.095474 31.167343
13099 09900001 Georgia-Pacific Corp Cedar Springs Operation S5 -85.095474 31.167343
13099 09900001 Georgia-Pacific Corp Cedar Springs Operation S6 -85.095474 31.167343
13099 09900001 Georgia-Pacific Corp Cedar Springs Operation S7 -85.095474 31.167343
13099 09900001 Georgia-Pacific Corp Cedar Springs Operation S8 -85.095474 31.167343
13099 09900001 Georgia-Pacific Corp Cedar Springs Operation S9 -85.095474 31.167343
13099 09900001 Georgia-Pacific Corp Cedar Springs Operation VSTACK -85.095474 31.167343
13099 09900001 Georgia-Pacific Corp Cedar Springs Operation WTS -85.095474 31.167343
13103 10300007 Georgia-Pacific Consumer Products Lp (Savannah River Mill) FUG -81.20178 32.33113
13103 10300007 Georgia-Pacific Consumer Products Lp (Savannah River Mill) S1 -81.20178 32.33113
13103 10300007 Georgia-Pacific Consumer Products Lp (Savannah River Mill) S10 -81.20178 32.33113
13103 10300007 Georgia-Pacific Consumer Products Lp (Savannah River Mill) S11 -81.20178 32.33113
13103 10300007 Georgia-Pacific Consumer Products Lp (Savannah River Mill) S12 -81.20178 32.33113
13103 10300007 Georgia-Pacific Consumer Products Lp (Savannah River Mill) S2 -81.20178 32.33113
13103 10300007 Georgia-Pacific Consumer Products Lp (Savannah River Mill) S3 -81.20178 32.33113
13103 10300007 Georgia-Pacific Consumer Products Lp (Savannah River Mill) S4 -81.20178 32.33113
13103 10300007 Georgia-Pacific Consumer Products Lp (Savannah River Mill) S6 -81.20178 32.33113
13103 10300007 Georgia-Pacific Consumer Products Lp (Savannah River Mill) S8 -81.20178 32.33113
13103 10300007 Georgia-Pacific Consumer Products Lp (Savannah River Mill) S9 -81.20178 32.33113
13115 11500077 Metal Container Corporation 28 -85.0991 34.32541
13115 11500077 Metal Container Corporation 30 -85.0991 34.32541
13115 11500077 Metal Container Corporation 32 -85.0991 34.32541
13115 11500077 Metal Container Corporation 37 -85.0991 34.32541
13115 11500077 Metal Container Corporation 44 -85.0991 34.32541
13115 11500077 Metal Container Corporation 61 -85.0991 34.32541
13115 11500077 Metal Container Corporation FUG -85.0991 34.32541
13115 11500077 Metal Container Corporation FUG2 -85.0991 34.32541
13121 12100807 Delta Airlines - General Office Facilities S1 -84.423194 33.656343
Appendix A - 100 Kentucky Regional Haze 5-Year Periodic Report SIP Revision, September 2014
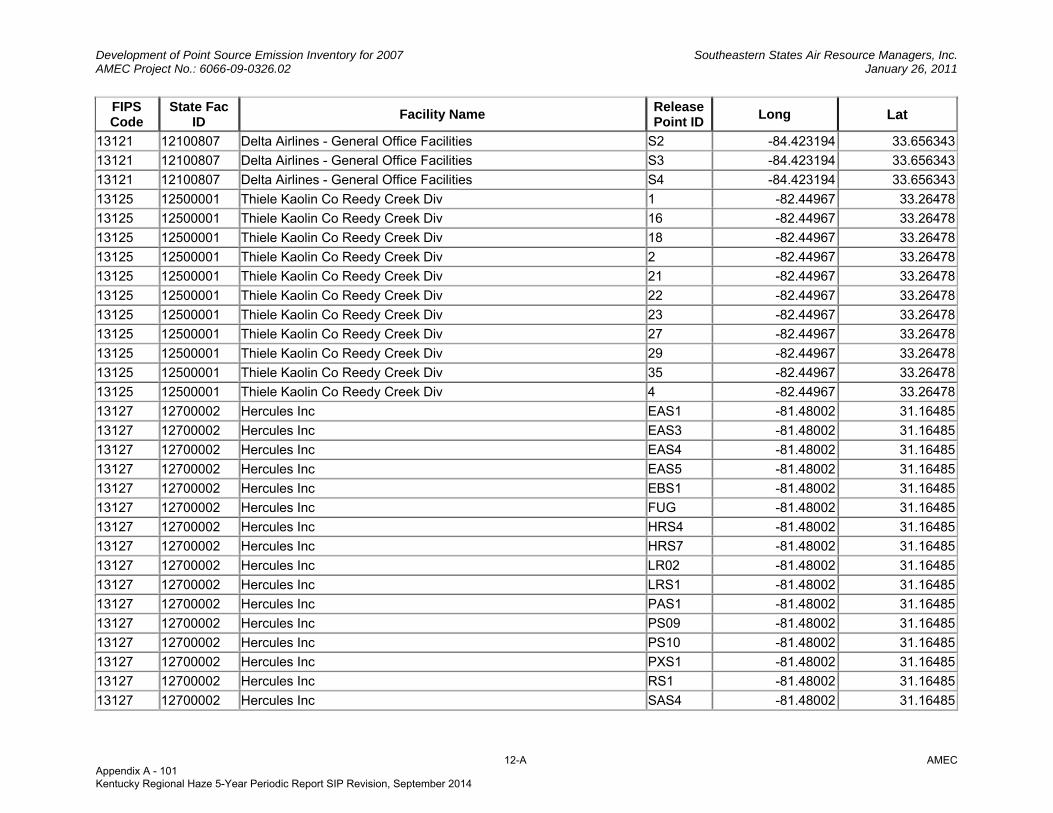
Development of Point Source Emission Inventory for 2007 Southeastern States Air Resource Managers, Inc. AMEC Project No.: 6066-09-0326.02 January 26, 2011
12-A AMEC
FIPS Code
State Fac ID Facility Name Release
Point IDLong Lat
13121 12100807 Delta Airlines - General Office Facilities S2 -84.423194 33.656343
13121 12100807 Delta Airlines - General Office Facilities S3 -84.423194 33.656343
13121 12100807 Delta Airlines - General Office Facilities S4 -84.423194 33.656343
13125 12500001 Thiele Kaolin Co Reedy Creek Div 1 -82.44967 33.26478
13125 12500001 Thiele Kaolin Co Reedy Creek Div 16 -82.44967 33.26478
13125 12500001 Thiele Kaolin Co Reedy Creek Div 18 -82.44967 33.26478
13125 12500001 Thiele Kaolin Co Reedy Creek Div 2 -82.44967 33.26478
13125 12500001 Thiele Kaolin Co Reedy Creek Div 21 -82.44967 33.26478
13125 12500001 Thiele Kaolin Co Reedy Creek Div 22 -82.44967 33.26478
13125 12500001 Thiele Kaolin Co Reedy Creek Div 23 -82.44967 33.26478
13125 12500001 Thiele Kaolin Co Reedy Creek Div 27 -82.44967 33.26478
13125 12500001 Thiele Kaolin Co Reedy Creek Div 29 -82.44967 33.26478
13125 12500001 Thiele Kaolin Co Reedy Creek Div 35 -82.44967 33.26478
13125 12500001 Thiele Kaolin Co Reedy Creek Div 4 -82.44967 33.26478
13127 12700002 Hercules Inc EAS1 -81.48002 31.16485
13127 12700002 Hercules Inc EAS3 -81.48002 31.16485
13127 12700002 Hercules Inc EAS4 -81.48002 31.16485
13127 12700002 Hercules Inc EAS5 -81.48002 31.16485
13127 12700002 Hercules Inc EBS1 -81.48002 31.16485
13127 12700002 Hercules Inc FUG -81.48002 31.16485
13127 12700002 Hercules Inc HRS4 -81.48002 31.16485
13127 12700002 Hercules Inc HRS7 -81.48002 31.16485
13127 12700002 Hercules Inc LR02 -81.48002 31.16485
13127 12700002 Hercules Inc LRS1 -81.48002 31.16485
13127 12700002 Hercules Inc PAS1 -81.48002 31.16485
13127 12700002 Hercules Inc PS09 -81.48002 31.16485
13127 12700002 Hercules Inc PS10 -81.48002 31.16485
13127 12700002 Hercules Inc PXS1 -81.48002 31.16485
13127 12700002 Hercules Inc RS1 -81.48002 31.16485
13127 12700002 Hercules Inc SAS4 -81.48002 31.16485
Appendix A - 101 Kentucky Regional Haze 5-Year Periodic Report SIP Revision, September 2014
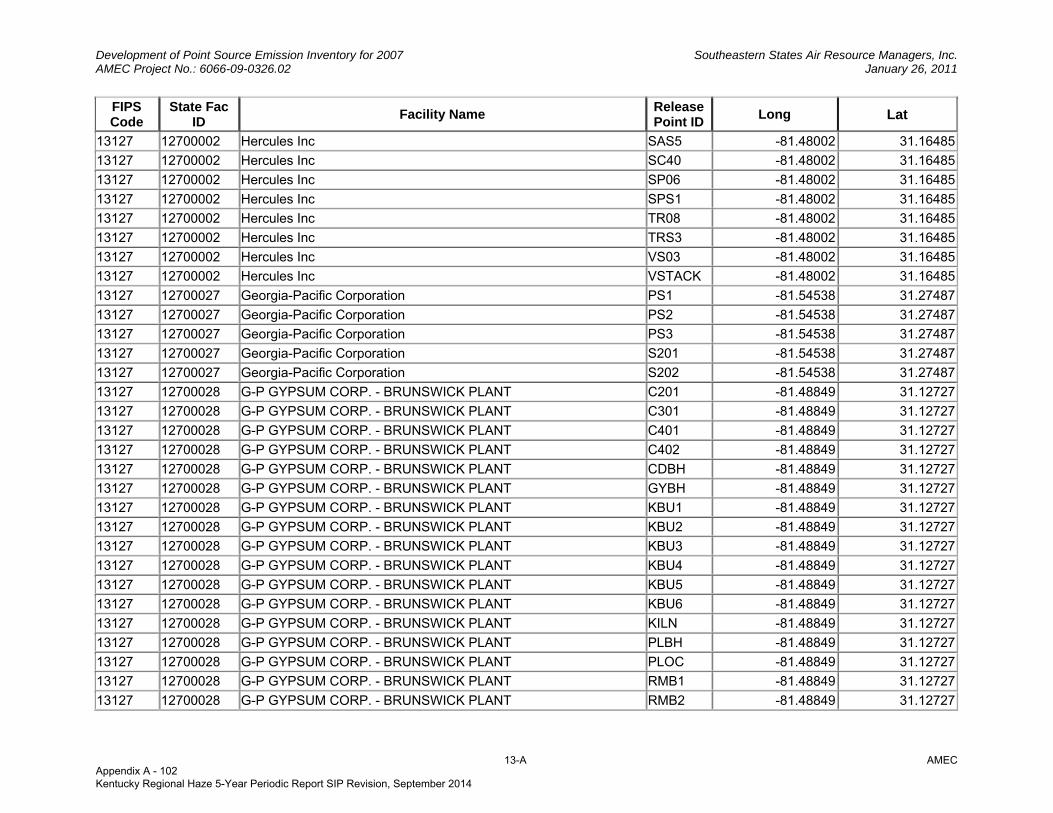
Development of Point Source Emission Inventory for 2007 Southeastern States Air Resource Managers, Inc. AMEC Project No.: 6066-09-0326.02 January 26, 2011
13-A AMEC
FIPS Code
State Fac ID Facility Name Release
Point IDLong Lat
13127 12700002 Hercules Inc SAS5 -81.48002 31.16485
13127 12700002 Hercules Inc SC40 -81.48002 31.16485
13127 12700002 Hercules Inc SP06 -81.48002 31.16485
13127 12700002 Hercules Inc SPS1 -81.48002 31.16485
13127 12700002 Hercules Inc TR08 -81.48002 31.16485
13127 12700002 Hercules Inc TRS3 -81.48002 31.16485
13127 12700002 Hercules Inc VS03 -81.48002 31.16485
13127 12700002 Hercules Inc VSTACK -81.48002 31.16485
13127 12700027 Georgia-Pacific Corporation PS1 -81.54538 31.27487
13127 12700027 Georgia-Pacific Corporation PS2 -81.54538 31.27487
13127 12700027 Georgia-Pacific Corporation PS3 -81.54538 31.27487
13127 12700027 Georgia-Pacific Corporation S201 -81.54538 31.27487
13127 12700027 Georgia-Pacific Corporation S202 -81.54538 31.27487
13127 12700028 G-P GYPSUM CORP. - BRUNSWICK PLANT C201 -81.48849 31.12727
13127 12700028 G-P GYPSUM CORP. - BRUNSWICK PLANT C301 -81.48849 31.12727
13127 12700028 G-P GYPSUM CORP. - BRUNSWICK PLANT C401 -81.48849 31.12727
13127 12700028 G-P GYPSUM CORP. - BRUNSWICK PLANT C402 -81.48849 31.12727
13127 12700028 G-P GYPSUM CORP. - BRUNSWICK PLANT CDBH -81.48849 31.12727
13127 12700028 G-P GYPSUM CORP. - BRUNSWICK PLANT GYBH -81.48849 31.12727
13127 12700028 G-P GYPSUM CORP. - BRUNSWICK PLANT KBU1 -81.48849 31.12727
13127 12700028 G-P GYPSUM CORP. - BRUNSWICK PLANT KBU2 -81.48849 31.12727
13127 12700028 G-P GYPSUM CORP. - BRUNSWICK PLANT KBU3 -81.48849 31.12727
13127 12700028 G-P GYPSUM CORP. - BRUNSWICK PLANT KBU4 -81.48849 31.12727
13127 12700028 G-P GYPSUM CORP. - BRUNSWICK PLANT KBU5 -81.48849 31.12727
13127 12700028 G-P GYPSUM CORP. - BRUNSWICK PLANT KBU6 -81.48849 31.12727
13127 12700028 G-P GYPSUM CORP. - BRUNSWICK PLANT KILN -81.48849 31.12727
13127 12700028 G-P GYPSUM CORP. - BRUNSWICK PLANT PLBH -81.48849 31.12727
13127 12700028 G-P GYPSUM CORP. - BRUNSWICK PLANT PLOC -81.48849 31.12727
13127 12700028 G-P GYPSUM CORP. - BRUNSWICK PLANT RMB1 -81.48849 31.12727
13127 12700028 G-P GYPSUM CORP. - BRUNSWICK PLANT RMB2 -81.48849 31.12727
Appendix A - 102 Kentucky Regional Haze 5-Year Periodic Report SIP Revision, September 2014
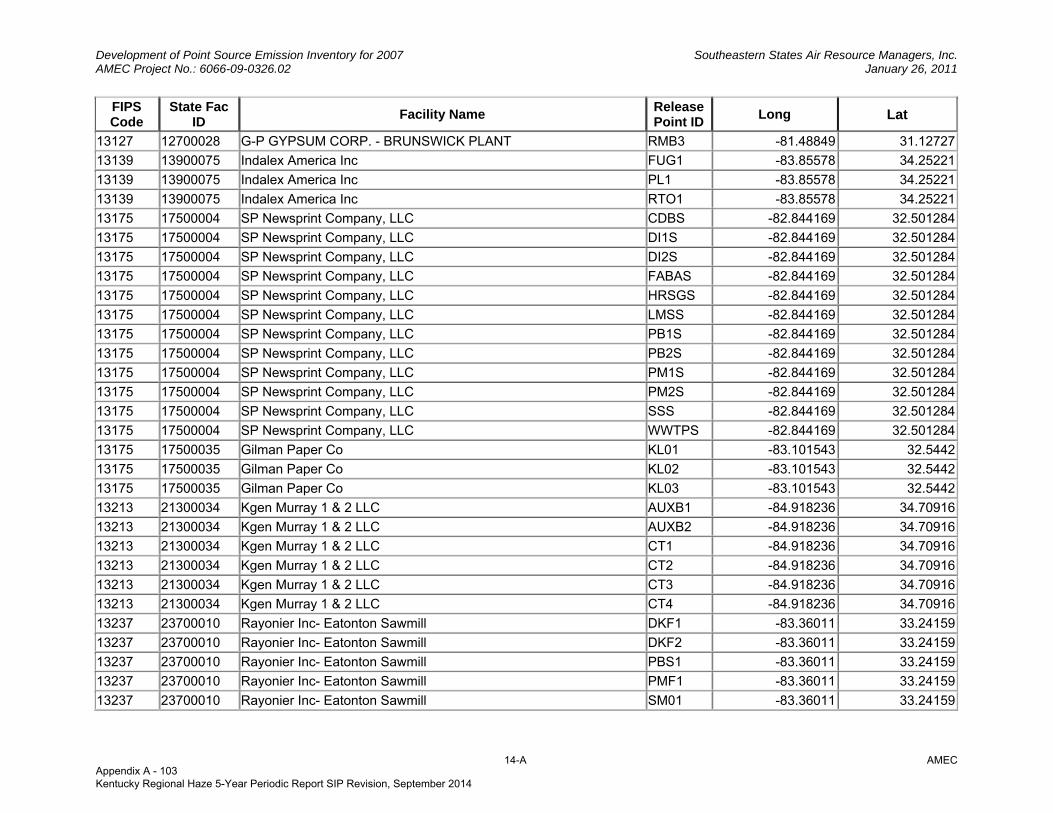
Development of Point Source Emission Inventory for 2007 Southeastern States Air Resource Managers, Inc. AMEC Project No.: 6066-09-0326.02 January 26, 2011
14-A AMEC
FIPS Code
State Fac ID Facility Name Release
Point IDLong Lat
13127 12700028 G-P GYPSUM CORP. - BRUNSWICK PLANT RMB3 -81.48849 31.12727
13139 13900075 Indalex America Inc FUG1 -83.85578 34.25221
13139 13900075 Indalex America Inc PL1 -83.85578 34.25221
13139 13900075 Indalex America Inc RTO1 -83.85578 34.25221
13175 17500004 SP Newsprint Company, LLC CDBS -82.844169 32.501284
13175 17500004 SP Newsprint Company, LLC DI1S -82.844169 32.501284
13175 17500004 SP Newsprint Company, LLC DI2S -82.844169 32.501284
13175 17500004 SP Newsprint Company, LLC FABAS -82.844169 32.501284
13175 17500004 SP Newsprint Company, LLC HRSGS -82.844169 32.501284
13175 17500004 SP Newsprint Company, LLC LMSS -82.844169 32.501284
13175 17500004 SP Newsprint Company, LLC PB1S -82.844169 32.501284
13175 17500004 SP Newsprint Company, LLC PB2S -82.844169 32.501284
13175 17500004 SP Newsprint Company, LLC PM1S -82.844169 32.501284
13175 17500004 SP Newsprint Company, LLC PM2S -82.844169 32.501284
13175 17500004 SP Newsprint Company, LLC SSS -82.844169 32.501284
13175 17500004 SP Newsprint Company, LLC WWTPS -82.844169 32.501284
13175 17500035 Gilman Paper Co KL01 -83.101543 32.5442
13175 17500035 Gilman Paper Co KL02 -83.101543 32.5442
13175 17500035 Gilman Paper Co KL03 -83.101543 32.5442
13213 21300034 Kgen Murray 1 & 2 LLC AUXB1 -84.918236 34.70916
13213 21300034 Kgen Murray 1 & 2 LLC AUXB2 -84.918236 34.70916
13213 21300034 Kgen Murray 1 & 2 LLC CT1 -84.918236 34.70916
13213 21300034 Kgen Murray 1 & 2 LLC CT2 -84.918236 34.70916
13213 21300034 Kgen Murray 1 & 2 LLC CT3 -84.918236 34.70916
13213 21300034 Kgen Murray 1 & 2 LLC CT4 -84.918236 34.70916
13237 23700010 Rayonier Inc- Eatonton Sawmill DKF1 -83.36011 33.24159
13237 23700010 Rayonier Inc- Eatonton Sawmill DKF2 -83.36011 33.24159
13237 23700010 Rayonier Inc- Eatonton Sawmill PBS1 -83.36011 33.24159
13237 23700010 Rayonier Inc- Eatonton Sawmill PMF1 -83.36011 33.24159
13237 23700010 Rayonier Inc- Eatonton Sawmill SM01 -83.36011 33.24159
Appendix A - 103 Kentucky Regional Haze 5-Year Periodic Report SIP Revision, September 2014
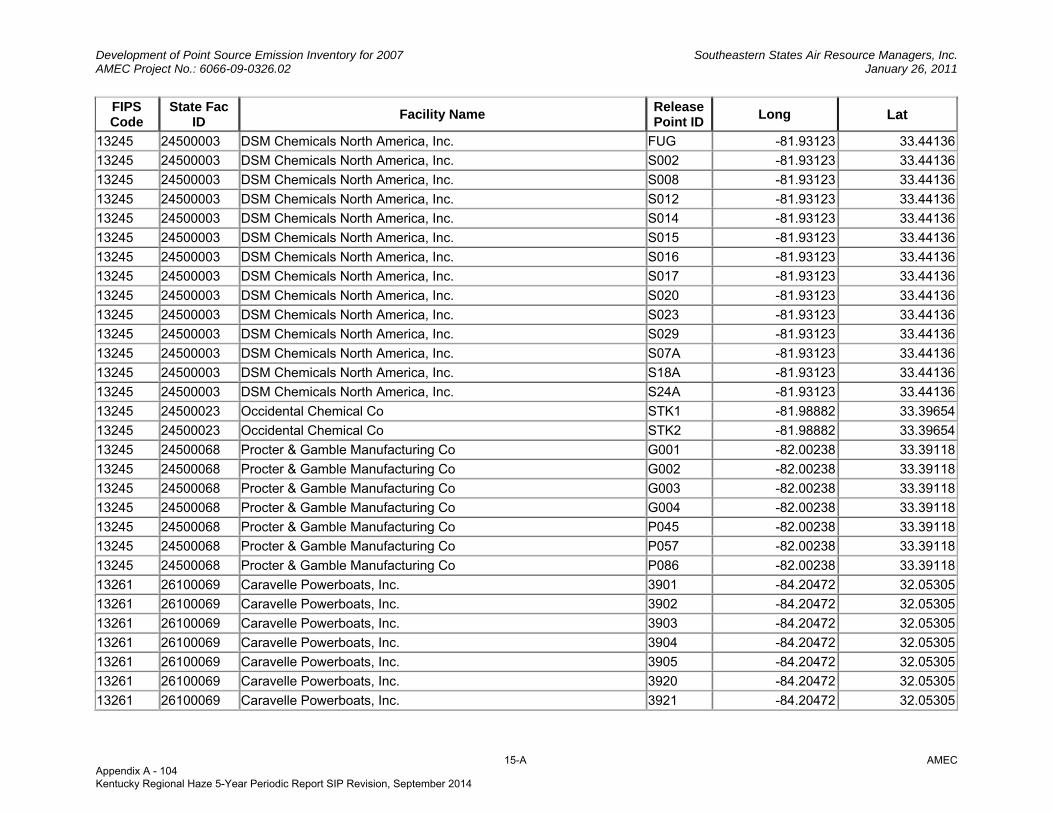
Development of Point Source Emission Inventory for 2007 Southeastern States Air Resource Managers, Inc. AMEC Project No.: 6066-09-0326.02 January 26, 2011
15-A AMEC
FIPS Code
State Fac ID Facility Name Release
Point IDLong Lat
13245 24500003 DSM Chemicals North America, Inc. FUG -81.93123 33.44136
13245 24500003 DSM Chemicals North America, Inc. S002 -81.93123 33.44136
13245 24500003 DSM Chemicals North America, Inc. S008 -81.93123 33.44136
13245 24500003 DSM Chemicals North America, Inc. S012 -81.93123 33.44136
13245 24500003 DSM Chemicals North America, Inc. S014 -81.93123 33.44136
13245 24500003 DSM Chemicals North America, Inc. S015 -81.93123 33.44136
13245 24500003 DSM Chemicals North America, Inc. S016 -81.93123 33.44136
13245 24500003 DSM Chemicals North America, Inc. S017 -81.93123 33.44136
13245 24500003 DSM Chemicals North America, Inc. S020 -81.93123 33.44136
13245 24500003 DSM Chemicals North America, Inc. S023 -81.93123 33.44136
13245 24500003 DSM Chemicals North America, Inc. S029 -81.93123 33.44136
13245 24500003 DSM Chemicals North America, Inc. S07A -81.93123 33.44136
13245 24500003 DSM Chemicals North America, Inc. S18A -81.93123 33.44136
13245 24500003 DSM Chemicals North America, Inc. S24A -81.93123 33.44136
13245 24500023 Occidental Chemical Co STK1 -81.98882 33.39654
13245 24500023 Occidental Chemical Co STK2 -81.98882 33.39654
13245 24500068 Procter & Gamble Manufacturing Co G001 -82.00238 33.39118
13245 24500068 Procter & Gamble Manufacturing Co G002 -82.00238 33.39118
13245 24500068 Procter & Gamble Manufacturing Co G003 -82.00238 33.39118
13245 24500068 Procter & Gamble Manufacturing Co G004 -82.00238 33.39118
13245 24500068 Procter & Gamble Manufacturing Co P045 -82.00238 33.39118
13245 24500068 Procter & Gamble Manufacturing Co P057 -82.00238 33.39118
13245 24500068 Procter & Gamble Manufacturing Co P086 -82.00238 33.39118
13261 26100069 Caravelle Powerboats, Inc. 3901 -84.20472 32.05305
13261 26100069 Caravelle Powerboats, Inc. 3902 -84.20472 32.05305
13261 26100069 Caravelle Powerboats, Inc. 3903 -84.20472 32.05305
13261 26100069 Caravelle Powerboats, Inc. 3904 -84.20472 32.05305
13261 26100069 Caravelle Powerboats, Inc. 3905 -84.20472 32.05305
13261 26100069 Caravelle Powerboats, Inc. 3920 -84.20472 32.05305
13261 26100069 Caravelle Powerboats, Inc. 3921 -84.20472 32.05305
Appendix A - 104 Kentucky Regional Haze 5-Year Periodic Report SIP Revision, September 2014
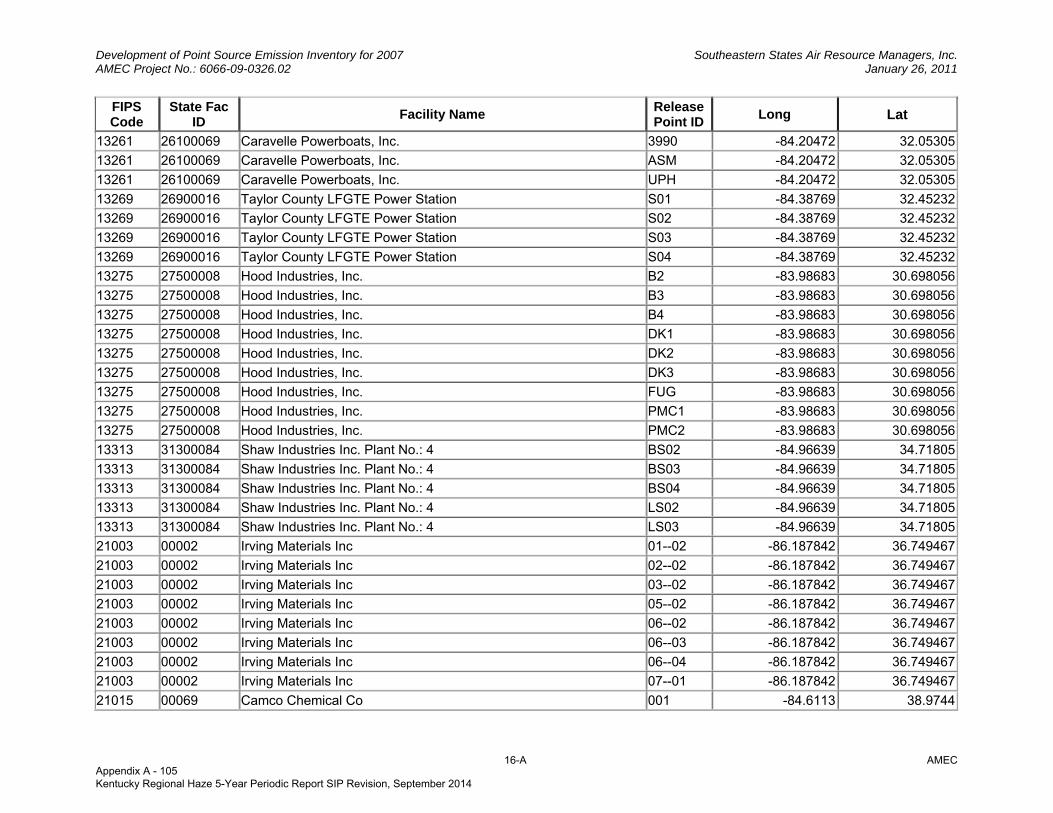
Development of Point Source Emission Inventory for 2007 Southeastern States Air Resource Managers, Inc. AMEC Project No.: 6066-09-0326.02 January 26, 2011
16-A AMEC
FIPS Code
State Fac ID Facility Name Release
Point IDLong Lat
13261 26100069 Caravelle Powerboats, Inc. 3990 -84.20472 32.05305
13261 26100069 Caravelle Powerboats, Inc. ASM -84.20472 32.05305
13261 26100069 Caravelle Powerboats, Inc. UPH -84.20472 32.05305
13269 26900016 Taylor County LFGTE Power Station S01 -84.38769 32.45232
13269 26900016 Taylor County LFGTE Power Station S02 -84.38769 32.45232
13269 26900016 Taylor County LFGTE Power Station S03 -84.38769 32.45232
13269 26900016 Taylor County LFGTE Power Station S04 -84.38769 32.45232
13275 27500008 Hood Industries, Inc. B2 -83.98683 30.698056
13275 27500008 Hood Industries, Inc. B3 -83.98683 30.698056
13275 27500008 Hood Industries, Inc. B4 -83.98683 30.698056
13275 27500008 Hood Industries, Inc. DK1 -83.98683 30.698056
13275 27500008 Hood Industries, Inc. DK2 -83.98683 30.698056
13275 27500008 Hood Industries, Inc. DK3 -83.98683 30.698056
13275 27500008 Hood Industries, Inc. FUG -83.98683 30.698056
13275 27500008 Hood Industries, Inc. PMC1 -83.98683 30.698056
13275 27500008 Hood Industries, Inc. PMC2 -83.98683 30.698056
13313 31300084 Shaw Industries Inc. Plant No.: 4 BS02 -84.96639 34.71805
13313 31300084 Shaw Industries Inc. Plant No.: 4 BS03 -84.96639 34.71805
13313 31300084 Shaw Industries Inc. Plant No.: 4 BS04 -84.96639 34.71805
13313 31300084 Shaw Industries Inc. Plant No.: 4 LS02 -84.96639 34.71805
13313 31300084 Shaw Industries Inc. Plant No.: 4 LS03 -84.96639 34.71805
21003 00002 Irving Materials Inc 01--02 -86.187842 36.749467
21003 00002 Irving Materials Inc 02--02 -86.187842 36.749467
21003 00002 Irving Materials Inc 03--02 -86.187842 36.749467
21003 00002 Irving Materials Inc 05--02 -86.187842 36.749467
21003 00002 Irving Materials Inc 06--02 -86.187842 36.749467
21003 00002 Irving Materials Inc 06--03 -86.187842 36.749467
21003 00002 Irving Materials Inc 06--04 -86.187842 36.749467
21003 00002 Irving Materials Inc 07--01 -86.187842 36.749467
21015 00069 Camco Chemical Co 001 -84.6113 38.9744
Appendix A - 105 Kentucky Regional Haze 5-Year Periodic Report SIP Revision, September 2014
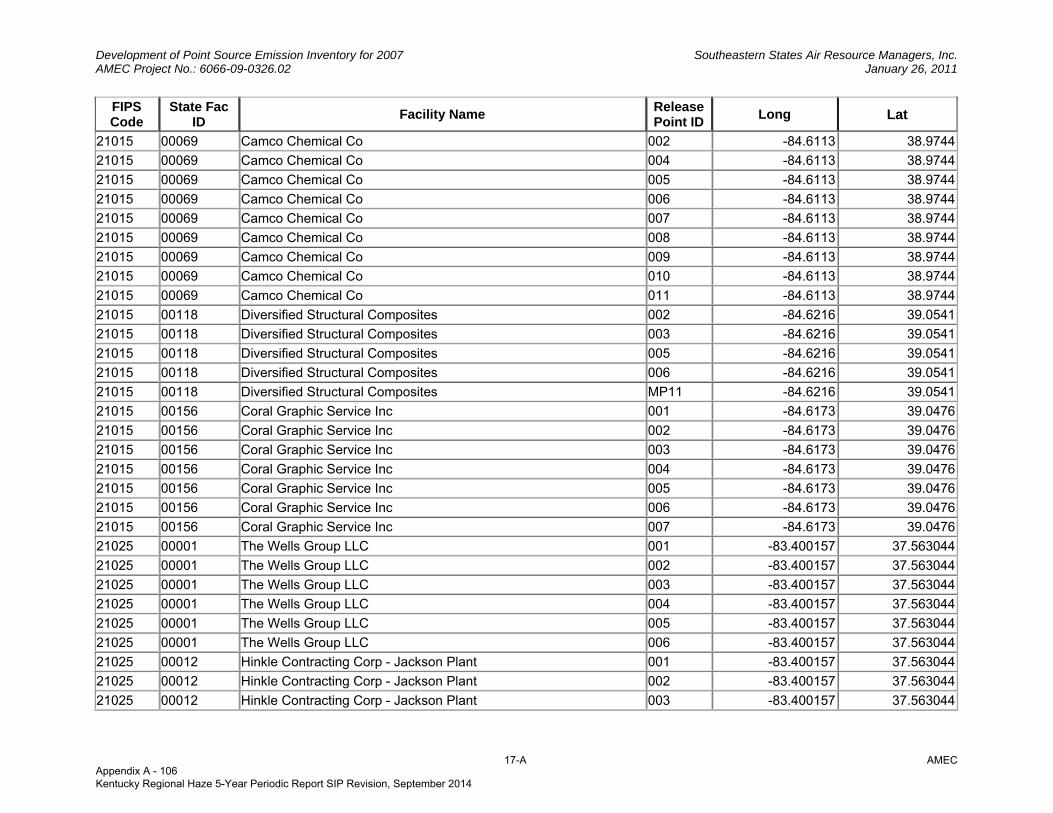
Development of Point Source Emission Inventory for 2007 Southeastern States Air Resource Managers, Inc. AMEC Project No.: 6066-09-0326.02 January 26, 2011
17-A AMEC
FIPS Code
State Fac ID Facility Name Release
Point IDLong Lat
21015 00069 Camco Chemical Co 002 -84.6113 38.9744
21015 00069 Camco Chemical Co 004 -84.6113 38.9744
21015 00069 Camco Chemical Co 005 -84.6113 38.9744
21015 00069 Camco Chemical Co 006 -84.6113 38.9744
21015 00069 Camco Chemical Co 007 -84.6113 38.9744
21015 00069 Camco Chemical Co 008 -84.6113 38.9744
21015 00069 Camco Chemical Co 009 -84.6113 38.9744
21015 00069 Camco Chemical Co 010 -84.6113 38.9744
21015 00069 Camco Chemical Co 011 -84.6113 38.9744
21015 00118 Diversified Structural Composites 002 -84.6216 39.0541
21015 00118 Diversified Structural Composites 003 -84.6216 39.0541
21015 00118 Diversified Structural Composites 005 -84.6216 39.0541
21015 00118 Diversified Structural Composites 006 -84.6216 39.0541
21015 00118 Diversified Structural Composites MP11 -84.6216 39.0541
21015 00156 Coral Graphic Service Inc 001 -84.6173 39.0476
21015 00156 Coral Graphic Service Inc 002 -84.6173 39.0476
21015 00156 Coral Graphic Service Inc 003 -84.6173 39.0476
21015 00156 Coral Graphic Service Inc 004 -84.6173 39.0476
21015 00156 Coral Graphic Service Inc 005 -84.6173 39.0476
21015 00156 Coral Graphic Service Inc 006 -84.6173 39.0476
21015 00156 Coral Graphic Service Inc 007 -84.6173 39.0476
21025 00001 The Wells Group LLC 001 -83.400157 37.563044
21025 00001 The Wells Group LLC 002 -83.400157 37.563044
21025 00001 The Wells Group LLC 003 -83.400157 37.563044
21025 00001 The Wells Group LLC 004 -83.400157 37.563044
21025 00001 The Wells Group LLC 005 -83.400157 37.563044
21025 00001 The Wells Group LLC 006 -83.400157 37.563044
21025 00012 Hinkle Contracting Corp - Jackson Plant 001 -83.400157 37.563044
21025 00012 Hinkle Contracting Corp - Jackson Plant 002 -83.400157 37.563044
21025 00012 Hinkle Contracting Corp - Jackson Plant 003 -83.400157 37.563044
Appendix A - 106 Kentucky Regional Haze 5-Year Periodic Report SIP Revision, September 2014

Development of Point Source Emission Inventory for 2007 Southeastern States Air Resource Managers, Inc. AMEC Project No.: 6066-09-0326.02 January 26, 2011
18-A AMEC
FIPS Code
State Fac ID Facility Name Release
Point IDLong Lat
21025 00033 Begley Properties LLC 001 -83.418283 37.559043
21025 00033 Begley Properties LLC 002 -83.418283 37.559043
21037 00051 Freeport Mcmoran Resource 001 -84.35136 37.030252
21037 00051 Freeport Mcmoran Resource 002 -84.35136 37.030252
21037 00097 DDA Partnership 001 -84.463611 39.116389
21045 00027 TN Gas Pipeline - Dry Creek Transmission Station 001 -85.1109 37.3447
21045 00027 TN Gas Pipeline - Dry Creek Transmission Station 002 -85.1109 37.3447
21045 00028 Casey Furniture Mfg, Llc 001 -84.94523 37.31977
21045 00028 Casey Furniture Mfg, Llc 002 -84.94523 37.31977
21045 00028 Casey Furniture Mfg, Llc 003 -84.94523 37.31977
21045 00028 Casey Furniture Mfg, Llc 004 -84.94523 37.31977
21045 00028 Casey Furniture Mfg, Llc 005 -84.94523 37.31977
21051 00034 Chas Coal LLC - Red Bird Prep Plant 001 -83.53708 36.96845
21051 00034 Chas Coal LLC - Red Bird Prep Plant 002 -83.53708 36.96845
21051 00034 Chas Coal LLC - Red Bird Prep Plant 003 -83.53708 36.96845
21051 00034 Chas Coal LLC - Red Bird Prep Plant 004 -83.53708 36.96845
21057 00005 Albany Redi-Mix 001 -85.36895 36.786998
21057 00005 Albany Redi-Mix 002 -85.36895 36.786998
21057 00005 Albany Redi-Mix 003 -85.36895 36.786998
21071 00154 Chesapeake Appalachia LLC - Warco Transmission Station E01 -82.7772 37.54394
21071 00154 Chesapeake Appalachia LLC - Warco Transmission Station E02 -82.7772 37.54394
21071 00154 Chesapeake Appalachia LLC - Warco Transmission Station E03A -82.7772 37.54394
21071 00154 Chesapeake Appalachia LLC - Warco Transmission Station E03B -82.7772 37.54394
21071 00158 EQT Gathering LLC - Drift Compressor Station 001 -82.7439 37.4758
21071 00158 EQT Gathering LLC - Drift Compressor Station 002 -82.7439 37.4758
21071 00159 EQT Gathering LLC - Maytown Compressor Station 001 -82.7875 37.5353
21071 00159 EQT Gathering LLC - Maytown Compressor Station 002 -82.7875 37.5353
21073 00079 Rogers Group Inc Portable Crush Plant 3 001 -84.873 38.201
21073 00079 Rogers Group Inc Portable Crush Plant 3 002 -84.873 38.201
21073 00079 Rogers Group Inc Portable Crush Plant 3 003 -84.873 38.201
Appendix A - 107 Kentucky Regional Haze 5-Year Periodic Report SIP Revision, September 2014
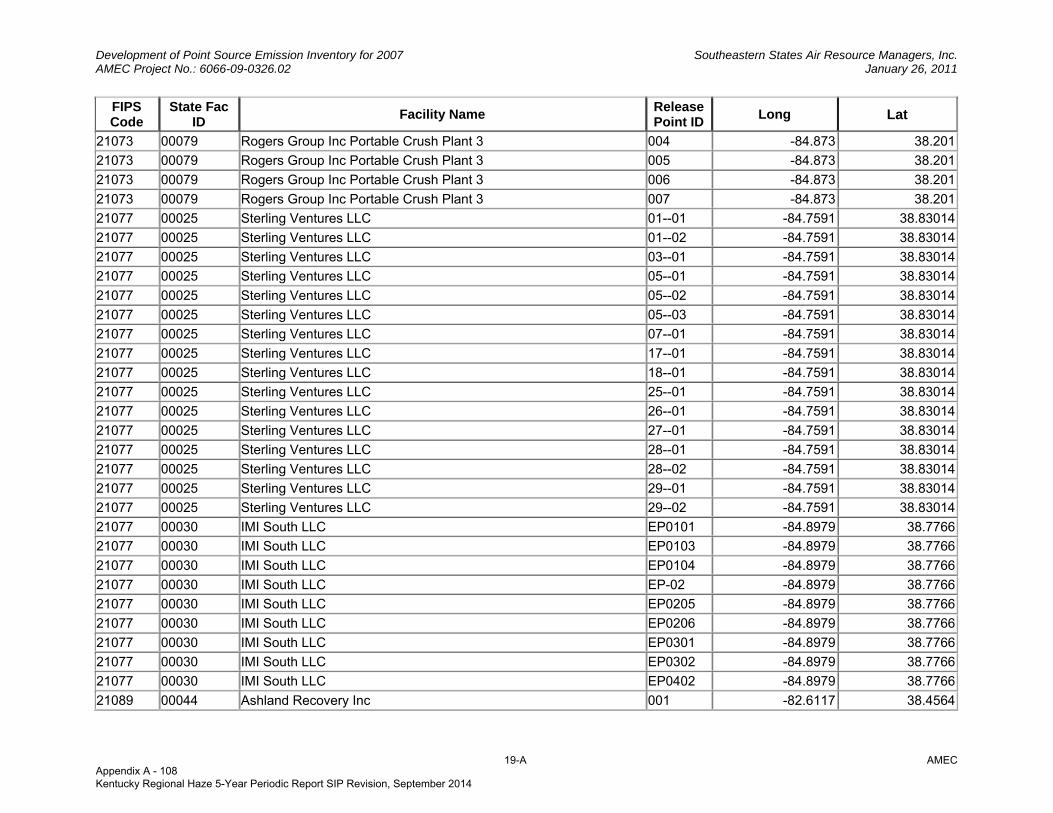
Development of Point Source Emission Inventory for 2007 Southeastern States Air Resource Managers, Inc. AMEC Project No.: 6066-09-0326.02 January 26, 2011
19-A AMEC
FIPS Code
State Fac ID Facility Name Release
Point IDLong Lat
21073 00079 Rogers Group Inc Portable Crush Plant 3 004 -84.873 38.201
21073 00079 Rogers Group Inc Portable Crush Plant 3 005 -84.873 38.201
21073 00079 Rogers Group Inc Portable Crush Plant 3 006 -84.873 38.201
21073 00079 Rogers Group Inc Portable Crush Plant 3 007 -84.873 38.201
21077 00025 Sterling Ventures LLC 01--01 -84.7591 38.83014
21077 00025 Sterling Ventures LLC 01--02 -84.7591 38.83014
21077 00025 Sterling Ventures LLC 03--01 -84.7591 38.83014
21077 00025 Sterling Ventures LLC 05--01 -84.7591 38.83014
21077 00025 Sterling Ventures LLC 05--02 -84.7591 38.83014
21077 00025 Sterling Ventures LLC 05--03 -84.7591 38.83014
21077 00025 Sterling Ventures LLC 07--01 -84.7591 38.83014
21077 00025 Sterling Ventures LLC 17--01 -84.7591 38.83014
21077 00025 Sterling Ventures LLC 18--01 -84.7591 38.83014
21077 00025 Sterling Ventures LLC 25--01 -84.7591 38.83014
21077 00025 Sterling Ventures LLC 26--01 -84.7591 38.83014
21077 00025 Sterling Ventures LLC 27--01 -84.7591 38.83014
21077 00025 Sterling Ventures LLC 28--01 -84.7591 38.83014
21077 00025 Sterling Ventures LLC 28--02 -84.7591 38.83014
21077 00025 Sterling Ventures LLC 29--01 -84.7591 38.83014
21077 00025 Sterling Ventures LLC 29--02 -84.7591 38.83014
21077 00030 IMI South LLC EP0101 -84.8979 38.7766
21077 00030 IMI South LLC EP0103 -84.8979 38.7766
21077 00030 IMI South LLC EP0104 -84.8979 38.7766
21077 00030 IMI South LLC EP-02 -84.8979 38.7766
21077 00030 IMI South LLC EP0205 -84.8979 38.7766
21077 00030 IMI South LLC EP0206 -84.8979 38.7766
21077 00030 IMI South LLC EP0301 -84.8979 38.7766
21077 00030 IMI South LLC EP0302 -84.8979 38.7766
21077 00030 IMI South LLC EP0402 -84.8979 38.7766
21089 00044 Ashland Recovery Inc 001 -82.6117 38.4564
Appendix A - 108 Kentucky Regional Haze 5-Year Periodic Report SIP Revision, September 2014

Development of Point Source Emission Inventory for 2007 Southeastern States Air Resource Managers, Inc. AMEC Project No.: 6066-09-0326.02 January 26, 2011
20-A AMEC
FIPS Code
State Fac ID Facility Name Release
Point IDLong Lat
21089 00044 Ashland Recovery Inc 002 -82.6117 38.4564
21089 00044 Ashland Recovery Inc 003 -82.6117 38.4564
21089 00044 Ashland Recovery Inc 004 -82.6117 38.4564
21089 00044 Ashland Recovery Inc 005 -82.6117 38.4564
21089 00044 Ashland Recovery Inc 006 -82.6117 38.4564
21089 00044 Ashland Recovery Inc 007 -82.6117 38.4564
21091 00026 L. R. Chapman (01) -86.857 37.9005
21091 00026 L. R. Chapman (02) -86.857 37.9005
21091 00026 L. R. Chapman (03) -86.857 37.9005
21091 00026 L. R. Chapman (04) -86.857 37.9005
21091 00026 L. R. Chapman (05) -86.857 37.9005
21091 00026 L. R. Chapman (06) -86.857 37.9005
21091 00026 L. R. Chapman (07) -86.857 37.9005
21091 00026 L. R. Chapman (08) -86.857 37.9005
21091 00026 L. R. Chapman (09) -86.857 37.9005
21091 00026 L. R. Chapman (10) -86.857 37.9005
21091 00026 L. R. Chapman (11) -86.857 37.9005
21091 00026 L. R. Chapman (12) -86.857 37.9005
21091 00026 L. R. Chapman (13) -86.857 37.9005
21091 00026 L. R. Chapman (14) -86.857 37.9005
21091 00026 L. R. Chapman (15) -86.857 37.9005
21091 00026 L. R. Chapman (16) -86.857 37.9005
21091 00026 L. R. Chapman (17) -86.857 37.9005
21091 00026 L. R. Chapman (18) -86.857 37.9005
21091 00026 L. R. Chapman (19) -86.857 37.9005
21091 00026 L. R. Chapman (20) -86.857 37.9005
21091 00026 L. R. Chapman (21) -86.857 37.9005
21091 00026 L. R. Chapman (22) -86.857 37.9005
21091 00026 L. R. Chapman (23) -86.857 37.9005
21091 00026 L. R. Chapman (24) -86.857 37.9005
Appendix A - 109 Kentucky Regional Haze 5-Year Periodic Report SIP Revision, September 2014
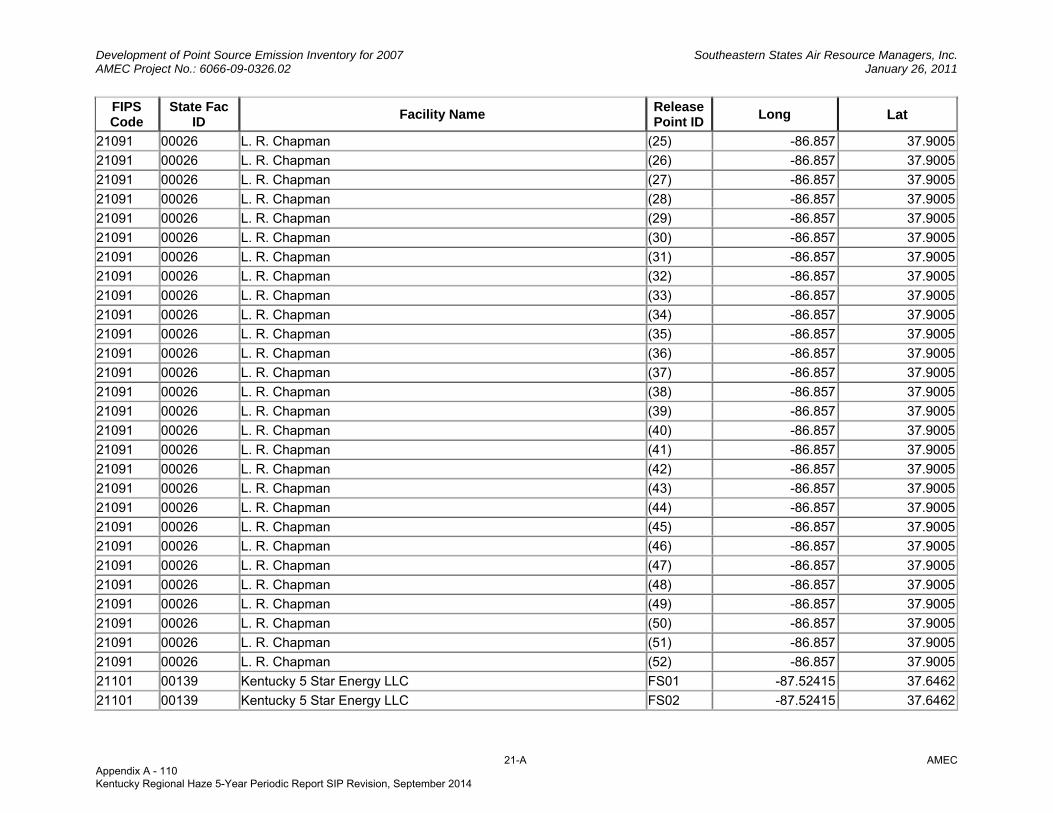
Development of Point Source Emission Inventory for 2007 Southeastern States Air Resource Managers, Inc. AMEC Project No.: 6066-09-0326.02 January 26, 2011
21-A AMEC
FIPS Code
State Fac ID Facility Name Release
Point IDLong Lat
21091 00026 L. R. Chapman (25) -86.857 37.9005
21091 00026 L. R. Chapman (26) -86.857 37.9005
21091 00026 L. R. Chapman (27) -86.857 37.9005
21091 00026 L. R. Chapman (28) -86.857 37.9005
21091 00026 L. R. Chapman (29) -86.857 37.9005
21091 00026 L. R. Chapman (30) -86.857 37.9005
21091 00026 L. R. Chapman (31) -86.857 37.9005
21091 00026 L. R. Chapman (32) -86.857 37.9005
21091 00026 L. R. Chapman (33) -86.857 37.9005
21091 00026 L. R. Chapman (34) -86.857 37.9005
21091 00026 L. R. Chapman (35) -86.857 37.9005
21091 00026 L. R. Chapman (36) -86.857 37.9005
21091 00026 L. R. Chapman (37) -86.857 37.9005
21091 00026 L. R. Chapman (38) -86.857 37.9005
21091 00026 L. R. Chapman (39) -86.857 37.9005
21091 00026 L. R. Chapman (40) -86.857 37.9005
21091 00026 L. R. Chapman (41) -86.857 37.9005
21091 00026 L. R. Chapman (42) -86.857 37.9005
21091 00026 L. R. Chapman (43) -86.857 37.9005
21091 00026 L. R. Chapman (44) -86.857 37.9005
21091 00026 L. R. Chapman (45) -86.857 37.9005
21091 00026 L. R. Chapman (46) -86.857 37.9005
21091 00026 L. R. Chapman (47) -86.857 37.9005
21091 00026 L. R. Chapman (48) -86.857 37.9005
21091 00026 L. R. Chapman (49) -86.857 37.9005
21091 00026 L. R. Chapman (50) -86.857 37.9005
21091 00026 L. R. Chapman (51) -86.857 37.9005
21091 00026 L. R. Chapman (52) -86.857 37.9005
21101 00139 Kentucky 5 Star Energy LLC FS01 -87.52415 37.6462
21101 00139 Kentucky 5 Star Energy LLC FS02 -87.52415 37.6462
Appendix A - 110 Kentucky Regional Haze 5-Year Periodic Report SIP Revision, September 2014
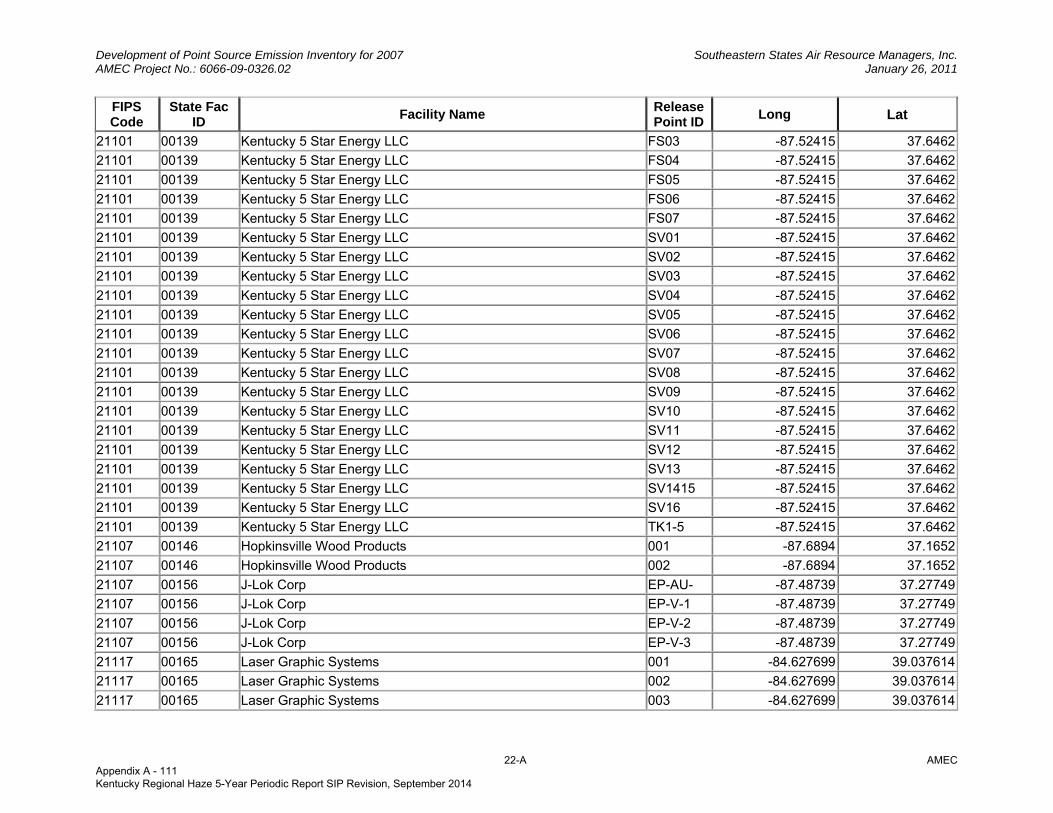
Development of Point Source Emission Inventory for 2007 Southeastern States Air Resource Managers, Inc. AMEC Project No.: 6066-09-0326.02 January 26, 2011
22-A AMEC
FIPS Code
State Fac ID Facility Name Release
Point IDLong Lat
21101 00139 Kentucky 5 Star Energy LLC FS03 -87.52415 37.6462
21101 00139 Kentucky 5 Star Energy LLC FS04 -87.52415 37.6462
21101 00139 Kentucky 5 Star Energy LLC FS05 -87.52415 37.6462
21101 00139 Kentucky 5 Star Energy LLC FS06 -87.52415 37.6462
21101 00139 Kentucky 5 Star Energy LLC FS07 -87.52415 37.6462
21101 00139 Kentucky 5 Star Energy LLC SV01 -87.52415 37.6462
21101 00139 Kentucky 5 Star Energy LLC SV02 -87.52415 37.6462
21101 00139 Kentucky 5 Star Energy LLC SV03 -87.52415 37.6462
21101 00139 Kentucky 5 Star Energy LLC SV04 -87.52415 37.6462
21101 00139 Kentucky 5 Star Energy LLC SV05 -87.52415 37.6462
21101 00139 Kentucky 5 Star Energy LLC SV06 -87.52415 37.6462
21101 00139 Kentucky 5 Star Energy LLC SV07 -87.52415 37.6462
21101 00139 Kentucky 5 Star Energy LLC SV08 -87.52415 37.6462
21101 00139 Kentucky 5 Star Energy LLC SV09 -87.52415 37.6462
21101 00139 Kentucky 5 Star Energy LLC SV10 -87.52415 37.6462
21101 00139 Kentucky 5 Star Energy LLC SV11 -87.52415 37.6462
21101 00139 Kentucky 5 Star Energy LLC SV12 -87.52415 37.6462
21101 00139 Kentucky 5 Star Energy LLC SV13 -87.52415 37.6462
21101 00139 Kentucky 5 Star Energy LLC SV1415 -87.52415 37.6462
21101 00139 Kentucky 5 Star Energy LLC SV16 -87.52415 37.6462
21101 00139 Kentucky 5 Star Energy LLC TK1-5 -87.52415 37.6462
21107 00146 Hopkinsville Wood Products 001 -87.6894 37.1652
21107 00146 Hopkinsville Wood Products 002 -87.6894 37.1652
21107 00156 J-Lok Corp EP-AU- -87.48739 37.27749
21107 00156 J-Lok Corp EP-V-1 -87.48739 37.27749
21107 00156 J-Lok Corp EP-V-2 -87.48739 37.27749
21107 00156 J-Lok Corp EP-V-3 -87.48739 37.27749
21117 00165 Laser Graphic Systems 001 -84.627699 39.037614
21117 00165 Laser Graphic Systems 002 -84.627699 39.037614
21117 00165 Laser Graphic Systems 003 -84.627699 39.037614
Appendix A - 111 Kentucky Regional Haze 5-Year Periodic Report SIP Revision, September 2014
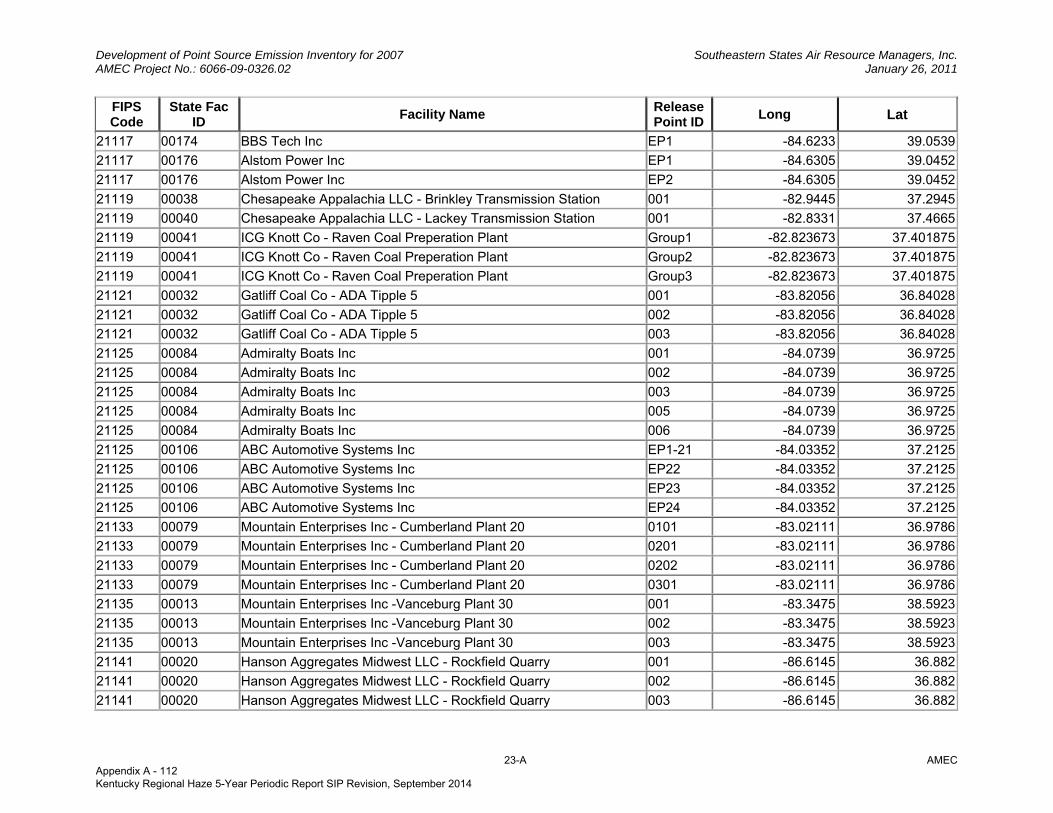
Development of Point Source Emission Inventory for 2007 Southeastern States Air Resource Managers, Inc. AMEC Project No.: 6066-09-0326.02 January 26, 2011
23-A AMEC
FIPS Code
State Fac ID Facility Name Release
Point IDLong Lat
21117 00174 BBS Tech Inc EP1 -84.6233 39.0539
21117 00176 Alstom Power Inc EP1 -84.6305 39.0452
21117 00176 Alstom Power Inc EP2 -84.6305 39.0452
21119 00038 Chesapeake Appalachia LLC - Brinkley Transmission Station 001 -82.9445 37.2945
21119 00040 Chesapeake Appalachia LLC - Lackey Transmission Station 001 -82.8331 37.4665
21119 00041 ICG Knott Co - Raven Coal Preperation Plant Group1 -82.823673 37.401875
21119 00041 ICG Knott Co - Raven Coal Preperation Plant Group2 -82.823673 37.401875
21119 00041 ICG Knott Co - Raven Coal Preperation Plant Group3 -82.823673 37.401875
21121 00032 Gatliff Coal Co - ADA Tipple 5 001 -83.82056 36.84028
21121 00032 Gatliff Coal Co - ADA Tipple 5 002 -83.82056 36.84028
21121 00032 Gatliff Coal Co - ADA Tipple 5 003 -83.82056 36.84028
21125 00084 Admiralty Boats Inc 001 -84.0739 36.9725
21125 00084 Admiralty Boats Inc 002 -84.0739 36.9725
21125 00084 Admiralty Boats Inc 003 -84.0739 36.9725
21125 00084 Admiralty Boats Inc 005 -84.0739 36.9725
21125 00084 Admiralty Boats Inc 006 -84.0739 36.9725
21125 00106 ABC Automotive Systems Inc EP1-21 -84.03352 37.2125
21125 00106 ABC Automotive Systems Inc EP22 -84.03352 37.2125
21125 00106 ABC Automotive Systems Inc EP23 -84.03352 37.2125
21125 00106 ABC Automotive Systems Inc EP24 -84.03352 37.2125
21133 00079 Mountain Enterprises Inc - Cumberland Plant 20 0101 -83.02111 36.9786
21133 00079 Mountain Enterprises Inc - Cumberland Plant 20 0201 -83.02111 36.9786
21133 00079 Mountain Enterprises Inc - Cumberland Plant 20 0202 -83.02111 36.9786
21133 00079 Mountain Enterprises Inc - Cumberland Plant 20 0301 -83.02111 36.9786
21135 00013 Mountain Enterprises Inc -Vanceburg Plant 30 001 -83.3475 38.5923
21135 00013 Mountain Enterprises Inc -Vanceburg Plant 30 002 -83.3475 38.5923
21135 00013 Mountain Enterprises Inc -Vanceburg Plant 30 003 -83.3475 38.5923
21141 00020 Hanson Aggregates Midwest LLC - Rockfield Quarry 001 -86.6145 36.882
21141 00020 Hanson Aggregates Midwest LLC - Rockfield Quarry 002 -86.6145 36.882
21141 00020 Hanson Aggregates Midwest LLC - Rockfield Quarry 003 -86.6145 36.882
Appendix A - 112 Kentucky Regional Haze 5-Year Periodic Report SIP Revision, September 2014
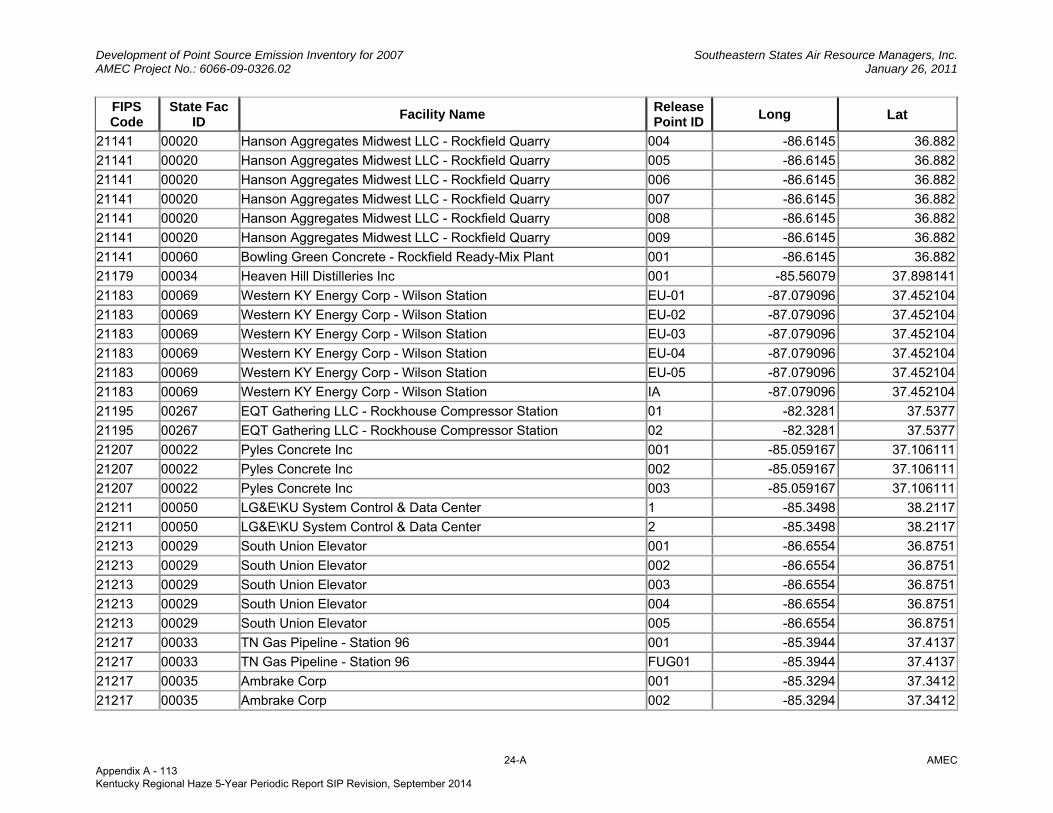
Development of Point Source Emission Inventory for 2007 Southeastern States Air Resource Managers, Inc. AMEC Project No.: 6066-09-0326.02 January 26, 2011
24-A AMEC
FIPS Code
State Fac ID Facility Name Release
Point IDLong Lat
21141 00020 Hanson Aggregates Midwest LLC - Rockfield Quarry 004 -86.6145 36.882
21141 00020 Hanson Aggregates Midwest LLC - Rockfield Quarry 005 -86.6145 36.882
21141 00020 Hanson Aggregates Midwest LLC - Rockfield Quarry 006 -86.6145 36.882
21141 00020 Hanson Aggregates Midwest LLC - Rockfield Quarry 007 -86.6145 36.882
21141 00020 Hanson Aggregates Midwest LLC - Rockfield Quarry 008 -86.6145 36.882
21141 00020 Hanson Aggregates Midwest LLC - Rockfield Quarry 009 -86.6145 36.882
21141 00060 Bowling Green Concrete - Rockfield Ready-Mix Plant 001 -86.6145 36.882
21179 00034 Heaven Hill Distilleries Inc 001 -85.56079 37.898141
21183 00069 Western KY Energy Corp - Wilson Station EU-01 -87.079096 37.452104
21183 00069 Western KY Energy Corp - Wilson Station EU-02 -87.079096 37.452104
21183 00069 Western KY Energy Corp - Wilson Station EU-03 -87.079096 37.452104
21183 00069 Western KY Energy Corp - Wilson Station EU-04 -87.079096 37.452104
21183 00069 Western KY Energy Corp - Wilson Station EU-05 -87.079096 37.452104
21183 00069 Western KY Energy Corp - Wilson Station IA -87.079096 37.452104
21195 00267 EQT Gathering LLC - Rockhouse Compressor Station 01 -82.3281 37.5377
21195 00267 EQT Gathering LLC - Rockhouse Compressor Station 02 -82.3281 37.5377
21207 00022 Pyles Concrete Inc 001 -85.059167 37.106111
21207 00022 Pyles Concrete Inc 002 -85.059167 37.106111
21207 00022 Pyles Concrete Inc 003 -85.059167 37.106111
21211 00050 LG&E\KU System Control & Data Center 1 -85.3498 38.2117
21211 00050 LG&E\KU System Control & Data Center 2 -85.3498 38.2117
21213 00029 South Union Elevator 001 -86.6554 36.8751
21213 00029 South Union Elevator 002 -86.6554 36.8751
21213 00029 South Union Elevator 003 -86.6554 36.8751
21213 00029 South Union Elevator 004 -86.6554 36.8751
21213 00029 South Union Elevator 005 -86.6554 36.8751
21217 00033 TN Gas Pipeline - Station 96 001 -85.3944 37.4137
21217 00033 TN Gas Pipeline - Station 96 FUG01 -85.3944 37.4137
21217 00035 Ambrake Corp 001 -85.3294 37.3412
21217 00035 Ambrake Corp 002 -85.3294 37.3412
Appendix A - 113 Kentucky Regional Haze 5-Year Periodic Report SIP Revision, September 2014
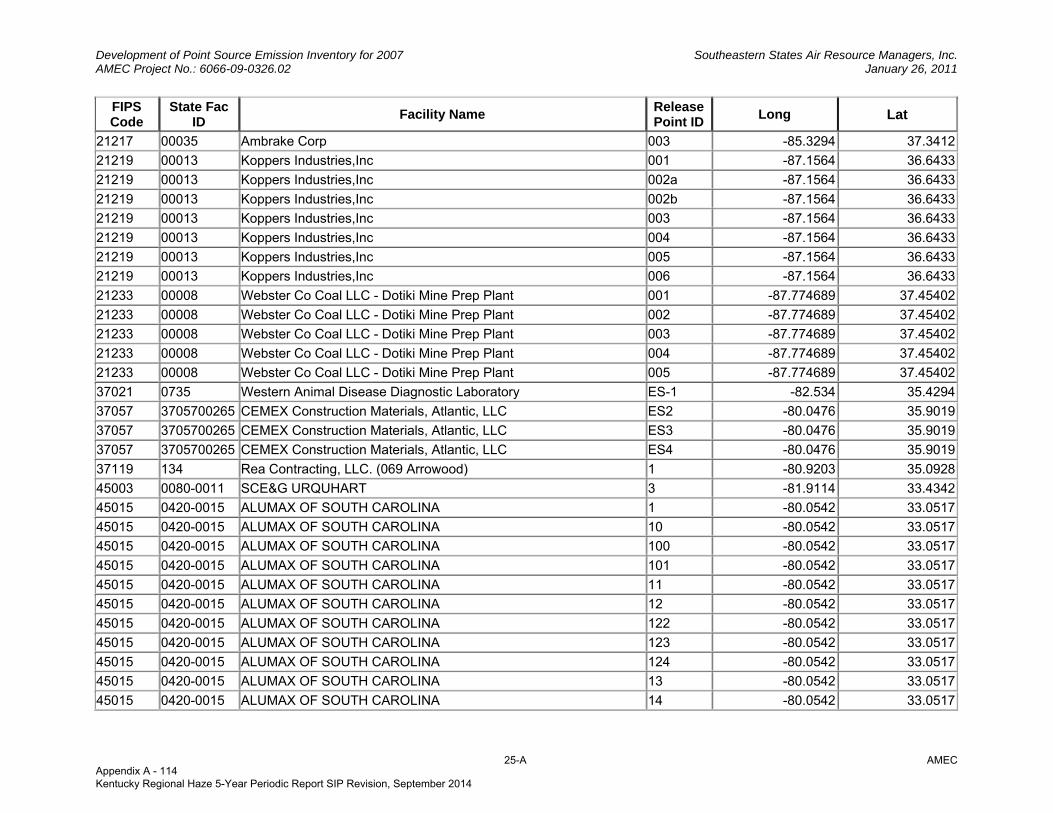
Development of Point Source Emission Inventory for 2007 Southeastern States Air Resource Managers, Inc. AMEC Project No.: 6066-09-0326.02 January 26, 2011
25-A AMEC
FIPS Code
State Fac ID Facility Name Release
Point IDLong Lat
21217 00035 Ambrake Corp 003 -85.3294 37.3412
21219 00013 Koppers Industries,Inc 001 -87.1564 36.6433
21219 00013 Koppers Industries,Inc 002a -87.1564 36.6433
21219 00013 Koppers Industries,Inc 002b -87.1564 36.6433
21219 00013 Koppers Industries,Inc 003 -87.1564 36.6433
21219 00013 Koppers Industries,Inc 004 -87.1564 36.6433
21219 00013 Koppers Industries,Inc 005 -87.1564 36.6433
21219 00013 Koppers Industries,Inc 006 -87.1564 36.6433
21233 00008 Webster Co Coal LLC - Dotiki Mine Prep Plant 001 -87.774689 37.45402
21233 00008 Webster Co Coal LLC - Dotiki Mine Prep Plant 002 -87.774689 37.45402
21233 00008 Webster Co Coal LLC - Dotiki Mine Prep Plant 003 -87.774689 37.45402
21233 00008 Webster Co Coal LLC - Dotiki Mine Prep Plant 004 -87.774689 37.45402
21233 00008 Webster Co Coal LLC - Dotiki Mine Prep Plant 005 -87.774689 37.45402
37021 0735 Western Animal Disease Diagnostic Laboratory ES-1 -82.534 35.4294
37057 3705700265 CEMEX Construction Materials, Atlantic, LLC ES2 -80.0476 35.9019
37057 3705700265 CEMEX Construction Materials, Atlantic, LLC ES3 -80.0476 35.9019
37057 3705700265 CEMEX Construction Materials, Atlantic, LLC ES4 -80.0476 35.9019
37119 134 Rea Contracting, LLC. (069 Arrowood) 1 -80.9203 35.0928
45003 0080-0011 SCE&G URQUHART 3 -81.9114 33.4342
45015 0420-0015 ALUMAX OF SOUTH CAROLINA 1 -80.0542 33.0517
45015 0420-0015 ALUMAX OF SOUTH CAROLINA 10 -80.0542 33.0517
45015 0420-0015 ALUMAX OF SOUTH CAROLINA 100 -80.0542 33.0517
45015 0420-0015 ALUMAX OF SOUTH CAROLINA 101 -80.0542 33.0517
45015 0420-0015 ALUMAX OF SOUTH CAROLINA 11 -80.0542 33.0517
45015 0420-0015 ALUMAX OF SOUTH CAROLINA 12 -80.0542 33.0517
45015 0420-0015 ALUMAX OF SOUTH CAROLINA 122 -80.0542 33.0517
45015 0420-0015 ALUMAX OF SOUTH CAROLINA 123 -80.0542 33.0517
45015 0420-0015 ALUMAX OF SOUTH CAROLINA 124 -80.0542 33.0517
45015 0420-0015 ALUMAX OF SOUTH CAROLINA 13 -80.0542 33.0517
45015 0420-0015 ALUMAX OF SOUTH CAROLINA 14 -80.0542 33.0517
Appendix A - 114 Kentucky Regional Haze 5-Year Periodic Report SIP Revision, September 2014
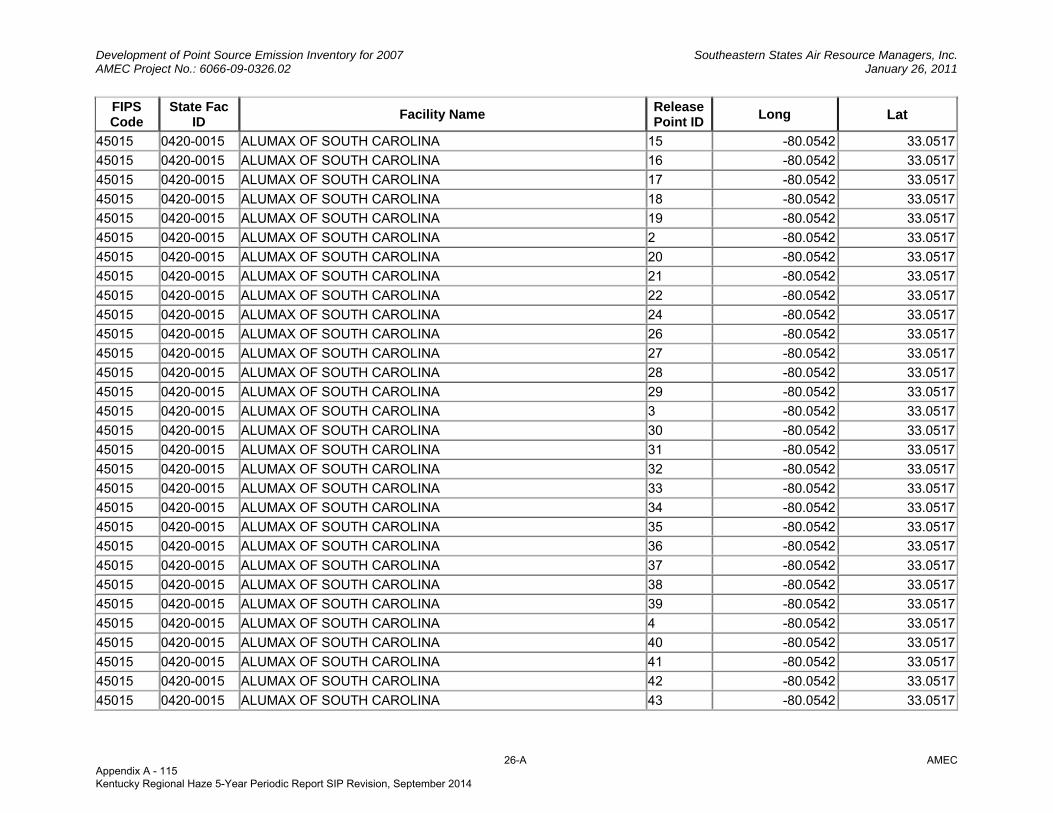
Development of Point Source Emission Inventory for 2007 Southeastern States Air Resource Managers, Inc. AMEC Project No.: 6066-09-0326.02 January 26, 2011
26-A AMEC
FIPS Code
State Fac ID Facility Name Release
Point IDLong Lat
45015 0420-0015 ALUMAX OF SOUTH CAROLINA 15 -80.0542 33.0517
45015 0420-0015 ALUMAX OF SOUTH CAROLINA 16 -80.0542 33.0517
45015 0420-0015 ALUMAX OF SOUTH CAROLINA 17 -80.0542 33.0517
45015 0420-0015 ALUMAX OF SOUTH CAROLINA 18 -80.0542 33.0517
45015 0420-0015 ALUMAX OF SOUTH CAROLINA 19 -80.0542 33.0517
45015 0420-0015 ALUMAX OF SOUTH CAROLINA 2 -80.0542 33.0517
45015 0420-0015 ALUMAX OF SOUTH CAROLINA 20 -80.0542 33.0517
45015 0420-0015 ALUMAX OF SOUTH CAROLINA 21 -80.0542 33.0517
45015 0420-0015 ALUMAX OF SOUTH CAROLINA 22 -80.0542 33.0517
45015 0420-0015 ALUMAX OF SOUTH CAROLINA 24 -80.0542 33.0517
45015 0420-0015 ALUMAX OF SOUTH CAROLINA 26 -80.0542 33.0517
45015 0420-0015 ALUMAX OF SOUTH CAROLINA 27 -80.0542 33.0517
45015 0420-0015 ALUMAX OF SOUTH CAROLINA 28 -80.0542 33.0517
45015 0420-0015 ALUMAX OF SOUTH CAROLINA 29 -80.0542 33.0517
45015 0420-0015 ALUMAX OF SOUTH CAROLINA 3 -80.0542 33.0517
45015 0420-0015 ALUMAX OF SOUTH CAROLINA 30 -80.0542 33.0517
45015 0420-0015 ALUMAX OF SOUTH CAROLINA 31 -80.0542 33.0517
45015 0420-0015 ALUMAX OF SOUTH CAROLINA 32 -80.0542 33.0517
45015 0420-0015 ALUMAX OF SOUTH CAROLINA 33 -80.0542 33.0517
45015 0420-0015 ALUMAX OF SOUTH CAROLINA 34 -80.0542 33.0517
45015 0420-0015 ALUMAX OF SOUTH CAROLINA 35 -80.0542 33.0517
45015 0420-0015 ALUMAX OF SOUTH CAROLINA 36 -80.0542 33.0517
45015 0420-0015 ALUMAX OF SOUTH CAROLINA 37 -80.0542 33.0517
45015 0420-0015 ALUMAX OF SOUTH CAROLINA 38 -80.0542 33.0517
45015 0420-0015 ALUMAX OF SOUTH CAROLINA 39 -80.0542 33.0517
45015 0420-0015 ALUMAX OF SOUTH CAROLINA 4 -80.0542 33.0517
45015 0420-0015 ALUMAX OF SOUTH CAROLINA 40 -80.0542 33.0517
45015 0420-0015 ALUMAX OF SOUTH CAROLINA 41 -80.0542 33.0517
45015 0420-0015 ALUMAX OF SOUTH CAROLINA 42 -80.0542 33.0517
45015 0420-0015 ALUMAX OF SOUTH CAROLINA 43 -80.0542 33.0517
Appendix A - 115 Kentucky Regional Haze 5-Year Periodic Report SIP Revision, September 2014

Development of Point Source Emission Inventory for 2007 Southeastern States Air Resource Managers, Inc. AMEC Project No.: 6066-09-0326.02 January 26, 2011
27-A AMEC
FIPS Code
State Fac ID Facility Name Release
Point IDLong Lat
45015 0420-0015 ALUMAX OF SOUTH CAROLINA 44 -80.0542 33.0517
45015 0420-0015 ALUMAX OF SOUTH CAROLINA 45 -80.0542 33.0517
45015 0420-0015 ALUMAX OF SOUTH CAROLINA 46 -80.0542 33.0517
45015 0420-0015 ALUMAX OF SOUTH CAROLINA 47 -80.0542 33.0517
45015 0420-0015 ALUMAX OF SOUTH CAROLINA 5 -80.0542 33.0517
45015 0420-0015 ALUMAX OF SOUTH CAROLINA 50 -80.0542 33.0517
45015 0420-0015 ALUMAX OF SOUTH CAROLINA 51 -80.0542 33.0517
45015 0420-0015 ALUMAX OF SOUTH CAROLINA 52 -80.0542 33.0517
45015 0420-0015 ALUMAX OF SOUTH CAROLINA 53 -80.0542 33.0517
45015 0420-0015 ALUMAX OF SOUTH CAROLINA 54 -80.0542 33.0517
45015 0420-0015 ALUMAX OF SOUTH CAROLINA 55 -80.0542 33.0517
45015 0420-0015 ALUMAX OF SOUTH CAROLINA 57 -80.0542 33.0517
45015 0420-0015 ALUMAX OF SOUTH CAROLINA 58 -80.0542 33.0517
45015 0420-0015 ALUMAX OF SOUTH CAROLINA 59 -80.0542 33.0517
45015 0420-0015 ALUMAX OF SOUTH CAROLINA 6 -80.0542 33.0517
45015 0420-0015 ALUMAX OF SOUTH CAROLINA 60 -80.0542 33.0517
45015 0420-0015 ALUMAX OF SOUTH CAROLINA 61 -80.0542 33.0517
45015 0420-0015 ALUMAX OF SOUTH CAROLINA 62 -80.0542 33.0517
45015 0420-0015 ALUMAX OF SOUTH CAROLINA 63 -80.0542 33.0517
45015 0420-0015 ALUMAX OF SOUTH CAROLINA 64 -80.0542 33.0517
45015 0420-0015 ALUMAX OF SOUTH CAROLINA 65 -80.0542 33.0517
45015 0420-0015 ALUMAX OF SOUTH CAROLINA 66 -80.0542 33.0517
45015 0420-0015 ALUMAX OF SOUTH CAROLINA 67 -80.0542 33.0517
45015 0420-0015 ALUMAX OF SOUTH CAROLINA 68 -80.0542 33.0517
45015 0420-0015 ALUMAX OF SOUTH CAROLINA 69 -80.0542 33.0517
45015 0420-0015 ALUMAX OF SOUTH CAROLINA 7 -80.0542 33.0517
45015 0420-0015 ALUMAX OF SOUTH CAROLINA 8 -80.0542 33.0517
45015 0420-0015 ALUMAX OF SOUTH CAROLINA 80 -80.0542 33.0517
45015 0420-0015 ALUMAX OF SOUTH CAROLINA 81 -80.0542 33.0517
45015 0420-0015 ALUMAX OF SOUTH CAROLINA 83 -80.0542 33.0517
Appendix A - 116 Kentucky Regional Haze 5-Year Periodic Report SIP Revision, September 2014
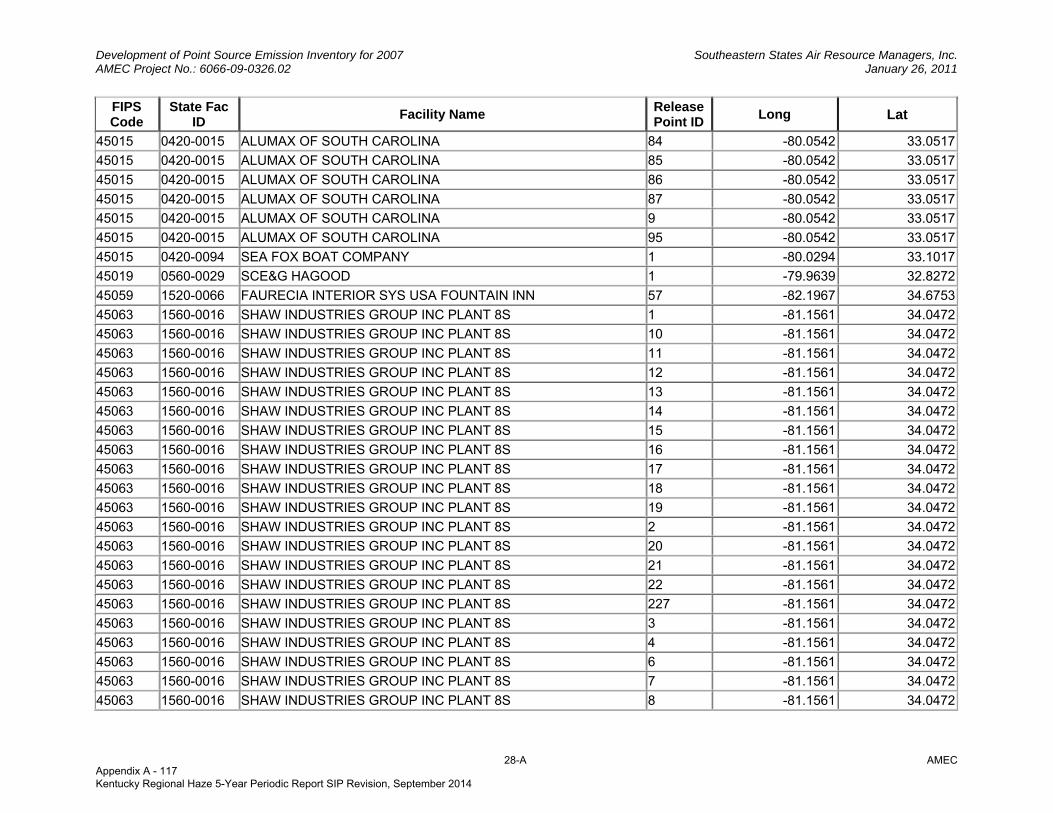
Development of Point Source Emission Inventory for 2007 Southeastern States Air Resource Managers, Inc. AMEC Project No.: 6066-09-0326.02 January 26, 2011
28-A AMEC
FIPS Code
State Fac ID Facility Name Release
Point IDLong Lat
45015 0420-0015 ALUMAX OF SOUTH CAROLINA 84 -80.0542 33.0517
45015 0420-0015 ALUMAX OF SOUTH CAROLINA 85 -80.0542 33.0517
45015 0420-0015 ALUMAX OF SOUTH CAROLINA 86 -80.0542 33.0517
45015 0420-0015 ALUMAX OF SOUTH CAROLINA 87 -80.0542 33.0517
45015 0420-0015 ALUMAX OF SOUTH CAROLINA 9 -80.0542 33.0517
45015 0420-0015 ALUMAX OF SOUTH CAROLINA 95 -80.0542 33.0517
45015 0420-0094 SEA FOX BOAT COMPANY 1 -80.0294 33.1017
45019 0560-0029 SCE&G HAGOOD 1 -79.9639 32.8272
45059 1520-0066 FAURECIA INTERIOR SYS USA FOUNTAIN INN 57 -82.1967 34.6753
45063 1560-0016 SHAW INDUSTRIES GROUP INC PLANT 8S 1 -81.1561 34.0472
45063 1560-0016 SHAW INDUSTRIES GROUP INC PLANT 8S 10 -81.1561 34.0472
45063 1560-0016 SHAW INDUSTRIES GROUP INC PLANT 8S 11 -81.1561 34.0472
45063 1560-0016 SHAW INDUSTRIES GROUP INC PLANT 8S 12 -81.1561 34.0472
45063 1560-0016 SHAW INDUSTRIES GROUP INC PLANT 8S 13 -81.1561 34.0472
45063 1560-0016 SHAW INDUSTRIES GROUP INC PLANT 8S 14 -81.1561 34.0472
45063 1560-0016 SHAW INDUSTRIES GROUP INC PLANT 8S 15 -81.1561 34.0472
45063 1560-0016 SHAW INDUSTRIES GROUP INC PLANT 8S 16 -81.1561 34.0472
45063 1560-0016 SHAW INDUSTRIES GROUP INC PLANT 8S 17 -81.1561 34.0472
45063 1560-0016 SHAW INDUSTRIES GROUP INC PLANT 8S 18 -81.1561 34.0472
45063 1560-0016 SHAW INDUSTRIES GROUP INC PLANT 8S 19 -81.1561 34.0472
45063 1560-0016 SHAW INDUSTRIES GROUP INC PLANT 8S 2 -81.1561 34.0472
45063 1560-0016 SHAW INDUSTRIES GROUP INC PLANT 8S 20 -81.1561 34.0472
45063 1560-0016 SHAW INDUSTRIES GROUP INC PLANT 8S 21 -81.1561 34.0472
45063 1560-0016 SHAW INDUSTRIES GROUP INC PLANT 8S 22 -81.1561 34.0472
45063 1560-0016 SHAW INDUSTRIES GROUP INC PLANT 8S 227 -81.1561 34.0472
45063 1560-0016 SHAW INDUSTRIES GROUP INC PLANT 8S 3 -81.1561 34.0472
45063 1560-0016 SHAW INDUSTRIES GROUP INC PLANT 8S 4 -81.1561 34.0472
45063 1560-0016 SHAW INDUSTRIES GROUP INC PLANT 8S 6 -81.1561 34.0472
45063 1560-0016 SHAW INDUSTRIES GROUP INC PLANT 8S 7 -81.1561 34.0472
45063 1560-0016 SHAW INDUSTRIES GROUP INC PLANT 8S 8 -81.1561 34.0472
Appendix A - 117 Kentucky Regional Haze 5-Year Periodic Report SIP Revision, September 2014

Development of Point Source Emission Inventory for 2007 Southeastern States Air Resource Managers, Inc. AMEC Project No.: 6066-09-0326.02 January 26, 2011
29-A AMEC
FIPS Code
State Fac ID Facility Name Release
Point IDLong Lat
45063 1560-0016 SHAW INDUSTRIES GROUP INC PLANT 8S 9 -81.1561 34.0472
45081 1940-0007 SIMPSON LBR CO JOHNSTON LBR MILL 1 -81.8242 33.9056
45081 1940-0007 SIMPSON LBR CO JOHNSTON LBR MILL 2 -81.8242 33.9056
45081 1940-0007 SIMPSON LBR CO JOHNSTON LBR MILL 6 -81.8242 33.9056
45081 1940-0007 SIMPSON LBR CO JOHNSTON LBR MILL 7 -81.8242 33.9056
47009 0176 USI, INC. SPB-1 -83.933361 35.866532
47009 0176 USI, INC. SPB-2 -83.933361 35.866532
47009 0176 USI, INC. SPB-3 -83.933361 35.866532
47009 0176 USI, INC. SPB-4 -83.933361 35.866532
47009 0176 USI, INC. SPB-5 -83.933361 35.866532
47009 0176 USI, INC. SPB-6 -83.933361 35.866532
47011 0215 ARCH CHEMICALS, INC. H-12V -84.78349 35.302237
47011 0215 ARCH CHEMICALS, INC. H-13E -84.78349 35.302237
47011 0215 ARCH CHEMICALS, INC. H-1E -84.78349 35.302237
47011 0215 ARCH CHEMICALS, INC. H-2E -84.78349 35.302237
47011 0215 ARCH CHEMICALS, INC. H-3E -84.78349 35.302237
47011 0215 ARCH CHEMICALS, INC. H-5E -84.78349 35.302237
47011 0215 ARCH CHEMICALS, INC. H-7E -84.78349 35.302237
47011 0215 ARCH CHEMICALS, INC. H-89BH -84.78349 35.302237
47011 0215 ARCH CHEMICALS, INC. H-8BH -84.78349 35.302237
47011 0215 ARCH CHEMICALS, INC. H-9BH -84.78349 35.302237
47011 0215 ARCH CHEMICALS, INC. H-P10 -84.78349 35.302237
47011 0215 ARCH CHEMICALS, INC. H-P11 -84.78349 35.302237
47017 0012 NORANDAL USA, INC. 801HD -88.381931 36.01828
47017 0012 NORANDAL USA, INC. 801MR -88.381931 36.01828
47017 0012 NORANDAL USA, INC. 802HD -88.381931 36.01828
47017 0012 NORANDAL USA, INC. 802M -88.381931 36.01828
47017 0012 NORANDAL USA, INC. 803HD -88.381931 36.01828
47017 0012 NORANDAL USA, INC. 803M -88.381931 36.01828
47017 0012 NORANDAL USA, INC. 804HD -88.381931 36.01828
Appendix A - 118 Kentucky Regional Haze 5-Year Periodic Report SIP Revision, September 2014
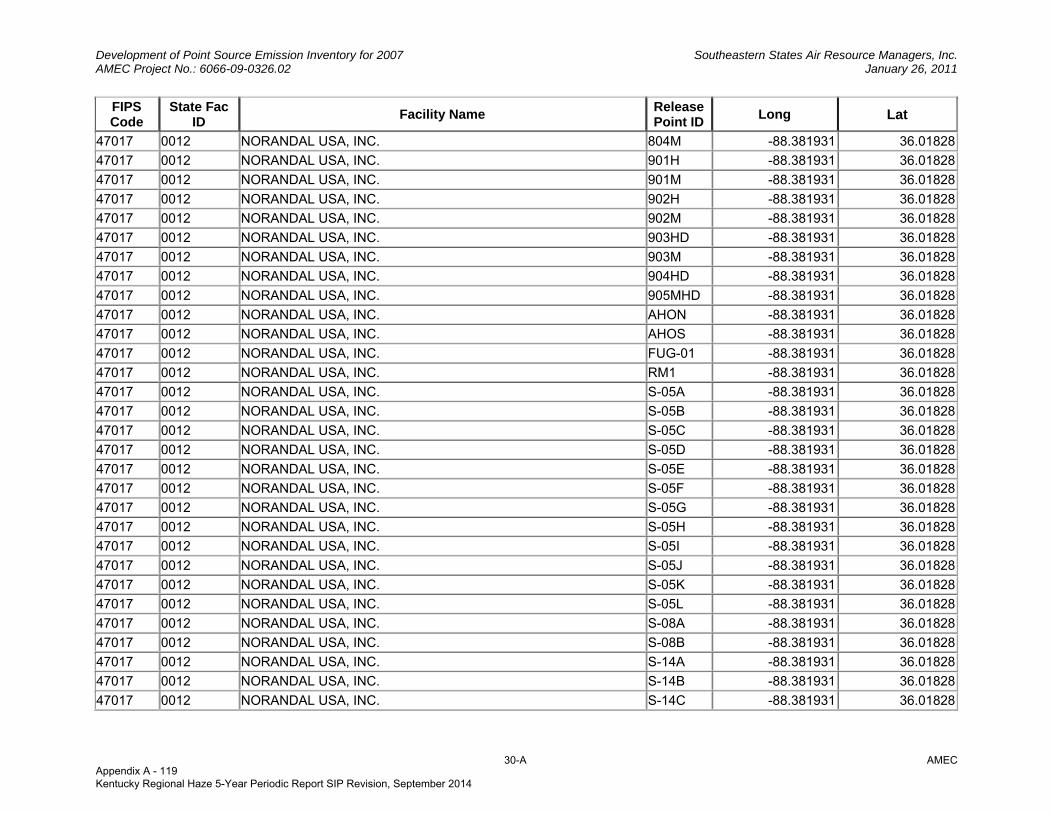
Development of Point Source Emission Inventory for 2007 Southeastern States Air Resource Managers, Inc. AMEC Project No.: 6066-09-0326.02 January 26, 2011
30-A AMEC
FIPS Code
State Fac ID Facility Name Release
Point IDLong Lat
47017 0012 NORANDAL USA, INC. 804M -88.381931 36.01828
47017 0012 NORANDAL USA, INC. 901H -88.381931 36.01828
47017 0012 NORANDAL USA, INC. 901M -88.381931 36.01828
47017 0012 NORANDAL USA, INC. 902H -88.381931 36.01828
47017 0012 NORANDAL USA, INC. 902M -88.381931 36.01828
47017 0012 NORANDAL USA, INC. 903HD -88.381931 36.01828
47017 0012 NORANDAL USA, INC. 903M -88.381931 36.01828
47017 0012 NORANDAL USA, INC. 904HD -88.381931 36.01828
47017 0012 NORANDAL USA, INC. 905MHD -88.381931 36.01828
47017 0012 NORANDAL USA, INC. AHON -88.381931 36.01828
47017 0012 NORANDAL USA, INC. AHOS -88.381931 36.01828
47017 0012 NORANDAL USA, INC. FUG-01 -88.381931 36.01828
47017 0012 NORANDAL USA, INC. RM1 -88.381931 36.01828
47017 0012 NORANDAL USA, INC. S-05A -88.381931 36.01828
47017 0012 NORANDAL USA, INC. S-05B -88.381931 36.01828
47017 0012 NORANDAL USA, INC. S-05C -88.381931 36.01828
47017 0012 NORANDAL USA, INC. S-05D -88.381931 36.01828
47017 0012 NORANDAL USA, INC. S-05E -88.381931 36.01828
47017 0012 NORANDAL USA, INC. S-05F -88.381931 36.01828
47017 0012 NORANDAL USA, INC. S-05G -88.381931 36.01828
47017 0012 NORANDAL USA, INC. S-05H -88.381931 36.01828
47017 0012 NORANDAL USA, INC. S-05I -88.381931 36.01828
47017 0012 NORANDAL USA, INC. S-05J -88.381931 36.01828
47017 0012 NORANDAL USA, INC. S-05K -88.381931 36.01828
47017 0012 NORANDAL USA, INC. S-05L -88.381931 36.01828
47017 0012 NORANDAL USA, INC. S-08A -88.381931 36.01828
47017 0012 NORANDAL USA, INC. S-08B -88.381931 36.01828
47017 0012 NORANDAL USA, INC. S-14A -88.381931 36.01828
47017 0012 NORANDAL USA, INC. S-14B -88.381931 36.01828
47017 0012 NORANDAL USA, INC. S-14C -88.381931 36.01828
Appendix A - 119 Kentucky Regional Haze 5-Year Periodic Report SIP Revision, September 2014
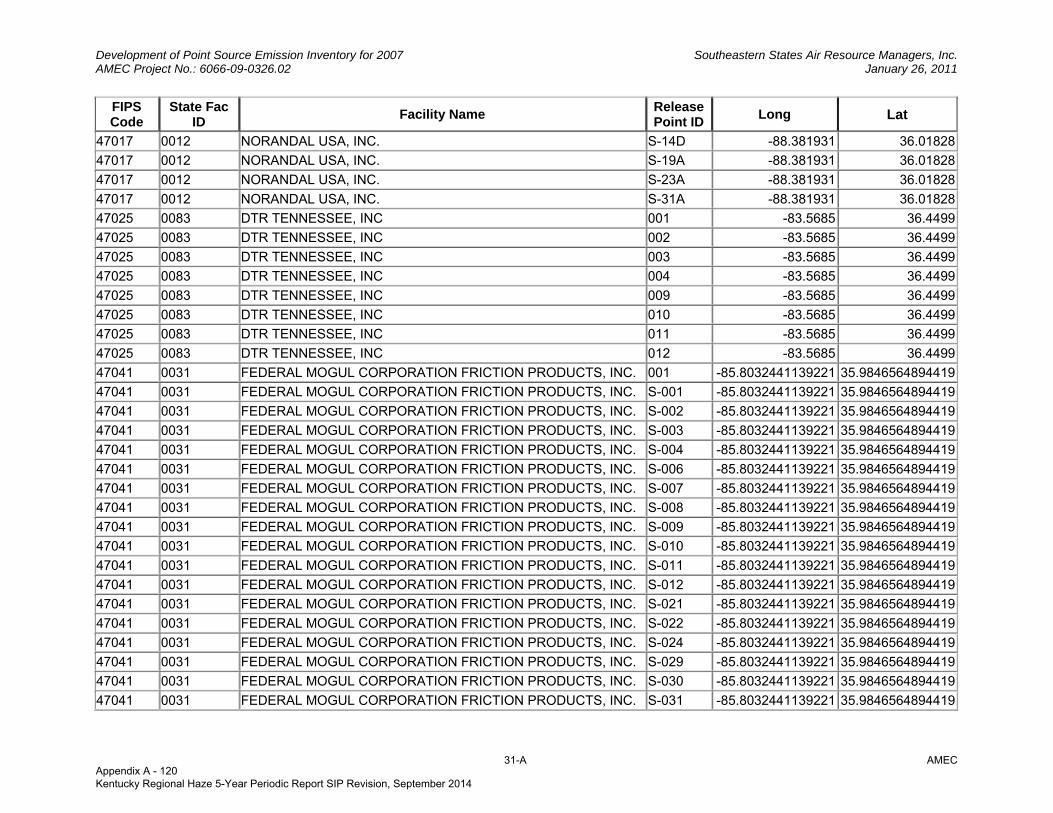
Development of Point Source Emission Inventory for 2007 Southeastern States Air Resource Managers, Inc. AMEC Project No.: 6066-09-0326.02 January 26, 2011
31-A AMEC
FIPS Code
State Fac ID Facility Name Release
Point IDLong Lat
47017 0012 NORANDAL USA, INC. S-14D -88.381931 36.01828
47017 0012 NORANDAL USA, INC. S-19A -88.381931 36.01828
47017 0012 NORANDAL USA, INC. S-23A -88.381931 36.01828
47017 0012 NORANDAL USA, INC. S-31A -88.381931 36.01828
47025 0083 DTR TENNESSEE, INC 001 -83.5685 36.4499
47025 0083 DTR TENNESSEE, INC 002 -83.5685 36.4499
47025 0083 DTR TENNESSEE, INC 003 -83.5685 36.4499
47025 0083 DTR TENNESSEE, INC 004 -83.5685 36.4499
47025 0083 DTR TENNESSEE, INC 009 -83.5685 36.4499
47025 0083 DTR TENNESSEE, INC 010 -83.5685 36.4499
47025 0083 DTR TENNESSEE, INC 011 -83.5685 36.4499
47025 0083 DTR TENNESSEE, INC 012 -83.5685 36.4499
47041 0031 FEDERAL MOGUL CORPORATION FRICTION PRODUCTS, INC. 001 -85.8032441139221 35.9846564894419
47041 0031 FEDERAL MOGUL CORPORATION FRICTION PRODUCTS, INC. S-001 -85.8032441139221 35.9846564894419
47041 0031 FEDERAL MOGUL CORPORATION FRICTION PRODUCTS, INC. S-002 -85.8032441139221 35.9846564894419
47041 0031 FEDERAL MOGUL CORPORATION FRICTION PRODUCTS, INC. S-003 -85.8032441139221 35.9846564894419
47041 0031 FEDERAL MOGUL CORPORATION FRICTION PRODUCTS, INC. S-004 -85.8032441139221 35.9846564894419
47041 0031 FEDERAL MOGUL CORPORATION FRICTION PRODUCTS, INC. S-006 -85.8032441139221 35.9846564894419
47041 0031 FEDERAL MOGUL CORPORATION FRICTION PRODUCTS, INC. S-007 -85.8032441139221 35.9846564894419
47041 0031 FEDERAL MOGUL CORPORATION FRICTION PRODUCTS, INC. S-008 -85.8032441139221 35.9846564894419
47041 0031 FEDERAL MOGUL CORPORATION FRICTION PRODUCTS, INC. S-009 -85.8032441139221 35.9846564894419
47041 0031 FEDERAL MOGUL CORPORATION FRICTION PRODUCTS, INC. S-010 -85.8032441139221 35.9846564894419
47041 0031 FEDERAL MOGUL CORPORATION FRICTION PRODUCTS, INC. S-011 -85.8032441139221 35.9846564894419
47041 0031 FEDERAL MOGUL CORPORATION FRICTION PRODUCTS, INC. S-012 -85.8032441139221 35.9846564894419
47041 0031 FEDERAL MOGUL CORPORATION FRICTION PRODUCTS, INC. S-021 -85.8032441139221 35.9846564894419
47041 0031 FEDERAL MOGUL CORPORATION FRICTION PRODUCTS, INC. S-022 -85.8032441139221 35.9846564894419
47041 0031 FEDERAL MOGUL CORPORATION FRICTION PRODUCTS, INC. S-024 -85.8032441139221 35.9846564894419
47041 0031 FEDERAL MOGUL CORPORATION FRICTION PRODUCTS, INC. S-029 -85.8032441139221 35.9846564894419
47041 0031 FEDERAL MOGUL CORPORATION FRICTION PRODUCTS, INC. S-030 -85.8032441139221 35.9846564894419
47041 0031 FEDERAL MOGUL CORPORATION FRICTION PRODUCTS, INC. S-031 -85.8032441139221 35.9846564894419
Appendix A - 120 Kentucky Regional Haze 5-Year Periodic Report SIP Revision, September 2014
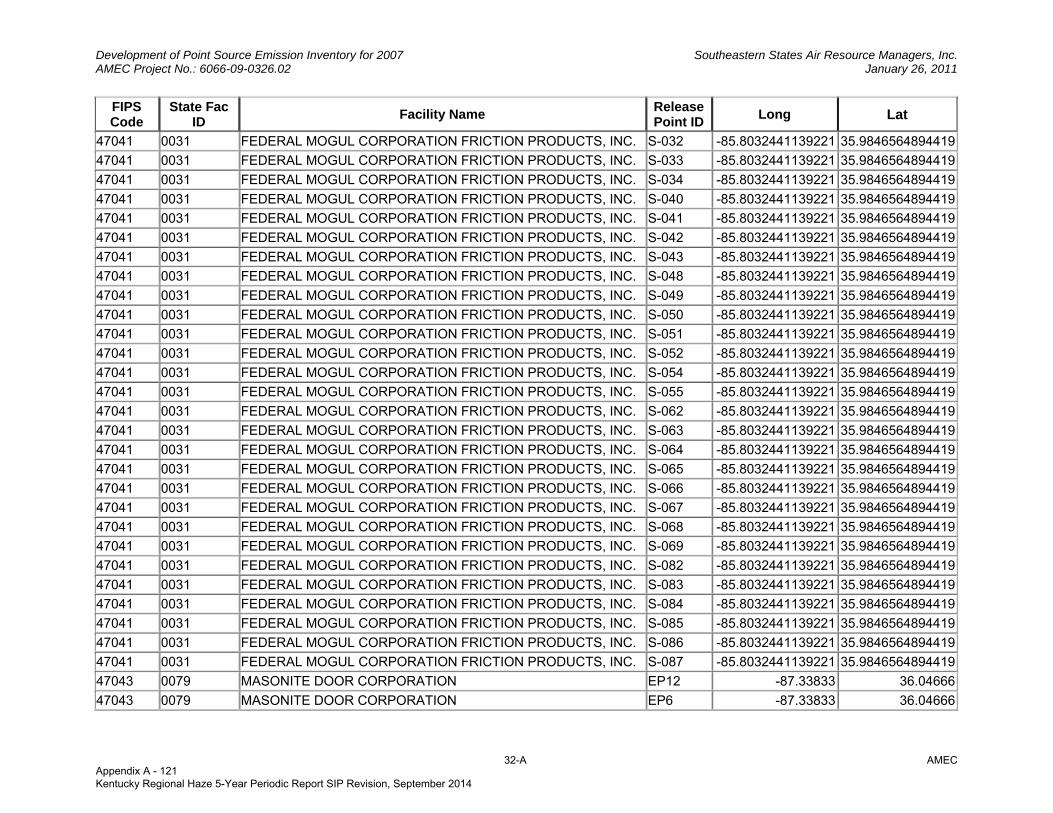
Development of Point Source Emission Inventory for 2007 Southeastern States Air Resource Managers, Inc. AMEC Project No.: 6066-09-0326.02 January 26, 2011
32-A AMEC
FIPS Code
State Fac ID Facility Name Release
Point IDLong Lat
47041 0031 FEDERAL MOGUL CORPORATION FRICTION PRODUCTS, INC. S-032 -85.8032441139221 35.9846564894419
47041 0031 FEDERAL MOGUL CORPORATION FRICTION PRODUCTS, INC. S-033 -85.8032441139221 35.9846564894419
47041 0031 FEDERAL MOGUL CORPORATION FRICTION PRODUCTS, INC. S-034 -85.8032441139221 35.9846564894419
47041 0031 FEDERAL MOGUL CORPORATION FRICTION PRODUCTS, INC. S-040 -85.8032441139221 35.9846564894419
47041 0031 FEDERAL MOGUL CORPORATION FRICTION PRODUCTS, INC. S-041 -85.8032441139221 35.9846564894419
47041 0031 FEDERAL MOGUL CORPORATION FRICTION PRODUCTS, INC. S-042 -85.8032441139221 35.9846564894419
47041 0031 FEDERAL MOGUL CORPORATION FRICTION PRODUCTS, INC. S-043 -85.8032441139221 35.9846564894419
47041 0031 FEDERAL MOGUL CORPORATION FRICTION PRODUCTS, INC. S-048 -85.8032441139221 35.9846564894419
47041 0031 FEDERAL MOGUL CORPORATION FRICTION PRODUCTS, INC. S-049 -85.8032441139221 35.9846564894419
47041 0031 FEDERAL MOGUL CORPORATION FRICTION PRODUCTS, INC. S-050 -85.8032441139221 35.9846564894419
47041 0031 FEDERAL MOGUL CORPORATION FRICTION PRODUCTS, INC. S-051 -85.8032441139221 35.9846564894419
47041 0031 FEDERAL MOGUL CORPORATION FRICTION PRODUCTS, INC. S-052 -85.8032441139221 35.9846564894419
47041 0031 FEDERAL MOGUL CORPORATION FRICTION PRODUCTS, INC. S-054 -85.8032441139221 35.9846564894419
47041 0031 FEDERAL MOGUL CORPORATION FRICTION PRODUCTS, INC. S-055 -85.8032441139221 35.9846564894419
47041 0031 FEDERAL MOGUL CORPORATION FRICTION PRODUCTS, INC. S-062 -85.8032441139221 35.9846564894419
47041 0031 FEDERAL MOGUL CORPORATION FRICTION PRODUCTS, INC. S-063 -85.8032441139221 35.9846564894419
47041 0031 FEDERAL MOGUL CORPORATION FRICTION PRODUCTS, INC. S-064 -85.8032441139221 35.9846564894419
47041 0031 FEDERAL MOGUL CORPORATION FRICTION PRODUCTS, INC. S-065 -85.8032441139221 35.9846564894419
47041 0031 FEDERAL MOGUL CORPORATION FRICTION PRODUCTS, INC. S-066 -85.8032441139221 35.9846564894419
47041 0031 FEDERAL MOGUL CORPORATION FRICTION PRODUCTS, INC. S-067 -85.8032441139221 35.9846564894419
47041 0031 FEDERAL MOGUL CORPORATION FRICTION PRODUCTS, INC. S-068 -85.8032441139221 35.9846564894419
47041 0031 FEDERAL MOGUL CORPORATION FRICTION PRODUCTS, INC. S-069 -85.8032441139221 35.9846564894419
47041 0031 FEDERAL MOGUL CORPORATION FRICTION PRODUCTS, INC. S-082 -85.8032441139221 35.9846564894419
47041 0031 FEDERAL MOGUL CORPORATION FRICTION PRODUCTS, INC. S-083 -85.8032441139221 35.9846564894419
47041 0031 FEDERAL MOGUL CORPORATION FRICTION PRODUCTS, INC. S-084 -85.8032441139221 35.9846564894419
47041 0031 FEDERAL MOGUL CORPORATION FRICTION PRODUCTS, INC. S-085 -85.8032441139221 35.9846564894419
47041 0031 FEDERAL MOGUL CORPORATION FRICTION PRODUCTS, INC. S-086 -85.8032441139221 35.9846564894419
47041 0031 FEDERAL MOGUL CORPORATION FRICTION PRODUCTS, INC. S-087 -85.8032441139221 35.9846564894419
47043 0079 MASONITE DOOR CORPORATION EP12 -87.33833 36.04666
47043 0079 MASONITE DOOR CORPORATION EP6 -87.33833 36.04666
Appendix A - 121 Kentucky Regional Haze 5-Year Periodic Report SIP Revision, September 2014

Development of Point Source Emission Inventory for 2007 Southeastern States Air Resource Managers, Inc. AMEC Project No.: 6066-09-0326.02 January 26, 2011
33-A AMEC
FIPS Code
State Fac ID Facility Name Release
Point IDLong Lat
47043 0079 MASONITE DOOR CORPORATION FUG1 -87.33833 36.04666
47059 0165 DELFASCO OF TENNESSEE 141-02 -82.777154 36.201447
47059 0165 DELFASCO OF TENNESSEE 165-1A -82.777154 36.201447
47059 0165 DELFASCO OF TENNESSEE 165-1B -82.777154 36.201447
47059 0165 DELFASCO OF TENNESSEE 165-1C -82.777154 36.201447
47059 0165 DELFASCO OF TENNESSEE 165-1D -82.777154 36.201447
47073 0001 HOLLISTON MILLS, INC. C1A -82.7581 36.51216
47073 0001 HOLLISTON MILLS, INC. C1W -82.7581 36.51216
47073 0001 HOLLISTON MILLS, INC. E19F -82.7581 36.51216
47073 0001 HOLLISTON MILLS, INC. E4F -82.7581 36.51216
47073 0001 HOLLISTON MILLS, INC. E53F -82.7581 36.51216
47073 0001 HOLLISTON MILLS, INC. E5F -82.7581 36.51216
47073 0001 HOLLISTON MILLS, INC. E61F -82.7581 36.51216
47073 0001 HOLLISTON MILLS, INC. E9F -82.7581 36.51216
47073 0001 HOLLISTON MILLS, INC. F1M -82.7581 36.51216
47073 0001 HOLLISTON MILLS, INC. F2M -82.7581 36.51216
47073 0001 HOLLISTON MILLS, INC. P10A -82.7581 36.51216
47073 0001 HOLLISTON MILLS, INC. P10F -82.7581 36.51216
47073 0001 HOLLISTON MILLS, INC. P11A -82.7581 36.51216
47073 0001 HOLLISTON MILLS, INC. P11AF -82.7581 36.51216
47073 0001 HOLLISTON MILLS, INC. P11F -82.7581 36.51216
47073 0001 HOLLISTON MILLS, INC. P12A -82.7581 36.51216
47073 0001 HOLLISTON MILLS, INC. P12F -82.7581 36.51216
47073 0001 HOLLISTON MILLS, INC. P13F -82.7581 36.51216
47073 0001 HOLLISTON MILLS, INC. P14F -82.7581 36.51216
47073 0001 HOLLISTON MILLS, INC. P15F -82.7581 36.51216
47073 0001 HOLLISTON MILLS, INC. P16F -82.7581 36.51216
47073 0001 HOLLISTON MILLS, INC. P17F -82.7581 36.51216
47073 0001 HOLLISTON MILLS, INC. P19F -82.7581 36.51216
47073 0001 HOLLISTON MILLS, INC. P1A -82.7581 36.51216
Appendix A - 122 Kentucky Regional Haze 5-Year Periodic Report SIP Revision, September 2014
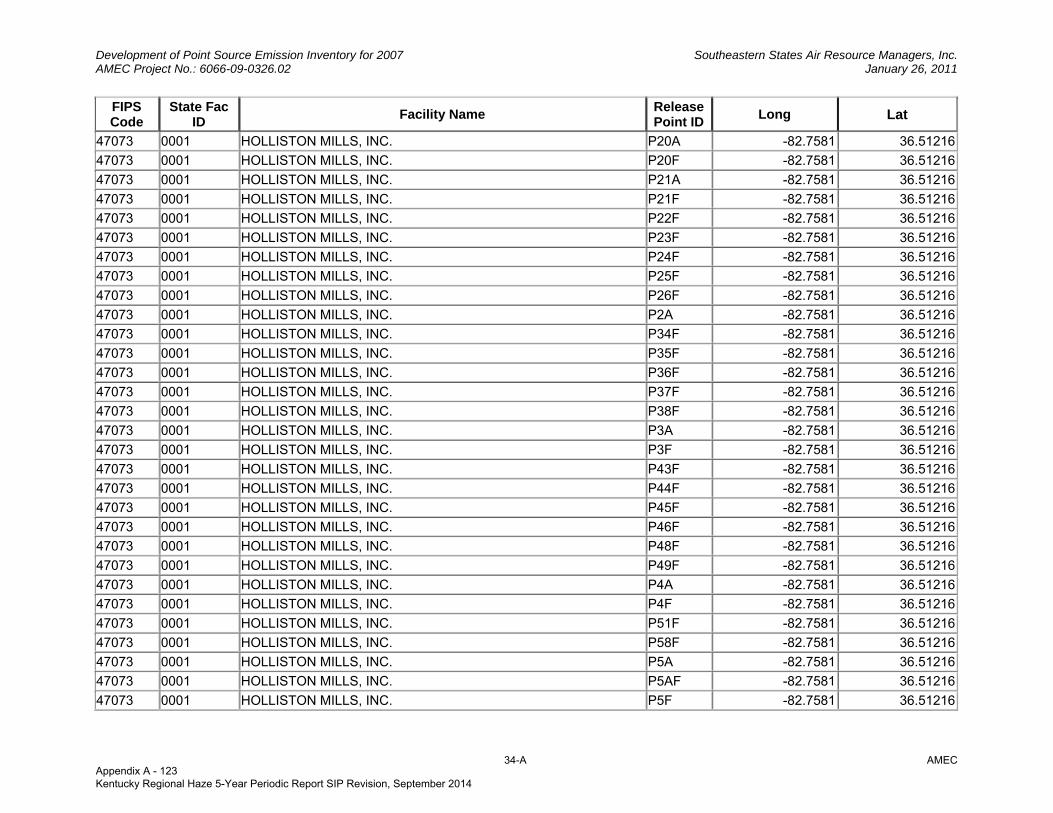
Development of Point Source Emission Inventory for 2007 Southeastern States Air Resource Managers, Inc. AMEC Project No.: 6066-09-0326.02 January 26, 2011
34-A AMEC
FIPS Code
State Fac ID Facility Name Release
Point IDLong Lat
47073 0001 HOLLISTON MILLS, INC. P20A -82.7581 36.51216
47073 0001 HOLLISTON MILLS, INC. P20F -82.7581 36.51216
47073 0001 HOLLISTON MILLS, INC. P21A -82.7581 36.51216
47073 0001 HOLLISTON MILLS, INC. P21F -82.7581 36.51216
47073 0001 HOLLISTON MILLS, INC. P22F -82.7581 36.51216
47073 0001 HOLLISTON MILLS, INC. P23F -82.7581 36.51216
47073 0001 HOLLISTON MILLS, INC. P24F -82.7581 36.51216
47073 0001 HOLLISTON MILLS, INC. P25F -82.7581 36.51216
47073 0001 HOLLISTON MILLS, INC. P26F -82.7581 36.51216
47073 0001 HOLLISTON MILLS, INC. P2A -82.7581 36.51216
47073 0001 HOLLISTON MILLS, INC. P34F -82.7581 36.51216
47073 0001 HOLLISTON MILLS, INC. P35F -82.7581 36.51216
47073 0001 HOLLISTON MILLS, INC. P36F -82.7581 36.51216
47073 0001 HOLLISTON MILLS, INC. P37F -82.7581 36.51216
47073 0001 HOLLISTON MILLS, INC. P38F -82.7581 36.51216
47073 0001 HOLLISTON MILLS, INC. P3A -82.7581 36.51216
47073 0001 HOLLISTON MILLS, INC. P3F -82.7581 36.51216
47073 0001 HOLLISTON MILLS, INC. P43F -82.7581 36.51216
47073 0001 HOLLISTON MILLS, INC. P44F -82.7581 36.51216
47073 0001 HOLLISTON MILLS, INC. P45F -82.7581 36.51216
47073 0001 HOLLISTON MILLS, INC. P46F -82.7581 36.51216
47073 0001 HOLLISTON MILLS, INC. P48F -82.7581 36.51216
47073 0001 HOLLISTON MILLS, INC. P49F -82.7581 36.51216
47073 0001 HOLLISTON MILLS, INC. P4A -82.7581 36.51216
47073 0001 HOLLISTON MILLS, INC. P4F -82.7581 36.51216
47073 0001 HOLLISTON MILLS, INC. P51F -82.7581 36.51216
47073 0001 HOLLISTON MILLS, INC. P58F -82.7581 36.51216
47073 0001 HOLLISTON MILLS, INC. P5A -82.7581 36.51216
47073 0001 HOLLISTON MILLS, INC. P5AF -82.7581 36.51216
47073 0001 HOLLISTON MILLS, INC. P5F -82.7581 36.51216
Appendix A - 123 Kentucky Regional Haze 5-Year Periodic Report SIP Revision, September 2014
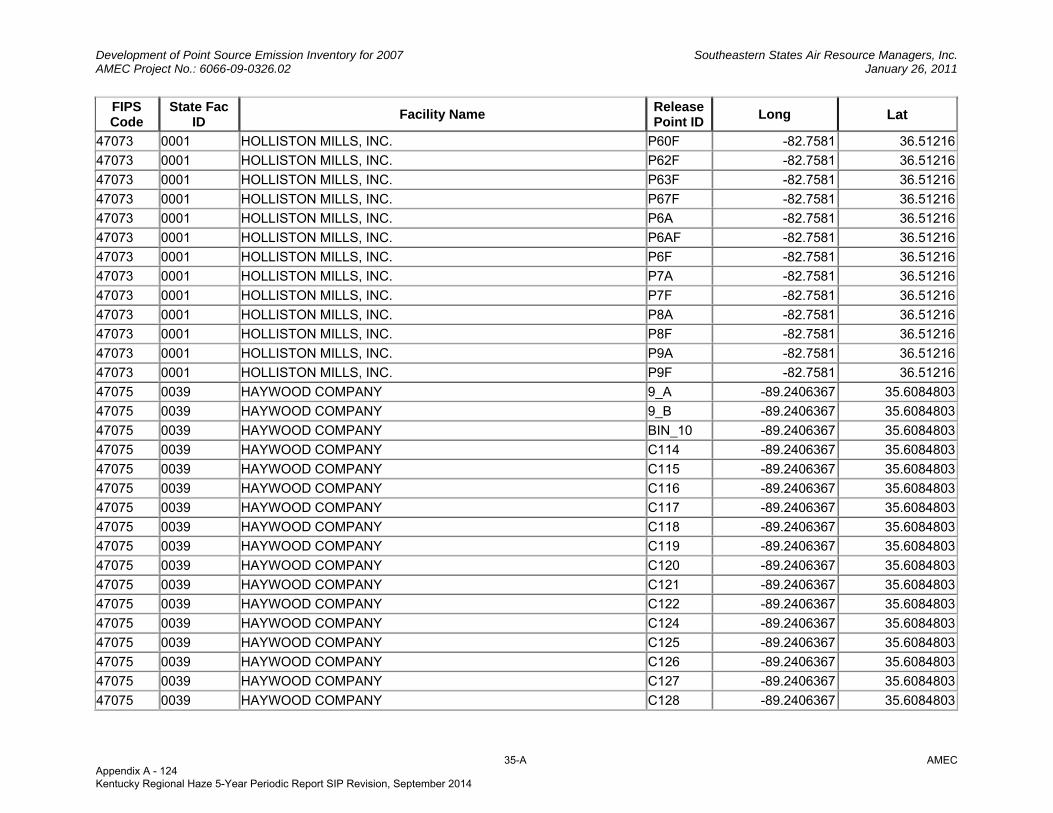
Development of Point Source Emission Inventory for 2007 Southeastern States Air Resource Managers, Inc. AMEC Project No.: 6066-09-0326.02 January 26, 2011
35-A AMEC
FIPS Code
State Fac ID Facility Name Release
Point IDLong Lat
47073 0001 HOLLISTON MILLS, INC. P60F -82.7581 36.51216
47073 0001 HOLLISTON MILLS, INC. P62F -82.7581 36.51216
47073 0001 HOLLISTON MILLS, INC. P63F -82.7581 36.51216
47073 0001 HOLLISTON MILLS, INC. P67F -82.7581 36.51216
47073 0001 HOLLISTON MILLS, INC. P6A -82.7581 36.51216
47073 0001 HOLLISTON MILLS, INC. P6AF -82.7581 36.51216
47073 0001 HOLLISTON MILLS, INC. P6F -82.7581 36.51216
47073 0001 HOLLISTON MILLS, INC. P7A -82.7581 36.51216
47073 0001 HOLLISTON MILLS, INC. P7F -82.7581 36.51216
47073 0001 HOLLISTON MILLS, INC. P8A -82.7581 36.51216
47073 0001 HOLLISTON MILLS, INC. P8F -82.7581 36.51216
47073 0001 HOLLISTON MILLS, INC. P9A -82.7581 36.51216
47073 0001 HOLLISTON MILLS, INC. P9F -82.7581 36.51216
47075 0039 HAYWOOD COMPANY 9_A -89.2406367 35.6084803
47075 0039 HAYWOOD COMPANY 9_B -89.2406367 35.6084803
47075 0039 HAYWOOD COMPANY BIN_10 -89.2406367 35.6084803
47075 0039 HAYWOOD COMPANY C114 -89.2406367 35.6084803
47075 0039 HAYWOOD COMPANY C115 -89.2406367 35.6084803
47075 0039 HAYWOOD COMPANY C116 -89.2406367 35.6084803
47075 0039 HAYWOOD COMPANY C117 -89.2406367 35.6084803
47075 0039 HAYWOOD COMPANY C118 -89.2406367 35.6084803
47075 0039 HAYWOOD COMPANY C119 -89.2406367 35.6084803
47075 0039 HAYWOOD COMPANY C120 -89.2406367 35.6084803
47075 0039 HAYWOOD COMPANY C121 -89.2406367 35.6084803
47075 0039 HAYWOOD COMPANY C122 -89.2406367 35.6084803
47075 0039 HAYWOOD COMPANY C124 -89.2406367 35.6084803
47075 0039 HAYWOOD COMPANY C125 -89.2406367 35.6084803
47075 0039 HAYWOOD COMPANY C126 -89.2406367 35.6084803
47075 0039 HAYWOOD COMPANY C127 -89.2406367 35.6084803
47075 0039 HAYWOOD COMPANY C128 -89.2406367 35.6084803
Appendix A - 124 Kentucky Regional Haze 5-Year Periodic Report SIP Revision, September 2014
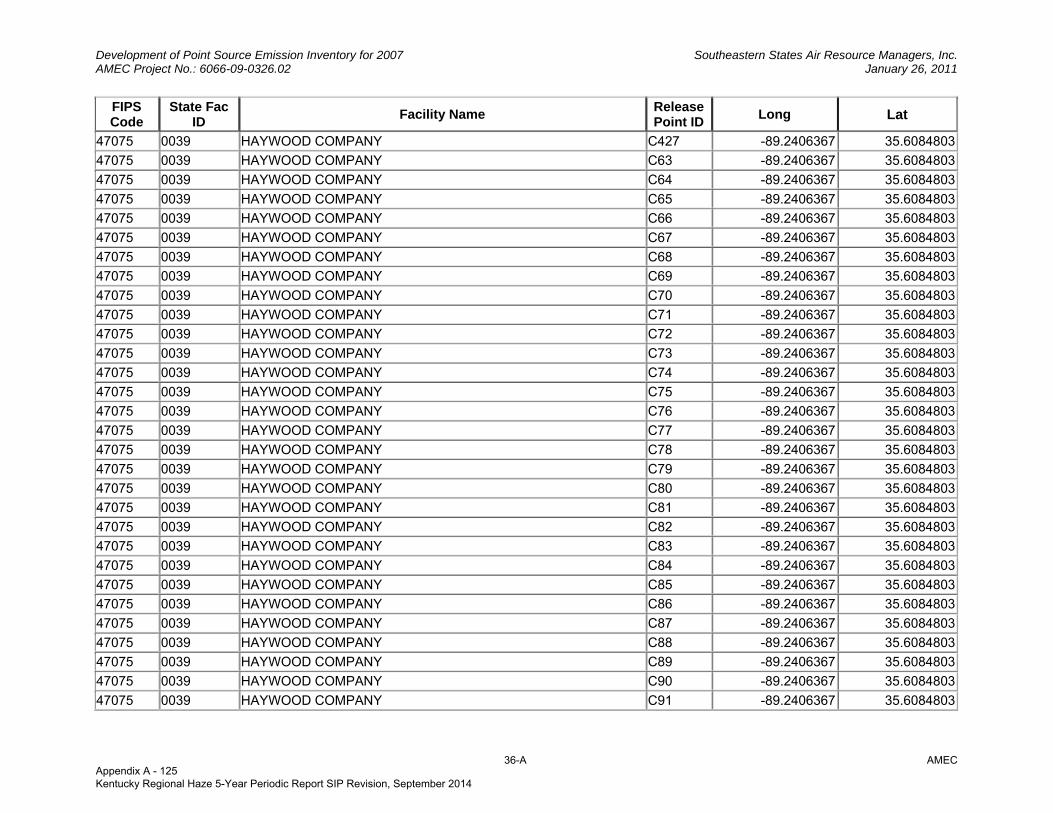
Development of Point Source Emission Inventory for 2007 Southeastern States Air Resource Managers, Inc. AMEC Project No.: 6066-09-0326.02 January 26, 2011
36-A AMEC
FIPS Code
State Fac ID Facility Name Release
Point IDLong Lat
47075 0039 HAYWOOD COMPANY C427 -89.2406367 35.6084803
47075 0039 HAYWOOD COMPANY C63 -89.2406367 35.6084803
47075 0039 HAYWOOD COMPANY C64 -89.2406367 35.6084803
47075 0039 HAYWOOD COMPANY C65 -89.2406367 35.6084803
47075 0039 HAYWOOD COMPANY C66 -89.2406367 35.6084803
47075 0039 HAYWOOD COMPANY C67 -89.2406367 35.6084803
47075 0039 HAYWOOD COMPANY C68 -89.2406367 35.6084803
47075 0039 HAYWOOD COMPANY C69 -89.2406367 35.6084803
47075 0039 HAYWOOD COMPANY C70 -89.2406367 35.6084803
47075 0039 HAYWOOD COMPANY C71 -89.2406367 35.6084803
47075 0039 HAYWOOD COMPANY C72 -89.2406367 35.6084803
47075 0039 HAYWOOD COMPANY C73 -89.2406367 35.6084803
47075 0039 HAYWOOD COMPANY C74 -89.2406367 35.6084803
47075 0039 HAYWOOD COMPANY C75 -89.2406367 35.6084803
47075 0039 HAYWOOD COMPANY C76 -89.2406367 35.6084803
47075 0039 HAYWOOD COMPANY C77 -89.2406367 35.6084803
47075 0039 HAYWOOD COMPANY C78 -89.2406367 35.6084803
47075 0039 HAYWOOD COMPANY C79 -89.2406367 35.6084803
47075 0039 HAYWOOD COMPANY C80 -89.2406367 35.6084803
47075 0039 HAYWOOD COMPANY C81 -89.2406367 35.6084803
47075 0039 HAYWOOD COMPANY C82 -89.2406367 35.6084803
47075 0039 HAYWOOD COMPANY C83 -89.2406367 35.6084803
47075 0039 HAYWOOD COMPANY C84 -89.2406367 35.6084803
47075 0039 HAYWOOD COMPANY C85 -89.2406367 35.6084803
47075 0039 HAYWOOD COMPANY C86 -89.2406367 35.6084803
47075 0039 HAYWOOD COMPANY C87 -89.2406367 35.6084803
47075 0039 HAYWOOD COMPANY C88 -89.2406367 35.6084803
47075 0039 HAYWOOD COMPANY C89 -89.2406367 35.6084803
47075 0039 HAYWOOD COMPANY C90 -89.2406367 35.6084803
47075 0039 HAYWOOD COMPANY C91 -89.2406367 35.6084803
Appendix A - 125 Kentucky Regional Haze 5-Year Periodic Report SIP Revision, September 2014
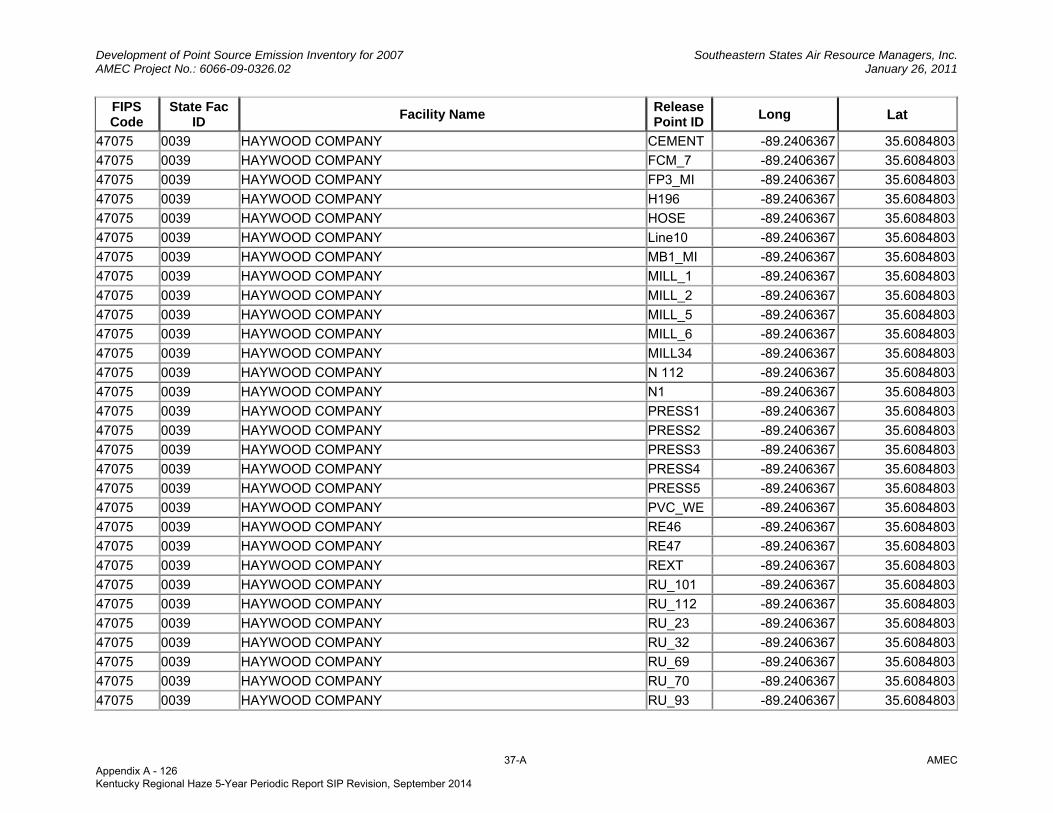
Development of Point Source Emission Inventory for 2007 Southeastern States Air Resource Managers, Inc. AMEC Project No.: 6066-09-0326.02 January 26, 2011
37-A AMEC
FIPS Code
State Fac ID Facility Name Release
Point IDLong Lat
47075 0039 HAYWOOD COMPANY CEMENT -89.2406367 35.6084803
47075 0039 HAYWOOD COMPANY FCM_7 -89.2406367 35.6084803
47075 0039 HAYWOOD COMPANY FP3_MI -89.2406367 35.6084803
47075 0039 HAYWOOD COMPANY H196 -89.2406367 35.6084803
47075 0039 HAYWOOD COMPANY HOSE -89.2406367 35.6084803
47075 0039 HAYWOOD COMPANY Line10 -89.2406367 35.6084803
47075 0039 HAYWOOD COMPANY MB1_MI -89.2406367 35.6084803
47075 0039 HAYWOOD COMPANY MILL_1 -89.2406367 35.6084803
47075 0039 HAYWOOD COMPANY MILL_2 -89.2406367 35.6084803
47075 0039 HAYWOOD COMPANY MILL_5 -89.2406367 35.6084803
47075 0039 HAYWOOD COMPANY MILL_6 -89.2406367 35.6084803
47075 0039 HAYWOOD COMPANY MILL34 -89.2406367 35.6084803
47075 0039 HAYWOOD COMPANY N 112 -89.2406367 35.6084803
47075 0039 HAYWOOD COMPANY N1 -89.2406367 35.6084803
47075 0039 HAYWOOD COMPANY PRESS1 -89.2406367 35.6084803
47075 0039 HAYWOOD COMPANY PRESS2 -89.2406367 35.6084803
47075 0039 HAYWOOD COMPANY PRESS3 -89.2406367 35.6084803
47075 0039 HAYWOOD COMPANY PRESS4 -89.2406367 35.6084803
47075 0039 HAYWOOD COMPANY PRESS5 -89.2406367 35.6084803
47075 0039 HAYWOOD COMPANY PVC_WE -89.2406367 35.6084803
47075 0039 HAYWOOD COMPANY RE46 -89.2406367 35.6084803
47075 0039 HAYWOOD COMPANY RE47 -89.2406367 35.6084803
47075 0039 HAYWOOD COMPANY REXT -89.2406367 35.6084803
47075 0039 HAYWOOD COMPANY RU_101 -89.2406367 35.6084803
47075 0039 HAYWOOD COMPANY RU_112 -89.2406367 35.6084803
47075 0039 HAYWOOD COMPANY RU_23 -89.2406367 35.6084803
47075 0039 HAYWOOD COMPANY RU_32 -89.2406367 35.6084803
47075 0039 HAYWOOD COMPANY RU_69 -89.2406367 35.6084803
47075 0039 HAYWOOD COMPANY RU_70 -89.2406367 35.6084803
47075 0039 HAYWOOD COMPANY RU_93 -89.2406367 35.6084803
Appendix A - 126 Kentucky Regional Haze 5-Year Periodic Report SIP Revision, September 2014
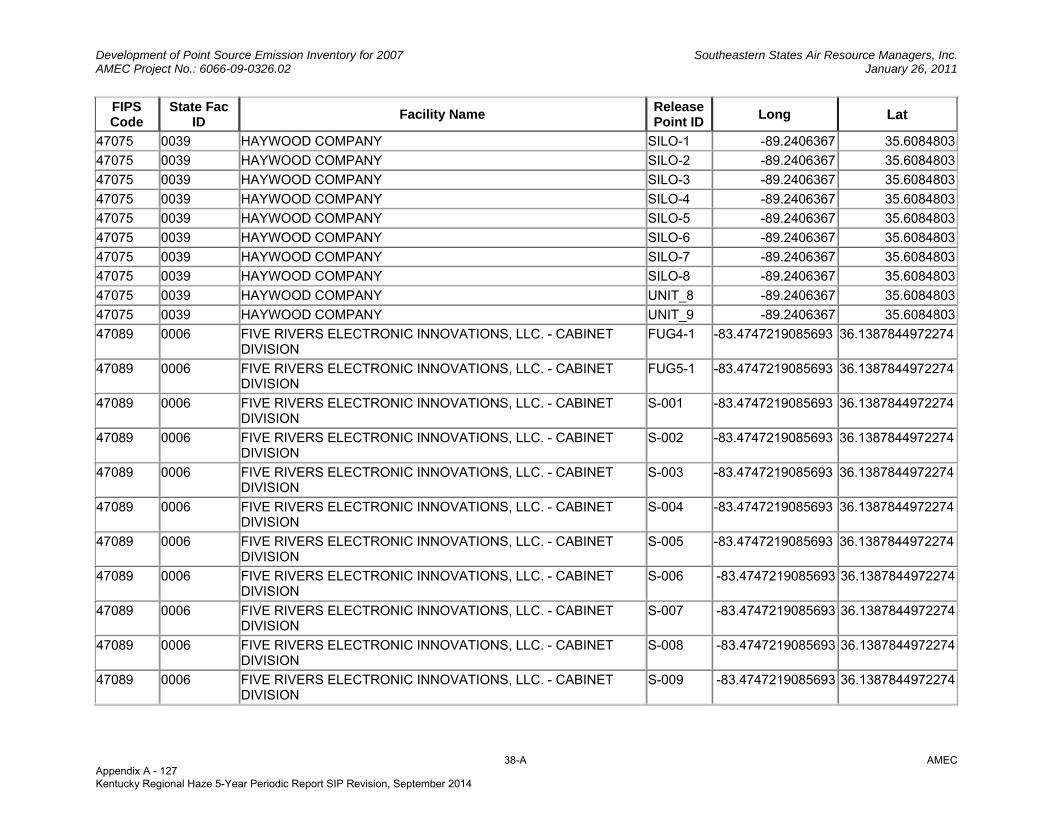
Development of Point Source Emission Inventory for 2007 Southeastern States Air Resource Managers, Inc. AMEC Project No.: 6066-09-0326.02 January 26, 2011
38-A AMEC
FIPS Code
State Fac ID Facility Name Release
Point IDLong Lat
47075 0039 HAYWOOD COMPANY SILO-1 -89.2406367 35.6084803
47075 0039 HAYWOOD COMPANY SILO-2 -89.2406367 35.6084803
47075 0039 HAYWOOD COMPANY SILO-3 -89.2406367 35.6084803
47075 0039 HAYWOOD COMPANY SILO-4 -89.2406367 35.6084803
47075 0039 HAYWOOD COMPANY SILO-5 -89.2406367 35.6084803
47075 0039 HAYWOOD COMPANY SILO-6 -89.2406367 35.6084803
47075 0039 HAYWOOD COMPANY SILO-7 -89.2406367 35.6084803
47075 0039 HAYWOOD COMPANY SILO-8 -89.2406367 35.6084803
47075 0039 HAYWOOD COMPANY UNIT_8 -89.2406367 35.6084803
47075 0039 HAYWOOD COMPANY UNIT_9 -89.2406367 35.6084803
47089 0006 FIVE RIVERS ELECTRONIC INNOVATIONS, LLC. - CABINET DIVISION
FUG4-1 -83.4747219085693 36.1387844972274
47089 0006 FIVE RIVERS ELECTRONIC INNOVATIONS, LLC. - CABINET DIVISION
FUG5-1 -83.4747219085693 36.1387844972274
47089 0006 FIVE RIVERS ELECTRONIC INNOVATIONS, LLC. - CABINET DIVISION
S-001 -83.4747219085693 36.1387844972274
47089 0006 FIVE RIVERS ELECTRONIC INNOVATIONS, LLC. - CABINET DIVISION
S-002 -83.4747219085693 36.1387844972274
47089 0006 FIVE RIVERS ELECTRONIC INNOVATIONS, LLC. - CABINET DIVISION
S-003 -83.4747219085693 36.1387844972274
47089 0006 FIVE RIVERS ELECTRONIC INNOVATIONS, LLC. - CABINET DIVISION
S-004 -83.4747219085693 36.1387844972274
47089 0006 FIVE RIVERS ELECTRONIC INNOVATIONS, LLC. - CABINET DIVISION
S-005 -83.4747219085693 36.1387844972274
47089 0006 FIVE RIVERS ELECTRONIC INNOVATIONS, LLC. - CABINET DIVISION
S-006 -83.4747219085693 36.1387844972274
47089 0006 FIVE RIVERS ELECTRONIC INNOVATIONS, LLC. - CABINET DIVISION
S-007 -83.4747219085693 36.1387844972274
47089 0006 FIVE RIVERS ELECTRONIC INNOVATIONS, LLC. - CABINET DIVISION
S-008 -83.4747219085693 36.1387844972274
47089 0006 FIVE RIVERS ELECTRONIC INNOVATIONS, LLC. - CABINET DIVISION
S-009 -83.4747219085693 36.1387844972274
Appendix A - 127 Kentucky Regional Haze 5-Year Periodic Report SIP Revision, September 2014
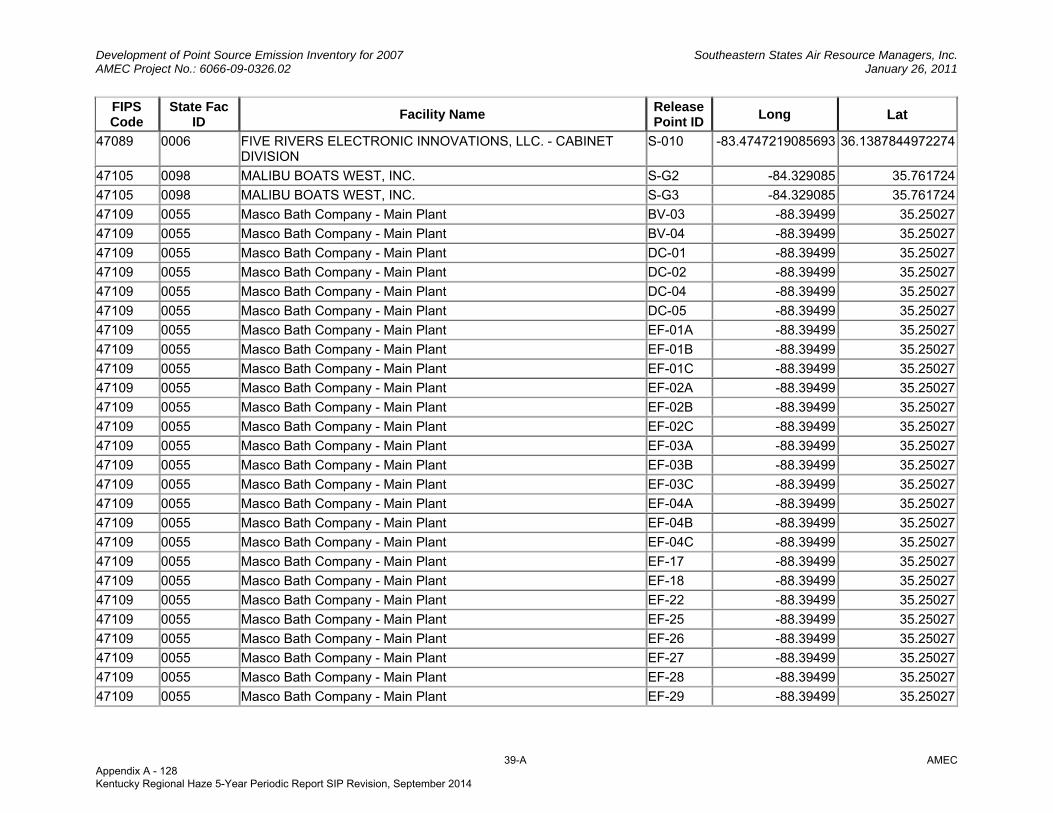
Development of Point Source Emission Inventory for 2007 Southeastern States Air Resource Managers, Inc. AMEC Project No.: 6066-09-0326.02 January 26, 2011
39-A AMEC
FIPS Code
State Fac ID Facility Name Release
Point IDLong Lat
47089 0006 FIVE RIVERS ELECTRONIC INNOVATIONS, LLC. - CABINET DIVISION
S-010 -83.4747219085693 36.1387844972274
47105 0098 MALIBU BOATS WEST, INC. S-G2 -84.329085 35.761724
47105 0098 MALIBU BOATS WEST, INC. S-G3 -84.329085 35.761724
47109 0055 Masco Bath Company - Main Plant BV-03 -88.39499 35.25027
47109 0055 Masco Bath Company - Main Plant BV-04 -88.39499 35.25027
47109 0055 Masco Bath Company - Main Plant DC-01 -88.39499 35.25027
47109 0055 Masco Bath Company - Main Plant DC-02 -88.39499 35.25027
47109 0055 Masco Bath Company - Main Plant DC-04 -88.39499 35.25027
47109 0055 Masco Bath Company - Main Plant DC-05 -88.39499 35.25027
47109 0055 Masco Bath Company - Main Plant EF-01A -88.39499 35.25027
47109 0055 Masco Bath Company - Main Plant EF-01B -88.39499 35.25027
47109 0055 Masco Bath Company - Main Plant EF-01C -88.39499 35.25027
47109 0055 Masco Bath Company - Main Plant EF-02A -88.39499 35.25027
47109 0055 Masco Bath Company - Main Plant EF-02B -88.39499 35.25027
47109 0055 Masco Bath Company - Main Plant EF-02C -88.39499 35.25027
47109 0055 Masco Bath Company - Main Plant EF-03A -88.39499 35.25027
47109 0055 Masco Bath Company - Main Plant EF-03B -88.39499 35.25027
47109 0055 Masco Bath Company - Main Plant EF-03C -88.39499 35.25027
47109 0055 Masco Bath Company - Main Plant EF-04A -88.39499 35.25027
47109 0055 Masco Bath Company - Main Plant EF-04B -88.39499 35.25027
47109 0055 Masco Bath Company - Main Plant EF-04C -88.39499 35.25027
47109 0055 Masco Bath Company - Main Plant EF-17 -88.39499 35.25027
47109 0055 Masco Bath Company - Main Plant EF-18 -88.39499 35.25027
47109 0055 Masco Bath Company - Main Plant EF-22 -88.39499 35.25027
47109 0055 Masco Bath Company - Main Plant EF-25 -88.39499 35.25027
47109 0055 Masco Bath Company - Main Plant EF-26 -88.39499 35.25027
47109 0055 Masco Bath Company - Main Plant EF-27 -88.39499 35.25027
47109 0055 Masco Bath Company - Main Plant EF-28 -88.39499 35.25027
47109 0055 Masco Bath Company - Main Plant EF-29 -88.39499 35.25027
Appendix A - 128 Kentucky Regional Haze 5-Year Periodic Report SIP Revision, September 2014
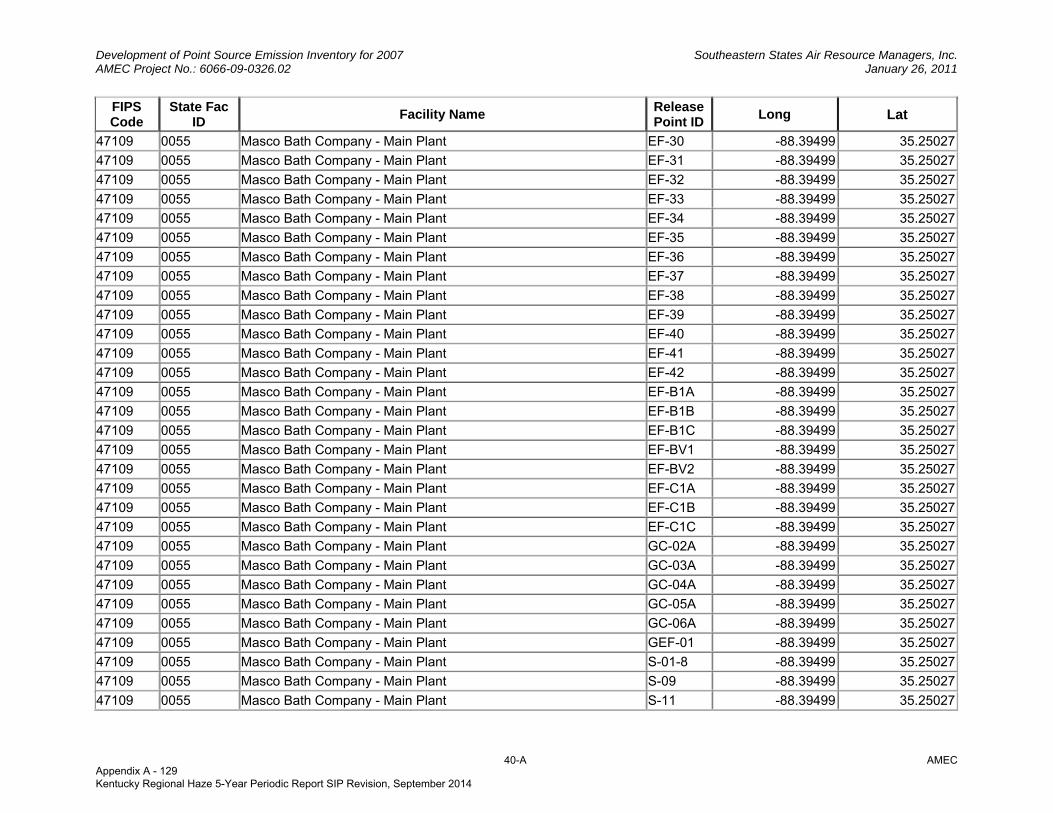
Development of Point Source Emission Inventory for 2007 Southeastern States Air Resource Managers, Inc. AMEC Project No.: 6066-09-0326.02 January 26, 2011
40-A AMEC
FIPS Code
State Fac ID Facility Name Release
Point IDLong Lat
47109 0055 Masco Bath Company - Main Plant EF-30 -88.39499 35.25027
47109 0055 Masco Bath Company - Main Plant EF-31 -88.39499 35.25027
47109 0055 Masco Bath Company - Main Plant EF-32 -88.39499 35.25027
47109 0055 Masco Bath Company - Main Plant EF-33 -88.39499 35.25027
47109 0055 Masco Bath Company - Main Plant EF-34 -88.39499 35.25027
47109 0055 Masco Bath Company - Main Plant EF-35 -88.39499 35.25027
47109 0055 Masco Bath Company - Main Plant EF-36 -88.39499 35.25027
47109 0055 Masco Bath Company - Main Plant EF-37 -88.39499 35.25027
47109 0055 Masco Bath Company - Main Plant EF-38 -88.39499 35.25027
47109 0055 Masco Bath Company - Main Plant EF-39 -88.39499 35.25027
47109 0055 Masco Bath Company - Main Plant EF-40 -88.39499 35.25027
47109 0055 Masco Bath Company - Main Plant EF-41 -88.39499 35.25027
47109 0055 Masco Bath Company - Main Plant EF-42 -88.39499 35.25027
47109 0055 Masco Bath Company - Main Plant EF-B1A -88.39499 35.25027
47109 0055 Masco Bath Company - Main Plant EF-B1B -88.39499 35.25027
47109 0055 Masco Bath Company - Main Plant EF-B1C -88.39499 35.25027
47109 0055 Masco Bath Company - Main Plant EF-BV1 -88.39499 35.25027
47109 0055 Masco Bath Company - Main Plant EF-BV2 -88.39499 35.25027
47109 0055 Masco Bath Company - Main Plant EF-C1A -88.39499 35.25027
47109 0055 Masco Bath Company - Main Plant EF-C1B -88.39499 35.25027
47109 0055 Masco Bath Company - Main Plant EF-C1C -88.39499 35.25027
47109 0055 Masco Bath Company - Main Plant GC-02A -88.39499 35.25027
47109 0055 Masco Bath Company - Main Plant GC-03A -88.39499 35.25027
47109 0055 Masco Bath Company - Main Plant GC-04A -88.39499 35.25027
47109 0055 Masco Bath Company - Main Plant GC-05A -88.39499 35.25027
47109 0055 Masco Bath Company - Main Plant GC-06A -88.39499 35.25027
47109 0055 Masco Bath Company - Main Plant GEF-01 -88.39499 35.25027
47109 0055 Masco Bath Company - Main Plant S-01-8 -88.39499 35.25027
47109 0055 Masco Bath Company - Main Plant S-09 -88.39499 35.25027
47109 0055 Masco Bath Company - Main Plant S-11 -88.39499 35.25027
Appendix A - 129 Kentucky Regional Haze 5-Year Periodic Report SIP Revision, September 2014
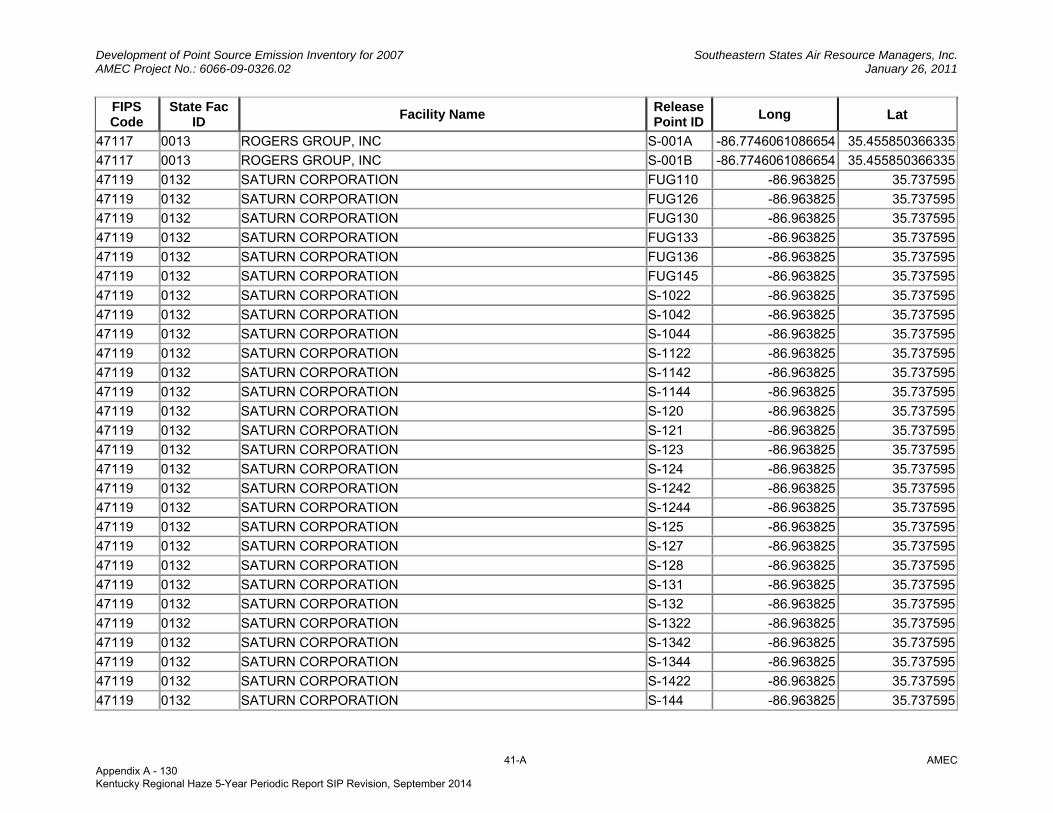
Development of Point Source Emission Inventory for 2007 Southeastern States Air Resource Managers, Inc. AMEC Project No.: 6066-09-0326.02 January 26, 2011
41-A AMEC
FIPS Code
State Fac ID Facility Name Release
Point IDLong Lat
47117 0013 ROGERS GROUP, INC S-001A -86.7746061086654 35.455850366335
47117 0013 ROGERS GROUP, INC S-001B -86.7746061086654 35.455850366335
47119 0132 SATURN CORPORATION FUG110 -86.963825 35.737595
47119 0132 SATURN CORPORATION FUG126 -86.963825 35.737595
47119 0132 SATURN CORPORATION FUG130 -86.963825 35.737595
47119 0132 SATURN CORPORATION FUG133 -86.963825 35.737595
47119 0132 SATURN CORPORATION FUG136 -86.963825 35.737595
47119 0132 SATURN CORPORATION FUG145 -86.963825 35.737595
47119 0132 SATURN CORPORATION S-1022 -86.963825 35.737595
47119 0132 SATURN CORPORATION S-1042 -86.963825 35.737595
47119 0132 SATURN CORPORATION S-1044 -86.963825 35.737595
47119 0132 SATURN CORPORATION S-1122 -86.963825 35.737595
47119 0132 SATURN CORPORATION S-1142 -86.963825 35.737595
47119 0132 SATURN CORPORATION S-1144 -86.963825 35.737595
47119 0132 SATURN CORPORATION S-120 -86.963825 35.737595
47119 0132 SATURN CORPORATION S-121 -86.963825 35.737595
47119 0132 SATURN CORPORATION S-123 -86.963825 35.737595
47119 0132 SATURN CORPORATION S-124 -86.963825 35.737595
47119 0132 SATURN CORPORATION S-1242 -86.963825 35.737595
47119 0132 SATURN CORPORATION S-1244 -86.963825 35.737595
47119 0132 SATURN CORPORATION S-125 -86.963825 35.737595
47119 0132 SATURN CORPORATION S-127 -86.963825 35.737595
47119 0132 SATURN CORPORATION S-128 -86.963825 35.737595
47119 0132 SATURN CORPORATION S-131 -86.963825 35.737595
47119 0132 SATURN CORPORATION S-132 -86.963825 35.737595
47119 0132 SATURN CORPORATION S-1322 -86.963825 35.737595
47119 0132 SATURN CORPORATION S-1342 -86.963825 35.737595
47119 0132 SATURN CORPORATION S-1344 -86.963825 35.737595
47119 0132 SATURN CORPORATION S-1422 -86.963825 35.737595
47119 0132 SATURN CORPORATION S-144 -86.963825 35.737595
Appendix A - 130 Kentucky Regional Haze 5-Year Periodic Report SIP Revision, September 2014
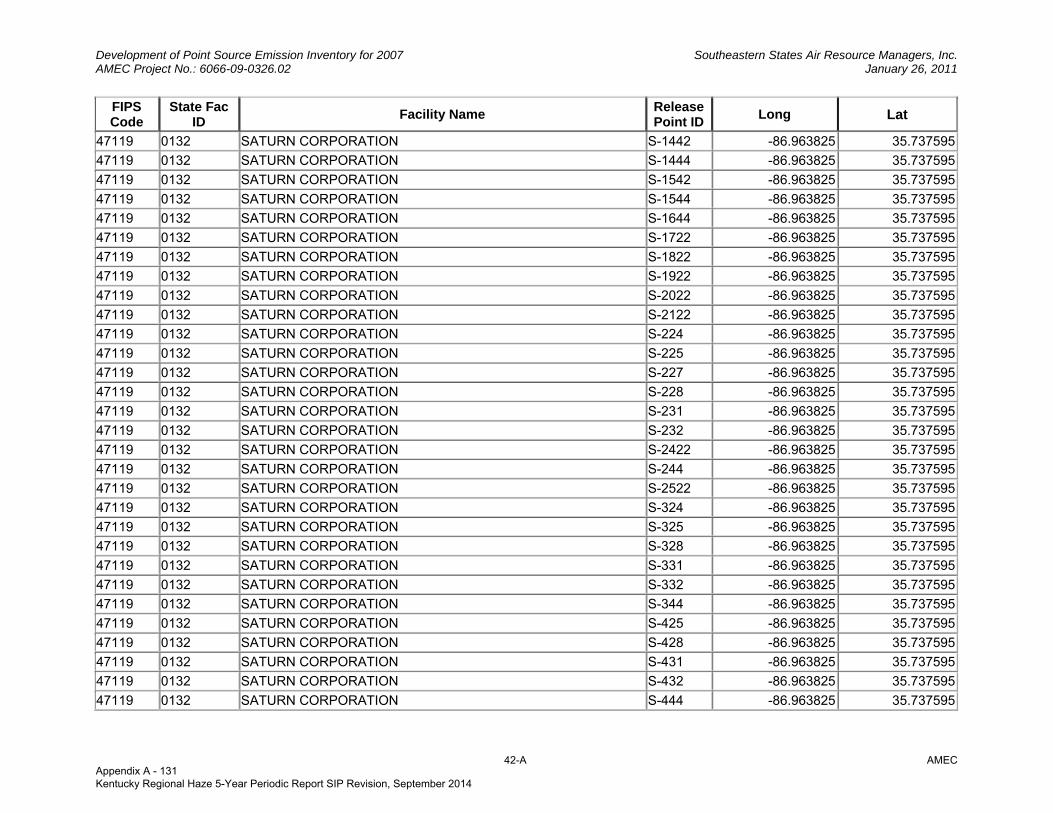
Development of Point Source Emission Inventory for 2007 Southeastern States Air Resource Managers, Inc. AMEC Project No.: 6066-09-0326.02 January 26, 2011
42-A AMEC
FIPS Code
State Fac ID Facility Name Release
Point IDLong Lat
47119 0132 SATURN CORPORATION S-1442 -86.963825 35.737595
47119 0132 SATURN CORPORATION S-1444 -86.963825 35.737595
47119 0132 SATURN CORPORATION S-1542 -86.963825 35.737595
47119 0132 SATURN CORPORATION S-1544 -86.963825 35.737595
47119 0132 SATURN CORPORATION S-1644 -86.963825 35.737595
47119 0132 SATURN CORPORATION S-1722 -86.963825 35.737595
47119 0132 SATURN CORPORATION S-1822 -86.963825 35.737595
47119 0132 SATURN CORPORATION S-1922 -86.963825 35.737595
47119 0132 SATURN CORPORATION S-2022 -86.963825 35.737595
47119 0132 SATURN CORPORATION S-2122 -86.963825 35.737595
47119 0132 SATURN CORPORATION S-224 -86.963825 35.737595
47119 0132 SATURN CORPORATION S-225 -86.963825 35.737595
47119 0132 SATURN CORPORATION S-227 -86.963825 35.737595
47119 0132 SATURN CORPORATION S-228 -86.963825 35.737595
47119 0132 SATURN CORPORATION S-231 -86.963825 35.737595
47119 0132 SATURN CORPORATION S-232 -86.963825 35.737595
47119 0132 SATURN CORPORATION S-2422 -86.963825 35.737595
47119 0132 SATURN CORPORATION S-244 -86.963825 35.737595
47119 0132 SATURN CORPORATION S-2522 -86.963825 35.737595
47119 0132 SATURN CORPORATION S-324 -86.963825 35.737595
47119 0132 SATURN CORPORATION S-325 -86.963825 35.737595
47119 0132 SATURN CORPORATION S-328 -86.963825 35.737595
47119 0132 SATURN CORPORATION S-331 -86.963825 35.737595
47119 0132 SATURN CORPORATION S-332 -86.963825 35.737595
47119 0132 SATURN CORPORATION S-344 -86.963825 35.737595
47119 0132 SATURN CORPORATION S-425 -86.963825 35.737595
47119 0132 SATURN CORPORATION S-428 -86.963825 35.737595
47119 0132 SATURN CORPORATION S-431 -86.963825 35.737595
47119 0132 SATURN CORPORATION S-432 -86.963825 35.737595
47119 0132 SATURN CORPORATION S-444 -86.963825 35.737595
Appendix A - 131 Kentucky Regional Haze 5-Year Periodic Report SIP Revision, September 2014

Development of Point Source Emission Inventory for 2007 Southeastern States Air Resource Managers, Inc. AMEC Project No.: 6066-09-0326.02 January 26, 2011
43-A AMEC
FIPS Code
State Fac ID Facility Name Release
Point IDLong Lat
47119 0132 SATURN CORPORATION S-523 -86.963825 35.737595
47119 0132 SATURN CORPORATION S-531 -86.963825 35.737595
47119 0132 SATURN CORPORATION S-532 -86.963825 35.737595
47119 0132 SATURN CORPORATION S-542 -86.963825 35.737595
47119 0132 SATURN CORPORATION S-544 -86.963825 35.737595
47119 0132 SATURN CORPORATION S-621 -86.963825 35.737595
47119 0132 SATURN CORPORATION S-623 -86.963825 35.737595
47119 0132 SATURN CORPORATION S-624 -86.963825 35.737595
47119 0132 SATURN CORPORATION S-625 -86.963825 35.737595
47119 0132 SATURN CORPORATION S-631 -86.963825 35.737595
47119 0132 SATURN CORPORATION S-632 -86.963825 35.737595
47119 0132 SATURN CORPORATION S-644 -86.963825 35.737595
47119 0132 SATURN CORPORATION S-721 -86.963825 35.737595
47119 0132 SATURN CORPORATION S-723 -86.963825 35.737595
47119 0132 SATURN CORPORATION S-724 -86.963825 35.737595
47119 0132 SATURN CORPORATION S-731 -86.963825 35.737595
47119 0132 SATURN CORPORATION S-744 -86.963825 35.737595
47119 0132 SATURN CORPORATION S-821 -86.963825 35.737595
47119 0132 SATURN CORPORATION S-823 -86.963825 35.737595
47119 0132 SATURN CORPORATION S-824 -86.963825 35.737595
47119 0132 SATURN CORPORATION S-831 -86.963825 35.737595
47119 0132 SATURN CORPORATION S-844 -86.963825 35.737595
47119 0132 SATURN CORPORATION S-922 -86.963825 35.737595
47119 0132 SATURN CORPORATION S-924 -86.963825 35.737595
47119 0132 SATURN CORPORATION S-942 -86.963825 35.737595
47119 0132 SATURN CORPORATION S-944 -86.963825 35.737595
47123 0089 SEA RAY BOATS, INC. TEL01 -84.265587 35.612424
47123 0089 SEA RAY BOATS, INC. TEL02 -84.265587 35.612424
47123 0089 SEA RAY BOATS, INC. TEL03 -84.265587 35.612424
47123 0089 SEA RAY BOATS, INC. TEL05 -84.265587 35.612424
Appendix A - 132 Kentucky Regional Haze 5-Year Periodic Report SIP Revision, September 2014
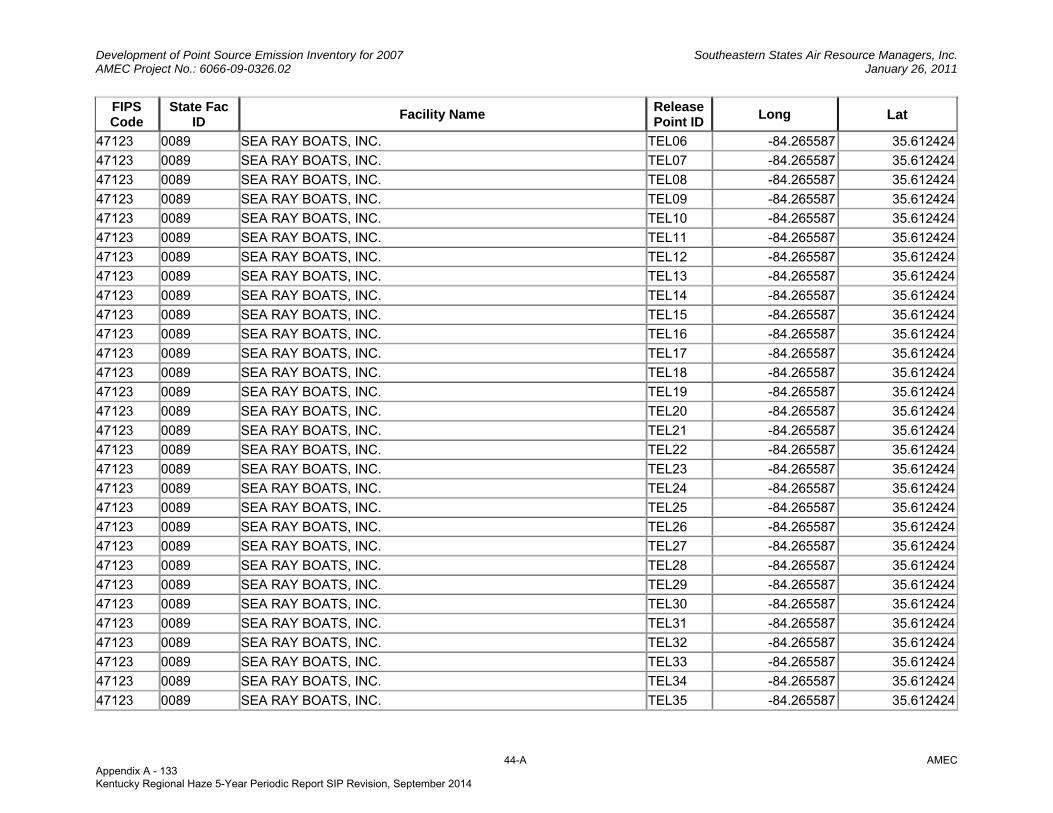
Development of Point Source Emission Inventory for 2007 Southeastern States Air Resource Managers, Inc. AMEC Project No.: 6066-09-0326.02 January 26, 2011
44-A AMEC
FIPS Code
State Fac ID Facility Name Release
Point IDLong Lat
47123 0089 SEA RAY BOATS, INC. TEL06 -84.265587 35.612424
47123 0089 SEA RAY BOATS, INC. TEL07 -84.265587 35.612424
47123 0089 SEA RAY BOATS, INC. TEL08 -84.265587 35.612424
47123 0089 SEA RAY BOATS, INC. TEL09 -84.265587 35.612424
47123 0089 SEA RAY BOATS, INC. TEL10 -84.265587 35.612424
47123 0089 SEA RAY BOATS, INC. TEL11 -84.265587 35.612424
47123 0089 SEA RAY BOATS, INC. TEL12 -84.265587 35.612424
47123 0089 SEA RAY BOATS, INC. TEL13 -84.265587 35.612424
47123 0089 SEA RAY BOATS, INC. TEL14 -84.265587 35.612424
47123 0089 SEA RAY BOATS, INC. TEL15 -84.265587 35.612424
47123 0089 SEA RAY BOATS, INC. TEL16 -84.265587 35.612424
47123 0089 SEA RAY BOATS, INC. TEL17 -84.265587 35.612424
47123 0089 SEA RAY BOATS, INC. TEL18 -84.265587 35.612424
47123 0089 SEA RAY BOATS, INC. TEL19 -84.265587 35.612424
47123 0089 SEA RAY BOATS, INC. TEL20 -84.265587 35.612424
47123 0089 SEA RAY BOATS, INC. TEL21 -84.265587 35.612424
47123 0089 SEA RAY BOATS, INC. TEL22 -84.265587 35.612424
47123 0089 SEA RAY BOATS, INC. TEL23 -84.265587 35.612424
47123 0089 SEA RAY BOATS, INC. TEL24 -84.265587 35.612424
47123 0089 SEA RAY BOATS, INC. TEL25 -84.265587 35.612424
47123 0089 SEA RAY BOATS, INC. TEL26 -84.265587 35.612424
47123 0089 SEA RAY BOATS, INC. TEL27 -84.265587 35.612424
47123 0089 SEA RAY BOATS, INC. TEL28 -84.265587 35.612424
47123 0089 SEA RAY BOATS, INC. TEL29 -84.265587 35.612424
47123 0089 SEA RAY BOATS, INC. TEL30 -84.265587 35.612424
47123 0089 SEA RAY BOATS, INC. TEL31 -84.265587 35.612424
47123 0089 SEA RAY BOATS, INC. TEL32 -84.265587 35.612424
47123 0089 SEA RAY BOATS, INC. TEL33 -84.265587 35.612424
47123 0089 SEA RAY BOATS, INC. TEL34 -84.265587 35.612424
47123 0089 SEA RAY BOATS, INC. TEL35 -84.265587 35.612424
Appendix A - 133 Kentucky Regional Haze 5-Year Periodic Report SIP Revision, September 2014
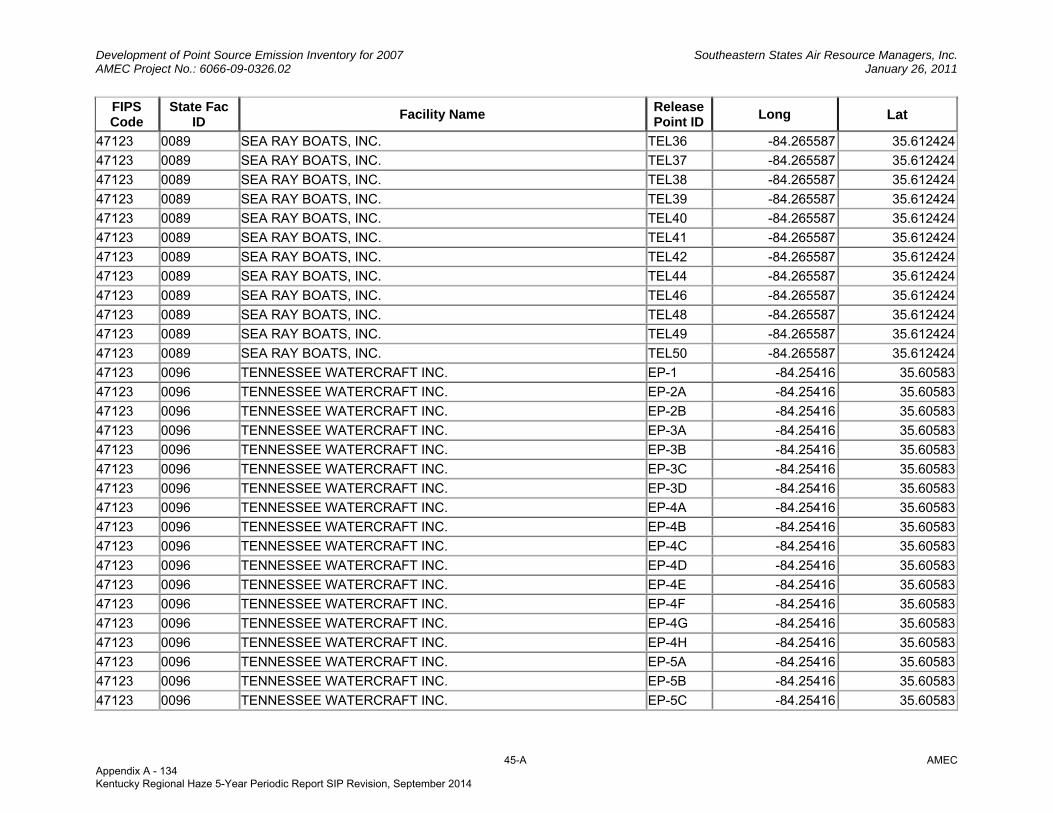
Development of Point Source Emission Inventory for 2007 Southeastern States Air Resource Managers, Inc. AMEC Project No.: 6066-09-0326.02 January 26, 2011
45-A AMEC
FIPS Code
State Fac ID Facility Name Release
Point IDLong Lat
47123 0089 SEA RAY BOATS, INC. TEL36 -84.265587 35.612424
47123 0089 SEA RAY BOATS, INC. TEL37 -84.265587 35.612424
47123 0089 SEA RAY BOATS, INC. TEL38 -84.265587 35.612424
47123 0089 SEA RAY BOATS, INC. TEL39 -84.265587 35.612424
47123 0089 SEA RAY BOATS, INC. TEL40 -84.265587 35.612424
47123 0089 SEA RAY BOATS, INC. TEL41 -84.265587 35.612424
47123 0089 SEA RAY BOATS, INC. TEL42 -84.265587 35.612424
47123 0089 SEA RAY BOATS, INC. TEL44 -84.265587 35.612424
47123 0089 SEA RAY BOATS, INC. TEL46 -84.265587 35.612424
47123 0089 SEA RAY BOATS, INC. TEL48 -84.265587 35.612424
47123 0089 SEA RAY BOATS, INC. TEL49 -84.265587 35.612424
47123 0089 SEA RAY BOATS, INC. TEL50 -84.265587 35.612424
47123 0096 TENNESSEE WATERCRAFT INC. EP-1 -84.25416 35.60583
47123 0096 TENNESSEE WATERCRAFT INC. EP-2A -84.25416 35.60583
47123 0096 TENNESSEE WATERCRAFT INC. EP-2B -84.25416 35.60583
47123 0096 TENNESSEE WATERCRAFT INC. EP-3A -84.25416 35.60583
47123 0096 TENNESSEE WATERCRAFT INC. EP-3B -84.25416 35.60583
47123 0096 TENNESSEE WATERCRAFT INC. EP-3C -84.25416 35.60583
47123 0096 TENNESSEE WATERCRAFT INC. EP-3D -84.25416 35.60583
47123 0096 TENNESSEE WATERCRAFT INC. EP-4A -84.25416 35.60583
47123 0096 TENNESSEE WATERCRAFT INC. EP-4B -84.25416 35.60583
47123 0096 TENNESSEE WATERCRAFT INC. EP-4C -84.25416 35.60583
47123 0096 TENNESSEE WATERCRAFT INC. EP-4D -84.25416 35.60583
47123 0096 TENNESSEE WATERCRAFT INC. EP-4E -84.25416 35.60583
47123 0096 TENNESSEE WATERCRAFT INC. EP-4F -84.25416 35.60583
47123 0096 TENNESSEE WATERCRAFT INC. EP-4G -84.25416 35.60583
47123 0096 TENNESSEE WATERCRAFT INC. EP-4H -84.25416 35.60583
47123 0096 TENNESSEE WATERCRAFT INC. EP-5A -84.25416 35.60583
47123 0096 TENNESSEE WATERCRAFT INC. EP-5B -84.25416 35.60583
47123 0096 TENNESSEE WATERCRAFT INC. EP-5C -84.25416 35.60583
Appendix A - 134 Kentucky Regional Haze 5-Year Periodic Report SIP Revision, September 2014
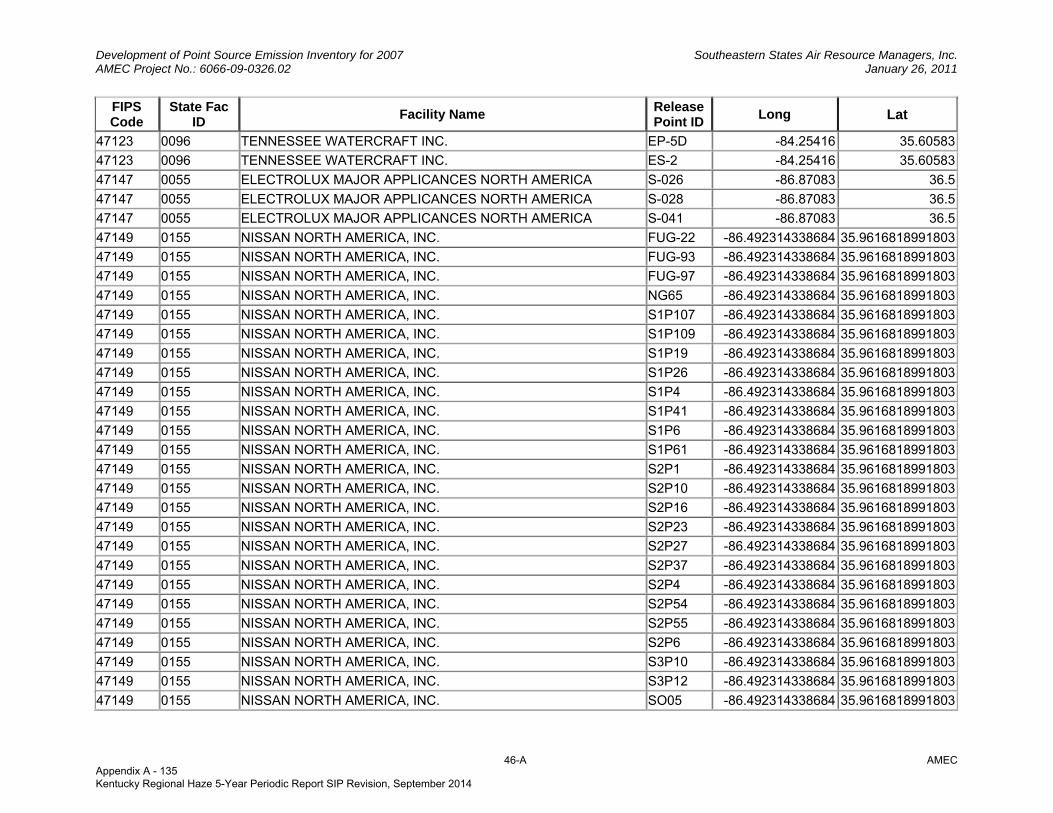
Development of Point Source Emission Inventory for 2007 Southeastern States Air Resource Managers, Inc. AMEC Project No.: 6066-09-0326.02 January 26, 2011
46-A AMEC
FIPS Code
State Fac ID Facility Name Release
Point IDLong Lat
47123 0096 TENNESSEE WATERCRAFT INC. EP-5D -84.25416 35.60583
47123 0096 TENNESSEE WATERCRAFT INC. ES-2 -84.25416 35.60583
47147 0055 ELECTROLUX MAJOR APPLICANCES NORTH AMERICA S-026 -86.87083 36.5
47147 0055 ELECTROLUX MAJOR APPLICANCES NORTH AMERICA S-028 -86.87083 36.5
47147 0055 ELECTROLUX MAJOR APPLICANCES NORTH AMERICA S-041 -86.87083 36.5
47149 0155 NISSAN NORTH AMERICA, INC. FUG-22 -86.492314338684 35.9616818991803
47149 0155 NISSAN NORTH AMERICA, INC. FUG-93 -86.492314338684 35.9616818991803
47149 0155 NISSAN NORTH AMERICA, INC. FUG-97 -86.492314338684 35.9616818991803
47149 0155 NISSAN NORTH AMERICA, INC. NG65 -86.492314338684 35.9616818991803
47149 0155 NISSAN NORTH AMERICA, INC. S1P107 -86.492314338684 35.9616818991803
47149 0155 NISSAN NORTH AMERICA, INC. S1P109 -86.492314338684 35.9616818991803
47149 0155 NISSAN NORTH AMERICA, INC. S1P19 -86.492314338684 35.9616818991803
47149 0155 NISSAN NORTH AMERICA, INC. S1P26 -86.492314338684 35.9616818991803
47149 0155 NISSAN NORTH AMERICA, INC. S1P4 -86.492314338684 35.9616818991803
47149 0155 NISSAN NORTH AMERICA, INC. S1P41 -86.492314338684 35.9616818991803
47149 0155 NISSAN NORTH AMERICA, INC. S1P6 -86.492314338684 35.9616818991803
47149 0155 NISSAN NORTH AMERICA, INC. S1P61 -86.492314338684 35.9616818991803
47149 0155 NISSAN NORTH AMERICA, INC. S2P1 -86.492314338684 35.9616818991803
47149 0155 NISSAN NORTH AMERICA, INC. S2P10 -86.492314338684 35.9616818991803
47149 0155 NISSAN NORTH AMERICA, INC. S2P16 -86.492314338684 35.9616818991803
47149 0155 NISSAN NORTH AMERICA, INC. S2P23 -86.492314338684 35.9616818991803
47149 0155 NISSAN NORTH AMERICA, INC. S2P27 -86.492314338684 35.9616818991803
47149 0155 NISSAN NORTH AMERICA, INC. S2P37 -86.492314338684 35.9616818991803
47149 0155 NISSAN NORTH AMERICA, INC. S2P4 -86.492314338684 35.9616818991803
47149 0155 NISSAN NORTH AMERICA, INC. S2P54 -86.492314338684 35.9616818991803
47149 0155 NISSAN NORTH AMERICA, INC. S2P55 -86.492314338684 35.9616818991803
47149 0155 NISSAN NORTH AMERICA, INC. S2P6 -86.492314338684 35.9616818991803
47149 0155 NISSAN NORTH AMERICA, INC. S3P10 -86.492314338684 35.9616818991803
47149 0155 NISSAN NORTH AMERICA, INC. S3P12 -86.492314338684 35.9616818991803
47149 0155 NISSAN NORTH AMERICA, INC. SO05 -86.492314338684 35.9616818991803
Appendix A - 135 Kentucky Regional Haze 5-Year Periodic Report SIP Revision, September 2014
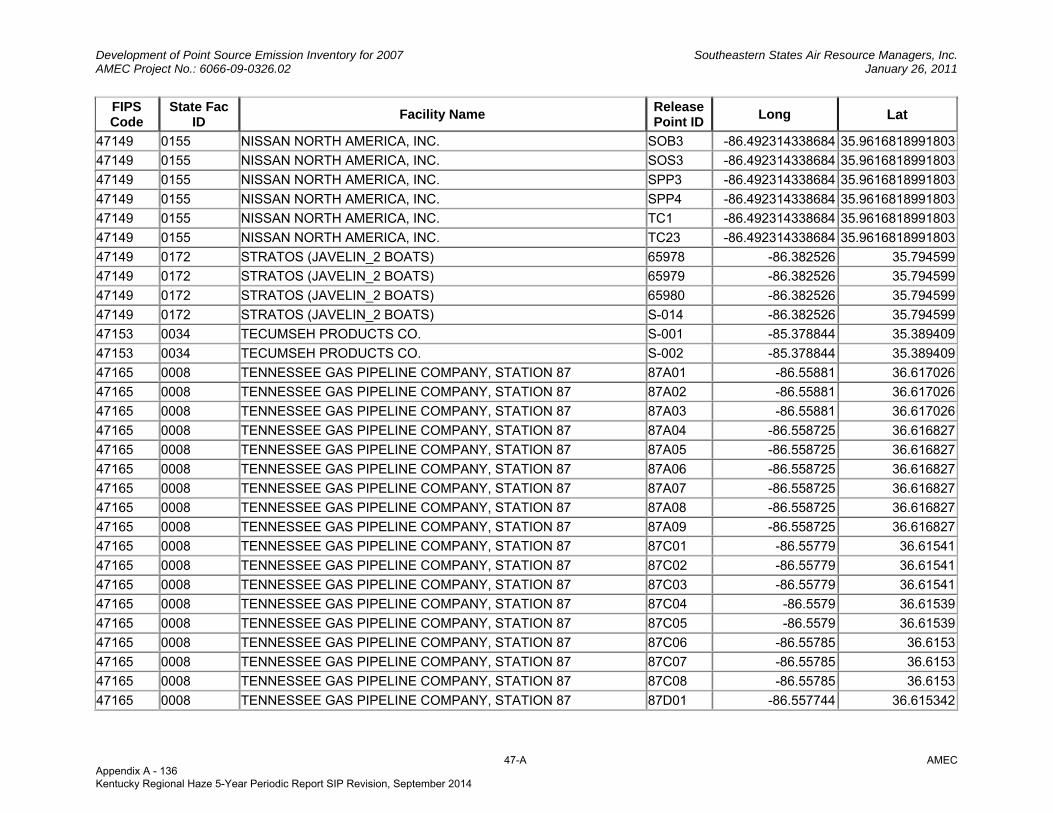
Development of Point Source Emission Inventory for 2007 Southeastern States Air Resource Managers, Inc. AMEC Project No.: 6066-09-0326.02 January 26, 2011
47-A AMEC
FIPS Code
State Fac ID Facility Name Release
Point IDLong Lat
47149 0155 NISSAN NORTH AMERICA, INC. SOB3 -86.492314338684 35.9616818991803
47149 0155 NISSAN NORTH AMERICA, INC. SOS3 -86.492314338684 35.9616818991803
47149 0155 NISSAN NORTH AMERICA, INC. SPP3 -86.492314338684 35.9616818991803
47149 0155 NISSAN NORTH AMERICA, INC. SPP4 -86.492314338684 35.9616818991803
47149 0155 NISSAN NORTH AMERICA, INC. TC1 -86.492314338684 35.9616818991803
47149 0155 NISSAN NORTH AMERICA, INC. TC23 -86.492314338684 35.9616818991803
47149 0172 STRATOS (JAVELIN_2 BOATS) 65978 -86.382526 35.794599
47149 0172 STRATOS (JAVELIN_2 BOATS) 65979 -86.382526 35.794599
47149 0172 STRATOS (JAVELIN_2 BOATS) 65980 -86.382526 35.794599
47149 0172 STRATOS (JAVELIN_2 BOATS) S-014 -86.382526 35.794599
47153 0034 TECUMSEH PRODUCTS CO. S-001 -85.378844 35.389409
47153 0034 TECUMSEH PRODUCTS CO. S-002 -85.378844 35.389409
47165 0008 TENNESSEE GAS PIPELINE COMPANY, STATION 87 87A01 -86.55881 36.617026
47165 0008 TENNESSEE GAS PIPELINE COMPANY, STATION 87 87A02 -86.55881 36.617026
47165 0008 TENNESSEE GAS PIPELINE COMPANY, STATION 87 87A03 -86.55881 36.617026
47165 0008 TENNESSEE GAS PIPELINE COMPANY, STATION 87 87A04 -86.558725 36.616827
47165 0008 TENNESSEE GAS PIPELINE COMPANY, STATION 87 87A05 -86.558725 36.616827
47165 0008 TENNESSEE GAS PIPELINE COMPANY, STATION 87 87A06 -86.558725 36.616827
47165 0008 TENNESSEE GAS PIPELINE COMPANY, STATION 87 87A07 -86.558725 36.616827
47165 0008 TENNESSEE GAS PIPELINE COMPANY, STATION 87 87A08 -86.558725 36.616827
47165 0008 TENNESSEE GAS PIPELINE COMPANY, STATION 87 87A09 -86.558725 36.616827
47165 0008 TENNESSEE GAS PIPELINE COMPANY, STATION 87 87C01 -86.55779 36.61541
47165 0008 TENNESSEE GAS PIPELINE COMPANY, STATION 87 87C02 -86.55779 36.61541
47165 0008 TENNESSEE GAS PIPELINE COMPANY, STATION 87 87C03 -86.55779 36.61541
47165 0008 TENNESSEE GAS PIPELINE COMPANY, STATION 87 87C04 -86.5579 36.61539
47165 0008 TENNESSEE GAS PIPELINE COMPANY, STATION 87 87C05 -86.5579 36.61539
47165 0008 TENNESSEE GAS PIPELINE COMPANY, STATION 87 87C06 -86.55785 36.6153
47165 0008 TENNESSEE GAS PIPELINE COMPANY, STATION 87 87C07 -86.55785 36.6153
47165 0008 TENNESSEE GAS PIPELINE COMPANY, STATION 87 87C08 -86.55785 36.6153
47165 0008 TENNESSEE GAS PIPELINE COMPANY, STATION 87 87D01 -86.557744 36.615342
Appendix A - 136 Kentucky Regional Haze 5-Year Periodic Report SIP Revision, September 2014
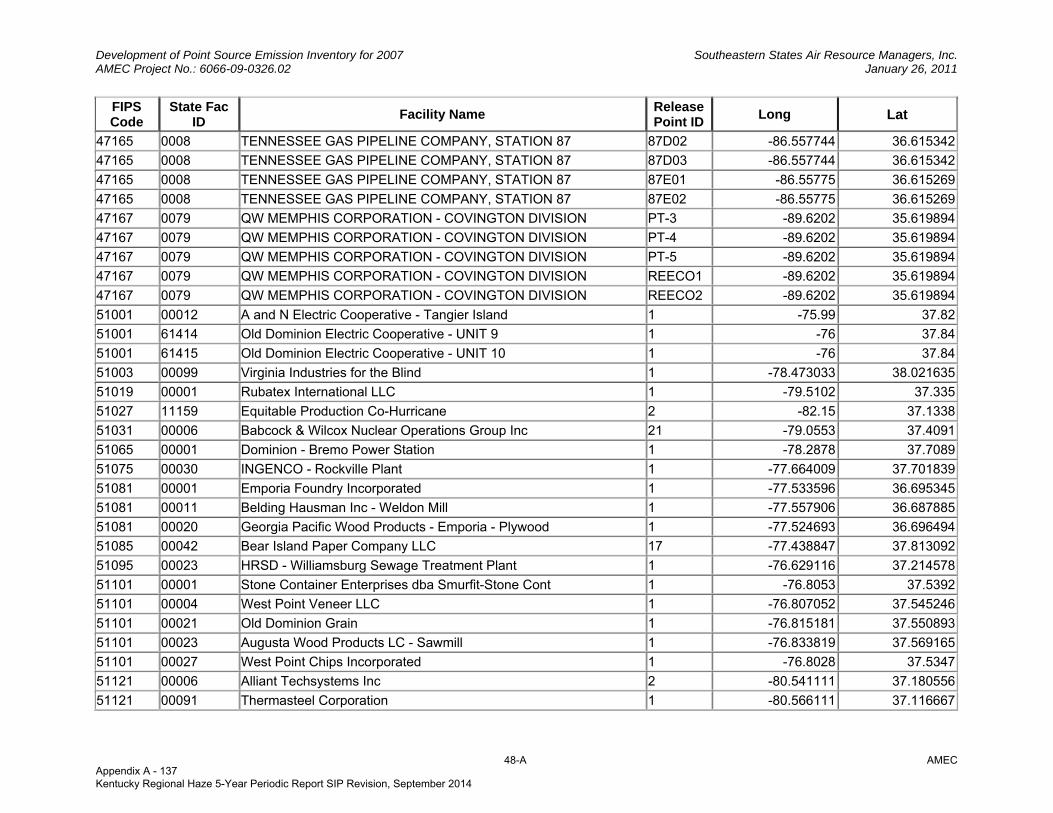
Development of Point Source Emission Inventory for 2007 Southeastern States Air Resource Managers, Inc. AMEC Project No.: 6066-09-0326.02 January 26, 2011
48-A AMEC
FIPS Code
State Fac ID Facility Name Release
Point IDLong Lat
47165 0008 TENNESSEE GAS PIPELINE COMPANY, STATION 87 87D02 -86.557744 36.615342
47165 0008 TENNESSEE GAS PIPELINE COMPANY, STATION 87 87D03 -86.557744 36.615342
47165 0008 TENNESSEE GAS PIPELINE COMPANY, STATION 87 87E01 -86.55775 36.615269
47165 0008 TENNESSEE GAS PIPELINE COMPANY, STATION 87 87E02 -86.55775 36.615269
47167 0079 QW MEMPHIS CORPORATION - COVINGTON DIVISION PT-3 -89.6202 35.619894
47167 0079 QW MEMPHIS CORPORATION - COVINGTON DIVISION PT-4 -89.6202 35.619894
47167 0079 QW MEMPHIS CORPORATION - COVINGTON DIVISION PT-5 -89.6202 35.619894
47167 0079 QW MEMPHIS CORPORATION - COVINGTON DIVISION REECO1 -89.6202 35.619894
47167 0079 QW MEMPHIS CORPORATION - COVINGTON DIVISION REECO2 -89.6202 35.619894
51001 00012 A and N Electric Cooperative - Tangier Island 1 -75.99 37.82
51001 61414 Old Dominion Electric Cooperative - UNIT 9 1 -76 37.84
51001 61415 Old Dominion Electric Cooperative - UNIT 10 1 -76 37.84
51003 00099 Virginia Industries for the Blind 1 -78.473033 38.021635
51019 00001 Rubatex International LLC 1 -79.5102 37.335
51027 11159 Equitable Production Co-Hurricane 2 -82.15 37.1338
51031 00006 Babcock & Wilcox Nuclear Operations Group Inc 21 -79.0553 37.4091
51065 00001 Dominion - Bremo Power Station 1 -78.2878 37.7089
51075 00030 INGENCO - Rockville Plant 1 -77.664009 37.701839
51081 00001 Emporia Foundry Incorporated 1 -77.533596 36.695345
51081 00011 Belding Hausman Inc - Weldon Mill 1 -77.557906 36.687885
51081 00020 Georgia Pacific Wood Products - Emporia - Plywood 1 -77.524693 36.696494
51085 00042 Bear Island Paper Company LLC 17 -77.438847 37.813092
51095 00023 HRSD - Williamsburg Sewage Treatment Plant 1 -76.629116 37.214578
51101 00001 Stone Container Enterprises dba Smurfit-Stone Cont 1 -76.8053 37.5392
51101 00004 West Point Veneer LLC 1 -76.807052 37.545246
51101 00021 Old Dominion Grain 1 -76.815181 37.550893
51101 00023 Augusta Wood Products LC - Sawmill 1 -76.833819 37.569165
51101 00027 West Point Chips Incorporated 1 -76.8028 37.5347
51121 00006 Alliant Techsystems Inc 2 -80.541111 37.180556
51121 00091 Thermasteel Corporation 1 -80.566111 37.116667
Appendix A - 137 Kentucky Regional Haze 5-Year Periodic Report SIP Revision, September 2014
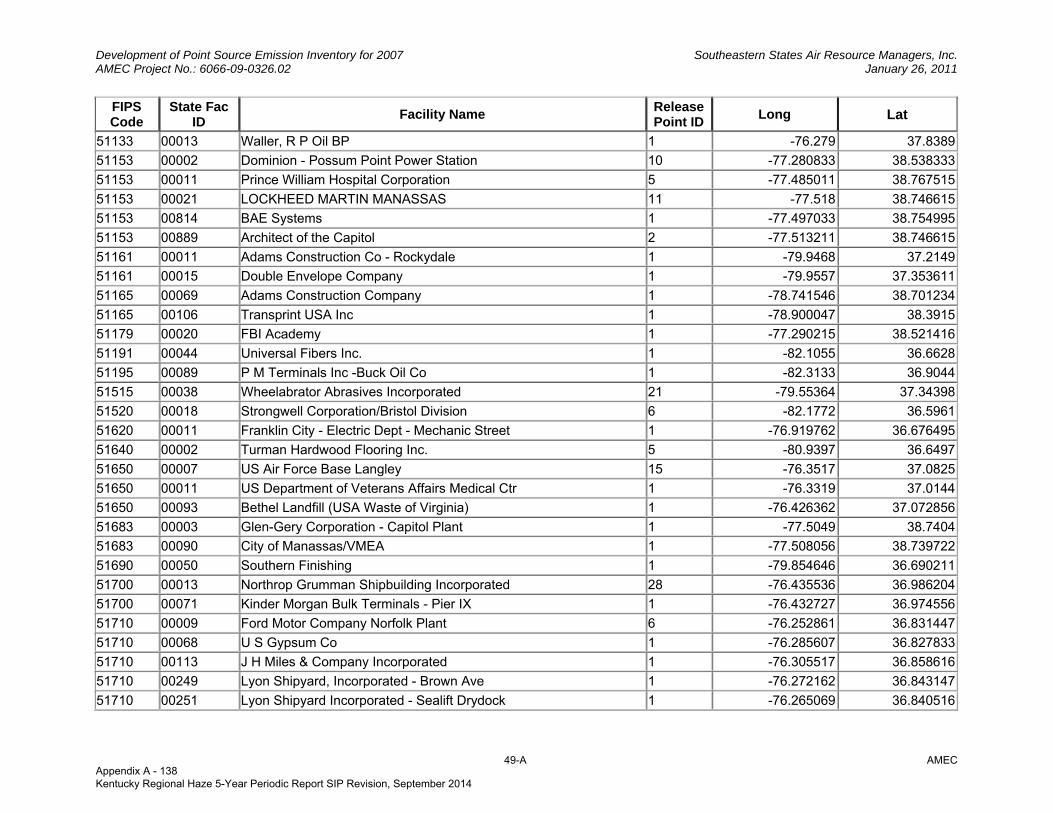
Development of Point Source Emission Inventory for 2007 Southeastern States Air Resource Managers, Inc. AMEC Project No.: 6066-09-0326.02 January 26, 2011
49-A AMEC
FIPS Code
State Fac ID Facility Name Release
Point IDLong Lat
51133 00013 Waller, R P Oil BP 1 -76.279 37.8389
51153 00002 Dominion - Possum Point Power Station 10 -77.280833 38.538333
51153 00011 Prince William Hospital Corporation 5 -77.485011 38.767515
51153 00021 LOCKHEED MARTIN MANASSAS 11 -77.518 38.746615
51153 00814 BAE Systems 1 -77.497033 38.754995
51153 00889 Architect of the Capitol 2 -77.513211 38.746615
51161 00011 Adams Construction Co - Rockydale 1 -79.9468 37.2149
51161 00015 Double Envelope Company 1 -79.9557 37.353611
51165 00069 Adams Construction Company 1 -78.741546 38.701234
51165 00106 Transprint USA Inc 1 -78.900047 38.3915
51179 00020 FBI Academy 1 -77.290215 38.521416
51191 00044 Universal Fibers Inc. 1 -82.1055 36.6628
51195 00089 P M Terminals Inc -Buck Oil Co 1 -82.3133 36.9044
51515 00038 Wheelabrator Abrasives Incorporated 21 -79.55364 37.34398
51520 00018 Strongwell Corporation/Bristol Division 6 -82.1772 36.5961
51620 00011 Franklin City - Electric Dept - Mechanic Street 1 -76.919762 36.676495
51640 00002 Turman Hardwood Flooring Inc. 5 -80.9397 36.6497
51650 00007 US Air Force Base Langley 15 -76.3517 37.0825
51650 00011 US Department of Veterans Affairs Medical Ctr 1 -76.3319 37.0144
51650 00093 Bethel Landfill (USA Waste of Virginia) 1 -76.426362 37.072856
51683 00003 Glen-Gery Corporation - Capitol Plant 1 -77.5049 38.7404
51683 00090 City of Manassas/VMEA 1 -77.508056 38.739722
51690 00050 Southern Finishing 1 -79.854646 36.690211
51700 00013 Northrop Grumman Shipbuilding Incorporated 28 -76.435536 36.986204
51700 00071 Kinder Morgan Bulk Terminals - Pier IX 1 -76.432727 36.974556
51710 00009 Ford Motor Company Norfolk Plant 6 -76.252861 36.831447
51710 00068 U S Gypsum Co 1 -76.285607 36.827833
51710 00113 J H Miles & Company Incorporated 1 -76.305517 36.858616
51710 00249 Lyon Shipyard, Incorporated - Brown Ave 1 -76.272162 36.843147
51710 00251 Lyon Shipyard Incorporated - Sealift Drydock 1 -76.265069 36.840516
Appendix A - 138 Kentucky Regional Haze 5-Year Periodic Report SIP Revision, September 2014
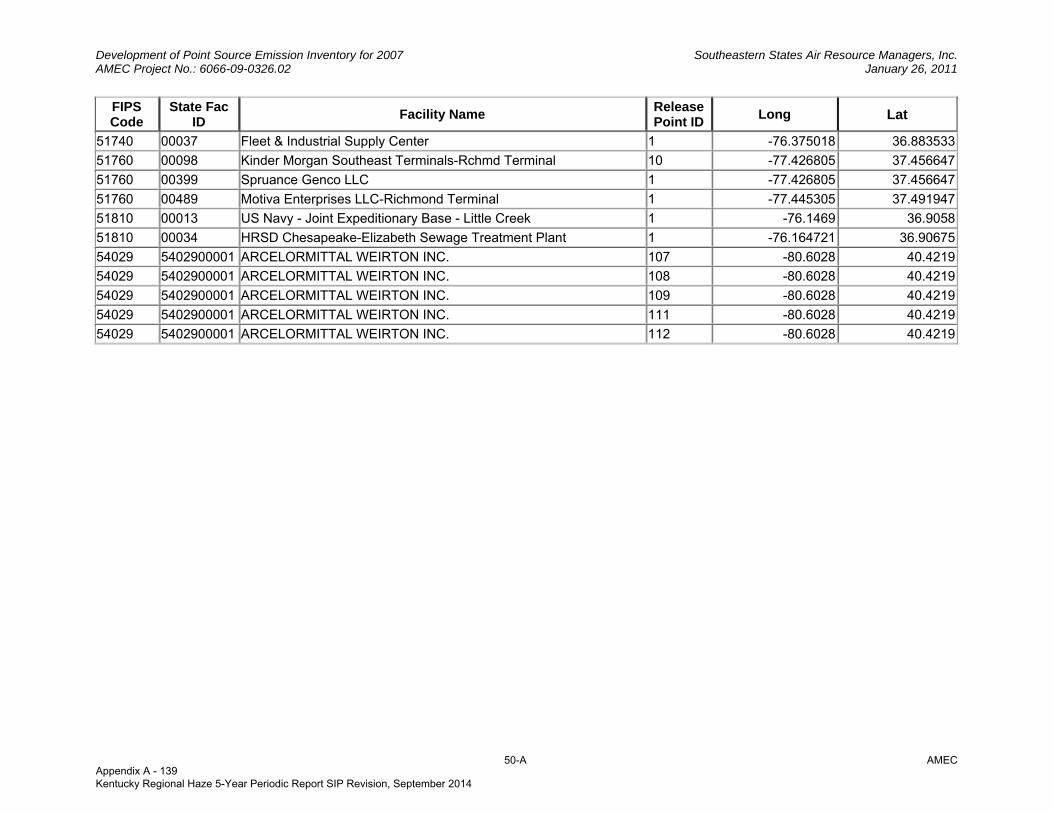
Development of Point Source Emission Inventory for 2007 Southeastern States Air Resource Managers, Inc. AMEC Project No.: 6066-09-0326.02 January 26, 2011
50-A AMEC
FIPS Code
State Fac ID Facility Name Release
Point IDLong Lat
51740 00037 Fleet & Industrial Supply Center 1 -76.375018 36.883533
51760 00098 Kinder Morgan Southeast Terminals-Rchmd Terminal 10 -77.426805 37.456647
51760 00399 Spruance Genco LLC 1 -77.426805 37.456647
51760 00489 Motiva Enterprises LLC-Richmond Terminal 1 -77.445305 37.491947
51810 00013 US Navy - Joint Expeditionary Base - Little Creek 1 -76.1469 36.9058
51810 00034 HRSD Chesapeake-Elizabeth Sewage Treatment Plant 1 -76.164721 36.90675
54029 5402900001 ARCELORMITTAL WEIRTON INC. 107 -80.6028 40.4219
54029 5402900001 ARCELORMITTAL WEIRTON INC. 108 -80.6028 40.4219
54029 5402900001 ARCELORMITTAL WEIRTON INC. 109 -80.6028 40.4219
54029 5402900001 ARCELORMITTAL WEIRTON INC. 111 -80.6028 40.4219
54029 5402900001 ARCELORMITTAL WEIRTON INC. 112 -80.6028 40.4219
Appendix A - 139 Kentucky Regional Haze 5-Year Periodic Report SIP Revision, September 2014
Appendix B: Comparison of Original EGU Emissions Prepared by AMEC (V_1_10) with Emissions Prepared by WV DAQ (v_1_10a)
Appendix A - 140 Kentucky Regional Haze 5-Year Periodic Report SIP Revision, September 2014
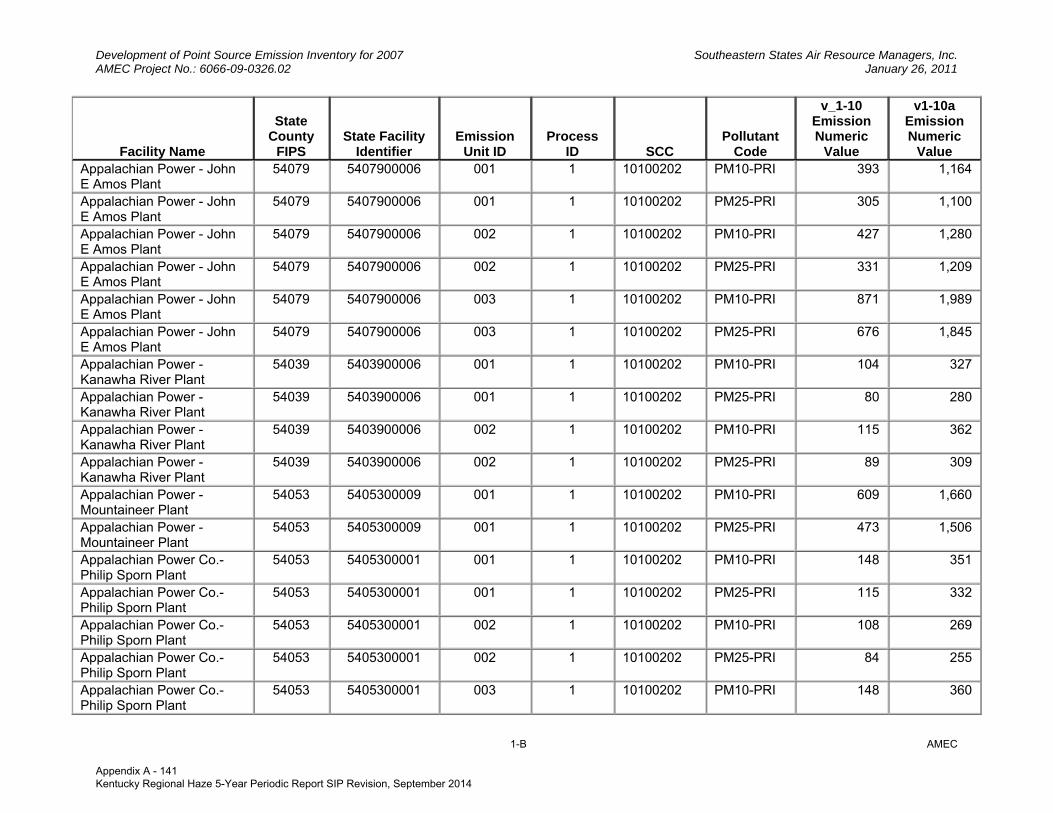
Development of Point Source Emission Inventory for 2007 Southeastern States Air Resource Managers, Inc. AMEC Project No.: 6066-09-0326.02 January 26, 2011
1-B AMEC
Facility Name
State County
FIPS State Facility
Identifier Emission
Unit ID Process
ID SCC Pollutant
Code
v_1-10 Emission Numeric
Value
v1-10a Emission Numeric
Value Appalachian Power - John E Amos Plant
54079 5407900006 001 1 10100202 PM10-PRI 393 1,164
Appalachian Power - John E Amos Plant
54079 5407900006 001 1 10100202 PM25-PRI 305 1,100
Appalachian Power - John E Amos Plant
54079 5407900006 002 1 10100202 PM10-PRI 427 1,280
Appalachian Power - John E Amos Plant
54079 5407900006 002 1 10100202 PM25-PRI 331 1,209
Appalachian Power - John E Amos Plant
54079 5407900006 003 1 10100202 PM10-PRI 871 1,989
Appalachian Power - John E Amos Plant
54079 5407900006 003 1 10100202 PM25-PRI 676 1,845
Appalachian Power - Kanawha River Plant
54039 5403900006 001 1 10100202 PM10-PRI 104 327
Appalachian Power - Kanawha River Plant
54039 5403900006 001 1 10100202 PM25-PRI 80 280
Appalachian Power - Kanawha River Plant
54039 5403900006 002 1 10100202 PM10-PRI 115 362
Appalachian Power - Kanawha River Plant
54039 5403900006 002 1 10100202 PM25-PRI 89 309
Appalachian Power - Mountaineer Plant
54053 5405300009 001 1 10100202 PM10-PRI 609 1,660
Appalachian Power - Mountaineer Plant
54053 5405300009 001 1 10100202 PM25-PRI 473 1,506
Appalachian Power Co.-Philip Sporn Plant
54053 5405300001 001 1 10100202 PM10-PRI 148 351
Appalachian Power Co.-Philip Sporn Plant
54053 5405300001 001 1 10100202 PM25-PRI 115 332
Appalachian Power Co.-Philip Sporn Plant
54053 5405300001 002 1 10100202 PM10-PRI 108 269
Appalachian Power Co.-Philip Sporn Plant
54053 5405300001 002 1 10100202 PM25-PRI 84 255
Appalachian Power Co.-Philip Sporn Plant
54053 5405300001 003 1 10100202 PM10-PRI 148 360
Appendix A - 141 Kentucky Regional Haze 5-Year Periodic Report SIP Revision, September 2014

Development of Point Source Emission Inventory for 2007 Southeastern States Air Resource Managers, Inc. AMEC Project No.: 6066-09-0326.02 January 26, 2011
2-B AMEC
Facility Name
State County
FIPS State Facility
Identifier Emission
Unit ID Process
ID SCC Pollutant
Code
v_1-10 Emission Numeric
Value
v1-10a Emission Numeric
Value Appalachian Power Co.-Philip Sporn Plant
54053 5405300001 003 1 10100202 PM25-PRI 115 341
Appalachian Power Co.-Philip Sporn Plant
54053 5405300001 004 1 10100202 PM10-PRI 155 377
Appalachian Power Co.-Philip Sporn Plant
54053 5405300001 004 1 10100202 PM25-PRI 120 357
Appalachian Power Co.-Philip Sporn Plant
54053 5405300001 005 1 10100202 PM10-PRI 373 818
Appalachian Power Co.-Philip Sporn Plant
54053 5405300001 005 1 10100202 PM25-PRI 289 773
Monongahela Power Co - Albright P.S.
54077 5407700001 001 1 10100202 PM10-PRI 7 281
Monongahela Power Co - Albright P.S.
54077 5407700001 001 1 10100202 PM25-PRI 4 273
Monongahela Power Co - Albright P.S.
54077 5407700001 002 1 10100202 PM10-PRI 11 280
Monongahela Power Co - Albright P.S.
54077 5407700001 002 1 10100202 PM25-PRI 6 273
Monongahela Power Co - Albright P.S.
54077 5407700001 003 1 10100212 PM10-PRI 0 609
Monongahela Power Co - Albright P.S.
54077 5407700001 003 1 10100212 PM25-PRI 0 567
Monongahela Power Co. - Rivesville Ps
54049 5404900009 001 1 10100202 PM10-PRI 1 4
Monongahela Power Co. - Rivesville Ps
54049 5404900009 001 1 10100202 PM25-PRI 1 4
Monongahela Power Co. - Rivesville Ps
54049 5404900009 002 1 10100202 PM10-PRI 32 166
Monongahela Power Co. - Rivesville Ps
54049 5404900009 002 1 10100202 PM25-PRI 19 137
Monongahela Power Co.- Fort Martin Power
54061 5406100001 001 1 10100212 PM10-PRI 110 2,196
Monongahela Power Co.- Fort Martin Power
54061 5406100001 001 1 10100212 PM25-PRI 65 2,164
Appendix A - 142 Kentucky Regional Haze 5-Year Periodic Report SIP Revision, September 2014

Development of Point Source Emission Inventory for 2007 Southeastern States Air Resource Managers, Inc. AMEC Project No.: 6066-09-0326.02 January 26, 2011
3-B AMEC
Facility Name
State County
FIPS State Facility
Identifier Emission
Unit ID Process
ID SCC Pollutant
Code
v_1-10 Emission Numeric
Value
v1-10a Emission Numeric
Value Monongahela Power Co.- Fort Martin Power
54061 5406100001 002 1 10100202 PM10-PRI 66 2,254
Monongahela Power Co.- Fort Martin Power
54061 5406100001 002 1 10100202 PM25-PRI 39 2,219
Monongahela Power Co.-Willow Island
54073 5407300004 001 1 10100202 PM10-PRI 2 135
Monongahela Power Co.-Willow Island
54073 5407300004 001 1 10100202 PM25-PRI 1 117
Monongahela Power Co.-Willow Island
54073 5407300004 002 1 10100203 PM10-PRI 236 368
Monongahela Power Co.-Willow Island
54073 5407300004 002 1 10100203 PM25-PRI 211 337
Monongahela Power Co-Harrison
54033 5403300015 001 1 10100202 PM10-PRI 603 943
Monongahela Power Co-Harrison
54033 5403300015 001 1 10100202 PM25-PRI 480 644
Monongahela Power Co-Harrison
54033 5403300015 002 1 10100202 PM10-PRI 506 859
Monongahela Power Co-Harrison
54033 5403300015 002 1 10100202 PM25-PRI 403 583
Monongahela Power Co-Harrison
54033 5403300015 003 1 10100202 PM10-PRI 632 1,060
Monongahela Power Co-Harrison
54033 5403300015 003 1 10100202 PM25-PRI 503 723
Monongahela Power Co-Pleasants Power Sta
54073 5407300005 001 1 10100202 PM10-PRI 584 465
Monongahela Power Co-Pleasants Power Sta
54073 5407300005 001 1 10100202 PM25-PRI 314 395
Monongahela Power Co-Pleasants Power Sta
54073 5407300005 002 1 10100202 PM10-PRI 258 490
Monongahela Power Co-Pleasants Power Sta
54073 5407300005 002 1 10100202 PM25-PRI 139 414
Mount Storm Power Station 54023 5402300003 001 1 10100212 PM10-PRI 92 2,388Mount Storm Power Station 54023 5402300003 001 1 10100212 PM25-PRI 73 2,355
Appendix A - 143 Kentucky Regional Haze 5-Year Periodic Report SIP Revision, September 2014

Development of Point Source Emission Inventory for 2007 Southeastern States Air Resource Managers, Inc. AMEC Project No.: 6066-09-0326.02 January 26, 2011
4-B AMEC
Facility Name
State County
FIPS State Facility
Identifier Emission
Unit ID Process
ID SCC Pollutant
Code
v_1-10 Emission Numeric
Value
v1-10a Emission Numeric
Value Mount Storm Power Station 54023 5402300003 002 1 10100212 PM10-PRI 97 2,488Mount Storm Power Station 54023 5402300003 002 1 10100212 PM25-PRI 77 2,454Mount Storm Power Station 54023 5402300003 003 1 10100212 PM10-PRI 191 510Mount Storm Power Station 54023 5402300003 003 1 10100212 PM25-PRI 151 397North Branch Power Station
54023 5402300014 001 1 10100217 PM10-PRI 19 55
North Branch Power Station
54023 5402300014 001 1 10100217 PM25-PRI 3 55
North Branch Power Station
54023 5402300014 002 1 10100217 PM10-PRI 18 34
North Branch Power Station
54023 5402300014 002 1 10100217 PM25-PRI 3 34
Ohio Power - Kammer Plant
54051 5405100006 001 1 10100203 PM10-PRI 34 760
Ohio Power - Kammer Plant
54051 5405100006 001 1 10100203 PM25-PRI 28 754
Ohio Power - Kammer Plant
54051 5405100006 002 1 10100203 PM10-PRI 33 726
Ohio Power - Kammer Plant
54051 5405100006 002 1 10100203 PM25-PRI 27 720
Ohio Power - Kammer Plant
54051 5405100006 003 1 10100203 PM10-PRI 34 755
Ohio Power - Kammer Plant
54051 5405100006 003 1 10100203 PM25-PRI 28 750
Ohio Power - Mitchell Plant 54051 5405100005 001 1 10100202 PM10-PRI 244 1,112Ohio Power - Mitchell Plant 54051 5405100005 001 1 10100202 PM25-PRI 189 1,056Ohio Power - Mitchell Plant 54051 5405100005 002 1 10100202 PM10-PRI 331 1,416Ohio Power - Mitchell Plant 54051 5405100005 002 1 10100202 PM25-PRI 257 1,345
Notes: v_1_10 values based on PM augmentation by AMEC of PM filterable data provided by WV DAQv_1_10a values calculated from emission factors based on the ratio of NEI 2002 emissions to CAMD 2002 heat inputs. Those factors were applied to 2007 CAMD heat inputs.
At the time WV DAQ requested that its data replace the original AMEC data, DAQ believed that the same methodology was necessary between its 2008 NEI submittal and the 2007 SEMAP inventory. That belief later turned out to be incorrect. Therefore, the SEMAP 2007 inventory that was modeled reflectsdifferent methodology for WV EGUs than was used for the other SEMAP states.
Appendix A - 144 Kentucky Regional Haze 5-Year Periodic Report SIP Revision, September 2014

AREA AND NONROAD 2007 BASE YEAR INVENTORIES
REVISED FINAL REPORT
Contract No. S-2009-06-01
January 2012
Prepared for:
Ronald C. Methier Southeastern States Air Resource Managers, Inc.
526 Forest Parkway, Suite F Forest Park, GA 30297-6140
Prepared by:
TranSystems Corporation 3622 Lyckan Parkway, Suite 2005
Durham, NC 27707
Appendix A - 145 Kentucky Regional Haze 5-Year Periodic Report SIP Revision, September 2014

[This page intentionally left blank.]
Appendix A - 146 Kentucky Regional Haze 5-Year Periodic Report SIP Revision, September 2014
January 2012
Final Report
iii
CONTENTS Page
TABLES ........................................................................................................................................................................ iv
FIGURES ...................................................................................................................................................................... iv
I. INTRODUCTION .................................................................................................................................................. 1
II. STATIONARY AREA SOURCE INVENTORY ...................................................................................................... 3
A. AGENCY SUPPLIED INVENTORY DATA .................................................................................................. 3
B. DEVELOPMENT OF TRANSYSTEMS DEFAULT 2007 AREA SOURCE INVENTORY ............................ 5
1. 2008 Nonpoint Source NEI .............................................................................................................. 5
a. Adjustment of NEI Data to Reflect 2007 Activity Levels ............................................................... 11
b. Adjustment of NEI Data to Remove Activity Reflected in the Point Source Inventory .................. 11
2. Estimation of Area Source Emissions from Industrial and Commercial/Institutional Fuel Combustion ................................................................................................................................... 16
a. Total ICI Energy Consumption ..................................................................................................... 18
b. Stationary Source Energy Consumption ...................................................................................... 18
c. Non-Fuel Energy Consumption .................................................................................................... 22
d. Emission Factors ......................................................................................................................... 23
e. Coal Sulfur and Ash Content ....................................................................................................... 25
f. County Allocation Data ................................................................................................................ 27
3. Estimation of Area Source Emissions from Residential Wood Combustion .................................. 29
4. Estimation of Area Source Emissions from Gasoline Service Stations/Stage I ............................. 34
C. INVENTORY SUPPLEMENTATION/FINAL DATA MERGING ................................................................. 34
D. QA/QC PROCEDURES ............................................................................................................................ 39
III. 2007 NONROAD MOBILE SOURCE INVENTORY ................................................................................................ 40
A. NONROAD MODEL CATEGORIES .......................................................................................................... 40
B. AIRCRAFT ................................................................................................................................................ 42
C. COMMERCIAL MARINE VESSELS .......................................................................................................... 43
D. LOCOMOTIVES ........................................................................................................................................ 47
E. QA/QC PROCEDURES ............................................................................................................................ 48
IV. EMISSIONS SUMMARIES ................................................................................................................................. 51
A. STATIONARY AREA SOURCE EMISSIONS ........................................................................................... 51
B. NONROAD MOBILE SOURCE EMISSIONS ............................................................................................ 56
V. REFERENCES ................................................................................................................................................... 61
APPENDIX A. POINT SOURCE SUBTRACTION PROCEDURE DETAILS ....................................................... A-1
Appendix A - 147 Kentucky Regional Haze 5-Year Periodic Report SIP Revision, September 2014
January 2012
Final Report
iv
TABLES Table II-1. Overview of Area Source Inventory Components by State/Local Agency ................................................... 4
Table II-2. 2008 NEI Area Source Categories for Which EPA Has Developed Emission Estimates ............................. 6
Table II-3. Methods for Updating 2008 NEI Estimates that Are Not Based on 2007 Emissions Activity ..................... 12
Table II-4. Throughput-Based Area Source Emission Adjustments ............................................................................ 16
Table II.5. ICI Fuel Combustion Area Source Classification Codes ............................................................................ 17
Table II-6. LPG Nonroad Mobile Source Classification Codes .................................................................................... 19
Table II-7. Assumptions Used to Estimate Industrial Sector Stationary Source Distillate Fuel Consumption ............. 22
Table II-8. Assumptions Used to Estimate Commercial/Institutional Sector Stationary Source Distillate Fuel Consumption ......................................................................................................................................... 22
Table II-9. Industrial Sector Energy Consumption from Non-Fuel Uses...................................................................... 23
Table II-10. Criteria Pollutant Emission Factors for ICI Combustion Area Source Categories .................................... 24
Table II-11. Bituminous/Subbituminous Coal Sulfur Content for 2007 ICI Combustion .............................................. 26
Table II-12. Anthracite Coal Ash and Sulfur Content for 2007 ICI Combustion ........................................................... 26
Table II-13. Summary of Data Carried Forward/Grown From 2002 NEI ..................................................................... 36
Table II-14. Area Source Inventory Data Source Codes ............................................................................................. 39
Table III-1. Summary of 2007 NCD Tables and State Comments............................................................................... 41
Table III-2. Aircraft Source Classification Codes ......................................................................................................... 42
Table III-3. Summary of State Updates to Aircraft Category Emissions ...................................................................... 43
Table III-4. Category 1 & CMV Growth Factors, by Pollutant ...................................................................................... 44
Table III-5. Category 3 CMV Growth Factors, by State and SCC ............................................................................... 45
Table III-6. Summary of State Updates to Commercial Marine Category Emissions .................................................. 46
Table III-7. Summary of State Updates to Locomotive Category Emissions ............................................................... 49
Table III-8. Data Source Codes Used for Final 2007 Nonroad Mobile Emission Estimates ........................................ 50
Table IV-1. Final 2007 SESARM Area Source Emissions by Major Sector ................................................................ 51
Table IV-2. Final 2007 Area Source Emission Estimates by State ............................................................................. 52
Table IV-3. Final 2007 Combustion Emission Estimates by State .............................................................................. 53
Table IV-4. Final 2007 Solvent Emission Estimates by State ..................................................................................... 54
Table IV-5. Final 2007 Fugitive Dust Emission Estimates by State ............................................................................ 55
Table IV-6. Final 2007 All Other Area Source Emission Estimates by State............................................................... 56
Table IV-7. Final 2007 SESARM Nonroad Source Emissions by Major Sector .......................................................... 57
Table IV-8. Final 2007 NONROAD Model Emission Estimates by State .................................................................... 57
Table IV-9. Final 2007 Aircraft Emission Estimates by State ...................................................................................... 58
Table IV-10. Final 2007 Commercial Marine Vessel Emission Estimates by State ..................................................... 59
Table IV-11. Final 2007 Locomotive Emission Estimates by State ............................................................................. 60
Table A-1. Industrial Fuel Combustion Crosswalk for Point Source Subtractions. .................................................... A-3
Table A-2. Commercial/Institutional Fuel Combustion Crosswalk for Point Source Subtractions ........................... A-12
Table A-3. Construction Crosswalk for Point Source Subtractions ......................................................................... A-15
Table A-4. Publicly Owned Treatment Works Crosswalk for Point Source Subtractions ........................................ A-16
Table A-5. Solvent Utilization Crosswalk for Point Source Subtractions ................................................................. A-17
Table A-6. Gasoline Distribution Crosswalk for Point Source Subtractions ............................................................ A-32
Table A-7. Mining and Quarrying Crosswalk for Point Source Subtraction ............................................................. A-38
Table A-8. Agriculture Production Crosswalk for Livestock ..................................................................................... A-41
FIGURES Figure 1. Decision Tree for Assigning Regional Average (Default) or National Urban Appliance Profile .................... 31
Figure 2. Decision Tree for Assigning Average (Default), Urban, or Rural Burn Profiles ............................................ 33
Appendix A - 148 Kentucky Regional Haze 5-Year Periodic Report SIP Revision, September 2014
January 2012
Final Report
1
I. INTRODUCTION TranSystems is supporting the Southeastern States Air Resource Managers, Inc. (SESARM) in the Southeastern Modeling, Analysis, and Planning (SEMAP) project that is funded by the same ten states originally involved in the Visibility Improvement – State and Tribal Association of the Southeast (VISTAS) project. The SEMAP project addresses the next phase of ozone, fine particle, and regional haze assessment obligations of the SESARM member states. The SEMAP project is designed to produce technical analyses to aid the participating agencies in developing State Implementation Plans (SIPs) required by the Clean Air Act. In June 2010, TranSystems developed a set of “final” 2007 area and nonroad source base year inventory emission estimates (Pechan, 2010). These estimates are reported by county and source classification code (SCC), and were developed using data from a number of sources:
• State/Local (S/L) agency emissions data;
• 2007 year emissions data compiled from running EPA’s NONROAD model with a combination of EPA default and S/L agency-supplied inputs;
• 2007 area source emissions estimated by TranSystems, generally developed using the emissions estimation procedures used to prepare EPA’s draft 2008 National Emissions Inventory (NEI);1
• 2007 industrial and commercial/institutional (ICI) fuel combustion emission estimates developed by TranSystems;
• 2008 commercial marine vessel and aircraft emission estimates from EPA’s draft 2008 NEI, modified by TranSystems to reflect 2007 activity levels;
• 2007 switchyard and Class I line-haul locomotive estimates provided by the Eastern Regional Technical Advisory Committee (ERTAC); and
• 2008 ERTAC Class II/III line-haul locomotive emission estimates, modified by TranSystems to reflect 2007 activity levels.
Because EPA had not developed draft 2008 NEI emission estimates for Agricultural Tilling, Mining and Quarrying, and Pesticide Application at the time that the final area/nonroad source inventory was prepared, the final area source inventory also incorporated guidance from S/L agencies as to whether to incorporate emission estimates carried forward or grown2 from EPA’s 2002 area source NEI for these source categories. For ICI fuel combustion and other NEI source categories for which draft emission estimates reflected total emissions activity, it was necessary for TranSystems to perform point source subtractions to develop estimates of the emissions from area sources. These point source subtractions were performed using version 1.3 of the 2007 SEMAP point source inventory. Since the final area source inventory was prepared in June 2010, SESARM requested that TranSystems incorporate additional S/L agency feedback into a revised final area source inventory. This feedback included direction to use updated agency emissions data, and to revise/remove other emission estimates. In the latter case, feedback included direction to replace S/L agency estimates with TranSystems defaults, and to remove emission estimates for specific fire source categories: Open Burning of Land Clearing Debris; Agricultural Field Burning; Forest Wildfire; and Prescribed Burning (these source categories are covered by a separate fire inventory developed by a different SESARM contractor).3 For two source categories, Residential Wood Combustion and Stage I Gasoline Service Stations, SESARM directed TranSystems to develop new emission estimates reflecting changes to some of the inputs that had been used to develop the 2008 area source NEI emission estimates. In addition, SESARM directed
1 2008 NEI methods rely on Eastern Regional Technical Advisory Committee (ERTAC) methods when available. 2 Based on direction from S/L agencies, some 2002 NEI emission estimates were projected to 2007 using emission activity growth factors from Version 5.0 of the Economic Growth Analysis System (EGAS) (EPA, 2010). 3 In the case of Open Burning of Land Clearing Debris and Agricultural Field Burning, TranSystems provided the contractor (AMEC) with a file containing the final area source inventory’s emission estimates.
Appendix A - 149 Kentucky Regional Haze 5-Year Periodic Report SIP Revision, September 2014

January 2012
Final Report
2
TranSystems to re-perform the point source subtractions using an updated version (1.10a) of the SEMAP 2007 point source inventory. 4, 5 Changes to the final nonroad mobile source inventory were relatively modest, with the only major change relating to the development of updated NONROAD model emission estimates for Virginia using a new set of Reid vapor pressure (RVP) values provided by the State. The following sections provide additional details on the inventory development process. The major topics that are discussed are:
• How TranSystems identified source categories and/or pollutants that may have been missing from the S/L agency supplied data;
• How TranSystems integrated data from the various emission data sources (i.e., S/L agencies, TranSystems defaults, ERTAC, and 2008 and 2002 NEI); and
• How TranSystems quality assured the integrated emissions inventory. The balance of this report is organized as follows. Section II describes the development of the stationary area source sector inventory. The development of the nonroad mobile source sector inventory is described in Section III. Section IV presents the area and nonroad source emission summaries for the final 2007 base year inventory for the SEMAP project. Section V presents the references that were consulted in preparing the revised final inventory.
4 As requested, TranSystems performed the point source subtractions for Georgia at the State-level (per Georgia’s earlier direction, the final inventory had performed these subtractions at the county-level). 5 It should be noted that although EPA recently developed emissions estimates for Agricultural Tilling, Mining and Quarrying, and Pesticide Application, and also incorporated revisions to the draft NEI emission estimates for Open Burning of Household Waste (2610030000) and Yard Waste (2610000100 and 2610000400), and Fugitive Dust from Paved Roads (2294000000), SESARM elected not to incorporate these updates into the revised final area source inventory.
Appendix A - 150 Kentucky Regional Haze 5-Year Periodic Report SIP Revision, September 2014
January 2012
Final Report
3
II. STATIONARY AREA SOURCE INVENTORY TranSystems developed the revised final 2007 base year area source inventory for the SEMAP project from a combination of six sources:
1) S/L agency supplied area source emissions data; 2) TranSystems 2007 area source emission estimates developed using the emission estimation methods from
the 2008 NEI with adjustments to reflect 2007 emissions activity and to subtract point source emissions; 3) TranSystems 2007 industrial and commercial/institutional fuel combustion area source emission estimates
specifically developed for the SESARM states; 4) TranSystems 2007 emission estimates for gasoline service stations/stage I unloading; 5) TranSystems 2007 emission estimates using EPA’s residential wood combustion tool with SESARM-
identified modifications, and 6) Area source emission estimates carried forward or grown from EPA’s 2002 nonpoint source NEI.
Table II-1 summarizes how these data sources were merged to create a comprehensive stationary area source inventory for jurisdictions covered by the SEMAP project. The following sections provide more specifics on the contents of each of these data sources and how they were combined into the final 2007 area source inventory.
A. AGENCY SUPPLIED INVENTORY DATA TranSystems commenced area source inventory development work by providing S/L agencies with a Technical Memorandum documenting the emission estimation methods and data TranSystems was using to develop the U.S. Environmental Protection Agency (EPA)’s 2008 nonpoint source NEI (Pechan, 2009a). The purpose of this memorandum was to provide agencies with information to: (1) review and comment on the methods/data, and (2) assist agencies in evaluating the merits of the NEI methods/data relative to any S/L area source inventory development efforts. State and local agencies were then provided with several months to compile and transmit area source emissions data to TranSystems. Two state agencies (North Carolina and Virginia) and two local agencies (Jefferson County, Kentucky and Davidson County, Tennessee) provided area source data for the draft area source inventory (two additional local agencies provided data for the final area source inventory – Knox County and Shelby County, Tennessee). After receiving these S/L agency data, TranSystems compared the source classification code (SCC) and pollutant coverage of these submittals against the SCCs/pollutants in the 2007 emissions data that TranSystems was developing for this project (hereafter referred to as the “TranSystems default inventory”). To assist in obtaining direction from SESARM agencies on how to merge the data from these sources, TranSystems first identified the SCC/pollutant combinations in the TranSystems default inventory that matched to S/L agency data. Next, TranSystems reviewed remaining S/L agency SCC/pollutant combinations against TranSystems defaults to identify whether it may be possible that these emissions were covered in the TranSystems default inventory under different SCCs. TranSystems then developed a list of potential indirect matches between the two data sets for agency review. This list was compiled in an Excel worksheet. Next, TranSystems developed a separate worksheet that listed SCC/pollutant combinations in the S/L supplied area source inventory that we were unable to either directly or indirectly match to combinations in the TranSystems default inventory. A list of SCC/pollutant combinations in the TranSystems default inventory that we were unable to directly or indirectly match to combinations in the S/L agency inventory was also prepared in a separate worksheet. Finally, TranSystems developed a worksheet that contained all S/L agency inventory SCC/pollutant combinations with emissions equal to “0.” The above worksheets were saved in a single Excel workbook for each Agency. In addition to these workbooks, TranSystems transmitted a Word document identifying questions on how two merge the two data sets (e.g., where S/L agency emissions are reported as zero, should TranSystems replace any of these with emissions from the TranSystems default inventory?). After
Appendix A - 151 Kentucky Regional Haze 5-Year Periodic Report SIP Revision, September 2014
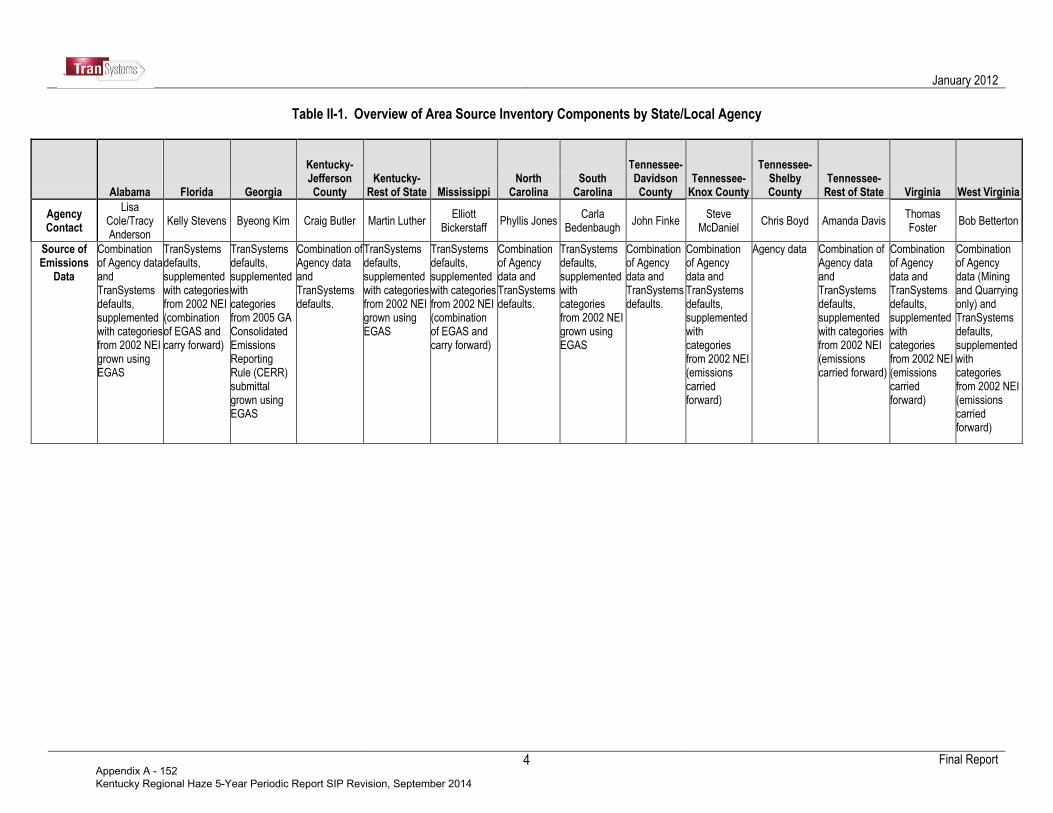
January 2012
Final Report
4
Table II-1. Overview of Area Source Inventory Components by State/Local Agency
Alabama Florida Georgia
Kentucky-Jefferson County
Kentucky-Rest of State Mississippi
North Carolina
South Carolina
Tennessee-Davidson County
Tennessee-Knox County
Tennessee-Shelby County
Tennessee-Rest of State Virginia West Virginia
Agency Contact
Lisa Cole/Tracy Anderson
Kelly Stevens Byeong Kim Craig Butler Martin Luther Elliott
Bickerstaff Phyllis Jones
Carla Bedenbaugh
John Finke Steve
McDaniel Chris Boyd Amanda Davis
Thomas Foster
Bob Betterton
Source of Emissions
Data
Combination of Agency data and TranSystems defaults, supplemented with categories from 2002 NEI grown using EGAS
TranSystems defaults, supplemented with categories from 2002 NEI (combination of EGAS and carry forward)
TranSystems defaults, supplemented with categories from 2005 GA Consolidated Emissions Reporting Rule (CERR) submittal grown using EGAS
Combination of Agency data and TranSystems defaults.
TranSystems defaults, supplemented with categories from 2002 NEI grown using EGAS
TranSystems defaults, supplemented with categories from 2002 NEI (combination of EGAS and carry forward)
Combination of Agency data and TranSystems defaults.
TranSystems defaults, supplemented with categories from 2002 NEI grown using EGAS
Combination of Agency data and TranSystems defaults.
Combination of Agency data and TranSystems defaults, supplemented with categories from 2002 NEI (emissions carried forward)
Agency data Combination of Agency data and TranSystems defaults, supplemented with categories from 2002 NEI (emissions carried forward)
Combination of Agency data and TranSystems defaults, supplemented with categories from 2002 NEI (emissions carried forward)
Combination of Agency data (Mining and Quarrying only) and TranSystems defaults, supplemented with categories from 2002 NEI (emissions carried forward)
Appendix A - 152 Kentucky Regional Haze 5-Year Periodic Report SIP Revision, September 2014
January 2012
Final Report
5
reviewing S/L agency responses to these questions, TranSystems transmitted any follow-up questions that were necessary to clarify S/L agency guidance.
B. DEVELOPMENT OF TRANSYSTEMS DEFAULT 2007 AREA SOURCE INVENTORY TranSystems created a default 2007 area source inventory that included all of the source categories covered by the 2008 nonpoint source NEI as of early 2010. For all these source categories except industrial and commercial/institutional (ICI) fuel combustion, stage I gasoline service stations, and residential wood combustion, TranSystems either directly incorporated emissions data from the 2008 nonpoint source NEI (when the NEI represented use of 2007 emissions activity data), or recalculated the NEI emission estimates to reflect 2007 activity levels (when the NEI reflected 2006 or 2008 activity levels) and/or removed the emissions associated with activity reflected in the point source inventory. As of early 2010, the 2008 nonpoint source NEI had only developed ICI fuel combustion emissions activity estimates, not emission estimates. Because of their potential importance and the availability of methodological improvements, TranSystems utilized an emissions estimation method for ICI fuel combustion that incorporated a few refinements to the NEI method. For stage I gasoline service stations, we developed emission estimates for this project using the NEI methods in combination with inputs reviewed and approved by S/L agencies. For residential wood combustion (RWC), TranSystems updated the emission estimates by running EPA’s RWC emissions estimation tool with updates to the tool’s wood consumption and wood-burning appliance profile/allocation assumptions. The following section discusses how information from the 2008 nonpoint source NEI was used in this project. The subsequent sections provide details on the methods used to estimate emissions from ICI fuel combustion, stage I gasoline service stations, and residential wood combustion. 1. 2008 Nonpoint Source NEI TranSystems supported EPA efforts to develop the 2008 nonpoint source NEI. Because of data availability issues, the 2008 NEI is comprised of data of various vintages (2006-2008). Table II-2 provides documentation of the 2008 nonpoint source NEI, which is as follows:
(1) Source Category – identifies the name of each general source category covered. (2) Source Classification Code(s) – lists the SCCs that are inventoried. (3) Source Classification Code Description – provides a description of each SCC. (4) Link to Emission Calculation Documentation – provides links to the detailed documentation of the NEI
methods;6 (5) Link to Emission Calculation Workbook – provides a link to the draft 2008 NEI emissions or activity data; (6) Year of Activity Data – identifies the year represented by the emissions activity data; and (7) Point Source Component – signifies whether a portion of the source category’s emissions may be included
within the point source inventory. When work commenced on the revised final base year inventory in late 2011, TranSystems notified SESARM of the availability of 2008 NEI emission estimates for the following additional area source categories: Agricultural Tilling, Mining and Quarrying, and Pesticide Application. SESARM directed TranSystems not to incorporate the 2008 NEI emission estimates for these categories. In lieu of such updates, the SEMAP emission estimates for these source categories reflect direction from S/L agencies as to whether to incorporate estimates based on emissions reported in the 2002 NEI. In such cases where these categories were identified for inclusion, agencies also provided direction as to whether the 2002 NEI emissions should be carried forward to represent 2007 emissions, or projected to 2007 using growth factors from the Economic Growth Analysis Systems (EGAS).
6 Left clicking on the hyperlink while simultaneously pressing the control key allows one to open or save the documentation/data of interest. The complete list of material can be accessed at: http://projects.pechan.com/EPA/Non-Point_Emission_Estimates/. Note that in some cases, this documentation reflects revisions that EPA incorporated after the NEI data were compiled for this project: SESARM opted not to incorporate NEI revisions for Open Burning of Household Waste (2610030000) and Yard Waste (2610000100 and 2610000400), and Fugitive Dust from Paved Roads (2294000000).
Appendix A - 153 Kentucky Regional Haze 5-Year Periodic Report SIP Revision, September 2014

January 2012
Final Report
6
Table II-2. 2008 NEI Area Source Categories for Which EPA Has Developed Emission Estimates
Source Category Source Classification
Code(s) Source Classification Code
Description Link to Emission Calculation
Documentation Link to Emission Calculation
Workbook
Year of Activity Data
Point Source Component
Agriculture Production – Livestock
28050nnnnn Livestock Agriculture_Production_Livestock_28050
nnnnn_Documentation.zip Agriculture_Production_Livestock_280
50nnnnn_Emissions.zip 2007
Yes (selected SCCs)
Asphalt Paving
2461021000 Cutback Asphalt Asphalt_Paving_Cutback_2461021000_
Documentation.zip Asphalt_Paving_Cutback_2461021000
_Emissions.zip 2008 No
2461022000 Emulsified Asphalt Asphalt_Paving_Emulsified_2461022000
_Documentation.zip Asphalt_Paving_Emulsified_24610220
00_Emissions.zip 2008 No
Aviation Gasoline Distribution: Stage I
2501080050 Aviation Gasoline:
Stage I Aviation_Gasoline_Distribution_Stage_I_
2501080050_Documentation.zip Aviation_Gasoline_Distribution_Stage
_I_2501080050_Emissions.zip 2008 No
Aviation Gasoline Distribution: Stage II
2501080100 Aviation Gasoline:
Stage II Aviation_Gasoline_Distribution_Stage_II_
2501080100_Documentation.zip Aviation_Gasoline_Distribution_Stage
_II_2501080100_Emissions.zip 2008 No
Commercial Cooking 2302002nnn 2302003nnn
Commercial Cooking Commercial_Cooking_2302002nnn_Doc
umentation.zip Commercial_Cooking_2302002nnn_E
missions.zip 2008 No
Construction Dust
2311010000 Residential Construction Residential_Construction_2311010000_
Documentation.zip Residential_Construction_2311010000
_Emissions.zip 2008 Yes
2311020000 Non-Residential Construction Non-
Residential_Construction_2311020000_Documentation.zip
Non-Residential_Construction_2311020000
_Emissions.zip 2008 Yes
2311030000 Road Construction Road_Construction_2311030000_Docum
entation.zip Road_Construction_2311030000_Emi
ssions.zip 2006 No
Fertilizer Application 28017000nn Fertilizer Application Fertilizer_Application_28017000nn_Docu
mentation.zip Fertilizer_Application_28017000nn_E
missions.zip 2007 No
Gasoline Distribution (SEMAP emissions were developed for Stage I
Gasoline Service Station Unloading using NEI
methods with S/L agency approved inputs)
25010110nn 25010120nn
Portable Fuel Containers Portable_Fuel_Containers_25010110nn_
25010120nn_Documentation.zip Portable_Fuel_Containers_25010110n
n_25010120nn_Emissions.zip 2008 No
2501050120 Gasoline Distribution Stage I;
Bulk Terminals Gasoline_Distribution_Stage_I_Documen
tation.zip Gasoline_Distribution_Stage_I_Bulk_Terminals_2501050120_Emissions.zip
2008 Yes
2501055120 Gasoline Distribution Stage I;
Bulk Plants Gasoline_Distribution_Stage_I_Documen
tation.zip Gasoline_Distribution_Stage_I_Bulk_P
lants_2501055120_Emissions.zip 2008 Yes
250106005n Gasoline Distribution Stage I;
Gasoline Service Station Unloading
Gasoline_Distribution_Stage_I_Documentation.zip
Gasoline_Distribution_Stage_I_Service_Station_Unloading_250106005n_E
missions.zip 2008 Yes
Appendix A - 154 Kentucky Regional Haze 5-Year Periodic Report SIP Revision, September 2014
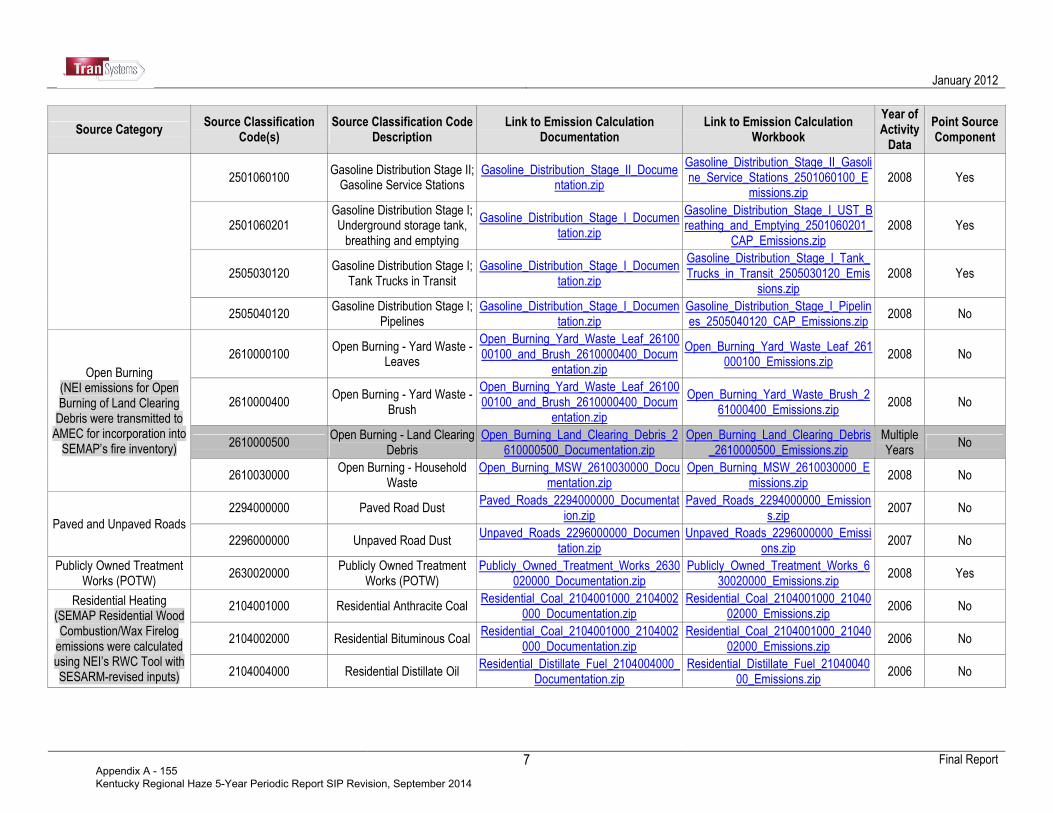
January 2012
Final Report
7
Source Category Source Classification
Code(s) Source Classification Code
Description Link to Emission Calculation
Documentation Link to Emission Calculation
Workbook
Year of Activity Data
Point Source Component
2501060100 Gasoline Distribution Stage II; Gasoline Service Stations
Gasoline_Distribution_Stage_II_Documentation.zip
Gasoline_Distribution_Stage_II_Gasoline_Service_Stations_2501060100_E
missions.zip 2008 Yes
2501060201 Gasoline Distribution Stage I; Underground storage tank, breathing and emptying
Gasoline_Distribution_Stage_I_Documentation.zip
Gasoline_Distribution_Stage_I_UST_Breathing_and_Emptying_2501060201_
CAP_Emissions.zip 2008 Yes
2505030120 Gasoline Distribution Stage I;
Tank Trucks in Transit Gasoline_Distribution_Stage_I_Documen
tation.zip
Gasoline_Distribution_Stage_I_Tank_Trucks_in_Transit_2505030120_Emis
sions.zip 2008 Yes
2505040120 Gasoline Distribution Stage I;
Pipelines Gasoline_Distribution_Stage_I_Documen
tation.zip Gasoline_Distribution_Stage_I_Pipelines_2505040120_CAP_Emissions.zip
2008 No
Open Burning (NEI emissions for Open Burning of Land Clearing Debris were transmitted to AMEC for incorporation into SEMAP’s fire inventory)
2610000100 Open Burning - Yard Waste -
Leaves
Open_Burning_Yard_Waste_Leaf_2610000100_and_Brush_2610000400_Docum
entation.zip
Open_Burning_Yard_Waste_Leaf_261000100_Emissions.zip
2008 No
2610000400 Open Burning - Yard Waste -
Brush
Open_Burning_Yard_Waste_Leaf_2610000100_and_Brush_2610000400_Docum
entation.zip
Open_Burning_Yard_Waste_Brush_261000400_Emissions.zip
2008 No
2610000500 Open Burning - Land Clearing
Debris Open_Burning_Land_Clearing_Debris_2
610000500_Documentation.zip Open_Burning_Land_Clearing_Debris
_2610000500_Emissions.zip Multiple Years
No
2610030000 Open Burning - Household
Waste Open_Burning_MSW_2610030000_Docu
mentation.zip Open_Burning_MSW_2610030000_E
missions.zip 2008 No
Paved and Unpaved Roads
2294000000 Paved Road Dust Paved_Roads_2294000000_Documentat
ion.zip Paved_Roads_2294000000_Emission
s.zip 2007 No
2296000000 Unpaved Road Dust Unpaved_Roads_2296000000_Documen
tation.zip Unpaved_Roads_2296000000_Emissi
ons.zip 2007 No
Publicly Owned Treatment Works (POTW)
2630020000 Publicly Owned Treatment
Works (POTW) Publicly_Owned_Treatment_Works_2630
020000_Documentation.zip Publicly_Owned_Treatment_Works_6
30020000_Emissions.zip 2008 Yes
Residential Heating (SEMAP Residential Wood Combustion/Wax Firelog emissions were calculated using NEI’s RWC Tool with SESARM-revised inputs)
2104001000 Residential Anthracite Coal Residential_Coal_2104001000_2104002
000_Documentation.zip Residential_Coal_2104001000_21040
02000_Emissions.zip 2006 No
2104002000 Residential Bituminous Coal Residential_Coal_2104001000_2104002
000_Documentation.zip Residential_Coal_2104001000_21040
02000_Emissions.zip 2006 No
2104004000 Residential Distillate Oil Residential_Distillate_Fuel_2104004000_
Documentation.zip Residential_Distillate_Fuel_21040040
00_Emissions.zip 2006 No
Appendix A - 155 Kentucky Regional Haze 5-Year Periodic Report SIP Revision, September 2014
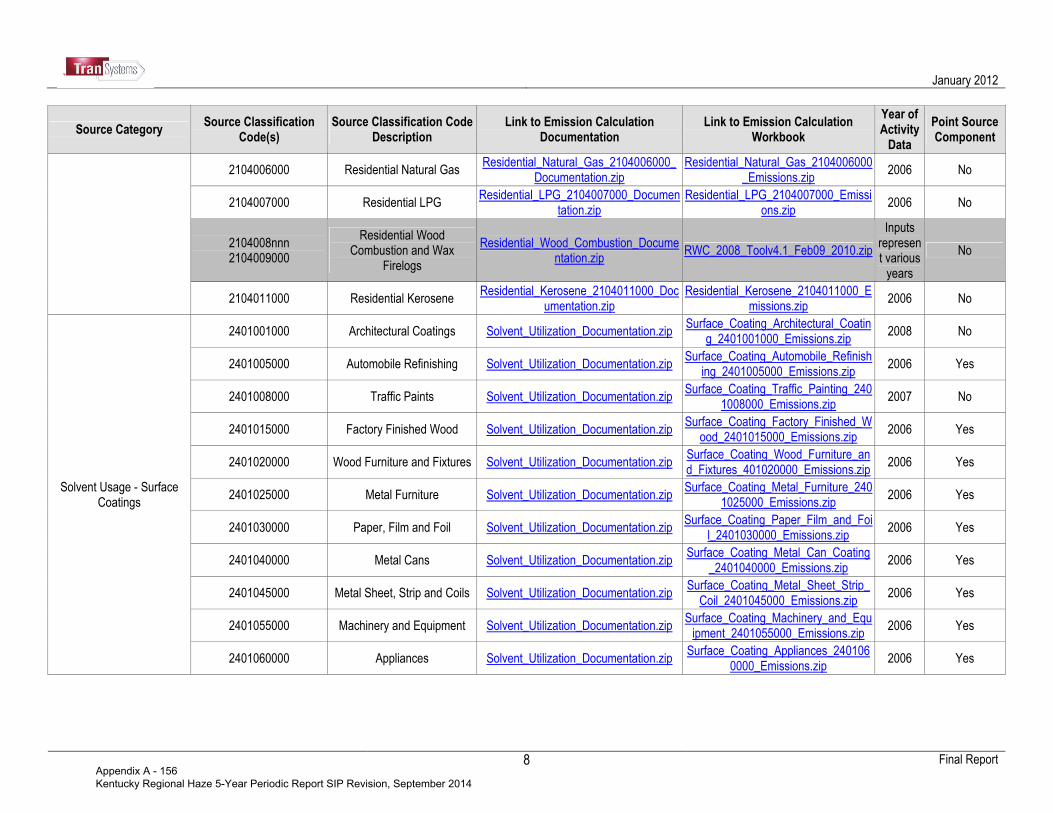
January 2012
Final Report
8
Source Category Source Classification
Code(s) Source Classification Code
Description Link to Emission Calculation
Documentation Link to Emission Calculation
Workbook
Year of Activity Data
Point Source Component
2104006000 Residential Natural Gas Residential_Natural_Gas_2104006000_
Documentation.zip Residential_Natural_Gas_2104006000
_Emissions.zip 2006 No
2104007000 Residential LPG Residential_LPG_2104007000_Documen
tation.zip Residential_LPG_2104007000_Emissi
ons.zip 2006 No
2104008nnn 2104009000
Residential Wood Combustion and Wax
Firelogs
Residential_Wood_Combustion_Documentation.zip
RWC_2008_Toolv4.1_Feb09_2010.zip
Inputs represent various years
No
2104011000 Residential Kerosene Residential_Kerosene_2104011000_Doc
umentation.zip Residential_Kerosene_2104011000_E
missions.zip 2006 No
Solvent Usage - Surface Coatings
2401001000 Architectural Coatings Solvent_Utilization_Documentation.zip Surface_Coating_Architectural_Coatin
g_2401001000_Emissions.zip 2008 No
2401005000 Automobile Refinishing Solvent_Utilization_Documentation.zip Surface_Coating_Automobile_Refinish
ing_2401005000_Emissions.zip 2006 Yes
2401008000 Traffic Paints Solvent_Utilization_Documentation.zip Surface_Coating_Traffic_Painting_240
1008000_Emissions.zip 2007 No
2401015000 Factory Finished Wood Solvent_Utilization_Documentation.zip Surface_Coating_Factory_Finished_W
ood_2401015000_Emissions.zip 2006 Yes
2401020000 Wood Furniture and Fixtures Solvent_Utilization_Documentation.zip Surface_Coating_Wood_Furniture_and_Fixtures_401020000_Emissions.zip
2006 Yes
2401025000 Metal Furniture Solvent_Utilization_Documentation.zip Surface_Coating_Metal_Furniture_240
1025000_Emissions.zip 2006 Yes
2401030000 Paper, Film and Foil Solvent_Utilization_Documentation.zip Surface_Coating_Paper_Film_and_Foi
l_2401030000_Emissions.zip 2006 Yes
2401040000 Metal Cans Solvent_Utilization_Documentation.zip Surface_Coating_Metal_Can_Coating
_2401040000_Emissions.zip 2006 Yes
2401045000 Metal Sheet, Strip and Coils Solvent_Utilization_Documentation.zip Surface_Coating_Metal_Sheet_Strip_
Coil_2401045000_Emissions.zip 2006 Yes
2401055000 Machinery and Equipment Solvent_Utilization_Documentation.zip Surface_Coating_Machinery_and_Equipment_2401055000_Emissions.zip
2006 Yes
2401060000 Appliances Solvent_Utilization_Documentation.zip Surface_Coating_Appliances_240106
0000_Emissions.zip 2006 Yes
Appendix A - 156 Kentucky Regional Haze 5-Year Periodic Report SIP Revision, September 2014
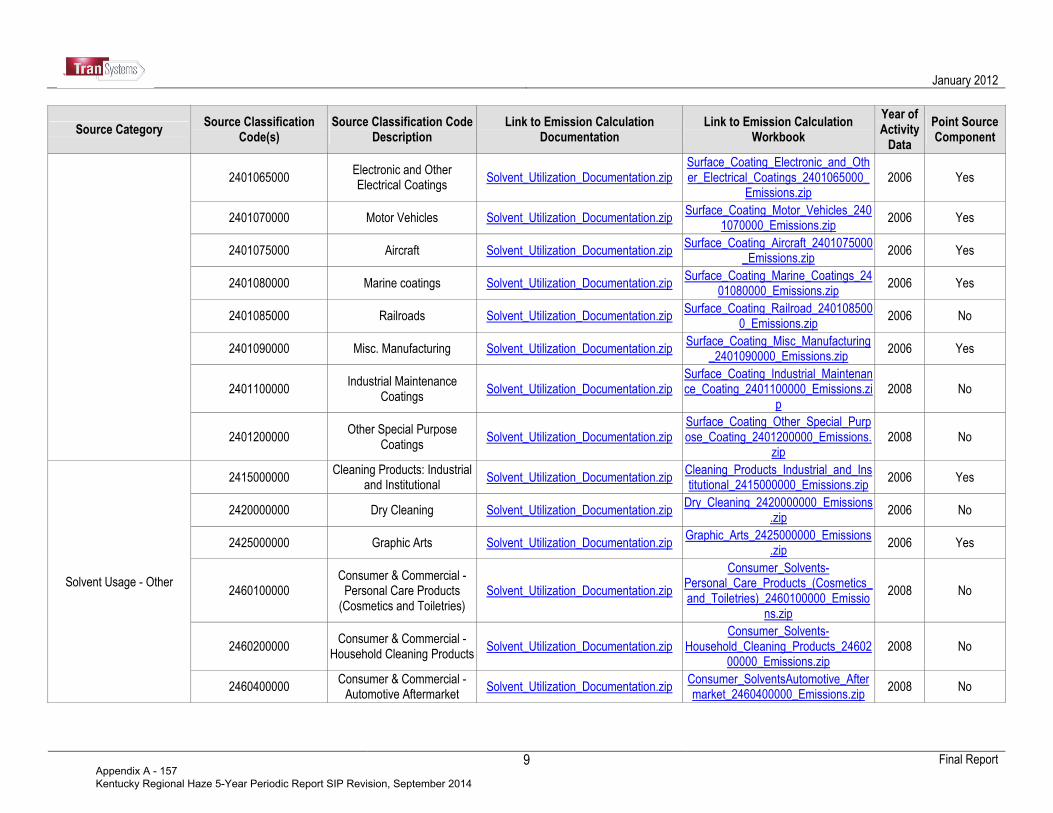
January 2012
Final Report
9
Source Category Source Classification
Code(s) Source Classification Code
Description Link to Emission Calculation
Documentation Link to Emission Calculation
Workbook
Year of Activity Data
Point Source Component
2401065000 Electronic and Other Electrical Coatings
Solvent_Utilization_Documentation.zip Surface_Coating_Electronic_and_Other_Electrical_Coatings_2401065000_
Emissions.zip 2006 Yes
2401070000 Motor Vehicles Solvent_Utilization_Documentation.zip Surface_Coating_Motor_Vehicles_240
1070000_Emissions.zip 2006 Yes
2401075000 Aircraft Solvent_Utilization_Documentation.zip Surface_Coating_Aircraft_2401075000
_Emissions.zip 2006 Yes
2401080000 Marine coatings Solvent_Utilization_Documentation.zip Surface_Coating_Marine_Coatings_24
01080000_Emissions.zip 2006 Yes
2401085000 Railroads Solvent_Utilization_Documentation.zip Surface_Coating_Railroad_240108500
0_Emissions.zip 2006 No
2401090000 Misc. Manufacturing Solvent_Utilization_Documentation.zip Surface_Coating_Misc_Manufacturing
_2401090000_Emissions.zip 2006 Yes
2401100000 Industrial Maintenance
Coatings Solvent_Utilization_Documentation.zip
Surface_Coating_Industrial_Maintenance_Coating_2401100000_Emissions.zi
p 2008 No
2401200000 Other Special Purpose
Coatings Solvent_Utilization_Documentation.zip
Surface_Coating_Other_Special_Purpose_Coating_2401200000_Emissions.
zip 2008 No
Solvent Usage - Other
2415000000 Cleaning Products: Industrial
and Institutional Solvent_Utilization_Documentation.zip
Cleaning_Products_Industrial_and_Institutional_2415000000_Emissions.zip
2006 Yes
2420000000 Dry Cleaning Solvent_Utilization_Documentation.zip Dry_Cleaning_2420000000_Emissions
.zip 2006 No
2425000000 Graphic Arts Solvent_Utilization_Documentation.zip Graphic_Arts_2425000000_Emissions
.zip 2006 Yes
2460100000 Consumer & Commercial - Personal Care Products
(Cosmetics and Toiletries) Solvent_Utilization_Documentation.zip
Consumer_Solvents-Personal_Care_Products_(Cosmetics_and_Toiletries)_2460100000_Emissio
ns.zip
2008 No
2460200000 Consumer & Commercial -
Household Cleaning Products Solvent_Utilization_Documentation.zip
Consumer_Solvents-Household_Cleaning_Products_24602
00000_Emissions.zip 2008 No
2460400000 Consumer & Commercial - Automotive Aftermarket
Solvent_Utilization_Documentation.zip Consumer_SolventsAutomotive_Aftermarket_2460400000_Emissions.zip
2008 No
Appendix A - 157 Kentucky Regional Haze 5-Year Periodic Report SIP Revision, September 2014
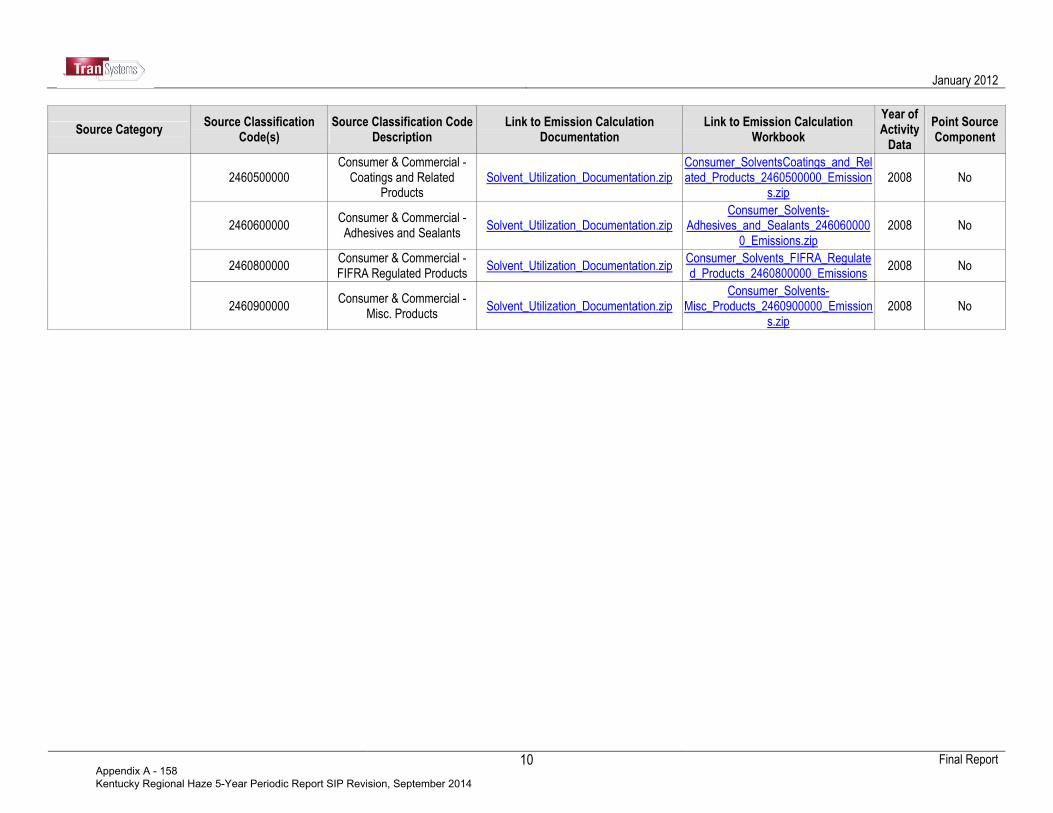
January 2012
Final Report
10
Source Category Source Classification
Code(s) Source Classification Code
Description Link to Emission Calculation
Documentation Link to Emission Calculation
Workbook
Year of Activity Data
Point Source Component
2460500000 Consumer & Commercial -
Coatings and Related Products
Solvent_Utilization_Documentation.zip Consumer_SolventsCoatings_and_Related_Products_2460500000_Emission
s.zip 2008 No
2460600000 Consumer & Commercial - Adhesives and Sealants
Solvent_Utilization_Documentation.zip Consumer_Solvents-
Adhesives_and_Sealants_2460600000_Emissions.zip
2008 No
2460800000 Consumer & Commercial - FIFRA Regulated Products
Solvent_Utilization_Documentation.zip Consumer_Solvents_FIFRA_Regulated_Products_2460800000_Emissions
2008 No
2460900000 Consumer & Commercial -
Misc. Products Solvent_Utilization_Documentation.zip
Consumer_Solvents-Misc_Products_2460900000_Emission
s.zip 2008 No
Appendix A - 158 Kentucky Regional Haze 5-Year Periodic Report SIP Revision, September 2014
January 2012
11 Final Report
a. Adjustment of NEI Data to Reflect 2007 Activity Levels7 When the 2008 nonpoint source NEI reflected 2007 activity data, TranSystems incorporated the 2008 NEI emission estimates as the default SEMAP area source inventory. When a source category’s NEI data reflected 2006 or 2008 emissions activity data, TranSystems updated the NEI estimates to reflect 2007 emission activity levels. Table II-3 documents these specific adjustments. For many area source categories, emissions activity data are not available at the county-level. In these cases, county-level emissions are estimated using two sets of activity data: one set reflecting state or regional-level emissions activity (e.g., volume of natural gas consumed by the residential sector in each state), and the other set representing data that are used to allocate emissions activity to the county-level (e.g., number of houses using natural gas as the primary heating fuel in each county). Specifically, the “Backcasting or Forecasting Methodology” column in Table II-3 presents the approach used to update emissions activity data to represent 2007, and the “County Allocation Method” column identifies the approach used to update the county allocation data. As noted in Table II-3, all county allocation data were not updated to 2007. These data were not updated because of the level-of-effort that would be involved, and the fact that these data are generally not expected to differ significantly from year-to-year. b. Adjustment of NEI Data to Remove Activity Reflected in the Point Source Inventory To prevent double-counting of emissions in the stationary point source and area source emissions inventories, it was necessary to perform point source subtractions on some of the source categories in the TranSystems default area source inventory. To facilitate the point source subtractions, TranSystems prepared crosswalks that link area SCCs to point SCCs. These crosswalks are presented in Appendix A. The general point source subtraction approach consisted of the following steps:
1. Compile 2007 point source emissions and control efficiency data provided by each state for the applicable point SCCs.
2. Identify potential quality assurance issues for S/L agency review; 3. Revise control efficiency data to incorporate S/L agency comments; 4. Back-calculate 2007 uncontrolled point source emissions from reported emissions and control efficiency
data -- e.g., 40 tpy of controlled NOx emissions and 80 percent control efficiency = 50 tpy of uncontrolled NOx emissions.
5. Sum the emissions for each record from step 4 to the state-level to yield state total uncontrolled point source emissions by pollutant.
6. For each pollutant and state, compute the fraction of total 2007 state-level emissions in the 2007 TranSystems default inventory represented by area sources (using step 5 total point source uncontrolled emissions).
7. Multiply the emission estimates in the draft base year inventory by the appropriate percentages in step 6 to yield area source emissions.
TranSystems performed the point source subtractions at the state- rather than county-level because of the uncertainty associated with the NEI county emission allocations in that actual county-level emissions activity data are generally not available (i.e., a surrogate indicator such as employment is typically used to allocate state-level activity to counties).8 Although the final inventory reflected Georgia’s request to perform Georgia’s point source subtractions at the county-level, Georgia’s revised final inventory reflects subtractions at the state-level.
7 In addition, TranSystems incorporated silt content inputs provided by Alabama for updated NEI-based emissions estimation calculations used for the residential and nonresidential construction dust categories (SCCs 2311010000 and 2311020000). 8 Efforts to perform subtractions at the county-level commonly result in negative emission estimates.
Appendix A - 159 Kentucky Regional Haze 5-Year Periodic Report SIP Revision, September 2014
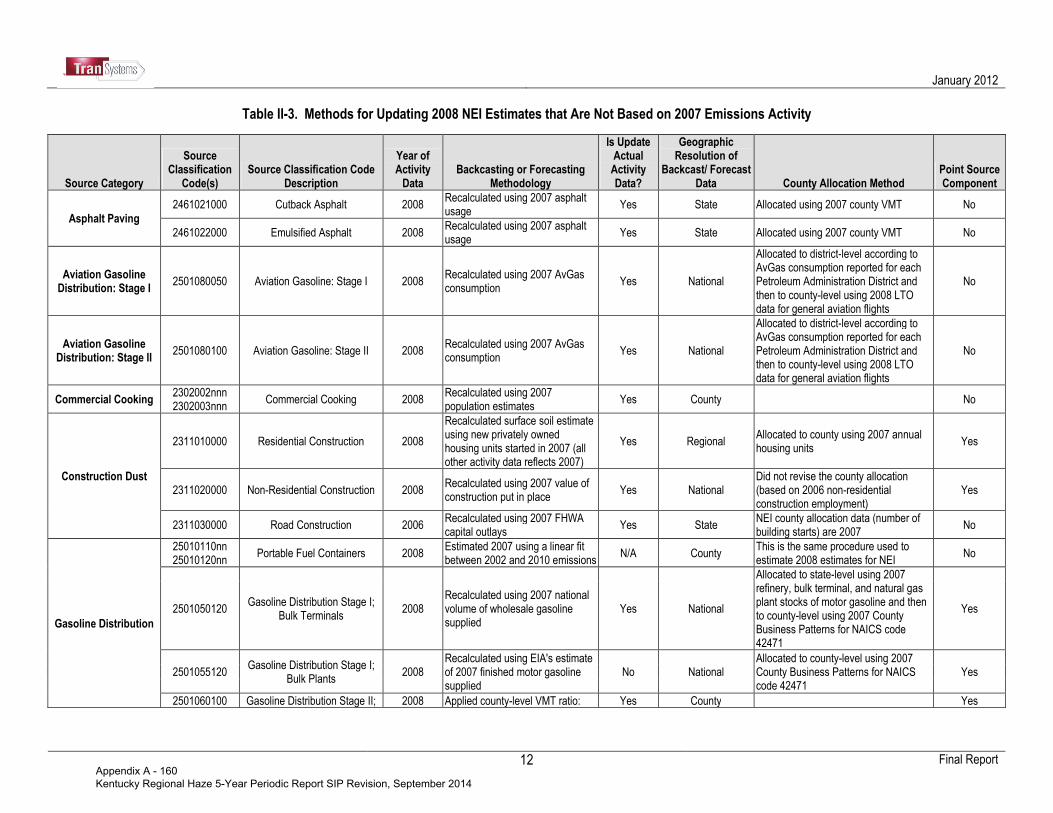
January 2012
Final Report
12
Table II-3. Methods for Updating 2008 NEI Estimates that Are Not Based on 2007 Emissions Activity
Source Category
Source Classification
Code(s) Source Classification Code
Description
Year of Activity Data
Backcasting or Forecasting Methodology
Is Update Actual Activity Data?
Geographic Resolution of
Backcast/ Forecast Data County Allocation Method
Point Source Component
Asphalt Paving
2461021000 Cutback Asphalt 2008 Recalculated using 2007 asphalt usage
Yes State Allocated using 2007 county VMT No
2461022000 Emulsified Asphalt 2008 Recalculated using 2007 asphalt usage
Yes State Allocated using 2007 county VMT No
Aviation Gasoline Distribution: Stage I
2501080050 Aviation Gasoline: Stage I 2008 Recalculated using 2007 AvGas consumption
Yes National
Allocated to district-level according to AvGas consumption reported for each Petroleum Administration District and then to county-level using 2008 LTO data for general aviation flights
No
Aviation Gasoline Distribution: Stage II
2501080100 Aviation Gasoline: Stage II 2008 Recalculated using 2007 AvGas consumption
Yes National
Allocated to district-level according to AvGas consumption reported for each Petroleum Administration District and then to county-level using 2008 LTO data for general aviation flights
No
Commercial Cooking 2302002nnn 2302003nnn
Commercial Cooking 2008 Recalculated using 2007 population estimates
Yes County No
Construction Dust
2311010000 Residential Construction 2008
Recalculated surface soil estimate using new privately owned housing units started in 2007 (all other activity data reflects 2007)
Yes Regional Allocated to county using 2007 annual housing units
Yes
2311020000 Non-Residential Construction 2008 Recalculated using 2007 value of construction put in place
Yes National Did not revise the county allocation (based on 2006 non-residential construction employment)
Yes
2311030000 Road Construction 2006 Recalculated using 2007 FHWA capital outlays
Yes State NEI county allocation data (number of building starts) are 2007
No
Gasoline Distribution
25010110nn 25010120nn
Portable Fuel Containers 2008 Estimated 2007 using a linear fit between 2002 and 2010 emissions
N/A County This is the same procedure used to estimate 2008 estimates for NEI
No
2501050120 Gasoline Distribution Stage I;
Bulk Terminals 2008
Recalculated using 2007 national volume of wholesale gasoline supplied
Yes National
Allocated to state-level using 2007 refinery, bulk terminal, and natural gas plant stocks of motor gasoline and then to county-level using 2007 County Business Patterns for NAICS code 42471
Yes
2501055120 Gasoline Distribution Stage I;
Bulk Plants 2008
Recalculated using EIA's estimate of 2007 finished motor gasoline supplied
No National Allocated to county-level using 2007 County Business Patterns for NAICS code 42471
Yes
2501060100 Gasoline Distribution Stage II; 2008 Applied county-level VMT ratio: Yes County Yes
Appendix A - 160 Kentucky Regional Haze 5-Year Periodic Report SIP Revision, September 2014
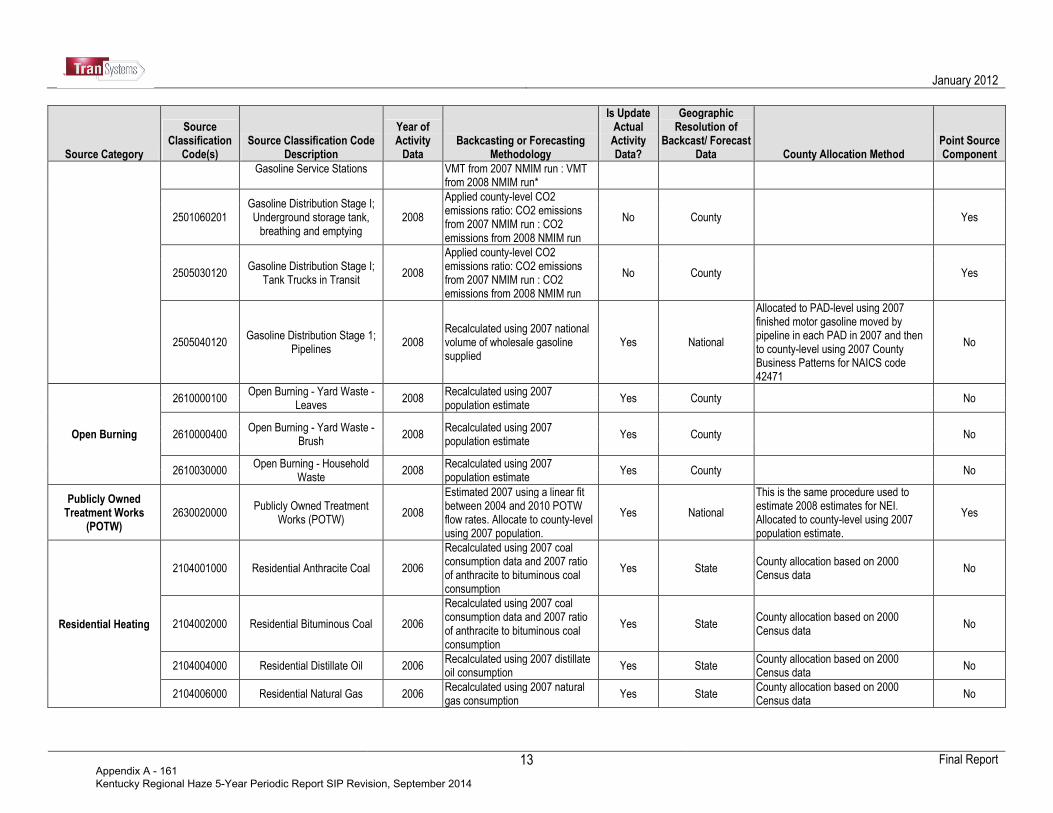
January 2012
Final Report
13
Source Category
Source Classification
Code(s) Source Classification Code
Description
Year of Activity Data
Backcasting or Forecasting Methodology
Is Update Actual Activity Data?
Geographic Resolution of
Backcast/ Forecast Data County Allocation Method
Point Source Component
Gasoline Service Stations VMT from 2007 NMIM run : VMT from 2008 NMIM run*
2501060201 Gasoline Distribution Stage I; Underground storage tank, breathing and emptying
2008
Applied county-level CO2 emissions ratio: CO2 emissions from 2007 NMIM run : CO2 emissions from 2008 NMIM run
No County Yes
2505030120 Gasoline Distribution Stage I;
Tank Trucks in Transit 2008
Applied county-level CO2 emissions ratio: CO2 emissions from 2007 NMIM run : CO2 emissions from 2008 NMIM run
No County Yes
2505040120 Gasoline Distribution Stage 1;
Pipelines 2008
Recalculated using 2007 national volume of wholesale gasoline supplied
Yes National
Allocated to PAD-level using 2007 finished motor gasoline moved by pipeline in each PAD in 2007 and then to county-level using 2007 County Business Patterns for NAICS code 42471
No
Open Burning
2610000100 Open Burning - Yard Waste -
Leaves 2008
Recalculated using 2007 population estimate
Yes County No
2610000400 Open Burning - Yard Waste -
Brush 2008
Recalculated using 2007 population estimate
Yes County No
2610030000 Open Burning - Household
Waste 2008
Recalculated using 2007 population estimate
Yes County No
Publicly Owned Treatment Works
(POTW) 2630020000
Publicly Owned Treatment Works (POTW)
2008
Estimated 2007 using a linear fit between 2004 and 2010 POTW flow rates. Allocate to county-level using 2007 population.
Yes National
This is the same procedure used to estimate 2008 estimates for NEI. Allocated to county-level using 2007 population estimate.
Yes
Residential Heating
2104001000 Residential Anthracite Coal 2006
Recalculated using 2007 coal consumption data and 2007 ratio of anthracite to bituminous coal consumption
Yes State County allocation based on 2000 Census data
No
2104002000 Residential Bituminous Coal 2006
Recalculated using 2007 coal consumption data and 2007 ratio of anthracite to bituminous coal consumption
Yes State County allocation based on 2000 Census data
No
2104004000 Residential Distillate Oil 2006 Recalculated using 2007 distillate oil consumption
Yes State County allocation based on 2000 Census data
No
2104006000 Residential Natural Gas 2006 Recalculated using 2007 natural gas consumption
Yes State County allocation based on 2000 Census data
No
Appendix A - 161 Kentucky Regional Haze 5-Year Periodic Report SIP Revision, September 2014
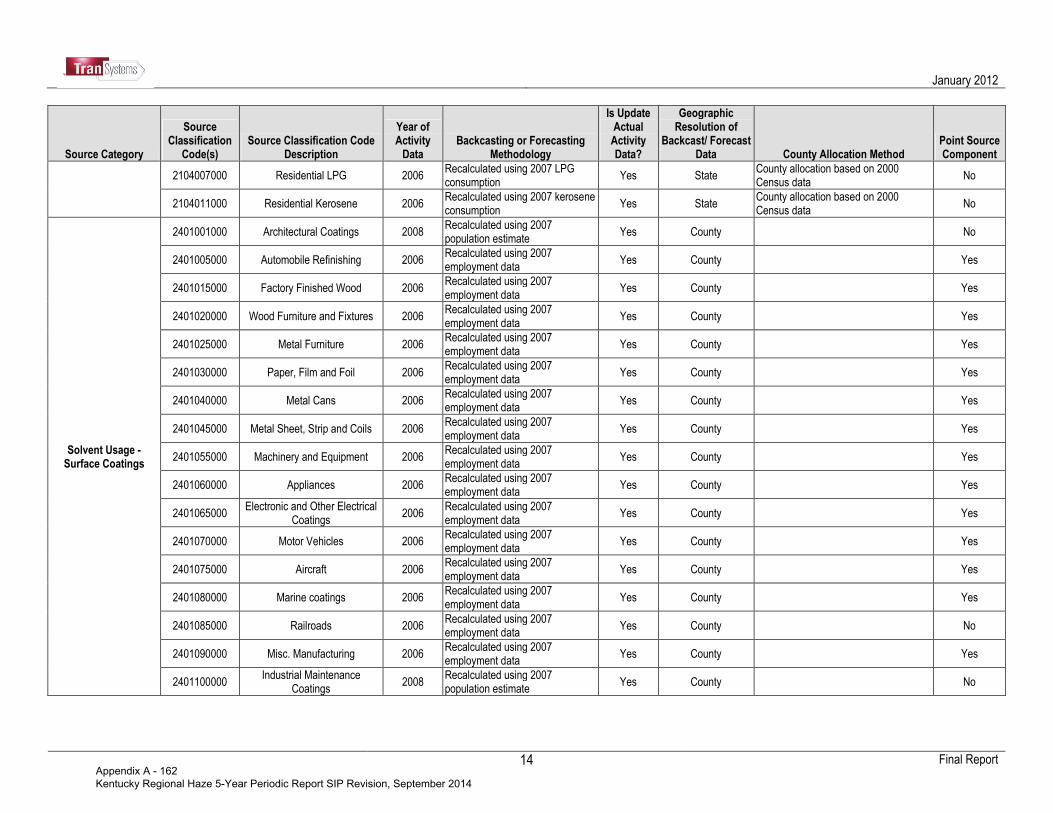
January 2012
Final Report
14
Source Category
Source Classification
Code(s) Source Classification Code
Description
Year of Activity Data
Backcasting or Forecasting Methodology
Is Update Actual Activity Data?
Geographic Resolution of
Backcast/ Forecast Data County Allocation Method
Point Source Component
2104007000 Residential LPG 2006 Recalculated using 2007 LPG consumption
Yes State County allocation based on 2000 Census data
No
2104011000 Residential Kerosene 2006 Recalculated using 2007 kerosene consumption
Yes State County allocation based on 2000 Census data
No
Solvent Usage - Surface Coatings
2401001000 Architectural Coatings 2008 Recalculated using 2007 population estimate
Yes County No
2401005000 Automobile Refinishing 2006 Recalculated using 2007 employment data
Yes County Yes
2401015000 Factory Finished Wood 2006 Recalculated using 2007 employment data
Yes County Yes
2401020000 Wood Furniture and Fixtures 2006 Recalculated using 2007 employment data
Yes County Yes
2401025000 Metal Furniture 2006 Recalculated using 2007 employment data
Yes County Yes
2401030000 Paper, Film and Foil 2006 Recalculated using 2007 employment data
Yes County Yes
2401040000 Metal Cans 2006 Recalculated using 2007 employment data
Yes County Yes
2401045000 Metal Sheet, Strip and Coils 2006 Recalculated using 2007 employment data
Yes County Yes
2401055000 Machinery and Equipment 2006 Recalculated using 2007 employment data
Yes County Yes
2401060000 Appliances 2006 Recalculated using 2007 employment data
Yes County Yes
2401065000 Electronic and Other Electrical
Coatings 2006
Recalculated using 2007 employment data
Yes County Yes
2401070000 Motor Vehicles 2006 Recalculated using 2007 employment data
Yes County Yes
2401075000 Aircraft 2006 Recalculated using 2007 employment data
Yes County Yes
2401080000 Marine coatings 2006 Recalculated using 2007 employment data
Yes County Yes
2401085000 Railroads 2006 Recalculated using 2007 employment data
Yes County No
2401090000 Misc. Manufacturing 2006 Recalculated using 2007 employment data
Yes County Yes
2401100000 Industrial Maintenance
Coatings 2008
Recalculated using 2007 population estimate
Yes County No
Appendix A - 162 Kentucky Regional Haze 5-Year Periodic Report SIP Revision, September 2014

January 2012
Final Report
15
Source Category
Source Classification
Code(s) Source Classification Code
Description
Year of Activity Data
Backcasting or Forecasting Methodology
Is Update Actual Activity Data?
Geographic Resolution of
Backcast/ Forecast Data County Allocation Method
Point Source Component
2401200000 Other Special Purpose
Coatings 2008
Recalculated using 2007 population estimate
Yes County No
Solvent Usage - Other
2415000000 Cleaning Products: Industrial
and Institutional 2006
Recalculated using 2007 employment data
Yes County Yes
2420000000 Dry Cleaning 2006 Recalculated using 2007 employment data
Yes County No
2425000000 Graphic Arts 2006 Recalculated using 2007 employment data
Yes County Yes
2460100000 Consumer & Commercial - Personal Care Products
(Cosmetics and Toiletries) 2008
Recalculated using 2007 population estimate
Yes County No
2460200000 Consumer & Commercial -
Household Cleaning Products 2008
Recalculated using 2007 population estimate
Yes County No
2460400000 Consumer & Commercial - Automotive Aftermarket
2008 Recalculated using 2007 population estimate
Yes County No
2460500000 Consumer & Commercial -
Coatings and Related Products 2008
Recalculated using 2007 population estimate
Yes County No
2460600000 Consumer & Commercial - Adhesives and Sealants
2008 Recalculated using 2007 population estimate
Yes County No
2460800000 Consumer & Commercial - FIFRA Regulated Products
2008 Recalculated using 2007 population estimate
Yes County No
2460900000 Consumer & Commercial -
Misc. Products 2008
Recalculated using 2007 population estimate
Yes County No
*Note that Stage II gasoline refueling VOC emissions were revised from the emissions reported in the final version of the 2007 SEMAP inventory, using updated 2007/2008 VMT adjustment factor ratios. The updated ratios reflect incorporation of the 2007 VMT data that was used as input to MOVES onroad mobile source emissions modeling runs.
Appendix A - 163 Kentucky Regional Haze 5-Year Periodic Report SIP Revision, September 2014
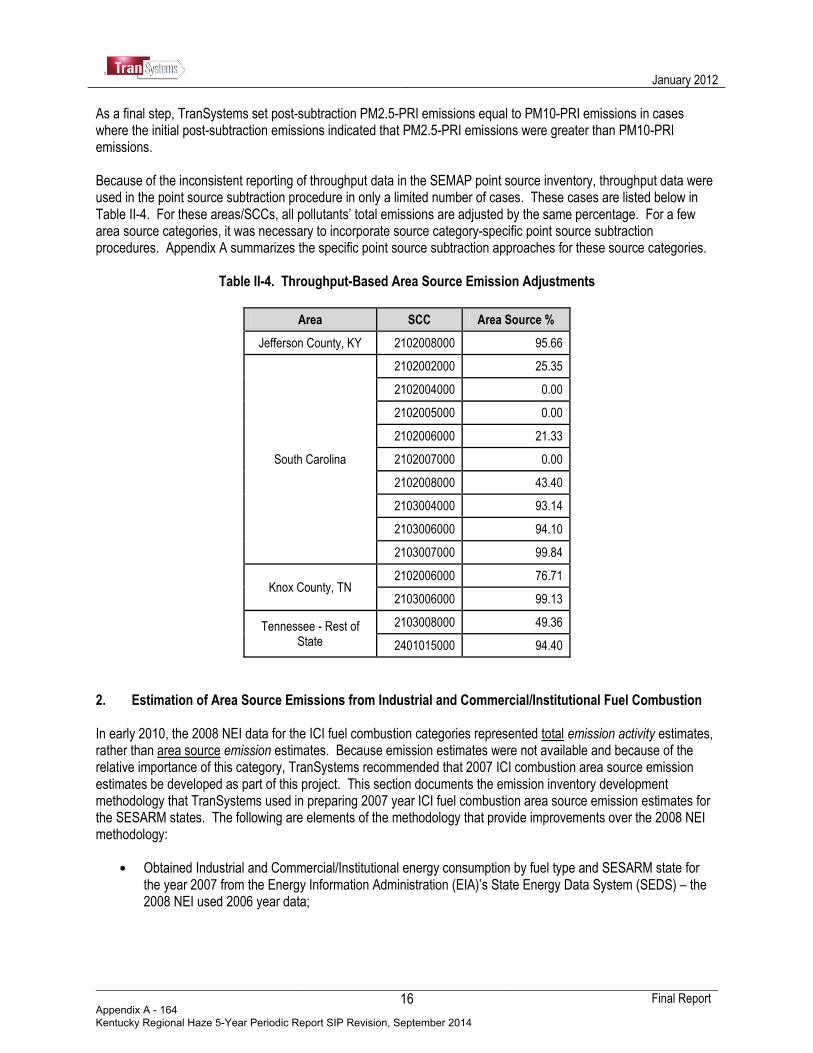
January 2012
Final Report
16
As a final step, TranSystems set post-subtraction PM2.5-PRI emissions equal to PM10-PRI emissions in cases where the initial post-subtraction emissions indicated that PM2.5-PRI emissions were greater than PM10-PRI emissions. Because of the inconsistent reporting of throughput data in the SEMAP point source inventory, throughput data were used in the point source subtraction procedure in only a limited number of cases. These cases are listed below in Table II-4. For these areas/SCCs, all pollutants’ total emissions are adjusted by the same percentage. For a few area source categories, it was necessary to incorporate source category-specific point source subtraction procedures. Appendix A summarizes the specific point source subtraction approaches for these source categories.
Table II-4. Throughput-Based Area Source Emission Adjustments
Area SCC Area Source %
Jefferson County, KY 2102008000 95.66
South Carolina
2102002000 25.35
2102004000 0.00
2102005000 0.00
2102006000 21.33
2102007000 0.00
2102008000 43.40
2103004000 93.14
2103006000 94.10
2103007000 99.84
Knox County, TN 2102006000 76.71
2103006000 99.13
Tennessee - Rest of State
2103008000 49.36
2401015000 94.40
2. Estimation of Area Source Emissions from Industrial and Commercial/Institutional Fuel Combustion
In early 2010, the 2008 NEI data for the ICI fuel combustion categories represented total emission activity estimates, rather than area source emission estimates. Because emission estimates were not available and because of the relative importance of this category, TranSystems recommended that 2007 ICI combustion area source emission estimates be developed as part of this project. This section documents the emission inventory development methodology that TranSystems used in preparing 2007 year ICI fuel combustion area source emission estimates for the SESARM states. The following are elements of the methodology that provide improvements over the 2008 NEI methodology:
• Obtained Industrial and Commercial/Institutional energy consumption by fuel type and SESARM state for
the year 2007 from the Energy Information Administration (EIA)’s State Energy Data System (SEDS) – the 2008 NEI used 2006 year data;
Appendix A - 164 Kentucky Regional Haze 5-Year Periodic Report SIP Revision, September 2014
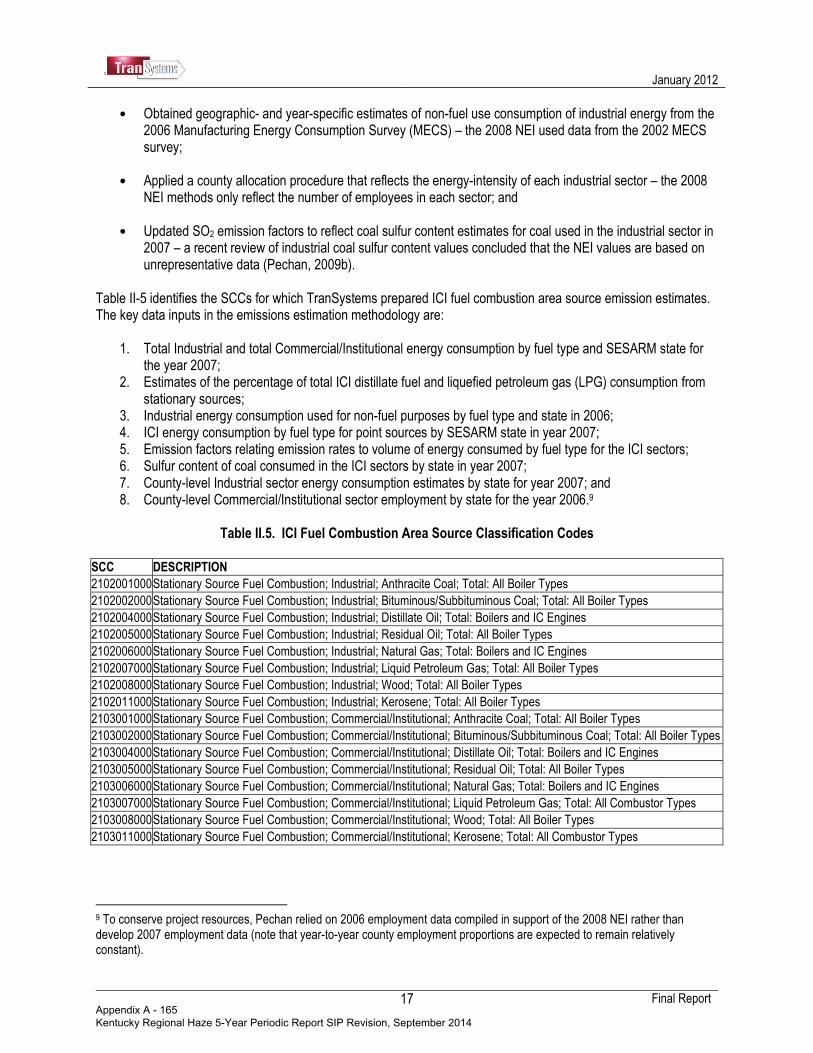
January 2012
Final Report
17
• Obtained geographic- and year-specific estimates of non-fuel use consumption of industrial energy from the 2006 Manufacturing Energy Consumption Survey (MECS) – the 2008 NEI used data from the 2002 MECS survey;
• Applied a county allocation procedure that reflects the energy-intensity of each industrial sector – the 2008
NEI methods only reflect the number of employees in each sector; and
• Updated SO2 emission factors to reflect coal sulfur content estimates for coal used in the industrial sector in 2007 – a recent review of industrial coal sulfur content values concluded that the NEI values are based on unrepresentative data (Pechan, 2009b).
Table II-5 identifies the SCCs for which TranSystems prepared ICI fuel combustion area source emission estimates. The key data inputs in the emissions estimation methodology are:
1. Total Industrial and total Commercial/Institutional energy consumption by fuel type and SESARM state for the year 2007;
2. Estimates of the percentage of total ICI distillate fuel and liquefied petroleum gas (LPG) consumption from stationary sources;
3. Industrial energy consumption used for non-fuel purposes by fuel type and state in 2006; 4. ICI energy consumption by fuel type for point sources by SESARM state in year 2007; 5. Emission factors relating emission rates to volume of energy consumed by fuel type for the ICI sectors; 6. Sulfur content of coal consumed in the ICI sectors by state in year 2007; 7. County-level Industrial sector energy consumption estimates by state for year 2007; and 8. County-level Commercial/Institutional sector employment by state for the year 2006.9
Table II.5. ICI Fuel Combustion Area Source Classification Codes
SCC DESCRIPTION
2102001000 Stationary Source Fuel Combustion; Industrial; Anthracite Coal; Total: All Boiler Types
2102002000 Stationary Source Fuel Combustion; Industrial; Bituminous/Subbituminous Coal; Total: All Boiler Types
2102004000 Stationary Source Fuel Combustion; Industrial; Distillate Oil; Total: Boilers and IC Engines
2102005000 Stationary Source Fuel Combustion; Industrial; Residual Oil; Total: All Boiler Types
2102006000 Stationary Source Fuel Combustion; Industrial; Natural Gas; Total: Boilers and IC Engines
2102007000 Stationary Source Fuel Combustion; Industrial; Liquid Petroleum Gas; Total: All Boiler Types
2102008000 Stationary Source Fuel Combustion; Industrial; Wood; Total: All Boiler Types
2102011000 Stationary Source Fuel Combustion; Industrial; Kerosene; Total: All Boiler Types
2103001000 Stationary Source Fuel Combustion; Commercial/Institutional; Anthracite Coal; Total: All Boiler Types
2103002000 Stationary Source Fuel Combustion; Commercial/Institutional; Bituminous/Subbituminous Coal; Total: All Boiler Types
2103004000 Stationary Source Fuel Combustion; Commercial/Institutional; Distillate Oil; Total: Boilers and IC Engines
2103005000 Stationary Source Fuel Combustion; Commercial/Institutional; Residual Oil; Total: All Boiler Types
2103006000 Stationary Source Fuel Combustion; Commercial/Institutional; Natural Gas; Total: Boilers and IC Engines
2103007000 Stationary Source Fuel Combustion; Commercial/Institutional; Liquid Petroleum Gas; Total: All Combustor Types
2103008000 Stationary Source Fuel Combustion; Commercial/Institutional; Wood; Total: All Boiler Types
2103011000 Stationary Source Fuel Combustion; Commercial/Institutional; Kerosene; Total: All Combustor Types
9 To conserve project resources, Pechan relied on 2006 employment data compiled in support of the 2008 NEI rather than develop 2007 employment data (note that year-to-year county employment proportions are expected to remain relatively constant).
Appendix A - 165 Kentucky Regional Haze 5-Year Periodic Report SIP Revision, September 2014
January 2012
Final Report
18
The following sections describe the methodology/data source(s) for developing each of these data inputs, and the source(s) of information for each of these data elements. In selecting the information sources for each of these data elements, TranSystems evaluated the completeness, representativeness, comparability, and accuracy criteria identified in the Quality Assurance Project Plan (QAPP) for this project. For example, information sources that provide data specific to the source category/geography/inventory period were selected over those that were less specific. a. Total ICI Energy Consumption For total Industrial and total Commercial/Institutional energy consumption by fuel type/state, TranSystems primarily used the same source that EPA uses in developing ICI combustion emission estimates for the NEI –EIA’s SEDS (EIA, 2009a). The SEDS provides total energy consumption estimates by sector, state, fuel type, and year. To facilitate use with the criteria pollutant emission factors, TranSystems compiled the SEDS energy consumption data in both sets of units provided by the EIA: physical units and British thermal units (Btus). For estimates of industrial distillate consumption, TranSystems relied on estimates reported in EIA’s “Fuel Oil and Kerosene Sales” (EIA, 2009b). This source is preferred over the SEDS data because it provides additional sectoral detail that is needed to perform the stationary source energy consumption adjustments described below.
b. Stationary Source Energy Consumption To avoid double-counting with energy consumption accounted for in mobile source inventories, it was necessary to adjust 2007 year SEDS distillate and LPG consumption estimates for mobile source fuel consumption. For LPG, the adjustments account for energy consumption reflected in the nonroad mobile sector. The adjustments were performed by subtracting estimated proportions of total Industrial sector and Commercial sector consumption computed from a national NONROAD model run. TranSystems compiled national LPG consumption estimates for relevant SCCs from a 2006 run of EPA’s NONROAD model (a 2006 run was performed in support of the NEI—it is not anticipated that the percentages differ considerably between 2006 and 2007). Table II-6 identifies a complete list of nonroad SCCs associated with Industrial and Commercial sector LPG. The shaded entries in this table indicate where NONROAD reports LPG consumption. This procedure estimates that nonroad mobile sources account for 9 percent of Industrial sector, and 18 percent of Commercial sector LPG consumption. The SEDS LPG consumption estimates for each state/sector were adjusted downward using these percentages. For distillate oil, it was necessary to remove energy consumption reflected in onroad/nonroad mobile source emission inventories. To facilitate this step, TranSystems used more detailed distillate fuel consumption estimates reported in EIA’s “Fuel Oil and Kerosene Sales,” and stationary source fuel consumption percentage assumptions used in the regulatory impact analysis for EPA’s nonroad diesel emissions rulemaking (EPA, 2003a). Table II-7 displays the assumptions that were applied to the state-level Industrial sector distillate fuel consumption estimates reported in “Fuel Oil and Kerosene Sales” to estimate Industrial sector stationary source consumption. Table II-8 identifies the assumptions that were applied to estimate total stationary source Commercial/Institutional sector consumption.
Appendix A - 166 Kentucky Regional Haze 5-Year Periodic Report SIP Revision, September 2014
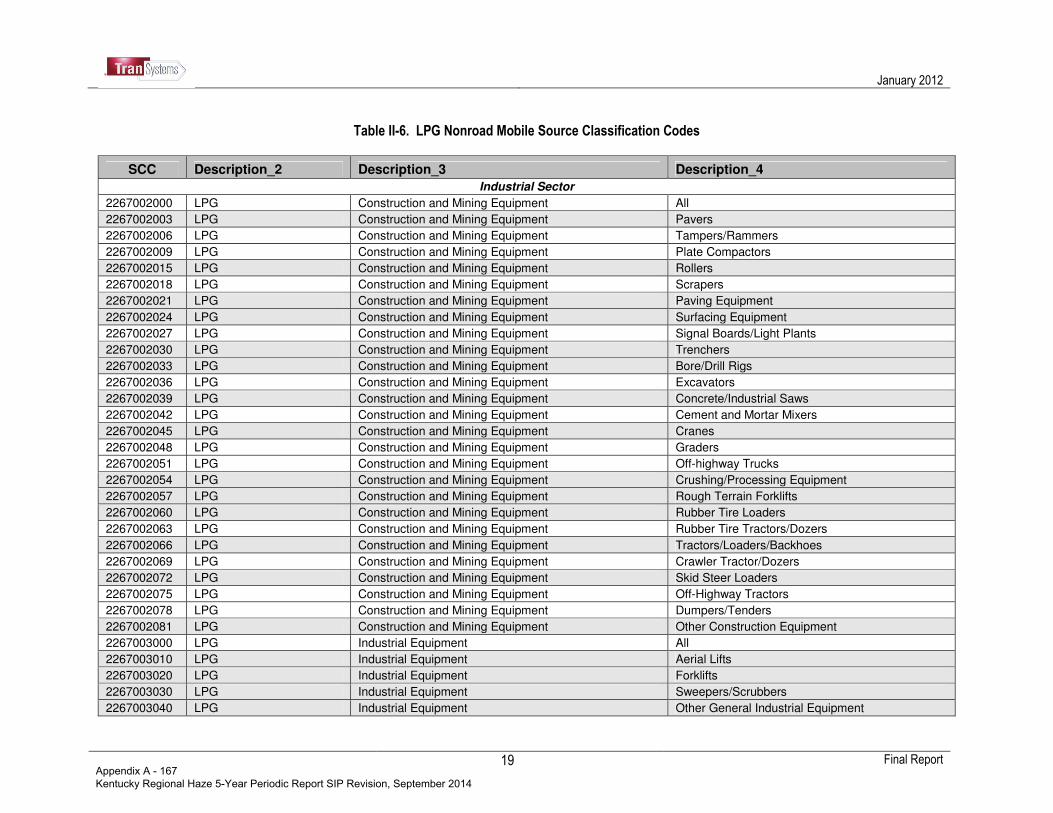
January 2012
19 Final Report
Table II-6. LPG Nonroad Mobile Source Classification Codes
SCC Description_2 Description_3 Description_4
Industrial Sector
2267002000 LPG Construction and Mining Equipment All
2267002003 LPG Construction and Mining Equipment Pavers
2267002006 LPG Construction and Mining Equipment Tampers/Rammers
2267002009 LPG Construction and Mining Equipment Plate Compactors
2267002015 LPG Construction and Mining Equipment Rollers
2267002018 LPG Construction and Mining Equipment Scrapers
2267002021 LPG Construction and Mining Equipment Paving Equipment
2267002024 LPG Construction and Mining Equipment Surfacing Equipment
2267002027 LPG Construction and Mining Equipment Signal Boards/Light Plants
2267002030 LPG Construction and Mining Equipment Trenchers
2267002033 LPG Construction and Mining Equipment Bore/Drill Rigs
2267002036 LPG Construction and Mining Equipment Excavators
2267002039 LPG Construction and Mining Equipment Concrete/Industrial Saws
2267002042 LPG Construction and Mining Equipment Cement and Mortar Mixers
2267002045 LPG Construction and Mining Equipment Cranes
2267002048 LPG Construction and Mining Equipment Graders
2267002051 LPG Construction and Mining Equipment Off-highway Trucks
2267002054 LPG Construction and Mining Equipment Crushing/Processing Equipment
2267002057 LPG Construction and Mining Equipment Rough Terrain Forklifts
2267002060 LPG Construction and Mining Equipment Rubber Tire Loaders
2267002063 LPG Construction and Mining Equipment Rubber Tire Tractors/Dozers
2267002066 LPG Construction and Mining Equipment Tractors/Loaders/Backhoes
2267002069 LPG Construction and Mining Equipment Crawler Tractor/Dozers
2267002072 LPG Construction and Mining Equipment Skid Steer Loaders
2267002075 LPG Construction and Mining Equipment Off-Highway Tractors
2267002078 LPG Construction and Mining Equipment Dumpers/Tenders
2267002081 LPG Construction and Mining Equipment Other Construction Equipment
2267003000 LPG Industrial Equipment All
2267003010 LPG Industrial Equipment Aerial Lifts
2267003020 LPG Industrial Equipment Forklifts
2267003030 LPG Industrial Equipment Sweepers/Scrubbers
2267003040 LPG Industrial Equipment Other General Industrial Equipment
Appendix A - 167 Kentucky Regional Haze 5-Year Periodic Report SIP Revision, September 2014
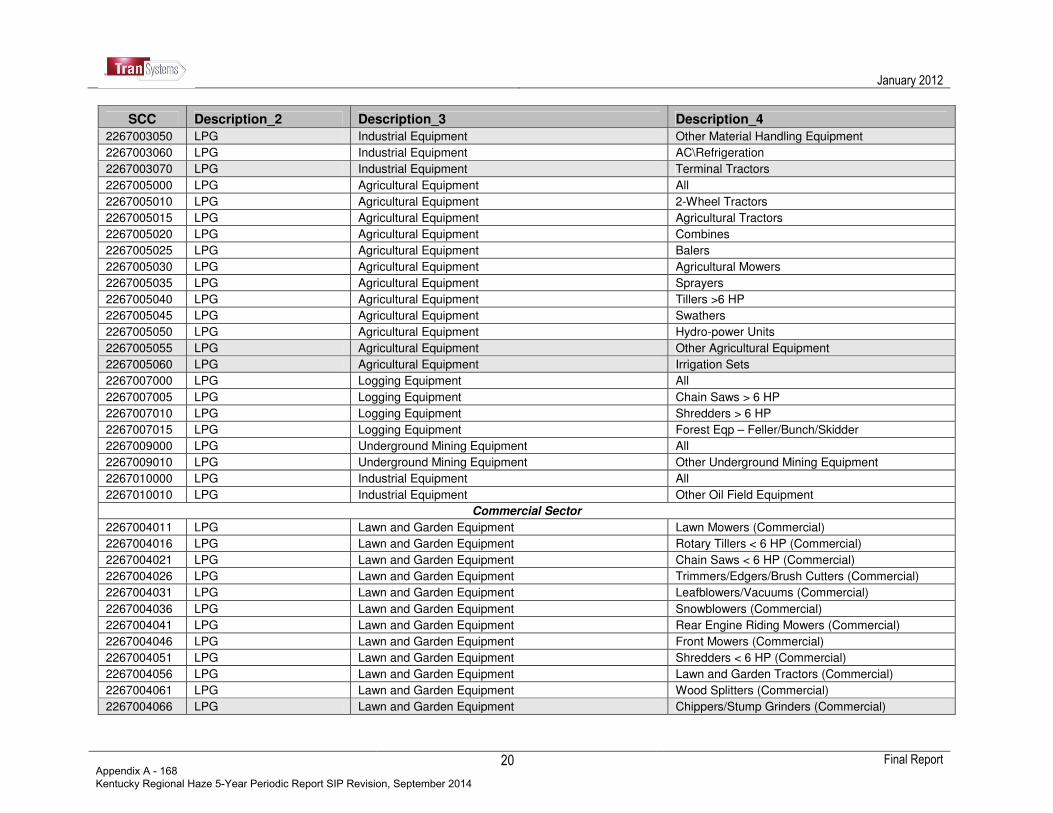
January 2012
20 Final Report
SCC Description_2 Description_3 Description_4
2267003050 LPG Industrial Equipment Other Material Handling Equipment
2267003060 LPG Industrial Equipment AC\Refrigeration
2267003070 LPG Industrial Equipment Terminal Tractors
2267005000 LPG Agricultural Equipment All
2267005010 LPG Agricultural Equipment 2-Wheel Tractors
2267005015 LPG Agricultural Equipment Agricultural Tractors
2267005020 LPG Agricultural Equipment Combines
2267005025 LPG Agricultural Equipment Balers
2267005030 LPG Agricultural Equipment Agricultural Mowers
2267005035 LPG Agricultural Equipment Sprayers
2267005040 LPG Agricultural Equipment Tillers >6 HP
2267005045 LPG Agricultural Equipment Swathers
2267005050 LPG Agricultural Equipment Hydro-power Units
2267005055 LPG Agricultural Equipment Other Agricultural Equipment
2267005060 LPG Agricultural Equipment Irrigation Sets
2267007000 LPG Logging Equipment All
2267007005 LPG Logging Equipment Chain Saws > 6 HP
2267007010 LPG Logging Equipment Shredders > 6 HP
2267007015 LPG Logging Equipment Forest Eqp – Feller/Bunch/Skidder
2267009000 LPG Underground Mining Equipment All
2267009010 LPG Underground Mining Equipment Other Underground Mining Equipment
2267010000 LPG Industrial Equipment All
2267010010 LPG Industrial Equipment Other Oil Field Equipment
Commercial Sector
2267004011 LPG Lawn and Garden Equipment Lawn Mowers (Commercial)
2267004016 LPG Lawn and Garden Equipment Rotary Tillers < 6 HP (Commercial)
2267004021 LPG Lawn and Garden Equipment Chain Saws < 6 HP (Commercial)
2267004026 LPG Lawn and Garden Equipment Trimmers/Edgers/Brush Cutters (Commercial)
2267004031 LPG Lawn and Garden Equipment Leafblowers/Vacuums (Commercial)
2267004036 LPG Lawn and Garden Equipment Snowblowers (Commercial)
2267004041 LPG Lawn and Garden Equipment Rear Engine Riding Mowers (Commercial)
2267004046 LPG Lawn and Garden Equipment Front Mowers (Commercial)
2267004051 LPG Lawn and Garden Equipment Shredders < 6 HP (Commercial)
2267004056 LPG Lawn and Garden Equipment Lawn and Garden Tractors (Commercial)
2267004061 LPG Lawn and Garden Equipment Wood Splitters (Commercial)
2267004066 LPG Lawn and Garden Equipment Chippers/Stump Grinders (Commercial)
Appendix A - 168 Kentucky Regional Haze 5-Year Periodic Report SIP Revision, September 2014
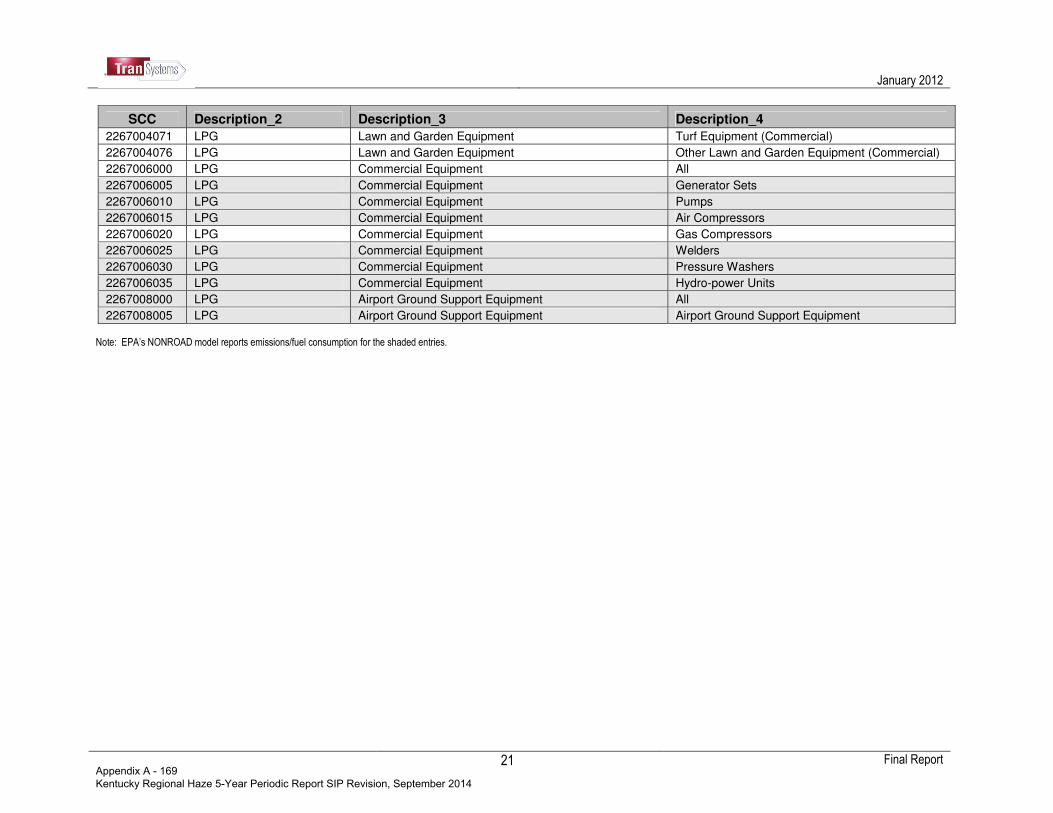
January 2012
21 Final Report
SCC Description_2 Description_3 Description_4
2267004071 LPG Lawn and Garden Equipment Turf Equipment (Commercial)
2267004076 LPG Lawn and Garden Equipment Other Lawn and Garden Equipment (Commercial)
2267006000 LPG Commercial Equipment All
2267006005 LPG Commercial Equipment Generator Sets
2267006010 LPG Commercial Equipment Pumps
2267006015 LPG Commercial Equipment Air Compressors
2267006020 LPG Commercial Equipment Gas Compressors
2267006025 LPG Commercial Equipment Welders
2267006030 LPG Commercial Equipment Pressure Washers
2267006035 LPG Commercial Equipment Hydro-power Units
2267008000 LPG Airport Ground Support Equipment All
2267008005 LPG Airport Ground Support Equipment Airport Ground Support Equipment Note: EPA’s NONROAD model reports emissions/fuel consumption for the shaded entries.
Appendix A - 169 Kentucky Regional Haze 5-Year Periodic Report SIP Revision, September 2014
January 2012
22 Final Report
Table II-7. Assumptions Used to Estimate Industrial Sector Stationary Source Distillate Fuel Consumption
Sector Distillate Fuel Type
% of Total Consumption from Stationary Sources
Industrial
No. 1 Distillate Fuel Oil 60
No. 2 Distillate Fuel Oil 100
No. 2 Distillate/Low and High Sulfur Diesel 15a
No. 4 Distillate Fuel Oil 100
Farm Diesel 0
Other Distillate Fuel Oil 100
Off-Highway (Construction and Other)
Distillate Fuel Oil 5
Oil Company Distillate Fuel Oil 50 a This value differs from the 0 percent assumption adopted in EPA’s nonroad diesel emissions rulemaking because it is known that some diesel fuel is used by stationary sources (a 15 percent value was selected for use as an approximate mid-point of a potential range of 8 to 24 percent stationary source use computed from a review of national data from the EIA’s Manufacturing Energy Consumption Survey and “Fuel Oil and Kerosene Sales”).
Table II-8. Assumptions Used to Estimate Commercial/Institutional Sector Stationary Source
Distillate Fuel Consumption
Sector Distillate Fuel Type % of Total Consumption from Stationary Sources
Commercial
No. 1 Distillate Fuel Oil 80
No. 2 Distillate Fuel Oil 100
No. 2 Distillate/Ultra-Low, Low, and High Sulfur Diesel 0a
No. 4 Distillate Fuel Oil 100 a A very small portion of total commercial/institutional diesel is actually consumed by point sources (SCC 203001xx).
c. Non-Fuel Energy Consumption Some Industrial sector energy is consumed for non-fuel purposes. For example, natural gas is used as a feedstock in chemical manufacturing plants and to make nitrogenous fertilizer, and LPG is used to create intermediate products that are made into plastics. To estimate the volume of fuel that is associated with ICI combustion, it is necessary to subtract the volume of fuel consumption for non-energy uses from the volume of total fuel consumption. The EPA’s State Inventory Tool (SIT) provides national defaults representing the percentage of total Industrial fuel consumption from non-energy uses. These default values have an additional limitation beyond their lack of geographic detail - they represent the EIA’s definition of the Industrial sector, which includes fuel use that is accounted for in other inventory source categories (e.g., Farm, Mining, Construction, and Commercial sectors fuel use that is accounted for in the nonroad inventory). Because of these limitations, TranSystems used regional non-fuel use percentages computed from energy consumption data from the EIA’s 2006 Manufacturing Energy Consumption Survey (MECS) for all fuel types (EIA, 2009c). There are two reasons why MECS provides a more representative data set for use in this project: (1) MECS provides data specific to the region of interest; and (2) MECS focuses solely on the Manufacturing sector. The latter
Appendix A - 170 Kentucky Regional Haze 5-Year Periodic Report SIP Revision, September 2014
January 2012
23 Final Report
characteristic is particularly important for fuel types which consume significant amounts of non-Manufacturing sector energy that is already included elsewhere (e.g., distillate fuel used by the Construction sector, which is included in the nonroad inventory). The MECS non-fuel consumption data treat coal that is used to produce coke as a feedstock (Lorenz, 2009). However, available data indicate that only four of the SESARM states produce coke (Alabama, Kentucky, Virginia, West Virginia; EIA, 2008a) and coke combustion is not included in the area source emissions inventory. Because of this, TranSystems estimated the percent energy consumption from non-fuel use for SESARM states without coke plants by subtracting the coal used in the primary metals industrial subsector (NAICS code 331*) from the MECS coal dataset. More than 97 percent of coking coal is ultimately consumed in this subsector (Lorenz, 2009). Table II-9 presents the non-fuel use percentages by type of energy.
Table II-9. Industrial Sector Energy Consumption from Non-Fuel Uses
Energy Type
2006 MECS % Energy Consumption from Non-Fuel Use
South1 National
Residual 30% 20%
Distillate 12% 12%
Natural Gas 11% 7%
LPG/NGL 99% 97%
Coal (excludes coking coal) 9% 6%
Sources: EIA, 2009c and Lorenz, 2009. 1 All SESARM states are in the South region.
d. Emission Factors Table II-10 presents the criteria pollutant emission factors that TranSystems used in calculating ICI combustion area source emissions. Except as noted below, all criteria air pollutant emission factors are from an EPA database used to prepare the 2008 nonpoint source NEI (Huntley, 2009).10 Wood combustion emission factors are from AP-42 (EPA, 2003b). Because there are no NH3 emission factors for ICI fuel combustion available in the 2008 NEI emission factor database, AP-42, or EPA’s WebFIRE, TranSystems used emission factors reported in an NH3
emissions Emission Inventory Improvement Program (EIIP) guidance document (Pechan, 2004).
10 All criteria pollutant emission factors were rounded to two decimal places.
Appendix A - 171 Kentucky Regional Haze 5-Year Periodic Report SIP Revision, September 2014

January 2012
Final Report
24
Table II-10. Criteria Pollutant Emission Factors for ICI Combustion Area Source Categories
SCC Description Emission
Factor Units1 VOC NOx CO SO2 PM2.5-FIL PM10-FIL PM-CON NH3
2102001000 Industrial Anthracite Coal lb/ton 0.3 9 0.6 39 * S% 0.48 * A% 1.1 * A% 0.08 0.03
2102002000 Industrial Bitum/Subbitum Coal lb/ton 0.05 11 5 38 * S% 1.4 12 1.04 0.03
2102004000 Industrial Distillate Oil lb/1000 gal 0.2 20 5 142 * S% 0.25 1 1.3 0.8
2102005000 Industrial Residual Oil lb/1000 gal 0.28 55 5 157 * S% 4.67 * (1.12 * S% + 0.37)
7.17 * (1.12 * S% + 0.37)
1.5 0.8
2102006000 Industrial Natural Gas lb/MMcf 5.5 100 84 0.6 0.11 0.2 0.32 0.49
2102007000 Industrial LPG 2 lb/1000 bbl 21.9 398 502 2.39 0.438 0.797 1.275 1.95
2102008000 Industrial Wood 3 lb/MMBtu 0.017 0.22 0.6 0.025 0.43 0.5 0.017 0.0074
2102011000 Industrial Kerosene lb/1000 gal 0.19 19.29 4.82 142 * S% 0.24 0.96 1.25 0.771
2103001000 Comm/Inst Anthracite Coal lb/ton 0.3 9 0.6 39 * S% 0.48 * A% 1.1 * A% 0.08 * A% 0.03
2103002000 Comm/Inst Bitum/Subbitum Coal lb/ton 0.05 11 5 38 * S% 1.4 12 1.04 0.03
2103004000 Comm/Inst Distillate Oil lb/1000 gal 0.34 20 5 142 * S% 0.83 1.08 1.3 0.8
2103005000 Comm/Inst Residual Oil lb/1000 gal 1.13 55 5 157 * S% 1.92 * (1.12 * S% + 0.37)
5.17 * (1.12 * S% + 0.37)
1.5 0.8
2103006000 Comm/Inst Natural Gas lb/MMcf 5.5 100 84 0.6 0.11 0.2 0.32 0.49
2103007000 Comm/Inst LPG lb/1000 bbl 21.9 398 502 2.39 0.438 0.797 1.275 1.95
2103008000 Comm/Inst Wood 3 lb/MMBtu 0.017 0.22 0.6 0.025 0.43 0.5 0.017 0.0054
2103011000 Comm/Inst Kerosene lb/1000 gal 0.33 19.29 4.82 142 * S% 0.8 1.04 1.25 0.771
Source: Unless otherwise noted, 2008 nonpoint source NEI (Huntley, 2009). Notes: 1 lb = pound; ton = short ton; gal = gallon; MMcf = million cubic feet; MMBtu = million British thermal units; bbl = barrels; S = sulfur content; A = ash
content 2 Emission factors from Commercial/Institutional LPG. 3 Emission factors from AP-42, Section 1.6, Wood Residue Combustion in Boilers (EPA, 2003b).
4 Emission factor from Pechan, 2004 (converted from lb/ton using 0.08 ton/MMBtu for Industrial sector and 0.0625 ton/MMBtu for Commercial sector).
Appendix A - 172 Kentucky Regional Haze 5-Year Periodic Report SIP Revision, September 2014

January 2012
Final Report
25
With a few notable exceptions, the 2008 NEI emission factors are the same as those used for the 2002 NEI.11 The PM emission factors for natural gas and LPG combustion are the major exceptions. Because the 2002 emission factors were deemed too high because of artifact formation in the test method (method 202) during stack testing, EPA developed a set of SCC-specific adjustment factors to apply to the 2002 NEI to better reflect PM emissions from these fuels.12 In preparation for the 2008 NEI, EPA developed revised natural gas PM emission factors by applying these adjustment factors to the 2002 NEI emission factors. Revised emission factors for LPG were computed by applying appropriate conversion factors to the updated natural gas emission factors. e. Coal Sulfur and Ash Content For a recent ICI combustion area source inventory project for the Central Regional Air Planning Association (CENRAP), TranSystems evaluated the reliability of various data sources for coal sulfur content to be used to estimate emissions in that project. TranSystems evaluated five potential data sources:
1. 2002 CENRAP state point source inventories; 2. U.S. Geological Survey (USGS)’s U.S. Coal Quality Database; 3. Energy Information Administration (EIA)’s “Cost and Quality of Fuels for Electric Plants 2002 and 2003.” 4. EIA’s “EIA-423 - Monthly Nonutility Fuel Receipts and Fuel Quality Data, 2002;” and 5. EIA’s “Quarterly Coal Report, January–March 2003.”
TranSystems evaluated these coal sulfur content data sources with respect to two specific criteria identified in the QAPP for this project: representativeness and accuracy. Based on these evaluations, TranSystems used the average sulfur content data from EIA’s “Quarterly Coal Report” to estimate the sulfur content of both Industrial and Commercial/Institutional sector bituminous/subbituminous coal in each SESARM state (EIA, 2008b). Even though this source does not report whether the coal is bituminous/subbituminous or anthracite, it is appropriate to treat the values for this source as representative of bituminous/subbituminous coal because anthracite accounts for only a very small proportion of coal consumption in SESARM states. Due to the lack of available data for anthracite coal, TranSystems used the average ash content (13.38 percent) and sulfur content (0.89 percent) from the 2002 NEI for the Industrial and Commercial/Institutional sectors. These percentages are based on the composition of anthracite coal seams in Pennsylvania, where all anthracite coal imported by SESARM states originated in 2007 (EIA, 2008c). Tables II-11 and II-12 report the coal ash and/or sulfur content values that were used in calculating ICI combustion area source emissions for the 2007 base year inventory.
11 The 2002 NEI documentation provides citations to the AP-42 source for each emission factor. 12 These factors reduce PM emissions by more than 90 percent.
Appendix A - 173 Kentucky Regional Haze 5-Year Periodic Report SIP Revision, September 2014
January 2012
Final Report
26
Table II-11. Bituminous/Subbituminous Coal Sulfur Content for 2007 ICI Combustion
State Industrial Coal1
Sulfur Content (%)
Commercial/ Institutional Coal2 Sulfur Content (%)
Alabama 0.94 0.94
Florida 0.87 0.87
Georgia 0.95 0.95
Kentucky 0.89 0.89
Mississippi 2.01 2.01
South Carolina 1.10 1.10
North Carolina 0.90 0.90
Tennessee 1.21 1.21
Virginia 0.96 0.96
West Virginia 0.95 0.95 1Reflects the average from coal received in 2007. 2Assumes that coal burned in the Commercial/Institutional sector has the same composition as coal burned in the Industrial sector.
Table II-12. Anthracite Coal Ash and Sulfur Content for 2007 ICI Combustion
State
Industrial Commercial/Institutional
Ash Content (%) Sulfur Content (%)
Ash Content (%) Sulfur Content (%)
Alabama 13.38 0.89 13.38 0.89
Florida 13.38 0.89 13.38 0.89
Georgia 13.38 0.89 13.38 0.89
Kentucky 13.38 0.89 13.38 0.89
Mississippi 13.38 0.89 13.38 0.89
South Carolina 13.38 0.89 13.38 0.89
North Carolina 13.38 0.89 13.38 0.89
Tennessee 13.38 0.89 13.38 0.89
Virginia 13.38 0.89 13.38 0.89
West Virginia 13.38 0.89 13.38 0.89
Appendix A - 174 Kentucky Regional Haze 5-Year Periodic Report SIP Revision, September 2014
January 2012
Final Report
27
f. County Allocation Data After computing state-level area source emissions using the data described above, the next step is to allocate these emissions to individual counties. Separate allocation approaches were implemented for the Industrial and Commercial/Institutional sectors. For Commercial/Institutional sector source categories, the approach relies on county employment data compiled from government sources. For Industrial sector source categories, the approach utilizes county-level Industrial sector energy consumption estimates developed in this effort. Commercial/Institutional Because SEDS data originate from EIA fuel sector-specific surveys of energy suppliers,13 TranSystems reviewed these survey forms/instructions for further details on what SEDS considers Commercial sector use of each fuel. This review found that the surveys/guidance do not always provide further clarity. In addition, the EIA has admitted that energy suppliers may use their own account classifications as well as EIA guidance in determining whether a particular account belongs in the Residential, Commercial, Industrial, or Transportation sector. The only source of NAICS-code based EIA definitions of the Commercial energy sector is a “rough crosswalk” between Commercial building types and NAICS codes developed for EIA’s Commercial Building Energy Consumption Survey (CBECS). With the exception of NAICS code 814 (Private Households), this crosswalk links all NAICS codes between 42 and 92 with Commercial building energy consumption. Employment data for the CBECS-identified NAICS codes (42 though 92 with exception of 814) were used to allocate SEDS energy consumption data to individual counties. TranSystems used private sector 2006 employment data from County Business Patterns (CBP) and public sector 2006 employment data from the Census of Governments (Census, 2009a; and Census, 2009b) because these data were already compiled in support of the 2008 NEI (year-to-year changes in county employment proportions are expected to be minimal). Industrial Unlike the Commercial sector, documentation provides a clear listing of the NAICS codes associated with SEDS Industrial energy consumption data: “the industrial sector encompasses the following types of activity: Manufacturing (NAICS codes 31–33); Agriculture, Forestry, Fishing and Hunting (NAICS code 11); Mining, including Oil and Gas Extraction (NAICS code 21); and Construction (NAICS code 23).” As noted earlier, a portion of Industrial sector consumption (Agriculture, Mining and Construction) is already accounted for in other emission inventory sectors and was removed. Therefore, TranSystems did not expand the list of NAICS codes used to represent the area source Industrial fuel combustion category beyond the Manufacturing sector NAICS codes (31-33). Employment-based county allocation methods lead to overrepresentation of energy consumption in counties with sectors that have high employment but low energy intensities (measured on a Btu per employee basis), and vice-versa. Given that Manufacturing sectors have much greater energy intensity variability than Commercial/Institutional sectors, TranSystems utilized energy use per employee values by NAICS code to improve upon the employment-based county allocation approach used in the 2008 NEI for the Industrial fuel combustion category. This procedure relied on 2007 national energy consumption data by NAICS code as reported by EIA in Annual Energy Outlook (EIA, 2009d). Energy intensity values were computed by dividing these Btu-based energy consumption estimates by NAICS code-level 2007 national employment data. The resulting intensity values were then multiplied by county/NAICS code-level employment estimates from CBP to estimate total county energy consumption by NAICS code. These values were then summed for the appropriate Industrial fuel combustion NAICS codes. The resulting county-level total Industrial energy consumption estimates were used to apportion state-level area source Industrial fuel combustion emissions to each county.
13 For natural gas, for example – EIA-176 “Annual Report of Natural and Supplemental Gas Supply and Disposition.”
Appendix A - 175 Kentucky Regional Haze 5-Year Periodic Report SIP Revision, September 2014
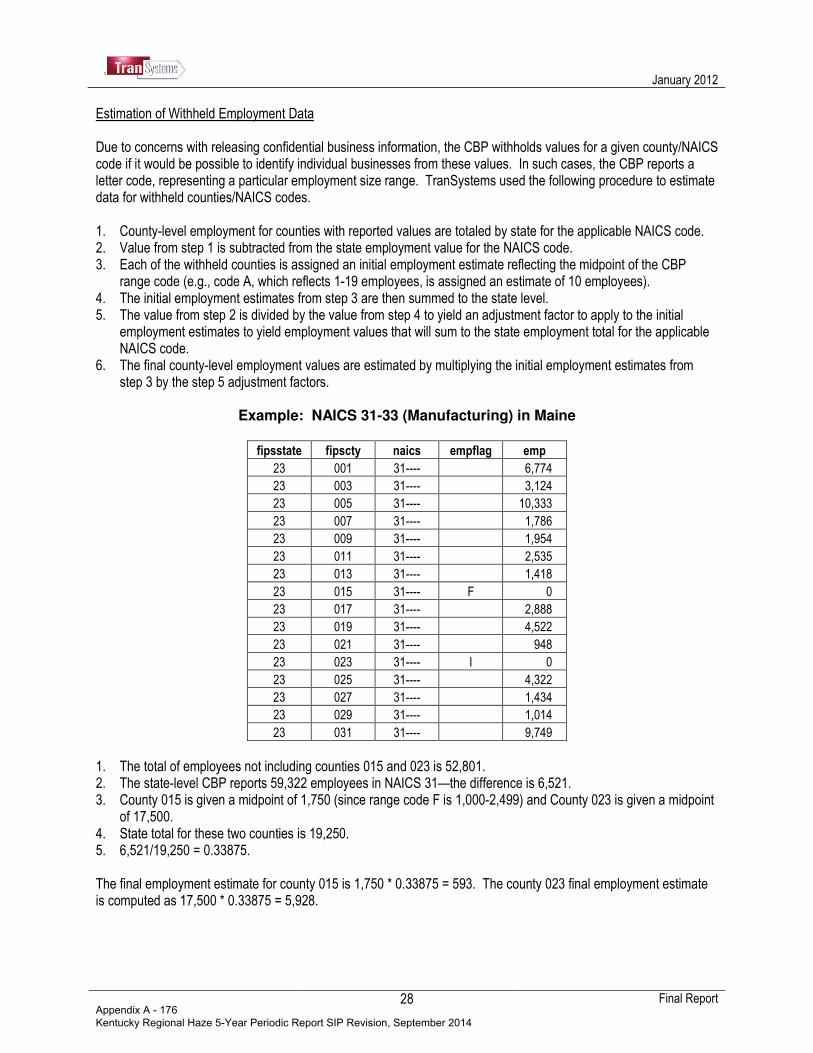
January 2012
Final Report
28
Estimation of Withheld Employment Data Due to concerns with releasing confidential business information, the CBP withholds values for a given county/NAICS code if it would be possible to identify individual businesses from these values. In such cases, the CBP reports a letter code, representing a particular employment size range. TranSystems used the following procedure to estimate data for withheld counties/NAICS codes. 1. County-level employment for counties with reported values are totaled by state for the applicable NAICS code. 2. Value from step 1 is subtracted from the state employment value for the NAICS code. 3. Each of the withheld counties is assigned an initial employment estimate reflecting the midpoint of the CBP
range code (e.g., code A, which reflects 1-19 employees, is assigned an estimate of 10 employees). 4. The initial employment estimates from step 3 are then summed to the state level. 5. The value from step 2 is divided by the value from step 4 to yield an adjustment factor to apply to the initial
employment estimates to yield employment values that will sum to the state employment total for the applicable NAICS code.
6. The final county-level employment values are estimated by multiplying the initial employment estimates from step 3 by the step 5 adjustment factors.
Example: NAICS 31-33 (Manufacturing) in Maine
fipsstate fipscty naics empflag emp
23 001 31---- 6,774
23 003 31---- 3,124
23 005 31---- 10,333
23 007 31---- 1,786
23 009 31---- 1,954
23 011 31---- 2,535
23 013 31---- 1,418
23 015 31---- F 0
23 017 31---- 2,888
23 019 31---- 4,522
23 021 31---- 948
23 023 31---- I 0
23 025 31---- 4,322
23 027 31---- 1,434
23 029 31---- 1,014
23 031 31---- 9,749
1. The total of employees not including counties 015 and 023 is 52,801. 2. The state-level CBP reports 59,322 employees in NAICS 31—the difference is 6,521. 3. County 015 is given a midpoint of 1,750 (since range code F is 1,000-2,499) and County 023 is given a midpoint
of 17,500. 4. State total for these two counties is 19,250. 5. 6,521/19,250 = 0.33875. The final employment estimate for county 015 is 1,750 * 0.33875 = 593. The county 023 final employment estimate is computed as 17,500 * 0.33875 = 5,928.
Appendix A - 176 Kentucky Regional Haze 5-Year Periodic Report SIP Revision, September 2014
January 2012
Final Report
29
3. Estimation of Area Source Emissions from Residential Wood Combustion
Residential wood combustion was calculated using the EPA’s Residential Wood Combustion (RWC) Tool. The tool uses the following equation to estimate RWC emissions: Emissions = (Number of wood-burning appliances) x (Cords of wood burned per appliance) x (Density of
wood burned) x (Emission factor) A review of the spatial distribution of SESARM region PM2.5 emissions from the tool indicated much higher emissions in urbanized areas than rural areas. Although there is reason to expect some correlation between the number of occupied housing units and residential wood combustion emissions, this correlation would be expected to be fairly weak because of at least two factors. The first factor is that housing units in urbanized areas generally have greater access to natural gas as a heating fuel, and therefore, would be expected to have a greater penetration of natural gas fireplaces than rural areas. The second factor is that the access to inexpensive wood supplies would be expected to be much greater in rural areas (and related to this, the proportion of housing units with wood-burning appliances that are used as primary heating units – i.e., woodstoves, outdoor hydronic heaters, pellet stoves – would also be expected to be greater in rural areas). Review of several wood consumption surveys, including the latest survey from Minnesota, also showed a clear trend in households in urbanized areas consuming less wood than their counterparts in rural areas. Based on this review, SESARM, with primary assistance from Tracy Anderson of the Alabama Department of Environmental Management, examined the EPA Tool’s default assumptions for the first two variables in the RWC emissions estimation equation. The following describes the specific refinements that SESARM incorporated into a revised RWC Tool for these two variables. Number of Wood-Burning Appliances SESARM incorporated updates to the estimated number of the following types of wood-burning appliances:
• Fireplaces;
• Fireplace Insert Uncertified;
• Fireplace Insert EPA Certified Catalytic;
• Fireplace Insert EPA Certified Non-catalytic;
• Woodstove Uncertified;
• Woodstove EPA Certified Catalytic;
• Woodstove EPA Certified Non-catalytic; and
• Fireplaces Burning Wax Logs. For these equipment types, the EPA’s RWC tool estimates the number of wood-burning appliances in each county by multiplying the county’s number of occupied housing units by an appropriate wood-burning appliance profile. Where possible, SESARM first updated the occupied housing unit estimates in the Tool. The Tool estimates the number of occupied housing units by multiplying each county’s total number of housing units in 2007, as reported by the U.S. Census Bureau, by the county-level occupancy rate in 2000 (last year of occupancy rate data available from the Census). For select counties (primarily those with large populations), the Census’ American Community Survey (ACS) reports estimates of the 2007 year number of occupied housing units. Several states use the ACS data and indicated a preference for its use. Therefore, SESARM updated the EPA tool to use the ACS’ housing unit estimates for counties where these data were available. A second type of update involved revisions to the wood-burning appliance profiles. Appliance profiles represent the fraction of occupied housing units that have each of the wood-burning appliances listed above. The appliance profiles were developed from the number of wood burning appliances and number of occupied housing units data
Appendix A - 177 Kentucky Regional Haze 5-Year Periodic Report SIP Revision, September 2014
January 2012
Final Report
30
compiled from the U.S. Census Bureau’s "American Housing Survey" (AHS). The RWC Tool applies appliance profiles to one or more geographic locations. The Tool includes a set of Metropolitan Statistical Area (MSA)-specific appliance profiles and regional default appliance profiles (Northeast, Midwest, South, and West). Based on new information gathered from these surveys, SESARM calculated 12 additional appliance profiles to better characterize the wood-burning appliance population. These profiles are as follows:
1) A default urban appliance profile based on national urban values reported by the 2005 National AHS, 2) "Sub-MSA" area profiles for each of the following MSAs:
a. Birmingham, AL; b. Miami-Dade County, FL; c. Urban Atlanta, GA; d. Kenton County, KY; e. De Soto County, MS; f. Gaston County, NC; g. Mecklenburg County, NC; h. York County, SC; i. Shelby County, TN; j. Fairfax County, VA; and k. Urban Norfolk-Virginia Beach-Newport News area, VA.
These sub-MSA appliance profiles were developed using the “sub-area” sections of the original Metropolitan Areas AHS used in the RWC tool. In keeping with EPA’s MSA appliance profile assignment approach, SESARM assigned the sub-MSA profiles only to the counties to which they applied. SESARM developed a default urban appliance profile in an attempt to better characterize wood-burning equipment populations in urbanized areas for which the AHS does not report MSA-specific data. This profile reflects national average wood-burning appliance information from the 2005 National AHS. The next step was to develop a set of criteria for determining what counties should be assigned the applicable regional average appliance profile (South), and which would be assigned the new national urban appliance profile. Figure 1 shows the decision tree that SESEARM developed to assign each of these two appliance profiles.
Appendix A - 178 Kentucky Regional Haze 5-Year Periodic Report SIP Revision, September 2014
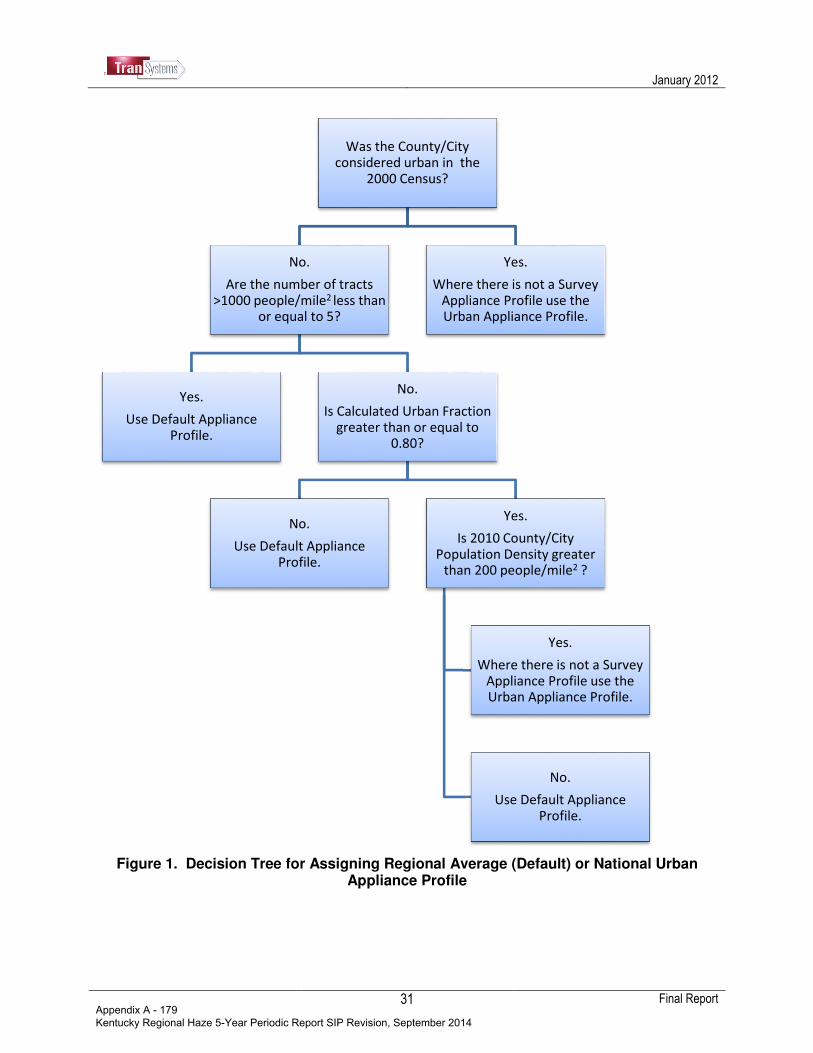
January 2012
Final Report
31
Figure 1. Decision Tree for Assigning Regional Average (Default) or National Urban
Appliance Profile
Was the County/City considered urban in the
2000 Census?
No.
Are the number of tracts >1000 people/mile2 less than
or equal to 5?
Yes.
Use Default Appliance Profile.
No.
Is Calculated Urban Fraction greater than or equal to
0.80?
No.
Use Default Appliance Profile.
Yes.
Is 2010 County/City Population Density greater
than 200 people/mile2 ?
Yes.
Where there is not a Survey Appliance Profile use the Urban Appliance Profile.
No.
Use Default Appliance Profile.
Yes.
Where there is not a Survey Appliance Profile use the Urban Appliance Profile.
Appendix A - 179 Kentucky Regional Haze 5-Year Periodic Report SIP Revision, September 2014
January 2012
Final Report
32
The above does not address the estimated count of the following wood-burning appliance types:
• Pellet stoves;
• Indoor furnaces; and
• Hydronic heaters (also known as outdoor wood boilers). The estimates for these equipment types are hard-coded into the RWC Tool. After review of the EPA’s appliance count estimation methods for these units, SESARM decided that the estimates for these appliances should also be updated. In the case of pellet stoves and hydronic heaters, the RWC Tool allocates regional (pellet stoves) or state-level (hydronic heater) counts of each appliance type. The RWC Tool utilizes estimates of the number of each type of equipment as calculated from cumulative sales data. The Tool then allocates these regional/state estimates to counties based on the proportion of regional/state number of woodstoves in each county. Because SESARM’s revised RWC Tool includes updated county-level woodstove population estimates, consistency with EPA’s methodology requires re-allocating the estimated number of regional/state pellet stoves and hydronic heaters to each county using the updated woodstove data incorporated into the revised Tool. The RWC Tool estimates the number of wood-burning indoor furnaces by multiplying the estimated number of woodstoves in each county by a factor. The EPA calculated this factor (0.53) from data on the number of woodstoves and indoor furnaces used for main heating in climate zones 1-3. To be consistent with the RWC Tool methods for estimating indoor furnaces, SESARM updated the indoor furnace appliance counts by multiplying the revised number of woodstoves in each county by the 0.53 factor. Cords of Wood Burned per Appliance SESARM also incorporated new burn rate profiles that characterize the amount of wood burned in each type of appliance. As with the appliance profiles, burn rate profiles can be assigned to one or more geographical areas. The EPA’s RWC Tool included burn rate profiles that were developed and refined by EPA using survey data from the U.S. Forest Service’s North Central region as the starting point. The EPA adjusted these data based on the ratio of energy consumption in the surveyed climate to energy consumption in other areas of the country. For example, if the energy consumption in climate zone 5 (the warmest climate zone) was half of the energy consumption in climate zone 1 (the surveyed climate zone), burn rates in climate zone 5 were estimated to be 50 percent of the burn rates in climate zone 1. The energy consumption data for these adjustments was obtained from the Energy Information Administration (EIA)'s 2005 Residential Energy Consumption Survey (RECS). SESARM compiled 2005 RECS data to refine the EPA’s burn rates, by computing the average cords of wood burned per household for each of three categories: Rural, Urban (sum of cities, towns, and suburbs), and Total. SESARM then calculated two ratios: Rural to Total wood consumption per household (1.563); and Urban to Total wood consumption per household (0.537). These ratios were then applied to the existing burn rate profiles to create new Rural and Urban burn rate profiles for each of the SESARM region climate zones—2, 3, 4, and 5. After the appropriate calculations were performed the new burn rate profiles were developed by adding either an “r” for Rural or “u” for urban to the original RWC tool default burn rate profile number. They are as follows:
1. Climate zone 2 : Nu and Nr 2. Climate zone 3 : 3Au and 3Ar 3. Climate zone 4 : 4u and 4r 4. Climate zone 5 : 5u and 5r
The next step in refining the burn rate information was to identify the criteria for assigning the Rural, Urban, and overall average burn rates (the original tool burn rate for a given climate zone) to each county within a climate zone. SESEARM developed these criteria, which are represented in Figure 2.
Appendix A - 180 Kentucky Regional Haze 5-Year Periodic Report SIP Revision, September 2014

January 2012
Final Report
33
After implementing the appliance profile and burn rate refinements, SESARM developed emission summary comparisons of EPA’s default RWC Tool versus the Tool updated by ADEM. These comparisons were submitted for State//Local agency review and comment. The following identify the revisions that were implemented based on comments supplied by S/L agencies:
• West Virginia revised the burn rate profiles in the following counties: o Berkeley – from default to urban; o Fayette – from rural to default; and o Jefferson – from rural to default.
It should also be noted that Shelby County, Tennessee directed SESARM to utilize Local agency RWC emissions in place of the RWC Tool emissions.
Figure 2. Decision Tree for Assigning Average (Default), Urban, or Rural Burn Profiles
Was the County/City considered urban in the 2000 Census?
No.
Is Calculated Urban fraction less than 0.50?
No.
Are the number of tracts >1000 people/mile2 equal to zero?
No.
Is Calculated Urban fraction greater than or equal to 0.80?
No.
Is 2010 County Population
Density >= 200 people/mile2?
No.
Use Default Burn Rate.
Yes.
Are the number of tracts >1000
people/mile2 more than five?
Yes.
Use Urban Burn Rate.
No.
Use Default Burn Rate.
Yes.
Use Urban Burn Rate.
Yes.
Is Appliance Profile = 39?
Yes.
Use Default Burn Rate.
No.
Use Rural Burn Rate.
Yes.
Is 2010 County Population Density >=
200 and has 1 or more tracts>= 1000people/mile2?
Yes.
Use Default Burn Rate.
No.
Use Rural Burn rate.
Yes.
Use Urban Burn Rate.
Appendix A - 181 Kentucky Regional Haze 5-Year Periodic Report SIP Revision, September 2014

January 2012
Final Report
34
4. Estimation of Area Source Emissions from Gasoline Service Stations/Stage I TranSystems estimated stage I gasoline service station emissions using the NEI methodology referenced in Table II-2. To improve emission estimates, TranSystems prepared a proposed set of key Stage I gasoline service station emission calculation parameter values for review by S/L agencies: (a) county-level gasoline throughput values; (b) emission control parameter values; and (c) county/month-level Reid vapor pressure (RVP) values. TranSystems specifically requested that agencies provide any updates they have to these values, including updates to the following control information: (a) filling technologies used (splash, submerged, and balanced submerged); (b) the rule effectiveness of S/L requirements for submerged and/or balanced submerged filling; (c) the rule penetration (RP) for submerged and/or balanced submerged filling; and (d) the control efficiency of balanced submerged filling. The RP value represents the proportion of throughput that is filled using submerged/balanced submerged filling, while the remaining proportion is assumed to be splash filling. In keeping with past NEI practice, the default rule effectiveness assumption was 100 percent (rule effectiveness is an adjustment to reflect any assumed non-compliance with the requirements of a regulation). The default control efficiency for balanced submerged filling was 90 percent for all SESARM counties (control efficiency is the percentage of a source category's emissions that is controlled by a control device). There is no control efficiency for submerged filling because the emission reduction effects of submerged filling are accounted for in the emission estimation equation (via a submerged-filling specific saturation factor) rather than a post-emission estimation adjustment. TranSystems reviewed all updated parameter values supplied by S/L agencies, provided follow-up questions/data requests to ensure the completeness and validity of the data, and incorporated any updated Stage I emission calculation parameter values provided by agencies. TranSystems prepared revised base year stage I gasoline service station VOC emission estimates using the agency-supplied values and provided S/L agencies with spreadsheets comparing the original and revised emission estimates. TranSystems updated the draft revised emission estimates to reflect S/L agency comments, and incorporated the final revised Stage I estimates into the revised final stationary area source inventory.
C. INVENTORY SUPPLEMENTATION/FINAL DATA MERGING As directed by S/L agencies, TranSystems supplemented 2007 S/L agency supplied emissions data (when supplied) and TranSystems default emissions data with emissions data from the 2002 nonpoint source NEI, or in the case of Georgia, the State’s 2005 Consolidated Emissions Reporting Rule (CERR) submittal. To assist agencies that supplied S/L emissions data, TranSystems compiled a list of SCC/pollutant combinations in the S/L area’s portion of the 2002 nonpoint source NEI that did not match to combinations in either the S/L agency inventory or TranSystems’ default inventory. This list was documented in an Excel worksheet and transmitted along with a request for agencies to identify whether each combination’s emissions should be carried forward or grown to 2007 using EGAS growth factors. TranSystems contacted agencies with any necessary follow-up questions to clarify guidance on the NEI supplementation procedure. To assist agencies that did not supply their own emissions data, TranSystems compiled a list of SCC/pollutant combinations in the state’s portion of the 2002 nonpoint source NEI that did not match to combinations in TranSystems default inventory. These lists were documented in an Excel workbook, which also contained a worksheet identifying associated inventory supplementation questions (e.g., “the 2002 NEI reports VOC emissions under Dry Cleaning/Perchloroethylene SCCs—TranSystems default inventory does not include VOC emissions for this SCC because perchloroethylene is no longer considered a VOC by EPA. Please confirm that VOC emissions from these SCCs should not be carried forward/grown”). After reviewing state agency responses to these data merging questions, TranSystems contacted agencies with follow-up questions as necessary to clarify state guidance.
Appendix A - 182 Kentucky Regional Haze 5-Year Periodic Report SIP Revision, September 2014

January 2012
Final Report
35
Table II-13 displays the SCC/pollutant combinations for which 2002 nonpoint source NEI emissions were carried forward or grown to 2007 using growth factors from EGAS.14 Further documenting the data merging procedures are NIF EM table records and the SCC/county-level emission summaries that display a data source code for each record. Table II-14 presents the data source codes used to document the source of each area source emission record. The compiled inventory was converted into EPA’s NIF 3.0 nonpoint source file format.15
14 Note that for some SCCs, EGAS did not provide growth factors. In these cases, Pechan used underlying EGAS 5.0 information (i.e., the EGAS Version 5.0 SCC-to-growth indicator crosswalk and economic output data from version 5.5 of the Regional Economic Models, Inc. [REMI] model) to develop growth factors. 15 Pechan removed throughput data when 2002 nonpoint source NEI data were carried forward,
Appendix A - 183 Kentucky Regional Haze 5-Year Periodic Report SIP Revision, September 2014

January 2012
Final Report
36
Table II-13. Summary of Data Carried Forward/Grown From 2002 NEI
Source Classifi- cation Code Source Classification Code Description Alabama Florida Georgia1
Kentucky-Rest of State Mississippi
South Carolina
Tennessee-Rest of State Virginia
West Virginia
2275085000 Aircraft/Unpaved Airstrips/Total EGAS EGAS
2275900000 Aircraft/Refueling: All Fuels/All Processes ** (Use 25-01-080-xxx) EGAS
2301030000 Chemical Manufacturing/Process Emissions from Pharmaceutical Manuf/Total Carry EGAS EGAS Carry Carry Carry
2301040000 Chemical Manufacturing/Fugitive Emissions from Synthetic Organic Chem Manuf/Total Carry EGAS Carry Carry
2302050000 Food & Kindred Products/Bakery Products/Total EGAS EGAS EGAS Carry EGAS Carry
2302070005 Food & Kindred Products/Fermentation/Beverages/Wineries EGAS
2302070010 Food & Kindred Products/Fermentation/Beverages/Distilleries EGAS
2305070000 Mineral Processes/Concrete, Gypsum, Plaster Products/Total Carry
2306000000 Petroleum Refining/All Processes/Total EGAS Carry
2306010000 Petroleum Refining/Asphalt Paving/Roofing Materials/Total Carry
2307060000 Wood Products/Misc Wood Products/Total Carry
2308000000 Rubber/Plastics/All Processes/Total Carry Carry
2309000000 Fabricated Metals/All Processes/Total Carry
2309100010 Fabricated Metals/Coating, Engraving, and Allied Services/Electroplating Carry
2309100230 Fabricated Metals/Coating, Engraving, and Allied Services/Alkaline Cleaning Carry
2310000000 Oil & Gas Expl & Prod/All Processes/Total: All Processes EGAS Carry EGAS EGAS Carry Carry Carry
2325000000 Mining &Quarrying/All Processes/Total Carry EGAS EGAS EGAS EGAS Carry Carry
2399000000 Industrial Processes: NEC/Industrial Processes: NEC/Total EGAS Carry EGAS EGAS Carry Carry
2401001010 Surface Coating/Architectural Coatings/Primers, Sealers, and Undercoaters Carry
2401001050 Surface Coating/Architectural Coatings/All Other Architectural Categories Carry
2401005600 Surface Coating/Auto Refinishing/Primers Carry
2401005700 Surface Coating/Auto Refinishing/Top Coats Carry
2440000000 Misc Industrial/All Processes/Total: All Solvent Types Carry EGAS Carry
2461800000 Misc Non-industrial: Commercial/Pesticide Applic.: All Processes/Total: All Solvent Types EGAS EGAS EGAS EGAS Carry EGAS
2461850000 Misc Non-indus: Consumer/Pesticide Application: Agricultural/All Processes EGAS EGAS Carry Carry
Appendix A - 184 Kentucky Regional Haze 5-Year Periodic Report SIP Revision, September 2014
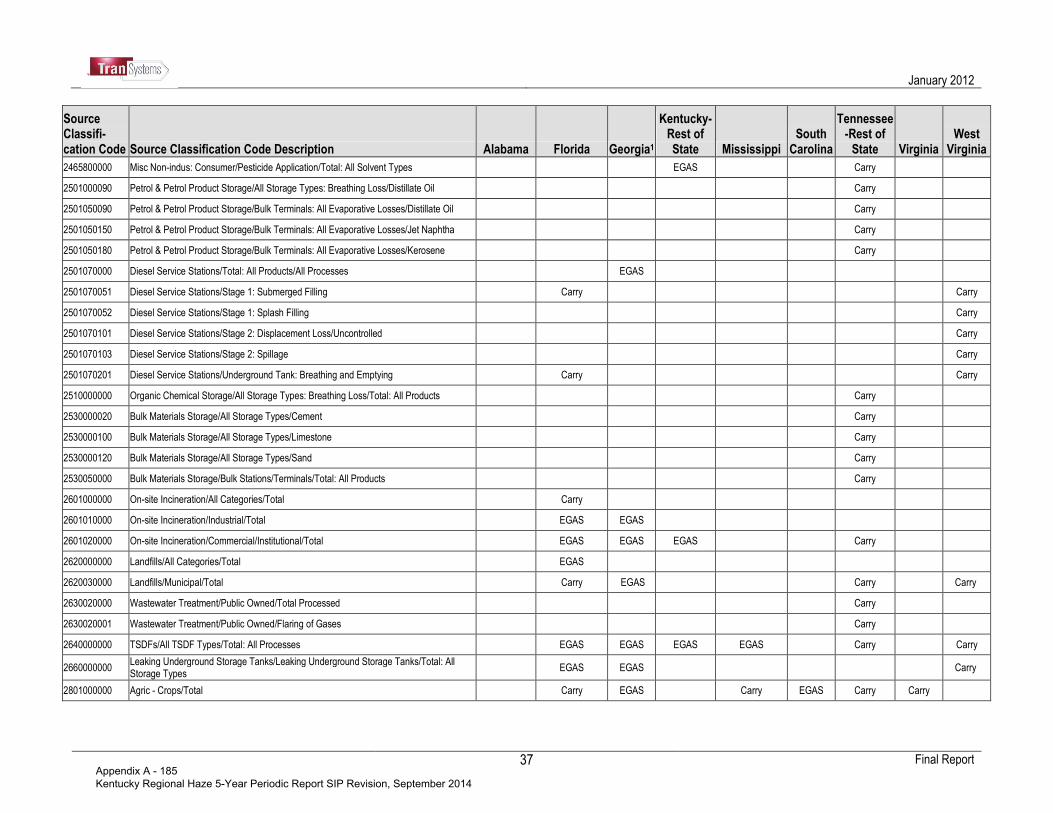
January 2012
Final Report
37
Source Classifi- cation Code Source Classification Code Description Alabama Florida Georgia1
Kentucky-Rest of State Mississippi
South Carolina
Tennessee-Rest of State Virginia
West Virginia
2465800000 Misc Non-indus: Consumer/Pesticide Application/Total: All Solvent Types EGAS Carry
2501000090 Petrol & Petrol Product Storage/All Storage Types: Breathing Loss/Distillate Oil Carry
2501050090 Petrol & Petrol Product Storage/Bulk Terminals: All Evaporative Losses/Distillate Oil Carry
2501050150 Petrol & Petrol Product Storage/Bulk Terminals: All Evaporative Losses/Jet Naphtha Carry
2501050180 Petrol & Petrol Product Storage/Bulk Terminals: All Evaporative Losses/Kerosene Carry
2501070000 Diesel Service Stations/Total: All Products/All Processes EGAS
2501070051 Diesel Service Stations/Stage 1: Submerged Filling Carry Carry
2501070052 Diesel Service Stations/Stage 1: Splash Filling Carry
2501070101 Diesel Service Stations/Stage 2: Displacement Loss/Uncontrolled Carry
2501070103 Diesel Service Stations/Stage 2: Spillage Carry
2501070201 Diesel Service Stations/Underground Tank: Breathing and Emptying Carry Carry
2510000000 Organic Chemical Storage/All Storage Types: Breathing Loss/Total: All Products Carry
2530000020 Bulk Materials Storage/All Storage Types/Cement Carry
2530000100 Bulk Materials Storage/All Storage Types/Limestone Carry
2530000120 Bulk Materials Storage/All Storage Types/Sand Carry
2530050000 Bulk Materials Storage/Bulk Stations/Terminals/Total: All Products Carry
2601000000 On-site Incineration/All Categories/Total Carry
2601010000 On-site Incineration/Industrial/Total EGAS EGAS
2601020000 On-site Incineration/Commercial/Institutional/Total EGAS EGAS EGAS Carry
2620000000 Landfills/All Categories/Total EGAS
2620030000 Landfills/Municipal/Total Carry EGAS Carry Carry
2630020000 Wastewater Treatment/Public Owned/Total Processed Carry
2630020001 Wastewater Treatment/Public Owned/Flaring of Gases Carry
2640000000 TSDFs/All TSDF Types/Total: All Processes EGAS EGAS EGAS EGAS Carry Carry
2660000000 Leaking Underground Storage Tanks/Leaking Underground Storage Tanks/Total: All Storage Types
EGAS EGAS Carry
2801000000 Agric - Crops/Total Carry EGAS Carry EGAS Carry Carry
Appendix A - 185 Kentucky Regional Haze 5-Year Periodic Report SIP Revision, September 2014
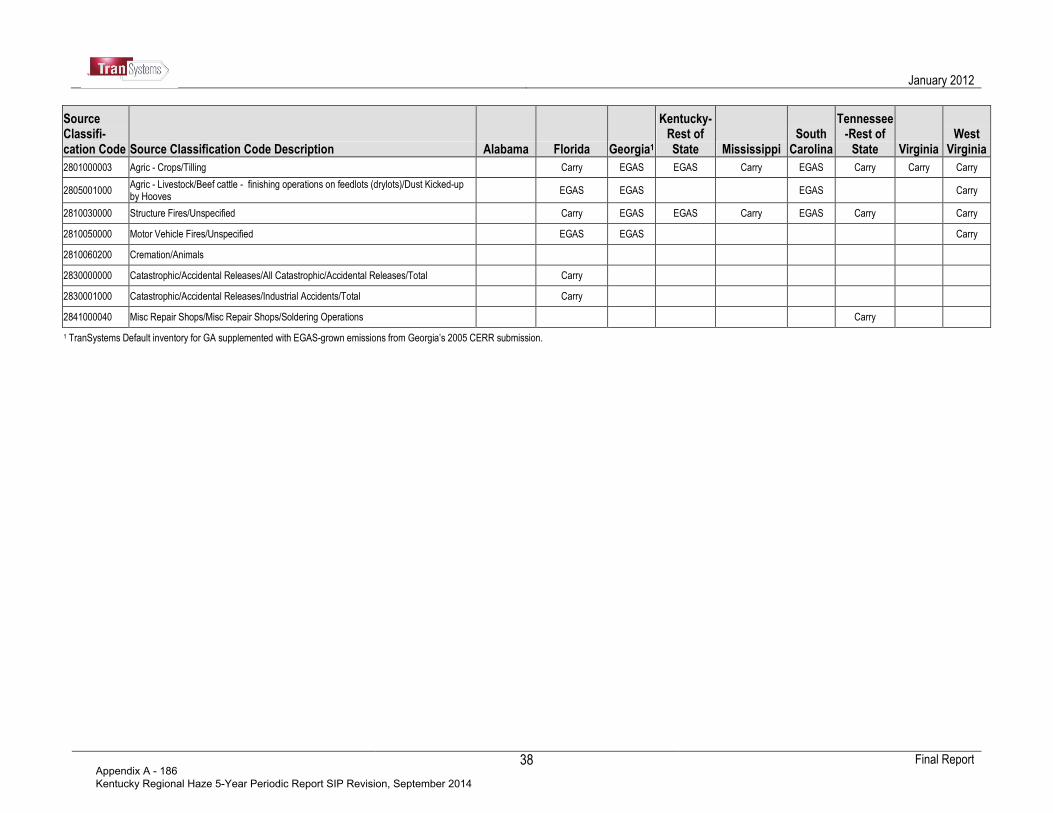
January 2012
Final Report
38
Source Classifi- cation Code Source Classification Code Description Alabama Florida Georgia1
Kentucky-Rest of State Mississippi
South Carolina
Tennessee-Rest of State Virginia
West Virginia
2801000003 Agric - Crops/Tilling Carry EGAS EGAS Carry EGAS Carry Carry Carry
2805001000 Agric - Livestock/Beef cattle - finishing operations on feedlots (drylots)/Dust Kicked-up by Hooves
EGAS EGAS EGAS Carry
2810030000 Structure Fires/Unspecified Carry EGAS EGAS Carry EGAS Carry Carry
2810050000 Motor Vehicle Fires/Unspecified EGAS EGAS Carry
2810060200 Cremation/Animals
2830000000 Catastrophic/Accidental Releases/All Catastrophic/Accidental Releases/Total Carry
2830001000 Catastrophic/Accidental Releases/Industrial Accidents/Total Carry
2841000040 Misc Repair Shops/Misc Repair Shops/Soldering Operations Carry
1 TranSystems Default inventory for GA supplemented with EGAS-grown emissions from Georgia’s 2005 CERR submission.
Appendix A - 186 Kentucky Regional Haze 5-Year Periodic Report SIP Revision, September 2014
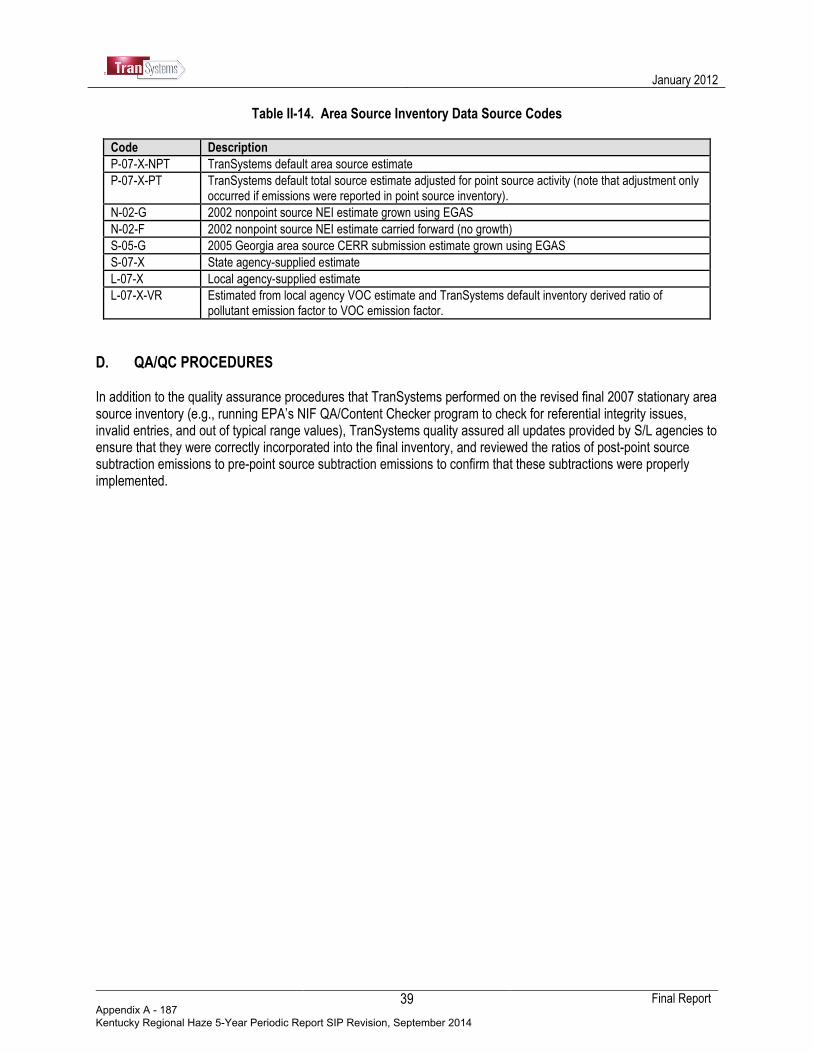
January 2012
Final Report
39
Table II-14. Area Source Inventory Data Source Codes
Code Description
P-07-X-NPT TranSystems default area source estimate
P-07-X-PT TranSystems default total source estimate adjusted for point source activity (note that adjustment only occurred if emissions were reported in point source inventory).
N-02-G 2002 nonpoint source NEI estimate grown using EGAS
N-02-F 2002 nonpoint source NEI estimate carried forward (no growth)
S-05-G 2005 Georgia area source CERR submission estimate grown using EGAS
S-07-X State agency-supplied estimate
L-07-X Local agency-supplied estimate
L-07-X-VR Estimated from local agency VOC estimate and TranSystems default inventory derived ratio of pollutant emission factor to VOC emission factor.
D. QA/QC PROCEDURES In addition to the quality assurance procedures that TranSystems performed on the revised final 2007 stationary area source inventory (e.g., running EPA’s NIF QA/Content Checker program to check for referential integrity issues, invalid entries, and out of typical range values), TranSystems quality assured all updates provided by S/L agencies to ensure that they were correctly incorporated into the final inventory, and reviewed the ratios of post-point source subtraction emissions to pre-point source subtraction emissions to confirm that these subtractions were properly implemented.
Appendix A - 187 Kentucky Regional Haze 5-Year Periodic Report SIP Revision, September 2014
January 2012
Final Report
40
III. 2007 NONROAD MOBILE SOURCE INVENTORY The nonroad sector is comprised of nonroad engines included in EPA’s NONROAD model, as well as other engines not modeled in NONROAD, including aircraft, commercial marine vessels and locomotives. A 2007 nonroad sector inventory was developed using the following general procedures:
• NONROAD model categories were based on the National Mobile Inventory Model (NMIM2008). SESARM agencies were asked to review the latest 2007 NMIM County Database and provide revisions as needed to the NMIM inputs.
• The aircraft category was based on EPA’s 2008 NEI. The 2008 estimates were backcast to 2007, and any state comments were incorporated.
• The commercial marine vessel category was based on EPA’s 2008 NEI, adjusted to 2007, and supplemented with any state emissions data.
• The locomotive category was based on draft Class I and Class II/III line haul emissions, as well as draft railyard emissions developed by ERTAC. Passenger and commuter rail emissions were based on EPA’s 2002 NEI. State emission estimates were also included.
A more detailed description of how 2007 emissions estimates for all nonroad categories were prepared is provided below.
A. NONROAD MODEL CATEGORIES NONROAD model categories include equipment such as recreational marine and land-based vehicles, farm, construction and industrial machinery, and lawn and garden equipment. These equipment are powered by compression-ignition engines, which are typically diesel-fueled, as well as spark-ignition or gasoline-fueled engines. Compressed natural gas (CNG) and LPG engines are also included in the NONROAD model. Criteria pollutant emissions may not be reported for all SCCs for all counties in the SESARM region, and will depend on the geographic allocation methods used by the model, or state-specific allocation data. NMIM2008 incorporates EPA’s latest NONROAD model (NONROAD2008) released in April 2009, and reflects all of EPA’s final nonroad standards to date. TranSystems first distributed the 2007 year NMIM county-level database (NCD) to SESARM agencies for review and comment. TranSystems prepared a report to accompany nonroad-related tables from the 2007 NCD providing instructions for agencies to provide any updates to these files that may represent S/L/T improvements to the NMIM/NONROAD defaults (Pechan, 2009c). A summary of the tables distributed and comments received from states is provided in Table III-1.
Appendix A - 188 Kentucky Regional Haze 5-Year Periodic Report SIP Revision, September 2014

January 2012
Final Report
41
Table III-1. Summary of 2007 NCD Tables and State Comments
NMIM Table Description Comments State(s)
County County-specific variables Revised OzoneSeasonStartMonth and OzoneSeasonEndMonth
AL, SC, VA
Update Barometric Pressure Jefferson County KY, VA
CountyYearMonthHour Hourly temps and relative humidity by month and county
Revised temperatures and relative humidity using NCDC data and EPA-prescribed methodology
VA
CountyNRFile External NONROAD data files Provided updates to SEASON.DAT file NC Revised Underground Mining Cty Allocation File WV
CountyYear Additional external data files (mostly onroad related)
None
CountyYearMonth Maps counties to monthly fuel data Revised county/monthly gasoline profile assignments GA, KY, Jefferson County KY, NC, SC, Davidson County TN, VA
Gasoline Gasoline fuel properties Revised/added gasoline fuel profiles GA, KY, Jefferson County KY, NC, SC, Davidson Cty TN, VA
Diesel Diesel sulfur content Revised Diesel sulfur content Davidson County, TN
Natural Gas Natural gas content None
Further descriptions of the state data provided and how they were evaluated and used is provided below. CountyYearMonthHour Table Virginia provided revised temperatures and relative humidity using National Climatic Data Center (NCDC) data and the EPA-prescribed methodology for stretching hourly averages to capture daily minima and maxima values. CountyNR Table North Carolina provided an updated SEASON.DAT file (37000.sea) that changed the seasonal profile assignment for North Carolina from the default Mid-Atlantic region to the Southeast region. West Virginia provided an updated county allocation file for distributing activity and emissions related to underground mining equipment in their state. This revised county distribution was based on 2007 Underground Coal Production values as reported by the West Virginia’s Office of Miners' Health Safety and Training 2007 Coal Production by County. CountyYearMonth, Gasoline, and Diesel Tables Several states provided revised fuel profile assignments by county, as reflected in changes to the CountyYearMonth table. In many cases, this also involved the creation of new gasoline profiles in the Gasoline table. The revisions submitted primarily related to changes by month for Reid Vapor Pressure (RVP) values as well as gasoline sulfur content. Updates to the oxygenated fuel data were provided for some states as well. Some states also revised the diesel fuel sulfur content values for 2007. For regional consistency, unless the values were based on actual testing that reflected the diesel sulfur content in use for an area, the NMIM default values of 1218 parts per million (ppm) for land-based equipment 1389 ppm for recreational marine were retained. Once the inputs to NMIM/NONROAD were quality assured, TranSystems ran NMIM to generate 2007 annual emission estimates for all SESARM states for all nonroad SCCs. Emissions from aircraft ground support equipment are now entirely addressed by the aircraft sector inventory (see discussion under Section III.B of this report).
Appendix A - 189 Kentucky Regional Haze 5-Year Periodic Report SIP Revision, September 2014
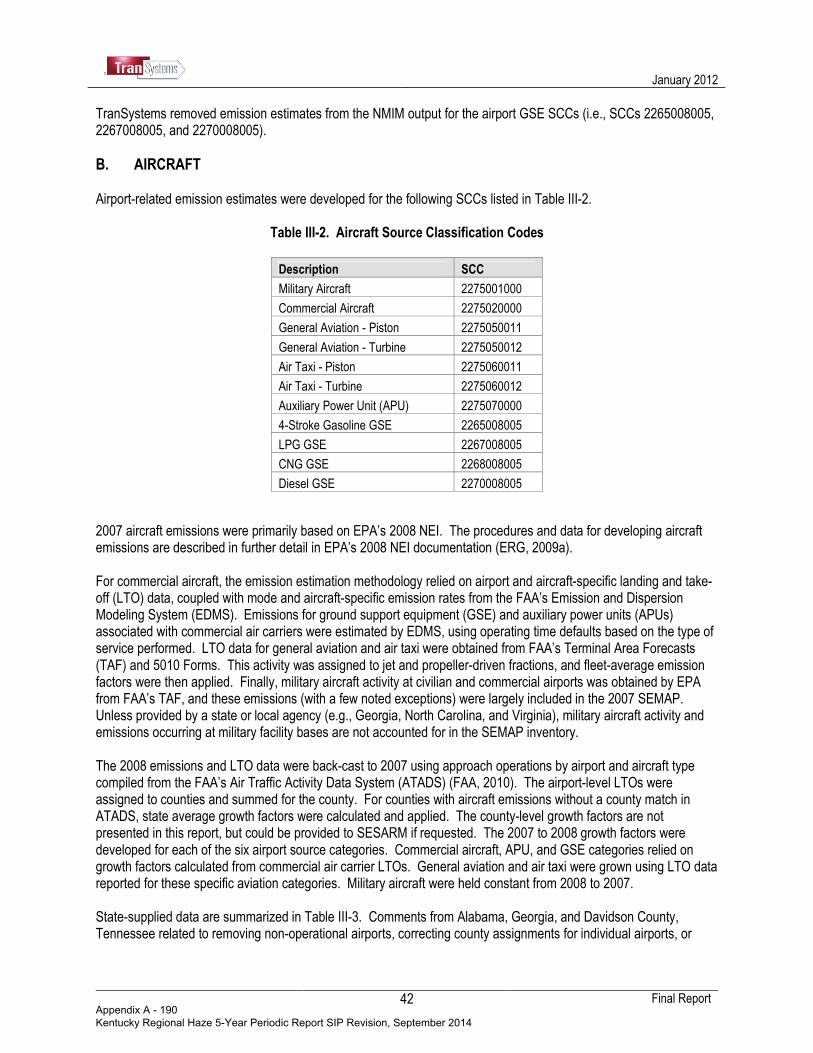
January 2012
Final Report
42
TranSystems removed emission estimates from the NMIM output for the airport GSE SCCs (i.e., SCCs 2265008005, 2267008005, and 2270008005).
B. AIRCRAFT Airport-related emission estimates were developed for the following SCCs listed in Table III-2.
Table III-2. Aircraft Source Classification Codes
Description SCC
Military Aircraft 2275001000
Commercial Aircraft 2275020000
General Aviation - Piston 2275050011
General Aviation - Turbine 2275050012
Air Taxi - Piston 2275060011
Air Taxi - Turbine 2275060012
Auxiliary Power Unit (APU) 2275070000
4-Stroke Gasoline GSE 2265008005
LPG GSE 2267008005
CNG GSE 2268008005
Diesel GSE 2270008005
2007 aircraft emissions were primarily based on EPA’s 2008 NEI. The procedures and data for developing aircraft emissions are described in further detail in EPA’s 2008 NEI documentation (ERG, 2009a). For commercial aircraft, the emission estimation methodology relied on airport and aircraft-specific landing and take-off (LTO) data, coupled with mode and aircraft-specific emission rates from the FAA’s Emission and Dispersion Modeling System (EDMS). Emissions for ground support equipment (GSE) and auxiliary power units (APUs) associated with commercial air carriers were estimated by EDMS, using operating time defaults based on the type of service performed. LTO data for general aviation and air taxi were obtained from FAA’s Terminal Area Forecasts (TAF) and 5010 Forms. This activity was assigned to jet and propeller-driven fractions, and fleet-average emission factors were then applied. Finally, military aircraft activity at civilian and commercial airports was obtained by EPA from FAA’s TAF, and these emissions (with a few noted exceptions) were largely included in the 2007 SEMAP. Unless provided by a state or local agency (e.g., Georgia, North Carolina, and Virginia), military aircraft activity and emissions occurring at military facility bases are not accounted for in the SEMAP inventory. The 2008 emissions and LTO data were back-cast to 2007 using approach operations by airport and aircraft type compiled from the FAA’s Air Traffic Activity Data System (ATADS) (FAA, 2010). The airport-level LTOs were assigned to counties and summed for the county. For counties with aircraft emissions without a county match in ATADS, state average growth factors were calculated and applied. The county-level growth factors are not presented in this report, but could be provided to SESARM if requested. The 2007 to 2008 growth factors were developed for each of the six airport source categories. Commercial aircraft, APU, and GSE categories relied on growth factors calculated from commercial air carrier LTOs. General aviation and air taxi were grown using LTO data reported for these specific aviation categories. Military aircraft were held constant from 2008 to 2007. State-supplied data are summarized in Table III-3. Comments from Alabama, Georgia, and Davidson County, Tennessee related to removing non-operational airports, correcting county assignments for individual airports, or
Appendix A - 190 Kentucky Regional Haze 5-Year Periodic Report SIP Revision, September 2014

January 2012
Final Report
43
updating emissions for specific commercial airports. Georgia, North Carolina, and Virginia submitted military aircraft emissions for military bases in their state. In addition, North Carolina provided emissions for military aircraft activity at commercial airports, and also provided diesel GSE emissions associated with all military aircraft. Note that for several North Carolina facilities, EPA had already reported diesel GSE emissions associated with commercial aircraft activity, so state-provided diesel GSE emissions were added to these existing EPA estimates at the SCC level.
Table III-3. Summary of State Updates to Aircraft Category Emissions
State/County SCC SCC Description Pollutants Comments
Alabama 2275050011 General Aviation Piston All Removed emissions for 1 non-operational airport; 1 airport in GA incorrectly assigned to AL county
2275050012 General Aviation Turbine
Georgia 2275001000 Military Aircraft All Updated emissions for Dobbins Air Reserve Base
2275007000 Auxiliary Power Unit (APU) All Updated emissions for Dobbins Air Reserve Base
2275050011 General Aviation Piston All Made revisions to county assignments for 2 airports
2275050012 General Aviation Turbine
All SCCs See Table III-2 All Updated emissions for Atlanta Hartsfield Airport
North Carolina 2275001000 Military Aircraft All Added military aircraft emissions at military bases and civilian airports
2270008005 Diesel Airport GSE
Davidson County, TN 2275050011 General Aviation Piston All Removed emissions for 4 non-operational airports; reassigned 1 airport from Davidson to Rutherford County
2275050012 General Aviation Turbine
2275020000 Commercial Aircraft All Updated emissions for Nashville International Airport
2265008005 Gasoline Airport GSE All Updated emissions for Nashville International Airport
2270008005 Diesel Airport GSE All Updated emissions for Nashville International Airport
Virginia 2275001000 Military Aircraft All but PM-10, PM-2.5, SO2
Added military aircraft emissions for 15 military bases
North Carolina and Georgia provided estimates for all needed pollutants, and Virginia provided estimates for all pollutants, with some exceptions for PM-10 and PM-2.5. Where PM-10 was provided by Virginia for two facilities, we estimated PM-2.5 using a particle size multiplier of 0.669, from Table “Military Aircraft Emission Factors” in Appendix A to EPA 2008 NEI documentation (ERG, 2009a). PM and SO2 emissions for the remaining military facilities in Virginia were not estimated.
C. COMMERCIAL MARINE VESSELS Commercial marine vessel emissions are reported under the following SCCs:
• 2280002100 – Diesel, In Port
• 2280002200 – Diesel, Underway
• 2280003100 – Residual, In Port
• 2280003200 – Residual, Underway For the purpose of the NEI it was assumed that Category 1 and 2 vessels typically use distillate fuels, while Category 3 vessels primarily use residual blends. Category 3 engines are defined as having displacement above 30 liters per cylinder.
Appendix A - 191 Kentucky Regional Haze 5-Year Periodic Report SIP Revision, September 2014
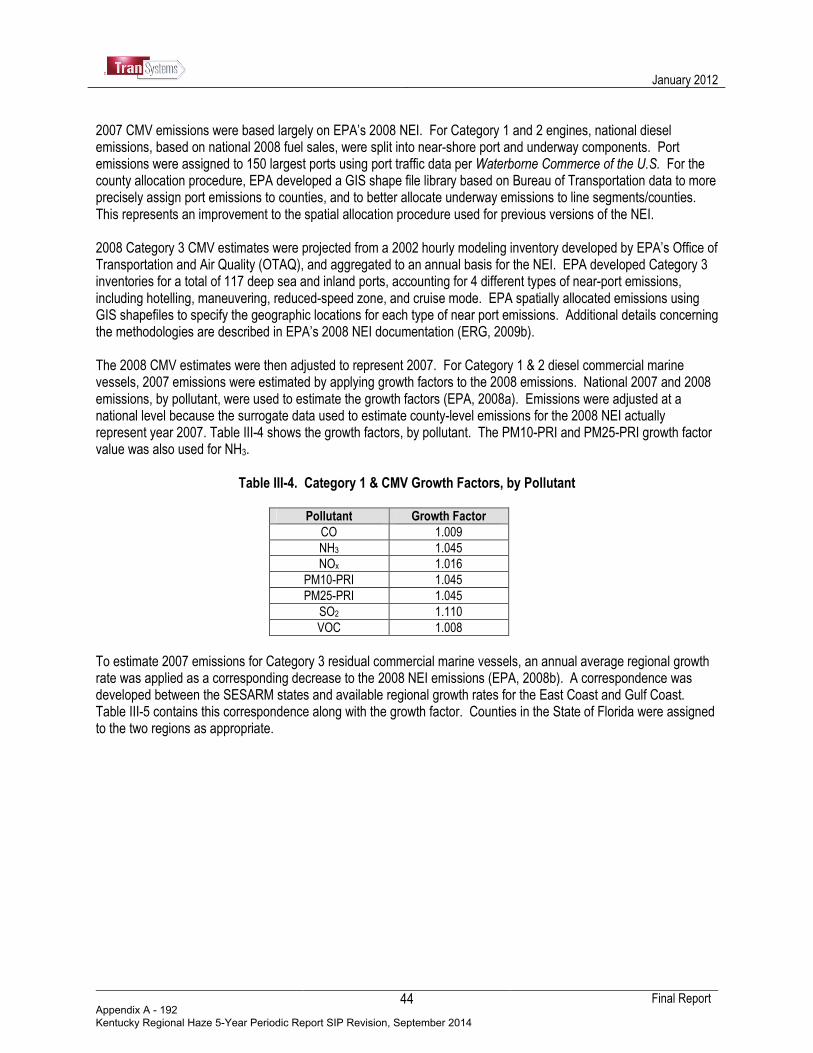
January 2012
Final Report
44
2007 CMV emissions were based largely on EPA’s 2008 NEI. For Category 1 and 2 engines, national diesel emissions, based on national 2008 fuel sales, were split into near-shore port and underway components. Port emissions were assigned to 150 largest ports using port traffic data per Waterborne Commerce of the U.S. For the county allocation procedure, EPA developed a GIS shape file library based on Bureau of Transportation data to more precisely assign port emissions to counties, and to better allocate underway emissions to line segments/counties. This represents an improvement to the spatial allocation procedure used for previous versions of the NEI. 2008 Category 3 CMV estimates were projected from a 2002 hourly modeling inventory developed by EPA’s Office of Transportation and Air Quality (OTAQ), and aggregated to an annual basis for the NEI. EPA developed Category 3 inventories for a total of 117 deep sea and inland ports, accounting for 4 different types of near-port emissions, including hotelling, maneuvering, reduced-speed zone, and cruise mode. EPA spatially allocated emissions using GIS shapefiles to specify the geographic locations for each type of near port emissions. Additional details concerning the methodologies are described in EPA’s 2008 NEI documentation (ERG, 2009b). The 2008 CMV estimates were then adjusted to represent 2007. For Category 1 & 2 diesel commercial marine vessels, 2007 emissions were estimated by applying growth factors to the 2008 emissions. National 2007 and 2008 emissions, by pollutant, were used to estimate the growth factors (EPA, 2008a). Emissions were adjusted at a national level because the surrogate data used to estimate county-level emissions for the 2008 NEI actually represent year 2007. Table III-4 shows the growth factors, by pollutant. The PM10-PRI and PM25-PRI growth factor value was also used for NH3.
Table III-4. Category 1 & CMV Growth Factors, by Pollutant
Pollutant Growth Factor
CO 1.009
NH3 1.045
NOx 1.016
PM10-PRI 1.045
PM25-PRI 1.045
SO2 1.110
VOC 1.008
To estimate 2007 emissions for Category 3 residual commercial marine vessels, an annual average regional growth rate was applied as a corresponding decrease to the 2008 NEI emissions (EPA, 2008b). A correspondence was developed between the SESARM states and available regional growth rates for the East Coast and Gulf Coast. Table III-5 contains this correspondence along with the growth factor. Counties in the State of Florida were assigned to the two regions as appropriate.
Appendix A - 192 Kentucky Regional Haze 5-Year Periodic Report SIP Revision, September 2014
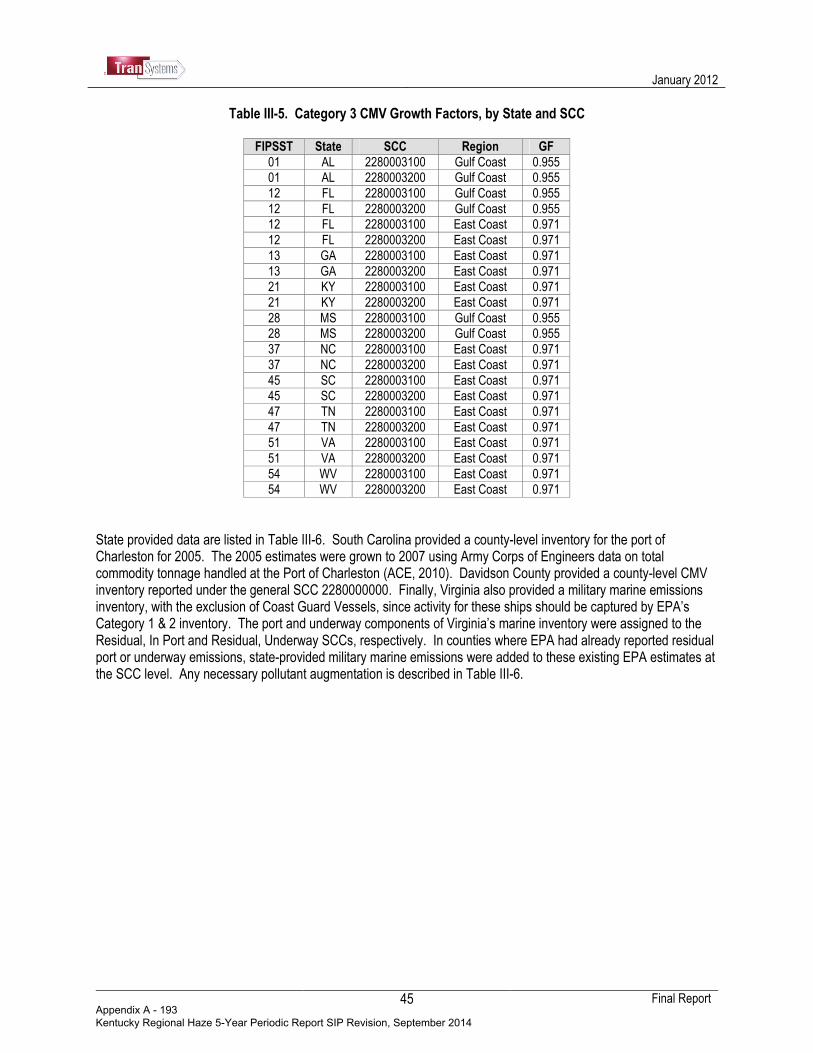
January 2012
Final Report
45
Table III-5. Category 3 CMV Growth Factors, by State and SCC
FIPSST State SCC Region GF
01 AL 2280003100 Gulf Coast 0.955 01 AL 2280003200 Gulf Coast 0.955
12 FL 2280003100 Gulf Coast 0.955
12 FL 2280003200 Gulf Coast 0.955 12 FL 2280003100 East Coast 0.971
12 FL 2280003200 East Coast 0.971
13 GA 2280003100 East Coast 0.971
13 GA 2280003200 East Coast 0.971 21 KY 2280003100 East Coast 0.971
21 KY 2280003200 East Coast 0.971
28 MS 2280003100 Gulf Coast 0.955 28 MS 2280003200 Gulf Coast 0.955
37 NC 2280003100 East Coast 0.971
37 NC 2280003200 East Coast 0.971
45 SC 2280003100 East Coast 0.971 45 SC 2280003200 East Coast 0.971
47 TN 2280003100 East Coast 0.971
47 TN 2280003200 East Coast 0.971 51 VA 2280003100 East Coast 0.971
51 VA 2280003200 East Coast 0.971
54 WV 2280003100 East Coast 0.971 54 WV 2280003200 East Coast 0.971
State provided data are listed in Table III-6. South Carolina provided a county-level inventory for the port of Charleston for 2005. The 2005 estimates were grown to 2007 using Army Corps of Engineers data on total commodity tonnage handled at the Port of Charleston (ACE, 2010). Davidson County provided a county-level CMV inventory reported under the general SCC 2280000000. Finally, Virginia also provided a military marine emissions inventory, with the exclusion of Coast Guard Vessels, since activity for these ships should be captured by EPA’s Category 1 & 2 inventory. The port and underway components of Virginia’s marine inventory were assigned to the Residual, In Port and Residual, Underway SCCs, respectively. In counties where EPA had already reported residual port or underway emissions, state-provided military marine emissions were added to these existing EPA estimates at the SCC level. Any necessary pollutant augmentation is described in Table III-6.
Appendix A - 193 Kentucky Regional Haze 5-Year Periodic Report SIP Revision, September 2014
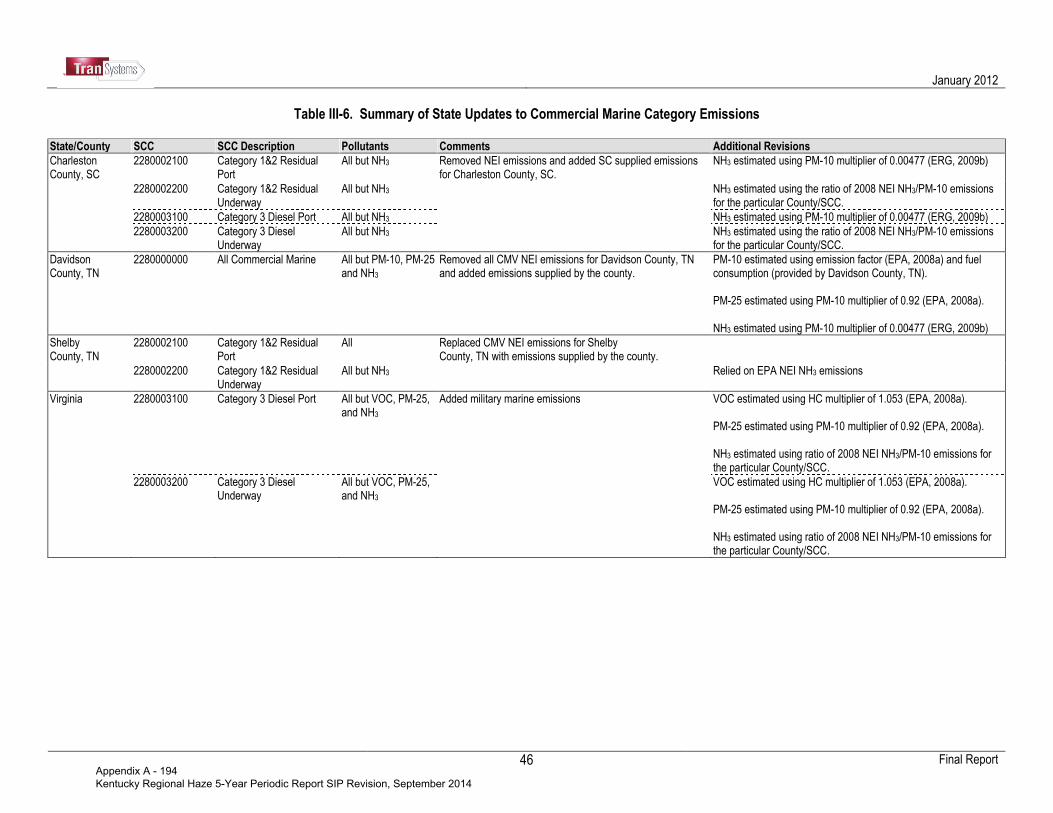
January 2012
Final Report
46
Table III-6. Summary of State Updates to Commercial Marine Category Emissions
State/County SCC SCC Description Pollutants Comments Additional Revisions
Charleston County, SC
2280002100 Category 1&2 Residual Port
All but NH3 Removed NEI emissions and added SC supplied emissions for Charleston County, SC.
NH3 estimated using PM-10 multiplier of 0.00477 (ERG, 2009b)
2280002200 Category 1&2 Residual Underway
All but NH3 NH3 estimated using the ratio of 2008 NEI NH3/PM-10 emissions for the particular County/SCC.
2280003100 Category 3 Diesel Port All but NH3 NH3 estimated using PM-10 multiplier of 0.00477 (ERG, 2009b)
2280003200 Category 3 Diesel Underway
All but NH3 NH3 estimated using the ratio of 2008 NEI NH3/PM-10 emissions for the particular County/SCC.
Davidson County, TN
2280000000 All Commercial Marine All but PM-10, PM-25 and NH3
Removed all CMV NEI emissions for Davidson County, TN and added emissions supplied by the county.
PM-10 estimated using emission factor (EPA, 2008a) and fuel consumption (provided by Davidson County, TN). PM-25 estimated using PM-10 multiplier of 0.92 (EPA, 2008a). NH3 estimated using PM-10 multiplier of 0.00477 (ERG, 2009b)
Shelby County, TN
2280002100 Category 1&2 Residual Port
All Replaced CMV NEI emissions for Shelby County, TN with emissions supplied by the county.
2280002200 Category 1&2 Residual Underway
All but NH3 Relied on EPA NEI NH3 emissions
Virginia 2280003100 Category 3 Diesel Port All but VOC, PM-25, and NH3
Added military marine emissions VOC estimated using HC multiplier of 1.053 (EPA, 2008a). PM-25 estimated using PM-10 multiplier of 0.92 (EPA, 2008a). NH3 estimated using ratio of 2008 NEI NH3/PM-10 emissions for the particular County/SCC.
2280003200 Category 3 Diesel Underway
All but VOC, PM-25, and NH3
VOC estimated using HC multiplier of 1.053 (EPA, 2008a). PM-25 estimated using PM-10 multiplier of 0.92 (EPA, 2008a). NH3 estimated using ratio of 2008 NEI NH3/PM-10 emissions for the particular County/SCC.
Appendix A - 194 Kentucky Regional Haze 5-Year Periodic Report SIP Revision, September 2014
January 2012
Final Report
47
D. LOCOMOTIVES Locomotive emissions are reported under the following SCCs:
• 2285002006 – Diesel Class I Line Haul
• 2285002007 – Diesel Class II/III Line Haul
• 2285002008 – Diesel Passenger (Amtrak)
• 2285002009 – Diesel Commuter
• 2285002010 – Diesel Switchyard Locomotives
Class I line haul operations typically account for the majority of fuel consumed and emissions when preparing locomotive inventories. As such, resources should be focused on developing emission estimates for these operations relative to other rail-related operations. However, for some local areas, certain operations related to switchyard activity may also be important. For Class I line-haul locomotives, emissions are normally calculated by multiplying the amount of fuel consumed in the inventory area by pollutant-specific emission factors. This calculation is performed for each railroad. The results for each railroad are then summed to obtain the total Class I railroad emissions in the inventory area. For Class I line haul, TranSystems obtained 2007 emission estimates from the Eastern Regional Technical Advisory Committee (ERTAC, 2010a). ERTAC used the Federal Railroad Administration’s GIS data to construct a dataset of link-level million gross tons per mile (MGT). Next the Railroad Fuel Consumption Index (RFCI) value was calculated for each railroad, which represents the number of GTM produced per gallon of diesel fuel. When applied to each link’s GTM per year, link-based fuel consumption can be calculated. This methodology allows for a more accurate reflection of how GTM are actually concentrated across rail line route miles. Finally, the fuel consumed is multiplied by the various emission factors derived for each Class I rail line to determine link-level emissions for each pollutant. An important aspect is determining the fraction of locomotives that fall under each regulatory “Tier,” since each Tier has an increasingly stringent emission rate for pollutants of concern. A limitation of the link-level MGT data maintained by the FRA is that the data are proprietary and can only be publicly released with the express permission of each Class I railroad. In addition, when the FRA coded the link-level MGT data they did not provide a means for separating out individual MGT contributions for links that are operated by multiple railroad companies. As such, some assumptions were made for these contributions by ERTAC. Class II/III line haul emissions were also developed and distributed by ERTAC (ERTAC, 2010b). Limited documentation has been developed to describe the procedures used by ERTAC to develop this inventory. Generally, fuel consumption for all Class II/III railroads was obtained from the American Shortline and Regional Railroad Association and assigned to counties using route miles by rail line within each county. An average fuel use factor expressed in gallons per mile was then multiplied by the route miles to estimate fuel consumption by railroad and by county. Class II/III locomotives were all assumed to be uncontrolled with respect to emission rates used for estimating pollutant emissions. Class II/III rail emissions represent calendar year 2008, and as such were back-cast to 2007 using a surrogate growth indicator. A SESARM regional growth factor of 1.438 was developed using 2007 and 2008 total distillate fuel sales/deliveries to railroad consumers which were obtained from the DOE Energy Information Administration State Energy Data (DOE, 2009a). Passenger and commuter rail line emissions from EPA’s 2002 NEI were grown to 2007. For both categories, the growth factor was developed using 2002 and 2007 passenger/commuter fuel use data obtained from the DOE Transportation Energy Data Book (DOE, 2009b). For passenger rail operations, the growth factor value was 0.732. For commuter rail operations, a growth factor of 1.11 was used.
Appendix A - 195 Kentucky Regional Haze 5-Year Periodic Report SIP Revision, September 2014
January 2012
Final Report
48
Finally, a switchyard inventory was completed by ERTAC on June 4, 2010 (ERTAC, 2010c). This inventory was compiled at a railyard level by ERTAC, but was summed to a county level for use in the SEMAP 2007 inventory. In general, switcher emissions were estimated using total switcher fuel consumption available from each Class I R-1 report allocated to railyards based on average density code data reported by the Federal Railroad Administration. Documentation describing the specific methodology and data sources used will be forthcoming from ERTAC. Some state data were provided for the locomotive category. These data are summarized in Table III-7. North Carolina provided a statewide passenger rail inventory for 2007. Davidson County provided a county level inventory comprised of Class I line haul and switchyard activity, reported under the general SCC 2285000000. Shelby County provided an updated Class I line haul, passenger, and yard locomotive inventory for most pollutants. Any needed pollutant augmentation is described in Table III-7.
E. QA/QC PROCEDURES TranSystems performed the following quality assurance procedures on the final 2007 nonroad sector inventory. For the NONROAD/NMIM categories, TranSystems quality assured all NCD updates provided by states to ensure consistency with the NCD formats, and for reasonableness. Where questions came up, we coordinated with the appropriate S/L agency. Cross-checks were performed to confirm that state-supplied revisions were correctly incorporated into the NCD. TranSystems compared results with 2007 emission estimates prepared by EPA using a prior version of the NCD. These comparisons were performed to ensure that results changed as expected given the updates made by specific states to the NMIM inputs.
Appendix A - 196 Kentucky Regional Haze 5-Year Periodic Report SIP Revision, September 2014
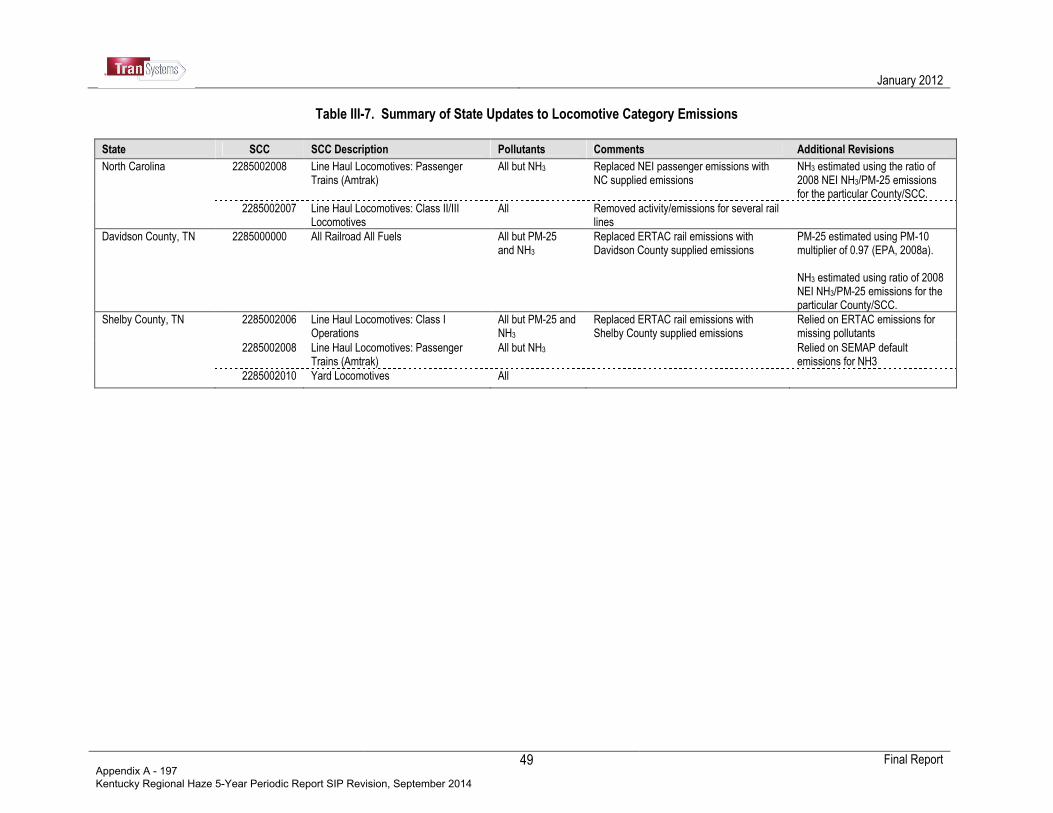
January 2012
Final Report
49
Table III-7. Summary of State Updates to Locomotive Category Emissions
State SCC SCC Description Pollutants Comments Additional Revisions
North Carolina 2285002008 Line Haul Locomotives: Passenger Trains (Amtrak)
All but NH3 Replaced NEI passenger emissions with NC supplied emissions
NH3 estimated using the ratio of 2008 NEI NH3/PM-25 emissions for the particular County/SCC.
2285002007 Line Haul Locomotives: Class II/III Locomotives
All Removed activity/emissions for several rail lines
Davidson County, TN 2285000000 All Railroad All Fuels All but PM-25 and NH3
Replaced ERTAC rail emissions with Davidson County supplied emissions
PM-25 estimated using PM-10 multiplier of 0.97 (EPA, 2008a). NH3 estimated using ratio of 2008 NEI NH3/PM-25 emissions for the particular County/SCC.
Shelby County, TN 2285002006 Line Haul Locomotives: Class I Operations
All but PM-25 and NH3
Replaced ERTAC rail emissions with Shelby County supplied emissions
Relied on ERTAC emissions for missing pollutants
2285002008 Line Haul Locomotives: Passenger Trains (Amtrak)
All but NH3 Relied on SEMAP default emissions for NH3
2285002010 Yard Locomotives All
Appendix A - 197 Kentucky Regional Haze 5-Year Periodic Report SIP Revision, September 2014
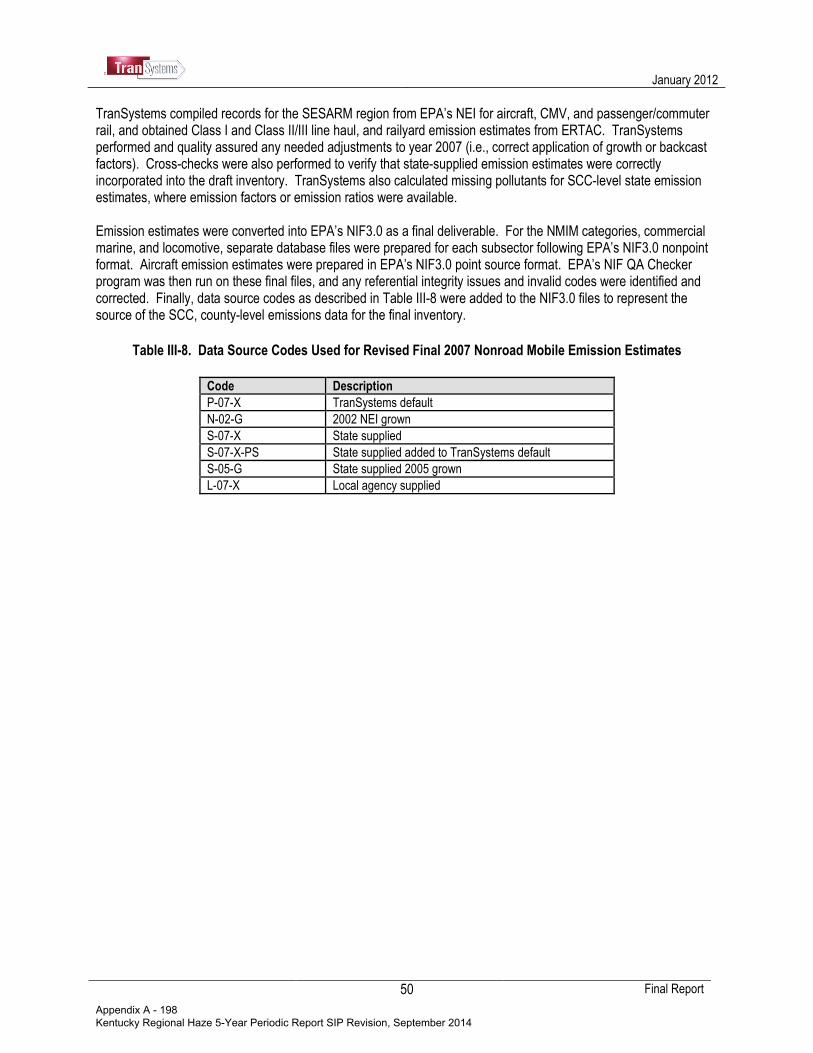
January 2012
Final Report
50
TranSystems compiled records for the SESARM region from EPA’s NEI for aircraft, CMV, and passenger/commuter rail, and obtained Class I and Class II/III line haul, and railyard emission estimates from ERTAC. TranSystems performed and quality assured any needed adjustments to year 2007 (i.e., correct application of growth or backcast factors). Cross-checks were also performed to verify that state-supplied emission estimates were correctly incorporated into the draft inventory. TranSystems also calculated missing pollutants for SCC-level state emission estimates, where emission factors or emission ratios were available. Emission estimates were converted into EPA’s NIF3.0 as a final deliverable. For the NMIM categories, commercial marine, and locomotive, separate database files were prepared for each subsector following EPA’s NIF3.0 nonpoint format. Aircraft emission estimates were prepared in EPA’s NIF3.0 point source format. EPA’s NIF QA Checker program was then run on these final files, and any referential integrity issues and invalid codes were identified and corrected. Finally, data source codes as described in Table III-8 were added to the NIF3.0 files to represent the source of the SCC, county-level emissions data for the final inventory.
Table III-8. Data Source Codes Used for Revised Final 2007 Nonroad Mobile Emission Estimates
Code Description
P-07-X TranSystems default
N-02-G 2002 NEI grown
S-07-X State supplied
S-07-X-PS State supplied added to TranSystems default
S-05-G State supplied 2005 grown
L-07-X Local agency supplied
Appendix A - 198 Kentucky Regional Haze 5-Year Periodic Report SIP Revision, September 2014
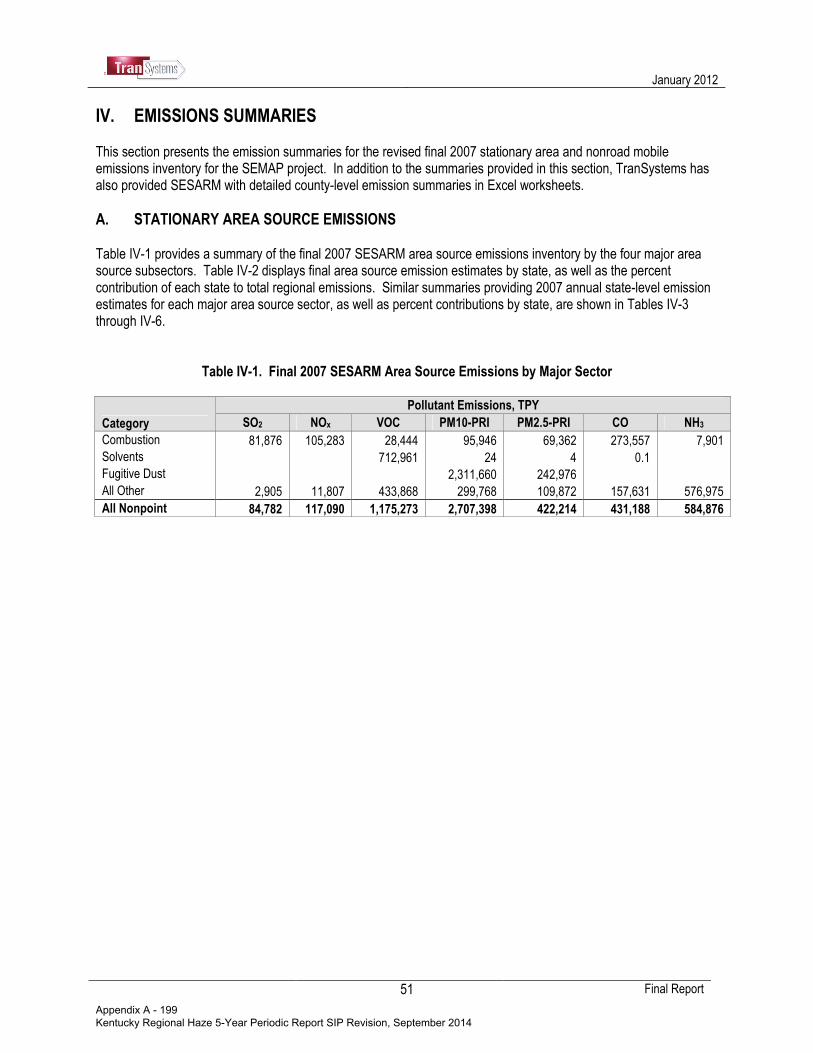
January 2012
Final Report
51
IV. EMISSIONS SUMMARIES This section presents the emission summaries for the revised final 2007 stationary area and nonroad mobile emissions inventory for the SEMAP project. In addition to the summaries provided in this section, TranSystems has also provided SESARM with detailed county-level emission summaries in Excel worksheets.
A. STATIONARY AREA SOURCE EMISSIONS Table IV-1 provides a summary of the final 2007 SESARM area source emissions inventory by the four major area source subsectors. Table IV-2 displays final area source emission estimates by state, as well as the percent contribution of each state to total regional emissions. Similar summaries providing 2007 annual state-level emission estimates for each major area source sector, as well as percent contributions by state, are shown in Tables IV-3 through IV-6.
Table IV-1. Final 2007 SESARM Area Source Emissions by Major Sector
Category
Pollutant Emissions, TPY
SO2 NOx VOC PM10-PRI PM2.5-PRI CO NH3
Combustion 81,876 105,283 28,444 95,946 69,362 273,557 7,901
Solvents 712,961 24 4 0.1
Fugitive Dust 2,311,660 242,976
All Other 2,905 11,807 433,868 299,768 109,872 157,631 576,975
All Nonpoint 84,782 117,090 1,175,273 2,707,398 422,214 431,188 584,876
Appendix A - 199 Kentucky Regional Haze 5-Year Periodic Report SIP Revision, September 2014

January 2012
Final Report
52
Table IV-2. Final 2007 Area Source Emission Estimates by State
State
Pollutant Emissions, TPY
SO2 NOx VOC PM10-PRI PM2.5-PRI CO NH3
Alabama 431 3,940 79,030 349,981 41,587 15,152 62,426
Florida 11,203 13,014 296,131 340,693 55,515 43,381 33,940
Georgia 4,858 25,552 143,469 652,757 95,801 83,246 86,544
Kentucky 15,590 12,693 75,100 226,829 40,341 55,450 52,332
Mississippi 344 6,091 74,755 326,350 42,758 22,377 58,774
North Carolina 8,365 12,715 152,825 51,678 16,829 47,379 169,440
South Carolina 6,048 9,353 76,838 266,749 39,538 32,208 30,248
Tennessee 14,415 12,418 111,100 215,667 33,948 44,668 35,277
Virginia 17,022 17,740 133,935 176,265 39,034 63,838 43,038
West Virginia 6,504 3,574 32,089 100,429 16,862 23,490 12,858
Total SESARM 84,782 117,090 1,175,273 2,707,398 422,214 431,188 584,876
State
Percentage of Regional Total
SO2 NOx VOC PM10-PRI PM2.5-PRI CO NH3
Alabama 0.5 3.4 6.7 12.9 9.8 3.5 10.7
Florida 13.2 11.1 25.2 12.6 13.1 10.1 5.8
Georgia 5.7 21.8 12.2 24.1 22.7 19.3 14.8
Kentucky 18.4 10.8 6.4 8.4 9.6 12.9 8.9
Mississippi 0.4 5.2 6.4 12.1 10.1 5.2 10.0
North Carolina 9.9 10.9 13.0 1.9 4.0 11.0 29.0
South Carolina 7.1 8.0 6.5 9.9 9.4 7.5 5.2
Tennessee 17.0 10.6 9.5 8.0 8.0 10.4 6.0
Virginia 20.1 15.2 11.4 6.5 9.2 14.8 7.4
West Virginia 7.7 3.1 2.7 3.7 4.0 5.4 2.2
Total SESARM 100 100 100 100 100 100 100
Appendix A - 200 Kentucky Regional Haze 5-Year Periodic Report SIP Revision, September 2014

January 2012
Final Report
53
Table IV-3. Final 2007 Combustion Emission Estimates by State
State
Pollutant Emissions, TPY
SO2 NOx VOC PM10-PRI PM2.5-PRI CO NH3
Alabama 376 3,490 1,903 1,400 1,391 11,257 449
Florida 11,032 12,163 2,421 27,419 19,713 29,097 585
Georgia 4,528 23,648 2,751 14,118 14,092 59,474 1,851
Kentucky 15,250 11,287 3,892 13,006 8,573 31,102 670
Mississippi 206 5,274 1,238 1,074 1,043 9,933 307
North Carolina 8,090 11,534 4,313 4,795 4,394 29,963 910
South Carolina 5,900 8,480 1,743 10,510 7,926 18,699 427
Tennessee 14,058 10,853 2,929 12,756 2,521 25,816 833
Virginia 16,061 15,569 5,270 8,142 7,358 43,205 1,443
West Virginia 6,376 2,985 1,984 2,728 2,354 15,012 424
Total SESARM 81,876 105,283 28,444 95,946 69,362 273,557 7,901
State
Percentage of Regional Total
SO2 NOx VOC PM10-PRI PM2.5-PRI CO NH3
Alabama 0.5 3.3 6.7 1.5 2.0 4.1 5.7
Florida 13.5 11.6 8.5 28.6 28.4 10.6 7.4
Georgia 5.5 22.5 9.7 14.7 20.3 21.7 23.4
Kentucky 18.6 10.7 13.7 13.6 12.4 11.4 8.5
Mississippi 0.3 5.0 4.4 1.1 1.5 3.6 3.9
North Carolina 9.9 11.0 15.2 5.0 6.3 11.0 11.5
South Carolina 7.2 8.1 6.1 11.0 11.4 6.8 5.4
Tennessee 17.2 10.3 10.3 13.3 3.6 9.4 10.5
Virginia 19.6 14.8 18.5 8.5 10.6 15.8 18.3
West Virginia 7.8 2.8 7.0 2.8 3.4 5.5 5.4
Total SESARM 100 100 100 100 100 100 100
Appendix A - 201 Kentucky Regional Haze 5-Year Periodic Report SIP Revision, September 2014
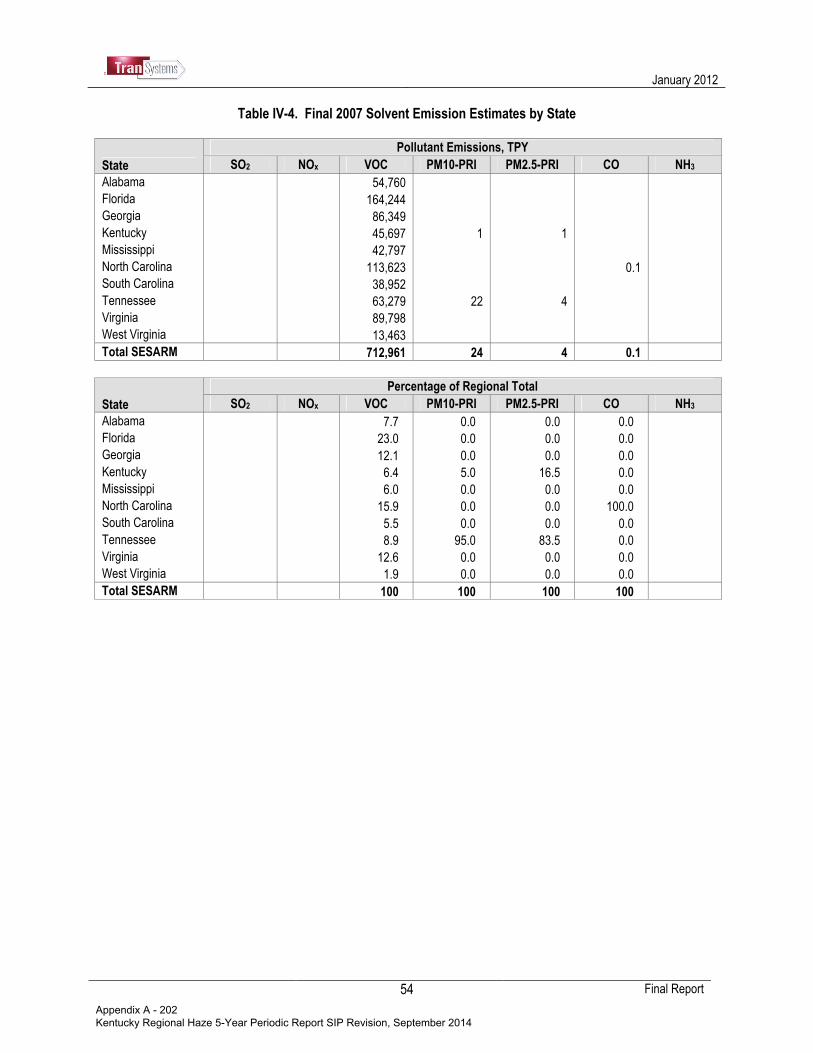
January 2012
Final Report
54
Table IV-4. Final 2007 Solvent Emission Estimates by State
State
Pollutant Emissions, TPY
SO2 NOx VOC PM10-PRI PM2.5-PRI CO NH3
Alabama 54,760
Florida 164,244
Georgia 86,349
Kentucky 45,697 1 1
Mississippi 42,797
North Carolina 113,623 0.1
South Carolina 38,952
Tennessee 63,279 22 4
Virginia 89,798
West Virginia 13,463
Total SESARM 712,961 24 4 0.1
State
Percentage of Regional Total
SO2 NOx VOC PM10-PRI PM2.5-PRI CO NH3
Alabama 7.7 0.0 0.0 0.0
Florida 23.0 0.0 0.0 0.0
Georgia 12.1 0.0 0.0 0.0
Kentucky 6.4 5.0 16.5 0.0
Mississippi 6.0 0.0 0.0 0.0
North Carolina 15.9 0.0 0.0 100.0
South Carolina 5.5 0.0 0.0 0.0
Tennessee 8.9 95.0 83.5 0.0
Virginia 12.6 0.0 0.0 0.0
West Virginia 1.9 0.0 0.0 0.0
Total SESARM 100 100 100 100
Appendix A - 202 Kentucky Regional Haze 5-Year Periodic Report SIP Revision, September 2014
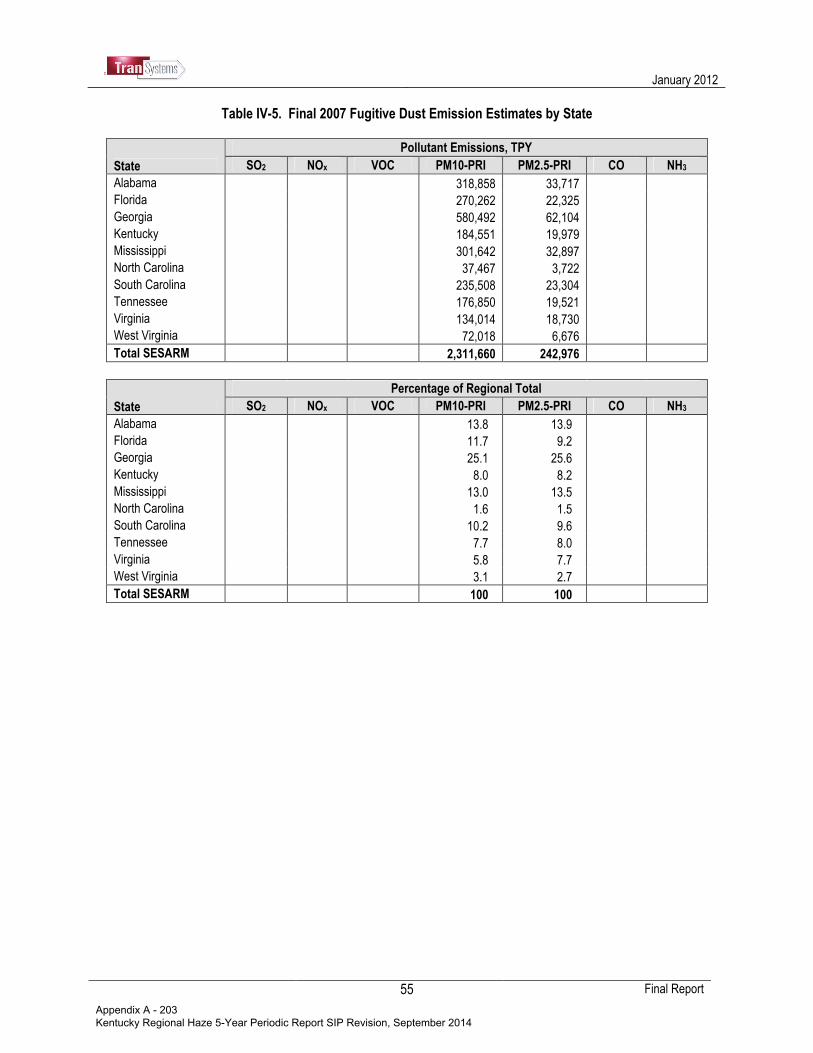
January 2012
Final Report
55
Table IV-5. Final 2007 Fugitive Dust Emission Estimates by State
State
Pollutant Emissions, TPY
SO2 NOx VOC PM10-PRI PM2.5-PRI CO NH3
Alabama 318,858 33,717
Florida 270,262 22,325
Georgia 580,492 62,104
Kentucky 184,551 19,979
Mississippi 301,642 32,897
North Carolina 37,467 3,722
South Carolina 235,508 23,304
Tennessee 176,850 19,521
Virginia 134,014 18,730
West Virginia 72,018 6,676
Total SESARM 2,311,660 242,976
State
Percentage of Regional Total
SO2 NOx VOC PM10-PRI PM2.5-PRI CO NH3
Alabama 13.8 13.9
Florida 11.7 9.2
Georgia 25.1 25.6
Kentucky 8.0 8.2
Mississippi 13.0 13.5
North Carolina 1.6 1.5
South Carolina 10.2 9.6
Tennessee 7.7 8.0
Virginia 5.8 7.7
West Virginia 3.1 2.7
Total SESARM 100 100
Appendix A - 203 Kentucky Regional Haze 5-Year Periodic Report SIP Revision, September 2014
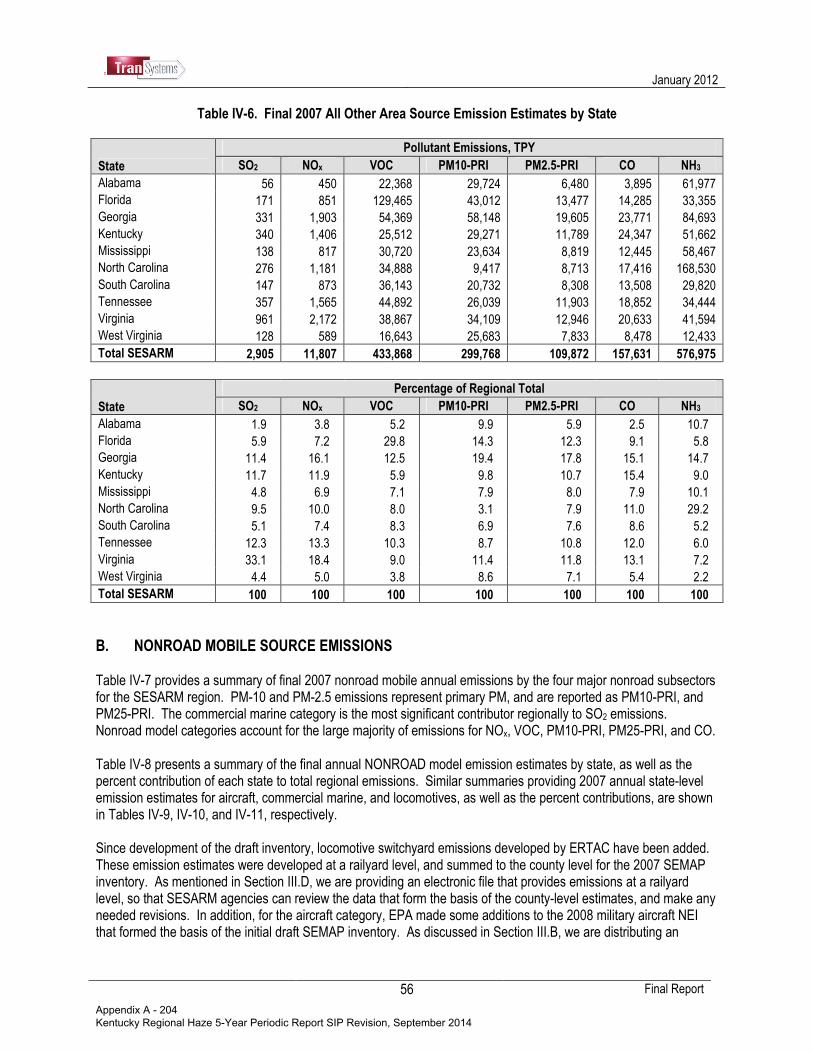
January 2012
Final Report
56
Table IV-6. Final 2007 All Other Area Source Emission Estimates by State
State
Pollutant Emissions, TPY
SO2 NOx VOC PM10-PRI PM2.5-PRI CO NH3
Alabama 56 450 22,368 29,724 6,480 3,895 61,977
Florida 171 851 129,465 43,012 13,477 14,285 33,355
Georgia 331 1,903 54,369 58,148 19,605 23,771 84,693
Kentucky 340 1,406 25,512 29,271 11,789 24,347 51,662
Mississippi 138 817 30,720 23,634 8,819 12,445 58,467
North Carolina 276 1,181 34,888 9,417 8,713 17,416 168,530
South Carolina 147 873 36,143 20,732 8,308 13,508 29,820
Tennessee 357 1,565 44,892 26,039 11,903 18,852 34,444
Virginia 961 2,172 38,867 34,109 12,946 20,633 41,594
West Virginia 128 589 16,643 25,683 7,833 8,478 12,433
Total SESARM 2,905 11,807 433,868 299,768 109,872 157,631 576,975
State
Percentage of Regional Total
SO2 NOx VOC PM10-PRI PM2.5-PRI CO NH3
Alabama 1.9 3.8 5.2 9.9 5.9 2.5 10.7
Florida 5.9 7.2 29.8 14.3 12.3 9.1 5.8
Georgia 11.4 16.1 12.5 19.4 17.8 15.1 14.7
Kentucky 11.7 11.9 5.9 9.8 10.7 15.4 9.0
Mississippi 4.8 6.9 7.1 7.9 8.0 7.9 10.1
North Carolina 9.5 10.0 8.0 3.1 7.9 11.0 29.2
South Carolina 5.1 7.4 8.3 6.9 7.6 8.6 5.2
Tennessee 12.3 13.3 10.3 8.7 10.8 12.0 6.0
Virginia 33.1 18.4 9.0 11.4 11.8 13.1 7.2
West Virginia 4.4 5.0 3.8 8.6 7.1 5.4 2.2
Total SESARM 100 100 100 100 100 100 100
B. NONROAD MOBILE SOURCE EMISSIONS Table IV-7 provides a summary of final 2007 nonroad mobile annual emissions by the four major nonroad subsectors for the SESARM region. PM-10 and PM-2.5 emissions represent primary PM, and are reported as PM10-PRI, and PM25-PRI. The commercial marine category is the most significant contributor regionally to SO2 emissions. Nonroad model categories account for the large majority of emissions for NOx, VOC, PM10-PRI, PM25-PRI, and CO. Table IV-8 presents a summary of the final annual NONROAD model emission estimates by state, as well as the percent contribution of each state to total regional emissions. Similar summaries providing 2007 annual state-level emission estimates for aircraft, commercial marine, and locomotives, as well as the percent contributions, are shown in Tables IV-9, IV-10, and IV-11, respectively. Since development of the draft inventory, locomotive switchyard emissions developed by ERTAC have been added. These emission estimates were developed at a railyard level, and summed to the county level for the 2007 SEMAP inventory. As mentioned in Section III.D, we are providing an electronic file that provides emissions at a railyard level, so that SESARM agencies can review the data that form the basis of the county-level estimates, and make any needed revisions. In addition, for the aircraft category, EPA made some additions to the 2008 military aircraft NEI that formed the basis of the initial draft SEMAP inventory. As discussed in Section III.B, we are distributing an
Appendix A - 204 Kentucky Regional Haze 5-Year Periodic Report SIP Revision, September 2014

January 2012
Final Report
57
electronic file showing additional emission records calculated by EPA for military aircraft by airport for the SESARM region. Agencies should provide feedback as to whether these records should be added to their inventory.
Table IV-7. Final 2007 SESARM Nonroad Source Emissions by Major Sector
Category Pollutant Emissions, tons per year
SO2 NOx VOC PM10-PRI PM25-PRI CO NH3
NONROAD Model 23,308 404,580 629,693 41,489 39,517 4,642,050 447
Aircraft 3,105 32,153 18,444 4,066 3,037 196,823 NA
Commercial Marine 33,715 162,801 4,516 7,869 7,462 28,726 86
Locomotive 2,178 155,025 8,285 5,085 4,693 21,633 67
All Nonroad 62,307 754,560 660,938 58,508 54,709 4,889,232 601
Table IV-8. Final 2007 NONROAD Model Emission Estimates by State
State Pollutant Emissions, tons per year
SO2 NOx VOC PM10-PRI PM25-PRI CO NH3
Alabama 1,483 26,695 49,956 2,806 2,665 316,138 30
Florida 6,714 109,218 193,974 11,543 10,986 1,431,464 134
Georgia 3,079 51,524 69,914 5,315 5,067 629,419 56
Kentucky 1,630 28,665 36,641 2,877 2,749 240,397 28
Mississippi 1,147 20,050 33,760 2,126 2,025 187,258 21
North Carolina 3,111 55,743 76,568 5,434 5,181 597,360 58
South Carolina 1,522 26,742 42,293 2,661 2,534 328,606 29
Tennessee 1,884 36,756 54,089 3,637 3,467 388,496 38
Virginia 2,329 41,658 55,164 4,132 3,937 416,303 45
West Virginia 410 7,529 17,333 957 905 106,610 9
Total SESARM 23,308 404,091 630,621 41,489 39,517 4,674,012 447
State Percentage of Regional Total
SO2 NOx VOC PM10-PRI PM25-PRI CO NH3
Alabama 6.4 6.6 7.9 6.8 6.7 6.8 6.7
Florida 28.8 27.0 30.8 27.8 27.8 30.8 29.9
Georgia 13.2 12.7 11.1 12.8 12.8 13.6 12.6
Kentucky 7.0 7.1 5.8 6.9 7.0 5.2 6.2
Mississippi 4.9 5.0 5.4 5.1 5.1 4.0 4.7
North Carolina 13.3 13.8 12.2 13.1 13.1 12.9 13.0
South Carolina 6.5 6.6 6.7 6.4 6.4 7.1 6.6
Tennessee 8.1 9.1 8.6 8.8 8.8 8.4 8.4
Virginia 10.0 10.3 8.8 10.0 10.0 9.0 10.0
West Virginia 1.8 1.9 2.8 2.3 2.3 2.3 2.0
Total SESARM 100 100 100 100 100 100 100
Appendix A - 205 Kentucky Regional Haze 5-Year Periodic Report SIP Revision, September 2014
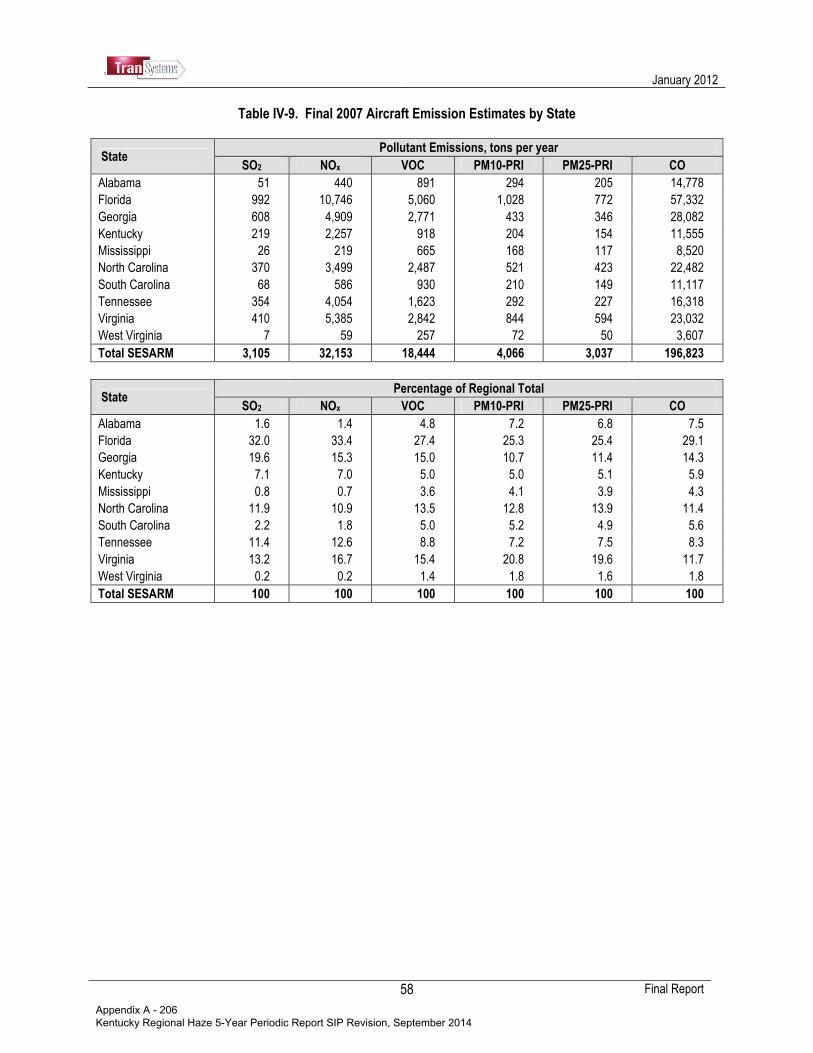
January 2012
Final Report
58
Table IV-9. Final 2007 Aircraft Emission Estimates by State
State Pollutant Emissions, tons per year
SO2 NOx VOC PM10-PRI PM25-PRI CO
Alabama 51 440 891 294 205 14,778
Florida 992 10,746 5,060 1,028 772 57,332
Georgia 608 4,909 2,771 433 346 28,082
Kentucky 219 2,257 918 204 154 11,555
Mississippi 26 219 665 168 117 8,520
North Carolina 370 3,499 2,487 521 423 22,482
South Carolina 68 586 930 210 149 11,117
Tennessee 354 4,054 1,623 292 227 16,318
Virginia 410 5,385 2,842 844 594 23,032
West Virginia 7 59 257 72 50 3,607
Total SESARM 3,105 32,153 18,444 4,066 3,037 196,823
State Percentage of Regional Total
SO2 NOx VOC PM10-PRI PM25-PRI CO
Alabama 1.6 1.4 4.8 7.2 6.8 7.5
Florida 32.0 33.4 27.4 25.3 25.4 29.1
Georgia 19.6 15.3 15.0 10.7 11.4 14.3
Kentucky 7.1 7.0 5.0 5.0 5.1 5.9
Mississippi 0.8 0.7 3.6 4.1 3.9 4.3
North Carolina 11.9 10.9 13.5 12.8 13.9 11.4
South Carolina 2.2 1.8 5.0 5.2 4.9 5.6
Tennessee 11.4 12.6 8.8 7.2 7.5 8.3
Virginia 13.2 16.7 15.4 20.8 19.6 11.7
West Virginia 0.2 0.2 1.4 1.8 1.6 1.8
Total SESARM 100 100 100 100 100 100
Appendix A - 206 Kentucky Regional Haze 5-Year Periodic Report SIP Revision, September 2014
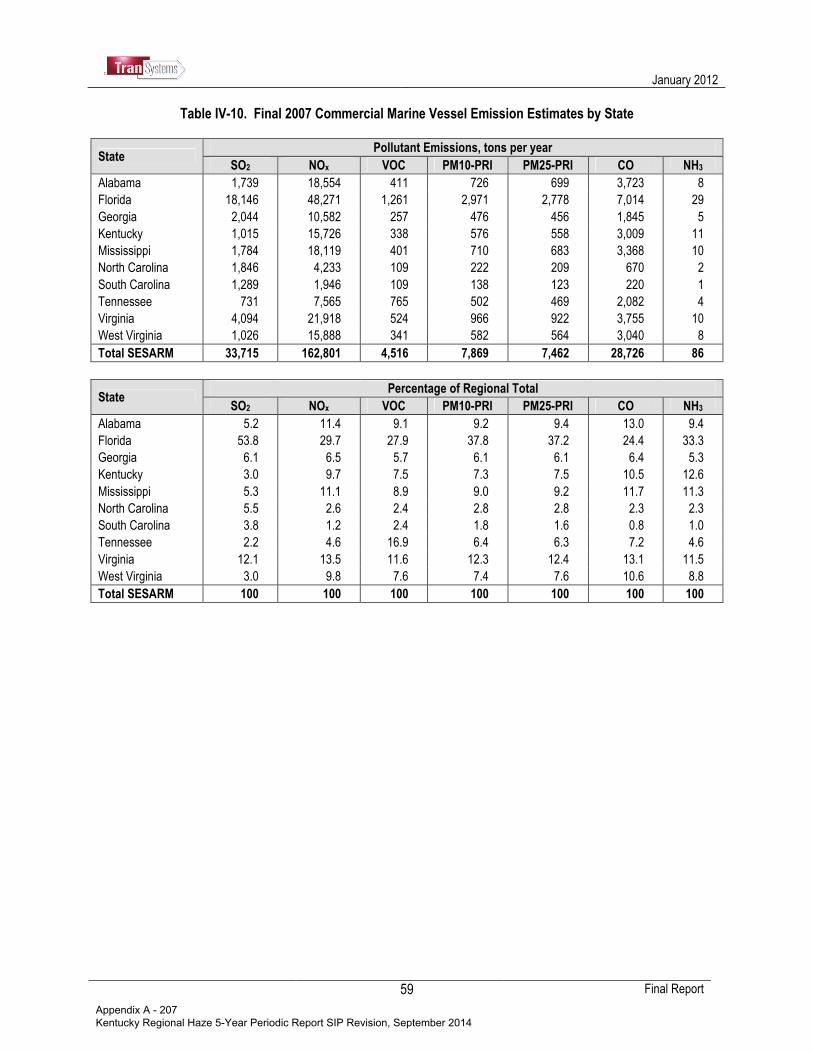
January 2012
Final Report
59
Table IV-10. Final 2007 Commercial Marine Vessel Emission Estimates by State
State Pollutant Emissions, tons per year
SO2 NOx VOC PM10-PRI PM25-PRI CO NH3
Alabama 1,739 18,554 411 726 699 3,723 8
Florida 18,146 48,271 1,261 2,971 2,778 7,014 29
Georgia 2,044 10,582 257 476 456 1,845 5
Kentucky 1,015 15,726 338 576 558 3,009 11
Mississippi 1,784 18,119 401 710 683 3,368 10
North Carolina 1,846 4,233 109 222 209 670 2
South Carolina 1,289 1,946 109 138 123 220 1
Tennessee 731 7,565 765 502 469 2,082 4
Virginia 4,094 21,918 524 966 922 3,755 10
West Virginia 1,026 15,888 341 582 564 3,040 8
Total SESARM 33,715 162,801 4,516 7,869 7,462 28,726 86
State Percentage of Regional Total
SO2 NOx VOC PM10-PRI PM25-PRI CO NH3
Alabama 5.2 11.4 9.1 9.2 9.4 13.0 9.4
Florida 53.8 29.7 27.9 37.8 37.2 24.4 33.3
Georgia 6.1 6.5 5.7 6.1 6.1 6.4 5.3
Kentucky 3.0 9.7 7.5 7.3 7.5 10.5 12.6
Mississippi 5.3 11.1 8.9 9.0 9.2 11.7 11.3
North Carolina 5.5 2.6 2.4 2.8 2.8 2.3 2.3
South Carolina 3.8 1.2 2.4 1.8 1.6 0.8 1.0
Tennessee 2.2 4.6 16.9 6.4 6.3 7.2 4.6
Virginia 12.1 13.5 11.6 12.3 12.4 13.1 11.5
West Virginia 3.0 9.8 7.6 7.4 7.6 10.6 8.8
Total SESARM 100 100 100 100 100 100 100
Appendix A - 207 Kentucky Regional Haze 5-Year Periodic Report SIP Revision, September 2014

January 2012
Final Report
60
Table IV-11. Final 2007 Locomotive Emission Estimates by State
State Pollutant Emissions, tons per year
SO2 NOx VOC PM10-PRI PM25-PRI CO NH3
Alabama 196 17,899 972 598 552 2,542 8
Florida 175 11,625 592 356 332 1,505 5
Georgia 252 24,066 1,303 801 739 3,402 11
Kentucky 173 16,806 888 550 508 2,355 7
Mississippi 131 9,933 489 304 280 1,295 4
North Carolina 130 11,592 622 378 350 1,610 5
South Carolina 99 8,968 479 296 273 1,264 4
Tennessee 367 19,461 1,083 650 591 2,799 8
Virginia 444 21,639 1,180 728 678 3,066 9
West Virginia 212 13,037 677 423 389 1,796 6
Total SESARM 2,178 155,025 8,285 5,085 4,693 21,633 67
State Percentage of Regional Total
SO2 NOx VOC PM10-PRI PM25-PRI CO NH3
Alabama 9.0 11.5 11.7 11.8 11.8 11.8 11.8
Florida 8.0 7.5 7.1 7.0 7.1 7.0 6.9
Georgia 11.6 15.5 15.7 15.7 15.7 15.7 15.8
Kentucky 8.0 10.8 10.7 10.8 10.8 10.9 10.9
Mississippi 6.0 6.4 5.9 6.0 6.0 6.0 6.0
North Carolina 6.0 7.5 7.5 7.4 7.5 7.4 7.5
South Carolina 4.6 5.8 5.8 5.8 5.8 5.8 5.8
Tennessee 16.8 12.6 13.1 12.8 12.6 12.9 12.5
Virginia 20.4 14.0 14.2 14.3 14.4 14.2 14.0
West Virginia 9.8 8.4 8.2 8.3 8.3 8.3 8.7
Total SESARM 100 100 100 100 100 100 100
Appendix A - 208 Kentucky Regional Haze 5-Year Periodic Report SIP Revision, September 2014
January 2012
Final Report
61
V. REFERENCES
ACE, 2010. U.S. Army Corps of Engineers, Navigation Data Center, U.S. Waterways Data, Principal Port commodity tonnage for 2005 and 2007, available at http://www.iwr.usace.army.mil/ndc/db/pport/dbf, accessed on January 2010.
Census, 2009a. U.S. Census Bureau, 2006 County Business Patterns, U.S. Department of Commerce, accessed
from http://www.census.gov/epcd/cbp/index.html, March 2009. Census, 2009b: U.S. Census Bureau, 2006 Census of Governments, U.S. Department of Commerce, accessed from
http://www.census.gov/govs/apes/historical_data_2006.html, April 2009. DOE, 2009a. U.S. Department of Energy, Energy Information Administration, “Petroleum Navigator- Total Distillate
Sales/Deliveries to Railroad Consumers (Thousand Gallons),” http://tonto.eia.doe.gov/dnav/pet/pet_cons_821dst_dcu_nus_a.htm, December 2009.
DOE, 2009b. U.S. Department of Energy, Energy Efficiency and Renewable Energy, “Transportation Energy Data
Book: Tables A.13 and A.15, http://cta.ornl.gov/data/appendix_a.shtml, 2009. EIA, 2008a. Energy Information Administration, “Domestic Distribution of U.S. Coal by Destination State, Consumer,
Origin and Method of Transportation, 2007,” U.S. Department of Energy, available from http://www.eia.doe.gov/cneaf/coal/page/coaldistrib/2007/d_07state.pdf, issued December 2008.
EIA, 2008b:. Energy Information Administration, “Quarterly Coal Report, October–December 2007,” DOE/EIA-0121
(2007/04Q), U.S. Department of Energy, available from http://tonto.eia.doe.gov/FTPROOT/coal/qcr/0121074q.pdf, issued March 2008.
EIA, 2008c. Energy Information Administration, “Domestic Distribution of U.S. Coal by Origin State, Consumer,
Destination and Method of Transportation, 2007,” U.S. Department of Energy, available from http://www.eia.doe.gov/cneaf/coal/page/coaldistrib/2007/o_07state.pdf, issued December 2008.
EIA, 2009a. Energy Information Administration, “State Energy Data System (SEDS): Consumption, Price, and
Expenditure Estimates,” U.S. Department of Energy, accessed from http://www.eia.doe.gov/emeu/states/_seds.html, accessed December 2009.
EIA, 2009b. Energy Information Administration, “Fuel Oil and Kerosene Sales,” U.S. Department of Energy,
accessed from http://www.eia.doe.gov/pub/oil_gas/petroleum/data_publications/fuel_oil_and_kerosene_sales/historical/2002/foks_2002.html, accessed December 2009.
EIA, 2009c. Energy Information Administration, “2006 Energy Consumption by Manufacturers−Data Tables,” 2006 Manufacturing Energy Consumption Survey, U.S. Department of Energy, accessed from http://www.eia.doe.gov/emeu/mecs/mecs2006/2006tables.html, issued June 2009.
EIA, 2009d. Energy Information Administration, “Annual Energy Outlook 2010 Early Release Overview,” Department
of Energy, accessed from http://www.eia.doe.gov/oiaf/aeo/index.html, released December 2009. EPA, 2003a. U.S. Environmental Protection Agency, “Draft Regulatory Impact Analysis: Control of Emissions from
Nonroad Diesel Engines,” EPA420-R-03-008, Office of Transportation and Air Quality, April 2003.
Appendix A - 209 Kentucky Regional Haze 5-Year Periodic Report SIP Revision, September 2014
January 2012
Final Report
62
EPA, 2003b. U.S. Environmental Protection Agency, AP 42, Compilation of Air Pollutant Emission Factors, Fifth Edition, “Volume I, Chapter 1: External Combustion Sources, Section 1.6-Wood Residue in Combustion Boilers,” accessed from http://www.epa.gov/ttn/chief/ap42/ch01/final/c01s06.pdf, September 2003.
EPA, 2008a. U.S. Environmental Protection Agency, “Regulatory Impact Analysis: Control of Emissions of Air
Pollution from Locomotive Engines and Marine Compression Ignition Engines Less than 30 Liters Per Cylinder,” EPA420-R-08-001a, Assessment and Standards Division, Office of Transportation and Air Quality, May 2008
EPA, 2008b. U.S. Environmental Protection Agency, “Regulatory Impact Analysis: Control of Emissions of Air
Pollution from Category 3 Marine Diesel Engines, Chapter 3 Emission Inventory,” EPA-420-R-09-019, Assessment and Standards Division Office of Transportation and Air, December 2008.
EPA, 2009. U.S. Environmental Protection Agency, “Economic Analysis of Final Effluent Limitation Guidelines and
Standards for the Construction and Development Industry,” Office of Water, October 21, 2009. EPA, 2010. U.S. Environmental Protection Agency, EGAS Version 5.0, available for download from
http://www.epa.gov/ttnecas1/egas5.htm, accessed March 2010. ERG, 2009a. Eastern Research Group, “Documentation for Aircraft Component of the National Emissions Inventory
Methodology,” prepared under subcontract to E.H. Pechan and Associates, Inc. for U.S. Environmental Protection Agency, Emissions, Monitoring and Analysis Division, December 15, 2009.
ERG, 2009b. Eastern Research Group, “Documentation for Commercial Marine Vessel Component of the National
Emissions Inventory Methodology,” prepared under subcontract to E.H. Pechan and Associates, Inc. for U.S. Environmental Protection Agency, Emissions, Monitoring and Analysis Division, December 15, 2009.
ERTAC, 2010a. Eastern Regional Technical Advisory Committee, 2007 Class I line haul emissions, transmitted in
file “EmissionsByCounty_Round6.xls” in email entitled “ERTAC update/Class I emissions,” from M. Bergin, ERTAC to K. Thesing, E.H. Pechan & Associates, Inc., March 23, 2010.
ERTAC, 2010b. Eastern Regional Technical Advisory Committee, 2008 Class II/III line haul Emissions, transmitted
in file “ClassII_III_v4.xls” in email entitled “Class II/III Spreadsheet with Reporting Marks,” from M. Janssen, LADCO to ERTAC distribution list, March 1, 2010.
ERTAC, 2010c. Eastern Regional Technical Advisory Committee, Railyard Emissions, transmitted in file “ERTAC
Railyard switcher emissions inventory 6_4_2010.xls” in email from M. Bergin, ERTAC to ERTAC distribution list, June 4, 2010.
FAA, 2010. Federal Aviation Administration, “2007 and 2008 LTO operations by SESARM State,” obtained from Air
Traffic Activity System, http://aspm.faa.gov/opsnet/sys/Main.asp?force=atads, February 2010. Huntley, 2009. Huntley, Roy, U.S. Environmental Protection Agency, “SCCs & emission factors to be used in 2008
NEI to Bollman May 1 2009.mdb [electronic file],” May 1, 2009. Lorenz, 2009. Lorenz, Thomas, Energy Information Administration, personal communication with Jonathan Dorn,
E.H. Pechan & Associates, Inc., September 29, 2009. Pechan, 2004. E.H. Pechan & Associates, Inc. “Estimating Ammonia Emissions from Anthropogenic Nonagricultural
Sources - Draft Final Report,” prepared for the Emission Inventory Improvement Program, April 2004.
Appendix A - 210 Kentucky Regional Haze 5-Year Periodic Report SIP Revision, September 2014
January 2012
Final Report
63
Pechan, 2009a. E.H. Pechan and Associates, Inc., “Non-Road and Area Source Base Year and Future Year
Emissions Inventories Technical Memorandum #1: Base Year Inventory – Summary of 2008 NEI Efforts,” prepared for Southeastern States Air Resource Managers, Inc., September 14, 2009.
Pechan, 2009b. E.H. Pechan and Associates, Inc., “Evaluation of ICI Combustion Coal Sulfur Content, Technical
Memorandum,” prepared for Central Air Planning Association, March 28, 2009. Pechan, 2009c. E.H. Pechan and Associates, Inc., “Instructions To SESARM States For Updating EPA’s National
Mobile Inventory Model 2007 County-Level Database, Technical Memorandum,” prepared for SESARM, September 18, 2009.
Pechan, 2010. E.H. Pechan and Associates, Inc., “Area & Nonroad Base & Forecast Year Inventories, Final Report,”
prepared for Southeastern States Air Resource Managers, Inc., June 2010.
Appendix A - 211 Kentucky Regional Haze 5-Year Periodic Report SIP Revision, September 2014
January 2012
A-1 Final Report
APPENDIX A. POINT SOURCE SUBTRACTION PROCEDURE DETAILS This Appendix describes source category-specific details on the point source subtraction procedures, and displays the area SCC to point SCC crosswalk (see Tables A-1 through A-8).
A. ICI FUEL COMBUSTION To assist in the point source subtractions for industrial, commercial, and institutional (ICI) fuel combustion, TranSystems developed two crosswalks: one between each industrial fuel combustion area SCC and associated point SCCs (Table A-1), and an analogous crosswalk developed for commercial/institutional fuel combustion (Table A-2). Because natural gas consumed as pipeline fuel is not included by the Energy Information Administration (EIA) in EIA’s state energy consumption data for the Industrial sector, it was necessary to exclude pipeline natural gas combustion emissions from the point source subtraction procedure. Since there are no SCCs specific to pipeline natural gas combustion, point source pipeline natural gas combustion emission estimates were compiled by summing emissions for industrial sector natural gas internal combustion engine records (SCC 202002xx) with a pipeline-related Standard Industrial Classification (SIC) or North American Industrial Classification System (NAICS) code (SIC codes 1311, 1321, 1381, 4612, 4613, 4619, 4922, 4923, 4924, 4925, or 4931; NAICS codes 211111, 21112, 22121, 221210, 486110, 48621, 486210, 486910, 48699, or 486990).
B. CONSTRUCTION DUST Table A-3 displays the point SCCs associated with dust from Construction activities. These SCCs do not provide information to separate activity into the two area source category processes:
• 2311010000 - Construction: SIC 15-17; Residential; Total; and
• 2311020000 - Construction: SIC 15-18; Industrial/Commercial/Institutional; Total. TranSystems apportioned point source construction dust emissions between the two categories using state-level acreage data reported in the EPA October 2008 report “Economic Analysis of Final Effluent Limitation Guidelines and Standards for the Construction and Development Industry” (EPA, 2009). These proportions for each SESARM state are displayed below.
Appendix A - 212 Kentucky Regional Haze 5-Year Periodic Report SIP Revision, September 2014

January 2012
A-2 Final Report
Percentage of Construction Acreage by State and Type of Construction
State Residential % Other %
Alabama 36 64
Florida 41 59
Georgia 39 61
Kentucky 31 69
Mississippi 24 76
North Carolina 48 52
South Carolina 42 58
Tennessee 35 65
Virginia 45 55
West Virginia 40 60 Source: Table 4-8 from EPA, 2009.
C. SOLVENT UTILIZATION Table A-5 presents the point source crosswalk for each solvent utilization nonpoint SCC. This crosswalk was derived from the crosswalk used in performing VOC emissions-based point source subtractions for the 2002 NEI. As noted in the Table A-5 crosswalk, two area source solvent utilization SCCs (2401005000-Auto Refinishing and 2401070000-Motor Vehicles) are associated with the same point SCCs. For the Auto Refinishing area source category, point source subtractions for the listed SCCs were limited to records identified with Auto Refinishing industry sector SIC/NAICS codes (e.g., NAICS code 8111*). Emissions for all other applicable point SCC S/L inventory records were subtracted from total emissions for the Motor Vehicles source category.
D. GASOLINE DISTRIBUTION Table A-6 displays the point SCCs associated with gasoline distribution. Some of these SCCs do not provide information to separate activity into each area source stage I gasoline distribution filling technology. Therefore, TranSystems allocated the emissions from these point SCCs to each filling technology based on the proportion of emissions from TranSystems default inventory.
Appendix A - 213 Kentucky Regional Haze 5-Year Periodic Report SIP Revision, September 2014

January 2012
Final Report
A-3
Table A-1. Industrial Fuel Combustion Crosswalk for Point Source Subtractions. Point SCC SCC1 DESC SCC3 DESC SCC6 DESC SCC8 DESC Comments
2102001000 - Stationary Source Fuel Combustion; Industrial; Anthracite Coal; Total: All Boiler Types
10200101 External Combustion Boilers Industrial Anthracite Coal Pulverized Coal
10200104 External Combustion Boilers Industrial Anthracite Coal Traveling Grate (Overfeed) Stoker
10200107 External Combustion Boilers Industrial Anthracite Coal Hand-fired
10200117 External Combustion Boilers Industrial Anthracite Coal Fluidized Bed Boiler Burning Anthracite-Culm Fuel
39000189 Industrial Processes In-process Fuel Use Anthracite Coal General
39000199 Industrial Processes In-process Fuel Use Anthracite Coal General
2102002000 - Stationary Source Fuel Combustion; Industrial; Bituminous/Subbituminous Coal; Total: All Boiler Types
10200201 External Combustion Boilers Industrial Bituminous/Subbituminous Coal Pulverized Coal: Wet Bottom
10200202 External Combustion Boilers Industrial Bituminous/Subbituminous Coal Pulverized Coal: Dry Bottom
10200203 External Combustion Boilers Industrial Bituminous/Subbituminous Coal Cyclone Furnace
10200204 External Combustion Boilers Industrial Bituminous/Subbituminous Coal Spreader Stoker
10200205 External Combustion Boilers Industrial Bituminous/Subbituminous Coal Overfeed Stoker
10200206 External Combustion Boilers Industrial Bituminous/Subbituminous Coal Underfeed Stoker
10200210 External Combustion Boilers Industrial Bituminous/Subbituminous Coal Overfeed Stoker **
10200212 External Combustion Boilers Industrial Bituminous/Subbituminous Coal Pulverized Coal: Dry Bottom (Tangential)
10200213 External Combustion Boilers Industrial Bituminous/Subbituminous Coal Wet Slurry
10200217 External Combustion Boilers Industrial Bituminous/Subbituminous Coal Atmospheric Fluidized Bed Combustion: Bubbling Bed (Bituminous Coal)
10200218 External Combustion Boilers Industrial Bituminous/Subbituminous Coal Atmospheric Fluidized Bed Combustion: Circulating Bed (Bitum. Coal)
10200219 External Combustion Boilers Industrial Bituminous/Subbituminous Coal Cogeneration (Bituminous Coal)
10200221 External Combustion Boilers Industrial Bituminous/Subbituminous Coal Pulverized Coal: Wet Bottom (Subbituminous Coal)
10200222 External Combustion Boilers Industrial Bituminous/Subbituminous Coal Pulverized Coal: Dry Bottom (Subbituminous Coal)
10200223 External Combustion Boilers Industrial Bituminous/Subbituminous Coal Cyclone Furnace (Subbituminous Coal)
10200224 External Combustion Boilers Industrial Bituminous/Subbituminous Coal Spreader Stoker (Subbituminous Coal)
10200225 External Combustion Boilers Industrial Bituminous/Subbituminous Coal Traveling Grate (Overfeed) Stoker (Subbituminous Coal)
10200226 External Combustion Boilers Industrial Bituminous/Subbituminous Coal Pulverized Coal: Dry Bottom Tangential (Subbituminous Coal)
10200229 External Combustion Boilers Industrial Bituminous/Subbituminous Coal Cogeneration (Subbituminous Coal)
10500102 External Combustion Boilers Space Heaters Industrial Coal **
39000201 Industrial Processes In-process Fuel Use Bituminous Coal Cement Kiln/Dryer (Bituminous Coal)
39000203 Industrial Processes In-process Fuel Use Bituminous Coal Lime Kiln (Bituminous)
39000288 Industrial Processes In-process Fuel Use Bituminous Coal General (Subbituminous)
Appendix A - 214 Kentucky Regional Haze 5-Year Periodic Report SIP Revision, September 2014
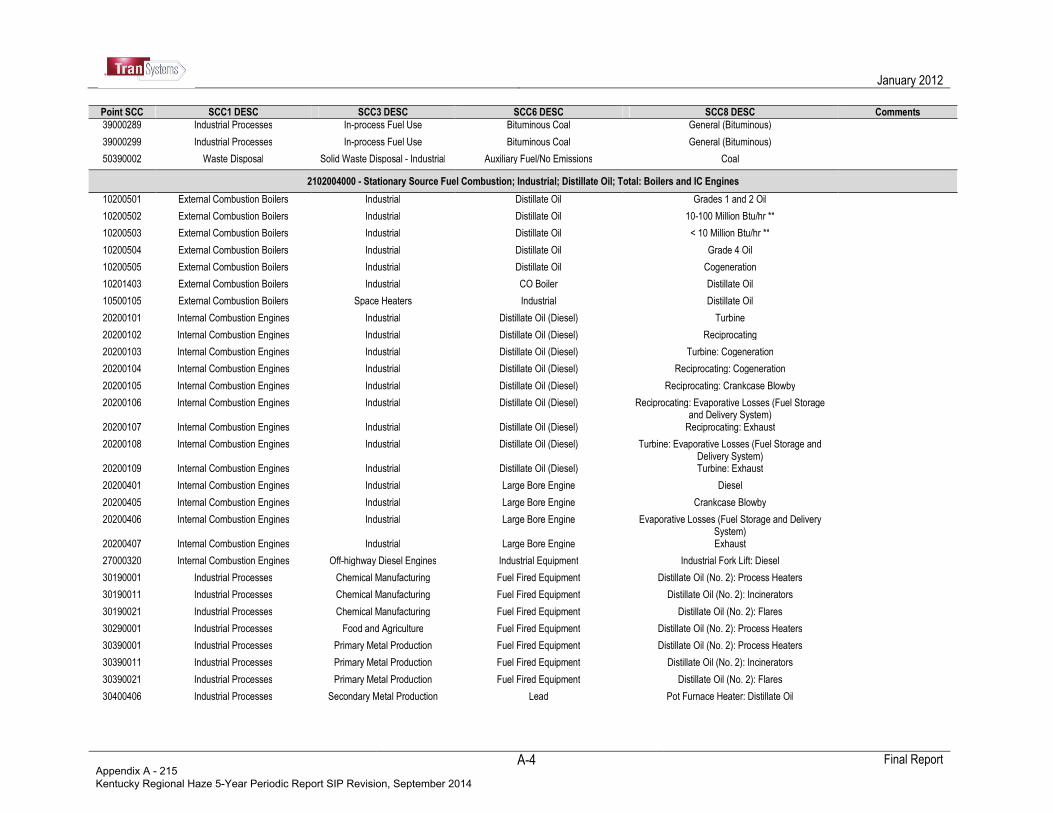
January 2012
Final Report
A-4
Point SCC SCC1 DESC SCC3 DESC SCC6 DESC SCC8 DESC Comments
39000289 Industrial Processes In-process Fuel Use Bituminous Coal General (Bituminous)
39000299 Industrial Processes In-process Fuel Use Bituminous Coal General (Bituminous)
50390002 Waste Disposal Solid Waste Disposal - Industrial Auxiliary Fuel/No Emissions Coal
2102004000 - Stationary Source Fuel Combustion; Industrial; Distillate Oil; Total: Boilers and IC Engines
10200501 External Combustion Boilers Industrial Distillate Oil Grades 1 and 2 Oil
10200502 External Combustion Boilers Industrial Distillate Oil 10-100 Million Btu/hr **
10200503 External Combustion Boilers Industrial Distillate Oil < 10 Million Btu/hr **
10200504 External Combustion Boilers Industrial Distillate Oil Grade 4 Oil
10200505 External Combustion Boilers Industrial Distillate Oil Cogeneration
10201403 External Combustion Boilers Industrial CO Boiler Distillate Oil
10500105 External Combustion Boilers Space Heaters Industrial Distillate Oil
20200101 Internal Combustion Engines Industrial Distillate Oil (Diesel) Turbine
20200102 Internal Combustion Engines Industrial Distillate Oil (Diesel) Reciprocating
20200103 Internal Combustion Engines Industrial Distillate Oil (Diesel) Turbine: Cogeneration
20200104 Internal Combustion Engines Industrial Distillate Oil (Diesel) Reciprocating: Cogeneration
20200105 Internal Combustion Engines Industrial Distillate Oil (Diesel) Reciprocating: Crankcase Blowby
20200106 Internal Combustion Engines Industrial Distillate Oil (Diesel) Reciprocating: Evaporative Losses (Fuel Storage and Delivery System)
20200107 Internal Combustion Engines Industrial Distillate Oil (Diesel) Reciprocating: Exhaust
20200108 Internal Combustion Engines Industrial Distillate Oil (Diesel) Turbine: Evaporative Losses (Fuel Storage and Delivery System)
20200109 Internal Combustion Engines Industrial Distillate Oil (Diesel) Turbine: Exhaust
20200401 Internal Combustion Engines Industrial Large Bore Engine Diesel
20200405 Internal Combustion Engines Industrial Large Bore Engine Crankcase Blowby
20200406 Internal Combustion Engines Industrial Large Bore Engine Evaporative Losses (Fuel Storage and Delivery System)
20200407 Internal Combustion Engines Industrial Large Bore Engine Exhaust
27000320 Internal Combustion Engines Off-highway Diesel Engines Industrial Equipment Industrial Fork Lift: Diesel
30190001 Industrial Processes Chemical Manufacturing Fuel Fired Equipment Distillate Oil (No. 2): Process Heaters
30190011 Industrial Processes Chemical Manufacturing Fuel Fired Equipment Distillate Oil (No. 2): Incinerators
30190021 Industrial Processes Chemical Manufacturing Fuel Fired Equipment Distillate Oil (No. 2): Flares
30290001 Industrial Processes Food and Agriculture Fuel Fired Equipment Distillate Oil (No. 2): Process Heaters
30390001 Industrial Processes Primary Metal Production Fuel Fired Equipment Distillate Oil (No. 2): Process Heaters
30390011 Industrial Processes Primary Metal Production Fuel Fired Equipment Distillate Oil (No. 2): Incinerators
30390021 Industrial Processes Primary Metal Production Fuel Fired Equipment Distillate Oil (No. 2): Flares
30400406 Industrial Processes Secondary Metal Production Lead Pot Furnace Heater: Distillate Oil
Appendix A - 215 Kentucky Regional Haze 5-Year Periodic Report SIP Revision, September 2014
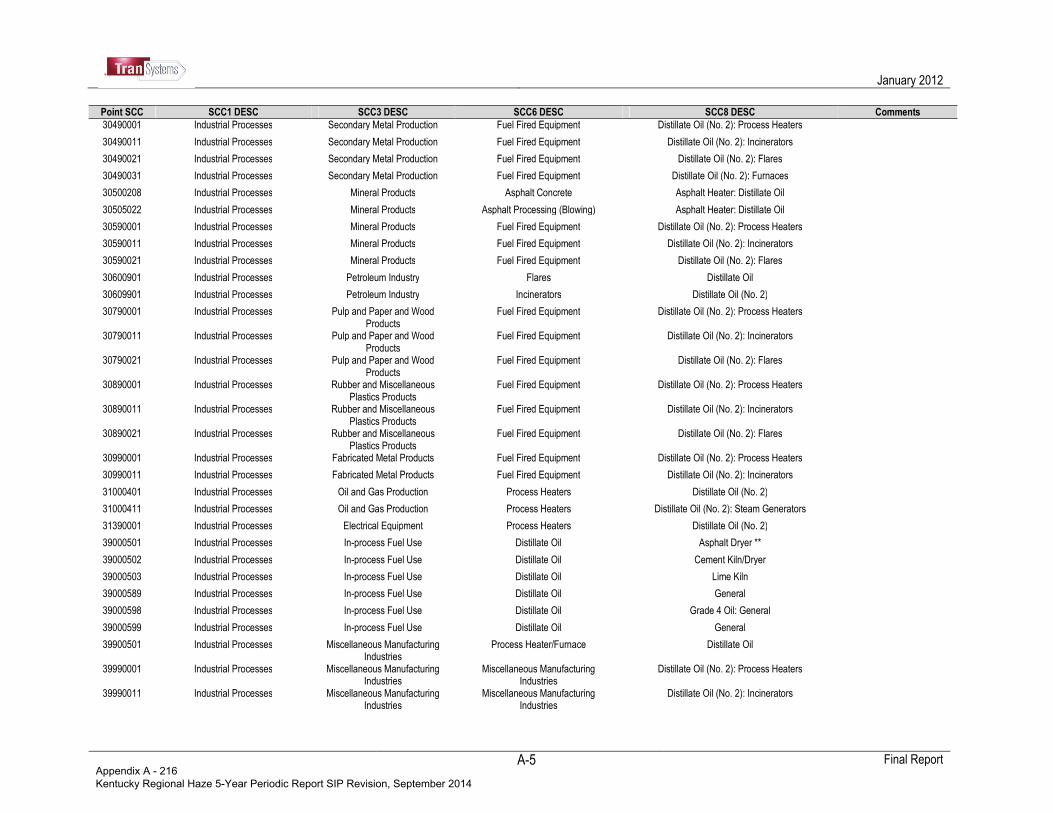
January 2012
Final Report
A-5
Point SCC SCC1 DESC SCC3 DESC SCC6 DESC SCC8 DESC Comments
30490001 Industrial Processes Secondary Metal Production Fuel Fired Equipment Distillate Oil (No. 2): Process Heaters
30490011 Industrial Processes Secondary Metal Production Fuel Fired Equipment Distillate Oil (No. 2): Incinerators
30490021 Industrial Processes Secondary Metal Production Fuel Fired Equipment Distillate Oil (No. 2): Flares
30490031 Industrial Processes Secondary Metal Production Fuel Fired Equipment Distillate Oil (No. 2): Furnaces
30500208 Industrial Processes Mineral Products Asphalt Concrete Asphalt Heater: Distillate Oil
30505022 Industrial Processes Mineral Products Asphalt Processing (Blowing) Asphalt Heater: Distillate Oil
30590001 Industrial Processes Mineral Products Fuel Fired Equipment Distillate Oil (No. 2): Process Heaters
30590011 Industrial Processes Mineral Products Fuel Fired Equipment Distillate Oil (No. 2): Incinerators
30590021 Industrial Processes Mineral Products Fuel Fired Equipment Distillate Oil (No. 2): Flares
30600901 Industrial Processes Petroleum Industry Flares Distillate Oil
30609901 Industrial Processes Petroleum Industry Incinerators Distillate Oil (No. 2)
30790001 Industrial Processes Pulp and Paper and Wood Products
Fuel Fired Equipment Distillate Oil (No. 2): Process Heaters
30790011 Industrial Processes Pulp and Paper and Wood Products
Fuel Fired Equipment Distillate Oil (No. 2): Incinerators
30790021 Industrial Processes Pulp and Paper and Wood Products
Fuel Fired Equipment Distillate Oil (No. 2): Flares
30890001 Industrial Processes Rubber and Miscellaneous Plastics Products
Fuel Fired Equipment Distillate Oil (No. 2): Process Heaters
30890011 Industrial Processes Rubber and Miscellaneous Plastics Products
Fuel Fired Equipment Distillate Oil (No. 2): Incinerators
30890021 Industrial Processes Rubber and Miscellaneous Plastics Products
Fuel Fired Equipment Distillate Oil (No. 2): Flares
30990001 Industrial Processes Fabricated Metal Products Fuel Fired Equipment Distillate Oil (No. 2): Process Heaters
30990011 Industrial Processes Fabricated Metal Products Fuel Fired Equipment Distillate Oil (No. 2): Incinerators
31000401 Industrial Processes Oil and Gas Production Process Heaters Distillate Oil (No. 2)
31000411 Industrial Processes Oil and Gas Production Process Heaters Distillate Oil (No. 2): Steam Generators
31390001 Industrial Processes Electrical Equipment Process Heaters Distillate Oil (No. 2)
39000501 Industrial Processes In-process Fuel Use Distillate Oil Asphalt Dryer **
39000502 Industrial Processes In-process Fuel Use Distillate Oil Cement Kiln/Dryer
39000503 Industrial Processes In-process Fuel Use Distillate Oil Lime Kiln
39000589 Industrial Processes In-process Fuel Use Distillate Oil General
39000598 Industrial Processes In-process Fuel Use Distillate Oil Grade 4 Oil: General
39000599 Industrial Processes In-process Fuel Use Distillate Oil General
39900501 Industrial Processes Miscellaneous Manufacturing Industries
Process Heater/Furnace Distillate Oil
39990001 Industrial Processes Miscellaneous Manufacturing Industries
Miscellaneous Manufacturing Industries
Distillate Oil (No. 2): Process Heaters
39990011 Industrial Processes Miscellaneous Manufacturing Industries
Miscellaneous Manufacturing Industries
Distillate Oil (No. 2): Incinerators
Appendix A - 216 Kentucky Regional Haze 5-Year Periodic Report SIP Revision, September 2014

January 2012
Final Report
A-6
Point SCC SCC1 DESC SCC3 DESC SCC6 DESC SCC8 DESC Comments
39990021 Industrial Processes Miscellaneous Manufacturing Industries
Miscellaneous Manufacturing Industries
Distillate Oil (No. 2 Oil): Flares
40201002 Petroleum and Solvent Evaporation Surface Coating Operations Coating Oven Heater Distillate Oil
40290011 Petroleum and Solvent Evaporation Surface Coating Operations Fuel Fired Equipment Distillate Oil: Incinerator/Afterburner
49090011 Petroleum and Solvent Evaporation Organic Solvent Evaporation Fuel Fired Equipment Distillate Oil (No. 2): Incinerators
49090021 Petroleum and Solvent Evaporation Organic Solvent Evaporation Fuel Fired Equipment Distillate Oil (No. 2): Flares
50390005 Waste Disposal Solid Waste Disposal - Industrial Auxiliary Fuel/No Emissions Distillate Oil
2102005000 - Stationary Source Fuel Combustion; Industrial; Residual Oil; Total: All Boiler Types
10200401 External Combustion Boilers Industrial Residual Oil Grade 6 Oil
10200402 External Combustion Boilers Industrial Residual Oil 10-100 Million Btu/hr **
10200403 External Combustion Boilers Industrial Residual Oil < 10 Million Btu/hr **
10200404 External Combustion Boilers Industrial Residual Oil Grade 5 Oil
10200405 External Combustion Boilers Industrial Residual Oil Cogeneration
10201404 External Combustion Boilers Industrial CO Boiler Residual Oil
20200501 Internal Combustion Engines Industrial Residual/Crude Oil Reciprocating
20200505 Internal Combustion Engines Industrial Residual/Crude Oil Reciprocating: Crankcase Blowby
20200506 Internal Combustion Engines Industrial Residual/Crude Oil Reciprocating: Evaporative Losses (Fuel Storage and Delivery System)
20200507 Internal Combustion Engines Industrial Residual/Crude Oil Reciprocating: Exhaust
30190002 Industrial Processes Chemical Manufacturing Fuel Fired Equipment Residual Oil: Process Heaters
30190012 Industrial Processes Chemical Manufacturing Fuel Fired Equipment Residual Oil: Incinerators
30190022 Industrial Processes Chemical Manufacturing Fuel Fired Equipment Residual Oil: Flares
30290002 Industrial Processes Food and Agriculture Fuel Fired Equipment Residual Oil: Process Heaters
30390002 Industrial Processes Primary Metal Production Fuel Fired Equipment Residual Oil: Process Heaters
30390012 Industrial Processes Primary Metal Production Fuel Fired Equipment Residual Oil: Incinerators
30390022 Industrial Processes Primary Metal Production Fuel Fired Equipment Residual Oil: Flares
30490002 Industrial Processes Secondary Metal Production Fuel Fired Equipment Residual Oil: Process Heaters
30490012 Industrial Processes Secondary Metal Production Fuel Fired Equipment Residual Oil: Incinerators
30490022 Industrial Processes Secondary Metal Production Fuel Fired Equipment Residual Oil: Flares
30490032 Industrial Processes Secondary Metal Production Fuel Fired Equipment Residual Oil: Furnaces
30500207 Industrial Processes Mineral Products Asphalt Concrete Asphalt Heater: Residual Oil
30505021 Industrial Processes Mineral Products Asphalt Processing (Blowing) Asphalt Heater: Residual Oil
30590002 Industrial Processes Mineral Products Fuel Fired Equipment Residual Oil: Process Heaters
30590012 Industrial Processes Mineral Products Fuel Fired Equipment Residual Oil: Incinerators
30600111 Industrial Processes Petroleum Industry Process Heaters Oil-fired (No. 6 Oil) > 100 Million Btu Capacity
30600902 Industrial Processes Petroleum Industry Flares Residual Oil
Appendix A - 217 Kentucky Regional Haze 5-Year Periodic Report SIP Revision, September 2014

January 2012
Final Report
A-7
Point SCC SCC1 DESC SCC3 DESC SCC6 DESC SCC8 DESC Comments
30609902 Industrial Processes Petroleum Industry Incinerators Residual Oil
30790002 Industrial Processes Pulp and Paper and Wood Products
Fuel Fired Equipment Residual Oil: Process Heaters
30790012 Industrial Processes Pulp and Paper and Wood Products
Fuel Fired Equipment Residual Oil: Incinerators
30790022 Industrial Processes Pulp and Paper and Wood Products
Fuel Fired Equipment Residual Oil: Flares
30890002 Industrial Processes Rubber and Miscellaneous Plastics Products
Fuel Fired Equipment Residual Oil: Process Heaters
30890012 Industrial Processes Rubber and Miscellaneous Plastics Products
Fuel Fired Equipment Residual Oil: Incinerators
30890022 Industrial Processes Rubber and Miscellaneous Plastics Products
Fuel Fired Equipment Residual Oil: Flares
30990002 Industrial Processes Fabricated Metal Products Fuel Fired Equipment Residual Oil: Process Heaters
30990012 Industrial Processes Fabricated Metal Products Fuel Fired Equipment Residual Oil: Incinerators
31000402 Industrial Processes Oil and Gas Production Process Heaters Residual Oil
31000412 Industrial Processes Oil and Gas Production Process Heaters Residual Oil: Steam Generators
31390002 Industrial Processes Electrical Equipment Process Heaters Residual Oil
39000402 Industrial Processes In-process Fuel Use Residual Oil Cement Kiln/Dryer
39000403 Industrial Processes In-process Fuel Use Residual Oil Lime Kiln
39000489 Industrial Processes In-process Fuel Use Residual Oil General
39000499 Industrial Processes In-process Fuel Use Residual Oil General
39990002 Industrial Processes Miscellaneous Manufacturing Industries
Miscellaneous Manufacturing Industries
Residual Oil: Process Heaters
39990012 Industrial Processes Miscellaneous Manufacturing Industries
Miscellaneous Manufacturing Industries
Residual Oil: Incinerators
39990022 Industrial Processes Miscellaneous Manufacturing Industries
Miscellaneous Manufacturing Industries
Residual Oil: Flares
40201003 Petroleum and Solvent Evaporation Surface Coating Operations Coating Oven Heater Residual Oil
40290012 Petroleum and Solvent Evaporation Surface Coating Operations Fuel Fired Equipment Residual Oil: Incinerator/Afterburner
49090012 Petroleum and Solvent Evaporation Organic Solvent Evaporation Fuel Fired Equipment Residual Oil: Incinerators
49090022 Petroleum and Solvent Evaporation Organic Solvent Evaporation Fuel Fired Equipment Residual Oil: Flares
2102006000 - Stationary Source Fuel Combustion; Industrial; Natural Gas; Total: Boilers and IC Engines
10200601 External Combustion Boilers Industrial Natural Gas > 100 Million Btu/hr
10200602 External Combustion Boilers Industrial Natural Gas 10-100 Million Btu/hr
10200603 External Combustion Boilers Industrial Natural Gas < 10 Million Btu/hr
10200604 External Combustion Boilers Industrial Natural Gas Cogeneration
10201401 External Combustion Boilers Industrial CO Boiler Natural Gas
10500106 External Combustion Boilers Space Heaters Industrial Natural Gas
Appendix A - 218 Kentucky Regional Haze 5-Year Periodic Report SIP Revision, September 2014
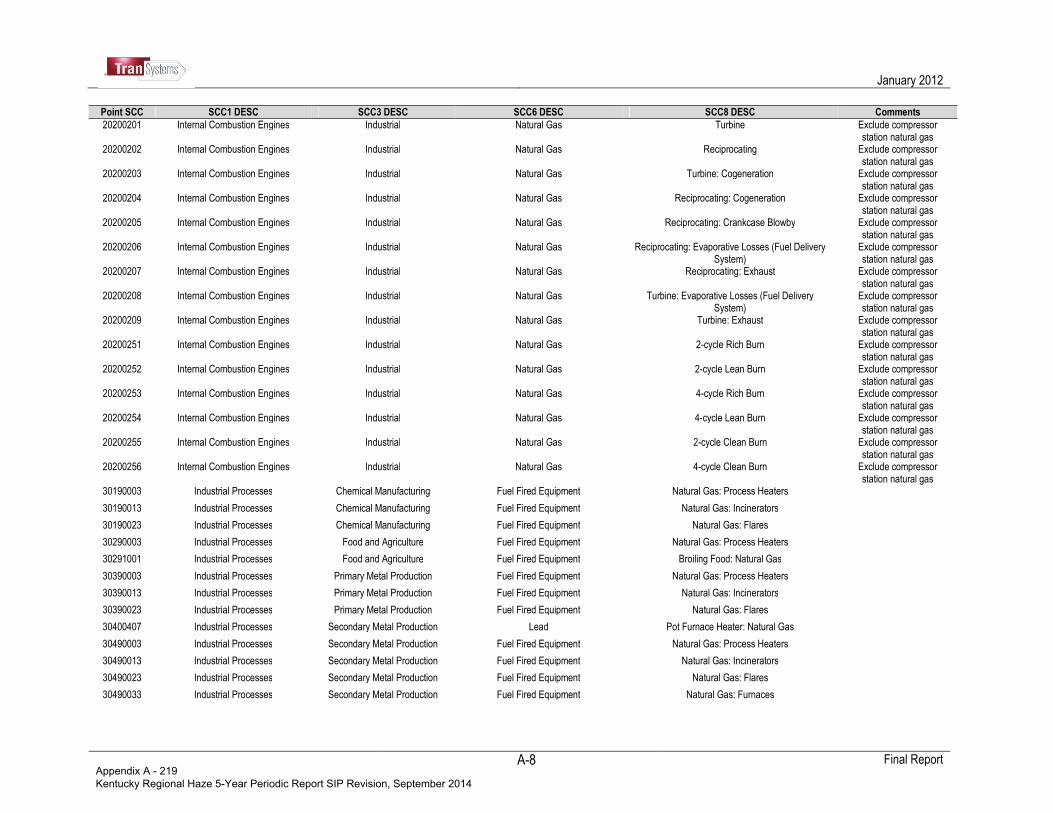
January 2012
Final Report
A-8
Point SCC SCC1 DESC SCC3 DESC SCC6 DESC SCC8 DESC Comments
20200201 Internal Combustion Engines Industrial Natural Gas Turbine Exclude compressor station natural gas
20200202 Internal Combustion Engines Industrial Natural Gas Reciprocating Exclude compressor station natural gas
20200203 Internal Combustion Engines Industrial Natural Gas Turbine: Cogeneration Exclude compressor station natural gas
20200204 Internal Combustion Engines Industrial Natural Gas Reciprocating: Cogeneration Exclude compressor station natural gas
20200205 Internal Combustion Engines Industrial Natural Gas Reciprocating: Crankcase Blowby Exclude compressor station natural gas
20200206 Internal Combustion Engines Industrial Natural Gas Reciprocating: Evaporative Losses (Fuel Delivery System)
Exclude compressor station natural gas
20200207 Internal Combustion Engines Industrial Natural Gas Reciprocating: Exhaust Exclude compressor station natural gas
20200208 Internal Combustion Engines Industrial Natural Gas Turbine: Evaporative Losses (Fuel Delivery System)
Exclude compressor station natural gas
20200209 Internal Combustion Engines Industrial Natural Gas Turbine: Exhaust Exclude compressor station natural gas
20200251 Internal Combustion Engines Industrial Natural Gas 2-cycle Rich Burn Exclude compressor station natural gas
20200252 Internal Combustion Engines Industrial Natural Gas 2-cycle Lean Burn Exclude compressor station natural gas
20200253 Internal Combustion Engines Industrial Natural Gas 4-cycle Rich Burn Exclude compressor station natural gas
20200254 Internal Combustion Engines Industrial Natural Gas 4-cycle Lean Burn Exclude compressor station natural gas
20200255 Internal Combustion Engines Industrial Natural Gas 2-cycle Clean Burn Exclude compressor station natural gas
20200256 Internal Combustion Engines Industrial Natural Gas 4-cycle Clean Burn Exclude compressor station natural gas
30190003 Industrial Processes Chemical Manufacturing Fuel Fired Equipment Natural Gas: Process Heaters
30190013 Industrial Processes Chemical Manufacturing Fuel Fired Equipment Natural Gas: Incinerators
30190023 Industrial Processes Chemical Manufacturing Fuel Fired Equipment Natural Gas: Flares
30290003 Industrial Processes Food and Agriculture Fuel Fired Equipment Natural Gas: Process Heaters
30291001 Industrial Processes Food and Agriculture Fuel Fired Equipment Broiling Food: Natural Gas
30390003 Industrial Processes Primary Metal Production Fuel Fired Equipment Natural Gas: Process Heaters
30390013 Industrial Processes Primary Metal Production Fuel Fired Equipment Natural Gas: Incinerators
30390023 Industrial Processes Primary Metal Production Fuel Fired Equipment Natural Gas: Flares
30400407 Industrial Processes Secondary Metal Production Lead Pot Furnace Heater: Natural Gas
30490003 Industrial Processes Secondary Metal Production Fuel Fired Equipment Natural Gas: Process Heaters
30490013 Industrial Processes Secondary Metal Production Fuel Fired Equipment Natural Gas: Incinerators
30490023 Industrial Processes Secondary Metal Production Fuel Fired Equipment Natural Gas: Flares
30490033 Industrial Processes Secondary Metal Production Fuel Fired Equipment Natural Gas: Furnaces
Appendix A - 219 Kentucky Regional Haze 5-Year Periodic Report SIP Revision, September 2014
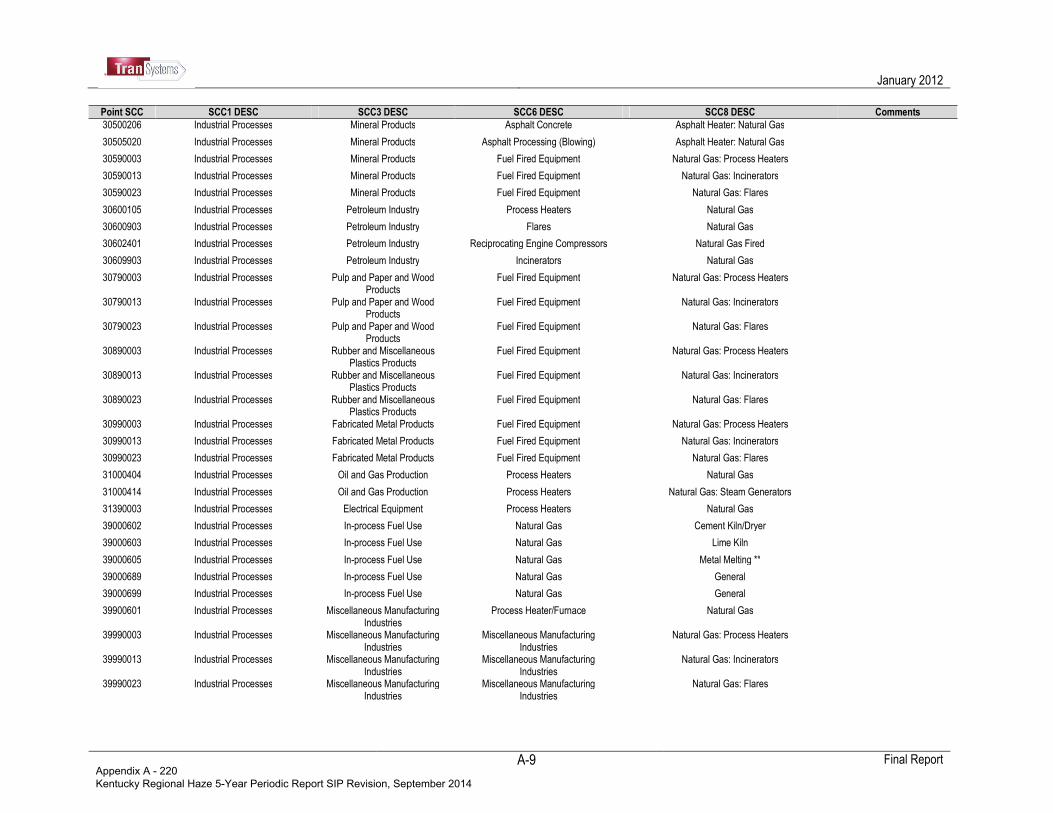
January 2012
Final Report
A-9
Point SCC SCC1 DESC SCC3 DESC SCC6 DESC SCC8 DESC Comments
30500206 Industrial Processes Mineral Products Asphalt Concrete Asphalt Heater: Natural Gas
30505020 Industrial Processes Mineral Products Asphalt Processing (Blowing) Asphalt Heater: Natural Gas
30590003 Industrial Processes Mineral Products Fuel Fired Equipment Natural Gas: Process Heaters
30590013 Industrial Processes Mineral Products Fuel Fired Equipment Natural Gas: Incinerators
30590023 Industrial Processes Mineral Products Fuel Fired Equipment Natural Gas: Flares
30600105 Industrial Processes Petroleum Industry Process Heaters Natural Gas
30600903 Industrial Processes Petroleum Industry Flares Natural Gas
30602401 Industrial Processes Petroleum Industry Reciprocating Engine Compressors Natural Gas Fired
30609903 Industrial Processes Petroleum Industry Incinerators Natural Gas
30790003 Industrial Processes Pulp and Paper and Wood Products
Fuel Fired Equipment Natural Gas: Process Heaters
30790013 Industrial Processes Pulp and Paper and Wood Products
Fuel Fired Equipment Natural Gas: Incinerators
30790023 Industrial Processes Pulp and Paper and Wood Products
Fuel Fired Equipment Natural Gas: Flares
30890003 Industrial Processes Rubber and Miscellaneous Plastics Products
Fuel Fired Equipment Natural Gas: Process Heaters
30890013 Industrial Processes Rubber and Miscellaneous Plastics Products
Fuel Fired Equipment Natural Gas: Incinerators
30890023 Industrial Processes Rubber and Miscellaneous Plastics Products
Fuel Fired Equipment Natural Gas: Flares
30990003 Industrial Processes Fabricated Metal Products Fuel Fired Equipment Natural Gas: Process Heaters
30990013 Industrial Processes Fabricated Metal Products Fuel Fired Equipment Natural Gas: Incinerators
30990023 Industrial Processes Fabricated Metal Products Fuel Fired Equipment Natural Gas: Flares
31000404 Industrial Processes Oil and Gas Production Process Heaters Natural Gas
31000414 Industrial Processes Oil and Gas Production Process Heaters Natural Gas: Steam Generators
31390003 Industrial Processes Electrical Equipment Process Heaters Natural Gas
39000602 Industrial Processes In-process Fuel Use Natural Gas Cement Kiln/Dryer
39000603 Industrial Processes In-process Fuel Use Natural Gas Lime Kiln
39000605 Industrial Processes In-process Fuel Use Natural Gas Metal Melting **
39000689 Industrial Processes In-process Fuel Use Natural Gas General
39000699 Industrial Processes In-process Fuel Use Natural Gas General
39900601 Industrial Processes Miscellaneous Manufacturing Industries
Process Heater/Furnace Natural Gas
39990003 Industrial Processes Miscellaneous Manufacturing Industries
Miscellaneous Manufacturing Industries
Natural Gas: Process Heaters
39990013 Industrial Processes Miscellaneous Manufacturing Industries
Miscellaneous Manufacturing Industries
Natural Gas: Incinerators
39990023 Industrial Processes Miscellaneous Manufacturing Industries
Miscellaneous Manufacturing Industries
Natural Gas: Flares
Appendix A - 220 Kentucky Regional Haze 5-Year Periodic Report SIP Revision, September 2014
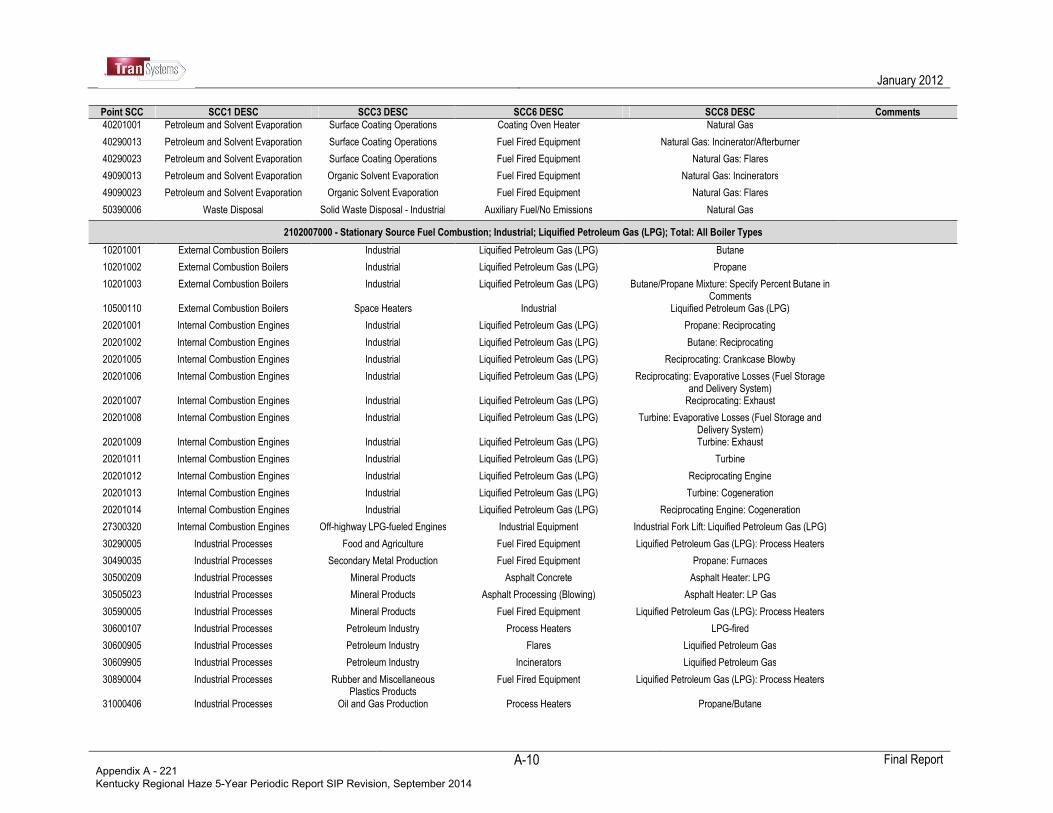
January 2012
Final Report
A-10
Point SCC SCC1 DESC SCC3 DESC SCC6 DESC SCC8 DESC Comments
40201001 Petroleum and Solvent Evaporation Surface Coating Operations Coating Oven Heater Natural Gas
40290013 Petroleum and Solvent Evaporation Surface Coating Operations Fuel Fired Equipment Natural Gas: Incinerator/Afterburner
40290023 Petroleum and Solvent Evaporation Surface Coating Operations Fuel Fired Equipment Natural Gas: Flares
49090013 Petroleum and Solvent Evaporation Organic Solvent Evaporation Fuel Fired Equipment Natural Gas: Incinerators
49090023 Petroleum and Solvent Evaporation Organic Solvent Evaporation Fuel Fired Equipment Natural Gas: Flares
50390006 Waste Disposal Solid Waste Disposal - Industrial Auxiliary Fuel/No Emissions Natural Gas
2102007000 - Stationary Source Fuel Combustion; Industrial; Liquified Petroleum Gas (LPG); Total: All Boiler Types
10201001 External Combustion Boilers Industrial Liquified Petroleum Gas (LPG) Butane
10201002 External Combustion Boilers Industrial Liquified Petroleum Gas (LPG) Propane
10201003 External Combustion Boilers Industrial Liquified Petroleum Gas (LPG) Butane/Propane Mixture: Specify Percent Butane in Comments
10500110 External Combustion Boilers Space Heaters Industrial Liquified Petroleum Gas (LPG)
20201001 Internal Combustion Engines Industrial Liquified Petroleum Gas (LPG) Propane: Reciprocating
20201002 Internal Combustion Engines Industrial Liquified Petroleum Gas (LPG) Butane: Reciprocating
20201005 Internal Combustion Engines Industrial Liquified Petroleum Gas (LPG) Reciprocating: Crankcase Blowby
20201006 Internal Combustion Engines Industrial Liquified Petroleum Gas (LPG) Reciprocating: Evaporative Losses (Fuel Storage and Delivery System)
20201007 Internal Combustion Engines Industrial Liquified Petroleum Gas (LPG) Reciprocating: Exhaust
20201008 Internal Combustion Engines Industrial Liquified Petroleum Gas (LPG) Turbine: Evaporative Losses (Fuel Storage and Delivery System)
20201009 Internal Combustion Engines Industrial Liquified Petroleum Gas (LPG) Turbine: Exhaust
20201011 Internal Combustion Engines Industrial Liquified Petroleum Gas (LPG) Turbine
20201012 Internal Combustion Engines Industrial Liquified Petroleum Gas (LPG) Reciprocating Engine
20201013 Internal Combustion Engines Industrial Liquified Petroleum Gas (LPG) Turbine: Cogeneration
20201014 Internal Combustion Engines Industrial Liquified Petroleum Gas (LPG) Reciprocating Engine: Cogeneration
27300320 Internal Combustion Engines Off-highway LPG-fueled Engines Industrial Equipment Industrial Fork Lift: Liquified Petroleum Gas (LPG)
30290005 Industrial Processes Food and Agriculture Fuel Fired Equipment Liquified Petroleum Gas (LPG): Process Heaters
30490035 Industrial Processes Secondary Metal Production Fuel Fired Equipment Propane: Furnaces
30500209 Industrial Processes Mineral Products Asphalt Concrete Asphalt Heater: LPG
30505023 Industrial Processes Mineral Products Asphalt Processing (Blowing) Asphalt Heater: LP Gas
30590005 Industrial Processes Mineral Products Fuel Fired Equipment Liquified Petroleum Gas (LPG): Process Heaters
30600107 Industrial Processes Petroleum Industry Process Heaters LPG-fired
30600905 Industrial Processes Petroleum Industry Flares Liquified Petroleum Gas
30609905 Industrial Processes Petroleum Industry Incinerators Liquified Petroleum Gas
30890004 Industrial Processes Rubber and Miscellaneous Plastics Products
Fuel Fired Equipment Liquified Petroleum Gas (LPG): Process Heaters
31000406 Industrial Processes Oil and Gas Production Process Heaters Propane/Butane
Appendix A - 221 Kentucky Regional Haze 5-Year Periodic Report SIP Revision, September 2014
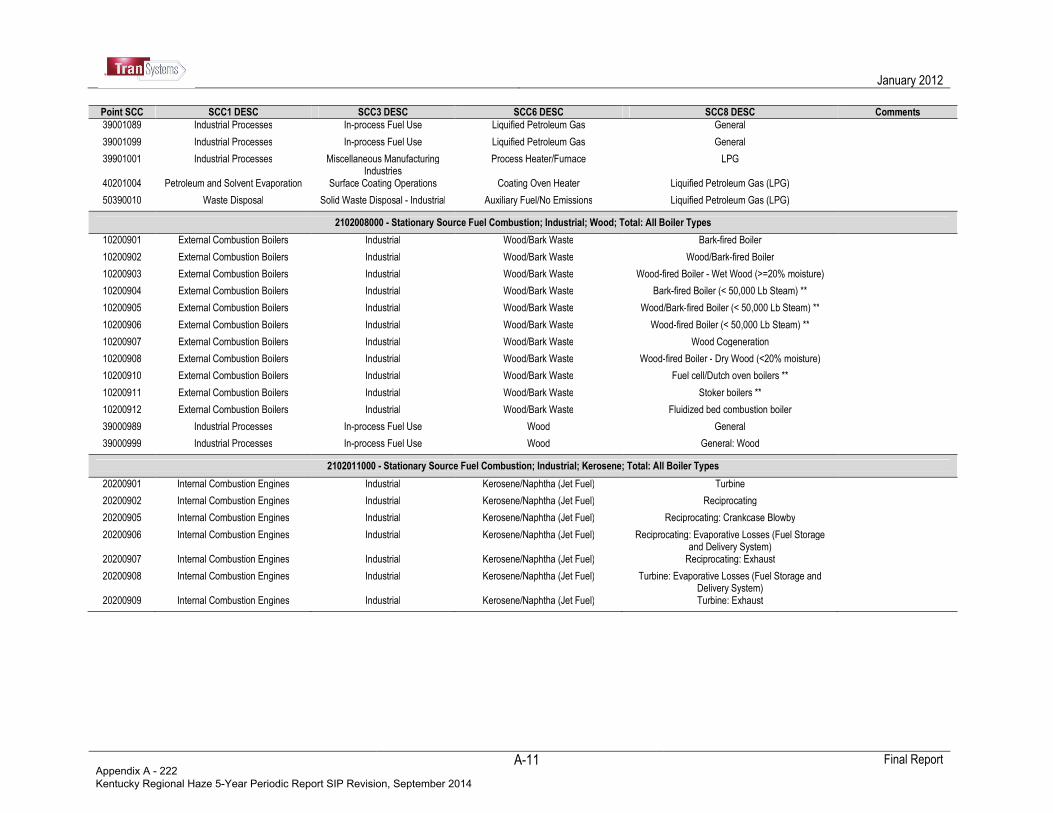
January 2012
Final Report
A-11
Point SCC SCC1 DESC SCC3 DESC SCC6 DESC SCC8 DESC Comments
39001089 Industrial Processes In-process Fuel Use Liquified Petroleum Gas General
39001099 Industrial Processes In-process Fuel Use Liquified Petroleum Gas General
39901001 Industrial Processes Miscellaneous Manufacturing Industries
Process Heater/Furnace LPG
40201004 Petroleum and Solvent Evaporation Surface Coating Operations Coating Oven Heater Liquified Petroleum Gas (LPG)
50390010 Waste Disposal Solid Waste Disposal - Industrial Auxiliary Fuel/No Emissions Liquified Petroleum Gas (LPG)
2102008000 - Stationary Source Fuel Combustion; Industrial; Wood; Total: All Boiler Types
10200901 External Combustion Boilers Industrial Wood/Bark Waste Bark-fired Boiler
10200902 External Combustion Boilers Industrial Wood/Bark Waste Wood/Bark-fired Boiler
10200903 External Combustion Boilers Industrial Wood/Bark Waste Wood-fired Boiler - Wet Wood (>=20% moisture)
10200904 External Combustion Boilers Industrial Wood/Bark Waste Bark-fired Boiler (< 50,000 Lb Steam) **
10200905 External Combustion Boilers Industrial Wood/Bark Waste Wood/Bark-fired Boiler (< 50,000 Lb Steam) **
10200906 External Combustion Boilers Industrial Wood/Bark Waste Wood-fired Boiler (< 50,000 Lb Steam) **
10200907 External Combustion Boilers Industrial Wood/Bark Waste Wood Cogeneration
10200908 External Combustion Boilers Industrial Wood/Bark Waste Wood-fired Boiler - Dry Wood (<20% moisture)
10200910 External Combustion Boilers Industrial Wood/Bark Waste Fuel cell/Dutch oven boilers **
10200911 External Combustion Boilers Industrial Wood/Bark Waste Stoker boilers **
10200912 External Combustion Boilers Industrial Wood/Bark Waste Fluidized bed combustion boiler
39000989 Industrial Processes In-process Fuel Use Wood General
39000999 Industrial Processes In-process Fuel Use Wood General: Wood
2102011000 - Stationary Source Fuel Combustion; Industrial; Kerosene; Total: All Boiler Types
20200901 Internal Combustion Engines Industrial Kerosene/Naphtha (Jet Fuel) Turbine
20200902 Internal Combustion Engines Industrial Kerosene/Naphtha (Jet Fuel) Reciprocating
20200905 Internal Combustion Engines Industrial Kerosene/Naphtha (Jet Fuel) Reciprocating: Crankcase Blowby
20200906 Internal Combustion Engines Industrial Kerosene/Naphtha (Jet Fuel) Reciprocating: Evaporative Losses (Fuel Storage and Delivery System)
20200907 Internal Combustion Engines Industrial Kerosene/Naphtha (Jet Fuel) Reciprocating: Exhaust
20200908 Internal Combustion Engines Industrial Kerosene/Naphtha (Jet Fuel) Turbine: Evaporative Losses (Fuel Storage and Delivery System)
20200909 Internal Combustion Engines Industrial Kerosene/Naphtha (Jet Fuel) Turbine: Exhaust
Appendix A - 222 Kentucky Regional Haze 5-Year Periodic Report SIP Revision, September 2014
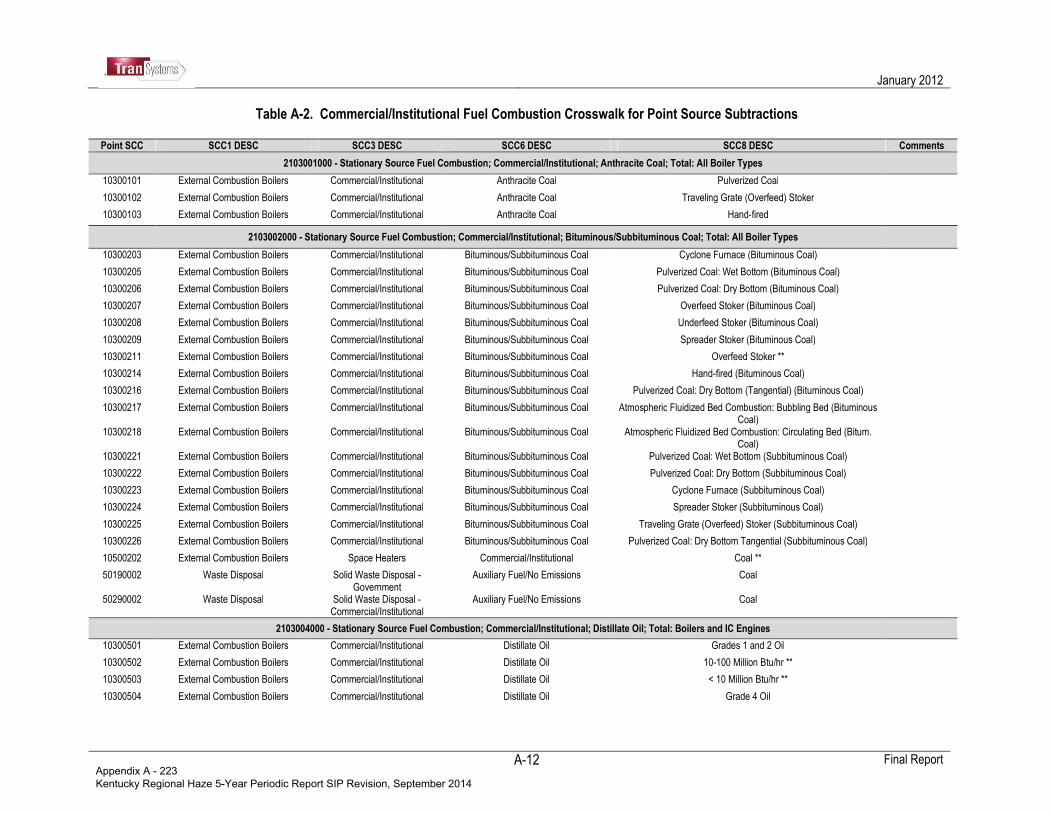
January 2012
Final Report
A-12
Table A-2. Commercial/Institutional Fuel Combustion Crosswalk for Point Source Subtractions Point SCC SCC1 DESC SCC3 DESC SCC6 DESC SCC8 DESC Comments
2103001000 - Stationary Source Fuel Combustion; Commercial/Institutional; Anthracite Coal; Total: All Boiler Types
10300101 External Combustion Boilers Commercial/Institutional Anthracite Coal Pulverized Coal
10300102 External Combustion Boilers Commercial/Institutional Anthracite Coal Traveling Grate (Overfeed) Stoker
10300103 External Combustion Boilers Commercial/Institutional Anthracite Coal Hand-fired
2103002000 - Stationary Source Fuel Combustion; Commercial/Institutional; Bituminous/Subbituminous Coal; Total: All Boiler Types
10300203 External Combustion Boilers Commercial/Institutional Bituminous/Subbituminous Coal Cyclone Furnace (Bituminous Coal)
10300205 External Combustion Boilers Commercial/Institutional Bituminous/Subbituminous Coal Pulverized Coal: Wet Bottom (Bituminous Coal)
10300206 External Combustion Boilers Commercial/Institutional Bituminous/Subbituminous Coal Pulverized Coal: Dry Bottom (Bituminous Coal)
10300207 External Combustion Boilers Commercial/Institutional Bituminous/Subbituminous Coal Overfeed Stoker (Bituminous Coal)
10300208 External Combustion Boilers Commercial/Institutional Bituminous/Subbituminous Coal Underfeed Stoker (Bituminous Coal)
10300209 External Combustion Boilers Commercial/Institutional Bituminous/Subbituminous Coal Spreader Stoker (Bituminous Coal)
10300211 External Combustion Boilers Commercial/Institutional Bituminous/Subbituminous Coal Overfeed Stoker **
10300214 External Combustion Boilers Commercial/Institutional Bituminous/Subbituminous Coal Hand-fired (Bituminous Coal)
10300216 External Combustion Boilers Commercial/Institutional Bituminous/Subbituminous Coal Pulverized Coal: Dry Bottom (Tangential) (Bituminous Coal)
10300217 External Combustion Boilers Commercial/Institutional Bituminous/Subbituminous Coal Atmospheric Fluidized Bed Combustion: Bubbling Bed (Bituminous Coal)
10300218 External Combustion Boilers Commercial/Institutional Bituminous/Subbituminous Coal Atmospheric Fluidized Bed Combustion: Circulating Bed (Bitum. Coal)
10300221 External Combustion Boilers Commercial/Institutional Bituminous/Subbituminous Coal Pulverized Coal: Wet Bottom (Subbituminous Coal)
10300222 External Combustion Boilers Commercial/Institutional Bituminous/Subbituminous Coal Pulverized Coal: Dry Bottom (Subbituminous Coal)
10300223 External Combustion Boilers Commercial/Institutional Bituminous/Subbituminous Coal Cyclone Furnace (Subbituminous Coal)
10300224 External Combustion Boilers Commercial/Institutional Bituminous/Subbituminous Coal Spreader Stoker (Subbituminous Coal)
10300225 External Combustion Boilers Commercial/Institutional Bituminous/Subbituminous Coal Traveling Grate (Overfeed) Stoker (Subbituminous Coal)
10300226 External Combustion Boilers Commercial/Institutional Bituminous/Subbituminous Coal Pulverized Coal: Dry Bottom Tangential (Subbituminous Coal)
10500202 External Combustion Boilers Space Heaters Commercial/Institutional Coal **
50190002 Waste Disposal Solid Waste Disposal - Government
Auxiliary Fuel/No Emissions Coal
50290002 Waste Disposal Solid Waste Disposal - Commercial/Institutional
Auxiliary Fuel/No Emissions Coal
2103004000 - Stationary Source Fuel Combustion; Commercial/Institutional; Distillate Oil; Total: Boilers and IC Engines
10300501 External Combustion Boilers Commercial/Institutional Distillate Oil Grades 1 and 2 Oil
10300502 External Combustion Boilers Commercial/Institutional Distillate Oil 10-100 Million Btu/hr **
10300503 External Combustion Boilers Commercial/Institutional Distillate Oil < 10 Million Btu/hr **
10300504 External Combustion Boilers Commercial/Institutional Distillate Oil Grade 4 Oil
Appendix A - 223 Kentucky Regional Haze 5-Year Periodic Report SIP Revision, September 2014
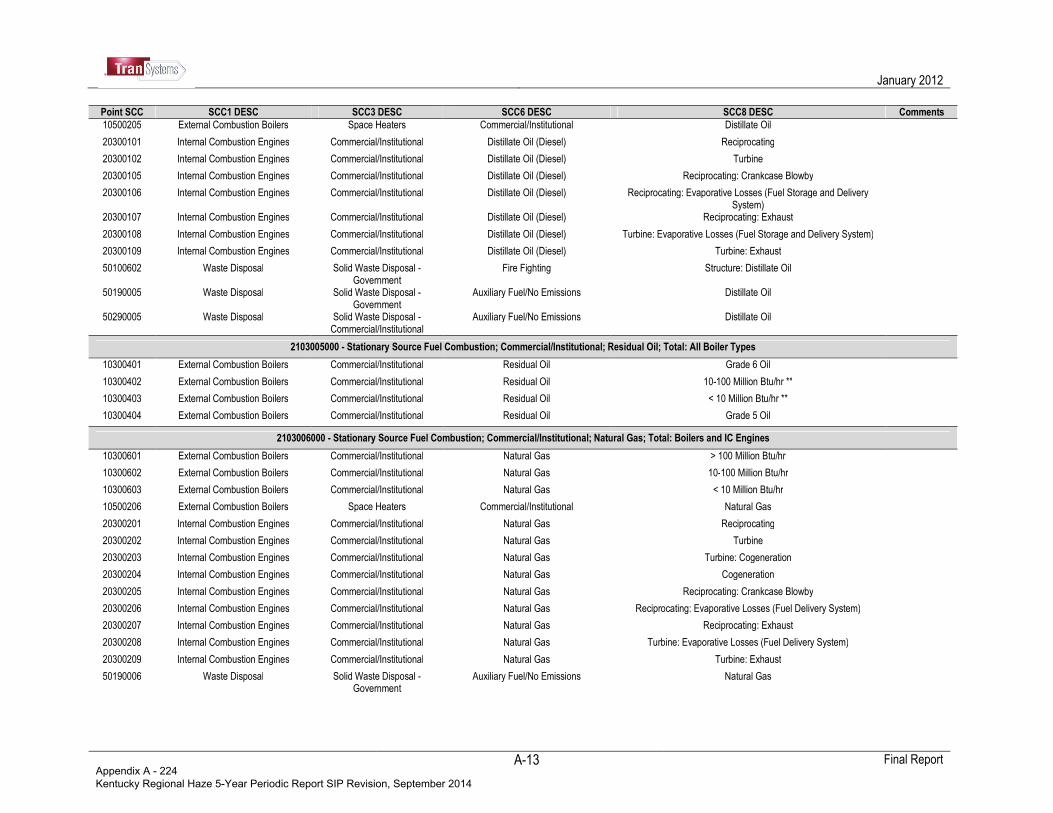
January 2012
Final Report
A-13
Point SCC SCC1 DESC SCC3 DESC SCC6 DESC SCC8 DESC Comments
10500205 External Combustion Boilers Space Heaters Commercial/Institutional Distillate Oil
20300101 Internal Combustion Engines Commercial/Institutional Distillate Oil (Diesel) Reciprocating
20300102 Internal Combustion Engines Commercial/Institutional Distillate Oil (Diesel) Turbine
20300105 Internal Combustion Engines Commercial/Institutional Distillate Oil (Diesel) Reciprocating: Crankcase Blowby
20300106 Internal Combustion Engines Commercial/Institutional Distillate Oil (Diesel) Reciprocating: Evaporative Losses (Fuel Storage and Delivery System)
20300107 Internal Combustion Engines Commercial/Institutional Distillate Oil (Diesel) Reciprocating: Exhaust
20300108 Internal Combustion Engines Commercial/Institutional Distillate Oil (Diesel) Turbine: Evaporative Losses (Fuel Storage and Delivery System)
20300109 Internal Combustion Engines Commercial/Institutional Distillate Oil (Diesel) Turbine: Exhaust
50100602 Waste Disposal Solid Waste Disposal - Government
Fire Fighting Structure: Distillate Oil
50190005 Waste Disposal Solid Waste Disposal - Government
Auxiliary Fuel/No Emissions Distillate Oil
50290005 Waste Disposal Solid Waste Disposal - Commercial/Institutional
Auxiliary Fuel/No Emissions Distillate Oil
2103005000 - Stationary Source Fuel Combustion; Commercial/Institutional; Residual Oil; Total: All Boiler Types
10300401 External Combustion Boilers Commercial/Institutional Residual Oil Grade 6 Oil 10300402 External Combustion Boilers Commercial/Institutional Residual Oil 10-100 Million Btu/hr ** 10300403 External Combustion Boilers Commercial/Institutional Residual Oil < 10 Million Btu/hr ** 10300404 External Combustion Boilers Commercial/Institutional Residual Oil Grade 5 Oil
2103006000 - Stationary Source Fuel Combustion; Commercial/Institutional; Natural Gas; Total: Boilers and IC Engines
10300601 External Combustion Boilers Commercial/Institutional Natural Gas > 100 Million Btu/hr
10300602 External Combustion Boilers Commercial/Institutional Natural Gas 10-100 Million Btu/hr
10300603 External Combustion Boilers Commercial/Institutional Natural Gas < 10 Million Btu/hr
10500206 External Combustion Boilers Space Heaters Commercial/Institutional Natural Gas
20300201 Internal Combustion Engines Commercial/Institutional Natural Gas Reciprocating
20300202 Internal Combustion Engines Commercial/Institutional Natural Gas Turbine
20300203 Internal Combustion Engines Commercial/Institutional Natural Gas Turbine: Cogeneration
20300204 Internal Combustion Engines Commercial/Institutional Natural Gas Cogeneration
20300205 Internal Combustion Engines Commercial/Institutional Natural Gas Reciprocating: Crankcase Blowby
20300206 Internal Combustion Engines Commercial/Institutional Natural Gas Reciprocating: Evaporative Losses (Fuel Delivery System)
20300207 Internal Combustion Engines Commercial/Institutional Natural Gas Reciprocating: Exhaust
20300208 Internal Combustion Engines Commercial/Institutional Natural Gas Turbine: Evaporative Losses (Fuel Delivery System)
20300209 Internal Combustion Engines Commercial/Institutional Natural Gas Turbine: Exhaust
50190006 Waste Disposal Solid Waste Disposal - Government
Auxiliary Fuel/No Emissions Natural Gas
Appendix A - 224 Kentucky Regional Haze 5-Year Periodic Report SIP Revision, September 2014
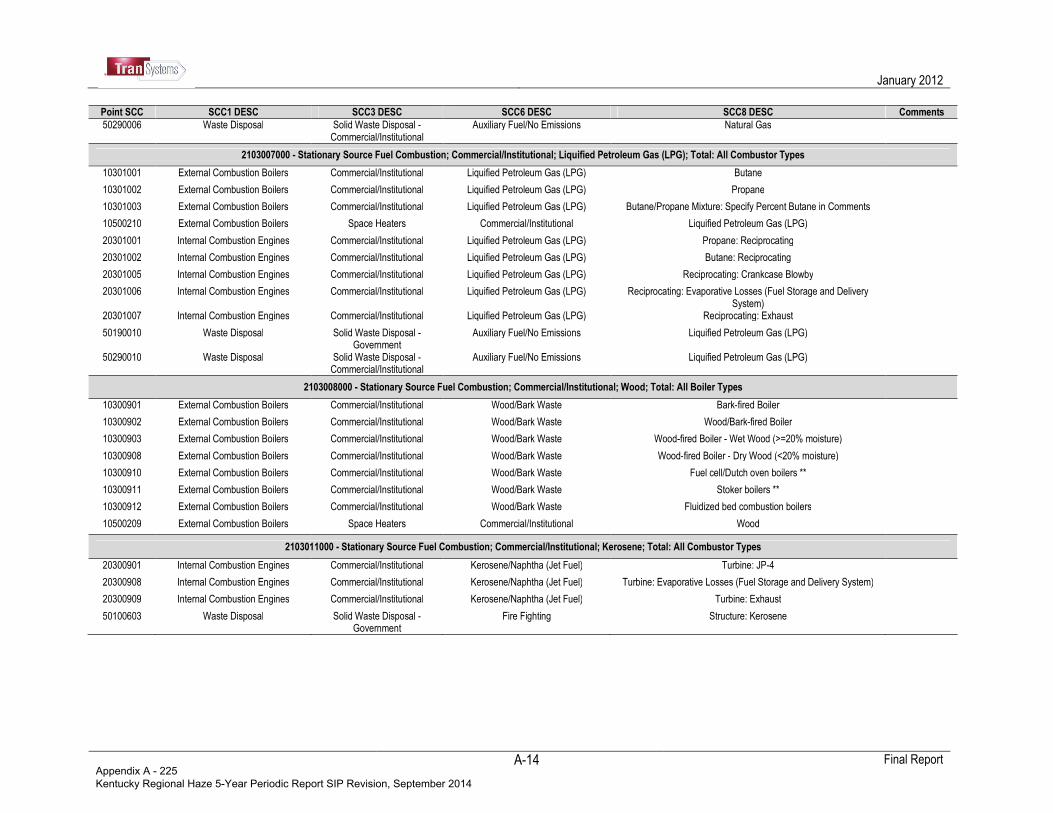
January 2012
Final Report
A-14
Point SCC SCC1 DESC SCC3 DESC SCC6 DESC SCC8 DESC Comments
50290006 Waste Disposal Solid Waste Disposal - Commercial/Institutional
Auxiliary Fuel/No Emissions Natural Gas
2103007000 - Stationary Source Fuel Combustion; Commercial/Institutional; Liquified Petroleum Gas (LPG); Total: All Combustor Types
10301001 External Combustion Boilers Commercial/Institutional Liquified Petroleum Gas (LPG) Butane
10301002 External Combustion Boilers Commercial/Institutional Liquified Petroleum Gas (LPG) Propane
10301003 External Combustion Boilers Commercial/Institutional Liquified Petroleum Gas (LPG) Butane/Propane Mixture: Specify Percent Butane in Comments
10500210 External Combustion Boilers Space Heaters Commercial/Institutional Liquified Petroleum Gas (LPG)
20301001 Internal Combustion Engines Commercial/Institutional Liquified Petroleum Gas (LPG) Propane: Reciprocating
20301002 Internal Combustion Engines Commercial/Institutional Liquified Petroleum Gas (LPG) Butane: Reciprocating
20301005 Internal Combustion Engines Commercial/Institutional Liquified Petroleum Gas (LPG) Reciprocating: Crankcase Blowby
20301006 Internal Combustion Engines Commercial/Institutional Liquified Petroleum Gas (LPG) Reciprocating: Evaporative Losses (Fuel Storage and Delivery System)
20301007 Internal Combustion Engines Commercial/Institutional Liquified Petroleum Gas (LPG) Reciprocating: Exhaust
50190010 Waste Disposal Solid Waste Disposal - Government
Auxiliary Fuel/No Emissions Liquified Petroleum Gas (LPG)
50290010 Waste Disposal Solid Waste Disposal - Commercial/Institutional
Auxiliary Fuel/No Emissions Liquified Petroleum Gas (LPG)
2103008000 - Stationary Source Fuel Combustion; Commercial/Institutional; Wood; Total: All Boiler Types
10300901 External Combustion Boilers Commercial/Institutional Wood/Bark Waste Bark-fired Boiler
10300902 External Combustion Boilers Commercial/Institutional Wood/Bark Waste Wood/Bark-fired Boiler
10300903 External Combustion Boilers Commercial/Institutional Wood/Bark Waste Wood-fired Boiler - Wet Wood (>=20% moisture)
10300908 External Combustion Boilers Commercial/Institutional Wood/Bark Waste Wood-fired Boiler - Dry Wood (<20% moisture)
10300910 External Combustion Boilers Commercial/Institutional Wood/Bark Waste Fuel cell/Dutch oven boilers **
10300911 External Combustion Boilers Commercial/Institutional Wood/Bark Waste Stoker boilers **
10300912 External Combustion Boilers Commercial/Institutional Wood/Bark Waste Fluidized bed combustion boilers
10500209 External Combustion Boilers Space Heaters Commercial/Institutional Wood
2103011000 - Stationary Source Fuel Combustion; Commercial/Institutional; Kerosene; Total: All Combustor Types
20300901 Internal Combustion Engines Commercial/Institutional Kerosene/Naphtha (Jet Fuel) Turbine: JP-4
20300908 Internal Combustion Engines Commercial/Institutional Kerosene/Naphtha (Jet Fuel) Turbine: Evaporative Losses (Fuel Storage and Delivery System)
20300909 Internal Combustion Engines Commercial/Institutional Kerosene/Naphtha (Jet Fuel) Turbine: Exhaust
50100603 Waste Disposal Solid Waste Disposal - Government
Fire Fighting Structure: Kerosene
Appendix A - 225 Kentucky Regional Haze 5-Year Periodic Report SIP Revision, September 2014

January 2012
Final Report
A-15
Table A-3. Construction Crosswalk for Point Source Subtractions
Point SCC SCC1 DESC SCC3 DESC SCC6 DESC SCC8 DESC Comments
2311010000 - Industrial Processes; Construction: SIC 15 – 17; Residential; Total and
2311020000 - Industrial Processes; Construction: SIC 15 – 18; Industrial/Commercial/Institutional; Total
31100101 Industrial Processes Building Construction Construction: Building Contractors Site Preparation: Topsoil Removal See Table II-2 for state-level SCC 231101000 versus 2310020000
proportions 31100102 Industrial Processes Building Construction Construction: Building Contractors Site Preparation: Earth Moving (Cut and Fill) See Table II-2 for state-level SCC
231101000 versus 2310020000 proportions
31100103 Industrial Processes Building Construction Construction: Building Contractors Site Preparation: Aggregate Hauling (On Dirt) See Table II-2 for state-level SCC 231101000 versus 2310020000
proportions 31100199 Industrial Processes Building Construction Construction: Building Contractors Other Not Classified See Table II-2 for state-level SCC
231101000 versus 2310020000 proportions
31100201 Industrial Processes Building Construction Demolitions/Special Trade Contracts
Mechanical or Explosive Dismemberment See Table II-2 for state-level SCC 231101000 versus 2310020000
proportions 31100202 Industrial Processes Building Construction Demolitions/Special Trade
Contracts Mechanical or Explosive Dismemberment See Table II-2 for state-level SCC
231101000 versus 2310020000 proportions
31100205 Industrial Processes Building Construction Demolitions/Special Trade Contracts
On-site Truck Traffic See Table II-2 for state-level SCC 231101000 versus 2310020000
proportions 31100206 Industrial Processes Building Construction Demolitions/Special Trade
Contracts On-site Truck Traffic See Table II-2 for state-level SCC
231101000 versus 2310020000 proportions
31100299 Industrial Processes Building Construction Demolitions/Special Trade Contracts
Other Not Classified: Construction/Demolition See Table II-2 for state-level SCC 231101000 versus 2310020000
proportions
Appendix A - 226 Kentucky Regional Haze 5-Year Periodic Report SIP Revision, September 2014
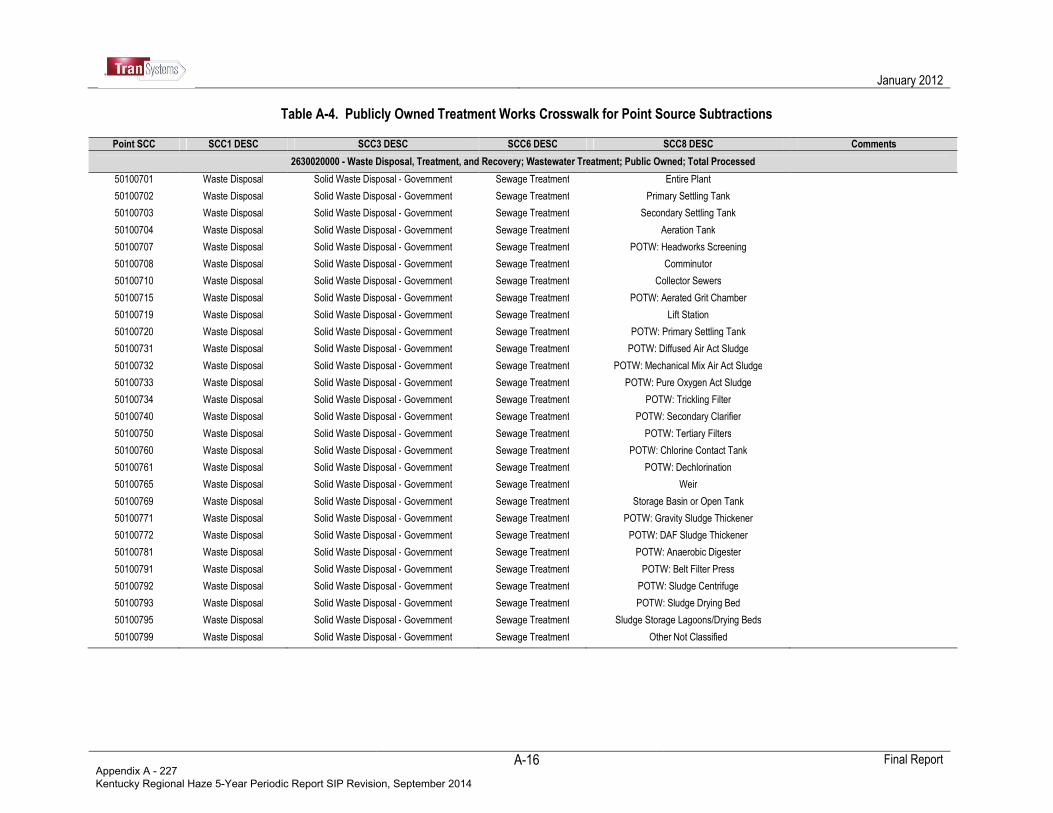
January 2012
Final Report
A-16
Table A-4. Publicly Owned Treatment Works Crosswalk for Point Source Subtractions
Point SCC SCC1 DESC SCC3 DESC SCC6 DESC SCC8 DESC Comments
2630020000 - Waste Disposal, Treatment, and Recovery; Wastewater Treatment; Public Owned; Total Processed
50100701 Waste Disposal Solid Waste Disposal - Government Sewage Treatment Entire Plant
50100702 Waste Disposal Solid Waste Disposal - Government Sewage Treatment Primary Settling Tank
50100703 Waste Disposal Solid Waste Disposal - Government Sewage Treatment Secondary Settling Tank
50100704 Waste Disposal Solid Waste Disposal - Government Sewage Treatment Aeration Tank
50100707 Waste Disposal Solid Waste Disposal - Government Sewage Treatment POTW: Headworks Screening
50100708 Waste Disposal Solid Waste Disposal - Government Sewage Treatment Comminutor
50100710 Waste Disposal Solid Waste Disposal - Government Sewage Treatment Collector Sewers
50100715 Waste Disposal Solid Waste Disposal - Government Sewage Treatment POTW: Aerated Grit Chamber
50100719 Waste Disposal Solid Waste Disposal - Government Sewage Treatment Lift Station
50100720 Waste Disposal Solid Waste Disposal - Government Sewage Treatment POTW: Primary Settling Tank
50100731 Waste Disposal Solid Waste Disposal - Government Sewage Treatment POTW: Diffused Air Act Sludge
50100732 Waste Disposal Solid Waste Disposal - Government Sewage Treatment POTW: Mechanical Mix Air Act Sludge
50100733 Waste Disposal Solid Waste Disposal - Government Sewage Treatment POTW: Pure Oxygen Act Sludge
50100734 Waste Disposal Solid Waste Disposal - Government Sewage Treatment POTW: Trickling Filter
50100740 Waste Disposal Solid Waste Disposal - Government Sewage Treatment POTW: Secondary Clarifier
50100750 Waste Disposal Solid Waste Disposal - Government Sewage Treatment POTW: Tertiary Filters
50100760 Waste Disposal Solid Waste Disposal - Government Sewage Treatment POTW: Chlorine Contact Tank
50100761 Waste Disposal Solid Waste Disposal - Government Sewage Treatment POTW: Dechlorination
50100765 Waste Disposal Solid Waste Disposal - Government Sewage Treatment Weir
50100769 Waste Disposal Solid Waste Disposal - Government Sewage Treatment Storage Basin or Open Tank
50100771 Waste Disposal Solid Waste Disposal - Government Sewage Treatment POTW: Gravity Sludge Thickener
50100772 Waste Disposal Solid Waste Disposal - Government Sewage Treatment POTW: DAF Sludge Thickener
50100781 Waste Disposal Solid Waste Disposal - Government Sewage Treatment POTW: Anaerobic Digester
50100791 Waste Disposal Solid Waste Disposal - Government Sewage Treatment POTW: Belt Filter Press
50100792 Waste Disposal Solid Waste Disposal - Government Sewage Treatment POTW: Sludge Centrifuge
50100793 Waste Disposal Solid Waste Disposal - Government Sewage Treatment POTW: Sludge Drying Bed
50100795 Waste Disposal Solid Waste Disposal - Government Sewage Treatment Sludge Storage Lagoons/Drying Beds
50100799 Waste Disposal Solid Waste Disposal - Government Sewage Treatment Other Not Classified
Appendix A - 227 Kentucky Regional Haze 5-Year Periodic Report SIP Revision, September 2014
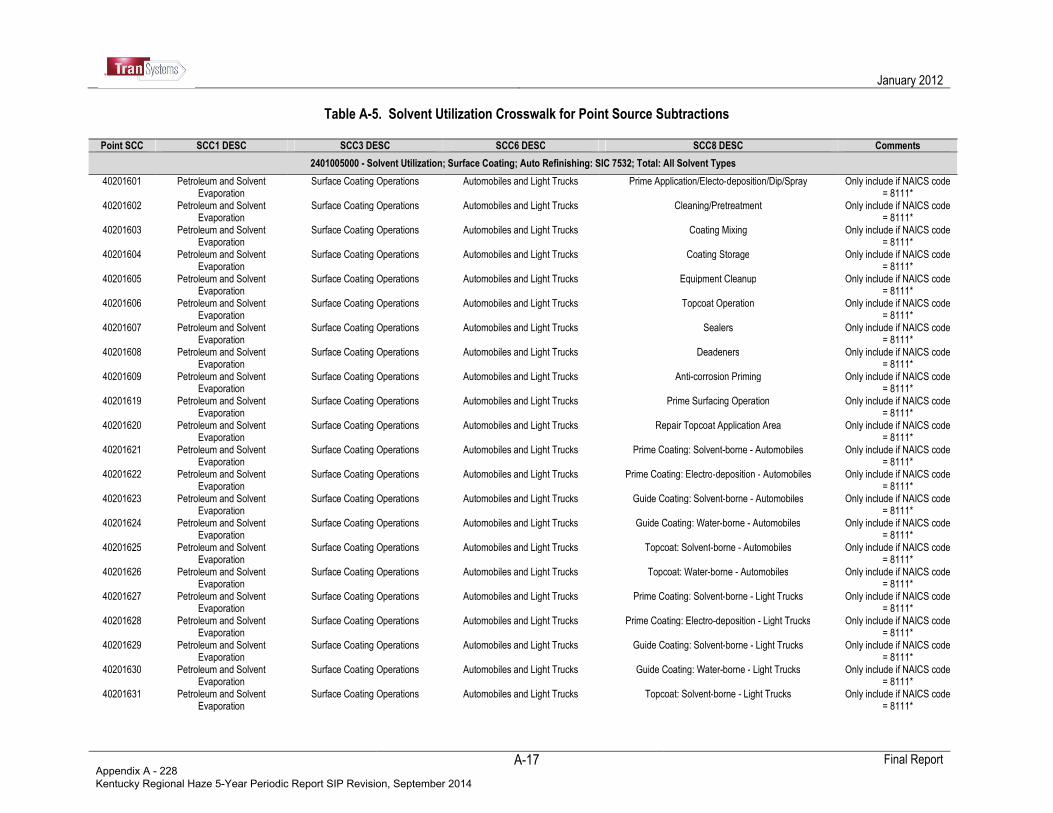
January 2012
Final Report
A-17
Table A-5. Solvent Utilization Crosswalk for Point Source Subtractions Point SCC SCC1 DESC SCC3 DESC SCC6 DESC SCC8 DESC Comments
2401005000 - Solvent Utilization; Surface Coating; Auto Refinishing: SIC 7532; Total: All Solvent Types
40201601 Petroleum and Solvent Evaporation
Surface Coating Operations Automobiles and Light Trucks Prime Application/Electo-deposition/Dip/Spray Only include if NAICS code = 8111*
40201602 Petroleum and Solvent Evaporation
Surface Coating Operations Automobiles and Light Trucks Cleaning/Pretreatment Only include if NAICS code = 8111*
40201603 Petroleum and Solvent Evaporation
Surface Coating Operations Automobiles and Light Trucks Coating Mixing Only include if NAICS code = 8111*
40201604 Petroleum and Solvent Evaporation
Surface Coating Operations Automobiles and Light Trucks Coating Storage Only include if NAICS code = 8111*
40201605 Petroleum and Solvent Evaporation
Surface Coating Operations Automobiles and Light Trucks Equipment Cleanup Only include if NAICS code = 8111*
40201606 Petroleum and Solvent Evaporation
Surface Coating Operations Automobiles and Light Trucks Topcoat Operation Only include if NAICS code = 8111*
40201607 Petroleum and Solvent Evaporation
Surface Coating Operations Automobiles and Light Trucks Sealers Only include if NAICS code = 8111*
40201608 Petroleum and Solvent Evaporation
Surface Coating Operations Automobiles and Light Trucks Deadeners Only include if NAICS code = 8111*
40201609 Petroleum and Solvent Evaporation
Surface Coating Operations Automobiles and Light Trucks Anti-corrosion Priming Only include if NAICS code = 8111*
40201619 Petroleum and Solvent Evaporation
Surface Coating Operations Automobiles and Light Trucks Prime Surfacing Operation Only include if NAICS code = 8111*
40201620 Petroleum and Solvent Evaporation
Surface Coating Operations Automobiles and Light Trucks Repair Topcoat Application Area Only include if NAICS code = 8111*
40201621 Petroleum and Solvent Evaporation
Surface Coating Operations Automobiles and Light Trucks Prime Coating: Solvent-borne - Automobiles Only include if NAICS code = 8111*
40201622 Petroleum and Solvent Evaporation
Surface Coating Operations Automobiles and Light Trucks Prime Coating: Electro-deposition - Automobiles Only include if NAICS code = 8111*
40201623 Petroleum and Solvent Evaporation
Surface Coating Operations Automobiles and Light Trucks Guide Coating: Solvent-borne - Automobiles Only include if NAICS code = 8111*
40201624 Petroleum and Solvent Evaporation
Surface Coating Operations Automobiles and Light Trucks Guide Coating: Water-borne - Automobiles Only include if NAICS code = 8111*
40201625 Petroleum and Solvent Evaporation
Surface Coating Operations Automobiles and Light Trucks Topcoat: Solvent-borne - Automobiles Only include if NAICS code = 8111*
40201626 Petroleum and Solvent Evaporation
Surface Coating Operations Automobiles and Light Trucks Topcoat: Water-borne - Automobiles Only include if NAICS code = 8111*
40201627 Petroleum and Solvent Evaporation
Surface Coating Operations Automobiles and Light Trucks Prime Coating: Solvent-borne - Light Trucks Only include if NAICS code = 8111*
40201628 Petroleum and Solvent Evaporation
Surface Coating Operations Automobiles and Light Trucks Prime Coating: Electro-deposition - Light Trucks Only include if NAICS code = 8111*
40201629 Petroleum and Solvent Evaporation
Surface Coating Operations Automobiles and Light Trucks Guide Coating: Solvent-borne - Light Trucks Only include if NAICS code = 8111*
40201630 Petroleum and Solvent Evaporation
Surface Coating Operations Automobiles and Light Trucks Guide Coating: Water-borne - Light Trucks Only include if NAICS code = 8111*
40201631 Petroleum and Solvent Evaporation
Surface Coating Operations Automobiles and Light Trucks Topcoat: Solvent-borne - Light Trucks Only include if NAICS code = 8111*
Appendix A - 228 Kentucky Regional Haze 5-Year Periodic Report SIP Revision, September 2014
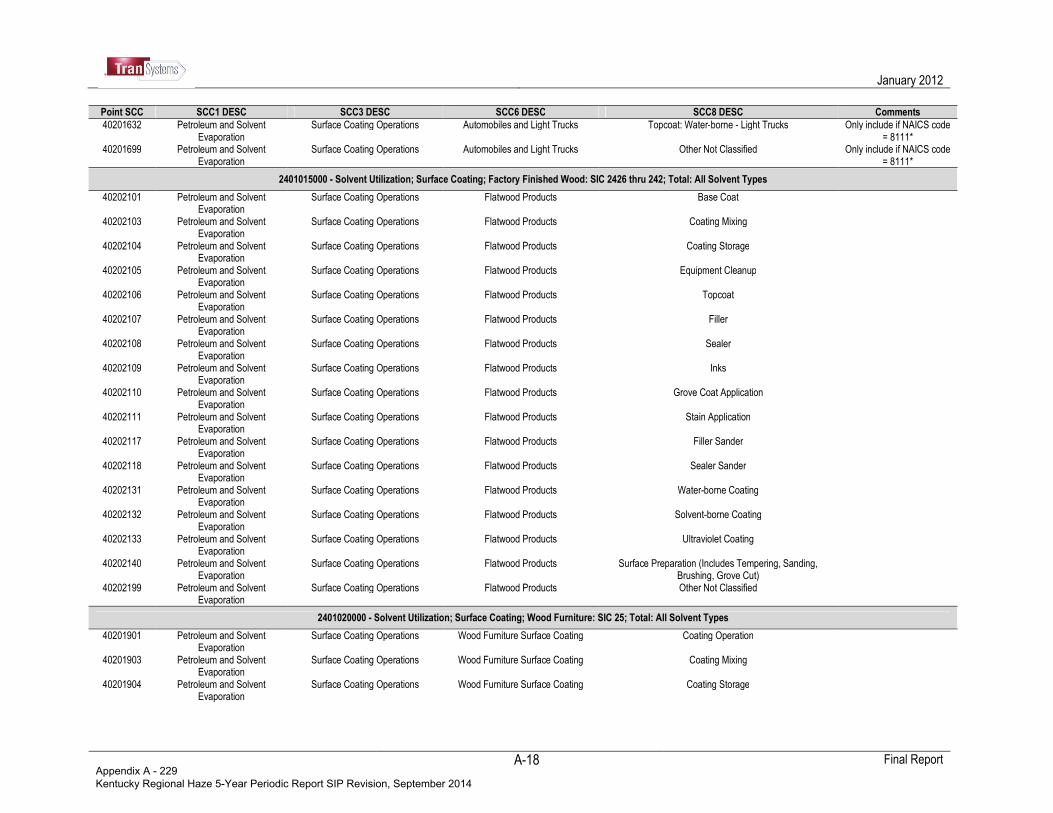
January 2012
Final Report
A-18
Point SCC SCC1 DESC SCC3 DESC SCC6 DESC SCC8 DESC Comments
40201632 Petroleum and Solvent Evaporation
Surface Coating Operations Automobiles and Light Trucks Topcoat: Water-borne - Light Trucks Only include if NAICS code = 8111*
40201699 Petroleum and Solvent Evaporation
Surface Coating Operations Automobiles and Light Trucks Other Not Classified Only include if NAICS code = 8111*
2401015000 - Solvent Utilization; Surface Coating; Factory Finished Wood: SIC 2426 thru 242; Total: All Solvent Types
40202101 Petroleum and Solvent Evaporation
Surface Coating Operations Flatwood Products Base Coat
40202103 Petroleum and Solvent Evaporation
Surface Coating Operations Flatwood Products Coating Mixing
40202104 Petroleum and Solvent Evaporation
Surface Coating Operations Flatwood Products Coating Storage
40202105 Petroleum and Solvent Evaporation
Surface Coating Operations Flatwood Products Equipment Cleanup
40202106 Petroleum and Solvent Evaporation
Surface Coating Operations Flatwood Products Topcoat
40202107 Petroleum and Solvent Evaporation
Surface Coating Operations Flatwood Products Filler
40202108 Petroleum and Solvent Evaporation
Surface Coating Operations Flatwood Products Sealer
40202109 Petroleum and Solvent Evaporation
Surface Coating Operations Flatwood Products Inks
40202110 Petroleum and Solvent Evaporation
Surface Coating Operations Flatwood Products Grove Coat Application
40202111 Petroleum and Solvent Evaporation
Surface Coating Operations Flatwood Products Stain Application
40202117 Petroleum and Solvent Evaporation
Surface Coating Operations Flatwood Products Filler Sander
40202118 Petroleum and Solvent Evaporation
Surface Coating Operations Flatwood Products Sealer Sander
40202131 Petroleum and Solvent Evaporation
Surface Coating Operations Flatwood Products Water-borne Coating
40202132 Petroleum and Solvent Evaporation
Surface Coating Operations Flatwood Products Solvent-borne Coating
40202133 Petroleum and Solvent Evaporation
Surface Coating Operations Flatwood Products Ultraviolet Coating
40202140 Petroleum and Solvent Evaporation
Surface Coating Operations Flatwood Products Surface Preparation (Includes Tempering, Sanding, Brushing, Grove Cut)
40202199 Petroleum and Solvent Evaporation
Surface Coating Operations Flatwood Products Other Not Classified
2401020000 - Solvent Utilization; Surface Coating; Wood Furniture: SIC 25; Total: All Solvent Types
40201901 Petroleum and Solvent Evaporation
Surface Coating Operations Wood Furniture Surface Coating Coating Operation
40201903 Petroleum and Solvent Evaporation
Surface Coating Operations Wood Furniture Surface Coating Coating Mixing
40201904 Petroleum and Solvent Evaporation
Surface Coating Operations Wood Furniture Surface Coating Coating Storage
Appendix A - 229 Kentucky Regional Haze 5-Year Periodic Report SIP Revision, September 2014
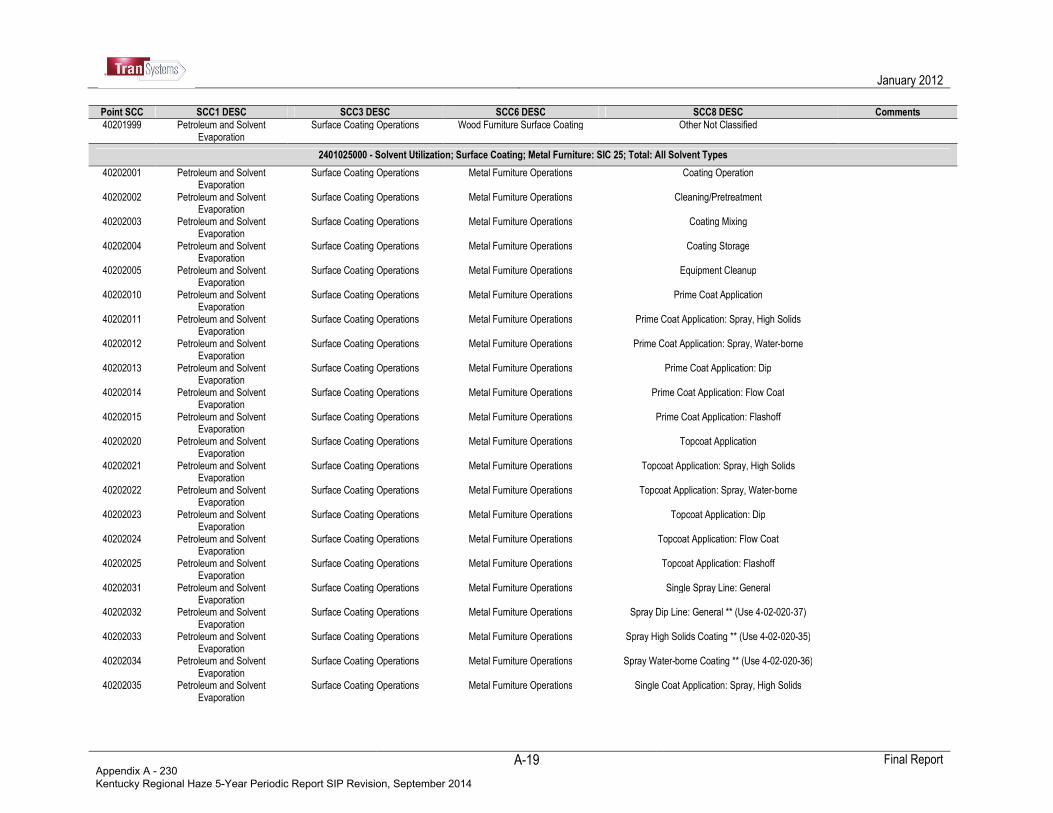
January 2012
Final Report
A-19
Point SCC SCC1 DESC SCC3 DESC SCC6 DESC SCC8 DESC Comments
40201999 Petroleum and Solvent Evaporation
Surface Coating Operations Wood Furniture Surface Coating Other Not Classified
2401025000 - Solvent Utilization; Surface Coating; Metal Furniture: SIC 25; Total: All Solvent Types
40202001 Petroleum and Solvent Evaporation
Surface Coating Operations Metal Furniture Operations Coating Operation
40202002 Petroleum and Solvent Evaporation
Surface Coating Operations Metal Furniture Operations Cleaning/Pretreatment
40202003 Petroleum and Solvent Evaporation
Surface Coating Operations Metal Furniture Operations Coating Mixing
40202004 Petroleum and Solvent Evaporation
Surface Coating Operations Metal Furniture Operations Coating Storage
40202005 Petroleum and Solvent Evaporation
Surface Coating Operations Metal Furniture Operations Equipment Cleanup
40202010 Petroleum and Solvent Evaporation
Surface Coating Operations Metal Furniture Operations Prime Coat Application
40202011 Petroleum and Solvent Evaporation
Surface Coating Operations Metal Furniture Operations Prime Coat Application: Spray, High Solids
40202012 Petroleum and Solvent Evaporation
Surface Coating Operations Metal Furniture Operations Prime Coat Application: Spray, Water-borne
40202013 Petroleum and Solvent Evaporation
Surface Coating Operations Metal Furniture Operations Prime Coat Application: Dip
40202014 Petroleum and Solvent Evaporation
Surface Coating Operations Metal Furniture Operations Prime Coat Application: Flow Coat
40202015 Petroleum and Solvent Evaporation
Surface Coating Operations Metal Furniture Operations Prime Coat Application: Flashoff
40202020 Petroleum and Solvent Evaporation
Surface Coating Operations Metal Furniture Operations Topcoat Application
40202021 Petroleum and Solvent Evaporation
Surface Coating Operations Metal Furniture Operations Topcoat Application: Spray, High Solids
40202022 Petroleum and Solvent Evaporation
Surface Coating Operations Metal Furniture Operations Topcoat Application: Spray, Water-borne
40202023 Petroleum and Solvent Evaporation
Surface Coating Operations Metal Furniture Operations Topcoat Application: Dip
40202024 Petroleum and Solvent Evaporation
Surface Coating Operations Metal Furniture Operations Topcoat Application: Flow Coat
40202025 Petroleum and Solvent Evaporation
Surface Coating Operations Metal Furniture Operations Topcoat Application: Flashoff
40202031 Petroleum and Solvent Evaporation
Surface Coating Operations Metal Furniture Operations Single Spray Line: General
40202032 Petroleum and Solvent Evaporation
Surface Coating Operations Metal Furniture Operations Spray Dip Line: General ** (Use 4-02-020-37)
40202033 Petroleum and Solvent Evaporation
Surface Coating Operations Metal Furniture Operations Spray High Solids Coating ** (Use 4-02-020-35)
40202034 Petroleum and Solvent Evaporation
Surface Coating Operations Metal Furniture Operations Spray Water-borne Coating ** (Use 4-02-020-36)
40202035 Petroleum and Solvent Evaporation
Surface Coating Operations Metal Furniture Operations Single Coat Application: Spray, High Solids
Appendix A - 230 Kentucky Regional Haze 5-Year Periodic Report SIP Revision, September 2014
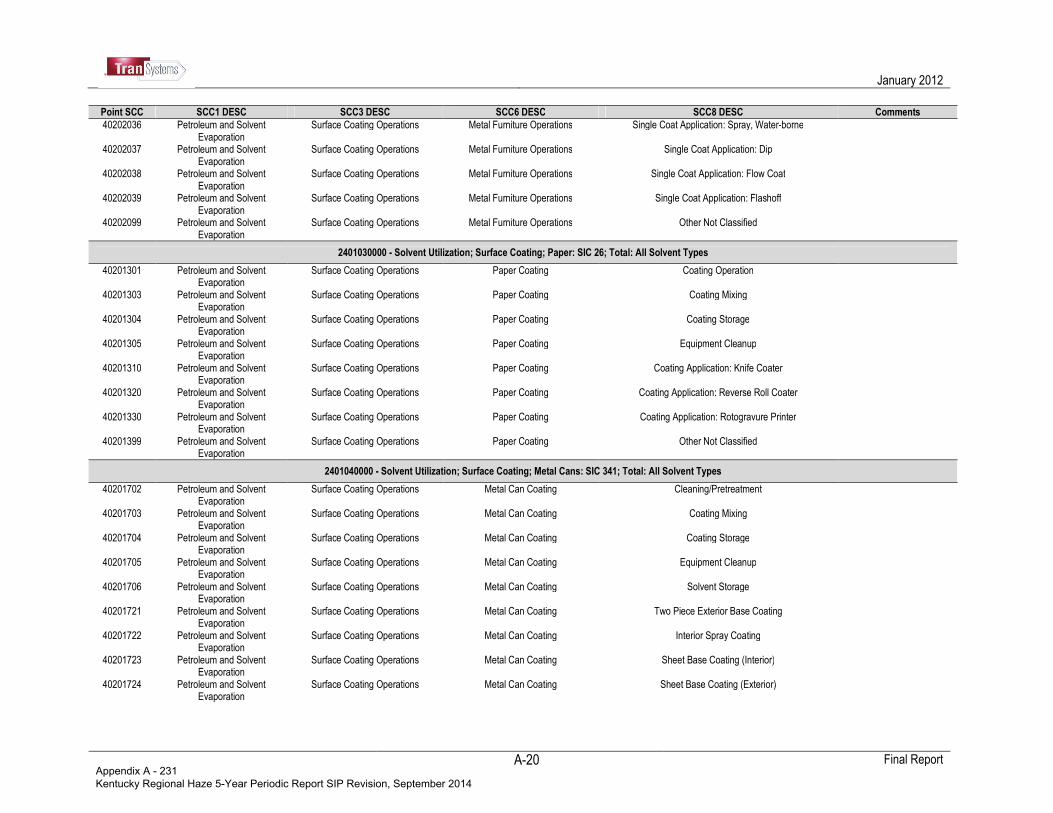
January 2012
Final Report
A-20
Point SCC SCC1 DESC SCC3 DESC SCC6 DESC SCC8 DESC Comments
40202036 Petroleum and Solvent Evaporation
Surface Coating Operations Metal Furniture Operations Single Coat Application: Spray, Water-borne
40202037 Petroleum and Solvent Evaporation
Surface Coating Operations Metal Furniture Operations Single Coat Application: Dip
40202038 Petroleum and Solvent Evaporation
Surface Coating Operations Metal Furniture Operations Single Coat Application: Flow Coat
40202039 Petroleum and Solvent Evaporation
Surface Coating Operations Metal Furniture Operations Single Coat Application: Flashoff
40202099 Petroleum and Solvent Evaporation
Surface Coating Operations Metal Furniture Operations Other Not Classified
2401030000 - Solvent Utilization; Surface Coating; Paper: SIC 26; Total: All Solvent Types
40201301 Petroleum and Solvent Evaporation
Surface Coating Operations Paper Coating Coating Operation
40201303 Petroleum and Solvent Evaporation
Surface Coating Operations Paper Coating Coating Mixing
40201304 Petroleum and Solvent Evaporation
Surface Coating Operations Paper Coating Coating Storage
40201305 Petroleum and Solvent Evaporation
Surface Coating Operations Paper Coating Equipment Cleanup
40201310 Petroleum and Solvent Evaporation
Surface Coating Operations Paper Coating Coating Application: Knife Coater
40201320 Petroleum and Solvent Evaporation
Surface Coating Operations Paper Coating Coating Application: Reverse Roll Coater
40201330 Petroleum and Solvent Evaporation
Surface Coating Operations Paper Coating Coating Application: Rotogravure Printer
40201399 Petroleum and Solvent Evaporation
Surface Coating Operations Paper Coating Other Not Classified
2401040000 - Solvent Utilization; Surface Coating; Metal Cans: SIC 341; Total: All Solvent Types
40201702 Petroleum and Solvent Evaporation
Surface Coating Operations Metal Can Coating Cleaning/Pretreatment
40201703 Petroleum and Solvent Evaporation
Surface Coating Operations Metal Can Coating Coating Mixing
40201704 Petroleum and Solvent Evaporation
Surface Coating Operations Metal Can Coating Coating Storage
40201705 Petroleum and Solvent Evaporation
Surface Coating Operations Metal Can Coating Equipment Cleanup
40201706 Petroleum and Solvent Evaporation
Surface Coating Operations Metal Can Coating Solvent Storage
40201721 Petroleum and Solvent Evaporation
Surface Coating Operations Metal Can Coating Two Piece Exterior Base Coating
40201722 Petroleum and Solvent Evaporation
Surface Coating Operations Metal Can Coating Interior Spray Coating
40201723 Petroleum and Solvent Evaporation
Surface Coating Operations Metal Can Coating Sheet Base Coating (Interior)
40201724 Petroleum and Solvent Evaporation
Surface Coating Operations Metal Can Coating Sheet Base Coating (Exterior)
Appendix A - 231 Kentucky Regional Haze 5-Year Periodic Report SIP Revision, September 2014
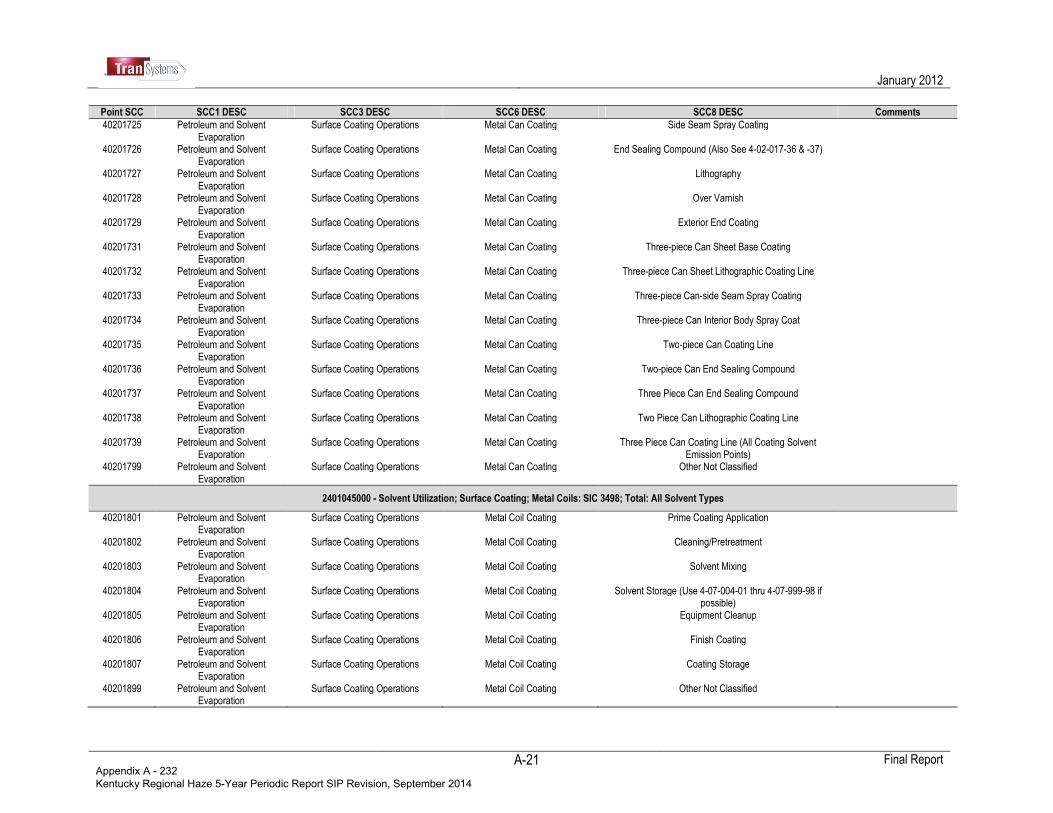
January 2012
Final Report
A-21
Point SCC SCC1 DESC SCC3 DESC SCC6 DESC SCC8 DESC Comments
40201725 Petroleum and Solvent Evaporation
Surface Coating Operations Metal Can Coating Side Seam Spray Coating
40201726 Petroleum and Solvent Evaporation
Surface Coating Operations Metal Can Coating End Sealing Compound (Also See 4-02-017-36 & -37)
40201727 Petroleum and Solvent Evaporation
Surface Coating Operations Metal Can Coating Lithography
40201728 Petroleum and Solvent Evaporation
Surface Coating Operations Metal Can Coating Over Varnish
40201729 Petroleum and Solvent Evaporation
Surface Coating Operations Metal Can Coating Exterior End Coating
40201731 Petroleum and Solvent Evaporation
Surface Coating Operations Metal Can Coating Three-piece Can Sheet Base Coating
40201732 Petroleum and Solvent Evaporation
Surface Coating Operations Metal Can Coating Three-piece Can Sheet Lithographic Coating Line
40201733 Petroleum and Solvent Evaporation
Surface Coating Operations Metal Can Coating Three-piece Can-side Seam Spray Coating
40201734 Petroleum and Solvent Evaporation
Surface Coating Operations Metal Can Coating Three-piece Can Interior Body Spray Coat
40201735 Petroleum and Solvent Evaporation
Surface Coating Operations Metal Can Coating Two-piece Can Coating Line
40201736 Petroleum and Solvent Evaporation
Surface Coating Operations Metal Can Coating Two-piece Can End Sealing Compound
40201737 Petroleum and Solvent Evaporation
Surface Coating Operations Metal Can Coating Three Piece Can End Sealing Compound
40201738 Petroleum and Solvent Evaporation
Surface Coating Operations Metal Can Coating Two Piece Can Lithographic Coating Line
40201739 Petroleum and Solvent Evaporation
Surface Coating Operations Metal Can Coating Three Piece Can Coating Line (All Coating Solvent Emission Points)
40201799 Petroleum and Solvent Evaporation
Surface Coating Operations Metal Can Coating Other Not Classified
2401045000 - Solvent Utilization; Surface Coating; Metal Coils: SIC 3498; Total: All Solvent Types
40201801 Petroleum and Solvent Evaporation
Surface Coating Operations Metal Coil Coating Prime Coating Application
40201802 Petroleum and Solvent Evaporation
Surface Coating Operations Metal Coil Coating Cleaning/Pretreatment
40201803 Petroleum and Solvent Evaporation
Surface Coating Operations Metal Coil Coating Solvent Mixing
40201804 Petroleum and Solvent Evaporation
Surface Coating Operations Metal Coil Coating Solvent Storage (Use 4-07-004-01 thru 4-07-999-98 if possible)
40201805 Petroleum and Solvent Evaporation
Surface Coating Operations Metal Coil Coating Equipment Cleanup
40201806 Petroleum and Solvent Evaporation
Surface Coating Operations Metal Coil Coating Finish Coating
40201807 Petroleum and Solvent Evaporation
Surface Coating Operations Metal Coil Coating Coating Storage
40201899 Petroleum and Solvent Evaporation
Surface Coating Operations Metal Coil Coating Other Not Classified
Appendix A - 232 Kentucky Regional Haze 5-Year Periodic Report SIP Revision, September 2014

January 2012
Final Report
A-22
Point SCC SCC1 DESC SCC3 DESC SCC6 DESC SCC8 DESC Comments
2401055000 - Solvent Utilization; Surface Coating; Machinery and Equipment: SIC 35; Total: All Solvent Types
40202501 Petroleum and Solvent Evaporation
Surface Coating Operations Miscellaneous Metal Parts Coating Operation
40202502 Petroleum and Solvent Evaporation
Surface Coating Operations Miscellaneous Metal Parts Cleaning/Pretreatment
40202503 Petroleum and Solvent Evaporation
Surface Coating Operations Miscellaneous Metal Parts Coating Mixing
40202504 Petroleum and Solvent Evaporation
Surface Coating Operations Miscellaneous Metal Parts Coating Storage
40202505 Petroleum and Solvent Evaporation
Surface Coating Operations Miscellaneous Metal Parts Equipment Cleanup
40202510 Petroleum and Solvent Evaporation
Surface Coating Operations Miscellaneous Metal Parts Prime Coat Application
40202511 Petroleum and Solvent Evaporation
Surface Coating Operations Miscellaneous Metal Parts Prime Coat Application: Spray, High Solids
40202512 Petroleum and Solvent Evaporation
Surface Coating Operations Miscellaneous Metal Parts Prime Coat Application: Spray, Water-borne
40202515 Petroleum and Solvent Evaporation
Surface Coating Operations Miscellaneous Metal Parts Prime Coat Application: Flashoff
40202520 Petroleum and Solvent Evaporation
Surface Coating Operations Miscellaneous Metal Parts Topcoat Application
40202521 Petroleum and Solvent Evaporation
Surface Coating Operations Miscellaneous Metal Parts Topcoat Application: Spray, High Solids
40202522 Petroleum and Solvent Evaporation
Surface Coating Operations Miscellaneous Metal Parts Topcoat Application: Spray, Water-borne
40202523 Petroleum and Solvent Evaporation
Surface Coating Operations Miscellaneous Metal Parts Topcoat Application: Dip
40202524 Petroleum and Solvent Evaporation
Surface Coating Operations Miscellaneous Metal Parts Topcoat Application: Flow Coat
40202525 Petroleum and Solvent Evaporation
Surface Coating Operations Miscellaneous Metal Parts Topcoat Application: Flashoff
40202531 Petroleum and Solvent Evaporation
Surface Coating Operations Miscellaneous Metal Parts Conveyor Single Flow
40202532 Petroleum and Solvent Evaporation
Surface Coating Operations Miscellaneous Metal Parts Conveyor Single Dip
40202533 Petroleum and Solvent Evaporation
Surface Coating Operations Miscellaneous Metal Parts Conveyor Single Spray
40202534 Petroleum and Solvent Evaporation
Surface Coating Operations Miscellaneous Metal Parts Conveyor Two Coat, Flow and Spray
40202535 Petroleum and Solvent Evaporation
Surface Coating Operations Miscellaneous Metal Parts Conveyor Two Coat, Dip and Spray
40202536 Petroleum and Solvent Evaporation
Surface Coating Operations Miscellaneous Metal Parts Conveyor Two Coat, Spray
40202537 Petroleum and Solvent Evaporation
Surface Coating Operations Miscellaneous Metal Parts Manual Two Coat, Spray and Air Dry
40202542 Petroleum and Solvent Evaporation
Surface Coating Operations Miscellaneous Metal Parts Single Coat Application: Spray, High Solids
Appendix A - 233 Kentucky Regional Haze 5-Year Periodic Report SIP Revision, September 2014
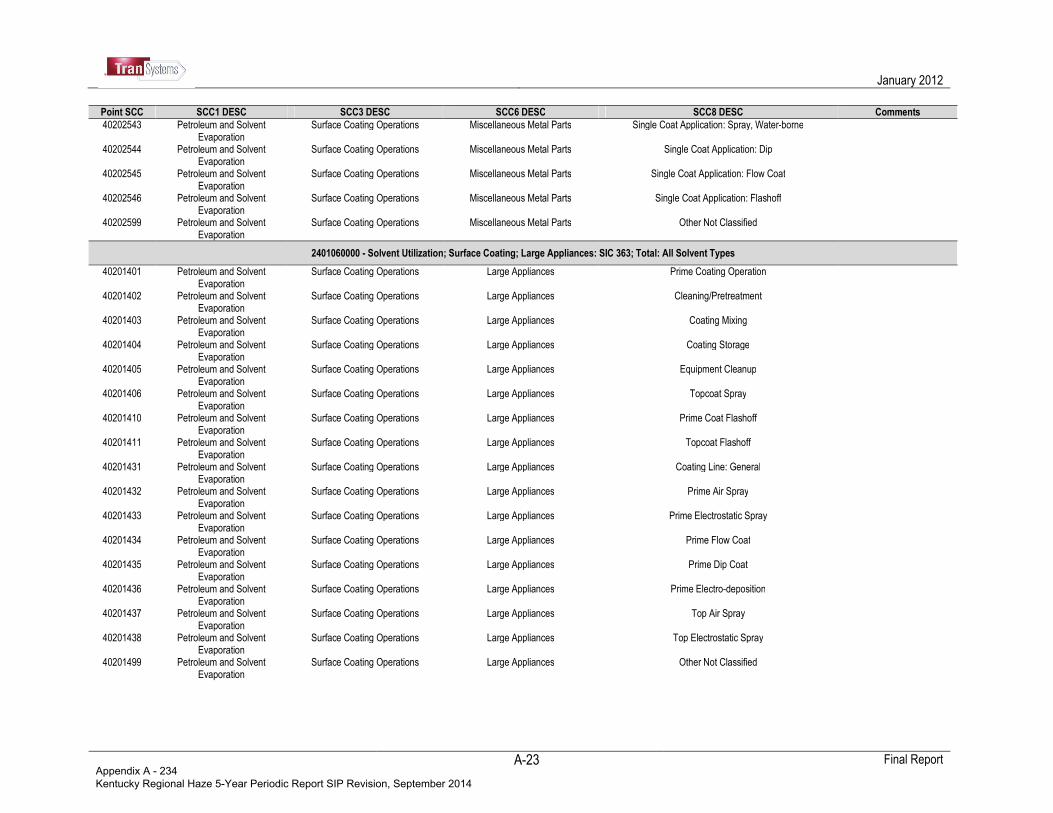
January 2012
Final Report
A-23
Point SCC SCC1 DESC SCC3 DESC SCC6 DESC SCC8 DESC Comments
40202543 Petroleum and Solvent Evaporation
Surface Coating Operations Miscellaneous Metal Parts Single Coat Application: Spray, Water-borne
40202544 Petroleum and Solvent Evaporation
Surface Coating Operations Miscellaneous Metal Parts Single Coat Application: Dip
40202545 Petroleum and Solvent Evaporation
Surface Coating Operations Miscellaneous Metal Parts Single Coat Application: Flow Coat
40202546 Petroleum and Solvent Evaporation
Surface Coating Operations Miscellaneous Metal Parts Single Coat Application: Flashoff
40202599 Petroleum and Solvent Evaporation
Surface Coating Operations Miscellaneous Metal Parts Other Not Classified
2401060000 - Solvent Utilization; Surface Coating; Large Appliances: SIC 363; Total: All Solvent Types
40201401 Petroleum and Solvent Evaporation
Surface Coating Operations Large Appliances Prime Coating Operation
40201402 Petroleum and Solvent Evaporation
Surface Coating Operations Large Appliances Cleaning/Pretreatment
40201403 Petroleum and Solvent Evaporation
Surface Coating Operations Large Appliances Coating Mixing
40201404 Petroleum and Solvent Evaporation
Surface Coating Operations Large Appliances Coating Storage
40201405 Petroleum and Solvent Evaporation
Surface Coating Operations Large Appliances Equipment Cleanup
40201406 Petroleum and Solvent Evaporation
Surface Coating Operations Large Appliances Topcoat Spray
40201410 Petroleum and Solvent Evaporation
Surface Coating Operations Large Appliances Prime Coat Flashoff
40201411 Petroleum and Solvent Evaporation
Surface Coating Operations Large Appliances Topcoat Flashoff
40201431 Petroleum and Solvent Evaporation
Surface Coating Operations Large Appliances Coating Line: General
40201432 Petroleum and Solvent Evaporation
Surface Coating Operations Large Appliances Prime Air Spray
40201433 Petroleum and Solvent Evaporation
Surface Coating Operations Large Appliances Prime Electrostatic Spray
40201434 Petroleum and Solvent Evaporation
Surface Coating Operations Large Appliances Prime Flow Coat
40201435 Petroleum and Solvent Evaporation
Surface Coating Operations Large Appliances Prime Dip Coat
40201436 Petroleum and Solvent Evaporation
Surface Coating Operations Large Appliances Prime Electro-deposition
40201437 Petroleum and Solvent Evaporation
Surface Coating Operations Large Appliances Top Air Spray
40201438 Petroleum and Solvent Evaporation
Surface Coating Operations Large Appliances Top Electrostatic Spray
40201499 Petroleum and Solvent Evaporation
Surface Coating Operations Large Appliances Other Not Classified
Appendix A - 234 Kentucky Regional Haze 5-Year Periodic Report SIP Revision, September 2014
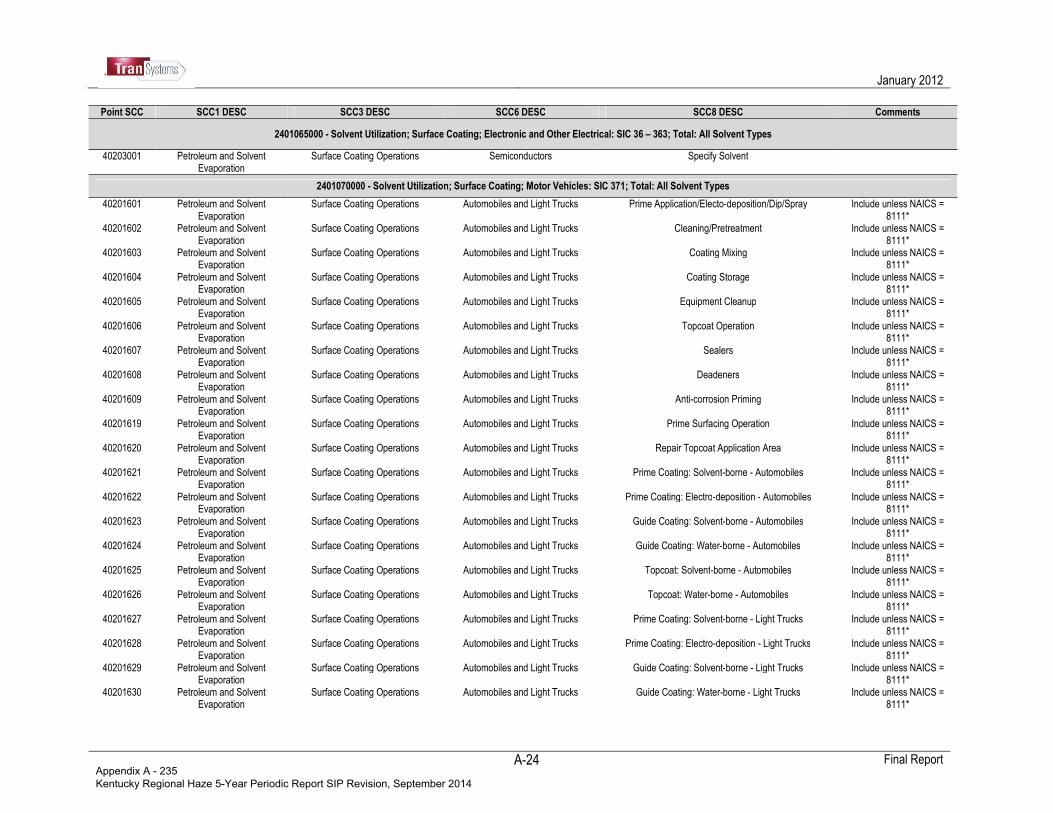
January 2012
Final Report
A-24
Point SCC SCC1 DESC SCC3 DESC SCC6 DESC SCC8 DESC Comments
2401065000 - Solvent Utilization; Surface Coating; Electronic and Other Electrical: SIC 36 – 363; Total: All Solvent Types
40203001 Petroleum and Solvent Evaporation
Surface Coating Operations Semiconductors Specify Solvent
2401070000 - Solvent Utilization; Surface Coating; Motor Vehicles: SIC 371; Total: All Solvent Types
40201601 Petroleum and Solvent Evaporation
Surface Coating Operations Automobiles and Light Trucks Prime Application/Electo-deposition/Dip/Spray Include unless NAICS = 8111*
40201602 Petroleum and Solvent Evaporation
Surface Coating Operations Automobiles and Light Trucks Cleaning/Pretreatment Include unless NAICS = 8111*
40201603 Petroleum and Solvent Evaporation
Surface Coating Operations Automobiles and Light Trucks Coating Mixing Include unless NAICS = 8111*
40201604 Petroleum and Solvent Evaporation
Surface Coating Operations Automobiles and Light Trucks Coating Storage Include unless NAICS = 8111*
40201605 Petroleum and Solvent Evaporation
Surface Coating Operations Automobiles and Light Trucks Equipment Cleanup Include unless NAICS = 8111*
40201606 Petroleum and Solvent Evaporation
Surface Coating Operations Automobiles and Light Trucks Topcoat Operation Include unless NAICS = 8111*
40201607 Petroleum and Solvent Evaporation
Surface Coating Operations Automobiles and Light Trucks Sealers Include unless NAICS = 8111*
40201608 Petroleum and Solvent Evaporation
Surface Coating Operations Automobiles and Light Trucks Deadeners Include unless NAICS = 8111*
40201609 Petroleum and Solvent Evaporation
Surface Coating Operations Automobiles and Light Trucks Anti-corrosion Priming Include unless NAICS = 8111*
40201619 Petroleum and Solvent Evaporation
Surface Coating Operations Automobiles and Light Trucks Prime Surfacing Operation Include unless NAICS = 8111*
40201620 Petroleum and Solvent Evaporation
Surface Coating Operations Automobiles and Light Trucks Repair Topcoat Application Area Include unless NAICS = 8111*
40201621 Petroleum and Solvent Evaporation
Surface Coating Operations Automobiles and Light Trucks Prime Coating: Solvent-borne - Automobiles Include unless NAICS = 8111*
40201622 Petroleum and Solvent Evaporation
Surface Coating Operations Automobiles and Light Trucks Prime Coating: Electro-deposition - Automobiles Include unless NAICS = 8111*
40201623 Petroleum and Solvent Evaporation
Surface Coating Operations Automobiles and Light Trucks Guide Coating: Solvent-borne - Automobiles Include unless NAICS = 8111*
40201624 Petroleum and Solvent Evaporation
Surface Coating Operations Automobiles and Light Trucks Guide Coating: Water-borne - Automobiles Include unless NAICS = 8111*
40201625 Petroleum and Solvent Evaporation
Surface Coating Operations Automobiles and Light Trucks Topcoat: Solvent-borne - Automobiles Include unless NAICS = 8111*
40201626 Petroleum and Solvent Evaporation
Surface Coating Operations Automobiles and Light Trucks Topcoat: Water-borne - Automobiles Include unless NAICS = 8111*
40201627 Petroleum and Solvent Evaporation
Surface Coating Operations Automobiles and Light Trucks Prime Coating: Solvent-borne - Light Trucks Include unless NAICS = 8111*
40201628 Petroleum and Solvent Evaporation
Surface Coating Operations Automobiles and Light Trucks Prime Coating: Electro-deposition - Light Trucks Include unless NAICS = 8111*
40201629 Petroleum and Solvent Evaporation
Surface Coating Operations Automobiles and Light Trucks Guide Coating: Solvent-borne - Light Trucks Include unless NAICS = 8111*
40201630 Petroleum and Solvent Evaporation
Surface Coating Operations Automobiles and Light Trucks Guide Coating: Water-borne - Light Trucks Include unless NAICS = 8111*
Appendix A - 235 Kentucky Regional Haze 5-Year Periodic Report SIP Revision, September 2014
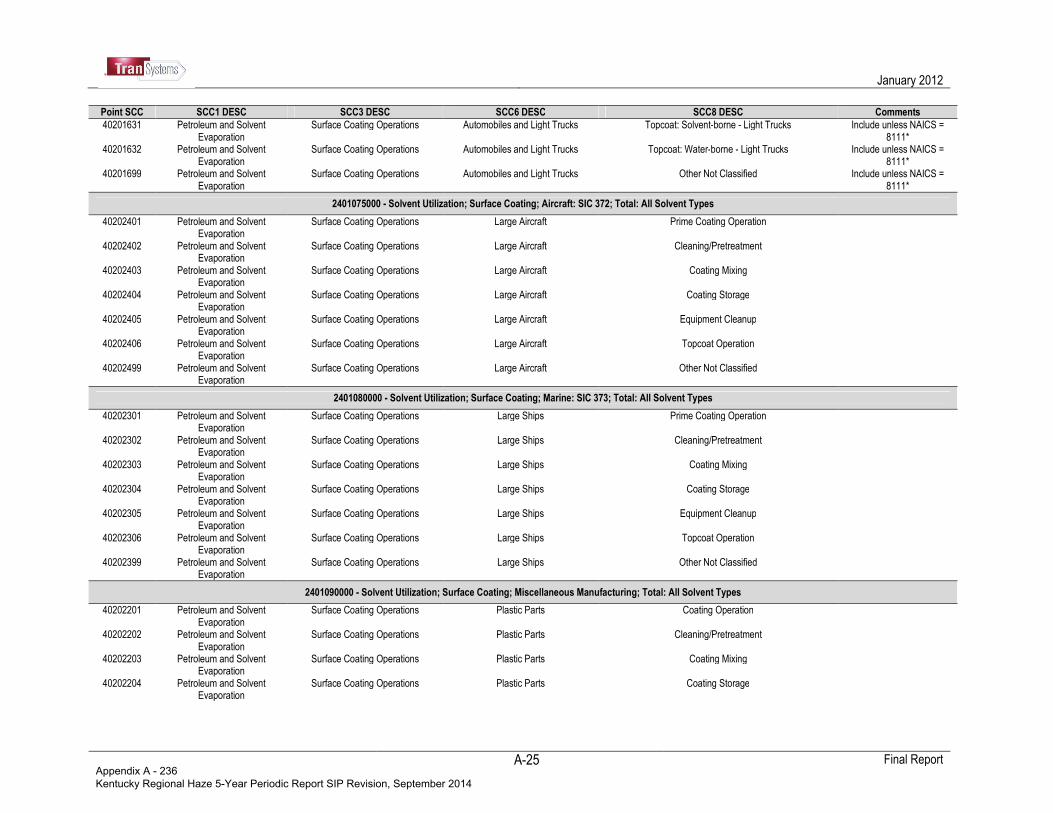
January 2012
Final Report
A-25
Point SCC SCC1 DESC SCC3 DESC SCC6 DESC SCC8 DESC Comments
40201631 Petroleum and Solvent Evaporation
Surface Coating Operations Automobiles and Light Trucks Topcoat: Solvent-borne - Light Trucks Include unless NAICS = 8111*
40201632 Petroleum and Solvent Evaporation
Surface Coating Operations Automobiles and Light Trucks Topcoat: Water-borne - Light Trucks Include unless NAICS = 8111*
40201699 Petroleum and Solvent Evaporation
Surface Coating Operations Automobiles and Light Trucks Other Not Classified Include unless NAICS = 8111*
2401075000 - Solvent Utilization; Surface Coating; Aircraft: SIC 372; Total: All Solvent Types
40202401 Petroleum and Solvent Evaporation
Surface Coating Operations Large Aircraft Prime Coating Operation
40202402 Petroleum and Solvent Evaporation
Surface Coating Operations Large Aircraft Cleaning/Pretreatment
40202403 Petroleum and Solvent Evaporation
Surface Coating Operations Large Aircraft Coating Mixing
40202404 Petroleum and Solvent Evaporation
Surface Coating Operations Large Aircraft Coating Storage
40202405 Petroleum and Solvent Evaporation
Surface Coating Operations Large Aircraft Equipment Cleanup
40202406 Petroleum and Solvent Evaporation
Surface Coating Operations Large Aircraft Topcoat Operation
40202499 Petroleum and Solvent Evaporation
Surface Coating Operations Large Aircraft Other Not Classified
2401080000 - Solvent Utilization; Surface Coating; Marine: SIC 373; Total: All Solvent Types
40202301 Petroleum and Solvent Evaporation
Surface Coating Operations Large Ships Prime Coating Operation
40202302 Petroleum and Solvent Evaporation
Surface Coating Operations Large Ships Cleaning/Pretreatment
40202303 Petroleum and Solvent Evaporation
Surface Coating Operations Large Ships Coating Mixing
40202304 Petroleum and Solvent Evaporation
Surface Coating Operations Large Ships Coating Storage
40202305 Petroleum and Solvent Evaporation
Surface Coating Operations Large Ships Equipment Cleanup
40202306 Petroleum and Solvent Evaporation
Surface Coating Operations Large Ships Topcoat Operation
40202399 Petroleum and Solvent Evaporation
Surface Coating Operations Large Ships Other Not Classified
2401090000 - Solvent Utilization; Surface Coating; Miscellaneous Manufacturing; Total: All Solvent Types
40202201 Petroleum and Solvent Evaporation
Surface Coating Operations Plastic Parts Coating Operation
40202202 Petroleum and Solvent Evaporation
Surface Coating Operations Plastic Parts Cleaning/Pretreatment
40202203 Petroleum and Solvent Evaporation
Surface Coating Operations Plastic Parts Coating Mixing
40202204 Petroleum and Solvent Evaporation
Surface Coating Operations Plastic Parts Coating Storage
Appendix A - 236 Kentucky Regional Haze 5-Year Periodic Report SIP Revision, September 2014
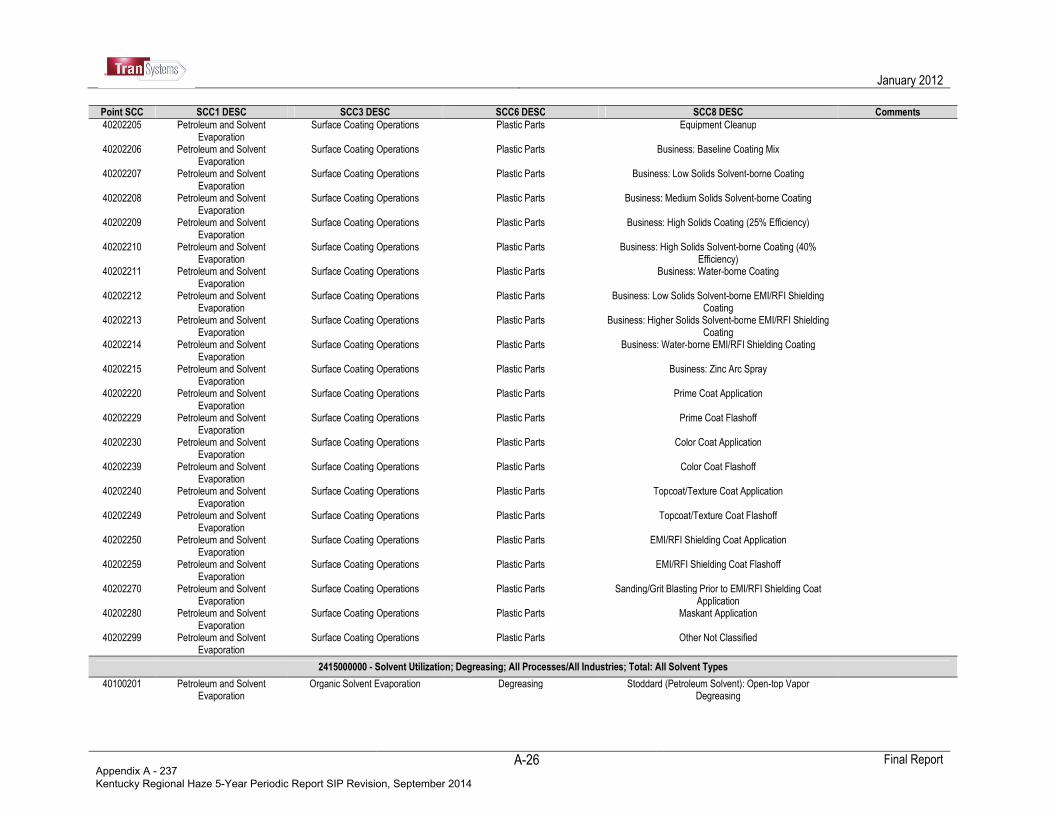
January 2012
Final Report
A-26
Point SCC SCC1 DESC SCC3 DESC SCC6 DESC SCC8 DESC Comments
40202205 Petroleum and Solvent Evaporation
Surface Coating Operations Plastic Parts Equipment Cleanup
40202206 Petroleum and Solvent Evaporation
Surface Coating Operations Plastic Parts Business: Baseline Coating Mix
40202207 Petroleum and Solvent Evaporation
Surface Coating Operations Plastic Parts Business: Low Solids Solvent-borne Coating
40202208 Petroleum and Solvent Evaporation
Surface Coating Operations Plastic Parts Business: Medium Solids Solvent-borne Coating
40202209 Petroleum and Solvent Evaporation
Surface Coating Operations Plastic Parts Business: High Solids Coating (25% Efficiency)
40202210 Petroleum and Solvent Evaporation
Surface Coating Operations Plastic Parts Business: High Solids Solvent-borne Coating (40% Efficiency)
40202211 Petroleum and Solvent Evaporation
Surface Coating Operations Plastic Parts Business: Water-borne Coating
40202212 Petroleum and Solvent Evaporation
Surface Coating Operations Plastic Parts Business: Low Solids Solvent-borne EMI/RFI Shielding Coating
40202213 Petroleum and Solvent Evaporation
Surface Coating Operations Plastic Parts Business: Higher Solids Solvent-borne EMI/RFI Shielding Coating
40202214 Petroleum and Solvent Evaporation
Surface Coating Operations Plastic Parts Business: Water-borne EMI/RFI Shielding Coating
40202215 Petroleum and Solvent Evaporation
Surface Coating Operations Plastic Parts Business: Zinc Arc Spray
40202220 Petroleum and Solvent Evaporation
Surface Coating Operations Plastic Parts Prime Coat Application
40202229 Petroleum and Solvent Evaporation
Surface Coating Operations Plastic Parts Prime Coat Flashoff
40202230 Petroleum and Solvent Evaporation
Surface Coating Operations Plastic Parts Color Coat Application
40202239 Petroleum and Solvent Evaporation
Surface Coating Operations Plastic Parts Color Coat Flashoff
40202240 Petroleum and Solvent Evaporation
Surface Coating Operations Plastic Parts Topcoat/Texture Coat Application
40202249 Petroleum and Solvent Evaporation
Surface Coating Operations Plastic Parts Topcoat/Texture Coat Flashoff
40202250 Petroleum and Solvent Evaporation
Surface Coating Operations Plastic Parts EMI/RFI Shielding Coat Application
40202259 Petroleum and Solvent Evaporation
Surface Coating Operations Plastic Parts EMI/RFI Shielding Coat Flashoff
40202270 Petroleum and Solvent Evaporation
Surface Coating Operations Plastic Parts Sanding/Grit Blasting Prior to EMI/RFI Shielding Coat Application
40202280 Petroleum and Solvent Evaporation
Surface Coating Operations Plastic Parts Maskant Application
40202299 Petroleum and Solvent Evaporation
Surface Coating Operations Plastic Parts Other Not Classified
2415000000 - Solvent Utilization; Degreasing; All Processes/All Industries; Total: All Solvent Types
40100201 Petroleum and Solvent Evaporation
Organic Solvent Evaporation Degreasing Stoddard (Petroleum Solvent): Open-top Vapor Degreasing
Appendix A - 237 Kentucky Regional Haze 5-Year Periodic Report SIP Revision, September 2014
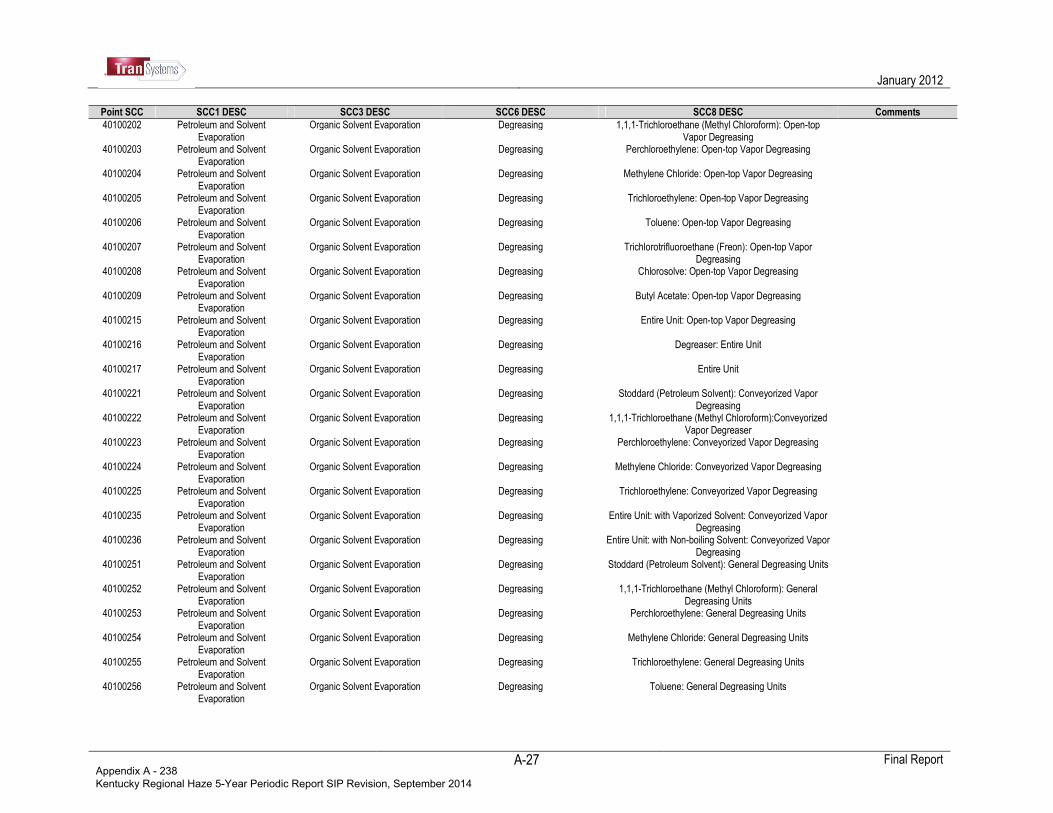
January 2012
Final Report
A-27
Point SCC SCC1 DESC SCC3 DESC SCC6 DESC SCC8 DESC Comments
40100202 Petroleum and Solvent Evaporation
Organic Solvent Evaporation Degreasing 1,1,1-Trichloroethane (Methyl Chloroform): Open-top Vapor Degreasing
40100203 Petroleum and Solvent Evaporation
Organic Solvent Evaporation Degreasing Perchloroethylene: Open-top Vapor Degreasing
40100204 Petroleum and Solvent Evaporation
Organic Solvent Evaporation Degreasing Methylene Chloride: Open-top Vapor Degreasing
40100205 Petroleum and Solvent Evaporation
Organic Solvent Evaporation Degreasing Trichloroethylene: Open-top Vapor Degreasing
40100206 Petroleum and Solvent Evaporation
Organic Solvent Evaporation Degreasing Toluene: Open-top Vapor Degreasing
40100207 Petroleum and Solvent Evaporation
Organic Solvent Evaporation Degreasing Trichlorotrifluoroethane (Freon): Open-top Vapor Degreasing
40100208 Petroleum and Solvent Evaporation
Organic Solvent Evaporation Degreasing Chlorosolve: Open-top Vapor Degreasing
40100209 Petroleum and Solvent Evaporation
Organic Solvent Evaporation Degreasing Butyl Acetate: Open-top Vapor Degreasing
40100215 Petroleum and Solvent Evaporation
Organic Solvent Evaporation Degreasing Entire Unit: Open-top Vapor Degreasing
40100216 Petroleum and Solvent Evaporation
Organic Solvent Evaporation Degreasing Degreaser: Entire Unit
40100217 Petroleum and Solvent Evaporation
Organic Solvent Evaporation Degreasing Entire Unit
40100221 Petroleum and Solvent Evaporation
Organic Solvent Evaporation Degreasing Stoddard (Petroleum Solvent): Conveyorized Vapor Degreasing
40100222 Petroleum and Solvent Evaporation
Organic Solvent Evaporation Degreasing 1,1,1-Trichloroethane (Methyl Chloroform):Conveyorized Vapor Degreaser
40100223 Petroleum and Solvent Evaporation
Organic Solvent Evaporation Degreasing Perchloroethylene: Conveyorized Vapor Degreasing
40100224 Petroleum and Solvent Evaporation
Organic Solvent Evaporation Degreasing Methylene Chloride: Conveyorized Vapor Degreasing
40100225 Petroleum and Solvent Evaporation
Organic Solvent Evaporation Degreasing Trichloroethylene: Conveyorized Vapor Degreasing
40100235 Petroleum and Solvent Evaporation
Organic Solvent Evaporation Degreasing Entire Unit: with Vaporized Solvent: Conveyorized Vapor Degreasing
40100236 Petroleum and Solvent Evaporation
Organic Solvent Evaporation Degreasing Entire Unit: with Non-boiling Solvent: Conveyorized Vapor Degreasing
40100251 Petroleum and Solvent Evaporation
Organic Solvent Evaporation Degreasing Stoddard (Petroleum Solvent): General Degreasing Units
40100252 Petroleum and Solvent Evaporation
Organic Solvent Evaporation Degreasing 1,1,1-Trichloroethane (Methyl Chloroform): General Degreasing Units
40100253 Petroleum and Solvent Evaporation
Organic Solvent Evaporation Degreasing Perchloroethylene: General Degreasing Units
40100254 Petroleum and Solvent Evaporation
Organic Solvent Evaporation Degreasing Methylene Chloride: General Degreasing Units
40100255 Petroleum and Solvent Evaporation
Organic Solvent Evaporation Degreasing Trichloroethylene: General Degreasing Units
40100256 Petroleum and Solvent Evaporation
Organic Solvent Evaporation Degreasing Toluene: General Degreasing Units
Appendix A - 238 Kentucky Regional Haze 5-Year Periodic Report SIP Revision, September 2014
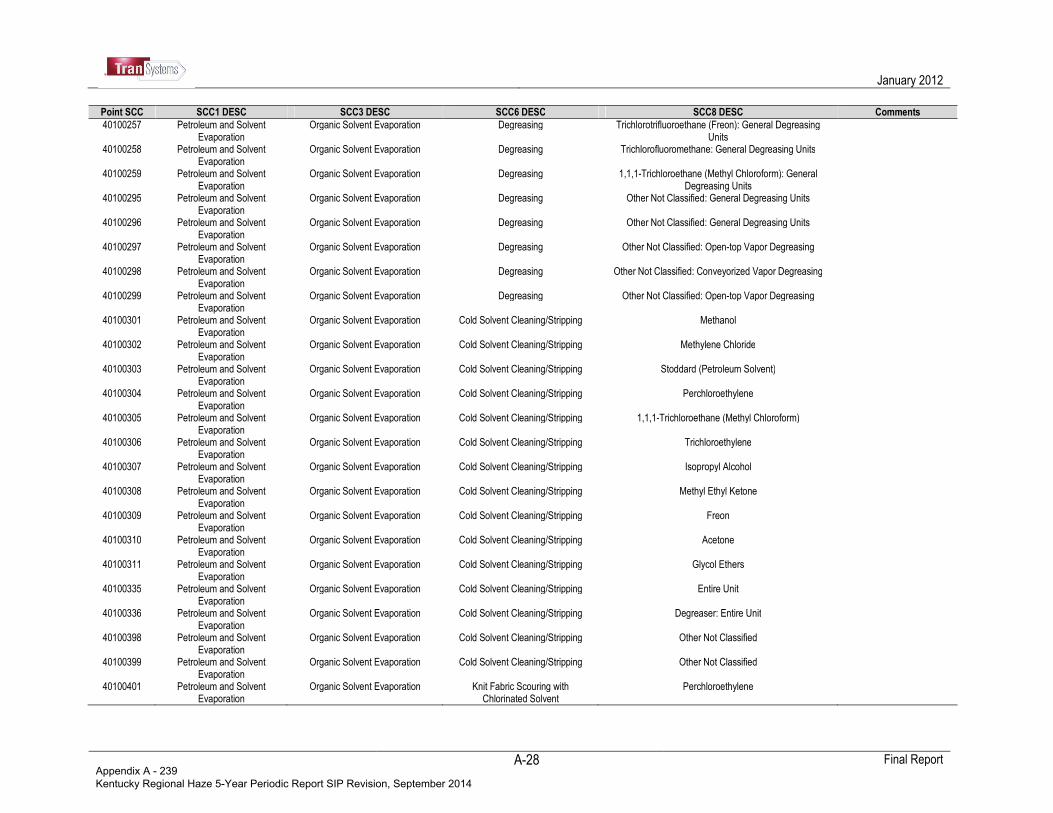
January 2012
Final Report
A-28
Point SCC SCC1 DESC SCC3 DESC SCC6 DESC SCC8 DESC Comments
40100257 Petroleum and Solvent Evaporation
Organic Solvent Evaporation Degreasing Trichlorotrifluoroethane (Freon): General Degreasing Units
40100258 Petroleum and Solvent Evaporation
Organic Solvent Evaporation Degreasing Trichlorofluoromethane: General Degreasing Units
40100259 Petroleum and Solvent Evaporation
Organic Solvent Evaporation Degreasing 1,1,1-Trichloroethane (Methyl Chloroform): General Degreasing Units
40100295 Petroleum and Solvent Evaporation
Organic Solvent Evaporation Degreasing Other Not Classified: General Degreasing Units
40100296 Petroleum and Solvent Evaporation
Organic Solvent Evaporation Degreasing Other Not Classified: General Degreasing Units
40100297 Petroleum and Solvent Evaporation
Organic Solvent Evaporation Degreasing Other Not Classified: Open-top Vapor Degreasing
40100298 Petroleum and Solvent Evaporation
Organic Solvent Evaporation Degreasing Other Not Classified: Conveyorized Vapor Degreasing
40100299 Petroleum and Solvent Evaporation
Organic Solvent Evaporation Degreasing Other Not Classified: Open-top Vapor Degreasing
40100301 Petroleum and Solvent Evaporation
Organic Solvent Evaporation Cold Solvent Cleaning/Stripping Methanol
40100302 Petroleum and Solvent Evaporation
Organic Solvent Evaporation Cold Solvent Cleaning/Stripping Methylene Chloride
40100303 Petroleum and Solvent Evaporation
Organic Solvent Evaporation Cold Solvent Cleaning/Stripping Stoddard (Petroleum Solvent)
40100304 Petroleum and Solvent Evaporation
Organic Solvent Evaporation Cold Solvent Cleaning/Stripping Perchloroethylene
40100305 Petroleum and Solvent Evaporation
Organic Solvent Evaporation Cold Solvent Cleaning/Stripping 1,1,1-Trichloroethane (Methyl Chloroform)
40100306 Petroleum and Solvent Evaporation
Organic Solvent Evaporation Cold Solvent Cleaning/Stripping Trichloroethylene
40100307 Petroleum and Solvent Evaporation
Organic Solvent Evaporation Cold Solvent Cleaning/Stripping Isopropyl Alcohol
40100308 Petroleum and Solvent Evaporation
Organic Solvent Evaporation Cold Solvent Cleaning/Stripping Methyl Ethyl Ketone
40100309 Petroleum and Solvent Evaporation
Organic Solvent Evaporation Cold Solvent Cleaning/Stripping Freon
40100310 Petroleum and Solvent Evaporation
Organic Solvent Evaporation Cold Solvent Cleaning/Stripping Acetone
40100311 Petroleum and Solvent Evaporation
Organic Solvent Evaporation Cold Solvent Cleaning/Stripping Glycol Ethers
40100335 Petroleum and Solvent Evaporation
Organic Solvent Evaporation Cold Solvent Cleaning/Stripping Entire Unit
40100336 Petroleum and Solvent Evaporation
Organic Solvent Evaporation Cold Solvent Cleaning/Stripping Degreaser: Entire Unit
40100398 Petroleum and Solvent Evaporation
Organic Solvent Evaporation Cold Solvent Cleaning/Stripping Other Not Classified
40100399 Petroleum and Solvent Evaporation
Organic Solvent Evaporation Cold Solvent Cleaning/Stripping Other Not Classified
40100401 Petroleum and Solvent Evaporation
Organic Solvent Evaporation Knit Fabric Scouring with Chlorinated Solvent
Perchloroethylene
Appendix A - 239 Kentucky Regional Haze 5-Year Periodic Report SIP Revision, September 2014
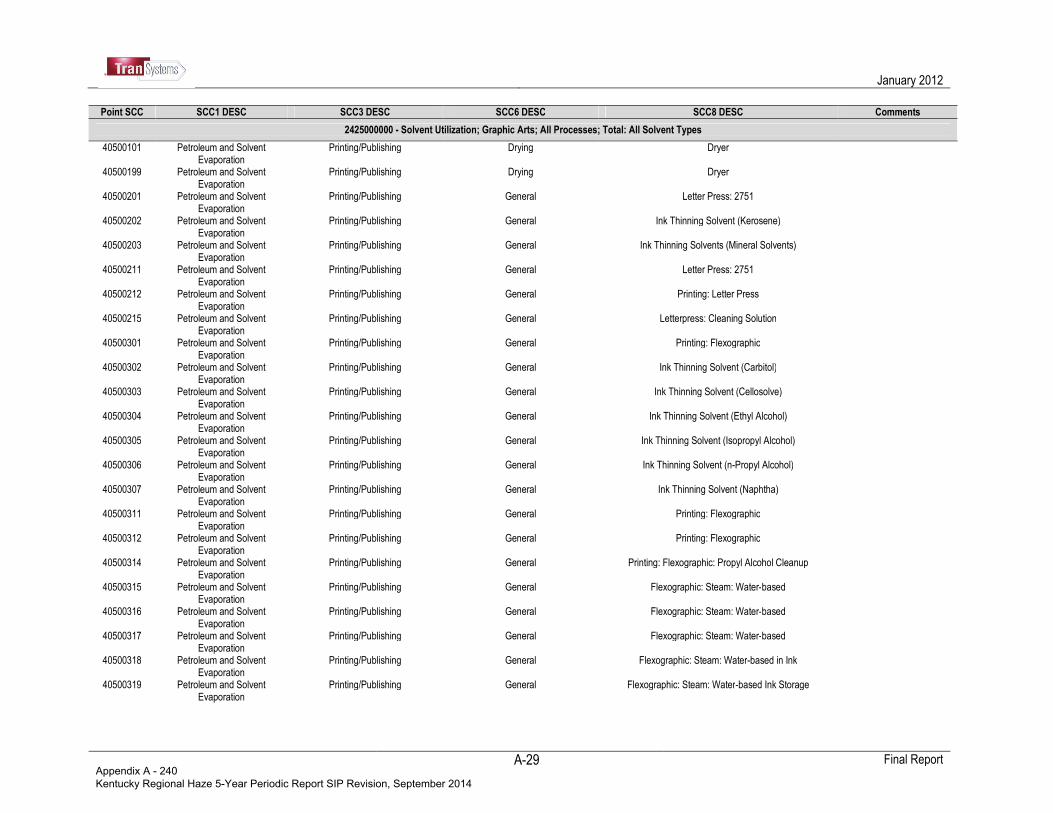
January 2012
Final Report
A-29
Point SCC SCC1 DESC SCC3 DESC SCC6 DESC SCC8 DESC Comments
2425000000 - Solvent Utilization; Graphic Arts; All Processes; Total: All Solvent Types
40500101 Petroleum and Solvent Evaporation
Printing/Publishing Drying Dryer
40500199 Petroleum and Solvent Evaporation
Printing/Publishing Drying Dryer
40500201 Petroleum and Solvent Evaporation
Printing/Publishing General Letter Press: 2751
40500202 Petroleum and Solvent Evaporation
Printing/Publishing General Ink Thinning Solvent (Kerosene)
40500203 Petroleum and Solvent Evaporation
Printing/Publishing General Ink Thinning Solvents (Mineral Solvents)
40500211 Petroleum and Solvent Evaporation
Printing/Publishing General Letter Press: 2751
40500212 Petroleum and Solvent Evaporation
Printing/Publishing General Printing: Letter Press
40500215 Petroleum and Solvent Evaporation
Printing/Publishing General Letterpress: Cleaning Solution
40500301 Petroleum and Solvent Evaporation
Printing/Publishing General Printing: Flexographic
40500302 Petroleum and Solvent Evaporation
Printing/Publishing General Ink Thinning Solvent (Carbitol)
40500303 Petroleum and Solvent Evaporation
Printing/Publishing General Ink Thinning Solvent (Cellosolve)
40500304 Petroleum and Solvent Evaporation
Printing/Publishing General Ink Thinning Solvent (Ethyl Alcohol)
40500305 Petroleum and Solvent Evaporation
Printing/Publishing General Ink Thinning Solvent (Isopropyl Alcohol)
40500306 Petroleum and Solvent Evaporation
Printing/Publishing General Ink Thinning Solvent (n-Propyl Alcohol)
40500307 Petroleum and Solvent Evaporation
Printing/Publishing General Ink Thinning Solvent (Naphtha)
40500311 Petroleum and Solvent Evaporation
Printing/Publishing General Printing: Flexographic
40500312 Petroleum and Solvent Evaporation
Printing/Publishing General Printing: Flexographic
40500314 Petroleum and Solvent Evaporation
Printing/Publishing General Printing: Flexographic: Propyl Alcohol Cleanup
40500315 Petroleum and Solvent Evaporation
Printing/Publishing General Flexographic: Steam: Water-based
40500316 Petroleum and Solvent Evaporation
Printing/Publishing General Flexographic: Steam: Water-based
40500317 Petroleum and Solvent Evaporation
Printing/Publishing General Flexographic: Steam: Water-based
40500318 Petroleum and Solvent Evaporation
Printing/Publishing General Flexographic: Steam: Water-based in Ink
40500319 Petroleum and Solvent Evaporation
Printing/Publishing General Flexographic: Steam: Water-based Ink Storage
Appendix A - 240 Kentucky Regional Haze 5-Year Periodic Report SIP Revision, September 2014

January 2012
Final Report
A-30
Point SCC SCC1 DESC SCC3 DESC SCC6 DESC SCC8 DESC Comments
40500401 Petroleum and Solvent Evaporation
Printing/Publishing General Lithographic: 2752
40500411 Petroleum and Solvent Evaporation
Printing/Publishing General Lithographic: 2752
40500412 Petroleum and Solvent Evaporation
Printing/Publishing General Lithographic: 2752
40500413 Petroleum and Solvent Evaporation
Printing/Publishing General Lithographic: Isopropyl Alcohol Cleanup
40500414 Petroleum and Solvent Evaporation
Printing/Publishing General Flexographic: Propyl Alcohol Cleanup
40500415 Petroleum and Solvent Evaporation
Printing/Publishing General Offset Lithography: Dampening Solution with Alcohol Substitute
40500416 Petroleum and Solvent Evaporation
Printing/Publishing General Offset Lithography: Dampening Solution with High Solvent Content
40500417 Petroleum and Solvent Evaporation
Printing/Publishing General Offset Lithography: Cleaning Solution: Water-based
40500418 Petroleum and Solvent Evaporation
Printing/Publishing General Offset Lithography: Dampening Solution with Isopropyl Alcohol
40500421 Petroleum and Solvent Evaporation
Printing/Publishing General Offset Lithography: Heatset Ink Mixing
40500422 Petroleum and Solvent Evaporation
Printing/Publishing General Offset Lithography: Heatset Solvent Storage
40500431 Petroleum and Solvent Evaporation
Printing/Publishing General Offset Lithography: Nonheated Lithographic Inks
40500432 Petroleum and Solvent Evaporation
Printing/Publishing General Offset Lithography: Nonheated Lithographic Inks
40500433 Petroleum and Solvent Evaporation
Printing/Publishing General Offset Lithography: Nonheated Lithographic Inks
40500501 Petroleum and Solvent Evaporation
Printing/Publishing General Gravure: 2754
40500502 Petroleum and Solvent Evaporation
Printing/Publishing General Ink Thinning Solvent: Dimethylformamide
40500503 Petroleum and Solvent Evaporation
Printing/Publishing General Ink Thinning Solvent: Ethyl Acetate
40500506 Petroleum and Solvent Evaporation
Printing/Publishing General Ink Thinning Solvent: Methyl Ethyl Ketone
40500507 Petroleum and Solvent Evaporation
Printing/Publishing General Ink Thinning Solvent: Methyl Isobutyl Ketone
40500510 Petroleum and Solvent Evaporation
Printing/Publishing General Ink Thinning Solvent: Toluene
40500511 Petroleum and Solvent Evaporation
Printing/Publishing General Gravure: 2754
40500512 Petroleum and Solvent Evaporation
Printing/Publishing General Gravure: 2754
40500513 Petroleum and Solvent Evaporation
Printing/Publishing General Gravure: 2754
40500514 Petroleum and Solvent Evaporation
Printing/Publishing General Gravure: Cleanup Solvent
Appendix A - 241 Kentucky Regional Haze 5-Year Periodic Report SIP Revision, September 2014
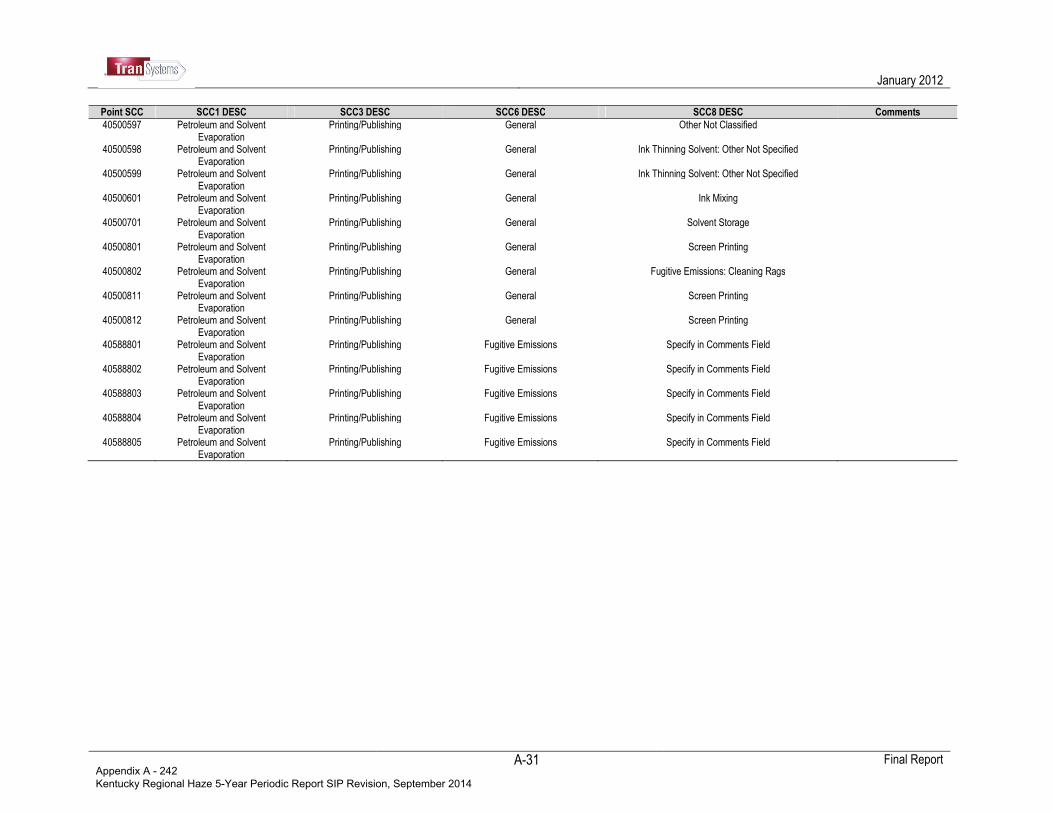
January 2012
Final Report
A-31
Point SCC SCC1 DESC SCC3 DESC SCC6 DESC SCC8 DESC Comments
40500597 Petroleum and Solvent Evaporation
Printing/Publishing General Other Not Classified
40500598 Petroleum and Solvent Evaporation
Printing/Publishing General Ink Thinning Solvent: Other Not Specified
40500599 Petroleum and Solvent Evaporation
Printing/Publishing General Ink Thinning Solvent: Other Not Specified
40500601 Petroleum and Solvent Evaporation
Printing/Publishing General Ink Mixing
40500701 Petroleum and Solvent Evaporation
Printing/Publishing General Solvent Storage
40500801 Petroleum and Solvent Evaporation
Printing/Publishing General Screen Printing
40500802 Petroleum and Solvent Evaporation
Printing/Publishing General Fugitive Emissions: Cleaning Rags
40500811 Petroleum and Solvent Evaporation
Printing/Publishing General Screen Printing
40500812 Petroleum and Solvent Evaporation
Printing/Publishing General Screen Printing
40588801 Petroleum and Solvent Evaporation
Printing/Publishing Fugitive Emissions Specify in Comments Field
40588802 Petroleum and Solvent Evaporation
Printing/Publishing Fugitive Emissions Specify in Comments Field
40588803 Petroleum and Solvent Evaporation
Printing/Publishing Fugitive Emissions Specify in Comments Field
40588804 Petroleum and Solvent Evaporation
Printing/Publishing Fugitive Emissions Specify in Comments Field
40588805 Petroleum and Solvent Evaporation
Printing/Publishing Fugitive Emissions Specify in Comments Field
Appendix A - 242 Kentucky Regional Haze 5-Year Periodic Report SIP Revision, September 2014
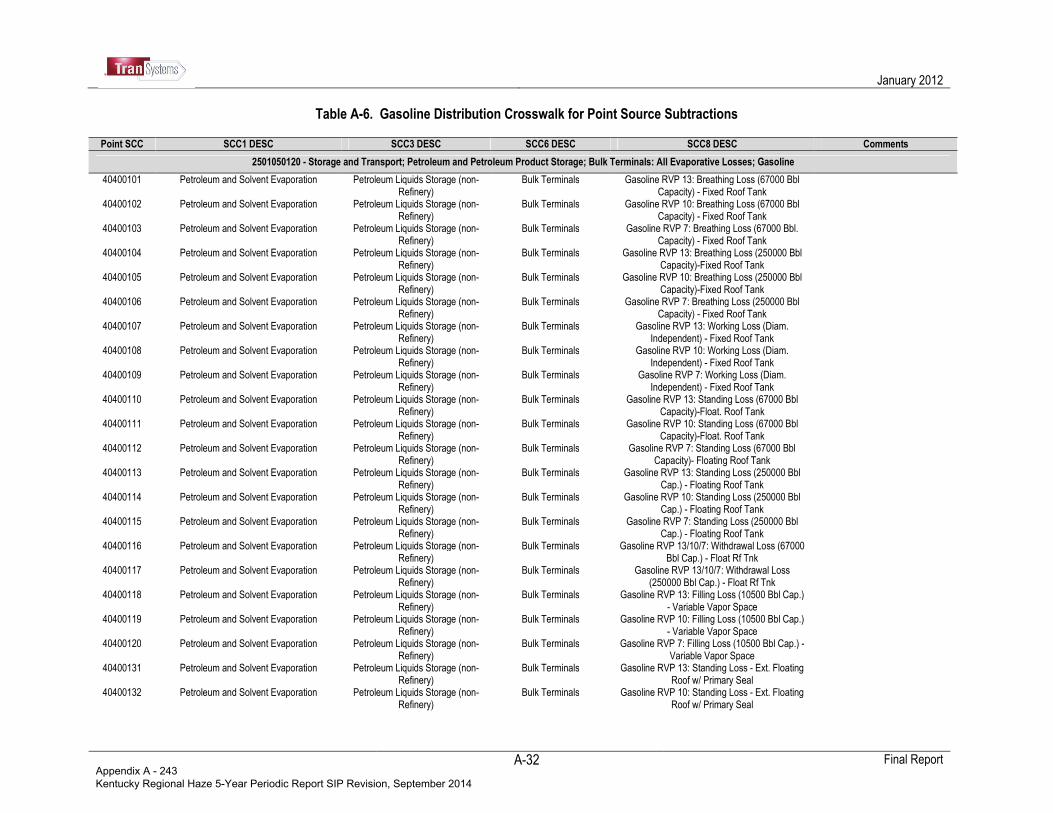
January 2012
Final Report
A-32
Table A-6. Gasoline Distribution Crosswalk for Point Source Subtractions Point SCC SCC1 DESC SCC3 DESC SCC6 DESC SCC8 DESC Comments
2501050120 - Storage and Transport; Petroleum and Petroleum Product Storage; Bulk Terminals: All Evaporative Losses; Gasoline
40400101 Petroleum and Solvent Evaporation Petroleum Liquids Storage (non-Refinery)
Bulk Terminals Gasoline RVP 13: Breathing Loss (67000 Bbl Capacity) - Fixed Roof Tank
40400102 Petroleum and Solvent Evaporation Petroleum Liquids Storage (non-Refinery)
Bulk Terminals Gasoline RVP 10: Breathing Loss (67000 Bbl Capacity) - Fixed Roof Tank
40400103 Petroleum and Solvent Evaporation Petroleum Liquids Storage (non-Refinery)
Bulk Terminals Gasoline RVP 7: Breathing Loss (67000 Bbl. Capacity) - Fixed Roof Tank
40400104 Petroleum and Solvent Evaporation Petroleum Liquids Storage (non-Refinery)
Bulk Terminals Gasoline RVP 13: Breathing Loss (250000 Bbl Capacity)-Fixed Roof Tank
40400105 Petroleum and Solvent Evaporation Petroleum Liquids Storage (non-Refinery)
Bulk Terminals Gasoline RVP 10: Breathing Loss (250000 Bbl Capacity)-Fixed Roof Tank
40400106 Petroleum and Solvent Evaporation Petroleum Liquids Storage (non-Refinery)
Bulk Terminals Gasoline RVP 7: Breathing Loss (250000 Bbl Capacity) - Fixed Roof Tank
40400107 Petroleum and Solvent Evaporation Petroleum Liquids Storage (non-Refinery)
Bulk Terminals Gasoline RVP 13: Working Loss (Diam. Independent) - Fixed Roof Tank
40400108 Petroleum and Solvent Evaporation Petroleum Liquids Storage (non-Refinery)
Bulk Terminals Gasoline RVP 10: Working Loss (Diam. Independent) - Fixed Roof Tank
40400109 Petroleum and Solvent Evaporation Petroleum Liquids Storage (non-Refinery)
Bulk Terminals Gasoline RVP 7: Working Loss (Diam. Independent) - Fixed Roof Tank
40400110 Petroleum and Solvent Evaporation Petroleum Liquids Storage (non-Refinery)
Bulk Terminals Gasoline RVP 13: Standing Loss (67000 Bbl Capacity)-Float. Roof Tank
40400111 Petroleum and Solvent Evaporation Petroleum Liquids Storage (non-Refinery)
Bulk Terminals Gasoline RVP 10: Standing Loss (67000 Bbl Capacity)-Float. Roof Tank
40400112 Petroleum and Solvent Evaporation Petroleum Liquids Storage (non-Refinery)
Bulk Terminals Gasoline RVP 7: Standing Loss (67000 Bbl Capacity)- Floating Roof Tank
40400113 Petroleum and Solvent Evaporation Petroleum Liquids Storage (non-Refinery)
Bulk Terminals Gasoline RVP 13: Standing Loss (250000 Bbl Cap.) - Floating Roof Tank
40400114 Petroleum and Solvent Evaporation Petroleum Liquids Storage (non-Refinery)
Bulk Terminals Gasoline RVP 10: Standing Loss (250000 Bbl Cap.) - Floating Roof Tank
40400115 Petroleum and Solvent Evaporation Petroleum Liquids Storage (non-Refinery)
Bulk Terminals Gasoline RVP 7: Standing Loss (250000 Bbl Cap.) - Floating Roof Tank
40400116 Petroleum and Solvent Evaporation Petroleum Liquids Storage (non-Refinery)
Bulk Terminals Gasoline RVP 13/10/7: Withdrawal Loss (67000 Bbl Cap.) - Float Rf Tnk
40400117 Petroleum and Solvent Evaporation Petroleum Liquids Storage (non-Refinery)
Bulk Terminals Gasoline RVP 13/10/7: Withdrawal Loss (250000 Bbl Cap.) - Float Rf Tnk
40400118 Petroleum and Solvent Evaporation Petroleum Liquids Storage (non-Refinery)
Bulk Terminals Gasoline RVP 13: Filling Loss (10500 Bbl Cap.) - Variable Vapor Space
40400119 Petroleum and Solvent Evaporation Petroleum Liquids Storage (non-Refinery)
Bulk Terminals Gasoline RVP 10: Filling Loss (10500 Bbl Cap.) - Variable Vapor Space
40400120 Petroleum and Solvent Evaporation Petroleum Liquids Storage (non-Refinery)
Bulk Terminals Gasoline RVP 7: Filling Loss (10500 Bbl Cap.) - Variable Vapor Space
40400131 Petroleum and Solvent Evaporation Petroleum Liquids Storage (non-Refinery)
Bulk Terminals Gasoline RVP 13: Standing Loss - Ext. Floating Roof w/ Primary Seal
40400132 Petroleum and Solvent Evaporation Petroleum Liquids Storage (non-Refinery)
Bulk Terminals Gasoline RVP 10: Standing Loss - Ext. Floating Roof w/ Primary Seal
Appendix A - 243 Kentucky Regional Haze 5-Year Periodic Report SIP Revision, September 2014
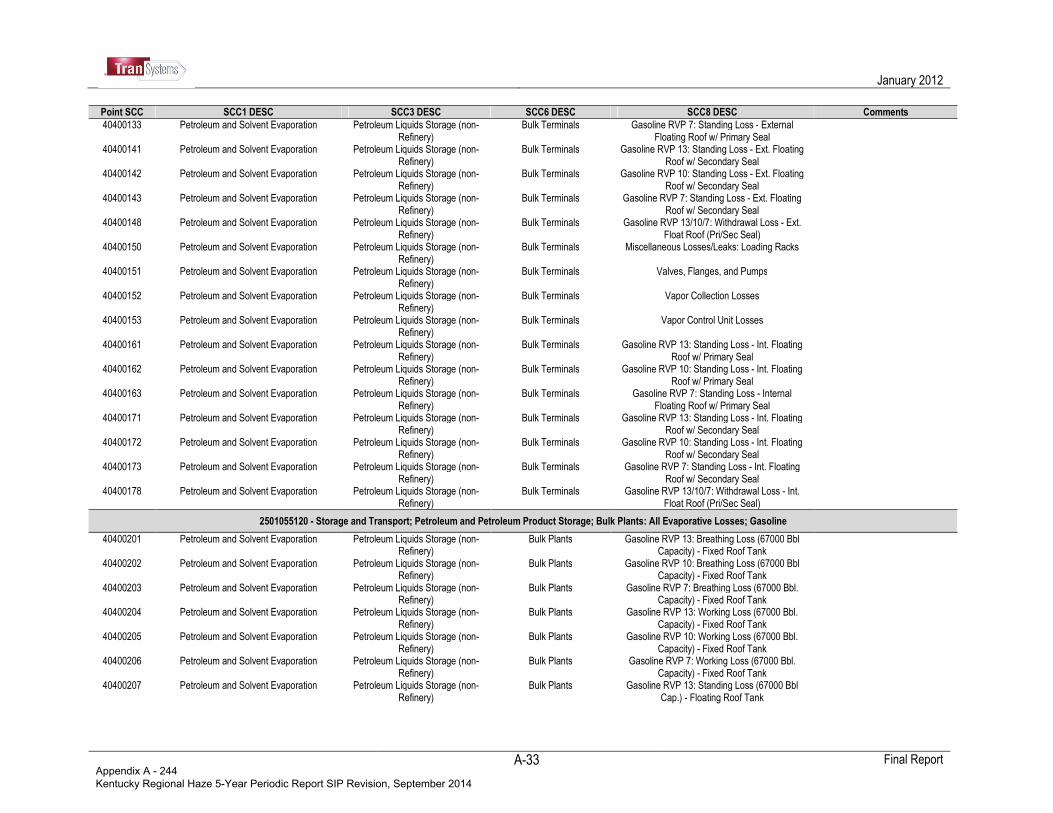
January 2012
Final Report
A-33
Point SCC SCC1 DESC SCC3 DESC SCC6 DESC SCC8 DESC Comments
40400133 Petroleum and Solvent Evaporation Petroleum Liquids Storage (non-Refinery)
Bulk Terminals Gasoline RVP 7: Standing Loss - External Floating Roof w/ Primary Seal
40400141 Petroleum and Solvent Evaporation Petroleum Liquids Storage (non-Refinery)
Bulk Terminals Gasoline RVP 13: Standing Loss - Ext. Floating Roof w/ Secondary Seal
40400142 Petroleum and Solvent Evaporation Petroleum Liquids Storage (non-Refinery)
Bulk Terminals Gasoline RVP 10: Standing Loss - Ext. Floating Roof w/ Secondary Seal
40400143 Petroleum and Solvent Evaporation Petroleum Liquids Storage (non-Refinery)
Bulk Terminals Gasoline RVP 7: Standing Loss - Ext. Floating Roof w/ Secondary Seal
40400148 Petroleum and Solvent Evaporation Petroleum Liquids Storage (non-Refinery)
Bulk Terminals Gasoline RVP 13/10/7: Withdrawal Loss - Ext. Float Roof (Pri/Sec Seal)
40400150 Petroleum and Solvent Evaporation Petroleum Liquids Storage (non-Refinery)
Bulk Terminals Miscellaneous Losses/Leaks: Loading Racks
40400151 Petroleum and Solvent Evaporation Petroleum Liquids Storage (non-Refinery)
Bulk Terminals Valves, Flanges, and Pumps
40400152 Petroleum and Solvent Evaporation Petroleum Liquids Storage (non-Refinery)
Bulk Terminals Vapor Collection Losses
40400153 Petroleum and Solvent Evaporation Petroleum Liquids Storage (non-Refinery)
Bulk Terminals Vapor Control Unit Losses
40400161 Petroleum and Solvent Evaporation Petroleum Liquids Storage (non-Refinery)
Bulk Terminals Gasoline RVP 13: Standing Loss - Int. Floating Roof w/ Primary Seal
40400162 Petroleum and Solvent Evaporation Petroleum Liquids Storage (non-Refinery)
Bulk Terminals Gasoline RVP 10: Standing Loss - Int. Floating Roof w/ Primary Seal
40400163 Petroleum and Solvent Evaporation Petroleum Liquids Storage (non-Refinery)
Bulk Terminals Gasoline RVP 7: Standing Loss - Internal Floating Roof w/ Primary Seal
40400171 Petroleum and Solvent Evaporation Petroleum Liquids Storage (non-Refinery)
Bulk Terminals Gasoline RVP 13: Standing Loss - Int. Floating Roof w/ Secondary Seal
40400172 Petroleum and Solvent Evaporation Petroleum Liquids Storage (non-Refinery)
Bulk Terminals Gasoline RVP 10: Standing Loss - Int. Floating Roof w/ Secondary Seal
40400173 Petroleum and Solvent Evaporation Petroleum Liquids Storage (non-Refinery)
Bulk Terminals Gasoline RVP 7: Standing Loss - Int. Floating Roof w/ Secondary Seal
40400178 Petroleum and Solvent Evaporation Petroleum Liquids Storage (non-Refinery)
Bulk Terminals Gasoline RVP 13/10/7: Withdrawal Loss - Int. Float Roof (Pri/Sec Seal)
2501055120 - Storage and Transport; Petroleum and Petroleum Product Storage; Bulk Plants: All Evaporative Losses; Gasoline
40400201 Petroleum and Solvent Evaporation Petroleum Liquids Storage (non-Refinery)
Bulk Plants Gasoline RVP 13: Breathing Loss (67000 Bbl Capacity) - Fixed Roof Tank
40400202 Petroleum and Solvent Evaporation Petroleum Liquids Storage (non-Refinery)
Bulk Plants Gasoline RVP 10: Breathing Loss (67000 Bbl Capacity) - Fixed Roof Tank
40400203 Petroleum and Solvent Evaporation Petroleum Liquids Storage (non-Refinery)
Bulk Plants Gasoline RVP 7: Breathing Loss (67000 Bbl. Capacity) - Fixed Roof Tank
40400204 Petroleum and Solvent Evaporation Petroleum Liquids Storage (non-Refinery)
Bulk Plants Gasoline RVP 13: Working Loss (67000 Bbl. Capacity) - Fixed Roof Tank
40400205 Petroleum and Solvent Evaporation Petroleum Liquids Storage (non-Refinery)
Bulk Plants Gasoline RVP 10: Working Loss (67000 Bbl. Capacity) - Fixed Roof Tank
40400206 Petroleum and Solvent Evaporation Petroleum Liquids Storage (non-Refinery)
Bulk Plants Gasoline RVP 7: Working Loss (67000 Bbl. Capacity) - Fixed Roof Tank
40400207 Petroleum and Solvent Evaporation Petroleum Liquids Storage (non-Refinery)
Bulk Plants Gasoline RVP 13: Standing Loss (67000 Bbl Cap.) - Floating Roof Tank
Appendix A - 244 Kentucky Regional Haze 5-Year Periodic Report SIP Revision, September 2014
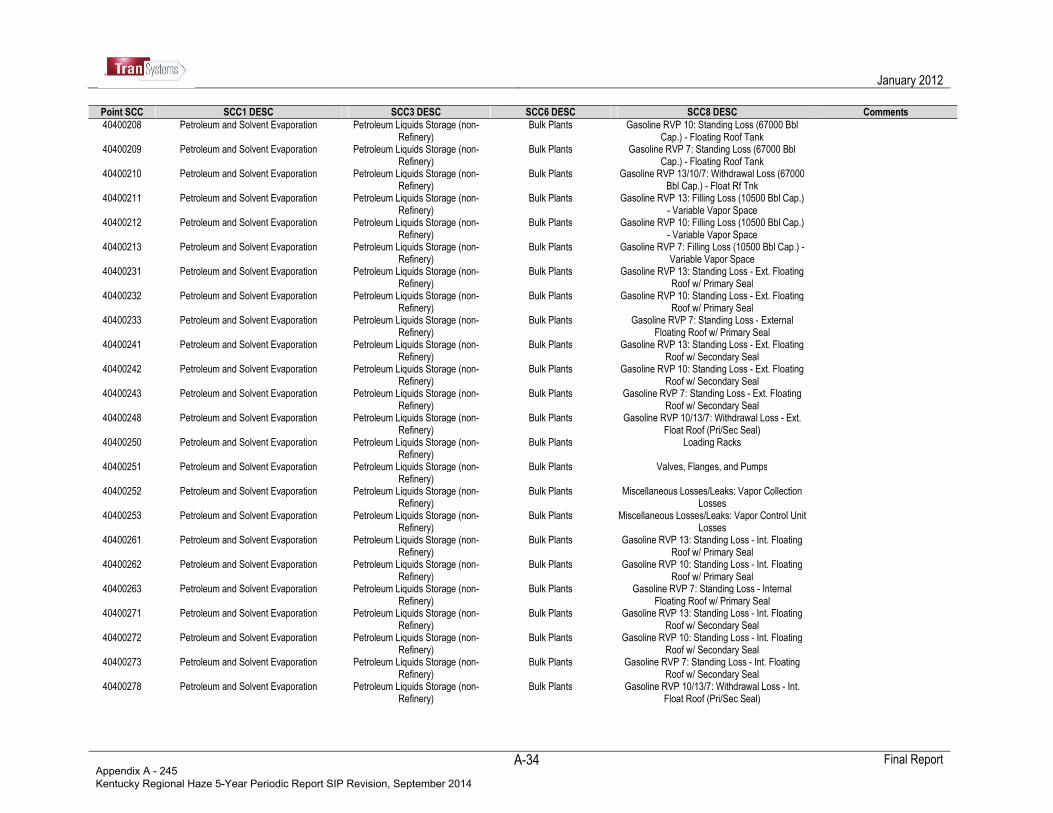
January 2012
Final Report
A-34
Point SCC SCC1 DESC SCC3 DESC SCC6 DESC SCC8 DESC Comments
40400208 Petroleum and Solvent Evaporation Petroleum Liquids Storage (non-Refinery)
Bulk Plants Gasoline RVP 10: Standing Loss (67000 Bbl Cap.) - Floating Roof Tank
40400209 Petroleum and Solvent Evaporation Petroleum Liquids Storage (non-Refinery)
Bulk Plants Gasoline RVP 7: Standing Loss (67000 Bbl Cap.) - Floating Roof Tank
40400210 Petroleum and Solvent Evaporation Petroleum Liquids Storage (non-Refinery)
Bulk Plants Gasoline RVP 13/10/7: Withdrawal Loss (67000 Bbl Cap.) - Float Rf Tnk
40400211 Petroleum and Solvent Evaporation Petroleum Liquids Storage (non-Refinery)
Bulk Plants Gasoline RVP 13: Filling Loss (10500 Bbl Cap.) - Variable Vapor Space
40400212 Petroleum and Solvent Evaporation Petroleum Liquids Storage (non-Refinery)
Bulk Plants Gasoline RVP 10: Filling Loss (10500 Bbl Cap.) - Variable Vapor Space
40400213 Petroleum and Solvent Evaporation Petroleum Liquids Storage (non-Refinery)
Bulk Plants Gasoline RVP 7: Filling Loss (10500 Bbl Cap.) - Variable Vapor Space
40400231 Petroleum and Solvent Evaporation Petroleum Liquids Storage (non-Refinery)
Bulk Plants Gasoline RVP 13: Standing Loss - Ext. Floating Roof w/ Primary Seal
40400232 Petroleum and Solvent Evaporation Petroleum Liquids Storage (non-Refinery)
Bulk Plants Gasoline RVP 10: Standing Loss - Ext. Floating Roof w/ Primary Seal
40400233 Petroleum and Solvent Evaporation Petroleum Liquids Storage (non-Refinery)
Bulk Plants Gasoline RVP 7: Standing Loss - External Floating Roof w/ Primary Seal
40400241 Petroleum and Solvent Evaporation Petroleum Liquids Storage (non-Refinery)
Bulk Plants Gasoline RVP 13: Standing Loss - Ext. Floating Roof w/ Secondary Seal
40400242 Petroleum and Solvent Evaporation Petroleum Liquids Storage (non-Refinery)
Bulk Plants Gasoline RVP 10: Standing Loss - Ext. Floating Roof w/ Secondary Seal
40400243 Petroleum and Solvent Evaporation Petroleum Liquids Storage (non-Refinery)
Bulk Plants Gasoline RVP 7: Standing Loss - Ext. Floating Roof w/ Secondary Seal
40400248 Petroleum and Solvent Evaporation Petroleum Liquids Storage (non-Refinery)
Bulk Plants Gasoline RVP 10/13/7: Withdrawal Loss - Ext. Float Roof (Pri/Sec Seal)
40400250 Petroleum and Solvent Evaporation Petroleum Liquids Storage (non-Refinery)
Bulk Plants Loading Racks
40400251 Petroleum and Solvent Evaporation Petroleum Liquids Storage (non-Refinery)
Bulk Plants Valves, Flanges, and Pumps
40400252 Petroleum and Solvent Evaporation Petroleum Liquids Storage (non-Refinery)
Bulk Plants Miscellaneous Losses/Leaks: Vapor Collection Losses
40400253 Petroleum and Solvent Evaporation Petroleum Liquids Storage (non-Refinery)
Bulk Plants Miscellaneous Losses/Leaks: Vapor Control Unit Losses
40400261 Petroleum and Solvent Evaporation Petroleum Liquids Storage (non-Refinery)
Bulk Plants Gasoline RVP 13: Standing Loss - Int. Floating Roof w/ Primary Seal
40400262 Petroleum and Solvent Evaporation Petroleum Liquids Storage (non-Refinery)
Bulk Plants Gasoline RVP 10: Standing Loss - Int. Floating Roof w/ Primary Seal
40400263 Petroleum and Solvent Evaporation Petroleum Liquids Storage (non-Refinery)
Bulk Plants Gasoline RVP 7: Standing Loss - Internal Floating Roof w/ Primary Seal
40400271 Petroleum and Solvent Evaporation Petroleum Liquids Storage (non-Refinery)
Bulk Plants Gasoline RVP 13: Standing Loss - Int. Floating Roof w/ Secondary Seal
40400272 Petroleum and Solvent Evaporation Petroleum Liquids Storage (non-Refinery)
Bulk Plants Gasoline RVP 10: Standing Loss - Int. Floating Roof w/ Secondary Seal
40400273 Petroleum and Solvent Evaporation Petroleum Liquids Storage (non-Refinery)
Bulk Plants Gasoline RVP 7: Standing Loss - Int. Floating Roof w/ Secondary Seal
40400278 Petroleum and Solvent Evaporation Petroleum Liquids Storage (non-Refinery)
Bulk Plants Gasoline RVP 10/13/7: Withdrawal Loss - Int. Float Roof (Pri/Sec Seal)
Appendix A - 245 Kentucky Regional Haze 5-Year Periodic Report SIP Revision, September 2014
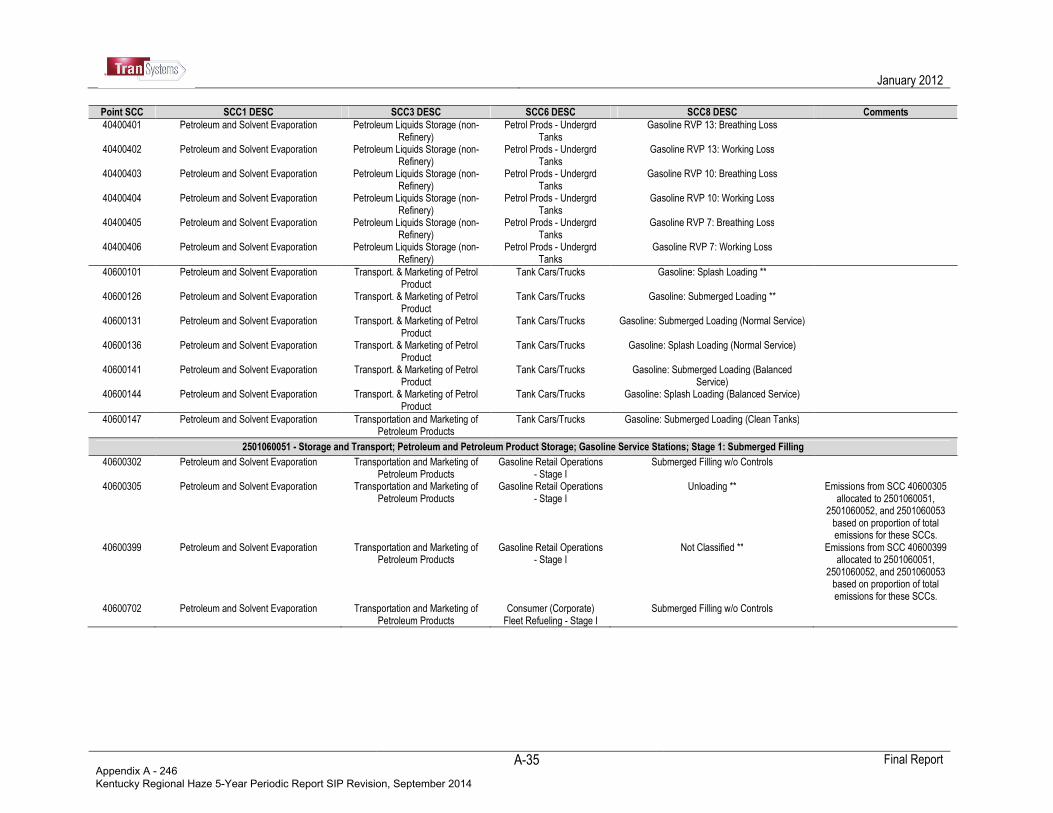
January 2012
Final Report
A-35
Point SCC SCC1 DESC SCC3 DESC SCC6 DESC SCC8 DESC Comments
40400401 Petroleum and Solvent Evaporation Petroleum Liquids Storage (non-Refinery)
Petrol Prods - Undergrd Tanks
Gasoline RVP 13: Breathing Loss
40400402 Petroleum and Solvent Evaporation Petroleum Liquids Storage (non-Refinery)
Petrol Prods - Undergrd Tanks
Gasoline RVP 13: Working Loss
40400403 Petroleum and Solvent Evaporation Petroleum Liquids Storage (non-Refinery)
Petrol Prods - Undergrd Tanks
Gasoline RVP 10: Breathing Loss
40400404 Petroleum and Solvent Evaporation Petroleum Liquids Storage (non-Refinery)
Petrol Prods - Undergrd Tanks
Gasoline RVP 10: Working Loss
40400405 Petroleum and Solvent Evaporation Petroleum Liquids Storage (non-Refinery)
Petrol Prods - Undergrd Tanks
Gasoline RVP 7: Breathing Loss
40400406 Petroleum and Solvent Evaporation Petroleum Liquids Storage (non-Refinery)
Petrol Prods - Undergrd Tanks
Gasoline RVP 7: Working Loss
40600101 Petroleum and Solvent Evaporation Transport. & Marketing of Petrol Product
Tank Cars/Trucks Gasoline: Splash Loading **
40600126 Petroleum and Solvent Evaporation Transport. & Marketing of Petrol Product
Tank Cars/Trucks Gasoline: Submerged Loading **
40600131 Petroleum and Solvent Evaporation Transport. & Marketing of Petrol Product
Tank Cars/Trucks Gasoline: Submerged Loading (Normal Service)
40600136 Petroleum and Solvent Evaporation Transport. & Marketing of Petrol Product
Tank Cars/Trucks Gasoline: Splash Loading (Normal Service)
40600141 Petroleum and Solvent Evaporation Transport. & Marketing of Petrol Product
Tank Cars/Trucks Gasoline: Submerged Loading (Balanced Service)
40600144 Petroleum and Solvent Evaporation Transport. & Marketing of Petrol Product
Tank Cars/Trucks Gasoline: Splash Loading (Balanced Service)
40600147 Petroleum and Solvent Evaporation Transportation and Marketing of Petroleum Products
Tank Cars/Trucks Gasoline: Submerged Loading (Clean Tanks)
2501060051 - Storage and Transport; Petroleum and Petroleum Product Storage; Gasoline Service Stations; Stage 1: Submerged Filling
40600302 Petroleum and Solvent Evaporation Transportation and Marketing of Petroleum Products
Gasoline Retail Operations - Stage I
Submerged Filling w/o Controls
40600305 Petroleum and Solvent Evaporation Transportation and Marketing of Petroleum Products
Gasoline Retail Operations - Stage I
Unloading ** Emissions from SCC 40600305 allocated to 2501060051,
2501060052, and 2501060053 based on proportion of total emissions for these SCCs.
40600399 Petroleum and Solvent Evaporation Transportation and Marketing of Petroleum Products
Gasoline Retail Operations - Stage I
Not Classified ** Emissions from SCC 40600399 allocated to 2501060051,
2501060052, and 2501060053 based on proportion of total emissions for these SCCs.
40600702 Petroleum and Solvent Evaporation Transportation and Marketing of Petroleum Products
Consumer (Corporate) Fleet Refueling - Stage I
Submerged Filling w/o Controls
Appendix A - 246 Kentucky Regional Haze 5-Year Periodic Report SIP Revision, September 2014
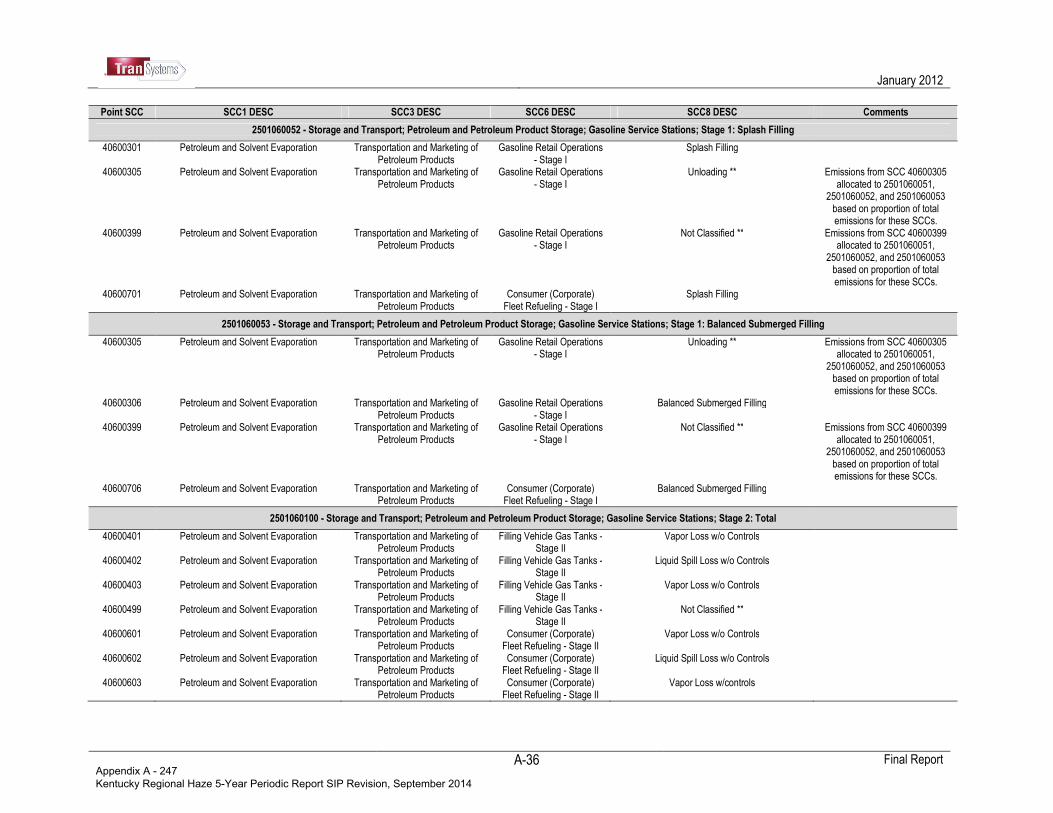
January 2012
Final Report
A-36
Point SCC SCC1 DESC SCC3 DESC SCC6 DESC SCC8 DESC Comments
2501060052 - Storage and Transport; Petroleum and Petroleum Product Storage; Gasoline Service Stations; Stage 1: Splash Filling
40600301 Petroleum and Solvent Evaporation Transportation and Marketing of Petroleum Products
Gasoline Retail Operations - Stage I
Splash Filling
40600305 Petroleum and Solvent Evaporation Transportation and Marketing of Petroleum Products
Gasoline Retail Operations - Stage I
Unloading ** Emissions from SCC 40600305 allocated to 2501060051,
2501060052, and 2501060053 based on proportion of total emissions for these SCCs.
40600399 Petroleum and Solvent Evaporation Transportation and Marketing of Petroleum Products
Gasoline Retail Operations - Stage I
Not Classified ** Emissions from SCC 40600399 allocated to 2501060051,
2501060052, and 2501060053 based on proportion of total emissions for these SCCs.
40600701 Petroleum and Solvent Evaporation Transportation and Marketing of Petroleum Products
Consumer (Corporate) Fleet Refueling - Stage I
Splash Filling
2501060053 - Storage and Transport; Petroleum and Petroleum Product Storage; Gasoline Service Stations; Stage 1: Balanced Submerged Filling
40600305 Petroleum and Solvent Evaporation Transportation and Marketing of Petroleum Products
Gasoline Retail Operations - Stage I
Unloading ** Emissions from SCC 40600305 allocated to 2501060051,
2501060052, and 2501060053 based on proportion of total emissions for these SCCs.
40600306 Petroleum and Solvent Evaporation Transportation and Marketing of Petroleum Products
Gasoline Retail Operations - Stage I
Balanced Submerged Filling
40600399 Petroleum and Solvent Evaporation Transportation and Marketing of Petroleum Products
Gasoline Retail Operations - Stage I
Not Classified ** Emissions from SCC 40600399 allocated to 2501060051,
2501060052, and 2501060053 based on proportion of total emissions for these SCCs.
40600706 Petroleum and Solvent Evaporation Transportation and Marketing of Petroleum Products
Consumer (Corporate) Fleet Refueling - Stage I
Balanced Submerged Filling
2501060100 - Storage and Transport; Petroleum and Petroleum Product Storage; Gasoline Service Stations; Stage 2: Total
40600401 Petroleum and Solvent Evaporation Transportation and Marketing of Petroleum Products
Filling Vehicle Gas Tanks - Stage II
Vapor Loss w/o Controls
40600402 Petroleum and Solvent Evaporation Transportation and Marketing of Petroleum Products
Filling Vehicle Gas Tanks - Stage II
Liquid Spill Loss w/o Controls
40600403 Petroleum and Solvent Evaporation Transportation and Marketing of Petroleum Products
Filling Vehicle Gas Tanks - Stage II
Vapor Loss w/o Controls
40600499 Petroleum and Solvent Evaporation Transportation and Marketing of Petroleum Products
Filling Vehicle Gas Tanks - Stage II
Not Classified **
40600601 Petroleum and Solvent Evaporation Transportation and Marketing of Petroleum Products
Consumer (Corporate) Fleet Refueling - Stage II
Vapor Loss w/o Controls
40600602 Petroleum and Solvent Evaporation Transportation and Marketing of Petroleum Products
Consumer (Corporate) Fleet Refueling - Stage II
Liquid Spill Loss w/o Controls
40600603 Petroleum and Solvent Evaporation Transportation and Marketing of Petroleum Products
Consumer (Corporate) Fleet Refueling - Stage II
Vapor Loss w/controls
Appendix A - 247 Kentucky Regional Haze 5-Year Periodic Report SIP Revision, September 2014
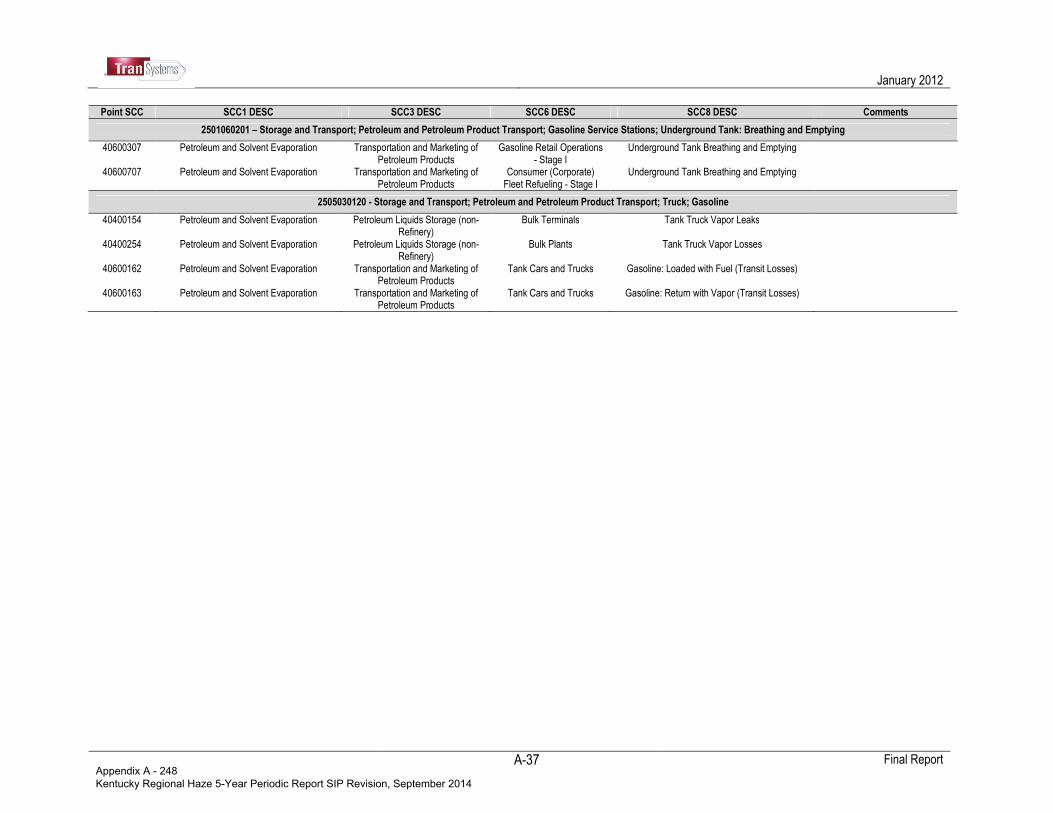
January 2012
Final Report
A-37
Point SCC SCC1 DESC SCC3 DESC SCC6 DESC SCC8 DESC Comments
2501060201 – Storage and Transport; Petroleum and Petroleum Product Transport; Gasoline Service Stations; Underground Tank: Breathing and Emptying
40600307 Petroleum and Solvent Evaporation Transportation and Marketing of Petroleum Products
Gasoline Retail Operations - Stage I
Underground Tank Breathing and Emptying
40600707 Petroleum and Solvent Evaporation Transportation and Marketing of Petroleum Products
Consumer (Corporate) Fleet Refueling - Stage I
Underground Tank Breathing and Emptying
2505030120 - Storage and Transport; Petroleum and Petroleum Product Transport; Truck; Gasoline
40400154 Petroleum and Solvent Evaporation Petroleum Liquids Storage (non-Refinery)
Bulk Terminals Tank Truck Vapor Leaks
40400254 Petroleum and Solvent Evaporation Petroleum Liquids Storage (non-Refinery)
Bulk Plants Tank Truck Vapor Losses
40600162 Petroleum and Solvent Evaporation Transportation and Marketing of Petroleum Products
Tank Cars and Trucks Gasoline: Loaded with Fuel (Transit Losses)
40600163 Petroleum and Solvent Evaporation Transportation and Marketing of Petroleum Products
Tank Cars and Trucks Gasoline: Return with Vapor (Transit Losses)
Appendix A - 248 Kentucky Regional Haze 5-Year Periodic Report SIP Revision, September 2014

January 2012
Final Report
A-38
Table A-7. Mining and Quarrying Crosswalk for Point Source Subtraction Point SCC SCC1 DESC SCC3 DESC SCC6 DESC SCC8 DESC Comments
2325000000 – Industrial Processes; Mining and Quarrying: SIC 14; All Processes; Total
30302401 Industrial Processes Primary Metal Production Metal Mining (General Processes) Primary Crushing: Low Moisture Ore 30302402 Industrial Processes Primary Metal Production Metal Mining (General Processes) Secondary Crushing: Low Moisture Ore 30302403 Industrial Processes Primary Metal Production Metal Mining (General Processes) Tertiary Crushing: Low Moisture Ore 30302404 Industrial Processes Primary Metal Production Metal Mining (General Processes) Material Handling: Low Moisture Ore 30302405 Industrial Processes Primary Metal Production Metal Mining (General Processes) Primary Crushing: High Moisture Ore 30302406 Industrial Processes Primary Metal Production Metal Mining (General Processes) Secondary Crushing: High Moisture Ore 30302407 Industrial Processes Primary Metal Production Metal Mining (General Processes) Tertiary Crushing: High Moisture Ore 30302408 Industrial Processes Primary Metal Production Metal Mining (General Processes) Material Handling: High Moisture Ore 30302409 Industrial Processes Primary Metal Production Metal Mining (General Processes) Dry Grinding with Air Conveying 30302410 Industrial Processes Primary Metal Production Metal Mining (General Processes) Dry Grinding without Air Conveying 30302411 Industrial Processes Primary Metal Production Metal Mining (General Processes) Ore Drying 30303101 Industrial Processes Primary Metal Production Leadbearing Ore Crushing and Grinding Lead Ore w/ 5.1% Lead Content 30303102 Industrial Processes Primary Metal Production Leadbearing Ore Crushing and Grinding Zinc Ore w/ 0.2% Lead Content 30303103 Industrial Processes Primary Metal Production Leadbearing Ore Crushing and Grinding Copper Ore w/ 0.2% Lead Content 30303104 Industrial Processes Primary Metal Production Leadbearing Ore Crushing and Grinding Lead-Zinc Ore w/ 2% Lead Content 30303105 Industrial Processes Primary Metal Production Leadbearing Ore Crushing and Grinding Copper-Lead Ore w/ 2% Lead Content 30303106 Industrial Processes Primary Metal Production Leadbearing Ore Crushing and Grinding Copper-Zinc Ore w/ 0.2% Lead Content 30303107 Industrial Processes Primary Metal Production Leadbearing Ore Crushing and Grinding Copper-Lead-Zinc w/ 2% Lead Content 30501001 Industrial Processes Mineral Products Coal Mining, Cleaning, and Material Handling (See 305310) Fluidized Bed 30501002 Industrial Processes Mineral Products Coal Mining, Cleaning, and Material Handling (See 305310) Flash or Suspension 30501003 Industrial Processes Mineral Products Coal Mining, Cleaning, and Material Handling (See 305310) Multilouvered 30501004 Industrial Processes Mineral Products Coal Mining, Cleaning, and Material Handling (See 305310) Rotary 30501005 Industrial Processes Mineral Products Coal Mining, Cleaning, and Material Handling (See 305310) Cascade 30501006 Industrial Processes Mineral Products Coal Mining, Cleaning, and Material Handling (See 305310) Continuous Carrier 30501007 Industrial Processes Mineral Products Coal Mining, Cleaning, and Material Handling (See 305310) Screen 30501008 Industrial Processes Mineral Products Coal Mining, Cleaning, and Material Handling (See 305310) Unloading 30501009 Industrial Processes Mineral Products Coal Mining, Cleaning, and Material Handling (See 305310) Raw Coal Storage 30501010 Industrial Processes Mineral Products Coal Mining, Cleaning, and Material Handling (See 305310) Crushing 30501011 Industrial Processes Mineral Products Coal Mining, Cleaning, and Material Handling (See 305310) Coal Transfer 30501012 Industrial Processes Mineral Products Coal Mining, Cleaning, and Material Handling (See 305310) Screening 30501013 Industrial Processes Mineral Products Coal Mining, Cleaning, and Material Handling (See 305310) Air Tables 30501014 Industrial Processes Mineral Products Coal Mining, Cleaning, and Material Handling (See 305310) Cleaned Coal Storage 30501015 Industrial Processes Mineral Products Coal Mining, Cleaning, and Material Handling (See 305310) Loading 30501016 Industrial Processes Mineral Products Coal Mining, Cleaning, and Material Handling (See 305310) Loading: Clean Coal 30501017 Industrial Processes Mineral Products Coal Mining, Cleaning, and Material Handling (See 305310) Secondary Crushing 30501021 Industrial Processes Mineral Products Coal Mining, Cleaning, and Material Handling (See 305310) Overburden Removal 30501022 Industrial Processes Mineral Products Coal Mining, Cleaning, and Material Handling (See 305310) Drilling/Blasting 30501023 Industrial Processes Mineral Products Coal Mining, Cleaning, and Material Handling (See 305310) Loading 30501024 Industrial Processes Mineral Products Coal Mining, Cleaning, and Material Handling (See 305310) Hauling 30501030 Industrial Processes Mineral Products Coal Mining, Cleaning, and Material Handling (See 305310) Topsoil Removal 30501031 Industrial Processes Mineral Products Coal Mining, Cleaning, and Material Handling (See 305310) Scrapers: Travel Mode 30501032 Industrial Processes Mineral Products Coal Mining, Cleaning, and Material Handling (See 305310) Topsoil Unloading 30501033 Industrial Processes Mineral Products Coal Mining, Cleaning, and Material Handling (See 305310) Overburden 30501034 Industrial Processes Mineral Products Coal Mining, Cleaning, and Material Handling (See 305310) Coal Seam: Drilling
Appendix A - 249 Kentucky Regional Haze 5-Year Periodic Report SIP Revision, September 2014
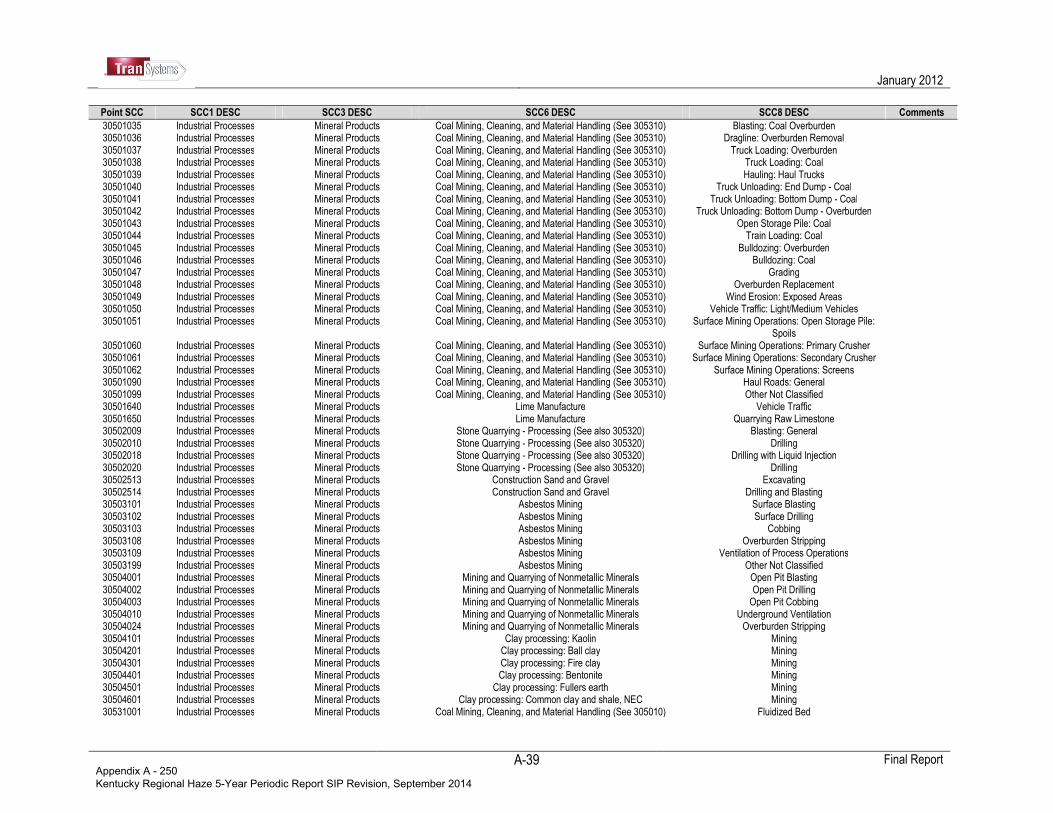
January 2012
Final Report
A-39
Point SCC SCC1 DESC SCC3 DESC SCC6 DESC SCC8 DESC Comments
30501035 Industrial Processes Mineral Products Coal Mining, Cleaning, and Material Handling (See 305310) Blasting: Coal Overburden 30501036 Industrial Processes Mineral Products Coal Mining, Cleaning, and Material Handling (See 305310) Dragline: Overburden Removal 30501037 Industrial Processes Mineral Products Coal Mining, Cleaning, and Material Handling (See 305310) Truck Loading: Overburden 30501038 Industrial Processes Mineral Products Coal Mining, Cleaning, and Material Handling (See 305310) Truck Loading: Coal 30501039 Industrial Processes Mineral Products Coal Mining, Cleaning, and Material Handling (See 305310) Hauling: Haul Trucks 30501040 Industrial Processes Mineral Products Coal Mining, Cleaning, and Material Handling (See 305310) Truck Unloading: End Dump - Coal 30501041 Industrial Processes Mineral Products Coal Mining, Cleaning, and Material Handling (See 305310) Truck Unloading: Bottom Dump - Coal 30501042 Industrial Processes Mineral Products Coal Mining, Cleaning, and Material Handling (See 305310) Truck Unloading: Bottom Dump - Overburden 30501043 Industrial Processes Mineral Products Coal Mining, Cleaning, and Material Handling (See 305310) Open Storage Pile: Coal 30501044 Industrial Processes Mineral Products Coal Mining, Cleaning, and Material Handling (See 305310) Train Loading: Coal 30501045 Industrial Processes Mineral Products Coal Mining, Cleaning, and Material Handling (See 305310) Bulldozing: Overburden 30501046 Industrial Processes Mineral Products Coal Mining, Cleaning, and Material Handling (See 305310) Bulldozing: Coal 30501047 Industrial Processes Mineral Products Coal Mining, Cleaning, and Material Handling (See 305310) Grading 30501048 Industrial Processes Mineral Products Coal Mining, Cleaning, and Material Handling (See 305310) Overburden Replacement 30501049 Industrial Processes Mineral Products Coal Mining, Cleaning, and Material Handling (See 305310) Wind Erosion: Exposed Areas 30501050 Industrial Processes Mineral Products Coal Mining, Cleaning, and Material Handling (See 305310) Vehicle Traffic: Light/Medium Vehicles 30501051 Industrial Processes Mineral Products Coal Mining, Cleaning, and Material Handling (See 305310) Surface Mining Operations: Open Storage Pile:
Spoils
30501060 Industrial Processes Mineral Products Coal Mining, Cleaning, and Material Handling (See 305310) Surface Mining Operations: Primary Crusher 30501061 Industrial Processes Mineral Products Coal Mining, Cleaning, and Material Handling (See 305310) Surface Mining Operations: Secondary Crusher 30501062 Industrial Processes Mineral Products Coal Mining, Cleaning, and Material Handling (See 305310) Surface Mining Operations: Screens 30501090 Industrial Processes Mineral Products Coal Mining, Cleaning, and Material Handling (See 305310) Haul Roads: General 30501099 Industrial Processes Mineral Products Coal Mining, Cleaning, and Material Handling (See 305310) Other Not Classified 30501640 Industrial Processes Mineral Products Lime Manufacture Vehicle Traffic 30501650 Industrial Processes Mineral Products Lime Manufacture Quarrying Raw Limestone 30502009 Industrial Processes Mineral Products Stone Quarrying - Processing (See also 305320) Blasting: General 30502010 Industrial Processes Mineral Products Stone Quarrying - Processing (See also 305320) Drilling 30502018 Industrial Processes Mineral Products Stone Quarrying - Processing (See also 305320) Drilling with Liquid Injection 30502020 Industrial Processes Mineral Products Stone Quarrying - Processing (See also 305320) Drilling 30502513 Industrial Processes Mineral Products Construction Sand and Gravel Excavating 30502514 Industrial Processes Mineral Products Construction Sand and Gravel Drilling and Blasting 30503101 Industrial Processes Mineral Products Asbestos Mining Surface Blasting 30503102 Industrial Processes Mineral Products Asbestos Mining Surface Drilling 30503103 Industrial Processes Mineral Products Asbestos Mining Cobbing 30503108 Industrial Processes Mineral Products Asbestos Mining Overburden Stripping 30503109 Industrial Processes Mineral Products Asbestos Mining Ventilation of Process Operations 30503199 Industrial Processes Mineral Products Asbestos Mining Other Not Classified 30504001 Industrial Processes Mineral Products Mining and Quarrying of Nonmetallic Minerals Open Pit Blasting 30504002 Industrial Processes Mineral Products Mining and Quarrying of Nonmetallic Minerals Open Pit Drilling 30504003 Industrial Processes Mineral Products Mining and Quarrying of Nonmetallic Minerals Open Pit Cobbing 30504010 Industrial Processes Mineral Products Mining and Quarrying of Nonmetallic Minerals Underground Ventilation 30504024 Industrial Processes Mineral Products Mining and Quarrying of Nonmetallic Minerals Overburden Stripping 30504101 Industrial Processes Mineral Products Clay processing: Kaolin Mining 30504201 Industrial Processes Mineral Products Clay processing: Ball clay Mining 30504301 Industrial Processes Mineral Products Clay processing: Fire clay Mining 30504401 Industrial Processes Mineral Products Clay processing: Bentonite Mining 30504501 Industrial Processes Mineral Products Clay processing: Fullers earth Mining 30504601 Industrial Processes Mineral Products Clay processing: Common clay and shale, NEC Mining 30531001 Industrial Processes Mineral Products Coal Mining, Cleaning, and Material Handling (See 305010) Fluidized Bed
Appendix A - 250 Kentucky Regional Haze 5-Year Periodic Report SIP Revision, September 2014
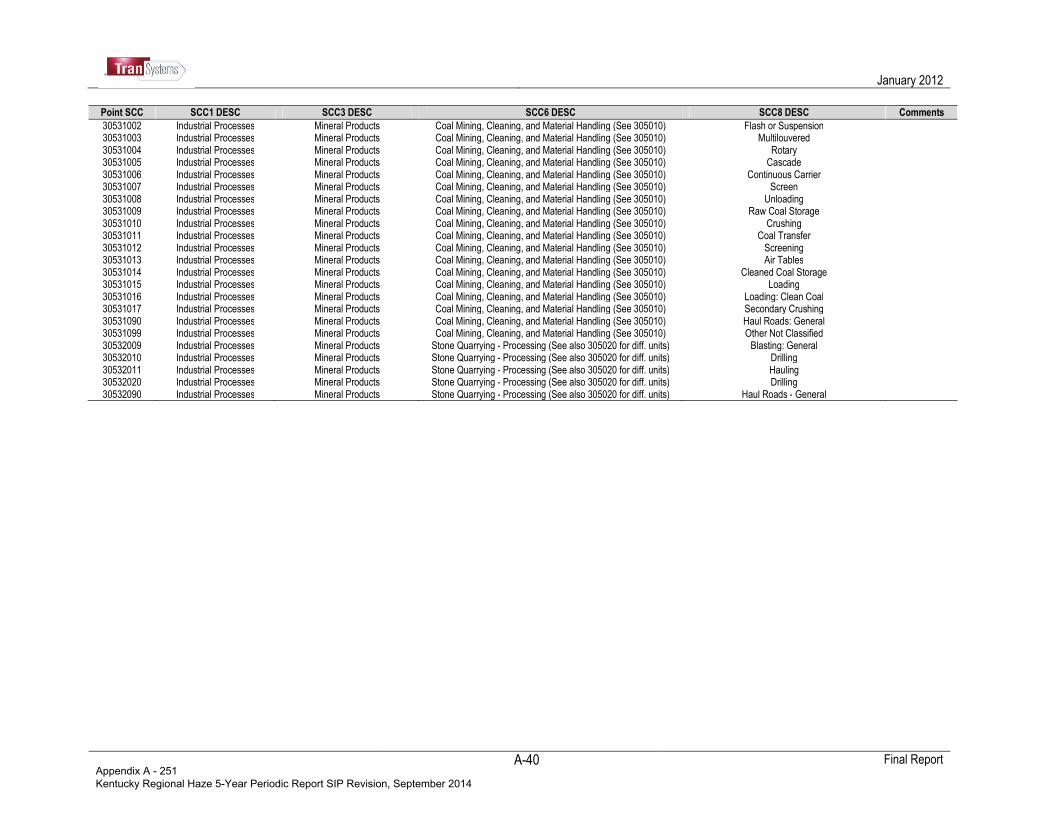
January 2012
Final Report
A-40
Point SCC SCC1 DESC SCC3 DESC SCC6 DESC SCC8 DESC Comments
30531002 Industrial Processes Mineral Products Coal Mining, Cleaning, and Material Handling (See 305010) Flash or Suspension 30531003 Industrial Processes Mineral Products Coal Mining, Cleaning, and Material Handling (See 305010) Multilouvered 30531004 Industrial Processes Mineral Products Coal Mining, Cleaning, and Material Handling (See 305010) Rotary 30531005 Industrial Processes Mineral Products Coal Mining, Cleaning, and Material Handling (See 305010) Cascade 30531006 Industrial Processes Mineral Products Coal Mining, Cleaning, and Material Handling (See 305010) Continuous Carrier 30531007 Industrial Processes Mineral Products Coal Mining, Cleaning, and Material Handling (See 305010) Screen 30531008 Industrial Processes Mineral Products Coal Mining, Cleaning, and Material Handling (See 305010) Unloading 30531009 Industrial Processes Mineral Products Coal Mining, Cleaning, and Material Handling (See 305010) Raw Coal Storage 30531010 Industrial Processes Mineral Products Coal Mining, Cleaning, and Material Handling (See 305010) Crushing 30531011 Industrial Processes Mineral Products Coal Mining, Cleaning, and Material Handling (See 305010) Coal Transfer 30531012 Industrial Processes Mineral Products Coal Mining, Cleaning, and Material Handling (See 305010) Screening 30531013 Industrial Processes Mineral Products Coal Mining, Cleaning, and Material Handling (See 305010) Air Tables 30531014 Industrial Processes Mineral Products Coal Mining, Cleaning, and Material Handling (See 305010) Cleaned Coal Storage 30531015 Industrial Processes Mineral Products Coal Mining, Cleaning, and Material Handling (See 305010) Loading 30531016 Industrial Processes Mineral Products Coal Mining, Cleaning, and Material Handling (See 305010) Loading: Clean Coal 30531017 Industrial Processes Mineral Products Coal Mining, Cleaning, and Material Handling (See 305010) Secondary Crushing 30531090 Industrial Processes Mineral Products Coal Mining, Cleaning, and Material Handling (See 305010) Haul Roads: General 30531099 Industrial Processes Mineral Products Coal Mining, Cleaning, and Material Handling (See 305010) Other Not Classified 30532009 Industrial Processes Mineral Products Stone Quarrying - Processing (See also 305020 for diff. units) Blasting: General 30532010 Industrial Processes Mineral Products Stone Quarrying - Processing (See also 305020 for diff. units) Drilling 30532011 Industrial Processes Mineral Products Stone Quarrying - Processing (See also 305020 for diff. units) Hauling 30532020 Industrial Processes Mineral Products Stone Quarrying - Processing (See also 305020 for diff. units) Drilling 30532090 Industrial Processes Mineral Products Stone Quarrying - Processing (See also 305020 for diff. units) Haul Roads - General
Appendix A - 251 Kentucky Regional Haze 5-Year Periodic Report SIP Revision, September 2014

January 2012
Final Report
A-41
Table A-8. Agriculture Production Crosswalk for Livestock
Point SCC SCC1 DESC SCC3 DESC SCC6 DESC SCC8 DESC Comments
2805001100 - Miscellaneous Area Sources; Agriculture Production – Livestock; Beef cattle - finishing operations on feedlots (drylots); Confinement
30202001 Industrial Processes Food and Agriculture Beef Cattle Feedlots Feedlots: General Apportion between nonpoint SCCs based on CMU Model output
30202002 Industrial Processes Food and Agriculture Beef Cattle Feedlots Feedlots: General Apportion between nonpoint SCCs based on CMU Model output
2805001200 - Miscellaneous Area Sources; Agriculture Production – Livestock; Beef cattle - finishing operations on feedlots (drylots); Manure handling and storage
30202001 Industrial Processes Food and Agriculture Beef Cattle Feedlots Feedlots: General Apportion between nonpoint SCCs based on CMU Model output
30202002 Industrial Processes Food and Agriculture Beef Cattle Feedlots Feedlots: General Apportion between nonpoint SCCs based on CMU Model output
2805001300 - Miscellaneous Area Sources; Agriculture Production – Livestock; Beef cattle - finishing operations on feedlots (drylots); Land application of manure
30202001 Industrial Processes Food and Agriculture Beef Cattle Feedlots Feedlots: General Apportion between nonpoint SCCs based on CMU Model output
30202002 Industrial Processes Food and Agriculture Beef Cattle Feedlots Feedlots: General Apportion between nonpoint SCCs based on CMU Model output
2805003100 - Miscellaneous Area Sources; Agriculture Production – Livestock; Beef cattle - finishing operations on pasture/range; Confinement
30202001 Industrial Processes Food and Agriculture Beef Cattle Feedlots Feedlots: General Apportion between nonpoint SCCs based on CMU Model output
30202002 Industrial Processes Food and Agriculture Beef Cattle Feedlots Feedlots: General Apportion between nonpoint SCCs based on CMU Model output
2805007100 - Miscellaneous Area Sources; Agriculture Production – Livestock; Poultry production - layers with dry manure management systems; Confinement
30202101 Industrial Processes Food and Agriculture Eggs and Poultry Production Manure Handling: Dry Apportion between nonpoint SCCs based on CMU Model output
30202102 Industrial Processes Food and Agriculture Eggs and Poultry Production Manure Handling: Dry Apportion between nonpoint SCCs based on CMU Model output
2805007300 - Miscellaneous Area Sources; Agriculture Production – Livestock; Poultry production - layers with dry manure management systems; Land application of manure
30202101 Industrial Processes Food and Agriculture Eggs and Poultry Production Manure Handling: Dry Apportion between nonpoint SCCs based on CMU Model output
30202102 Industrial Processes Food and Agriculture Eggs and Poultry Production Manure Handling: Dry Apportion between nonpoint SCCs based on CMU Model output
2805008100 - Miscellaneous Area Sources; Agriculture Production – Livestock; Poultry production - layers with wet manure management systems; Confinement
30202105 Industrial Processes Food and Agriculture Eggs and Poultry Production Manure Handling: Wet Apportion between nonpoint SCCs based on CMU Model output
30202106 Industrial Processes Food and Agriculture Eggs and Poultry Production Manure Handling: Wet Apportion between nonpoint SCCs based on CMU Model output
2805008200 - Miscellaneous Area Sources; Agriculture Production – Livestock; Poultry production - layers with wet manure management systems; Manure handling and storage
30202105 Industrial Processes Food and Agriculture Eggs and Poultry Production Manure Handling: Wet Apportion between nonpoint SCCs based on CMU Model output
Appendix A - 252 Kentucky Regional Haze 5-Year Periodic Report SIP Revision, September 2014
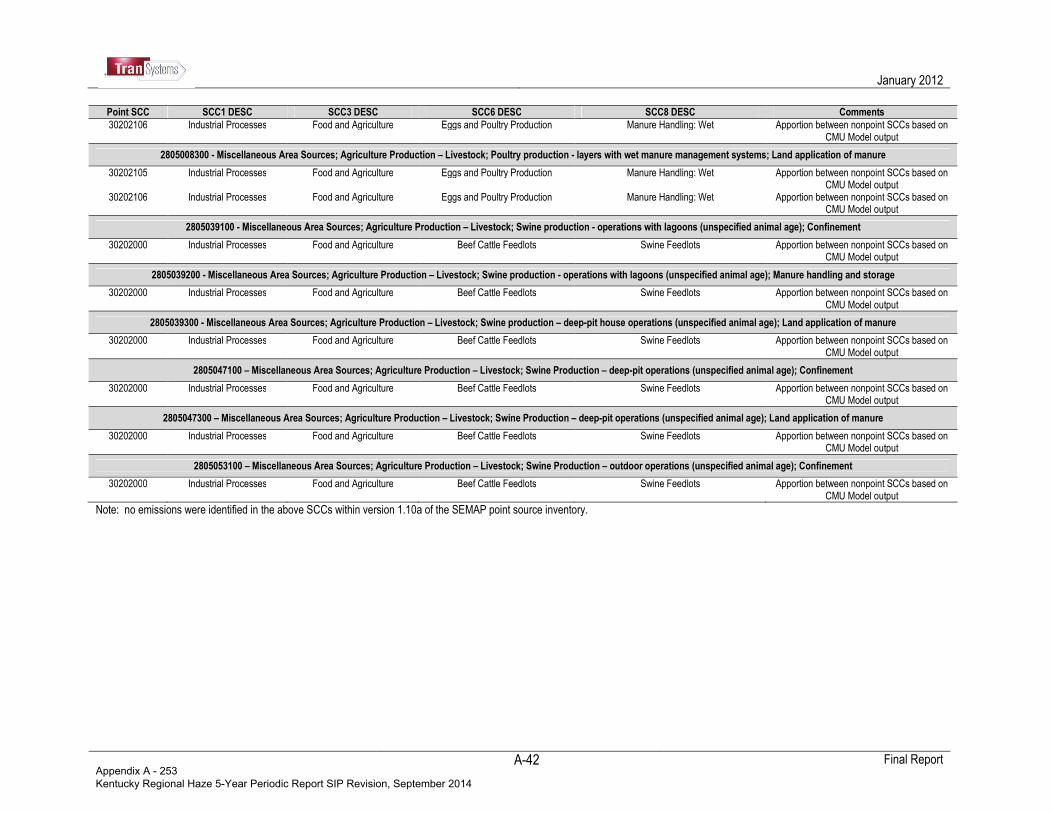
January 2012
Final Report
A-42
Point SCC SCC1 DESC SCC3 DESC SCC6 DESC SCC8 DESC Comments
30202106 Industrial Processes Food and Agriculture Eggs and Poultry Production Manure Handling: Wet Apportion between nonpoint SCCs based on CMU Model output
2805008300 - Miscellaneous Area Sources; Agriculture Production – Livestock; Poultry production - layers with wet manure management systems; Land application of manure
30202105 Industrial Processes Food and Agriculture Eggs and Poultry Production Manure Handling: Wet Apportion between nonpoint SCCs based on CMU Model output
30202106 Industrial Processes Food and Agriculture Eggs and Poultry Production Manure Handling: Wet Apportion between nonpoint SCCs based on CMU Model output
2805039100 - Miscellaneous Area Sources; Agriculture Production – Livestock; Swine production - operations with lagoons (unspecified animal age); Confinement
30202000 Industrial Processes Food and Agriculture Beef Cattle Feedlots Swine Feedlots Apportion between nonpoint SCCs based on CMU Model output
2805039200 - Miscellaneous Area Sources; Agriculture Production – Livestock; Swine production - operations with lagoons (unspecified animal age); Manure handling and storage
30202000 Industrial Processes Food and Agriculture Beef Cattle Feedlots Swine Feedlots Apportion between nonpoint SCCs based on CMU Model output
2805039300 - Miscellaneous Area Sources; Agriculture Production – Livestock; Swine production – deep-pit house operations (unspecified animal age); Land application of manure
30202000 Industrial Processes Food and Agriculture Beef Cattle Feedlots Swine Feedlots Apportion between nonpoint SCCs based on CMU Model output
2805047100 – Miscellaneous Area Sources; Agriculture Production – Livestock; Swine Production – deep-pit operations (unspecified animal age); Confinement
30202000 Industrial Processes Food and Agriculture Beef Cattle Feedlots Swine Feedlots Apportion between nonpoint SCCs based on CMU Model output
2805047300 – Miscellaneous Area Sources; Agriculture Production – Livestock; Swine Production – deep-pit operations (unspecified animal age); Land application of manure
30202000 Industrial Processes Food and Agriculture Beef Cattle Feedlots Swine Feedlots Apportion between nonpoint SCCs based on CMU Model output
2805053100 – Miscellaneous Area Sources; Agriculture Production – Livestock; Swine Production – outdoor operations (unspecified animal age); Confinement
30202000 Industrial Processes Food and Agriculture Beef Cattle Feedlots Swine Feedlots Apportion between nonpoint SCCs based on CMU Model output
Note: no emissions were identified in the above SCCs within version 1.10a of the SEMAP point source inventory.
Appendix A - 253 Kentucky Regional Haze 5-Year Periodic Report SIP Revision, September 2014