Appendix A CWA Section 404 Compliance Forms - Galveston ...
134
DRAFT DOCUMENT BSC Improvements Section 408 and Section 204(f) AOM Draft EA Appendix A CWA Section 404 Compliance Forms – Section 404(b)(1) Guideline Short Form and Coastal Zone Consistency
-
Upload
khangminh22 -
Category
Documents
-
view
0 -
download
0
Transcript of Appendix A CWA Section 404 Compliance Forms - Galveston ...
DRAFT DOCUMENT
BSC Improvements Section 408 and Section 204(f) AOM Draft EA
Appendix A CWA Section 404 Compliance Forms – Section 404(b)(1) Guideline Short Form and Coastal Zone Consistency

1
EVALUATION OF SECTION 404(b)(1) GUIDELINES (SHORT FORM)
PROPOSED PROJECT: SECTION 408 AND SECTION 204(f) REPORT BAYPORT SHIP CHANNEL IMPROVEMENTS, HARRIS COUNTY, TEXAS
Yes No*
1. Review of Compliance (230.10(a)-(d)) A review of the proposed project indicates that:
a. The placement represents the least environmentally damaging practicable alternative and, if in a special aquatic site, the activity associated with the placement must have direct access or proximity to, or be located in the aquatic ecosystem, to fulfill its basic purpose (if no, see section 2 and information gathered for EA alternative).
X
b. The activity does not appear to:
1) Violate applicable state water quality standards or effluent standards prohibited under Section 307 of the Clean Water Act; X
2) Jeopardize the existence of Federally listed endangered or threatened species or their habitat; and X
3) Violate requirements of any Federally designated marine sanctuary (if no, see section 2b and check responses from resource and water quality certifying agencies). X
c. The activity will not cause or contribute to significant degradation of waters of the U.S. including adverse effects on human health, life stages of organisms dependent on the aquatic ecosystem, ecosystem diversity, productivity and stability, and recreational, aesthetic, an economic values (if no, see values, Section 2)
X
d. Appropriate and practicable steps have been taken to minimize potential adverse impacts of the discharge on the aquatic ecosystem (if no, see Section 5) X
Not Applicable
Not Significant
Significant*
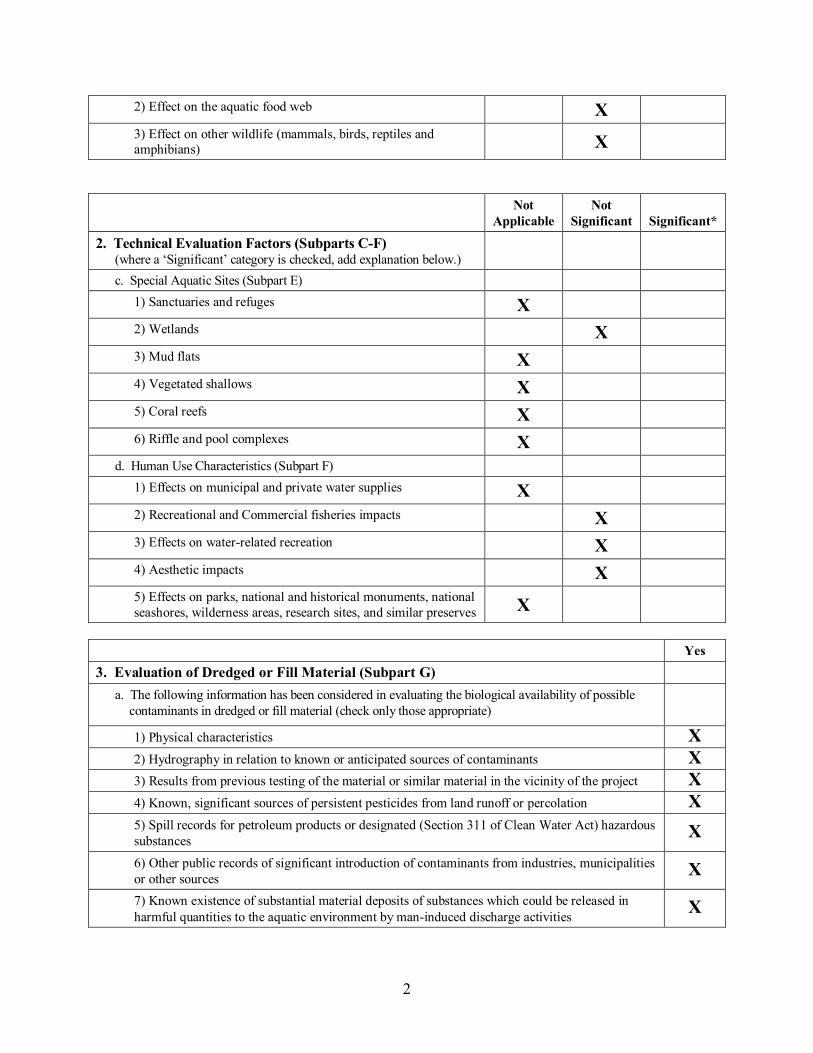
2. Technical Evaluation Factors (Subparts C-F) (where a ‘Significant’ category is checked, add explanation below.)
a. Physical and Chemical Characteristics of the Aquatic Ecosystem (Subpart C)
1) Substrate impacts X
2) Suspended particulates/turbidity impacts X
3) Water column impacts X
4) Alteration of current patterns and water circulation X
5) Alteration of normal water fluctuation/hydroperiod X
6) Alteration of salinity gradients X
b. Biological Characteristics of the Aquatic Ecosystem (Subpart D) 1) Effect on threatened/endangered species and their habitat X
2
2) Effect on the aquatic food web X
3) Effect on other wildlife (mammals, birds, reptiles and amphibians) X
Not Applicable
Not Significant
Significant*
2. Technical Evaluation Factors (Subparts C-F) (where a ‘Significant’ category is checked, add explanation below.)
c. Special Aquatic Sites (Subpart E) 1) Sanctuaries and refuges X
2) Wetlands X 3) Mud flats X
4) Vegetated shallows X
5) Coral reefs X
6) Riffle and pool complexes X
d. Human Use Characteristics (Subpart F) 1) Effects on municipal and private water supplies X
2) Recreational and Commercial fisheries impacts X
3) Effects on water-related recreation X
4) Aesthetic impacts X
5) Effects on parks, national and historical monuments, national seashores, wilderness areas, research sites, and similar preserves X
Yes 3. Evaluation of Dredged or Fill Material (Subpart G)
a. The following information has been considered in evaluating the biological availability of possible contaminants in dredged or fill material (check only those appropriate)
1) Physical characteristics X 2) Hydrography in relation to known or anticipated sources of contaminants X 3) Results from previous testing of the material or similar material in the vicinity of the project X 4) Known, significant sources of persistent pesticides from land runoff or percolation X 5) Spill records for petroleum products or designated (Section 311 of Clean Water Act) hazardous substances X 6) Other public records of significant introduction of contaminants from industries, municipalities or other sources X 7) Known existence of substantial material deposits of substances which could be released in harmful quantities to the aquatic environment by man-induced discharge activities X
3
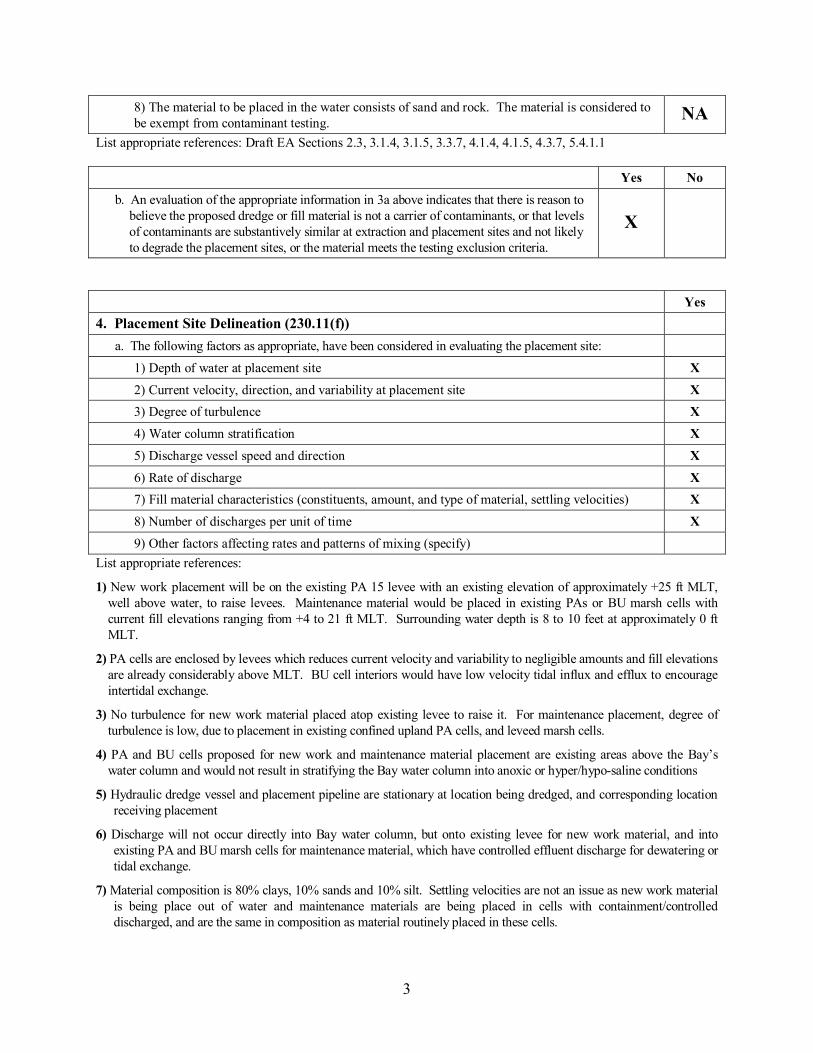
8) The material to be placed in the water consists of sand and rock. The material is considered to be exempt from contaminant testing. NA
List appropriate references: Draft EA Sections 2.3, 3.1.4, 3.1.5, 3.3.7, 4.1.4, 4.1.5, 4.3.7, 5.4.1.1
Yes No b. An evaluation of the appropriate information in 3a above indicates that there is reason to
believe the proposed dredge or fill material is not a carrier of contaminants, or that levels of contaminants are substantively similar at extraction and placement sites and not likely to degrade the placement sites, or the material meets the testing exclusion criteria.
X
Yes 4. Placement Site Delineation (230.11(f))
a. The following factors as appropriate, have been considered in evaluating the placement site: 1) Depth of water at placement site X 2) Current velocity, direction, and variability at placement site X 3) Degree of turbulence X 4) Water column stratification X 5) Discharge vessel speed and direction X 6) Rate of discharge X 7) Fill material characteristics (constituents, amount, and type of material, settling velocities) X 8) Number of discharges per unit of time X 9) Other factors affecting rates and patterns of mixing (specify)
List appropriate references:
1) New work placement will be on the existing PA 15 levee with an existing elevation of approximately +25 ft MLT, well above water, to raise levees. Maintenance material would be placed in existing PAs or BU marsh cells with current fill elevations ranging from +4 to 21 ft MLT. Surrounding water depth is 8 to 10 feet at approximately 0 ft MLT.
2) PA cells are enclosed by levees which reduces current velocity and variability to negligible amounts and fill elevations are already considerably above MLT. BU cell interiors would have low velocity tidal influx and efflux to encourage intertidal exchange.
3) No turbulence for new work material placed atop existing levee to raise it. For maintenance placement, degree of turbulence is low, due to placement in existing confined upland PA cells, and leveed marsh cells.
4) PA and BU cells proposed for new work and maintenance material placement are existing areas above the Bay’s water column and would not result in stratifying the Bay water column into anoxic or hyper/hypo-saline conditions
5) Hydraulic dredge vessel and placement pipeline are stationary at location being dredged, and corresponding location receiving placement
6) Discharge will not occur directly into Bay water column, but onto existing levee for new work material, and into existing PA and BU marsh cells for maintenance material, which have controlled effluent discharge for dewatering or tidal exchange.
7) Material composition is 80% clays, 10% sands and 10% silt. Settling velocities are not an issue as new work material is being place out of water and maintenance materials are being placed in cells with containment/controlled discharged, and are the same in composition as material routinely placed in these cells.
4
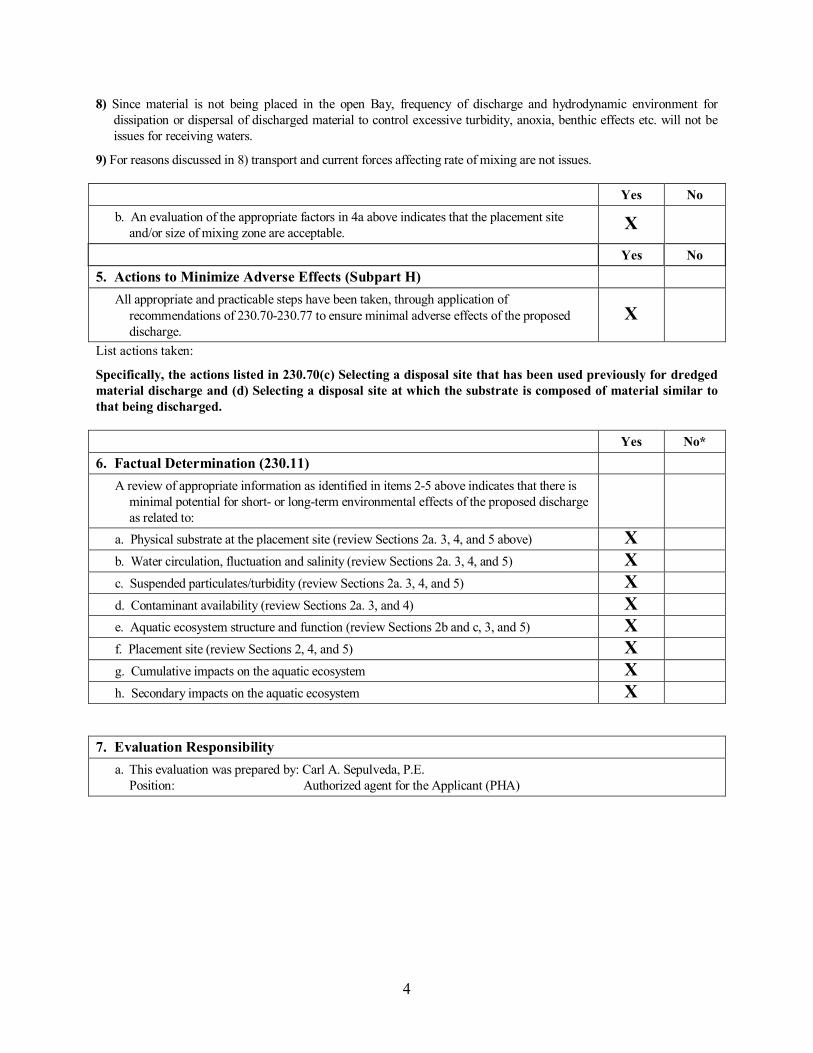
8) Since material is not being placed in the open Bay, frequency of discharge and hydrodynamic environment for dissipation or dispersal of discharged material to control excessive turbidity, anoxia, benthic effects etc. will not be issues for receiving waters.
9) For reasons discussed in 8) transport and current forces affecting rate of mixing are not issues.
Yes No b. An evaluation of the appropriate factors in 4a above indicates that the placement site
and/or size of mixing zone are acceptable. X
Yes No 5. Actions to Minimize Adverse Effects (Subpart H)
All appropriate and practicable steps have been taken, through application of recommendations of 230.70-230.77 to ensure minimal adverse effects of the proposed discharge.
X
List actions taken:
Specifically, the actions listed in 230.70(c) Selecting a disposal site that has been used previously for dredged material discharge and (d) Selecting a disposal site at which the substrate is composed of material similar to that being discharged.
Yes No*
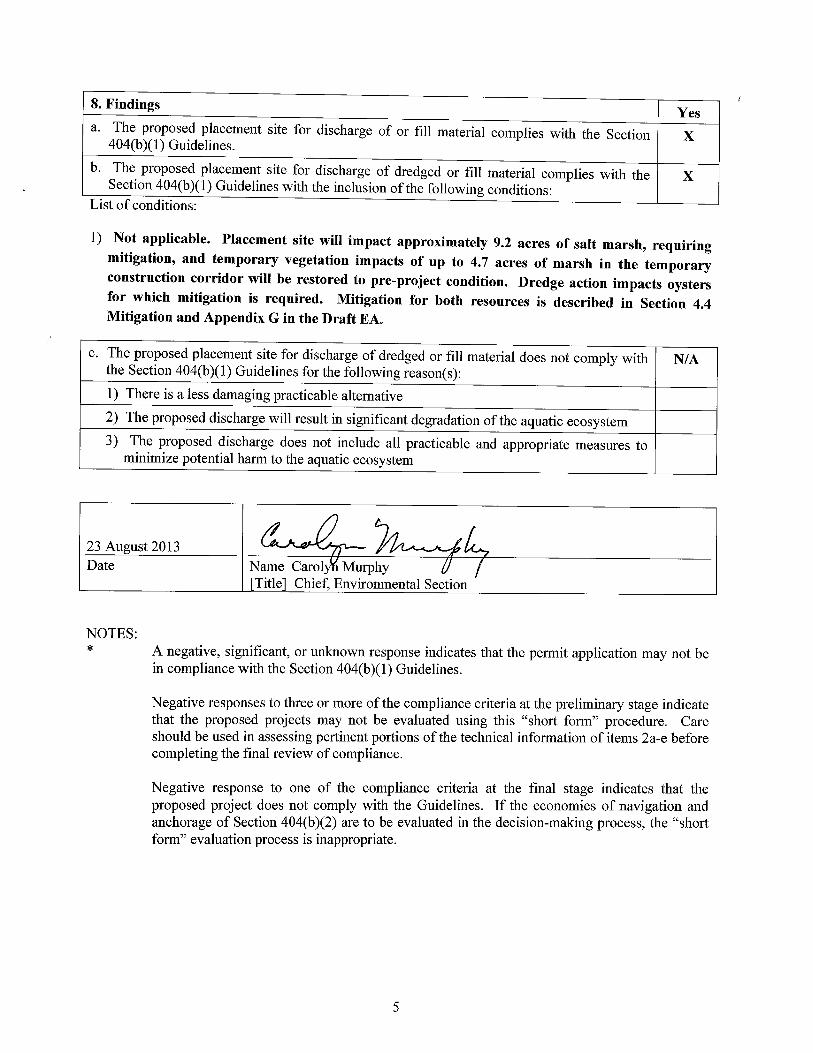
6. Factual Determination (230.11) A review of appropriate information as identified in items 2-5 above indicates that there is
minimal potential for short- or long-term environmental effects of the proposed discharge as related to:
a. Physical substrate at the placement site (review Sections 2a. 3, 4, and 5 above) X b. Water circulation, fluctuation and salinity (review Sections 2a. 3, 4, and 5) X c. Suspended particulates/turbidity (review Sections 2a. 3, 4, and 5) X d. Contaminant availability (review Sections 2a. 3, and 4) X e. Aquatic ecosystem structure and function (review Sections 2b and c, 3, and 5) X f. Placement site (review Sections 2, 4, and 5) X g. Cumulative impacts on the aquatic ecosystem X h. Secondary impacts on the aquatic ecosystem X
7. Evaluation Responsibility
a. This evaluation was prepared by: Carl A. Sepulveda, P.E. Position: Authorized agent for the Applicant (PHA)
DRAFT BIOLOGICAL ASSESSMENT Bayport Ship Channel Improvements
Harris and Chambers Counties, Texas
August 2013
Bayport Ship Channel Improvements Project Draft Biological Assessment i
TABLE OF CONTENTS
1.0 Introduction ................................................................................................................ 1-3 1.1 Purpose of the Biological Assessment ................................................................................. 1-3 1.2 Description of the Proposed Project and Existing Habitats .................................................... 1-4 1.3 Sea Turtles ......................................................................................................................... 1-5
2.0 Effects Analysis ......................................................................................................... 2-1 2.1 Effects of the Proposed Action on Listed Species ................................................................. 2-1 2.2 Sea Turtles ......................................................................................................................... 2-1
3.0 Summary ..................................................................................................................... 3-1 4.0 References .................................................................................................................. 4-1

Bayport Ship Channel Improvements Project Draft Biological Assessment ii
LIST OF TABLES
Table 1-1 Federally-Listed Threatened and Endangered Species in Chambers and Harris Counties, Texas ...... 1-4

Bayport Ship Channel Improvements Project Draft Biological Assessment 1-3
1.0 INTRODUCTION
1.1 PURPOSE OF THE BIOLOGICAL ASSESSMENT
This Biological Assessment (BA) has been prepared to fulfill the U.S. Army Corps of Engineers (USACE), Galveston District requirements as outlined under Section 7(c) of the Endangered Species Act (ESA) of 1973, as amended. This assessment is required by the USACE action to permit the proposed deepening and widening of the Bayport Ship Channel (BSC). The nonfederal sponsor and Applicant for the permit for the proposed action of deepening and widening the BSC is the Port of Houston Authority (PHA).
This BA evaluates the potential impacts the proposed BSC deepening and widening may have on federally listed threatened and endangered species identified by the U.S. Fish and Wildlife Service (USFWS) for Chambers and Harris Counties, Texas and the National Marine Fisheries Service (NMFS) for the State of Texas. Species included in this BA (Table 1-1) were identified from lists obtained from databases managed by the USFWS and NMFS (USFWS 2013a and 2013b; NMFS 2013). Additional federally protected species are listed by the Texas Parks and Wildlife Department (TPWD) as potentially occurring in Chambers and Harris Counties. However, these additional species are not covered in this BA as they were not identified on the lists obtained from the databases managed by the jurisdictional Federal agencies (USFWS and NMFS).
The bald eagle has been delisted from the Federal list of threatened and endangered species in 2007. The bald eagle still remains federally protected under both the Bald and Golden Eagle Protection Act (16 United States Code (U.S.C. 668-668c) and the Migratory Bird Treaty Act [16 U.S.C. 703-712]. The bald eagle is not included in this BA as they are no longer protected under the ESA.
The brown pelican was removed from the Federal list of endangered and threatened species on December 17, 2009 (74 Federal Register 59443), but still receives protection under the Migratory Bird Treaty Act and the Lacey Act (16 U.S.C. 3371-3378). The brown pelican is not included in this BA as they are no longer protected under the ESA.
Bayport Ship Channel Improvements Project Draft Biological Assessment 1-4
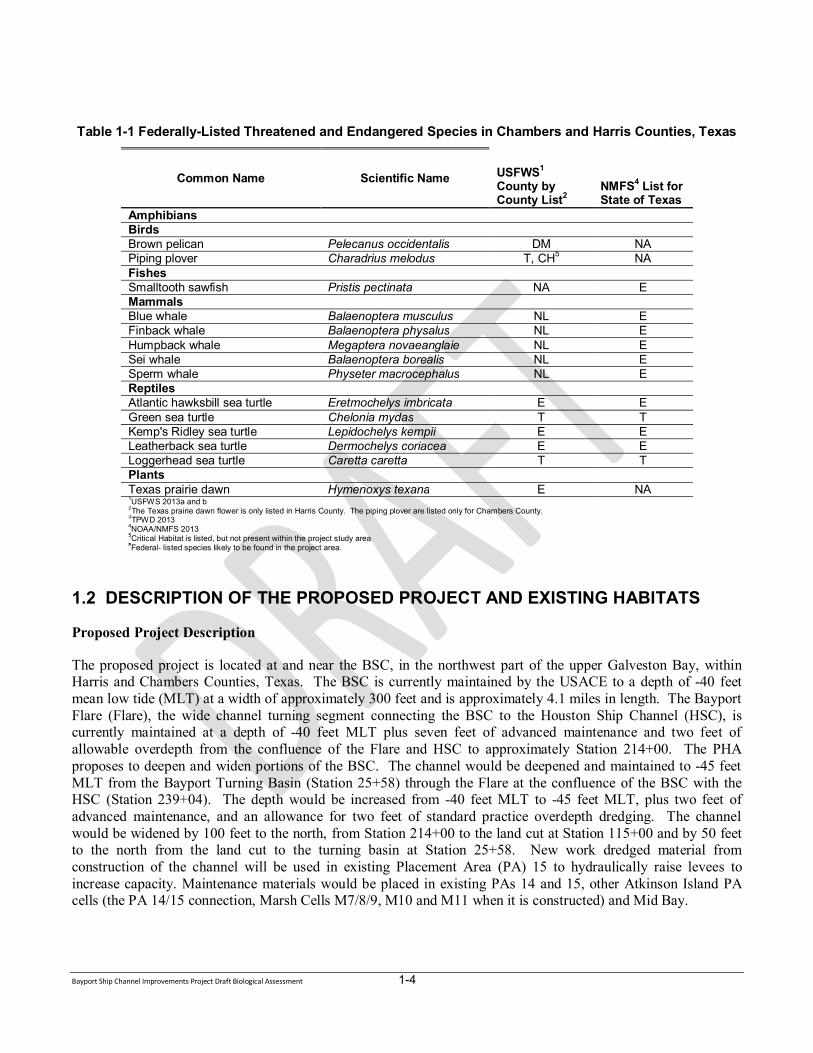
Table 1-1 Federally-Listed Threatened and Endangered Species in Chambers and Harris Counties, Texas
Common Name Scientific Name USFWS1 County by County List2
NMFS4 List for State of Texas
Amphibians Birds Brown pelican Pelecanus occidentalis DM NA Piping plover Charadrius melodus T, CH5 NA Fishes Smalltooth sawfish Pristis pectinata NA E Mammals Blue whale Balaenoptera musculus NL E Finback whale Balaenoptera physalus NL E Humpback whale Megaptera novaeanglaie NL E Sei whale Balaenoptera borealis NL E Sperm whale Physeter macrocephalus NL E Reptiles Atlantic hawksbill sea turtle Eretmochelys imbricata E E Green sea turtle Chelonia mydas T T Kemp's Ridley sea turtle Lepidochelys kempii E E Leatherback sea turtle Dermochelys coriacea E E Loggerhead sea turtle Caretta caretta T T Plants Texas prairie dawn Hymenoxys texana E NA 1USFWS 2013a and b 2The Texas prairie dawn flower is only listed in Harris County. The piping plover are listed only for Chambers County. 3TPWD 2013 4NOAA/NMFS 2013 5Critical Habitat is listed, but not present within the project study area #Federal- listed species likely to be found in the project area.
1.2 DESCRIPTION OF THE PROPOSED PROJECT AND EXISTING HABITATS
Proposed Project Description
The proposed project is located at and near the BSC, in the northwest part of the upper Galveston Bay, within Harris and Chambers Counties, Texas. The BSC is currently maintained by the USACE to a depth of -40 feet mean low tide (MLT) at a width of approximately 300 feet and is approximately 4.1 miles in length. The Bayport Flare (Flare), the wide channel turning segment connecting the BSC to the Houston Ship Channel (HSC), is currently maintained at a depth of -40 feet MLT plus seven feet of advanced maintenance and two feet of allowable overdepth from the confluence of the Flare and HSC to approximately Station 214+00. The PHA proposes to deepen and widen portions of the BSC. The channel would be deepened and maintained to -45 feet MLT from the Bayport Turning Basin (Station 25+58) through the Flare at the confluence of the BSC with the HSC (Station 239+04). The depth would be increased from -40 feet MLT to -45 feet MLT, plus two feet of advanced maintenance, and an allowance for two feet of standard practice overdepth dredging. The channel would be widened by 100 feet to the north, from Station 214+00 to the land cut at Station 115+00 and by 50 feet to the north from the land cut to the turning basin at Station 25+58. New work dredged material from construction of the channel will be used in existing Placement Area (PA) 15 to hydraulically raise levees to increase capacity. Maintenance materials would be placed in existing PAs 14 and 15, other Atkinson Island PA cells (the PA 14/15 connection, Marsh Cells M7/8/9, M10 and M11 when it is constructed) and Mid Bay.

Bayport Ship Channel Improvements Project Draft Biological Assessment 1-5
The overall project purpose is to improve navigational efficiency of the BSC to alleviate the current transit restrictions and to allow passage of larger vessels including those expected upon expansion of the Panama Canal. At the time the channel was completed in 1974, the largest container ships could hold just over 2,000 TEUs (Port Bureau, 2011). Since then, container ship sizes have grown to more than 10,000 TEU. Ships approaching this size are already calling on the BSC, even before the completion of the Panama Canal expansion. The proposed project would increase the navigational efficiency of vessel traffic already utilizing the BSC and BSCCT, and would prepare the channel and terminal for more efficient operations when future increases in large vessel traffic occur. The navigational efficiency needs driving the project are explained in more detail in the Bayport Ship Channel Improvements Draft Environmental Assessment.
Existing Habitat
The existing environment within the proposed project footprint is composed of the existing channel, shallow estuarine waters, existing active PAs and wetlands of Marsh Cell M7/8/9. Relevant natural resources data was reviewed to determine if natural resources may be located in or around the project area. Geographic Information Systems (GIS) data obtained from the Texas General Land Office (TxGLO) indicate oyster reefs within the proposed channel improvement footprint and lining the HSC near the existing PAs. Side-scan sonar surveys for mapping sea floor hard-bottom conducted in February and April 2011, and benthic characterization ground-truthing surveys performed in March and May 2011 for the EA indicated oyster reef within the channel improvement footprint. Status of Federally Listed Species Likely to Occur in the Project Area
Of the species listed in Table 1-1, sea turtles are most likely to occur in and around the project area. Other species listed are not likely to occur in the vicinity of the project due to lack of suitable habitat or the area is beyond their known range limits. There is no designated critical habitat for any of the listed species within the project area. Sea turtle species are considered in detail in the sub-sections that follow.. Other species listed in Table 1-1 are not likely to occur in and around the project area due to lack of suitable habitat and known range limits. No designated critical habitat for any of the listed species is located within the project area.
1.3 SEA TURTLES
Sea turtles may occur in the bay waters within and in the vicinity of the project area. Of the five turtle species listed by the NMFS and the USFWS, only the Kemp’s ridley, green, and loggerhead sea turtles are likely to occur in the project area. The hawksbill and leatherback sea turtles are not likely to be found within the project area due to a lack of suitable habitats. Hawksbill sea turtles prefer clear offshore waters of mainland and island shelves and therefore are unlikely to occur in the project area. They are most common where coral reef formations are present (TPWD 2013d). Leatherback sea turtles primarily inhabit the upper reaches of the ocean where deep water comes to the surface (upwelling areas) and therefore are unlikely to occur in the project area. They also frequently descend into deep waters from 650 feet to 1650 feet in depth in search of their prey such as jellyfish, tunicates, squid, fish, crustaceans, algae, and floating seaweed (TPWD 2013e).
Reasons for Protected Status
The largest threat to populations of sea turtles is the alteration of the existing environment, especially their nesting grounds and direct contact with humans. Historically, turtles declined worldwide due to the harvest of both sea turtles and their eggs from nesting grounds. It is illegal to harvest sea turtles or their eggs in the United States and in many other parts of the world, although these practices continue in some parts of the world. Sea turtles are also threatened by entanglement in commercial fishing gear, ingestion of or entanglement in marine debris, environmental contamination from industrial areas, and degradation of nesting habitat due to beach re-nourishment or beach armoring activities. The green sea turtle was designated as threatened in July 1970 and

Bayport Ship Channel Improvements Project Draft Biological Assessment 1-6
currently remains threatened in Texas. The Kemp’s ridley sea turtle was designated as endangered in December 1970 and currently remains endangered in Texas. The loggerhead sea turtle was designated as threatened in July 1978 and currently remains threatened in Texas.
Habitat
Green sea turtles are found in three distinct marine habitat types: high-energy oceanic beaches, convergence zones in pelagic habitat and benthic feeding grounds in relatively shallow, protected waters (USFWS/NMFS 1991). The females deposit eggs on the high-energy beaches above the high water line. The hatchlings take refuge and feed in the convergence zones in the open ocean. The sub-adults feed on sea-grasses, coral, and rocky bottoms.
Kemp’s ridley adults are generally found in the Gulf of Mexico waters and open ocean. Juveniles are most commonly reported in the northern Gulf of Mexico between Texas and Florida. Nesting mostly occurs on sandy beaches of Mexico. The post-pelagic stages are commonly found feeding over bottoms and juveniles are frequently found feeding in bays, coastal lagoons, and river mouths (TPWD 2013b).
Loggerhead sea turtles are found in a variety of environments such as brackish waters of coastal lagoons, river mouths, and tropical and temperate waters above 50 degrees Fahrenheit. Below 50 degrees Fahrenheit, the loggerhead sea turtles may lose their ability to swim and dive (NMFS/USFWS 2008). Loggerhead sea turtles also are found in three distinct marine habitats: oceanic beaches, pelagic convergence zones, and benthic feeding grounds of shallow waters and bays (TPWD 2013c).
Range
Green sea turtles are found worldwide in tropical and sub-tropical waters. In the United States Atlantic waters, green turtles are found around the U.S. Virgin Islands, Puerto Rico, and the continental U.S. from Texas to Massachusetts. Important feeding areas for green turtles are located in and around Florida. Major Green turtle nesting beaches in the United States are found on the Atlantic beaches along the southeast coast of Florida and in smaller numbers along the beaches of Puerto Rico and the US Virgin Islands (TPWD 2013a).
Kemp’s ridley sea turtles have one of the most restricted distributions of any species of sea turtle, occurring mainly in coastal areas of the Gulf of Mexico and the northwestern Atlantic Ocean. The major nesting beach for the Kemp’s ridley is on the northeastern coast of Mexico near Rancho Nuevo in southern Tamaulipas (TPWD 2013b).
Loggerhead sea turtles are found worldwide throughout temperate and tropical seas. Their major nesting beaches in the United States are located primarily in the southeast along the Atlantic coasts of North Carolina, South Carolina, Georgia, and Florida (TPWD 2013c).
Distribution in Texas
In Texas, green sea turtles are primarily found in the Gulf of Mexico, and sub-adults are occasionally found feeding in shallow bays and estuaries where marine sea grasses, the turtle’s principle food source, grow. The green sea turtle population in Texas once flourished but declined due to commercialized overfishing in the mid to late nineteenth century. Green sea turtles can still be found in Texas bays and estuaries of but in much-reduced numbers (TPWD 2013a).
The Kemp’s ridley migrates along the Texas coast and generally remains in near shore waters less than 165 feet deep to feed on shrimp, crab, and other invertebrates (TPWD 2013b). The smallest juveniles are found in shallow

Bayport Ship Channel Improvements Project Draft Biological Assessment 1-7
waters of bays or lagoons, often foraging in less than 3 feet of water, whereas larger juveniles and adults are found in deeper water. Almost the entire population of Kemp’s ridley turtles nest near Rancho Nuevo, Tamaulipas, Mexico, although an increasing number of nests have been found along the Texas coast. According to information from the Final Environmental Assessment Expansion of Placement Areas 14 and 15 (hereafter referred to as the “PAs 14 and 15 Expansion EA”), 10 Kemp’s ridley nests have been documented on the Bolivar Peninsula and 37 Kemp’s ridley nests have been documented on Galveston Island since 1999 (USACE 2010).
Loggerhead sea turtles are transient species along the Texas coast and in Texas bays and estuaries. Only minor and solitary nesting has been recorded along the coasts of the Gulf of Mexico. Only one nest has been documented since 1999 between both Bolivar Peninsula and Galveston Island (USACE 2010).
Presence in Project Area
Although green sea turtle nests have been not been documented on the Bolivar Peninsula or Galveston Island since 1999 (USACE 2010), and although the project area has no sea grasses, it remains likely that the green sea turtle may occur as a transient species in the project area.
It is likely that green sea turtles, Kemp’s ridley sea turtles, and loggerhead sea turtles may be found in or near the project area as a transient species, since it contains and is surrounded by a warm estuarine bay. It is unlikely that leatherback or hawksbill sea turtles would be found in or near the project area, as it does not contain suitable nesting habitat for any sea turtle species.
Bayport Ship Channel Improvements Project Draft Biological Assessment 2-1
2.0 EFFECTS ANALYSIS
2.1 EFFECTS OF THE PROPOSED ACTION ON LISTED SPECIES
The following sections provide the findings of Galveston District and species-specific avoidance, minimization, and conservation measures that support the effect determinations presented. Effect determinations are presented using the language of the ESA:
• No effect - the proposed action will not affect a federally-listed species or critical habitat;
• May effect, but not likely to adversely affect - the project may affect listed species and/or critical habitat; however, the effects are expected to be discountable, insignificant, or completely beneficial; or
• Likely to adversely affect - adverse effects to listed species and/or critical habitat may occur as a direct result of the proposed action or its interrelated or interdependent actions, and the effect is not discountable, insignificant, or completely beneficial. Under this determination, an additional determination is made whether the action is likely to jeopardize the continued survival and eventual recovery of the species.
2.2 SEA TURTLES
The sea turtles that may occur in the bay waters in or near the project area are green, Kemp’s ridley, and loggerhead sea turtles. Dredging for the proposed project would be conducted using hydraulic cutterhead dredges, which move at sufficiently slow speeds that turtles would be able to avoid the cutterhead. Additionally, a Regional Biological Opinion (RBO), dated November 19, 2003, by the NMFS for the Galveston, New Orleans, Mobile, and Jacksonville Districts of the USACE concluded that non-hopper dredges are not known to take sea turtles. A hydraulic cutterhead dredge is a non-hopper type of dredge. There is no suitable nesting habit in the project area. Therefore, it is anticipated that the project would not impact nesting or non-nesting sea turtles in the project area.
Effect Determination: No effect.
Bayport Ship Channel Improvements Project Draft Biological Assessment 3-1
3.0 SUMMARY
The proposed action is not expected to impact any listed species or their critical habitat identified in this BA. Therefore, no effect on any of the federally-listed species or their critical habitat is anticipated.
Bayport Ship Channel Improvements Project Draft Biological Assessment 4-1
4.0 REFERENCES
Federal Register. “Endangered and Threatened Wildlife and Plants; Removal of the Brown Pelican (Pelecanus occindentalis) From the Federal List of Endangered and Threatened Wildlife; Final Rule”, Volume 74, No. 220, Page 59443-59472, November 17, 2009.
National Marine Fisheries Service (NMFS). 2013. Endangered and Threatened Species and Critical Habitats under the Jurisdiction of the NOAA Fisheries Service – Texas. http://sero.nmfs.noaa.gov/pr/pdf/Texas.pdf. (Accessed May 3, 2013).
NMFS and U.S. Fish and Wildlife Service (USFWS). Recovery Plan for the Northwest Atlantic Population of the Loggerhead Sea Turtle (Caretta caretta), Second Revision. National Marine Fisheries Service, Silver Spring, MD, 2008.
Texas Parks and Wildlife Department (TPWD). 2013 http://www.tpwd.state.tx.us/gis/ris/es/ (Accessed May 2013)
TPWD. 2013a. Green Sea Turtle. http://www.tpwd.state.tx.us/huntwild/wild/species/greentur. (Accessed May 7, 2013)
______. 2013b. Kemps Ridley Sea Turtle. http://www.tpwd.state.tx.us/huntwild/wild/species/ridley. (Accessed May 7, 2013).
______. 2013c. Loggerhead Sea Turtle. http://www.tpwd.state.tx.us/huntwild/wild/species/logghead. (Accessed May 7, 2013).
______. 2013d. Hawksbill Sea Turtle. http://www.tpwd.state.tx.us/huntwild/wild/species/endang/animals/reptiles_amphibians/hawkturt.phtml. (Accessed May 7, 2013).
______. 2013e. Leatherback Sea Turtle. http://www.tpwd.state.tx.us/huntwild/wild/species/lethback (Accessed May 7, 2013).
U.S. Army Corps of Engineers (USACE). 2010. Final Environmental Assessment, Expansion of Placement Areas 14 and 15, Houston Ship Channel, Chambers County, Texas. U.S. Army Corps of Engineers – Galveston District. Galveston, Texas.
U.S. Fish and Wildlife Service (USFWS) and National Marine Fisheries Service (NMFS). 1991. Recovery Plan for U.S. Population of Atlantic Green Turtle. National Marine Fisheries Service, Washington, D.C.
USFWS. 2013a. United States Fish and Wildlife Service Endangered Species List – Chambers County, Texas. http://www.fws.gov/southwest/es/EndangeredSpecies/EndangeredSpecies_Lists/EndangeredSpecies_ListSpecies.cfm. (Accessed May 3, 2013).
______. 2013b. United States Fish and Wildlife Service Endangered Species List – Harris County, Texas. http://www.fws.gov/southwest/es/EndangeredSpecies/EndangeredSpecies_Lists/EndangeredSpecies_ListSpecies.cfm. (Accessed May 3, 2013).

DRAFT DOCUMENT
BSC Improvements Section 408 and Section 204(f) AOM Draft EA
Appendix C Draft General Conformity Determination
Bayport Ship Channel Improvements Draft General Conformity Determination
In Support of Department of the Army
Permit Application SWG-2011-01183
U.S. Army Corps of Engineers, Galveston District
March 2013
Table of Contents
SEcnON liNTRODUCnON .. ........ ............. ........ ............................. ....................... ......... ..... ..... .......... ........ 1
1.1
1.1.1
1.1.2
Project Background .. .............. ...... ................................................. .... ... .............. .......... ............ . 1
Project Description and Purpose ............................................... .................... ............. .. ........... 2
Need fo r Project ... .............. .... ............... .......... ........... ...... ........................ .. ................. ........... .... 6
1.2 Regulatory Background ... ... .... ............ ......................................... .......... ..... ......... ....... ....... .. .. .. .. 6
SECTION 2 PROJ ECT CONSTRUCTION EMISSIONS ...................... ............... ............................. ....... 11
2.1 Dredging Equipment and Supporting Vessel E missions ....... ............................. ......... ...... 11
2.2 Dredged Material Placement Site Work ........... ...... ...... ....... .... ....... ......................... ...... ....... 12
2.3 Employee V chicle Commuting .............. ........ .... ............ ................. .... ........ .. ...... ................ ... 12
SECT ION 3 G EN ERAL CONFORMITY EVALUATION ........................................... ............. .......... .... 13
SECTION 4 PRELIMINARY GENERAL CONFORM ITY DETERMINATION ............. ........ ... ... .. 17
REFERENCES ............................... ...... ............................. ................................. ...... ..... ..... .............. .. ... .......... ..... 20
Attachment A - Emission Estimation Detai ls
Attachment B - February 7, 2013, Applicant Letter to the Texas Commission on Environmental Quality (TCEQ) Requesting General Conformity Concurrence
Attachment C - February 20, 2013, TCEQ Letter, General Confonnity Concurrence
As directed by the U.S. Anny Corps of Engineers (USACE) Galveston District for compliance with General Confonnity regulations promulgated in 40 CFR Part 93 (Detennining Conformity of Federal Actions to State or Federal Lmplementation Plans) the Port of Houston Authori ty (PHA) provided a draft of this document to the USACE. The PHA draft was prepared for the PHA by Starcrest Consulting Group, LLC, under subcontract to the l oint Venture of Turner Collie & Braden Inc., and Gahagan & Bryant Associates, Inc.
SECTION 1 INTRODUCTION
The Port of Houston Authority (PHA), Harris County, Texas (hereinafter referred to as "the App licant") applied to the U.S. Army Corps of Engineers (USACE) Galveston District for a Department of the Army (DA) Pennit, under Section 404 of the Clean Water Act Section and Section 10 of the Rivers and Harbors Act of 1899, for dredge and fill activities related 10 the improvements of portions of the Bayport Ship Channel (BSC), hereinafter referred to as "the proposed project", on December 6, 201 1. The pennit was applied for through DA Permit Application SWG-20 11-0 1183. The proposed project requires dredging in navigable waters to deepen and widen portions of the BSe, and potential placement offi ll in waters of the United States, both regulated activities under the jurisdiction of the USACE. In accordance with the General Confonnity (GC) regulations promulgated under the Clean Air Act in 40 CFR Part 93 Subpart B (Determining Conformity of Federal Actions to State or Federal Implementation Plans), this Draft General Conformity Determination has been prepared to analyze and document the GC-re lated air emissions that would result from the proposed project and document that these emissions conform to the last U.S. Environmental Protection Agency (USEPA) approved State Implementation Plan (SIP) applicable to the HoustoniGalvestonlBrazoria (HGB) ozone non-attainment area.
1.1 Project Background
The Applicant is an autonomous governmental entity created in 1927 by a special act of the Texas Legislature (article lit, section 52 of the Texas Constitution, Act of 1927, 40th Legislature, R.S., Chapter 97, § 1, 1927 Texas General Laws 256, 256-57), with a mission to provide, operate, and maintain waterways and cargo/passenger facilities. Its mission is also to promote trade and generate favorable economic effects upon, and contribute to, the economic development of the Applicant, the City of Houston, and the communities of Harris County and the Texas Coastal Region. This mission is to be accomplished in a manner that provides sufficient funds to cover the Applicant 's operational expenses and capital investments.
The Port of Houston is ranked first among U.S. ports in foreign waterborne tonnage (1 4 consecutive years); first in U.S. imports (19 consecutive years); second in U.S. export tonnage and second in the U.S. in total tonnage (19 consecutive years) [PHA, 2010]. More than 220 million tons of cargo moved through the Port of Houston in 2009. More than 7,700 vessel calls were recorded at the Port of Houston in 2009 (PHA, 2010). The Port of Houston is horne to the world's second largest petrochemical complex. The size of the refining industry plus the concentration of other energy sector services and industry (e.g. equipment manufacturing) in the area help position the Port of Houston as one of the few ports that exports more goods than it imports.
Based on container cargo processed through its facili ties, the Port of Houston is the seventh largest container port in the U.S., and the leading container port on the Gulf Coast. It handles almost over 65 percent of the container traffic in the Gulf Coast region and over 94 percent of the container traffic in Texas (PHA, 20 11 ). The Port of Houston is a 52-mile-long complex of diversified public and private port faci li ties located in southeastern Texas. These fac ili ties include the Houston Ship Channel (HSC), its tributary channels and basins which extend from Morgan ' s Point to the HSC Turning Basin within the City of Houston, Buffalo Bayou from the HSC Turning Basin to Main Street, and the BSC. The facilities include a container terminal at Barbours Cut Terminal (BCT) at
Bayport Ship Channel Improvements Draft General Confonnity Detennination
1 March 2013
Morgan ' s Point, and a container tenninal at the Bayport Ship Channel Container Tenninal (BSCCT) on the BSe. There are also two privately-owned liquid cargo tenninals to serve the petrochemical complex located next to the BSCCT. There are other smaller facilities along the HSC around the HSC Turning Basin that have been used to handle containerized cargo; however, these facilities serve smaller vessels, have insufficient shore-side handling and storage, are not designed for modernized container operations, and are not suited for this use. Therefore, the BCT and BSCCT have been the primary container tenninals for the Port of Houston.
The BSC began with a series of agreements in 1964 between Humble Oil and Refining Company and the Harris County HSC Navigation District (now the PHA) to dredge a new side channel to connect to the HSC in the present-day location of the BSe. A 10-foot deep, 100-foot wide barge channel was completed in 1966, and later deepened to 12 feet (ft) in 1970 as the first phase of the project. The second phase began in 1972 and was completed in 1977, resulting in the Bayport Turning Basin, aids to navigation, dredged material placement, drainage structures, access roads, and railroad modifications on the property on the south side of the channel within the land cut. The land cut is the portion of the channel that was created by cutting into the mainland. The BSC channel was later deepened in 1974 to its current authorized depth of -40 ft mean low tide (ML T) in order to handle a design vessel drafting 36 ft, pursuant to DA pennit number 6140. Federal maintenance of the BSC was authorized by an amendment to Section 819 of the Water Resources Development Act (WRDA) of 1986, Public Law 99-662. The USACE assumed maintenance of the channel in April 1993 with a Local Cooperation Agreement (LCA) authorized by the WRDA 1986 amendment.
A Twenty-foot Equivalent Unit (TEU) is a standard measure of cargo volume equal to the volume ofa standardized twenty-foot-Iong shipping container. The Port of Houston handled 1,057,869 TEUs in 2001 with most of this (911 ,903 TEUs) handled at the BCT, the Applicant' s then-primary facility. This exceeded the practical annual throughput capacity of that facility, and regional container vessel traffic was expected to increase. Container throughput in Houston had risen at an average growth of more than 10 percent per year since 1992, a rate among the highest in the world. Therefore, the Applicant sought to develop new container and cruise tenninal facilities at the BSC to meet current and anticipated future needs. Planning for these facilities resulted in the Final Environmentalimpaci Statement (FEIS) for Port of Houston Authority 's Proposed Bayport Ship Channel Container/Cruise Terminal, dated May 2003, hereafter referred to as the "Bayport Ship Channel Container/Cruise Tenninal FEIS" (BSCCT FEIS). Construction started in 2004, with the first phase completed in January 2007, providing three of the seven planned container ship berths.
1.1.1 Project Description and Purpose
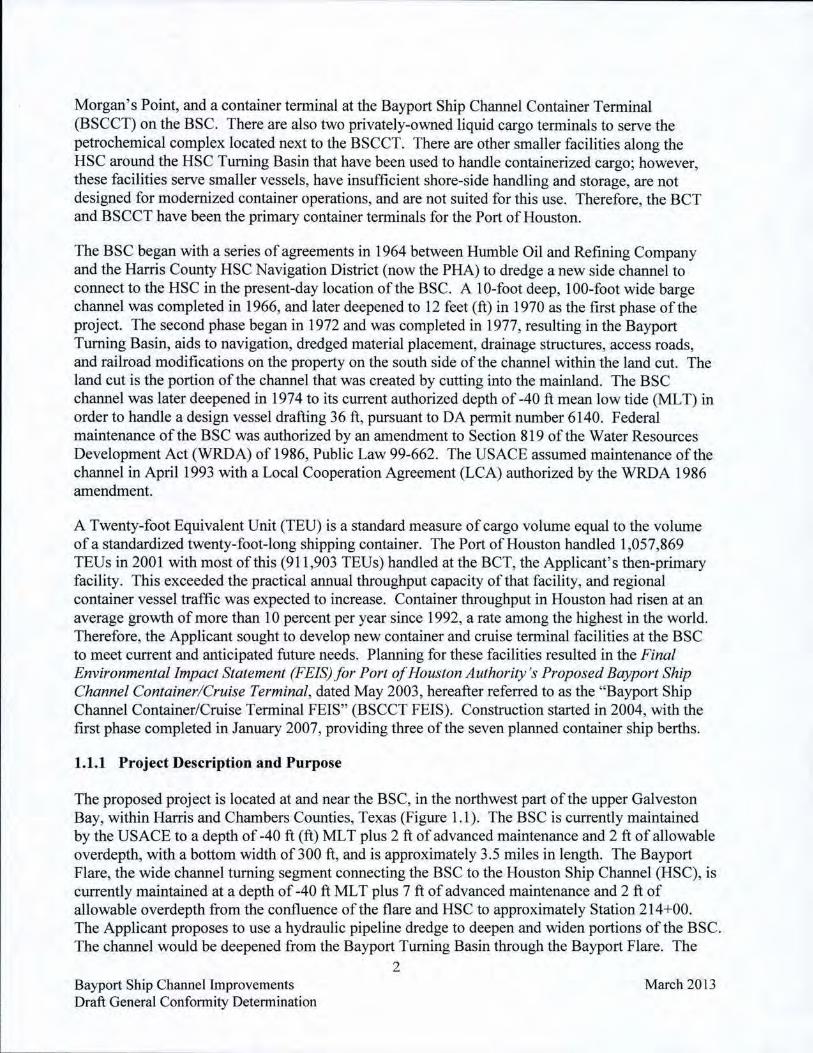
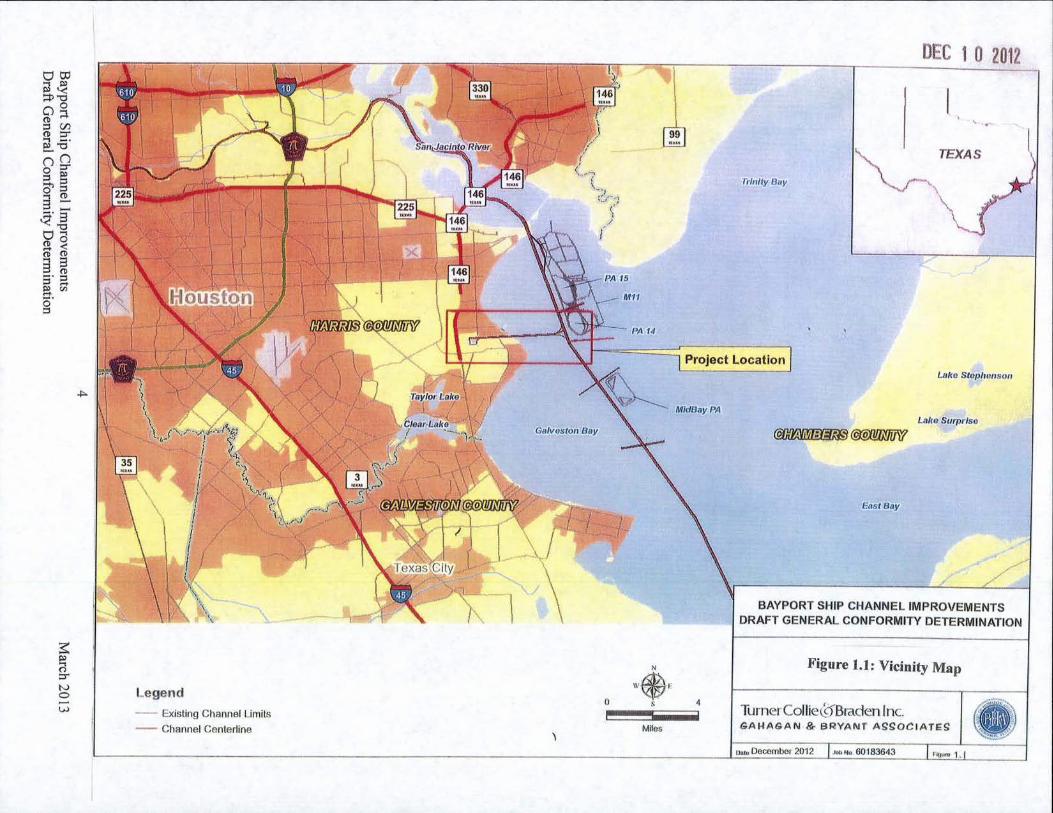
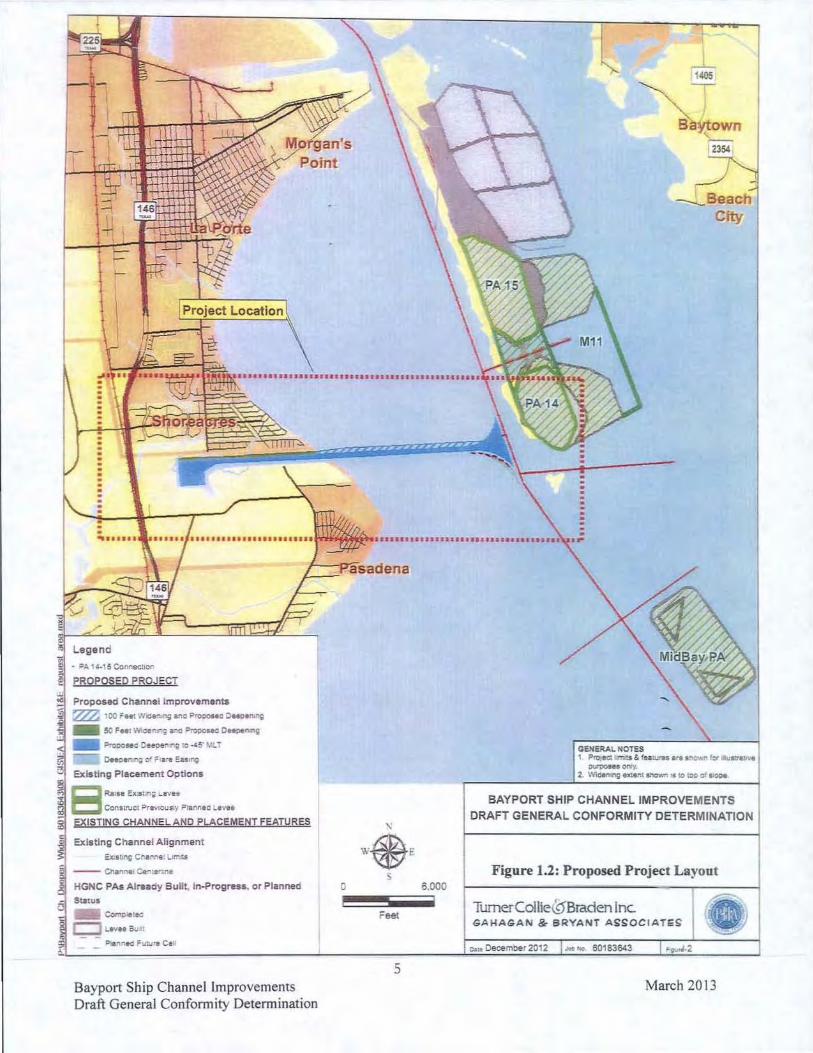
The proposed project is located at and near the BSe, in the northwest part of the upper Galveston Bay, within Harris and Chambers Counties, Texas (Figure 1.1). The BSe is currently maintained by the USACE to a depth of -40 ft (ft) ML T plus 2 ft of advanced maintenance and 2 ft of allowable overdepth, with a bottom width of 300 ft , and is approximately 3.5 miles in length. The Bayport Flare, the wide channel turning segment connecting the SSC to the Houston Ship Channel (HSC), is currently maintained at a depth of -40 ft ML T plus 7 ft of advanced maintenance and 2 ft of allowable overdepth from the confluence of the flare and HSC to approximately Station 2 14+00. The Applicant proposes to use a hydraulic pipeline dredge to deepen and widen portions of the SSe. The channel would be deepened from the Bayport Turning Basin through the Bayport Flare. The
Bayport Ship Channel Improvements Draft General Confonnity Detennination
2 March 2013
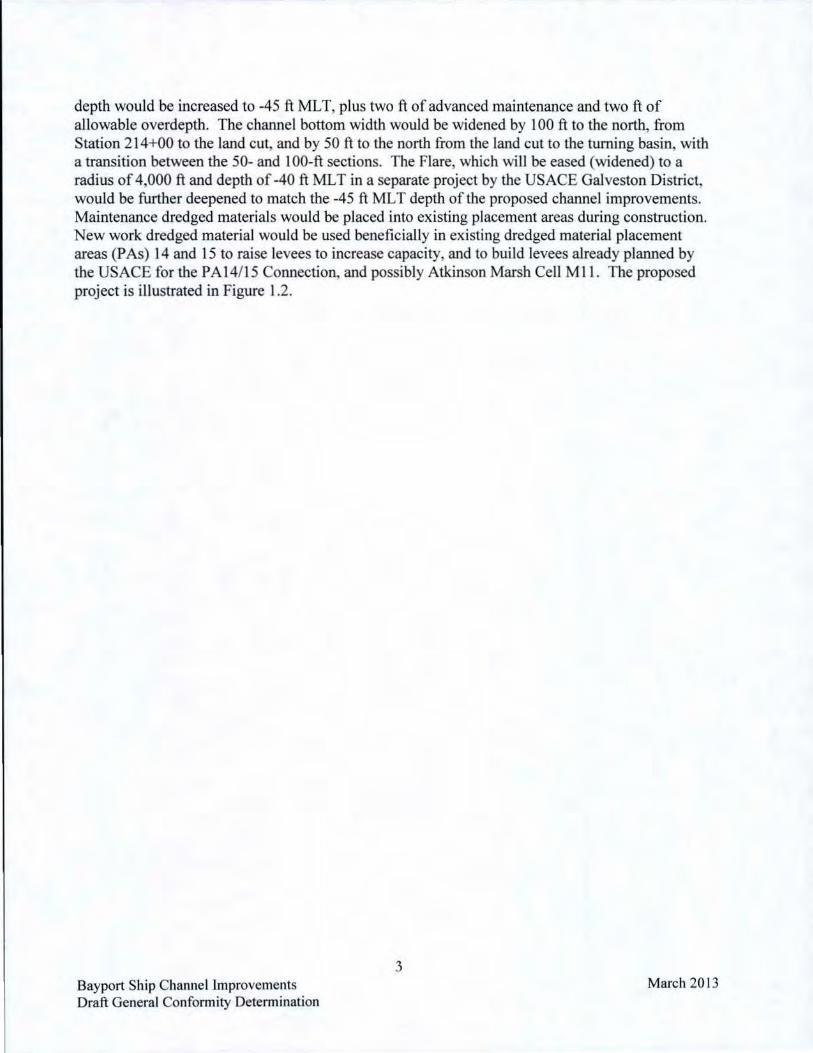
depth would be increased to -45 ft MLT, plus two ft of advanced maintenance and two ft of allowable overdepth. The channel bottom width would be widened by 100 ft to the north, from Station 214+00 to the land cut, and by 50 ft to the north from the land cut to the turning basin, with a transition between the 50- and IOO-ft sections. The Flare, which will be eased (widened) to a radius of 4,000 ft and depth of -40 ft MLT in a separate project by the USACE Galveston District, would be further deepened to match the -45 ft MLT depth of the proposed channel improvements. Maintenance dredged materials would be placed into existing placement areas during construction. New work dredged material would be used beneficially in existing dredged material placement areas (PAs) 14 and 15 to raise levees to increase capacity, and to build levees already planned by the USACE for the PA 14115 Connection, and possibly Atkinson Marsh Cell M II . The proposed project is illustrated in Figure 1.2.
Bayport Ship Channel Improvements Draft General Confonnity Detennination
3 March 2013
OOl il ~ ", " oil o " " V> . ". ~ 'i5 ' ()() o ". a,§ 3 !!. - 3' "'" 0-o 0 ~ ri H _. " " -~ ~
g'
s: ~
<1 ".
~ ~
...
~ \ J
\+
Legend
-- Existing Channel Limits
-- Channel Centerline
\~PA" ",,11
I'A 14
GaNus /on llDY
" ·~f} , , .... ,
DEC 1 0 2012
TEXAS
Trlnlly OllY
Project Location
MIdRayPA
•
wire Sl lJplwnsoll
(alra S urprise
~W!!JNi!i7
E"SI Blly
BAYPORT SHIP CHANNEL IMPROVEMENTS DRAFT GENERAL CONFORMITY DETERMINATION
Figure 1.1: Vicinity Map
TurnerCollie0 Braden Inc. GA H AGA N & BRYANT ASSOC I A TES
PROpOSER PROJECT
Proposl'd Chann~ Improv_m_na
~ 100 F ... WClen;t\Q anc PfoooMa OHIIWMII
_ 50 F .. , 'Ma.t\r~ ..... ~ 0_'
_1>roc>o"~~IO .. !·.uLj
_ ~(llF'."'£ao~
Ex'-tlnll PI.c.m.nt Options
8~!>"'''' 1i ~ '''''· eon.""eI Pr.....,.,~ i>r.,.".o Ll YN
EXISTING CHANNEL AND PLACEMENT FEATURES
Exlstlnll Cnann_1 AHgnm.nt
S-""G (;n. ".,.l lJmU
-- er. .. ~".. CI<l.tr.t..,.
HGNC PAa Al r •• dy Built. In-Progr_ ... or Planned
!lUU'" -~,..,
~Uv"S;;tI ~nec ''''''''C'''
Bayport Ship Channel Improvements Draft. General Confonnity Detennination
0
, w. ' s 6.000
Feel
5
City
BAYPORT SHIP CHANNEL IMPROVEMENTS
DRAFT GENERAL CONFORMITY DETERMINATION
Figure 1.2: Proposed Project Layout
TumerCoIlie0 Braden Inc. GAIotAGAN &- BRYANT ASSOC1AT ii S
March 20 13
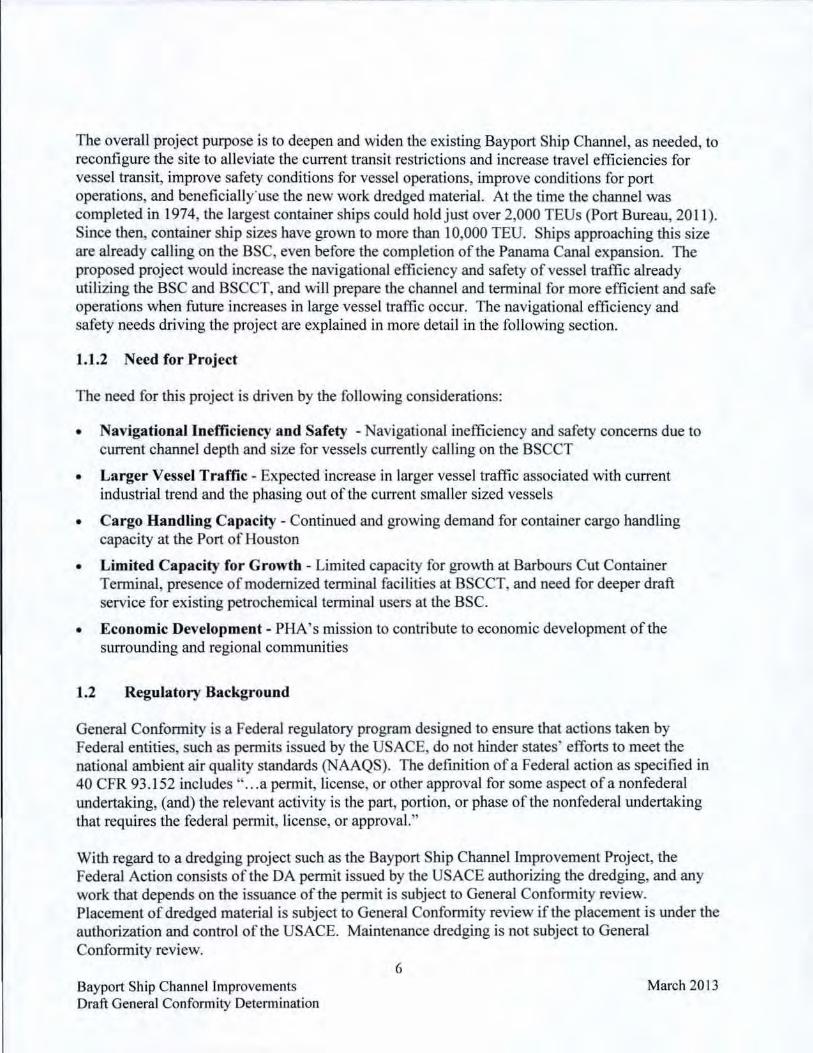
The overall project purpose is to deepen and widen the existing Bayport Ship Channel, as needed, to reconfigure the site to alleviate the current transit restrictions and increase travel efficiencies for vessel transit, improve safety conditions for vesse l operations, improve conditions for port operations, and beneficially 'use the new work dredged material. At the time the channel was completed in 1974, the largest container ships could ho ld just over 2,000 TEUs (Port Bureau, 201 1). Since then, container ship sizes have grown to more than 10,000 TEU. Ships approaching this size are already caJling on the BSC, even before the completion of the Panama Canal expansion. The proposed project would increase the navigational efficiency and safety of vessel traffic already utilizing the BSC and BSCCT, and will prepare the channel and terminal for more efficient and safe operations when future increases in large vessel traffic occur. The navigational efficiency and safety needs driving the project are explained in more detai l in the following section.
1.1.2 Need for Project
The need for this project is driven by the following considerations:
• Navigationallnefficicncy and Safety - Navigational inefficiency and safety concerns due to current channel depth and size for vessels current ly calling on the BSCCT
• Larger Vcsscl Traffic - Expected increase in larger vessel traffic associated with current industrial trend and the phasing out of the current smaller sized vessels
• Cargo Handling Capacity - Continued and growing demand for container cargo handling capacity at the Port of Houston
• Limited Capacity for Growth - Limited capacity for growth at Barbours Cut Container Tenninal, presence of modernized terminal faci li ties at BSCCT, and need for deeper draft service for existing petrochemical terminal users at the BSe.
• Economic Development - PHA's mission to contribute to economic development of the surrounding and regional communities
1.2 Regulatory Background
Genera1 Conformity is a Federal regulatory program designed to ensure that actions taken by Federal entities, such as permits issued by the USACE, do not hinder states' efforts to meet the national ambient air quality standards (NAAQS). The definition of a Federal action as specified in 40 CFR 93.152 includes ..... a permit, li cense, or other approval for some aspect ofa nonfederal undertaking, (and) the relevant activity is the part, portion, or phase of the non federal undertaking that requires the federal permit, license, or approval."
With regard to a dredging project such as the Bayport Ship Channel Lmprovement Project, the Federal Action consists of the DA permit issued by the USACE authorizing the dredging, and any work that depends on the issuance of the permit is subject to General Conformity review. Placement of dredged material is subject to General Conformity review if the placement is under the authorization and control of the USACE. Maintenance dredging is not subject to General Conformity review.
Bayport Ship Channel Improvements Draft General Confonnity Determinat ion
6 Man:h 20 13

The USEPA has established a series of steps to determine whether a given Federal Action is subject to General Conformity review as follows (US EPA, 2010):
I. Whether the action wi ll occur in a nonattainment or maintenance area (see Table 1-1 below for the attainment status of the project area);
2. Whether one or more of the specific exemptions apply to the action;
3. Whether the federal agency has included the action on its list of "presumed to conform" actions;
4. Whether the total direct and indirect emissions are below or above the de minimis levels (see Table 1-2 below for the de minimis levels); and/or
5. Where the facility has an emission budget approved by the state as part of the SfP, the federal agency determines if the emissions from the proposed action are within the budget.
Regarding the proposed Bayport Channel Improvement Project,
1. The action wi ll be occurring in the 8-county Houston-Galveston-Brazoria (HGB) ozone nonattainment area, which is designated as a severe nonattainment area (NAA) for the 1997 ozone standard and as marginal nonattainment for the 2008 ozone standard;
2. None of the specific exemptions apply to the action, except to the extent that any of the dredging to be carried out is maintenance dredging, which is specifically exempt;
3. The USACE has not included dredging projects on a list of "presumed to conform" actions;
4. Total direct and indirect emissions, as currently estimated, will exceed the de minimis levels of25 tons for oxides of nitrogen (NOx) and vo latile organic compounds (VOCs) in a severe ozone nonattainment area and onl y the de minimis level of 100 tons of NO x in a marginal nonattainment area. (see Table 2-1 in Section 2 for estimated project related emissions); and
5. The Port of Houston Authority does not possess an emissions budget approved as part of the HOB area SIP.
Based on the discussion presented above and the emissions presented below in Section 2, a General Conformity determination is required for both NOx and VOC emissions from the proposed project. Since the action is required to demonstrate conformity, one or more of the fo llowing conditions must be met (USEPA 2010).
I. Demonstrating that the total direct and indirect emissions are specifically identified and accounted for in the applicable SIP;
Bayport Ship Channel Improvements Draft General Confonnity Detennination
7 March 2013

2. Obtaining a written statement from the state documenting that the total direct and indirect emissions from the action, along with all other emissions in the area, will not exceed the SIP emission budget;
3. Obtaining a written commitment from the state to revise the SIP to include the emissions from the action;
4. Obtaining a statement from the metropolitan planning organization (MPO) for the area documenting that anyon-road motor vehicle emissions are included in the current regional emission analysis for the area's transportation plan or transportation improvement program;
5. Fully offsetting the total direct and indirect emissions by reducing emissions of the same pollutant or precursor in the same nonattainment or maintenance area.
A sixth potential demonstration method, conducting air quality modeling that demonstrates that the emissions will not cause or contribute to new violations of the standards, or increase the frequency or severity of any existing violations of the standards, is not available for the proposed project because modeling is not acceptable for ozone nonattainment areas due to the complexity of ozone formation from precursor pollutants and the limitations of current air quality models.
Of the options detai led above, the Applicant elected to utilize the second option, obtaining concurrence from the Texas Commission on Environmental Quali ty (TCEQ) that the total direct and indirect NO,.; and VOC emissions from the action will not exceed the applicable SIP as well as the most recent TCEQ adopted SrP emissions budget, because of the very low level of emissions compared with the SIP budget, and the temporary nature of the emissions. It is important to note that only a small portion of project emissions would occur in 20 16, and no emissions would occur during 2017 and 2018, the three years that wi ll be used to determine attainment in 201 9.
Bayport Ship Channel Improvements Draft General Confonnity Determination
8 March 20 13
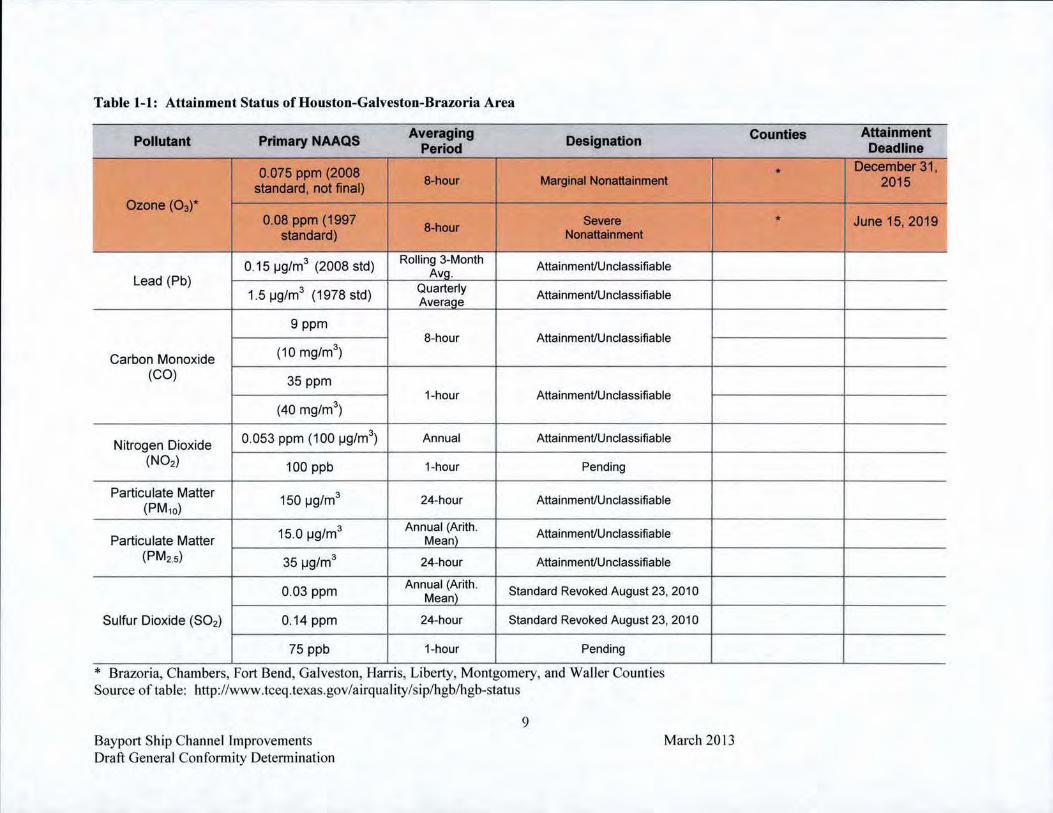
Ta ble I-I : Attainment Status of Houston-Galveston- Brazoria Area
Pollutant Primary NAAQS
0.075 ppm (2008 standard, not final)
Ozone (0 ,)" 0.08 ppm (1997
standard) -
0 .15 ~g/m' (2008 sId) Lead (Pb)
1.5 ~g/m' (1978 sId)
9 ppm
Carbon Monoxide (10 mg/m3
)
(CO) 35 ppm
(40 mg/m3)
Nitrogen Dioxide 0.053 ppm (100 ~g/m')
(NO,) 100 ppb
Particulate Matter 150 IJg/m3
(PM1o)
Particulate Matter 15.0 j.Jg/m3
(PM, .,) 35 1l9/m3
0.03 ppm
Sulfur Dioxide (S02) 0.14 ppm
75 ppb -
Averaging Period - - ----
8-hour
8-hour
Rolling 3-Month A,g .
Quarterly AveraQe
a-hour
1-hour
Annual
1-hour
24-hour
Annual (Arith. Mean)
24-hour
Annual ~rith . Mean
24-hour
1-hour
Designation
Marginal Nonattainment
Severe Nonattainment
- -,
AtiainmenVUndassifiable
AllainmenVUndassifiable
AttainmenVUndassifiable
AltainmentiUndassifiable
AttainmentfUndassifiable
Pending
AttainmenVUndassifiable
AttainmenUUndassifiable
AttainmenUUnclassifiable
Standard Revoked August 23,2010
Standard Revoked August 23, 2010
Pending
• Brazor ia, Chambers, Fort Bend, Galveston, Harri s, L iberty, Montgomery, and Waller Counties Source of table: httpj/www.tceq.texas.gov/airquality/siplhgblhgb-status
Bayport Ship Channel Improvements Draft Genera l Confonnity Detenninat ion
9 Ma.-ch 2013
Counties
"
"
. .-
Attainment Deadline - --- ----
December 31 . 2015
June 15. 2019
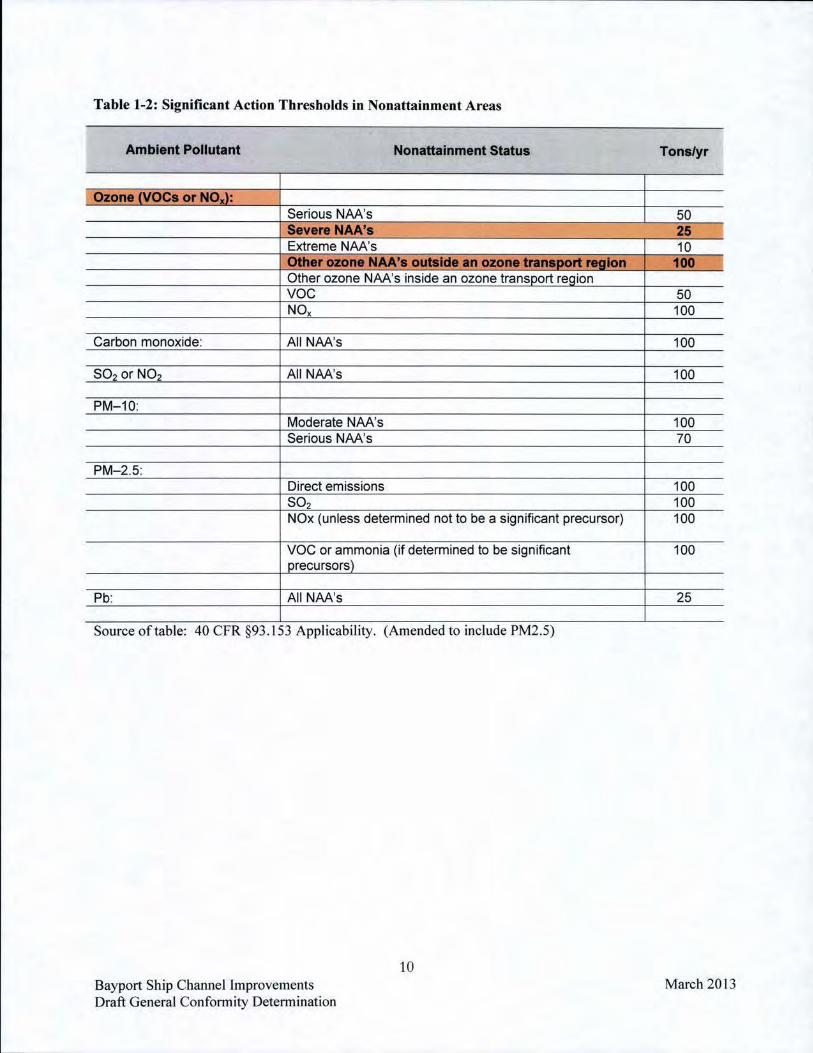
Table 1-2 : Significant Action Thresholds in Nonattainment Areas
Ambient Pollutant Nonattalnment Status
I I~I:
~ , NAI :s
18. ~ozon. NAA's inside an
VOC I NC
( fIiJiNAA'S
so. or NO. All NAA's
,NAA's ; NAA's
I~ ;
~ I ; I nollobe.
VOCor ; I (;f U"'""";""" to be ; ;
Pt All NM's
Source of table: 40 CFR §93.153 I to I , PM2S
Bayport Sh ip Channel Improvements Draft General Confonn ity Determination
10
Tonslyr
b reo;on
50 10C
10C
10C
10C
10C
"I -Wo-"" 100
25
March 201 3
SECTION 2 PROJECT CONSTRUCTION EMISSIONS
Project construction emissions have been estimated using equipment and activity estimates provided by the project engineers and emission factors and other information from published sources, including the applicant's recent ly released air emissions inventory, 2007 Goods Movement Air Emissions Inventory at the Pori of Houston (Starcrest 2009), and the emission estimating model MOBILE6.2. Use of the Goods Movement Emissions Inventory CGMEI) as a source of emission factors and other emissions-related information ensures that the emission estimates presented in this conformity determination are consistent with the applicant' s portwide inventory of air emissions.
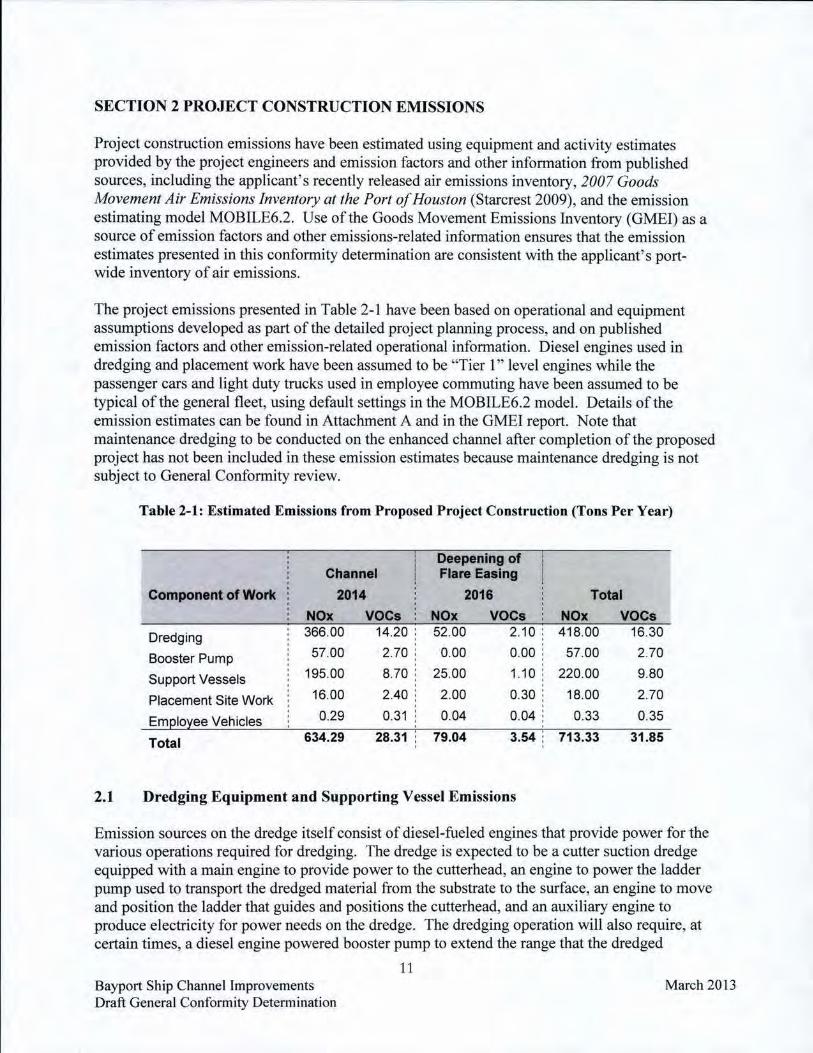
The project emissions presented in Table 2- 1 have been based on operational and equipment assumptions developed as part of the detailed project planning process, and on published emission factors and other emission-related operational infonnation. Diesel engines used in dredging and placement work have been assumed to be "Tier 1" level engines whi le the passenger cars and light duty trucks used in employee commuting have been assumed to be typical of the general fleet , using default settings in the MOBlLE6.2 model. Detai ls of the emission estimates can be found in Attachment A and in the GMEI report. Note that maintenance dredging to be conducted on the enhanced channel after completion of the proposed project has not been included in these emission estimates because maintenance dredging is not subject to General Confonnity review.
Table 2-1: Estimated Emissions from Proposed Project Construction (Tons Per Year)
Deepening of Channel Flare Easing
Component of Work 2014 2016 Total
NOx voe. NOx voe. NOx voe. Dredging 366.00 14.20 : 52.00 2.10 418.00 16.30
Booster Pump 57.00 2.70 0.00 0.00 57.00 2.70
Support Vessels 195.00 8.70 25.00 1.10 220.00 9.80
Placement Site Work 16.00 2.40 2.00 0.30 18.00 2.70
Emf!:lo:tee Vehicles 0.29 0.31 0.04 0.04 0.33 0.35
Tota l 634.29 28.31 79.04 3.54 713.33 31.85
2.] Dredging Equipment and Supporting Vessel Emissions
Emission sources on the dredge itself consist of diesel-fueled engines that provide power for the various operations required for dredging. The dredge is expected to be a cutter suction dredge equipped with a main engine to provide power to the cutterhead, an engine to power the ladder pump used to transport the dredged material from the substrate to the surface, an engine to move and position the ladder that guides and positions the cutterhead, and an auxiliary engine to produce electricity for power needs on the dredge. The dredging operation wi ll also require, at certain times, a diesel engine powered booster pump to extend the range that the dredged
Bayport Ship Channel Improvements Draft General Confonnity Determination
11 March 2013
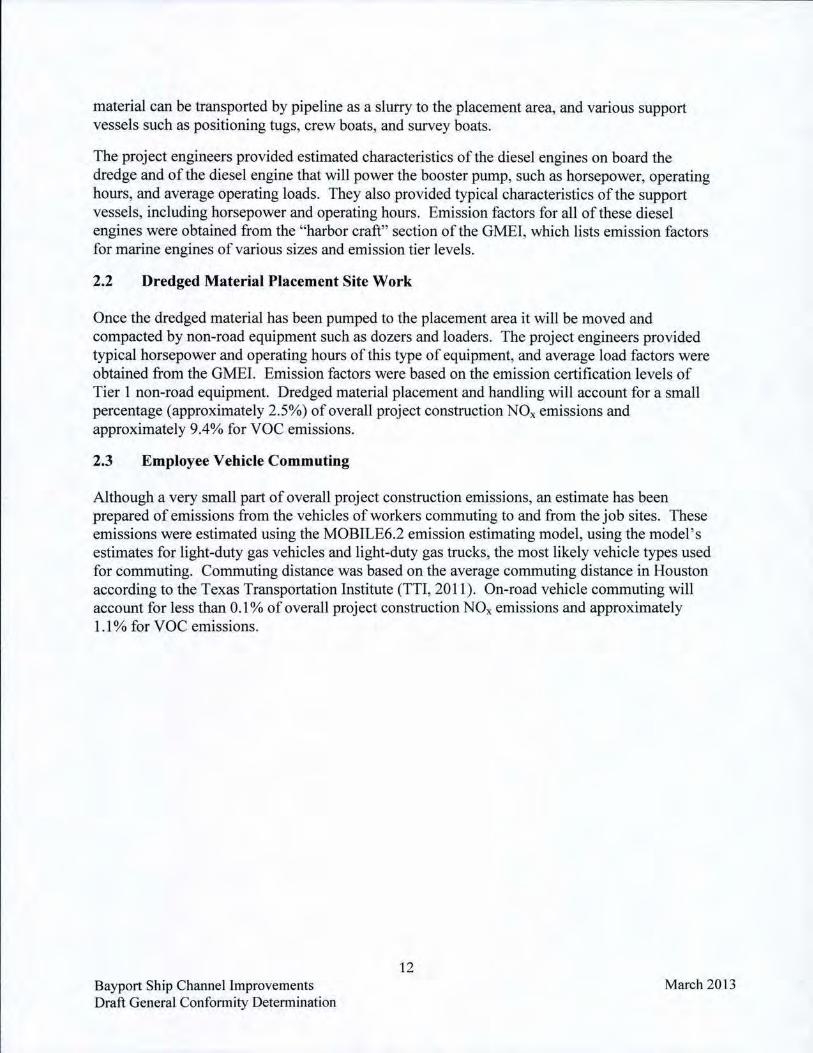
material can be transported by pipeline as a slurry to the placement area, and various support vessels such as positioning tugs, crew boats, and survey boats.
The project engineers provided estimated characteristics of the diesel engines on board the dredge and of the diesel engine that will power the booster pump, such as horsepower, operating hours, and average operating loads. They also provided typical characteristics of the support vessels, including horsepower and operating hours. Emission factors for all of these diesel engines were obtained from the "harbor craft" section of the GMEl, which lists emission factors for marine engines of various sizes and emission tier levels.
2.2 Dredged Material Placement Site Work
Once the dredged material has been pumped to the placement area it will be moved and compacted by non-road equipment such as dozers and loaders. The project engineers provided typical horsepower and operating hours of this type of equipment, and average load factors were obtained from the GMEI. Emission factors were based on the emission certification levels of Tier I non-road equipment. Dredged material placement and handling will account for a small percentage (approximately 2.5%) of overall project construction NO,; emissions and approximately 9.4% for VOC emissions.
2.3 Employee Vehicle Commuting
Although a very small part of overall project construction emissions, an estimate has been prepared of emissions from the vehicles of workers commuting to and from the job sites. These emissions were estimated using the MOBILE6.2 emission estimating model , using the model's estimates for light-duty gas vehicles and light-duty gas trucks, the most likely vehicle types used for commuting. Commuting distance was based on the average commuting distance in Houston according to the Texas Transportation Institute (TTl, 2011). On-road vehicle commuting will account for less than 0.1 % of overall project construction NOx emissions and approximately 1.1 % for VOC emissions.
Bayport Ship Channel Improvements Draft General Confonnity Detennination
12 March 201 3
SECTION 3 GENERAL CONFORMITY EVALUATION
To demonstrate that the project construction NOx and VOC emissions can be accommodated in the HOB SIP emissions budgets, the most recent US EPA-approved ozone SIP demonstration l
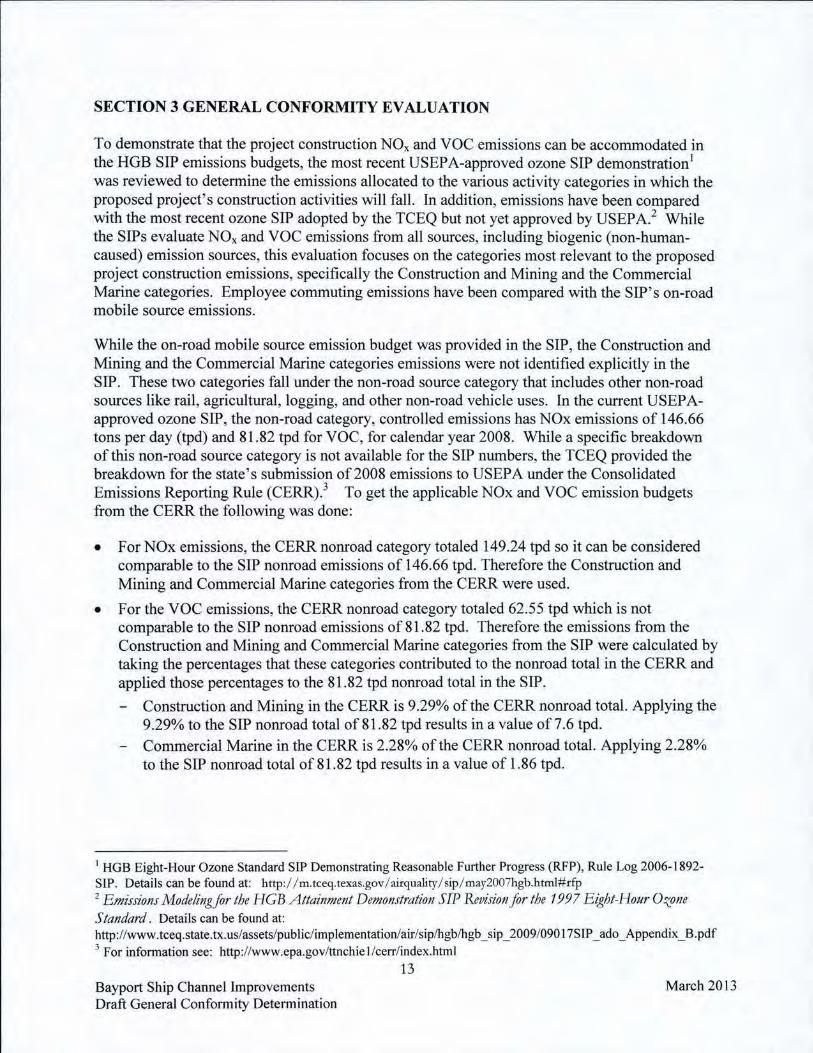
was reviewed to determine the emissions allocated to the various activity categories in which the proposed project's construction activities will faiL In addition, emissions have been compared with the most recent ozone SIP adopted by the TCEQ but not yet approved by USEPA. 2 While the SIPs evaluate NOx and VOC emissions from all sources, including biogenic (non-humancaused) emission sources, this evaluation focuses on the categories most relevant to the proposed project construction emissions, specifically the Construction and Mining and the Commercial Marine categories. Employee commuting emissions have been compared with the SIP's on-road mobile source emissions.
While the on-road mobile source emission budget was provided in the SIP, the Construction and Mining and the Commercial Marine categories emissions were not identified explicitly in the SIP. These two categories fa ll under the non-road source category that includes other non-road sources like rail , agricultural , logging, and other non-road vehicle uses. In the current USEPAapproved ozone SIP, the non-road category, contro lled emissions has NOx emissions of 146.66 tons per day (tpd) and 81 .82 tpd for VOC, for calendar year 2008. Whi le a specific breakdown of this non-road source category is not avai lable for the SLP numbers, the TCEQ provided the breakdown for the state 's submission of2008 emissions to USEPA under the Consolidated Emissions Reporting Rule (CERR).) To get the applicable NOx and VOC emission budgets from the CERR the fo llowing was done:
• For NOx emissions, the CERR nonroad category tota led 149.24 tpd so it can be considered comparable to the SIP nonroad emissions of 146.66 tpd. Therefore the Construction and Mining and Commercial Marine categories from the CERR were used.
• For the VOC emissions, the CERR nonroad category totaled 62.55 tpd which is not comparable to the SIP nonroad emissions of 8 1.82 tpd . Therefore the emissions from the Construction and Mining and Commercial Marine categories from the SIP were calculated by taking the percentages that these categories contributed to the nonroad total in the CERR and applied those percentages to the 81.82 tpd nonroad total in the SIP.
- Construction and Mining in the CERR is 9.29% of the CERR nonroad total. Applying the 9.29% to the S[P nonroad total of 81 .82 tpd results in a value of 7.6 tpd. Commercial Marine in the CERR is 2.28% of the CERR nonroad total. Applying 2.28% to the SLP nonroad total of81.82 tpd results in a value of 1.86 tpd.
I HGB Eight-Hour Ozone Standard SIP Demonstrating Reasonable Further Progress (RFP), Rule Log 2006- 1892-SIP. Details can be fo und at: http://m.tceq.texas.gov/ airquality/ sip/ may2007hgb.html#rfp 2 Emissions Modelingfor the HGB Atta;nment Demonstration SlP Revision for the 1997 Eight-Hour Ozone Standard. Details can be found al: http://www.lceq.state.tx.us/assets/publ ie/imp lementationlair/siplhgblhgb _sip _ 2009/090 I 7S I P _ado _Append ix _B. pdf J For infonnation see: http://www.epa.gov/nochiel /cerr/index.html
Bayport Ship Channel Improvements Draft General Conform ity Detennination
13 March 201 3
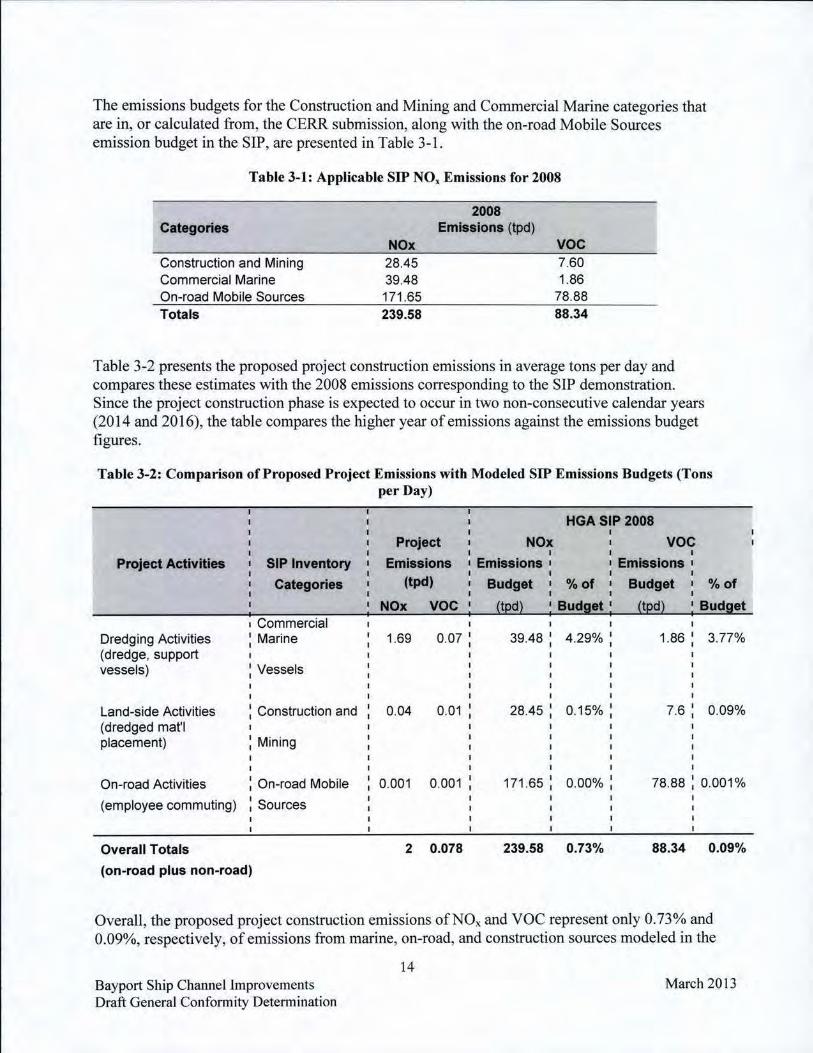
The emissions budgets for the Construction and Mining and Commercial Marine categories that are in, or calculated from, the CERR submission, along with the on-road Mobi le Sources emission budget in the SIP, are presented in Table 3-1.
Table 3-1: Applicable SIP NO~ Emissions fo r 2008
Categorlea NO.
Construction and Mining 28.45 Commercial Marine 39.48 On-road Mobile Sources 171.65 Totals 239.58
2008 Emissions (tpd)
VOC 7.60 1.86
78.88 88.34
Table 3-2 presents the proposed project construction emissions in average tons per day and compares these estimates with the 2008 emissions corresponding to the SIP demonstration. Since the project construction phase is expected to occur in two non-consecutive calendar years (20 14 and 2016), the table compares the higher year of emissions against the emissions budget figures.
Overall Totals 2 0.078 239.58 0.73% 88.34 0.09%
(on-road plus non-road)
Overall, the proposed project construction emissions of NO" and VOC represent only 0.73% and 0.09%, respectively, of emissions from marine, on-road, and construction sources modeled in the
Bayport Ship Channel Improvements Draft General Confonnity Detennination
14 March 20 13
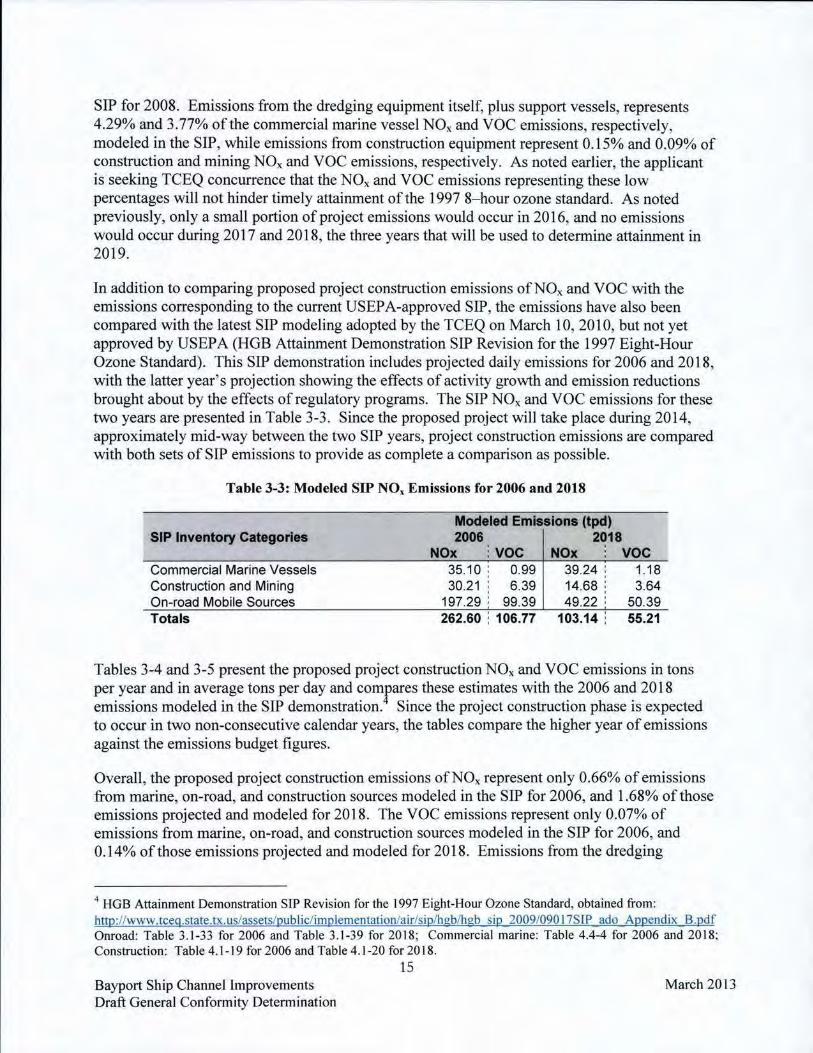
S[P for 2008. Emissions from the dredging equipment itself, plus support vessels, represents 4.29% and 3.77% of the commercial marine vessel NOx and voe emissions, respectively, modeled in the SIP, while emissions from construction equipment represent 0.1 5% and 0.09% of construction and mining NOx and VOC emissions, respective ly. As noted earlier, the applicant is seeking TeEQ concurrence that the NOx and VOC emissions representing these low percentages will not hinder timely attainment of the 1997 8- hour ozone standard. As noted previously, only a small portion of project emissions would occur in 2016, and no emissions would occur during 20 17 and 2018, the three years that will be used to detennine attainment in 2019.
In addition to comparing proposed project construction emissions of NOx and voe with the emissions corresponding to the current USEPA·approved SIP, the emissions have also been compared with the latest SIP modeling adopted by the TCEQ on March 10, 2010, but not yet approved by USEPA (HGB Attainment Demonstration SIP Revision forthe 1997 Eight.Hour Ozone Standard). This SIP demonstration includes projected daily emissions for 2006 and 20 18, with the latter year's projection showing the effects of activity growth and emiss ion reductions brought about by the effects of regulatory programs. The SIP NOx and voe emissions for these two years are presented in Table 3· 3. Since the proposed project will take place during 2014, approximate ly mid·way between the two SIP years, project construction emissions are compared with both sets of SIP emissions to provide as complete a comparison as possible.
Table 3·3: Modeled SIP NO. Emissions for 2006 and 20t8
SIP Inventory Categories
Commercial Marine Vessels Construction and Mining On· road Mobile Sources Totals
Modeled Emissions (!peI, 2006
NOx : VOC 35.10 : 0.99 30.21 : 6.39
197.29 : 99.39 262.60 : 106.77
2018 NOx : voe
39.24 : 1.18 14.68 : 3.64 49.22 : 50.39
103.14 : 55.21
Tables 3-4 and 3·5 present the proposed project construction NOx and voe emissions in tons per year and in average tons per day and compares these estimates with the 2006 and 20 18 emissions modeled in the SIP demonstration. Since the project construction phase is expected to occur in two non·consecutive calendar years, the tables compare the higher year of emissions against the emissions budget figures.
Overall, the proposed project construction emissions of NOx represent only 0.66% of emissions from marine, on-road, and construction sources modeled in the SIP for 2006, and 1.68% of those emissions projected and modeled for 2018. The VOC emissions represent only 0.07% of emissions from marine, on·road, and construction sources modeled in the SIP for 2006, and 0.14% of those emissions projected and modeled for 2018. Emissions from the dredging
4 HGB Attainmenl Demonstration SIP Revision for the 1997 Eight·Hour Ozone Standard, obtained from: http://www.tceg.state.tx.us/assets/public/implementalionlairlsiplhgblhgb sip 20091090 17S1 P ado Appendix B.pdf Onroad: Table 3.1 -33 for 2006 and Table 3. 1·39 for 2018; Commercial marine: Table 4.4-4 for 2006 and 2018; Construction: Table 4.1 ·19 for 2006 and Table 4. 1·20 for 2018.
Bayport Ship C hannel Improvements Draft General Confo rmity Determination
15 March 2013
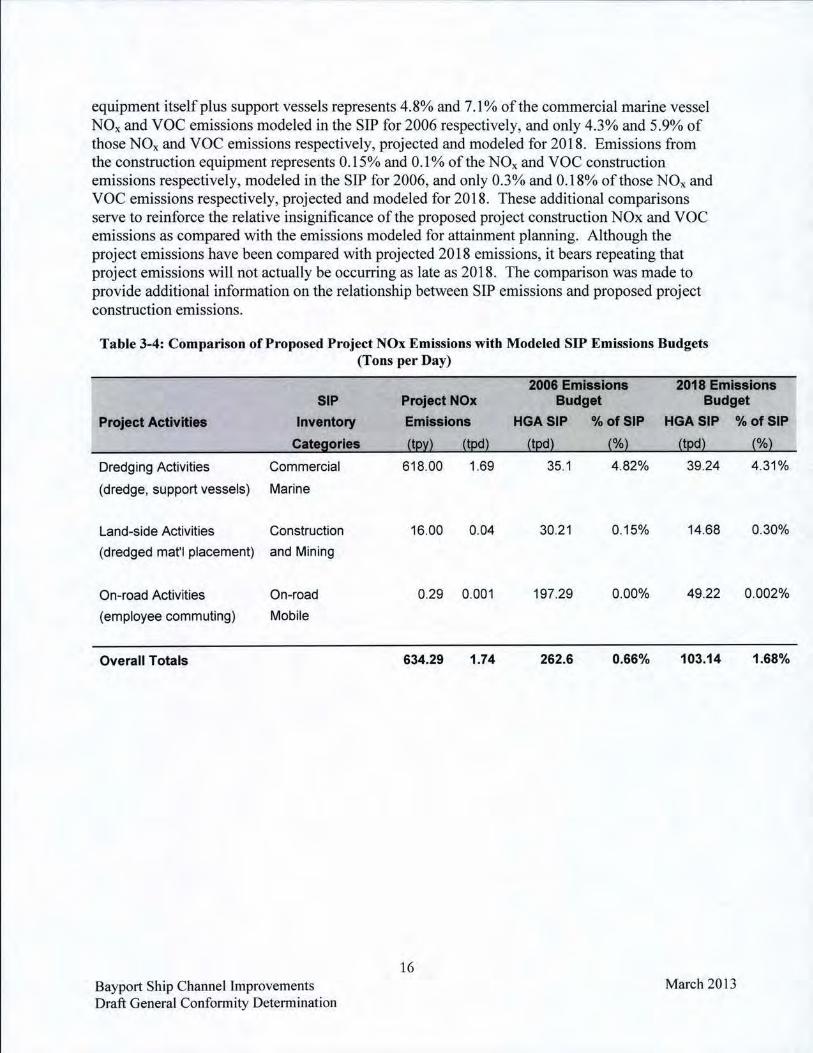
equipment itself plus support vessels represents 4.8% and 7. 1 % of the commercial marine vessel NO" and VOC emissions modeled in the SIP for 2006 respectively, and only 4.3% and 5.9% of those NOx and VOC emissions respectively, projected and modeled for 2018. Emissions from the construction equipment represents 0.15% and 0.1% of the NOx and VOC construction emissions respectively, modeled in the SIP for 2006, and only 0.3% and 0. 18% of those NO" and VOC emissions respective ly, projected and modeled for 20 18. These additional comparisons serve to reinforce the relative insignificance of the proposed project construction NOx and VOC emissions as compared with the emissions modeled for attainment planning. Although the project emissions have been compared with projected 20 18 emissions, it bears repeating that project emissions wi ll not actually be occurring as late as 2018. The comparison was made to provide additional in formation on the relationship between SIP emissions and proposed project construction emissions.
Table 3-4: Comparison of Proposed Project NOx Emissions with Modeled SlP Emissions Budgets (Tons per Day)
2008 Em_ Ions 2018 Emissions SIP
Project ActlvHI .. Inventory
C1t!Sori"
Dredging Activities Commercial
(dredge, support vessels) Marine
Land-side Activities Construction
(dredged mat'I placement) and Mining
On-road Activities On-road
(employee commuting) Mobile
Overall Totals
Bayport Ship Channe l Improvements Draft General Confonnity Detennination
ProjectNOx
Emlsslone
(!E~l (tpdl
618.00 1.69
16.00 0.04
029 0.001
634.29 1.74
16
Budget Budget
HGASIP % of SIP HGASIP % ofSIP
(tpdl (%l (tpdl (%l
35.1 4.82% 39.24 4.31%
30.21 0.15% 14.68 0.30%
197.29 0.00% 49.22 0.002%
262.6 0.66% 103.14 1.68%
March 20 13
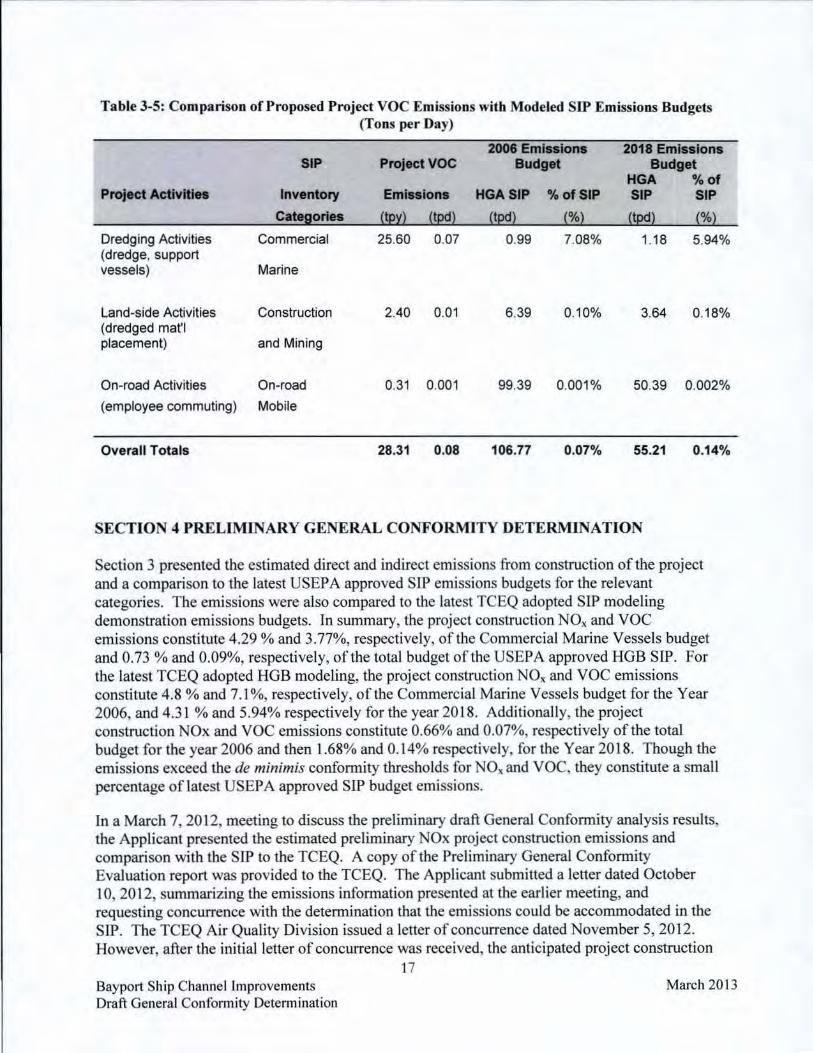
Table 3-5: Comparison of Proposed Project VOC Emissions with Modeled SIP Emissions Budgets (Tons per Day)
2006 Em"'k»ne 2018 Emlutone SIP ProjectVOC Budget Budget
HGA % 01 Project Actlvit leo Inventory Em ... k»ne HGASIP 'Io olSIP SIP SIP
Categories !!E~l !1I>d1 !1I>d1 !%l !1I>d1 !%l Dredging Activities Commercial 25.60 0.07 0.99 7.08% 1.18 5.94% (dredge, support vessels) Marine
Land-side Activities Construction 2.40 0 .01 6 .39 0.10% 3.64 0.18% (dredged mat'I placement) and Mining
On-road Activities On-road 0.31 0.001 99.39 0.001% 50.39 0.002%
(employee commuting) Mobile
Overall Totals 28.31 0.08 106.77 0.07% 55.21 0.14%
SECTION 4 PRELIMINARY GENERAL CONFORMITY DETERMINATION
Section 3 presented the estimated direct and indirect emissions from construction of the project and a comparison to the latest USEPA approved SIP emissions budgets for the relevant categories. The emissions were also compared to the latest TCEQ adopted SIP modeling demonstration emissions budgets. In summary, the project construction NOx and VOC emissions constitute 4.29 % and 3.77%, respectively, of the Commercial Marine Vessels budget and 0.73 % and 0.09%, respectively, of the total budget of the USEPA approved HOB SIP. For the latest TCEQ adopted HOB modeling, the project construction NOx and VOC emissions constitute 4.8 % and 7.1 %, respectively, of the Commercial Marine Vessels budget for the Year 2006, and 4.31 % and 5.94% respectively for the year 20 18. Additionally, the project construction NOx and VOC emissions constitute 0.66% and 0.07%, respectively of the total budget for the year 2006 and then 1.68% and 0.14% respecti vely, for the Year 2018. Though the emissions exceed the de minimis conformity thresholds for NOx and VOC, they constitute a small percentage of latest USEPA approved SlP budget emissions.
In a March 7, 2012, meeting to discuss the preliminary draft General Confonnity analysis results, the Applicant presented the estimated preliminary NOx project construction emissions and comparison with the SIP to the TCEQ. A copy of the Preliminary General Confonnity Evaluation report was provided to the TCEQ. The Applicant submitted a letter dated October 10, 2012, summarizing the emissions infonnation presented at the earlier meeting, and requesting concurrence with the detennination that the emissions could be accommodated in the SIP. The TCEQ Air Quality Division issued a letter of concurrence dated November 5, 2012. However, after the initial letter of concurrence was received, the anticipated project construction
Bayport Ship Channel Improvements Draft General Confonnity Detennination
17 March 2013
years changed from the previous anticipated construction years of 20 13 and 20 I 4, to early 2014 and 2016. The change was due to a change in the Applicant's implementation schedule, and to more recent information regarding the USACE Galveston District's Flare Easing project, construction schedule, which affects when the proposed deepening of the flare easing can be performed by the Applicant. The Applicant's construction schedule change necessitated a recalculation of emissions. The emissions were recalculated and coordinated with the TCEQ via a February 7, 2013, letter (reference Attachment B). The TCEQ responded via a letter dated February 20, 2013, confirming that the change in emissions due to the change in project construction years will not exceed the emissions budget in the most recent SIP approved by the USEPA (reference Attachment C).
Although the February 20, 2013, concurrence letter from TCEQ confirmed that the project would not exceed budgets in the SIP, TCEQ did li st several air quality improvement suggestions to help reduce project emissions. TCEQ suggested the use of clean fuel in the marine vesse ls, however marine diesel fuel already must meet the ultra·low·sulfur diesel (ULSD) fuel standard of 15 parts·per·million (ppm) sulfur content, so no further action is needed. Though the TCEQ concurrence is not conditional on the PHA implementing the suggestions, the PHA will implement the following:
• PHA wi ll encourage contractors to apply for Texas Emission Reduction Plan grants.
• The project wi ll be procured using the Compet itive Sealed Proposal (CSP) process which wi ll allow for PHA to include in the evaluation criteria for contractor se lection, the use of cleaner nonroad and marine equipment.
• PHA will encourage the selected contractor to exercise air quality best management practices.
Pursuant to the General Conformity Rule (40 CFR 51.851) and associated regulations (40 CFR 93), this Draft Genera l Conformity Determination has been produced to demonstrate that the proposed Baypon Ship Channel Improvements Project would comply with the requirements of the General Conformity Rule and would be in conformity with the SIP. The TCEQ General Rule § 1 0 1.30, Conformity of General Federal Actions to State Implementation Plans, which specified State obligations under General Conformity of Federal actions, was repealed in 2011 due to repeal of most of 40 CFR Part 5 I. The repeal was submitted to the US EPA as a revision to the SIP (State of Texas Secretary of State 2011 Page 2817). However, the relevant obligations are superseded and incorporated into 40 CFR Part 93, Subpart B, which speci fies at 40 CFR 93.158(a)(5)(i)(A) that the state must make a determination and document that the total of direct and indirect emissions from the action, or portion thereof, would result in a level of emissions which, together with all other emissions in the HGB NAA, would not exceed the emissions budgets specified in the SIP. The TCEQ reviewed the estimated project construction emissions information contained in the Preliminary General Confonnity Evaluation report and summarized in the February 7, 2013, review request letter from the applicant, and provided written confirmation in their February 20, 2013, letter that the project emissions would not result in a HOB NAA-wide level of emissions that would exceed the emissions budgets specified in the SIP, as discussed in the paragraph above. Therefore, it is determined that the project emissions resulting from the Federal action will result in a level of emissions, which, together with all other
Bayport Ship Channel Improvements Draft General Conformity Detennination
18 March 2013
emissions in the HGB NAA, would not exceed the emissions budgets specified in the SIP. and the action can be considered to confonn with the HGB NAA SIP. This detennination will serve as the basis for making a Final General Confonnity Detennination for the proposed Bayport Ship Channel Lmprovements Project.
Bayport Ship Channe l Improvements Draft General Conformity Determination
19 March 201 3
REFERENCES
Port Bureau. 20 11. Bui lding Bayport: boom or bust? POri Bureau News. January: 3-4.
Port of Houston Authority (PHA). 2010. Genera l Infonnation: Overview. http: //www.portofhouston.com/ geninfo/ overview1.honl (Accessed March 20 11).
20 I I. Houston' s retai l advantage. The Port of Houston. January/February: 26-28.
Starcrest Consulting Group, LLC. 2009. 2007 Goods Movement Air Emissions Inventory at the Port of Houston.
State of Texas, Secretary of State. 2011. Texas Register, Volume 36, Number \8, Pages 2793-3060, May 06,20 11. University of North Texas Libraries, Government Documents Department, Denton, Texas. Avai lable at: http://texashistory.unt.edu!ark:/67531 /metapth 1766181 (accessed November 28,20 12).
Texas Commission on Environmenta l Quality, 2009. Emiss ions Modeling for the HGB Attainment Demonstration SIP Revision forthe 1997 Eight·Hour Ozone Standard. Avai lable at:http://www.tceq.state.tx.uslassetslpubl ic/imp lementation/airlsiplhgblhgb _sip _2009/090 I 7S1 P _a do_Append ix _B.pdf (Accessed December 20 II).
Texas Transportation Institute, 20 11. 2011 Urban Mob ility Report. Ava ilable at: http://tti.tamu.eduldocuments/mobi li ty-report-20 I I.pdf (Accessed December 201 1).
u.s. Env iron mental Protection Agency (USEPA). 20 lOa. Revisions to the General Confonnity Regulations. EPA·HQ·OAR·2006-0669. Avai lable at: www.epa.gov/airqual ity/genconfonn/documents/20 I 00324ru le.pdf (Accessed November 20 I I).
USEPA. 20 lOb. Title 40: Protection of Environment, Part 93 - Detennining Confonnity of Federal Actions to State or Federal Implementation Plans, Subpart B - Detennining Confonnity of General Federal Actions to State or Federal Imp lementat ion Plans.
Bayport Ship Channe l Improvements Draft General Confonnity Detenninat ion
20 March 2013
Appendix A - Emission Estimation Details
Emission estimates have been prepared for the dredging and associated activities in support of a Draft General Conforrnity Detennination (OCD) that has been prepared in accordance with the General Confonnity (OC) regulations promulgated in 40 CFR Part 93 (Detennining Confonnity of Federal Actions to State or Federal Implementation Plans). The detennination evaluates and documents the OC-related air emissions that will result from the proposed project and documents that these emissions confonn to the current State Implementation Plan (SIP) applicable to the Houston/Oalveston/Brazoria (HOB) ozone non-attainment area.
The infonnation needed to estimate construction emissions for the proposed project includes the following:
• A description of the equipment that will be needed, in tenns of type, horsepower, age, and other characteristi cs;
• Estimates of the operating time (e.g., hours per day, days per week, etc.) of each type of equipment during each phase or component of work;
• Emissions characteristics (emission factors) of each type of equipment; • Emission calculation methods and equations.
Additionally, assumptions have been made regarding the number of employee commuting days to develop estimates of on-road emissions associated with the project.
Infonnation related to the physical and operational characteristics of the equipment has been developed by the project engineers. The physical infonnation includes the type of equipment (e.g. , dredge, supporting tug boat, dozer), the type of engine on that equipment (e.g. , main engine, auxiliary engine) for equipment with more than one engine, the typical rated horsepower for the type of equipment and engine, and, for the dredge and booster pump, the average in-use load factor, which is the average percentage of full power at which the engine is typically operated. The load factors used for tugs and land-side equipment have been obtained from the GMAEI. A sununary of the physical and operational characteristics is presented in Table I.
The emission factors have primarily been obtained from the harbor craft section of the GMAEI. The report lists emission factors for engines in various size and horsepower ranges, and three different "tier levels," which reflect emission standards effective when the engines were manufactured. Because the specific equipment to be used on the proposed project is not known, the engines are assumed to be Tier I engines, manufactured in approximately the 2000 to 2005 time frame. Emission factors for the land-side equipment (dozers and loaders) have been based on the Tier 1 emission standards for non-road diesel engines. Emission factors for on-road vehicles used in employee commuting have been based on the emission estimating model MOBILE6.2. While the newer estimating model MOVES also produces emission estimates for on-road vehicles, the existing SIPs against which project emissions are being compared were prepared using MOBILE6.2, so this is the appropriate model to use for the current analysis. In addition, any difference in results between models would not be significant given the very low emissions from on-road travel related to this proposed project. Table 2 lists the emission factors used in developing the emission estimates.
Bayport Sh ip Channel Improvements Draft General Conformity Determination
A- l Mar<:h2013
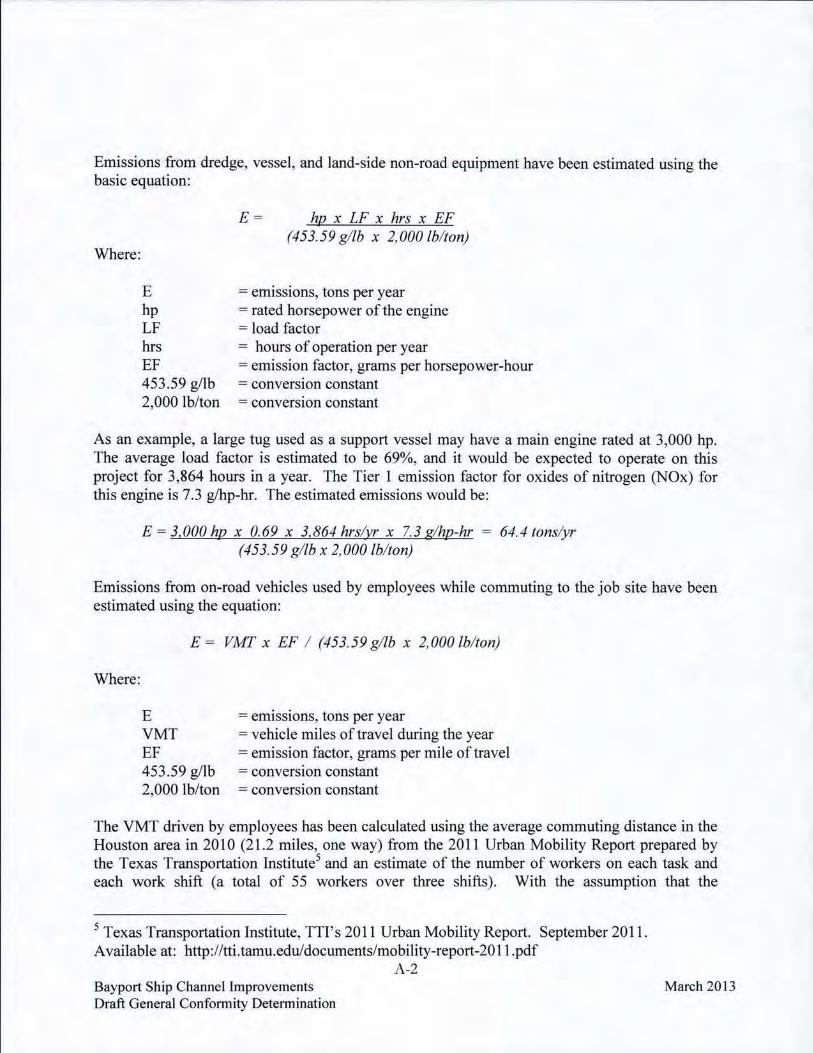
------- -
Emissions from dredge, vessel, and land-side non-road equipment have been estimated using the basic equation:
Where:
E hp LF hrs EF 453.59 glib 2,000 Ib/ton
E = hp x IF x hrs x EF (453.59 glib x 2,000Ibl /on)
= emissions, tons per year = rated horsepower of the engine = load factor = hours of operation per year = emission factor, grams per horsepower-hour = conversion constant = conversion constant
As an example, a large tug used as a support vesse l may have a main engine rated at 3,000 hp. The average load factor is estimated to be 69%, and it would be expected to operate on thi s project for 3,864 hours in a year. The Tier I emission factor for oxides of nitrogen (NOx) for this engine is 7.3 g/hp-hr. The estimated emissions would be:
E ~ 3,000 he x 0.69 x 3,864 hrsl yr x 7.3 glhp-hr ~ 64.4/onslyr (453.59 glib x 2,000 Ibl/on)
Emissions from on-road vehicles used by employees while commuting to the job site have been estimated using the equation:
Where:
E ~ VMT x EF I (453.59 glib x 2,000Ibl/on)
E VMT EF 453.59 glib 2,000 Ib/ton
= emissions, tons per year = vehicle miles of travel during the year = emission factor, grams per mile of trave l = conversion constant = conversion constant
The VMT driven by employees has been calculated using the average commuting distance in the Houston area in 2010 (21.2 miles, one way) from the 20 11 Urban Mobility Report prepared by the Texas Transportation InstituteS and an estimate of the number of workers on each task and each work shift (a total of 55 workers over three shifts). With the assumption that the
.5 Texas Transportation Institute, TIl's 20 11 Urban Mobi lity Report. September 20 II. Available at: http://tti .tamu.eduldocumentslmobility-report-20 11.pdf
Bayport Ship Channel Improvements Draft Genera l Confonnity Detennination
A-2 March 201 3
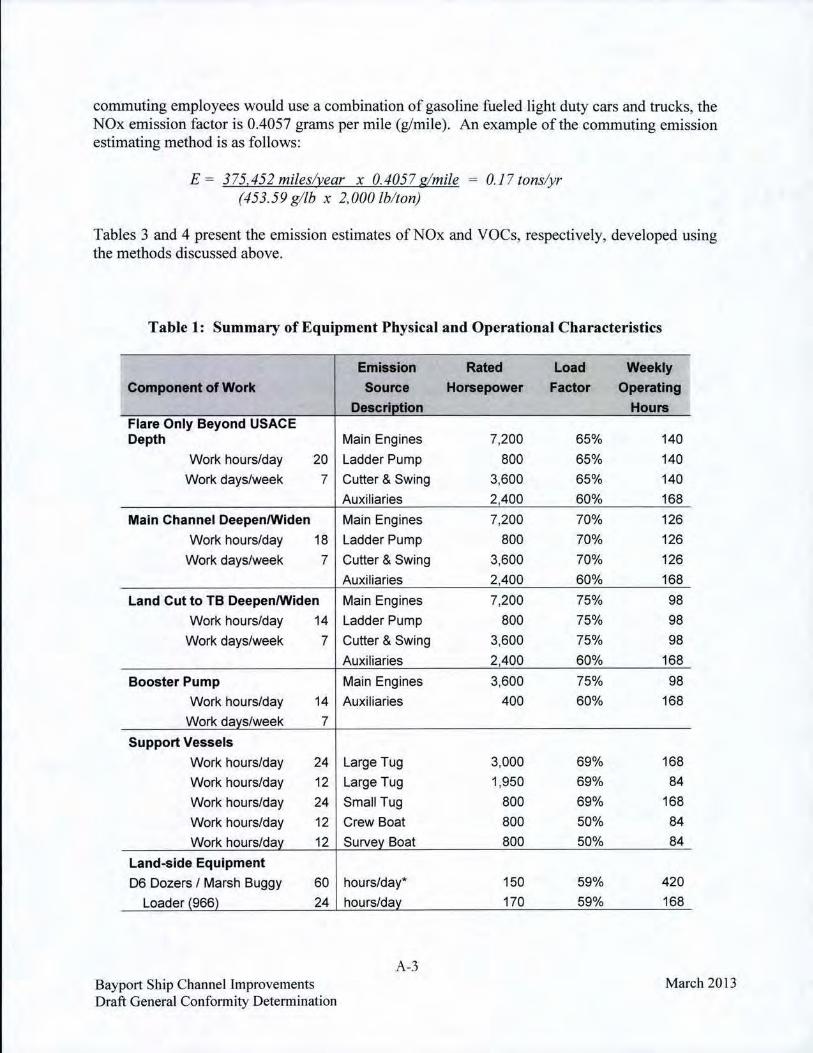
conunuting employees would use a combination of gasoline fueled light duty cars and trucks, the NOx emission factor is 0.4057 grams per mile (g/mi le). An example of the commuting emission estimating method is as follows:
E ~ 375,452 milesl year x 0.4057 glmile (453.59 glib x 2,000Ibl/on)
0.17 /onslyr
Tables 3 and 4 present the emission estimates of NO x and VOCs, respectively, developed using the methods discussed above.
Table 1: Summary of Equipment Physical and Operational Characteristics
Component of Work
Flare Only Beyond USACE Depth
Work hours/day 20
Work days/week 7
Main Channel DeepenlWiden
Work hours/day 18
Work days/week 7
Land Cut to TB OeepenlWiden
Work hours/day 14
Work days/week 7
Booster Pump
Work hours/day 14
Work days/week 7
Support Vessels
Work hours/day 24
Work hours/day 12
Work hours/day 24
Work hours/day 12
Work hours/day 12
Land-side Equipment
D6 Dozers / Marsh Buggy 60
Loader (966) 24
Bayport Sh ip Channe l Improvements Draft General Conformity Detenn ination
Emission
Source Qeecriotlon
Main Engines
Ladder Pump
Cutter & Swing
Auxiliaries
Main Engines
Ladder Pump
Cutter & Swing
Auxiliaries
Main Engines
l adder Pump
Cutter & Swing
Auxiliaries
Main Engines
Auxiliaries
Large Tug
Large Tug
Small Tug
Crew Boat
Survey Boat
hours/day·
hours/day
A -3
Rated Load Weekly
Horsepower Factor OperatIng Hours
7,200 65% 140
800 65% 140
3,600 65% 140
2,400 60% 168
7,200 70% 126
800 70% 126
3,600 70% 126
2,400 60% 168
7,200 75% 98
800 75% 98
3,600 75% 98
2,400 60% 168
3,600 75% 98
400 60% 168
3,000 69% 168
1,950 69% 84
800 69% 168
800 50% 84
800 50% 84
150 59% 420
170 59% 168
March 2013
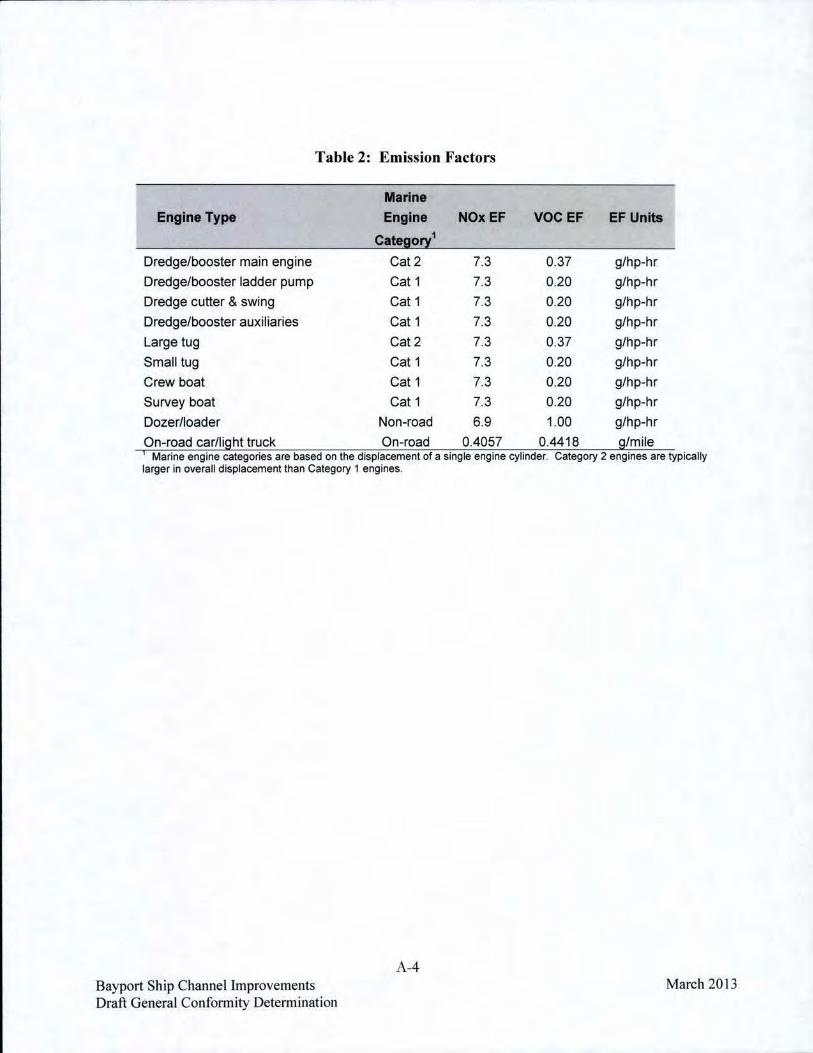
Table 2: Emiss ion Factors
Marine Englno Type Engine NOx EF VOCEF EF Units
Category1
Dredge/booster main engine Cat2 7.3 0.37 g/hp-hr
Dredge/booster ladder pump Cat 1 7.3 0.20 g/hp~hr
Dredge cutter & swing Cat 1 7.3 0.20 g/hp-hr
Dredge/booster auxiliaries Cat 1 7.3 020 g/hp-hr
Large tug Cat2 7.3 0.37 g/hp-hr
Small tug Cat 1 7.3 0.20 g/hp-hr
Crew boat Cat 1 7.3 0.20 g/hp-hr
Survey boat Cat 1 7.3 0.20 g/hp-hr
Dozer/loader Non-road 6.9 1.00 g/hp-hr
On-road car/light truck On-road 0.4057 0.4418 g/mile i Marine engine categories are based on the displacement of a single engine cyl inder. Category 2 engines are typically larger in overall displacement than Category 1 engines.
Bayport Sh ip Channe l Im provements Draft General Conformity Determination
A-4 March 20 13

Table 3: Project Construction NOx Emission Estimates
Emission
Component of Work SOurce Engine
Description Category Flare Only Beyond USACE Depth Main Engines Cat 2
Weeks of work, 2014: 0 ladder Pump Cat 1
Weeks of work, 2016: 5 Cutter & Swing Cat 1
Auxilia ries Cat 1
Subtotals
Main Channel Deepen/Widen Main Engines Cat 2
Weeks of work, 2014: 16 ladder Pump Cat 1
Weeks of work, 2016: 0 Cutter & Swing Cat 1
Auxiliaries Cat 1
Subtotals
Land Cut to TB Deepen/Widen Main Engines Cat 2
Weeks of work, 2014: 23 ladder Pump Cat 1
Weeks of work, 2016: 0 Cutter & Swing Cat 1
Auxilia ries Cat 1
Subtotals
Booster Main Engines Cat 2
Weeks of work, 2014: 23 Auxilia ries Cat 1
Weeks of work, 2016: 0
Subtotals
Support Vessels
large Tug Cat 2
Weeks of work, 2014: 39 large Tug Cat 2
Weeks of work, 2016: 5 Small Tug Catl
Crew Boat Cat 1
Survey Boat Cat 1
Subtota ls
Land-side Equipment
Weeks of work, 2014: 39 Dozers (D6)/ Marsh Buggy
Weeks of work, 2016: 5 l oader (966)
Subtotals
Totals
Bayport Ship Channel Improvements Draft General Confonnity Delenninalion
A-5
NO. EFs
c/hphr 2014
7.3 0.0
7.3 0.0
7.3 0.0
7.3 0.0
0.0
7.3 81.9
7.3 9.1
7.3 40.9
7.3 31.2
163.1
7.3 98.1
7.3 10.9
7.3 49 .0
7.3 44.8
202.8
7.3 49.0
7.3 7.5
56.5
7.3 109.3
7.3 35.5
7.3 29.1
7.3 10.6
7.3 10.6
195.1
6.9 11.0
6.9 5.0
16.0
633.5
NOx r Emissions
Ions 2016 Total
26.4 26.4
2.9 2.9
13.2 13.2
9.7 9.7
52.2 52.2
0.0 81.9
0.0 9.1
0.0 40.9
0.0 31.2
0.0 163.1
0.0 98.1
0.0 10.9
0.0 49.0
0.0 44.8
0.0 202.8
0.0 49.0
0.0 7.5
56.5
14.0 123.3
4.6 40.1
3.7 32 .8
1.4 12.0
1.4 12.0
25.1 220.2
1.4 12.4
0.6 5.6
2.0 18.0
79.3 712.8
March 2013
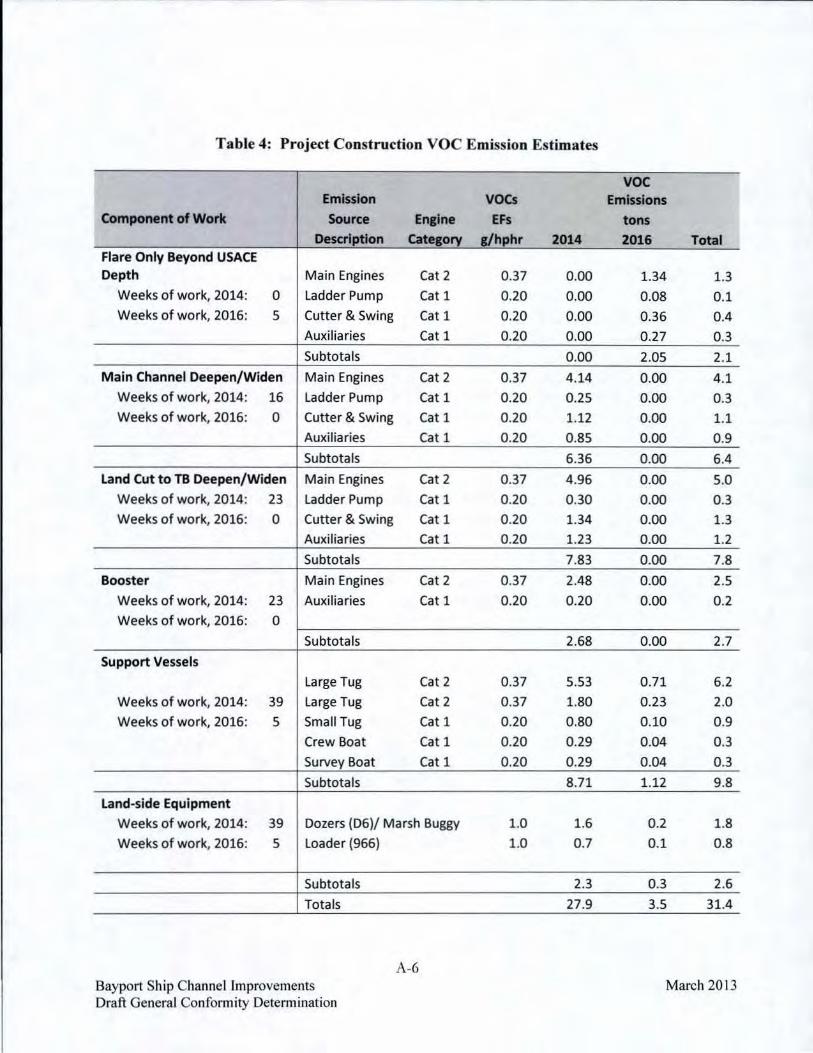
Table 4: Project Construction VOC Emiss ion Estimates
Emission Component of Work Source E .. lne
Description Catelory Flare Only Beyond USACE Depth Main Engines Cat 2
Weeks of work, 2014: 0 Ladder Pump Cat 1 Weeks of work, 2016: 5 Cutter & Swing Cat 1
Auxil ia ries Cat 1
Subtotals
Main Channel Deepen/Widen Main Engines Cat 2
Weeks of work, 2014: 16 Ladder Pump Cat 1 Weeks of work, 2016: 0 Cutter & Swing Cat 1
Auxiliaries Cat 1
Subtotals
land Cut to TB Deepen/Widen Main Engines Cat 2
Weeks of work, 2014: 23 Ladder Pump Cat 1 Weeks of work, 2016: 0 Cutter & Swing Cat 1
Auxiliaries Cat 1
Subtotals
Booster Main Engines Cat 2
Weeks of work, 2014: 23 Auxiliaries Cat 1
Weeks of work, 2016: 0
Subtotals
Support Vessels
Large Tug Cat 2 Weeks of work, 2014: 39 Large Tug Cat 2
Weeks of work, 2016: 5 Small Tug Cat 1
Crew Boat Cat 1
Survey Boat Cat 1 Subtotals
land-side Equipment
Weeks of work, 2014: 39 Dozers (06)/ Marsh Buggy
Weeks of work, 2016: 5 loader (966)
Subtotals
Totals
Bayport Ship Channel Improvements Draft General Confonnity Delenninalion
A-6
VOCS EFs
slhphr 2014
0.37 0.00 0.20 0.00 0.20 0.00 0.20 0.00
0.00
0.37 4.14 0.20 0.25 0.20 1.12 0.20 0.85
6.36
0.37 4.96 0.20 0.30 0.20 1.34 0.20 1.23
7.83
0.37 2.48
0.20 0.20
2.68
0.37 5.53 0.37 1.80 0.20 0.80
0.20 0.29
0.20 0.29
8.71
1.0 1.6
1.0 0.7
2.3
27.9
voc Emissions
I tons 2016 Total
1.34 1.3 0.08 0.1 0.36 0.4 0.27 0.3
2.05 2.1
0.00 4.1 0.00 0.3 0.00 1.1 0.00 0.9
0.00 6.4
0.00 5.0 0.00 0.3 0.00 1.3 0.00 1.2
0.00 7.8
0.00 2.5 0.00 0.2
0.00 2.7
0.71 6.2 0.23 2.0 0.10 0.9
0.04 0.3 0.04 0.3
1.12 9.8
0.2 1.8 0.1 0.8
0.3 2.6
3.5 31.4
March 201 3
February 07,2013
Mr. David Brymer
Director
Ai r Quality Division
PORT OF IIOUSTON AUTHORITY
Texas Commission on Environmental Quality
MC206
P.O. Box 13087
Austin, TX 78711-3087
SUBJECT: Department of the Anny Permit Application SWG-2011-011 83: General
Confonnity Concurrence - UPDATE
Dear Mr. Brymer:
The Port of Houston Authority (PHA) received general conformity concurrence from the
Texas Commission on Environmental Quality (TCEQ) in a letter dated November 5,
2012 for the improvements to the Bayport Ship Channel (SSC). As outl ined in the
October 10, 2012 letter to TCEQ, the PHA has applied to the u.s. Anny Corps o f
Engineers (USACE) for a Department of Army pennit pursuant to Section 404 of the
Clean Water Act and Section 10 of the Ri vers and Harbors Act of 1899 (Pennit Application No SWG-201 1-01 183). PHA plans to deepen and widen the existing sse, deepen the Turning Basin, deepen a portion of the Bayport Flare, and place the new work
dredged material and maintenance dredged material in ex isting dredged material
placement areas .
However, since the time we received TCEQ concurrence, the schedule has changed for
thi s project. Instead of the project taking place in 2013 and 2014, the project will now take place primarily in 201 4 with additional work in 2016. The improvements to the
BSC and the Turning Basin wi ll occur in 2014 while the work on the Bayport Flare will
happen in 2016. This schedule change means that the majority of the NOx. emissions will
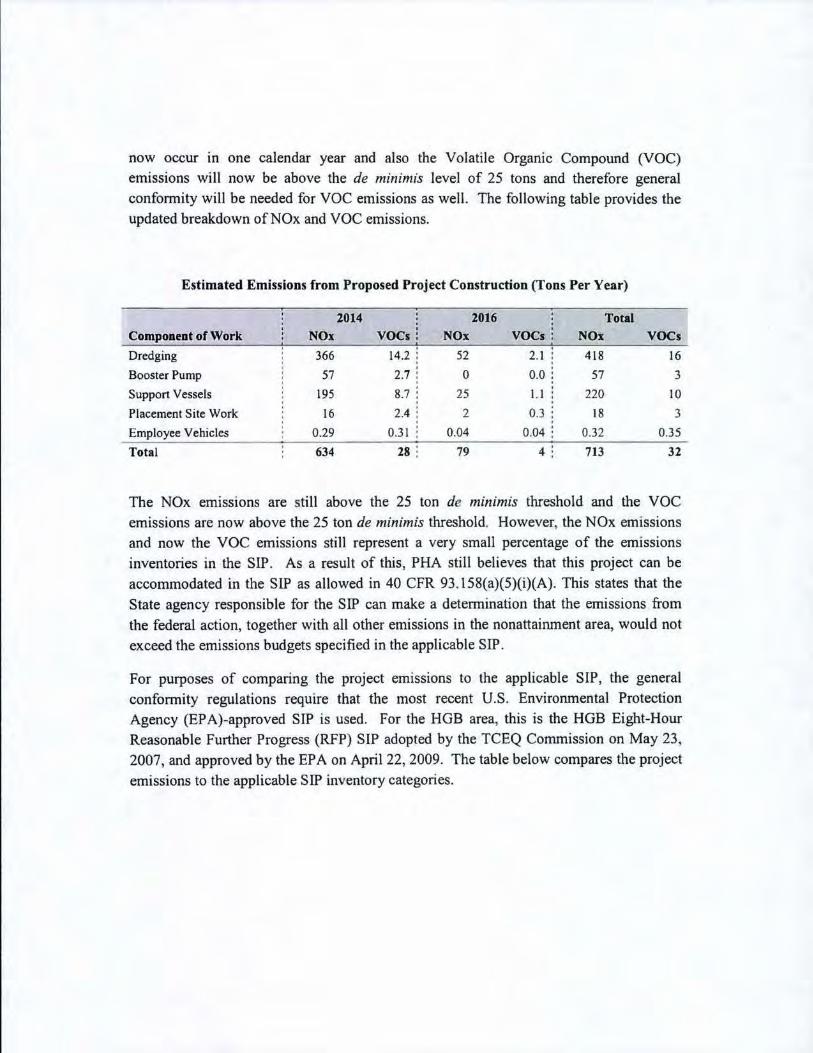
now occur In one calendar year and also the Volatile Organic Compound (VOC) emissions will now be above the de minimis level of 25 tons and therefore general confonnity will be needed for VOC emissions as wel l. The fo llowing table provides the updated breakdown of NO x and VOC emissions.
Estimated Emissions from Proposed Project Construction (Tons Per Year)
CompoaeDt of Work
Dredging
Booster Pump
Support Vessels
Placement Site Work
Employee Vehicles
Total
2014
NO,
366
57 195
16
0.29
634
voc, : NO,
14.2 1 52
2.7 : 0
8.7 : 25
2.4 : 2
0.31 : 0.04
28 : 79
2016 Total
voc. NO,
2.1 418
0.0 57
1.1 220
0.3 18
0.04 : 0.32
4: 713
voc. 16
3 10
3
0.35
31
The NOx emissions are still above the 25 ton de minimis threshold and the VOC emissions are now above the 25 ton de minimis threshold. However, the NOx emissions and now the VOC emissions still represent a very small percentage of the emissions inventories in the SIP. As a result of this, PHA still bel ieves that this project can be
accommodated in the SIP as allowed in 40 CFR 93. I S8(a)(S)(i)(A). This states that the State agency responsible for the SIP can make a detennination that the emissions from the federal action, together with all other emissions in the nonattairunent area, would not exceed the emissions budgets specified in the applicable SIP .
For purposes of comparing the project emissions to the applicable SIP, the general confonnity regulations require that the most recent U.S. Envirorunental Protection Agency (EPA)~approved SIP is used. For the HGS area, this is the HGS Eight-Hour Reasonable Further Progress (RFP) SIP adopted by the TCEQ Commission on May 23, 2007, and approved by the EPA on April 22, 2009. The table below compares the project emissions to the applicable SIP inventory categories.
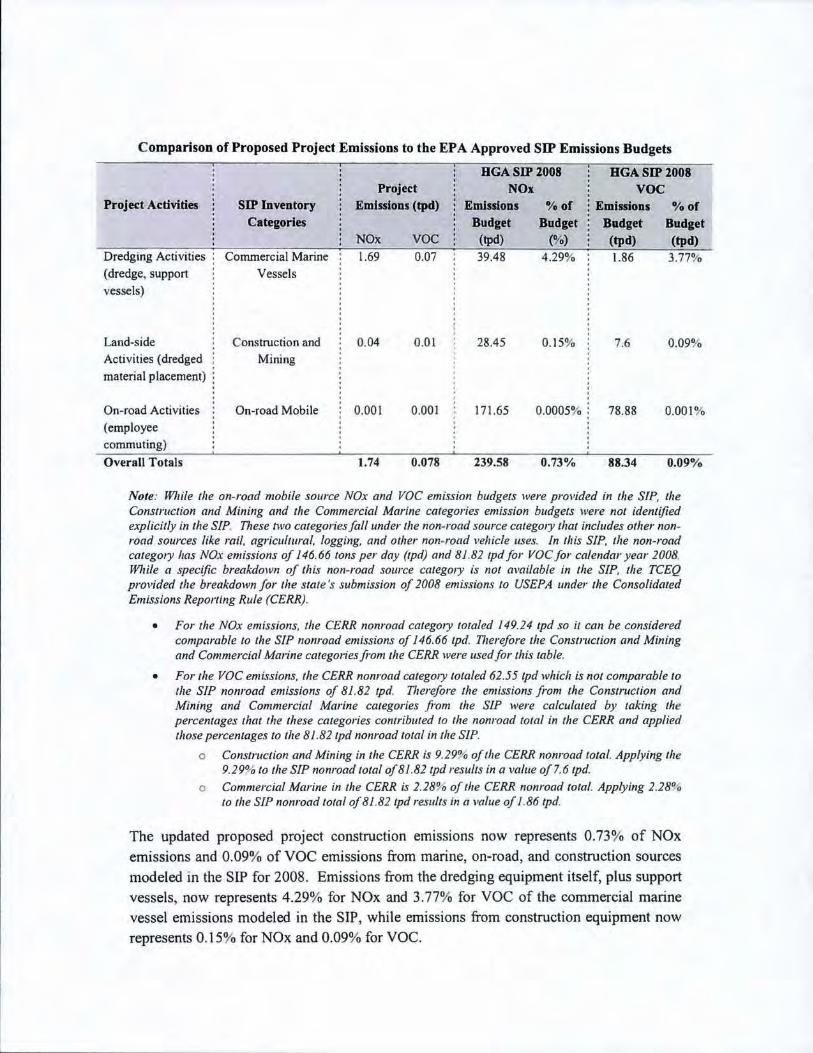
C omparison of Proposed Project Emissions to tbe EPA Approved SIP Emissions Budgets
BGA SIP 2008 HGASIP2008 Projrc:t NO. VOC
P roject Activities SIP Inventory Emissions (tpd) Emissions .". of : Emillions .". of Catqories Budaet Budeet Badad Budaet
NO. VOC (Ipd) (%) (lpd) (lpd) Dredging Activities Commercial Marine 1.69 0.07 39.48 4.29% 1.86 3.77% (dredge, support Vessels
vessels)
Land-side Construction and 0. 04 0.01 28.45 0.15% 7.6 0.09% Activities (dredged Mining material placement)
On-road Activities On-road Mobile 0.001 0.001 171.65 0.0005% i 78.88 0.00 1% (employee
commuting)
Overall Totals 1.74 0.078 239.58 O.73'/u 88.34 0_09"'0
Note: Whife tfle on-rood mobile source NOx and VOC emission budgets were provided in the SfP, the Construction and Mining and the Commercilll Mllrine categories emission budgets were not identified explicitly in Ihe SfP. These nyo categories fall under the non-road sOlll"ce categOly that includes other non_ road sources like rail, agriclllwl"Ql, logging, and olher non-road vehicle IIses. In this SfP, the non-road category has NOx emissions of 146.66 tons per day (/pd) and 81.82 tpdfor VOC for calendar year 2008. While a specific breakdown of Ihis non-road source categOly is not avai/able in the SIP, the TCEQ provided the breakdown for Ihe slate"s submission of 2008 emissions to USEPA under the Consolidated Emissions Reporting Rule (CERR).
• For the NOx emissions, tlte CERR nonroad category to/aled 149.24 Ipd so il can be considered comparable 10 the SIP nonroad emissions of 146.66 Ipd. n,uefore the Construct jon and Mining and Commercial Marine categories from the CERR were used fortlEis (able.
• For tile VOC emissions, ,lie CERR nonroad categOlY lotoled 62.5.5 Ipd which is not comparable /0
the SIP nonroad emissions of 81.82 tpd. n,erefore the emissions from the Construction and Mining and Commercial Marine calegories from the SIP were calculated by taking the percentages that the these categories contribllted to the nom-oad to/al in the CERR and applied those percentages to fhe 81.82 tpd nonraad 10101 in the SIP.
o ConSfl1lction and Mining in the CERR is 9.29% of the CERR non/'Oad total. Applying the 9.29% to fire SIP nonroad total of81.82tpd results in a vallie of7.6tpd.
o Commercial Marine in Ihe CERR is 2.28% of the CERR nonrOlld toto/. Applying 2.2811'0 to tlte SIP nonrood lotal of 81 .82 Ipd results in a value of J .86 tpd.
The updated proposed project construction emissions now represents 0.73% of NOx emissions and 0.09% of voe emissions from marine, on-road, and construction sources modeled in the SIP for 2008. Emissions from the dredging equipment itself, plus support vessels, now represents 4.29% for NOx and 3.77% for voe of the commercial marine vessel emissions modeled in the SIP, while emissions from construction equipment now represents 0. 15% for NOx and 0.09% for VOe.
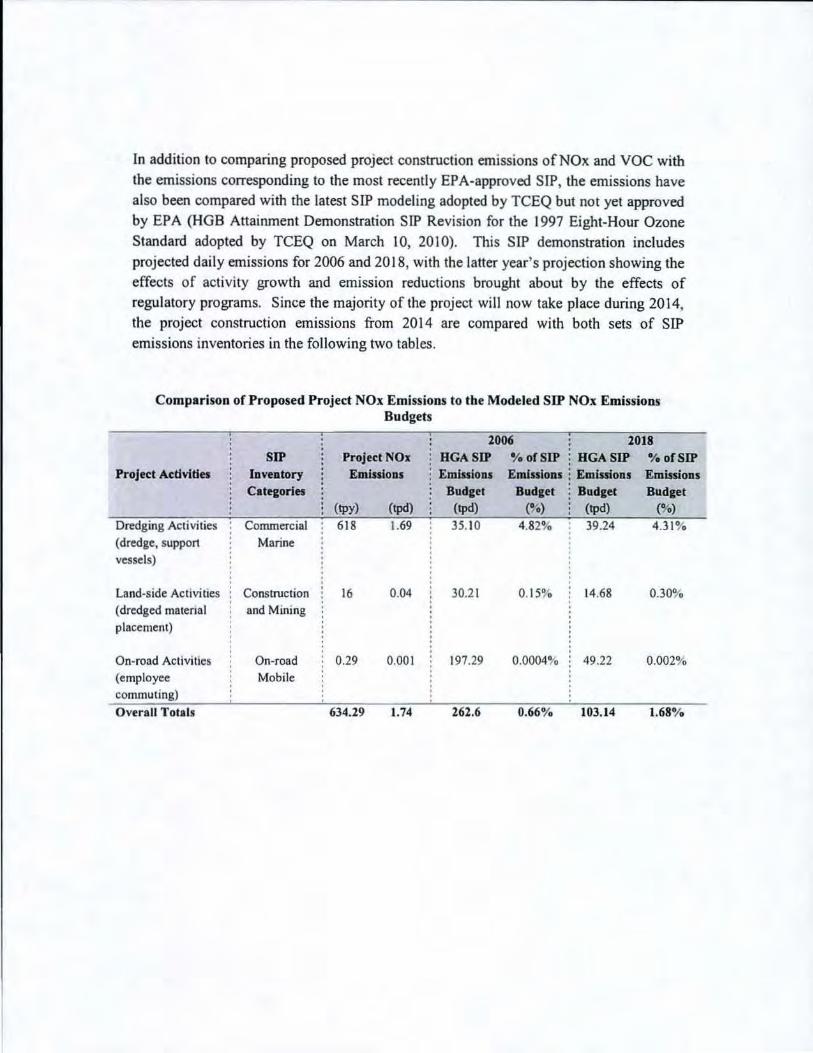
In addition to comparing proposed project construction emissions of NO x and VOC with the emissions corresponding to the most recently EPA-approved SIP, the emissions have al so been compared with the latest SIP modeling adopted by TCEQ but not yet approved by EPA (HGB Attainment Demonstration SIP Revision for the 1997 Eight-Hour Ozone
Standard adopted by TCEQ on March 10, 2010). This SIP demonstration includes projected daily emissions for 2006 and 2018, with the latter year's projection showing the effects of activity growth and emission reductions brought about by the effects of regulatory programs. Since the majority of the project will now take place during 2014, the project construction emissions from 2014 are compared with both sets of SIP emissions inventories in the fo llowing two tables.
Comparison of Proposed Project NOx Emissions to the Modeled SIP NOx EmissiODs Budget
1006 2018 SIP ProjedNOx RGASlP Y.ofSIP : RGASIP 'Y.ofSIP
Projed Acdvides laveatory EmluloD, EmiaioD' EmiaIOD. : EmfuioD' EmissioD' Catqories Budlet Budlet i Blldle! Blldett
(lpy) (tpd) (tpd) ('.) ,
(tpd) (%) , Dredging Activities Commercial 61 8 1.69 35. 10 4.82% : 39.24 4.31% (dredge, suppon Marine vessels)
Land-side Activities Construction 16 0.04 30.2 1 0. 15% 14.68 0.30% (dredged material and Mining
placement)
On-road Activities On-road 0.29 0.001 197.29 0.0004% 49.22 0.002% (employee Mobile commuting)
Overall Totlls 634.29 1.74 261,6 0.66'Y. 103.14 1.68"1.
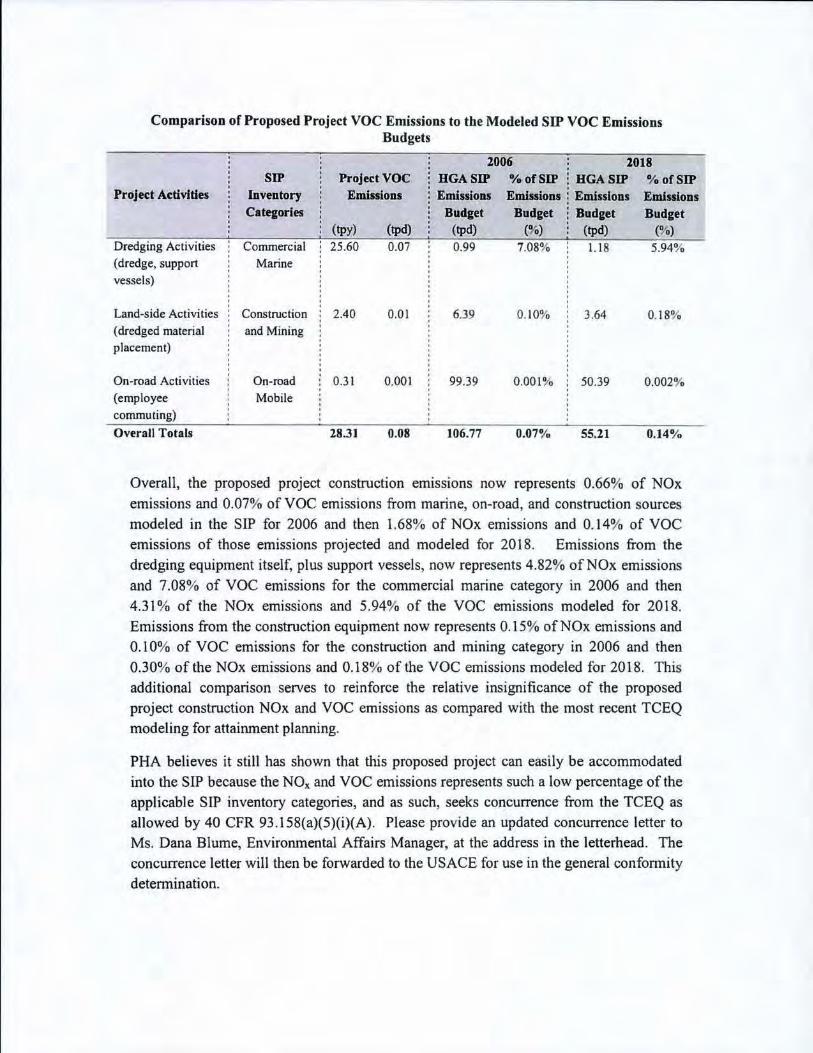
Comparison of Proposed Project VOC Emissions to tbe Modeled SIP VOC Emissions Budgets
1006 1018 SIP ProjectVOC HGASIP ¥.ofSIP : HGASlP Y. ofSIP
Project AcdvtdH laventory EmiuioDS EmissiollS EmiuloDS Emissions Emission. Cltq:ories Buqet Budlet Buded Budeet
( lpy) (tpd) (lpd) ('Yo) (tpd) ('Yo) Dredging Activities Commercial 25 .60 0.07 0.99 7.08% 1.1 8 5.94% (dredge, support Marine vessels)
Land-side Activities Construction 2.40 0.01 6.39 0. 10% 3.64 0. 18% (dredged material and Mining placement)
On-road Activities On-road 0.31 0.001 99.39 0.00\% 50.39 0.002% (employee Mobile commuting)
Overall Totals 2831 0.08 106.77 0.07 % 55.:Zl 0.14 '10
Overall, the proposed project construction emiSSions now represents 0.66% of NOx emissions and 0.07% of VOC emissions from marine, on-road, and construction sources modeled in the SIP for 2006 and then 1.68% of NOx emissions and 0.14% of VOC emissions of those emissions projected and modeled for 20 18. Emissions from the dredging equipment itself, plus support vessels, now represents 4.82% of NO x emissions and 7.08% of VOC emissions fo r the commercial marine category in 2006 and then 4.3 1 % of the NOx emissions and 5.94% of the VOC emissions modeled for 2018. Emiss ions from the construction equipment now represents 0.15% of NO x emissions and 0.10% of VOC emissions for the construction and mining category in 2006 and then 0.30% of the NOx emissions and 0.18% of the VOC emissions modeled for 2018. This additional comparison serves to reinforce the relative insignificance of the proposed project construction NOx and VOC emissions as compared with the most recent TCEQ modeling for attainment planning.
PHA believes it sti ll has shown that thi s proposed project can easily be accommodated into the SIP because the NOx and VOC emissions represents such a low percentage of the applicable SIP inventory categories, and as such, seeks concurrence from the TCEQ as allowed by 40 CFR 93.158(a)(5)(i)(A). Please provide an updated concurrence letter to Ms. Dana Blume, Environmental Affairs Manager, at the address in the letterhead. The concurrence letter will then be forwarded to the USACE for use in the general confonnity detennination.
If you have any questions, please contact Ken Gathright by telephone at 713-670-2690, or via emai l [email protected].
Sincerely.
Dana Blume Environmental Affairs Manager
CC:
Mr. Mark Vincent, Port of Houston Authority
Mr. Carl Sepulveda, AECOM, 5757 Woodway, Suite 10 1 W, Houston, Texas 77057
Bryan W. Shaw, Ph.D., Chainnan Carlos Rubinstein, Commissioner Toby Baker, Commissioner Zak CoWf, Executive Director
TExAs COMMISSION ON ENvIRONMENTAL QUALI1Y
Protecting Tl!Xl1s by Reducing and Preventing Pollution
Ms. Dana Blume Environmental Manager Port of Houston Authority P.O. Box 2562 Houston, Texas 77252-2562
February 20, 2013
Re: Department of the Army Permit Application SWG-2011-01183; General Conformity Concurrence - Update
Dear Ms. Blume:
This letter provides general conformity concurrence for the updated proposed Department of the Army Permit Application SWG-2011-ou83. The Texas Commission on Environmental Quality (TCEQ) reviewed the updates to the project in accordance with Title 40 Code of Federal Regulations Part 93. The proposed project is located in the Houston-Galveston-Brazoria (HGB) area, which is classified as severe nonattainment for the 1997 eight-hour ozone standard. Emissions are expected to be above the 25 tons per year de minimis threshold ; therefore, a general conformity analysis is required.
The TCEQ has detennined that the changes to the emissions from the proposed project will not exceed the emissions budgets specified in the most recent state implementation plan (SIP) revision approved by the United States Environmental Protection Agency (EPA). The most recently approved SIP revision, the HGB Reasonable Further Progress SIP adopted by the Commission on May 23, 2007, was approved by the EPA on March 29, 2010. This general conformity determination is based upon updated information provided in a February 7, 2013 letter submitted by t he Port of HouslonAuthority_
In support of the ozone National Ambient Air QuaJity Standard, the TCEQ suggests the Port of Houston Authority adopt pollution prevention and/or reduction measures in conjunction with this and fu ture projects, such as the following:
• encourage construction contractors to apply for Texas Emission Reduction Plan grants; • establish bidding conditions that give preference to clean contractors; • direct construction contractors to exercise air quality best management practices; • direct contractors that will use tugboats during construction to usc clean fuels; • direct operators of the assist tugboats used in maneuvering dredge vessels to use clean fuels; • select assist tugs based on lowest nitrogen oxides (NOx) emissions instead of lowest price;
and/or • purchase and permanently retire surplus NOx offsets prior to commencement of operations.
P.O. Box 13087 • Austin, Texas 78711-3087 • 512-239.1000 • tceq.texas.gov
How is our customer service? tceq.texllS.gov /customersurvey
Ms. Dana Blume Page 2
February 20, 2013
Thank you for providing the necessary updated information and staff assistance for our review. We would also appreciate any other update(s), as appropriate, as this project moves forward. 1 Jook forward to working with you in the future on any upcoming projects you may have that affect air quality in your district. If you requi re further assistance on this matter, please contact Mrs. Amy Muttoni at (512) 239-6351 or [email protected].
Sincerely,
~ctor Air Quality Division Texas Commission on Environmental Quality
DB/AM/kb
DRAFT DOCUMENT
BSC Improvements Section 408 and Section 204(f) AOM Draft EA
Appendix D Agency Coordination
______________________________________ NOAA National Marine Fisheries Services ______________________________________
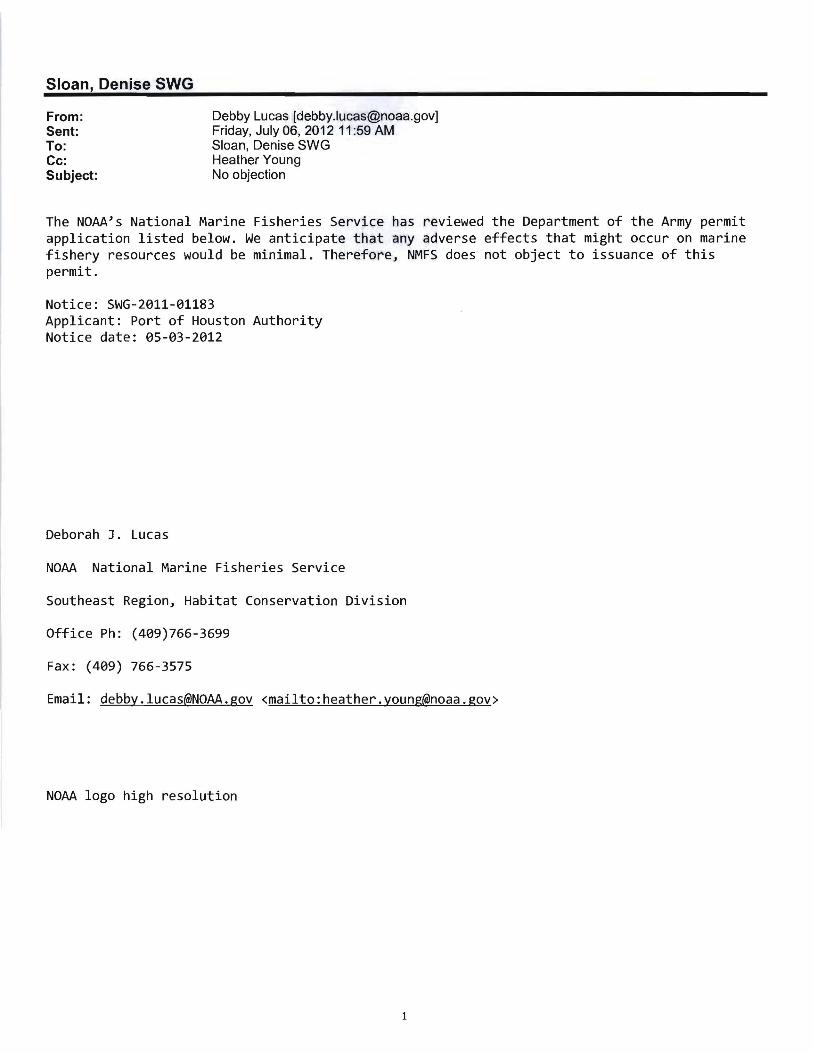
Sloan, Denise SWG
From: Debby Lucas [[email protected]] Sent: Friday. July 06, 2012 11 :59 AM To: Sloan, Denise SWG Cc: Heather Young Subject: No objection
The NOAA's National Marine Fisheries Service has reviewed the Department of the Army permit application listed below. We anticipate that any adverse effects that might occur on marine fishery resources would be minimal. Therefore, NMFS does not object to issuance of this permit.
Notice: SWG-2011-01183 Applicant: Port of Houston Authority Notice date: 05-03-2012
Deborah J. Lucas
NOAA National Marine Fisheries Service
Southeast Region, Habitat Conservation Division
Office Ph: (409)766-3699
Fax: (409) 766-3575
Email: [email protected] <mailto:[email protected]>
NOAA logo high resolution
1

______________________________________ Texas Council on Environmental Quality ______________________________________
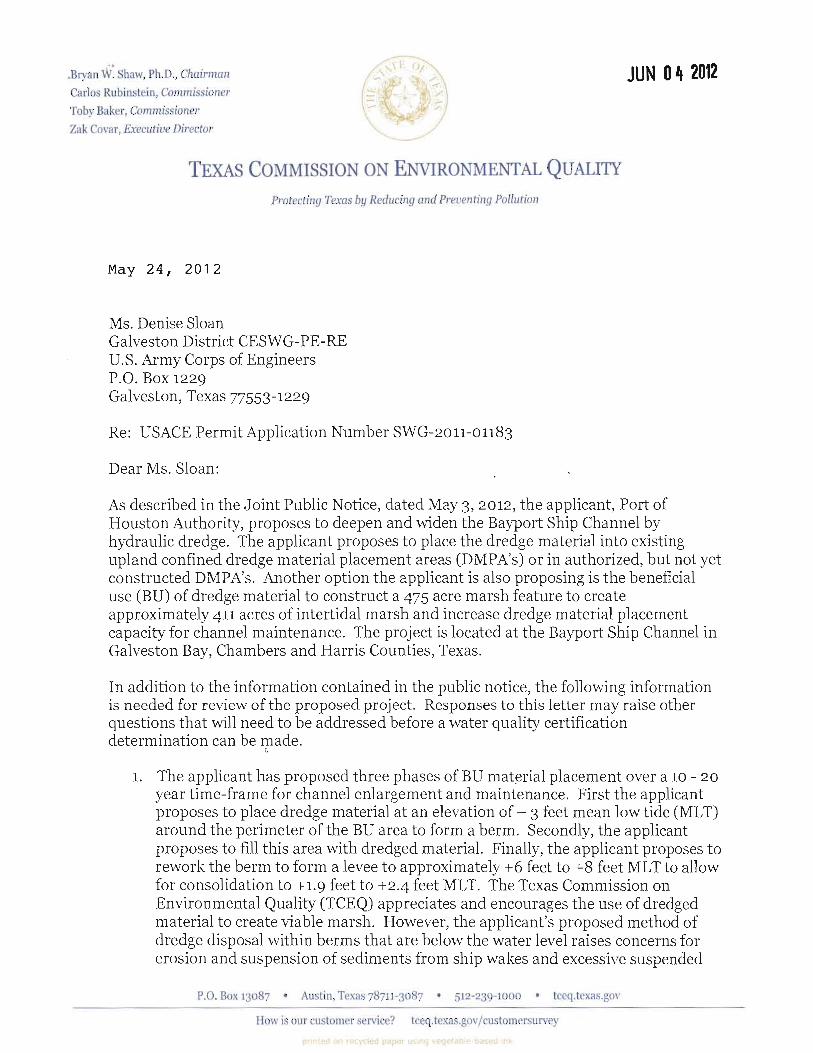
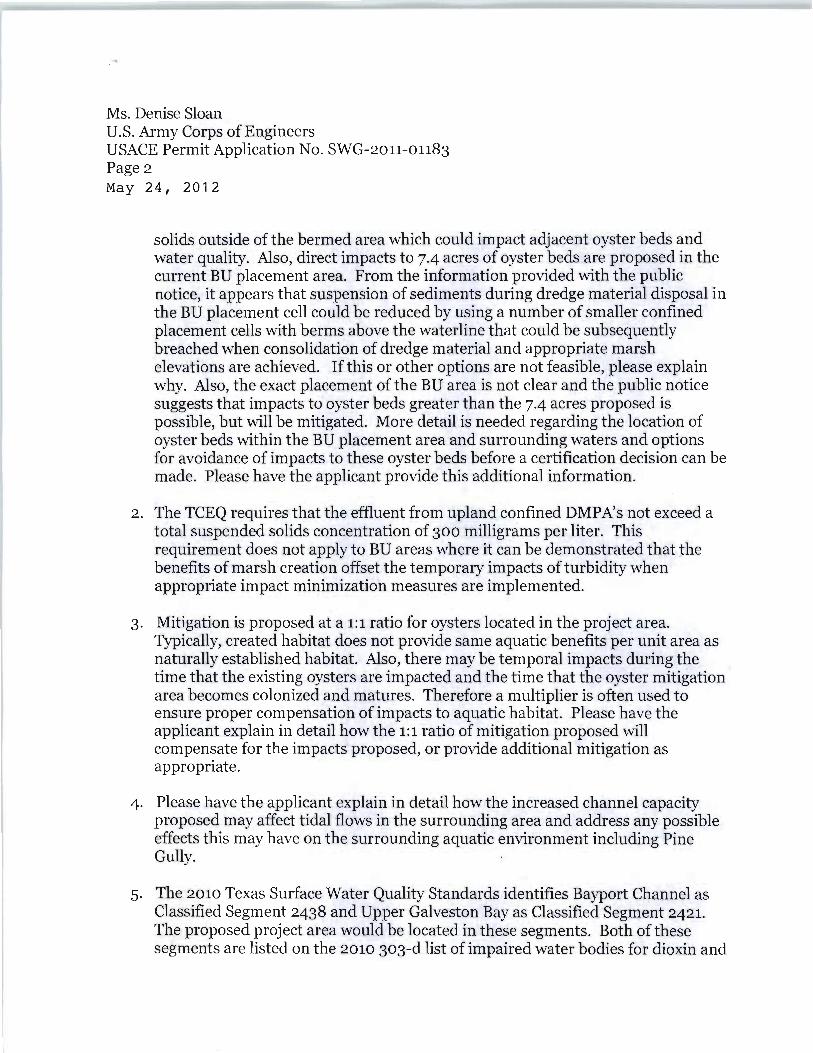
Ms. Denise Sloan U.S. Army Corps of Engineers USACE Permit Application No. SWG-2011-01183 Page 3
May 24, 2012
PCB's in edible tissue. Segment 2421 is also on the 2010 303-d list for Bacteria in oyster waters. If contamination of sediments to be dredged is suspected, sediment analyses should be performed in appropriate locations and if necessary, appropriate actions should be taken to minimize or eliminate re-suspension of contaminated sediments. Please have the applicant address sediment quality in the project area.
The TCEQ looks forward to receiving and evaluating other agency or public comments. Please provide any agency comments, public comments, as well as the applicant's comments, to Mr. Peter Schaefer of the Water Quality Division MC-150, P.O. Box 13087, Austin, Texas 78711-3087. Mr. Schaefer may also be contacted bye-mail at [email protected], or by telephone at (512) 239-4372.
Sincerely,
J)~WGJ~ David W. Galindo, Director Water Quality Division Texas Commission on Environmental Quality
DWG/PS/gg
Enclosure
ccs: Mr. Mark Vincent, Port of Houston Authority, P.O. Box 2562, Houston, Texas 77252-2562 Mr. Carl Sepulveda, AECOM, 5757 Woodway Drive, Suite 101 W., Houston, Texas 77057-1506 Ms. Kate Zultner, Secretary, Coastal Coordination Council, P. O. Box 12873, Austin, Texas 78711-2873
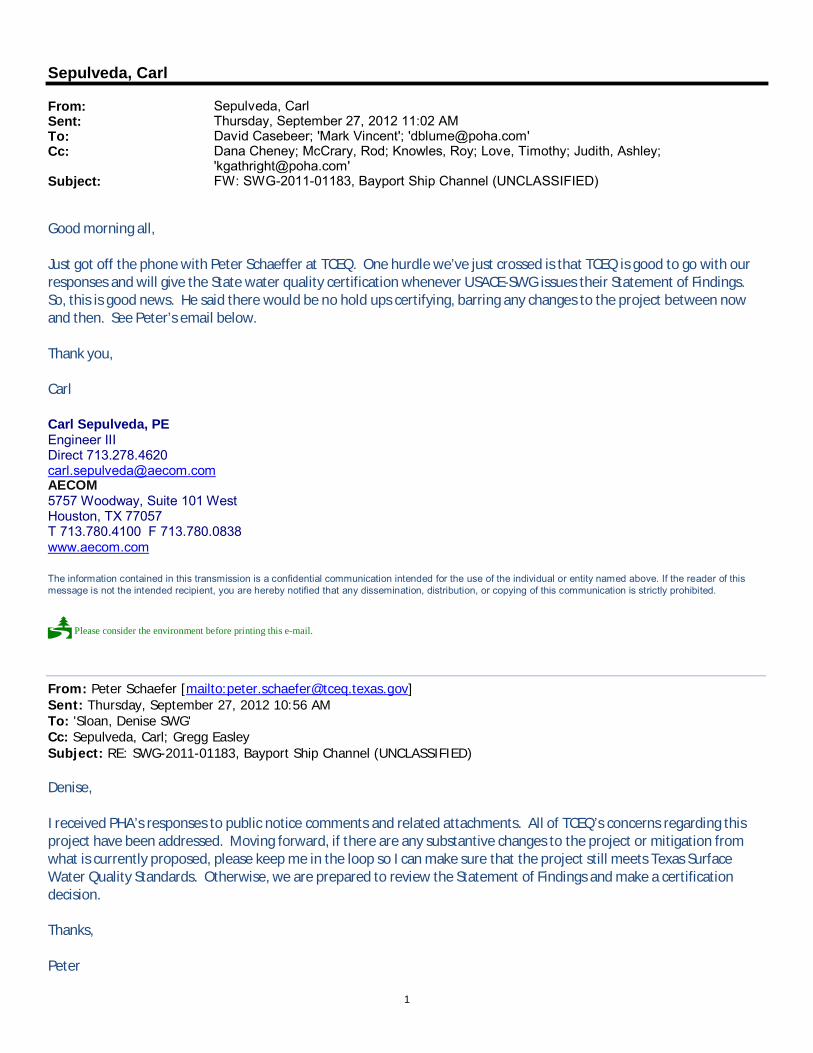
1
Sepulveda, Carl
From: Sepulveda, CarlSent: Thursday, September 27, 2012 11:02 AMTo: David Casebeer; 'Mark Vincent'; '[email protected]'Cc: Dana Cheney; McCrary, Rod; Knowles, Roy; Love, Timothy; Judith, Ashley;
'[email protected]'Subject: FW: SWG-2011-01183, Bayport Ship Channel (UNCLASSIFIED)
Good morning all, Just got off the phone with Peter Schaeffer at TCEQ. One hurdle we’ve just crossed is that TCEQ is good to go with our responses and will give the State water quality certification whenever USACE-SWG issues their Statement of Findings. So, this is good news. He said there would be no hold ups certifying, barring any changes to the project between now and then. See Peter’s email below. Thank you, Carl
Carl Sepulveda, PE Engineer III Direct 713.278.4620 [email protected] AECOM 5757 Woodway, Suite 101 West Houston, TX 77057 T 713.780.4100 F 713.780.0838 www.aecom.com
The information contained in this transmission is a confidential communication intended for the use of the individual or entity named above. If the reader of this message is not the intended recipient, you are hereby notified that any dissemination, distribution, or copying of this communication is strictly prohibited.
Please consider the environment before printing this e-mail.
From: Peter Schaefer [mailto:[email protected]] Sent: Thursday, September 27, 2012 10:56 AM To: 'Sloan, Denise SWG' Cc: Sepulveda, Carl; Gregg Easley Subject: RE: SWG-2011-01183, Bayport Ship Channel (UNCLASSIFIED) Denise, I received PHA’s responses to public notice comments and related attachments. All of TCEQ’s concerns regarding this project have been addressed. Moving forward, if there are any substantive changes to the project or mitigation from what is currently proposed, please keep me in the loop so I can make sure that the project still meets Texas Surface Water Quality Standards. Otherwise, we are prepared to review the Statement of Findings and make a certification decision. Thanks, Peter
2
From: Sloan, Denise SWG [mailto:[email protected]] Sent: Tuesday, September 25, 2012 9:54 AM To: Peter Schaefer Subject: SWG-2011-01183, Bayport Ship Channel (UNCLASSIFIED) Classification: UNCLASSIFIED Caveats: NONE
Good Morning Peter, This morning I asked Carl Sepulveda 713-278-4620, Port of Houston Authority’s agent, to forward you an email with links to the PHA’s responses to the public notice comments, and to mail you a hard copy of the responses to comments. Please let me know of any additional info you need. Denise Sloan Regulatory Project Manager Galveston District, U.S. Army Corps of Engineers P.O. Box 1229 Galveston, TX 77553-1229 409-766-3962 phone 409-766-3931 fax [email protected] Classification: UNCLASSIFIED Caveats: NONE
1
Sepulveda, Carl
From: [email protected]: Tuesday, August 21, 2012 11:15 AMTo: Sepulveda, CarlSubject: AECOM SendFiles Confirmation: Your files have been sent
This is an automatic notification from AECOM's File Transfer system that you have successfully sent 8 files
Recipient(s): [email protected];[email protected];[email protected];[email protected];[email protected];[email protected]
Message: Peter, Enclosed is our latest version of the responses to TCEQ comments. Our apologies; getting these reviewed on a quick turnaround took longer than anticipated, so we weren't able to getbefore today. As you are aware, the New BU Marsh option has been withdrawn from the permit, and we identified the comments having solely to do with this option in the response letter. Any feedback when you get back is appreciated. This version contains all the detail in the response for your review. In the version incorporated into the USACE response, there will be some referencing to responses that precede this that deal with the same issue. We will keep you posted as soon as possible if the response deadline is extended. Thank you kindly, Carl ----These files will be available for download until 8/28/2012
File Description Size Atch 4 Proj Oyster Hab Map.pdf 327KB Atch 2 Figs 1 & 2 Climate & Vessel Shear Diagrams.pdf 3,010KB TCEQ Sect 401 Comments Responses_DRAFT_2012-08-17_CLEAN.docx 65KB Atch 6 Project Area Sidescan.pdf 175KB Atch 1-Tate TBEM-2008.PPT 7,976KB Atch 7 References.docx 16KB Atch 3 Proj Hydro Model Current Vel Hi Flo Subm Berm & Marsh.pdf 6,736KB Atch 5 Oyster Mapping from gbnep_50-167-maps.pdf 1,037KB If you wish to check the status of these files, you may do so by CLICKING HERE


______________________________________ Texas General Land Office
______________________________________


______________________________________ Texas Historical Commission
______________________________________

______________________________________ U.S. Environmental Protection Agency
______________________________________
e\'V\4. i I rece\\led 5.Jvz. 1-0' z..
JUl 10 2012 UNITED STATES ENVIRONMENTAL PROTECTION AGENCY
REGION 6 1445 ROSS AVENUE, SUITE 1200
DALLAS, TX 75202-2733
',JUL 5 2012
Ms. Denise Sloan Regulatory Branch, CESWG-PE-RB U.S. Army Corps of Engineers P.O. Box 1229 Galveston, TX 77553-1229
Re: Public Notice SWG-20 11-0 1183, Port of Houston Authority, applicant
Dear Ms. Sloan:
The Environmental Protection Agency (EPA) has reviewed the Public Notice (PN), dated May 3, 2012, concerning Department of the Army (DA) Permit Application Number SWG-2011-01183, Port of Houston Authority, applicant. The project is located in Galveston Bay, at the Bayport Ship Channel in Chambers and Harris Counties, Texas.
The applicant proposes to use a hydraulic pipeline dr.::dge to deepen and widen the existing Bayport Ship Channel, deepen the turning basin and a portion of the Bayport Flare, and place the new work dredged material and maintenance dredgea material in a proposed beneficial use (BU) site and/or in existing dredged material placement areas.
The applicant proposes to use either or both of two dredged material placement options for the material: raise levees in existing placement areas, and/or build a new BU marsh placement area in phases.
The applicant states that the project would not impact any wetlands or special aquatic sites as the proposed work area is located in open water and unvegetated shallow bay bottom. The PN states that the preferred project alternative has the least potential impact on oyster reef habitat.
The comments that follow are being provided for u~ ,.; In rcaching a decision relative to compliance with the EPA's 404(b)(1) Guidelines/or .')"/Jecijication a/Disposal Sites for Dredged or Fill Material (40 CFR Part 230).
The EPA is concerned wi th the chemical composition of the material to be dredged, and the possibility of pollutants or hazardous substances in tI le sediments in this industrialized area. Unless recent sampling data exists for the sediments in the ship channel, the EPA requests sediment and elutriate testing of any sediments propL.sed for dredging and requests a copy of the test results.
We appreciate the applicant ' s examination of alternatives and consideration ofBU of dredged materials to create marsh, rather than placement in dredged material areas. However, we do have some questions that need clarifying. We also note that use of dredged material for BU needs to
Recycled!Recycllbie • Printed with Vegetable on Based Inks on 1000/0 Recycled Paper (40% Postc:onsumer)
follow BU guidelines as recommended by both the Corps and EPA, found at the following website: http://el.erdc.usace.army.milldots/budm/budm.cfm.
The EPA is concerned about the potential for construction of the P A 1411 5 connector and Atkinson Marsh Cell M -11 to disrupt the southeastern fetch along East Gal veston Bay to the Gulf of Mexico, and inhibit long-shore sediment transport and deposition. The Expansion of Placement Areas 14 and 15 and construction ofM-ll were documented in an Environmental Assessment (EA) dated January 2010. EPA did not receive a public notice or a copy of the Environmental Assessment for this expansion.
In addition, some of the project impacts to Galveston Bay described in the PN are unclear. A table found on page 9 of the PN summarizes the total impact to bay bottom acres, and cites a total of 1676.8 acres impacted. This is an excess impact of 904 acres beyond the total cut and total fill, and should be described or clarified.
EP A requests additional information regarding the construction of new beneficial use marsh, to accurately assess the environmental impacts to oyster habitat within both the project area and further downstream. The descriptions of the construction phases for this option are unclear, and EP A asks that several clarifications be made, induding:
1. Characterization of new work material destined for BU marsh berm creation: some portion of
the 4.0 MCY will likely be unconsolidated material that has settled out since the last
maintenance event. Has the virgin material underlying this accumulated "fluff' been tested
for berm construction suitability as well? In the discussion of dredging means and
application, the PN mentions that these containment berms will be "hydraulically
constructed." We interpret this to mean that a hydraulic cutterhead suction dredge will be
used to remove the new work material, which will then be piped to the BU site for berm
construction. This approach could cause any formerly consolidated material to become
slurried, thus compromising any soil structure that would have been beneficial to berm
construction. If this is the case, a significant amount of the material intended for berm construction could instead be carried downstream.
2. The initial design height of the submerged berm is projected at -3' MLT. Due to the semi
confined nature of this feature and the fact that 90 percent of the candidate material is
composed of fines (sand + silt), a significant portion of the material delivered to the placement area could likely be washed up and over the submerged berm and be carried downstream.
3. A brief description of wave energy and river/bay currents in the project area would be
beneficial for an understanding of how sediment is transported to, from and within the
project area, and would likely assist project engineers in the construction process. Has the
applicant conducted any such physical assessment or made plans to do so in the near future?
In addition to directly affecting several smaller oyster beds along its eastern extent, the current footprint of this proposed BU area also has the potential to adversely affect the health of other smaller oyster beds to the south of the area during the construction and filling periods, given any combination of outcomes from the phenomena mentioned above. These oyster beds are present on either side of the Bayport Ship Channel, which also may suffer adverse impacts if a significant amount of sediment is transported back into the channel. This could potentially increase dredging frequency of the Bayport Shipping Channel during the early stages of the project.
Therefore, the EPA recommends that the Department of the Army not issue a permit for this activity until the applicant has performed sediment sampling and responds to our concerns and request for clarification on the particulars of the proposed work.
Thank you for the opportunity to comment on the PN. If you have questions, please contact Ms. Barbara Aldridge of my staff at (214) 665-2712.
Sincerely yours,
e,~'!:;Jr:vL Chief Wetlands Section
cc: Edith Erfling, U.S . Fish and Wildlife Service, Houston, TX Heather Young, NMFS, Galveston, TX TCEQ, Austin, TX Mike Morgan, Texas Parks & Wildlife Department, Dickinson, TX

______________________________________ U.S. Fish and Wildlife Service
______________________________________
01183
JUL 09 2012
u.s. FISH & WD.DLIFE
SERVICE
United States Department of the Interior FISH AND WILDLIFE SERVICE
Division of Ecological Services ~~~Iw 'nl"' \~ 17629 El Camino Real, Suite 211 Houston, Texas 77058 In Reply Refer To:
2811286-8282 f (FAX) 2811488-5882FWS/R2/CLESI SWG-2011
July2, 20l2
Colonel Christopher Sal lese Galveston District, Corps of Engineers Attn: Denise Sloan P.O. Box 1229 Galveston, Texas 77553-1229
Dear Colonel Saltese,
Thank you for the opportunity to comment on the public notice for U.S. Army Corps of Engineers (Corps) permit application SWG-20 11-01183 dated May 3, 2012 . The applicant, Port of Houston Authority, proposes to deepen and widen the existing Bayport Ship Channel, deepen the Turning Basin, deepen a port of the Bayport Flare and place new work dredged material and maintenance dredged material in a proposed beneficial use site and/or in existing dredged material placement areas.
The revised Department of the Interior Manual Instructions (503 DM I), dated August 3, 1973, assign responsibility for Department of the Interior coordination and review of Corps permit applications to the u.S. Fish and Wildlife Service (Service). Our comments are provided in accordance with these instructions and the Fish and Wildlife Coordination Act (16 U.S.c. 661667(e)), the Endangered Species Act of 1973 (Act) (16 U.S.c. 1531 et seq.), the Migratory Bird Treaty Act (16 U.S.c. 703 et seg .), and the National Environmental Policy Act (42 U.S.c. 43214347) .
The Service has no objection to the issuance of this proposed permit. The applicant has extensively coordinated the proposed project with the Beneficial Uses Group, of which the Service is a member, on using the dredged material from this project in a manner that will benefit federal trust resources under the Service's jurisdiction.
Thank you for the opportunity to comment on this permit application. If you need any additional information please contact either myself of Donna Anderson, staff biologist, at 281-286-8282.
Sincerely,
~~ Edith Erfling Field Supervisor

DRAFT DOCUMENT
BSC Improvements Section 408 and Section 204(f) AOM Draft EA
Appendix E Responses to Comment

DRAFT DOCUMENT
BSC Improvements Section 408 and Section 204(f) AOM Draft EA
Appendix F Relative Sea Level Rise Analysis
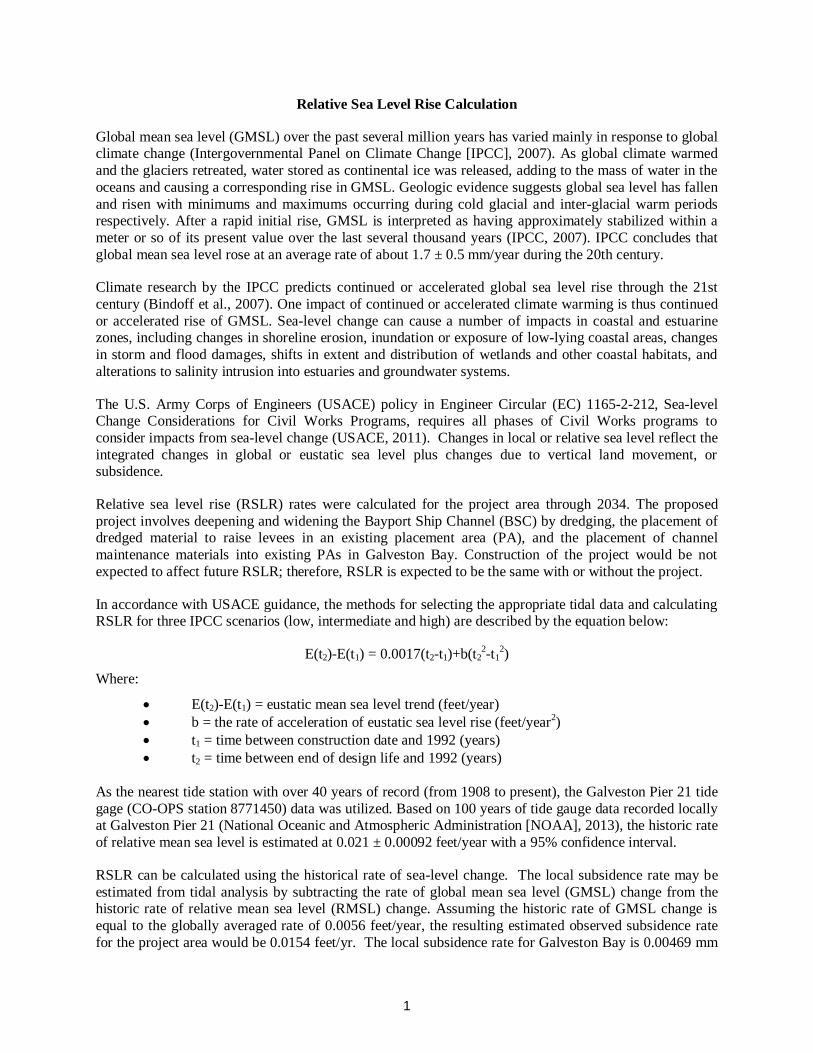
1
Relative Sea Level Rise Calculation
Global mean sea level (GMSL) over the past several million years has varied mainly in response to global climate change (Intergovernmental Panel on Climate Change [IPCC], 2007). As global climate warmed and the glaciers retreated, water stored as continental ice was released, adding to the mass of water in the oceans and causing a corresponding rise in GMSL. Geologic evidence suggests global sea level has fallen and risen with minimums and maximums occurring during cold glacial and inter-glacial warm periods respectively. After a rapid initial rise, GMSL is interpreted as having approximately stabilized within a meter or so of its present value over the last several thousand years (IPCC, 2007). IPCC concludes that global mean sea level rose at an average rate of about 1.7 ± 0.5 mm/year during the 20th century.
Climate research by the IPCC predicts continued or accelerated global sea level rise through the 21st century (Bindoff et al., 2007). One impact of continued or accelerated climate warming is thus continued or accelerated rise of GMSL. Sea-level change can cause a number of impacts in coastal and estuarine zones, including changes in shoreline erosion, inundation or exposure of low-lying coastal areas, changes in storm and flood damages, shifts in extent and distribution of wetlands and other coastal habitats, and alterations to salinity intrusion into estuaries and groundwater systems.
The U.S. Army Corps of Engineers (USACE) policy in Engineer Circular (EC) 1165-2-212, Sea-level Change Considerations for Civil Works Programs, requires all phases of Civil Works programs to consider impacts from sea-level change (USACE, 2011). Changes in local or relative sea level reflect the integrated changes in global or eustatic sea level plus changes due to vertical land movement, or subsidence.
Relative sea level rise (RSLR) rates were calculated for the project area through 2034. The proposed project involves deepening and widening the Bayport Ship Channel (BSC) by dredging, the placement of dredged material to raise levees in an existing placement area (PA), and the placement of channel maintenance materials into existing PAs in Galveston Bay. Construction of the project would be not expected to affect future RSLR; therefore, RSLR is expected to be the same with or without the project.
In accordance with USACE guidance, the methods for selecting the appropriate tidal data and calculating RSLR for three IPCC scenarios (low, intermediate and high) are described by the equation below:
E(t2)-E(t1) = 0.0017(t2-t1)+b(t22-t1
2)
Where:
• E(t2)-E(t1) = eustatic mean sea level trend (feet/year) • b = the rate of acceleration of eustatic sea level rise (feet/year2) • t1 = time between construction date and 1992 (years) • t2 = time between end of design life and 1992 (years)
As the nearest tide station with over 40 years of record (from 1908 to present), the Galveston Pier 21 tide gage (CO-OPS station 8771450) data was utilized. Based on 100 years of tide gauge data recorded locally at Galveston Pier 21 (National Oceanic and Atmospheric Administration [NOAA], 2013), the historic rate of relative mean sea level is estimated at 0.021 ± 0.00092 feet/year with a 95% confidence interval.
RSLR can be calculated using the historical rate of sea-level change. The local subsidence rate may be estimated from tidal analysis by subtracting the rate of global mean sea level (GMSL) change from the historic rate of relative mean sea level (RMSL) change. Assuming the historic rate of GMSL change is equal to the globally averaged rate of 0.0056 feet/year, the resulting estimated observed subsidence rate for the project area would be 0.0154 feet/yr. The local subsidence rate for Galveston Bay is 0.00469 mm
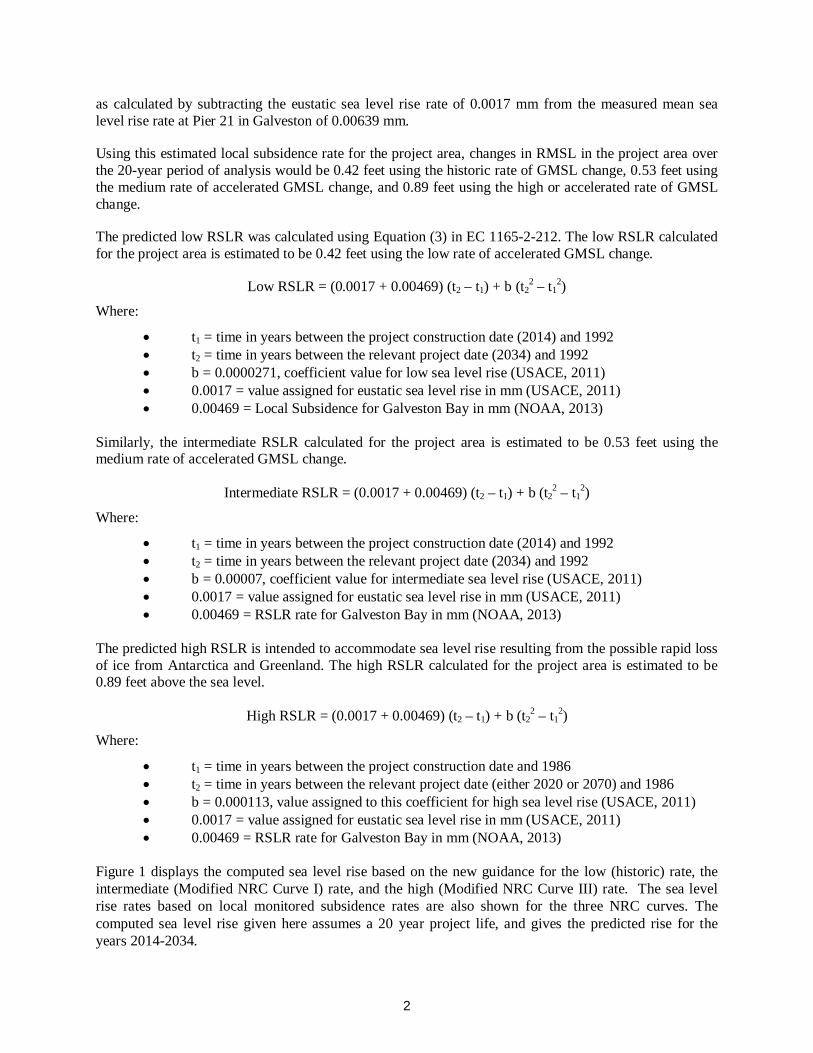
2
as calculated by subtracting the eustatic sea level rise rate of 0.0017 mm from the measured mean sea level rise rate at Pier 21 in Galveston of 0.00639 mm.
Using this estimated local subsidence rate for the project area, changes in RMSL in the project area over the 20-year period of analysis would be 0.42 feet using the historic rate of GMSL change, 0.53 feet using the medium rate of accelerated GMSL change, and 0.89 feet using the high or accelerated rate of GMSL change.
The predicted low RSLR was calculated using Equation (3) in EC 1165-2-212. The low RSLR calculated for the project area is estimated to be 0.42 feet using the low rate of accelerated GMSL change.
Low RSLR = (0.0017 + 0.00469) (t2 – t1) + b (t22 – t1
2)
Where:
• t1 = time in years between the project construction date (2014) and 1992 • t2 = time in years between the relevant project date (2034) and 1992 • b = 0.0000271, coefficient value for low sea level rise (USACE, 2011) • 0.0017 = value assigned for eustatic sea level rise in mm (USACE, 2011) • 0.00469 = Local Subsidence for Galveston Bay in mm (NOAA, 2013)
Similarly, the intermediate RSLR calculated for the project area is estimated to be 0.53 feet using the medium rate of accelerated GMSL change.
Intermediate RSLR = (0.0017 + 0.00469) (t2 – t1) + b (t22 – t1
2)
Where:
• t1 = time in years between the project construction date (2014) and 1992 • t2 = time in years between the relevant project date (2034) and 1992 • b = 0.00007, coefficient value for intermediate sea level rise (USACE, 2011) • 0.0017 = value assigned for eustatic sea level rise in mm (USACE, 2011) • 0.00469 = RSLR rate for Galveston Bay in mm (NOAA, 2013)
The predicted high RSLR is intended to accommodate sea level rise resulting from the possible rapid loss of ice from Antarctica and Greenland. The high RSLR calculated for the project area is estimated to be 0.89 feet above the sea level.
High RSLR = (0.0017 + 0.00469) (t2 – t1) + b (t22 – t1
2)
Where:
• t1 = time in years between the project construction date and 1986 • t2 = time in years between the relevant project date (either 2020 or 2070) and 1986 • b = 0.000113, value assigned to this coefficient for high sea level rise (USACE, 2011) • 0.0017 = value assigned for eustatic sea level rise in mm (USACE, 2011) • 0.00469 = RSLR rate for Galveston Bay in mm (NOAA, 2013)
Figure 1 displays the computed sea level rise based on the new guidance for the low (historic) rate, the intermediate (Modified NRC Curve I) rate, and the high (Modified NRC Curve III) rate. The sea level rise rates based on local monitored subsidence rates are also shown for the three NRC curves. The computed sea level rise given here assumes a 20 year project life, and gives the predicted rise for the years 2014-2034.
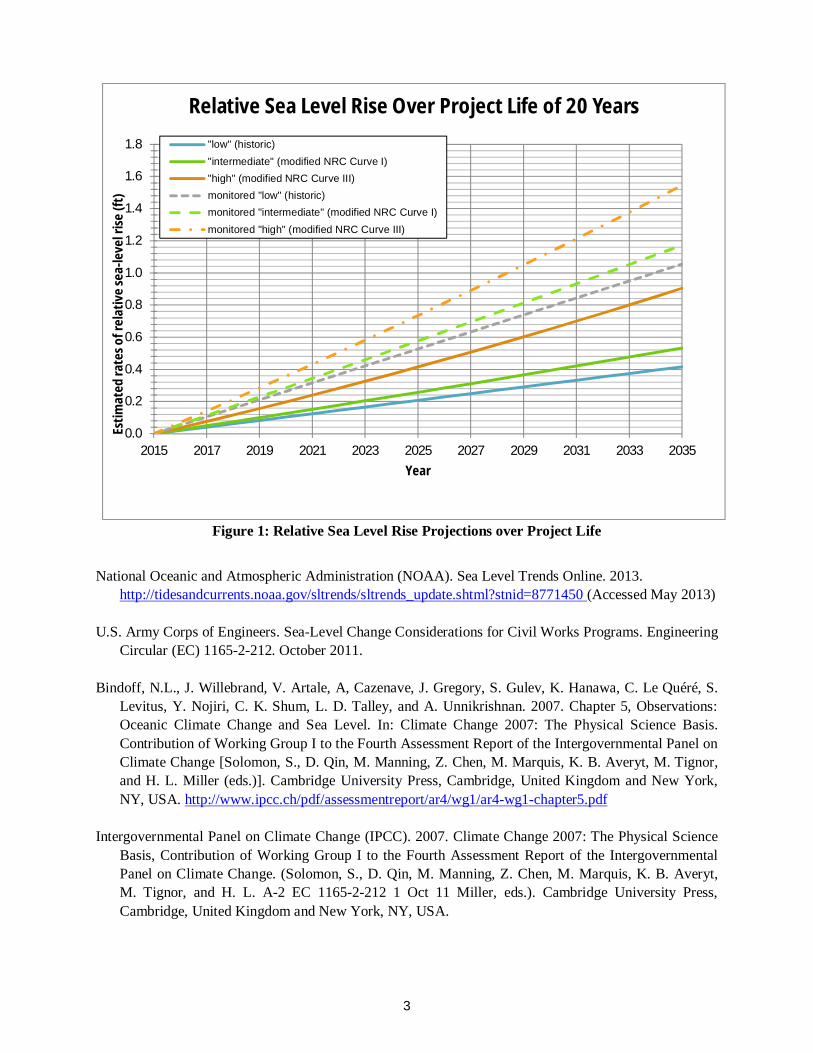
3
Figure 1: Relative Sea Level Rise Projections over Project Life
National Oceanic and Atmospheric Administration (NOAA). Sea Level Trends Online. 2013.
http://tidesandcurrents.noaa.gov/sltrends/sltrends_update.shtml?stnid=8771450 (Accessed May 2013) U.S. Army Corps of Engineers. Sea-Level Change Considerations for Civil Works Programs. Engineering
Circular (EC) 1165-2-212. October 2011. Bindoff, N.L., J. Willebrand, V. Artale, A, Cazenave, J. Gregory, S. Gulev, K. Hanawa, C. Le Quéré, S.
Levitus, Y. Nojiri, C. K. Shum, L. D. Talley, and A. Unnikrishnan. 2007. Chapter 5, Observations: Oceanic Climate Change and Sea Level. In: Climate Change 2007: The Physical Science Basis. Contribution of Working Group I to the Fourth Assessment Report of the Intergovernmental Panel on Climate Change [Solomon, S., D. Qin, M. Manning, Z. Chen, M. Marquis, K. B. Averyt, M. Tignor, and H. L. Miller (eds.)]. Cambridge University Press, Cambridge, United Kingdom and New York, NY, USA. http://www.ipcc.ch/pdf/assessmentreport/ar4/wg1/ar4-wg1-chapter5.pdf
Intergovernmental Panel on Climate Change (IPCC). 2007. Climate Change 2007: The Physical Science
Basis, Contribution of Working Group I to the Fourth Assessment Report of the Intergovernmental Panel on Climate Change. (Solomon, S., D. Qin, M. Manning, Z. Chen, M. Marquis, K. B. Averyt, M. Tignor, and H. L. A-2 EC 1165-2-212 1 Oct 11 Miller, eds.). Cambridge University Press, Cambridge, United Kingdom and New York, NY, USA.
0.0
0.2
0.4
0.6
0.8
1.0
1.2
1.4
1.6
1.8
2015 2017 2019 2021 2023 2025 2027 2029 2031 2033 2035
Estim
ated
rate
s of r
elat
ive
sea-
leve
l ris
e (ft
)
Year
Relative Sea Level Rise Over Project Life of 20 Years
"low" (historic)"intermediate" (modified NRC Curve I)"high" (modified NRC Curve III)monitored "low" (historic)monitored "intermediate" (modified NRC Curve I)monitored "high" (modified NRC Curve III)
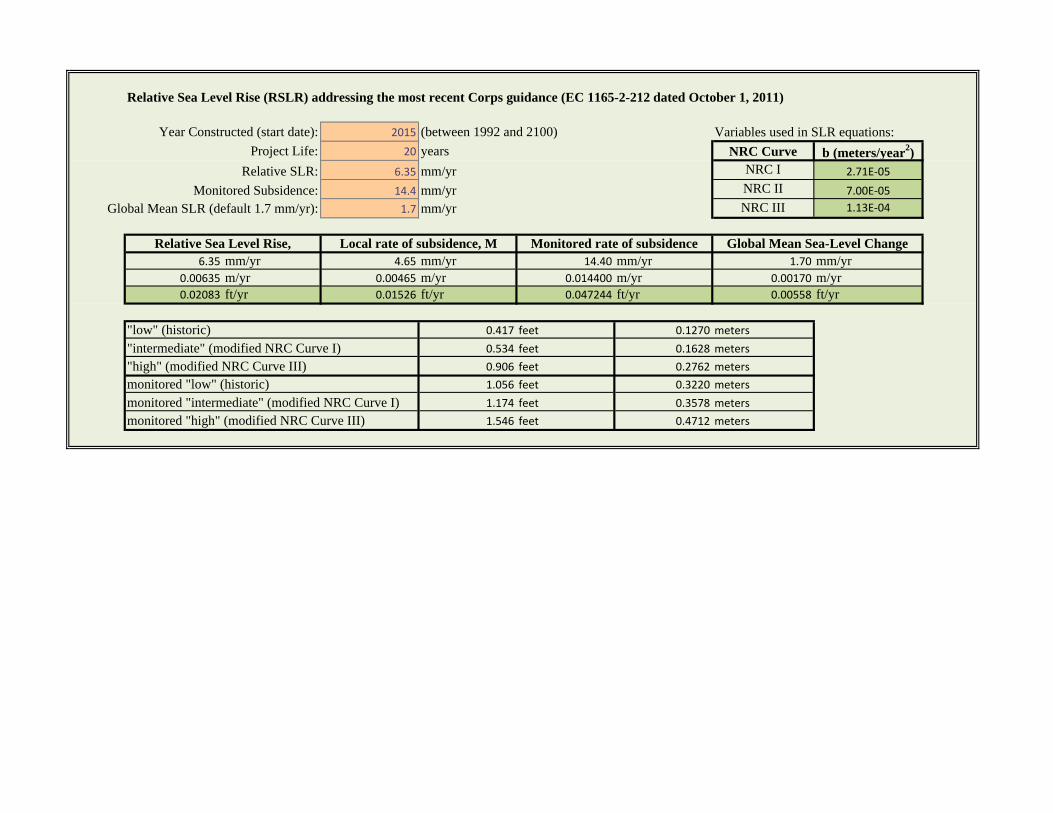
Relative Sea Level Rise (RSLR) addressing the most recent Corps guidance (EC 1165-2-212 dated October 1, 2011)
2015 (between 1992 and 2100) Variables used in SLR equations:20 years NRC Curve b (meters/year2)
6.35 mm/yr NRC I 2.71E-0514.4 mm/yr NRC II 7.00E-05
1.7 mm/yr NRC III 1.13E-04
6.35 mm/yr 4.65 mm/yr 14.40 mm/yr 1.70 mm/yr0.00635 m/yr 0.00465 m/yr 0.014400 m/yr 0.00170 m/yr0.02083 ft/yr 0.01526 ft/yr 0.047244 ft/yr 0.00558 ft/yr
"low" (historic) 0.417 feet 0.1270 meters"intermediate" (modified NRC Curve I) 0.534 feet 0.1628 meters"high" (modified NRC Curve III) 0.906 feet 0.2762 metersmonitored "low" (historic) 1.056 feet 0.3220 metersmonitored "intermediate" (modified NRC Curve I) 1.174 feet 0.3578 metersmonitored "high" (modified NRC Curve III) 1.546 feet 0.4712 meters
Monitored rate of subsidence Global Mean Sea-Level ChangeLocal rate of subsidence, M
Global Mean SLR (default 1.7 mm/yr):
Year Constructed (start date):Project Life:
Relative SLR:Monitored Subsidence:
Relative Sea Level Rise,
DRAFT DOCUMENT
BSC Improvements Section 408 and Section 204(f) AOM Draft EA
Appendix G G-1: Compensatory Mitigation Plan for Oyster Habitat Mitigation
G-2: Compensatory Mitigation Plan for Tidal Marsh Mitigation
PORT OF HOUSTON AUTHORITY BAYPORT SHIP CHANNEL IMPROVEMENTS
HARRIS AND CHAMBERS COUNTIES, TEXAS
Compensatory Mitigation Plan
for
Oyster Mitigation
for the Proposed Bayport Ship Channel Improvements
July 2013
Compensatory Mitigation Plan for Oyster Mitigation for Proposed BSC Improvements
1
1.0 OBJECTIVES The primary objective of the mitigation project is to replace the oyster reef habitat that would be removed by construction of the Bayport Ship Channel (BSC) improvements through restoration of oyster habitat on Fisher's Reef in Trinity Bay, Chambers County, Texas. Specifically, the mitigation plan proposes to add approximately 3,710 cubic yards (cy) of cultch to 4.6 acres on Fisher’s Reef to compensate for the direct impacts associated with the proposed deepening and widening of the BSC. The restoration would increase the existing oyster habitat in Trinity Bay by providing 4.6 acres of hard surface area available for natural recruitment of oyster larvae. Fisher’s Reef was impacted by Hurricane Ike-induced sedimentation in 2008. The oyster reef restoration would replace oyster reef that contributes to important ecological benefits to Galveston Bay. Benefits include provision of aquatic habitat structure for several fish and invertebrate species, improvement of water quality and clarity as well as general re-establishment of essential fish and invertebrate habitat. The proposed site at Fisher’s Reef is shown in Figure 1. 2.0 SITE SELECTION CRITERIA The two Fisher’s Reef areas selected were chosen for maximum water depth and minimum sediment overburden based on post-Hurricane Ike TPWD side-scan sonar data and sub-bottom profiling data collected by Texas A&M University at Galveston. One reef footprint is in a shellfish harvesting area, and the other reef footprint is in waters restricted from shellfish harvest, thus allowing for research on harvested versus non-harvested adjacent oyster reefs. The Fisher’s Reef area was recommended by the Texas Parks and Wildlife Department (TPWD) as the preferred location for oyster reef restoration at the request of the Beneficial Uses Group (BUG). Following Hurricane Ike, the TPWD side-scan sonar surveys found that approximately 50 percent of the reefs in Galveston Bay were covered by hurricane-induced sedimentation eliminating or substantially reducing their function. This triggered an ongoing restoration effort by TPWD to reverse these losses. As the selected site is in Galveston Bay, the mitigation occurs in the same bay system that the impacts would occur in, and where restoration efforts have been planned and targeted by the resource agency with primary responsibility for oyster reef conservation. Direct on-site mitigation is not applicable in this situation as replacement reef cannot be appropriately located in the deepened navigation channel. The restoration relies on natural oyster larvae recruitment and growth, and would be self-sustaining. This method has been successfully used on past similar restoration projects in Galveston Bay and around the nation. 3.0 SITE PROTECTION INSTRUMENTS The Fisher’s Reef area is located within Galveston Bay, for which, in general, the submerged land is State-owned and managed by the Texas General Land Office (TxGLO). Natural resource use or impact is subject to regulation by various governmental agencies including but not limited to TPWD, USACE, National Marine Fisheries Service (NMFS), and the U.S. Environmental Protection Agency (USEPA).
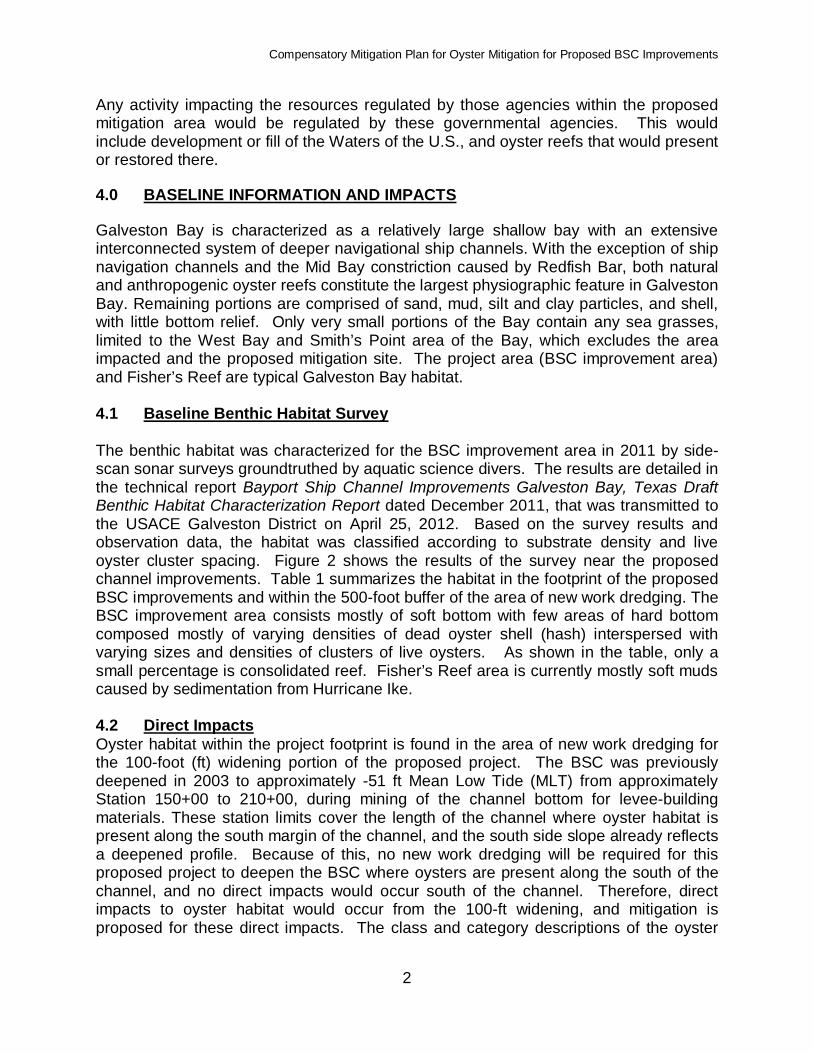
Compensatory Mitigation Plan for Oyster Mitigation for Proposed BSC Improvements
2
Any activity impacting the resources regulated by those agencies within the proposed mitigation area would be regulated by these governmental agencies. This would include development or fill of the Waters of the U.S., and oyster reefs that would present or restored there. 4.0 BASELINE INFORMATION AND IMPACTS Galveston Bay is characterized as a relatively large shallow bay with an extensive interconnected system of deeper navigational ship channels. With the exception of ship navigation channels and the Mid Bay constriction caused by Redfish Bar, both natural and anthropogenic oyster reefs constitute the largest physiographic feature in Galveston Bay. Remaining portions are comprised of sand, mud, silt and clay particles, and shell, with little bottom relief. Only very small portions of the Bay contain any sea grasses, limited to the West Bay and Smith’s Point area of the Bay, which excludes the area impacted and the proposed mitigation site. The project area (BSC improvement area) and Fisher’s Reef are typical Galveston Bay habitat. 4.1 Baseline Benthic Habitat Survey The benthic habitat was characterized for the BSC improvement area in 2011 by side-scan sonar surveys groundtruthed by aquatic science divers. The results are detailed in the technical report Bayport Ship Channel Improvements Galveston Bay, Texas Draft Benthic Habitat Characterization Report dated December 2011, that was transmitted to the USACE Galveston District on April 25, 2012. Based on the survey results and observation data, the habitat was classified according to substrate density and live oyster cluster spacing. Figure 2 shows the results of the survey near the proposed channel improvements. Table 1 summarizes the habitat in the footprint of the proposed BSC improvements and within the 500-foot buffer of the area of new work dredging. The BSC improvement area consists mostly of soft bottom with few areas of hard bottom composed mostly of varying densities of dead oyster shell (hash) interspersed with varying sizes and densities of clusters of live oysters. As shown in the table, only a small percentage is consolidated reef. Fisher’s Reef area is currently mostly soft muds caused by sedimentation from Hurricane Ike. 4.2 Direct Impacts Oyster habitat within the project footprint is found in the area of new work dredging for the 100-foot (ft) widening portion of the proposed project. The BSC was previously deepened in 2003 to approximately -51 ft Mean Low Tide (MLT) from approximately Station 150+00 to 210+00, during mining of the channel bottom for levee-building materials. These station limits cover the length of the channel where oyster habitat is present along the south margin of the channel, and the south side slope already reflects a deepened profile. Because of this, no new work dredging will be required for this proposed project to deepen the BSC where oysters are present along the south of the channel, and no direct impacts would occur south of the channel. Therefore, direct impacts to oyster habitat would occur from the 100-ft widening, and mitigation is proposed for these direct impacts. The class and category descriptions of the oyster
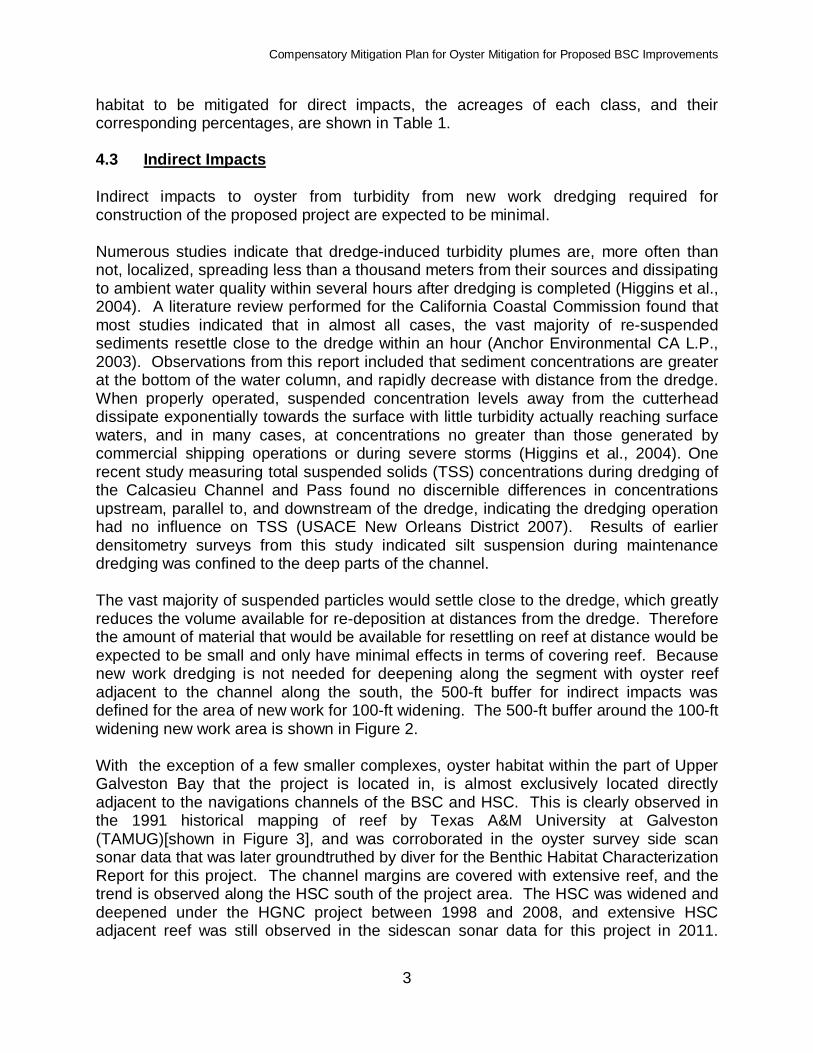
Compensatory Mitigation Plan for Oyster Mitigation for Proposed BSC Improvements
3
habitat to be mitigated for direct impacts, the acreages of each class, and their corresponding percentages, are shown in Table 1. 4.3 Indirect Impacts Indirect impacts to oyster from turbidity from new work dredging required for construction of the proposed project are expected to be minimal. Numerous studies indicate that dredge-induced turbidity plumes are, more often than not, localized, spreading less than a thousand meters from their sources and dissipating to ambient water quality within several hours after dredging is completed (Higgins et al., 2004). A literature review performed for the California Coastal Commission found that most studies indicated that in almost all cases, the vast majority of re-suspended sediments resettle close to the dredge within an hour (Anchor Environmental CA L.P., 2003). Observations from this report included that sediment concentrations are greater at the bottom of the water column, and rapidly decrease with distance from the dredge. When properly operated, suspended concentration levels away from the cutterhead dissipate exponentially towards the surface with little turbidity actually reaching surface waters, and in many cases, at concentrations no greater than those generated by commercial shipping operations or during severe storms (Higgins et al., 2004). One recent study measuring total suspended solids (TSS) concentrations during dredging of the Calcasieu Channel and Pass found no discernible differences in concentrations upstream, parallel to, and downstream of the dredge, indicating the dredging operation had no influence on TSS (USACE New Orleans District 2007). Results of earlier densitometry surveys from this study indicated silt suspension during maintenance dredging was confined to the deep parts of the channel. The vast majority of suspended particles would settle close to the dredge, which greatly reduces the volume available for re-deposition at distances from the dredge. Therefore the amount of material that would be available for resettling on reef at distance would be expected to be small and only have minimal effects in terms of covering reef. Because new work dredging is not needed for deepening along the segment with oyster reef adjacent to the channel along the south, the 500-ft buffer for indirect impacts was defined for the area of new work for 100-ft widening. The 500-ft buffer around the 100-ft widening new work area is shown in Figure 2. With the exception of a few smaller complexes, oyster habitat within the part of Upper Galveston Bay that the project is located in, is almost exclusively located directly adjacent to the navigations channels of the BSC and HSC. This is clearly observed in the 1991 historical mapping of reef by Texas A&M University at Galveston (TAMUG)[shown in Figure 3], and was corroborated in the oyster survey side scan sonar data that was later groundtruthed by diver for the Benthic Habitat Characterization Report for this project. The channel margins are covered with extensive reef, and the trend is observed along the HSC south of the project area. The HSC was widened and deepened under the HGNC project between 1998 and 2008, and extensive HSC adjacent reef was still observed in the sidescan sonar data for this project in 2011.
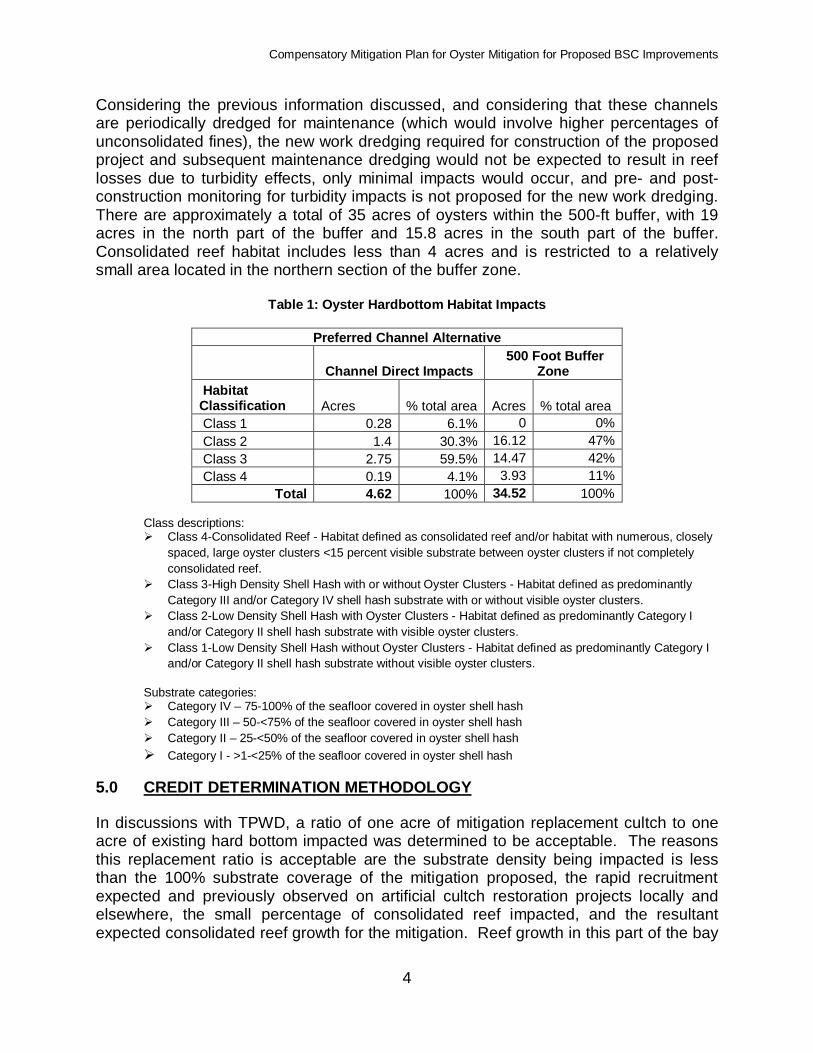
Compensatory Mitigation Plan for Oyster Mitigation for Proposed BSC Improvements
4
Considering the previous information discussed, and considering that these channels are periodically dredged for maintenance (which would involve higher percentages of unconsolidated fines), the new work dredging required for construction of the proposed project and subsequent maintenance dredging would not be expected to result in reef losses due to turbidity effects, only minimal impacts would occur, and pre- and post-construction monitoring for turbidity impacts is not proposed for the new work dredging. There are approximately a total of 35 acres of oysters within the 500-ft buffer, with 19 acres in the north part of the buffer and 15.8 acres in the south part of the buffer. Consolidated reef habitat includes less than 4 acres and is restricted to a relatively small area located in the northern section of the buffer zone.
Table 1: Oyster Hardbottom Habitat Impacts
Preferred Channel Alternative
Channel Direct Impacts 500 Foot Buffer
Zone Habitat Classification Acres % total area Acres % total area Class 1 0.28 6.1% 0 0% Class 2 1.4 30.3% 16.12 47% Class 3 2.75 59.5% 14.47 42% Class 4 0.19 4.1% 3.93 11%
Total 4.62 100% 34.52 100% Class descriptions:
Class 4-Consolidated Reef - Habitat defined as consolidated reef and/or habitat with numerous, closely spaced, large oyster clusters <15 percent visible substrate between oyster clusters if not completely consolidated reef.
Class 3-High Density Shell Hash with or without Oyster Clusters - Habitat defined as predominantly Category III and/or Category IV shell hash substrate with or without visible oyster clusters.
Class 2-Low Density Shell Hash with Oyster Clusters - Habitat defined as predominantly Category I and/or Category II shell hash substrate with visible oyster clusters.
Class 1-Low Density Shell Hash without Oyster Clusters - Habitat defined as predominantly Category I and/or Category II shell hash substrate without visible oyster clusters.
Substrate categories: Category IV – 75-100% of the seafloor covered in oyster shell hash Category III – 50-<75% of the seafloor covered in oyster shell hash Category II – 25-<50% of the seafloor covered in oyster shell hash Category I - >1-<25% of the seafloor covered in oyster shell hash
5.0 CREDIT DETERMINATION METHODOLOGY In discussions with TPWD, a ratio of one acre of mitigation replacement cultch to one acre of existing hard bottom impacted was determined to be acceptable. The reasons this replacement ratio is acceptable are the substrate density being impacted is less than the 100% substrate coverage of the mitigation proposed, the rapid recruitment expected and previously observed on artificial cultch restoration projects locally and elsewhere, the small percentage of consolidated reef impacted, and the resultant expected consolidated reef growth for the mitigation. Reef growth in this part of the bay

Compensatory Mitigation Plan for Oyster Mitigation for Proposed BSC Improvements
5
is very limited by suitable substrate. The mitigation project will improve conditions by providing this clean substrate. As summarized in the table above, approximately 96% of the impacted acreage consists of areas where 1-25%, 25-50% and 50-75% substrate coverage predominates. The mitigation would be a solid 100% coverage of artificial cultch, which would provide more attachment surface area per acre than the substrate impacted. Rapid recruitment of oyster spat on the artificial cultch is expected and was observed with the previous oyster mitigation in Galveston Bay that employed the same proposed method for the Houston and Galveston Navigation Channel (HGNC) Project. Substantial growth was observed within 3 months as documented in post-construction monitoring. The live oyster density observed during post-construction monitoring for the HGNC was commensurate with the consolidated reef live oyster cluster spacing observed during the groundtruthing-by-diver for this project. Consolidated growth would be expected on the mitigation cultch. The mitigation ratio is a one to one ratio of hard bottom area to hard bottom area and not a direct one to one replacement ratio of living oysters. However, as discussed, the cultch material will be readily colonized by oyster larvae, and the resultant live oyster density would be expected to be greater than that impacted. 6.0 MITIGATION WORK PLAN The following are elements of the mitigation work plan:
• Geographic boundaries of the project – The project site and approximate boundaries are shown in Figure 1. The mitigation for the proposed project is shown as conceptual, since the 4.6 acres of mitigation will specifically be located within the 30-acre TPWD restoration site considering review of detailed local site condition information and consultation with TPWD staff during construction design.
• Construction methods, substrate elevation, and slopes – The mitigation work plan proposes to add approximately 3,710 cy of cultch to 4.6 acres, to result in an approximate 6-inch thick layer of cultch above the bay bottom. This profile was recommended by the TPWD. The cultch would be clean limestone, crushed concrete rubble, or other suitable substrate as deemed acceptable by the TPWD. Limestone is anticipated to be used. The cultch would most likely be barged to Fisher’s Reef and then placed evenly on the bay bottom at Fisher’s Reef over the indicated acreage. Proper sloping for stability will be determined for the specific cultch material used, but is nominally identified as a 2 horizontal: 1 vertical side slope ratio.
• Timing and sequence – The mitigation would be constructed concurrent with the construction of the proposed channel improvements. Therefore, mitigation would be built at the time impacts occur. With the area and volume of material
Compensatory Mitigation Plan for Oyster Mitigation for Proposed BSC Improvements
6
involved, it is anticipated the mitigation would be constructed in a single phase, under a single mobilization. Seasonally, the construction will be timed to be completed a short time before the spawning season to ensure recruitment of spat soon after the substrate is available. Spawning season is late spring to early fall in Galveston Bay.
• Foundation – Proper analysis will be performed and measures taken to determine and ensure vertical stability of cultch material in the soft bay bottom. This will be determined after the specific cultch material is determined and local site conditions analyzed. Historic knowledge of the site indicates that suitable foundation exists.
• Other elements considered – Other mitigation work plan elements listed in 40 CFR 230.94(c)(7), such as source of water or methods to establish the desired plan community, are not applicable.
7.0 MAINTENANCE PLAN Once the cultch has been placed on the bottom of the Fisher’s Reef area of Galveston Bay, no further maintenance of the project area would be required. The cultch should stay exposed for colonization by oyster larvae and other aquatic organisms. The substrate will develop on its own into mature reef with market-size oysters expected in two to three years similar to that experienced with the HGNC oyster restoration. However, other unusual events, such as another major hurricane like Hurricane Ike could cover the area, as well as natural reefs. No specific long term maintenance for these unusual events is planned. 8.0 ECOLOGICAL PERFORMANCE STANDARDS The object of this restoration is to replace oyster habitat by a one to one ratio. Success would be defined as an increase in reef acreage of at least 4.6 acres. Pre-restoration and post-restoration side scan-sonar data would be collected and processed into ArcGIS data layers. Restored reef acreage would be quantified by subtracting pre-restoration reef acreage from post-restoration reef acreage to determine the amount of habitat restored. The functional endpoint would be oyster density (oysters per square meter [oysters/m2]). Oyster density would be measured using the diver quadrat method twice a year (pre- and post-oyster harvest season) for three years. Self-contained Underwater Breathing Apparatus (SCUBA) divers would sample random points along a transect line by placing a 0.5 square meter quadrat on the bay bottom and placing all shells and live oysters from within the quadrat into a mesh bag. All live oysters within the quadrat would be enumerated and measured for shell length. Success would be defined as a post-restoration oyster density equal to or greater than densities observed during a pre-construction survey of a nearby control site chosen by TPWD.
9.0 MONITORING REQUIREMENTS
Compensatory Mitigation Plan for Oyster Mitigation for Proposed BSC Improvements
7
Monitoring of the restoration sites would be conducted pre- and post-restoration to assess the success of the project. Criteria for restoration success would include one structural and one functional endpoint. The structural endpoint would be the number of reef acres restored. Oyster density, the functional endpoint, would be measured using the diver quadrat method twice a year (pre- and post-oyster harvest season) for three years. SCUBA divers would sample random points along a transect line by placing a 0.5 square meter quadrat on the bay bottom and placing all shells and live oysters from within the quadrat into a mesh bag. All live oysters within the quadrat would be enumerated and measured for shell length. When the success criteria are met, the monitoring would cease and the mitigation project would be determined to be successful. 10.0 LONG-TERM MANAGEMENT PLAN After the mitigation project is determined to be successful, management of the Fisher’s reef area would be returned to the owners of the site and regulators of the bottom of Galveston Bay, which are the various governmental agencies including but not limited to TPWD, TxGLO, USACE, NMFS, and USEPA. 11.0 ADAPTIVE MANAGEMENT PLAN Any time during the monitoring period, if the success of the mitigation plan appears not to be meeting the success criteria; the permittee would notify the TPWD and USACE District Engineer as soon as possible, so that the mitigation can be evaluated and measures pursued to address deficiencies of the mitigation. Discussions on meeting the success criteria would be included in each monitoring report. 12.0 FINANCIAL ASSURANCES The Port of Houston Authority (the Applicant) is an autonomous governmental entity created in 1927 by a special act of the Texas Legislature (article III, section 52 of the Texas Constitution, Act of 1927, 40th Legislature, R.S., Chapter 97, § 1, 1927 Texas General Laws 256, 256-57), with a mission to provide, operate, and maintain waterways and cargo/passenger facilities. Its mission is also to promote trade and generate favorable economic effects upon, and contribute to, the economic development of the Port of Houston Authority, the City of Houston, and the communities of Harris County and the Texas Coastal Region. This mission is to be accomplished in a manner that provides sufficient funds to cover the mitigation operational expenses and capital investments. A preliminary cost estimate for the mitigation is approximately $1.09 million, which is approximately 1.3 percent of the $79.4 million cost to construct the proposed channel improvements. It is anticipated the mitigation funding source will be the same as that for the proposed project construction. The Applicant has a long track record of successfully participating in and funding mitigation and restoration (e.g. beneficial use) as part of its sponsored projects, including the HGNC Project.
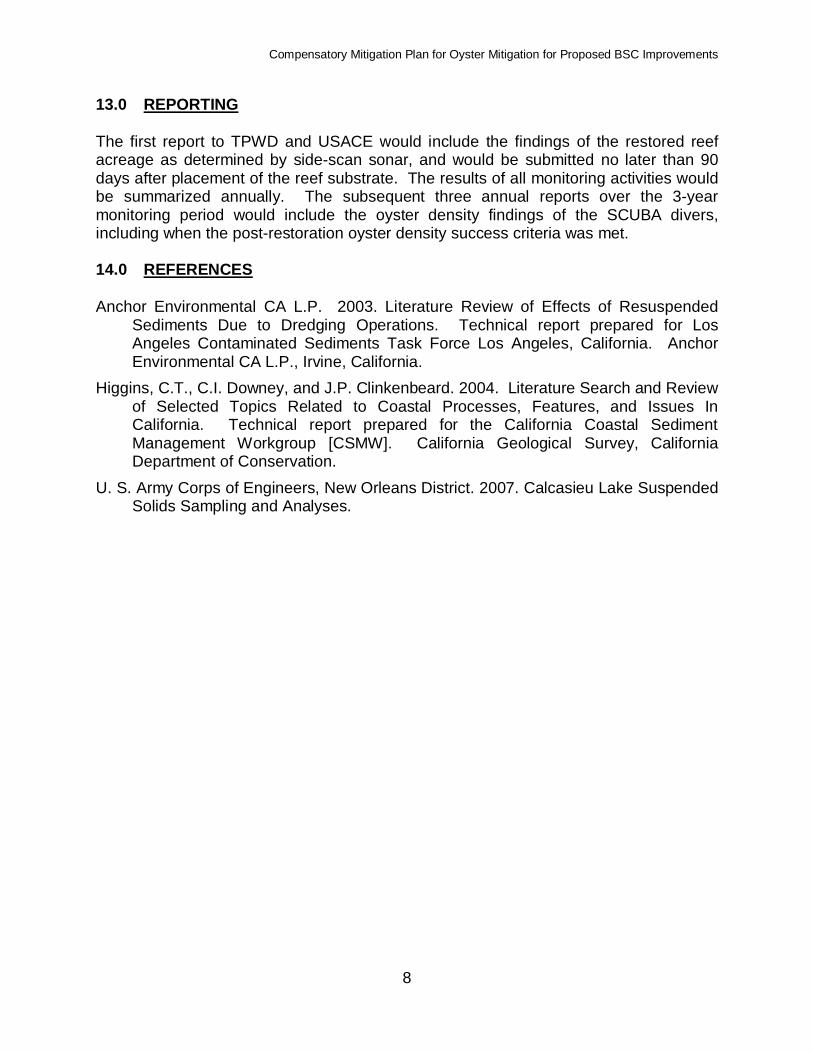
Compensatory Mitigation Plan for Oyster Mitigation for Proposed BSC Improvements
8
13.0 REPORTING The first report to TPWD and USACE would include the findings of the restored reef acreage as determined by side-scan sonar, and would be submitted no later than 90 days after placement of the reef substrate. The results of all monitoring activities would be summarized annually. The subsequent three annual reports over the 3-year monitoring period would include the oyster density findings of the SCUBA divers, including when the post-restoration oyster density success criteria was met. 14.0 REFERENCES Anchor Environmental CA L.P. 2003. Literature Review of Effects of Resuspended
Sediments Due to Dredging Operations. Technical report prepared for Los Angeles Contaminated Sediments Task Force Los Angeles, California. Anchor Environmental CA L.P., Irvine, California.
Higgins, C.T., C.I. Downey, and J.P. Clinkenbeard. 2004. Literature Search and Review of Selected Topics Related to Coastal Processes, Features, and Issues In California. Technical report prepared for the California Coastal Sediment Management Workgroup [CSMW]. California Geological Survey, California Department of Conservation.
U. S. Army Corps of Engineers, New Orleans District. 2007. Calcasieu Lake Suspended Solids Sampling and Analyses.
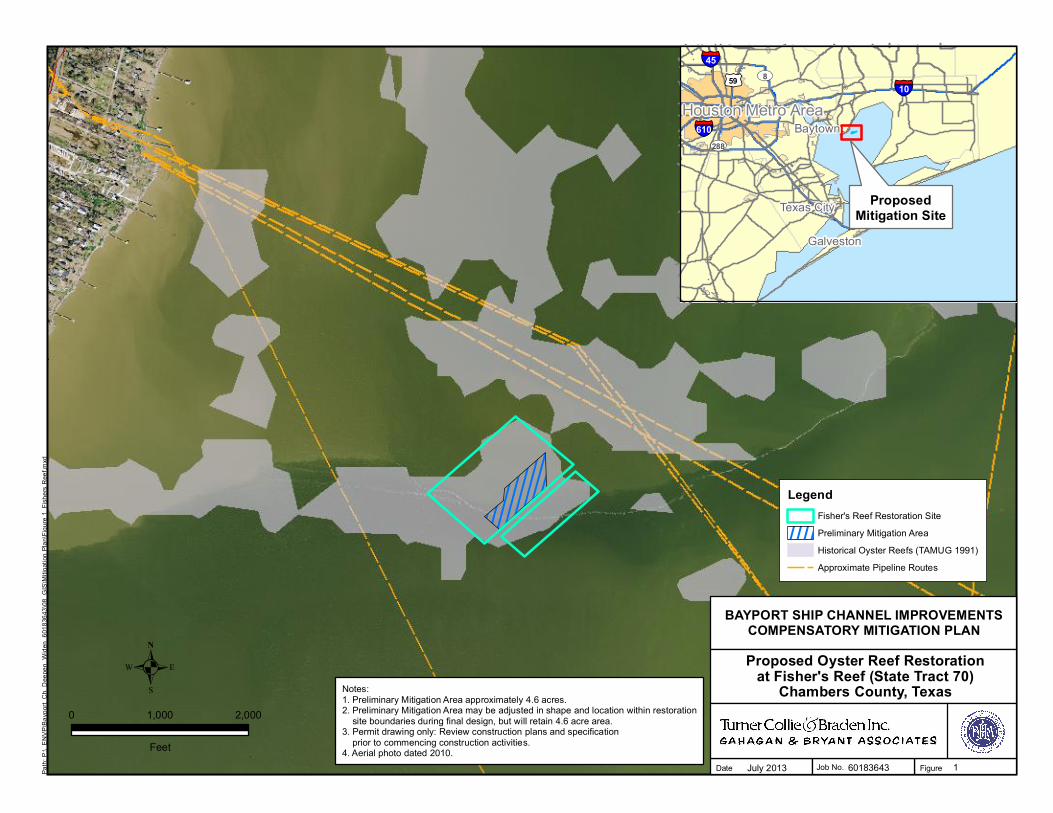
.0 2,0001,000
Feet
LegendFisher's Reef Restoration Site
Preliminary Mitigation Area
Historical Oyster Reefs (TAMUG 1991)
Approximate Pipeline Routes
Notes:1. Preliminary Mitigation Area approximately 4.6 acres.2. Preliminary Mitigation Area may be adjusted in shape and location within restoration site boundaries during final design, but will retain 4.6 acre area.3. Permit drawing only: Review construction plans and specification prior to commencing construction activities.4. Aerial photo dated 2010.
ProposedMitigation Site
Houston Metro Area
Texas City
Baytown
Galveston
§̈¦10
§̈¦45
§̈¦610
£¤59 UV8
UV288
FigureDate Job No.
BAYPORT SHIP CHANNEL IMPROVEMENTSCOMPENSATORY MITIGATION PLAN
Proposed Oyster Reef Restorationat Fisher's Reef (State Tract 70)
Chambers County, Texas
July 2013 60183643 1Path
: P:\_
EN
VP\
Bay
port_
Ch_
Dee
pen_
Wid
en_6
0183
643\
08_G
IS\M
itiga
tion
Plan
\Fig
ure
1_Fi
sher
s R
eef.m
xd

µ0 2,000
Feet
LegendExisting Southern Top of Bank
Existing Channel Alignment/Limits
Proposed Channel ImprovementsFeature
100 Feet Widening and Deepening
50 Feet Widening and Deepening
Deepening to -45 MLT
500 Foot Buffer
Hard-Bottom Resources near Proposed Channel Layout
1-Low Density Shell Hash w/o Oyster Clusters
2-Low Density Shell Hash w/ Oyster Clusters
3-High Density Shell Hash w/ & w/o Oyster Clusters
4-Consolidated Reef
GENERAL NOTE1. Project limits & features are shown for illustrative purposes only.
FigureDate Job No.
Surveyed Oyster Habitat NearProposed Channel Improvements
July 2013 60183643 2
BAYPORT SHIP CHANNEL IMPROVEMENTSCOMPENSATORY MITIGATION PLAN
Path
: P:\_
EN
VP\
Bay
port_
Ch_
Dee
pen_
Wid
en_6
0183
643\
08_G
IS\M
itiga
tion
Plan
\Fig
ure
2_O
yste
r Hab
itat.m
xd
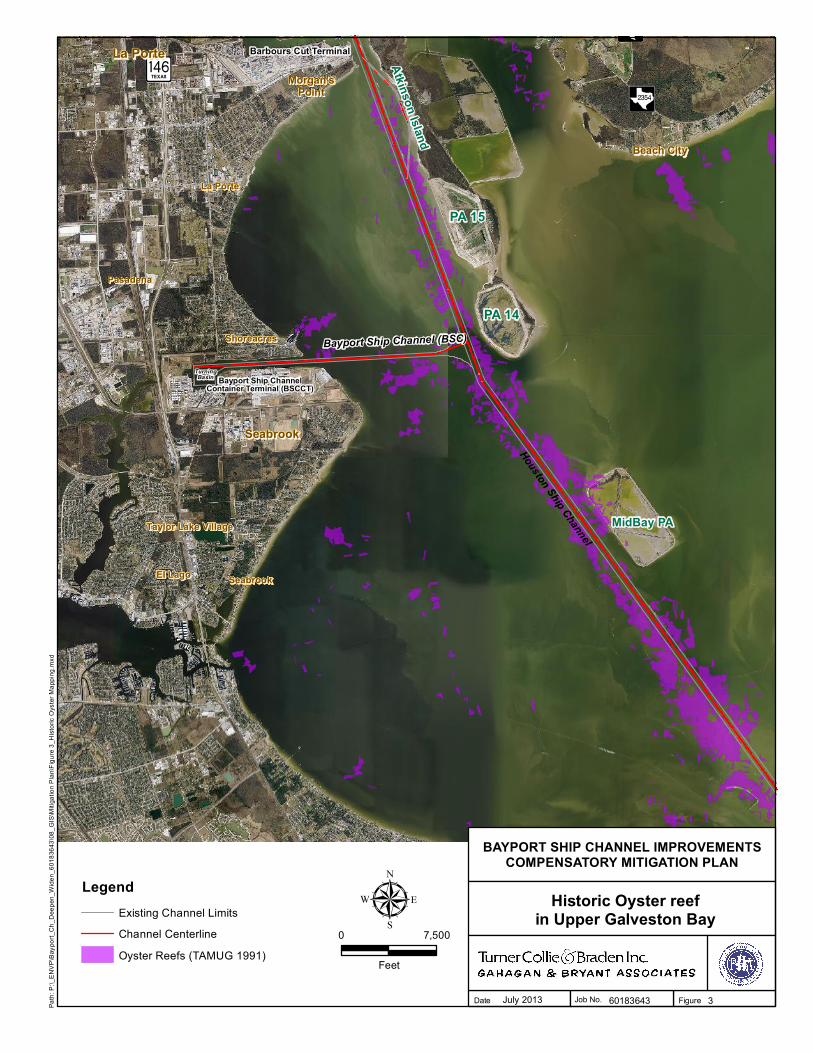
PA 15
PA 14
MidBay PA
?¥
Cf
Cè
Bayport Ship Channel (BSC)
Bayport Ship ChannelContainer Terminal (BSCCT)
Houston Ship Channel
Barbours Cut Terminal
SeabrookSeabrook
Beach CityBeach City
La PorteLa Porte
TurningBasin
Atkinson Island
La PorteLa Porte
SeabrookSeabrook
Morgan'sMorgan'sPointPoint
PasadenaPasadena
ShoreacresShoreacres
El LagoEl Lago
Taylor Lake VillageTaylor Lake Village
µ0 7,500
Feet
FigureDate Job No. 3
Historic Oyster reefin Upper Galveston Bay
60183643July 2013
LegendExisting Channel Limits
Channel Centerline
Oyster Reefs (TAMUG 1991)
BAYPORT SHIP CHANNEL IMPROVEMENTSCOMPENSATORY MITIGATION PLAN
Path
: P:\_
EN
VP
\Bay
port_
Ch_
Dee
pen_
Wid
en_6
0183
643\
08_G
IS\M
itiga
tion
Pla
n\Fi
gure
3_H
isto
ric O
yste
r Map
ping
.mxd
Tidal Marsh Mitigation Plan
BSC Improvements PA 15 Mitigation USACE File SWG-2011-01183
Prepared for: The Port of Houston Authority
CESI PROJECT NO. 32-13
July 2013
DRAFT
Prepared By
402 Teetshorn Street • Houston, Texas 77009
713.868.1043 • Fax 713. 863.7944 www.CrouchEnvironmental.com [email protected]
Tidal Marsh Mitigation Plan
BSC Improvements PA 15 Mitigation USACE File SWG-2011-01183
CESI Project Number 32-13 July 2013
Prepared For
The Port of Houston Authority 111 East Loop North
Houston, Texas 77029
Project Manager Ryan Robol Report Author Susanna Scott
Data Collection Ryan Robol, Susanna Scott, Greg Crouch Maps and Figures Gregory Sevcik, Patrick Forrest Report Reviewers Greg Crouch, Ryan Robol, Richard Rexroad
Tidal Marsh Mitigation
i BSC Improvements PA 15 Mitigation
USACE File SWG-2011-01183 Harris County, Texas
Table of Contents Introduction .................................................................................................................................................................. 1 Objectives ..................................................................................................................................................................... 1 Site Selection ............................................................................................................................................................... 2
Project Site Description .......................................................................................................................................... 2 Site Selection Process ............................................................................................................................................ 2
Site Protection Instrument .......................................................................................................................................... 3 Baseline Information.................................................................................................................................................... 3 Determination of Credits ............................................................................................................................................. 5 Mitigation Work Plan .................................................................................................................................................... 6
Geographic Boundaries .......................................................................................................................................... 6 Construction Methods ............................................................................................................................................ 6
Soil Contouring ................................................................................................................................................... 6 Planting Plan ....................................................................................................................................................... 7
Maintenance Plan ......................................................................................................................................................... 7 Performance Standards ............................................................................................................................................... 8 Monitoring Requirements .......................................................................................................................................... 10
Monitoring Methods .............................................................................................................................................. 10 Monitoring Reports ............................................................................................................................................... 10
Long-Term Management ........................................................................................................................................... 11 Adaptive Management ............................................................................................................................................... 11 Financial Assurances ................................................................................................................................................ 10 References .................................................................................................................................................................. 13
Appendices Appendix A – Vicinity Map Appendix B – 2008 Aerial Photograph with Proposed Mitigation Site Appendix C – Proposed Mitigation Site with 10-Digit Hydrologic Unit Codes Appendix D – Historical Aerial Photographs 1953 Historical Aerial Photograph with Proposed Marsh Site Overlay
1978 Historical Aerial Photograph with Proposed Marsh Site Overlay Appendix E – Subsidence Map Appendix F – Plan Views and Cross-section for the Proposed Mitigation Area
Plan View Cross-section A – A’
Appendix G – Aerial Photograph with Observed Oyster Locations Appendix H – Tidal Wetland Delineation East of PA 15 Levee Appendix I – Mitigation iHGM Results
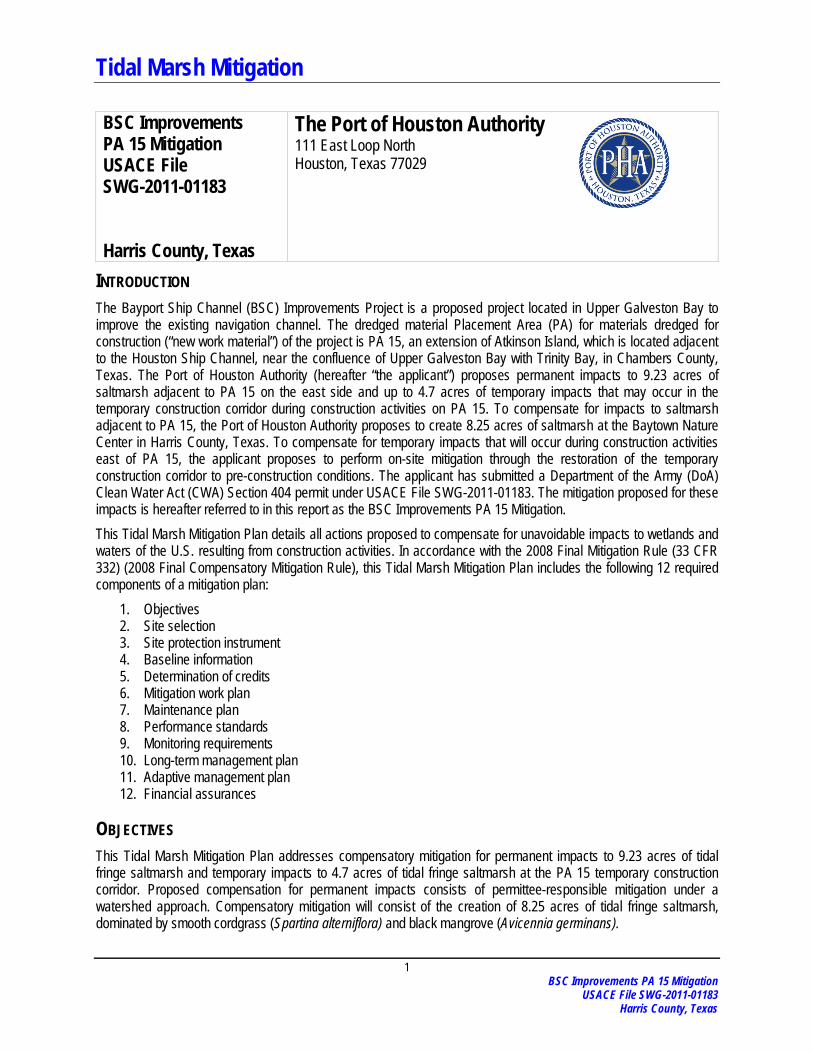
Tidal Marsh Mitigation
1 BSC Improvements PA 15 Mitigation
USACE File SWG-2011-01183 Harris County, Texas
BSC Improvements PA 15 Mitigation USACE File SWG-2011-01183 Harris County, Texas
The Port of Houston Authority 111 East Loop North Houston, Texas 77029
INTRODUCTION The Bayport Ship Channel (BSC) Improvements Project is a proposed project located in Upper Galveston Bay to improve the existing navigation channel. The dredged material Placement Area (PA) for materials dredged for construction (“new work material”) of the project is PA 15, an extension of Atkinson Island, which is located adjacent to the Houston Ship Channel, near the confluence of Upper Galveston Bay with Trinity Bay, in Chambers County, Texas. The Port of Houston Authority (hereafter “the applicant”) proposes permanent impacts to 9.23 acres of saltmarsh adjacent to PA 15 on the east side and up to 4.7 acres of temporary impacts that may occur in the temporary construction corridor during construction activities on PA 15. To compensate for impacts to saltmarsh adjacent to PA 15, the Port of Houston Authority proposes to create 8.25 acres of saltmarsh at the Baytown Nature Center in Harris County, Texas. To compensate for temporary impacts that will occur during construction activities east of PA 15, the applicant proposes to perform on-site mitigation through the restoration of the temporary construction corridor to pre-construction conditions. The applicant has submitted a Department of the Army (DoA) Clean Water Act (CWA) Section 404 permit under USACE File SWG-2011-01183. The mitigation proposed for these impacts is hereafter referred to in this report as the BSC Improvements PA 15 Mitigation. This Tidal Marsh Mitigation Plan details all actions proposed to compensate for unavoidable impacts to wetlands and waters of the U.S. resulting from construction activities. In accordance with the 2008 Final Mitigation Rule (33 CFR 332) (2008 Final Compensatory Mitigation Rule), this Tidal Marsh Mitigation Plan includes the following 12 required components of a mitigation plan:
1. Objectives 2. Site selection 3. Site protection instrument 4. Baseline information 5. Determination of credits 6. Mitigation work plan 7. Maintenance plan 8. Performance standards 9. Monitoring requirements 10. Long-term management plan 11. Adaptive management plan 12. Financial assurances
OBJECTIVES This Tidal Marsh Mitigation Plan addresses compensatory mitigation for permanent impacts to 9.23 acres of tidal fringe saltmarsh and temporary impacts to 4.7 acres of tidal fringe saltmarsh at the PA 15 temporary construction corridor. Proposed compensation for permanent impacts consists of permittee-responsible mitigation under a watershed approach. Compensatory mitigation will consist of the creation of 8.25 acres of tidal fringe saltmarsh, dominated by smooth cordgrass (Spartina alterniflora) and black mangrove (Avicennia germinans).
Tidal Marsh Mitigation
2 BSC Improvements PA 15 Mitigation
USACE File SWG-2011-01183 Harris County, Texas
Proposed compensation for temporary impacts resulting from construction activities at the PA 15 temporary construction corridor will consist of returning the temporary impact area to pre-construction conditions, including recontouring and revegetation of the site. The purpose of this Tidal Marsh Mitigation Plan is to describe how unavoidable impacts to jurisdictional waters of the U.S. associated with the BSC Improvements Project will be compensated for.
SITE SELECTION Project Site Description Mitigation for Permanent Impacts The proposed mitigation site is located at the Baytown Nature Center (BNC), in Baytown, Harris County, Texas. The BNC is 450 acres encompassing two connected peninsulas in the western edge of the City of Baytown. It is owned, protected, and managed by the City of Baytown Parks and Recreation Department. The peninsulas are surrounded by three bays: Burnet Bay to the north, Scott Bay to the south and Crystal Bay and the Houston Ship Channel to the west. The BNC was established at the site of the former Brownwood subdivision, which was abandoned after severe subsidence and repeated flooding. Approximately 150-acres of wetland restoration projects have already been constructed within the BNC, and this compensatory mitigation plan has been designed to contribute to previous restoration efforts. The proposed mitigation site is located in the Buffalo Bayou – San Jacinto River Watershed (Hydrologic Unit Code [HUC] 1204010407), which drains all or part of Harris, Montgomery, Waller, Walker, Grimes, Liberty and San Jacinto Counties, for a total drainage area of approximately 4,500 square miles. In Harris County, the San Jacinto River watershed covers approximately 487 square miles. Additional information concerning the proposed mitigation site is located in the Baseline Information section of this Tidal Marsh Mitigation Plan.
Site Selection Process Mitigation for Permanent Impacts During the site selection process, the applicant considered several options for providing compensatory mitigation for the unavoidable impacts proposed by the development. The 2008 Final Compensatory Mitigation Rule states that mitigation options should be considered based on the following hierarchy:
• Purchasing credits from an operational mitigation bank • Purchasing credits from an approved in-lieu fee program • Permittee-responsible mitigation under a watershed approach • Permittee-responsible mitigation through on-site, in-kind mitigation • Permittee-responsible mitigation through off-site and/or out-of-kind mitigation
The impact site is outside of the primary and secondary service areas for any mitigation banks and in-lieu fee programs. Therefore, the applicant proposes to perform permittee-responsible mitigation under a watershed approach. Permittee-responsible mitigation under a watershed approach ensures that the ecological functional lift provided by an ecological mitigation project is performed within the same watershed as the ecological functional loss that results from unavoidable impacts. This guarantees that there is no net loss of aquatic resources in the watershed. The impact site on Atkinson Island and the BNC are located on the Houston Ship Channel and in the same 4-digit HUC (HUC 1204). Both of these locations contribute to the quality of habitat in the Houston Ship Channel and Galveston Bay. The BNC is located approximately 9 miles upstream of the impact site on Atkinson Island, and improvements to the BNC will enhance the ecological functions of both of these waterbodies. A Vicinity Map is located in Appendix A and a 2008 Aerial Photograph of the Proposed Mitigation Site is located in Appendix B. A 2012 Aerial Photograph depicting the Proposed Mitigation Site with 10-Digit Hydrologic Unit Codes is located in Appendix C.
Tidal Marsh Mitigation
3 BSC Improvements PA 15 Mitigation
USACE File SWG-2011-01183 Harris County, Texas
Mitigation for Temporary Impacts Impacts at the PA 15 temporary construction corridor will be confined to the duration of construction activities. Therefore, the applicant proposes to perform permitee-responsible on-site, in-kind mitigation at the temporary impact site. On-site, in-kind mitigation increases the likelihood that compensation for functions and services lost during impacts is achieved.
SITE PROTECTION INSTRUMENT The proposed wetlands will be constructed at the BNC. Upon achievement of the success criteria outlined in the Performance Standards section, the wetland will be protected and managed under the existing BNC management plan. Management and stewardship by the BNC will prohibit all development and other activities except those outlined in this Tidal Marsh Mitigation Plan. The applicant owns the submerged land upon which the proposed mitigation site is located.
BASELINE INFORMATION The proposed mitigation site is located at the BNC, in Baytown, Harris County, Texas, approximately 20 miles east of Houston. The BNC is located at the site of the former Brownwood subdivision. After the subdivision was built in the 1940s and 1950s, unrestrained withdrawal of groundwater resulted in the Brownwood subdivision sinking approximately 9 feet, leaving the peninsula vulnerable to flooding during storms and hurricanes. In 1983 Hurricane Alicia decimated the subdivision. The City of Baytown discontinued all utilities to the subdivision and forced the residents to evacuate their homes. For over a decade, the neighborhood was dormant as the remaining homes were flooded repeatedly. In 1993, Crouch Environmental Services, Inc. (CESI) proposed transforming the former neighborhood into a wildlife refuge by constructing 60 acres of saltmarsh and freshwater habitat. That successful endeavor led the City to set aside the 450-acre area as the BNC. The BNC consists of approximately 300 acres of uplands and 150 acres of wetlands and is home to 275 species of birds, including five endangered species. Alligators, deer, fox, and other native wildlife have also returned. In 1997 the BNC was officially designated part of the Great Coastal Texas Birding Trail, a 500-mile route linking the best bird-watching sites along the coast. It is also used as an outdoor classroom for students. Plans are underway for new walking trails and other wildlife observation areas. With the subdivision now removed, the peninsula is reverting to its original mosaic of forest and wetlands (BNC, 2013). The proposed mitigation site is a shallow cove located on the south side of the BNC peninsula, adjacent to Scott Bay. The approximate center coordinates for the cove are W 95°02'32.78" longitude, N 29°45'0.73” latitude, (Universal Trans Mercator (Zone 15R) 302498.63 m E, 3292853.58 m N). A review of historical aerial photographs reveals that the location of the proposed compensatory mitigation is historically upland and saltmarsh. In the 1953 historical aerial photograph the proposed mitigation site appears to consist of both upland and saltmarsh habitats. However, by 1978, the proposed mitigation site has been almost completely submerged due to subsidence. The 1953 and 1978 Historical Aerial Photographs are located in Appendix D. Although the area in the vicinity of the mitigation site has subsided more than 9 feet since 1900 (Region H Water Planning Group, 2009), virtually no subsidence is projected for eastern Harris County (Neighbors, 2003) due to the implementation of the 1999 Harris County Subsidence District Regulatory Plan, which regulates groundwater withdrawals. A map of Elevation Changes Due to Subsidence is located in Appendix E. Currently, the proposed mitigation site is submerged by the tidal waters of Scott Bay. A site assessment was conducted by biologists from CESI on June 11, 2013. CESI biologists surveyed the entire site by kayak, and determined the entire proposed mitigation site to be open water. No vegetation was observed on the project site. No section 404 wetlands or areas of submerged aquatic vegetation were observed on the project site. Depth measurements taken throughout the proposed mitigation site indicate that the maximum depths on the project site at mean high water (MHW) are approximately 8 feet at the southern portion of the site, becoming shallower in near
Tidal Marsh Mitigation
4 BSC Improvements PA 15 Mitigation
USACE File SWG-2011-01183 Harris County, Texas
shore areas. Depths taken in near shore areas drop to 4 feet at MHW at 20-30 feet from the shoreline. The uplands surrounding the proposed mitigation site are lined with rip-rap at the upland/shoreline interface. Dead, rooted trees are located on the submerged lands in the central and western portion of the proposed mitigation site. Sediments on the proposed mitigation site were observed to be predominantly sandy, with some areas overlain by several inches of silt. The general assessment of mitigation site bottom conditions on June 11, 2013 did not result in indications of continuous or extensive subtidal oyster reef within the proposed footprint. A more comprehensive bay bottom condition probing effort conducted by Gahagan and Bryant Associates, Inc. on July 17 and 19, 2013 confirmed the lack of extensive or continuous bottom reef. The probing investigation involved approximately 76 evenly distributed probing locations spaced on 100 foot centers covering the proposed site and the adjacent seaward area surrounding it. Only seven locations within the proposed site indicated areas of remnant shell in mud mainly corresponding to the location of the historical shoreline, visible in the 1953 aerial, that has since subsided, but also areas around where dead tree stumps remain. These areas were probed with a Ponar grab sampler, and only two of the locations were observed to have sporadic live and dead oyster clusters with attached mussels, intermixed with sandy and silt areas. These locations were in areas containing fallen trees, stumps, and/or broken concrete or riprap. Three other sporadic locations of similar growth on debris serving as substrate were observed south and southeast outside of the proposed mitigation footprint. All other probe areas only indicated soft bottom conditions. No indication of any sizable, continuous, consolidated reef growth was apparent, and the live oyster clusters observed are indicative of small, scattered, sporadic growth on submerged debris (e.g. logs, rip-rap). The continuous area of rip-rap proposed as shore protection for the marsh containment levee will provide far more substrate surface area for oyster attachment than would the sporadic areas of live and dead oyster clusters observed within the proposed footprint. Therefore recolonization of the proposed shore protection substrate would result in greater live oyster cluster density than what is present. An aerial photograph with the location of the oysters observed on the project site is located in Appendix G. Additional information regarding the marsh containment levee may be found in the Mitigation Work Plan section of this Tidal Marsh Mitigation Plan and in the Cross-section A-A’ located in Appendix F. No seagrasses were observed during any of the site visits and bottom probing efforts previously discussed. The proposed mitigation site is located in the Gulf Coast Prairies and Marshes natural region of Texas, which is approximately 20,312 square miles (Gould, 1975). Gulf Coast prairies are nearly level, with slow surface drainage and elevations ranging from sea level to approximately 250 feet above mean sea level (MSL). In addition to wildlife habitat, the prairies are used for crops, livestock grazing, and urban and industrial centers. It is estimated that as much as 99 percent of the coastal prairies in Texas have been converted to agricultural land (Gould, 1975; McMahan, et. al, 1984). Gulf Coast marshes are low, wet areas typically inundated with saline water, ranging from sea level to a few feet in elevation above MSL. These marshes support species of sedges, rushes, cordgrasses, reeds, and forbs, which provide beneficial wildlife habitat for numerous birds and marine fisheries. Many areas in the region have been invaded by noxious volunteer species such as honey mesquite (Prosopis glandulosa), smut grass (Sporobolus indicus), and Chinese tallow (Triadica sebifera). According to The Vegetation Types of Texas, the project site is located within the “Marsh/Barrier Island” vegetation type (McMahan et al., 1984). The dominant vegetation in these areas includes water hyacinth (Eichhornia sp.), pennywort (Hydrocotyle sp.), bulltongue arrowhead (Sagittaria lancifolia), and duckweed (Lemna sp.). These types of vegetation are associated with hydric lowlands landward of brackish marshes, coastal prairies, and marshes. One soil type is mapped by the Natural Resources Conservation Service (NRCS) as occurring on the proposed mitigation site, Vamont-Urban land complex. This soil series is classified as non-hydric in Harris County. The following soil series description is taken from the 1976 NRCS Soil Survey of Harris County (USDA NRCS, 1976).
Vamont – Urban land complex (Vn) –This nearly level to gently sloping soil is in broad, irregular areas and in long and narrow, gently sloping areas leading to low terraces and flood plains of major streams and drainageways. Vamont soils account for 20 to 75 percent of this complex; Urban covers 10 to 70 percent; and other soils account for 15 percent or less. The surface layer of Vamont soil is firm, medium acid, very
Tidal Marsh Mitigation
5 BSC Improvements PA 15 Mitigation
USACE File SWG-2011-01183 Harris County, Texas
dark grayish-brown clay about four inches thick. The layer below that is 14 inches thick and consists of firm, strongly acid clay that is predominantly mottled with yellowish-brown and gray. To a depth of 60 inches is a layer of very firm, strongly acid to medium acid, grayish-brown clay that has few yellowish-brown and brownish-yellow mottles. This soil has high shrink-swell potential in the clay layers. Vamont soil is somewhat poorly drained with rapid surface runoff. Internal drainage is slow, and permeability is very slow.
According to the FEMA floodplain data for Harris County (FEMA Panel Nos. 48201C0745L and 4801C0935L, both effective February 18, 2009), the entire project site is situated in the 100-year floodplain.
DETERMINATION OF CREDITS The proposed compensatory mitigation area at the BNC will compensate for unavoidable impacts to aquatic resources by providing functions and services similar to those provided by the impacted area. The proposed mitigation includes compensation for losses of these functions and services as the mitigation area achieves the success criteria. These functions and services include providing suitable habitat for aquatic flora and fauna in the project vicinity and watershed, providing an area where suspended solids can be trapped and settle, and providing water quality treatment and polishing through the assimilation of non-point source pollutants. To ensure the function and value of impacted wetlands are being adequately compensated for, interim hydrogeomorphic modeling (iHGM) was used to calculate compensation requirements. The purpose of the iHGM is to provide an easily repeatable and rapid assessment of the current functional condition of a given aquatic resource. The fundamental unit for evaluating impacts within the iHGM is the Functional Capacity Index (FCI). Several iHGM models exist, specific to different classifications of wetlands. The tidal fringe iHGM was used to determine the ecological value of services lost as a result of construction of the improvements at Atkinson Island DMPA and gained by construction of the proposed mitigation site. The tidal fringe iHGM uses the following sub-indices to determine FCI values: biota, botanical, physical, and chemical. The FCI value of each sub-index is calculated by incorporating data obtained from several field variables observed into specific equations. The mean value of these FCIs for each wetland assessment area is multiplied by the acreage of the aquatic system to determine the Functional Capacity Unit (FCU) of the wetland. By calculating the FCI of the tidal fringe saltmarsh to be impacted on Atkinson Island, the area of tidal fringe saltmarsh creation necessary to compensate for losses was calculated. The amount of mitigation required for this project, as determined by the iHGM model, is 8.25 acres. A brief synopsis of the results of the modeling effort is provided in Table 1.
Table 1. Summary of FCIs, FCUs, and Calculated Compensation Acreages
Subindex Biota Botanical Physical Chemical
Impacted Marsh FCI (area weighted average) 0.65 0.81 0.59 0.69
Impacted Marsh FCU 6.00 7.50 5.40 6.35
FCU = FCI * acreage; Required Mitigation Acreage = Impacted FCU/Proposed Marsh FCI Proposed Marsh FCI 0.79 1.00 0.67 0.77
Proposed Acreage Required 7.59 7.50 8.06 8.25** Proposed Marsh FCU 6.00 7.50 5.40 6.35
**To fully compensate for impacts to Functional Capacity Units (FCUs), the proposed mitigation marsh must generate enough FCUs to compensate for the loss of FCUs for each of the four sub-indices (Biota, Botanical, Physical, and Chemical). Therefore, the proposed marsh acreage must equal or exceed the largest area required to compensate for any of the four sub-indices. Here, the Chemical sub-index acreage has been used as the minimum acreage that will fully compensate for the impacted FCUs.
Tidal Marsh Mitigation
6 BSC Improvements PA 15 Mitigation
USACE File SWG-2011-01183 Harris County, Texas
MITIGATION WORK PLAN GEOGRAPHIC BOUNDARIES Mitigation for Permanent Impacts
The applicant proposes to construct all compensatory mitigation for permanent impacts in the cove located on the south side of the BNC, adjacent to Scott Bay. The applicant intends to construct 8.25 acres of tidal fringe saltmarsh dominated by smooth cordgrass and planted with black mangroves at two locations along the existing shoreline, following the approval of this Tidal Marsh Mitigation Plan by the United States Army Corps of Engineers (USACE). Please refer to the Baseline Information section of this Tidal Marsh Mitigation Plan for the approximate center coordinates of the proposed mitigation sites. A Plan View for the proposed mitigation area is located in Appendix F. Mitigation for Temporary Impacts Compensation for temporary impacts to the construction corridor will occur at the PA 15 temporary construction corridor. The construction corridor will be bounded by construction and silt fence prior to and during construction to ensure construction activities do not extend beyond the zone specified, and construction mats will be used for equipment access. Upon completion of construction, the construction corridor will be restored to the pre-existing elevation contours if necessary (although no change in elevation contours is anticipated), and replanted as necessary as close to the pre-existing coverage as practicable. An aerial depicting the location of the temporary impact area is located in Appendix H.
CONSTRUCTION METHODS Soil Contouring Mitigation for Permanent Impacts Construction activities include creation and planting of 8.25 acres of tidal fringe saltmarsh wetlands at the BNC in a cove adjacent to Scott Bay. To bring the substrate of the proposed mitigation site to suitable elevations to facilitate the success of the tidal fringe saltmarsh, beneficial use of non-contaminated sediments from suitable locations, is proposed, and would be tested for contaminants prior to use to ensure fill material used is environmentally acceptable. The proposed source and testing results will be coordinated with the USACE prior to construction. The soils will be stockpiled in surrounding uplands and mechanically placed in the cove. The project would result in the net placement of approximately 52,000 to 58,000 cubic yards of fill into Scott Bay. Soils will be contoured so that the proposed grade at the existing upland/shoreline interface will be the MHW elevation (1.66’ NAVD88) and the grade at the proposed marsh creation levee will be 6 inches below MHW (1.16’ NAVD88). Please refer to the Plan View in Appendix F for further detail. A marsh containment levee will be constructed to contain sediments introduced into Scott Bay. The levee will provide a method of reducing wave energy and thereby protecting saltmarsh plantings. The crest of the levee will be constructed to one foot above MHW (2.66’ NAVD88). For a visual representation and additional details, please refer to Cross-section A-A’ in Appendix F for further detail. The 1,355-linear foot marsh containment levee would be constructed as an earthen levee protected by a rip-rap veneer. Soil fill (approximately 7,600 cubic yards) would be used to build the levee to approximately 7.5 feet above the existing bay bottom and an 18-inch layer of rip-rap (approximately 3,200 cubic yards) would be placed on the top and bay-side of the levee. The slope of the levee on the Scott Bay side would be 4:1. The presence of a rip-rap veneer on the upper 1.5 feet of the levee would provide a porous substrate for tidal waters to pass through in the elevations between +1 and -0.5 MHW. This will allow the tidal salt marsh to become inundated during daily high tides, and to drain from the marsh during low tides. The marsh containment levee will yield approximately 0.29 acres of additional potential habitat, yielding a total project area of 8.54 acres. Saltmarsh creation associated with a separate mitigation project will occur within a 1.38-acre section in the northwest portion of the cove (SWG-2011-00125). These projects will be constructed concurrently. Visual markers will be
Tidal Marsh Mitigation
7 BSC Improvements PA 15 Mitigation
USACE File SWG-2011-01183 Harris County, Texas
placed around the boundary between the two mitigation areas to ensure that, while there will be no difference in the vegetative community, a clear visual separation between the two areas exists. Please refer to the Plan View in Appendix F for further detail. Mitigation for Temporary Impacts Compensation for temporary impacts in the PA 15 temporary construction corridor will commence after construction activities are complete. The use of construction mats and silt fencing should preclude any substantial change in elevation in the construction corridor to rutting, dredged material spillage etc. In the event activities result in substantial areas in the construction corridor being lowered or filled, soils in the temporary impact area will be graded and restored to pre-construction contours. Target soil elevations and contours will be based on a pre-construction elevation survey. A post-construction elevation survey will be performed following contouring activities to ensure the temporary construction corridor is consistent with pre construction conditions. Planting Plan Mitigation for Permanent Impacts Once the sediments have been contoured to elevations suitable for tidal fringe saltmarsh success, the soils will be allowed to settle for approximately 3 months before planting will commence on the proposed mitigation site. A Texas Parks and Wildlife (TPWD) permit for harvesting wetland plants will be required in order to obtain smooth cordgrass for transplant to the proposed mitigation site at the BNC. This permit will be obtained prior to commencement of harvesting and planting activities. Healthy plugs of smooth cordgrass would be harvested from nearby healthy and dense cordgrass communities at the BNC and transplanted to the proposed mitigation site. Harvested plugs will be kept moist and shaded until they are planted. Planting of harvested plugs will occur within 24 hours of harvesting, to decrease mortality and stress. Harvested plants will be live, fresh, healthy, and uninjured at the time of planting. Field harvested cordgrass plugs will consist of clumps that contain viable root-rhizome stock. The minimum plug size to be installed at the planting site is four inches by four inches. Although it will be acceptable to divide large root-masses into smaller plugs, excessive manipulation and disturbance of the soil mass will be avoided, to minimize physical damage and desiccation during harvest, transport, and planting. When smooth cordgrass is harvested from local populations, other species intermingled with the target species will not be excluded from the harvested material prior to planting unless these species are noxious plants that will have a deleterious effect on the wetlands diversity over time. Noxious and invasive species will be excluded from harvest and planting activities to the maximum extent possible. A list of species identified as noxious or invasive by TPWD may be found at www.texasinvasives.org/plant_database/tpwd_results.php. Natural water depths will be maintained during planting and initial plant establishment to allow optimal rooting conditions. Vegetation will be installed on approximately 5-foot centers, at the appropriate depth for the specific species. Smooth cordgrass will be installed by hand using a shovel, spade, dibble, trowel, or other method. The planting tool will be used to create a shallow hole in the moist substrate for installation. The hole will be of sufficient depth and width to allow the entire root mass to be inserted without breakage or other damage. Excessively deep vegetation placement will not occur. To supplement vegetative species diversity and the wildlife value of the proposed mitigation marsh, two areas adjacent to existing uplands on the mitigation site will be planted with black mangroves (Avicennia germinans). An approximately 10-foot-wide by 374-foot-long (0.09 acres) section of the northern project boundary, and an approximately 10-foot-wide by 289-foot-long (0.06 acres) section of the eastern project boundary will be planted with black mangroves. Mangrove saplings will be transported from a reputable nursery to the proposed project site at the BNC and planted on 5-foot centers. For planting locations, please refer to the Plan View and Cross-section A-A’ in Appendix F. Mangroves and smooth cordgrass will be installed upright so that the junction between the root crown and the stem is at the substrate surface. After installation of the plant in the hole, the hole will be carefully closed around the plant
Tidal Marsh Mitigation
8 BSC Improvements PA 15 Mitigation
USACE File SWG-2011-01183 Harris County, Texas
roots by filling the hole with excavated soil, and gently applying foot pressure to the edge of the hole. Should it be determined that there is a possibility of newly installed vegetation floating free of its hole, the plant may be weighted down with a non-galvanized iron nail or an equivalent method as appropriate. Mitigation for Temporary Impacts A pre-construction survey of existing vegetative cover at the PA 15 temporary construction corridor will determine the vegetative baseline cover values that must be achieved to compensate for losses resulting from construction activities. Based on the results of this survey, native vegetation will be replanted as necessary to achieve as close to the pre-construction cover conditions of wetland vegetation in the 4.7-acre temporary construction corridor as practicable. Planting will commence following construction and the completion of soil contouring activities. MAINTENANCE PLAN Mitigation for Permanent Impacts The applicant will be responsible for all maintenance and management activities. The applicant will consult a regional mitigation specialist and/or the USACE in the event adaptations or revisions to this Tidal Marsh Mitigation Plan are required. All mitigation areas on the BNC will be inundated daily through normal tidal inflows from Scott Bay to maintain low marsh conditions. Should it be determined by the applicant that appropriate hydrology levels are not being maintained by tidal sources during the course of the mitigation activities, the applicant will implement appropriate corrective action to address the deficiency. Should it be determined that natural establishment of vegetative communities on is unsuccessful at either the BNC mitigation site replanting options will be evaluated. Invasive species will be monitored and controlled during all phases of construction, establishment, maintenance, and monitoring. This can include selective mowing and selective spraying. The created wetlands will be protected by temporarily installed construction or wire fencing to prevent grazing by species such as nutria, grass carp, or other fauna. No vehicular or other traffic will be allowed to transverse the area, preventing soil compaction, plant mortality, and/or seed dispersal. Replanting will occur if any significant event occurs that prevents coverage of vegetation from meeting the predetermined success criteria.
Mitigation for Temporary Impacts
The PA 15 temporary construction corridor will be monitored six months post replanting to ensure a minimum 75 percent plant survival rate. If success criteria are not met, areas in need of attention will be replanted. If success criteria are met, no further monitoring will be conducted. It should be noted that the USACE plans to fill the Marsh Cells M7/8/9 in 2015. The planned filling will inundate the proposed construction corridor with a thin layer of sediment and water for a period of time. The PHA cannot guarantee the long term survival or propagation of the replanted vegetation after that time.
PERFORMANCE STANDARDS Mitigation for Permanent Impacts
The success criteria used to evaluate the performance standards for this Tidal Marsh Mitigation Plan are intended to ensure that the chemical, physical, and biological functions of the compensatory mitigation area compensate for the chemical, physical, and biological functions lost due to impacts on the project site. Monitoring and quantification of performance standards will assess the success of the saltmarsh wetland. The tidal fringe iHGM will be used to quantify the performance of the mitigation area. To be considered successful, the mitigation area FCUs for the four tidal fringe iHGM sub-indices (biota, botanical, physical, and chemical) must meet or exceed the FCUs lost to impact for each of these sub-indices.

Tidal Marsh Mitigation
9 BSC Improvements PA 15 Mitigation
USACE File SWG-2011-01183 Harris County, Texas
The project will be considered successful if the following conditions are met:
• Minimum of 50 percent survival of installed plugs within 60 calendar days of planting • Nuisance, invasive, noxious, and exotic species should consist of relative cover of 10 percent or less. A list
of species identified as noxious or invasive by TPWD may be found at www.texasinvasives.org/plant_database/tpwd_results.php.
• After one calendar year from planting, the following target FCUs must be met: Biota 6.00 Botanical 7.50 Physical 5.40 Chemical 6.35
These FCU values must be met or exceeded one, two, and three calendar years following planting activities. A transplant survival survey of the planted mitigation area must be performed within 60 calendar days following the initial planting effort. If at least 50 percent survival of transplants is not achieved within 60 calendar days of planting, a second planting effort will be completed within 60 calendar days of completing the initial survival survey. If optimal seasonal requirements for replanting targeted species are not suitable when replanting would be required, the permittee must provide a replanting schedule to the Corps of Engineers, Chief, Compliance Section, Regulatory Branch, Galveston District (Corps) for review and approval. Written reports detailing plant survival must be submitted to the Corps within 30 calendar days of completing the initial survival survey and any subsequent replanting effort. A thorough review of the iHGM model for the mitigation area indicated that the percent areal coverage of native vegetation is the only variable that has a temporal component. In order to achieve the required number of FCUs to achieve compensation for permanent impacts, areal coverage of native vegetation must be at least 90 percent. An iHGM dataform summarizing the index values needed to achieve the necessary number of FCUs is located in Appendix I. If expected conditions are met by the end of year one, the BNC mitigation area is expected to exceed success criteria and achieve the Anticipated Year 1 FCU values detailed in the dataform located in Appendix I. If success criteria for wetland areas are not met at any of the scheduled times, including after initial transplanting activities and during the first three years of monitoring, those areas that are not sufficiently vegetated will be replanted with vegetation and monitored for the remainder of the three years. At the end of the required three-year monitoring period, the mitigation area will be required to achieve the minimum FCUs for the four sub-indices. If this requirement is not satisfied, corrective action will be required to meet the target FCU values. The area will then be monitored on an annual basis until the success criteria is met. This will be repeated until the tidal fringe wetland areas meet the required success rate. Mitigation for Temporary Impacts The construction corridor will be resurveyed pre- and post-construction to verify the condition of the wetland vegetation. The PA 15 temporary construction corridor will be monitored six months post replanting to ensure a minimum 75 percent plant survival rate. Nuisance, invasive, noxious, and exotic species should consist of relative cover of 10 percent or less. If this success criterion is not met, areas in need of attention will be replanted. If success criteria are met, no further monitoring will be conducted. It should be noted that the USACE plans to fill Marsh Cell M7/8/9 in 2015. The planned filling will inundate the proposed construction corridor with a thin layer of sediment and water for a period of time. The PHA cannot guarantee the long term survival or propagation of the replanted vegetation after that time.
Tidal Marsh Mitigation
10 BSC Improvements PA 15 Mitigation
USACE File SWG-2011-01183 Harris County, Texas
MONITORING REQUIREMENTS Monitoring Methods Mitigation for Permanent Impacts
Monitoring requirements for the compensatory mitigation area will adhere to the 2008 Final Compensatory Mitigation Rule and USACE Regulatory Guidance Letter 08-03. Monitoring studies at the BNC will be conducted on an annual basis for up to three years after all mitigation activities are complete. Monitoring studies at the BNC will occur annually past the nominal three year required monitoring period only if the mitigation site does not meet success criteria during that time. Success criteria of the compensatory mitigation area will be evaluated annually. The assessment of wetland vegetation establishment and the iHGM assessment will be determined by a visual assessment of pre-established sample plots located in the created wetlands. All variables required to complete the iHGM will be assessed and quantified. The location of each of these sample plots will be randomly determined, but will remain fixed for all subsequent monitoring events. This will allow for an accurate determination of the progress of the wetland as it matures, and will limit variation in assessment results due to site-specific differences. Mitigation for Temporary Impacts Monitoring studies at the PA 15 temporary impact site will be conducted six months following completion of planting. The assessment of wetland vegetation establishment and quantification of the areal vegetative coverage will be determined by a visual assessment of the planted areas. If success criteria are met, no further monitoring will be conducted.
Monitoring Reports Mitigation for Permanent Impacts An as-built mitigation monitoring report, detailing the site conditions immediately after completion of construction, will include a project description, project history, aerial photographs, as-built drawings, and an estimate of the percent survival of installed vegetation. The as-built mitigation monitoring report will be submitted to the USACE within three months after all construction and planting activities are complete. Thereafter, the site will be monitored annually for up to three years, or until the mitigation site meets success criteria. All subsequent annual monitoring reports will include descriptions of the entire proposed mitigation site. The annual monitoring reports will describe the results of the iHGM analysis, provide photographic documentation of the proposed mitigation sites, discuss results in comparison to performance standards, and if needed, provide recommendations for corrective actions that might be necessary to compensate for deficiencies. Mitigation for Temporary Impacts Mitigation for temporary impacts at the PA 15 temporary construction corridor will be monitored six months following revegetation of the impact site. A Mitigation Monitoring Report will be submitted to the USACE describing the results of the monitoring assessment, the areal coverage of installed vegetation, provide photographic documentation of the proposed mitigation sites, discuss results in comparison to performance standards, and if needed, provide recommendations for corrective actions that might be necessary to compensate for deficiencies. The USACE plans to fill the Marsh Cell M7/8/9 in 2015. The planned filling will inundate the proposed construction corridor with a thin layer of sediment and water for a period of time. The PHA cannot guarantee the long term survival or propagation of the replanted vegetation after that time. Achievement of Success Criteria for Both Mitigation Areas Once the proposed mitigation sites have been determined to have met the minimum success criteria, the USACE will be notified in writing within 30 days of the last monitoring event that the mitigation plan has met minimum success. If the success criteria are not met at the scheduled times after initial planting activities and during the first three years of monitoring at the BNC, or within six months at the PA 15 temporary construction corridor, areas in need of
Tidal Marsh Mitigation
11 BSC Improvements PA 15 Mitigation
USACE File SWG-2011-01183 Harris County, Texas
rehabilitation will be improved via the methods outlined in the Maintenance Plan section of this Tidal Marsh Mitigation Plan. Should any condition be observed that is indicative of a problem at the proposed mitigation sites, the condition will be evaluated and a solution recommended in the Recommendation Section of the annual monitoring reports. Solutions may include erection of predator barriers, installation of additional vegetation, adjusting site elevations, or other prudent solutions that are dependent on the site and situation. Should undesirable plant species threaten the proposed projects, these species will be eradicated manually or mechanically by industry-approved methods that will not harm wildlife or aquatic resources. Should corrective action be required during the monitoring and maintenance period, the applicant will implement the appropriate mitigation action in order to assure that project success criteria are achieved. All monitoring reports will be submitted to:
United States Army Corps of Engineers Galveston District
2000 Fort Point Road Galveston, TX 77550
The applicant is the responsible party for conducting the monitoring. The applicant may choose to hire a reputable environmental consultant to perform the monitoring, analyze the data collected, and prepare a monitoring report in accordance with this Tidal Marsh Mitigation Plan. The applicant is the responsible party for providing the monitoring reports to the USACE, at the address listed above, unless otherwise directed by the USACE.
LONG-TERM MANAGEMENT After performance standards have been achieved and the mitigation areas have met all success criteria, long-term management is needed to ensure the sustainability of the resource. The Final Mitigation Monitoring Report for the proposed project will include a description of management needs and the funding mechanism that will be used to meet those needs. Additional details are located in the Site Protection Instrument section of this Mitigation Plan.
ADAPTIVE MANAGEMENT Adaptive management is a strategy to address unforeseen changes in site conditions or other components of the compensatory mitigation project. If the compensatory mitigation project cannot be constructed in accordance with the approved Tidal Marsh Mitigation Plan, or if performance standards are not being met as anticipated, the permittee must notify the USACE, with approval required for any significant modification of the Tidal Marsh Mitigation Plan. Performance standards may be revised in accordance with adaptive management to account for measures taken to address deficiencies in the mitigation project. For the proposed mitigation areas, adaptive management may include the following measures:
• Plant additional wetland vegetation species in areas where new growth is inadequate • Adjust site conditions to improve hydrologic conditions • Improve or enhance erosion control measures • Provide for additional access restrictions if human disturbance is impacting the site
The Final Mitigation Monitoring Report for the proposed project at the BNC will include additional adaptive management details and guidelines for implementation. Adaptive management is a key component of this Tidal Marsh Mitigation Plan that provides for on-going evaluation and changes to the mitigation measures, as needed, to satisfy required compensation for impacts to waters of the U.S., including wetlands. The applicant or its successors or assigns will be responsible for implementing adaptive management to achieve mitigation success.
Tidal Marsh Mitigation
12 BSC Improvements PA 15 Mitigation
USACE File SWG-2011-01183 Harris County, Texas
FINANCIAL ASSURANCES The overall success of compensatory mitigation, including creation, restoration, and enhancement of natural ecosystems is subject to many variables. Site-specific factors such as local droughts, catastrophic storm events, fires or floods, pest infestations, herbivory, disease, or illegal entrance by off-road vehicles may negatively affect a compensatory mitigation project before it has achieved the specified performance standards, and thus may require additional effort or remediation to ensure functional success. The District Engineer determines if a project would require financial assurances on a case-by-case basis. Financial assurances may be necessary to ensure the initiation and successful completion of required compensatory mitigation, including but not limited to multiple-year plantings, invasive and/or nuisance species control, hydroperiod establishment, and any corrective actions following the initial physical phases of landscape construction (e.g., grading and planting). Should the District Engineer determine that financial assurances are required for this project, the permittee will create and implement a USACE-approved performance bond, letter of credit, escrow, or causality insurance for the period of construction, planting, maintenance, and monitoring activities. The amount of the financial assurances will be established based on the size and complexity of the proposed compensatory mitigation project, the estimated amount required to construct and remediate the proposed compensatory mitigation project, and monitoring of the compensatory mitigation site. The financial assurances will also include a reasonable amount to cover contingency costs to meet performance standards or other amount determined to be appropriate to the level of the uncertainty for completion of a successful compensatory mitigation project.

Tidal Marsh Mitigation
13 BSC Improvements PA 15 Mitigation
USACE File SWG-2011-01183 Harris County, Texas
REFERENCES
BNC 2013. Friends of the Baytown Nature Center. History of the Baytown Nature Center. http://www.baytownnaturecenter.org/bnc_information/history_of_site.html. Accessed June 2013.
Gould, F.W. 1975. Texas Plants-A Checklist and Ecological Summary. Texas Agricultural Experiment Station, Publication 585. McMahan, C.A., R.G. Frye, and K.L. Brown. 1984. The Vegetation Types of Texas Including Cropland, an Illustrated Synopsis
to Accompany the Map. Texas Park and Wildlife Department. Austin, Texas. Neighbors, R.J., 2003. Subsidence in the Greater Houston Area – Past, Present and Future. Proceedings, CIGMAT-2003
Conference and Exhibition. Harris-Galveston Coastal Subsidence District and the Fort Bend Subsidence District. Region H Water Planning Group. 2009. 2011 Regional Water Plan. Chapter 3 – Analysis of Current Water Supplies. The United Stated Department of Agriculture National Resource Conservation Service. (USDA NRCS). 1976. Soil Survey of
Harris County. Accessed June 2013.

BSC Improvements PA 15 Mitigation USACE File SWG-2011-01183
Harris County, Texas
Appendix A
Vicinity Map

Burnet Bay
Scott Bay
Crystal Bay
§̈¦10
ST330ST134
Bay
way
Dr
W Baker Rd
East
Cana
l
Spr in
g Cree k
±Port of Houston Authority
BSC Improvements PA 15 MitigationVICINITY MAP
Harris County, Texas
ProposedMitigation Site
(8.25 acres)
§̈¦10¬«146
UV225
¬«8UV3300 2,5001,250
Feet ^
Mapleton AveBaysho
reDr
N Bayshore Dr
Bayw
ayDr
Brownwood Dr
Crow RdCabaniss Ave
BaytownNatureCenter
BSC Improvements PA 15 Mitigation USACE File SWG-2011-01183
Harris County, Texas
Appendix B
2008 Aerial Photograph with Proposed Mitigation Site
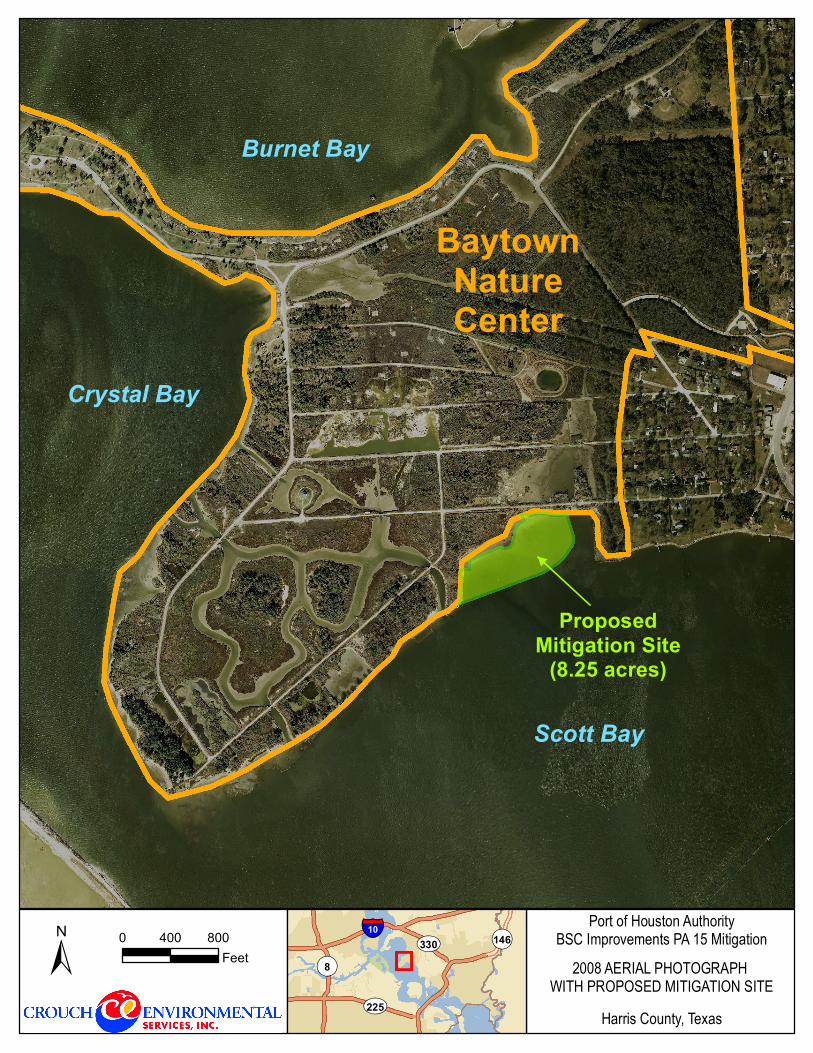
0 800400Feet±
Harris County, Texas
ProposedMitigation Site
(8.25 acres)
Scott Bay
§̈¦10¬«146
UV225
¬«8UV330
Crystal Bay
Burnet Bay
Port of Houston AuthorityBSC Improvements PA 15 Mitigation
2008 AERIAL PHOTOGRAPH WITH PROPOSED MITIGATION SITE
BaytownNatureCenter
BSC Improvements PA 15 Mitigation USACE File SWG-2011-01183
Harris County, Texas
Appendix C
Proposed Mitigation Site with 10-Digit Hydrologic Unit Codes
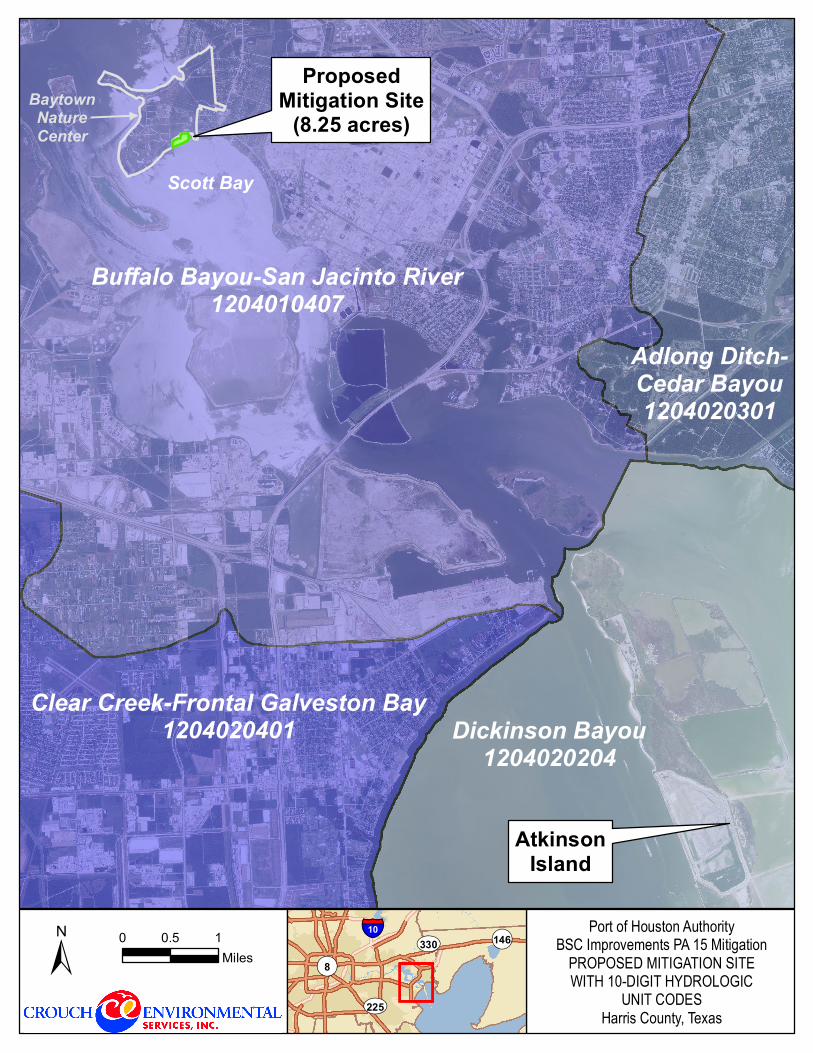
0 10.5Miles±
ProposedMitigation Site
(8.25 acres)
Scott Bay
§̈¦10¬«146
UV225
¬«8UV330
Port of Houston AuthorityBSC Improvements PA 15 Mitigation
PROPOSED MITIGATION SITEWITH 10-DIGIT HYDROLOGIC
UNIT CODESHarris County, Texas
AtkinsonIsland
Buffalo Bayou-San Jacinto River1204010407
Clear Creek-Frontal Galveston Bay1204020401 Dickinson Bayou
1204020204
Adlong Ditch-Cedar Bayou1204020301
BaytownNatureCenter

BSC Improvements PA 15 Mitigation USACE File SWG-2011-01183
Harris County, Texas
Appendix D
Historical Aerial Photographs
1953 Historical Aerial Photograph with Proposed Marsh Site Overlay 1978 Historical Aerial Photograph with Proposed Marsh Site Overlay
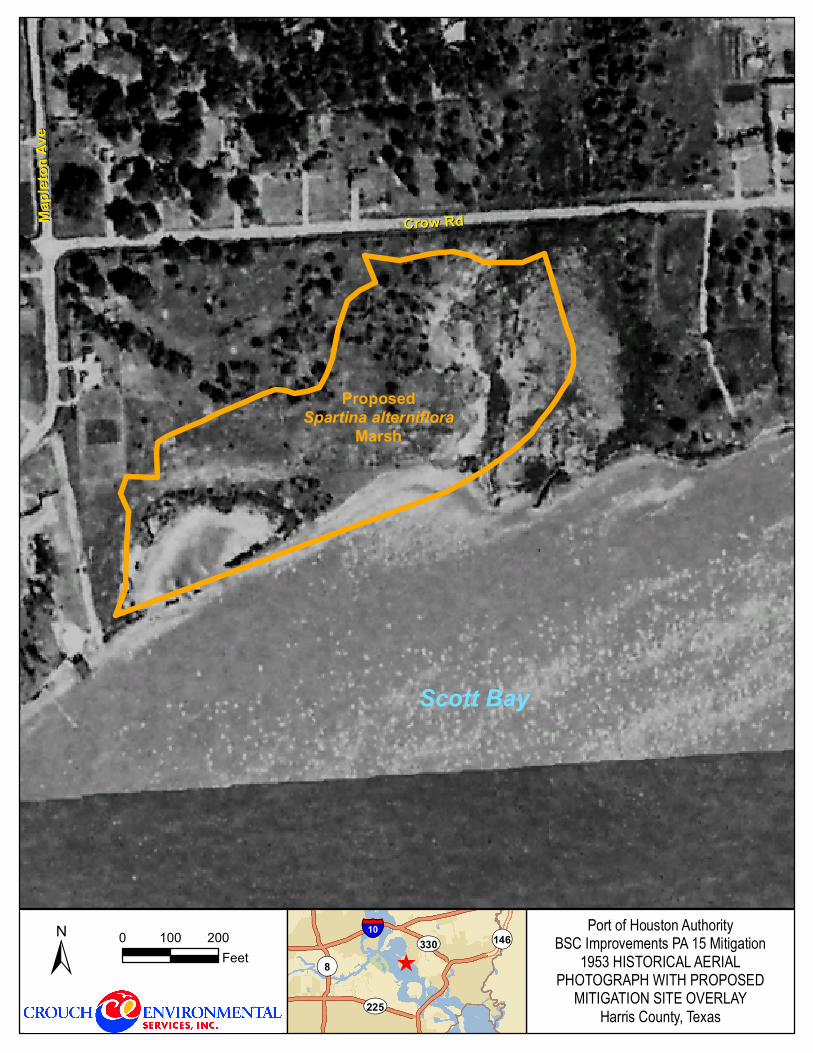
^0 200100
Feet±Port of Houston Authority
BSC Improvements PA 15 Mitigation1953 HISTORICAL AERIAL
PHOTOGRAPH WITH PROPOSEDMITIGATION SITE OVERLAY
Harris County, Texas
Scott Bay
§̈¦10¬«146
UV225
¬«8UV330
CCrrooww RRddMMaappll ee
tt oonnAA
vvee
Spartina alternifloraMarsh
Proposed
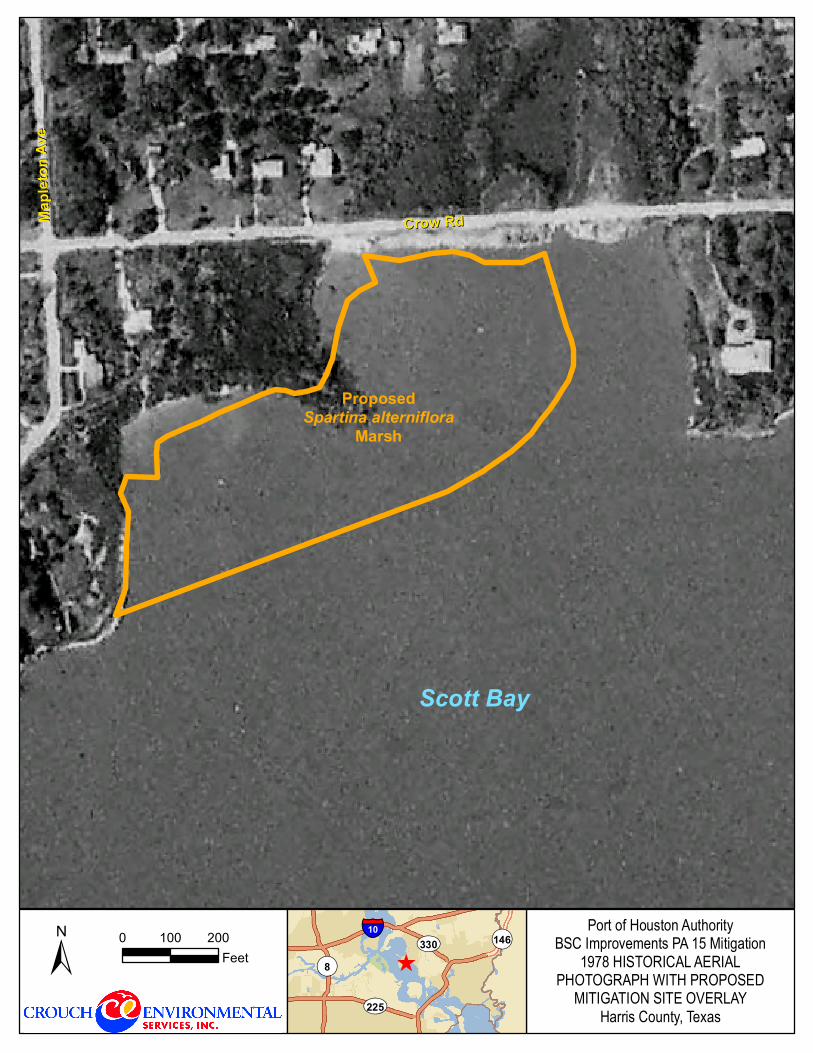
^0 200100
Feet±Port of Houston Authority
BSC Improvements PA 15 Mitigation1978 HISTORICAL AERIAL
PHOTOGRAPH WITH PROPOSEDMITIGATION SITE OVERLAY
Harris County, Texas
Scott Bay
§̈¦10¬«146
UV225
¬«8UV330
CCrrooww RRddMMaappll ee
tt oonnAA
vvee
Spartina alternifloraMarsh
Proposed
BSC Improvements PA 15 Mitigation USACE File SWG-2011-01183
Harris County, Texas
Appendix E
Subsidence Map
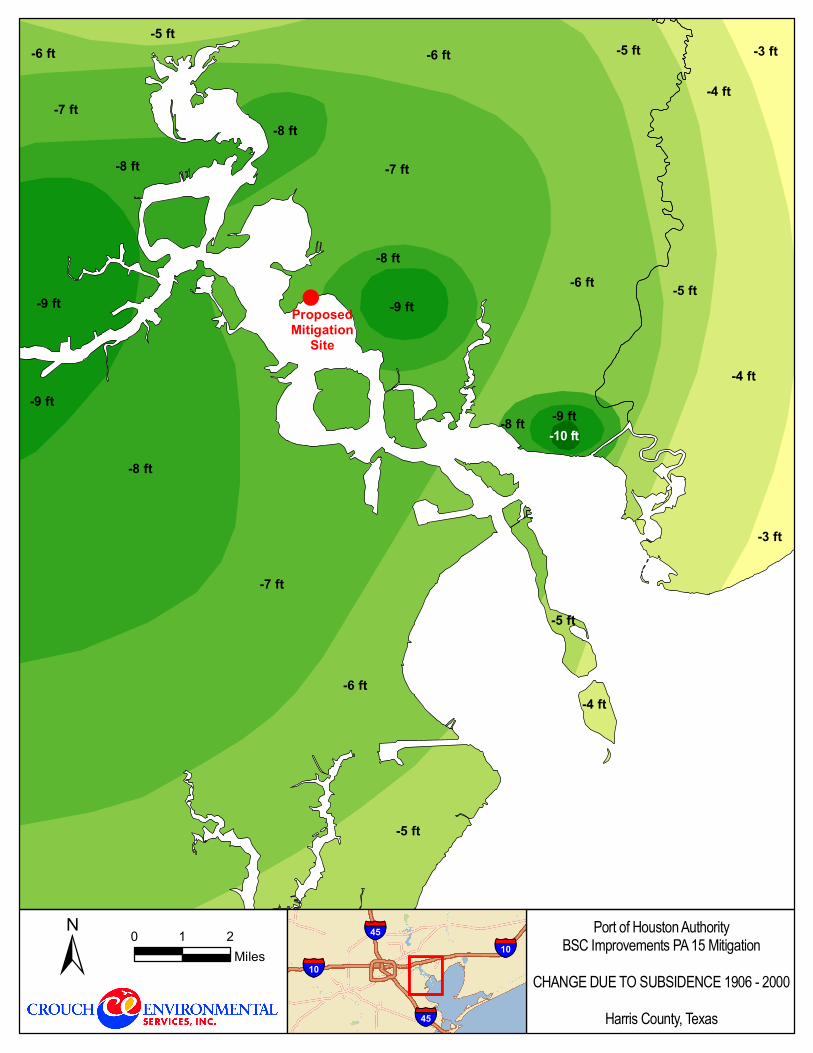
0 21Miles±
Port of Houston AuthorityBSC Improvements PA 15 Mitigation
CHANGE DUE TO SUBSIDENCE 1906 - 2000Harris County, Texas
-10 ft-9 ft-8 ft
-6 ft
-6 ft
-7 ft
-7 ft
-7 ft
-6 ft-6 ft
-8 ft
-8 ft
-8 ft
-9 ft
-9 ft
-9 ft
-8 ft
-5 ft
-5 ft
-5 ft
-5 ft
-4 ft
-4 ft
-4 ft
-3 ft
-3 ft
-5 ft
ProposedMitigation
Site
§̈¦10§̈¦10
§̈¦45
§̈¦45
BSC Improvements PA 15 Mitigation USACE File SWG-2011-01183
Harris County, Texas
Appendix F
Plan Views and Cross-section Option for the Proposed Mitigation Area
Plan View
Cross-section A-A’
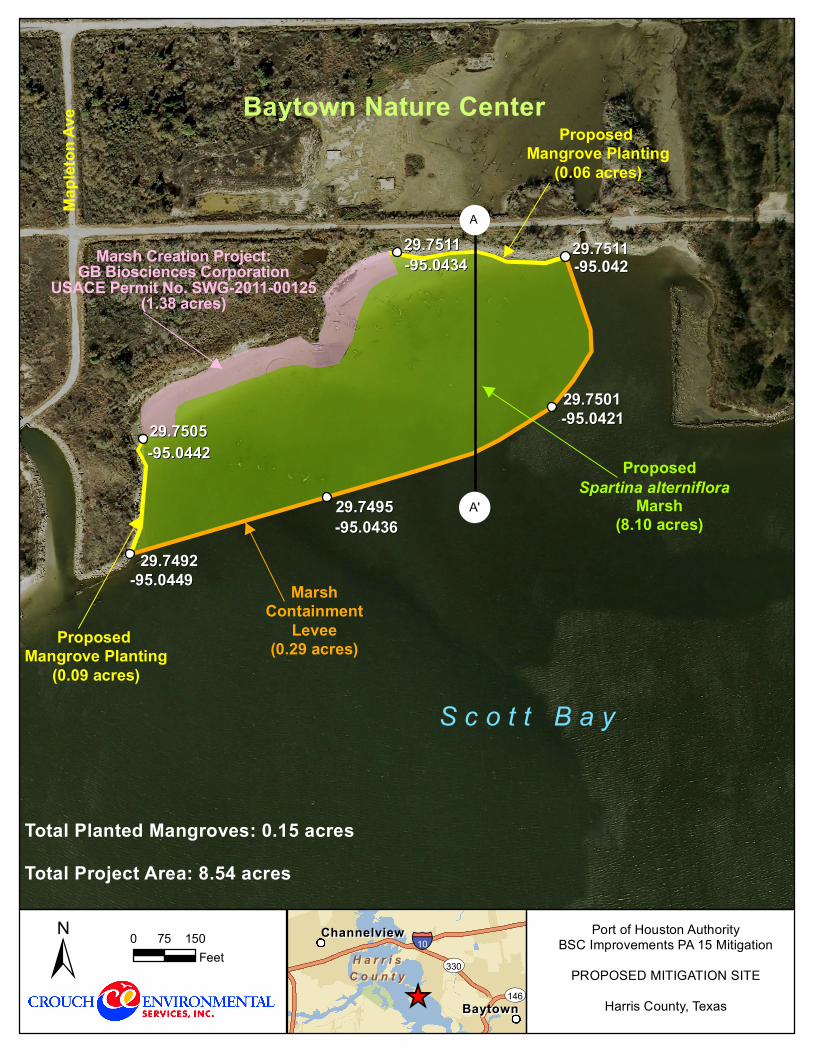
A
A'
-95.042-95.042
-95.0449-95.0449
-95.0442-95.0442
-95.0436-95.0436
-95.0434-95.0434
-95.0421-95.0421
29.751129.7511
29.749229.7492
29.750529.7505
29.749529.7495
29.751129.7511
29.750129.7501
H a r r i sH a r r i sC o u n t yC o u n t y ST330
ST146
§̈¦10
BaytownBaytown
ChannelviewChannelview0 15075Feet±
Port of Houston AuthorityBSC Improvements PA 15 Mitigation
PROPOSED MITIGATION SITEHarris County, Texas
Marsh Creation Project:GB Biosciences Corporation
USACE Permit No. SWG-2011-00125(1.38 acres)
#
Baytown Nature Center
ProposedMarsh
(8.10 acres)Spartina alterniflora
MarshContainment
Levee(0.29 acres)
#
#
S c o t t B a y
Total Planted Mangroves: 0.15 acresTotal Project Area: 8.54 acres
Proposed Mangrove Planting
(0.06 acres)
#
Proposed Mangrove Planting
(0.09 acres)
#
_̂
Maple
ton Av
e
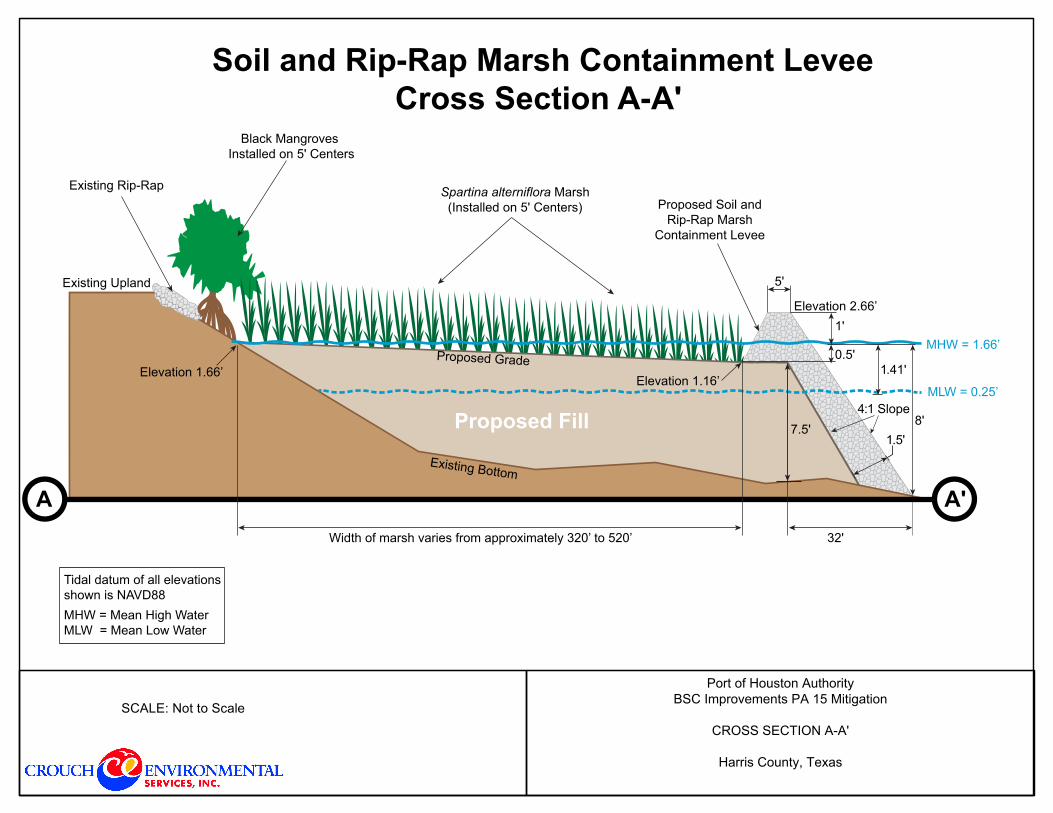
Port of Houston AuthorityBSC Improvements PA 15 Mitigation
CROSS SECTION A-A'
Harris County, Texas
SCALE: Not to Scale
Soil and Rip-Rap Marsh Containment LeveeCross Section A-A'
0.5'
1'
1.41'
8'1.5'
32'
5'
Existing Rip-Rap
Existing Upland
Proposed Fill
Black Mangroves Installed on 5' Centers
4:1 Slope
Spartina alterniflora Marsh(Installed on 5' Centers) Proposed Soil and
Rip-Rap MarshContainment Levee
Existing Bottom
Proposed Grade
A A'
MHW = 1.66’
MLW = 0.25’
Tidal datum of all elevations shown is NAVD88MHW = Mean High WaterMLW = Mean Low Water
Elevation 1.66’Elevation 1.16’
Width of marsh varies from approximately 320’ to 520’
Elevation 2.66’
7.5'

BSC Improvements PA 15 Mitigation USACE File SWG-2011-01183
Harris County, Texas
Appendix G
Aerial Photograph with Observed Oyster Locations
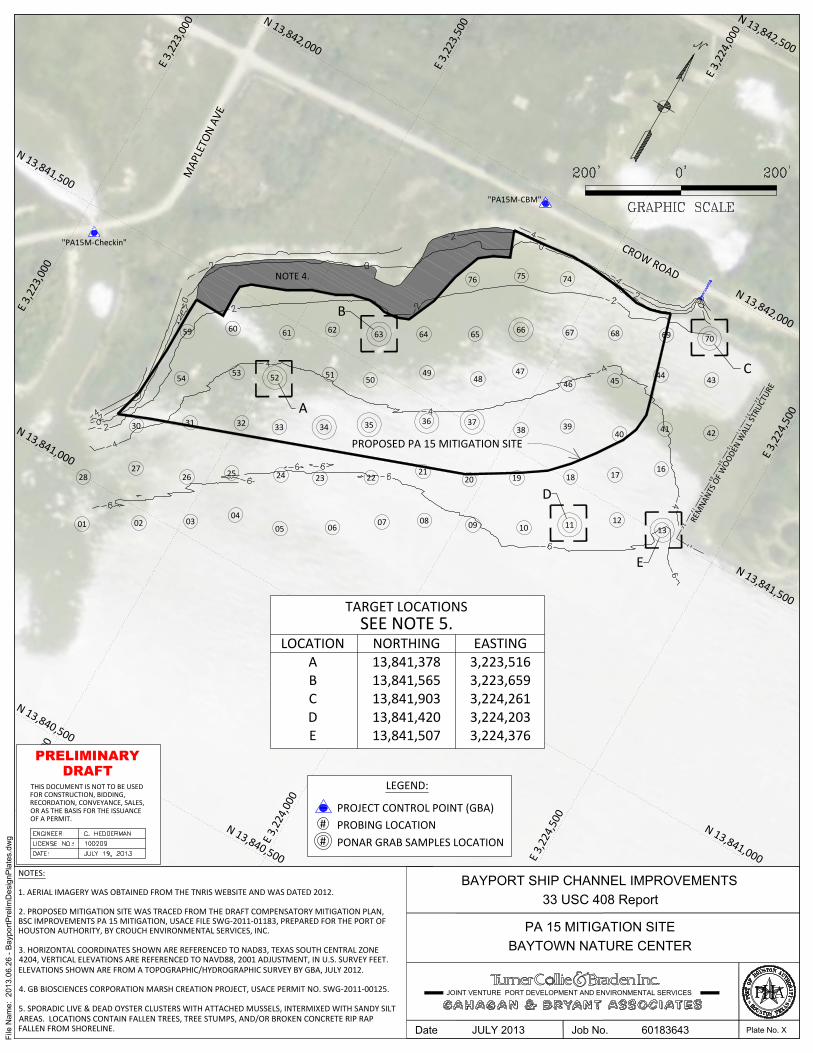
"PA15M-CBM"
"PA15M-Checkin"
10 11 1213
16171819
38 3940
41 42
43444546
47
66 67 68 69 70
76 75 74
01 02 03
2627
28
30 31
54
59
04
05 0607 08 09
2021
22232425
32 33 34 35 36 37
4849
50515253
60 61 62 63 64 65
N 13,841,500
N 13,842,000
N 13,842,500
N 13,841,000
N 13,840,500
N 13,840,500
N 13,841,000
N 13,841,500
N 13,842,000
E 3,
223,
500
E 3,
223,
000
E 3,
224,
000
E 3,
224,
500
E 3,
224,
500
E 3,
224,
000
E 3,
223,
500
E 3,
223,
000
MAP
LETO
N A
VE
CROW ROAD
PROPOSED PA 15 MITIGATION SITE
NOTE 4.
REM
NANT
S O
F W
OO
DEN
WAL
L STR
UCTU
RE
A
B
C
D
E
File
Nam
e: 2
013.
06.2
6 - B
aypo
rtPre
limD
esig
nPla
tes.
dwg
Date JULY 2013 Job No.
BAYPORT SHIP CHANNEL IMPROVEMENTS
60183643 Plate No. X
JOINT VENTURE PORT DEVELOPMENT AND ENVIRONMENTAL SERVICES
33 USC 408 Report
PA 15 MITIGATION SITEBAYTOWN NATURE CENTER
NOTES:
1. AERIAL IMAGERY WAS OBTAINED FROM THE TNRIS WEBSITE AND WAS DATED 2012.
2. PROPOSED MITIGATION SITE WAS TRACED FROM THE DRAFT COMPENSATORY MITIGATION PLAN,BSC IMPROVEMENTS PA 15 MITIGATION, USACE FILE SWG-2011-01183, PREPARED FOR THE PORT OFHOUSTON AUTHORITY, BY CROUCH ENVIRONMENTAL SERVICES, INC.
3. HORIZONTAL COORDINATES SHOWN ARE REFERENCED TO NAD83, TEXAS SOUTH CENTRAL ZONE4204, VERTICAL ELEVATIONS ARE REFERENCED TO NAVD88, 2001 ADJUSTMENT, IN U.S. SURVEY FEET.ELEVATIONS SHOWN ARE FROM A TOPOGRAPHIC/HYDROGRAPHIC SURVEY BY GBA, JULY 2012.
4. GB BIOSCIENCES CORPORATION MARSH CREATION PROJECT, USACE PERMIT NO. SWG-2011-00125.
5. SPORADIC LIVE & DEAD OYSTER CLUSTERS WITH ATTACHED MUSSELS, INTERMIXED WITH SANDY SILTAREAS. LOCATIONS CONTAIN FALLEN TREES, TREE STUMPS, AND/OR BROKEN CONCRETE RIP RAPFALLEN FROM SHORELINE.
LOCATIONABCDE
NORTHING13,841,37813,841,56513,841,90313,841,42013,841,507
EASTING3,223,5163,223,6593,224,2613,224,2033,224,376
TARGET LOCATIONSSEE NOTE 5.
PROBING LOCATION#
PONAR GRAB SAMPLES LOCATION#
LEGEND:
PROJECT CONTROL POINT (GBA)
PRELIMINARYDRAFT
THIS DOCUMENT IS NOT TO BE USEDFOR CONSTRUCTION, BIDDING,RECORDATION, CONVEYANCE, SALES,OR AS THE BASIS FOR THE ISSUANCEOF A PERMIT.

BSC Improvements PA 15 Mitigation USACE File SWG-2011-01183
Harris County, Texas
Appendix H
Tidal Wetland Delineation East of PA 15 Levee
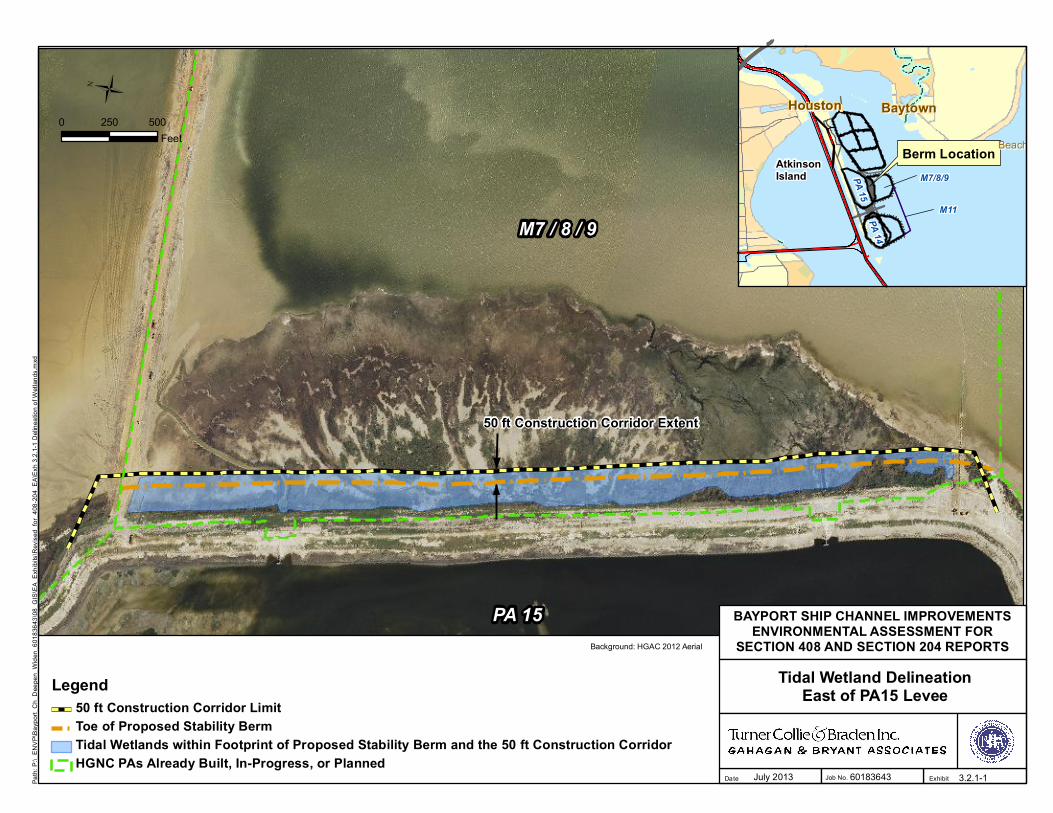
M7 / 8 / 9
PA 15
50 ft Construction Corridor Extent
Ü0 500250
Feet
Path
: P:\_
EN
VP\
Bay
port_
Ch_
Dee
pen_
Wid
en_6
0183
643\
08_G
IS\E
A_E
xhib
its\R
evis
ed_f
or_4
08-2
04_E
A\E
xh 3
.2.1
-1 D
elin
eatio
n of
Wet
land
s.m
xd
Background: HGAC 2012 Aerial
Legend50 ft Construction Corridor LimitToe of Proposed Stability BermTidal Wetlands within Footprint of Proposed Stability Berm and the 50 ft Construction CorridorHGNC PAs Already Built, In-Progress, or Planned
ExhibitDate Job No. 3.2.1-1
Tidal Wetland DelineationEast of PA15 Levee
BAYPORT SHIP CHANNEL IMPROVEMENTSENVIRONMENTAL ASSESSMENT FOR
SECTION 408 AND SECTION 204 REPORTS
60183643July 2013
PA 15PA 14
M11
AtkinsonIsland M7/8/9
Berm Location
BaytownBaytownHoustonHouston
Beach CityBeach City
BSC Improvements PA 15 Mitigation USACE File SWG-2011-01183
Harris County, Texas
Appendix I
Mitigation iHGM Results

BSC Improvements PA 15 MitigationTidal Fringe HGM (Interim) Results
ForMitigation at Baytown Nature Center
Select value for each variable by placing an "X" in the appropriate yellow boxes
1 Vedge: The amount of marsh‐water meters/hectare Variable SubindexQualitative Quantitative Sub index Vedge 0.40
Very High >800 m/ha (>1,062 ft/acre) 0.8 Vhydro 0.60
High 350 ‐ 800 m/ha (465 ‐ 1,062 ft/acre) 1.0 Vnhc 0.80
Moderate 200‐350 m/ha (266 ‐ 465 ft/acre) 0.7 Vtypical 1.00
LowLess than 200 m/ha (<266 ft/acre) 0.4 x Vslope 0.10
Vwidth 0.852 Vhydro: Site hydroperiod or degree of hydrological modifications Vrough 1.00
Sub index Vsoil 0.80
1.0
0.6 x
0.3
0.10.0
3 Vnhc: Number of nekton habitat types presentHabitat types within 150 ft of the edge of the WAA
Low Marsh High Marsh Subtidal creeks Intertidal creeks
ponds or depressions SAVs Oyster Reef Unvegetative flatsAlgal flats Mangroves Coarse woody debris
Number of habitat types Variable Subindex
0.20.30.50.7
0.8 x1.0
4 Vtypical: Proportion of the site that is covered by vegetation typical of the regional subclsssInvasive species: tallow, alligator weeds, spiny aster, common reed, rattlebox, cattail, flat sedge(Sapium sabiferum, Alternathera philoxeroides, Aster spinosus, Phragmites drummondii, Sesbania drumondii, Typha sp, Cyperus entranianus )
Variable Sub index Biota 6.00 6.480.1 Botanical 7.50 8.250.1 Physical 5.40 5.530.2 Chemical 6.35 6.390.40.50.60.70.91.0 x1.0
5 Vslope: Distance to water greater than or equal to 6 feet deepVariable Sub index
0.10 x
0.50
1.00
Site Description
Site Description
Marsh shows deterioration due to subsidence, large amounts of open water
Well developed tidal drainage network presentORSimple tidal network with isolated ponds & depression in the marsh interior
Simple tidal drainage network…isolated ponds and depressions are few & lacking
Marsh lacks both tidal creeks & isolated ponds & depressions, shoreline is linear or smooth …Marsh area is large relative to shoreline length. OR the WAA is a depression that is not affected by the daily tide (i.e. high marsh)
FCI = Vtypical
Site is open, no hydrologic restrictions
Moderate hydrologic restriction(i.e. low‐level berms overtopped frequently by waves, or has multi‐breeches or large numerous culverts)
Severe hydrologic restriction(high elevation berm with infrequent over‐top, small culverts, single opening or breech) Year 1
Site receives water only during extreme storm events Biota:Site is cut off from tidal exchange FCL = [{(Vedge + 2 Vhydro + 0.5Vnhc)/3.5} + Vtypical]/2
FCI = 0.79
Botanical
5 FCI = 0.77
FCI = 1.00
PhysicalFCL = [{Vslope + Vwidth + Vrough + Vsoil + Vhydro]/5
1 FCI = 0.6723 Chemical4 FCL = [Vtypical X Vhydro]1/2
6
Total % Cover by typical species
10%
20%
30%40%50%60%70%80%90%100%
Distance to Navigation Channel or water greater than or equal to 6 ft deep
Less than 150 ft
151‐450 ft
Greater than 450 ft
Anticipated Year 1 FCUs
Impact FCUs (FCU Success Criteria)Sub Index
Date: July 2013
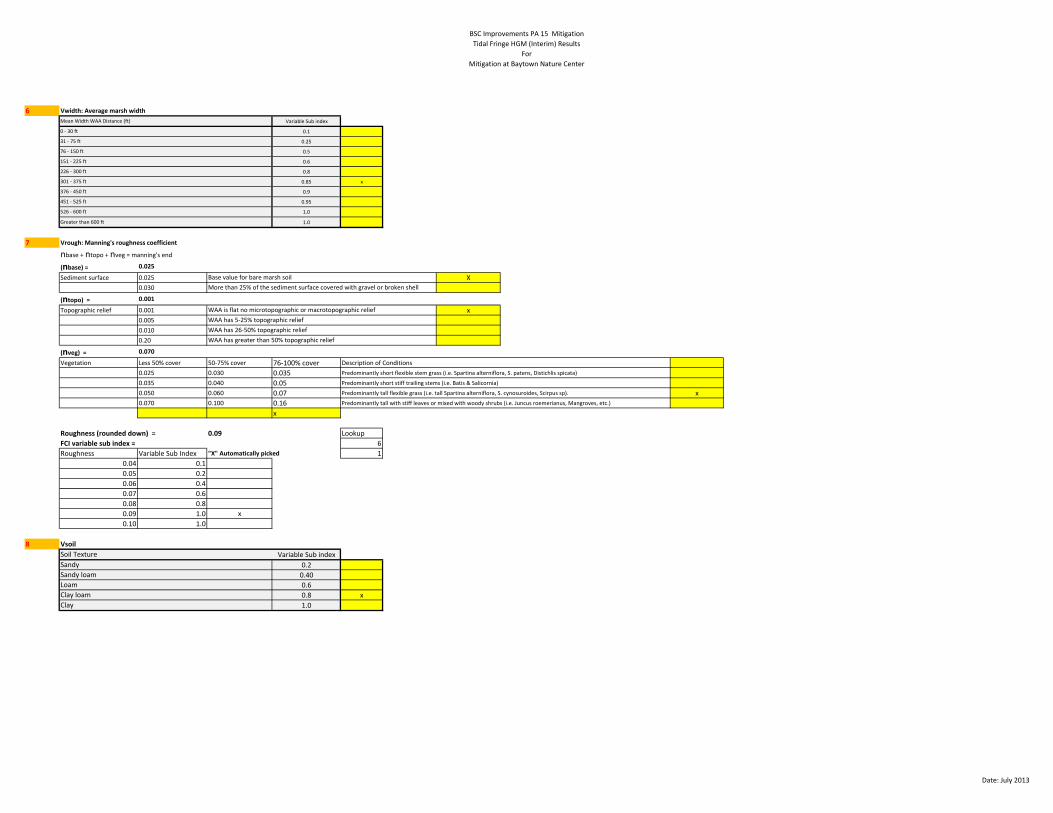
BSC Improvements PA 15 MitigationTidal Fringe HGM (Interim) Results
ForMitigation at Baytown Nature Center
6 Vwidth: Average marsh widthVariable Sub index
0.1
0.25
0.5
0.6
0.8
0.85 x
0.9
0.95
1.0
1.0
7 Vrough: Manning's roughness coefficient
nbase + ntopo + nveg = manning's end
(nbase) = 0.025
Sediment surface 0.025 X0.030
(ntopo) = 0.001
Topographic relief 0.001 x0.0050.0100.20
(nveg) = 0.070
Vegetation Less 50% cover 50‐75% cover 76‐100% cover Description of Conditions0.025 0.030 0.035 Predominantly short flexible stem grass (i.e. Spartina alterniflora, S. patens, Distichlis spicata)
0.035 0.040 0.05 Predominantly short stiff trailing stems (i.e. Batis & Salicornia)
0.050 0.060 0.07 Predominantly tall flexible grass (i.e. tall Spartina alterniflora, S. cynosuroides, Scirpus sp). x0.070 0.100 0.16 Predominantly tall with stiff leaves or mixed with woody shrubs (i.e. Juncus roemerianus, Mangroves, etc.)
x
Roughness (rounded down) = 0.09 LookupFCI variable sub index = 6Roughness Variable Sub Index "X" Automatically picked 1
0.04 0.10.05 0.20.06 0.40.07 0.60.08 0.80.09 1.0 x0.10 1.0
8 VsoilVariable Sub index
0.20.400.60.8 x1.0
526 ‐ 600 ft
76 ‐ 150 ft
Mean Width WAA Distance (ft)
0 ‐ 30 ft
31 ‐ 75 ft
151 ‐ 225 ft
226 ‐ 300 ft
301 ‐ 375 ft
376 ‐ 450 ft
451 ‐ 525 ft
Clay
WAA has greater than 50% topographic relief
Soil TextureSandySandy loamLoamClay loam
Greater than 600 ft
Base value for bare marsh soilMore than 25% of the sediment surface covered with gravel or broken shell
WAA is flat no microtopographic or macrotopographic reliefWAA has 5‐25% topographic reliefWAA has 26‐50% topographic relief
Date: July 2013