Secure Network Card. Implementation of a Standard Network Stack in a Smart Card
Upload
khangminh22Category
view
0download
0
Photo by:
GALVESTON BAY
REPORT CARD 2018

Galveston Bay is a vibrant, resilient ecosystem, but faces an
uncertain future. The Bay’s watershed is home to the fifth
largest city in the U.S., Houston. It is also home to three
ports, and remains a hub for the manufacturing and refining
of chemicals and petroleum products. However, people,
industry, and commerce often come with environmental
challenges. Galveston Bay’s most significant problems are
tied to pollution, declines in habitat acreage, and the impacts
of climate change, such as sea level rise.
That Galveston Bay could receive a grade of C for overall health despite
facing these monumental issues shows how resilient it is. This offers hope that we can
change our negative impact on water quality, wetlands, seagrasses, and wildlife. But a
healthier Galveston Bay is in everyone’s interest.
(About the grade: The combined GPA for all six categories together is a 2, which
registers in the low C range. Unfortunately, the combined grade does not include
grades for three of our indicators: Litter and Trash, Wetlands and Oyster Reef Acreage
- There were not enough data available on these indicators to include them in the
overall grade. We hope you will join us in encouraging local, state, and national leaders
to pass legislate on, and provide funding, that will improve monitoring and address
these issues.
Photo by Andrew Hancock

OVERVIEW SECTION
About the Bay Galveston Bay is Texas’ largest bay, covering about 600 square miles. The Galveston
Bay watershed — the area of land that drains into a given body of water — is about
24,000 square miles. It stretches northward from the Houston metropolitan area, up the
Trinity River basin, and past the Dallas-Fort Worth area. Half the population of Texas
currently lives in the Galveston Bay watershed. The Bay’s urbanized, industrialized, and
agricultural setting poses unique
challenges for water quality,
habitat protection, and resource
conservation. If you live, work, or
go to school in the Galveston Bay
Watershed,
you can find your local watershed
now.
Galveston Bay is, by definition,
an estuary – a semi-enclosed
coastal body of water that has a
free connection with the open sea.
Within an estuary, seawater mixes
with freshwater from the land. In
the case of Galveston Bay, it is where
freshwater from the Trinity and San Jacinto rivers and the extensive bayous and creeks
of the Houston-Galveston region mix with the saltwater of the Gulf of Mexico.
Estuaries are among the most productive ecosystems in the world. They are home to a
huge amount of plant and animal life, and can produce large harvests of recreational and
commercial fish and shellfish.
People are drawn to the water – and for good reason. Galveston Bay and the habitats
within its watershed provide many benefits to society, including:
• Fisheries/seafood.
• Water quality improvement.
• Erosion, flood, and storm protection.
• Regulation of local climate.
• Aesthetics and recreational opportunities such as swimming, boating, and
bird watching.
Ensuring a healthy future for Galveston Bay is ensuring that future generations can enjoy
a safe place to not only live, but also swim, boat, and fish.

OVERVIEW SECTION
About the Project The Galveston Bay Report Card is a citizen-driven, scientific analysis of the health of
Galveston Bay. Supported by a grant from Houston Endowment and implemented by
the Galveston Bay Foundation and the Houston Advanced Research Center, the report
card’s goal is to engage community members in meaningful discussion about Bay
health topics. The report card is also designed to inspire people to take actions that
protect and preserve the Bay. The 2018 report card is the fourth release, and we
plan to update the report annually.
Through a series of surveys and interactive presentations, six topic categories were
identified by the Galveston Bay Foundation as health topics of interest to the public
in the fall of 2014: Water Quality, Pollution Events & Sources, Wildlife, Habitat, Human
Health Risks, and Coastal Change. Scientists from HARC (the Houston Advanced
Research Center) then analyzed data and trends for 19 indicators. What has emerged
is a compelling story about Galveston Bay, its challenges, opportunities, and greatest
needs.
Each indicator features easy-to-understand grades, similar to the grades you would
find in a school report card. These indicators show specific ways you can help the Bay,
as well as data-driven infographics, additional resources, and a downloadable full
report with expanded content. There is also specific data on each indicator.
How We Grade It is not easy to measure how “healthy” a bay system is. Estuaries are extremely
dynamic environments that change by the minute. It is not always clear how much
stress a particular component of the bay can take before it begins to deteriorate, how
fast it may deteriorate, or if recovery after deterioration is even possible. The way an
individual defines a “healthy” bay is often related to how we, as humans, value the
services that the system provides us, such as seafood harvests, clean water for
drinking and playing, and habitat that protects and stabilizes shorelines.
The goal of the federal Clean Water Act of 1972 is to make the nation’s waters
swimmable and fishable. That goal was our guideline in measuring the indicators for
this report card. In this project, the Bay’s health is perceived as a question of
sustainability and resiliency: Do the indicator trends portray a Bay that will continue to
provide recreation, food, clean water, and protection from storms?
Instead of trying to apply a universal grading methodology to such a variety of Bay
indicators, some degree of best professional judgment was used to determine overall
category grades and indicator grading scales. A detailed explanation outlines how
grades were calculated and when grading relied heavily on best professional
judgment based on available data. This is disclosed in the downloadable PDFs for
each indicator. Letter grades correspond to a 4.0 grade point average scale, and are
accompanied by descriptors ranging from “Excellent” to “Critical.”

OVERVIEW SECTION
CONTACT US Working Together For a Healthy Bay As Texans and residents of the Galveston Bay watershed, we all carry the responsibility
of protecting and preserving the Bay for future generations. The Bay is at the heart
of immense ecological and economic productivity. It’s also a special place to many
people who enjoy its views, tranquility, and recreational opportunities. The indicators
selected for this report represent a diverse cross-section of Bay features, but they
are not intended to be all-encompassing. We have already identified a few topics for
future indicator expansion: water clarity, chlorophyll-a concentrations (an indicator of
productivity at the base of the food chain), marine mammals and reptiles, land use/
development, harmful algal blooms, and species range expansions.
We welcome your comments, suggestions and ideas to improve the report card, which
we plan to update annually. A healthy environment is good for the communities we live,
work, and play in. So please share this report with your family and friends. We encourage
you to ask questions and seek innovative solutions to challenging environmental issue.
Galveston Bay Foundation
T’Noya Thompson Scott Jones
281-332-3381 Ext. 223 281-332-3381 Ext. 209
[email protected] [email protected]
Houston Advanced Research Center
Erin Kinney Lisa Gonzalez
281-364-6040 281-364-6044

WATER QUALITY
2018 GALVESTON BAY
REPORT CARD
WWW.GALVBAYGRADE.ORG
#GalvBayGrade18

WATER QUALITY
In each of the report card sections, you can learn a little
more about how various indicators impact the Bay and
the many species within it.
SUMMARY
• The overall water quality of Galveston Bay is excellent.
• Water quality in the Report Card is assessed using
information describing nutrient and dissolved oxygen
levels.
• Nutrient pollution can cause algae blooms, deplete
oxygen, and even kill marine life.
The Galveston Bay watershed received an A for water quality in 2017. This year’s
excellent grade is consistent with long-term trends of improving water quality as a
result of Clean Water Act implementation and ongoing implementation of Watershed
Protection Plans in our region (locally-driven, watershed-specific plans to voluntarily
address complex water quality problems in the region). 2017 was also a good year
for consistent rainfall, which helps keep the region’s rivers and bayous flowing.
However, the Galveston Bay watershed’s human population is growing. This means
more land will be developed for homes, businesses, and transportation
infrastructure. As that happens, new strategies will be needed to keep the Bay from
being overloaded with nutrients that degrade water quality.
A good way to gauge the health of Galveston Bay is to assess the levels of life-
sustaining nutrients and oxygen. Energy from the sun and elements like nitrogen
A

WATER QUALITY
and phosphorus are necessary for plants such as microscopic algae, seagrasses,
and wetland grasses to exist in the Bay. These form the base of the food web upon
which the entire ecosystem depends.
The water in Galveston Bay flows from watersheds on land into rivers and bayous, picking
up nutrients and contaminants along the way. Too many nutrients can have
negative effects on the health of the Bay. Surface waters in some watersheds
contain more nutrients than they should. We need to watch those areas and
determine the causes of elevated nutrient levels to ensure those nutrients do not
cause more widespread problems in the future.
What is Nutrient Pollution? Too many nutrients from human
activities, like over-fertilizing and
discharging wastewater, can alter
the natural balance of nitrogen and
phosphorus in our waterways. When
nutrient levels are too high, they can
lead to algae blooms, oxygen depletion,
and hypoxic (low oxygen) or anoxic
(no oxygen) zones that can kill fish and
bottom-dwelling animals.
Making the Grade
Photo by Anna Armitage
The levels of nutrients and dissolved oxygen found in samples taken from rivers, bayous,
and the Bay itself in 2017 were most often at acceptable levels for supporting diverse
and healthy aquatic life. So overall water quality earned an A grade. The water quality
problems that did exist — relating to high levels of phosphorus — typically occur in
bayous that receive runoff and wastewater from human activity in residential, industrial,
commercial, and agricultural areas.

WATER QUALITY
SLOW YOUR RUNOFF: Nutrient pollution often peaks after heavy rainfall because of the
particles picked up by the rain as it flows down roadways into storm drains, and then into the Bay
and its tributaries.
There are several ways to slow runoff:
• Reduce or replace concrete areas with porous coverings like gravel and
• Install rain barrels to collect rainwater from your roof.
• Keep as much green space as possible on your property.
Learn more: www.galvbay.org/rainbarrel
PICK UP AFTER YOUR PETS: Properly dispose of pet waste in the trash. Pet waste
contains excess nitrogen and phosphorus. Those nutrients get carried from yards and
parks by storm and irrigation runoff into creeks and other tributaries that flow into Galveston
Bay.
Learn more: www.petwastepollutes.org
CONSERVE:
• Electricity generation and transportation that
require fossil fuels add nitrogen to the air,
which is then deposited into our waterways
from rain and runoff.
• Fertilizers contain nitrogen and phosphorus,
and overwatering creates standing water
and runoff.
• Some detergents (such as laundry, dish, and
Photo by Anja Borski
car-washing soaps) contain phosphorus.
BE A CLEAN WATER PARTNER: Community groups
and organizations — including schools, business and
cities — can offer educational programs and service
projects to their constituents by contacting the
Galveston Bay Foundation’s Water Programs.
Photo by Chris Kuhlman CK Productions
JOIN IN: Participate in watershed protection planning
initiatives in your area. For programs on the east side
of the Bay, visit the Houston-Galveston Area Council
website, and for the west side (Liberty County), visit
the Double Bayou Watershed Partnership website.

WATER QUALITY
NITROGEN
• Nitrogen stimulates plant growth.
• Too much nitrogen can cause the overgrowth of algae (or an “algae bloom”), which can
deplete oxygen in the water.
Algae blooms can choke waterways and lead to low oxygen levels in the water. Some
algae can even be toxic to humans, posing a threat to recreation and clean water for
drinking.
Rivers and Bayous Nitrogen Grade: A (Excellent) Only fourteen percent of samples collected from the rivers and bayous surrounding Galveston
Bay were above nitrogen screening levels in 2017, up from 9 percent in 2016. In these waterways, a significant percentage of flowing water can come from wastewater treatment plants, particularly in dry, summer months. How that wastewater is treated — as well as what the runoff carries (fertilizer, pet waste, and other pollution from roads, parking lots, and yards) — impacts how much nitrogen is in the water of a river or bayou. If nitrogen levels in rivers and bayous become too high, Galveston Bay will likely be affected downstream.
The majority of watersheds in the Galveston Bay region receive an A grade. However, some of the region’s most urbanized watersheds (Addicks Reservoir, Brays Bayou and Sims Bayou) receive B grades, respectively. The western portion of Galveston Bay also received a B grade for the second year in a row. It is notable that 2017 was an extremely wet year with above average rainfall. Greater amounts of rainfall mean larger volumes of runoff flowing through our region’s
bayous into the Bay.
Galveston Bay Nitrogen
Grade: A (Excellent) The 2017 nitrogen
concentrations in Galveston Bay
exceeded screening levels in 17
percent of samples collected, up
from 13 percent in 2015, but
still earning the Bay an A.
Water quality concentrations (such
as how much nitrogen is in the Bay
and its tributaries) are monitored
by federal, state, and local
agencies. Data describing nitrogen
concentrations in rivers, bayous,
and the waters of Galveston Bay
were obtained from the Texas
Commission on Environmental
Quality (TCEQ)
Surface Water Quality Monitoring
Program and the TCEQ/H-GAC Clean
Rivers Program.

WATER QUALITY
NITROGEN
Nitrogen grades are based on total ammonia-nitrogen in water. Ammonia was chosen to
represent this indicator because the TCEQ data on it were the most complete for both
tidal and non-tidal waters. Grades reflect the percent of samples that exceeded TCEQ
screening levels in 2017, meaning the samples were above the range that is acceptable
in Texas. The grading scale is based on the best professional judgement of coastal and
estuarine scientists. This scale is also used to set water quality parameters in other
coastal report cards, such as the one for Chesapeake Bay.
Grade Percent of Samples Exceeding Screening Level
A 0-20%
B 21-40%
C 41-60%
D 61-80%
F 81-100%
I (Insufficient Data)
Keep Excess Nitrogen Out of Our Waterways
• Follow fertilizer directions carefully and don’t over-fertilize or over-water your lawns or gardens.
• Have septic systems inspected and repaired if they are not functioning properly. The
Houston-Galveston Area Council (H-GAC) estimates that there are more than
300,000 onsite sewage facilities in its 13-county service area. Learn more and see a
map of septic systems in your area.
• Leave as much of your property unpaved as possible so rainwater has a chance to
soak in rather than run off.
• Plant a rain garden to prevent rainwater from running into storm sewers. Choose
native plants that grow well in our climate and use compost instead of fertilizer.
Nitrogen enters the Galveston Bay system
through wastewater, fertilizer from yards
and agricultural lands, and runoff from
paved surfaces. Besides being an important
component of unhealthy ground level ozone
(smog), airborne nitrogen from vehicle
exhaust, electricity generation, and some
industrial processes can be deposited into
waters of the Bay and its rivers and bayous.
Photo by Anja Borski

WATER QUALITY
PHOSPHORUS
• Like nitrogen, phosphorus stimulates plant growth, but too much contributes to
algae blooms.
• Phosphorus — commonly found in fertilizers, detergents, manure, sewage, and
industrial wastewater (effluent) — attaches to soil particles. This makes erosion a factor in
phosphorus pollution.
Just like having too much nitrogen, too much phosphorus can cause an overgrowth of
algae (or an “algae bloom”). Algae blooms can choke waterways and lead to low oxygen
levels in the water. Some algae can even be toxic to humans, posing a threat to recreation
and clean water for drinking.
Rivers and Bayous Phosphorus Grade: B (Good) In 2017, eight sub-watersheds of Galveston Bay scored C or D for exceeding the phosphorus
water quality standards with one watershed, Barker Reservoir, scoring F. About 34 percent of
all samples exceeded total phosphorus screening levels, resulting in a grade of B.
Many southern and eastern watersheds in the Galveston Bay region receive the grade of A.
However, the region’s most urbanized watersheds extending from Clear Creek northward to
Spring Creek in Montgomery County continue to receive B, C and D grades. These watersheds
reflect some of the most heavily populated, urban land uses in the region yielding larger
volumes of rainfall runoff flowing from yards, parking lots and streets.
Galveston Bay Phosphorus
Grade: A (Excellent) In 2017, 11 percent of samples
collected in Galveston Bay waters
had phosphorus levels above
screening levels set for the
protection of aquatic life, up from 2
percent in 2016, which still qualifies
as an A.
Water quality concentrations
such as phosphorus are
monitored by federal, state, and
local agencies. Data describing
phosphorus concentrations in
rivers, bayous, and the waters of
Galveston Bay were obtained
from the Texas Commission on
Environmental Quality (TCEQ)
Surface Water Quality
Monitoring Program and the
TCEQ/H-GAC Clean Rivers
Program.

WATER QUALITY
PHOSPHORUS
Phosphorus grades are based on the total amount of phosphorus in the water. Grades
reflect the percent of samples exceeding TCEQ screening levels in 2017, meaning those levels
were above the range that is acceptable in Texas. The grading scale is based on the
best professional judgement of coastal and estuarine scientists. This scale is also used
to set water quality parameters in other coastal report cards, such as the one for
Chesapeake Bay.
Grade Percent of Samples Exceeding Screening Level
A 0-20%
B 21-40%
C 41-60%
D 61-80%
F 81-100%
I (Insufficient Data)
Keep Excess Phosphorus Out of Our Waterways
• Use phosphate-free or phosphate-reduced laundry, dish, and car-washing soaps.
• Incorporate landscaping techniques that require less fertilizer, like growing a garden
with native plants.
• Control erosion. Phosphorus attaches to soil particles, making erosion a contributor
to phosphorus pollution.
Phosphorus concentrations in Galveston Bay waters have declined greatly since the
early 1970s thanks to the success of the Clean Water Act and the switch to phosphate-
free or phosphate-reduced formulas for laundry, dish, and car-washing soaps.
However, some detergents are still high in
phosphates, and Texas has not yet joined
the list of states with legislation banning
their use.
Most phosphorus pollution today comes
from runoff from the land. There are several
ways to reduce this kind of runoff. They
include relying on landscaping techniques
that require less fertilizer, taking steps to
prevent erosion, and using native plants.
Learn more Photo by Anja Borski/Galveston Bay Foundation

WATER QUALITY
DISSOLVED OXYGEN
• Adequate oxygen levels are required to support aquatic life in Galveston Bay.
• Hypoxia (low-oxygen) and anoxia (no-oxygen) zones are common in water that is
warm, still, and has poor clarity. These areas are commonly seen following large algae
blooms.
• Benthic (bottom-dwelling) organisms, like oysters, cannot escape hypoxic conditions.
Most animals will die if caught in anoxic water for any length of time.
Like nutrients, oxygen is a natural and vital component for supporting life in our Bay
and tributaries. Oxygen is introduced when surface water mixes with air, and when
aquatic plants produce oxygen during photosynthesis. Dissolved oxygen tends to be
lower in warm waters and in waters with poor clarity that block the light needed for
photosynthesis. The growth, die-off, and decomposition of aquatic plants can also
lead to low levels of dissolved oxygen. This is why we often see sudden reductions in
dissolved oxygen levels following large algae blooms.
Hypoxia is the term used to describe low levels of oxygen in the water. The absence of
dissolved oxygen is called anoxia, and most animals die if caught in anoxic water for
any length of time. Some animals, like fish, can escape hypoxic or anoxic conditions. But
organisms that are attached to surfaces like a rocky bay bottom or piers and docks
cannot move freely. They will die if they cannot get enough oxygen from the water
around them. Fish and shellfish species can usually recover from temporary and sporadic
periods of low oxygen, which are not uncommon during hot, dry weather. But
prolonged or chronic periods of reduced oxygen in water can affect the longer-term
status of fish and shellfish populations.
Shaded bayou and stream banks
offer protection from direct sunlight,
which can rapidly increase water
temperatures and lower dissolved
oxygen levels. It is vital that we all
work to preserve and restore the
forests and wetlands that protect
the shores of Galveston Bay’s
rivers and bayous. Because of their
shallow and often slow-moving
nature, the rivers and bayous are
at a higher risk of low dissolved
oxygen during hot, dry weather or
algae blooms.
Photo by Irene Amiet

WATER QUALITY
DISSOLVED OXYGEN
Rivers and Bayous Dissolved Oxygen Grade: A (Excellent) Dissolved oxygen levels were below screening levels in ten percent of samples collected
from rivers and bayous surrounding Galveston Bay in 2017. Two watersheds received
grades of B: Dickinson Bayou and Sims Bayou.
Galveston Bay Dissolved Oxygen Grade: A (Excellent) In 2017, only two percent of samples collected in Galveston Bay waters had dissolved
oxygen levels below the screening levels set for the protection of aquatic life.
About the Data Data describing dissolved oxygen concentrations in rivers, bayous, and the waters of
Galveston Bay were obtained from the Texas Commission on Environmental Quality
(TCEQ) Surface Water Quality Monitoring Program, the TCEQ/H-GAC Clean Rivers
Program, and partner agencies. The TCEQ data were combined with dissolved oxygen
data collected by the Texas Parks and Wildlife
Department (TPWD) Coastal
Fisheries Division.
Dissolved oxygen grades are
based on dissolved oxygen
in water, and the percent of
samples falling short of TCEQ
screening levels in 2017
(meaning they were below
the range that is acceptable
in Texas).

WATER QUALITY
DISSOLVED OXYGEN
The grading scale for water quality indicators (nitrogen, phosphorus, dissolved oxygen)
shows the status of those indicators in 2017 around the Galveston Bay system. This
scale is based on the best professional judgment of coastal and estuarine scientists. This
scale is also used to set water quality in other coastal report cards, such as the one for
Chesapeake Bay.
Grade Percent of Samples Below Screening Level
A 0-20%
B 21-40%
C 41-60%
D 61-80%
F 81-100%
I (Insufficient Data)
Our Actions Impact Oxygen Levels
• Help preserve and restore habitats that help promote high oxygen levels, like forests
and wetlands.
• Help prevent nutrient pollution by following the steps to reduce nitrogen and
phosphorus levels in Galveston Bay.
• Find out what else you can do about nutrient pollution.
Preserving and restoring forests and wetlands that protect the shores of Galveston Bay
and its rivers and bayous can improve dissolved oxygen levels in the water. Plants help
to remove nutrients, and trees provide shade to lower water temperatures. This helps to
maintain oxygen levels.
Every summer, a hypoxic zone forms in the northern Gulf of Mexico off the coasts
of Texas and Louisiana. In this massive region, the water near the bottom of the gulf
contains less than two parts per million of dissolved oxygen. Because few
organisms can survive under hypoxic conditions, this area is also known as the
“Dead Zone.” The Dead Zone is caused by excessive nutrients from human
activities (fertilizers, wastewater, erosion, etc.). Also, floods, droughts, and hurricanes
influence its size. The large size and location of the Gulf of Mexico Dead Zone cause
major ecological and economic problems in the entire Gulf of Mexico ecosystem,
including Galveston Bay.
In order to improve or maintain dissolved oxygen levels in the Galveston Bay watershed,
we all need to take a look at ways we can reduce excess nutrient runoff.

17
POLLUTION EVENTS &
SOURCES
2018 GALVESTON BAY
REPORT CARD
WWW.GALVBAYGRADE.ORG
#GalvBayGrade18

2
SUMMARY
• There were no major spills in 2017, and the number of spills was lower compared to previous years.
• Trash in rivers, bayous and the Bay is inadequately
monitored; we do not know enough about types of
waterway trash, sources of litter or amounts in water.
• A long history of industrial contamination has polluted
Galveston Bay sediment in some areas. Some
contaminants are known to persist in the environment for
many years, even after they are no longer produced.
These are monitored in parts of Galveston Bay and the
Houston Ship Channel.
Galveston Bay received a C for pollution events and pollution sources in 2017.
Galveston Bay’s long history of industrial manufacturing has caused environmental
damage. The pollution from this manufacturing has left toxic compounds in the
sediment of our rivers, bayous, and Galveston Bay itself. Sediments are monitored in
Galveston Bay and the Houston Ship Channel, but are only monitored in a few rivers
and bayous.
Litter and trash can also threaten the environment and human health. However, there is
little data regarding the types of waterway trash, sources of litter or amounts in the Bay
and bayou waters. This lack of information results in a grade of “incomplete” for litter
and trash.
Photo by Chris Kuhlman
C

POLLUTION EVENTS & SOURCES
Living with the Damage Oil spills and toxic contamination are environmental risks we live with as Galveston Bay’s
local economy benefits from shipping and industrial activity. The good news is that the
Bay is a less toxic place now than in the years before the Clean Water Act of 1972. As we
learn more about the harmful compounds that result from manufacturing products and
chemicals, we have strengthened regulations and found innovative ways to reduce
pollution from industrial runoff and wastewater. Industries along the Bay have invested in
technologies to reduce pollutants and improve safety, and those investments are paying
off.
However, some toxics, like PCBs, have been banned for decades but are still present
in the environment. There are also more people living and contributing to pollution and
trash in the Houston area now than there were in the 1970s, and the population is
expected to keep growing. There is still plenty of work to be done to clean up
Galveston Bay.
Back the Bay by Keeping It Clean REPORT
• Environmental emergencies, discharges, spills or air releases can be reported to the
Texas General Land Office and the Texas Commission on Environmental Quality at
1-800-832-8224.
• The Galveston Bay Action Network is an interactive tool for submitting and viewing
water-related pollution and waste dumping reports across the four counties that
touch Galveston Bay (Brazoria, Chambers, Galveston, and Harris). Reports are sent
directly to the appropriate authorities, so you do not have to do research to find out
where to send your concerns.
SPEAK UP
• Contact local officials and legislators about making the cleanup and preservation of
Galveston Bay a priority.
• Participate in public processes to clean up known pollution sites, like the San Jacinto
River Waste Pits.
PICK IT UP
• Remember that pollution and litter are everyone’s problem. If you see trash, pick it up
before it ends up in the Bay.
MAINTAIN YOUR VEHICLE
• According to the U.S. Environmental Protection Agency, motor oil from a single oil
change can pollute up to a million gallons of drinking water.

POLLUTION EVENTS & SOURCES
The report card looks at five of these contaminants: PCBs, dioxins, PAHs, pesticides,
and metals.
ORGANICS:
• PCBs, or polychlorinated biphenyls, can be found in electrical transformers and
other equipment. While the manufacture of PCBs has been banned since 1979,
they may be present in products and materials produced before the ban. PCBs are
considered a legacy pollutant, a class of toxics that persist in the environment from
contamination that largely occurred in the past.
• Dioxins are chlorinated byproducts of chemical manufacturing, incineration, and the
pulp and paper industry. The EPA Superfund site known as the San Jacinto River
Waste Pits is a former paper mill waste disposal site that is a significant source of
dioxin contamination in Galveston Bay, and it’s most likely not the only one. Dioxin
may also enter the Bay through the air. Dioxin is monitored at the San Jacinto River
Waste Pits, but not elsewhere in Galveston Bay.
• PAHs, or polycyclic aromatic hydrocarbons, are a class of chemicals most often
deposited into the Bay through the air. PAHs result from the incomplete burning of
coal, oil, gas, garbage, or other organic substances. They may also get deposited
into the Bay as urban runoff that washes away vehicle pollution.
• Pesticides are substances intended to control insects. Herbicides are used to control
weeds and other unwanted plants. Pesticides and herbicides are both used on
farmland and residential and commercial properties. When it rains, runoff from yards,
farmland, and roadsides carry these chemicals into local streams, bayous, rivers and
the Bay itself.
METALS:
• Heavy metals — such as mercury, lead, and chromium — reach the Bay from sources
linked to the land, water, and air. For example, mercury and lead can enter the air
through manufacturing processes and the burning of coal or waste. Metals are also
used in a variety of industrial processes, and found in sources such as paint and
batteries.
TOXINS IN SEDIMENT
• Toxic chemicals pose a threat to the environment and our health.
• Contaminants often attach to particles of soil, rather than water.
• Toxins are known to biomagnify, or build up, in the food chain, contaminating our
seafood.
Toxic chemicals pose a threat to our environment and health. Many of these toxic
contaminants are found in higher concentrations in sediment — the materials (like soil
and rocks) that are washed down rivers and bayous. Sediment eventually settles to the
bottom of a body of water. Toxic contaminants within sediment can attach to particles of
soil and then find their way into the food chain.

POLLUTION EVENTS & SOURCES
TOXICS IN SEDIMENT
Galveston Bay Sediment Toxic Content Grade: C (Adequate for Now) Toxic chemicals pose a threat to our health and the health of the Bay, and have
even led to the establishment of Seafood Consumption Advisories. Monitoring
programs gather data describing toxins in sediments of Galveston Bay and the
Houston Ship Channel, where elevated concentrations of metals such as mercury,
and organic compounds such as PCBs, and polycyclic aromatic hydrocarbons
(PAHs) are found in sediment.
The grades for Toxins in Sediment are:
• Toxic metals in sediments of Galveston Bay (A)
• Toxic metals in sediments of the Houston Ship Channel (B)
• Organic toxins in sediments of Galveston Bay (I)
• Organic toxins in sediments of the Houston Ship Channel (B)
• Dioxins in sediments of Galveston Bay (I)
• Dioxins in sediments of the Houston Ship Channel (D)
Dioxins in the Houston Ship Channel, are monitored as part of the San Jacinto Waste
Pit superfund site, but there are not enough data to asses a grade for dioxins in
Galveston Bay. Therefore Dioxins in Galveston Bay received a grade of “Incomplete”.
The danger of legacy pollutants such as PCBs and dioxins is they can persist in the
sediment for decades and can move into the Bay food web.
See the Data
POLLUTION EVENTS & SOURCES
TOXICS IN SEDIMENT
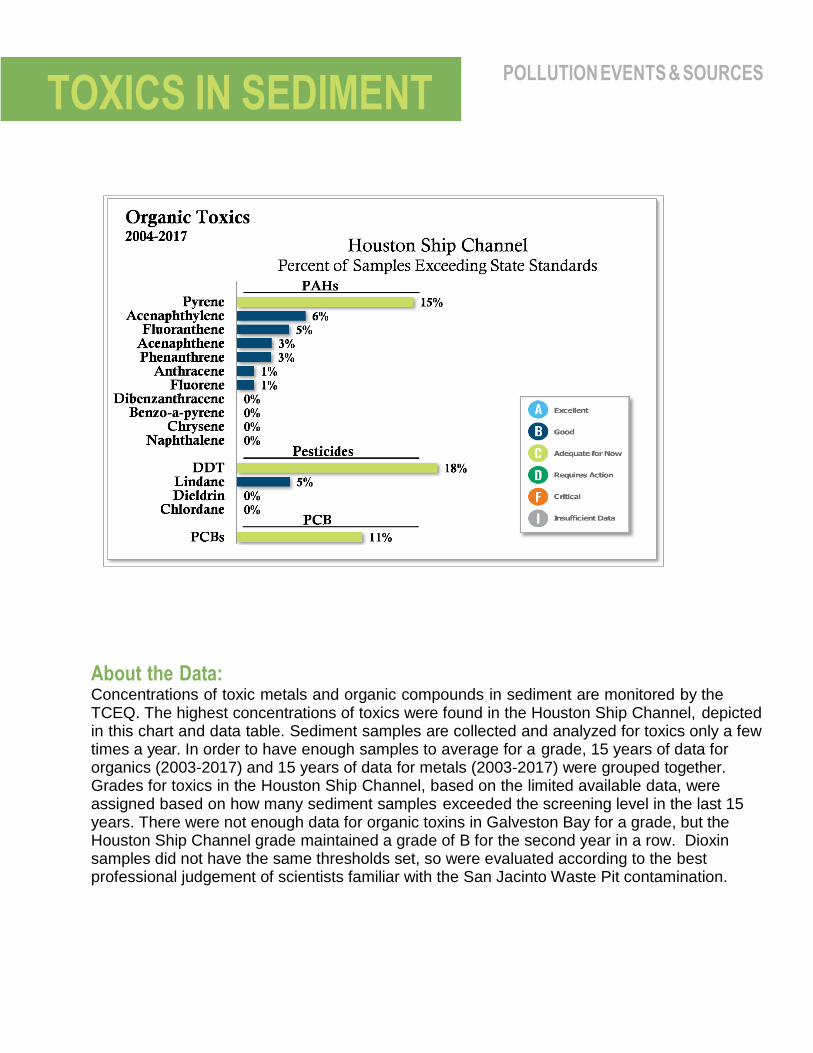
About the Data: Concentrations of toxic metals and organic compounds in sediment are monitored by the TCEQ. The highest concentrations of toxics were found in the Houston Ship Channel, depicted in this chart and data table. Sediment samples are collected and analyzed for toxics only a few times a year. In order to have enough samples to average for a grade, 15 years of data for organics (2003-2017) and 15 years of data for metals (2003-2017) were grouped together. Grades for toxics in the Houston Ship Channel, based on the limited available data, were assigned based on how many sediment samples exceeded the screening level in the last 15 years. There were not enough data for organic toxins in Galveston Bay for a grade, but the Houston Ship Channel grade maintained a grade of B for the second year in a row. Dioxin samples did not have the same thresholds set, so were evaluated according to the best professional judgement of scientists familiar with the San Jacinto Waste Pit contamination.

POLLUTION EVENTS & SOURCES
TOXICS IN SEDIMENT
Grading scale The grading scale for toxics was developed as part of the Galveston Bay Indicators
Project, by HARC in 2005 based on the best professional judgment of a group of
scientific experts. It is more conservative than the quintile scale for water quality
indicators because of the relative danger of toxics compared to other substances and
the persistence of toxics in the environment.
Grade Percent of Samples Above Screening Level
A 0%
B 1-9%
C 10-24%
D 25-49% F >50%
I (Insufficient Data)
Don’t Leave a Toxic Legacy
• Always dispose of household hazardous wastes properly.
• Ask your local waste disposal provider about hazardous waste recycling events.
• Help protect the seafood supply for future generations by cleaning up and helping to
prevent toxic pollution today.
The presence of dangerous toxic chemicals in fish and shellfish have led to the
establishment of Seafood Consumption Advisories. These advisories warn against the
consumption of seafood from certain portions of the Galveston Bay system. Cleaning
up and preventing toxic pollution today will protect our seafood supply for future
generations. Read more about Seafood Consumption Advisories here.
Additionally, always dispose of household
hazardous wastes properly. Ask your local
waste disposal provider about hazardous
waste recycling events, and learn more about
what you can do to minimize environmental
impacts from your household wastes.
Learn more.
Photo by Katie Gillis

POLLUTION EVENTS & SOURCES
• Oil spills pollute the air, land, and water
• Oil spills pose a significant threat to vital Bay animals and their habitat.
When spilled in water, the lightest components of oil evaporate and become air pollution.
Heavier components may float and combine into balls of tar that wash up in shoreline
habitats. Meanwhile, the heaviest components sink to the bottom, where they can
damage benthic animals like oysters — the organisms that live on or in the
Bay sediment.
Galveston Bay Oil Spill Grades: Number of Spills – B (Good) Volume Spilled – A (Excellent)
Texas' Oil Spill Prevention and Response program is world-renowned for its proactive
and preventive initiatives to keep oil out of our water. However, on average, 238 oil
spills have still been reported every year in Galveston Bay since 2003. Most spills are
small—less than five gallons—while some are large, such as a September 2016
shipping vessel incident that released 88,000 gallons of diesel fuel into the Houston
Ship Channel. The total number of spills has declined since 2004 and earned a grade of
B. In 2017, there were no large oil spills, leading to a grade of A for volume spilled.
Photo by Stephen Lehmann

POLLUTION EVENTS & SOURCES
LITTER AND TRASH
See the Data
The Texas General Land Office (GLO) Oil Spill Prevention and Response Program
has gathered data describing oil spills in the segment of the Galveston Bay system since
1998. Oil spills are self-reported to the GLO and are listed as facility spills, vessel spills,
or unknown/other. The report card compares the number and volume of total spills,
facility spills, and vessel spills in 2017 to the average number of spills between 2003 and
2016.

POLLUTION EVENTS & SOURCES
Grading Scale The grading scale for oil spills was developed by creating a “baseline” using a historical
segment of available data and comparing the values for 2017 to that baseline. Since less
oil spilled into the environment is the desired outcome, a reduction in the frequency of
spills and volume of oil spilled (values less than 100 percent) receives a higher grade,
and an increase in the frequency of spills and volume of oil spilled (values above 100
percent), receives a lower grade.
Grade Percent of Samples Exceeding Screening Level
A 0-49%
B 50-89%
C 90-110%
D 111-150%
F >151%
Keep Oil Out
• If you see oil, report it to the Texas General Land Office (GLO) Oil Spill Planning and
Response Toolkit: 1-800-832-8224.
• Avoid eating fish, shrimp, or crabs that either have a chemical smell or taste, or come
from areas where oil is present.
• Learn about the assessment and restoration process following the Deepwater
Horizon oil spill in the Gulf of Mexico.
Texas’ Oil Spill Prevention and Response program is world-renowned for its proactive
and preventive initiatives to keep oil out of our water. When oil does spill into the water,
the Texas General Land Office (GLO) and U.S. Coast Guard work with the responsible
party to stop, contain, and clean up the spill.
Oil from a spill can significantly impact wildlife in the water — on the surface and on
shore. Of particular concern in Galveston Bay are the impact of oil spills on already
stressed habitats, including oyster reefs. Oysters are an important commercial fishery,
and oyster reefs are a key coastal habitat. Learn more in the Wildlife indicator.
It is always a good idea to avoid eating fish, shrimp, or crabs that have a chemical smell
or taste, or are from areas where oil is present. Lasting impacts of Deepwater Horizon
oil spill in the Gulf of Mexico are still being studied. There are currently no restrictions on
recreational activities due to this incident. Learn more about the assessment,
remediation, and restoration process following the Deepwater Horizon oil spill.
POLLUTION EVENTS & SOURCES
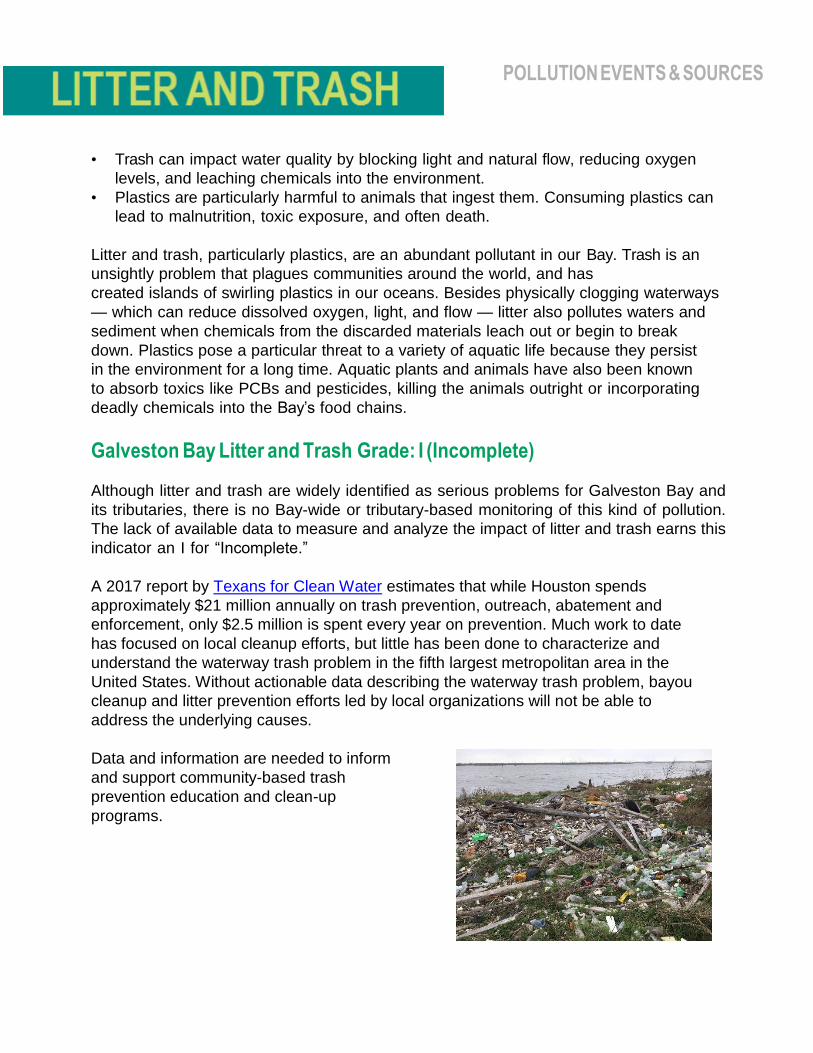
• Trash can impact water quality by blocking light and natural flow, reducing oxygen
levels, and leaching chemicals into the environment.
• Plastics are particularly harmful to animals that ingest them. Consuming plastics can
lead to malnutrition, toxic exposure, and often death.
Litter and trash, particularly plastics, are an abundant pollutant in our Bay. Trash is an
unsightly problem that plagues communities around the world, and has
created islands of swirling plastics in our oceans. Besides physically clogging waterways
— which can reduce dissolved oxygen, light, and flow — litter also pollutes waters and
sediment when chemicals from the discarded materials leach out or begin to break
down. Plastics pose a particular threat to a variety of aquatic life because they persist
in the environment for a long time. Aquatic plants and animals have also been known
to absorb toxics like PCBs and pesticides, killing the animals outright or incorporating
deadly chemicals into the Bay’s food chains.
Galveston Bay Litter and Trash Grade: I (Incomplete)
Although litter and trash are widely identified as serious problems for Galveston Bay and
its tributaries, there is no Bay-wide or tributary-based monitoring of this kind of pollution.
The lack of available data to measure and analyze the impact of litter and trash earns this
indicator an I for “Incomplete.”
A 2017 report by Texans for Clean Water estimates that while Houston spends
approximately $21 million annually on trash prevention, outreach, abatement and
enforcement, only $2.5 million is spent every year on prevention. Much work to date
has focused on local cleanup efforts, but little has been done to characterize and
understand the waterway trash problem in the fifth largest metropolitan area in the
United States. Without actionable data describing the waterway trash problem, bayou
cleanup and litter prevention efforts led by local organizations will not be able to
address the underlying causes.
Data and information are needed to inform
and support community-based trash
prevention education and clean-up
programs.

POLLUTION EVENTS & SOURCES
See the Data
Making Connections
Nonprofit organizations around the Houston-Galveston region taken it upon themselves
to clean up our waterways. In 2017, Buffalo Bayou Partnership’s skimmer boat, litter
booms, and other cleanup initiatives have removed over 2,000 cubic yards of trash and
debris from Buffalo Bayou, its tributaries, and the Port of Houston. Clean-ups like these
are the only large-scale efforts to combat trash in Galveston Bay, in spite of the reports
of trash in the rivers and bayous around Galveston Bay.

POLLUTION EVENTS & SOURCES
Litter is as much about attitude as it is about action. Whether blown by the wind or carried away
by rainwater, most litter eventually finds its way to a body of water like Galveston Bay. Set an example for those around you by practicing tidy habits, like securing your trash and picking up litter when you see it — even if it is not yours.
The EPA estimates that about 13 percent
of municipal waste is made of plastic.*
Plastic poses a particular threat to
wildlife that may ingest it, causing
malnutrition, starvation, injury, or illness
due to toxicity. Join or start a movement
to ban single- use plastic bags, like the
Galveston Chapter of the Surfrider
Foundation, or volunteer to collect
monofilament fishing line for recycling.
Organize a cleanup for your
neighborhood, local park, stream, or
shoreline — or participate in an event like
Trash Bash.
*Source: http://www.epa.gov/osw/conserve/materials/ plastics.htm

WILDLIFE
2018 GALVESTON BAY
REPORT CARD
WWW.GALVBAYGRADE.ORG
#GalvBayGrade18

SUMMARY
• The Bay is home to a variety of animals.
• The Bay’s wildlife species are valued aesthetically,
economically, and for their inherent role in the ecosystem
• Overall, finfish and bird populations are considered
adequate and maintaining, while some shellfish populations
are deteriorating and require action.
Galveston Bay and its watersheds are home to a diverse assemblage of wildlife species.
Some species are economically important to the region. Examples include species of
shellfish — like shrimp, crabs, and oysters — that are harvested and sold to consumers
in restaurants and grocery stores. Other species of animals, like speckled trout and
flounder, are popular for recreational fishermen. Still other species are important
components of the Bay food web (the network of organisms that consume and interact
with one another).
Trends in wildlife populations are great indicators of the health of the Bay. Conservation
and restoration efforts can be evaluated by looking at increases or decreases in the
number of animals found in and around the Bay.
Photo by Andrew Hancock
C
WILDLIFE
Making the Grade Many shellfish species appear to be declining and require protection. While white and brown shrimp populations are holding steady, blue crab populations have experienced a decline, earning shellfish a C grade. With a few exceptions, populations of finfish and colonial waterbirds in Galveston Bay appear to be holding steady. Twelve species of finfish identified as significant for either recreational fishing or food web relationships were found to be maintaining population levels, earning finfish a grade of D. Similarly, the majority of colonial waterbird species monitored earned a C for maintaining populations.
Note: Wildlife population studies and commercial seafood catch studies can reveal
different trends. The Report Card looks at wildlife populations from an ecological
standpoint (focusing on the relation of organisms to one another and to their physical
surroundings). Various market or economic factors that are unrelated to the Bay’s
ecology can impact commercial catch data.
VOLUNTEER:
Help build oyster reefs, participate in bird surveys, and remove debris like abandoned
crab traps.
KNOW THE NESTS:
Get familiar with the popular nesting sites around the Bay — and keep your distance
when birds are present.
REDUCE PLASTIC WASTE:
Keep track of your monofilament fishing line and hooks. Recycle monofilament line at
designated locations. Refuse single-use plastic bags when you shop, and take your own
reusable bags instead.
OBEY REGULATIONS: It is important to following fishing regulations, which are set with
sustainable management of wildlife populations in mind. “Closed” seasons are often vital
to providing a species the opportunity to successfully spawn the next generation, and
catch limits are designed to prevent overfishing. For more information, visit the Texas
Parks and Wildlife Department’s Outdoor Annual site.

WILDLIFE
SHELLFISH
• Life in the Bay is interdependent. All plants and animals are connected through their
roles in the food web.
• Trends in shrimp and crab populations are a good indicator of the quality and quantity
of suitable habitat.
• Shellfish trends are also a good indicator for food availability for the rest of the ecosystem.
Galveston Bay
Shellfish Grade:
D (Requires Action) The species of shellfish analyzed for the report card included blue crabs and two species of shrimp. Blue crab have seen a significant decline, earning a grade of F for 2003-2017. White and brown shrimp appear to be maintaining their population levels. Rapid human population growth in the Galveston Bay/Houston region —
which brings with it increased
recreational and commercial use of the Bay, decreased habitat acreage, and
increased stress on the system as a whole — has had a major impact on shellfish in
Galveston Bay.
See the Data The Texas Parks and Wildlife Department (TPWD) Coastal Fisheries Division conducts
fish surveys using several kinds of equipment: bag seines (nets deployed by hand) for
catching smaller organisms in near-shore environments; bay trawls (nets deployed from
the back of a boat, like on a shrimp boat) for collecting organisms found on or near the
open bay bottoms; gill nets (large nets specialized for catching larger fish) near shore;
and oyster dredges (specialized nets that remove oysters from the bay bottom) for
sampling oyster reefs. The results we have shown are for bay trawl catch per unit effort
(CPUE), which accounts for how long the trawl was deployed for each sample. We
examined how catches for certain commercial, recreational, and important food web
species have changed since 2003.
Photo by Steve Ford
WILDLIFE
SHELLFISH
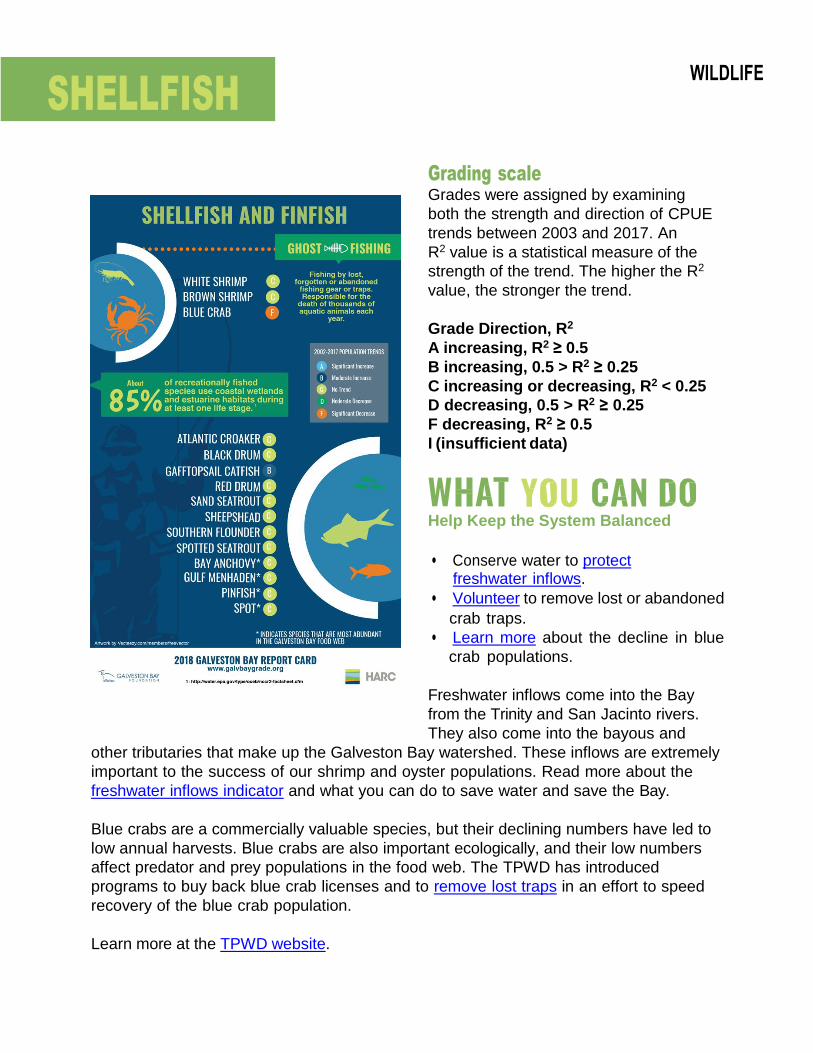
Grading scale Grades were assigned by examining
both the strength and direction of CPUE
trends between 2003 and 2017. An
R2 value is a statistical measure of the
strength of the trend. The higher the R2
value, the stronger the trend.
Grade Direction, R2
A increasing, R2 ≥ 0.5
B increasing, 0.5 > R2 ≥ 0.25
C increasing or decreasing, R2 < 0.25
D decreasing, 0.5 > R2 ≥ 0.25
F decreasing, R2 ≥ 0.5
I (insufficient data)
Help Keep the System Balanced
• Conserve water to protect freshwater inflows.
• Volunteer to remove lost or abandoned
crab traps.
• Learn more about the decline in blue
crab populations.
Freshwater inflows come into the Bay
from the Trinity and San Jacinto rivers.
They also come into the bayous and
other tributaries that make up the Galveston Bay watershed. These inflows are extremely
important to the success of our shrimp and oyster populations. Read more about the
freshwater inflows indicator and what you can do to save water and save the Bay.
Blue crabs are a commercially valuable species, but their declining numbers have led to
low annual harvests. Blue crabs are also important ecologically, and their low numbers
affect predator and prey populations in the food web. The TPWD has introduced
programs to buy back blue crab licenses and to remove lost traps in an effort to speed
recovery of the blue crab population.
Learn more at the TPWD website.
WILDLIFE
FINFISH
• Galveston Bay is home to more than 100 species of finfish.
• Finfish in Galveston Bay make up a significant recreational fishery.
• Finfish populations have held steady since 2003.
The most common finfish species in the Bay include Atlantic croaker, bay anchovy,
species of drum, seatrout, and species of catfish. Compared to shrimp, crabs and
oysters, finfish make up only a small percentage of the commercially harvested seafood
from Galveston Bay. They do, however, make up an economically significant recreational
fishery. They also play an important role in the Bay and Gulf of Mexico ecosystems,
serving as predator and prey for other species.
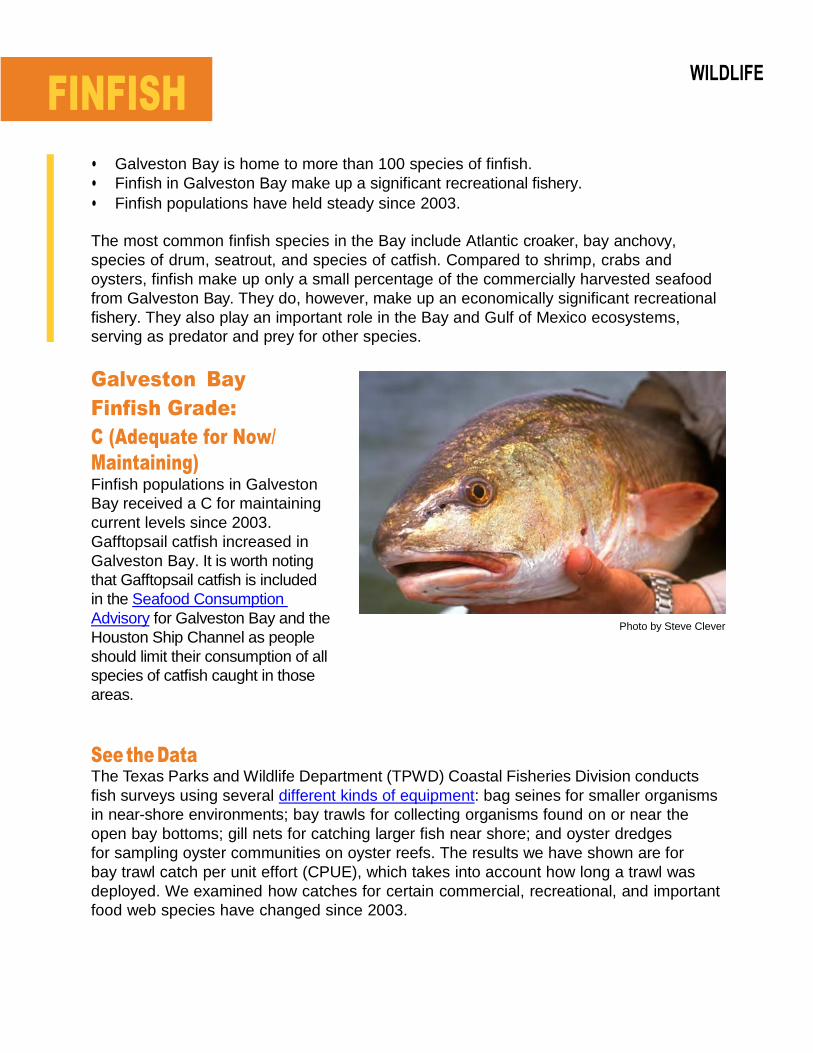
Galveston Bay
Finfish Grade:
C (Adequate for Now/
Maintaining) Finfish populations in Galveston
Bay received a C for maintaining
current levels since 2003.
Gafftopsail catfish increased in
Galveston Bay. It is worth noting
that Gafftopsail catfish is included
in the Seafood Consumption
Advisory for Galveston Bay and the
Houston Ship Channel as people
should limit their consumption of all
species of catfish caught in those
areas.
Photo by Steve Clever
See the Data The Texas Parks and Wildlife Department (TPWD) Coastal Fisheries Division conducts
fish surveys using several different kinds of equipment: bag seines for smaller organisms
in near-shore environments; bay trawls for collecting organisms found on or near the
open bay bottoms; gill nets for catching larger fish near shore; and oyster dredges
for sampling oyster communities on oyster reefs. The results we have shown are for
bay trawl catch per unit effort (CPUE), which takes into account how long a trawl was
deployed. We examined how catches for certain commercial, recreational, and important
food web species have changed since 2003.

WILDLIFE
FINFISH
Grading scale Grades were assigned by examining
both the strength and direction of CPUE
trends between 2003 and 2017. An
R2 value is a statistical measure of the
strength of the trend. The higher the R2
value, the stronger the trend.
Grade Direction, R2
A increasing, R2 ≥ 0.5
B increasing, 0.5 > R2 ≥ 0.25
C increasing or decreasing, R2 < 0.25
D decreasing, 0.5 > R2 ≥ 0.25
F decreasing, R2 ≥ 0.5
I (insufficient data)
Be a Friend to the Fishes
• Protect their habitat. Visit the Habitat page to learn more.
• Reduce pollution and slow your runoff with rain barrels, and use gravel instead of concrete.
• Report any evidence of a fish kill.
Many Bay and offshore fish species
use the wetlands as a nursery for their
young. Protecting critical habitat is vital
to the ongoing success of finfish species in Galveston Bay and in the Gulf of Mexico.
Visit the habitat page for more information.
Fish kills are a frequent occurrence on the Gulf Coast. Most fish kills can be attributed
to our hot climate and high volume of urban runoff, which can cause eutrophic (low
dissolved oxygen) conditions that can cause fish to die. If you see evidence of a fish
kill, you can contact the Texas Parks and Wildlife Kills & Spills Team (KAST) at (281)
842-8100. KAST team members are trained to assess the impacts and to determine the
causes of these events.

WILDLIFE
BIRDS
• Colonial waterbirds are heavily dependent on the quality and availability of nesting and
feeding habitat. This makes them an excellent indicator of the Bay’s overall health.
• The bird populations also depend on the populations of shellfish, finfish, and other
organisms for food.
• Most bird populations in Galveston Bay have held steady since 2003.
Galveston Bay Bird Grade: C (Adequate for Now/Maintaining) Bird populations in Galveston Bay received a C. Most populations monitored by the Texas
Colonial Waterbird Society (TCWS; a coalition consisting of Audubon Texas, Coastal
Bend Bays and Estuaries Program, Texas A&M University – Kingsville, Texas General
Land Office, Texas Parks & Wildlife Department, The Nature Conservancy, U. S. Fish
and Wildlife Service, U. S. National Park Service, and volunteers) have not shown either
increases or decreases since 2003. Notable exceptions include a decline in black-
crowned heron, a moderate increase in laughing gull, and a significant increase in
populations of brown pelican. Colonial waterbirds are widely distributed along the Texas
Coast. Declines of a species in one Bay system may be offset by increases in that
species in other Texas estuaries.
See the Data Texas Colonial Waterbird surveys are conducted each year by staff of participating TWCS
organizations and volunteers in May and June. The survey period corresponds to the
summer nesting season, when colonial waterbird species come to the Texas Coast to
raise their young. The survey estimates the number of nesting pairs
of colonial waterbird species in rookeries or colonies along the Texas coast. This count
excludes waterfowl and
solitary nesters, but
includes herons, egrets,
gulls, terns, ibises and
others. The report card
compiles nesting pair
numbers over all colonies
in the lower Galveston
Bay watershed to assess
trends in abundance for
the last 15 years.
Photo by Gene Fissler

WILDLIFE
BIRDS
Grading scale Grading scale: Grades were assigned by
examining both the strength and direction
of the trend line between 2003 and 2017.
An R2 value is a statistical measure of the
strength of the trend. The higher the R2
value, the stronger the trend.
Grade Direction, R2
A increasing, R2 ≥ 0.5
B increasing, 0.5 > R2 ≥ 0.25
C increasing or decreasing, R2 < 0.25
D decreasing, 0.5 > R2 ≥ 0.25
F decreasing, R2 ≥ 0.5
I (insufficient data)
Keep an Eye Out for Birds
• Join Houston Audubon for birding,
advocacy, conservation, and education.
• Support legislation that prioritizes the
preservation of natural nesting and feeing
habitat for birds.
• Get to know birds’ habitats on the Great
Texas Coastal Birding Trail.
The Texas Coast is a magnet for bird
watchers who come from all over the world to view species of waterbirds, waterfowl,
raptors, and migratory songbirds. Houston Audubon is a great resource for birding in
the Galveston Bay area, covering an 11-county region (which includes 17 sanctuaries).
Audubon’s mission is to advance the conservation of birds and positively impact their
supporting environments. The organization offers a variety of advocacy, conservation and
educational programs, as well as volunteer opportunities.
The Great Texas Coastal Birding Trail is a state-designated system of trails, bird
sanctuaries, and nature preserves along the entire length of the Texas Gulf Coast. Maps
are available online to guide you to the location of bird colonies, rookeries, and great
birding habitat.

WILDLIFE
INVASIVE SPECIES
• Invasive species are species of plants, animals, fungi and microbes that come from other parts of the world and when introduced to new areas such as the Galveston Bay watershed, spread to a degree that causes environmental, economic or social harm.
• Invasive species degrade natural ecosystems, are destructive to infrastructure resulting in economic losses, and negatively impact outdoor recreational activities including boating, fishing, and hunting.
• Once introduced to new areas, invasive species are often very difficult and expensive
to control and can be detrimental to crops, fisheries, forests, and other natural resources.
Therefor prevention of new introductions is key to stopping the spread of invasive species.
• The 84th Texas legislature approved $6.5 million to address the management of aquatic
invasive species state-wide.
Galveston Bay
Invasive Species
Grade: B (Good)
Invasive species in the waters of
Galveston Bay received a grade of B. Unlike
some other bay systems around the country,
Galveston Bay does not have a large invasive
species problem. The rivers and bayous flowing
into the Galveston Bay watershed, however,
earned a grade of D as there are multiple
invasive species that have become established
and are causing problems in the Galveston Bay
watershed and waterways. Invasive species
include water hyacinth, Chinese tallow, grass carp, armored catfish, fire ants and the new-to-
Texas zebra mussel, an invasive species documented previously in the Great Lakes and
Mississippi River watershed. While there is no designated monitoring program for invasive
species in the State of Texas, resource managers and citizen scientists around the state do
what they can to report and track the spread of invasive plants and animals. Aquatic invasive
species are reported to a national database maintained by the United States Geological Survey
(USGS). The Ladybird Johnson Wildflower Center’s Texas Invasives Program maintains a
database of invasive plants and pests reported in Texas. Invasive species regulation in Texas is
overseen by the Texas Parks and Wildlife Department and the Texas Department of Agriculture
with both agencies mainlining lists of prohibited species.
Photo by Earl Chilton, TPWD
WILDLIFE
INVASIVE SPECIES
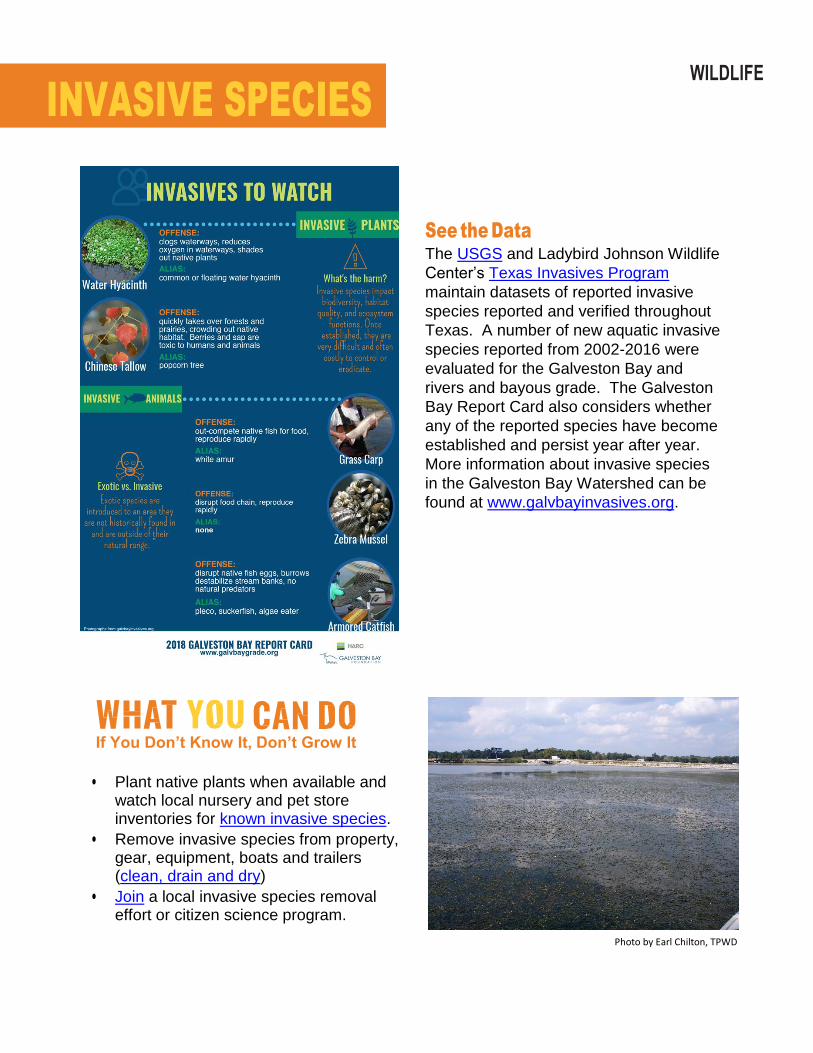
See the Data The USGS and Ladybird Johnson Wildlife
Center’s Texas Invasives Program
maintain datasets of reported invasive
species reported and verified throughout
Texas. A number of new aquatic invasive
species reported from 2002-2016 were
evaluated for the Galveston Bay and
rivers and bayous grade. The Galveston
Bay Report Card also considers whether
any of the reported species have become
established and persist year after year.
More information about invasive species
in the Galveston Bay Watershed can be
found at www.galvbayinvasives.org.
If You Don’t Know It, Don’t Grow It
• Plant native plants when available and watch local nursery and pet store inventories for known invasive species.
• Remove invasive species from property, gear, equipment, boats and trailers (clean, drain and dry)
• Join a local invasive species removal effort or citizen science program.
Photo by Earl Chilton, TPWD

HABITAT
2018 GALVESTON BAY
REPORT CARD
WWW.GALVBAYGRADE.ORG
#GalvBayGrade18
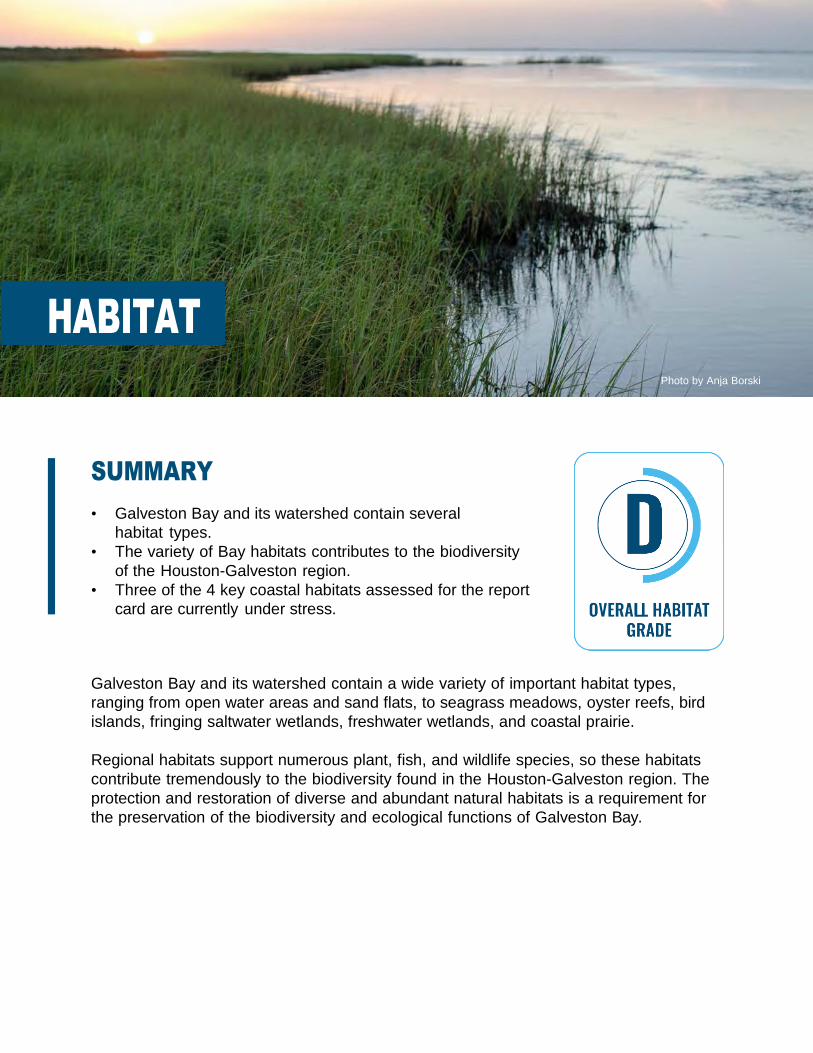
SUMMARY
• Galveston Bay and its watershed contain several
habitat types.
• The variety of Bay habitats contributes to the biodiversity
of the Houston-Galveston region.
• Three of the 4 key coastal habitats assessed for the report
card are currently under stress.
Galveston Bay and its watershed contain a wide variety of important habitat types,
ranging from open water areas and sand flats, to seagrass meadows, oyster reefs, bird
islands, fringing saltwater wetlands, freshwater wetlands, and coastal prairie.
Regional habitats support numerous plant, fish, and wildlife species, so these habitats
contribute tremendously to the biodiversity found in the Houston-Galveston region. The
protection and restoration of diverse and abundant natural habitats is a requirement for
the preservation of the biodiversity and ecological functions of Galveston Bay.
Photo by Anja Borski

HABITAT
The various habitats found within Galveston Bay’s watershed also provide goods (like
seafood) and services (such as storing nutrients and cleaning water) that enhance and
support the quality of life for people living and working in our region. Protecting and
restoring habitat is vital to the future health of the Bay and the area’s residents.
Making the Grade Many of the habitats in Galveston Bay and its watershed are under stress. Freshwater
wetlands, oyster reefs and underwater grasses (seagrass) have seen significant
declines over the years, while some habitats, such as fringing saltwater wetlands around
the Bay, are beginning to benefit from the successes of regulatory protection and
restoration efforts. Collecting accurate habitat data takes time and considerable effort.
As a result, it is often not possible to gather new habitat data on a yearly basis. Data
describing wetland habitats are supposed to be updated every five years; the next
update of that dataset was expected in late 2016, but has not been updated for Texas,
leading to a grade of I. Data describing the extent of habitats including oyster reefs and
underwater grasses are gathered by state agencies such as the Texas Parks and
Wildlife Department are being processed. The Galveston Bay Report Card habitat
grades will be updated as new data are obtained.
VOLUNTEER: Restore habitat around Galveston Bay by joining an organization or taking
part in events such as Marsh Mania, where people plant cordgrass.
STAY INFORMED: Be aware of proposed construction and dredging projects that could
impact natural habitats in and around Galveston Bay. Also, participate by submitting
comments during public review periods. A list of public review documents is available at
the U.S. Army Corps of Engineers Galveston District website.
• Each year, the Galveston Bay Foundation’s Wetland Permit Review Committee
examines approximately 100 public notices from the U.S. Army Corps of Engineers
for wetland permit applications. The committee makes recommendations for
changes or denials when the projects do not appear to meet applicable regulations
or mitigation requirements — or do not represent the least environmentally damaging
alternative. For additional information about the GBF’s Wetland Permit Review
Committee and opportunities to get involved, visit the Galveston Bay
Foundation’s website.
CONSERVE LAND: Private landowners can consider donating land or establishing
conservation easements as two ways to conserve natural resources. These protect
the land from development for perpetuity while retaining ownership. Donors of land
or easements can often take advantage of federal tax incentives for the value of their
donation. Learn more about aquatic habitat conservation here.

HABITAT
WETLANDS
• Wetlands are found at the transition between land and aquatic environments.
• Wetlands are a natural filter for runoff. They also slow tides and storm surges, and
reduce shoreline erosion.
• Saltwater wetland acreage is currently maintaining, but freshwater wetland acreage is
declining.
Found at the transition between land and aquatic environments, wetlands can be salty, brackish,
or fresh, and can be either constantly or intermittently flooded. Wetlands naturally filter polluted
runoff coming from land, storing and processing nutrients as they flow toward the Bay. Wetlands
also serve as a buffer for tides and storm surges, reduce shoreline erosion, and offer
recreational opportunities. Biologically, wetlands are an important source of nutrients for the
aquatic food web, and they serve as an important habitat for many species of fish, birds, and
other wildlife, especially those in juvenile stages of life.
Overall Saltwater Wetlands
Grade: I (Insufficient Data)
Overall Freshwater Wetlands
Grade: I (Insufficient Data)
Between 1953 and 1989, the
Galveston Bay watershed lost more
than 30,000 acres of freshwater and
saltwater wetlands. In just 15 years
(1996 to 2010), the Galveston Bay
system lost an additional 365 acres of
saltwater wetlands and 13,538 acres of freshwater wetlands (a total of 13 percent of all wetlands)
to development. In order for wetlands to effectively prevent flooding, filter water, and provide
habitat for the entire Galveston Bay system, they need to be present all around Galveston Bay.
The disappearance of wetlands from a large portion of Galveston Bay means that our area is
more vulnerable to flooding and water quality issues. Wetlands are an extremely valuable and
threatened resource, and keeping track of our region’s wetlands is vital to their protection.
Wetland coverage maps are usually released by NOAA (National Oceanic and Atmospheric
Administration) every five years, but have not been updated for Texas since 2010, leading to a
another year of I for incomplete in 2017.
Some wetlands are difficult for the average person to identify; they may not look “wet” all of the
time. But that doesn’t mean that they aren’t valuable. There are two major categories of
wetlands around Galveston Bay. One type, called saltwater or fringing wetlands, occurs where
saltwater from the ocean mixes with freshwater from land. The second type, called freshwater
or palustrine wetlands, are found further inland, often embedded in coastal prairie or forested
habitats.

HABITAT
WETLANDS
Runoff from impervious surfaces like concrete parking lots and roads can alter the plant
community and impact the basic services provided to animals that rely on wetland
habitats. Wetlands can be permanently damaged by disturbances such as clearing and
draining, the placement of permanent and temporary structures, and driving vehicles
through soft soils.
Under the Clean Water Act, construction in, and alteration of, saltwater wetlands requires
a permit, and is regulated by the U.S. Army Corps of Engineers. But many freshwater
wetlands remain unprotected from development, and continue to be lost at a greater rate
than which they are being restored or preserved.
See the Data
Saltwater wetland loss by subwatershed graphic legend:
Subwatersheds of Galveston Bay are shaded according to wetland loss grade. Saltwater
wetlands are located on the fringe of tidal waters and land. The wetland maps only show
wetland loss between 1996 and 2010. Wetlands lost before 1996 are not shown.
Freshwater wetland loss by subwatershed graphic legend:
Subwatersheds of Galveston Bay are shaded according to wetland loss grade.
Freshwater wetlands include prairie potholes, freshwater swamps, wetlands along
nontidal rivers and streams, and seasonal wetlands. The maps only show wetland loss
between 1996 and 2010, while wetlands lost before 1996 are not shown.

HABITAT
WETLANDS
Wetland coverage was calculated using the National Oceanic and Atmospheric
Administration (NOAA) Coastal Change Analysis Program (C-CAP) data set. Change
from wetland to developed land uses (residential and commercial development)
between 1996 and 2010 was used to calculate percent of wetland loss. As there is no
comparable baseline to use for historic wetland loss, percent of wetland loss and
percent of developed land in the subwatershed were averaged to come up with a
composite wetland loss grade for each subwatershed.
Grading scale We created our composite wetland loss grading scale after consulting with coastal and
wetland scientistsand considered the impact of wetland loss on the Galveston Bay
system as a whole.
Grade % Loss
A 0%
B 1-9%
C 10-25%
D 26-50%
F 51-100%
I Incomplete
Choose Conservation
• Join a wetland restoration effort.
• Stay informed about development projects that threaten wetlands.
Flooding and water quality affects all citizens of the Galveston Bay region; therefore,
wetland loss does too. Wetland loss is a serious issue around the United States. In 1988,
President George H. W. Bush adopted a national goal of “no net loss” of wetlands. That
goal continues, but every year more wetlands are lost, mostly to development.
HARC engaged in a study of the long-term status of wetland permit and mitigation
activities in the Lower Galveston Bay watershed. The goal of the study is to determine
how to better bridge the gap between development, land use permitting decisions made
by local governments, the federal wetland permitting process, and regional habitat
conservation goals.

HABITAT
UNDERWATER GRASSES
• Underwater grasses grow in shallow, clear water.
• Underwater grasses are an important habitat for juvenile species of fish and shellfish.
• The acreage of seagrass habitat has significantly declined.
Underwater grasses, or seagrasses, grow in shallow areas of the Bay with clear water.
This lets light penetrate the surface, allowing the grass to perform photosynthesis. Like
wetlands, seagrass beds are an important habitat for juvenile species of fish
and shellfish.
Photo by Anja Borski
Overall Underwater Grasses Grade: C
(Adequate for Now) Underwater grasses have largely disappeared from
Galveston Bay, with the exception of Christmas Bay.
In 1996, the Galveston Bay Plan set a goal of 1,400
acres of seagrass restoration within 10 years. Since
1996, 2,218 acres of seagrass have been restored
in the Galveston Bay system, but another 342 acres
have been lost,
resulting in a net gain of 1876 acres of seagrass in Galveston Bay since 1996. The
goal set by the Galveston Bay Plan for 2006 has been achieved, but a new goal for
Galveston Bay is needed.. We hope that continued restoration efforts and improving
water quality, will help this valuable habitat recover.
See the Data The Texas Parks and Wildlife
Seagrass Viewer shows the current
extent of seagrasses in coastal
Texas bays, including Galveston
Bay. In order to grade Galveston
Bay’s seagrass acreage, we used
the TPWD’s seagrass map. We also
added acreage near Carancahua
Cut using new aerial photographs
provided by the Galveston District of
the U.S. Army Corps of Engineers.
We then compared the total current
seagrass coverage to the Galveston
Bay Plan’s goal of 1,400 acres of
restored seagrass.

HABITAT
UNDERWATER GRASSES
Grading scale We based our underwater grasses grading scale on the percent of
restoration achievement.
Grade % Restoration
A 81-100%
B 61-80%
C 41-60%
D 21-40%
F 0-20%
I Incomplete
Keep the Water Clear
• Prevent nutrient pollution by using rain barrels, picking up after your pets, and
following fertilizer directions carefully.
• Be a responsible boater and never allow propellers or paddles to come into contact
with seagrass beds.
• Speak up for responsible dredging practices.
Underwater grasses are an excellent indicator of ecosystem health, since so many
factors contribute to their success or failure. For more information about the aspects of
Bay health that impact underwater grasses, be sure to read about water quality issues
like poor water clarity caused by too much nitrogen and phosphorus; salinity changes
due to variability in freshwater inflows; and habitat loss due to sea level rise.
Progress has been made in recent years to move away from old practices of open-bay
disposal. These practices deposited dredge material on valuable underwater habitats
like seagrass meadows and oyster reefs. Today, a network of partners around the region
works to identify dredge disposal locations that support beneficial uses in Galveston
Bay. Dredge material is tested and used to restore habitats such as bird islands, as well
as associated habitats, such as sand flats and wetlands.
Learn more about seagrass in Texas and access educational materials about seagrass-
friendly boating.

HABITAT
OYSTER REEFS
• Oysters filter silt and contaminants from Galveston Bay, improving water quality
and clarity.
• Galveston Bay was once filled with oyster reefs, but only a fraction remains due to
the overharvesting of oyster shells, damaging storms, drought, fishing pressure,
and disease.
• The most recent oyster reef maps available are outdated (1994), and the current
status of oysters cannot be evaluated, so the grade for oyster reefs is an I
for Incomplete.
As generations of oysters grow on
top of each other, they form reefs
that provide habitat for many other
animals. Oysters are capable of
filtering as much as 50 gallons of
water each in a single day, removing
silt and contaminants from the
water, and improving local water
quality and clarity. Galveston Bay
was once filled with oyster reefs,
but we only have a fraction of them
left because of the overharvesting
oyster shells for construction
material (a practice that is now
prohibited), damaging storms, fishing pressure, and disease.
Photo by Chris Kuhlman
Galveston Bay oysters are also an important commercial fishery. Oysters are monitored
closely for signs of stress because of changes in salinity (the salt content of the water).
These changes occur due to fluctuations in the amount or timing of freshwater flowing
from the Trinity and San Jacinto rivers, especially during times of drought. Prolonged
periods of saltier water can cause predators and parasites to overwhelm oysters’ natural
defenses. The good news is that because of their biological and economic importance, a
lot of work is being done to restore oyster reefs in Galveston Bay.
Overall Oyster Reefs Grade: I (Incomplete) Historically, oyster reefs in Galveston Bay covered large areas, especially near Red Fish
Bar (which once extended across the middle of the Bay, from Eagle Point to Smith Point),
in East Bay, and in West Bay. Oyster reef area has decreased over the last decade due to
three primary factors: coastal storm surges, drought, and fishing pressure.
Fishing pressure for oysters has increased along with oyster’s popularity on restaurant
menus. In an effort to keep oysters from being overharvested and disappearing from the
Bay completely, the State of Texas stopped issuing new commercial oyster licenses in
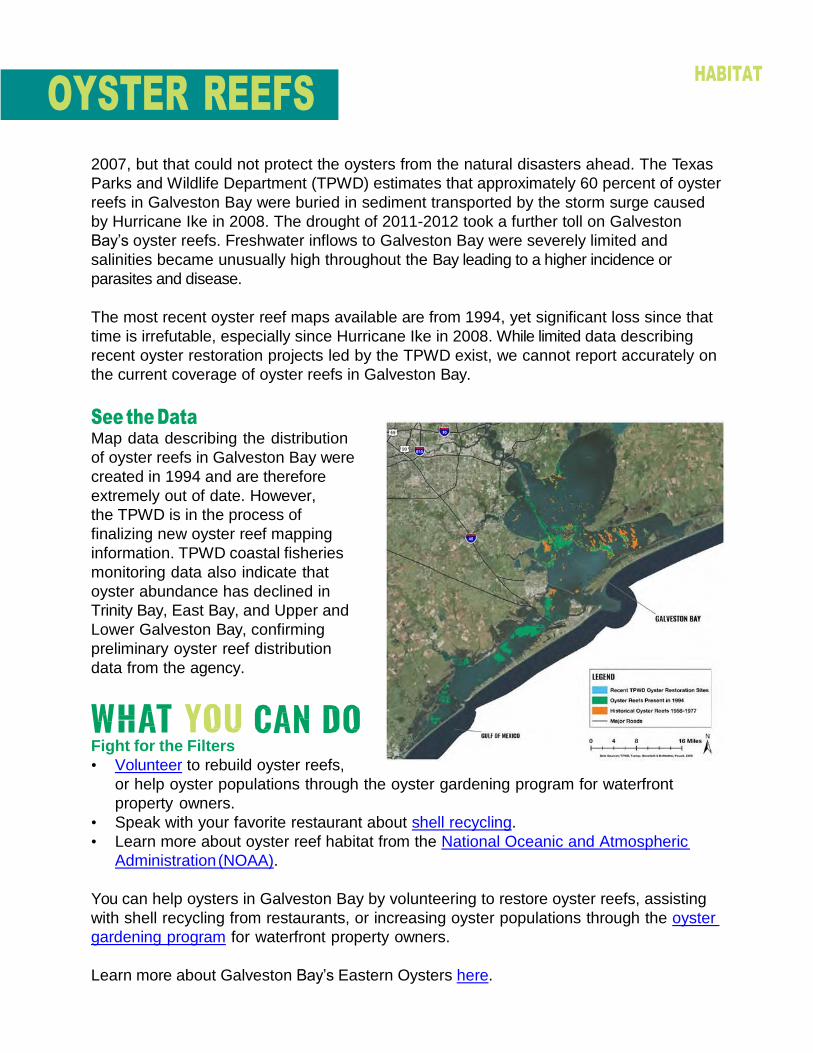
HABITAT
OYSTER REEFS
2007, but that could not protect the oysters from the natural disasters ahead. The Texas
Parks and Wildlife Department (TPWD) estimates that approximately 60 percent of oyster
reefs in Galveston Bay were buried in sediment transported by the storm surge caused
by Hurricane Ike in 2008. The drought of 2011-2012 took a further toll on Galveston
Bay’s oyster reefs. Freshwater inflows to Galveston Bay were severely limited and
salinities became unusually high throughout the Bay leading to a higher incidence or
parasites and disease.
The most recent oyster reef maps available are from 1994, yet significant loss since that
time is irrefutable, especially since Hurricane Ike in 2008. While limited data describing
recent oyster restoration projects led by the TPWD exist, we cannot report accurately on
the current coverage of oyster reefs in Galveston Bay.
See the Data Map data describing the distribution
of oyster reefs in Galveston Bay were
created in 1994 and are therefore
extremely out of date. However,
the TPWD is in the process of
finalizing new oyster reef mapping
information. TPWD coastal fisheries
monitoring data also indicate that
oyster abundance has declined in
Trinity Bay, East Bay, and Upper and
Lower Galveston Bay, confirming
preliminary oyster reef distribution
data from the agency.
Fight for the Filters
• Volunteer to rebuild oyster reefs,
or help oyster populations through the oyster gardening program for waterfront
property owners.
• Speak with your favorite restaurant about shell recycling.
• Learn more about oyster reef habitat from the National Oceanic and Atmospheric
Administration (NOAA).
You can help oysters in Galveston Bay by volunteering to restore oyster reefs, assisting
with shell recycling from restaurants, or increasing oyster populations through the oyster
gardening program for waterfront property owners.
Learn more about Galveston Bay’s Eastern Oysters here.

HUMAN HEALTH RISKS
2018 GALVESTON BAY
REPORT CARD
WWW.GALVBAYGRADE.ORG
#GalvBayGrade18

SUMMARY • Many types of Galveston Bay seafood are safe to eat,
however toxic contamination in the Bay has led to seafood
consumption advisories for some species in certain areas.
• Streams and bayous that flow into the Bay frequently
have high levels of bacteria that indicate the presence
of microorganisms that can make humans sick via
consumption of oysters or contact with water.
• The Clean Water Act of 1972 initiated great improvements
to Galveston Bay. However, today’s advisories indicate that
there’s work to be done.
In the early 1970s, the Clean Water Act set a national goal for the country’s bodies
of water to be swimmable and fishable. However, toxic and bacterial contamination
in Galveston Bay has triggered the implementation of advisories concerning the
consumption of certain kinds of seafood, and limits oyster harvesting in specified
locations. When pollution such as oil or chemicals is found in the sediment at the bottom
of the Bay, it can be ingested by animals like fish and crabs. Pregnant women
and children, in particular, who eat those animals then have a higher risk of adverse
health effects.
Photo by Chris Kuhlman

HUMAN HEALTH RISKS
Making the Grade Some areas, especially the bayous upstream of the Bay, are frequently impaired by high
levels of bacteria. That means there may be other bacteria or viruses that can make
swimmers, anglers, or boaters sick if the waters are ingested or come in contact with
an open wound. Great improvements have taken place since the implementation of the
Clean Water Act. But the advisories in place today are evidence that work still needs to
be done to improve conditions so that future generations can continue to swim and fish
in Galveston Bay.
Keep Galveston Bay Clean OBSERVE SEAFOOD ADVISORIES
• Many types of Galveston Bay seafood — including fish, shrimp, crabs, and oysters
are safe to eat. But toxic pollutants or bacteria can pose a threat to human health
when they accumulate in the tissues of the animals we eat.
• Children and pregnant women are at the greatest risk for illness from
contaminated seafood.
• Avoiding or limiting consumption of species included in the advisories, and varying
the location and type of seafood you eat, are easy ways to lower your risk from
contaminated seafood. Learn more.
CEASE THE GREASE
• Fats, oils, and grease (FOG) poured down the sink can condense and clog pipes and
sewer lines below our feet. About 50 percent of sewer overflows are caused by FOG,
which release untreated sewage into the environment and pollute Galveston Bay with
harmful bacteria.
• The Galveston Bay Foundation’s Cease the Grease program aims to educate people
on the issue. Learn more.
BOAT CLEANLY
• Sewage from boats is one of the primary sources of fecal bacteria in Galveston Bay.
In spite of having several pump-out facilities in the area, many boaters continue
to dump raw sewage directly into our waters due to a lack of enforcement and
understanding about the potential impacts.
• The Galveston Bay Foundation’s Pump Don’t Dump program aims to educate boaters
about the issue. Learn more.
MAINTAIN SEPTIC TANKS
• If your home is not connected to a municipal sewer, you will have a septic tank, or
on-site sewage facility (OSSF). It is important to ensure that your OSSF is functioning
properly to avoid contaminating the environment with harmful bacteria. Learn more.

SEAFOOD CONSUMPTION
• Toxic contaminants enter the food web through biomagnification — the progressively
increasing concentration of toxic substances such as polychlorinated biphenyls
(PCBs) or mercury as they move up the food chain.
• Approximately 50 percent of Galveston Bay is currently classified as a prohibited or
restricted harvest zone for oysters, indicating a significant risk to human health.
• The state of advisories in Galveston Bay has not changed significantly in recent
years.
Toxic contaminants work their way into the food web through biomagnification. Plants,
microorganisms, and animals that live in the sediment or on the Bay bottom, absorb
contaminants first. They are consumed in turn by larger organisms, which are consumed
by even larger organisms. Some toxins pass out of the animals’ bodies, but others have
a tendency to accumulate, especially in the fatty tissues.
Bacteria are another topic of concern for seafood, specifically oysters. Bacteria
screening levels set for oyster harvesting are more stringent than those for contact
recreation like swimming, because bacteria can accumulate in oysters and other
shellfish. This makes them unsafe to eat, especially if consumed raw.
Galveston Bay Seafood
Consumption Advisories
Grade: C
(Adequate for Now)
Rivers and Bayous Seafood
Consumption Advisories
Grade: D
(Requires Action) The Texas Department of State Health Services issues Seafood Consumption Advisories. Advisories are updated as new data are made available, and may be issued after a specific incident.
At the time of this report, advisories covered five geographic areas of the Bay, each
having its own set of affected species. Pollutants listed in the advisories include PCBs,
dioxins, and pesticides.
The Seafood Consumption grade in Galveston Bay remains a C because the current
state of advisories has remained stable for several years. We awarded Seafood
Consumption from rivers and bayous a D because advisories in the rivers and bayous
of Galveston Bay increased in 2015 and has not been resolved. We are concerned
Photo by Galveston Bay Foundation

SEAFOOD CONSUMPTION
that limited and irregular funding for testing fish for contaminants may be under-
representing the extent of regional threats to healthy seafood.
The most commonly impaired
use of Texas coastal waters is
“oyster waters use,” or the
areas of the Bay from which
oysters are harvested. While
there are not currently any
consumption advisories for
oysters, approximately 50
percent of Galveston Bay is
classified as prohibited or
restricted harvest zones,
indicating significant risk to
human health. Restrictions
can reflect closures due to
high rainfall and runoff,
extreme weather conditions, oil
or chemical spills, harmful
algal blooms, or the failure or
inefficient operation of
wastewater treatment facilities.
The Texas Commission on
Environmental Quality (TCEQ)
has adopted a Total Daily
Maximum Load (TMDL) for
Galveston Bay’s oyster waters,
a scientifically derived target
that tells us the greatest
amount of a particular
substance that we can add to
a waterway and still keep it
healthy. This helps improve
water quality so that the oyster
beds remain safe for
harvesting.
See the Data Fish samples are collected and
fish tissue is tested for a variety
of contaminants, including
metals, pesticides, PCBs, and
SEAFOOD CONSUMPTION
others. The criteria levels that trigger the issuance of Seafood Consumption
Advisories are meant to protect vulnerable populations, especially children and
women of childbearing age. The advisories also differ depending on the species
caught and their locations. See a full listing of all Texas advisories, bans, and
cancelled orders.
Grading scale The current advisories from the Texas Department of State Health Services represent the
best available data for Galveston Bay. In our best professional judgment, this information
is adequate for the current conditions in the Bay, earning a “C” grade. The rivers and
bayous of Galveston Bay are the areas of greatest concern for seafood contamination.
In 2015, Lake Livingston and parts of Trinity River were added to the list for fish tissue containing elevated levels of dioxins and PCBs.
Watch Out for What You Eat
• Stay informed about and support cleanup efforts that protect the Bay and its bounty,
such as the cleanup of the San Jacinto River Waste Pits.
• Participate in the various workgroups for the Galveston Bay Bacteria Reduction Plan.
• Learn more about Seafood Consumption Advisories and pay attention to where you
fish and what you eat.
Don’t assume that all seafood from Galveston Bay is unsafe to eat. Galveston Bay’s
commercial fishery is the most productive of all the bays in Texas, and the vast majority
of seafood harvested from Galveston Bay is safe to eat. Recreational fishermen harvest
prized seafood species such as flounder, red drum, and speckled trout. Consult the
Seafood Consumption Advisories for advice about which species to avoid from certain
areas of the Bay.
The U.S. Environmental Protection Agency is overseeing the cleanup of the San Jacinto
River Waste Pits (SJRWP), where the Champion Paper mill dumped waste in the 1960s.
The SJRWP, located where the mouth of the San Jacinto River and I-10 cross, east
of Houston, are a source of dioxins in Galveston Bay. Dioxins cause increased risk of
cancer and other threats to human health, including liver damage and birth defects.
In an effort to address bacteria impairments, the Galveston Bay Foundation (GBF) has
worked with stakeholder groups and the Texas Commission on Environmental Quality
(TCEQ) to help develop the Upper Gulf Coast Oyster Waters Total Maximum Daily Load
(TMDL) and the Bacteria Reduction Plan. The TMDL determines the amount of bacteria
that Galveston Bay can receive and still support oyster harvesting, and the Galveston
Bay Bacteria Reduction Plan outlines strategies to reduce bacteria levels and improve
the safety of oyster harvesting.

RECREATION
• Bacteria and viruses from the waste of humans, other mammals, and birds that live in
the Bay watershed can cause illness or infection in those who come into contact with
the water.
• Today’s high concentrations of people and pets, and an aging sewage infrastructure,
have resulted in too much bacteria in some regional waterways.
• In 2017, swimming in the Bay remained safe, but swimming in many of the region’s
streams and bayous is discouraged due to recurring high levels of bacteria.
Bacteria and viruses in our waterways can cause swimmers and others who may come
into contact with contaminated water to become ill or suffer from infections. The harmful
microorganisms causing these problems come from humans and other warm-blooded
animals, including both domestic and wild mammals and birds. It is natural to find bacteria
and viruses in the environment. However, today’s combination of high concentrations of
people and pets living along the coast, aging sewer infrastructure, and other changes has
resulted in far more bacteria in waterways than the ecosystem can handle.
Galveston Bay Water Recreation Safety Grade: A (Excellent)
Galveston Bay
Rivers and Bayous Grade:
B (Good)
In 2017, bacteria concentrations exceeded screening levels in only 7 percent of samples
collected from Galveston Bay, indicating that the risk of bacterial infection
while swimming in its open waters remained low yielding the grade of an A. Additionally, the rivers,
streams and bayous grade received a B for the second year in a row. Of the 25 watersheds
included in the Report Card, 5 watersheds saw some improvement compared to last year’s grades.
Nine watersheds saw no change, while four watersheds (Armand-Taylor Bayou, Cedar Bayou,
Clear Cree, and Houston Ship Channel) degraded. A number of watersheds received A’s. However,
swimming in certain rivers, streams, and bayous upstream from Galveston Bay may be
discouraged, as 35 percent of samples collected in these urban and suburban areas still exceeded
screening levels in 2017. Check the map of High Swim Risk Watersheds below.
Photo by Gene Fissler

RECREATION
Water Recreation
Safety Combined
Bacteria graphic legend:
In the map of the Galveston Bay
region, Galveston Bay and its
sub watersheds are colored
according to their grade for bacteria.
A sub watershed is the area of land
where all of the water drains into a
body of water that, in turn, flows into
Galveston Bay. Each Galveston Bay
sub watershed is labeled with its name
(e.g., Buffalo Bayou WS). The water in
the bay, river, or bayou is tested for
bacteria, but the entire sub watershed
is shaded to show the grade since the
bacteria come from the watershed as a
whole.
The water recreation safety grade in
the Galveston Bay Report Card is
based on bacteria levels in water.
Galveston Bay and its rivers and
bayous are monitored by the TCEQ
for recreational safety using bacteria
levels as indicators of human and
animal waste that might cause
disease.

RECREATION
E. coli concentrations were compared to 2010 TCEQ recreational-use, single-sample
screening levels set at 394 colonies/100mL for freshwater segments. Enterococcus
concentrations were compared to 2010 TCEQ recreational-use, single-sample screening
levels set at 89 colonies/100mL for saltwater. Samples collected by the Texas General
Land Office’s Texas Beach Watch Program at Galveston Island State Park, Texas City
Dike, and Sylvan Beach were included in this grade using Texas Beach Watch’s single-
sample screening level of 104 colonies/100 mL. Grades are based on the number of
samples collected in 2017 exceeding the above screening levels.
Grading scale The grading scale for water recreation safety Grade % Exceedance
is based on the quintile-grading scheme A 0-20
used for water quality parameters. B 21-40
C 41-60
D 61-80
F 81-100
I (insufficient data)
Keep Galveston Bay Fun
• Pick up after your pets and properly dispose of pet waste in the trash.
• Volunteer for the Water Quality Monitoring Team.
• Check beach conditions before heading out to play in the Bay.
Water samples tested immediately following rain events often show a spike in bacteria
levels. Storm water can cause wastewater treatment facilities and septic system
overflows. Storm water can also wash animal waste into streams, rivers, bayous, and
the Bay. Investments in wastewater treatment infrastructure are needed to improve water
recreation safety. Also, everyone with pets can do their part by picking up and properly
disposing of animal waste.
The Galveston Bay Foundation’s Water Quality Monitoring Team is composed of more
than 50 volunteers who are specially certified as bacteria samplers. These samplers
collect a small amount of water to be tested for a type of fecal indicator bacteria
(enterococcus). Testing is completed at the Galveston Bay Foundation’s Bacteria
Monitoring Lab by a specially trained volunteer and GBF staff. See their sampling results
and learn about how you could join the team.
Bacteria in Streams and Bayous: See the 2017 Basin Highlights on Basins from the
Houston- Galveston Area Council.
Beach Conditions: When you are thinking about heading out to play in the Bay, check
the Texas General Land Office’s Texas Beach Watch website for the latest bacteria test
results at three locations: Sylvan Beach in La Porte, the Texas City Dike, and the bay side
of Galveston Island State Park.

COASTAL CHANGE
2018 GALVESTON BAY
REPORT CARD
WWW.GALVBAYGRADE.ORG
#GalvBayGrade18

SUMMARY
• Coastal change and resilience of coastal communities to
hazards such as storms, rising sea levels and drought have
become a global priority.
• Although plants and animals are able to adapt to their
ever-changing physical environment, they may not be
able to adapt to rapid changes associated with rising sea
levels, increasing temperatures, acidification of waters, and
declining amounts of freshwater.
• While water temperatures and pH appear to be maintaining,
the rate of sea level rise and increases in human freshwater
use are concerning for the future of the Bay.
Coastal change is emerging as a high priority as communities around the world face
climate-related challenges. Nearly half of the U.S. population lives in coastal areas and
the majority live in urban centers such as the Houston-Galveston metropolitan area. It is
vital that we understand our vulnerabilities to a changing coast and adapt to enhance
resilience in the Houston-Galveston region and along Texas' coastline. Vulnerabilities
for a coastal metropolis often involve our reliance on and proximity to water.
Photo by Port of Houston Authority

COASTAL CHANGE
Making the Grade Water temperature and pH in Galveston Bay have leveled out over the years, but the drought
of 2010-2011 had some significant effects on the ecosystem. Currently, temperature
and pH remain steady. But the high rate of relative sea level rise occurring in
Galveston, and the increasing demands for freshwater due to our expanding
population, cannot be ignored by the more than six million people living in Galveston
Bay’s lower watershed. The combination of subsidence and sea level rise is also
responsible for the loss of thousands of acres of wetland habitat over the last 100
years, further exposing the region to increased flooding from storm surge.
CONSERVE WATER
• Landscaping with native plants and leaving grass clippings on your yard can help you
reduce your outdoor watering.
• On average, the Houston-Galveston area receives more than 50 inches of rain per
year, so monitor the weather and only water to supplement rainfall.
• Installing water-saving appliances, like low-flow showerheads and kitchen faucet
aerators, can add up to significant savings both in your wallet and for the river or
aquifer supplying your city with water.
• Visit the Texas Water Conservation Score Card to see what municipal water suppliers
in your city are doing to save water and to sign a petition urging them to prioritize
water conservation programs in your community.
• Learn to conserve water at your home or business. • Join the Galveston Bay Water Brigade. Enter your pledge to conserve water at home and/or
work and become a Water Brigade Member!
LOWER YOUR CARBON FOOTPRINT
• Reduce vehicle emissions, lessen electricity usage, and recycle whenever possible.
• Carpool to work or school and make fuel efficiency a priority when purchasing your
next vehicle.
USE LESS “STUFF”
• The process of creating, transporting, and throwing away “stuff” uses an immense
amount of energy at every step.
• Reduce the amount of material you buy and consume, reuse and repurpose items
whenever possible, and recycle materials rather than sending them to landfills.
• Watch The Story of Stuff.
BE A CITIZEN SCIENTIST
• Learn how to properly observe signs of coastal change by observing the world
around you and reporting what you find.
• For interest in plants and animals, check out these resources for citizen
science programs.
• For interest in water quality, learn about the Galveston Bay Foundation’s Water
Monitoring Team or become a part of the Texas Stream Team program.

COASTAL CHANGE
FRESHWATER INFLOWS
• The Bay’s health depends on freshwater flowing from the rivers, bayous, and creeks.
• The amount and timing of freshwater inflows are directly related to salinity, available
nutrients, and stabilizing sediment.
• The Bay’s freshwater inflows are maintaining, but increasing water use and climate
variability threaten their future reliability.
Bays and estuaries are bodies of water where freshwater and marine environments mix. The Galveston Bay ecosystem depends upon an adequate amount of freshwater flowing
to it from the Trinity and San Jacinto Rivers, as well as area bayous and creeks. The term
“environmental flow” refers to water flowing in rivers, streams, lakes, and reservoirs, and includes
freshwater inflows to bays and estuaries, as well as to flows in inland
stream systems.
Freshwater inflows are influenced by precipitation (mainly rain) and water use by a growing
human population. Runoff and wastewater effluent from treatment plants make up a significant
percentage of the freshwater flowing into Galveston Bay. It is hard to say exactly how much
freshwater Galveston Bay needs, however. But we do know that the amount and timing of
freshwater flowing into the Bay are directly related to salinity, the availability of nutrients to fuel
the food web, and the availability of sediment that supports Bay habitats.
Galveston Bay Freshwater Inflows
Grade: C (Maintaining)
Galveston Bay received a C for freshwater
Inflows based on 2016 data. The 2017 data have
not been released yet. On average, the Houston-
Galveston region receives 40-50 inches of
rainfall a year. However, the region experienced
an extreme drought between 2010 and 2012,
with extremely dry conditions in 2011. In 2015
and 2016, rainfall rates were again above
average with major flood events in May and April
of those years, respectively. With the end of the drought and two sequential years of higher than
average rainfall, the Bay's rivers, bayous and creeks appear to be maintaining an adequate rate
of flow for now, yielding a C. However, increasing water use and climate variability threatens the
future availability of freshwater inflows in the region.
We need to consider changes now to ensure that freshwater will continue to flow to Galveston Bay. These adjustments should range from cutting daily water use, to better regulation of water resources by the state. Even flood events like those in May 2015 and April 2016 sometimes do not reduce long-term drinking water scarcity or alter long-term conditions in the Bay.
Freshwater inflows from rivers and bayous were drastically reduced during the drought of 2011-
2012, providing insight into what Galveston Bay would look like if starved of freshwater. The
occasional heavy rainstorm might not have a noticeable impact on the salinity of the Bay, but
the prolonged drought did.
Photo by Anja Borski

COASTAL CHANGE
FRESHWATER INFLOWS
See the Data The Texas Water Development Board
(TWDB) produces freshwater inflow
models that take into account the balance
of inflows from rivers and runoff from land,
return flow of wastewater effluent from
treatment plants, water diversion, and rain
and evaporation.
Grading scale The freshwater inflows grade in the
Galveston Bay Report Card is based
on trend analysis of TWDB’s model of
freshwater entering the Bay, and 2016
inflow data compared to a baseline
established by the average freshwater
balance, modeled by the TWDB from
2002-2015.
Conserve Our Freshwater Inflows
• Pledge to save water and save
Galveston Bay.
• Learn how much water can be
saved by making small changes in our
landscaping routines.
• Speak up for the Bay by
participating in state and regional water
planning processes.
Conserving water resources is the easiest and least expensive way to ensure that
freshwater continues to flow to Galveston Bay. Making small changes in our landscaping
routines can save a significant amount of water.
You can speak up for the Bay by participating in state and regional water planning
processes. Region H covers a 15-county area that includes the city of Houston and
much of the lower Galveston Bay watershed. Decisions made by Region H determine
how we allocate water resources for recognized water use categories. Currently, the
environment is not included as a recognized water use, which means there are no
additional environmental flow protections. Stay informed about public meetings and
opportunities to let your voice be heard.
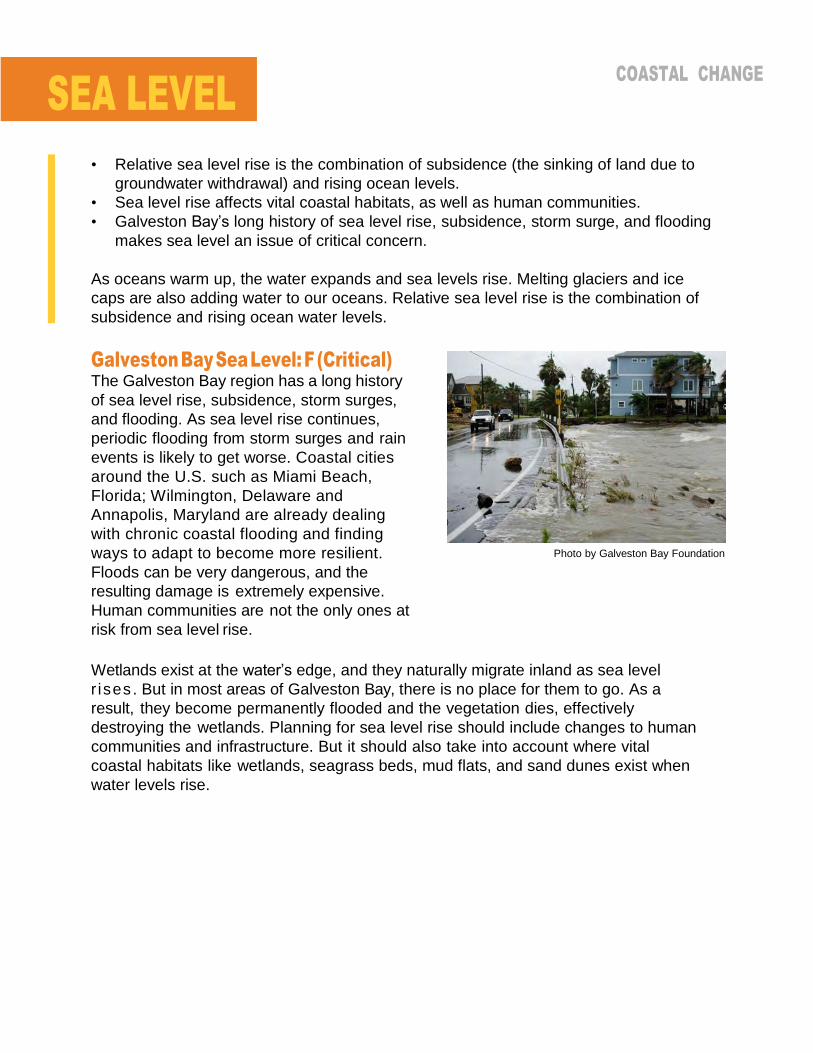
COASTAL CHANGE
SEA LEVEL
• Relative sea level rise is the combination of subsidence (the sinking of land due to
groundwater withdrawal) and rising ocean levels.
• Sea level rise affects vital coastal habitats, as well as human communities.
• Galveston Bay’s long history of sea level rise, subsidence, storm surge, and flooding
makes sea level an issue of critical concern.
As oceans warm up, the water expands and sea levels rise. Melting glaciers and ice
caps are also adding water to our oceans. Relative sea level rise is the combination of
subsidence and rising ocean water levels.
Galveston Bay Sea Level: F (Critical) The Galveston Bay region has a long history
of sea level rise, subsidence, storm surges,
and flooding. As sea level rise continues,
periodic flooding from storm surges and rain
events is likely to get worse. Coastal cities
around the U.S. such as Miami Beach,
Florida; Wilmington, Delaware and
Annapolis, Maryland are already dealing
with chronic coastal flooding and finding
ways to adapt to become more resilient.
Floods can be very dangerous, and the
resulting damage is extremely expensive.
Human communities are not the only ones at
risk from sea level rise.
Photo by Galveston Bay Foundation
Wetlands exist at the water’s edge, and they naturally migrate inland as sea level
r ises . But in most areas of Galveston Bay, there is no place for them to go. As a
result, they become permanently flooded and the vegetation dies, effectively
destroying the wetlands. Planning for sea level rise should include changes to human
communities and infrastructure. But it should also take into account where vital
coastal habitats like wetlands, seagrass beds, mud flats, and sand dunes exist when
water levels rise.

COASTAL CHANGE
SEA LEVEL
See the Data
The National Oceanic and Atmospheric Administration (NOAA) measures the sea level
from Pier 21 on the bay side of Galveston Island. Over the last 100 years, sea level at
Pier 21 has risen more than two feet. At 6.62 mm/year, Galveston has one of the highest-
measured rates of sea level rise in the country.
Grading scale The sea level grade in the Galveston Bay Report Card is based on trend analysis of
sea level rise data from Galveston Pier 21, and 2017 data compared to a baseline
established by the average sea level measured at Galveston Pier 21 from 2003-2016.
Become More Resilient to Rising Sea Level
• Contact your local officials and ask how your community is becoming more resilient
and preparing for a changing coast.
• Protect and restore habitat like wetlands and seagrass.
• Reduce your influence on the extent and rate at which coastal change takes place by
reducing your carbon footprint.
Sunny day flooding — which is when low-lying areas are inundated with seawater during
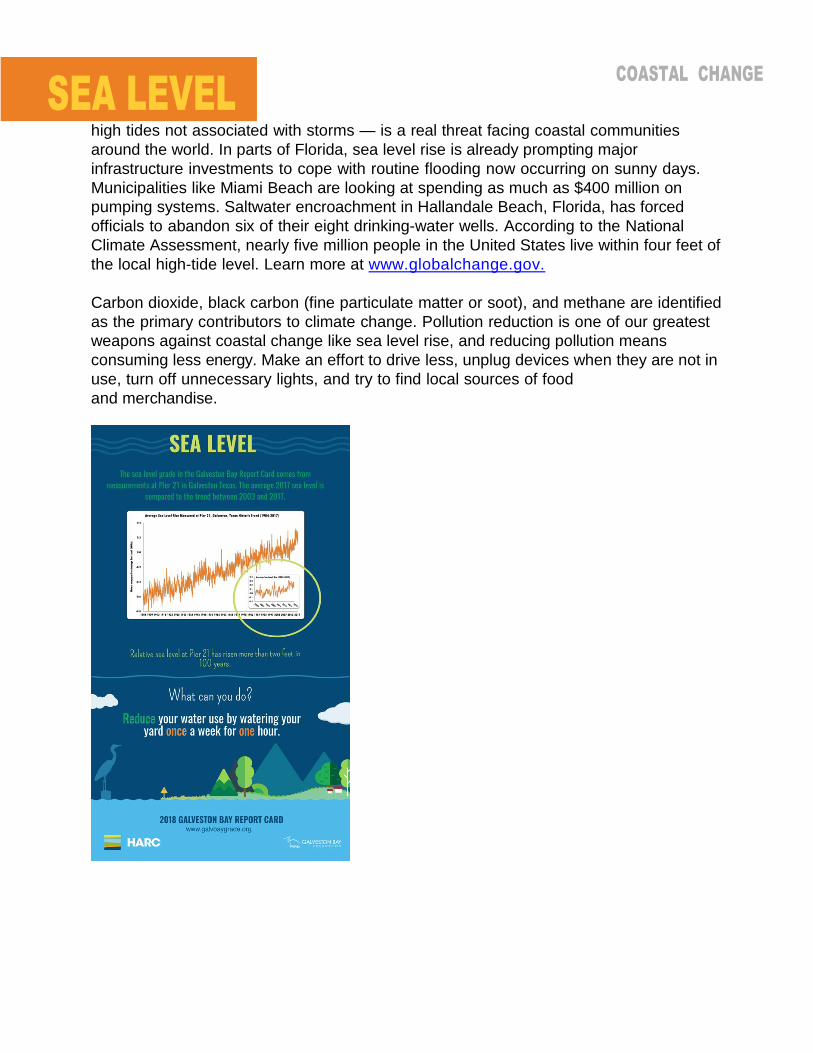
COASTAL CHANGE
SEA LEVEL
high tides not associated with storms — is a real threat facing coastal communities
around the world. In parts of Florida, sea level rise is already prompting major
infrastructure investments to cope with routine flooding now occurring on sunny days.
Municipalities like Miami Beach are looking at spending as much as $400 million on
pumping systems. Saltwater encroachment in Hallandale Beach, Florida, has forced
officials to abandon six of their eight drinking-water wells. According to the National
Climate Assessment, nearly five million people in the United States live within four feet of
the local high-tide level. Learn more at www.globalchange.gov.
Carbon dioxide, black carbon (fine particulate matter or soot), and methane are identified
as the primary contributors to climate change. Pollution reduction is one of our greatest
weapons against coastal change like sea level rise, and reducing pollution means
consuming less energy. Make an effort to drive less, unplug devices when they are not in
use, turn off unnecessary lights, and try to find local sources of food
and merchandise.

COASTAL CHANGE
WATER TEMPERATURE
• Winter water temperatures represent the lowest temperatures that plants and animals
endure in order to live in the Bay.
• As changes in climate impact water temperatures, species of plants and animals
move into new areas where they were not previously found.
• Winter water temperatures in Galveston Bay (from December to February) from 2003
to 2017 did not exhibit an increase.
Winter water temperature represents the
lower range of temperatures that plant and
animal species have to endure to be able to
live in Galveston Bay. The lowest extreme
is important when considering southern
fish, plant, and animal species that might
be moving northward along the Gulf Coast.
If new species can expand into Galveston
Bay due to warming water, they may be able
to outcompete native species and shift the
balance of the Galveston Bay ecosystem.
Galveston Bay Water Temperature: A
(Excellent) There has not been a significant change in
winter water temperatures for the months of
December through February between the years
2003 and 2017, indicating that Galveston Bay
may currently be limited to range expansion of
southern species. Warming trends have been
observed in bays south of Galveston Bay,*
so ongoing monitoring will continue to be an
important component of assessing the impact of
coastal change on the Galveston Bay system.
Photo by Anja Borski
*Tolan, J. M., & Fisher, M. (2009). “Biological response to changes in climate patterns: population increases of gray
snapper (Lutjanus griseus) in Texas bays and estuaries.” Fishery Bulletin, 107(1), 36-43.

COASTAL CHANGE
WATER TEMPERATURE
See the Data
The TCEQ and Texas Parks and Wildlife Department Coastal Fisheries Division collect
water temperature data through their regular monitoring programs.
Grading scale The water temperature grade in the Galveston Bay Report Card is based both on our
best professional judgment of trend analysis of water temperature data, and on 2017
surface water temperature data for December, January, and February, compared to a
baseline established by the average winter water temperatures from 2003-2016.
Help Balance the Bay’s Ecosystem
• Educate yourself on invasive species (species of plants, animals, and microorganisms
that are not native to the region) using the Galveston Bay Area field guides.
• Learn about how changing temperatures affect coastal environments. Water
temperature affects the amount of dissolved oxygen in the water and also tells us
what types of plants and animals are able to live in the estuary.
• Report aquatic invasive species to the Texas Parks and Wildlife Department 1-800-792-4263.
Appearance of new species in Galveston Bay is not always a cause for concern, but
some species are invasive and should be reported.
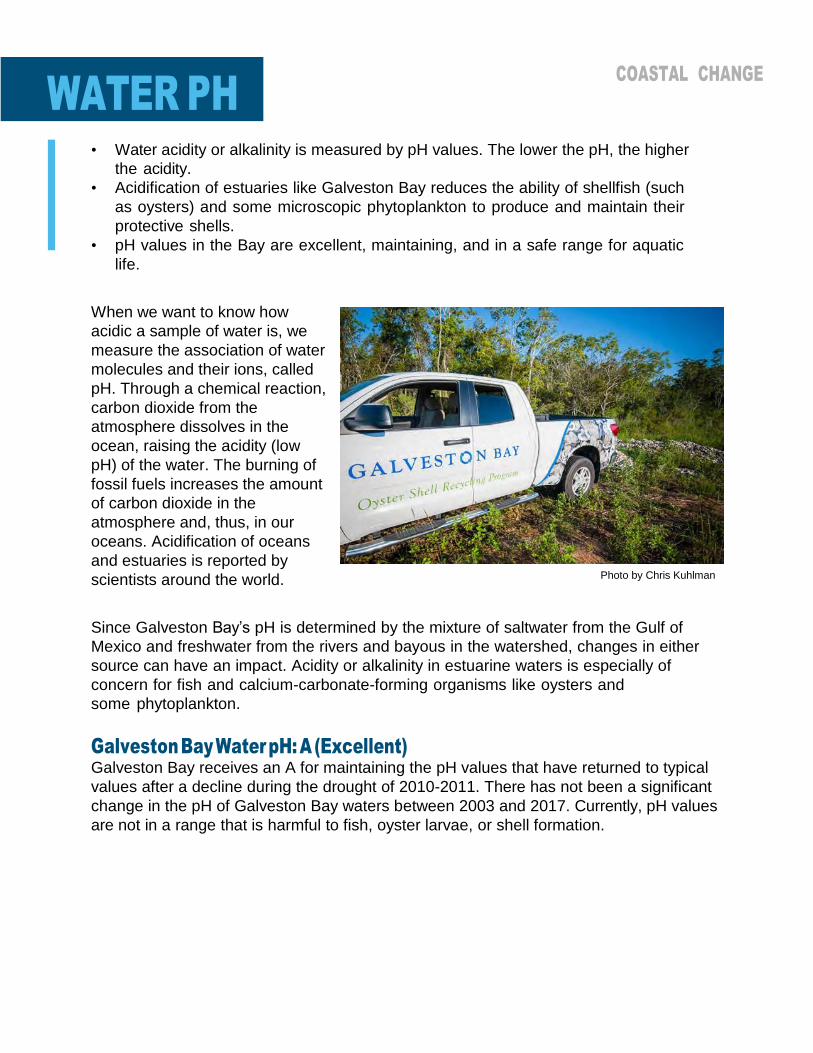
COASTAL CHANGE
WATER PH
• Water acidity or alkalinity is measured by pH values. The lower the pH, the higher
the acidity.
• Acidification of estuaries like Galveston Bay reduces the ability of shellfish (such
as oysters) and some microscopic phytoplankton to produce and maintain their
protective shells.
• pH values in the Bay are excellent, maintaining, and in a safe range for aquatic
life.
When we want to know how
acidic a sample of water is, we
measure the association of water
molecules and their ions, called
pH. Through a chemical reaction,
carbon dioxide from the
atmosphere dissolves in the
ocean, raising the acidity (low
pH) of the water. The burning of
fossil fuels increases the amount
of carbon dioxide in the
atmosphere and, thus, in our
oceans. Acidification of oceans
and estuaries is reported by
scientists around the world.
Since Galveston Bay’s pH is determined by the mixture of saltwater from the Gulf of
Mexico and freshwater from the rivers and bayous in the watershed, changes in either
source can have an impact. Acidity or alkalinity in estuarine waters is especially of
concern for fish and calcium-carbonate-forming organisms like oysters and
some phytoplankton.
Galveston Bay Water pH: A (Excellent) Galveston Bay receives an A for maintaining the pH values that have returned to typical
values after a decline during the drought of 2010-2011. There has not been a significant
change in the pH of Galveston Bay waters between 2003 and 2017. Currently, pH values
are not in a range that is harmful to fish, oyster larvae, or shell formation.
Photo by Chris Kuhlman

COASTAL CHANGE
WATER PH
3
2
See the Data
The Texas Commission on
Environmental Quality (TCEQ)
monitors water pH around
Galveston Bay. Samples were
collected near the water’s surface,
at less than 0.5 meter depth.
Grading scale The pH grade in the Galveston
Bay Report Card is based both on
our best professional judgment of
trend analysis of pH data, and on
2017 surface water pH compared
to a baseline established by the
average pH from 2003-2016.
Reduce Your Carbon Footprint
• Pollution in the air, soil, or directly in the water, can all affect pH. Take steps to reduce
pollution in your daily activities, and report industrial pollution to authorities.
• Learn about the science behind ocean acidification.
• Join the Oyster Shell Recycling Program, which helps the Bay naturally
reduce acidity.
It’s important to note that a seemingly small decrease of 0.1 in pH units actually indicates
a 30 percent increase in acidity.
Seawater is naturally alkaline (it has a high pH, typically between 7.5 and 8.4) because of
the presence of carbonate ions (CO ). Because of this alkalinity, seawater has a buffering
capacity and can absorb large amounts of CO . Prior to the drought of 2010-2011, data
describing pH trends in Galveston Bay showed rising acidity. The one benefit of the
drought is that the declining pH trend has disappeared for now.
Acidification of estuaries reduces the ability of shellfish (such as oysters) to produce and
maintain their protective shells, having a negative impact on this habitat type. Efforts
to return oyster shells to the Bay after harvest help to increase this habitat. The same
is true of efforts to increase populations of oysters in the Bay, like the Galveston Bay
Foundation’s Oyster Shell Recycling Program.
Copyright © 2022 FDOKUMEN