Country Score Card - Columbia SIPA
76
PG. 1 Country Score Card FOR PENCILS OF PROMISE | SIPA CAPSTONE PROJECT | Fall 2016 Faculty Advisor Chip Raymond Team Nicole Qing - [email protected] Gloria Soomi Oh - [email protected] Ying Li – [email protected] Ryan Yu – [email protected] Serdar Polat – [email protected] Srinivas Rajan – [email protected]
-
Upload
khangminh22 -
Category
Documents
-
view
0 -
download
0
Transcript of Country Score Card - Columbia SIPA

PG. 1
Country Score Card FOR PENCILS OF PROMISE
| SIPA CAPSTONE PROJECT | Fall 2016
Faculty Advisor Chip Raymond
Team
Nicole Qing - [email protected] Gloria Soomi Oh - [email protected]
Ying Li – [email protected] Ryan Yu – [email protected]
Serdar Polat – [email protected] Srinivas Rajan – [email protected]

PG. 2
Table of Contents 1. Introduction: .........................................................................................................3
Pencils of Promise ...................................................................................................3
Project Objective ......................................................................................................4
The Big Picture on Education ..................................................................................5
ECOWAS – An Introduction ...................................................................................8
2. Project Approach & Timelines ...........................................................................11
Project Plan ............................................................................................................11
Work Breakdown Structure ...................................................................................12
3. Portfolio Analysis .................................................................................................13
Overview ................................................................................................................13
Barriers to Education .............................................................................................15
PoP value proposition ............................................................................................17
Recommendations ..................................................................................................18
4. Demand Analysis ..................................................................................................19
Objective & Global Agenda ...................................................................................19
Methodology ..........................................................................................................21
Recommendations ..................................................................................................30
5. Competitor Analysis ............................................................................................31
Overview ................................................................................................................32
Summary of best practices .....................................................................................33
Recommendations ..................................................................................................36
6. Country Scorecard ...............................................................................................38
Key Elements .........................................................................................................39
ECOWAS Score Card ............................................................................................44
7. Financial Analysis ................................................................................................45
8. Recommendations ................................................................................................48
9. References .............................................................................................................49
Appendix I .............................................................................................................50
Appendix II ............................................................................................................57
Appendix III ...........................................................................................................57
Appendix IV...........................................................................................................57
Appendix V ............................................................................................................57

PG. 3
1. Introduction
Pencils of Promise
PoP is a global NGO working primarily in less developed countries with a portfolio of
offerings aimed at improving the quality of education provided in these countries, thereby
improving the literacy levels of the target population. Their website proudly proclaims
“We’re a global community that believes everyone deserves access to quality education.
We’re reshaping the landscape of education guided by our100% promise”.
Founded in 2009, PoP has an active presence in Ghana, Guatemala, Laos and Nicaragua
apart from a strategic partnership formed recently in Liberia. Their key support offerings
include
School builds,
Water, health & sanitation,
Teacher support
Scholarships
Headquartered in New York, PoP has relied on the strong network of the founder to raise
funds for its various initiatives. As the organization moves into the next logical phase of
organizational maturity, there are the natural questions regarding strategic direction and
approach towards furthering their mission. Unlike traditional corporates that rely on
complex strategic frameworks, PoP has preferred to rely on “Emergent learning” strategy
which basically allows them the freedom to plan on the go and adjust to the experiences
they make rather than make lofty commitments that would otherwise tie them into knots
trying to run after those targets and losing sight of the reason for their existence.
So here we were at the PoP office in mid - September 2016 clarifying our project objectives
and embracing the challenge of producing a mechanism that was concise yet capturing
essential elements for effective decision making. We had our tasks cut out to analyze their
strengths, weaknesses and make recommendations that were synchronous to their culture.

PG. 4
Project Objective
Develop a screening criteria for Pencils of Promise’s future expansion to ECOWAS
(Economic community of West African States) or deepen their current operation in the
countries they have presence in by:
Analyzing the product portfolios available in education for developing countries
Conducting demand-side Analysis in ECOWAS (Economic community of West
African States) countries to identify the needs in the educational space
We have since named the screening mechanism document as the Country Score Card. It is
a self-guided tool to determine whether a given country can be considered by PoP based
on certain pre-defined criteria.

PG. 5
The ‘Big Picture’ on Education
The Rio+20 conference (the United Nations Conference on Sustainable Development) in Rio de
Janeiro, June 2012, galvanized a process to develop a new set of Sustainable Development Goals
(SDGs) to carry on the momentum generated by the Millennium Development Goals (MDGs) and
fit into a global development framework beyond 2015.
In July 2014, the UN General Assembly Open Working Group (OWG) proposed a document
containing 17 goals to be put forward for the General Assembly’s approval in September 2015.
This document set the ground for the new SDGs and the global development agenda spanning from
2015-2030.
196 countries have signed up for the Sustainable Development Goals or SDGs as part of
Agenda 2030 meeting that happened in September 2015. Of the 17 goals, Goal no. 4 is focused
on Education.
Goal No. 4: Ensure inclusive and equitable quality education and promote life-long learning
opportunities for all
Since 2000, there has been enormous progress in achieving the target of universal primary
education. The total enrolment rate in developing regions reached 91 percent in 2015, and
the worldwide number of children out of school has dropped by almost half. There has also
been a dramatic increase in literacy rates, and many more girls are in school than ever
before. These are all remarkable successes.
Progress has also been tough in some developing regions due to high levels of poverty,
armed conflicts and other emergencies. In Western Asia and North Africa, ongoing armed
conflict has seen an increase in the number of children out of school. This is a worrying
trend. While Sub-Saharan Africa made the greatest progress in primary school enrolment
among all developing regions – from 52 percent in 1990, up to 78 percent in 2012 – large
disparities still remain. Children from the poorest households are up to four times more
likely to be out of school than those of the richest households. Disparities between rural
and urban areas also remain high.

PG. 6
Achieving inclusive and quality education
for all reaffirms the belief that education is
one of the most powerful and proven
vehicles for sustainable development. This
goal ensures that all girls and boys
complete free primary and secondary
schooling by 2030. It also aims to provide
equal access to affordable vocational
training, to eliminate gender and wealth disparities, and achieve universal access to a
quality higher education.
More than half of countries and areas worldwide have achieved or nearly achieved
universal primary education – that is, they have a net enrolment rate or net attendance rate
of more than 95 per cent. In about 25 countries, however, net enrolment or attendance is
less than 80 per cent. These countries are concentrated mainly in West and Central Africa
and in South Asia, and many of them are affected by conflict.
CHILDREN OUT OF SCHOOL
In 2013, an estimated 59 million children of primary school age were out of school; 52 per
cent of them were girls. About one third of the world’s out-of-school children live in West
and Central Africa; about one fifth are in Eastern and Southern Africa. In West and Central
Africa, more than a quarter of all primary-school-age children are out of school. In Liberia,
the out-of-school rate rises to 62 percent. In Nigeria, more than 8 million children of
primary school age are out of school.
Source: www.unicef.org

PG. 7
Disparities in Primary Education
In many countries, children from the poorest 20 per cent of the population are less likely
to attend school than those who are better off, with each successive quintile having a
higher average attendance. The largest disparities of all are in West and Central Africa. In
Guinea, for example, nearly 90 per cent of children from the wealthiest households
attended primary school in 2012, compared with less than a third of children from the
poorest quintile. Children in rural areas are in general more disadvantaged, being almost
twice as likely to be out of primary school as their urban counterparts. In Niger, 83 per
cent of children in urban areas attended primary school in 2012, whereas only 45 percent
of rural children did so in 2012.
CEE/CIS: Central and Eastern Europe and the Commonwealth of Independent States
Source: UNESCO Institute for Statistics global databases, 2016

PG. 8
ECOWAS – An Introduction
Established on May 28 1975 via the treaty of Lagos, ECOWAS1 is a 15-member regional
group with a mandate of promoting economic integration in all fields of activity of the
constituting countries. Member countries making up ECOWAS are Benin, Burkina Faso,
Cape Verde, Cote d’ Ivoire, The Gambia, Ghana, Guinea, Guinea Bissau, Liberia, Mali,
Niger, Nigeria, Sierra Leone, Senegal and Togo.
Considered one of the pillars of the African Economic Community, ECOWAS was set up
to foster the ideal of collective self-sufficiency for its member states. As a trading union, it
is also meant to create a single, large trading bloc through economic cooperation. Integrated
economic activities as envisaged in the area that has a combined GDP of $734.8 billion,
revolve around but are not limited to industry, transport, telecommunications, energy,
agriculture, natural resources, commerce, monetary and financial issues, social as well as
cultural matters.
The Vision of ECOWAS is the creation of a borderless region where the population has
access to its abundant resources and is able to exploit same through the creation of
1 www.ecowas.int

PG. 9
opportunities under a sustainable environment. What ECOWAS has created is an
integrated region where the population enjoys free movement, have access to efficient
education and health systems and engage in economic and commercial activities while
living in dignity in an atmosphere of peace and security. ECOWAS is meant to be a region
governed in accordance with the principles of democracy, rule of law and good governance.
Efforts have been made in harmonizing macroeconomic policies and private sector
promotion towards achieving economic integration, giving rise to some initiatives which
include implementation of the roadmap for the ECOWAS single currency program,
monitoring and evaluation of performance and macroeconomic convergence, management
of the ECOWAS Macroeconomic Database & Multilateral Surveillance System
(ECOMAC) as well as co-operation with other regional and international institutions.
Education in ECOWAS
From its inception ECOWAS was conscious of the priority of Education and Training
towards imparting employable skills to the teaming youths of the Community, only
recently, the Commission organized a series of capacity building sessions in Member States
on the use of multimedia approach for the development and revision of Technical and
Vocational Education and Training (TVET) curriculum and instructional materials.
Additional content of capacity building sessions in five countries (Cape Verde, Guinea,
Liberia, Niger and Sierra Leone) included the use of the internet to source modern
animations and other resource materials to enhance the quality of teaching and learning,
competency based approach to teaching that lay more emphasis on practical; integration of
entrepreneurship education into TVET curriculum to address challenges associated with
values, attitudes and dignity; and the use of ICT in the teaching and management of TVET.
Furthermore, a survey was conducted in five countries (Burkina Faso, Côte d’Ivoire,
Ghana, Nigeria and Senegal) in the course of the year towards revitalization of TVET
Management Information Systems and Delivery in order to optimize the comparative
advantage of Member States for the overall benefit of the Community and source for
funds for identified gaps.
PG. 10
The Status report on Girls’ Education was prepared by the Commission with the
collaboration of experts on education of girls and other vulnerable groups in Banjul in April
2013. The meeting also identified and documented best practices that could be replicated
at the Regional level, namely in the areas of advocacy and sensitization; information
sharing on Regional and Global trends towards achieving the MDGs in 2015 and beyond.
Towards the promotion of higher education with emphasis on the production of high level
professionals for the region, the project of a West African University was adopted in 2012.
The terms of reference for the feasibility study was developed by some of the Chancellors
and Vice Chancellors of ECOWAS Member States Universities in September, 2013.
As part of plans for comprehensive intervention, the ECOWAS Experts on education
discussed the girls’ education; equivalence of certificates; E-learning; Education
Management Information Systems (EMIS).
We noticed that information about ECOWAS was not very forthcoming in the initial phase
of the project but from early October 2016, their website (www.ecowas.int) has been
upgraded with a lot more information that might be useful in making a more detailed
assessment by country as well as find contacts for business opportunities. Our efforts at
contacting the officials did not bear fruits but this is something that PoP can seriously
consider in order to gain partnerships at the government levels before entering some of the
recommended countries in ECOWAS.

PG. 11
Key milestones
We kicked off client interactions with an onsite meeting in Mid-September to clarify the project objectives. We had the opportunity
to synchronize our efforts on a weekly basis with the PoP management2. We also had a face to face interviews with all of PoP’s
country heads when they visited New York (early November). A mid-term report was presented to a SIPA Panel as a mandatory
Capstone requirement in mid-October & a Final project presentation was made to PoP on the 13th of Dec, 2016.
2 Tom Cassazone – Chief Operating Officer, Pencils of Promise Leslie Engle Young - Director of Impact, Pencils of Promise
INTRODUCTION DUE DILIGENCE PROPOSAL DEVELOPMENT CLOSURE PHASE
Introduction Project planning Work allocation
Client kick-off Initial Interviews Expectation setting
(Sign-off) Competitor Interviews
Country Score card Focus groups for
feedback Report preparation
Client presentation Recommended next
steps SIPA report submission
9/19 11/16 12/14 10/20
Project Plan
2. Project Approach & Timelines

PG. 12
Work Break-down structure
We decided to approach the topic by doing an inside-out as well as an outside-in analysis.
Country footprint review was to study PoP’s operations in the 4 countries with their major
presence and draw lessons about what
worked and what didn’t.
The Product portfolio analysis enabled
us to analyze PoP’s value proposition in
more detail but also to compare with
what else could they do or do differently
in order to gain better access and thereby
create better impact in their operations. An interview based Competitor Analysis was
conducted on a few NGOs based out of New York and having a presence in the ECOWAS
region. We received insights from these NGOs that will hopefully find traction and offer a
credible perspective to PoP.
An ECOWAS Political Social Economic and Technological (or PEST)) analysis was aimed at
finding an integrated platform that could be leveraged for a simultaneous and coordinated
entry into some of the countries of interest in ECOWAS.
Most importantly, an Education Needs Analysis was conducted for ECOWAS countries to
establish the demand for NGOs like PoP and the scope of work that could be achieved given
PoP’s service offerings and operating strengths.
In addition, we did Financial Data Analysis based on available data to simulate the future
financial commitments for PoP with certain operating assumptions. It must be mentioned here
that PoP does not have a funding problem but given the global slowdown in trade and
economic activity, the future may see some uncertainties. Given that sustaining existing
operations would be a primary concern, a slow but steady growth of its foot-print is certainly
a more risk averse approach.

PG. 14
3. Portfolio Analysis
Overview
Many challenges facing education systems are common in almost all low-to-medium income
countries, although some disparities exist between and within countries due to specific
political, economic and social conditions. This chapter of the report will focus on solutions
that different stakeholders provide to the challenges in primary education systems in low-to-
mid countries where PoP generally operate in. The analysis intends to answer important
questions for Pencils of Promise as to where its products fit in the spectrum of solutions to
existing problems in the primary education system, what kind of expansion of the product
portfolio or general operation of PoP could focus on in the future, and what feasible roadmaps
for those expansions are. First, the analysis starts by describing key challenges identified by
international development organizations in primary education system in low-to-mid income
countries. Next, the analysis would aim to insert PoP’s current products offerings into the
spectrum of solutions and support system. Lastly, recommendations are made to help PoP
foresee growth paths and partnership opportunities. (Figure 1)
Figure 1. Portfolio Analysis

PG. 15
Barriers to Education3
By the end of the 2014 school year, 263 million children were out of school globally, among
which 61 million children are of primary school age (about 6 to 11 years). Although many
parts of the developing world have made extraordinary advances in primary education in the
past decade, progress has been stagnated in recent years partially caused by the decline in aide
due to the most recent financial crisis. According to UNESCO’s Institute for Statistics (UIS),
most of this stagnation can be attributed to the situation in Sub-Saharan Africa, where the
absolute number of children denied access to
school had climbed from 29 million in 2008 to
31 million in 2010. In this region, almost one
school-age child in four has never been to
school, or dropped out of school before finishing
the primary cycle Looking at the big picture of
primary education challenges in low-to-mid
income countries, international organizations
have identified three main barriers to educations that development practitioners around the
world are still striving to bring down: Demand-side barriers, which usually involves parents
and students as key stakeholders; supply-side problems, which involves schools, teachers, and
government as key stakeholders; and last but not least, the context in which schools operate.
NGOs can engage and have impacts on one or more facets of these three areas to help achieve
the goal of universal education. In later paragraphs, we will discuss each barrier and its major
stakeholders in more detailed analysis and pave the way for defining PoP’s current value
proposition as well as growth paths based on the analysis. (Figure 2)
3 Target: ALL CHILDREN IN SCHOOL BY 2015, Global initiative on out-of-school children, UNESCO http://www.uis.unesco.org/Education/Documents/wca-oosci-report-2014-en.pdf
Figure 2 Overview of barriers to education

PG. 16
Demand-side Barriers
Lack of access to education is most often due to the marginalization of children. Typically, it
is the poor, remote rural populations, those affected by conflict, or those belonging to ethnic,
racial and linguistic minorities that are most often left out of education. Access, participation
and completion are often determined by demand-side factors, which include economic
problems (low levels of income, adverse wealth and negative income shocks, migration...)
associated with family issues (death, absence, illness of one or both parents, number of
children in the household...), problems of child health (illness, disability, malnutrition,
fatigue...), cultural factors (early marriage, early pregnancy, religion, language...) and a poor
perception of the value of education (because of integration in the workforce or its effect on
traditional values...), partly explain the phenomenon of school exclusion and generate other
phenomena such as differential treatment and discriminatory attitudes among children who
go to school (birth order, gender, disability, level of academic achievement, the number of
children already in school...) and those who work (domestic work, income support).
Supply-side Barriers
On the supply side, the direct and indirect costs of education (registration fees, school fees,
parent association contributions, contributions for teachers’ salaries, school supplies,
uniforms, transportation...), a lack of schools (which leads to problems of accessibility,
discontinuity and distance which is further aggravated by insecurity), a lack of teachers
(exacerbated by absenteeism and lack of motivation) and inadequate equipment (textbooks,
desks, blackboards, toilets, canteens...) and some bad teaching practices (repetition, violence
and discrimination in the classroom, teachers’ level of education, language of instruction,
class management, learning methods...), cause poor academic results and explain a large part
of the school exclusion phenomenon.
Context
In terms of the context, political governance issues (weak and slow decision-making, poor
coordination, no attempt to fight against school exclusion, trade-offs between educational
objectives of access and quality), conflict and insecurity (threat of danger when going to

PG. 17
school, indoctrination of students and teachers), institutional capacity and efficiency (poor
decentralization of funds and decision making, low capacity at decentralized levels,
availability, quality, use of information, poor management, supervision and evaluation of
educational activities, lack of birth certificates...), the ability to finance activities (inability to
raise funds, inefficiency, delays, inequity in the allocation of funds, inadequate amounts,
corruption...), natural climatic disasters (cyclones, floods, drought) and health issues
(pandemics, malnutrition...), also partly explain the extent of school exclusion phenomena.
PoP’s Product Portfolio and Value Proposition
PoP’s current product portfolio include four programs: school builds, WASH programs,
teacher training, and scholarships. Teacher’s training programs aim to equip teachers with
classroom management skills that are specifically beneficial to students’ learning outcomes
in literacy, providing WASH program (also as part of infrastructure improvement) to
incentivize children to attend schools, and scholarships to alleviate financial burden of the
children’s families. In terms of allocation of financial resources, schools builds also receive
the most funding compared to other three. Between 2012 and 2015, PoP has allocated majority
of its budget in school builds (83%), followed by WASH programs (9%), Teacher Support
(4%) and Scholarships (4%). PoP also believes in using technology effectively in measuring
the effectiveness of their programs, especially the Teacher’s training. Their website has the
most recent data updated and available for public consumption. They are also increasing the
use of technology aided learning in their programs to improve the quality of assimilation and
pique the interest of young minds in getting exposure to the latest forms of education support.
With extensive experience and well-developed expertise in school builds, PoP targets to tackle
the supply side problems (Figure 2), among which it specifically focuses on physical
infrastructure improvement through building/improving existing schools in rural areas. As
other three supporting programs that complement this core mission of building schools in

PG. 18
rural regions, WASH programs, teacher training,
and scholarship programs aim to tackle other
supply-side problems that exist in the region
with PoP’s presence.
Recommendations
The expansion of PoP’s current product portfolio can take various forms. Although it is
theoretically feasible to hire new, highly talented staffs and develop new programs, it can be
more cost effective to partner with other NGOs that have developed expertise in other (supply,
demand, or context-focused) solutions. Those partnerships should not be limited to
educational NGOs either. Some development organizations or microfinance institutions
possess resources that can be beneficial to PoP’s schools and students in the long run. For
example, organizations that provide microcredit or micro saving programs usually have access
to existing women-led social networks and community leaders, which can be utilized as a
parent support social infrastructure to be tied into PoP’s existing programs. For example, PoP
can partner with NGOs in the region that
Provide literacy-related programs. (e.g. reading materials and/or innovative
curriculum with technological components)
has a gender-focused mandate
build libraries
focused on other aspects of teacher training and support
provide parent support and advocacy
have other demand-side focused mandate, such as microfinance organizations
provide mobile healthcare facilities that can be co-opted as part of the school build
offering for securing the health needs of the students of the community
PoP’s Product Offerings and Value Proposition

PG. 19
4. Education Demand Analysis Objective Educational demand analysis aims to evaluate all relevant indicators to measure the need of
ECOWAS countries, and then select top indicators for the screening mechanism by analysis
of them.
Global Agenda
Education is foremost important policy are for less developed countries. United Nations
introduced Millennium Development Goals (MDGs) in 2000, and achieved substantial
progress in access to education and gender disparities for LDCs despite not desired level. With
the end of MDGs, UN had a consensus on Sustainable Development Goals (SDGs) in 2015,
and these goals will define priorities and targets in education as well as other sectors until
2030.
Apart from MDGs, SDGs cover a more coherent target list for education. Goal 4 of SDGs and
its targets are as follows;
Goal 4: Ensure inclusive and equitable quality education and promote lifelong learning
opportunities for all
Table 1: SDG Goal 4 Targets4 4.1: By 2030, ensure that all girls and boys
complete free, equitable and quality
primary and secondary education leading
to relevant and effective learning
outcomes
4.5: By 2030, eliminate gender disparities
in education and ensure equal access to all
levels of education and vocational training
for the vulnerable, including persons with
disabilities, indigenous peoples and
children in vulnerable situations
4 Source: https://sustainabledevelopment.un.org/

PG. 20
4.2 : By 2030, ensure that all girls and
boys have access to quality early
childhood development, care and pre-
primary education so that they are ready
for primary education
4.6: By 2030, ensure that all youth and a
substantial proportion of adults, both men
and women, achieve literacy and
numeracy
4.3: By 2030, ensure equal access for all
women and men to affordable and quality
technical, vocational and tertiary
education, including university
4.4: By 2030, substantially increase the
number of youth and adults who have
relevant skills, including technical and
vocational skills, for employment, decent
jobs and entrepreneurship
4.7: By 2030, ensure that all learners
acquire the knowledge and skills needed
to promote sustainable development,
including, among others, through
education for sustainable development
and sustainable lifestyles, human rights,
gender equality, promotion of a culture of
peace and non-violence, global citizenship
and appreciation of cultural diversity and
of culture’s contribution to sustainable
development

PG. 21
Methodology With respect to mentioned international goals, ECOWAS countries’ needs on education
should match with competitiveness analysis and product analysis. Therefore, educational need
analysis plays a critical role within screening framework.
Figure 1: Educational Need Analysis – The context
Demand analysis is based on what ECOWAS
countries need for providing access and
increasing educational quality. These countries
are specifically challenging with high child
dependency ratio, large population of school age
children, due to fertility patterns. This has some
important implications for these countries lack in education inputs, including qualified
teachers, proper textbooks, and so on.
These indicators are also valid to consider because they represent Goal 4 in Sustainable
Development Goals, PoPs portfolio analysis and competitive analysis, and are mostly
available and produced in even less developed regions.

PG. 22
Following are main educational demand indicators for our screening filters:
1) Input Indicators
- Human Resources; teacher per pupil, trained teachers, qualified teachers, teacher
attrition.
- School Resources; basic services (water, electricity and water), expenditure per
student, and textbook per pupil
2) Output Indicators
Access and Quality; Youth literacy, net enrollment, gross enrollment, drop out, out
of school children ratios.
Figure 2: Framework for Educational Process There are several indicators measuring
educational output (access and quality) and
inputs (school and human resources). On the
other hand, there is a high correlation between
these indicators with respect to countries.
Therefore, using more indicators instead of
choosing some for ranking of countries may
cause double-counting problem and
overestimate/underestimate results. Considering this risk, a good option is to choose best
indicators reflecting whole situation of educational need as much as possible. Therefore,
considered methodology of selecting indicators for screening mechanism is correlation
analysis. This analysis aims to correlate all indicators within both input and output categories.
Some indicators would have higher correlations with others, that is, it would reflect all other
indicators by self.
Data All relevant data are taken from UNESCO (UIS) to keep reliability and consistency
(http://data.uis.unesco.org/). For some countries, data availability is limited. Since focus of
this analysis is primary education, all indicators belongs this level of education.
Access and
Quality
Human Resources
School Reseources

PG. 23
Access and Quality Youth Literacy Rate
The most important and eligible indicator
for quality is youth literacy rate (age 15-
24). With respect to quality of education,
international student assessments serve
also as comparative of education systems.
However, these kinds of assessments are
not commonly available for all ECOWAS
countries.
Youth Literacy rate directly measures of
the output of primary education. It is
accepted that all children older than 15
should finish primary level theoretically.
While some countries such as Togo, Ghana
and Cabo Verde has a literacy rate higher
than 80 %, Niger and Guinea are the most
vulnerable countries where the rate is less
than 50 %.
Figure 3: Youth Literacy (15-24)
Gross and Net Enrollment Rate
While gross enrollment cover all children
independent of their age, net enrollment
covers only children at theoretical age of
primary education in the country. So, small
difference between these indicators arises
from late enrollment and repetitions.
0.0
20.0
40.0
60.0
80.0
100.0
120.0
NIG
ERG
UIN
EAM
ALI
CÔ
TE D
'IVO
IRE
BUR
KIN
A FA
SOBEN
INLIBER
IASIER
RA
LEON
ESEN
EGA
LN
IGER
IAG
AM
BIATO
GO
GH
AN
AC
ABO
VER
DE
Youth Literacy
Total Female Male

PG. 24
Figure 4: Gross Enrollment
Figure 5: Net Enrollment Ratio
There is also a gap between male and
female enrollment rates. Nigeria, Benin,
Niger, and Guinea are countries where
girls are disadvantaged. In Gambia and
Senegal, boys enroll less compared to girls.
This is also important agenda with respect
to SDG targets for education.
Figure 6: Enrollment Sex Ratio Female/Male
Drop-Out Rate and Out-of School Children
Drop-out rates gives number of drops
before completion of primary education. In
some, countries this rate reaches to over 30
%. This also increase out-of school
children. Out-of school children covers
both non-starters and drop-outs. Both rates
have a high correlation with enrollment
rates naturally. Gender disparity is a
problem for some countries as well.
60.0
70.0
80.0
90.0
100.0
110.0
120.0
130.0
140.0
NIG
ERM
ALI
SENEG
AL
NIG
ERIA
GA
MBIA
BUR
KIN
A FA
SOC
ÔT
E D'IV
OIR
EG
UIN
EALIBER
IAG
HA
NA
CA
BO V
ERD
ETO
GO
BENIN
SIERR
A LEO
NE
Gross Enrollment
Total Female Male
0.0
20.0
40.0
60.0
80.0
100.0
120.0
LIBERIA
MA
LIN
IGER
NIG
ERIA
BUR
KIN
A FA
SOG
AM
BIASEN
EGA
LC
ÔT
E D'IV
OIR
EG
UIN
EAG
HA
NA
TOG
OBEN
INSIER
RA
LEON
EC
ABO
VER
DE
Net Enrollment Ratio
Total Female Male
0.8
0.85
0.9
0.95
1
1.05
1.1
1.15
NIG
ERIA
NIG
ERG
UIN
EABE
NIN
CÔ
TE
D'IV
OIR
EM
ALI
TOG
OBU
RK
INA
FA
SOLI
BER
IASI
ERR
A L
EON
EC
ABO
VER
DE
GH
AN
AG
AM
BIA
SEN
EGA
L
Enrollment Sex Ratio

PG. 25
Figure 7: Drop-out Rate
Figure 8: Out of School Children
Human Resources Human resources mainly tell about
quantity and quality of teacher. In this
regard, teacher per pupil is an important
indicator to affect the quality of education
in terms of two ways. Of course, keeping
in mind that this is an average rate for the
country, first, high rate means that classes
are crowded, so there is a need for school
infrastructure. That is, less availability of
schools hinders enrollment. Also, there
might be many instructional and discipline
problems hindering quality of education.
Second, in international average, average
teacher pupil rate is approximately 20. This
is regarded as that teacher can handle. On
the other hand, in some countries the rate
is higher than 40, extremely problematic
for a quality instruction.
Figure 9: Pupil Teacher Ratio
All indicators measure quality and quantity
of teachers. Teacher per pupil measures the
lack of teachers in that country. Other
indicators are relevant for quality side of
teachers. However, qualification and
training criteria are different with respect
0.010.020.030.040.050.060.0
SIERR
A LEO
NE
TOG
OBEN
INSEN
EGA
LM
ALI
NIG
ERG
UIN
EABU
RK
INA
FASO
CÔ
TE D
'IVO
IRE
GA
MBIA
GH
AN
AC
ABO
VER
DE
LIBERIA
NIG
ERIA
Drop Out Rate
Total Female Male
0.010.020.030.040.050.060.070.0
LIBERIA
NIG
ERM
ALI
NIG
ERIA
BUR
KIN
A FA
SOG
AM
BIASEN
EGA
LC
ÔTE D
'IVO
IRE
GU
INEA
GU
INEA
GH
AN
ATO
GO
BENIN
CA
BO V
ERD
ESIER
RA
LEON
E
Out of School Children
Total Female Male
15.0
20.0
25.0
30.0
35.0
40.0
45.0
50.0
BEN
ING
UIN
EAG
UIN
EABU
RK
INA
FA
SOC
ÔTE
D'IV
OIR
EM
ALI
TOG
ON
IGER
IAG
AM
BIA
NIG
ERSI
ERR
A L
EON
ESE
NEG
AL
GH
AN
ALI
BER
IAC
ABO
VER
DE
Pupil-Teacher Ratio

PG. 26
to countries. Also, for these countries,
having sufficient number of teacher is a
most important to priority than quality of
them.
Figure 10: Teachers who are trained
Figure 11: Teacher Attrition Rate
Figure 12: Qualified Teachers
School Resources
In third category, school resources are
mostly dependent on expenditure per
student. Both basic services and textbook
availability is a cause of budget resources.
Since all countries have different levels of
purchasing powers, it would be more
logical to use expenditure with purchasing
power parity.
Highest expenditure per student is in Cabo
Verde, and substantially higher than other
countries while Liberia and Nigeria has no
data. Remaining 12 countries has
expenditure from $ 106 to $ 420.
40.050.060.070.080.090.0
100.0
CA
BO …
BUR
KIN
A …
CÔ
TE …
GA
MBIA
TO
GO
GU
INEA
GU
INEA
SENEG
AL
BENIN
NIG
ERIA
SIERR
A …
LIBERIA
GH
AN
AM
ALI
NIG
ER
% of Teachers, who are trained
Total Female Male
0.02.04.06.08.0
10.012.014.016.0
GA
MBIA
LIBERIA
NIG
ERIA
SIERR
A LEO
NE
TO
GO
GH
AN
ABEN
INM
ALI
CÔ
TE D'IV
OIR
EG
UIN
EAG
UIN
EABU
RK
INA
FASO
SENEG
AL
CA
BO V
ERD
EN
IGER
Teacher Attrition
0.020.040.060.080.0
100.0120.0
BENIN
NIG
ERSEN
EGA
LC
ABO
VER
DE
CÔ
TE D
'IVO
IRE
BUR
KIN
A FA
SOG
AM
BIAG
UIN
EAG
UIN
EATO
GO
GH
AN
ASIER
RA
LEON
ELIBER
IAM
ALI
NIG
ERIA
Qualified Teachers
Both Sexes Female Male

PG. 27
Figure 13: Expenditure per Pupil (PPP)
Other important elements of school resources
are access to basic services and textbook
availability. It seems that access to electricity
is most critical constraint for ECOWAS.
Potable water and toilet access are limited
respectively.
Figure 14: Access to Basic Services in Schools
Textbook per student are available for
math and reading. Higher values of these
indicators mean that there is lack textbook
resources, and some students have no
textbook or share it with other students.
Niger, Ghana, Senegal and Cote de Ivoire
has problems in textbook availability.
Other countries have no data or no problem
in this area.
Figure 15: Textbook per Student
Analysis Correlation tests were run to identify key
indicators that we could potentially use for
screening. For Indicators with a high
correlation, we choose to use only one
indicator in these cases to avoid
duplication effects. For example, Out of
school and Net enrollment are
0.00.0
106.4125.5125.5172.1
205.2216.2235.2278.4
323.2363.7381.7
419.3
917.1
0.0
100.0
200.0
300.0
400.0
500.0
600.0
700.0
800.0
900.0
1000.0
LIBERIA
NIG
ERIA
SIERR
A LEO
NE
GU
INEA
GU
INEA
GA
MBIA
TOG
OBEN
INM
ALI
NIG
ERBU
RK
INA
FASO
SENEG
AL
GH
AN
AC
ÔTE D
'IVO
IRE
CA
BO V
ERD
E
Expenditure Per Student, PPP $
0.020.040.060.080.0
100.0120.0
GU
INEA
BISSAU
LIBERIA
NIG
ERIA
GU
INEA
NIG
ERSIER
RA
LEON
EM
ALI
TO
GO
BUR
KIN
A FA
SOSEN
EGA
LBEN
INC
ÔT
E D'IV
OIR
EG
AM
BIAG
HA
NA
CA
BO V
ERD
E
Basic Services
Wilthout Electricty Without Toilet Without Potable Water
0.00.51.01.52.02.53.03.5
NIG
ERIA
SIERR
A LEO
NE
LIBERIA
GH
AN
AC
ÔT
E D'IV
OIR
ESEN
EGA
LN
IGER
GU
INEA
BUR
KIN
A FA
SOC
ABO
VER
DE
GA
MBIA
GU
INEA
TOG
OM
ALI
BENIN
Textbook Per Student
Math Reading

PG. 28
complementary statistics and have a very
high correlation (~1.00) and we chose to
use Net enrollment data.
Similarly, gross and net enrollment ratios
have a high correlation (0.95), that is, they
are mostly identical. Since drop out ratios
reflects drop-outs of enrolled students, in
low enrolled and high enrolled countries,
this rate might be similar. Therefore, this
rate has less correlation with other output
indicators.
Since net enrollment ratio measure the
ratio of number of enrolled children in
primary school age to number of total
children in primary school age, it
considers the late enrollments and
repetitions. However, gross enrollment
covers all children enrolled in primary
level. Drop-out ratio and out of school
children affect net enrollment ratio. That
is, the sole indicator which reflects other
relevant output indicators is net enrollment
ratio. Low values of this indicator will
provide a basis to consider the country.
Literacy issue is an important agenda for
PoP. Moreover, literacy is final outcome of
primary school. With respect to quality of
education, literacy rate is chosen as firs
indicator. For access to education, net
enrollment represents all other access
indicators. Finally, literacy rate is chosen
for quality side, net enrollment rate is
chosen for access side. Following table
shows relative correlations. It is considered
that high correlation is larger than 0.3 or
less than -0.3. It doesn’t matter the sign of
correlation. For instance, while the low
enrollment rate is an opportunity, the high
rate of out of school children gives the
opportunity to enter that country.
Table 2: Correlation among Access and
Quality Indıcators (Output Side)
Note: Green is positive high correlation>0.3 or <-0.3, yellow is mid correlation 0.3< and -0.3, and red is negative high correlation <-0.3.
With respect to human resources and
school resources (input side), the best
candidate for the screening filter is per
student expenditure because this indicator
has a high positive or negative correlation
with all indicators except the textbook per
pupil. Second best candidate is pupil
teacher ratio. Except train teacher and
teacher attrition, there is a high positive or
negative correlation between this indicator
and others. In screening filter,
Out of School
Net Enrollme
nt Literacy
Gross Enrollme
nt Drop OutOut of School 1.00 -1.00 -0.64 -0.96 -0.07Net Enrollment -1.00 1.00 0.64 0.95 0.04Literacy -0.64 0.64 1.00 0.57 -0.39Gross Enrollment -0.96 0.95 0.57 1.00 0.25Drop Out -0.07 0.04 -0.39 0.25 1.00

PG. 29
Infrastructure section use education expenditure per GDP is used as commitment to education.
So, pupil teacher ratio (second best) is chosen for the screening for preventing duplication
with commitment to education.
Table 3: Correlation among School and Human Resources Indıcators (Input Side)
Note: Green is positive high correlation>0.3 or <-0.3, yellow is mid correlation 0.3< and -0.3, and red is negative high correlation <-0.3.Conclusion
Net Enrollmen
tLiteracy
Pupil-Teacher
BENIN 95.9 52.5 45.9BURKINA FASO 67.5 52.5 44.5
CABO VERDE 98.2 98.3 22.6CÔTE D'IVOIRE 74.7 50.2 42.5
GAMBIA 67.9 73.2 36.8GHANA 91.1 90.6 31.3GUINEA 75.7 45.2 45.6LIBERIA 37.7 54.5 45.6
MALI 59.4 49.4 26.5NIGER 61.0 26.6 42.5
NIGERIA 63.8 72.8 35.8SENEGAL 71.1 69.8 37.6
SIERRA LEONE 97.9 67.4 31.6TOGO 91.2 85.2 34.8
Average 75.2 63.4 37.4Standard Deviation 17.1 19.0 7.2
Lower Limit 67 54 34Upper Limit 84 73 41
Pupil-Teacher
Trained Teachers
Teacher Attrition
Per Student
Expenditure
TextbookWithout
ElectricityWithout
Toilet
Without Potable Water
Pupil-Teacher 1 -0.12 0.26 -0.81 -0.40 0.76 0.34 0.56Trained Teachers -0.12 1 -0.14 0.55 -0.24 -0.24 -0.51 -0.22Teacher Attrition 0.26 -0.14 1 -0.37 0.11 -0.11 0.2 -0.15Per Student Expenditure -0.81 0.55 -0.37 1 0.15 -0.78 -0.53 -0.62Textbook -0.40 -0.24 0.11 0.15 1 -0.47 0.00 -0.45Without Electricity 0.76 -0.24 -0.11 -0.78 -0.47 1 0.47 0.9Without Toilet 0.34 -0.51 0.2 -0.53 0.00 0.47 1 0.59Without Potable Water 0.56 -0.22 -0.15 -0.62 -0.45 0.9 0.59 1
Note: Green values are higher than upper limit for
first and second indicator, and lower than lower
limıt for third indicator, yellow ones are between
lower and upper limits, and other values are red.

PG. 30
Recommendations
After selection of indicators, they are evaluated how they would contribute in final ranking of
countries in screening mechanism. In line with screening filter; low, medium and high values
of selected indicators are defined.
For all three indicators, averages and standard deviations of countries are calculated. Then,
upper and lower limit for the indicator are calculated as mean plus/minus half of standard
deviation. These upper and lower limits are used as critical values for classification.
Table 5: Selected Indicators Final classification of the indicators with respect to critical values is following table. Table 6 Selected Indicators and Relative Ranking
Ranking
Selected Indicators Low Med High
Net Enrollment Ratio >84 % 67-84 % <67 %
Youth Literacy >73% 54-73% <54%
Pupil per teacher < 34 34-41 > 41
PG. 31
5. Competitor Analysis Introduction Interviewing four NGOs that are involved with school builds and/or education, we were able to pinpoint strengths
in entrance decision making and network building. The objective of this analysis was to provide insights from
other organizations for our screening process for success in potential expansion. After speaking with Building
Tomorrow, Room to Read, Caravan to Class, and the Malala Fund, we analyzed characteristics relating to
relationships with governing bodies, population characteristics, community engagement, conflict zones, network
building, and measures of need, funding, and focus on mission. We boiled the information down to four key
takeaways for success:
1. Strong local partnerships with regional leadership and community
2. Deep community engagement
3. Partnerships and support between other NGOs
4. National government approval and support
We selected organizations for their involvement in education and the regions in which they work. These
organizations that are invested in education, with three of the four involved in school builds. Two of the chosen
organizations work in Mali due to our focus on Mali as a test case. The organizations vary in size and scope.
Caravan to Class is the smallest of the four, only working in the Timbuktu region in Mali, while other
organizations, such as Room to Read and Malala Fund, operates across continents. Between the four NGOs, they
overlap with services that Pencils of Promise also offers, such a school builds, teacher training, and focus on
literacy.

PG. 32
Overview of the listed NGOs5
Building Tomorrow uses the following steps help to ensure that
selected countries both need their services and are willing to
support sustainable operations:
Room to Read, while operating in Bangladesh, Cambodia,
India, Laos, Nepal, South Africa, Sri Lanka, Tanzania,
Vietnam, and Zambia, tie together their vision, mission and program goals with their theory of change, which
focuses on literacy of primary school children and girls’
secondary education in order to empower active and responsible
future citizens (see figure below).
5 Appendix IV – Sample Interview questions asked to the benchmarked NGOs

PG. 33
Caravan to Class’s process of operating in a specific village
begins with identifying, through a field study and research, a
specific village and its education needs; partnering with a
reputable and known local NGO in the given area; creating a
plan with a budget; meet with the villages elders and sign a
contract with the village; inviting investment in the village
(donations) to bring literacy to the village children; and
following up to assure that the plan is fulfilled and the
investment is having results (see the diagram below).
After the contract is signed, Caravan to Class confirms with the national Ministry of Education that the new school
is a government certified and operated school before beginning construction on the school.
Malala Fund operates within three key objectives:
1. Investing in girls' education through innovative solutions to deliver high-quality education to
disadvantaged communities around the world.
2. Amplifying voices of educational advocates to tell the stories of those who are fighting for their right to
education.
3. Channeling collective action to make girls' education a true priority.
Their current work includes providing better access to quality education for Syrian refugees, grant making for
secondary schooling for girls in Pakistan, providing learning programs for adolescent girls, including those who
are out-of-school and married, and investment in secondary education and training in information and
communication technology for low income girls.
Analysis of Considered Characteristics
The priority of our interview was how organizations determine new countries for expansion. When looking for
country characteristics, Building Tomorrow, Room to Read, Caravan to Class, and the Malala Fund prioritize the
extent of need, the cooperation of governing bodies, and, to some extent, funding availability.

PG. 34
The need for their educational programs are often qualified by lack of access to education, including the physical
distance children have to travel to get to a school building, and low school attendance. The willingness of
governing bodies to work with and support these
NGOs is essential, especially when programs are
meant to have sustainable impact. Both the
national ministries of education and finance being
on board with program offerings is of importance.
Additionally, local leadership must have buy in
for the successful launch of programs and
initiatives but also for their sustainability. Funding
plays a large role as well. Funding can come in the
forms of donations to the NGO, support from the
national government, or in-kind donations from community members. However, without this funding, NGOs, for
very obvious reasons cannot enter a new country. The most prominent red flags that our interviewees look for in
a new country are government corruption and regional or national conflict. If the country’s governing bodies are
very corrupt or the region is an active conflict zone, entering the country is strongly recommended against. This
is in line with the approach adopted by PoP as well.
In order to understand these criteria6 in a deeper manner, we analyzed the NGOs experiences and perspectives on
relationships with:
1. Governing bodies 5. Network building
2. Population characteristics 6. Funding
3. Community engagement 7. Focus on mission
4. Conflict zones
6 Detailed assessment on each of the above criteria is available in Appendix I

PG. 35
Recommendations
Considering all the information we have gathered from Building Tomorrow, Room to Read, Caravan to Class,
and the Malala Fund, we have four key recommendations.
First of all, local partnerships, governing bodies and community, is key. PoP does this already to an extent, but
we recommend strengthening relationships through ensuring contracts and understandings that will stand through
exchanging leadership. Additionally, considering the tendency of the population to migrate or stay in the region,
especially in areas affected directly or indirectly by conflict is a major consideration to how sustainable schools
will be.
This is tied in very closely with our recommendation to engage the communities in which PoP operates. While
this is done well by PoP, we recommend gauging community needs and goals aligning with what PoP offers. PoP
should continue to ask for investments from the community in the form of in-kind donations but can also ask for
long-term commitment from parents or community members in terms of sending children to school and other
forms of assistance.
Third, partnering with NGOs to build and strengthen support networks within region will greatly benefit PoP.
While there is the risk of limiting control of operations if programs are shared, there are other ways to partner
without sharing control of school builds or teacher support programs. For example, much like Building Tomorrow

PG. 36
and Caravan to Class, PoP could look for partners that would provide services that fall outside of PoP’s scope,
such as food programs, clean water, and adult literacy programs. This can support PoP’s programs by allowing
community members to prioritize education once basic needs are met and giving extra support for children in
their homes.
Finally, government willingness is essential. PoP currently only works in countries where national governments
welcome their programs. Like Building Tomorrow, PoP can identify key ministries and ensure the cooperation
of all necessary government branches. If the ministries of finance and education are both necessary for
successfully operating within a country, PoP should secure understandings with both before beginning operations.
Two other takeaways on this is that while the willingness of the national government to work with PoP indicates
a barrier or a green light for entry, the stability of the local governance is a better predictor for sustainable presence
and impact. Additionally, if the need, willingness, cooperation of necessary government branches, and stability
is present, then the type of government is not as important, as Malala Fund mentioned.

PG. 37
6. The Country Score Card
Introduction
The Country Score card is meant to serve as a first level of screening that provides PoP a reference framework to
filter in/out opportunities for business development. The score card comprises of 3 broad categories with 3
indicators each that are equally weighted in terms of priority. Based on the evolving strategy of the organization,
some or more of the indicators could be given a higher weightage.
Each Indicator has equal weightage in our model. Each Indicator is divided into three categories (Low =1,
Medium=3, High=5) with a low score meaning the country doesn’t justify participation by an NGO for support
on that particular Indicator. The country could either be self-sufficient or is unsuitable for external intervention.
Example: A low score of 1 on ‘Age of stable government’ indicates that the country does not have a stable
government for long enough to be able to offer ideal conditions for an NGO to operate in the country. A low score
of 1 on ‘Primary Literacy Level’ indicates that the country has sufficient literacy rate and may not need an NGO
to support them in improving their primary education needs. A low score does not indicate a good or bad therefore,
but an evaluation of the need.

PG. 38
Key elements of the Score Card
1. Political Indicators
a. Stability of governance
b. Global Peace Index ranking of the country of Interest
c. Ease of doing business Index (World Bank methodology)
Stability of governance
The PoP model primarily supports existing government education framework (Institutions, curriculum, teachers
etc.) and strengthening them with resources like school buildings, augmenting their teacher effectiveness via the
teacher training initiatives, augmenting the learning experience by distributing tablets that provide stand-alone
reading and learning experience to the students, and providing WASH facilities in the schools to provide a clean
learning experience as well as an awareness about the importance of clean water, sanitation in daily life
Government institutions that are stable and free from frequent threats (like military coups, dictatorship etc.)
allow for NGOs to operate much more effectively with their stable policies and established rule of law. This is
also an important factor in ensuring safety for the employees of organizations operating in these countries
Global Peace Index
The Global Peace Index (GPI) is an attempt to measure the relative position of nations' and regions' peacefulness.
It is the product of the Institute for Economics and Peace (IEP) and developed in consultation with an international
panel of peace experts from peace institutes and think tanks with data collected and collated by the Economist
Intelligence Unit. The list was launched in May 2007 and updates have been made on an annual basis since then.
It is claimed to be the first study to rank countries around the world according to their peacefulness. It ranks 162
countries, up from 121 in 2007. The study is the brainchild of Australian technology entrepreneur Steve Killelea,
founder of Integrated Research, and is endorsed by individuals such as Kofi Annan, the Dalai Lama, archbishop
Desmond Tutu, Finland's President Sauli Niinistö, Nobel laureate Muhammad Yunus, economist Jeffrey Sachs,
former president of Ireland Mary Robinson, current Deputy Secretary-General of the United Nations Jan Eliasson
and former US president Jimmy Carter.
The index gauges global peace using three broad themes: the level of safety and security in society, the extent of
domestic and international conflict, and the degree of militarization. Factors are both internal such as levels of
violence and crime within the country and external such as military expenditure and wars.
The GPI currently indicates Iceland, Denmark, Austria, Portugal, and New Zealand to be the most peaceful
countries and Syria, Afghanistan, South Sudan, Central African Republic and Iraq to be the least peaceful.

PG. 39
2. Socio- Economic Indicators
a. Government commitment
b. Internet Penetration %
c. The IHDI or Inequality adjusted Human Development Index
Government Commitment
It is measured as a % of government expenditure towards primary education in proportion to GDP/capita. A
stronger commitment to education by the government is a welcome indicator of support even to non-governmental
agencies. PoP insists on 10% contribution for the school builds from the respective local government bodies.
Internet Penetration
It is measured as the number of internet users as a fraction of the total population of the country. The higher the
degree of penetration, the better prepared a country is to receive technological aids in learning. This was
specifically requested by PoP and is also seen as a trend in the education sector to shorten the learning curve for
young minds. Therefore a penetration ratio of over 50% of the population has been given the highest rating (of 5)
and <25% ratio receives the lowest rating (of 1)
Ease of doing business Index
The ease of doing business index is an index created by the World Bank Group. Higher rankings (a low numerical
value) indicate better, usually simpler, regulations for businesses and stronger protections of property rights.
Empirical research funded by the World Bank to justify their work show that the economic growth impact of
improving these regulations is strong.
The Doing Business project, launched in
2002, looks at domestic small and medium-
size companies and measures the regulations
applying to them through their life cycle.
For the purpose of our project, we restricted
ourselves to the relative ranking of countries
within Africa to differentiate the ease of
doing business rather than using global
scores. We found that a global ranking may
be less relevant as all countries in Africa
were falling in a relatively lower scale by
doing so.

PG. 40
The higher the score, the better the country for a new organization to operate. Therefore a high score (of 5)
corresponds to a better facilitation for the NGO and a low score (of 1) indicates significant challenges that may
be posed if a new business were to be set up operations in a country with low ease of doing business.
3. Education sector demand Indicators
a. Youth Literacy rate
b. Pupil – Teacher Ratio
c. Primary Enrollment Ratio
Youth Literacy rate
Youth literacy rate is the percentage of people ages 15-24 who can both read and write with understanding a
short simple statement about their everyday life. We chose this indicator to measure the medium term success of
literacy programs in a country and how the environment of education was helping to shape the overall society.
A higher rate indicates the relative success of the governments in securing a sustainable primary and secondary
education system and therefore received a low score (of 1) and a lower rate indicates either the absence or work
in progress status as far as achievement of full youth literacy is concerned and received a high score (of 5)
suggesting the need for an NGO to enter and support the respective government.
Source: United Nations Educational, Scientific, and Cultural Organization (UNESCO) Institute for Statistics
Pupil – Teacher ratio
It is the ratio of the number of students per teacher. The higher the ratio, the lower is the likelihood of quality
education. Therefore in our score card, a higher ratio gets a higher score (of 5) and a lower ratio gets a lower score

PG. 41
(of 1) i.e. a country with a higher ratio of Pupils – Teacher deserves more support and attention compared to a
country that has a healthier ratio.
Primary Enrollment Ratio (Net)
Net primary enrolment rate in primary education is the number of pupils of official primary school age (according
to ISCED977) who are enrolled in primary education as a percentage of the total children of the official school
age population. Since PoP focuses on primary education, this was a direct demand indicator for the countries of
Interest. A lower enrollment score indicates the opportunity for an NGO to enter and support the country and
therefore receives a higher score (of 5)
7 6 International Standard Classification of Education. Primary education is defined by ISCED97 as programmes normally designed on a unit or project basis to give pupils a sound basic education in reading, writing and mathematics along with an elementary understanding of other subjects such as history, geography, natural science, social science, art and music

PG. 42
Country8 Score Card – ECOWAS
A Country score of at least 27 is recommended for entry. The logic of arriving at 27 was considering 3 indicators with a score of 5, 3 indicators
with a score of 3and 3 indicators with a score of 1 (= 3*5 + 3*3 + 3*1)
Note: The Score card gives equal weightage to all Indicators.
8 Appendix III for qualitative country reports

PG. 43
7. Financial Analysis
This financial analysis’ purpose is to explain PoP’s past spending pattern, and to give
projections for new countries that PoP decides to enter. We analyzed PoP’s programs spending
between 2012 to 2015 in Ghana, Guatemala, and Laos, and set up a budget to give projections
of how much it costs per student in new countries, and how many programs PoP could launch
based on its historical program expenditures. In the end, we have implemented all ECOWAS
countries in this model, and resulted projections to enter those countries.
Methodology9 To calculate total cost per student for each country PoP will enter, we assume that each country
implements only four programs: School Build, Teacher Training program, Wash program, and
Scholarships. These four programs constitute the total costs of PoP entering and operating in
the new countries. Based on historical data, information, and interviews with PoP’s
management team, we have three assumptions:
a) the number of students that each school serves is 70
b) the number of students that each Teacher Training program serves is 100
c) the number of students that each Wash program serves is 100
For the country we consider entering, we derive total cost of each program in that country by
decomposing it into material costs and labor costs, and adjust them with corresponding
measurements: Consumer Price Index (CPI) in 2014 (2010=100) and Gross National Income
(GNI), Atlas method (current US$), based on the two parts’ respective average costs of the
program that PoP has in countries it currently operates in, e.g. Ghana, Guatemala and Laos.
9 Graphs & Charts in Appendix II

PG. 44
For total material cost, we first calculate the average total material cost of the program in
existing countries, and then multiply it by the new country’s CPI to existing countries’ average
CPI ratio to take price level into consideration. Similarly, for total labor cost, we calculate the
average total labor cost in existing countries and multiply by the new country’s GNI to existing
countries’ average GNI ratio to include wage level factor. Adding up these two parts costs, we
get the total cost of the program. And finally, we take a total cost with a 20% contingency as
the final cost. The cost per student is the cost of the program divided by the number of students
served. So the total cost per student in one new country is the sum of costs per student of the
four programs.
Besides the total cost per student, we have also projected the number of each program to launch
in new countries based on the past expenditure performance of PoP spent in Ghana, Guatemala,
and Laos.
Based on the analysis of PoP’s historical expenditures in Ghana, Guatemala, and Laos from
2012 to 2015, we calculated total expenses for each country and then sum them to get total
expenses for each year from 2012 to 2015. Then we calculated the compound annual growth
rate (CAGR) to be 41% for total expenses from 2012 to 2015. Also, based on past expenditures,
we have found that PoP spent, on average, 83% on School Build, 4% on Teacher Support
Program, 9% on Wash Program, 4% on Scholarship.
We assume that the growth of total program costs each year follows CAGR of total program
costs from 2012 to 2015, and 30% of the costs would be devoted to expanding in the new
countries. Further assume that the proportion of funds contributed to each program equals to
the average percentage of funds used in that program in existing countries over these years,
which is 83% on School Build, 4% on Teacher Support Program, 9% on Wash Program, 4%
on Scholarship. The number of units PoP launches in a program in a new country in a certain

PG. 45
year is 30% of total program costs multiplied by the proportion of funds distributed to that
program divided by the cost of the program. This way we can get the number of schools built,
the number of Teacher Training programs provided, the number of Wash programs provided,
and the number of scholarships granted.

PG. 46
8. Summary of Recommendations
Partnerships
• Build network with the representative missions (in New York) of the
recommended countries
• Partnering with multilateral agencies could be an advantage both from an entry
and advocacy stand point. UN SDG Fund is actively engaging with the private
sector to promote the sustainable development goals.
• Partnership with “digital education” players in the sub-Saharan region can be
beneficial in better penetration and shorter lead times for procurement
Geography
Portfolio
• PoP could start by expanding in the immediate neighborhood of Ghana (E.g.
Nigeria is a neighbouring English speaking country)
• Expand the language portfolio to French and consider expanding to Mali &
Niger)
• Once Mali / Liberia operations are stabilized, Senegal could be considered
• Consider other developing countries outside ECOWAS using the same model
• Organic growth (moving up the value chain of offerings) in existing locations or
Inorganic growth (tie-ups, partnerships for specific initiatives etc.) in newer
countries/ regions
• Measurement of Impact using some of the demand indicators listed in our
model (within the local communities)
• Increase in the proportion of budget spent on measures that have a more
direct impact on Literacy rate (other than school builds)

PG. 47
9. References
1. UN Sustainable development goals:
http://www.undp.org/content/undp/en/home/sustainable-development-goals/goal-4-quality-
education.html
2. ECOWAS website: www.ecowas.int/
3. Global Peace Index: http://www.visionofhumanity.org/
4. Ease of doing business: http://www.doingbusiness.org/rankings
5. Government expenditure on Education:
http://data.worldbank.org/indicator/SE.XPD.TOTL.GD.ZS
6. Internet penetration: http://www.internetlivestats.com/internet-users/
7. Inequality adjusted HDI: http://hdr.undp.org/en/content/inequality-adjusted-human-
development-index-ihdi
8. Country facts: http://www.indexmundi.com/
9. World bank education statistics: http://www.worldbank.org/en/topic/education
10. Ten innovative NGOs in education: https://ironline.american.edu/ten-innovative-
ngos-in-education/
11. Country data: a. http://www.developmentprogress.org/sites/developmentprogress.org/files/beni
n_education_progress.pdf b. http://economicsandpeace.org/wp-content/uploads/2015/06/Global-Peace-
Index-Report-2015_0.pdf c. http://blog.transparency.org/2016/10/11/benins-fight-against-corruption-is-
only-beginning/ d. http://www.worldbank.org/en/country/benin/overview e. http://www.classbase.com/Countries/Burkina-Faso/Education-System f. http://www.burkina.com g. http://www.compassion.com/burkina-faso/rural-region.htm h. http://www.indexmundi.com/facts/burkina-faso/rural-
populationhttp://www.epdc.org/epdc-data-points/senegal-s-progress-still-marked-regional-and-gender-inequality
i. http://economicsandpeace.org/wp-content/uploads/2015/06/Global-Peace-Index-Report-2015_0.pdf

PG. 50
APPENDIX I
1. Relationships with governing bodies include both the cooperation and the stability of
national and local leadership. Stability also encapsulates the existing infrastructure and
collaboration of branches of government, though Malala Fund expressed that the form of
government is not as important to them, particularly if the government is a democracy or not.
Both the political stability of the country and local communities and their willingness to work
with and support NGO programs creates stable understanding between governing bodies over
time, which sets a foundation for sustainable operations and impact.
Room to Read states that “first and foremost, we try to choose to go into countries that are
political[ly] stable, since we need a strong government partner.” In order to develop better
collaboration with the national government, Room to Read only works in government
operated schools, and does so only after being invited in good will by the national government.
Building Tomorrow also makes connections with both the ministry of education and the
ministry of finance to ensure a stable partnership with and lasting support from the national
government.
Additionally, like
Pencils of Promise,
Caravan to Class
monitors activity within
the schools that they
have built but does not
attempt to directly
influence government
issues curriculum. As an
aside, Malala Fund does create educational programs and advocates for policy change, but as
we can see above in the brief description of the organization, the mission is very different
from Pencils of Promise, so we do not take this into our recommendations. Cooperation with
the ministry of education in any given country is essential to successful operations. This can
be in the form of a director sent by the ministry or teachers themselves. When Caravan to

PG. 51
Class builds a school, the ministry of education sends a director. This is acknowledged as a
sign of commitment from the government since Timbuktu has a large physical distance from
the central government and sending a director can be difficult. Room to Read only works with
government schools and with government teachers, so they have expressed that the assistance
of the education ministries in their countries of operation are crucial, “If they will not work
with us, our program model will not work.” Evidence of government corruption also signals
instability and lack of ability to cooperate, even if willingness may be present. Building
Tomorrow may vet a certain region or country by gathering information from in-house people
who can report on how a school is run and can provide information. They also avoid working
with regions if there is a push from to funnel funding through a governing body as this signals
high risk for corruption.
2. Population characteristics can be used to determine need, network building capacity,
and ability to cooperate.
The number of school aged children and the distances from a community to the nearest school
is taken into consideration. Room to Read and Building Tomorrow both take into account low
attendance of students in primary or secondary school and how many school aged children
are not in school. In addition to low attendance, Room to Read considers high illiteracy
another indicator of need. Caravan to Class, on the other hand, takes into consideration how
far children in a certain region must travel to attend school. In an area without a school,
Caravan to Class assesses how many go to another village school. How close or far are schools
to each other is another consideration in network building. If a region is too close to another

PG. 52
school, then this may diminish need, but if a region is too far, then this will diminish the ability
for communities and schools to support each other. On the other hand, if the schools are within
the range to provide support, the local reputation and prestige Caravan to Class grows to make
it easier to find local government support. Caravan to Class also states that larger and more
permanent populations are necessary for sustainability of their schools. Additionally, another
area of concern is the ethnic makeup and cohesion of communities. Contention between ethnic
groups in diverse villages can be problematic in their ability to provide support for the schools.
Finally, poverty is a standard measure of need; however, a region where poverty brings with
it other immediate unmet needs, such as high food insecurity, may not be willing to invest
time and resources into education. We go into this further in the next paragraph about
community investment.
3. The success and sustainability of schools and programs are contingent highly on community
engagement in terms of community attitudes and investment. The priorities of a community
indicate the need and the willingness to support the school.
Malala Fund aims at maintaining
balance between ensuring local
organization goals and own
organization goals in their programs.
Caravan to Class will only build in
regions where parents are committed
to sending their children to school. This being said, if a community struggles with meeting
basic needs such as food or shelter, it may not be on board to invest in education before those
needs are met. This could be ameliorated if an NGO that could help to fill that area of need
paves the way for NGOs like Pencils of Promise. For example, Caravan to Class belongs to a
network of NGOs that all provide different services. We will touch on this a bit later.
Community investment creates local ownership of the school, which in turn allows for
sustainable schools and programs. Room to Read states that the “willingness of local
communities is also very important to us in our work. We actually require some form of
investment from all local communities when we start our programs in those areas. It is usually

PG. 53
is not very much (a small portion of the monetary costs or labor), but enough to create some
sort of ownership of the program. If there is no local ownership, the work cannot be sustained
long-term.” Building Tomorrow also requires community agreement to give 15 thousand
hours of labor, 3 acres of land and ongoing partnership. Caravan to Class also states that the
head of the village must agree to providing unskilled labor to help build the new school.
4. Conflict zones pose a more immediate threat to NGO work, not only in terms of danger
to staff, but in terms of the transitory qualities of the population that the NGO hopes to serve.
While both Malala Fund and
Caravan to Class works directly with
refugees, they have not stayed in
areas where there is active conflict.
Malala Fund, instead, works with
Syrian refugees in countries that
receive forced migrants from Syria.
Caravan to Class was shut out of
Timbuktu during conflict for almost
a year but continued to help forced
migrants. After the region was liberated by French forces, Caravan to Class continued their
work in the region. In fact, the area had greater need due to the conflict which strengthened
the resolve to re-enter the area. According to Caravan to Class, this created challenge due to
transportation as well as they were only able to fly in through the UN. This did not impact
Caravan to Class’s work but did impact ability to raise funds. Room to Read also ran into
issues with this kind of political instability but only after establishing itself in Bangladesh.
They shared with us that, “in Bangladesh the past few years, we have had to take special
precautions to ensure the protection of our staff, particularly as there have been attacks against
female empowerment groups and westerners. We had to put a travel ban on our western staff
from visiting Bangladesh for a while when things were particularly turbulent. In order to work
through these difficulties, we have to assess the situation, determine what is best for our staff
on the ground, and then figure out if we need to adjust any of our implementation plans based
on the difficulties of the situation.” The other problem underlying areas with conflict is how

PG. 54
it affects the consistency in population and governing body. Caravan to Class shared that
conflicts zones do not have permanent resident populations, which is problem for building
schools.
5. Network building is a common thread across all four NGOs we interviewed. These
networks include inter-school networks and communities but are generally established
partnerships with other NGOs. While partnerships may support Pencils of Promise programs
in terms of meeting other community needs outside of the scope of Pencils of Promise’s
mission, supplementing and
enriching programs, and cutting
costs, maintaining balance
among ensuring partner goals
and one’s own organization
goals can be a challenge. For
these reasons, each organization
approaches potential partners
with a critical eye. Malala Fund
specifically looks to find small
agencies that have already established platforms and access in their countries and regions of
interest. Building Tomorrow establishes alignment or complements in mission and operations
and then examines multiple agencies and compares to get the best value to resource cost. The
chosen partner must have a good reputation with the community and the national government
and a good record of service. Bank references offer evidence that the potential partner is
operating in a nationally recognized and official capacity in the country as well. Building
Tomorrow looks for partnerships, but looks for partnerships with what they can provide in
school, such as WASH programs, electricity, and school feeding programs, girls’ hygiene,
among others. Caravan to Class knew they needed a local partner to help build and supervise,
so they reached out a number of NGO. Initially, they only chose to work one very good local
partner; however, this partner NGO developed a network of NGOs, and Caravan to Class now
benefits from this network. Realizing this was a strength, Caravan to Class has worked to
pursue and sustain this network. Geographic location to other organization schools sites can

PG. 55
develop social networks with other communities. Caravan to Class states that the smaller
distance between a potential site from another existing school can help to create a greater
degree of voice and power in the area communities.
6. Funding or donations either by donors, government, bilateral sources, or community
members is a necessary component of successful programs. Room to Read states that
guarantees of sustained funding from donors ensures the implementation of their programs
over the course of time. They write, “our programs are intensive, and if there is no will on the
part of donors to fund it, there is no way we can even consider entering a new country.” Malala
Fund often co-funds projects, when missions align. On the recipient side of grants, grants that
align with operations or mission can not only sustain current operations but can help to
broaden reach. Caravan to Class received a grant for female adult literacy to support mothers
and women in villages. This allowed Caravan to Class include in their programs mechanisms
that help these adults become more invested in education, which works in two ways. First,
children can instill an interest in education in their mothers, but, second, adults will see the
value in committing to sending their children to school.
7. Finally maintaining
focus by aligning all
partnerships, goals, and
programs to the organization’s
vision and mission is imperative
to achieve success. Malala
Fund prioritizes mission and
objectives, maintaining balance
between ensuring local organization goals and own organization goals. In their five year plan,
Room to Read also aligned vision, mission, and goals in their theory of change. Measuring
outcomes for program evaluation is also essential to stay focused and accountable to the
organization’s mission. Malala Fund measures change in the number of students in schools,
learning outcomes, and engagement with local organizations and community engagement.
Room to Read also looks at number of literacy programs in partner schools, number of school

PG. 56
with infrastructure projects, number of books published and distributed, number of teachers
and librarians trained, and number of children benefited as outputs. This is distinguished from
their outcomes, which are number of books checked out, percentage of children reading at a
fluent level, percentage of girls who stayed in secondary school, percentage of girls who
graduated to the next grade level, percentage of girls receiving life skills training, and
percentage of girls advancing to tertiary education. While not ideal, where data is limited,
another measure can be used to stand in for a more specific outcome. Caravan to Class does
not have the capacity to demonstrate literacy output, but they can demonstrate school
attendance, so they use this as their main measure of success.

PG. 57
APPENDIX II – Financial Analysis (Graphs)
Graph: Projections of Number of Schools for ECOWAS countries between 2017 and 2019
Graph: Projections of Number of Teacher Programs for ECOWAS countries between 2017
and 2019
- 20 40 60 80
100 120 140 160 180 200
# of Schools
2,017 2,018 2,019
- 1 2 3 4 5 6 7 8 9
10
# of Teacher Programs
2,017 2,018 2,019
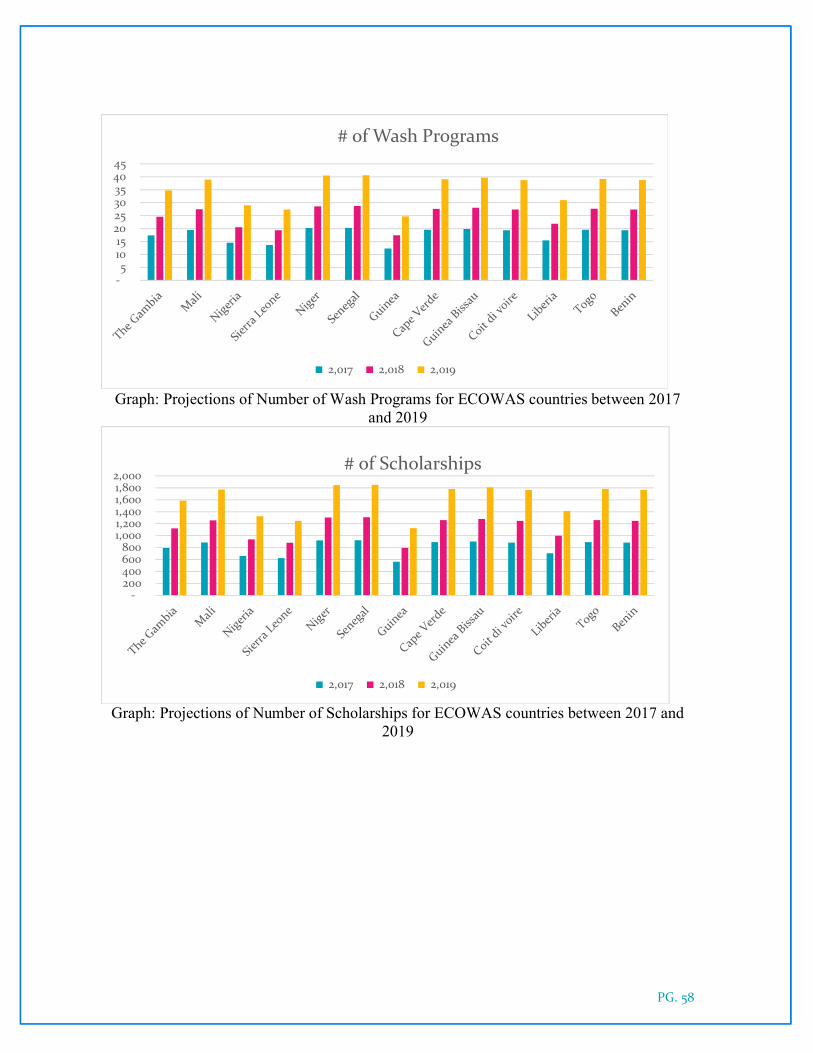
PG. 58
Graph: Projections of Number of Wash Programs for ECOWAS countries between 2017
and 2019
Graph: Projections of Number of Scholarships for ECOWAS countries between 2017 and
2019
- 5
10 15 20 25 30 35 40 45
# of Wash Programs
2,017 2,018 2,019
- 200 400 600 800
1,000 1,200 1,400 1,600 1,800 2,000
# of Scholarships
2,017 2,018 2,019

PG. 59
Graph: Per Student Costs for ECOWAS Countries
Graph: School Build Costs for ECOWAS Countries
-
200
400
600
800
1,000
1,200
Per Student Costs
- 5,000
10,000 15,000 20,000 25,000 30,000 35,000 40,000 45,000
USD School Build Costs

PG. 60
Graph: Teacher Program Costs for ECOWAS Countries
Graph: Wash Program Costs for ECOWAS Countries
Graph: Scholarships Costs for ECOWAS Countries
22,500 23,000 23,500 24,000 24,500 25,000 25,500 26,000
USD Teacher Program Costs
- 2,000 4,000 6,000 8,000
10,000 12,000 14,000 16,000 18,000
USD Wash Program Costs
-
50
100
150
200
USD Scholarships Costs

PG. 61
APPENDIX III
Mali
EXECUTIVE SUMMARY
Anti-government sentiment is on the rise and political stability will be fragile. Meanwhile
the security situation in much of the country will remain volatile as implementation of the
peace deal signed in 2015 is slow. Jihadist networks will pose a major security threat across
the north and central regions. Despite the fragile security situation, real GDP growth will be
robust in 2017-18, at around 5%, as donor support is firm, public investment grows and
agricultural production expands.
KEY STATISTICS
Urban-Rural Population
Urban: (2014) 39.1%
Rural: (2014) 60.9%
Mali ranks 179th out of 188 countries on the United Nations Human Development
Index for 2015. Poverty is much lower in urban areas with 90% of all poor living in
rural areas concentrated in the south where population density is highest.
Life Expectancy at Birth
Male: (2013) 52.8 years
Female: (2013) 56.4 years
Literacy: Percentage Of Population Age 15 And Over Literate
Male: (2010) 43.4%
Female: (2010) 20.3%
Poverty:
While Mali experienced an overall drop in national poverty from 55.6% in 2001 to 43.6% in
2010, regional differences persist and in 2013, the poverty rate rebounded to 45%.

PG. 62
MAP
Mali is divided into eight regions (Gao, Kayes, Kidal, Koulikoro, Mopti, Ségou, Sikasso,
Tombouctou) and the capital district of Bamako, each under the authority of an elected
governor. Each region consists of five to nine districts (or Cercles), administered by
Prefects. Cercles are divided into communes, which, in turn, are divided into villages or
quarters.
A decentralization and democratization process began in the 1990s with the establishment of
702 elected municipal councils, headed by elected mayors, and previously appointed
officials have been replaced with elected officials, which culminates in a National council of
local officials. Other changes included greater local control over finances, and the reduction
of administrative control by the central government.
POLITICS
Mali's constitution provides for a multi-party democracy.

PG. 63
From 1968 to 1991, Mali was governed by a government resulting from a military coup.
Elected twice unopposed, the president governed as a dictator.
The political and security situation has been particularly volatile in recent years. In early
2012, there was a military coup and an occupation of the northern regions by rebel and
criminal groups While the political situation in Mali stabilized in 2014, persistent attacks by
numerous pro and anti-government armed groups in the north led to a marked deterioration
in security in Gao, Kidal, and Timbuktu regions, where the 2013 French-led intervention
sought to restore state control. Peace negotiations between government and two rebel
coalitions (known as the “Platform” and “Coordination” groups) concluded with the signing
of an agreement on May 15, 2015 by both the government and the Platform group, and the
government and the Coordination group on June 20, 2015. While the new agreement does
not envision an autonomous status for the northern regions, it gives a stronger impetus to
decentralization, creating a critical role for these regions and a development zone consisting
of the northern regions. Its implementation, however, remains challenging. Security, which
is critical to ensuring economic recovery and poverty reduction, remains fragile with
continuing attacks on the UN force and the Malian army by jihadist groups mainly in the
north but also on civilians in Bamako, the most recent of which targeted the Radisson Blu
hotel in November 2015 and the Nord-Sud Azalai hotel in March 2016. Local government
elections scheduled for October 2015 were postponed to the fourth quarter of 2016.
RECRUITMENT OF CHILDREN AND CHILD LABOR
Armed groups in the north continued to recruit and use child soldiers, some as young as 12.
During 2014, some 20 schools in the north were at various times occupied by members of
the armed groups, pro-government militias, the Malian army and, in one case, MINUSMA.
Several children suspected of supporting the armed groups were detained in both the
Bamako Central Prison and a gendarme camp in Bamako, in contravention of a 2013
protocol signed by the government stipulating that children were to be placed in a care
center managed by the UN Children’s Rights Emergency and Relief Organization.

PG. 64
Child labor in agriculture, domestic service, mining, and other sectors was common, and
often included dangerous work that Malian law prohibits for anyone under the age of 18.
Child laborers in artisanal gold mining were exposed to health risks from accidents and
exposure to toxic mercury.
EDUCATION
French, spoken by only a very small segment of the population, was the only language of
instruction until 1994, when national languages such as Bambara and Fula were introduced
into primary schools. Mali utilizes an educational track resembling the school system in
France, Mali’s former colonial authority. In this system, primary and secondary
education are compulsory and free from 7 to 16 years of age and are combined in the nine-
year curriculum of the cycle fundamental (fundamental educational level). The general
secondary school, or lycée, provides the last three years of traditional secondary education.
Higher education—geared directly to the needs of the government—is offered by
the University of Bamako (1993) and state colleges, which include teacher-training colleges,
a college of administration, an engineering institute, an agricultural and veterinary science
institute, and a medical school. Many of Mali’s university students study abroad, especially
in France and Senegal. Other school reform has focused on such programs as “ruralization,”
in which rural schools teach students about trades such as sewing, building, and farming in
addition to such subjects as French, history, mathematics, and geography.
In the early 21st century, Mali remained a vast, poor country where opportunities for even
primary education were extremely limited, especially in rural areas or among the nomadic
peoples of the north. The World Bank began to assist Mali in 2000 by providing credit so
that the country could expand its educational system. At that time only slightly more than
half the population entered primary school. Expanding educational opportunities for the
female population was also of interest to the Malian government. The country’s literacy rate
is one of the lowest in the world, with estimates varying between two-fifths and one-third of
the population being able to read. The literacy rate of women is significantly lower than that
of men.

PG. 65
HEALTH AND WELFARE
Mali has few resources for health care, and child and infant mortality rates are among the
highest in the world. State hospitals at Bamako and Kati are supplemented by a network of
medical centers, maternity centers, dispensaries, and a mobile service that visits patients in
rural areas. Research centers in tropical ophthalmology and leprosy treat patients at
Bamako. Healthcare services are also provided by international relief organizations. Despite
improvements in medical care, Mali is still challenged by a lack of personnel, facilities,
resources, and supplies and by difficulties involving poor access to much of the country.
Malnutrition and inadequate sanitation are also problems in many areas. Some progress has
been made against polio, onchocerciasis (river blindness), schistosomiasis, and leprosy, but
yellow fever and cholera are common, and malaria remains a leading cause of death. While
Mali has not been hit as hard by HIV as some African countries, AIDS is becoming more
prevalent in urban areas.
RULE OF LAW
Malian authorities made little effort to investigate and hold accountable those implicated in
serious abuses committed during the 2012-2013 armed conflict. However, there was a
decrease in abuses by state security forces and progress in the investigation into the 2012
torture and killing of 21 elite soldiers. Rule of law institutions countrywide were weak, in
part due to unprofessional practices and inadequate budgetary allocations for the criminal
justice system. Corruption, endemic at all levels of government, further impeded Malians’
access to basic health care and education.
EXISTING EDUCATIONAL NGO
Build On:
Contact Rosann Jager
VP of International Programs
734.727.5436 [email protected]

PG. 66
Nigeria
Map
Politics
The Federal Republic of Nigeria, often referred to as Nigeria, is a Federal constitutional
republic in West Africa. Nigeria is officially a democratic secular country. Modern-day
Nigeria has been the site of numerous kingdoms and tribal states over the millennia. Nigeria
became a formally independent federation in 1960, and went into a civil war from 1967 to
1970. It has since alternated between democratically-elected civilian governments and
military dictatorships, until it achieved a stable democracy in 1999, with the 2011 presidential
elections considered the first to be reasonably free and fair.
Society
Population (2015 estimate): 188,462,640
Density: 197,2/km2 or 510.8/sq mi
GDP (PPP) 2016 estimate: $1.166 trillion
GDP per capita (PPP) 2016 estimate: $6,351
Gini (2010): 43.0
IHDI (Inequality-adjusted HDI): 0.32
Life expectancy: 58
Poverty rate (2014): 69%

PG. 67
Health
Health care delivery in Nigeria is a concurrent responsibility of the three tiers of government
and the private sector. Nigeria has been reorganizing its health system since the Bamako
Initiative of 1987, which formally promoted community-based methods of increasing
accessibility of drugs and health care services to the population, in part by implementing
user fees. The new strategy dramatically increased accessibility through community-based
healthcare reform, resulting in more efficient and equitable provision of services.
Education
Official language: English.
Nigeria has medium youth literacy rate at 68%, male 75.7% and female 60.0%. Its net
enrollment rate is 63.8% and its pupil-teacher ratio is 37.6, all at medium range.
Nigeria provides free, government-supported education, but attendance is not compulsory at
any level, and certain groups, such as nomads and the handicapped, are under-served.
Education in Nigeria is overseen by the Ministry of Education. Local authorities take
responsibility for implementing policy for state-controlled public education and state
schools at a regional level. The education system is divided into Kindergarten, primary
education, secondary education and tertiary education. It consists of six years of primary
school, three years of junior secondary school, three years of senior secondary school, and
four, five or six years of university education leading to a bachelor's degree. After the 1970s
oil boom, tertiary education was improved so that it would reach every sub region of
Nigeria.
Business
In terms of economy, the GDP in Nigeria shrank by 2.06% year-on-year in the second
quarter of 2016 and its GDP annual growth rate is rather low, at around 2.65% in 2015.
According to the World Bank’s rankings of economies’ ease of doing business, Nigeria
ranks the 169th on ease of doing business, the 174th on dealing with construction permits,
the 180th on getting electricity and the 182th on registering property.
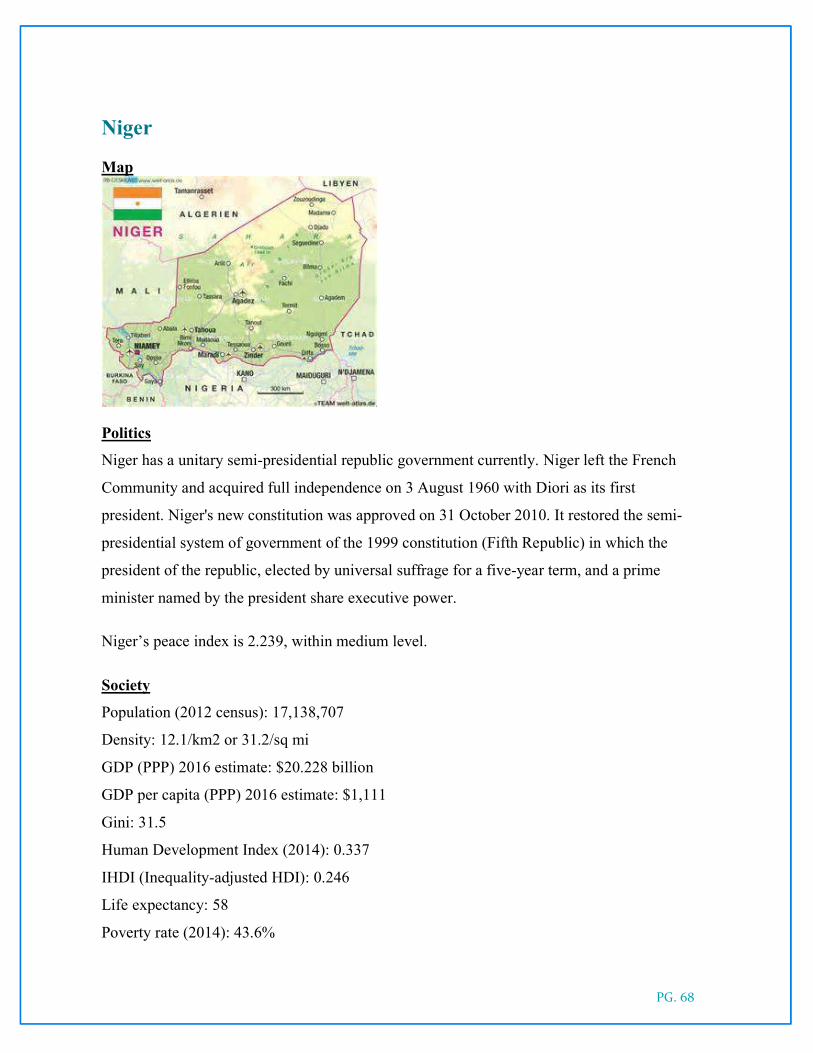
PG. 68
Niger
Map
Politics
Niger has a unitary semi-presidential republic government currently. Niger left the French
Community and acquired full independence on 3 August 1960 with Diori as its first
president. Niger's new constitution was approved on 31 October 2010. It restored the semi-
presidential system of government of the 1999 constitution (Fifth Republic) in which the
president of the republic, elected by universal suffrage for a five-year term, and a prime
minister named by the president share executive power.
Niger’s peace index is 2.239, within medium level.
Society
Population (2012 census): 17,138,707
Density: 12.1/km2 or 31.2/sq mi
GDP (PPP) 2016 estimate: $20.228 billion
GDP per capita (PPP) 2016 estimate: $1,111
Gini: 31.5
Human Development Index (2014): 0.337
IHDI (Inequality-adjusted HDI): 0.246
Life expectancy: 58
Poverty rate (2014): 43.6%

PG. 69
Health
The child mortality rate in Niger is high (248 per 1,000). According to the organization Save
the Children, Niger has the world's highest infant mortality rate, the highest fertility rate
(7.03 births per woman according to 2013 estimates) and the 11th highest maternal mortality
rate (820 deaths/100,000 live births). This means that nearly half (49%) of the Nigerien
population is under age 15.
Education
Official language: French.
Niger’s literacy rate is among the lowest in the world. The youth literacy rate in 2015 is
26.6%. Net enrollment rate is low at 61% and pupil-teacher ratio is 35.8. Although primary
education in Niger is compulsory for six years, the primary school enrollment and
attendance rates are low, particularly for girls. Besides, children are often forced to work
rather than attend school, particularly during planting or harvest periods. Nomadic children
in the north of the country often do not have access to schools.
Business
For GDP annual growth rate, the GDP in Niger expanded 5.70% in the second quarter of
2016 over the same quarter of last year.
According to the World Bank’s rankings of economies’ ease of doing business, Niger ranks
the 150th on ease of doing business, the 179th on dealing with construction permits, the
166th on getting electricity and the 125th on registering property.
Foreign aid
About 45% of Niger’s government's FY 2002 budget, including 80% of its capital budget
derives from donor resources. The most important donors in Niger are France, the European
Union, the World Bank, the International Monetary Fund, and various United Nations
agencies (UNDP, UNICEF, FAO, World Food Program, and United Nations Population
Fund). Other principal donors include the United States, Belgium, Germany, Switzerland,
Canada, and Saudi Arabia, among which the United States is a major donor, contributing
nearly $10 million each year to Niger's development.

PG. 70
Senegal
MAP
EXECTIVE SUMMARY
Senegal is bordered by Mauritania in the north, Mali to the east, Guinea to the southeast, and
Guinea-Bissau to the southwest. Senegal is one of the world’s poorest countries. According
to the United Nations Development Programme’s 2015 Human Development Index, it ranks
No. 170 out of 188 countries. In Senegal, wealth distribution is highly unequal, and it has a
higher poverty rate in rural areas.
In 2015, Senegal has approximately 15.13 million population. The population in Senegal is
very young. It is estimated that 62% of Senegalese are under the age of 25. The country has
low productivity and very high levels of unemployment rate.

PG. 71
POLITICS
Senegal is a republic with a presidency. The presidential election happens every five years.
The current President is Macky Sall, whom was elected in March 2012. The transition of
power following the presidential elections of March 2012 and the legislative elections of
July 2012.
Senegal is an example of democracy and political stability, which plays a lead role in the
Africa. Senegal has a quasi-democratic political culture, which is one of the more successful
post-colonial democratic transitions in Africa. Senegal has a quite peaceful environment.
The Global Peace Index of Benin is 1.805 in 2015, which ranks No. 4 in Sub-Saharan
Africa.
EDUCATION
In Senegal, most of people do not have access to basic education, and illiteracy is
widespread, especially among women and girls. Even access to education in Senegal has
been increased steadily over past two decades, but overall levels of education attainment are
still extremely low.
As we could see the graph below, the gross enrollment ratio steadily increased from 59% to
above 80% from 1996 to 2012. And according to World Bank, the percent of young people
who have attended school has increased from 53% to 65% over the last decade. Also, young
people were twice as likely as their peers to attend schools five years earlier.
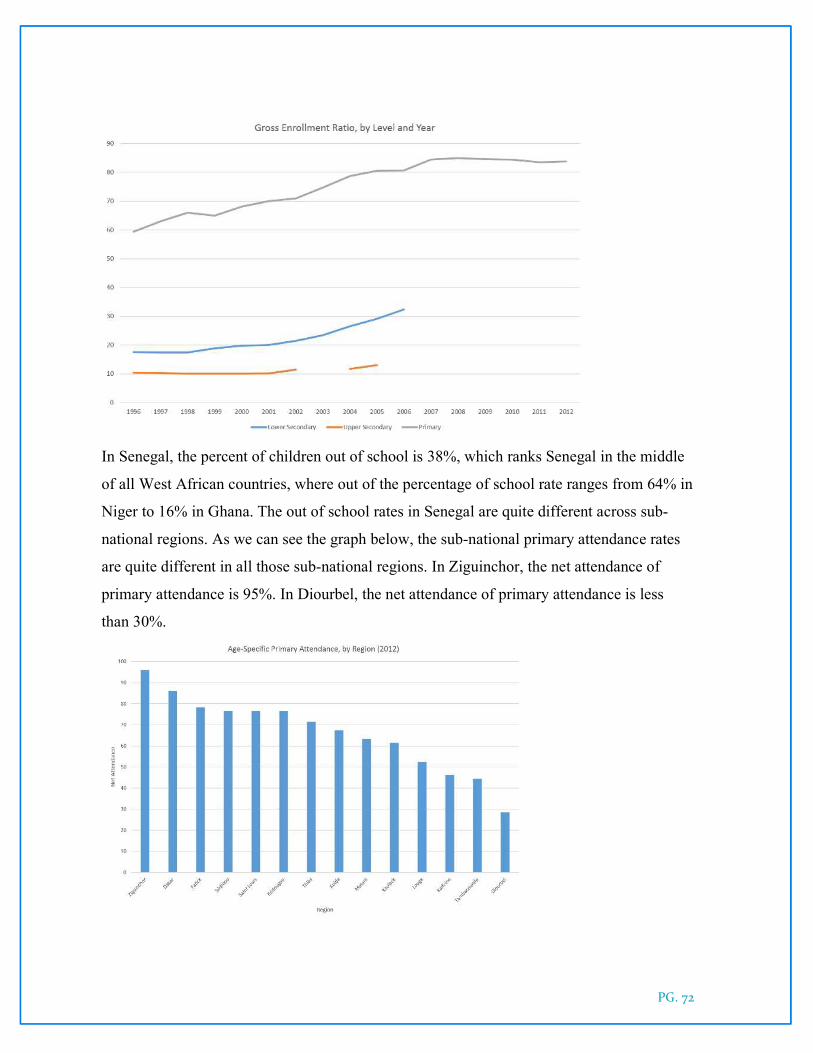
PG. 72
In Senegal, the percent of children out of school is 38%, which ranks Senegal in the middle
of all West African countries, where out of the percentage of school rate ranges from 64% in
Niger to 16% in Ghana. The out of school rates in Senegal are quite different across sub-
national regions. As we can see the graph below, the sub-national primary attendance rates
are quite different in all those sub-national regions. In Ziguinchor, the net attendance of
primary attendance is 95%. In Diourbel, the net attendance of primary attendance is less
than 30%.

PG. 73
Benin
MAP
The capital of Benin is Porto-Novo, but the seat of government is in Cotonou, the country's largest city and economic capital. The official language of Benin is French. However, indigenous languages such as Fon and Yoruba are commonly spoken as well. Benin has a majority of the population live in the south. There are about 42 African ethnic groups live in this country. These various groups settled in Benin at different times and also migrated within the country. Ethnic groups include:
the Yoruba in the southeast the Dendi in the north-central area the Bariba and the Fula in the northeast the Betammaribe and the Somba in the Atacora Range the Fon in the area around Abomey in the South Central the Mina, Xueda, and Aja on the coast
Benin has an inequality adjusted HDI index of 0.300, which ranks relatively high in ECOWAS areas. Low score indicates that the country has other challenges to worry about and may not be able to prioritize education. Politics Benin is one of Africa's most stable democracies. The current political system is derived from the 1990 Constitution of Benin and the subsequent transition to democracy in 1991. Since the end of the Marxist-Leninist regime in 1989, the country has organized six presidential

PG. 74
elections, seven legislative elections and three local elections peacefully. Also, Benin has a quite peaceful environment. The Global Peace Index of Benin is 1.958 in 2015, which ranks No.14 in Sub-Saharan Africa. Since Patrice Talon, a businessman and politician, won presidential elections in March 2016, the new government has promoted better political and economic governance, and has planned for political and institutional reforms to consolidate democracy, reduce poverty, and attract investments. Education The official language in Benin is French. However, since the advent of Democracy in1990, the language of English has been introduced and American English has been implemented with education. And Benin operates on a 6-4-3-4 system:
Primary School: 6 years Junior High School: 4 years Senior High School: 3 Years Bachelor degree: 3 years Master degree: 4 Years
In 1990, Benin had one of the world’s lowest primary and secondary school enrolment rates, with enormous gender and regional disparities in access to education. Since 1990, governments have placed a higher priority to address deficiencies in the education sector and developed with other partners to increase substantial funding. The expenditures on education sector have been a significant share of annual public expenditure, on average 23% of public expenditure is allocated to education. On average, the government expenditure per student is around $11.58. Student enrolment in primary schools increased a lot between 1989/90 and 2008/09. The improvement of primary gross enrolment rate (GER) is one of the world’s fastest rate over the period. During 1989/90, the GER was around 50% (only 36% for girls). By 2008/09, the GER was 109%. The improvements are associated with improvements in health and in infant mortality and morbidity rates, and particularly on malnutrition, and many other important aspects have also improved significantly since the early 1990s. Even with rapidly improvement on enrolment rate, but still Benin has a very poor literacy rate at the current stage. The overall literacy rate is 38.4%, male literacy rate is 49.9%, and female literacy rate is 27.3%. And Pupil-Teacher Ratio, the number of students who attend a school divided by the number of teachers in the institution, in Benin is 46 in 2014, which is quite high comparing with developed countries, which are usually in the range 20 – 30.

PG. 75
Burkina Faso
MAP
Burkina Faso is surrounded by six countries: Mali to the north, Niger to the east, Benin to the south east, Togo and Ghana to the south, and Côte d'Ivoire to the south west. In Burkina Faso, French is an official language of government and business. In 2015, the population of Burkina Faso was around 18 million people. And 90 percent of Burkina Faso’s population depends on subsistence farming. Rural population has been increased steadily. In 2015, Burkina Faso has about around 12,7 million people live in rural areas, increased from 4.2 million in 1060.
Graph: Rural Population in Burkina Faso
Burkina Faso has an inequality adjusted HDI index of 0.261, which ranks relatively low in ECOWAS areas, which indicates that Burkina Faso has other challenges to worry about and may not be able to prioritize education.

PG. 76
Politics Burkina Faso is a semi-presidential republic, whereby the Prime Minister of Burkina Faso is the head of government, and of a multi-party system. The president is the head of state. And both the President and the Government exercise executive power. Both the government and parliament exercise legislative power. The Congress for Democracy and Progress dominated the party system until 2014, and then it had lost influence in the country, and a bunch of opposition parties are trying to vie for power in elections that was schedule on November 29, 2015. Roch Marc Christian Kaboré was elected as the President. Burkina Faso has a relative peaceful environment comparing with other ECOWAS countries. The Global Peace Index of Benin is 1.994 in 2014, which ranks No.18 in Sub-Saharan Africa. Education Burkina Faso has been ranked one of the most illiterate country in the world. The overall literacy rate is 36%, male literacy rate is 43%, and female literacy rate is 29.3%. Education in Burkina Faso is structured primary, secondary, and higher education. It provides:
Primary Education Middle Education Secondary Education Vocational Education Tertiary Education
The education system is mainly on the French model and teaching language is French. After 6 years in primary school, students would spend 4 years in Junior high school. During Junior High school’s curriculum includes languages, geography, history, mathematics, and sciences. Very few students among Junior High could go to Senior High school. Primary education is technically free and mandatory until the age of 16. Even the education is free, and mandatory age is 16, but attendance is not enforced. Only about 35% of children with primary school age receive a basic education. Children need to pay for school supplies, and most of communities in each region are responsible for school build and teachers’ housing. Qualified student could also receive scholarships for further junior high and high school. And Pupil-Teacher Ratio, the number of students who attend a school divided by the number of teachers in the institution, in Benin is 44 in 2014, which is quite high comparing with developed countries, which are usually in the range 20 – 30.

PG. 77
APPENDIX IV
Interview Questions to Competitors
What criteria do you use when you enter a new country?
What are some red flags that you look for?
What are some must haves for potential countries?
How does language affect your ability to work in this country?
What methodologies do you use when you enter these countries?
What are the first steps you take before you start your work?
Do you partner with other NGOs?
If so, what process do you use to choose and align yourself with these partners?
Which region of [Mali] do you operate in?
How did you decide on working in this region?
Could you describe the political stability in the regions you operate?
How does this affect your work?
How have you been able to continue your work through these difficulties?
What is your relationship with [Mali] and local governing bodies?
How has this affected your work?
In what ways have you used these relationships to mitigate the instability in local
regions?
How important has it been for you to have existing infrastructure or education
ministries?
For example, how much has it helped or impeded you to work with existing schools
and teachers or to have to build this capital on your own?
How does the willingness of local communities to cooperate affect your work?
Would you say community attitudes and networks play a role in how your work is
implemented?
PG. 78
APPENDIX V
People Profile
Nicole Qing is a second-year graduate student at Columbia University School
of International and Public Affairs, concentrating International Finance and
Economic Policy. She has extensive experience in seeking policy solutions for
social issues in the metropolitan context. Prior to graduate school, she had
interned at UNICEF and various nonprofit organizations that involve a wide range of
stakeholders in the development spectrum. Her expertise include, among other things, policy
analysis, financial regulation, and economic development.
Gloria Soomi Oh is a Master of Public Administration degree candidate at
Columbia University's School of International and Public Affairs, with a
concentration in Urban and Social Policy, focused on Education Policy. She
is specializing in Advanced Policy and Economic Analysis. She also has a
Masters of Education from Temple University and a Bachelor of Arts in sociology from
Mount Holyoke College. She has classroom experience as a public school teacher in
Philadelphia, USA, and in Seoul, South Korea. She has also been head teacher and assistant
professor in the General English Program at Sookmyung Women's University in Seoul.
Ying Li graduated from Peking University with double degrees of Bachelor of
Science in Finance and Bachelor of Arts in International Relations and Public
Affairs. Having done internships in investment banking, private equity, consulting
and development and research with top companies and institutions in China, she
is in the Executive Master of Public Administration program, majoring Advanced Finance
and Management in SIPA, Columbia University. She has been working in a private equity
investment firm in New York since last summer and is pursuing future career in finance and
international affairs.

PG. 79
Xingxin Yu is a graduate student at Columbia University pursuing Master of
International Affairs, with a concentration in International Finance and
Economic Policy. Previously, he worked in Investment Banking Division at
Goetzpartners and Morgan Stanley in China, where he mainly focused on
cross-border merger and acquisitions. He received his bachelor degree of Accounting and
Finance from Purdue University.
Serdar Polat is pursuing a Master of Public Administration at the School of
International and Public Affairs, Columbia University, with a concentration in
economic and political development. Currently, he is on sabbatical from his
job as a Planning Expert in the Ministry of Development, Turkey, where he focuses on
education sector policy development, budget planning and researching. Also, he had worked
as a Head of Monitoring and Evaluation Department in the Ministry of National Education.
Srinivas Rajan is a Master of Public Administration 2017 candidate
specializing in economic policy management. He is an Instrumentation &
control engineer who went on to pursue an MBA in Strategy & HR and has
10 years of international experience with Siemens. He was the head of the
Continuous Improvement Program Office at Siemens China prior to enrolling at Columbia,
SIPA. He is a founding member of a political advocacy group in India called India Vikas
Party. He looks forward to his ‘second career’ in public policy consulting, advocacy and
international governance areas.