Appalachian Mathematics and Science Partnership (AMSP) Needs Analysis Surveys: Methodology and...
19
Appalachian Mathematics and Science Partnership (AMSP) Needs Analysis Surveys: Methodology and Results Harold Peach, Data Analyst AMSP Josh Poulette, Technical Research Associate AMSP Barbara Q. Shoemaker, PEP Coordinator AMSP Donald Long, Associate Director AMSP Dr. Stephen Henderson, Co-PI AMSP This brief research note details a survey that was conducted by the Appalachian Mathematics and Science Partnership in the fall of 2006 and the spring of 2007. This survey consisted of a ‘paper’ survey administered to a focus group, which facilitated the development of an online survey that was administered to 2,175 educators from AMSP partner school districts. The justification for and methodology and results of this survey are detailed below. This survey indicated that most respondents were, in general, quite willing to identify need areas as salient for their school or district, and that administrators were more likely to identify salient need areas than were teachers. The following sections provide an introduction and justification (Section 1), description of methodology (Section 2), results and analysis (Section 3), summary of limitations (Section 4) and conclusion (Section 5).
Transcript of Appalachian Mathematics and Science Partnership (AMSP) Needs Analysis Surveys: Methodology and...

Appalachian Mathematics and Science Partnership (AMSP) Needs Analysis Surveys:
Methodology and Results
Harold Peach, Data Analyst AMSP Josh Poulette, Technical Research Associate AMSP
Barbara Q. Shoemaker, PEP Coordinator AMSP Donald Long, Associate Director AMSP Dr. Stephen Henderson, Co-PI AMSP
This brief research note details a survey that was conducted by the Appalachian Mathematics and Science Partnership in the fall of 2006 and the spring of 2007. This survey consisted of a ‘paper’ survey administered to a focus group, which facilitated the development of an online survey that was administered to 2,175 educators from AMSP partner school districts. The justification for and methodology and results of this survey are detailed below. This survey indicated that most respondents were, in general, quite willing to identify need areas as salient for their school or district, and that administrators were more likely to identify salient need areas than were teachers. The following sections provide an introduction and justification (Section 1), description of methodology (Section 2), results and analysis (Section 3), summary of limitations (Section 4) and conclusion (Section 5).

2
Section 1: Introduction and Justification
The general motivation for the survey described in detail below stems from the goals of the
Appalachian Mathematics and Science Partnership (AMSP)1. A close examination of each of these goals
makes it clear that an awareness of the perspectives of PreK-12 mathematics and science educators is
critically important to the work of the AMSP. Along with higher education faculty, this is the primary
group of personnel involved in facilitating mathematics and science education. Therefore, the specific
goals that this survey research were designed to address the views and opinions of PreK-12 school
personnel. These goals are:
1. Assess the mathematics and science education professional development needs in preK-12 schools and
districts.
2. Develop an understanding of the barriers that inhibit PreK-12 educators from delivering highly
effective instruction and leading to increased student learning.
3. Compare the results of a national survey of STEM instructional standards with results from a similar
survey of Appalachian schools and districts.
4. Determine the sources of the data underpinning PreK-12 educators’ views on these matters.
The purpose of the focus groups and the online survey was to generate a profile of the viewpoints
of AMSP-involved PreK-12 school personnel relative to the goals of the AMSP. The data collected is
1 AMSP serves students and educators by emphasizing strong partnerships that tackle local needs and build grassroots support to: • Enhance schools’ capacity to provide challenging curricula for all students and encourage more students to
succeed in advanced courses in mathematics and the sciences; • Increase the number, quality and diversity of mathematics and science teachers, especially in underserved
areas; • Engage and support scientists, mathematicians, and education faculty at local colleges and universities to
work and build partnerships with K-12 educators and students; • Contribute to a greater understanding of how students effectively learn mathematics and science and how
teacher preparation and professional development can be improved, especially in rural areas; and, • Promote institutional and organizational change in education systems — from kindergarten through
graduate school — to sustain partnerships’ promising practices and policies.

3
currently being utilized to facilitate the design of effective activities and programs. Note that data was
collected from two sources with the potential for overlap: district-level focus groups and surveys of
individual school district personnel.
Section 2: Survey Methodology
In the fall of 2006, focus-group meetings were carried out by AMSP with the participation of
stakeholders from 31 (60.8%) of the 51 AMSP school districts. Each district self-selected the members of
its team, but AMSP suggested that teams include a district level and school level administrator, as well as
mathematics and science educators. One meeting was held in each of the 4 AMSP regions, in locations
geographically convenient for the districts in that region.
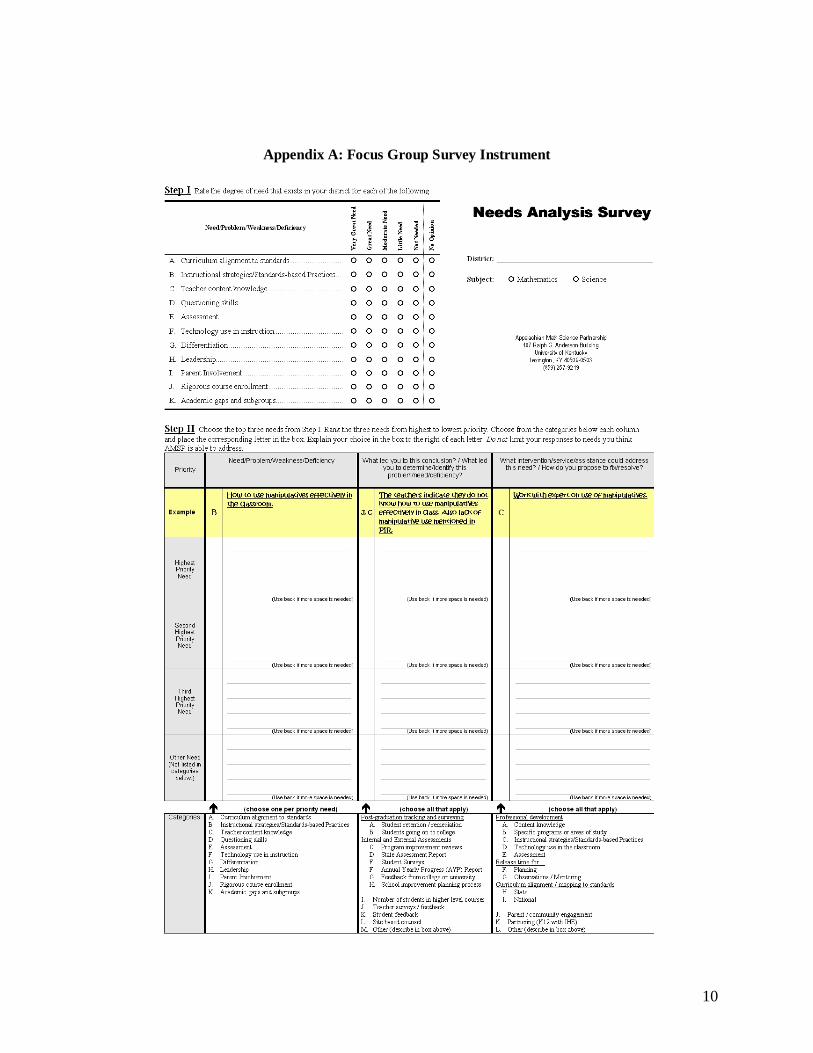
Each group was given an instrument (see Appendix A) to guide their discussion. This instrument
was developed using the needs districts had previously identified in proposals submitted to AMSP or in
school improvement plans. Needs identified by AMSP in the course of classroom observations and
evaluation instruments used at AMSP workshops were also used.
Participants were instructed to use the instrument to record their consensus from their discussions
with groups of their peers, not as an individual survey instrument. They were first asked to discuss the
degree to which their district needed assistance with each area listed in Step 1. Then, in Step 2, they were
asked to rank the needs listed in Step 1 and record the top 3 needs in the blanks provided on the form. For
these needs, the districts were asked to provide more detail and record the sources of information they
used to identify each need and how they believed each need could best be addressed. At the end of the
session, completed instruments and notes were collected by the AMSP staff and examined.
The findings from this examination were used to create an online survey (see Appendix B),
administered in the spring of 2007. District and school level administrators and mathematics and science
teachers who had participated in at least 1 AMSP activity over the 4 year life of the project were sent
emails (when available) and paper correspondence explaining the purpose of the survey, soliciting their
participation, and providing a link to the Web-based survey instrument. Some of these individuals had
4
been among the focus group participants at the fall meetings. Other individuals had not participated in
those meetings. The final response rate was nearly 30%2.
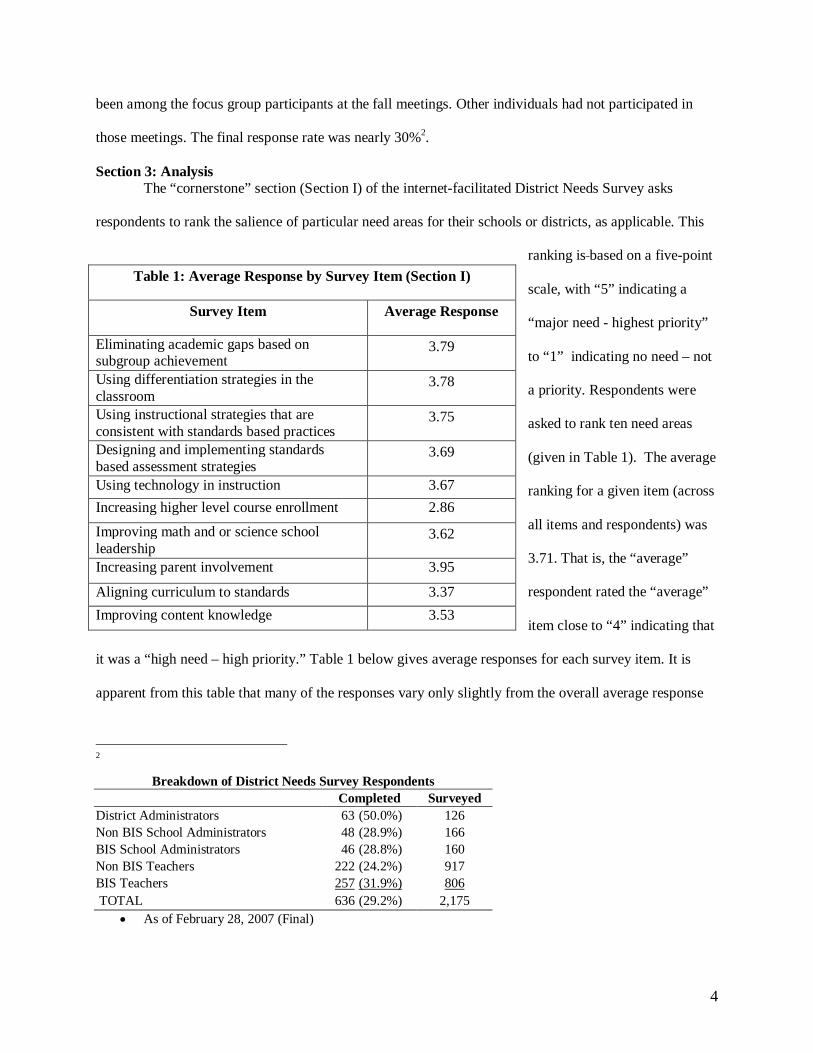
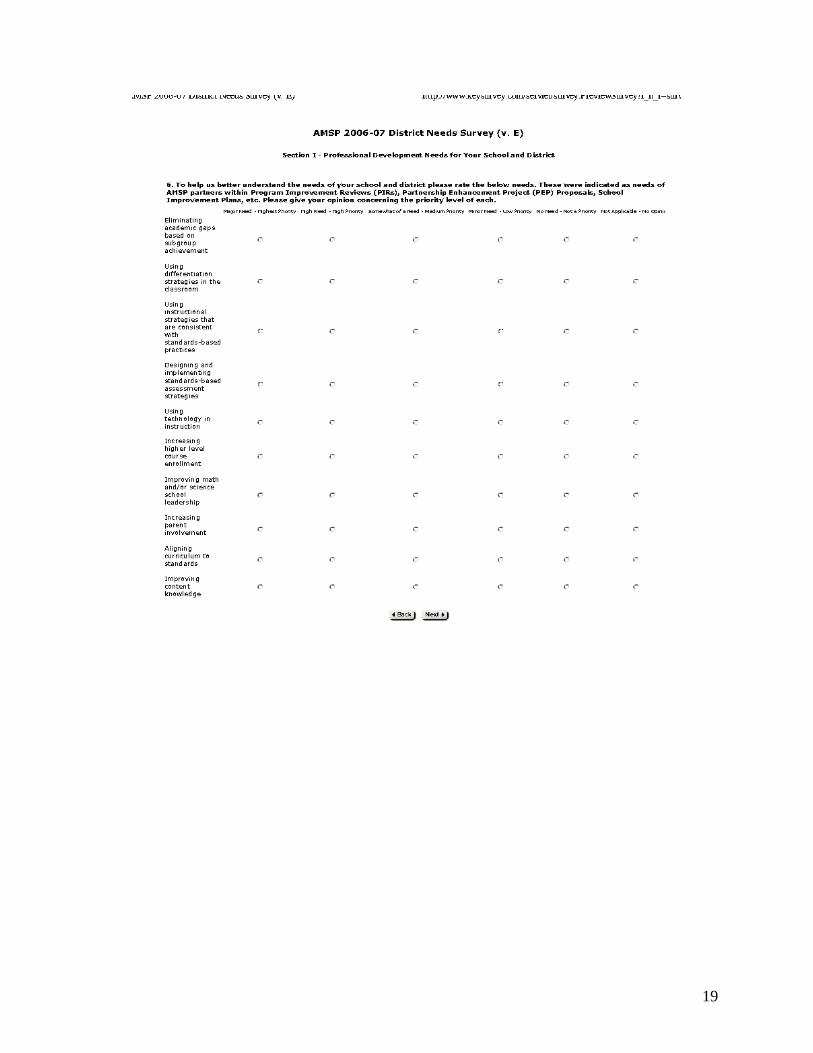
Section 3: Analysis The “cornerstone” section (Section I) of the internet-facilitated District Needs Survey asks
respondents to rank the salience of particular need areas for their schools or districts, as applicable. This
ranking is based on a five-point
scale, with “5” indicating a
“major need - highest priority”
to “1” indicating no need – not
a priority. Respondents were
asked to rank ten need areas
(given in Table 1). The average
ranking for a given item (across
all items and respondents) was
3.71. That is, the “average”
respondent rated the “average”
item close to “4” indicating that
it was a “high need – high priority.” Table 1 below gives average responses for each survey item. It is
apparent from this table that many of the responses vary only slightly from the overall average response
2
Breakdown of District Needs Survey Respondents Completed Surveyed District Administrators 63 (50.0%) 126 Non BIS School Administrators 48 (28.9%) 166 BIS School Administrators 46 (28.8%) 160 Non BIS Teachers 222 (24.2%) 917 BIS Teachers 257 (31.9%) 806 TOTAL 636 (29.2%) 2,175 • As of February 28, 2007 (Final)
Table 1: Average Response by Survey Item (Section I)
Survey Item Average Response
Eliminating academic gaps based on subgroup achievement
3.79
Using differentiation strategies in the classroom
3.78
Using instructional strategies that are consistent with standards based practices
3.75
Designing and implementing standards based assessment strategies
3.69
Using technology in instruction 3.67
Increasing higher level course enrollment 2.86
Improving math and or science school leadership
3.62
Increasing parent involvement 3.95
Aligning curriculum to standards 3.37
Improving content knowledge 3.53

5
of 3.71. However, some marked departures exist: the “Increasing higher level course enrollment” item
exhibits a significantly lower average response than any other item at 2.86 (though this relatively extreme
value is likely due to the inapplicability of this item to elementary and middle school environments, as
explained below). The responses for the “aligning curriculum to standards” and “improving content
knowledge” items are also noticeably lower than the average response value, while the “Increasing parent
involvement” exhibits a slightly higher-than-average response value. Overall, the ten survey items from
Section I display responses that are rather closely gathered around the average with only a few
exceptions.
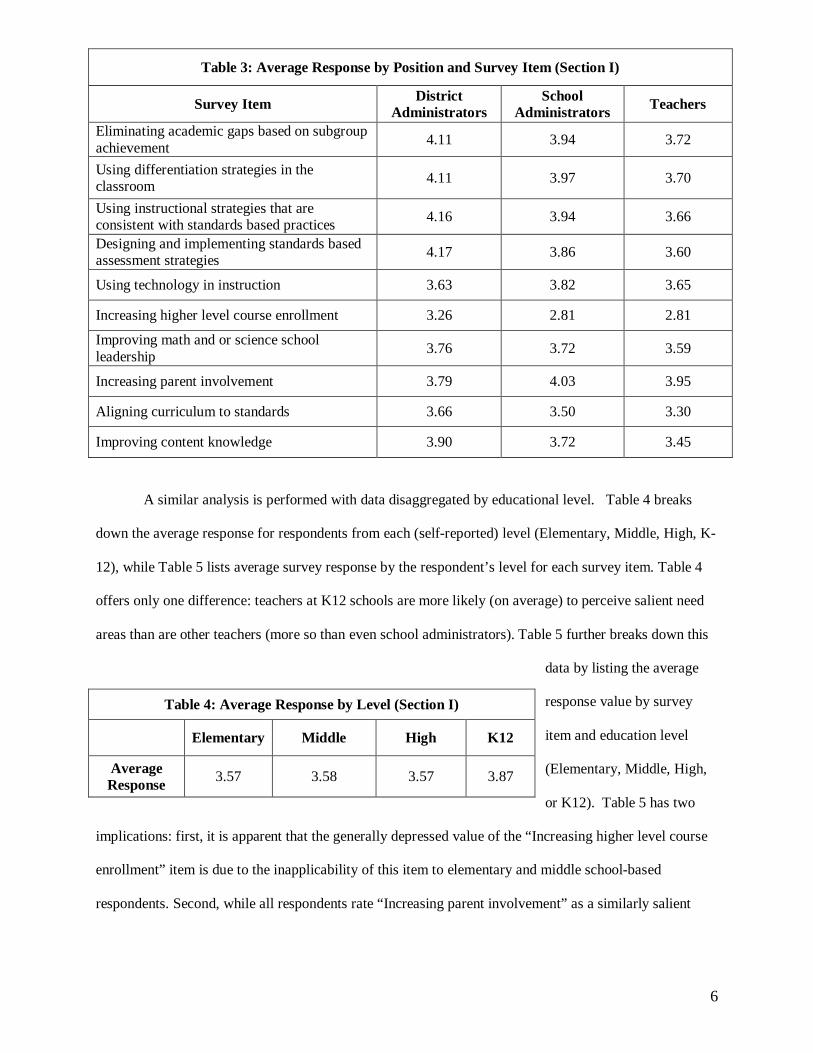
A more detailed analysis is given below in Table 2. In this table, respondents are disaggregated
and grouped according to their (self-identified) position type3. The averages for these position types
differ. respondent is, the more likely The administrators were more likely to perceive higher need for the
given set of items in Section I.
The overall averages differ
across position type, as
respondents from the different
positions display different rating behavior for the ten survey items from Section I. It is clear from Table 3
that the different respondent classes (by position) display some interesting variation in the values they
assign to the survey items from Section I. For example, the three position groups give quite similar
assessments of the salience of “Improving math and or science school leadership,” while they seem to
have markedly different opinions on the priority of “Improving content knowledge” or “Designing and
implementing standards based assessment strategies.” In summary, the three position groups display
somewhat different assessments of the ten possible need areas included in Section I. For all items as a
whole (and for most items individually), district administrators are more likely than the other groups (and
school administrators more likely than teachers) to assign a higher need priority to a given survey item.
3 Options: Teacher, School Administrator, District Administrator, Other.
Table 2: Average Response by Position (Section I)
District
Administrators School
Administrators Teachers
Average Response
3.86 3.73 3.54
6
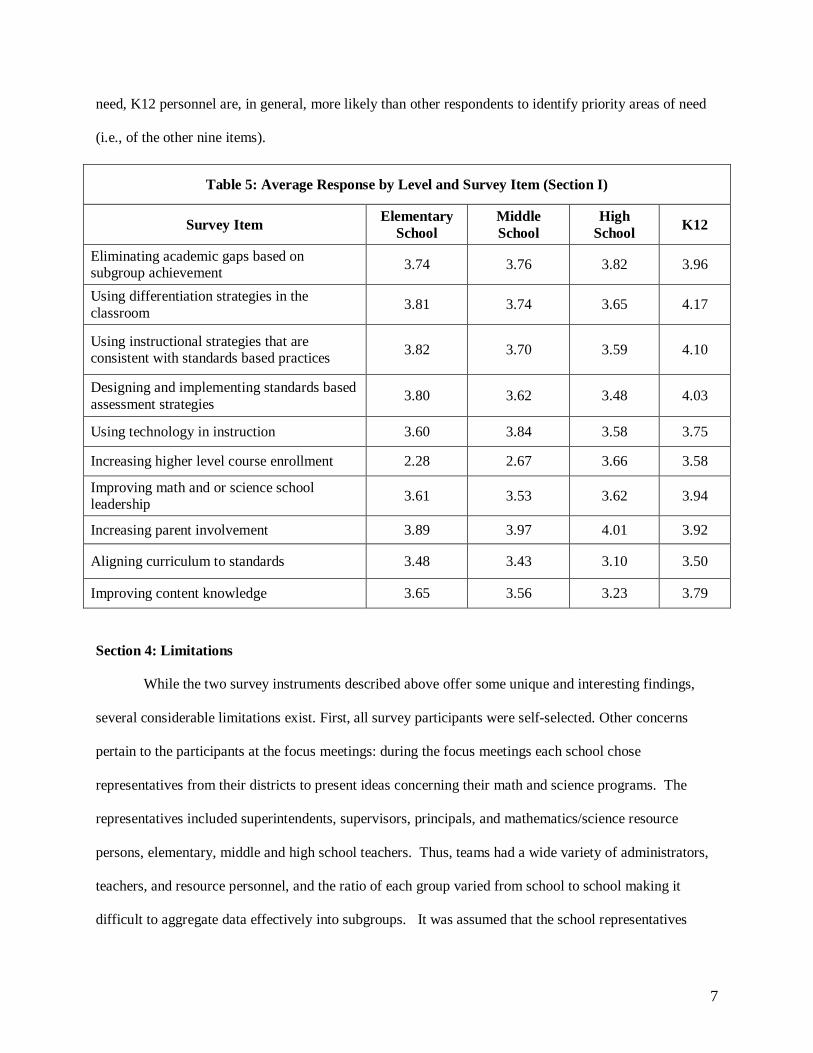
A similar analysis is performed with data disaggregated by educational level. Table 4 breaks
down the average response for respondents from each (self-reported) level (Elementary, Middle, High, K-
12), while Table 5 lists average survey response by the respondent’s level for each survey item. Table 4
offers only one difference: teachers at K12 schools are more likely (on average) to perceive salient need
areas than are other teachers (more so than even school administrators). Table 5 further breaks down this
data by listing the average
response value by survey
item and education level
(Elementary, Middle, High,
or K12). Table 5 has two
implications: first, it is apparent that the generally depressed value of the “Increasing higher level course
enrollment” item is due to the inapplicability of this item to elementary and middle school-based
respondents. Second, while all respondents rate “Increasing parent involvement” as a similarly salient
Table 3: Average Response by Position and Survey Item (Section I)
Survey Item District Administrators
School Administrators Teachers
Eliminating academic gaps based on subgroup achievement
4.11 3.94 3.72
Using differentiation strategies in the classroom
4.11 3.97 3.70
Using instructional strategies that are consistent with standards based practices
4.16 3.94 3.66
Designing and implementing standards based assessment strategies
4.17 3.86 3.60
Using technology in instruction 3.63 3.82 3.65
Increasing higher level course enrollment 3.26 2.81 2.81
Improving math and or science school leadership
3.76 3.72 3.59
Increasing parent involvement 3.79 4.03 3.95
Aligning curriculum to standards 3.66 3.50 3.30
Improving content knowledge 3.90 3.72 3.45
Table 4: Average Response by Level (Section I)
Elementary Middle High K12
Average Response
3.57 3.58 3.57 3.87
7
need, K12 personnel are, in general, more likely than other respondents to identify priority areas of need
(i.e., of the other nine items).
Section 4: Limitations
While the two survey instruments described above offer some unique and interesting findings,
several considerable limitations exist. First, all survey participants were self-selected. Other concerns
pertain to the participants at the focus meetings: during the focus meetings each school chose
representatives from their districts to present ideas concerning their math and science programs. The
representatives included superintendents, supervisors, principals, and mathematics/science resource
persons, elementary, middle and high school teachers. Thus, teams had a wide variety of administrators,
teachers, and resource personnel, and the ratio of each group varied from school to school making it
difficult to aggregate data effectively into subgroups. It was assumed that the school representatives
Table 5: Average Response by Level and Survey Item (Section I)
Survey Item Elementary
School Middle School
High School K12
Eliminating academic gaps based on subgroup achievement
3.74 3.76 3.82 3.96
Using differentiation strategies in the classroom
3.81 3.74 3.65 4.17
Using instructional strategies that are consistent with standards based practices
3.82 3.70 3.59 4.10
Designing and implementing standards based assessment strategies
3.80 3.62 3.48 4.03
Using technology in instruction 3.60 3.84 3.58 3.75
Increasing higher level course enrollment 2.28 2.67 3.66 3.58
Improving math and or science school leadership
3.61 3.53 3.62 3.94
Increasing parent involvement 3.89 3.97 4.01 3.92
Aligning curriculum to standards 3.48 3.43 3.10 3.50
Improving content knowledge 3.65 3.56 3.23 3.79

8
were involved with mathematics, science and AMSP activities but we have insufficient information as to
the process used to assign personnel to the project: thus, we cannot say with confidence that the group
was proficient in assessing district and school needs.
The highly structured nature of the online survey is also a potential limitation: open response was
not an option on the online survey. The online survey allowed individuals to choose answers which were
directed to pre-selected responses that did not allow the participant to explain their reason for making the
choice. Expressions of individual views on the mathematics and science program in the relevant school
or district were severely limited without an open response mechanism. With the online survey, selections
were ranked, but there was not a mechanism to link the ranking with a specific determination or data
source for the need.
Section 5: Conclusion
During this study a total of 2,175 AMSP participants (including administrators and math and
science teachers) were surveyed with a total of 636 completing the survey (plus an additional 85 who
participated in the focus group survey). The unique two-step survey process allowed AMSP personnel to
generate a profile of the viewpoints of AMSP-involved PreK-12 school personnel on the most salient
educational needs at their school or district. This series of surveys and data collection led to three distinct
outcomes: (1) Focus groups were able to discuss individual needs with their own district personnel and
share the information with regional peers. It is rare that school districts make opportunities to openly
discuss needs or concerns with each other. (2) The follow-up online survey allowed for an expanded
view of school and district needs as identified by both teachers and administrative personnel. The closed-
response nature of this survey device produced data that was more easily to analyzed (as in Section 3) and
holds the potential for more analysis than was conducted to date. (3) Finally, this process provided AMSP
with vital information on the needs of the PreK-12 partners. This information will be crucial in helping
AMSP (and other projects) better address the need areas of its population of partners which sorely need
assistance.

9
Student achievement for the almost 170,000 students in the Appalachian Mathematics and
Science Partnership’s partner districts is significantly lower than state averages.. 4 The Appalachian
Mathematics and Science Partnership seeks to eliminate the “achievement gap” in science, mathematics,
and technology in the Central Appalachian region. The information gleaned by the survey tools described
will aid AMSP, and other agencies/projects, design programs which can help eliminate this “achievement
gap.”
________________________ 4 MSPnet, http://hub.mspnet.org/index.cfm/showcase_project/project_id-5
10
Appendix A: Focus Group Survey Instrument

11
Appendix B: Online Survey Instrument4
4 Please note that only part of the online survey is included in order to keep paper length to a minimum.
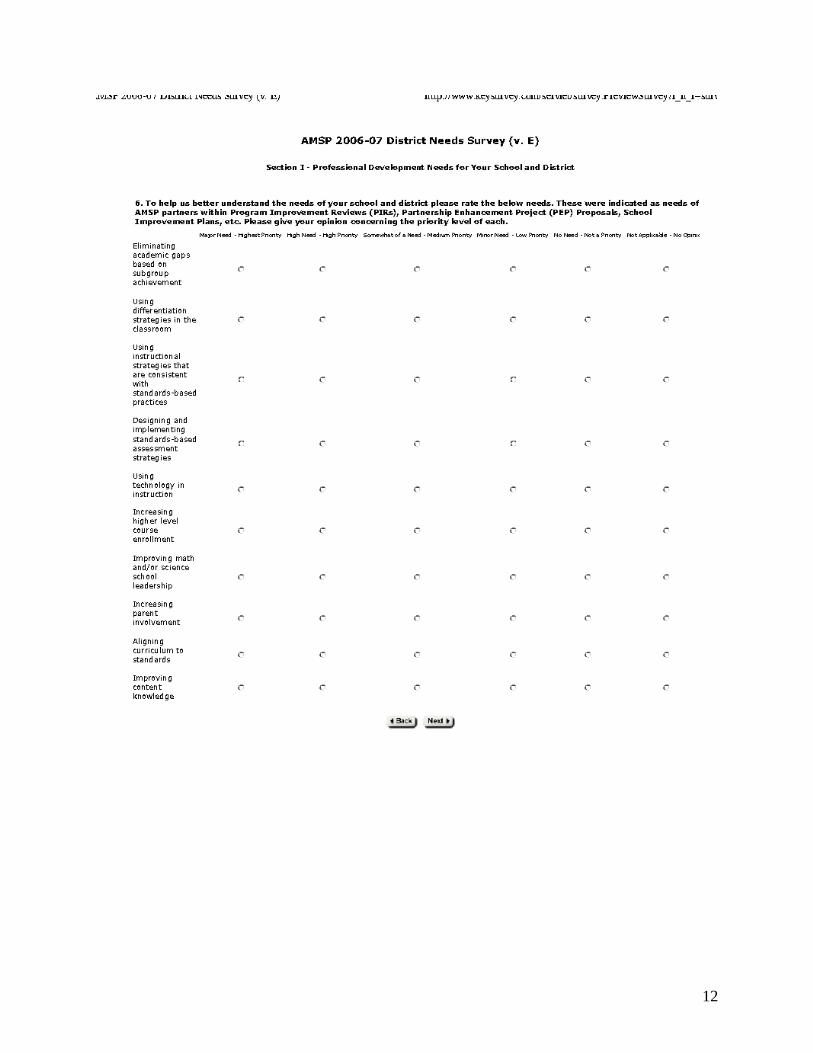
12
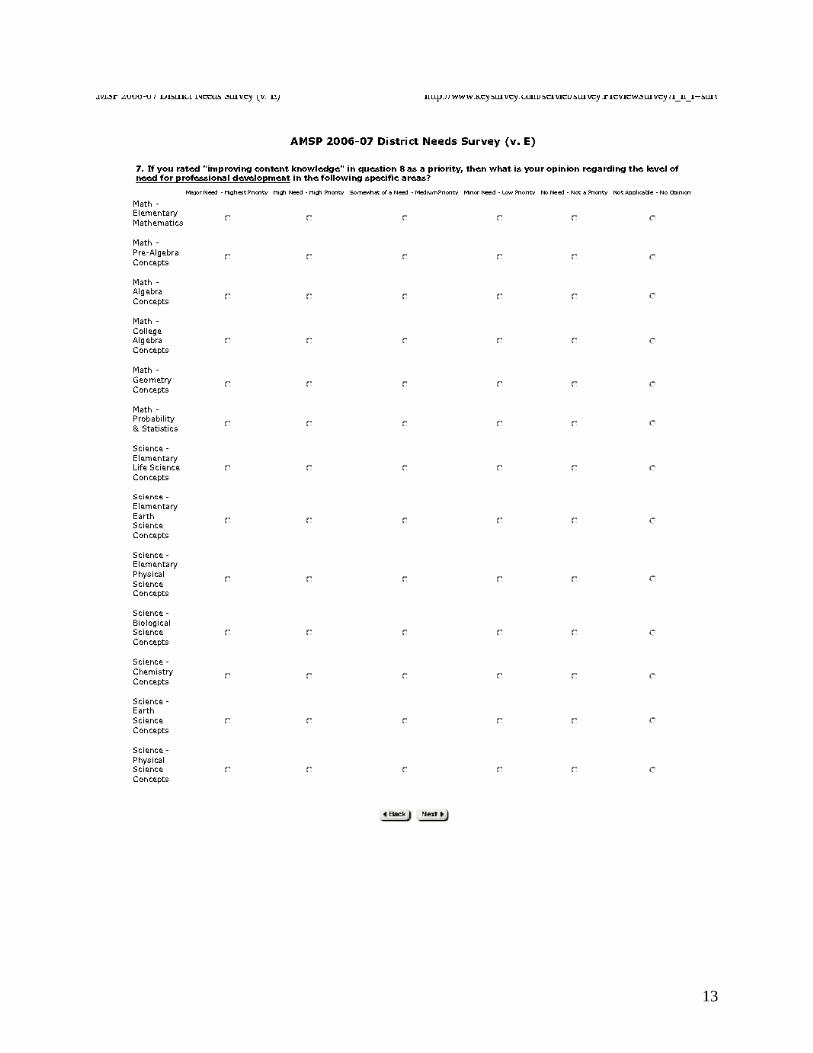
13
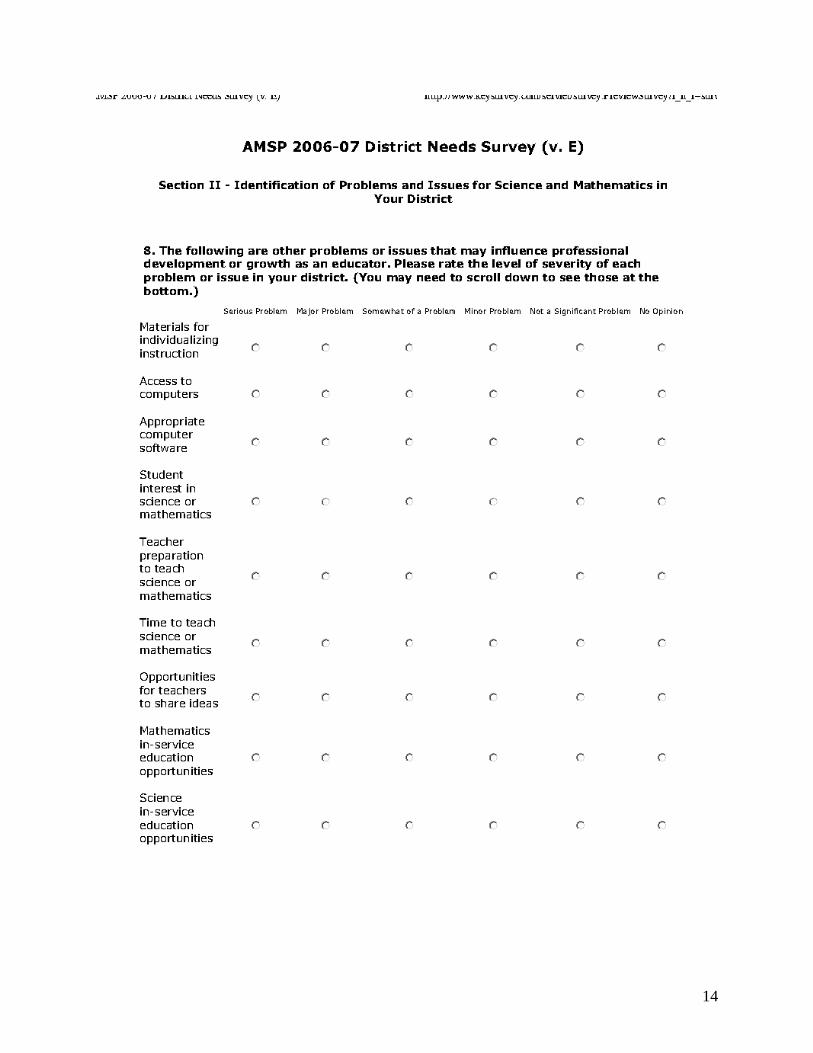
14

15
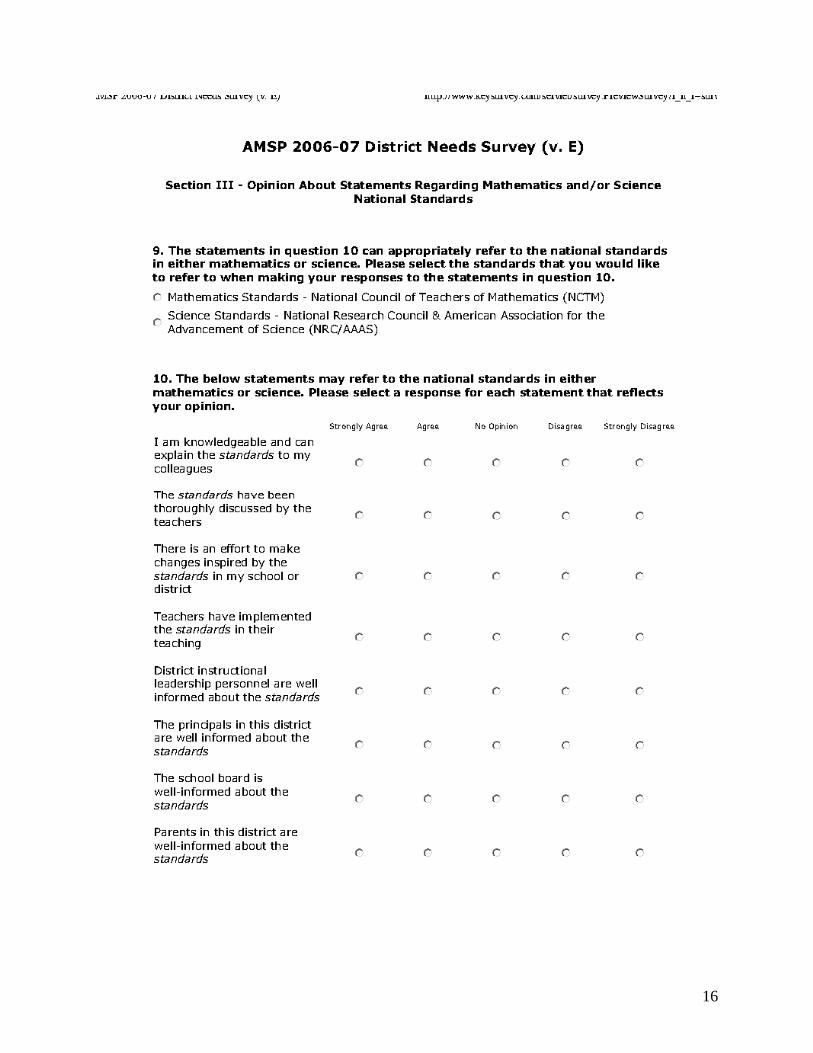
16
17
Banilower,E., Boyd,S., Pasley, J. Weiss, I. Lessons from a Decade of Mathematics and Science Reform, Horizon Research, Inc. Chapel Hill, NC. 2006
18
19