apollo-tyr-2017-2018.. - xampp 1.8.2
254
-
Upload
khangminh22 -
Category
Documents
-
view
0 -
download
0
Transcript of apollo-tyr-2017-2018.. - xampp 1.8.2


The sitting fees for attending the Board Meetings and the commission as approved by the members within the overall ceiling of 1 % of the net profits of the Company, is paid to the Directors of the Company other than Managing Directors in proportion to their tenure of Directorship. Ms. Anjali Bansal is entitled to a remuneration of� 2.00 million as commission, as approved by the Board, for FY2018.
In the opinion of the Board, Ms. Anja Ii Bansal fulfils the conditions specified in the Companies Act, 2013, rules made thereunder and SEBI (Listing Obligations & Disclosure Requirements) Regulations 2015, for her appointment as an Independent Director of the Company and she is independent of the management. Copy of the draft letter for appointment of Ms. Anjali Bansal as an Independent Director would be available for inspection, without any fee, by the members at the Registered Office and Corporate Office of the Company during normal business hours on any working day, excluding Saturday and at the venue of the meeting.
The Board considers that her continued association would be of immense benefit to the Company and it is desirable to continue to avail services of Ms. Anjali Bansal as an Independent Director.
This Explanatory Statement may also be regarded as a disclosure under Regulation 36 of the SEBI (Listing Obligations & Disclosure Requirements) Regulations, 2015.
None of the Directors or KMPs of the Company or their relatives except Ms. Anjali Bansal herself is concerned or interested
(financial or otherwise) in the resolution.
The Board of Directors recommends resolution set out at item no.5 for your consideration and approval.
Item No. 6
In order to meet Company's ongoing Capex requirements, the Members of the Company at the Annual General Meeting held on July 5, 2017 had passed the resolution for raising of funds not exceeding �15,000 million through Issue of Secured NonConvertible Debentures (NCDs) through Private Placement, in one or more tranches within overall borrowing limits of the Company. The above resolution is valid upto July 4, 2018.
In order to meet funds requirements for Company's growth, the Board approved raising of funds through issue of NCDs for not exceeding �15,000 million.
In order to enable the Company to offer or invite subscriptions for Non-Convertible Debentures on a Private Placement basis, in one or more tranches, as per provisions of Section 42 of the Companies Act, 2013, read with Rule 14 of the Companies (Prospectus and Allotment of Securities) Rules, 2014 and Rule 18 of the Companies (Share Capital and Debentures) Rules, 2014, a Company shall not make a Private Placement of its securities unless the proposed offer of securities or invitation to subscribe to securities has been previously approved by the Members of the Company by a Special Resolution for each of the offers or invitations. However, in case of offer or invitation for "Non-Convertible Debentures", it shall be sufficient if the Company passes a Special Resolution only once in a year for all the offers or invitations for such Debentures during the year.
Further, the Board of Directors of the Company (the "Board") or any duly constituted Committee of the Board or such other authority as may be approved by the Board, shall be authorized to determine the terms of the Issue, including the class of investors to whom the NCDs are to be allotted, the number of NCDs to be allotted in each tranche, issue price, tenor, interest rate, premium/discount to the then prevailing market price, amount of issue, discount to issue price to a class of bond/ debenture holders, listing, issuing any declaration / undertaking etc. required to be included in the Private Placement Offer Letter and any other regulatory requirement for the time being in force.
The Board of Directors of the Company, at its meeting held on May 10, 2018, had approved the above proposal and recommends the passing of proposed Special Resolution by Members of the Company.
The approval of the Members is being sought by way of a Special Resolution under Section 42 & 71 of the Companies Act, 2013, read with the Rules made there under, to enable the Company to offer or invite subscriptions for NCDs on a Private Placement basis, in one or more tranches, during the period of one year from the date of passing of the resolution, within the overall borrowing limits of the Company, as approved by the Members from time to time.
None of the Directors or Key Managerial Personnel (KMPs) of the Company or their relatives is concerned or interested
(financial & otherwise) in the resolution.
The Board of Directors recommends resolution set out at item no.6 for your consideration and approval.
9


ON A NEWROAD.
ALWAYS.
apollotyres.com
Annual Report 2017-18

26
Management Discussion
and Analysis
10
Key Performance Highlights
12
Integrated Report
01
On a New Road. Always.
Contents
Corporate Overview 01 On a New Road. Always.02 Chairman’s Message04 Vice Chairman’s Message06 Board of Directors08 Management Board10 Key Performance Highlights12 Integrated Report26 Management Discussion & Analysis42 Sustainability Snapshot
Statutory Reports62 Board’s Report71 Annual Report on CSR78 Business Responsibility Report101 Corporate Governance Report
Financial Statements
123 Standalone Financial Statements177 Consolidated Financial Statements

On a New Road. Always.At Apollo Tyres, we further cemented our position in FY2018 as a leading tyre manufacturer by recording a profitable and sustainable growth. We reached this high point on the back of our vision to create relevant products and renew capabilities to meet dynamic customer needs.
FY2018 was a year marked with many milestones and achievements. Right from the inauguration of the new plant in Hungary and announcement of a new Greenfield facility in India to high-decibel football sponsorships, we are inching closer to achieving the Company’s 2020 vision –
‘To be a premier tyre company with a diversified and multinational presence.’
With the new plant in Hungary, Apollo Tyres has progressed and expanded supplies to Original Equipment Manufacturers (OEMs) in Europe. This marks our transformation in the region from a strong replacement tyre supplier to diversifying into the OEM market.
The APMEA business recorded a noteworthy J10,000 crore growth figure, a significant milestone for the Company.
Closer home, we ramped-up our Chennai plant’s capacity by 50% and our Bias business saw a huge resurgence fuelled by a massive quality improvement programme. This year, we also laid the foundation stone for our next Greenfield plant in Andhra Pradesh, which will help expand our capacity for Passenger Car Radial (PCR) tyres and later for Truck and Bus Radial (TBR) tyres.
In FY2018, we paved a new path for ourselves with the support of every single member of the Apollo One Family. As we embark on the journey to achieve our long-term goals, we stay committed to our business vision of growing responsibly. At Apollo, we believe that the conservation of our natural resources and growth of our communities is central to business sustainability.
Hence, as we match the dynamic pace of the market environment, we remain rooted to our core objective of sustained value creation for all our stakeholders.
About this reportThis Annual Report is aimed at meeting both financial and non-financial information requirements of all our stakeholders, including investors, customers, suppliers, dealers, employees and contractors, to help them take informed decisions regarding the Company. Based on the requirement of SEBI – LODR of 2015 and the circular released on ‘Integrated Reporting’, in 2017, we are following the guiding principles and content elements of the International Integrated Reporting (IR) Framework. The Report presents information on the Company’s value-creation process, its strategic framework, the key risks, the key resources and capitals used, the inter-linkages and the material issues, thereby narrating our ‘integrated thinking’ process to our stakeholders.
8.5%ROE
`30.80 bnCAPITAL EXPENDITURE
`149.29 bnGROSS SALES
Key highlights for FY2018
`17.68 bnEBITDA
`7.24 bnNET PROFIT

On a Firm Growth Trajectory
Dear Members,Since the inception of Apollo Tyres, it has been my resolve to deliver value to all our stakeholders, including employees, shareholders, customers, partners and other relevant communities.
In this journey, your Company has had to think and act differently as compared to others. We invested in the Chennai plant when conventional wisdom dictated to avoid any investments during recessionary times or made international acquisitions when we were told to cover our flanks in India. Of course, going against the tide would not have been possible without the faith of our team and you, our shareholders, along with the dedication and hard work put in by each member of the Apollo Family.
Led by our long-term vision to become a global leader in the industry and guided by our values, we continue to have an agile and dynamic approach to adapt to changing market realities. Yet at the core, we continue to pursue our profitable growth strategy focussed on a three-pronged approach – consolidate market position in existing markets and seek new markets/segments, continue investment in both the brands – Apollo and Vredestein – and capacity expansion via Greenfield facilities; and seek other growth opportunities.
Looking back at FY2018, I see it as a year of continuous efforts around our strategy, with a focus on capacity expansion and building the brands. We inaugurated our sixth manufacturing plant in Hungary, added capacities in our plants in India and announced another Greenfield in India. The latter part of FY2018 saw the Company announcing a deeper connect with football in India, the UK and Hungary. From an industry perspective, the big heartening news was that the Government of India acted upon the industry’s plea to impose custom duties on the low-cost Chinese
imports. I thank the Government for enforcing the duties and helping provide a level playing field in the country. The implementation of the Goods and Services Tax (GST) further aided all tyre manufacturers in India to provide safe and tested products for the customers, as against unsafe low-cost imports.
Over the years, one of my key endeavours has been to build the Company as a strong institution. We have worked hard to create efficient processes and robust policies. Recognising the culture created in the Company, the Great Place to Work institute named Apollo Tyres as one of India’s Best Workplaces in Manufacturing. The institute rated us highly for our transparency in the performance management process, especially the variable pay, and the employee development programmes. Another feather in our cap was the recognitions we received from various vendors, including Hyundai and Maruti Suzuki.
In pursuit of its strategies, your Company never loses sight of its commitment to social responsibility and sustainability. We have ensured that these efforts are embedded into our commercial activity or business strategy and hence are an intrinsic part of our business as usual. Even as we continue to win laurels for our Corporate Social Responsibility (CSR) activities, I feel that the real joy for me and the team is to see the positive impact we are able to bring in the lives of our stakeholders. During FY2018, we reached out to our rubber tapper community and co-created income-generation opportunities for the rubber
tappers’ wives. The rubber sheet unit will be run by a group of women, who have been trained by us and the Rubber Board on tapping, sheet making, sheet smoking and general entrepreneurial skills. Another initiative in this area was the launch of our Mobile Medical Unit for checking the health of truckers. This step has helped us expand the reach of our healthcare initiative to truckers who do not enter the transhipment hubs where we provide healthcare facilities.
Looking at FY2019, I continue to be bullish on our key markets – India, Europe and ASEAN. The economies have displayed strong growth and with fundamentals in place, I see them moving northward. While I am aware that we will face challenges in each market, I am confident that your Company is on a firm growth trajectory. This confidence is due to the trust continuously reposed by each one of you, our valuable shareholders. I would also like to thank our bankers, various financial institutions and the various State and National Governments where we operate, network partners and business partners who have allowed us to surpass the goals we had set for ourselves.
Of course, the journey would not happen but for our employees. It is with pride that I talk about the strong culture in the Company where our individual accomplishments are directed towards achieving the Company milestones and marching together to fulfil our Vision 2020. On behalf of the Board of Directors, I would like to acknowledge every single employee for having stood by Apollo and actively contributed to its success.
Yours sincerely,
Onkar S. Kanwar
Chairman and Managing Director
Chennai Plant Hungary Plant
Chairman’s Message
2

Looking at FY2019, I continue to be bullish on our key markets – India, Europe and ASEAN. The economies have displayed strong growth and with fundamentals in place, I see them moving northward.
3
Corporate Overview / Statutory Reports / Financial Statements
Apollo Tyres Ltd Annual Report 2017-18

Dear Members,On a New Road. Always – this is not just the theme for the year’s Annual Report but raison d’etre of your Company’s profitable and sustainable growth journey and behind each of its milestones and achievements.
Pushing the Envelope and Always Going the Distance on ‘New Roads’
Vice Chairman’s Message
4

FY2018 was a year marked with frantic activity at Apollo Tyres. Commercial production of the new plant in Hungary, announcement of a new Greenfield facility in India, high-decibel football sponsorship in India… I am sure that as you read through the pages, you will see the efforts taken by your Company to achieve its 2020 vision – ‘To be a leading and premier tyre company with a diversified and multinational presence’. We continued to push the envelope and always go the distance on New Roads with enthusiasm and exhilaration.
The year started with a major leap to our globalisation journey with the inauguration of the Company’s first Greenfield plant in Hungary by the Prime Minister of Hungary, Viktor Orbán. From being a replacement market focussed Company in Europe, the year saw us aggressively pursuing a strategy of building relationships with original equipment manufacturers in Europe and we have seen a few initial wins. It is heartening to note that the Company’s premium brand, Vredestein, has been selected as a fitment on the Volkswagen Polo, SEAT Ibiza and Ford EcoSport and the supplies have already begun to these auto makers. I am confident that this facility, along with the superior product range, will help us further increase our presence and market share in Europe.
For Apollo Tyres, FY2018 was a year of big achievements as our APMEA business achieved a significant financial milestone of `10,000 crores and Europe achieved its own record growth target. It was a synergistic flow across the regions to achieve these goals. The Chennai plant ramped-up its capacity by 50% and the Bias business saw a huge resurgence on the back of a massive quality improvement programme. To fulfil the regional objectives, we launched multiple new products across various countries, segments and applications. Further, given the confidence about our strategy and the belief in the future of the industry and Apollo Tyres, we laid the foundation stone for our next Greenfield plant in Andhra Pradesh, to expand our capacity for both passenger car and truck/bus radial tyres.
One of the key focus areas in achieving our long-term vision is to become a brand of choice. The year saw significant activities in this journey as we continued our focus on football in our key markets. Your Company saw a deeper engagement with the game in India, where the sports is growing rapidly in popularity and engagement. We associated with the I-league team, Minerva Punjab FC, as the title sponsor
and with the Indian Super League (ISL) team, Chennaiyin FC, as the principal sponsor. Both teams emerged as winners in their respective leagues and helped connect Apollo with football fans across the country. We also partnered with ISL and brought in the world’s best freestyle football artists to popularise the sport and engage with the enthusiastic fans. Beyond India, the Company joined hands with the English Premier League club Crystal Palace Football Club as its official tyre partner. Further, it deepened its connect with Hungarian football and partnered with DVTK, the leading sports club in Hungary.
In retrospect, the year went by at an exhilarating pace. I don’t see the excitement and the pressure ebbing in the current year. The year has already begun on a positive note as the prestigious JD Power 2018 India Original Equipment Tyre Customer Satisfaction Index Study ranked your Company highest in the small car segment and #2 in the midsize cars or sedan segment. The Company also received a 5-star Power Circle Ratings from JD Power for both small and midsize cars. The year has also seen the global launch of the motorcycle steel radial tyre, a first by any Indian company and a technology available only with a handful of global tyre majors.
I sincerely thank the support of every single member of the Apollo One Family, including our employees, our network and business partners and our shareholders. I will continue to update you on an annual basis and I do look forward to be in touch with you.
With best regards,
Neeraj Kanwar
Vice Chairman and Managing Director
For Apollo Tyres, FY2018 was a year of big achievements as our APMEA business achieved a significant financial milestone of ` 10,000 crores and Europe achieved its own record growth target. It was a synergistic flow across the regions to achieve these goals.
Vice Chairman’s Message
5
Corporate Overview / Statutory Reports / Financial Statements
Apollo Tyres Ltd Annual Report 2017-18

Board of Directors
13
4 5
6
7
910 12
13
118
2
6

Sunam SarkarPresident & Chief Business Officer Apollo Tyres Holdings (Singapore) Pte. Ltd.
Vikram S. MehtaFormer Chairman Shell Group of Companies
Neeraj KanwarVice Chairman & Managing Director
Nimesh N. KampaniChairman JM Financial Group
Pallavi Shroff Regional Managing Partner Shardul Amarchand Mangaldas & Co.
Onkar S. KanwarChairman & Managing Director
Arun Kumar PurwarFormer ChairmanState Bank of India
Vinod RaiEx-Comptroller and Auditor General of India
General Bikram Singh (Retd.)Former Chief of Indian Army
Akshay ChudasamaRegional Managing Partner Shardul Amarchand Mangaldas & Co.
Francesco GoriFormer CEO Pirelli Tyre
Robert SteinmetzFormer Chief of International Business Continental AG
Dr. S. NarayanFormer Principal Secretary to the Prime Minister of India
Not in picture:
Anjali BansalFormer Global Partner and MD TPG Private Equity
Dr. M. BeenaNominee Director Government of Kerala
1 9
2
10
3
11
4
12
5
13
6
7
8
7
Corporate Overview / Statutory Reports / Financial Statements
Apollo Tyres Ltd Annual Report 2017-18

Management Board
13 4 5
6
782 9
10
12 13
14
11
8

Daniele LorenzettiChief Technology Officer
Pedro MatosChief Quality Officer
P. K. Mohamed Chief Advisor, Research & Development
Markus J. KorstenChief Manufacturing Officer
Satish Sharma President, APMEA
K. PrabhakarChief, Projects
Gaurav Kumar Chief Financial Officer
Mathias HeimannPresident, Europe
Sunam Sarkar President & Chief Business Officer
Francesco GoriDirector
Martha DesmondChief Human Resources Officer
Onkar S. KanwarChairman & Managing Director
Robert SteinmetzDirector
Neeraj KanwarVice Chairman & Managing Director
1
92
103
114
125
13
14
6
7
8
9
Corporate Overview / Statutory Reports / Financial Statements
Apollo Tyres Ltd Annual Report 2017-18

Key Performance Highlights
Gross Sales (` in Billion)
149.29
FY14 142.90
FY15 137.25
FY16 127.43
FY17 140.53
FY18
EBITDA (` in Billion)
17.68
FY14
FY15
FY16
FY17
19.73
19.84
20.65
20.01
FY18
Net Profit (` in Billion)
7.24
FY14 10.05
FY15 9.78
FY16 11.23
FY17 10.99
FY18
EBIT (` in Billion)
11.75
FY14
FY15
FY16
FY17
15.63
15.96
16.39
15.39
FY18
Capital Expenditure (` in Billion)
30.80
FY14
FY15
FY16
FY17
17.93
39.02
FY18
Net Debt/Equity (Ratio)
0.28
FY14
FY15
FY16
FY17 0.37
FY18
Return on Equity (%)
8.5
FY14
FY15
FY16
FY17
FY18
25.2
20.3
18.7
15.8
1.53
0.49
1.35
Capacity (MT/Day)
1,872
FY14
FY15
FY16
FY17
FY18
1,685
1,640
1,661
1,684
Net Debt/EBIT (Ratio)
2.30
FY14
FY16
FY17
FY18
0.62
1.76
Note: Data for FY14 and FY15 is as per previous GAAP (i.e. IGAAP) and for FY16, FY17 and FY18 is
as per Ind AS.
FY14
FY15 0.26
FY16
FY17
FY18
Net Debt/EBITDA (Ratio)
0.21
0.18 0.23
FY15
5.84
6.93
0.08
0.06
0.21
10

Revenue Segmentation (%)
Geography Product Customer
l Passenger Vehicles 39.1l Truck-Bus 41.9l Off Highway 10.3l Light Truck 6.8l Other 1.8
l APMEA 69.46l Europe 30.07l Others 0.47
l Replacement 74.50l OEM 25.50
Natural Rubber Price Movement (`/Kg)
Crude Oil Price Movement (BRENT Crude) ($/Barrel)
Apr 17
May 17
Jun 17
Jul 17
Aug 17
Sep 17
Oct 17
Nov 17
Dec 17
Jan 18
Feb 18
Mar18
144
131
122
133
131
134
131
126
131
127
124
124
5451
49
58
63
64
69
66
67
56
52
48
Apr 17
May 17
Jun 17
Jul 17
Aug 17
Sep 17
Oct 17
Nov 17
Dec 17
Jan 18
Feb 18
Mar18
11
Corporate Overview / Statutory Reports / Financial Statements
Apollo Tyres Ltd Annual Report 2017-18

12
On the Road to Integrated Thinking with Vision 2020Apollo Tyres’ Vision 2020 – ‘To be a premier tyre company with a diversified and multinational presence’ is the driving force towards integrated thinking. The organisation has identified key priorities to realise Vision 2020 – ‘build leadership in India’, ‘premiumisation in Europe’, and ‘explore strategically attractive markets where we are currently not represented.’ These priority areas are integrated within the six capitals and interconnected in order to create value in the short, medium and long-term.
Integrated Report

Apollo Tyres has conducted the materiality assessment in FY2018 as per integrated reporting framework’s materiality assessment process. It has conducted materiality through a third-party study. The material issues were identified by mapping stakeholder concerns and the business priorities.
The process of materiality assessment included establishing process parameters and identifying relevant non-financial topics; evaluating the importance of relevant matters based on magnitude of effect and likelihood of occurrence and conducting a survey among key stakeholder groups representing investors, customers, senior management, employees, suppliers, NGOs, institutions, associations and sustainability professionals.
The Materiality Assessment process helps us identify the material aspects that impact our value-creation process. Being cognisant of the megatrends, we shape our strategy addressing the material issues that are relevant to our stakeholders and have significant business impacts.
Materiality
13
Corporate Overview / Statutory Reports / Financial Statements
Apollo Tyres Ltd Annual Report 2017-18

Three-pronged Strategy
Consolidate market position in existing markets & seek new markets/new segments
Continue investment in core brands & capacity expansion via Greenfield facilities
Seek other growth opportunities
Global competition
Social & Relationship CapitalIntegrating needs and requirements of our stakeholders into our business process
Natural CapitalNatural rubber and crude oil linked raw materials
Manufactured CapitalContinuous investments in plants and equipment allows us to operate safely with efforts to reduce environmental footprints
Human CapitalHigh-performance and skilled people with diverse experience
Intellectual CapitalFor our competitive advantage – R&D, Patents etc.
Financial CapitalFinancial strength to run our operations and fund our growth – debt and equity financing, as well as cash generation
Business Model
Suppliers
Shareholders
Employees
Customers
Dealers
Com
mun
ity
Vision 2020To be a premier tyre company with a
diversified and multinational presence
Business Model
Business Activities
Driving Forces
Vision &Core Values
Strategy
Perfo
rman
ce
& OpportunitiesRisks
Governance
Out
look
2020
INPUTS
Low-cost Chinese truck tyres imports
Raw material price volatility & availability
Economic slowdown in Indian & European markets
1 2 3
R&D Locations
Asia and Europe
MarketsIndia/Asia, Middle East, Europe, US
Supply Chain
Raw material procurement from South East Asia Region
5 Segments
Two-WheelerLight TruckOff HighwayPassenger VehiclesTruck & Bus
Manufacturing Locations
Asia and Europe
14

Social & Relationship Capital
Community satisfaction index No. of beneficiaries Customer satisfaction index
Expanded market share, strengthened brand value and social prosperity
Natural Capital
Carbon abated, Water conserved GHG emissions Waste Water treated/discharged Waste generated and disposed Used tyres recovered
Working through various initiatives to create a positive impact on the environment. Reduced environmental impacts by protection and conservation
Manufactured Capital
Production capacity Sales revenue
Safe workplaces, globally competitive products, value to customers through quality
Human Capital
Employee satisfaction Attrition rate Safety performance
Invested in human capital development to upgrade skills capabilities and a responsible remuneration policy
Intellectual Capital
No. of IPRs registered No. of innovations Savings due to innovations No. of employees in certified training
Expanded market share by introducing new products in Europe and growing its presence in 2W market
Financial Capital
Underlying ROE EPS Credit Rating
Sustainable revenues and focus on cost reduction, leading to healthy ROIs and capital buffers for growth opportunities
Climate change – monsoon and natural rubber
Radial technology
External Factors
OUTCOMESOUTPUTS
15
Corporate Overview / Statutory Reports / Financial Statements
Apollo Tyres Ltd Annual Report 2017-18

Apollo Tyres converts natural capital into financial and societal value by deploying advanced technology and other resources.Positively impacting its stakeholders by supporting economic developmental needs by monetising natural capital into high-value products. In order to minimise negative impacts, the Company continuously invests in new technologies to improve performance and enhance resource efficiency. The Company invests significantly in reducing its environmental footprint and in enhancing the positive contributions of its products and processes.
Interlinkage of natural capital with other capitalsTo reduce impact on natural capital, the Company invests in community development projects like Environmental Protection thereby increasing social & relationship capital through generation of livelihood opportunities for the local community.
INPUTS
EMISSIONS
GHGScope 1: 51% & Scope 2: 49%
NOX, SOX, PM10(Refer to Apollo Tyres’ Sustainability Report (SR) for FY2018 for more details)
Managing Outcomes
• The Company makes conscious efforts to check its carbon footprint in both domestic as well as international markets
• Investing in R&D to find innovative solutions related to our processes, products and by-products
• Partnering with municipalities and communities to promote water stewardship, waste management and conservation of biodiversity through various initiatives
• Setting high thresholds/targets for GHG mitigation, water & energy efficiency and waste reduction
ENERGY CONSUMPTION 5,093 TJ Direct energy 68.9% Indirect energy 31.1%
Renewable energy 6.0% Non-renewable energy 94.0%
TOTAL RAW MATERIAL CONSUMED
APMEA EUROPE
778,306 MT 70,165 MT Natural Rubber APMEA 21.4% Europe 19.75%
Synthetic Rubber APMEA 7.63% Europe 21.27%
Carbon Black APMEA 15.42% Europe 17.00%
Other Raw Material APMEA 55.56% Europe 41.97%
TOTAL RECYCLED MATERIAL
APMEA EUROPE
5,433 MT 801 MT
TOTAL WATER USAGE
6,524,380 m3
Annual water withdrawal APMEA & Europe
ENERGY SAVINGS/CONSERVED
36,715 GJ
RECYCLED/REUSED WATER
APMEA
598,816 m3
HAZARDOUS WASTE GENERATED
SOLID LIQUID
932.65 MT 12,901.6 KL
NON-HAZARDOUS WASTE GENERATED
SOLID
23,901.48 MT
Natural Capital
OUTCOMESOUTPUTS
16

Apollo Tyres is committed to empower its people and build an organisation on strong business and cultural values. The skills, experience, diversity and productivity of its employees enable the organisation to operate facilities safely, reliably and sustainably, and deliver on its growth objectives.Apollo Tyres is focussed on best safety practices and wellness interventions for its people. The Company invests considerably in employee development to attract and retain values-driven, high-performing and diverse talent. Recognition under the ‘Emerging Leader in HR’ category distinction award in 2017, is a testimony to the dedicated people-centric management approach and processes.
Interlinkage of human capital with other capitalsThe Company’s human capital stock is positively impacted when it invests in skill development initiatives to improve the technical know-how for R&D purposes. This also benefits the individuals for career enhancements, and increasing growth prospects, thereby increasing social and relationship capital stock and intellectual capital stock.
INPUTS
Managing Outcomes
• Passion in Motion (PIM 2.0) launched to achieve strategic priorities and serve as a foundation to Vision 2020. To aid PIM 2.0 and create a single unified process, team HR introduced Horizon, a new performance management process
Outcomes of activitiesA SAFE, HEALTHY, ENGAGED AND
PRODUCTIVE WORKFORCE
16,766 peoplewith relevant skills, knowledge and experience(as of March 31, 2018)
EMPLOYEE ATTRITION RATE
for FY2018
5.28%
WORK-RELATED EMPLOYEE AND
SERVICE PROVIDER FATALITIES
in FY2018
1
A strong leadership team, driving a culture of high performance
NUMBER OF TRAINING PROGRAMMES
10(refer to Apollo’s SR-2018 for more details)
COVERAGE OF TRAINING PROGRAMMES
569 Employees1,321 man days (refer to Apollo’s SR-2018 for more details)
The superior people management practices have once again made Apollo Tyres among the top 3 Companies to Work for in the Auto Ancillary category for FY2018. (GPTW 2017)
• Management development programmes called the ‘Essential 7’ were launched this year to provide knowledge of core managerial requirements including, delegation, mentoring and coaching, performance management and recruitment skills. During the reporting year, over 400 managers have attended one of the ‘Essential 7’ programmes
• Promoting a working environment that allows employees to deliver high performance
• Engaging, enabling and energising teams by embedding the critical behaviours and high-performance culture
• Developing critical skills to drive business performance
• Building leadership capability to enable productivity, high performance and sustainable growth
• Embedding focussed talent sourcing and succession planning to enable long-term strategy and accelerate diversity
• Driving a high-performance culture to ensure growth objectives are delivered
Human Capital
OUTCOMES
17
Corporate Overview / Statutory Reports / Financial Statements
Apollo Tyres Ltd Annual Report 2017-18

Apollo Tyres continuously strives to contribute to social and economic development to enable sustainable business practices. The Company’s main focus is on developing partnerships based on trust that will enhance their long-term sustainability.‘Care for Society’ as a core value has been firmly etched in the Company’s DNA since it began its journey 40 years ago. In addition to the societal value the Company creates through its business activities, it undertakes targeted community and enterprise development initiatives with its business activities impacting many people and communities, the Company has strategies, systems, and processes in place aimed at developing relationships with stakeholders.
INPUTS
• Promote an employees relations culture that encourages employee inputs and involvement through various initiatives to enable employee engagement. One of the four key parameters that will determine the success of Vision 2020 includes employees as an integral part
• Collaborative relationships with customers based on mutually agreed terms of engagement and the drive to innovate and excel. In order to improve its products and services, the Company conducts regular customer satisfaction surveys. The Company’s customer-centric approach and customer-oriented values have led to the initiative ‘Customer Champion Project’ in 2017
• Sustained confidence of suppliers and dealers in our business have led to building strong and committed partnerships. With a well-defined purchase policy, our Suppliers/Dealers development and management systems are aligned with our business goals and objectives
• Open channels of communication and constructive relationships with neighbouring communities, NGOs and the media. The Company is actively working in the communities to address issues like environment conservation, health awareness and livelihood generation
• With no political contribution, the Company has constructive and informed engagement with government representatives and also regulators. Maintain constructive relationships and partnerships with all representative unions and works councils who enjoy consultative or negotiating powers on issues of mutual interest. Effective partnerships with business peers, sector organisations and research bodies
CSR EXPENDITURE
215.68 mnfor FY2018
CSR ACTIVITIES BENEFICIARIES
578,591outreached from the activities of the four core themes of CSR initiatives of the organisation in FY2018. Some beneficiaries may be common to one or more initiatives and hence may have got double counted.
PREFERENCE OF THE OEM TYRE BRAND
DURING REPLACEMENT HAS INCREASED
54% 48%2018 2017
HEALTH INITIATIVE OUTPUTS
FY2018
5,29,717 people were outreached from awareness activities out of which 1,18,913 people received treatment facility.
40% increase in the people treated from the reporting year FY2017.
Out of the total treated in the reporting year FY2018:HIV testing 39,914Vision screening 52,793Diabetes testing 15,021
Social and Relationship Capital
Outcomes of activities
OUTCOMES
18

Managing Outcomes
• Prioritising social investment projects in skills development, community development, environment, health and livelihood generation where there is a convergence of multiple stakeholder interests to achieve maximum impact in our communities
• Fostering positive employee relations culture, informed by trust and respect. Implementation of ‘Horizon’ has helped in improving employee relationships through constructive dialogue with superiors. Building strong Industry-Employee relations, employee health & safety, developing ‘Apollo One Family’ value system and bringing diversity across cultures are some of the focus areas of Apollo Tyres
• Ensuring consistent and effective engagement with suppliers/dealers with the objective of aligning their expectations with our strategy and targets. Natural Rubbers Suppliers Meet, Global Partners Summit, Partner Code of Conduct, IT-enabled digitised solution for business transaction, queries, benefits and grievances
• Total 22,488 people were outreached from awareness generation and 10,805 people were outreached from door to door waste collection service. Total 324 individual household toilets were constructed at Chennai and Andhra Pradesh location in the reporting year. Further one end-of-life tyre playground constructed at Chennai location. The playground used 130 one end-of-life tyre to construct various play structure
• Total 1,393 women and 1,473 male farmers were outreached under sustainable agriculture initiative through trainings and awareness activities
TOTAL WASTE COLLECTED
2,084.5 Metric Ton (MT)From Clean My Transport Nanagr (CMTN) and Clean My Village (CMV)
Biodegradable 198.1 MTNon-biodegradable 1,886.4 MT
Interlinkage of social and relationship capital with other capitalsThe Company invests heavily in social and relationship capital to enable growth in financial capital over the long-term.
19
Corporate Overview / Statutory Reports / Financial Statements
Apollo Tyres Ltd Annual Report 2017-18

Apollo Tyres value proposition is based on its research & development and intellectual capital inputs to achieve technological leadership. The Company has focussed on developing its own technology through in-house efforts or through collaborative research. Key organisational intangibles also include know-how and management systems. Apollo Tyres assesses the extent to which their proprietary or licensed technologies, in combination with their expertise, provide sufficient advantage to generate targeted returns on investment. The Company is striving to develop innovative and high quality products and also protect its proprietary intellectual property.
INPUTS
• 10 patents applied for protection in India (6 patents applied outside and extended the protection in India and 4 patents applied in India) so far. For last fiscal year, one patent granted in India
• Partnership with various research institutes, universities & OEM partners across the world – collaborate with Centire USA in tyre research, Dresden University and Twente University
Managing Outcomes
• Prioritising focussed research and development activities
• Focus on new product development to grow market share
• Partnering with academic institutions, research bodies and OEM partners across the world to develop, pilot and implement new technologies
• Providing training and technical skills development for engineers and other non-technical employees
• Research for new transportation solutions with low impact on environment
• Exploring the feasibility of usage of alternate materials to natural rubber including the use of recycled materials
• Skilled, experienced and technically qualified employees, industry thought leaders and experts
• Business processes and management systems
• Investments in innovation partnerships and ventures
• Patented technology obtained for epoxide natural rubber, a key ingredient in sustainable tyre development
INTANGIBLE ASSETS
` 345 mn(FY2018)
RESEARCH & DEVELOPMENT
ALLOCATED CAPEX
` 1,294 mn(FY2018)
Intellectual Capital
OUTCOMESOUTPUTS
Interlinkage of intellectual capital with other capitalsThe Company boosts investments in intellectual capital through modern R&D facilities for passenger and commercial vehicle tyres. This will play a key role in bringing in cutting-edge technology and innovation to drive growth for the Company. Consequentially, financial capital, as well as manufactured capital, natural capital, human and social & relationship capital are likely to be enhanced.
20

Apollo Tyres relies on its significant fixed assets (property, plant, equipment) to deliver superior quality goods and services efficiently.The Company continues to invest to nurture and grow these assets, reducing the environmental footprint of its facilities and enabling compliance with new regulatory requirements. It is committed to execute its 2020 strategy. Given the ever-changing environment, the Company has de-risked and re-phased certain projects, while prioritising capital to advance its growth projects in European market and also beginning to look at the US market. Sufficient capital has been allocated to maintenance and sustenance activities to ensure that the business continues to operate sustainably.
INPUTS OUTCOMES
Managing Outcomes
• Focus on inorganic growth to strengthen global operations – acquired Reifencom GmbH, one of the largest tyre distributors in Germany
• Dedicated R&D centres to support innovation and better quality for customers
• Launch of Two-wheeler tyres in India in 2016
• Apollo’s new Malaysia office, ASEAN region’s third largest automotive market
• Commercial production at Chennai brownfield expansion
• Commenced production at Hungary (PCR & TBR) greenfield plant
• Invest in planned maintenance of asset for safe and reliable operations
PROPERTY, PLANT AND EQUIPMENT
` 95.3 bn net asset value(as on March 2018)
4 MANUFACTURING LOCATIONS
IN INDIA
Chennai, Perambra, Limda & Kalamassery In 2017, the Company announced plans of fifth Indian manufacturing plant in Andhra Pradesh
2 GLOBAL MANUFACTURING
LOCATIONS
Netherlands and Hungary
INSTALLED CAPACITIES
(as on March 31, 2018)
INDIALimda 182,462 MTChennai 229,533 MTPerambra 116,565 MTKalamassery 34,572 MT
EUROPEEnshcede 68,078 MT
2 GLOBAL RESEARCH
& DEVELOPMENT CENTRES
Chennai (India) Enschede (The Netherlands)
Under the operating lease agreements, the Company has acquired assets, office space and warehouses
CAPITAL EXPENDITURE
` 30.80 bnFY2018
DEPRECIATION AND AMORTISATION
Consolidated Standalone
` 5,926 mn ` 3,644 mnFY2018 FY2018
IMPAIRMENT OF ASSETS
NILFY2018
Manufactured Capital
Interlinkage of manufactured capital with other capitalsWith the Company’s strategic focus on growth projects, it increases the stock of manufactured capital. Increasing capex on manufacturing plants to access domestic as well as global markets impacts financial capital and natural capital in the near term. The enhanced manufactured capital in terms of new products across segments will help company in achieving its market leadership in India. The Company’s commitment to reduce the environmental footprint of its existing facilities will benefit natural, intellectual, human and social & relationship capital.
OUTPUTS
21
Corporate Overview / Statutory Reports / Financial Statements
Apollo Tyres Ltd Annual Report 2017-18

22
Apollo Tyres’ effective management of the balance sheet and cash flows is important to sustain and grow its business. Delivering a significant positive contribution to financial capital by using advanced technologies, well-defined processes, skilled people and resource management that monetise natural capital. Considering the targeted return on capital, the Company’s investment decisions are strategically evaluated. Apart from creating value through its business activities, the resulting financial capital is also reinvested in each of the six capitals in a carefully balanced manner to ensure the most effective and efficient achievements to succeed in the industry.
INPUTS
Managing Outcomes
• Strategically located Singapore office to work closely with South East Asian region suppliers to address Natural Rubber price volatility
• Focussing on optimal capital allocation and delivering returns on invested capital
• Considering alternatives to fund capital growth investments – including project financing, bank loans, and other alternatives of financing
• Benefiting from intensified risk management systems to define financial risk appetite and tolerance measures, ensuring business is sustainable
MARKET CAPITALISATION
` 158.5 bn(as of March 31, 2018)
OPERATING PROFIT
` 17,678 mn
NET DEBT
` 27.06 bn (as of March 31, 2018)
CASH GENERATED BY OPERATING
ACTIVITIES
` 17,197 mn
NET DEBT TO EBITDA (RATIO)
1.53
NET DEBT TO EQUITY (RATIO)
0.28
EARNINGS PER SHARE
` 13.43
RETURN ON EQUITY
8.5%
DIVIDENDS PAID TO SHAREHOLDERS
300%
CREDIT RATINGS
AA+ (CRISIL)
CAPITAL EXPENDITURE
` 30.80 bn (FY2018)
CAPITAL EMPLOYED
` 97.8 bn (as of March 31, 2018)
Financial Capital
OUTCOMES

23Apollo Tyres Ltd Annual Report 2017-18
Continuing raw material price volatility, any slowdown in the economic growth across regions, seasonal changes and, like in the past, a possibility of the high levels of Chinese truck and bus tyre imports in India… all these factors can have an impact on the Indian tyre manufacturers and the Company.
Decline in demand for some products
Erosion of competitive advantage
Reduced revenue, margins and earnings
Curtailed capital investment programme
Lower return on invested capital resulting in pressure on share price
Premium positioning of Vredestein brand in Europe
• By initiating or intensifying a business performance enhancement programme and response plan, the Company conserved financial capital.
• With a diversified market base across geographies, Apollo Tyres is not dependent on domestic market alone. The Company is strategically working towards growth opportunities in other large markets.
• With the entry in two-wheeler segment, the Company is now a full range tyre manufacturer in India and can service the large and growing two-wheeler tyre segment.
• Advanced R&D facilities will support growth through cutting-edge technology and innovation.
• Highly automated state-of-art Greenfield plant in Hungary is operational and positioned to grow in the European market due to a new cost competitive manufacturing facility.
Apollo Tyres’ response to the volatile macroeconomic environment
FOCUS AREAS TO CREATE VALUE
Corporate Overview / Statutory Reports / Financial Statements
OUR ACTIONS TOWARDS FOCUS AREAS
Creating Value Along the Way

24
Stimulating economic growth by providing the markets for our products and services
Maintaining production integrity by ensuring responsible supplier management
Localising and diversifying supply chain/ distribution networks through acquisitions/ associations
Developing the skills needed to maintain technological lead
• By promoting social value through business activities and applying financial capital, building trust through effective stakeholder engagement and delivering value through social investment Apollo Tyres built the stocks of human and social and relationship capital.
• Promoting ethical behaviour and respect for human rights also had a positive impact on those capitals, as did its contributions to the communities in which the Company operates.
• Apollo Tyres work to upgrade community to address issues like environment, health and livelihood generation boosted natural capital, social and relationship capital.
• Spent ` 215.68 mn in FY2018 on social investment programmes to uplift communities where Apollo Tyres operates.
• Continued efforts to build trust and accountability through effective stakeholder engagement.
• The Company invested in health programme for truck drivers and community development initiatives for women and farmers. The Company continued to invest in other initiatives around solid waste management and sanitation and environment conservation.
The Company’s contribution to social and economic development is essential to create and sustain an enabling environment for investment. It has enabled Apollo’s positioning as a credible stakeholder partner. The Company’s sustainability agenda is focussed on fostering inclusive growth. Social investments towards programmes provide support to respond directly to community’s desired outcomes and also aligned with the country’s economic growth drivers such as job creation, health issues, environmental compliance etc.
Apollo Tyres’ contribution to promote sustainability by delivering social and economic value
FOCUS AREAS TO CREATE VALUE
OUR ACTIONS TOWARDS FOCUS AREAS

25
Corporate Overview / Statutory Reports / Financial Statements
Apollo Tyres Ltd Annual Report 2017-18
Skilled, experienced, diverse and productive people enable the Company to operate safely, reliably and sustainably
Pursuing zero accident culture is paramount: safe plants are stable plants, allowing the Company to meet production targets
Providing a safe work environment where employees are healthy and engaged
Ensuring that the Company has the right talent in the right place at the right time enabling transformation and growth
• By investing in the safety, health and well-being of its employees, Apollo Tyres ensures a culture of high performance and nurturing talent to build the stocks of human and social and relationship capital.
• The regrettable injuries and tragic fatality in FY2018 negatively impacted human capital The Company has retrained all employees involved in similar operations across the world and put in place additional engineering controls and protections to prevent such accidents from recurring. There is significant improvement in lost time incident (LTI) cases in plants. Due to Company’s efforts lost time incidents have reduced from 80 LTI to 59 LTI in the fiscal year.
• The transformation of workforce and promoting an inclusive culture is key in protecting Apollo Tyres’ human, social and ultimately its financial capital.
• Despite challenges posed by volatile oil and natural rubber prices reality, it provided fit-for-purpose remuneration to attract and retain values-driven, high-performing people.
Apollo Tyres’ HR strategy seeks to enable effective delivery of its strategy. The Company strives to provide a work environment that attracts, develops and retains the best talent, promotes a values-driven, high-performance culture embedding diversity and transformation. The Company has continued to focus on critical skills development to ensure that they have the right skills base and culture for future growth. With Global operations in European and Asian regions, the Company has managed to align cultural diversity to cultivate sound employee relations.
Apollo Tyres’ contribution to promote people centric approach by enhancing human capital
FOCUS AREAS TO CREATE VALUE
OUR ACTIONS TOWARDS FOCUS AREAS

26
Financial Year 2017-18 (FY2018) was marked by uncertainty – be it the threat of increasing hostilities between the US and North Korea; continuous talks about increased protectionism by countries either from an economic or immigration perspective; or China agreeing to open its domestic market even as a trade war between the US and China continues to be on the horizon. Yet, it was a good year for the global economy. The International Monetary Fund (IMF) pegged the global economy’s growth rate at 3.8%, with continued strengthening of fundamental factors, which began towards the end of 2016. Importantly, the economic growth was widespread, with almost two-thirds of countries worldwide posting better numbers in 2017.
For Apollo Tyres, FY2018 continued to be a year of progressing towards its Vision 2020 – ‘to be a premier tyre company with a diversified and multinational presence’. The year began with the commercial production of its Greenfield Hungary plant and stabilisation of production during the year. The Company achieved a major milestone of crossing D 10,000 crore revenue by its Indian operations. It was also a year when Apollo
Apollo Tyres is one of the leading players in India with significant market share across product categories
Management Discussion and Analysis
26

27Apollo Tyres Ltd Annual Report 2017-18
Corporate Overview / Statutory Reports / Financial Statements
MARKET OVERVIEW
In FY2018, India clocked a slow growth of 6.7%, slower than FY2017 (7.1%), and lost the tag of the ‘fastest growing economy’ to China. The lingering effects of demonetisation in FY2017, along with the implementation of Goods and Services Tax (GST), had a near-term adverse effect on the economy. The economy suffered a loss of output and employment in the labour-intensive unorganised sector. However, normal monsoon witnessed record foodgrain production and sustained government expenditure provided support to aggregate demand. Further, the softer interest regime since the past few years, among other factors, helped the economy post a growth rate double of the global economy.
AUTO SEGMENT
Despite the slower-than-expected growth of the Indian economy, in FY2018, the domestic business of the Auto segment raced ahead to post a 14.2% growth in the Indian market compared to 6.8% for FY2017. According to data from the Society of Indian
VISION 2020 – ‘TO BE A PREMIER TYRE COMPANY WITH A DIVERSIFIED AND MULTINATIONAL PRESENCE’.
FOR FY2018, THE COMPANY POSTED A CONSOLIDATED REVENUE OF RS 149.29 BILLION, UP BY 6% AS COMPARED TO PREVIOUS FISCAL.
27
Tyres furthered its commitment to support football and announced sponsorship of two Indian teams – Minerva Punjab FC and Chennaiyin FC.
For FY2018, the Company posted a consolidated revenue of Rs 149.29 billion, up by 6% as compared to previous fiscal. The Company posted a Net Profit of Rs 7.24 billion as against previous fiscal’s profit of Rs 10.99 billion.

28
EUROPE
EconomyThe European economy performed significantly better than expected in Calendar Year 2017 (CY2017), propelled by robust private consumption, a bullish global economy and falling rates of unemployment. As per estimates from Eurostat, the European Union’s (EU’s) statistics office, the Eurozone economy expanded at its fastest rate in a decade in 2017, posting a growth of 2.5% for CY2017, the fastest growth rate since a 3.4% rise in 2007. The Eurozone continued to show a broad cyclical expansion after years of economic stagnation and rolling crises. This continued growth has been fuelled by recovering confidence and monetary stimulus from the European Central Bank.
OUR OWN ESTIMATES INDICATE THAT THE GROWTH HAS BEEN LED BY THE ORIGINAL EQUIPMENT (OE) SALES MORE THAN BY THE SALES IN THE REPLACEMENT MARKET.
Automobile Manufacturers (SIAM), the Commercial Vehicles (CV) growing at 19.9%, the two-wheelers with a growth of 14.8% and the three-wheelers at 24.2% drove the industry as against the Passenger Vehicles (PV) segment that had propelled the industry in FY2017. The growth rate of the PV segment fell from 9.2% to 7.9%. Further, exports by the Auto manufacturers grew a robust 16% for FY2018 as against a negative growth of 4% for FY2017. The growth surge in the export business was primarily led by the three-wheeler segment, which grew by 40%, and the two-wheeler segment, which posted a 20% growth.
TYRE SEGMENT
With the bullishness in the economy and the auto industry, the tyre industry also was on an upward march. However, the Automotive Tyre Manufacturers’ Association (ATMA) has not shared any industry-specific numbers for FY2018. Nevertheless, our own estimates indicate that the growth has been led by the Original Equipment (OE) sales more than by the sales in the replacement market. With a 19% growth in the CV segment, the tyre industry followed a growth graph similar to that of the Auto segment. The CV segment continues to account for the highest value within the industry. Good monsoons boosted the demand for all tractor tyres (front, rear and trailer), which posted good growth numbers.
Gross Sales
FY14
142.90
FY15
137.25
FY17
140.53
` bn
FY18
149.29
FY16
127.43
Apollo Tyres to invest ` 1,800 cr in Andhra Pradesh factory. N Chandrababu Naidu, Chief Minister of Andhra Pradesh state, lights a ceremonial lamp during the foundation stone laying ceremony

29Apollo Tyres Ltd Annual Report 2017-18
THE FOCUS ON THE ALL-SEASON SEGMENT REMAINED UNCHANGED, WITH A STRONG DOUBLE-DIGIT GROWTH OVER THE YEAR.
Auto SegmentThe European Commission underlines that the automotive industry is crucial for Europe’s prosperity. The sector provides jobs for 12 million people in manufacturing, sales, maintenance and transport and accounts for 4% of the EU’s GDP. As per the data from the European Automobile Manufacturers’ Association, CY2017 saw the demand for passenger cars inching up by 3.4% for the fourth consecutive year, with more than 15 million new passenger cars being registered for the first time since 2007. Among the big markets, Italy (7.9%) and Spain (7.7%) recorded the strongest gains, followed by France (4.7%) and Germany (2.7%). By contrast, last year’s demand for cars in the UK declined by 5.7%.
Tyre Segment According to the European Tyre and Rubber Manufacturers’ Association (ETRMA), the performance of the tyre sector is generally stable, with the exception of the agricultural tyre sales, which performed badly for the fourth year in a row. The segment did not see a rub-off effect of the rapid gains made by the auto industry. The OE component of the passenger car segment grew marginally by 1% to close the year with 86.7 million units.
INDUSTRY STRUCTURE AND DEVELOPMENTS
INDIA
The Indian tyre industry had a mixed bag for FY2018. For long, the industry has been demanding that the government create a level-playing field against the low-cost Chinese tyre imports. This year, the Government imposed an anti-dumping duty on the import of radial tyres used in buses and trucks from China for five years. The implementation of GST also helped in creating a better market for the domestic tyre industry as in some cases the importers of low-cost tyres could reduce the tax burden or circumvent some tax liability by making cash deals. The demonetisation initiative had sucked away excessive cash from the system and the industry witnessed a sharp drop in the import and dumping of tyres. However, with remonetisation, the tyre imports started moving upwards. Along with formalisation of the economy, GST is bringing such importers within the tax ambit and further levelling the field.
However, the industry had to face the burden of increase in the commodity prices. In FY2018, the raw material cost increased by 10% over the last fiscal. The major contributors to this cost push were carbon black, synthetic rubber, nylon fabric, chemicals and natural rubber, even as oil prices continued to climb upwards. Brent Oil prices crossed the psychological mark of USD 70 per barrel in the month of January 2018. Increased compliance by Organisation of the Petroleum Exporting Countries (OPEC) members to agreed production cuts supported by other large oil exporters has kept the oil prices high during the financial year. As the carbon black industry has lagged in capacity creation, the fiscal witnessed a severe shortage in the availability of raw material in India. The problem was further compounded due to the anti-dumping duty on import of carbon black from China, which is the largest producer of the crucial raw material.
THE IMPLEMENTATION OF GST HELPED IN CREATING A BETTER MARKET FOR THE DOMESTIC TYRE INDUSTRY.
EUROPE
According to ETRMA data, volume sales in the tyre market in 2017 were more or less flat compared to 2016. The focus on the All-Season segment remained unchanged, with a strong double-digit growth over the year. Despite a slight growth in the Winter segment, the All-Season growth continued to impact Winter and Summer tyre segments. Further, the density of players in the All-Season segment is increasing, resulting in price pressure. The SUV segment also showed a positive trend with a high single-digit growth driven by an increase in Winter volumes and All-Season volumes.Low-cost import tyres are visible in the market with an increasing volume and price pressure on all segments.In tyre distribution, the Company saw further vertical and horizontal integration, which continued to drive all market participants into a consolidation process. As a result, all major industry players are driving initiatives to integrate manufacturing and trade, which will reduce the number of independent participants in the tyre distribution industry in Europe.
Corporate Overview / Statutory Reports / Financial Statements

30
SWOT ANALYSIS
Strengths1. Apollo Tyres has the advantage of a diversified
market base across geographies and therefore, it is not dependent on the domestic Indian market alone. Further, the Company is working towards establishing and growing operations in other large markets.
2. With its entry in the two-wheeler segment, the Company is now a full-range tyre player in India and can service the large and growing two-wheeler tyre segment.
3. The Company is powered by strong product brands in its key markets – Apollo and Vredestein.
4. Apollo Tyres enjoys an extensive distribution network for its products across its two key markets. The acquisition of Reifencom GmbH, one of the significant tyre distributors in Germany, has further enhanced distribution strength in Europe.
5. In Europe, the Company’s brand, Vredestein, has an established presence and enjoys a reasonable premium positioning.
6. In India, the Company is a leading brand in the CV segment, which accounts for the bulk of the industry’s revenue. The Company is best positioned to maintain its leadership position in the truck radial segment and drive growth through the same.
7. The Company has a global and culturally-diversified management team driving growth across geographies.
8. The presence of modern Research & Development (R&D) facilities for passenger and CV tyres will play a key role in bringing cutting-edge technology and innovation to drive growth for the Company.
9. Increased spends on building the corporate brand, including Apollo Tyres’ association with Manchester United and its association with football in India, is starting to make Apollo a stronger brand in India and a recognised one globally.
10. The Company has long established relationships with global OE manufacturers, present in India, and has forayed into the premium OE segments in India.
11. The Company is aggressively pursuing its strategy of building OE relationships in Europe and has seen few initial wins.
Weaknesses1. The Company still needs to establish a larger
presence in new growing geographies to reach economic-sized operations.
2. In a rapidly-rising raw material cost scenario, the Company is unable to pass on cost escalations to consumers, in a timely fashion, due to intense competition and various market dynamics resulting in pressure on margins.
THE COMPANY HAS LONG ESTABLISHED RELATIONSHIPS WITH GLOBAL OE MANUFACTURERS, PRESENT IN INDIA, AND HAS FORAYED INTO THE PREMIUM OE SEGMENTS IN INDIA.
Vredestein Techno Classica 2018

31Apollo Tyres Ltd Annual Report 2017-18
Opportunities1. In India, the Company has a healthy lead over
its competition in terms of capacity and market share in the Truck Bus Radial (TBR) segment. This implies healthy growth prospects with increasing ‘radialisation.’
2. In India, the Company’s two-wheeler tyre product has been widely accepted by the market and there are prospects of scaling up the market share in a fast-growing and profitable segment.
3. The Company’s highly automated state-of-the-art Greenfield plant is now operational and it is well-positioned to grow in the European market due to a new cost-competitive manufacturing facility.
4. The Company is continuously working towards building up OE capability in Europe. With enhanced capacity and a state-of-the-art plant, it is well positioned to win more OE business, which in turn will generate replacement demand and enhance brand positioning.
5. With the premium positioning of the Vredestein brand in Europe and now with the modern state-of-the-art plant in Hungary, the Company has good prospects for improving its product mix towards a more profitable premium car tyre segment.
6. The Company continues to increase its focus on new geographies such as North America and in geographies where it has already made some inroads, such as in the Association of Southeast
THE COMPANY HAS GOOD PROSPECTS FOR IMPROVING ITS PRODUCT MIX TOWARDS A MORE PROFITABLE PREMIUM CAR TYRE SEGMENT.
Asian Nations (ASEAN) and the Middle East. These geographies will be the growth avenues for the future.
7. The Company can convert excess bias capacity into more profitable OHT and industrial tyres capacity and tap into a new product segment.
8. The Company is working towards launching truck radial tyres in Europe, which will further enhance revenue and market presence.
Threats1. Economic downturn or slowdown in the key markets
(India and Europe) can lead to decreased volumes and capacity utilisation.
2. The coming year will have two large investments on stream. There would be pressure on margins as the utilisations ramp-up gradually.
3. Increased competition from global players in India could impact the Company’s growth plans and/or profitability.
4. Increased level of radialisation can result in a quicker than expected decline in volumes within the Truck Bus Bias (TBB) segment. This increase can lead to redundant capacities, which will need investment to convert into other product segments.
5. Tight labour market in Europe and low level of unemployment can make talent acquisition challenging in Hungary.
6. There is a continued threat of raw material price volatility and this translates into pressure on margins in case of a rapid rise in raw material prices.
7. A weak Indian currency can result in pressure on margins, since the Company is a net importer.
8. A growing influence of budget tyres, mainly Tier 2 and 3 brands from established manufacturers, could further impact business, particularly in Europe.
SEGMENT-WISE PERFORMANCE
The Company continues to focus on its key regions – Asia Pacific, Middle East and Africa (APMEA) and Europe. While it has a small presence in the Americas, it further added new territories in the region and offered an expanded product range in these markets.
FY2017 for the APMEA region began with a clarion call for the Indian market to cross the ` 10,000 crore milestone. During the financial year, Team India relentlessly focused on this goal by launching new products across segments, strengthening the dealer network, increasing investments in branding, winning new OE customers and creating unique and innovative initiatives for dealers and customers. As a result, in FY2018, the Company’s market share increased in various categories.
Global Partners’ Summit 2017
Corporate Overview / Statutory Reports / Financial Statements

32
Commercial Vehicles In the CV tyre segment, the Company is a market leader in the TBR segment and closed the FY2018 with an estimated 24% market share and a ~1.5% gain over the last FY. The Company’s replacement market for TBR outpaced the industry growth by a wide margin to post a 19% increase as against the industry’s 11%. Cutting-edge R&D, highly-efficient factory processes and wide tyre range ensured that the OE business grew at a healthy clip and the tyres became the preferred choice of Indian and global Original Equipment Manufacturers (OEMs), including Tata Motors, Ashok Leyland, Eicher Motors and Bharat Benz.
In the other key segment, Truck Bus Bias (TBB), the Government’s introduction of anti-dumping duty and pan-India GST resulted in the decline of the low-cost Chinese TBR imports during the year. Improved product portfolio across sub-segments such as steel, mining and intermediate CVs helped the Company inch up its market share in the TBB segment and cement its pole position with an estimated 27% share.
During the year, the Company continued expanding its Apollo CV zones to take the total number to 24. This has helped the Company to offer best-in-class tyre service to commercial truck and bus fleets at many more locations. Similarly, the Company continued to focus on the Apollo Retread Zones, which offer the retreading service to ensure maximum value realisation from truck and bus tyres.
Along with launching new products and expanding the network, the Company continued engaging with its customers. Two key programmes introduced during
the year were ‘Leaders and Movers Meet’ and ‘Apollo Swasthya Saarthi’. The former was to engage with the customers and educate them on improving efficiencies and reducing cost, and the latter was a specialised programme for the truck drivers on their health and safety.
Passenger Car In the Passenger Car Radial (PCR) segment, the Company grew at a healthy clip. The robust passenger car sales, along with GST, has had a direct effect on both key markets in the PCR segment – OE and replacement. Like the CV segment, the Company had multiple product launches in the PCR category. In the general car segment, the Company launched the Altrust brand with a promise of unmatched performance and best-in-class durability meant for long hauls along with excellent comfort and safety. In the fast-growing SUV segment, the Apterra HT2 was introduced, which was specially designed by Apollo Tyres’ R&D to offer excellent comfort and a super silent ride. The Alnac 4G continued to grow by double digits in the premium range tyres category for hatchbacks and sedans. To become a full range player within the PCR segment, the Company launched the Aspire 4G tyre for the luxury vehicles. This tyre provides excellent comfort backed with exceptional handling at high speeds, along with the necessary power and grip to the vehicle. Working closely with the OE customers and aligning the Company’s R&D to develop products to meet their stringent requirements, the Company is now the dominant supplier to Indian OE customers with the Company’s tyres being OE fitted in 10 of the top 15 cars in the country. Key wins during the year included Innova Crysta from the Toyota stable and Maruti Suzuki’s new Swift and Desire cars for domestic and global markets.
THE COMPANY FOCUSED ON CONSOLIDATING POSITION IN KEY MARKETS, E X P A N D I N G MARKET SHARE, E N H A N C I N G RETAIL PRESENCE AND BECOMING A FULL-RANGE TYRE COMPANY IN INDIA
DURING THE YEAR, THE COMPANY CONTINUED EXPANDING ITS APOLLO CV ZONES TO TAKE THE TOTAL NUMBER TO 24.
Unveiling of the plaque during the foundation stone laying ceremony held in Andhra Pradesh

33Apollo Tyres Ltd Annual Report 2017-18
Off-Highway Tyres (OHT)In the segment, the Company focussed on three key sub-segments – Industrial, Earthmovers and Agricultural. Strengthened product range, targeted distribution network and new customer acquisition saw the Industrial business segment growing by 25% and the Earthmover business by 15%. The Industrial and Earthmover segments were also strengthened by the introduction of all-new 25-inch range of 14 new products targeting three different segments – Underground Mining, PORT and Wheeled Loader. New products such as VIRAT 23 for hard soil application and VIRAT Harvest, a combine harvester product, ensured a 1% market growth for the Agricultural business.
The Company participated in various trade shows and exhibitions and launched multiple initiatives to connect and reach out to the customers for each of its three businesses in the OHT segment. For the Agriculture market, the Company further strengthened its engagement with its well-established Apollo Tractor Owners Meet (ATOM) platform. The joint platform of Apollo Tyres and ITC e-Choupal, ‘Apollo Grahak Diwas@ITC’, reached the strong customer base of the e-Choupals across major states, including UP, MP and Maharashtra. Further, the Company showcased its product in 150 locations across Maharashtra along with Mahindra and Mahindra.
FY2018 was a significant milestone for the Company in its brand-building journey. The Company covered the football fan base across the country. It associated with the I-league team, Minerva Punjab FC, as the title
THE COMPANY COVERED THE FOOTBALL FAN BASE ACROSS THE COUNTRY.
DURING THE YEAR, THE COMPANY GAINED SUCCESS AND ITS VREDESTEIN BRAND WAS SELECTED AS A FITMENT ON THE VOLKSWAGEN POLO, SEAT IBIZA AND FORD ECOSPORT.
sponsor and with the Indian Super League (ISL) team, Chennaiyin FC, as the principal sponsor. Both teams emerged as winners in their respective leagues and helped connect Apollo with football fans across the country. The Company also partnered with ISL and brought in the world’s best freestyle football artists to popularise the sport and engage with the enthusiastic fans. Thus, the Company garnered a high amount of paid and earned publicity. Given the importance of digital media, the Company used this medium for all its campaigns, including the #ApolloXISL, #iloveunited and #monsoondrift.
Beyond India As the Company continues seeding other markets in the APMEA region through increased investment for brand building and expansion of product range, the Thailand market experienced high growth in the overall OHT segment, including the Agriculture segment. With a strategy of introducing products catering to specific markets for specific applications, the Company has started witnessing traction in Malaysia, Vietnam and Myanmar, among other countries. Despite natural disasters in many countries in the SAARC region and availability of low-cost Chinese tyres in these countries, the Company saw healthy double-digit growth from the region. The Company also expanded its two-wheeler business beyond India with the launch of tyres in Bangladesh and Sri Lanka.
Europe The big news for the region was the capacity addition as the manufacturing plant in Hungary went live in the beginning of FY2018. This boosted the Company’s efforts to engage with premium European OEMs. During the year, the Company gained success and its Vredestein brand was selected as a fitment on the Volkswagen Polo, SEAT Ibiza and Ford EcoSport.
For FY2018, the sales volumes for the PCR business for Europe remained flat, but an improvement in the product mix helped the region post a 3% growth for the year. Launch of new products and start of a relationship with the OE segment were the reasons for an improvement in turnover and market share in an overall declining market.
During the year, the Company continued launching its TBR products in various European markets to understand the market needs, even as R&D continued to better the products for the market.
The Company continues to participate in various shows, rallies and local fairs apart from using its association with Manchester United to further the Apollo brand in the region. It participated in Agritechnica, the world’s largest agricultural fair, and launched its latest edition on flotation tyres with a positive feedback from customers – specifically from the OEs. The Company has partnered with Mille de Miglia, one of the most prestigious classic car rallies in the world, for three years. Through this partnership, the Company is realising its ambition of promoting the Vredestein brand.
Corporate Overview / Statutory Reports / Financial Statements

34
OUTLOOK
The global economy is expected to be on an upswing for 2018. The IMF expects global growth to inch up from 3.8% in 2017 – its fastest pace in 6 years – to 3.9% in 2018 and 2019. However, the possibility of trade war between the US and China and protectionist measures adopted by multiple countries can derail the growth story.
According to European Commission Winter 2018 Economic Forecast, the robust performance in 2017 is expected to continue in 2018 and 2019 with a growth of 2.3% and 2.0%, respectively, in both the Eurozone and EU. The forecast mentions that strong demand, high capacity utilisation and supportive financing conditions are set to favour investment in the region. Compounded with a stronger cyclical momentum and bullish economic sentiment, the forecast projects an improvement in the labour markets and stronger-than-expected pick-up in global economic activity and trade.
Estimates for India remain in the bullish zone as the IMF pegs the growth rate to further accelerate for the next fiscal to 7.2%. The IMF contends that India’s progress on structural reforms in the recent past is expected to raise productivity and incentivise private investment. Further, the GST implementation will help reduce internal barriers to trade, increase efficiency and improve tax compliance. Normal monsoons and a strong domestic economy, along with a continuing soft interest regime, will see a spurt in consumption and further push the economy.
For the tyre industry, a good monsoon implies strong demand for the CV and Agriculture businesses. Complementary business enablers such as the Government’s thrust on infrastructure development, increased farm credit and rural infrastructure development are expected to spur rural demand in FY2019. The spanner in the wheel for the industry could come from possible concerns around increased prices of raw material, including oil, carbon black, synthetic rubber, chemicals and natural rubber, which might impact the profitability.
Against this background of global and Indian outlook, Apollo Tyres will continue its three-pronged strategy:
> To consolidate market position in existing markets and seek new markets/segments
> To continue investment in both brands – Apollo and Vredestein – and capacity expansion via Greenfield facilities
> To seek other growth opportunities
Even as the Company continues to expand its other markets, India will be its dominant market. With its leadership position in TBR, the Company will continue to focus on achieving terminal capacity utilisation at its Chennai plant and also sweat its other plant assets. For the high volume two-wheeler segment, the Company plans to introduce steel radial tyre through a pilot plant capacity. For Europe region, the focus will remain on
THE COMPANY WILL CONTINUE TO FOCUS ON ACHIEVING TERMINAL CAPACITY UTILISATION AT ITS CHENNAI PLANT AND ALSO SWEAT ITS OTHER PLANT ASSETS.
Apollo joining hands with Hungarian football club DVKT 2

35Apollo Tyres Ltd Annual Report 2017-18
premiumisation in the sizes 17” and above for the PCR segment and all its sub-categories – summer, winter and all-season segment. Given the success and top ratings of its all-season tyres, the Company foresees further growth in this segment. Further, the launch of the next-generation winter tyres, Wintrac Pro, will support its position in the premium winter segment. The Company continues to seed the market with its best-in-class TBR tyres in the European market and the next year will see an aggressive push in this direction.
RISKS AND CONCERNS FROM THE POINT OF VIEW OF THE ORGANISATION
The Company has in place a robust risk management framework that identifies and evaluates business risks and opportunities. The Company recognises that these risks need to be handled effectively and mitigated to protect the interest of the shareholders and stakeholders, to achieve business objectives and create sustainable value and growth. The Company’s Risk Management processes focus on ensuring that these risks are identified promptly; and a mitigation action plan is identified and monitored periodically to ensure that the risks are being addressed accordingly. The Risk Management Steering Committee, which is responsible for the identification and mitigation of risks, operates with the following objectives:
> Proactively identify and highlight risks to the right stakeholders
> Facilitate discussions around risk prioritisation and mitigation
> Provide a framework to assess risk capacity and appetite; develop systems to warn when the appetite is getting breached
> Provide an analysis of residual risk
The list of key risks and opportunities identified by the Risk Management Steering Committee are the following:
FINANCIALS
1. Raw material price volatilitya) Natural rubber is an agricultural commodity
and subject to price volatility and production concerns.
b) Most other raw materials are affected by the movement in crude prices. Any increase in crude oil prices may impact the prices of some of the raw materials.
c) Both natural rubber and crude prices are controlled by external environment and are, therefore, beyond reasonable control of the management.
THE COMPANY CONTINUES TO SEED THE MARKET WITH ITS BEST-IN-CLASS TBR TYRES IN THE EUROPEAN MARKET AND THE NEXT YEAR WILL SEE AN AGGRESSIVE PUSH IN THIS DIRECTION.
2. Ability to pass on increasing cost in a timely mannera) Demand-supply situation must remain in favour
of the industry to enable it to undertake price increases.
b) The situation is further impacted by competitive activities and a general reluctance to make quick and significant price hikes.
3. Continued economic growtha) Demand in the tyre industry is dependent
on economic growth and/or infrastructure development. Any slowdown in the economic growth across regions impacts the industry.
b) In Europe, the Company’s tyre sales in winters are subject to seasonal requirement, which can be adversely impacted in case of a mild winter season.
4. Radialisation levels in Indiaa) Slower than expected increase in the radialisation
level in the truck tyre segment may affect Indian operations. Excess capacity may result in competitive pressures and decline in profit.
b) At the same time, an unexpected quicker increase in the level of radialisation can result in faster redundancy of cross-ply capacities and create a need for fresh investments.
5. Future growth a) Lower profitability due to some of the above
factors impacts the ability to invest in future growth.
b) Increased competition from global players such as Michelin, Bridgestone, etc. in India, may also hamper growth.
c) High levels of Chinese truck and bus tyre imports in India have impacted the Company’s business in the CV category in the past.
SOCIAL
6. Manpower retentiona) Retaining skilled personnel may become
increasingly difficult in India due to the entry of global majors in the Indian tyre industry.
INTERNAL CONTROLS AND SYSTEMS
The Company believes that internal control is one of the key pillars of governance, which provides freedom to the management within a framework of appropriate checks and balances. Apollo Tyres has a robust internal control framework, which has been instituted considering the nature, size and risks in the business.
Corporate Overview / Statutory Reports / Financial Statements

36
The framework comprises, inter alia, a well-defined organisation structure, roles and responsibilities, documented policies and procedures, etc. IT policies and processes also ensure that they mitigate the current business risks. These policies are complemented by a management information and monitoring system, which ensures compliance with internal processes as well as with applicable laws and regulations. The operating management is not only responsible for revenue and profitability, but also for maintaining financial discipline.
The Company’s internal control environment provides assurance on efficient conduct of operations, security of assets, prevention and detection of frauds/errors, accuracy and completeness of accounting records and the timely preparation of reliable financial information. The Company uses SAP – an Enterprise Resource Planning (ERP) software – as its core IT system. The systems and processes are continuously improved by adopting best-in-class processes and automation and implementing the latest IT tools.
The Company has a well-established independent in-house Internal Audit function that is responsible for providing assurance on compliance with operating systems, internal policies and legal requirements, as well as suggesting improvements to systems and processes. The Head of Internal Audit reports functionally to the Audit Committee and administratively to the Chairman and Managing Director of the Company. Key internal audit findings are presented to the Audit Committee at its quarterly meetings.
Most importantly, the Senior Management sets the tone at the top of no tolerance to non-compliance and promotes a culture of continuous innovation and improvement.
DISCUSSION ON FINANCIAL PERFORMANCE WITH RESPECT TO OPERATIONAL PERFORMANCE
The financial statements have been prepared in accordance with the requirement of the Companies Act, 2013, and applicable accounting standards issued by the Institute of Chartered Accountants of India. The management of Apollo Tyres Ltd. accepts the integrity and objectivity of these financial statements as well as the various estimates and judgements used therein. The
APOLLO TYRES HAS A ROBUST INTERNAL CONTROL FRAMEWORK, WHICH HAS BEEN INSTITUTED CONSIDERING THE NATURE, SIZE AND RISKS IN THE BUSINESS.
THE SENIOR MANAGEMENT SETS THE TONE AT THE TOP OF NO TOLERANCE TO NON-COMPLIANCE AND PROMOTES A CULTURE OF CONTINUOUS INNOVATION AND IMPROVEMENT.

37Apollo Tyres Ltd Annual Report 2017-18
estimates and judgements relating to the financial statements have been made on a prudent and reasonable basis, in order that the financial statements are reflected in a true and fair manner and also reasonably present the Company’s state of affairs and profit for the year.
(` in Million)
Sl. No.
Particulars
Year Ended Year Ended
March 31, 2018 March 31, 2017 March 31, 2018 March 31, 2017
Standalone Consolidated
1 Revenue from Operations:Gross Sales 103,881 98,066 149,290 140,529Less: Excise Duty 2,549 9,899 2,549 9,899Net Sales 101,332 88,167 146,741 130,630Other Operating Income 1,665 1,171 1,665 1,171
2 Other Income 1,218 1,353 1,165 1,518Total 104,215 90,691 149,571 133,319
3 Total Expenditurea) Decrease / (Increase) in Finished Goods
& Work-in-Process125 (3,181) (1,474) (2,356)
b) Consumption of Raw Materials / Purchase of Stock-in-Trade
65,329 55,342 85,430 71,257
c) Employee Benefits Expense 7,097 6,208 21,566 19,270d) Other Expenses 17,972 17,696 26,371 25,143
Total 90,523 76,065 131,893 113,3144 Operating Profit 13,692 14,626 17,678 20,0055 Finance Costs 1,375 888 1,629 1,0296 Depreciation & Amortisation Expenses 3,644 2,882 5,926 4,6187 Profit before Exceptional Items & Tax 8,673 10,856 10,123 14,3588 Exceptional Items - -9 Share of profit/ (loss) in associate/ joint venture 0 (3)10 Profit before Tax 8,673 10,856 10,123 14,35511 Provision for Tax
– Current 1,885 2,310 2,389 2,764– Deferred 1,486 745 495 601– MAT Credit (922) (226)Total 2,449 2,829 2,884 3,365
12 Profit after Tax 6,224 8,027 7,239 10,990
Apollo Tyres’ entry into Indian football arena by becoming the principal sponsor for the Indian Super League team, Chennaiyin FC.
Corporate Overview / Statutory Reports / Financial Statements

38
INFORMATION TECHNOLOGY
IT plays an important role in ensuring the functioning of all operations across Apollo Tyres. FY2018 was an eventful year for the Company’s IT programme as it pushed its technology roadmap and implemented multiple projects. Some of the key initiatives in diverse areas such as infrastructure, compliance and customer support included:
> Completion of SAP Infrastructure revamp for better performance and availability of the core ERP system
> Integration of Hungary Greenfield
> Start of the journey to cloud-based applications, reducing the total cost of ownership for IT assets and increasing security
> Kick-off of enhanced Managed Security Services to prevent cyber attacks and secure the data
> As a statutory requirement, the Company rolled out the GST implementation with limited system downtime and no minimal impact on customer billing
> Implementation of Sales versus Claims Dashboard and Reports for Customer Service for traceability
> Business Partner Call Centre application performance improvements
> Rollout of Barcode Traceability for Chennai PCR
> Digital enablement of dealer network with access to the APMEA IT systems, e.g. Dealer Portal (Sampark) and mobile application
> Launch of Apollo Smart App for the South Africa market
DEVELOPMENT IN HUMAN RESOURCES AND INDUSTRIAL RELATIONS
In a complex and competitive world, Apollo Tyres strongly believes that its people are a key differentiating factor to achieve business and social objectives. The Company continues to invest in a wide variety of Human Resources (HR) activities that ensure that the capability, motivation and individual needs of our employees are met and HR continues to play the role of a strategic business partner.
The HR strategy comprises the following four themes:
1. Performance ManagementOur Performance Management process, ‘Horizon’, completed its second annual cycle. During the period and due to the stringent process methodology, employees have sharper visibility of their key objectives and their alignment with the organisational objectives. Further, employees are now charting clear developmental requirements to meet the demands of their current job as well as future roles.
2. Management and Leadership CapabilityWith a sharp focus on scaling people management capability for line managers, the Company introduced a suite of management development programmes called the ‘Essential 7’ to provide knowledge on core managerial requirements, including delegation, mentoring and coaching, performance management and recruitment skills. In the past year, over 400 managers have attended one of the ‘Essential 7’ programs.
APOLLO TYRES STRONGLY BELIEVES THAT ITS PEOPLE ARE A KEY DIFFERENTIATING FACTOR TO ACHIEVE BUSINESS AND SOCIAL OBJECTIVES.

39Apollo Tyres Ltd Annual Report 2017-18
3. Talent and Succession With the Company’s ambitious growth plans and increasing competitor activity, the war for key talent is heating up. For this reason, a focussed talent identification and development programme was launched. Through this, the Company is able to:
> Identify high-potential individuals
> Assess their current experience and capability against the leadership model
> Facilitate discussions around development needs; formulate a development plan
> Put in place retention methods
Further, a corporate succession planning initiative has focused on long-term talent planning. The Company has identified a number of high-potential employees as successors for key general management roles.
The HR Team at R&D has initiated knowledge-sharing sessions called ‘Meet the Maestro’ for the employees at R&D. In the sessions, eminent personalities share their understanding and trends of the fast-paced changes in the automotive industry, including areas such as driverless cars, solar engines and driver-recognition security to name a few.
In the Hungary plant, a job-evaluation exercise was undertaken to define job levels and documented areas of accountability. This exercise is now being used to underpin a range of people-related activities, including resource planning, salary benchmarking and Learning & Development.
4. Employee EngagementFor Apollo Tyres, employee engagement is of paramount importance. The Company believes that an engaged employee is one who has clear job knowledge, pipeline for growth, job rotation, an atmosphere of learning and sharing, open upward and downward communication and beyond. The Company endeavours to provide an engaging environment by ensuring that the above parameters are met. No wonder, in India, the Company was placed in the top ten companies list in the Manufacturing sector in the Great Place to Work survey.
Further, the Company continuously engages with its employees to get feedback on a range of topics, including leadership, communication, working conditions and overall satisfaction. In Europe, an employee engagement survey was undertaken to gather such feedback and an action plan has been put in place to address the identified areas of improvement.
IN INDIA, THE COMPANY WAS PLACED IN THE TOP FOUR COMPANIES LIST IN THE MANUFACTURING SECTOR IN THE GREAT PLACE TO WORK SURVEY.
Apollo Tyres wins gold award in the QCFI, Coimbatore chapter
Corporate Overview / Statutory Reports / Financial Statements

40
In line with its core value of One Family, the Company reaches out to the families of the employees with activities such as family fun days and visits to the factories and offices across a number of locations worldwide.
Beyond these, the Company continued to focus on training and development. During the year, the ‘Admire’ program, a truly cutting-edge development programme for sales professionals, was rolled out in APMEA. The programme was designed and run in collaboration with EY with an objective of assessing, developing and monitoring sales capability. The strong link to the business strategy and measurable return on investment of this programme have already demonstrated the value added to the business.
INDUSTRIAL AND EMPLOYEE RELATIONS
Apollo Tyres has consistently worked collaboratively with unions and work councils across its global locations. This year, the Company successfully concluded a number of key agreements with unions both in India and Europe that will allow it to develop and deploy its existing workforce for greater flexibility.
HEALTH, SAFETY AND ENVIRONMENT
As a firm commitment to Health, Safety and Environment (HSE), the year saw multiple initiatives to implement and review the HSE plans and achieve the defined KPIs. These initiatives included Gemba Walks (review of the site conditions) by the Leadership team, identification
of behaviour-based safety observations and ensuring positive intervention to motivate people. During FY2018, the Company recorded 1,074 areas of opportunities to further enhance HSE levels of the organisation.
As part of its commitment to the environment, the Company trained over 150 managers to ensure seamless transitioning from ISO 14001:2004 to ISO 14001:2015, which aims to enhance the environment performance.
During the year, the Company focused on incident reporting and implementation of lessons learned as a key component of the HSE management system. It saw a sharp reduction in the lost-time incident cases from our plants due to structured efforts to improve the safety performance.
Use of mobile phones was identified as one of the major distractions, especially while working inside manufacturing plants. The Company took proactive steps to address this risk by limiting smartphone usage on the shop floor. Further, an employee education and awareness campaign, Lookup, was rolled out to stress on work- and non-work related distractions due to the mobile phone.
HSE efforts were reinforced through various promotional drives such as World Safety Day, World Environment Day, Earth Day and Road Safety Week celebrations. Rewards and recognition initiatives were set up across the Company to encourage HSE initiatives across the value chain. A Chairman Safety Award was introduced
THE COMPANY FOCUSED ON INCIDENT REPORTING AND IMPLEMENTATION OF LESSONS LEARNED AS A KEY COMPONENT OF THE HSE MANAGEMENT SYSTEM.

41Apollo Tyres Ltd Annual Report 2017-18
to recognise employees demonstrating superior safety performance.
During the year, the Company’s Perambra unit received the Factories & Boilers Safety Award 2017 for its continuous efforts in the field of safety.
CORPORATE SOCIAL RESPONSIBILITY
Sustainability and social responsibility are integral elements of Apollo Tyres’ corporate strategy. The Company’s CSR activities aim at bringing a positive impact on the everyday lives of its stakeholders. Currently, both regions have actively undertaken CSR activities. Across all these regions, the CSR activities focus on two broad areas: Environment and Social. Within the two themes, there are four core areas of
work health programme for truck drivers; solid waste management and sanitation, environment conservation (biodiversity and climate change); and community development (livelihood for women and farmers).
SOCIAL
Under the health programme for truck drivers, the Company expanded its flagship project, HIV / AIDS awareness and prevention, to include vision care – a critical aspect related to driving – and other generic health issues. This programme runs across 27 transhipment hubs in 18 states of India. FY2018 saw the Company launching mobile units in Delhi and Nammakal, Tamil Nadu, and expanding the reach of the healthcare centres. Given the depth and success of the program, other government bodies such as National Aids Control Organisation, National Programme for Control of Blindness and Essilor Group joined hands with the Company to reach out to a much larger audience. The Company continued its partnership with Ambuja and ACC.
It also focused on aiding the livelihood and income generation for underprivileged women and farmers and on improved farming practices. In FY2018, the Company helped the wives of the rubber tappers to set up rubber sheet processing units and create income-generation opportunities.
ENVIRONMENT
The year saw the Company organising events to link with National Swachhata Diwas under its SPARSH banner with mass cleaning campaigns in various cities. Further, household toilets were constructed in partnership with the governments in Tamil Nadu and Andhra Pradesh. Taking this initiative forward, the Company constructed a playground using end-of-life tyres.
Under biodiversity conservation, the Company continued to work in partnership with the Wildlife Trust of India for its Mangrove Conservation project in Kerala. During the year, the Company organised a Mangrove National Conclave along with the Wildlife Trust of India and the International Union for Conservation. Over 200 corporate and government institutions and other professionals participated in the conclave. The Company further ramped up its tree plantation drive and has now planted over 0.35 million trees to generate a carbon sink in Tamil Nadu, India, thus sequestering around 5,500 tonnes of CO2. The Company also continued to work with the Municipality of Enschede in planting various saplings and flowers on the slopes of the Beek city.
THE COMPANY’S PERAMBRA UNIT RECEIVED THE FACTORIES & BOILERS SAFETY AWARD 2017 FOR ITS CONTINUOUS EFFORTS IN THE FIELD OF SAFETY.
Celebration of Swachhata Diwas in Chennai, India
Corporate Overview / Statutory Reports / Financial Statements

42
This section gives an overview of the sustainability performance of Apollo Tyres by focusing on its key stakeholders. The Company has developed its own Sustainability Framework, drawing elements from ISO 26000, the international standard on Social Responsibility and National Voluntary Guidelines developed by the Government of India.
PERIOD OF REPORTING
The period covered for the purpose of this report is April 1, 2017 to March 31, 2018.
SCOPE OF THE REPORT
The Company has made all efforts to ensure transparency, accuracy and materiality in this report. The information disclosed in this report relates to the two operations of the Company – Europe and Asia Pacific Middle East and Africa (APMEA). This report primarily covers manufacturing operations, with the exception of the ‘Care for Employees’ section, which also discusses non-manufacturing operations.
Apollo Tyres is one of the leading players in India with significant market share across product categories
Sustainability Snapshot

Corporate Overview / Statutory Reports / Financial Statements
43Apollo Tyres Ltd Annual Report 2017-18
The manufacturing locations are: > Europe Operations: Enschede in the Netherlands
and Gyongyoshalasz, Hungary> APMEA Operations: Chennai, Limda, Perambra and
Kalamassery (leased unit) in India
MANUFACTURING LOCATIONS
43
Enschede
Gyongyoshalasz
Chennai
Perambra
Kalamassery
Limda
Note: Map not to scale

44
Committee, which has Board representation, to define the essence of sustainability in the organisation. The Sustainability Framework and the associated roadmap are further embedding the sustainability principles in the heart of the organisation.
Moreover, to reach out to a wider range of stakeholders and communicate its sustainability performance, the Company started making disclosures based on international guidelines since 2010. The sustainability disclosures have been instrumental in assessing the actual performance, setting benchmarks and thriving for continual improvement towards a better growth trajectory in all domains of the triple bottom line – social, environment and economic.
Regular formal and informal interactions with the stakeholders over the years have been fruitful in enduring strong stakeholder relationships reflecting onto the key business risks and opportunities. Sustainability risks are identified through such engagements and strategies are formulated to mitigate these risks.
THE COMPANY FOCUSED ON CONSOLIDATING POSITION IN KEY MARKETS, EXPANDING MARKET SHARE, ENHANCING RETAIL PRESENCE AND BECOMING A FULL-RANGE TYRE COMPANY IN INDIA.
MANAGEMENT APPROACH TOWARDS SUSTAINABILITY
The sustainability strategy of Apollo Tyres encompasses a conscious approach and effort towards environment protection, social prosperity, financial growth and stability. The Company incorporates environmental and social considerations in its day-to-day operations. The Company’s sustainability strategy has made its growth balanced and responsible.
The Company continues to aspire to be the industry leader by pursuing new emerging opportunities and continually embedding sustainability into its business model. This is further enhanced through its well-developed and implemented Sustainability Management Framework.
The Company ensures that the sustainability goals are aligned with the business, as it is imperative to create value for all stakeholders. A major shift over the past years has been the integration of sustainability into all levels of the corporate strategy, business model as well as the value chain. The Company has a Sustainability
IN THE PREVIOUS FISCAL, THE COMPANY HAD LAUNCHED THE AMAZER 4G LIFE. WITHIN A SHORT SPAN OF TWO YEARS, THE PRODUCT IS THE TOP BRAND IN ITS SEGMENT, A TESTIMONY TO APOLLO’S STRONG R&D SKILLS.
Apollo Tyres flags off Mobile Medical Unit for health check of truckers, Sanjay Gandhi Transport Hub, New Delhi

45Apollo Tyres Ltd Annual Report 2017-18
Corporate Overview / Statutory Reports / Financial Statements
WORKING TOGETHER
The Company engages with a wide range of stakeholders around the globe. At the local/regional level, the operations are encouraged to work with communities to identify and implement stakeholder engagement initiatives.
CUSTOMERS EMPLOYEESSUPPLIERS
AND DEALERS
SHAREHOLDERS/INVESTORS/
ANALYSTSCOMMUNITY
The Company believes in communicating with various stakeholders to understand their concerns and respond with appropriate mechanisms. Various functional departments use diverse communication channels to fulfil this responsibility.
Apollo’s Three-Pronged Strategy for Stakeholder Engagement
To increase stakeholder participation
To achieve organisational goals
To strengthen strategic partnerships with its stakeholders
CARE FOR CUSTOMERS
Apollo Tyres’ strength lies in its competency to fulfil customers’ needs with high-quality products that ensure customer safety on the road. One of the cornerstones of Apollo Tyres’ value system rests on its key value ‘Customer First’ and the Company’s consistent investment in R&D, testing facilities, etc. in line with the value.
In its journey towards building trusting customer relationships, the Company has achieved many milestones and has made a significant transition in the recent past by shifting the focus to a more holistic approach of ‘complaint management’ through customer engagement.
Customer EngagementThe pivot for establishing a superior customer engagement rests with the Company’s Customer Service department, which serves as the bridge between the customers and other departments, including R&D, Marketing and Manufacturing, by sharing customer feedback. Each member of the department
Caring about customers and
creating win-win partnership with
our customer
Timely delivery of requested
services
Cummunicate openly & honesty

46
has specialised product expertise, technical expertise and commercial understanding to provide value-added services to the customers. The Company has rolled out multiple initiatives to ensure a world-class customer engagement programme. Some of these initiatives include:
Regional Inspection Centres (RICs)The Company has set up RICs across India to carry out checks on returned products. The insights gained are shared with the Manufacturing and R&D departments for improving the quality of the products and minimising wastes in terms of scrap, thus creating a virtuous cycle and helping Apollo Tyres to further its commitment on ‘Customer First’.
Voice of MarketThe Company has regular interactions with key people in the trade, such as the Fitter, Retreader, Casing Dealer and Drivers, etc. to understand their pain points. This interaction helps the Company in educating them and providing them with the tools to better engage with their respective customers.
Load and Fitment StudiesThe Customer Service team gathered data of roughly around 1 lakh tyre fitments from approximately 9,000 trucks every month, as part of its Load and Fitment study initiative. The data is analysed to understand the Company’s customers and serve them better.
Cost per Kilometre (CPKM)During the year, the Company recorded CPKM values at 393 fleets. This record has helped the Company in showcasing the value of its tyres to the fleet owners.
Customer SafetyAt Apollo Tyres, customer safety continues to be accorded top priority and is a critical component of any business decision made. The Company is constantly looking for best-in-class and innovative solutions to give its customers the best and safest product experience.
Product labelling is critical to not only ensure compliance to applicable rules and legislations but also to ensure that sufficient information is provided to customers regarding the product safety, which helps them to make informed decisions. In its Europe operations, the Company makes all the necessary efforts to comply with the European Tyre Labelling (ETL) regulation, which requires display of information on fuel efficiency (carbon footprint), wet grip (road safety) and external rolling noise (environmental pollution) of tyres.
Customer SatisfactionThe recently released JD Power 2018 India Original Equipment Tyre Customer Satisfaction Index (TCSI) study has ranked Apollo Tyres the highest in the small car segment. As per this year’s study, the small car segment translates to all the hatchbacks sold in India. JD Power’s TCSI study also ranked Apollo Tyres #2 in the midsize cars or sedan segment. The Company also received 5-star Power Circle Ratings from JD Power for both small and midsize cars.
The Company’s tyres, which are Original Equipment (OE) fitted in eight of the top 10 cars being sold in India, have a share of nearly 30% in India’s OE segment for small and midsized cars. Apart from the OE fitment in the domestic models of several cars, the Company’s
THE RECENTLY RELEASED JD POWER 2018 INDIA ORIGINAL EQUIPMENT TYRE CUSTOMER SATISFACTION INDEX (TCSI) STUDY HAS RANKED APOLLO TYRES THE HIGHEST IN THE SMALL CAR SEGMENT.

47Apollo Tyres Ltd Annual Report 2017-18
Corporate Overview / Statutory Reports / Financial Statements
tyres are also OE fitted for multiple export models, as Apollo Tyres has secured the Global Supplier status with various car makers.
CARE OF BUSINESS PARTNERS
Suppliers and dealers form the base of sustainable organisations. As a forward-looking Company, Apollo considers its suppliers and dealers to be important stakeholders and works closely with them, and continuously engages with them to build long-term associations.
SUPPLIER ENGAGEMENT
Apollo Tyres has a centralised purchase function, based out of its Head Office, for the procurement of raw materials for its manufacturing plants globally. In addition, the Company has purchase offices at Cochin, Singapore and Enschede, the Netherlands. The suppliers are spread across Asia, Africa, Europe and the Americas.
Sustainability is becoming an integral part of the supply chain management. The focus in the upstream supply chain extends to the sourcing of the raw materials, their processing and their use in the manufacture of intermediate and final products.
Purchase PolicyApollo Tyres considers its vendors as long-term business partners who are expected to ensure their operations and the products supplied to Apollo Tyres comply with all national and other applicable laws and regulations.
The Company’s purchase policy rests on the fundamentals of striving to continuously enhance customer satisfaction by providing cost-effective and quality materials on a timely basis, while working together with our supply chain partners on environmental, economic and social aspects to enable sustainable business practices.
Purchasing GuidelinesApollo Tyres deals directly with the manufacturers and prefers domestic suppliers because of obvious benefits such as proximity to its plants, lower transit time, lower inventory and lower carbon footprint.
Import suppliers are developed as an alternative source of materials for cost benefit and for technical partnerships in areas where the domestic suppliers have limited capacity or technology.
Partner Code of ConductThe Company works together with its partners and encourages them to be responsible towards the society and environment as they conduct their business. This also helps in the development and implementation of the Company’s Corporate Social Responsibility (CSR) programme. The Company also promotes and encourages its partners to comply with its Partner Code of Conduct (PCC), which integrates environmental, occupational health and safety and human rights and labour policies into the business and decision-making processes.
Green ProcurementApollo Tyres promotes and encourages its suppliers in the development and usage of environment-friendly and green products in the production of its finished products, including the usage of recycled products. Also, the Company is actively engaged with its suppliers for the use of eco-friendly packaging material and reusable/recyclable packaging, such as returnable metal boxes, returnable pallets, returnable metallic spools, etc., in the supply of their raw materials to its manufacturing plants globally.
Regulatory CompliancesThe Company complies with various regulations and also mandates that its supply chain partners register for various compliances. For example, Apollo’s products are REACH (Registration, Evaluation, Authorisation and Restriction of Chemicals) complaint. REACH is a European Union regulation to improve the protection of human health and the environment from the risks posed by chemicals. The Company ensures that its suppliers are either registered for REACH or are executing the required activity as prescribed by REACH. Further, the Company ensures the export of PAH (carcinogens found in rubber articles) free tyres to Europe and other markets.
Tyre Labelling RequirementsApollo is engaged with its raw material suppliers for continual improvement of the labelling parameters related to its tyre, in line with the continuously evolving needs of the market and expectations from its Original Equipment Manufacturer (OEM) customers.
Safety at WorkplaceApollo Tyres reinforces that its suppliers follow all the applicable industrial practices to ensure its employees’ safety. A safe workplace ensures high morale and energy among the employees to work towards the common goal of achieving high quality and productivity.
Supplier Management PracticesThe Company continuously works with its supplier community and has undertaken the following initiatives:
APOLLO TYRES PROMOTES AND ENCOURAGES ITS SUPPLIERS IN THE DEVELOPMENT AND USAGE OF ENVIRONMENT-FRIENDLY AND GREEN PRODUCTS IN THE PRODUCTION OF ITS FINISHED PRODUCTS, INCLUDING THE USAGE OF RECYCLED PRODUCTS.
THE COMPANY WORKS TOGETHER WITH ITS PARTNERS AND ENCOURAGES THEM TO BE RESPONSIBLE TOWARDS THE SOCIETY AND ENVIRONMENT AS THEY CONDUCT THEIR BUSINESS. THIS ALSO HELPS IN THE DEVELOPMENT AND IMPLEMENTATION OF THE COMPANY’S CORPORATE SOCIAL RESPONSIBILITY (CSR) PROGRAMME.

48
a) New Supplier Selection The Company follows a multi-level and in-depth
supplier selection process involving commercial and technical evaluation of the supplier through a cross-function team of Purchase, R&D, Plant Technology and Manufacturing.
b) Joint Development Projects The Company, along with its suppliers, works on joint
projects to ensure the development of new materials and tyres. The Company also seeks technical collaboration from its suppliers through active participation in various technical seminars and in its Technical Leadership Development Programmes (TLDPs).
c) Supplier Audits Supplier audits are conducted at the time of
selection of new suppliers and are also conducted at a frequency based on the defined audit criteria for existing suppliers. Such supplier audits are conducted by a qualified team of trained auditors from Apollo. Based on the outcome of the audit, detailed improvement plans are drawn up, agreed upon and followed up with the suppliers until closure.
d) Supplier Performance Evaluation Supplier performance evaluation is done on the
performance aspects of quality, delivery and service through rating criteria that aim at timely feedback to suppliers to improve their performance.
e) CSR in Supply Chain The Apollo Team runs a CSR Programme at the
premises of its raw material suppliers under which an awareness programme is conducted
on HIV/AIDS prevention and the ill effects of substance abuse. The programme is conducted by internal resources from the Company’s Purchase department, who have been trained by the International Labour Organisation (ILO). During the awareness programme, participants are sensitised about HIV / AIDS and substance abuse through a presentation, along with the other education material.
f) Quality Workshop for Natural Rubber – Apollo Certified Sheet Rubber Programme (ACSRS)
A programme was organised for natural rubber suppliers to empower them with the required sheet grading, handling and storage practices. The programme focused on enhancing awareness about the quality aspects, implementing good grading and sheet handling practices and constant improvement through feedback and periodic interactions.
THE APOLLO TEAM RUNS A CSR PROGRAMME AT THE PREMISES OF ITS RAW MATERIAL SUPPLIERS UNDER WHICH AN AWARENESS PROGRAMME IS CONDUCTED ON HIV / AIDS PREVENTION AND THE ILL EFFECTS OF SUBSTANCE ABUSE. THE PROGRAMME IS CONDUCTED BY INTERNAL RESOURCES FROM THE COMPANY’S PURCHASE DEPARTMENT, WHO HAVE BEEN TRAINED BY THE INTERNATIONAL LABOUR ORGANISATION (ILO).
Recognition plaque in Women Empowerment category, FICCI CSR Award.

49Apollo Tyres Ltd Annual Report 2017-18
Corporate Overview / Statutory Reports / Financial Statements
DEALERS ENGAGEMENT
In the tyre manufacturing industry, dealers act as the interface between the manufacturer and consumers. They play an important role as they can influence the decision of buyers as well as provide feedback to the Company on buyers’ preferences and concerns. With dedicated policies such as ‘Commercial Policy’ and ‘Trade Communication’, the Company continues to strengthen its business process and improve dealer-friendly benefits. These initiatives aid in fostering a culture of healthy competition and belongingness and promote ease of doing business with a strong governance system in place.
The Company has undertaken multiple initiatives aimed at dealers to build a stronger connect and enhance the Apollo brand. For example, the formation of the Management Advisory Committee, comprising key business partners, collects feedback to improve organisational performance. The Apollo Value Edge Club Programme offers tier-based benefits and empowerment as per the nature and extent of business and commitment to its various business partners.
In line with its philosophy to listen to its stakeholders, the Company has created various initiatives and platforms. The Business Partner Service Centre enables dealers to place queries regarding orders, payments, complaints, etc. Importantly, dealer feedback and grievances are recorded, mapped and resolved in a time-bound manner. The mid and senior management of the Sales and Commercial team regularly visit dealers to collect feedback from different markets and then takes the
THE APOLLO VALUE EDGE CLUB PROGRAMME OFFERS TIER-BASED BENEFITS AND EMPOWERMENT AS PER THE NATURE AND EXTENT OF BUSINESS AND COMMITMENT TO ITS VARIOUS BUSINESS PARTNERS
Easy to do Businesss
Dealer Profitability
Service Excellence
necessary actions. The Company also has an annual forum for the big dealers, also known as ‘Platinum Dealers’, where the Senior Management interacts with them in a structured manner, listening to their queries, grievances and suggestions.
Further, the Company has introduced two robust IT-enabled platforms – Business Partner Service Centre and Sampark – that provide a single window to its business partners for all matters related to business transactions, queries, benefits and grievances, etc. The year also saw the rollout of the Goods and Service Tax (GST) compliance and the Company created a special GST cell for hand-holding and support to dealers for
Quality Workshop for Natural Rubber – Apollo Certified Sheet Rubber Programme [ACSRS]

50
Europe
91
9
Employee Statisics
Region-wise Employee Distribution
76.54
APEMA Europe Corporate Americas Permanent Contract
Permanent Contract Permanent Contract
0.10
%
%
%
%
6.18
17.18
Employment Break-Up for Permanent and Contract is depicted below –
APMEA
6634
Corporate
98
2
smooth migration. All such initiatives have helped improve the dealer experience and turnaround time of services, in addition to strengthening the product. These initiatives have also cemented the trust level between the Company and its stakeholders by making business more transparent and easy.
CARING FOR OUR WORKFORCE
In today’s dynamic and competitive business landscape, our people are a key differentiating factor, enabling us to achieve our business objectives. Apollo Tyres continues to invest in various Human Resources activities, ensuring the overall growth of the employee along with the organisation. The Company has devised a strategy to manage this important resource.
The Human Resources strategy has four main themes, as mentioned in the Management Discussion and Analysis section:
> Performance Management
> Management and Leadership Capability
> Talent and Succession
> Employee Engagement

51Apollo Tyres Ltd Annual Report 2017-18
Corporate Overview / Statutory Reports / Financial Statements
Americas
Americas - 100
The total employee attrition for Apollo Tyres was 5.28% for FY2018
Programme Brief Description Target Audience Key Matrix Learning Partner
ADMIRE For Territory Incharges (TIs)
Functional programme for Field Sales TIs for effective Network Management
TI Field Sales
120 unique learners (entire TI Layer) 300 training man-days
EY E-Cube Sales Solutions Field Sales Leaders
Sales Step Up Training
Product and Process Training
Field Frontline 1 batch with 20 unique learners 120 training man-days
Internal Experts
Key Account Management Training: OEM Sales Team
Essentials of KAM Approach of Sales for OEM Frontline team
OEM Frontline 20 unique learners 40 training man-days
Work Better Training
B2B Sales Fleet and OHT Sales
Essentials of B2B Selling for newly assembled Fleet Sales and OHT Sales team
OHT Sales Fleet Sales
25 unique learners 75 training man-days
Work Better Training
Essential 7 Programs # First Line Managers # Communication Skills
Essential managerial training at junior and mid-managerial layers
Junior and Middle Management
105 unique learners 210 training man-days
Internal Experts from Corporate HR
Assorted Individual Nominations and HO Team Trainings
Specialised and bespoke training requirements that are met by attending external symposiums, conferences and workshops
As per requirement
22 distinct programs 34 unique learners 51 training man-days
Various
Back to Basics Provide foundational knowledge of core tyre technology
R&D specialists 70 attendees over three sessions
Internal Experts
Tyre Manufacturing Quality Control
Essentials of tyre manufacturing process
Quality and Assurance specialists
35 participants in a three-day programme
Directorate General of Quality Assurance, Ministry of Defence, India
Permanent Contract
% THE COMPANY HAS INTRODUCED TWO ROBUST IT ENABLED PLATFORMS – BUSINESS PARTNER SERVICE CENTRE AND SAMPARK – THAT PROVIDE A SINGLE WINDOW TO ITS BUSINESS PARTNERS FOR ALL MATTERS RELATED TO BUSINES TRANSACTIONS, QUERIES, BENEFITS AND GRIEVANCES, ETC.

52
Health and SafetyApollo Tyres is committed to adhere to the highest standards of health and safety. It strives to provide its employees with a safe and healthy workplace. The Company continuous to focus on deploying behaviour-based safety programmes and global safety standards across its locations. Apollo Tyres Limited, Perambra has received the Factories & Boilers Safety Award - 2017 from the Honourable Minister for Labour, Kerala for its continuous efforts in the field of safety.
In the year FY2018, a total of 1,074 near misses were recorded through the collective effort of the employees. Action plans based on these areas were developed and implemented. Apollo Tyres has adopted a systematic approach aimed at quickly implementing low-cost improvements that result in measurable impact – ‘Kaizen’, one of the brands of the Company. Due to our efforts, there is a significant improvement in Lost Time Injury (LTI) cases in plants. The number of incidents have reduced from 80 LTI to 59 LTI in the year 2017-18. However, LTI reporting from the non-manufacturing area is still low, which has been identified as an area of focus for the coming year.
In FY2018, the Company lost one of its employees in a tragic accident. Post the accident, the Company has retrained all employees involved in similar operations across the world and put in place additional engineering controls and protections to prevent such accidents from recurring.
The Company has identified the use of mobile phone as one of the major distractions while working inside a manufacturing plant. As a result, 2 out of 6 plants have
restricted its use at the shop floor and remaining plants are making structured efforts to implement the same. To educate employees, a focused campaign – Look up – was rolled out. This campaign focuses on work-related distractions as well as on off-the-work issues.
The Company focused on educating and training its stakeholders and conducted numerous workshops for employees on workplace hazards and controls.
CARE FOR COMMUNITIES:
Apollo Tyres has been executing CSR projects around its facilities/project sites and also extending them to other locations as identified necessary. All our programmes are developed in partnership with the community to ensure that they cater to specific needs and to inculcate a sense of ownership among the community members. Aligned to national and international development goals, the CSR programmes and activities are categorised into two themes: Environment and Social (which includes health and community development). Within these themes, there are four core areas of work: Health Programme for truck drivers, Solid Waste Management and Sanitation, Environment Conservation – Biodiversity and Climate Change, and Community Development (livelihood for women and farmers).
In addition to the above-mentioned initiatives, there are a few local ones around our manufacturing locations. They are Watershed Management and Renewable Energy Proliferation projects under Environment and Road Safety Awareness and Computer Literacy under Social. Further, the organisation also undertakes philanthropic initiatives under the Taru Foundation.
THE COMPANY FOCUSED ON EDUCATING AND TRAINING ITS STAKEHOLDERS AND CONDUCTED NUMEROUS WORKSHOPS FOR EMPLOYEES ON WORKPLACE HAZARDS AND CONTROLS.
Children at Go The Distance ELT Playground, Vallakottai, Tamil Nadu

53Apollo Tyres Ltd Annual Report 2017-18
Corporate Overview / Statutory Reports / Financial Statements
1. Health Programme for Truck Drivers Apollo Tyres has initiated a preventive health care
programme for its key stakeholders, its customers – truck drivers. By virtue of their profession, truck drivers are vulnerable to various health hazards. The programme provides health care services such as awareness and prevention of HIV / AIDS, vision care, awareness about tuberculosis, detection of other non-communicable diseases such as diabetes and high blood pressure and general treatment facility.
The programme has established 27 Health Care Centres (HCCs) in large transhipment hubs across the country. The HCCs are staffed with well-qualified doctors, paramedics, counsellors and outreach workers.
To enhance connectivity, in the reporting year, the organisation also launched a mobile medical unit (Apollo Tyres Health Care Express) for the health check of truck drivers and allied population at two locations in Delhi and Nammakkal, Tamil Nadu.
The important feature of the health programme is Peer Educators (PEs) or volunteers. They actively reach out to the target audience at the most opportune time. So far, the programme has mobilised 700 active PEs across locations.
In the reporting year, awareness initiatives reached 529,717 people out of which 118,913 people received treatment facility. In the reporting year, there is a 40% increase in the people treated from the year FY2017.
Out of the total treated in the reporting year FY2017-18, 39,914 people opted for HIV testing, 52,793 for vision screening and 15,021 for diabetes testing.
2. Solid Waste Management and Sanitation Projects such as Clean My Transport Nagar (CMTN),
Clean My Village (CMV), the Sanitation project and End-of-Life Tyres (ELT) project form part of the solid waste management and sanitation programme. The ELT project promotes recycling of waste tyres by constructing play grounds.
These programmes are running under the umbrella SPARSH, Swachh Banao – Our endeavour is to promote Waste-Conscious Societies in a resource-constrained Habitat and Hygienic Lifestyle by Crusading against Open Defecation.
SPARSH stands for: S – Segregate Waste; P – Practise Composting;
A – Awareness Generation; R – Reduce, Reuse & Recycle; S – Safe Sanitation; H – Hygiene for All. The strategy of SPARSH remains to engage with its stakeholders to create awareness on the 3 R’s, i.e. Reduce, Reuse and Recycle.
22,488 people were outreached by awareness generation and 10,805 people were outreached by the door-to-door waste collection service.
In the reporting year total waste collected from
CMTN & CMV is 2,084.5 metric tonne (MT) out of which 198.1 MT was biodegradable and 1886.4 MT was non-biodegradable waste.
To support the Swachh Bharat Mission, 324 individual household toilets were constructed in Chennai and Andhra Pradesh in the reporting year. Further, one ELT playground was constructed using 130 tyres at Chennai location.
3. Environment Conservation – Biodiversity and Climate Change
The organisation has contributed towards conservation of biodiversity and mitigation of climate change with the help of projects such as afforestation and mangrove conservation.
Under the afforestation project, the organisation has planted 100,000 trees in the reporting year. As per estimation, around 5,500 tonnes of CO2 has been sequestered from these trees. 800 acres of land is being converted under social foresting, with 306 farmers involved in the programme.
Mangrove conservation is a project started under this theme in the year FY2017. The organisation has partnered with the Wild Life Trust of India (WTI) for the mangrove conservation project located in Kunhimangalam village in Kannur district in Kerala. The project has a nodal centre set up for mangrove-based nature education, research and restoration at project site. A mangrove nursery and community-based initiatives to enhance public awareness and reduce threats to mangroves are other aspects of the project. A total of 10,000 people were educated through various awareness programmes on mangrove conservation.
In the reporting year, the National Conclave on Mangrove Conservation was organised in December 2017. It was in partnership with the WTI and the International Union for Conservation of Nature (IUCN). The Conclave witnessed the participation of 200 delegates from corporate and government institutions and other professionals.
4. Community Development – Livelihood Initiative for underprivileged women and farmers
Under this project, women are empowered by encouraging them to form Self Help Group (SHGs) or making them part of existing SHGs. Women are trained on financial literacy, book keeping, documentation, leadership, etc. through SHG trainings. The training includes vocational skills such as apparel making, jewellery designing, nursing, beautician, housekeeping, khakhra making, sanitary napkin making, sheet making, mushroom cultivation, apiculture etc. The main objective of this initiative is to create livelihood opportunities at door step and develop the entrepreneurship capabilities of underprivileged women through training. The trained beneficiaries are further linked with the market and service sector for employment. In the reporting year, the livelihood initiative reached a total of 947 women, out of which 618 women were trained in income generation.

54
The women who are engaged in income-generation initiatives through our programme are further benefitted by the provision of biogas units, as they save the cost and time invested in collecting the firewood. In the reporting year, 140 biogas units were installed.
The project also supports the farming community through capacity-building activities such as livestock care and management and scientific agriculture practices. A total of 1,393 women and 1,473 male farmers were outreached under the sustainable agriculture initiative through trainings and awareness activities.
Under this project, Industrial Training Institute (ITI) and graduate students are being also provided career counselling and employability skills for better job opportunities in Chennai and Kochi. A total of 1,138 students were trained.
In addition to the above four core themes, the Company implemented various local initiatives within the radius of 25-30 kms of its manufacturing locations. Details of the initiatives are:
a) Watershed Management Projects The Company has initiated various projects to
deal with water crisis and quality issues around our manufacturing locations.
The project provides access to purified drinking water to 300 households (around 1,200 beneficiaries) in Orgadam village close to our manufacturing facility in Chennai. Another project undertakes eco restoration and improvement of water bodies such as ponds and development of surroundings area. A total 5 ponds were constructed in the reporting year. Today, around 5,000 people are directly benefitting from the ponds.
One more local initiative revolves around the conservation of riparian vegetation and associated biodiversity of Chalakudy River in Kerala. The project involves school students and the local community through awareness generation activities.
b) Computer Literacy A computer literacy project was launched in
around our Chennai plant. Till now we have set up computer labs in 5 schools.
c) Road Safety The road safety programme at Perambra
location focuses on two aspects – installing road safety signboards for road users on the 15 km stretch of the Chalakudi-Thrissur highway and engaging school students in awareness generation and sensitisation.
5. Philanthropic Initiatives The Company undertakes philanthropic initiatives
in India for the deprived and destitute communities.
These activities aim at providing support for the education of underprivileged girls and donations for health care needs to hospitals in the rural area and distribution of food items to eradicate hunger and poverty.
Initiatives in Europe In its endeavour to conserve and promote
biodiversity in the vicinity of the factory in Enschede, Apollo is working on the Stadsbeek project. The objective of this project is to address issues related to rainwater and groundwater and improve the living environment. It involves digging of a ‘stadsbeek’ or city creek, from Bruggertstraat to the Volkspark. The project will be implemented in several phases. A monitoring and evaluation mechanism has been set up to keep track of the project.
ECO-CONSCIOUS GROWTH
Environment-Conscious OperationsApollo Tyres considers the environment as a key stakeholder and ensures its utmost care at all times. This approach has been developed under the framework of ISO 14001 – Environment Management System. The Company also takes environment consciousness beyond the fence and has undertaken many environment initiatives as a part of the CSR efforts aimed at communities at large. These efforts have been detailed in the ‘Care for Community’ section.
The Company enhanced its manufacturing footprint with the commencement of operations of its Hungary facility in FY2018.
Raw Material Sourcing and ManagementThe three main constituents used for manufacturing tyres are natural rubber, synthetic rubber and carbon black and they account for 45.5% of the Company’s total raw material consumption for FY2018, as compared to 46.1% for FY2017. Natural rubber continues to be the dominant source of rubber in the operations. The APMEA operations reported that of the total rubber used, 73.7% was natural rubber. The share of natural rubber use in the Europe region stood at 48.1%.
Share of Raw Material Consumed, APMEA and Europe Operations in FY2018
APMEA
55.56
7.63
15.42
21.4
Natural Rubber Synthetic Rubber Carbon Black Other Raw Materials*
%
APOLLO TYRES CONSIDERS THE ENVIRONMENT AS A KEY STAKEHOLDER AND ENSURES ITS UTMOST CARE AT ALL TIMES.

55Apollo Tyres Ltd Annual Report 2017-18
Corporate Overview / Statutory Reports / Financial Statements
%Europe
94.01
1.124.87
Butyl Reclaim NR Reclaim Ultrafine Reclaim
Energy PerformanceApollo Tyres uses direct and indirect energy sources in its operations, with a mix of renewable and non-renewable fuel types.
For the India operations, the main source of direct energy was coal, followed by furnace oil. At the Netherlands plant, direct energy is sourced from natural gas.
Indirect energy sources in India operations comprise electricity, wind and solar energy. In Netherlands, electricity is the main source of indirect energy.
Total raw material consumed across all the operations: 848,471 metric tonne
Total recycled material: 6,234 metric tonne
In the APMEA operations, the total amount of raw materials consumed was 778,306 metric tonne and the total amount of recycled material was 5,433 metric tonne.
In Europe operations, the total amount of raw materials consumed was 70,165 metric tonne. The total amount of recycled materials was 801 metric tonne.
Break-Up of Recycled Raw Materials by Type, APMEA and Europe Operations in FY2018
%APMEA
49.00
6.22
44.78
Butyl Reclaim Ultrafine Reclaim 80 Mesh Crumb
Europe
41.97
17.00
19.75
21.27
Natural Rubber Synthetic Rubber Carbon Black Other Raw Materials*
%
*Other Raw Materials includes associated process materials. In APMEA, it also includes Steam used in Limda.
Rubber sheet making unit inauguration at Kottayam Kerala, India

56
%
Share of Direct and Indirect Energy Consumed, FY2018
68.86
31.14
Direct Energy Indirect Energy
The total energy consumption (both direct and indirect) for the reporting year was 5,093 TJ as compared to 4,007 TJ in FY2017. The share of direct energy was 68.9% (3,507 TJ) and that of indirect energy was 31.1% (1,586 TJ).
Non-renewable energy sources held the major share in the total energy consumption. Coal remained the leading source of direct energy at 2,786 TJ, accounting for 79.4% of direct energy consumption.
The share of renewable energy in the total mix stood at 6%. In the reporting year, the Limda and Chennai facilities contributed captive capacities for solar energy in the renewable sources portfolio.
Break-Up of Direct Energy by Source, FY2018
%Share of Direct Energy by Source
79.45
3.61
2.22
1.75 0.42
0.37
12.16
Coal Natural Gas Furnace Oil Wind RLNG HSD Solar
Break-Up of Indirect Energy by Source, FY2018
%Share of Indirect Energy by Source
64.99
13.39
21.62
Wind Power Thermal Power State Electricity Board
Energy Efficiency InitiativesThe Company has been continuously making efforts to achieve energy efficiency through improvements in its process design, conversion and retrofitting of equipment and use of energy-efficient equipment. Several initiatives undertaken during the reporting period resulted in energy savings of 36,715 GJ.
In the reporting period, the major savings were realised from conversions and retrofitting of equipment. The table below lists the amount of energy saved across operations:
Energy Saved in APMEA Operations from Different Levers (in GJ), FY2018
PlantsProcess
Design
Conversion and Retrofitting
Equipment
Use of Energy-Efficient
Equipment
Total Energy Saved
Limda 2,601 212 191 3,004Chennai 0 0 0 0Kalamassery 437 346 – 783Perambra 1,584 31,344 32,928Total Energy Saved 2017–18 4,622 31,902 191 36,715
APOLLO TYRES USES STATE-OF-THE-ART TECHNOLOGY TO ENSURE CLEAN OPERATIONS IN ITS MANUFACTURING OPERATIONS.
Emission ReductionApollo Tyres uses state-of-the-art technology to ensure clean operations in its manufacturing operations. The concentration of air emissions across all the plants was within the prescribed limits throughout the reporting period.
Green House Gas (GHG) EmissionsAt present, the Company operations mostly depend on non-renewable energy sources. With the addition of the manufacturing facility at Hungary, the footprint has increased. For the purpose of this report, emissions under Scope 1 and Scope 2 have been considered as defined by the GHG Protocol.
The Company has also attempted estimation of Scope 3 emissions from Business travel as a pilot in order to make the carbon footprint measurement comprehensive.
Carbon Emission Profile FY2018
FY2017 – 18GHG Emissions (t CO2eq) – Scope Breakup
5149
Scope 1 Scope 2
%
Water Sourcing and ManagementThe primary source of water at the operations is surface water, which accounted for 98% of total water consumption during FY2018. Other sources include ground water and municipal water.

57Apollo Tyres Ltd Annual Report 2017-18
Corporate Overview / Statutory Reports / Financial Statements
Total Annual Water (in m3), FY2018
Plant Perambra Kalamassery Limda Chennai Netherlands HungaryTotal Annual
Water Withdrawal
Annual water withdrawal 515,387 270,701 881,810 623,833 4,163,919 68,730 6,524,380
The APMEA operations carried out several initiatives to conserve water in the reporting year. Some of them are mentioned below:
> Improvement in ETP RO Recovery from 75% to 93%
> Condensate polishing for steam condensate
> Rerouting of dome condensate from curing back to coal-fired boiler
Water Recycle, APMEA Operations (in m3), FY2018
Perambra Kalamassery Limda Chennai Total APMEA
2,500,000
2,000,000
1,500,000
500,000
0
In the APMEA operations, the total annual water withdrawal was 2,291,731 m3, of which 598,816 m3 (26%) was recycled or reused.
At the organisation level, the total amount of recycled or reused water was 598,816 m3, accounting for 9.2% of total annual water withdrawal. This was higher than last year’s share of 8.6%.
Waste Reduction and ManagementWaste generated from our operations includes solid and liquid forms and both hazardous and non-hazardous in nature.
The total solid waste generated in the reporting period was 24,834 metric tonne.
In the APMEA operations, 649 metric tonne of hazardous and 18,371 metric tonne of non-hazardous solid wastes were generated. The hazardous liquid waste generated was 12,902 kilolitres.
A total of 284 metric tonne of hazardous and 5,530 metric tonne of non-hazardous solid wastes were generated in the reporting period in the Europe region.
Conservation of BiodiversityProtection and enhancement of biodiversity is important from the perspective of the entire value chain. During the
Break-Up of Total Water Usage in Terms of Recycled Water and Fresh Water Withdrawal, FY2018
90.8
9.2
Withdrawal Recycled
Solid waste – Haz/Non-Haz
96.2
3.8
Hazardous Non-Hazardous
Break-Up of Solid Wastes by Type Generated, FY2018
1,000,000
515,
387
270
,70
1
41,6
50
881,
810
351,
816
623,
833
120
,348
2,2
91,7
31
2,29
1,73
1
85,0
02
Withdrawal Water Recycled or Reused*
%
%

58
reporting period, as part of the environment programme HabitAt Apollo, several activities were carried out within the plants to enhance biodiversity. While some of these activities were directly aimed at biodiversity conservation, others had indirect benefits.
Formal risk and impact assessment studies to measure the impact on biodiversity in the manufacturing locations were conducted by third-party agencies. As an outcome of this study, biodiversity conservation projects were initiated at the Perambra and Kalamassery plants.
At Kalamassery, the activities included maintaining the existing theme gardens such as butterfly garden, snake repellent plant belt and fruit garden to enhance the biodiversity and increase the flora and fauna species. The Company also supports the Kalamassery municipality in main taining this green cover in an eco–friendly manner. As a part of the initiative, the Therikulam pond was restored, which was then awarded the best prize among the ponds in Ernakulam by the Ernakulam District Administration.
At Perambra, the initiatives included conservation and restoration of the pond ecosystem and developing theme gardens & converting them into a learning centre by placing information boards. Apiculture for collection of honey from rubber trees within the premises was also continued at Perambra during the reporting period.
INNOVATION
For the R&D function in Apollo Tyres, environmental sustainability efforts are among the primary responsibilities in the journey towards business excellence. Apollo continues to work to increase the use of recycled and renewable materials that partially reduce the use of fossil fuel based materials.
The Company is constantly striving to reduce the rolling resistance of the tyre by reducing its weight and optimising the compounding ingredients with performance materials using multi-objective optimisation techniques. New-generation steel wire cords with high tensile and low diameter wires and fabrics of different configuration were used to reduce the weight of the tyre with enhanced performance properties.
In its retreading research centre, the Company is developing an effective methodology using energy-efficient and environment-friendly techniques to increase the service life of the tyres.
One major reason for higher emissions due to tyre rolling is improper inflation pressure. This has led to Apollo mandating the usage of equipment such as Tyre Pressure Monitoring System (TPMS), which warns the driver about insufficient tyre pressure.
The Company is currently engaged in numerous new research projects in-house as well as in collaboration with external partners such as national research institutes, universities and raw material suppliers to create the much-needed technological edge in the areas of environmental sustainability. Some of the projects underway include:
> Silane-treated Kaolin clays being executed to lower the hysteresis or rolling losses of the tread compounds.
> A silicone rubber-based holder being developed for the TPMS sensors.
> A number of projects involving the Radio-Frequency Identification (RFID) technologies are currently under implementation. The supply chain management is one area where the RFID technologies play a major role in going digital. Another fascinating work is the task of permanently embedding an RFID tag into a tyre, which equips the tyre with a unique identifier and an anti-theft mechanism.
> The material research group has successfully completed several novel projects such as puncture-free two-wheeler tyres using a novel sealant technology, which is an also an innovative step towards retaining air pressure and fuel efficiency of two-wheelers, providing added safety to the riders.
> Work around creating TPMS sensors that monitor the tyre pressure and temperature.
Recycle Material Usage Apollo is dedicated to reuse ELT materials that would otherwise be burned or deposited in landfills.
Reuse of tyre recycled material: Powdered tyre crumb (in MT)
2011-12 2012-13 2013-14 2014-15 2015-16 2016-17 2017-18
Con
sum
ptio
n (M
T)
Financial year
3,000
2,000
1,000
0
2,697
3,253 3,2982,923
2,540 2,5512,269
Reuse of tyre recycled material: Reclaim (in MT)
Con
sum
ptio
n (M
T)
Financial year
3,500
2,376
3,1362,949
2,401
2,173
2,859
2,074
3,000
2,500
2,000
1,500
1,000
500
02011-12 2013-14 2014-15 2015-16 2016-17 2017-182012-13

59Apollo Tyres Ltd Annual Report 2017-18
Corporate Overview / Statutory Reports / Financial Statements
REACH & PAH regulation ComplianceThe REACH regulation of the EU came into force on June 1, 2007. REACH entrusts the industry with the responsibility of providing safety information for substances and properly managing the risks arising from their use. In order to comply with the regulation, we ensure REACH compliance of our downstream raw material supplies by scrutinising test reports on Substance of Very High Concern (SVHC) and PAH (Entry 50 of Annex XVII to REACH) compliance during the regular supplies. We further ensure that the test reports are refreshed on an annual basis based on the latest revisions of the substances. New vendors are approved based on their compliance to this regulation. In addition to this, samples of the tyres that are exported to the EU are periodically tested and certified by certifying agencies for ensuring their compliance.
Conflict Mineral Rule ComplianceAs per Section 1502 of the Dodd-Frank Act, Manufacturers and Issuers (who ‘contract to manufacture’) are required to disclose annually whether conflict minerals (gold, tin, tantalum and tungsten minerals mined in conditions of armed conflict and human rights abuses in the Democratic Republic of the Congo-DRC) used for the ‘functionality or production’ of a product are originated in the DRC or an adjoining country. In full support to this rule, we have enabled our supply chain system to trace the origin of the minerals supplied to our downstream suppliers, up to the smelter levels and mines. These updated declarations are submitted to our OEMs annually.
Support to GADSL ObjectivesThe Global Automotive Stakeholder Group (GASG) consists of automobile manufacturers, tier (1/ 2/ 3) suppliers and material suppliers having regular communication, which covers the declaration of certain information about substances relevant to parts and materials supplied by the supply chain to the automobile manufacturer. Apollo supports its OEMs by providing International Material Data System (IMDS) declarations that contain information about the materials and substances in the tyres supplied to them.
Women engaged in Kite making - Livelihood Project Vadodara, Gujarat, India

60
Employee Engagement in R&DCapability Building As part of building the capability of our R&D employees, various learning and development initiatives were rolled out. Some of them are:
> Knowledge Now, an initiative to share the knowledge of employees in R&D, a structured presentation about their learning to others. 12 Knowledge Now sessions during FY2018
> Meet the Maestro, a small event in the presence of eminent personalities/celebrities who are known for their commendable achievement in their chosen area so that the employees can share their experiences
> Back to Basics, an integrated orientation programme focusing on the Basics of Tyre Technology for new joiners
Annual Training and Development CalendarR&D launched the Learning Calendar in the month of October 2017. The major trainings were:
> Failure Modes and Effects Analysis (FMEA), Advanced Product Quality Planning (APQP), Production Part Approval Process (PPAP), statistical tools and Geometric Dimensioning and Tolerancing (GD&T)
> Effective presentation skills for specialists, facilitated by the Chief Human Resources Officer (CHRO)
> Time management, financial planning and high-impact interpersonal skills
In addition, few other workshops were organised such as I am an Apolloite – Workshop on Apollo Values, Six-day workshop for DGQA (Directorate General of
Quality Assurance, Ministry of Defence, Government of India) officers on the basics of tyre manufacturing and Technology Leadership Development Programme – Module 3 Process Technology and Manufacturing
As a part of propagating the Apollo One Family Concept, various engagement initiatives were rolled out in R&D Asia:
> R&D Parivaar – Family visit to R&D, with an objective of facilitating the visit of our employees’ families to our R&D facility.
> Family Day 2018, celebrated on February 25, 2018 at Mahabalipuram. The programme was well attended by 300 + employees.
> The Boss Day Out – Employee Get together Programme. This programme is to foster the culture of informal workplace and to enhance the ‘Zing Spirit’ among our employees.
> Well Done Cards (small exclusively designed cards) to recognise individuals instantly for the work done. This initiative motivates the employees, inculcates a culture of recognition and encourages each employee to excel.
WAY FORWARD
Sustainability is at the core of functioning at Apollo Tyres and continues to guide the organisation towards adopting best practices and enhancing stakeholder value. Our Sustainability Management Framework helps us in this endeavour. The Framework shall lead to standardisation of approach and uniformity in practices. We also aim to calibrate our efforts against global guidelines and standards to become a truly sustainable organisation. We have been investing resources to achieve this goal and fulfil our aspiration of matching the global best in our quest to be a process-driven and socially responsible Corporation.
Street Play for Health Programme, Sanjay Gandhi Transport Hub, New Delhi
Health camp at Apollo Fleet, Jamalpur, Haryana

Corporate Overview / Statutory Reports / Financial Statements
Statutory Reports
62 Board’s Report
71 Annual Report on CSR
78 Business Responsibility Report
101 Corporate Governance Report
Financial Statements
123 Standalone Financial Statements
177 Consolidated Financial Statements
Apollo Tyres Hungary Plant

Board’s Report
Dear Member,
On behalf of the Board of Directors of your Company, we share with you the Annual Report along with the audited financial statements of your Company for the financial year ended March 31, 2018.
FINANCIAL PERFORMANCE
The financial performance of the Company for the financial year ended March 31, 2018 is summarised below: (` in Million)
Particulars
Year ended Year ended
March 31, 2018 March 31, 2017 March 31, 2018 March 31, 2017
Standalone Consolidated
Net Sales 101,332 88,167 146,741 130,630Other Income 2,883 2,524 2,830 2,689Operating Profit (EBIDTA) 13,692 14,626 17,678 20,005Less: Depreciation/Amortisation Exp. 3,644 2,882 5,926 4,618
Finance Cost 1,375 888 1,629 1,029 Provision for Tax 2,449 2,829 2,884 3,365
Net Profit before Exceptional Items 6,224 8,027 7,239 10,993Add: Exceptional Items - - - -Less: Share of Profit/(Loss) in Associate/Joint Venture - - - (3)Net Profit 6,224 8,027 7,239 10,990
OPERATIONS
With the bullishness in the Indian economy and the Indian auto industry, the tyre industry also was on a northward march. Internal estimates indicate that the growth has been led by the OE sales more than sales in the replacement market. A 19% growth in the commercial vehicle segment saw the tyre industry following a similar growth graph and continues to account for the highest value within the industry. Good monsoons saw a strong demand for all tractor tyres (front, rear and trailer) which posted good growth numbers.
Europe saw a stable performance of the tyre industry with the exception of the agricultural tyre sales, which performed badly for the fourth year in a row. The OE component of the passenger car segment grew marginally by 1% to close the year with 86.7 million units.
On a standalone basis, your Company achieved a net turnover of ` 101,332 million as against ` 88,167 million during the previous financial year. EBIDTA was at ` 13,692 million as compared to ` 14,626 million during the previous financial year. The Net Profit for the year under review was ̀ 6,224 million, as against ̀ 8,027 million in the previous fiscal.
The consolidated net turnover of your Company was ̀ 146,741 million during FY2018, as compared to ` 130,630 million in FY2017. The consolidated EBIDTA was ` 17,678 million for FY2018 as compared to ` 20,005 million for the previous financial year. On consolidated basis, Apollo Tyres earned a Net Profit of ` 7,239 million for FY2018 as against ` 10,990 million for the previous financial year.
RAW MATERIALS
The year under review saw the raw material cost increase by ~ 10% over the last fiscal. The major contribution in this cost push was from Carbon Black, Synthetic Rubber, Nylon Fabric, Chemicals and Natural Rubber.
The recovery in the automobile industry and the resultant strong OE demand post GST put a lot of pressure on the raw material supply chain in the second half of the year with tightness noticed in Carbon Black, Chemicals and Beadwire. The demand supply gap in Natural Rubber continued during the course of the year.
Oil prices during the year continued to climb upwards. The brent oil prices crossed the psychological mark of USD 70 per barrel in the month of January 2018. Increased compliance by OPEC members to agreed production cuts supported by other large oil exporters has kept the oil prices high during the financial year. The present OPEC production cuts are likely to extend till the end of 2018. The oil prices have now found a new normal in the band of USD 60 – 65 /bbl as against USD 50 – 55 /bbl in the last year.
The three major Natural Rubber (NR) producing countries of Thailand, Indonesia and Malaysia have been moderating exports of NR under the Agreed Export Tonnage Scheme (AETS) to shore up prices. During the year, AETS 4 and AETS 5 were introduced to curtail exports by 615,000 MT and 350,000 MT respectively.
Natural Rubber in India continued to attract 25% Customs Duty. The port restrictions on NR and also the pre import condition on NR imports under advance licences continued during the year. India’s requirement of NR for radial application continues to grow rapidly with the increase in the production of truck and bus radial tyres. This increased requirement for radial application has to be met through imports. The duty on import of Nylon Fabric was raised from 10% to 20% in the month of October 2017.
There was severe tightness in the availability of Carbon Black in India. The capacity creation in the Carbon Black industry has lagged behind the investments made in the Tyre Industry leading to serious supply constraints. The situation became acute in Q4 with the closure of a Carbon Black unit in North India owing to environmental reasons. The Company had to import Carbon Black to continue its manufacturing operations inspite of antidumping duty on import of Carbon Black from China which is the largest producer of Carbon Black in the world.
The conventional grades of Synthetic Rubber – Styrene Butadiene Rubber (SBR) are now produced in India leading to import substitution. However, antidumping duty has been imposed on imports of SBR from Korea, Thailand and Europe in August 2017. The Solution SBRs used in the manufacture of tyres with low rolling resistance are not produced in India and have to be imported from Europe and South East Asia.
62

Apollo Tyres Ltd Annual Report 2017-18
Rubber chemicals availability has been impacted due to shutdown of chemical industries in China which has the largest chemical footprint globally. The antidumping duty continues on imports of major Raw Materials – Carbon Black from China and Russia, Nylon Fabric from China, Rubber Chemicals from China, EU and Korea.
DIVIDEND
Your Company has a consistent track record of dividend payment. The Directors are pleased to recommend a dividend of `3/- (300%) per share of ` 1/- each on Equity Share Capital of the Company for FY2018 for your approval. There will be no tax deduction at source on dividend payments, but certain specified shareholders (resident in India) receiving a dividend income exceeding ` 1 million, would become liable to pay additional tax @ 10% (plus applicable surcharge and cess). Your Company would continue to bear tax on dividend @ 20.56 %, inclusive of surcharge and cess.
The dividend, if approved, shall be payable to the members holding shares as on record date/cut-off date, i.e. July 19, 2018.
RESERVES
The amount available for appropriations, including surplus from previous year amounted to ` 37,367 million. Surplus of ` 33,888 million has been carried forward to the balance sheet. A debenture redemption reserve of ` 160 million and general reserve of ` 1000 million has been provided.
BOARD OF DIRECTORS
A) Appointment/Re-appointment of Director Mr. Onkar S. Kanwar (DIN: 00058921), Managing Director was
re-appointed for a period of 5 years w.e.f. February 1, 2018 at the AGM held on July 5, 2017.
Pursuant to Section 161 of the Companies Act, 2013, Ms. Anjali Bansal (DIN:00207746) was appointed as an Additional Director (Independent) of the Company w.e.f. November 1, 2017, to hold office till the date of the ensuing Annual General Meeting (AGM). The Company has received requisite notice, as provided under Section 160 of the Companies Act, 2013, from a member, proposing the appointment of Ms. Anjali Bansal, as an Independent Director not liable to retire by rotation.
Dr. M. Beena (DIN: 03483417), IAS, was nominated by Government of Kerala as a Director on the Board of the Company in place of Mr. Paul Antony (DIN:02239492) w.e.f. January 30, 2018.
Pursuant to the provisions of Section 152 (6) of the Companies Act, 2013, Mr. Sunam Sarkar, (DIN:00058859), Director of the Company, is liable to retire by rotation and being eligible, offers himself for re-appointment. Mr. Sunam Sarkar is not disqualified under Section 164(2) of the Companies Act, 2013.
B Changes in Directors and Key Managerial Personnel During the year under review, except the appointment of Ms.
Anjali Bansal as an Additional Director (Independent) w.e.f. November 1, 2017 and nomination of Dr. M. Beena, IAS, in place of Mr. Paul Antony to the Board of the Company by Government of Kerala w.e.f. January 30, 2018, there were no changes in Directors and Key Managerial Personnel of the Company.
C) Declaration by Independent Directors In terms with Section 149 (7) of the Companies Act, 2013,
every Independent Director of the Company has submitted a declaration that they meet the criteria of Independence.
D) Formal Annual Evaluation Pursuant to the provisions of the Companies Act, 2013, the
Board is required to carry out annual evaluation of its own performance and that of its Committees and individual Directors. The Nomination and Remuneration Committee of the Board also carries out evaluation of every Director’s performance. Accordingly, your Company has carried out the performance evaluation during the year under review.
For annual performance evaluation of the Board as a whole, it’s Committee(s) and individual Directors including the Chairman of the Board, the Company has formulated a questionnaire to assist in evaluation of the performance. Every Director has to fill the questionnaire related to the performance of the Board, its Committees and individual Directors except himself by rating the performance on each question on the scale of 1 to 5, 1 being Unacceptable and 5 being Exceptionally Good.
On the basis of the response to the questionnaire, a matrix reflecting the ratings was formulated and placed before the Board for formal annual evaluation by the Board of its own performance and that of its Committees and individual Directors. The Board was satisfied with the evaluation results.
E) Separate Meeting of Independent Directors In terms of requirements under Schedule IV of the Companies
Act 2013 and Regulation 25 (3) of SEBI (Listing Obligations and Disclosure Requirements) Regulations, 2015, a separate meeting of the Independent Directors was held on January 9, 2018.
The Independent Directors at the meeting, inter alia, reviewed the following:-
> Performance of Non- Independent Directors and Board as a whole.
> Performance of the Chairperson of the Company, taking into account the views of Executive Directors and Non-Executive Directors.
> Assessed the quality, quantity and timeliness of flow of information between the Company Management and the Board that is necessary for the Board to effectively and reasonably perform their duties.
F) Remuneration Policy The Board has, on the recommendation of the Nomination
& Remuneration Committee, laid down a Nomination & Remuneration Policy for selection and appointment of the Directors, Key Managerial Personnel and Senior Management and their remuneration. The extract of the Nomination and Remuneration Policy provided in the Corporate Governance Report forms part of Board’s Report.
PRODUCT & MARKETING
FY2018 for the APMEA region began with a clarion call for the Indian market to cross the ` 10,000 crore milestone. The entire financial year saw the India team relentlessly focusing on this goal by launching new products across segments, strengthening the dealer network, increasing investments in branding, winning new OE customers and creating unique and innovative initiatives for dealers and customers and in the process ended the year with increased market share in various categories.
Cutting edge R&D, highly efficient factory processes, high product quality, wide product portfolio and good marketing activation
63
Corporate Overview / Statutory Reports / Financial Statements

ensured growth for the Commercial vehicle tyres in both its segment – replacement and OE business. The year saw multiple product launches in the passenger car segment including Altrust in the general car segment, Apterra HT2 for the SUV segment and Aspire 4G tyre for the luxury segment. Along with the Company’s bestseller range like Alnac 4G, it helped the Company to post a good growth rate in the passenger car segment. A strengthened product range including products for specific applications like the VIRAT 23 for hard soil application, a targeted distribution network and new customer acquisition saw the OHT business segment growing significantly.
The year was a significant milestone for the Company in its brand building journey. The Company deepened its association with football and this helped it to cover the fan base across the country. It associated with I-league team Minerva Punjab FC as the title sponsor and for Indian Super League (ISL) team Chennaiyin FC as its principal sponsor. Both the teams emerged as winners in their respective leagues and helped connect Apollo Tyres to the football loving fans across the country. The Company also partnered with Indian Super League and brought in the world’s best freestyle football artists to popularise the sport and engage with the enthusiastic fans. This helped the Company garner high amount of paid and earned media. Given the importance of digital media, the Company focussed on this media for all its campaigns including the #ApolloXISL, #iloveunited, #monsoondrift.
Beyond India, the Thailand market saw high growth in the overall OHT segment including the Agriculture segment. With a strategy of introducing products catering to specific markets and for specific applications, the Company has started witnessing traction in countries like Malaysia, Vietnam and Myanmar among other countries. Despite availability of low cost Chinese tyres in these countries, the Company saw healthy double digit growth from the region. The Company expanded its two-wheeler business beyond India with the launch of the tyres in Bangladesh and Sri Lanka.
With the Hungary manufacturing plant going live in the beginning of the financial year, the year saw continuous efforts by the Company to ramp up and stabilize operations and overcome the initial teething challenges. The key businesses for the region – PCR and agricultural – saw decent growth with agricultural segment sales was up by 6.6% in an overall declining market. The Company is currently seeding its TBR products in various European markets to understand the market needs, even as R&D continues to improve the products for the market.
EXPANSION PROGRAMME AND FUTURE OUTLOOK
Even as the Company continues to seed other markets, India will continue to be the dominant market. With its leadership position in TBR, the Company will continue to focus on achieving terminal capacity utilization of its Chennai plant with completion of large truck and bus radial tyres investment and also sweat its other plant assets. For the high volume two-wheeler segment, the Company plans to introduce radial tyre through a pilot capacity.
Our new production plant in Gyöngyöshalász (Hungary) was opened in April 2017. The new plant ramped up capacity and production through the year and should target to reach planned full capacity production by end of next fiscal year. The commercial production of truck and bus radial tyres will start by summer of 2018.
In our plant in Enschede (the Netherlands) we continued to invest in modernization.
MATERIAL CHANGES AND COMMITMENTS
No material changes and commitments affecting the financial position of your Company have occurred between the end of the
financial year of the Company to which the financial statements relate and on the date of this report.
SIGNIFICANT MATERIAL ORDERS PASSED BY REGULATORS
No significant material orders have been passed during the year under review by the regulators or courts or tribunals impacting the going concern status and Company’s operations in future.
CHANGE IN THE NATURE OF BUSINESS, IF ANY
There is no change in the nature of business of your Company during the year under review.
INTERNAL FINANCIAL CONTROLS
The Company has identified and documented key internal financial controls as part of standard operating procedures (SOPs). The SOPs are designed for critical processes across all plants, warehouses and offices wherein financial transactions are undertaken. The SOPs cover the standard processes, risks, key controls and each process is identified to a process owner. In addition, the Company has a well defined Financial Delegation of Authority (FDOA), which ensures approval of financial transaction by appropriate personnel.
The Company uses SAP-ERP to process financial transactions and maintain its books of accounts. The SAP has been setup to ensure adequacy of financial transactions and integrity & reliability of financial reporting. SAP was implemented in the European operations in year 2016. SAP was also implemented at Company’s Greenfield plant in Hungary.
The financial controls are evaluated for operating effectiveness through management’s ongoing monitoring and review process, and independently by Internal Audit. The testing of controls by Internal Audit are divided into three separate categories; a) automated controls within SAP, b) segregation of duties within SAP and restricted access to key transactions, c) manual process controls.
In our view, the Company has in place adequate internal financial controls with reference to its financial statements and such internal financial controls are operating effectively.
MANAGEMENT DISCUSSION AND ANALYSIS REPORT
As required by Regulation 34 (2) of the SEBI (Listing Obligations and Disclosure Requirements) Regulations, 2015, a detailed Management Discussion and Analysis Report is presented in a separate section forming part of the Annual Report.
MANUFACTURING FACILITY AT ANDHRA PRADESH
Your Company intends to set up a state-of-the-art facility in Industrial Park, Chinnapanduru, Chittoor District, Andhra Pradesh for manufacturing of tyres. The Company had executed an Agreement for sale of land with Andhra Pradesh Industrial Infrastructure Corporation Ltd on March 13, 2018 and got the possession of the land admeasuring 200 acres.
The foundation stone for Company’s manufacturing unit at Andhra Pradesh was laid by the Honourable Chief Minister of Andhra Pradesh Mr. N. Chandrababu Naidu on January 9, 2018. This will be the India’s 5th and globally 7th manufacturing unit for the Company.
The planned capacity in the first phase based on the current demand & existing capacity situation is 5.5 million tyres per annum of Passenger Car Tyres and 1 million tyres per annum of Truck & Bus Radial tyres. The first tyre roll out is expected to happen within 2 years from the start of construction.
64

Apollo Tyres Ltd Annual Report 2017-18
QUALIFIED INSTITUTIONS PLACEMENT (QIP)
Your Company, on October 10, 2017, had issued and allotted 63,025,210 Equity Shares to eligible qualified institutional buyers at the issue price of `238/- per share (including premium of `237/- per share) aggregating to `15,000 million, through private placement under QIP. Pursuant to the allotment, the paid up equity share capital of the Company stands increased from ` 509,024,770 to ` 572,049,980 comprising of 572,049,980 Equity Shares of ̀ 1/- each.
The aforesaid shares have been listed for trading on the Stock Exchanges (NSE & BSE) w.e.f. October 12, 2017.
SUBSIDIARY/ ASSOCIATE & JOINT VENTURE COMPANIES
As the Company follows its vision to become a global tyre brand of choice, it created multiple subsidiaries/ associates for facilitating these operations in various countries. As on March 31, 2018, your Company had 43 subsidiaries including step subsidiaries, 2 associates and 1 joint venture.
Apollo Tyres Holdings (Singapore) Pte. Ltd. had incorporated ATL Singapore Pte. Ltd. as its wholly owned subsidiary on May 11, 2017 in Singapore.
Apollo Tyres (Cyprus) Pvt Ltd, wholly owned subsidiary of the Company is under winding up.
Apollo Vredestein Italia Srl, a step subsidiary of the Company is under winding up.
Your Company had decided to make an investment upto `9 crores in KT Telematic Solutions Private Ltd. (“KTT”), a Company operating in Automotive and Information Technology Sector, by way of subscription of equity shares in one or more tranches within a time span of one year on achievement of certain milestones. The Company had invested ̀ 2.25 crores in KTT on February 21, 2018. By virtue of control in certain business decisions under an agreement, KTT had become an Associate of the Company w.e.f. February 21, 2018.
As per the provisions of Section 129 of the Companies Act, 2013, the consolidated financial statements of the Company, its subsidiaries and associates are attached in the Annual Report. A statement containing brief financial details of all the subsidiaries and associates of the Company for the year ended March 31, 2018, forms part of the Annual Report. The annual accounts of subsidiaries and associates will be made available to shareholders on request and will also be kept for inspection by any shareholder at the Registered Office and Corporate Office of your Company. A statement in Form AOC-1 containing the salient features of the financial statements of the Company’s subsidiaries, associates and joint venture is also attached with financial statements.
DEBENTURES
The following series of Secured Redeemable Non-Convertible Debentures (NCDs) were issued and allotted during the year under review through Private Placement:-
SL.No Series of NCDsNo. of NCDs @ Face Value of
` 10,00,000 eachValue (` in Million) Date of Allotment
1 7.80 % Series A, B & C 4,500 4,500 May 31, 2017
The aforesaid NCDs are listed on the debt segment of the National Stock Exchange of India Limited (NSE).
DEPOSITS
During the year under review, your Company did not accept deposits covered under Chapter V of the Companies Act, 2013.
AUDITORS
M/s. Walker Chandiok & Co LLP, Chartered Accountants, Firm Registration No. 001076N/N500013 (the firm licenses audit software as well as audit methodology from Grant Thornton International Ltd), had been appointed as Statutory Auditors of your Company for a period of 5 years from FY2018 to FY2022 at the Annual General Meeting held on July 5, 2017.
AUDITORS’ REPORT
The report given by M/s. Walker Chandiok & Co LLP, Chartered Accountants, Statutory Auditors on financial statements of the Company for FY2018 is part of the Annual Report. The comments on statement of accounts referred to in the report of the Auditors are self explanatory. The Auditors’ Report does not contain any qualification, reservation or adverse remark.
During the year under review, the Auditors had not reported any matter under Section 143(12) of the Companies Act, 2013 therefore no detail is required to be disclosed under Section 134(3)(ca) of the Companies Act, 2013.
COST AUDIT
M/s. N.P. Gopalakrishnan & Co., Cost Accountants, were appointed with the approval of the Board to carry out the cost audit in respect of the Company’s facilities at Perambra, Vadodara and Chennai as well as Company’s lease operated plant at Kalamassery for FY2018.
Based on the recommendation of the Audit Committee, M/s. N.P. Gopalakrishnan & Co., Cost Accountants, being eligible, have also been appointed by the Board as the Cost Auditor for FY2019 subject to members’ approval. The Company has received a letter from them to the effect that their re-appointment would be within the limits prescribed under Section 141(3)(g) of the Companies Act, 2013 and that they are not disqualified for such re-appointment within the meaning of Section 141 of the Companies Act, 2013.
SECRETARIAL AUDITOR
Pursuant to the provisions of Section 204 of the Companies Act, 2013 and the Companies (Appointment and Remuneration of Managerial Personnel) Rules, 2014, your Company has re-appointed M/s. PI & Associates, Company Secretaries as Secretarial Auditor of the Company for FY2018 to undertake Secretarial Audit of the Company.
The Secretarial Audit Report does not contain any qualification, reservation or adverse remark. Secretarial Audit Report given by Secretarial Auditors is annexed with the report as Annexure I.
65
Corporate Overview / Statutory Reports / Financial Statements

MEETINGS OF THE BOARD OF DIRECTORS
A calendar of meetings is prepared and circulated in advance to the Directors. During the year, six Board meetings were convened and held. The intervening gap between the meetings was within the period prescribed under the Companies Act, 2013 and SEBI (Listing Obligations and Disclosure Requirements) Regulations, 2015. The details of all Board/ Committee meetings held are given in the Corporate Governance Report.
AUDIT COMMITTEE
The details of the Audit Committee including its composition and terms of reference mentioned in the Corporate Governance Report forms part of Board’s Report.
The Board, during the year under review, had accepted all recommendations made to it by the Audit Committee.
VIGIL MECHANISM/WHISTLE BLOWER POLICY
The Company has formulated a vigil mechanism through Whistle Blower Policy to deal with instances of unethical behaviour, actual or suspected, fraud or violation of Company’s code of conduct or ethics policy. The details of the policy are explained in the Corporate Governance Report and also posted on the website of the Company.
COMMITTEES OF BOARD
Pursuant to requirement under Companies Act, 2013 and SEBI (Listing Obligations and Disclosure Requirements) Regulations, 2015, the Board of Directors has constituted various Committees of Board such as Audit Committee, Nomination & Remuneration Committee, Stakeholders Relationship Committee, Business Responsibility Committee and Corporate Social Responsibility Committee. The details of composition and terms of reference of these Committees are mentioned in the Corporate Governance Report.
SHARE CAPITAL
During the year under review, the Company has issued and allotted 63,025,210 Equity Shares on October 10, 2017 by way of qualified institutions placement and post issue, the Issued, Subscribed and Paid-up Share Capital increased from 509,024,770 to 572,049,980 equity shares. As on March 31, 2018, the Issued, Subscribed and Paid-up Share Capital of the Company was 572,049,980 equity shares of ` 1/- each.
a) Issue of equity shares with differential rights Your Company has not issued any equity shares with differential
rights during the year under review.
b) Issue of sweat equity shares Your Company has not issued any sweat equity shares during
the year under review.
c) Issue of employee stock options Your Company has not issued any employee stock options
during the year under review.
d) Provision of money by Company for purchase of its own shares by employees or by trustees for the benefit of employees
Your Company has not made any provision of money for purchase of its own shares by employees or by trustees for the benefit of employees during the year under review.
PARTICULARS OF LOANS, GUARANTEES OR INVESTMENTS UNDER SECTION 186
During the year under review, your Company has not given any loan or guarantee which is covered under the provisions of Section 186 of the Companies Act, 2013. However, details of investment made during the year, are given under notes to the financial statements.
RELATED PARTY TRANSACTIONS
All contracts/ arrangements/ transactions entered by the Company during the financial year with related parties were in the ordinary course of business and on an arm’s length basis and do not attract the provisions of Section 188 of the Companies Act, 2013. During the year, the Company had not entered into any contract/ arrangement/ transaction with related parties which could be considered material in accordance with the policy of the Company on materiality of related party transactions.
Suitable disclosure as required by the Indian Accounting Standards has been made in the notes to the financial statements. The policy on Related Party Transactions as approved by the Board is uploaded on the Company’s website.
MANAGERIAL REMUNERATION
a) The details required pursuant to Rule 5(1) of the Companies (Appointment and Remuneration of Managerial Personnel) Rules, 2014, are provided in the Corporate Governance Report.
b) During the year under review, Mr. Neeraj Kanwar (DIN: 00058951), Vice Chairman & Managing Director also received remuneration from Apollo Tyres (UK) Pvt. Ltd., wholly owned subsidiary of the Company.
PARTICULARS OF EMPLOYEES
Particulars of employees as required in terms of the provisions of Section 197 of the Companies Act, 2013, read with Rule 5(2) of the Companies (Appointment and Remuneration of Managerial Personnel) Rules, 2014, are set out in Annexure A to the Board’s Report.
PREVENTION OF SEXUAL HARASSMENT AT WORKPLACE
Your Company has in place a formal policy for prevention of sexual harassment of its employees at workplace.
During the year under review, there were no cases filed pursuant to the Sexual Harassment of Women at Workplace (Prevention, Prohibition and Redressal) Act, 2013.
66

Apollo Tyres Ltd Annual Report 2017-18
HEALTH, SAFETY & ENVIRONMENT
As a firm commitment to Health, Safety and Environment (HSE), the year saw multiple initiatives to implement and review the HSE plans and achieve the defined KPIs. For details on HSE, please refer to Management Discussion and Analysis Report.
AWARDS AND RECOGNITIONS
In its constant quest for growth and excellence, your Company was honoured and recognised at various forums. The prominent Awards are listed below for your reference.
Name of the Award Category Awarded byFlame Awards Asia 2017 Best Campaign Leveraging Technology
Experience & EngagementRural Marketing Association of India (RMAI)
SNEMA 2016 Energy Conservation Society of Energy Engineers and Managers(SEEM)Campaign India Digital Crest Awards 2017
Best use of Search marketing - Consumer promotion in the PCR segment
Campaign India
QCFI 2017 Quality Quality Circle Forum of IndiaICQCC 2017 Quality Quality & Productivity Association of The Philippines (QPAP)Compliance Team 2017 Annual Compliance Awards Compliance 10/10 award organised by Legasis ServicesABCI Award 2017 Annual Report Association of Business Communicators of India (ABCI)Golden Peacock Award Risk Management India’s Corporate Institute of Directors (IOD)
RISK MANAGEMENT
The Company has a well laid out Risk Management Policy, covering the process of identifying, assessing, mitigating, reporting and reviewing critical risks impacting the achievement of Company’s objectives.
The Risk Management Steering Committees have been formed for APMEA and Europe regions which are headed by President (APMEA) and President (Europe) as Chairman of the respective Committees and represented by the functional heads as Chief Risk Officers. The Committees review each risk on a quarterly basis and evaluate its impact and plans of mitigation. Few cross functioning teams have been formed to share the common risks between dependent functions to avoid overlap of risks. The risks duly aligned with the organisation objectives, documented in form of risk register are placed before Audit Committee. The Audit Committee of the Company reviews the risks of APMEA and Europe regions and provides its directions to the management, if any. The Audit Committee updates the Board on the key risks placed before it.
CORPORATE SOCIAL RESPONSIBILITY
Your Company has been taking initiatives under Corporate Social Responsibility (CSR) for society at large, well before it has been prescribed through the Companies Act 2013. The Company has a well defined Policy on CSR as per the requirement of Section 135 of the Companies Act, 2013 which covers the activities as prescribed under Schedule VII of the Companies Act 2013. The Company has an in-house department which is exclusively working towards that Objective. The Company is carrying out its CSR Activities through Registered Trusts, created by the Company, for this purpose and the Trust is monitored by CSR Committee.
During the year under review, the Company has carried out activities primarily related to promoting preventive healthcare, ensuring environmental sustainability, livelihood enhancement projects, rural development projects, promoting education and eradication of hunger and poverty.
Corporate Social Responsibility Report, pursuant to clause (o) of sub-section (3) of Section 134 of the Act and Rule 9 of the Companies (Corporate Social Responsibility) Rules, 2014 forms part of this Report as Annexure II.
BUSINESS RESPONSIBILITY REPORT
SEBI (Listing Obligations and Disclosure Requirements) Regulations, 2015 mandates the top 500 Listed Companies by market capitalisation to include Business Responsibility Report (“BR Report”) in their Annual Report.
Your Company falls under the top 500 Listed Companies by market capitalisation. Accordingly, a BR Report describing the initiatives taken by the Company from an environmental, social and governance perspective, forms part of this Report as Annexure III.
CONSERVATION OF ENERGY, TECHNOLOGY ABSORPTION, FOREIGN EXCHANGE EARNINGS AND OUTGO
Particulars required under Section 134(3)(m) of the Companies Act, 2013 read with Rule 8 of the Companies (Accounts) Rules, 2014, regarding conservation of energy, technology absorption and foreign exchange earnings and outgo, are given in Annexure IV, forming part of this report.
EXTRACT OF THE ANNUAL RETURN
The extract of the annual return in Form MGT– 9 is enclosed herewith as Annexure V, forming part of this report.
CORPORATE GOVERNANCE REPORT
Your Company always places major thrust on managing its affairs with diligence, transparency, responsibility and accountability thereby upholding the important dictum that an organisation’s corporate governance philosophy is directly linked to high performance.
The Company is committed to adopting and adhering to established world-class corporate governance practices. The Company understands and respects its fiduciary role and responsibility towards its stakeholders and society at large, and strives to serve their interests, resulting in creation of value and wealth for all stakeholders.
The compliance report on corporate governance and a certificate from M/s. Walker Chandiok & Co LLP , Chartered Accountants, Statutory Auditors of the Company, regarding compliance of the conditions of corporate governance, as stipulated under Chapter IV of SEBI
67
Corporate Overview / Statutory Reports / Financial Statements

(Listing Obligations and Disclosure Requirements) Regulations, 2015 is attached herewith as Annexure VI to this report.
DIRECTORS’ RESPONSIBILITY STATEMENT
As required by Section 134(3)(c) of the Companies Act, 2013, your Directors state that:
(a) in the preparation of the annual accounts for the financial year ended March 31, 2018, the applicable accounting standards had been followed along with proper explanation relating to material departures;
(b) the Directors had selected such accounting policies and applied them consistently and made judgments and estimates that are reasonable and prudent so as to give a true and fair view of the state of affairs of the Company at the end of the financial year and of the profit and loss of the Company for that period;
(c) the Directors had taken proper and sufficient care for the maintenance of adequate accounting records in accordance with the provisions of this Act for safeguarding the assets of the Company and for preventing and detecting fraud and other irregularities;
(d) the Directors had prepared the annual accounts on a going concern basis;
(e) the Directors had laid down internal financial controls to be followed by the Company and that such internal financial controls are adequate and were operating effectively; and
(f) the Directors had devised proper systems to ensure compliance with the provisions of all applicable laws and that such systems were adequate and operating effectively.
SECRETARIAL STANDARDS
During the year under review, your Company had complied with all the applicable Secretarial Standards.
ACKNOWLEDGEMENT
Your Company’s organisational culture upholds professionalism, integrity and continuous improvement across all functions, as well as efficient utilisation of the Company’s resources for sustainable and profitable growth.
Your Directors wish to place on record their appreciation to the respective State Governments of Kerala, Gujarat, Haryana, Tamil Nadu and Andhra Pradesh and the National Governments of India, Netherlands and Hungary. We also thank our customers, business partners, members, bankers and other stakeholders for their continued support during the year. We place on record our appreciation for the contribution made by all employees towards the growth of your Company.
For and on behalf of Board of Directors
Place: Gurgaon ONKAR S. KANWARDate: May 10, 2018 Chairman & Managing Director
68

Apollo Tyres Ltd Annual Report 2017-18
ANNEXURE I
FORM NO. MR - 3SECRETARIAL AUDIT REPORT
For the Financial year ended March 31, 2018[Pursuant to section 204(1) of the Companies Act, 2013 and rule No.9 of the Companies
(Appointment and Remuneration Personnel) Rules, 2014]
To, The Members, Apollo Tyres Limited. (L25111KL1972PLC002449)
We have conducted the Secretarial Audit of the compliance of applicable statutory provisions and the adherence to good corporate practices by Apollo Tyres Limited (hereinafter referred to as “the Company”). Secretarial Audit was conducted in a manner that provided us a reasonable basis for evaluating the corporate conducts/statutory compliances and expressing our opinion thereon.
Based on our verification of the Company, books, papers, minute books, forms and returns filed and other records maintained by the Company and also the information provided by the Company, its officers, agents and authorized representatives during the conduct of secretarial audit, We hereby report that in our opinion, the Company has, during the audit period covering the financial year ended on March 31, 2018, complied with the statutory provisions listed hereunder and also that the Company has proper Board-processes and compliance-mechanism in place to the extent based on the management representation letter/ confirmation, in the manner and subject to the reporting made hereinafter.
We have examined the books, papers, minute books, forms and returns filed and other records maintained by the Company for the financial year ended on March 31, 2018, according to the provisions of:
(i) The Companies Act, 2013 (‘the Act’) and the rules made thereunder;
(ii) The Securities Contracts (Regulation) Act, 1956 (‘SCRA’) and the rules made thereunder;
(iii) The Depositories Act, 1996 and the Regulations and Bye-laws framed thereunder;
(iv) Foreign Exchange Management Act, 1999 and the rules and regulations made thereunder to the extent of Foreign Direct Investment, Overseas Direct Investment and External Commercial Borrowings;
(v) The following Regulations and Guidelines prescribed under the Securities and Exchange Board of India Act, 1992 (‘SEBI Act’):-
a. The Securities and Exchange Board of India (Substantial Acquisition of Shares and Takeovers) Regulations, 2011;
b. The Securities and Exchange Board of India (Listing Obligations and Disclosure Requirements) Regulations, 2015,
c. The Securities and Exchange Board of India (Prohibition of Insider Trading) Regulations, 2015;
d. The Securities and Exchange Board of India (Issue of Capital and Disclosure Requirements) Regulations, 2009;
e. The Securities and Exchange Board of India (Employee Stock Option Scheme and Employee Stock Purchase Scheme) Guidelines, 1999 (not applicable during the period of audit);
f. The Securities and Exchange Board of India (Issue and Listing of Debt Securities) Regulations, 2008;
g. The Securities and Exchange Board of India (Registrars to an Issue and Share Transfer Agents) Regulations, 1993 regarding the Companies Act and dealing with client;
h. The Securities and Exchange Board of India (Delisting of Equity Shares) Regulations, 2009 (not applicable during the period of audit); and
i. The Securities and Exchange Board of India (Buyback of Securities) Regulations, 1998 (not applicable during the period of audit);
(vi) We further report that as per Management, following laws are specifically applicable on the Company. In respect of the compliance of the said laws, we have relied on the representation made by the Company and its officers for system and mechanism framed by the Company for necessary compliances under the said laws:
(a) Pneumatic Tyres and Tubes for Automotive Vehicles (Quality Control), Order, 2009;
(b) Bureau of India Standards Act, 1986 and the Rules made thereunder as applicable to Tyre Industry and;
(c) The Industrial (Development and Regulation) Act, 1951
We have also examined compliance with the applicable clauses of the following:
(i) Secretarial Standards issued by The Institute of Company Secretaries of India;
(ii) The Listing Agreements entered into by the Company with the Stock Exchange(s) and The Securities Exchange Board of India (Listing Obligations & Disclosure Requirements) Regulations, 2015.
During the period under review, the Company has complied with the provisions of the Act, Rules, Regulations, Guidelines, Standards, etc. mentioned above.
We further report that: The Board of Directors of the Company is duly constituted with proper balance of Executive Directors, Non-Executive Directors and Independent Directors. The changes in the composition of the Board of Directors that took place during the period under review were carried out in compliance with the provisions of the Act.
69
Corporate Overview / Statutory Reports / Financial Statements

Adequate notice is given to all directors to schedule the Board Meetings, agenda and detailed notes on agenda were sent at least seven days in advance, and a system exists for seeking and obtaining further information and clarifications on the agenda items before the meeting and for meaningful participation at the meeting.
Majority decision is carried through while the dissenting members’ views are captured and recorded as part of the minutes.
We further report that there are adequate systems and processes in the Company commensurate with the size and operations of the Company to monitor and ensure compliance with applicable laws, rules, regulations and guidelines.
We further report that during the audit period, the Company has following event: -
> The Company has passed the Special Resolution in the Annual General Meeting held on July 05, 2017 for issuance of Non – Convertible Debentures of ̀ 15,000 Million on private placement basis to be allotted in one or more tranches.
> During the period under review, the Company has issued and allotted ` 4500 million Secured Non - Convertible Debentures through private placement.
> The Company has issued and allotted 63,025,210 Equity Shares of ` 1 each to Qualified Institutional Buyers on October 10, 2017 at an issue price of ` 238 per Equity Share (including a premium of ` 237 per Equity share), aggregating to approximately ` 15,000 million, Pursuant to the allotment of Equity shares in the Qualified Institutional Placement, the paid-up equity share capital of the Company stands increased to ` 572.05 million.
For PI & AssociatesCompany Secretaries
Ankit Singhi(Partner)
Date: May 8, 2018 ACS No.:A20642Place: New Delhi C P No.: 16274
Annexure A
To, The Members, Apollo Tyres Limited.
Our Secretarial Audit Report of even date is to be read along with this letter.
1. Maintenance of secretarial records is the responsibility of the management of the Company. Our Responsibility is to express an opinion on these secretarial records based on our audit.
2. We have followed the audit practices and processes as were appropriate to obtain reasonable assurance about the correctness of the contents of the secretarial records. The verification was done on test basis to ensure that correct facts are reflected in secretarial records. We believe that the processes and practices, we followed provide a reasonable basis for our opinion.
3. We have not verified the correctness and appropriateness of financial records and Books of Accounts of the Company.
4. Where ever required, we have obtained the Management representation about the compliance of laws, rules and regulation and happening of events etc.
5. The compliance of the provisions of corporate and other applicable laws, rules, regulations, standards are the responsibility of management. Our examination was limited to the verification of procedures on test basis.
6. The Secretarial Audit Report is neither an assurance as to future viability of the Company nor of the efficacy or effectiveness with which the management has conducted the affairs of the Company.
For PI & AssociatesCompany Secretaries
Ankit Singhi(Partner)
Date: May 8, 2018 ACS No.:A20642Place: New Delhi C P No.: 16274
This report is to be read with our letter of even date which is annexed as “Annexure A” and forms an integral part of this report.
70

Apollo Tyres Ltd Annual Report 2017-18
ANNUAL REPORT ON CORPORATE SOCIAL RESPONSIBILITY (CSR) ACTIVITIES FOR FY2018
ANNEXURE II
1. Outline of Company’s CSR Policy Apollo Tyres, being conscious of the triple bottom line coherence
(People, Planet and profit), it has developed a CSR framework identifying and prioritising its key stakeholders. This framework clearly revolves around the principle of three I’s i.e. to Involve, Influence and Impact its key stakeholders-Customers, Employees, Supply Chain Partners and Community. The clear objective of all CSR activities is to have a positive impact on everyday lives of our key stakeholders and on business. The CSR activities are particularly aligned with International and National Development agenda.
The programmes are categorised into two broad themes: Environment and Social (which has health and community development). Within the themes there are 4 core areas of work:
1. Health Programme for truck drivers.
2. Solid Waste Management and Sanitation.
3. Environment Conservation- Biodiversity & Climate Change.
4. Community Development (Livelihood for women and farmers).
5. Local Initiatives - Besides the above, there are other local initiatives that are part of broad themes:
Environment: Watershed Management and Renewable Energy Proliferation projects at manufacturing locations.
Social: Road Safety Awareness, Computer Literacy.
CSR policy of Apollo covered all the activities which are mentioned in Schedule VII of Companies Act, 2013 but does not include the following:
> Activities undertaken in pursuance of normal course of business of the Company.
> Activities that benefit only the employees of the Company and their families.
> Contribution to any political party.
Projects or Programmes proposed to be undertaken Following are the proposed initiatives which will be undertaken
by the Company:
Environment Initiative: > Tree plantation with objective of carbon sequestration at
Tamilnadu (already initiated).
> Mangrove conservation project at Kannur, Kerala (already initiated).
> Waste management and Sanitation project (SPARSH) in different transhipment hubs and communities around manufacturing locations (already initiated).
> Watershed management project such as pond conservation, river conservation and drinking water project at the local communities round manufacturing units (already initiated).
> Conservation and maintenance of biodiversity parks in Kochi (already initiated).
Social Initiative: > Health Programme for truck drivers at 27 transhipment
locations (already initiated).
> Expansion of livelihood initiative at Baroda and Kottayam location (already initiated).
> Introduction of agriculture based livelihood project at Chinnapandur panchayat, Chittoor district, Andhra Pradesh.
> Expansion of job counseling and employability training for ITI and other Graduates in Kochi and Chennai (already started).
> Computer literacy projects in the villages around Chennai plant (already started).
> Road safety awareness project at Perambra location.
Philanthropic Initiative: > Support to Kabiliji Hospital for the treatment of
underprivileged rural people.
> Sponsorship of education of underprivileged girls in Dehradun, Uttrakahand (Himjyoti School).
> Support to education of disabled (Madhav Rao Schindia Golf Club).
> Feeding of people outside AIIMS hospital (Delhi Langar Society).
> Livelihood support to the unemployed blind girls (National Association for the Blind Employment and Training).
> Ration support to the underprivileged old age people (DAVO NGO).
Web Link: The Company has framed a CSR Policy in compliance with the
provisions of the Companies Act, 2013 and the same is placed on the Company’s website and the web link for the same is https://corporate.apollotyres.com/en-in/responsibility/policies-documents/
2. The Composition of the CSR Committee. A. Mr. Onkar S. Kanwar- Chairman of the Committee.
B. Mr. Sunam Sarkar - Member of the CSR Committee.
C. General Bikram Singh (Retd.) - Member of CSR Committee.
D. Ms. Anjali Bansal - Member of the CSR Committee.
3. Average net profit of the Company for last three financial years: 10,783.12 Million
4. Prescribed CSR Expenditure (two per cent of the amount as in item 3 above): 215.66 Million
5. Details of CSR spent during the financial year: 215.68 Million
(a) Total amount to be spent for the financial year: 215.66 Million
(b) Amount unspent, if any: Nil
71
Corporate Overview / Statutory Reports / Financial Statements

(c) Manner in which the amount spent during the financial year is detailed below:(` in Million)
(1) (2) (3) (4) (5) (6) (7) (8)
S. NoCSR project or activity identified
Sector in which the Project is covered
Projects or programs(1) Local area or other(2) Specify the State and district where projects or programs was undertaken
Amount outlay (budget)
project or programs wise
Amount spent on the projects or programs
Sub – heads: (1) Direct expenditure
on projects or programs
(2) Overheads
Cumulative expenditure
up to the reporting
period
Amount spent: Direct or throughImplementing agency*
1 Community solid waste management project; Clean My Transport Nagar
Ensuring Environmental Sustainability
Clean My Transport Nagar, Agra, Uttar Pradesh
2.85 2.81 2.81 Adarsh Seva Samiti
2 Community solid waste management project; Clean My Transport Nagar
Ensuring Environmental Sustainability
Clean My Transport Nagar, Chennai, Tamil Nadu
3.00 2.87 2.87 Citizen consumer and civic Action Group
3 Community solid waste management project; Clean My Transport Nagar
Ensuring Environmental Sustainability
Clean My Transport Nagar, Delhi
5.07 5.06 5.06 Apollo Tyres Foundation
4 Community solid waste management project; Clean My Transport Nagar
Ensuring Environmental Sustainability
Clean My Transport Nagar, Jaipur, Rajasthan
2.46 2.43 2.43 R K Sansthan
5 Community solid waste management project; Clean My Transport Nagar
Ensuring Environmental Sustainability
Clean My Transport Nagar, Jodhpur, Rajasthan
2.28 2.20 2.20 Gramin Swabhiman Sansthan
6 Community solid waste management project; Clean My Transport Nagar
Ensuring Environmental Sustainability
Clean My Transport Nagar, Kanpur, Uttar Pradesh
2.88 2.72 2.72 Muskan Jyoti Samiti
7 Community solid waste management project; Clean My Transport Nagar
Ensuring Environmental Sustainability
Clean My Transport Nagar, Kolkata, West Bengal
1.76 1.67 1.67 Society For Direct Initiative For Social And Health Action
8 Community solid waste management project; Clean My Village
Ensuring Environmental Sustainability
Gujarat 5.59 5.55 5.55 Harsidhdhi Corporation Pvt. Ltd.
9 Pond Restoration project
Ensuring Environmental Sustainability
Dolapura, Baroda, Gujarat
0.37 0.37 0.37 Harsidhdhi Corporation Pvt. Ltd.
10 Community solid waste management project
Ensuring Environmental Sustainability
Clean My Village, Chennai, Tamil Nadu
2.53 2.45 2.45 Help Foundation
11 Community solid waste management project
Ensuring Environmental Sustainability
Clean My Village, Chennai, Tamil Nadu
5.15 5.05 5.05 World Heritage Trust
12 Play structure in Govt. schools
Ensuring Environmental Sustainability
Oragadam, Sennakuppam & Mathur Village, Kancheepuram District, Chennai, Tamil Nadu
1.70 1.74 1.74 Sri Sun Flower, B.S. Enterprises & Frames Creations
13 Biodiversity-Greening work near pond and water plant area
Ensuring Environmental Sustainability
Oragadam, Sennakuppam & Mathur Village, Kancheepuram District, Chennai, Tamil Nadu
2.29 1.40 1.40 Sri Sun Flower, SMB Engineering & B.S. Enterprises
14 Pond management project
Ensuring Environmental Sustainability
Sennanthangal & Eraiyur, Kancheepuram District, Chennai, Tamil Nadu
3.96 3.23 3.23 Thrust Geo Consultants Private Limited, SMB Engineering & Frames Creations
15 Tree plantation & Livelihood project
Ensuring Environmental Sustainability
Sennakuppam & Valakottai panchayat, Chennai, Tamil Nadu
6.23 6.31 6.31 TIST Tree Planting India Private Limited
16 Community solid waste management project;
Ensuring Environmental Sustainability
Clean My Village, Kodakara Panchayat, Kerala
5.17 5.17 5.17 Plan@Earth & Apollo Tyres Foundation
17 Pond management project
Ensuring Environmental Sustainability
Pond management project, Kodakara, Kerala
1.06 1.09 1.09 Tropical Institute of Ecological Science, Delwin Devis, K K Varghese & Santhoshkumar P
72

Apollo Tyres Ltd Annual Report 2017-18
(` in Million)(1) (2) (3) (4) (5) (6) (7) (8)
S. NoCSR project or activity identified
Sector in which the Project is covered
Projects or programs(1) Local area or other(2) Specify the State and district where projects or programs was undertaken
Amount outlay (budget)
project or programs wise
Amount spent on the projects or programs
Sub – heads: (1) Direct expenditure
on projects or programs
(2) Overheads
Cumulative expenditure
up to the reporting
period
Amount spent: Direct or throughImplementing agency*
18 Mangrove Project Ensuring Environmental Sustainability
Thrissur, Kerala 4.19 4.21 4.21 Wildlife Trust of India & Apollo Tyres Foundation
19 Water conservation project of Chalakudy river
Ensuring Environmental Sustainability
Chalakudy, Kerala 1.18 1.18 1.18 Tropical Institute of Ecological Science
20 Chalakudy park maintenance
Ensuring Environmental Sustainability
Chalakudy, Kerala 0.30 0.30 0.30 Tropical Institute of Ecological Science
21 Baseline to identify environment related issues in community
Ensuring Environmental Sustainability
Kodakara Panchayat, Perambra, Kerala
1.38 1.38 1.38 Knight Frank India Pvt Ltd
22 Swachh Bharat event at 5 locations
Ensuring Environmental Sustainability
Delhi(Delhi), Chennai(Tamil Nadu), Baroda(Gujarat), Perambra(Kerala) & Agra(Uttar Pradesh)
1.96 1.89 1.89 Apollo Tyres Foundation, Frames Creations, Plan@Earth & Adarsh Seva Samiti
23 Ration support to flood effected people
Eradication Hunger, Poverty & Malnutrition
Jasola, New Delhi & Lodhi Estate, New Delhi
0.50 0.50 0.50 The Lepra India Trust & WWF - India
24 Monthly Ration support for the under privileged people
Eradication Hunger, Poverty & Malnutrition
Amritsar, Punjab 1.00 1.00 1.00 Bhai Vir Singh Sahitya Sadan
25 Monthly Ration support for the under privileged people
Eradication Hunger, Poverty & Malnutrition
New Delhi 0.83 0.83 0.83 Delhi Langar Seva Society
26 Skill building & income generation projects for the community
Livelihood Enhancement Projects
Waghodiya Taluka, Baroda, Gujarat
8.41 7.70 7.70 Apollo Tyres Foundation, Nandanvan
27 Skill building & income generation projects for the community
Livelihood Enhancement Projects
Baroda, Gujarat 0.63 0.63 0.63 Live Wire Private Limited & India Cares
28 Skill generation in various trades for women
Livelihood Enhancement Projects
Kottayam, Kerala 2.90 2.90 2.90 Jawaharlal Memorial Social Welfare and Public Co-Operation Centre
29 Terrace farming project in Kodakara panchayat
Livelihood Enhancement Projects
Kodakara Panchayat, Perambra, Kerala
0.40 0.40 0.40 Tropical Institute of Ecological Science & Rajagiri Outreach
30 Skill generation in various trades for women
Livelihood Enhancement Projects
Kottayam, Kerala 3.42 3.42 3.42 South Asian Rubber & Beta Rubbers
31 Skill Development Programme-Youth
Promoting Education
Sennakuppam & Valakottai panchayat, Chennai, Tamil Nadu
1.89 1.62 1.62 Magic Bus
32 Computer literacy to Govt. School children
Promoting Education
Sennakuppam & Valakottai panchayat, Chennai, Tamil Nadu
1.34 1.30 1.30 Bhumi
33 Skill Development Programme-Youth
Promoting Education
Kodakara Panchayat, Perambra, Kerala
1.47 1.34 1.34 3J Consulting Private Limited
34 Road Safety Awareness Programme
Promoting Education
Kodakara Panchayat, Perambra, Kerala
1.05 1.05 1.05 National Road Safety Organisation & Graphin Communications
35 Education support to under privileged children
Promoting Education
Delhi 0.70 0.70 0.70 Christel House India
36 Education support to 50 under privileged girls
Promoting Education
Dehradun, Uttrakhand 3.25 3.25 3.25 Himalayan School Society
37 Education support to under privileged children
Promoting Education
Gurgaon, Haryana 0.60 0.60 0.60 Madhavrao Scindia Foundation
38 Education support to under privileged children
Promoting Education
Delhi 0.07 0.06 0.06 Chandra Mohan Mishra
39 Education support to under privileged children
Promoting Education
Civil Lines, New Delhi 0.20 0.21 0.21 Sudeva
73
Corporate Overview / Statutory Reports / Financial Statements

(` in Million)(1) (2) (3) (4) (5) (6) (7) (8)
S. NoCSR project or activity identified
Sector in which the Project is covered
Projects or programs(1) Local area or other(2) Specify the State and district where projects or programs was undertaken
Amount outlay (budget)
project or programs wise
Amount spent on the projects or programs
Sub – heads: (1) Direct expenditure
on projects or programs
(2) Overheads
Cumulative expenditure
up to the reporting
period
Amount spent: Direct or throughImplementing agency*
40 Education support to under privileged children
Promoting Education
Gurgaon, Haryana 0.32 0.32 0.32 National Association for The Blind-Manesar
41 Education support to under privileged children
Promoting Education
Jasola Vihar, New Delhi
0.50 0.50 0.50 Action for Autism
42 Education support to under privileged children
Promoting Education
Main Kanjhawala Road, Delhi
0.10 0.10 0.10 Navjyoti India Foundation
43 Education support to under privileged children
Promoting Education
Andheria Morh Mehrauli, Delhi
0.50 0.50 0.50 Sri Guru Granth Sahib Vidya Kender Society
44 Education support to under privileged children
Promoting Education
Gurgaon, Haryana 0.44 0.41 0.41 Guru Nanak Seva Sansthan
45 HIV-AIDS awareness & prevention programme (Targeted Intervention)
Promoting Preventive Health
Apollo Tyres Health Care Centre, Agra, Uttar Pradesh
2.42 2.58 2.58 Jan Chetna Sewa Samiti
46 HIV-AIDS awareness & prevention programme (Targeted Intervention)
Promoting Preventive Health
Apollo Tyres Health Care Centre, Ankleshwar, Gujarat
2.00 2.08 2.08 Lok Vikas Sanstha
47 HIV-AIDS awareness & prevention programme (Targeted Intervention)
Promoting Preventive Health
Apollo Tyres Health Care Centre, Bangalore, Karnataka
2.73 2.35 2.35 Hindustan Latex Family Planning Promotion Trust
48 HIV-AIDS awareness & prevention programme (Targeted Intervention)
Promoting Preventive Health
Health Care Centre, Barmana, Himachal Pradesh
1.07 1.26 1.26 Himachal Pradesh Voluntary Health Association
49 HIV-AIDS awareness & prevention programme (Targeted Intervention)
Promoting Preventive Health
Apollo Tyres Health Care Centre, Chennai, Tamil Nadu
2.35 2.51 2.51 Confederation of Surface Transport Tamil Nadu
50 HIV-AIDS awareness & prevention programme (Targeted Intervention)
Promoting Preventive Health
Apollo Tyres Health Care Centre, Kochi, Kerala
2.25 0.75 0.75 Rajiv Youth Foundation
51 HIV-AIDS awareness & prevention programme (Targeted Intervention)
Promoting Preventive Health
Apollo Tyres Health Care Centre, Delhi
5.78 6.41 6.41 Apollo Tyres Foundation
52 HIV-AIDS awareness & prevention programme (Targeted Intervention)
Promoting Preventive Health
Apollo Tyres Health Care Centre, Delhi
1.22 1.40 1.40 Nav Srishti
53 HIV-AIDS awareness & prevention programme (Targeted Intervention)
Promoting Preventive Health
Health Care Centre, Farakka, West Bengal
1.28 1.44 1.44 Ambuja Cement Foundation
54 HIV-AIDS awareness & prevention programme (Targeted Intervention)
Promoting Preventive Health
Apollo Tyres Health Care Centre, Guwahati, Assam
2.56 2.76 2.76 Global Organisation for Life Development
55 HIV-AIDS awareness & prevention programme (Targeted Intervention)
Promoting Preventive Health
Apollo Tyres Health Care Centre, Gwalior, Madhya Pradesh
2.34 2.42 2.42 Sambhav Social Service Organization
56 HIV-AIDS awareness & prevention programme (Targeted Intervention)
Promoting Preventive Health
Apollo Tyres Health Care Centre, Hyderabad, Telangana
2.46 2.64 2.64 Telugu Network of People Living With HIV/AIDS
57 HIV-AIDS awareness & prevention programme (Targeted Intervention)
Promoting Preventive Health
Apollo Tyres Health Care Centre, Indore, Madhya Pradesh
2.38 2.59 2.59 Adarsh Jan Seva Sansthan
58 HIV-AIDS awareness & prevention programme (Targeted Intervention)
Promoting Preventive Health
Apollo Tyres Health Care Centre, Jaipur, Rajasthan
2.22 2.33 2.33 Institute for Global Development
74

Apollo Tyres Ltd Annual Report 2017-18
(` in Million)(1) (2) (3) (4) (5) (6) (7) (8)
S. NoCSR project or activity identified
Sector in which the Project is covered
Projects or programs(1) Local area or other(2) Specify the State and district where projects or programs was undertaken
Amount outlay (budget)
project or programs wise
Amount spent on the projects or programs
Sub – heads: (1) Direct expenditure
on projects or programs
(2) Overheads
Cumulative expenditure
up to the reporting
period
Amount spent: Direct or throughImplementing agency*
59 HIV-AIDS awareness & prevention programme (Targeted Intervention)
Promoting Preventive Health
Apollo Tyres Health Care Centre, Jalandhar, Punjab
2.48 2.68 2.68 Pahal
60 HIV-AIDS awareness & prevention programme (Targeted Intervention)
Promoting Preventive Health
Apollo Tyres Health Care Centre, Jodhpur, Rajasthan
2.36 2.28 2.28 Meera Sansthan
61 HIV-AIDS awareness & prevention programme (Targeted Intervention)
Promoting Preventive Health
Apollo Tyres Health Care Centre, Kanpur, Uttar Pradesh
2.83 3.05 3.05 Jan Kalyan Maha Samiti
62 HIV-AIDS awareness & prevention programme (Targeted Intervention)
Promoting Preventive Health
Health Care Centre, Kolkata, West Bengal
1.44 1.63 1.63 Ambuja Cement Foundation
63 HIV-AIDS awareness & prevention programme (Targeted Intervention)
Promoting Preventive Health
Apollo Tyres Health Care Centre, Mumbai, Maharashtra
2.63 2.77 2.77 Alert India
64 HIV-AIDS awareness & prevention programme (Targeted Intervention)
Promoting Preventive Health
Apollo Tyres Health Care Centre, Nagpur, Maharashtra
2.14 2.31 2.31 Young Men’s Christian Association
65 HIV-AIDS awareness & prevention programme (Targeted Intervention)
Promoting Preventive Health
Health Care Centre, Nalagarh, Himachal Pradesh
1.46 1.58 1.58 Ambuja Cement Foundation
66 HIV-AIDS awareness & prevention programme (Targeted Intervention)
Promoting Preventive Health
Apollo Tyres Health Care Centre, Patna, Bihar
2.60 2.79 2.79 Step Foundation
67 HIV-AIDS awareness & prevention programme (Targeted Intervention)
Promoting Preventive Health
Apollo Tyres Health Care Centre, Pune, Maharashtra
2.17 2.30 2.30 Magmo Welfare Sanstha
68 HIV-AIDS awareness & prevention programme (Targeted Intervention)
Promoting Preventive Health
Apollo Tyres Health Care Centre, Pune, Maharashtra
2.32 2.39 2.39 Indian Society of Healthcare Professionals
69 HIV-AIDS awareness & prevention programme (Targeted Intervention)
Promoting Preventive Health
Health Care Centre, Surat, Gujarat
1.13 1.24 1.24 Ambuja Cement Foundation
70 HIV-AIDS awareness & prevention programme (Targeted Intervention)
Promoting Preventive Health
Apollo Tyres Health Care Centre, Varansi, Uttar Pradesh
2.08 2.25 2.25 Jan Kalyan Maha Samiti
71 HIV-AIDS awareness & prevention programme (Targeted Intervention)
Promoting Preventive Health
Apollo Tyres Health Care Centre, Vijayawada, Andhra Pradesh
2.43 2.63 2.63 Vasavya Mahila Mandali
72 HIV-AIDS awareness & prevention programme (Migrant Project)
Promoting Preventive Health
Apollo Tyres Health Care Centre, Delhi
1.39 1.25 1.25 Confederation of Surface Transport Tamil Nadu
73 HIV-AIDS awareness & prevention programme (Migrant Project)
Promoting Preventive Health
Apollo Tyres Health Care Centre, Delhi
1.27 1.28 1.28 Shree Sevanidhi Trust
74 HIV-AIDS awareness & prevention programme (Migrant Project)
Promoting Preventive Health
Apollo Tyres Health Care Centre, Delhi
0.82 0.57 0.57 Global Organisation for Life Development
75 HIV-AIDS awareness & prevention programme (Migrant Project)
Promoting Preventive Health
Apollo Tyres Health Care Centre, Delhi
3.03 2.90 2.90 Apollo Tyres Foundation
76 Project on eye check up camps organised for truckers and allied population
Promoting Preventive Health
Apollo Tyres Health Care Centre, Agra, Uttar Pradesh
0.31 0.36 0.36 Jan Chetna Sewa Samiti
75
Corporate Overview / Statutory Reports / Financial Statements

(` in Million)(1) (2) (3) (4) (5) (6) (7) (8)
S. NoCSR project or activity identified
Sector in which the Project is covered
Projects or programs(1) Local area or other(2) Specify the State and district where projects or programs was undertaken
Amount outlay (budget)
project or programs wise
Amount spent on the projects or programs
Sub – heads: (1) Direct expenditure
on projects or programs
(2) Overheads
Cumulative expenditure
up to the reporting
period
Amount spent: Direct or throughImplementing agency*
77 Project on eye check up camps organised for truckers and allied population
Promoting Preventive Health
Apollo Tyres Health Care Centre, Agra, Uttar Pradesh
0.18 0.22 0.22 Lok Vikas Sanstha
78 Project on eye check up camps organised for truckers and allied population
Promoting Preventive Health
Apollo Tyres Health Care Centre, Agra, Uttar Pradesh
0.57 0.53 0.53 Hindustan Latex Family Planning Promotion Trust
79 Project on eye check up camps organised for truckers and allied population
Promoting Preventive Health
Apollo Tyres Health Care Centre, Chennai, Tamil Nadu
0.31 0.31 0.31 Confederation of Surface Transport Tamil Nadu
80 Project on eye check up camps organised for truckers and allied population
Promoting Preventive Health
Apollo Tyres Health Care Centre, Kochi, Kerala
0.18 0.09 0.09 Rajiv Youth Foundation
81 Project on eye check up camps organised for truckers and allied population
Promoting Preventive Health
Apollo Tyres Health Care Centre, Delhi
1.05 1.00 1.00 Apollo Tyres Foundation
82 Project on eye check up camps organised for truckers and allied population
Promoting Preventive Health
Apollo Tyres Health Care Centre, Guwahati, Assam
1.05 1.05 1.05 Global Organisation for Life Development
83 Project on eye check up camps organised for truckers and allied population
Promoting Preventive Health
Apollo Tyres Health Care Centre, Guwahati, Assam
0.18 0.24 0.24 Sambhav Social Service Organization
84 Project on eye check up camps organised for truckers and allied population
Promoting Preventive Health
Apollo Tyres Health Care Centre, Hyderabad, Telangana
0.31 0.39 0.39 Telugu Network of People Living With HIV/AIDS
85 Project on eye check up camps organised for truckers and allied population
Promoting Preventive Health
Apollo Tyres Health Care Centre, Indore, Madhya Pradesh
0.95 1.03 1.03 Adarsh Jan Seva Sansthan
86 Project on eye check up camps organised for truckers and allied population
Promoting Preventive Health
Apollo Tyres Health Care Centre, Jaipur, Rajasthan
0.18 0.21 0.21 Institute for Global Development
87 Project on eye check up camps organised for truckers and allied population
Promoting Preventive Health
Apollo Tyres Health Care Centre, Jalandhar, Punjab
0.88 0.81 0.81 Pahal
88 Project on eye check up camps organised for truckers and allied population
Promoting Preventive Health
Apollo Tyres Health Care Centre, Jalandhar, Punjab
0.18 0.17 0.17 Meera Sansthan
89 Project on eye check up camps organised for truckers and allied population
Promoting Preventive Health
Apollo Tyres Health Care Centre, Kanpur, Uttar Pradesh
0.84 0.83 0.83 Jan Kalyan Maha Samiti
90 Project on eye check up camps organised for truckers and allied population
Promoting Preventive Health
Apollo Tyres Health Care Centre, Mumbai, Maharashtra
0.31 0.31 0.31 Alert India
91 Project on eye check up camps organised for truckers and allied population
Promoting Preventive Health
Apollo Tyres Health Care Centre, Nagpur, Maharashtra
0.31 0.33 0.33 Young Men’s Christian Association
92 Project on eye check up camps organised for truckers and allied population
Promoting Preventive Health
Apollo Tyres Health Care Centre, Patna, Bihar
0.31 0.33 0.33 Step Foundation
93 Project on eye check up camps organised for truckers and allied population
Promoting Preventive Health
Apollo Tyres Health Care Centre, Pune, Maharashtra
0.31 0.35 0.35 Magmo Welfare Sanstha
94 Project on eye check up camps organised for truckers and allied population
Promoting Preventive Health
Apollo Tyres Health Care Centre, Varanasi, Uttar Pradesh
0.31 0.36 0.36 Jan Kalyan Maha Samiti
76

Apollo Tyres Ltd Annual Report 2017-18
(` in Million)(1) (2) (3) (4) (5) (6) (7) (8)
S. NoCSR project or activity identified
Sector in which the Project is covered
Projects or programs(1) Local area or other(2) Specify the State and district where projects or programs was undertaken
Amount outlay (budget)
project or programs wise
Amount spent on the projects or programs
Sub – heads: (1) Direct expenditure
on projects or programs
(2) Overheads
Cumulative expenditure
up to the reporting
period
Amount spent: Direct or throughImplementing agency*
95 Project on eye check up camps organised for truckers and allied population
Promoting Preventive Health
Apollo Tyres Health Care Centre, Vijayawada, Andhra Pradesh
0.31 0.35 0.35 Vasavya Mahila Mandali
96 TB awareness & prevention programme
Promoting Preventive Health
Apollo Tyres Health Care Centre, Delhi
1.94 1.80 1.80 German Leprosy & TB Relief Association - India
97 Impact Assesment of Targeted Intervention projects at 3 clinics in India
Promoting Preventive Health
Kanpur(Uttar Pradesh), Agra(Uttar Pradesh), Delhi(New Delhi)
1.15 0.58 0.58 Knight Frank India Pvt Ltd
98 Sanitation project-Toilet construction & Geo Tagging
Promoting Preventive Health
Mathur & Eraiyur Panchayat, Chennai, Tamil Nadu
7.58 7.48 7.48 Help Foundation, Frames
99 General health program for Tappers community in Perambra
Promoting Preventive Health
General Health Project, Perambra, Kerala
0.86 0.86 0.86 Global Cancer Concern India & Apollo Tyres Foundation
100 General health & eye care treatment support to the under privileged rural community
Promoting Preventive Health
Gurgaon, Haryana 3.00 3.00 3.00 Sardar Ram Singh Kabli and Sardarni Harnam Kaur Trust
101 General health treatment support to the under privileged rural community
Promoting Preventive Health
Delhi 0.54 0.53 0.53 Delhi Commonwealth Women’s Association
102 General health treatment support to the under privileged rural community
Promoting Preventive Health
Gurgaon, Haryana 0.41 0.41 0.41 Desire Society
103 General health treatment support to the under privileged rural community
Promoting Preventive Health
Gurgaon, Haryana 0.26 0.32 0.32 DAVO NGO
104 Bio-gas project Rural Development Projects
Baroda, Gujarat 5.44 4.37 4.37 Sintex Industries Limited
105 Improved Farming Practices for community
Rural Development Projects
Baroda, Gujarat 4.59 4.59 4.59 BAIF Institute for Sustainable Livelihoods and Development, Shrishti Organics
106 Improved Farming Practices for community
Rural Development Projects
Baroda, Gujarat 3.05 3.05 3.05 Shrishti Organics
107 Sustainable Agriculture project
Rural Development Projects
Chennai, Tamil Nadu 3.20 3.23 3.23 National Agro Foundation
108 Sustainable Agriculture project
Rural Development Projects
Osmanabad, Maharashtra
3.67 3.59 3.59 Rain Drop
109 Baseline for need assessment, Toilet Construction & General health check-up camp for community
Rural Development Projects
Chinnapanduru Gram Panchayath
1.57 2.49 2.49 Help Foundation, Knight Frank India Pvt Ltd
Total 205.41Administrative Cost 5% of total expense 10.27
Grand Total 215.68
6. The CSR Committee confirms that the implementation and monitoring of CSR Policy, is in compliance with CSR Objectives and Policy of the Company.
Place: Gurgaon ONKAR S. KANWAR NEERAJ KANWARDate: May 10, 2018 Chairman of CSR Committee Vice Chairman & Managing Director
77
Corporate Overview / Statutory Reports / Financial Statements

ANNEXURE IIIBUSINESS RESPONSIBILITY REPORT (BRR)
Business Responsibility Report of the Company for the financial year ended on March 31, 2018, pursuant to Regulation 34 (2)(f) of the SEBI (Listing Obligations and Disclosure Requirements) Regulations, 2015 is as follows:-
SECTION A: GENERAL INFORMATION ABOUT THE COMPANY
1 Corporate Identity Number (CIN) of the Company L25111KL1972PLC002449
2 Name of the Company APOLLO TYRES LTD
3 Registered address 3rd floor, Areekal Mansion, Near Manorama Junction, Panampilly Nagar, Kochi- 682036 (Kerala)
4 Website apollotyres.com
5 E-mail id [email protected]
6 Financial Year reported 2017-18
7 Sector(s) that the Company is engaged in (industrial activity code-wise)
Tyres manufacturing
8 List three key products/services that the Company manufactures/provides (as in balance sheet)
Tyres, Tubes and Flaps
9 Total number of locations where business activity is undertaken by the Company
138 locations
A Number of International Locations (Provide details of major 5)
Apollo has business activity undertaken in about 102 international locations. The major ones are Netherlands, Hungary, Middle East, Thailand, and Singapore. The Company has manufacturing units in Netherlands and Hungary.
B Number of National Locations Apollo has business activity carried out in about 36 domestic locations. The manufacturing units are located at Gujarat (Limda), Kerala (Perambra and Kalamassery) and Tamil Nadu (SIPCOT Industrial Growth Centre Oragadam, Chennai).
10 Markets served by the Company – Local/State/National/International
National and International
SECTION B: FINANCIAL DETAILS OF THE COMPANY
1. Paid up Capital (INR): ` 572.05 million
2. Total Turnover (INR): ` 101,332 million
3. Total profit after taxes (INR): ` 6,224 million
4. Total Spending on Corporate Social Responsibility (CSR) as percentage of profit after tax (%): ` 215.68 million
5. List of activities in which expenditure in 4 above has been incurred:-
During the year under review, the Company has carried out activities primarily related to promoting preventive healthcare, ensuring environmental sustainability, livelihood enhancement projects, rural development projects, promoting education and eradication of hunger, poverty & malnutrition.
SECTION C: OTHER DETAILS
1. Does the Company have any Subsidiary Company/ Companies?
Yes
2. Do the Subsidiary Company/Companies participate in the BR Initiatives of the parent Company? If yes, then indicate the number of such Subsidiary Company(s):
At present the BR initiatives have been undertaken at parent Company level.
3. Do any other entity/entities (e.g. suppliers, distributors etc.) that the Company does business with, participate in the BR initiatives of the Company? If yes, then indicate the percentage of such entity/entities? [Less than 30%, 30-60%, More than 60%] :-
At present the BR initiatives have been undertaken at Company level.
SECTION D: BR INFORMATION
1. Details of Director/Directors responsible for BR
a. Details of the Director/Director responsible for implementation of the BR policy/policies
i. DIN Number :- 00058859
ii. Name :- Mr. Sunam Sarkar
iii. Designation :- Director
2. Details of the BR head
No Particulars Details
1 DIN Number (if applicable)
NA
2 Name Ms. Seema Thapar
3 Designation Company Secretary
4 Telephone number 0124-2721000
5 e-mail id [email protected]
78

Apollo Tyres Ltd Annual Report 2017-18
LIST OF PRINCIPLES
Principle 1: Businesses should conduct and govern themselves with Ethics, Transparency and Accountability.
Principle 2: Businesses should provide goods and services that are safe and contribute to sustainability throughout their life cycle.
Principle 3: Businesses should promote the wellbeing of all employees.
Principle 4: Businesses should respect the interests of, and be responsive towards all stakeholders, especially those who are disadvantaged, vulnerable and marginalized.
Principle 5: Businesses should respect and promote human rights.
Principle 6: Business should respect, protect, and make efforts to restore the environment.
Principle 7: Businesses, when engaged in influencing public and regulatory policy, should do so in a responsible manner.
Principle 8: Businesses should support inclusive growth and equitable development.
Principle 9: Businesses should engage with and provide value to their customers and consumers in a responsible manner.
2. Principle-wise (as per NVGs) BR Policy/policies (Reply in Y/N)
P1 P2 P3 P4 P5 P6 P7 P8 P9
1. Do you have a policy /policies for.... Y Y Y Y Y Y Y Y Y2. Has the policy being formulated in consultation with the relevant stakeholders? Y Y Y Y Y Y Y Y Y3. Does the policy conform to any national /international standards? If yes, specify?
(50 words)(1)
Y Y Y Y Y Y Y Y Y
4. Has the policy being approved by the Board? If yes, has it been signed by MD/Owner/CEO/appropriate Board Director?(2)
Y Y Y Y Y Y Y Y Y
5. Does the Company have a specified Committee of the Board/ Director/Official to oversee the implementation of the policy?(3)
Y Y Y Y Y Y Y Y Y
6. Indicate the link for the policy to be viewed online? (4) Y Y Y Y Y Y Y Y Y7. Has the policy been formally communicated to all relevant internal and external
stakeholders?Y Y Y Y Y Y Y Y Y
8. Does the Company have in-house structure to implement the policy/policies? Y Y Y Y Y Y Y Y Y9. Does the Company have a grievance redressal mechanism related to the policy/
policies to address stakeholders’ grievances related to the policy/policies?Y Y Y Y Y Y Y Y Y
10. Has the Company carried out independent audit/evaluation of the working of this policy by an internal or external agency?
Y Y Y Y Y Y Y Y Y
(1) The policies are in compliance with applicable national/international laws, rules, regulations, guidelines and standards. The policies are in conformance to the spirit of international standards like ISO 9001, ISO 14001 and OHSAS 18001
(2) As per Company practice the policies that are approved by the Board are posted on the website of the Company www.apollotyres.com (3) The Business Responsibility(BR) Committee shall oversee the implementation of the Policies (4)https://corporate.apollotyres.com/en-in/investors/corporate-governance/?filter=CodesPolicies
2a. If the answer to S. No.1 against any principle, is ‘No’, please explain why: (Tick upto 2 options)- Not Applicable
P1 P2 P3 P4 P5 P6 P7 P8 P9
1. The Company has not understood the Principles2. The Company is not at a stage where it finds itself in a position to formulate and
implement the policies on specified principles3. The Company does not have financial or manpower resources available for the task4. It is planned to be done within next 6 months5. It is planned to be done within the next 1 year 6. Any other reason (please specify)
3. Governance related to BR (a) Indicate the frequency with which the Board of
Directors, Committee of the Board or CEO to assess the BR performance of the Company. Within 3 months, 3-6 months, Annually, More than 1 year
The Business Responsibility (BR) Committee reviews the Business performance annually and as an when required.
(b) Does the Company publish a BR or a Sustainability Report? What is the hyperlink for viewing this report? How frequently it is published?
Yes, the Company publishes Annual sustainability report as a part of the Annual Report. From FY2017, the BR Report was also part of the Annual Report. Both BR and Sustainability
Report are published on the website https://corporate.apollotyres.com/en-in/responsibility/policies-documents.
SECTION E: PRINCIPLE-WISE PERFORMANCE
Principle 1
1. Does the policy relating to ethics, bribery and corruption cover only the Company? Yes/ No. Does it extend to the Group/Joint Ventures/ Suppliers/Contractors/NGOs /Others?
Yes. The Company has designed a global “Code of Conduct Policy” (“Code”) to conduct its business with honesty and integrity and in compliance with all applicable legal and regulatory requirements. This Code sets out the fundamental standards to be followed by all employees of the Company including Associates, Subsidiaries and Joint Ventures.
79
Corporate Overview / Statutory Reports / Financial Statements

The Code is also to act as a deterrent from unethical doings and to promote ethical values and is the manifestation of the Company’s commitment to successful operation of the Company’s business in the best interest of the shareholders, creditors, employees, other business associates and stakeholders.
The Company has rolled out Code of Conduct mandatory online training for all the employees. The Code of Conduct explicitly guides our people on ethical dealings with external stakeholders.
2. How many stakeholder complaints have been received in the past financial year and what percentage was satisfactorily resolved by the management? If so, provide details thereof, in about 50 words or so.
During the year under review, there were no cases on the violation of the Company’s Code of Conduct. During the past financial year, 19 Shareholders Complaints were received and no complaints are pending as on March 31, 2018. All the Complaints were attended and resolved to the satisfaction of the shareholders.
Principle 2
1. List up to 3 of your products or services whose design has incorporated social or environmental concerns, risks and/or opportunities.
At Apollo Tyres, we follow state of the art and efficient manufacturing practices. Our Passenger Car Radial tyres and Truck / Bus Radial Tyres are designed to meet all the international norms and are duly certified for that. These tyres do not contain any conflict materials and all materials used for making these tyres are REACH compliant. Also all the tyres are aligned to the requirements of ELV norms. In FY2018, Apollo introduced all steel radial tyres for light commercial vehicle adding another product category complying to the REACH norms.
2. For each such product, provide the following details in respect of resource use (energy, water, raw material etc.) per unit of product(optional):
a) Reduction during sourcing/production/distribution achieved since the previous year throughout the value chain?
Comparative Details for FY15-16, 16-17 and 17-18 against reference of 14-15 on
(i) Steam consumed per kg of product [Kg/kg]: PCR - 7.5%, 14.5% & 17.3% reduction.
(ii) Electricity consumed per kg of product [KwH/Kg]: PCR – 11.0% , 18.9% & 16.4% reduction.
(iii) Water consumed per kg of product [Litre/Kg]: PCR – 26.5% , 22.0% & 21.0% reduction.
(iv) Tyre weight of PCR tyres reduced by 3% progressively thus consumption of Hydrocarbon is reduces and reduced carbon footprint per tyre.
(v) Silica based tyre production for PCR category increased by 300% in last 3 years and reduced fossil fuel based reinforcing agent carbon black consumption.
(vi) Recycled material usage started for inner liner of PCR tyres to the tune of 25 phr to reduce virgin material consumption.
b) Reduction during usage by consumers (energy, water) has been achieved since the previous year?
The rolling resistance of the PCR tyres are reduced through the year from 13.0 Kg/T to 11.5 Kg/T to 10.0 Kg/T to 9.0 Kg/T. This translates into reduction of rolling loss and reduce fuel consumption.
Further, we promote and practice of retreading of Truck tyres to provide extended life cycle of the tyre body material to 2-3 times, thus avoiding the need for frequent replacement.
Tyre wear life is increased by around 20% in car tyres in last 3 years thus improved reuse of the non consumable part of tyres to a longer period.
Product failure rate is reduced by almost 30% for PCR tyres thus enhancing the application life of tyres and improve usage of tyres for longer period.
In FY2018, Apollo launched its range of all steel radial tyres for Light Commercial Vehicles with a low rolling resistance for the category. This would contribute increased fuel efficiency for the Light Commercial Vehicles.
3. Does the Company have procedures in place for sustainable sourcing (including transportation)?
a) If yes, what percentage of your inputs was sourced sustainably? Also, provide details thereof, in about 50 words or so.
Apollo is conscious about environmental protection therefore utmost care is taken while selecting new materials such that steps are taken for reduction of environmental burden. The focus in the upstream supply chain extends to the sourcing of the raw materials, their processing, and their use in the manufacture of intermediate and final products.
The Company also has a Sustainable Supply Chain policy at corporate level. Apollo Tyres believes that supply chain is a key contributor in the development and implementation of its Corporate Social Responsibility Programme, and expects its Business Partners to show concern for social and environmental responsibility as they conduct their business. Apollo’s endeavour is to work jointly with Partners to promote and encourage compliance with the Partner Code of Conduct (PCC). Suppliers are expected to comply with Apollo’s Partner Code of Conduct (PCC) and integrate environmental, occupational health and safety, and human rights and labor policies into their business and decision-making processes.
Apollo seeks to establish green procurement standards in its procurement activities and build a society capable of supporting sustainable development. As a part of promoting sustainability, all the purchase orders are auto generated through the ERP system and communicated to the entire global supplier base by electronic medium only, thereby an improvement over the earlier practice of sending hard copies of the purchase orders to its suppliers.
Apollo promotes and encourages its suppliers in development and usage of environmental friendly and green products in the production of its finished products including usage of recycled products.
80

Apollo Tyres Ltd Annual Report 2017-18
Also, Apollo is actively engaged with its suppliers for the use of eco-friendly packaging material and reusable/recyclable packaging e.g., Returnable Metal Boxes, Returnable pallets, Returnable metallic spools, etc in the supply of their raw materials to its manufacturing plants globally. The packaging of the raw materials supplied must be “wood-free”. In addition, a supplier needs to conform to the local regulations, as and where applicable in each country of supply.
Considering the backdrop of the growing spread of business operations globally and need for more frequent and close interactions amongst the cross functional teams, it is encouraged to maximise the use of information technology including video conferencing, telephonic conferencing, smart phone based email and other applications in order to minimise the impact to environment and make the best use of technology to drive the business.
Apollo is engaged with its raw material suppliers for continual improvement of the labelling parameters related to its tyre, in line with the continuously evolving needs of the market and expectations from its OEM customers.
Apollo encourages its suppliers to follow all applicable industrial practices to ensure its employees safety. Safe workplace ensures high morale and energy amongst the employees to work towards common goal of achieving high quality & productivity. The new manufacturing and information technologies can be an enabler to make the workplace safer. Apollo encourages its suppliers to drive continual improvement in building a safe work environment through periodic assessment of the prevailing safety practices and development of their work place conditions.
Supplier audits are conducted at the time of selection of new suppliers and are also conducted at defined frequency for existing suppliers as per defined audit criteria. The scope of supplier audits covers various elements like quality management system, environmental standards, occupational health and safety standards and others as per our Green Procurement Standards and Partner Code of Conduct. Our audit teams visits them at regular intervals for compliance check as per the standard audit checklist. The Supplier improvement plans are drawn up post the audit, agreed and followed up with the suppliers until closure.
4. Has the Company taken any steps to procure goods and services from local & small producers, including communities surrounding their place of work?
a) If yes, what steps have been taken to improve their capacity and capability of local and small vendors?
From the perspective of raw material procurement, the Purchasing guidelines at Apollo Tyres states that other things being equal, the organisation prefers domestic suppliers because of benefits like proximity to our plants, lower transit time, lower inventory and carbon footprint.
5. Does the Company have a mechanism to recycle products and waste? If yes what is the percentage of recycling of products and waste (separately as <5%, 5-10%, > 10%). Also, provide details thereof, in about 50 words or so.
Yes, Process reject compounds are used with virgin materials at 10% for usage in lower critical application. Further, reclaimed rubber is also used at 2.5% to replace virgin rubber for compounds.
Principle 3
1. Please Indicate Total number of employees - 7663
2. Please indicate the Total number of employees hired on temporary / contractual / casual basis - 4462
3. Please indicate the Number of permanent women employees - 118
4. Please indicate the Number of permanent employees with disabilities - 41
5. Do you have an employee association that is recognized by management?
Yes
6. What percentage of your permanent employees is members of this recognized employee association?
Limda - 32.70% Kalamassery - 65.90% Perambra - 54%
7. Please indicate the Number of complaints relating to child labour, forced labour, involuntary labour, sexual harassment in the last financial year and pending, as on the end of the financial year.
No complaints relating to child labor, forced labor, involuntary labor, sexual harassment has been received in the last financial year as on March 31, 2018.
8. What percentage of your under mentioned employees were given safety & skill upgradation training in the last year?
Permanent employees 80%
Permanent women employees Not Captured
Casual/Temporary/Contractual Employees 100%
Employees with Disabilities Not Captured
Principle 4
1. Has the Company mapped its internal and external stakeholders? Yes/No
Yes, Apollo Tyres has identified employees, customers (OEM), consumers (replacement) and dealers, suppliers, investors and analysts, shareholders, regulatory bodies and community as stakeholders.
2. Out of the above, has the Company identified the disadvantaged, vulnerable & marginalized stakeholders.
Yes, Apollo Tyres has identified community (Women and Children), consumers (replacement: Truck Drivers) as vulnerable and marginalized stakeholders.
3. Are there any special initiatives taken by the Company to engage with the disadvantaged, vulnerable and marginalized stakeholders. If so, provide details thereof, in about 50 words or so.
Yes, Care for society is one of the core Apollo values and all the CSR initiatives are designed to cater to the need of the community. The CSR initiatives have a clear roadmap that follows the overall vision of the function. The organization’s vision
81
Corporate Overview / Statutory Reports / Financial Statements

is to create value for its stakeholders by bringing about positive change in their lives through our intervention. The processes in place ensure that the stakeholder’s needs are addressed before the formulation of the projects (such as conducting baseline or getting informal information through natives in the area). Some of them Company’s community engagement programs are -
1. Health Programme for truck drivers (customers);
2. Sanitation project in Chennai;
3. Livelihood and income generation program for underprivileged women;
4. Improved farming practices program;
5. Computer Literacy project (Chennai).
The Company also does some philanthropic work like –
1) Supporting a hospital for underprivileged rural people.
2) Supporting education for underprivileged girls.
3) Monthly ration support to the underprivileged.
4) Support the education of the disabled children.
5) Supplementary nutrition support to HIV +ve or dependent children.
Principle 5
1. Does the policy of the Company on human rights cover only the Company or extend to the Group/Joint Ventures/Suppliers/Contractors/NGOs/Others?
Respect for human rights is fundamental part of the DNA of the Company and the communities in which we operate. In our Company and across our system, we are committed to ensure that people are treated with dignity and respect. The Company promote the awareness and realization of human rights across our value chain and among our stakeholders.
The Company believe the in core Apollo Value of “One Family” where every individual is respected and is treated equally, regardless of caste, color, nationality etc.
2. How many stakeholder complaints have been received in the past financial year and what percent was satisfactorily resolved by the management?
The Company did not receive any Stakeholder Complaint during the past financial year regarding Human Rights.
Principle 6
1. Does the policy related to Principle 6 cover only the Company or extends to the Group/Joint Ventures/Suppliers/Contractors/NGOs/others.
Policy related to principle 6 is limited to parent Company. All manufacturing plants are ISO:14001:2004 certified. Environmental indicators are part of vendor assessment criteria for upstream suppliers.
2. Does the Company have strategies/ initiatives to address global environmental issues such as climate change, global warming, etc.? Y/N. If yes, please give hyperlink for webpage etc.
Yes, the Company has strategies to address global environmental issues. The Company also has a sustainability statement that covers the aspects of environment conservation
and community development. Various sustainability initiatives taken by the Company includes energy management, waste reduction, emission reduction, water management, and biodiversity conservation. Below are the projects to mitigate climate change.
a) Tree plantation and Livelihood Generation Programme Our afforestation project has a two pronged focus on carbon
sequestration and livelihood generation for farmers in the water starved areas of Tamil Nadu. This project is being carried out in Kanchipuram, Tiruvannamalai and Tiruvallur districts in Tamil Nadu. Through this project, a total of 100,000 saplings were planted in the year FY2018. Since the inception of this project in 2013, we have planted 350,000 saplings and have been able to sequester over 5,500 tonnes of CO2 equivalent.
b) Renewable Energy: Use of Biogas Within the Climate change mitigation theme of Habitat
Apollo, we are promoting the use of biogas in villages near our manufacturing location in Limda, Gujarat. Apart from providing an eco-friendly alternative source of energy, the programme offers additional benefits of organic manure from slurry, utilization of cow dung (which is a solid waste) and savings accruing from fuel replacement from LPG to Biogas. We provide individual household type Biogas units. The project has been scaled up in the year FY2018 to add 140 more beneficiaries.
3. Does the Company identify and assess potential environmental risks? Y/N
Yes, environmental aspect & impact is assessed and reviewed periodically by the management. Organization strive to minimize impact on environment by developing environmental improvement programs and operational control procedures. All manufacturing plants are certified for ISO:14001: 2004 and environmental risk and controls reviewed by third party auditors.
4. Does the Company have any project related to Clean Development Mechanism? If so, provide details thereof, in about 50 words or so. Also, if Yes, whether any environmental compliance report is filed?
No
5. Has the Company undertaken any other initiatives on – clean technology, energy efficiency, renewable energy, etc.? Y/N. If yes, please give hyperlink for web page etc.
Yes, combining effective strategy with practical measures is key to achieving successful energy management. We focus on reducing our energy consumption by being energy efficient. There are several initiatives that were undertaken during the reporting period in the Indian Operations which resulted in energy savings of 36,715 GJ. We are continuously making efforts to achieve energy efficiency through improvements in our process design, conversion and retrofitting of equipment and use of energy efficient equipments.
6. Are the Emissions/Waste generated by the Company within the permissible limits given by CPCB/SPCB for the financial year being reported?
Emissions concentration across all our operating units are under prescribed limit.
82

Apollo Tyres Ltd Annual Report 2017-18
7. Number of show cause/ legal notices received from CPCB/SPCB which are pending (i.e. not resolved to satisfaction) as on end of Financial Year.
There were no show cause notices issued or pending in the reporting period.
Principle 7
1. Is your Company a member of any trade and chamber or association? If Yes, Name only those major ones that your business deals with.
Yes. The Company actively engages with Industry bodies. The major bodies in which the Company is a member are listed below –
a. Confederation of Indian Industry [CII];
b. Federation of Indian Chamber of Commerce and Industry [FICCI];
c. PHD Chamber of Commerce and Industry;
d. Society of Indian Automobile Manufacturers;
e. Automotive Tyre Manufacturers’ Association.
2. Have you advocated/lobbied through above associations for the advancement or improvement of public good? Yes/No; if yes specify the broad areas ( drop box: Governance and Administration, Economic Reforms, Inclusive Development Policies, Energy security, Water, Food Security, Sustainable Business Principles, Others)
Yes, The Company through various Industry associations, participates in advocating matters for the advancement of the Industry and Public Good. As a member of the Automotive Tyre Manufacturers Association (ATMA), the Company strives to be an active participant in policy making process of ATMA and also is a frequent participant in the meetings with the Government departments to discuss the challenges being faced by the industry in the ever-changing economic environment.
The Company has a Public and Regulatory Policy to ensure that the highest standards of business conduct are followed while engaging with aforesaid Trade associations/Industry bodies
Principle 8
1. Does the Company have specified programmes/initiatives/projects in pursuit of the policy related to Principle 8? If yes, details thereof.
Sustainability and social responsibility are inherent component of our corporate strategy. Our CSR activities are aimed at bringing a positive impact on the everyday lives of our stakeholders. They are also aligned with national and international development goals. Within this strategy, our CSR activities focus on two broad themes “Environment” and “Social” (which has health and community development).
Within the themes there are 4 core areas of work:
1. Health Programme for truck drivers
2. Solid Waste Management and Sanitation
3. Environment Conservation- Biodiversity & Climate Change
4. Community Development (Livelihood for women and farmers)
In addition to the above there are a few Local Initiatives across around our Manufacturing locations. These are Watershed Management and Renewable Energy Proliferation projects under Environment, and Road Safety Awareness, Computer Literacy under Social:.
Details of the project under our 4 core themes are as follows:
1. Health Programme for truck drivers: Preventive health care is an important dimension of health that needs significant attention and investment from all section of the society. At Apollo Tyres, Healthcare is identified as one of the key area of intervention, where health services are provided to the vulnerable section of the society such as truck drivers. This programme is one of the biggest and most inclusive initiatives under the Company’s CSR work. The programme provides health care services such as prevention of HIV-AIDS, Vision Care, Integration of Tuberculosis and other non communicable diseases such as diabetes, high blood pressure and general treatment facility.
The programme provides its services in the form of 27 healthcare centres in large transhipment hubs spanning across 18 Indian states. In addition to enhance connectivity, the organisation also launched mobile medical unit (Apollo Tyres Health Care Express) for the health check of truck drivers and allied population at two locations in Delhi and Nammakkal, Tamil Nadu.
Initiatives under health programme: a) HIV-AIDS Awareness & Prevention Programme:
India has over 2.01 million individuals living with this life threatning disease and now, this epidemic is rapidly spreading from the vulnerable population to general population specially the youth. The organisation recognised this as a threat to society and business , and started a fosussed programme to address this issue in 2001. The service provided under HIV Awareness and Prevention includes Behaviour Change Communication (BCC), Sexually Transmitted Infection (STI) Diagnosis and Treatment, Counselling, Condom Promotion, Integrated Counselling Testing Centre (ICTC) support and awareness through peer educators.
b) Vision Care: Vision testing services are a part of the Health Care Centres, where eye checkups are conducted. Periodic eye check up camps are also organised at other locations. Spectacles are distributed at low cost rate to the people identified with refractive error issues. Cataract patients are linked with nearby hospitals for further treatment.
c) Awareness on Tuberculosis (TB): There is an associated risk factor amongst the people living with HIV and the risk of catching the infection of TB is 16-27 times greater. Truck drivers due to their nomadic lifestyle are more prone to this disease. To ensure the well-being of its customer, the organisation started a pilot project on generating awareness on TB at Delhi location in partnership with Revised National Tuberculosis Programme (RNTCP). The initiative offers services like sputum testing, linking beneficiaries found positive with (DOTs) facility and conducting regular awareness sessions in order to prevent TB.
d) Other Non-Communicable Diseases: Based on the everyday findings from our outpatient department (OPD) at each health care centre, Diabetes and High
83
Corporate Overview / Statutory Reports / Financial Statements

Blood Pressure were identified as two significant risks that challenge truck drivers. In order to address the problem the organisation added testing facility for both the risks
e) General Healthcare and Treatment: There are other generic treatment facilities also provided at each healthcare centre such as fever, cough, cold, flu and other basic first aid features.
In the reporting year total 529,717 people were outreached from awareness activities out of which 118,913 people received treatment facility. There is 40% increase in the people treated from the reporting year FY2017. Out of the total treated in the reporting year FY2018, 39,914 people opted for HIV testing, 52,793 for vision screening and 15,021 for diabetes testing.
2. Solid Waste Management and Sanitation (SPARSH): Under this initiative solid waste management and recycling projects have been initiated. These include Clean My Transport Nagar (CMTN), Clean My Village (CMV), Sanitation project and End of Life Tyre playgrounds. These programmes are running under the umbrella SPARSH, Swachh Banao - Our endeavour to promote Waste Conscious Societies in a resource constrained Habitat and Hygienic Lifestyle by Crusading against Open Defecation.
SPARSH stands for –
S – Segregate Waste; P – Practice Composting; A – Awareness Generation; R – Reduce, Reuse & Recycle; S – Safe Sanitation; H – Hygiene for All The strategy of SPARSH remains to engage with its stakeholders create awareness on the 3 R’s, i.e., Reduce, Reuse and Recycle.
In the reporting year, total waste collected from CMTN & CMV is 2084.5 Metric Ton (MT) out of which 198.1 MT was biodegradable and 1886.4 MT was non biodegradable waste. Total 22,488 people were outreached from awareness generation and 10,805 people were outreached from door to door waste collection service.
To support Swachh Bharat Mission, total 324 individual household toilets were constructed at Chennai and Andhra Pradesh location in the reporting year. Further, one End of life Tyre playground was constructed at Chennai location. The playground used 130 End of Life tyres to construct various play structures.
3. Environment Conservation - Biodiversity & Climate Change: The organisation is conscious about the environmental sustainability therefore initiated projects related to biodiversity conservation and climate change mitigation such as Afforestation project at Tamil Nadu and Mangrove conservation project at Kerala.
Afforestation project is aimed at carbon sequestration through tree plantation. The project is being carried out in Kancheepuram, Tiruvanamalai and Tiruvallur districts in Tamil Nadu region. Through this project the organisation has planted a total of 350,000 teak and red sandal trees for emission reduction. Of these, 100,000 trees were planted in the reporting year. As per estimation, around 5,500 CO2
has been sequestered from these trees. Total area brought under social forestry is over 800 acres with the involvement of 306 farmers.
Another important project, Mangrove conservation, has been initiated in partnership with Wildlife Trust of India in Kannur region of Kerala. The Kannur Kandal Project – ‘kandal’ being the Malayalam word for mangroves – aims to ensure the survival of existing mangroves and increase the acreage of such habitats across Kannur, potentially making it a prototype for other coastal districts of Kerala and a model for the rest of the country. In the reporting year, Mangrove National Conclave was organised in December 2017. It was in partnership with Wildlife Trust of India, International Union for Conservation of Nature (IUCN). It witnessed a participation of 200 delegates from Corporates, Government Institutions, Academia. As a result of the awareness activities in the project, a total of 10,000 people were outreached in FY2018.
4. Community Development (Livelihood for women and farmers): Under this initiative underprivileged Women are trained on agriculture and non agriculture based livelihood activities so that they engage in income generation initiatives at their door step. The project follows a two way approach. First is formation of Self Help Group Formation (SHGs) or strengthening the already formed SHGs for promoting the habit of monthly savings. Second is to impart vocational and agriculture based trainings for income generation.The main objective of this initiative is to create livelihood opportunities and develop entrepreneurship capabilities of underprivileged women. The training includes SHG management, book keeping, financial literacy and awareness on women rights.
Vocational skill training includes apparel making, jewellery designing, nursing, beautician, housekeeping, Khakhra making, sanitary napkin, rubber sheet making and others. The trained beneficiaries are further linked with the market and service sector for employment.
In the reporting year total 947 women were outreached from livelihood initiative, out of which 618 women were trained in income generation and 264 have started income generation activities. These beneficiaries are further benefitted by our Biogas initiative which is detailed in the local initiatives.
The project also supports women and farmer dependent on agriculture as source of livelihood. This project operates in 20 villages of Waghodia Taluka, Vadodara-Gujarat and one village (Eraiyur- Chennai, Tamil Nadu). The initiative focuses on supporting farmers by training them on modern techniques and ways to increase agricultural productivity that would lead to improved agricultural practices and better crop yield. Basic training related to seed selection, preparation of land, soil testing, organic compost making, methods of irrigation, kitchen gardening practices and others are delivered .The project also offers services related to livestock care and management. Awareness Programmes related to livestock care management practices and breeding camps are also organised under this initiative.
Total 1,393 women and 1,473 male farmers were outreached under sustainable agriculture initiative through trainings and awareness activities.
In addition to the above four core themes, within the radius of 25-30 kms of our manufacturing locations, various local initiatives are implemented which are based on local stakeholder requirement. Details of such initiatives are below:
a) Watershed Management: Enhancement of water availability is identified as a key initiative under the
84

Apollo Tyres Ltd Annual Report 2017-18
environmental sustainability journey. The project focuses currently on addressing the issue of shortage of potable water sources in vulnerable communities. Chennai being water starved area , Apollo has piloted a purified drinking water project in the year 2015 for communities around our Chennai plant. 300 households (around 1,200 beneficiaries) are receiving directly water from the plant.
Eco restoration and improvement of water bodies in the community is another project under watershed management theme aimed at restoring and enhancing the aqua-biodiversity. Pond restoration project is implemented at our locations in Chennai, Limda and Perambra. The activity includes water quality assessment, cleaning, deepening and bunding of the ponds. It also involves development of surroundings around the pond area. A total of 5 ponds were constructed in the reporting year. Around 5,000 people at all locations are directly benefitting from the ponds.
Chalakudy River conservation (Kerala) is yet another project under this theme, which aims to raise awareness on importance of rivers in supporting aquatic biodiversity and human habitats. 10 km stretch of the river is identified for river conservation and awareness generation. Around 200 students were outreached from awareness activities such as rally, cleaning drive and others.
b) Computer Literacy Project: To impart computer knowledge and enhance digital literacy skills, a computer literacy project was launched for the school children of Mathur, Orgadam, Sennakupam, Eraiyur and Vallakotai villages near Chennai plant in the year 2016. From the outcomes of the ongoing project and the request from other neighboring schools, the same project was extended to Serappanancheri Middle School, Chennai. In the reporting year 420 students were outreached.
c) Road Safety Awareness Programme: The road safety programme is initiated at 15 km stretch of Chalakudi- Thrissur highway of Perambra location. It focuses on two aspects – installation of road safety signboards for road users and engaging with school students for awareness generation . The main aim of this initiative is to sensitise the road users and school students regarding road safety and traffic rules. This will help in reducing road accidents. In the reporting year 35 signboards were installed and 1,314 people were outreached out of which 689 were students.
d) Bio-gas Use Proliferation: The organisation is promoting the use of Biogas in its communities around the Limda plant in Gujarat. The women who are engaged in Income generation initiatives through our programme are further benefitted through this project by saving the cost and time in collecting the firewood. The use of Renewable energy proliferation is a key to address the issue of climate change, and this project supports the cause. In the reporting year, 140 biogas units were installed as a part of the initiative.
Further, the organisation also undertakes philanthropic initiatives – under Taru Foundation. These are highlighted below.
1) Supporting a hospital for underprivileged.
2) Supporting education for children.
3) Monthly ration support to the underprivileged.
4) Support the education of the disabled children.
For more information on CSR please refer to CSR booklet under the policy and document section on Apollo’s Responsibility page, link: https://corporate.apollotyres.com/en-in/responsibility/overview/
2. Are the programmes/projects undertaken through in-house team/own foundation/external NGO/government structures/any other organization?
The programs are carried out by the organisation’s own Foundation - Apollo Tyres Foundation (ATF).
Apollo Tyres, being conscious of the triple bottom line coherence (people, planet and profit), it has developed a CSR framework identifying and prioritizing its key stakeholders. This framework clearly revolves around the principle of three I’s i.e. to Involve, Influence and Impact its key stakeholders-Customers, Employees, Supply Chain Partners, Community and Environment.
All the CSR activities of Apollo Tyres are routed from Apollo Tyres Foundation (ATF) which was registered in 2008. The clear objective of CSR activities is to have a positive impact on everyday lives of our key stakeholders and on business. The implementation of the projects is with the help of expert organisations and local Non Governmental Organisations.
The CSR Programmes and activities are aligned to national and international development goals. . These are under two broad themes “Environment” and “Social” (which has health and community development).
3. Have you done any impact assessment of your initiative?
The programme is evaluated by the external agencies. External research agencies are hired to undertake the mid-line/end line assessments.
Monitoring is undertaken on monthly basis and a monthly report is compiled across centres/locations. Baseline survey is carried out before starting any project. Mid line assessment is conducted after completion of 3 years of project and end line research is conducted after completion of 5 years to understand the impact of the project.
We undertook impact assessment of three health care centres (Agra, Delhi and Kanpur). Major findings are given below:
> ATF has played an important roles in disseminating the information across locations, related to HIV-AIDS awareness and prevention compared to advertisement and other media.
85
Corporate Overview / Statutory Reports / Financial Statements

> Allied population and peer educators (dhaba owner, teas stall owner, mechanic, vendor etc) play a major role in reaching out to the truck drivers and spreading awareness of ATF’s intervention.
> At Kanpur location there is a significant increase (from 26% to 92%) in reaching out to trucker population by peer educator in comparison to 2012.
> ATF & TV/radio has emerged as an important source of awareness generation amongst truck drivers.
> Widespread awareness of the causes and impacts of HIV amongst all.
> Apollo has emerged to be the most likeable brand due to its social activities for its customers and high quality products.
4. What is your Company’s direct contribution to community development projects- Amount in INR and the details of the projects undertaken?
Broad Areas of CSR Programs Amount in Million
Ensuring environmental sustainability 61.08
Eradication hunger, poverty & malnutrition 2.33
Livelihood enhancement projects 36.37
Promoting Education 11.96
Promoting Preventive Health 93.67
Total 205.41
Administrative Cost (5% over total expense) 10.27
Grand Total 215.68
5. Have you taken steps to ensure that this community development initiative is successfully adopted by the community? Please explain in 50 words, or so.
Biogas is considered to be a boon for the rural women. It not only helps in producing clean fuel from waste like cow dung, food waste, dry plants but it also helps producing the high quality manure from the left slurry. The bio gas project was initiated as a pilot project in the villages of Waghodia Taluka at Baroda location in the year 2016, for our women involved in income generation activities (IGA). The project involved installation of 50 biogas units. After reviewing the outcomes of the 50 biogas units, other community members involved in IGA also demanded the installation of more units. In the year FY2018 the organisation installed 140 units of biogas. Biogas unit not only provides clean fuel to the community, but also saves time for women, which they can use it for their IGA or spend with family.
Principle 9
1. What percentage of customer complaints/consumer cases are pending as on the end of financial year?
The Company has a robust system for addressing customer complaints. As on March 31, 2018, there are no Customer Complaint pending. The total number of Legal Cases pending are 250 at Pan India level.
2. Does the Company display product information on the product label, over and above what is mandated as per local laws? Yes/No/N.A. /Remarks(additional information).
The Company adheres to all legal requirements with respect to product labelling and display of product information. All data as
per current laws are available on the tyre sidewall. Product labels are available on PCR Tyres as of now basis current laws in India.
3. Is there any case filed by any stakeholder against the Company regarding unfair trade practices, irresponsible advertising and/or anti-competitive behavior during the last five years and pending as on end of financial year. If so, provide details thereof, in about 50 words or so.
In various Consumer cases complainants allege about unfair trade practice by Apollo on warranty policies. No indent of such complaint in Competition Commission except a pending CCI case initiated on the complaint of a dealers’ federation i.e. AITDF.
4. Did your Company carry out any consumer survey/consumer satisfaction trends?
The Company regularly engages with customers to get their feedback on the product and carries out surveys to gauge their satisfaction level.
Background and Objective: > With the presence of multiple players in the market- Indian
as well as global, customers have more choices and are keenly evaluating their brand experience across touch points.
> Thus it becomes imperative for the brands to effectively manage customer experience across product and service touch points which will not only drive repeat purchases but also act as brand proponent.
> To measure customer experience which can provide a strategic direction in terms identifying key priorities to improve customer satisfaction.
During the year under review, the Company has carried out a customer satisfaction study for truck customers.
Following are the objectives of the study: > Gauging the strength of relationship between Apollo and its
Customers, Dealers.
> Understanding the drivers of satisfaction of customers and evaluating Apollo Tyres performance on them vis-à-vis competition brands.
> Arriving at the action plan keeping in mind relative performance across touch-points as also competition performance.
> Assess the strength of customer relationship.
> Gauge importance / performance expectation attached to each touch point.
> Arriving at Company level / department level action plan keeping in view expectations as well as relative performance.
For and on behalf of Board of Directors
Place: Gurgaon ONKAR S. KANWARDate: May 10, 2018 Chairman & Managing Director
86

Apollo Tyres Ltd Annual Report 2017-18
ANNEXURE IV
CONSERVATION OF ENERGY, TECHNOLOGY ABSORPTION, FOREIGN EXCHANGE EARNINGS AND OUTGO
A) CONSERVATION OF ENERGY
(i) The steps taken or impact on conservation of energy Energy Management Standard (EnMS 50001) deployment
activities were strengthened across Apollo plants to improve and sustain energy performance at work Centre. Twin approach of effective measures introduced to control variable energy consumption aligning to market requirement along with activities taken up for reducing the fixed consumption by deployment of leaning helped to reduce energy usage and cost.
The Synergy Projects (energy consumption reduction projects) identified for deployment across locations are nearing completion. Real time measurement, monitoring & evaluation of energy data has become part of Daily Work Management (DWM) activity.
Energy Projects & activities taken up :
> Source Mapping at Work Centre to arrive at monitoring indicators.
> Bench Marking of Performance Indicators to identify opportunities.
> Study of Steam Distribution network to identify gap & opportunity.
> LED deployment across plants to reduce fixed consumption.
> Forward planning for optimized usage of energy sources (Direct & In-Direct) to control cost.
> Monitoring, analysis and control of fixed consumption in utilities.
> Horizontal deployment of activities to improve power quality in internal power grid.
> Improvement opportunity deployed at coal fired boilers to reduce fixed consumption and control critical performance parameters.
> Projects for Recovery of waste heat identified and closed.
(ii) Steps taken by the Company for utilizing alternate sources of energy
Planned & Optimized usage of different sources of energy led to greater flexibility at operations and also lower CO2
emission from the tire manufacturing process.
The current financial year Solar Energy usage was sustained for the manufacturing process with capacities built up earlier. Over all potential of Solar Energy is mapped and detailing completed to scale up capacity at the right moment.
(iii) Additional investment and proposal for reduction of energy usage: (Investment in Energy Front to reduce cost and consumption)
> Consolidation of Power Purchase Agreement from energy source providers to ensure stability in cost and usage.
> Deployment of energy efficient products to reduce fixed consumption.
> Power Quality Improvement at high load distribution centers to improve availability.
> Evaluation of real time data at work Centre to control variable consumption and identify new energy indicators.
> Segmentation concepts to bring flexibility for HVAC requirement.
> Enhancement of condensate recovery and waste heat recovery to reduce generation.
B) TECHNOLOGY ABSORPTION
(i) Efforts made towards Technology Absorption Apollo values Technology as a key pillar to support business
growth and believes that leadership in technology only can sustain business leadership. R&D Asia had initiated and successfully completed many projects that can positively impact our business in future. Material research group has completed several novel projects like puncture free two wheeler tyres using novel sealant technology and also embarked on the development of suitable polymers essential for various components of airless non Pneumatic tyres. Projects related to Silane treated Kaolin clays being executed to lower hysteresis losses in tread compounds. Silicone rubber based holder was developed for TPMS which enhances compatibility. Valve based TPMS with a lower cost (than all current products), is nearing commercialization which will be a boon for vehicle drivers. A number of projects involving RFID technologies are currently under implementation. Supply Chain Management (SCM) is one area where RFID technologies plays a major role in going “Digital “. Another fascinating work is the task of embedding a RFID tag permanently into a tyre which enables a “tyre with a unique identifier with an anti-theft mechanism”. Several new materials sources were also scrutinized, and approved after qualifying the EU regulatory requirement like REACh, PAH etc.
Apollo has a three pronged approach in research towards material and tyre compound development. Adopting new ways in compounding technology using new generation materials to meet the ever growing regulations with respect to Environmental protection, Evaluation of new generation functional materials to explore quantum jump in technology and product performance and Exploring the possibility of using nano-structured materials in tyre compounds for increased durability with energy efficiency in rolling. Research in these areas can make the Company ready for future with better capabilities to meet any evolving regulatory and performance requirements.
World is passing through an age of disruptive changes that are happening in every field of business. These changes are particularly enabled by electronics and communication technology. Major disruption is happening in automobile sector and tyres being the key component of automobiles, our Company has taken several initiatives that will keep us future ready. Electrification of automobiles is one such change and Apollo has started its efforts towards developing suitable products to support electric mobility.
(ii) New product development Notwithstanding the efforts towards radialization, cross ply
tyres will still be preferred in many applications in India and abroad. Apollo has developed a product in this category for
87
Corporate Overview / Statutory Reports / Financial Statements

bus application that will meet Euro 1 standards for rolling resistance and this product is currently exported to different markets abroad.
Understanding the advantage of using rib tyres for free rolling positions of the trailers, R&D developed a bias tyre christened -AXVT (Apollo ‘Xtra Value Trailer tyre) that will be of specific use in trailer applications. Tyre failures related to defects in flaps have been a general issue in the market and by developing a new series of optimally profiled flaps, R&D could almost eliminate flap related defects in tyre performance.
Apollo had significant growth in PCR OEM market in India and achieved undisputed leadership position by supplying more than 450,000 tyres to OEM per month in India and also in the fastest growing premium Hatch and Compact SUV segment. Majority of the new vehicle launches in India were on Apollo, also for premium vehicles of respective OEMs. Apollo is the sole supplier for some large selling vehicles in India and also single source for many ongoing development projects for some of the prestigious models of Renault, Ford, Suzuki, Skoda, Fiat etc. Achieved global supplier status from Suzuki, Hyundai. Achieved preferred supplier status from Suzuki, Mahindra, Renault, Nissan, Skoda, VW and Toyota. New OEMs in India like Kia, Peugeot/Citroen etc. have preferred Apollo as a development partner.
Apollo has also continued it’s growth in replacement market with launch of Altrust range for Premium Van application. SUV (Apterra HT2) and 4G life tyres range expanded to capture more vehicle segments. Product performance improved significantly to achieve comparable identity with the performance leader in India. Heavy cost drive from R&D made OE business reasonably profitable and replacement business significantly profitable. OE conversion has also improved significantly to deliver benefit in replacement business out of rub off from OE business.
R&D capability build up continued with development of new materials to achieve a better balance between Rolling Resistance, Wet traction and Wear life and helped the Company to offer better performance proposition and demonstrate technology leadership to OEMs. Development process and systems improved to reduce number of iteration loops and achieve faster and cost effective development. Product technology improvement ensured all products to meet the European label Stage 2 regulation requirements.
Apollo has launched 4 tyres in South Africa for underground mine applications and developed port tyres for markets in India, Ghana and south-east Asia markets. Tyres for compact tractor range for orchard and intercultural operations were developed and launched successfully. Apollo’s new tyre for hard soil farming and harvesting application has quickly gained the perception as a winner product and an impressive market share, shortly after its introduction.
Many OEMs such as M&M and John Deere launched their models fitted with Apollo’s products. R&D has achieved a major breakthrough by developing Very high Flexion technology, which is a low inflation tyre technology aimed
at minimal soil compaction and launched its Agri radial tyre in European markets.
Apollo had developed Low RR technology for TBR and created products for truck and busses which are successfully tested against Stage II requirements of regulations. R&D has created the entire range of all steel radial tyres for light truck and light commercial applications and also an economy range of TBR products that are introduced in select markets in another brand name owned by the Company. This will help the Company to satisfy price sensitive customers and to grow business in such markets.
India is one of the fastest growing markets for 2 wheeler tyres where the high end sports motorcycle business is poised for unprecedented levels of growth. Sensing this potential, Apollo had developed 2 wheeler tyres in Acti series and successfully introduced to the market in 2016. The Company has continued its development activities and pioneered the zero degree steel belted radial motorcycle tyre technology in India and created products in the shortest possible development time. This technology is equivalent to the latest technology available anywhere in the globe and the Company is planning to develop products for Europe market very soon.
Development of motocycle radials will make Apollo an effective full range player for global markets.
(iii) Benefits derived like product improvement, cost reduction or import substitution
Development of alternative and novel materials & technologies helped in enhancing product quality. Various productivity improvement activities were implemented like reducing mixing cycle; improvement in extrusion speed, optimization of cure cycle etc. These improvements have considerably improved the performance of our current products in market particularly in Agri and Steer tyres of Commercial vehicles.
Research projects is also undertaken to improve recycling of used tyres and re-use back into the tyre. R&D’s Retread Research and Training wing is supporting the user community by providing training in efficient re-treading and end of life tyre usage
(iv) In case of imported technology (imported during last 3 years reckoned from the beginning of the financial year),
a) Details of technology imported.
b) Year of import.
c) Whether the technology been fully absorbed.
d) If not fully absorbed, areas where absorption has not taken place and reasons therefore.
No technology was imported in the current year. The very purpose of creating our own R&D was to attain self-sufficiency in technology and Apollo can pride in the fact that this objective is ably met by the efforts of the two R&D centres and their satellite centres in Europe and India.
88

Apollo Tyres Ltd Annual Report 2017-18
(v) Expenditure incurred on Research and Development
(` in Million)
a) Capital 307.31
b) Deferred Revenue Expenditure -
c) Revenue 1,252.45
d) Total 1,559.76
e) Total R&D expenditure as a % turnover 1.49%
C) FOREIGN EXCHANGE EARNINGS AND OUTGO
Foreign Exchange Earnings (` in Million)
On account of direct - export sales from Apollo Tyres Ltd (FOB value) 8,954.90
On account of royalty from Foreign Subsidiary Companies 56.79
On account of interest received from Foreign Subsidiary Companies 114.87
On account of Cross Charge of Management Expenses from Foreign Subsidiary Companies 69.03
On account of Reimbursement of Expenses from Foreign Subsidiary Companies 537.12
Foreign Exchange outgo (other than CIF value of imports) 3,035.06
For and on behalf of Board of Directors
Place: Gurgaon ONKAR S. KANWARDate: May 10, 2018 Chairman & Managing Director
89
Corporate Overview / Statutory Reports / Financial Statements

ANNEXURE V
FORM NO. MGT 9EXTRACT OF ANNUAL RETURN
as on financial year ended on MARCH 31, 2018Pursuant to Section 92(3) of the Companies Act, 2013 and Rule 12(1) of the Companies (Management & Administration ) Rules, 2014.
I REGISTRATION & OTHER DETAILS
i CIN L25111KL1972PLC002449ii Registration Date September 28, 1972iii Name of the Company Apollo Tyres Ltdiv Category/Sub-category of the Company Public Company (Limited by shares)v Address of the Registered office & contact details 3rd Floor, Areekal Mansion, Near Manorama Junction, Panampilly
Nagar, Kochi- 682036, Kerala Ph:-91 484 4012046, 47vi Whether listed company Yesvii Name , Address & contact details of the Registrar &
Transfer Agent, if any.Apollo Tyres Ltd. Apollo House, 7, Institutional Area, Sector-32, Gurgaon, Haryana- 122001
II PRINCIPAL BUSINESS ACTIVITIES OF THE COMPANY
SL No
Name & Description of main products/servicesNIC Code of the Product /service
% to total turnover of the Company
1 Tyres, Tubes and Flaps 25111 100
III PARTICULARS OF HOLDING , SUBSIDIARY & ASSOCIATE COMPANIES
Sl No.
Name & Address of the Company CIN/GLNHolding/ Subsidiary/ Associate
% of Shares
Held
Applicable Section
1 Apollo ( South Africa) Holdings (Pty) Ltd - 150 Denne Road, Hughes, Boksburg, Gauteng, 1459.
Foreign Company Subsidiary 100 2(87)
2 Apollo Tyres (Cyprus) Pvt. Ltd. - Zinonos Sozou, 12, P.C. 1075, nicosia, Cyprus
Foreign Company Subsidiary 100 2(87)
3 Apollo Tyres (Greenfield) B.V. - Ir. Schiffstraat 370, 7547 RD Enschede
Foreign Company Subsidiary 100 2(87)
4 Apollo Tyres (Hungary) Kft. - 3212 Gyöngyöshalász, Apollo út 106 Foreign Company Subsidiary 100 2(87)5 Apollo Tyres Cooperatief U.A- Ir. Schiffstraat 370, 7547 RD
EnschedeForeign Company Subsidiary 100 2(87)
6 Apollo Tyres AG- Mellingerstrassen 2a, 5400 Baden, Switzerland Foreign Company Subsidiary 100 2(87)7 Apollo Tyres Global R & D B.V.- Colosseum 2, 7521 PT Enschede Foreign Company Subsidiary 100 2(87)8 Apollo Tyres (Middle East) FZE - Building No-3, Galleries- Office
No- GB030603, Jebel Ali- Dubai, UAEForeign Company Subsidiary 100 2(87)
9 Apollo Tyres Holdings (Singapore)Pte. Ltd- 9 Temasek Boulevard, #42-01, Suntec Tower Two, Singapore 038989
Foreign Company Subsidiary 100 2(87)
10 Apollo Tyres (Thailand) Limited-23FL, KPN Tower, 719, Rama-9 Road, Bang Kapi, Huay Kwang, Bangkok-10310
Foreign Company Subsidiary 100 2(87)
11 Apollo Tyres Do (Brasil) Ltda.- Rua Marques de Paranaguá, 348 9º andar Consolação São Paulo - CEP 01.303-050 SP
Foreign Company Subsidiary 100 2(87)
12 Apollo Tyres B.V.- Ir. Schiffstraat 370, 7547 RD Enschede Foreign Company Subsidiary 100 2(87)13 Apollo Tyres (UK) Pvt. Ltd- 3rd Floor, Maddox House I, Maddox
Street & 215-221, Regent Street London WIS 2PZForeign Company Subsidiary 100 2(87)
14 Apollo Tyres (Malaysia) Sdn Bhd - Level 21, Suite 21.01, The Gardens South Tower, Mid Valley City, Lingkaran Syed Putra, 59200 Kuala Lumpur
Foreign Company Subsidiary 100 2(87)
15 Apollo Tyres (Germany) GmbH - Am Prime Park 17, 65479 Raunheim
Foreign Company Subsidiary 100 2(87)
16 Reifencom GmbH, Bielefeld - Am Stadtholz 24-26, D-33609 Bielefeld
Foreign Company Subsidiary 100 2(87)
17 Reifencom GmbH, Hannover - Südfeldstr. 16, D-30453 Hannover Foreign Company Subsidiary 100 2(87)18 Reifencom Einkaufsgesellschaft, mbH & Co. OHG, Hannover -
Südfeldstr. 16 D-30453 HannoverForeign Company Subsidiary 100 2(87)
19 Reifencom Tyre (Qingdao) Co., Ltd. - Room 306, International News Center No.50 Hong Kong Middle Road, Shinan Dist Qingdao 266000 P.R. China
Foreign Company Subsidiary 100 2(87)
20 Apollo Tyres (London) Pvt Ltd- Third Floor, Maddox House 1 Maddox street & 215-221 Regent Street London WIS 2PZ
Foreign Company Subsidiary 100 2(87)
21 Apollo Vredestein B.V.- Ir. Schiffstraat 370, 7547 RD Enschede Foreign Company Subsidiary 100 2(87)
90

Apollo Tyres Ltd Annual Report 2017-18
Sl No.
Name & Address of the Company CIN/GLNHolding/ Subsidiary/ Associate
% of Shares
Held
Applicable Section
22 Apollo Vredestein Kft.- Alkotás út 39/c 1123 Budapest Foreign Company Subsidiary 100 2(87)23 Apollo Vredestein Belux- Buro & Design Center, Heizel Esplanade
bus 6 1020 BrusselForeign Company Subsidiary 100 2(87)
24 Vredestein Consulting B.V.- Ir. E.L.C. Schiffstraat 370, 7547 RD Enschede
Foreign Company Subsidiary 100 2(87)
25 Finlo B.V.- Ir. Schiffstraat 370, 7547 RD Enschede Foreign Company Subsidiary 100 2(87)26 Vredestein Marketing B.V- Ir. E.L.C. Schiffstraat 370, 7547 RD
EnschedeForeign Company Subsidiary 100 2(87)
27 Vredestein Marketing B.V & Co. KG- Schulzendorferstrasse 12, 12529 Schonefeld
Foreign Company Subsidiary 100 2(87)
28 Apollo Vredestein GesmbH- Seybelgasse 10-12, 1230 Wien Foreign Company Subsidiary 100 2(87)29 Apollo Vredestein Schweiz AG- Mellingerstrasse 2A, Postfach
2112, 5402 BadenForeign Company Subsidiary 100 2(87)
30 Apollo Vredestein S.R.L.- Via Edelweiss Rodriquez Senior n.3 int.13 47900 Rimini (RN)
Foreign Company Subsidiary 100 2(87)
31 Apollo Vredestein Ibérica S.A.- Cityparc Edificio Bruselas, Ctra. De Hospitalet 147-149, 08940 Cornella de Llobregat Barcelona
Foreign Company Subsidiary 100 2(87)
32 Apollo Vredestein (UK) Ltd.- 1 Beechwood, Cherry Hall Road, Kettering Business Park, Northants NN14 1UE
Foreign Company Subsidiary 100 2(87)
33 Apollo Vredestein Nordic AB- Flöjelbergsgatan 18, 431 37 MÖLNDAL, SWEDEN
Foreign Company Subsidiary 100 2(87)
34 Apollo Vredestein SAS- 59, Avenue Victor Hugo, 75116, Paris Foreign Company Subsidiary 100 2(87)35 Apollo Vredestein GmbH- Rheinstrasse 103, Vallendar Foreign Company Subsidiary 100 2(87)36 Apollo Vredestein Opony Polska sp. Z o.o.- Ul Prosta 32, 00-838
WarszawaForeign Company Subsidiary 100 2(87)
37 Apollo Vredestein Tires Inc- 1175 Peachtree Street NE 10th Fl. - Atlanta GA 30361, USA
Foreign Company Subsidiary 100 2(87)
38 S.C. Vredestein RO S.R.L.- 400071 Cluj-Napoca str.Zrinyi Miklos nr. 7/3-4, Cluj
Foreign Company Subsidiary 100 2(87)
39 Apollo Tyres Africa (Pty) Ltd - 150 Denne Road, Hughes, Boksburg, Gauteng, 1459.
Foreign Company Subsidiary 100 2(87)
40 Rubber Research LLC - Paracorp Incorporated, 2140 South DuPont Highway, Camden, DE 19934
Foreign Company Subsidiary 100 2(87)
41 Saturn F1 Pvt Ltd - 21 St Thomas Street, Bristol, BS1 6JS Foreign Company Subsidiary 100 2(87)42 Retail Distribution Holding B.V. - Herikerbergweg 5, 1101CN
AmsterdamForeign Company Subsidiary 100 2(87)
43 ATL Singapore Pte Ltd. 9 Temasek Boulevard, #42-01, Suntec Tower Two, Singapore 038989
Foreign Company Subsidiary 100 2(87)
44 Pressurite (Pty) Ltd. (RSA)- Unit 1 , Aviation Crescent, Airport City, 7490
Foreign Company Associate 28 2(6)
45 KT Telematic Solutions Pvt. Ltd., 2-1-D5 Stemuns Building, Salem Main Road, Sankari Taluk, Salem - 637301, Tamilnadu
U74999TZ2016PTC027629 Associate 14 2(6)
46 PAN Aridus LLC- PO Box 5134 Carefree, Arizona USA, 85377 Foreign Company Joint Venture
50 2(6)
IV SHAREHOLDING PATTERN (Equity Share capital Break up as % to Total Equity)
(i) Category-Wise Shareholding
Category of Shareholders
No. of Shares held at the beginning of the year No. of Shares held at the end of the Year
Demat Physical Total% of Total
SharesDemat Physical Total
% of Total Shares
% change during the
year
A. PROMOTERS(1) Indiana) Individual/HUF 1683010 0 1683010 0.33 983010 0 983010 0.17 (0.16)b) Central Govt. or State Govt. 0 0 0 - 0 0 0 - - c) Bodies Corporates 221049282 7450 221056732 43.43 227709666 7450 227717116 39.81 (3.62)d) Bank/FI 0 0 0 - 0 0 0 - - e) Any other 0 0 0 - 0 0 0 - - Sub Total (A) (1):- 222732292 7450 222739742 43.76 228692676 7450 228700126 39.98 (3.78)(2) Foreign - a) NRI- Individuals 1977000 0 1977000 0.39 1977000 0 1977000 0.35 (0.04)b) Other Individuals 0 0 0 - 0 0 0 - - c) Bodies Corp. 0 0 0 - 0 0 0 - - d) Banks/FI 0 0 0 - 0 0 0 - -
91
Corporate Overview / Statutory Reports / Financial Statements

Category of Shareholders
No. of Shares held at the beginning of the year No. of Shares held at the end of the Year
Demat Physical Total% of Total
SharesDemat Physical Total
% of Total Shares
% change during the
year
e) Any other… 0 0 0 - 0 0 0 - - Sub Total (A) (2) :- 1977000 0 1977000 0.39 1977000 0 1977000 0.35 (0.04)Total Shareholding of Promoter (A)= (A)(1)+(A)(2) 224709292 7450 224716742 44.15 230669676 7450 230677126 40.32 (3.82)B. PUBLIC SHAREHOLDING(1) Institutionsa) Mutual Funds 36790546 744700 37535246 7.37 106949282 738750 107688032 18.82 11.45 b) Banks/FI 4007022 647750 4654772 0.91 5926969 631500 6558469 1.15 0.23 c) Central govt 0 0 0 - 0 0 0 - - d) State Govt. 10000000 0 10000000 1.96 10000000 0 10000000 1.75 (0.22)e) Venture Capital Fund 0 0 0 - 0 0 0 - - f) Insurance Companies 0 0 0 - 0 0 0 - - g) FIIS 158111133 501880 158613013 31.16 138746512 499500 139246012 24.34 (6.82)h) Foreign Venture Capital Funds 0 0 0 - 0 0 0 - - Sub Total (B)(1):- 208908701 1894330 210803031 41.41 261622763 1869750 263492513 46.06 4.65 (2) Non Institutions a) i) Individual shareholders holding nominal
share capital upto `2 lakhs28543267 8082043 36625310 7.20 26191557 7027918 33219475 5.81 (1.39)
ii) Individuals shareholders holding nominal share capital in excess of ` 2 lakhs
1120000 0 1120000 0.22 1339310 0 1339310 0.23 0.01
b) Others (specify)NRIs 1722325 538740 2261065 0.44 1650998 409760 2060758 0.36 (0.08)Foregin National 0 0 0 - 0 0 0 - - Investor Education and Protection Fund Authority 0 0 0 - 2037549 0 2037549 0.36 0.36 Unclaimed Suspense A/c 1404300 0 1404300 0.28 300540 0 300540 0.05 (0.22)Others (balancing figure) 31862402 231920 32094322 5.58 38714039 208670 38922709 6.80 1.22 Sub Total (B)(2):- 64652294 8852703 73504997 14.44 70233993 7646348 77880341 13.61 (0.83)Total Public Shareholding (B)= (B)(1)+(B)(2) 273560995 10747033 284308028 55.85 331856756 9516098 341372854 59.68 3.82 C. SHARES HELD BY CUSTODIAN FOR GDRS
& ADRS0 0 0 0 0 0 0 0 -
Grand Total (A+B+C) 498270287 10754483 509024770 100.00 562526432 9523548 572049980 100.00 -
(ii) Share Holding of Promoters
Sl No.
Shareholders Name
Shareholding at the beginning of the year
Shareholding at the end of the year
% change in share holding
during the yearNo. of shares
% of total shares of the
Company
% of shares pledged/
encumbered to total shares
No. of shares
% of total shares of the
Company
% of shares pledged/
encumbered to total shares
1 Neeraj Consultants Pvt. Ltd. 72138999 14.17 1.05 73827161 12.91 1.67 (1.27)2 PTL Enterprises Ltd. 0 - 0 1550000 0.27 0 0.27 3 Apollo Finance Ltd. 36759650 7.22 1.34 39381872 6.88 2.05 (0.34)4 Sunrays Properties & Investment Co. Pvt. Ltd. 35725648 7.02 3.46 36307648 6.35 2.34 (0.67)5 Apollo International Ltd. 984485 0.19 0 984485 0.17 0 (0.02)6 Motlay Finance Pvt. Ltd. 16724817 3.29 1.41 16942817 2.96 1.01 (0.32)7 Sacred Heart Investment Co. Pvt. Ltd. 24435180 4.80 0 24435180 4.27 0 (0.53)8 Classic Autotubes Ltd. 14493500 2.85 0 14493500 2.53 0 (0.31)9 Ganga Kaveri Credit & Holding Pvt. Ltd. 7688380 1.51 0 7688380 1.34 0 (0.17)10 Indus Valley Investment & Finance Pvt. Ltd. 5076040 1.00 0 5076040 0.89 0 (0.11)11 Mr. Onkar S. Kanwar 800000 0.16 0 100000 0.02 0 (0.14)12 Global Capital Ltd. 3627158 0.71 0 3627158 0.63 0 (0.08)13 Ms. Shalini Chand Kanwar 1977000 0.39 0 1977000 0.35 0 (0.04)14 Kenstar Investment & Finance Pvt Ltd. 1842280 0.36 0 1842280 0.32 0 (0.04)15 Mr. Neeraj Kanwar 671380 0.13 0 671380 0.12 0 (0.01)16 Mr. Raaja Kanwar 180880 0.04 0 180880 0.03 0 (0.00)17 Ms. Simran Kanwar 18500 0.00 0 18500 0.00 0 (0.00)18 Ms. Taru Kanwar 12250 0.00 0 12250 0.00 0 (0.00)19 Amit Dyechem Pvt. Ltd. 1560595 0.31 0 1560595 0.27 0 (0.03)
Total 224716742 44.15 7.26 230677126 40.32 7.07 (3.82)
92

Apollo Tyres Ltd Annual Report 2017-18
(iii) Change in Promoters’ Shareholding
Sl No.
Folio / DP-Id & Client Id Name of Shareholder
Shareholding at the beginning of the year
Date of change in
Shareholding
Increase/ decrease in
Shareholding
Reason for Increase/Decrease
Cumulative shareholding during
the year
No. of Shares
% of Total
Share Holding
No. of Shares
% of total Share
holding
1 N-IN300118/10148832 Mr. Neeraj Kanwar 671380 0.13 01-04-2017 - - 671380 0.13
31-03-2018 - - 671380 0.12
2 N-IN300118/10150311 Ms. Simran Kanwar 18500 0.00 01-04-2017 - - 18500 0.00
31-03-2018 - - 18500 0.00
3 N-IN300118/10150320 Mr. Raaja R S Kanwar 180880 0.04 01-04-2017 - - 180880 0.04
31-03-2018 - - 180880 0.03
4 N-IN300118/10150354 Mr. Onkar S Kanwar 800000 0.16 01-04-2017 - - 800000 0.16
12-05-2017 -800000 Transfer 0 0.00
16-02-2018 100000 Transfer 100000 0.02
31-03-2018 - - 100000 0.02
5 N-IN300118/11257309 Ms. Taru Kanwar 12250 0.00 01-04-2017 - - 12250 0.00
31-03-2018 - - 12250 0.00
6 N-IN300118/11277023 Ms. Shalini Kanwar Chand
1977000 0.39 01-04-2017 - - 1977000 0.39
31-03-2018 - - 1977000 0.35
7 P-0014890 Sunrays Properties & Investment Co. Pvt. Ltd.
6450 0.00 01-04-2017 - - 6450 0.00
31-03-2018 - - 6450 0.00
8 P-0023027 Global Capital Ltd. 1000 0.00 01-04-2017 - - 1000 0.00
31-03-2018 - - 1000 0.00
9 N-IN300095/10124640 Sunrays Properties & Investment Co Pvt. Ltd.
35719198 7.02 01-04-2017 - - 35719198 7.02
19-05-2017 582000 Transfer 36301198 6.35
31-03-2018 - - 36301198 6.35
10 N-IN300095/10124658 Ganga Kaveri Credit & Holdings Pvt. Ltd.
7688380 1.51 01-04-2017 - - 7688380 1.51
31-03-2018 - - 7688380 1.34
11 N-IN300095/10124666 Global Capital Ltd. 3626158 0.71 01-04-2017 - - 3626158 0.71
31-03-2018 3626158 0.63
12 N-IN300118/10141089 Motlay Finance Pvt. Ltd. 16724817 3.29 01-04-2017 - - 16724817 3.29
19-05-2017 218000 Transfer 16942817 2.96
31-03-2018 16942817 2.96
13 N-IN300118/10141101 Sacred Heart Investment Company Pvt. Ltd.
24435180 4.80 01-04-2017 - - 24435180 4.80
31-03-2018 - - 24435180 4.27
14 N-IN300118/10148066 Apollo International Ltd.
984485 0.19 01-04-2017 - - 984485 0.19
31-03-2018 - - 984485 0.17
15 N-IN300118/10182874 Apollo Finance Ltd. 36759650 7.22 01-04-2017 - - 36759650 7.22
09-03-2018 1200528 Transfer 37960178 6.64
23-03-2018 387821 Transfer 38347999 6.70
31-03-2018 1033873 Transfer 39381872 6.88
16 N-IN300118/11621581 PTL Enterprises Ltd. 0 0.00 01-04-2017 - - 0 0.00
17-11-2017 25000 Transfer 25000 0.00
24-11-2017 176740 Transfer 201740 0.04
01-12-2017 148260 Transfer 350000 0.06
08-12-2017 180000 Transfer 530000 0.09
15-12-2017 160000 Transfer 690000 0.12
22-12-2017 70000 Transfer 760000 0.13
29-12-2017 99980 Transfer 859980 0.15
05-01-2018 150020 Transfer 1010000 0.18
19-01-2018 165000 Transfer 1175000 0.21
26-01-2018 375000 Transfer 1550000 0.27
31-03-2018 - - 1550000 0.27
93
Corporate Overview / Statutory Reports / Financial Statements

Sl No.
Folio / DP-Id & Client Id Name of Shareholder
Shareholding at the beginning of the year
Date of change in
Shareholding
Increase/ decrease in
Shareholding
Reason for Increase/Decrease
Cumulative shareholding during
the year
No. of Shares
% of Total
Share Holding
No. of Shares
% of total Share
holding
17 N-IN301127/15045132 Neeraj Consultants Pvt. Ltd.
72138999 14.17 01-04-2017 - - 72138999 14.17
23-02-2018 219930 Transfer 72358929 12.65
02-03-2018 1298732 Transfer 73657661 12.88
09-03-2018 150000 Transfer 73807661 12.90
31-03-2018 19500 Transfer 73827161 12.91
18 N-IN301127/15399078 Indus Valley Investment and Finance Pvt. Ltd.
5076040 1.00 01-04-2017 - - 5076040 1.00
31-03-2018 - - 5076040 0.89
19 N-IN302365/10866463 Classic Autotubes Ltd. 9393500 1.85 01-04-2017 - - 9393500 1.85
31-03-2018 - - 9393500 1.64
20 N-IN303559/10011002 Classic Autotubes Ltd. 5100000 1.00 01-04-2017 - - 5100000 1.00
31-03-2018 - - 5100000 0.89
21 C-1201410000007516 Kenstar Investment & Finance Pvt. Ltd.
1842280 0.36 01-04-2017 - - 1842280 0.36
31-03-2018 1842280 0.32
22 C-1201410000017026 Amit Dyechem Pvt. Ltd. 1560595 0.31 01-04-2017 - - 1560595 0.31
31-03-2018 - - 1560595 0.27
(iv) Shareholding Pattern of top ten Shareholders (other than Directors, Promoters & Holders of GDRs & ADRs)
Sl No.
DP ID/Client ID Name of Shareholders
Shareholding at the beginning of the year
Date of change in
shareholding
Increase/ Decrease in
shareholding
Reason for
increase decrease
Cumulative Shareholding during the year
No. of shares
% of total shares
of the Company
No. Of shares
% of total shares of
the Company
1 N-IN300054/10009134 HDFC Trustee Company Limited - Hdfc Prudence Fund
0 0.00 01-04-2017 - - 0 0.00
05-01-2018 1496000 Transfer 1496000 0.26
12-01-2018 800000 Transfer 2296000 0.40
19-01-2018 2165459 Transfer 4461459 0.78
02-02-2018 1131000 Transfer 5592459 0.98
09-02-2018 2053500 Transfer 7645959 1.34
23-02-2018 141000 Transfer 7786959 1.36
31-03-2018 79000 Transfer 7865959 1.38
2 N-IN300054/10015680 LSV Emerging Markets Equity Fund Lp
5491000 1.08 01-04-2017 - - 5491000 0.96
18-08-2017 -821100 Transfer 4669900 0.82
23-02-2018 -491209 Transfer 4178691 0.73
3-02-2018 -603133 Transfer 3575558 0.63
9-03-2018 -951318 Transfer 2624240 0.46
16-03-2018 -280340 Transfer 2343900 0.41
31-03-2018 - - 2343900 0.41
3 N-IN300054/10016472 Credit Suisse (Singapore) Limited
5126297 1.01 01-04-2017 - - 5126297 0.90
07-04-2017 -250598 Transfer 4875699 0.85
14-04-2017 -64353 Transfer 4811346 0.84
05-05-2017 738 Transfer 4812084 0.84
12-05-2017 -15099 Transfer 4796985 0.84
19-05-2017 6000 Transfer 4802985 0.84
26-05-2017 -157390 Transfer 4645595 0.81
02-06-2017 -86475 Transfer 4559120 0.80
09-06-2017 -18339 Transfer 4540781 0.79
16-06-2017 -42155 Transfer 4498626 0.79
30-06-2017 -117810 Transfer 4380816 0.77
07-07-2017 -52325 Transfer 4328491 0.76
14-07-2017 -92197 Transfer 4236294 0.74
21-07-2017 -17860 Transfer 4218434 0.74
28-07-2018 -150189 Transfer 4068245 0.71
04-08-2017 -1703257 Transfer 2364988 0.41
94

Apollo Tyres Ltd Annual Report 2017-18
Sl No.
DP ID/Client ID Name of Shareholders
Shareholding at the beginning of the year
Date of change in
shareholding
Increase/ Decrease in
shareholding
Reason for
increase decrease
Cumulative Shareholding during the year
No. of shares
% of total shares
of the Company
No. Of shares
% of total shares of
the Company
11-08-2017 -1059383 Transfer 1305605 0.23
18-08-2017 -311946 Transfer 993659 0.17
25-08-2017 -169763 Transfer 823896 0.14
06-10-2017 -144855 Transfer 679041 0.12
27-10-2017 -584562 Transfer 94479 0.02
03-11-2017 -81459 Transfer 13020 0.00
22-12-2017 -13020 Transfer 0 0.00
31-03-2018 - - 0 0.00
4 N-IN300054/10040054 Dimensional Emerging Markets Value Fund
5101922 1.00 01-04-2017 - - 5101922 0.89
07-04-2017 -78529 Transfer 5023393 0.88
05-05-2017 -26040 Transfer 4997353 0.87
12-05-2017 -63993 Transfer 4933360 0.86
19-05-2017 -125590 Transfer 4807770 0.84
26-05-2017 -118720 Transfer 4689050 0.82
02-06-2017 -146450 Transfer 4542600 0.79
16-06-2017 -143479 Transfer 4399121 0.77
30-06-2017 -88143 Transfer 4310978 0.75
29-09-2017 -116629 Transfer 4194349 0.73
06-10-2017 -250842 Transfer 3943507 0.69
13-10-2017 -3924 Transfer 3939583 0.69
20-10-2017 -54777 Transfer 3884806 0.68
31-03-2018 - - 3884806 0.68
5 N-IN300054/10076881 Government Pension Fund Global
2492948 0.49 01-04-2017 - - 2492948 0.44
13-10-2017 4789915 Transfer 7282863 1.27
05-01-2018 -474279 Transfer 6808584 1.19
12-01-2018 178827 Transfer 6987411 1.22
19-01-2018 45928 Transfer 7033339 1.23
09-02-2018 -513577 Transfer 6519762 1.14
02-03-2018 -561816 Transfer 5957946 1.04
09-03-2018 -185157 Transfer 5772789 1.01
16-03-2018 -358643 Transfer 5414146 0.95
23-03-2018 -121547 Transfer 5292599 0.93
31-03-2018 - - 5292599 0.93
6 N-IN300126/11209306 HDFC Trustee Company Ltd - A/C Hdfc Mid - Cap opportunities Fund
2876000 0.57 01-04-2017 - - 2876000 0.50
28-07-2017 611000 Transfer 3487000 0.61
04-08-2017 280700 Transfer 3767700 0.66
11-08-2017 1000000 Transfer 4767700 0.83
18-08-2017 500000 Transfer 5267700 0.92
25-08-2017 1500000 Transfer 6767700 1.18
15-09-2017 6000 Transfer 6773700 1.18
13-10-2017 1680672 Transfer 8454372 1.48
27-10-2017 150000 Transfer 8604372 1.50
15-12-2017 453000 Transfer 9057372 1.58
22-12-2017 2392000 Transfer 11449372 2.00
29-12-2017 681000 Transfer 12130372 2.12
05-01-2018 481000 Transfer 12611372 2.20
12-01-2018 80000 Transfer 12691372 2.22
09-02-2018 700000 Transfer 13391372 2.34
16-02-2018 400000 Transfer 13791372 2.41
23-03-2018 820000 Transfer 14611372 2.55
31-03-2018 - - 14611372 2.55
7 N-IN300126/11218322 ICICI Prudential Balanced Advantage Fund
0 0.00 01-04-2017 - - 0 0.00
12-05-2017 1521400 Transfer 1521400 0.27
26-05-2017 1668486 Transfer 3189886 0.56
04-08-2017 1280819 Transfer 4470705 0.78
11-08-2017 1343443 Transfer 5814148 1.02
18-08-2017 19183 Transfer 5833331 1.02
01-09-2017 649104 Transfer 6482435 1.13
95
Corporate Overview / Statutory Reports / Financial Statements

Sl No.
DP ID/Client ID Name of Shareholders
Shareholding at the beginning of the year
Date of change in
shareholding
Increase/ Decrease in
shareholding
Reason for
increase decrease
Cumulative Shareholding during the year
No. of shares
% of total shares
of the Company
No. Of shares
% of total shares of
the Company
12-01-2018 -249000 Transfer 6233435 1.09
16-03-2018 614214 Transfer 6847649 1.20
31-03-2018 - - 6847649 1.20
8 N-IN300142/10753517 Kotak Funds - India Midcap Fund
0 0.00 01-04-2017 - - 0 0.00
13-10-2017 2510924 Transfer 2510924 0.44
20-10-2017 460125 Transfer 2971049 0.52
27-10-2017 200000 Transfer 3171049 0.55
03-11-2017 468404 Transfer 3639453 0.64
10-11-2017 205812 Transfer 3845265 0.67
24-11-2017 400000 Transfer 4245265 0.74
01-12-2017 390000 Transfer 4635265 0.81
29-12-2017 1379554 Transfer 6014819 1.05
05-01-2018 690000 Transfer 6704819 1.17
19-01-2018 200000 Transfer 6904819 1.21
26-01-2018 139584 Transfer 7044403 1.23
02-02-2018 36686 Transfer 7081089 1.24
09-02-2018 97786 Transfer 7178875 1.25
23-02-2018 87282 Transfer 7266157 1.27
02-03-2018 300000 Transfer 7566157 1.32
09-03-2018 485000 Transfer 8051157 1.41
31-03-2018 15773 Transfer 8066930 1.41
9 N-IN300167/10010936 Franklin Templeton Mutual Fund A/C Franklin India Prima Fund
4643261 0.91 01-04-2017 - - 4643261 0.81
28-04-2017 200000 Transfer 4843261 0.85
12-05-2017 150000 Transfer 4993261 0.87
19-05-2017 13257 Transfer 5006518 0.88
26-05-2017 262518 Transfer 5269036 0.92
02-06-2017 24225 Transfer 5293261 0.93
11-08-2017 -100000 Transfer 5193261 0.91
10-11-2017 200000 Transfer 5393261 0.94
09-02-2018 600000 Transfer 5993261 1.05
31-03-2018 - - 5993261 1.05
10 N-IN300167/10011040 Franklin Templeton Mutual Fund A/C Franklin India Prima Plus
5000000 0.98 01-04-2017 - - 5000000 0.87
09-06-2017 -500000 Transfer 4500000 0.79
16-06-2017 -150000 Transfer 4350000 0.76
01-09-2017 -350000 Transfer 4000000 0.70
03-11-2017 206695 Transfer 4206695 0.74
10-11-2017 493305 Transfer 4700000 0.82
24-11-2017 300000 Transfer 5000000 0.87
01-12-2017 500000 Transfer 5500000 0.96
09-02-2018 500000 Transfer 6000000 1.05
09-03-2018 110588 Transfer 6110588 1.07
16-03-2018 89412 Transfer 6200000 1.08
31-03-2018 - - 6200000 1.08
11 N-IN300239/10150207 Kerala State Industrial Development Corporation
5000000 0.98 01-04-2017 - - 5000000 0.87
31-03-2018 - - 5000000 0.87
12 N-IN300239/10664696 Governor of Kerala 5000000 0.98 01-04-2017 - - 5000000 0.87
31-03-2018 - - 5000000 0.87
13 N-IN303438/10004305 Franklin Templeton Investment Funds
18714398 3.68 01-04-2017 - - 18714398 3.27
07-04-2017 2038 Transfer 18716436 3.27
14-04-2017 4819 Transfer 18721255 3.27
21-04-2017 102989 Transfer 18824244 3.29
28-04-2017 1468512 Transfer 20292756 3.55
12-05-2017 200993 Transfer 20493749 3.58
19-05-2017 755447 Transfer 21249196 3.72
09-06-2017 6383 Transfer 21255579 3.72
30-06-2017 -109372 Transfer 21146207 3.70
21-07-2017 965861 Transfer 22112068 3.87
96

Apollo Tyres Ltd Annual Report 2017-18
Sl No.
DP ID/Client ID Name of Shareholders
Shareholding at the beginning of the year
Date of change in
shareholding
Increase/ Decrease in
shareholding
Reason for
increase decrease
Cumulative Shareholding during the year
No. of shares
% of total shares
of the Company
No. Of shares
% of total shares of
the Company
28-07-2017 1124738 Transfer 23236806 4.06
04-08-2017 1231128 Transfer 24467934 4.28
11-08-2017 2006921 Transfer 26474855 4.63
25-08-2017 624451 Transfer 27099306 4.74
06-10-2017 587713 Transfer 27687019 4.84
27-10-2017 27000 Transfer 27714019 4.85
03-11-2017 580327 Transfer 28294346 4.95
24-11-2017 1710709 Transfer 30005055 5.25
09-02-2018 1003804 Transfer 31008859 5.42
09-03-2018 -767773 Transfer 30241086 5.29
31-03-2018 - - 30241086 5.29
14 N-IN303438/10007517 T Rowe Price New Asia Fund
0 0.00 01-04-2017 - - 0 0.00
13-10-2017 5722102 Transfer 5722102 1.00
10-11-2017 343100 Transfer 6065202 1.06
23-02-2018 492561 Transfer 6557763 1.15
31-03-2018 - - 6557763 1.15
15 N-IN301330/19132926 Custodian A/C - Ashwin Shantilal Mehta
13507300 2.65 01-04-2017 - - 13507300 2.36
31-03-2018 - - 13507300 2.36
16 N-IN303438/10004432 Templeton Global Investment Trust - Templeton Emerging Markets Small Cap Fund
4551783 0.89 01-04-2017 - - 4551783 0.80
07-04-2017 1600 Transfer 4553383 0.80
14-04-2017 4754 Transfer 4558137 0.80
28-04-2017 991112 Transfer 5549249 0.97
12-05-2017 136269 Transfer 5685518 0.99
21-07-2017 574032 Transfer 6259550 1.09
28-07-2017 139100 Transfer 6398650 1.12
04-08-2017 33800 Transfer 6432450 1.12
31-03-2018 - - 6432450 1.12
17 N-IN300054/10026602 Skagen Kon-Tiki Verdipapirfond
11855954 2.33 01-04-2017 - - 11855954 2.07
28-04-2017 -5187126 Transfer 6668828 1.17
05-05-2017 -929828 Transfer 5739000 1.00
12-05-2017 -2471785 Transfer 3267215 0.57
19-05-2017 -1410134 Transfer 1857081 0.32
26-05-2017 -1857081 Transfer 0 0.00
31-03-2018 - - 0 0.00
97
Corporate Overview / Statutory Reports / Financial Statements

(v) Shareholding of Directors & KMPs
Sl. No
Name of the Director/KMP
Shareholding at the beginning/end of the year
Cumulative Shareholding at the beginning/during the year
No. of shares% of total shares of
the CompanyNo. of shares
% of total shares of the Company
1 Mr. Onkar S. Kanwar - Chairman & Managing DirectorAt the Beginning of the Year (April 1, 2017) 800000 0.16 800000 0.14
Shares sold on May 12, 2017 -800000 -0.16 0 0
Shares purchased on February 16, 2018 100000 0.02 100000 0.02
At the end of the year (March 31, 2018) 100000 0.02 100000 0.02
2 Mr. Neeraj Kanwar - Vice Chairman & Managing DirectorAt the Beginning of the Year (April 1, 2017) 671380 0.13 671380 0.12
Transaction (Purchase/ sale) from April 1, 2017 upto March 31, 2018
- - - -
At the end of the year (March 31, 2018) 671380 0.12 671380 0.12
3 Mr. Vikram S Mehta - DirectorAt the Beginning of the Year (April 1, 2017) 6000 0 6000 0
Transaction (Purchase/ sale) from April 1, 2017 upto March 31, 2018
- - - -
At the end of the year (March 31, 2018) 6000 0 6000 0
4 Mr. A.K. Purwar - DirectorAt the Beginning of the Year (April 1, 2017) 0 0 0
Transaction (Purchase/ sale) from April 1, 2017 upto March 31, 2018
5000 0 5000 0
At the end of the year (March 31, 2018) 5000 0 5000 0
The following Directors/Key Managerial Personnel(KMP) did not hold any shares during FY2018:
(i) Mr. Akshay Chudasama, Director (ii) Ms. Anjali Bansal, Director (iii) Mr. Nimesh N. Kampani , Director (iv) Dr. M. Beena, Director (v) Mr. Robert Steinmetz, Director (vi) Mr. Sunam Sarkar, Director (vii) Dr. S. Narayan, Director (viii) Ms. Pallavi Shroff, Director (ix) General Bikram Singh (Retd), Director (x) Mr. Vinod Rai, Director (xi) Mr. Francesco Gori, Director (xii) Mr. Gaurav Kumar, CFO - KMP and (xiii) Ms. Seema Thapar, Company Secretary-KMP
V INDEBTEDNESS
Indebtedness of the Company including interest outstanding/accrued but not due for payment
(` in Million)
ParticularsSecured Loans
excluding deposits
Unsecured Loans
DepositsTotal
Indebtedness
Indebtedness at the beginning of the financial year (01.04.17)i) Principal Amount 10,391.01 7,529.41 17,920.42
ii) Interest Due but not paid - - -
iii) Interest Accrued but not due 379.01 - 379.01 Total (i+ii+iii) 10,770.02 7,529.41 18,299.43
Change in indebtedness during the financial yeari) Addition 13,565.60 34,517.96 48,083.56
ii) Reduction 3,692.08 36,716.52 40,408.60 Total 9,873.52 (2,198.56) 7,674.96
indebtedness at the end of the financial year (31.03.18)i) Principal Amount 19,977.60 5,330.85 25,308.45
ii) Interest Due but not paid - - -
iii) Interest Accrued but not due 665.94 - 665.94 Total (i+ii+iii) 20,643.54 5,330.85 25,974.39
98

Apollo Tyres Ltd Annual Report 2017-18
VI REMUNERATION OF DIRECTORS AND KEY MANAGERIAL PERSONNEL
A. Remuneration to Managing Director, Whole Time Director and/or Manager:
(` in Million)
Sl . No
Particulars of Remuneration Name of the MD/WTD/Manager Total
1 Gross salary Onkar S. Kanwar Neeraj Kanwar
(a) Salary as per provisions contained in Section 17(1) of the Income Tax. 1961.
166.75 105.29 272.04
(b) Value of perquisites u/s 17(2) of the Income tax Act, 1961 0.30 0.06 0.36
(c ) Profits in lieu of salary under Section 17(3) of the Income Tax Act, 1961
- -
2 Stock option - -
3 Sweat Equity - -
4 Commission 282.80 322.20 605.00
as % of profitothers (specify) - -
5 Others, please specify - -Total (A) 449.85 427.55 877.40Ceiling as per the Act ` 991.83 Million (being 10% of the Net Profits of
the Company calculated as per Section 198 of the Companies Act, 2013)
B. Remuneration to other Directors:(` in Million)
Sl. No
Particulars of Remuneration Name of the DirectorsTotal
Amount
1 Independent Directors A.K. Purwar Askhay Chudasama
Anjali Bansal Gen. Bikram Singh(Retd.)
Francesco Gori
Dr. M.Beena/* Paul Antony
Nimesh N. Kampani
(a) Fee for attending Board Committee Meetings
0.70 1.70 0.50 0.90 0.60 0.40 1.10 5.90
(b) Commission 4.83 4.83 2.00 4.83 4.83 4.83 4.83 30.98
(c ) Others, please specify - - - - - - -
Total (1) 5.53 6.53 2.50 5.73 5.43 5.23 5.93 36.88
2 Other Non Executive Directors
Pallavi Shroff Robert Steinmetz
Sunam Sarkar Dr. S. Narayan Vikram S.Mehta
Vinod Rai
(a) Fee for attending Board Committee Meetings
0.90 1.00 2.00 1.60 0.60 0.70 6.80
(b) Commission 4.83 4.83 4.83 4.83 4.83 4.83 28.98
(c) Others, please specify. - - - -
Total (2) 5.73 5.83 6.83 6.43 5.43 5.53 35.78
Total (B)=(1+2) 72.66
Total Managerial Remuneration
908.26
Overall ceiling as per the Act.
` 1091.01 Millions (being 11% of the Net Profits of the Company calculated as per Section 198 of the Companies Act, 2013)
* Paid to Govt. of Kerala
99
Corporate Overview / Statutory Reports / Financial Statements

C. Remuneration to Key Managerial Personnel other than MD/Manager/WTD(` in Million)
Sl. No.
Particulars of Remuneration Name of KMP
1 Gross SalaryCFO (Gaurav Kumar)
Company Secretary
(Seema Thapar)
(a) Salary as per provisions contained in Section 17(1) of the Income Tax Act, 1961. 29.50 4.68
(b) Value of perquisites u/s 17(2) of the Income Tax Act, 1961 0.01 0.38
(c ) Profits in lieu of salary under Section 17(3) of the Income Tax Act, 19612 Stock Option - -
3 Sweat Equity - -
4 Commission - -
as % of profit - -
others, specify - -
5 Others, please specify - -Total 29.51 5.06
VII PENALTIES/PUNISHMENT/COMPOUNDING OF OFFENCES There were no penalties/ punishment/ compounding of offences under Companies Act, 2013 for the year ended March 31, 2018.
For and on behalf of Board of Directors
Place: Gurgaon ONKAR S. KANWARDate: May 10, 2018 Chairman & Managing Director
100

Apollo Tyres Ltd Annual Report 2017-18
Apollo Tyres’ governance framework enjoins the highest standards of ethical and responsible conduct of business to create value for all stakeholders. It continues to focus on good corporate governance, in line with emerging local and global standards. It understands and respects its fiduciary role in the corporate world. Besides adhering to the prescribed corporate governance practices as per Regulation 4 (2) read with Chapter IV of the SEBI (Listing Obligations and Disclosure Requirements) Regulations, 2015 (“Listing Regulations”), the Company voluntarily governs itself as per highest standards of ethical and responsible conduct of business in all facets of its operations and in all interactions with its stakeholders, including shareholders, employees, consumers, lenders and the community at large.
The prime focus of Companies Act, 2013 is on shareholders’ democracy, higher transparency and more disclosures, E-Governance, investor protection/minority shareholders and on Professionals’ enhanced role & accountability. The current annual report of your Company contains all the information and disclosures which are required to be given under Companies Act, 2013/Listing Regulations.
This report, along with the report on Management Discussion and Analysis and additional shareholders information provides the details of implementation of the corporate governance code by your Company as contained in the Listing Regulations:
1. CORPORATE GOVERNANCE PHILOSOPHY
At Apollo Tyres Ltd., corporate governance brings direction and control to the affairs of the Company in a fashion that ensures optimum return for stakeholders. Corporate governance is the broad framework which defines the way the Company functions and interacts with its environment. It is in compliance with laws and regulations in each of the markets the Company operates, leading to effective management of the organisation. Moreover, Apollo in its journey towards sustainability is integrating sustainability practices in its corporate governance system which goes beyond compliance.
The Company is guided by a key set of values for all its internal and external interactions.
Simultaneously, in keeping with the best practices, your Company seeks to execute the practices of corporate governance by maintaining strong business fundamentals and by delivering high performance through relentless focus on the following:
(a) Transparency by classifying and explaining the Company’s policies and actions to those towards whom it has responsibilities, including its employees. This implies the maximum possible disclosures without hampering the interests of the Company and those of its stakeholders. The Company believes in promotion of ethical values and setting up exemplary standards of ethical behaviour in our conduct towards our business partners, colleagues, shareholders and general public;
(b) Accountability is a key pillar, where there cannot be a compromise in any aspect of accountability and full responsibility, even as the management pursues profitable growth for the Company;
(c) Professionalism ensures that management teams at all levels are qualified for their positions, have a clear understanding of their roles and are capable of exercising their own judgment, keeping in view the Company’s interests, without being subject to undue influence from any external or internal pressures;
(d) Trusteeship brings into focus the fiduciary role of the management to align and direct the actions of the organisation towards creating wealth and shareholder value in the Company’s quest to establish a global network, while abiding with global norms and cultures;
(e) As part of Corporate Responsibility, the Company believes in working towards sustainable development - environmental and social. Though the journey on sustainability is recent, it is already a key pillar in its next five year growth journey;
(f) Safeguarding integrity ensures independent verification and truthful presentation of the Company’s financial position. For this purpose, the Company has also constituted an Audit Committee which pays particular attention to the financial management process;
(g) Continuous focus on training and development of employees and workers to achieve the overall corporate objectives while ensuring employee integration across national boundaries.
Your Company is open, accessible and consistent with its communication. Apollo Tyres shares a long term perspective and firmly believes that good corporate governance practices underscore its drive towards competitive strength and sustained performance. Thus, overall corporate governance norms have been institutionalised as an enabling and facilitating business process at the Board, Management and at all operational levels.
2. BOARD OF DIRECTORS (SUPERVISORY BOARD)
At Apollo, we believe that an active, well-informed and independent Board is necessary to ensure highest standards of Corporate Governance. The Board of Directors of Apollo Tyres, being at the core of its Corporate Governance practice, plays the most pivotal role in overseeing how the management serves and protects the long term interests of all our stakeholders.
Apollo’s Board consists of an optimal combination of Executive Directors and Independent Directors, representing a judicious mix of professionalism, knowledge and experience. The Directors bring in expertise in the fields of strategy, management, human resource development, legal, finance and economics, among others. The Board provides leadership, strategic guidance, objective and independent view to the Company’s management while discharging its fiduciary responsibilities, thereby ensuring that the management adheres to high standards of ethics, transparency and disclosure.
(a) Composition of Board: The size and composition of the Board as on March 31, 2018 meet the requirements of Regulation 17 (1) of SEBI (Listing Obligations and Disclosure Requirements) Regulations, 2015. The Company’s Board of Directors consists of 15 Executive and Non-Executive Directors, including leading professionals in their respective fields. The following is the percentage of Executive and Non- Executive Directors of the Company:
Category of Directors No. of Directors% of Total no. of
Directors
Executive 2 13
Non-Executive (including Independent Directors)
13 87
Total 15 100
ANNEXURE VI
Corporate Governance Report
101
Corporate Overview / Statutory Reports / Financial Statements

The constitution of the Board and attendance record of Directors are given below:
Name/Designation of Director Executive/ Non-Executive/ IndependentNo. of positions held in
Other Companies No. of Board
Meetings Attended(3)
Attendance at last AGM
Board(1) Committee(2)
Mr. Onkar S. Kanwar Chairman & Managing Director
Promoter – Executive 5 2 6 Yes
Mr. Neeraj Kanwar Vice Chairman & Managing Director
Executive 3 3 6 Yes
Mr. Akshay Chudasama Non-Executive Independent 6 1 6 Yes
Ms. Anjali Bansal Non-Executive Independent 4 1 3 N.A.
Mr. A.K. Purwar Non-Executive Independent 8 5 6 Yes
Gen. Bikram Singh (Retd.) Non-Executive Independent - - 6 Yes
Mr. Francesco Gori Non-Executive Non-Independent - - 6 No
Dr. M. Beena(4)(5) Nominee Director – Govt. of Kerala (Equity Investor)
Non-Executive Non-Independent 9 - 1 N.A.
Mr. Nimesh N.Kampani Non-Executive Independent 6 6 6 Yes
Ms. Pallavi Shroff Non-Executive Independent 4 2 5 No
Mr. Robert Steinmetz Non-Executive Non-Independent - - 6 No
Mr. Sunam Sarkar Non-Executive Non-Independent - - 5 Yes
Dr. S. Narayan Non-Executive Independent 6 2 6 Yes
Mr. Vikram S. Mehta Non-Executive Independent 7 2 5 Yes
Mr. Vinod Rai Non-Executive Independent 3 3 6 Yes
Ceased to be DirectorMr. Paul Antony(4)(5) Nominee Director – Govt. of Kerala (Equity Investor)
Non-Executive Non-Independent 8 1 3 No
(1) This includes Directorships held in Public Ltd. Companies and Subsidiaries of Public Ltd. Companies and excludes Directorships in Private Ltd. Companies and Overseas Companies.
(2) For the purpose of Committees of Board of Directors, only Audit and Stakeholders’ Relationship Committees in other Public Ltd. Companies and Subsidiaries of Public Ltd. Companies are considered.
(3) During FY2018, six Board Meetings were held.
(4) Govt. of Kerala nominated Dr. M Beena as Director of the Company in place of Mr. Paul Antony w.e.f. January 30, 2018.
(5) Pursuant to Section 149(6) of the Companies Act, 2013, Dr. M. Beena shall not be treated as an Independent Director.
None of the Directors of your Company is a member of more than 10 Committees or is the Chairman of more than 5 Committees across all the Companies in which he/she is a Director.
Ms. Pallavi Shroff and Mr. Akshay Chudasama are Managing Partners of M/s. Shardul Amarchand Mangaldas & Co.,Solicitors and Advocates on record, to whom the Company has paid fee of `12.84 million during FY2018 for professional advice rendered by the firm in which they are interested. The Board has determined that such payment in the context of overall expenditure by the Company is not significant and does not affect their independence.
As required under Regulation 25(3) of the Listing Regulations, a separate meeting of the Independent Directors was held on January 9, 2018. The Independent Directors at the meeting, inter alia, reviewed the following:-
> Performance of Non-Independent Directors and Board as a whole;
> Performance of the Chairman of the Company, taking into account the views of Executive Directors and Non-Executive Directors;
> Assessed the quality, quantity and timeliness of flow of information between the Company management and the Board that was necessary for the Board to effectively and reasonably perform their duties.
In addition to formal meetings, interactions outside the Board Meetings also take place between the Chairman and Independent Directors to discuss the issues and concerns, if any.
(b) Performance evaluation of Independent Directors. The Company has devised a policy for performance
evaluation of Independent Directors, Board, Committees and other individual Directors which includes criteria for performance evaluation of the Non-Executive Directors and Executive Directors.
(c) Board Functioning & Procedure: Apollo Tyres’ Board is committed to ensure good governance through a style of functioning that is self-governing. The members of the Board always have complete liberty to express their opinion and decisions are taken on the basis of consensus arrived at after detailed discussions. They are also free to bring up any matter for discussion at the Board Meetings.
Apollo Tyres’ Board meets at least once in every quarter to discuss and review the quarterly results and other items of agenda, including the information required to be placed before the Board, as required under Regulation 17 (7) read with Part A, Schedule II of the Listing Regulations and additional meetings are held as and when required. The meeting dates are usually finalized well before the beginning of the year. The Chairman/Vice Chairman of the Board and the Company Secretary discuss the items to be included in the
102

Apollo Tyres Ltd Annual Report 2017-18
agenda and the detailed agenda, management reports and other explanatory statements are circulated well in advance of the meeting. Senior Management officials are called to provide additional inputs on the matters being discussed by the Board/ Committee. Overseas operating subsidiaries are represented through their CEO’s who make detailed presentations about working of their respective Companies.
Paperless Board Meetings: With a view to leverage technology and reducing paper consumption, the Company has adopted a web-based application for transmitting Board / Committee Agenda. The Directors of the Company receive the Agenda in electronic form through this application, which can be accessed through Browsers or iPads. The application meets high standards of security and integrity that is required for storage and transmission of Board / Committee Agenda in electronic form.
Post Meeting follow up procedure: The Board has an effective post meeting follow up procedure. Items arising out of previous Board Meeting and their follow up action report are placed at the immediately succeeding meeting for information of the Board.
(d) Information placed before the Board of Directors The Board has complete access to all the information
available within the Company. The following information, inter-alia, is provided periodically by the management to the Board for its review:
> Quarterly/Half yearly/Yearly financial results (consolidated & standalone) and items arising out of Annual Accounts.
> Proceedings of various Committees of the Board (on quarterly basis).
> Minutes of the Subsidiaries (on quarterly basis).
> Internal/External Audit findings & recommendations (on quarterly basis).
> Report on Share Capital Audit (on quarterly basis).
> Secretarial Audit Report (on Annual basis).
> Related Parties Transactions (on quarterly basis).
> Information on Cost Audit (on Annual basis).
> Compliance certificates on applicable laws of ATL & its Subsidiaries (on quarterly basis).
> Compliance Reports: Share Capital Audit, Investors Complaints, Corporate Governance, Transfer/Transmission/Demat of shares (on quarterly basis).
> Foreign Exchange exposure & steps taken to limit the risk(on quarterly basis).
> Material legal cases (on quarterly basis).
> Investment/deployment of funds & borrowings (on quarterly basis).
> Annual Report(on Annual basis).
> Capital and Revenue Budgets (on Annual basis).
> Overall business scenario, operations of the Company (on quarterly basis).
> Growth & Expansion plans at various operations, capital spend, business/financial justification and time frame (as and when required).
> Sales Forecast, Margin outlook etc. (on quarterly basis).
> Banking facilities and its utilization (on quarterly basis).
> Review of Material Events and Transactions (on quarterly basis).
> Global growth plans (as and when required).
> Codes and Policies (as and when required).
> Investment in Subsidiary Companies & providing guarantee etc.(as and when required).
> Update on statutory compliance requirements and implementation process (as and when required).
The Chairman, Vice Chairman, CFO and Company Secretary keep the members of the Board informed about any material development/business update through various modes viz. emails, letters, telecon etc. from time to time.
(e) Expertise/ Skills of Directors
Sl. No.
Name of the Director Expertise/ Skills
1 Mr. Onkar S. Kanwar Refer the detailed profile in point 2(g) under this report2 Mr. Neeraj Kanwar Refer the detailed profile in point 2(g) under this report3 Mr. Akshay Chudasama A lawyer, specialised in Mergers and Acquisitions, Joint Ventures, Cross Border Investments,
Private Equity etc.4 Mr. A.K. Purwar Expert in the fields of Banking and Finance.5 Ms. Anjali Bansal Expert in Strategy, International Finance and Business and Human Resource Development. 6 Gen. Bikram Singh
(Retd.)Former Chief of Indian Army and an expert in Strategy.
7 Mr. Francesco Gori Expert in the field of International Strategy, Product Development & Management, Sales and Marketing.
8 Dr. M. Beena IAS officer from Kerala Cadre.9 Mr. Nimesh N. Kampani Expert in the fields of Investment Banking, Securities Trading, Mergers and Acquisitions and
providing financial solutions.10 Ms. Pallavi Shroff A lawyer, with an expertise in ad-hoc arbitrations and institutional arbitrations and handling
legal disputes.11 Mr. Robert Steinmetz Expert in International Tyre Business.
103
Corporate Overview / Statutory Reports / Financial Statements

Sl. No.
Name of the Director Expertise/ Skills
12 Mr. Sunam Sarkar Expert in Sales, Marketing, Business Operations and Corporate Strategy.13 Dr. S. Narayan Retired IAS officer having expertise in Business Management, Finance and Economics.14 Mr. Vikram S. Mehta Expert in the field of Strategy and Management.15 Mr. Vinod Rai Ex-Comptroller and Auditor General of India. Expert in Audit, Banking and Finance.
(f) Relationship amongst Directors: Mr. Neeraj Kanwar, Vice Chairman & Managing Director is the son of Mr. Onkar S. Kanwar, Chairman & Managing Director. None of the other Directors are related to each other.
(g) Profile of the Chairman & Managing Director: As the Chairman of Apollo Tyres Ltd, Mr. Onkar S. Kanwar is the chief architect of the Company’s vision and value-driven business strategy. Under his able leadership Apollo became a professionally managed and a globally recognised tyre manufacturer. As a visionary entrepreneur, he plays a critical role in the articulation of Company’s business philosophy.
Modernisation, excellence and quality are his guiding principles. Registered in 1972, Apollo Tyres under his guidance transformed itself from an Indian manufacturer of commercial vehicle tyres, to a global entity with a full-fledged product portfolio, spanning 3 continents. Mr. Onkar S. Kanwar is highly regarded for his constant emphasis on bettering the lives of people - be it employees, customers, business partners, shareholders or any other stakeholders - and responsiveness to change and continuous learning.
He is the Past President of the Federation of Indian Chambers of Commerce and Industry (FICCI) and a former Chairman of the Automotive Tyre Manufacturers’ Association. Currently, apart from being a member of the Trade Advisory Committee to the Government of India, he is also a Member of the Board of Governors for the Indian Institute of Management (Kozhikode).
Mr. Onkar S. Kanwar has a keen interest in the field of education and health care. Artemis Health Sciences, promoted by him, is an enterprise focusing on state-of-the-art medical care and runs a cutting edge multi-specialty medical facility which focuses on holistic treatment. An initiative close to his heart is Apollo Tyres’ HIV-AIDS awareness and prevention programme for the commercial vehicle driver community, implemented through Apollo Tyres Foundation’s Health Care Centres located in large transhipment hubs across India.
A Science and Administration graduate from the University of California, Mr. Onkar S. Kanwar is a widely travelled individual. He devotes a large part of his time to reading and is passionate about learning modern management practices and their successful application in business.
He has been conferred with ‘Ernst & Young Entrepreneur of the Year Award – Manufacturing’ for the year 2012.
Profile of the Vice Chairman & Managing Director: As the Vice Chairman & Managing Director of Apollo Tyres, Mr. Neeraj Kanwar plays a pivotal role in Apollo’s journey towards becoming one of the most admired automotive tyre brands. Mr. Neeraj Kanwar has pioneered key initiatives in enhancing the competitiveness of the Company’s operations and products across the Board. He is responsible for crafting Apollo’s growth story -- taking the Company from US$450
million to US$2 billion within a 5 year time span. Under his able leadership Apollo acquired Dunlop Tyres International in South Africa and Zimbabwe in 2006, Vredestein Banden B V in the Netherlands in 2009, and a Greenfield facility in Hungary has been being set-up -- thereby transforming itself into a multi-geography Company with operations across geographies.
Mr. Neeraj Kanwar began his career with Apollo Tyres as Manager, Product & Strategic Planning, where he played a crucial role in creating a bridge between the two key functions of manufacturing and marketing. In 1998, he joined the Board of Directors and was promoted to Chief, Manufacturing and Strategic Planning. His people management skills helped him bring overarching changes in industrial relations, upgradation of technology and benchmarking on product and efficiency parameters.
In 2002, he took over as the Chief Operating Officer of the organisation, wherein he introduced value-driven process improvements in human resources and information technology. Mr. Neeraj Kanwar was appointed Joint Managing Director in 2006 and elevated to Vice Chairman in 2008, and soon after to Managing Director in 2009 for his initiatives in establishing the Company in the global arena.
As a business leader, Mr. Neeraj Kanwar is associated with leading industry associations and was recently the Chairman of the Automotive Tyre Manufacturer’s Association, India.
Mr. Neeraj Kanwar is a people-centric leader and believes in empowering employees to enable them to undertake effective and efficient decisions at all times. Within Apollo, he is known for his affable management style, and combine work with liberal doses of fun.
An engineering graduate from Lehigh University in Pennsylvania, USA, Mr. Neeraj Kanwar is an avid sportsperson. He prefers to spend his leisure time with his family or playing tennis, swimming and travelling.
(h) No. & Dates of Board Meetings held: During the FY2018, 6 (six) Board Meetings were held on April 6, 2017, May 5, 2017, August 4, 2017, November 1, 2017, February 6, 2018 and March 28, 2018. The gap between any two meetings never exceeded 120 days as per the requirements of Regulation 17(2) of the Listing Regulations.
(i) Statutory Compliance of Laws: The Board periodically reviews the compliance report of the laws applicable to the Company as well as steps taken by the Company to rectify the instances of non-compliance, if any.
3. MANAGEMENT BOARD
To ensure expedient and effective focus on important issues, the Company has constituted a Management Board with a primary aim to maintaining strong business fundamentals and delivering high performance through relentless focus on the affairs of the Company across all its geographies.
104

Apollo Tyres Ltd Annual Report 2017-18
The said Management Board consists of 15 members comprising of the Company’s senior management team. The objective of the Management Board is to (i) policy making process for key functions undertaken at corporate level; (ii) sharing & promoting implementation of process improvements and best practices and (iii) analysing certain key operational matters/strategic projects, to enhance stakeholders’ value.
The Management Board generally meets once in every quarter to perform its functions.
4. AUDIT COMMITTEE
The primary objective of the Audit Committee is to monitor and provide effective supervision of the Management’s financial reporting process with a view to ensuring accurate and timely disclosures, with the highest levels of transparency, integrity and quality of financial reporting. The Committee oversees the work carried out in the financial reporting process by the management, the internal auditors and the independent auditor, and notes the processes and safeguards employed by each. All possible measures are taken by the Committee to ensure the objectivity and independence of the independent auditor.
(a) Composition & Terms of Reference of Committee The Board of Directors constituted an Audit Committee in
the year 1992. The powers, role and terms of reference of the Audit Committee covers the areas as contemplated under Regulation 18 of SEBI (Listing Obligations and Disclosure Requirements) Regulations, 2015 and Section 177 of the Companies Act, 2013. The present Audit Committee comprises of following four Directors viz. Dr. S. Narayan, Mr. Akshay Chudasama, Mr. Robert Steinmetz and Mr. Nimesh N. Kampani, with the Independent Directors forming the majority. Dr. S. Narayan, Independent Director, acts as the Chairman of the Committee. All the members are financially literate and possess the requisite financial/business acumen to specifically look into the internal controls and audit procedures. Members have discussions with the Statutory Auditors during the meetings of the Committee and the quarterly/ half-yearly and annual audited financials of the Company are reviewed by the Audit Committee before consideration and approval by the Board of Directors. The Committee also reviews Internal Control Systems and IT systems.
As per Regulation 18 (3) read with Part C of Schedule II of the Listing Regulations and Section 177 of the Companies Act, 2013, the Audit Committee has been entrusted with the following responsibilities:-
> Oversight of the Company’s financial reporting process and the disclosure of its financial information to ensure that the financial statement is correct, sufficient and credible;
> Recommendation for appointment, remuneration and terms of appointment of auditors of the Company;
> Approval of payment to statutory auditors for any other services rendered by the statutory auditors;
> Reviewing with the management, the annual financial statements and auditor’s report thereon before submission to the Board for approval;
> Reviewing matters required to be included in the Director’s Responsibility Statement to be included in the Board’s report in terms of clause (c) of sub-section (3) of Section 134 of the Companies Act, 2013;
> Reviewing changes, if any, in accounting policies and practices and reasons for the same;
> Reviewing major accounting entries involving estimates based on the exercise of judgment by management;
> Reviewing significant adjustments made in the financial statements arising out of audit findings;
> Reviewing compliance with listing and other legal requirements relating to financial statements;
> Reviewing disclosure of any related party transactions;
> Reviewing modified opinion(s) in the draft audit report;
> Reviewing with the management, the quarterly financial statements before submission to the Board for approval;
> Reviewing with the management, the statement of uses/application of funds raised through an issue (public issue, right issue, preferential issue etc.), the statement of funds utilized for purposes other than those stated in the offer document/prospectus/notice and the report submitted by the monitoring agency, monitoring the utilization of proceeds of a public or rights issue, and making appropriate recommendations to the Board to take up steps in this matter;
> Reviewing and monitoring the auditor’s independence and performance, and effectiveness of audit process;
> Approval or any subsequent modification of transactions of the Company with related parties;
> Scrutiny of inter-corporate loans and investments;
> Valuation of undertakings or assets of the Company, wherever it is necessary;
> Evaluation of internal financial controls and risk management systems;
> Reviewing, with the management, performance of statutory and internal auditors, adequacy of the internal control systems;
> Reviewing the adequacy of internal audit function, if any, including the structure of the internal audit department, staffing and seniority of the official heading the department, reporting structure coverage and frequency of internal audit;
> Discussion with internal auditors of any significant findings and follow up there on;
> Reviewing the findings of any internal investigations by the internal auditors into matters where there is suspected fraud or irregularity or a failure of internal control systems of a material nature and reporting the matter to the Board;
> Discussion with statutory auditors before the audit commences, about the nature and scope of audit as well as post-audit discussion to ascertain any area of concern;
> To look into the reasons for substantial defaults in the payment to the depositors, debenture holders, shareholders (in case of non-payment of declared dividends) and creditors;
> Review of the functioning of Whistle Blower Mechanism;
> Approval of appointment of CFO (i.e. the Whole-Time Finance Director or any other person heading the finance
105
Corporate Overview / Statutory Reports / Financial Statements

function or discharging that function) after assessing the qualifications, experience and background etc. of the candidate;
> Review of Management Discussion and Analysis of financial condition and results of operations;
> Review statement of significant related party transactions submitted by Management;
> Review of management letters/ letters of internal control weaknesses issued by the statutory auditors;
> Review of internal audit reports relating to internal control weaknesses and the appointment, removal and terms of remuneration of the chief internal auditor;
> Review of statement of deviations, if any:-
a) Quarterly statement of deviation(s) including report of monitoring agency, if applicable, submitted to stock exchange(s) in terms of Regulation 32 (1).
b) Annual statement of funds utilized for purposes other than those stated in the offer document/prospectus/notice in terms of Regulation 32 (7).
The Chairman of the Audit Committee has confirmed to the Board that the Audit Committee during the year under review has complied with all the roles assigned to it pursuant to the Companies Act, 2013 and Listing Regulations.
(b) Meetings of Audit Committee and attendance of members during the year During the FY2018, 4 (four) Audit Committee Meetings were held on May 5, 2017, August 3, 2017, November 1, 2017 and February
5, 2018.
Name of Director Designation Category of DirectorNo. of meetings
attended
Dr. S. Narayan Chairman Non- Executive Independent 4
Mr. Akshay Chudasama Member Non- Executive Independent 4
Mr. Robert Steinmetz Member Non- Executive Non-Independent 4
Mr. Nimesh N. Kampani Member Non- Executive Independent 2
In addition to the members of the Audit Committee, these meetings were attended by Vice Chairman & Managing Director, Chief Financial Officer, President (APMEA), President (Europe), Group Head (Corporate Accounts), Internal Auditor, Cost Auditor and Statutory Auditor of the Company, wherever necessary, and those executives of the Company who were considered necessary for providing inputs to the Committee.
The Company Secretary acts as Secretary of the Committee.
The Chairman of the Audit Committee, Dr. S. Narayan, was present at the Annual General Meeting of the Company held on July 5, 2017.
The Committee invites the Directors who are not the members of the Committee, to attend the meeting as an invitee.
(c) Role of Internal Auditor Internal Audit is an independent function within the
Company, which provides assurance to the management, on design and operating effectiveness of internal controls and systems. Internal Audit assesses and promotes strong ethics and values within the organisation and facilitates in managing changes in the business and regulatory environment. Internal Audit responsibilities encompass all locations, operating entities and geographies of the Company, in which all aspect of business, viz. operational, financial, information systems and regulatory compliances are reviewed periodically. The Internal Audit has a well laid down internal audit methodology, which emphasis on risk based internal audits using data analytics. The Internal Audit prepares a rolling annual internal audit plan, comprising of operational, financial, compliance and information systems audits, covering all the locations, operations and geographies of the Company. The audit plan for the year is reviewed and approved by the Audit Committee at the beginning of each financial year. Internal Auditor reports to both, the Chairman and Audit Committee of the Company, and therefore it is an independent function from the business.
The Internal Auditor reports on quarterly basis to the Audit Committee, the key internal audit findings, and action plan agreed with the management, the status of audits vis-à-vis the approved annual audit plan and status of open audit issues.
(d) Subsidiary Companies The Company does not have any material non-listed Indian
Subsidiary Company.
The Audit Committee of the Company reviews the financial statements, in particular the investments made by all unlisted overseas Subsidiary Companies. Significant issues pertaining to Subsidiary Companies are also discussed at Audit Committee meetings. A summarised statement of important matters reflecting all significant transactions and arrangements entered into by the Subsidiary Companies, included in the minutes of the above overseas Subsidiary Companies are placed before the Board of Directors of the Company and are duly noted by it. The performance of all its Subsidiaries is also reviewed by the Board periodically.
5. NOMINATION AND REMUNERATION COMMITTEE
(a) Constitution and Composition of the Committee The Board of Directors had constituted a Remuneration
Committee in the year 2003. The powers, role and terms of reference of the Nomination and Remuneration Committee covers the areas as contemplated under SEBI (Listing Obligations and Disclosure Requirements) Regulations, 2015 and Section 178 of the Companies Act, 2013. The present Nomination and Remuneration Committee comprises of four members which includes three Non-Executive Independent Directors viz. Dr. S. Narayan, Mr. Nimesh N.Kampani, Mr. Akshay Chudasama and the Chairman & Managing Director Mr. Onkar S. Kanwar. Dr. S. Narayan is the Chairman of the Committee.
The Nomination and Remuneration Committee has devised a policy on Board diversity in terms with the requirement under Regulation 19 of SEBI (Listing Obligations and Disclosure Requirements) Regulations, 2015.
106

Apollo Tyres Ltd Annual Report 2017-18
The Company Secretary acts as the Secretary of the Committee.
(b) Brief description of the Terms of Reference The Nomination and Remuneration Committee has been
entrusted with the responsibilities to review and grant annual increments, vary and/or modify the terms and conditions of appointment/re-appointment including remuneration and perquisites, commission etc. payable to Managing Directors within the overall ceiling of remuneration as approved by the members.
The Committee in its meeting held on May 15, 2014, noted the following terms of reference pursuant to Section 178 of the Companies Act, 2013 & Regulation 19 (4) read with Part D Schedule II of SEBI (Listing Obligations and Disclosure Requirements) Regulations, 2015:-
> Formulation of the criteria for determining qualifications, positive attributes and independence of a Director and recommend to the Board a policy, relating to the remuneration of the Directors, Key Managerial Personnel and Other Employees.
> Formulation of criteria for evaluation of performance of Independent Directors and the Board of Directors.
> Devising a policy on diversity of Board of Directors.
> Identifying persons who are qualified to become Directors and who may be appointed in senior management in accordance with the criteria laid down, and recommend to the Board their appointment and removal.
> To see that the level and composition of remuneration is reasonable and sufficient to attract, retain and motivate Directors of the quality required to run the Company successfully.
> To see that the relationship of remuneration to performance is clear and meets appropriate performance benchmarks.
> To see that remuneration to Directors, Key Managerial Personnel and Senior Management involves a balance between fixed and incentive pay reflecting short and long-term performance objectives appropriate to the working of the Company and its goals.
> The Nomination Committee shall lay down the evaluation criteria for performance evaluation of Independent Directors.
> To decide whether to extend or continue the term of appointment of the independent director, on the basis of the report of performance evaluation of Independent Directors.
(c) Policy for appointment and remuneration In terms of Section 178 of the Companies Act, 2013 and
Regulation 19 of SEBI (Listing Obligations and Disclosure Requirements) Regulations, 2015, as amended from time to time, this policy on nomination and remuneration of Directors, Key Managerial Personnel (KMP), Senior Management and other employees of the Company has
been formulated by the Nomination and Remuneration Committee of the Company and approved by the Board of Directors. The relevant extract of the aforesaid policy are given as below:
1. Criteria for Appointment of Director and Senior Management
The Committee shall consider the following factors for identifying the persons who are qualified to becoming Director and who can be appointed in Senior Management:
1.1 The Committee shall identify and ascertain the integrity, qualification, expertise and experience of the person for appointment as Director or at Senior Management level and recommend to the Board his / her appointment.
1.2 A person should possess adequate qualification, expertise and experience for the position he/she is considered for appointment. The Committee has discretion to decide whether qualification, expertise and experience possessed by a person are sufficient/satisfactory for the concerned position.
1.3 An Independent Director shall possess appropriate skills, experience and knowledge in one or more fields of finance, law, management, sales, marketing, administration, research, corporate governance, technical operations or other disciplines related to the Company’s business.
1.4 The Company may appoint or continue the employment of any person as Whole-time Director who has attained the age of seventy years subject to the approval of shareholders by passing a special resolution. The explanatory statement annexed to the notice for such motion shall indicate the justification for appointing such person.
1.5 The Company should ensure that the person so appointed as Director/Independent Director/Senior Management Personnel shall not be disqualified under the Companies Act, 2013, rules made thereunder, or any other enactment for the time being in force.
1.6 The Director/Independent Director/ Senior Management Personnel shall be appointed as per the procedure laid down under the provisions of the Companies Act, 2013, rules made thereunder, or under SEBI (Listing Obligations and Disclosure Requirements) Regulations, 2015 or any other enactment for the time being in force.
1.7 Independent Director shall meet all criteria specified in Section 149(6) of the Companies Act, 2013 and rules made thereunder and/or as specified in Regulation 16 (b) & 25 of SEBI (Listing Obligations and Disclosure Requirements) Regulations, 2015.
The term “Senior Management” means the personnel of the Company who are members of its core
107
Corporate Overview / Statutory Reports / Financial Statements

management team excluding Board of Directors, comprising of all members of management one level below the Executive Directors, including the functional heads.
The Nomination and Remuneration Committee shall have discretion to consider and fix any other criteria or norms for selection of the most suitable candidate(s).
2. Criteria for Determining Positive Attributes & Independence of Directors
Criteria for determining positive attributes: The Committee shall consider the following factors for
determining positive attributes of Directors (including Independent Directors):
2.1 Directors are to demonstrate integrity, credibility, trustworthiness, ability to handle conflict constructively, and the willingness to address issues proactively.
2.2 Actively update their knowledge and skills with the latest developments in the Tyre/Automobile industry, market conditions and applicable legal provisions.
2.3 Willingness to devote sufficient time and attention to the Company’s business and discharge their responsibilities.
2.4 To assist in bringing independent judgment to bear on the Board’s deliberations especially on issues of strategy, performance, risk management, resources, key appointments and standards of conduct.
2.5 Ability to develop a good working relationship with other Board members and contribute to the Board’s working relationship with the senior management of the Company.
2.6 To act within their authority, assist in protecting the legitimate interests of the Company, its shareholders and employees.
Criteria for determining Independence: The Independent Director shall qualify the criteria
of independence mentioned in Section 149(6) of the Companies Act, 2013 and rules related thereto and in Regulation 16 (b) & 25 of SEBI (Listing Obligations and Disclosure Requirements) Regulations, 2015.
3. Remuneration of Directors, Key Managerial Personnel (KMP) and Other Employees
On the appointment or re-appointment of Managing Director, Whole-time Director and KMPs, the Committee will recommend to the Board for their approval, the remuneration to be paid to them. The remuneration to be paid to the Senior Management Personnel and other employees shall be as per HR policy of the Company.
The annual increment of remuneration for Managing Director/Whole-time Directors shall be made on the basis of the resolution approved by the shareholders. The annual increment in Salary of KMP (other than Managing Director/
Whole-time Directors), Senior Management Personnel and other employees shall be made as per HR policy of the Company.
The level and composition of remuneration as determined by the Committee shall be reasonable and sufficient to attract, retain and motivate Directors, Key Managerial Personnel and Senior Management of the quality required to run the Company successfully.
The relationship of remuneration to performance should be clear and meet appropriate performance benchmarks. The remuneration should also involve a balance between fixed and incentive pay reflecting short and long-term performance objectives appropriate to the working of the Company and its goals:
3.1 General: 3.1.1 Nomination and Remuneration Committee
shall recommend to the Board for its approval, the remuneration, including the commission based on the net profits of the Company for the Non-Executive Directors and Whole-time Director and other Executive Directors. The remuneration shall be subject to the prior/post approval of the shareholders of the Company and Central Government, wherever required.
3.2 Remuneration to Whole-time / Executive / Managing Director
3.2.1 Fixed pay: The Whole-time Director shall be eligible
for remuneration as may be approved by the shareholders of the Company on the recommendation of the Committee and the Board of Directors. The break-up of the pay scale, performance bonus and quantum of perquisites including, employer’s contribution to P.F, pension scheme, medical expenses, club fees etc. shall be decided and approved by the Board on the recommendation of the Committee and shall be within the overall remuneration approved by the shareholders and Central Government, wherever required.
3.2.2 Minimum Remuneration: If, in any financial year, the Company has
no profits or its profits are inadequate, the Company shall pay remuneration to its Whole-time Director in accordance with the provisions of the Companies Act, 2013.
3.2.3 Provisions for excess remuneration: If any Whole-time Director draws or
receives, directly or indirectly by way of remuneration any such sums in excess of the limits prescribed under the Act or without the prior sanction of the Central Government, where required, he / she shall refund such sums to the Company and until such sum is refunded, hold it in trust for the Company. The Company shall not waive recovery of such sum refundable to it unless permitted by the Central Government.
108

Apollo Tyres Ltd Annual Report 2017-18
3.3 Remuneration to Non- Executive Independent / Non- Independent Director:
3.3.1 Sitting Fees: The Non- Executive/Independent Director
may receive remuneration by way of fees for attending meetings of Board or Committee thereof. Provided that the amount of such fees shall not exceed One lakh per meeting of the Board or Committee or such amount as may be prescribed by the Central Government from time to time. The quantum of sitting fees will be determined as per the recommendation of Nomination and Remuneration Committee and approved by the Board of Directors of the Company. Further, the boarding and lodging expenses shall be reimbursed to the Directors.
3.3.2 Commission: The profit-linked Commission shall be paid
within the monetary limit approved by the Board/Shareholders of the Company subject to the same not exceeding 1% of the net profits of the Company computed as per the applicable provisions of the Act.
3.3.3 Stock Options: Pursuant to the provisions of the Act, an
Independent Director shall not be entitled to any stock option of the Company. Only such employees of the Company and its
Subsidiaries as approved by the Nomination and Remuneration Committee will be granted ESOPs.
Criteria of making payments to Non- Executive Directors are disseminated on the website and same can be viewed at:-https://corporate.apollotyres.com/en-in/investors/corporate-governance/?filter=CodesPolicies
3.4 Remuneration to KMP, Senior Management Personnel and Other Employees
The KMP, Senior Management Personnel and other employees of the Company shall be paid monthly remuneration as per the Company’s HR policies and / or as may be approved by the Committee. The break-up of the pay scale and quantum of perquisites including, employer’s contribution to P.F, pension scheme, medical expenses, club fees etc. shall be as per the Company’s HR policies.
The annual variable pay of managers is linked to the performance of the Company in general and their individual performance for the relevant year measured against Company’s objectives fixed in the beginning of the year.
This Remuneration Policy shall apply to all future/continuing employment/engagement(s) with the Company. In other respects, the Remuneration Policy shall be of guidance for the Board.
(d) Meetings of Nomination and Remuneration Committee and Attendance of members during the year During FY2018, 2 (two) Nomination and Remuneration Committee Meetings were held on May 5, 2017 and November 1, 2017.
Name of Director Designation Category of DirectorNo. of meetings
attended
Dr. S. Narayan Chairman Non- Executive Independent 2
Mr. Onkar S. Kanwar Member Executive 2
Mr. Akshay Chudasama Member Non- Executive Independent 2
Mr. Nimesh N. Kampani Member Non- Executive Independent 2
(e) Payment of remuneration/sitting fee to the Directors etc. The details of remuneration paid to Directors during FY2018 are given below.
(i) Executive Directors/CFO /Company Secretary: Amount (` in Million)
ParticularsMr. Onkar S. Kanwar,
Managing DirectorMr.Neeraj Kanwar, Managing Director
Salary 72.00 43.20
Contribution to PF/ Superannuation/ Gratuity 56.55 25.12
Commission/ Performance Bonus 282.80 322.20
Perquisites 84.47 55.88Total Remuneration 495.82 446.40Stock Option N.A N.A
Service contracts, notice period, severance fees N.A N.A
109
Corporate Overview / Statutory Reports / Financial Statements

Amount (` in Million)
ParticularsMr. Gaurav Kumar,
Chief Financial OfficerMs. Seema Thapar,
Company Secretary
Salary 6.80 1.36
Contribution to PF/ Superannuation/ Gratuity 1.84 0.37
Commission/ Performance Bonus 9.19 1.20
Perquisites 12.66 2.45Total Remuneration 30.49 5.38Stock Option N.A N.A
Service contracts, notice period, severance fees N.A N.A
Notes:-
1) Managing Director(s) / Whole-time Director are entitled to performance linked incentive in the form of commission as approved by the members.
2) The ratio of remuneration of each Director to the median remuneration of the employees of the Company for FY2018 was as follows: Mr. Onkar S. Kanwar - 1044 and Mr. Neeraj Kanwar – 940.
3) The percentage increase in the remuneration of Mr. Onkar S. Kanwar was 8% and Mr. Neeraj Kanwar was 45% during FY2018 over the previous financial year as approved by Board and Shareholders of the Company. The increase in renumeration of Mr. Neeraj Kanwar was approved considering the key initiatives taken by him in enhancing the competitiveness of the Company’s operations.
The percentage increase in the remuneration of Mr. Gaurav Kumar, Chief Financial Officer was 19% and Ms. Seema Thapar, Company Secretary was 21% during FY2018 over the previous financial year.
The amount of total commission provided to Non-Executive Directors in FY2018 was `60 million against `60 million paid in the FY2017. There was 3.3% decrease in the remuneration by way of commission of Non-Executive Directors due to distribution of commission amongst 13 Directors in FY2018 for the full/part of the year in proportion to their tenure of Directorship as compared to commission distributed amongst 12 Directors for the full year in FY2017.
The ratios of remuneration of Non-Executive Directors to median remuneration of employees are as under:-
Name of DirectorRemuneration for
FY2018 (` in Million)Ratio to median
remuneration of employees
Mr. A.K.Purwar 4.83 10.18
Mr. Akshay Chudasama 4.83 10.18
Ms. Anjali Bansal (1) 2.00 N.A.
Gen. Bikram Singh (Retd) 4.83 10.18
Mr. Francesco Gori 4.83 10.18
Dr. M. Beena/Mr. Paul Antony(2) 4.83 10.18
Mr. Nimesh N. Kampani 4.83 10.18
Ms. Pallavi Shroff 4.83 10.18
Mr. Robert Steinmetz 4.83 10.18
Dr. S. Narayan 4.83 10.18
Mr. Sunam Sarkar 4.83 10.18
Mr.Vikram S. Mehta 4.83 10.18Mr. Vinod Rai 4.83 10.18
(1) Appointed w.e.f. November 1, 2017. (2) Govt. of Kerala nominated Dr. M. Beena as Director of the Company in place of Mr. Paul Antony w.e.f. January 30, 2018. Payment of Commission is
payable to Government of Kerala.
4) The percentage increase in the median remuneration of employees was 16.59%.
5) The total number of employees of Company as on March 31, 2018 were 12,125, out of which 7,663 were permanent employees on the rolls of the Company.
6) Average percentage increase made in the salaries of employees other than the managerial personnel in FY2018 was 9.5% whereas there was 23% increase in the managerial remuneration in FY2018.
7) Remuneration paid to the Directors is in accordance with the remuneration policy of the Company.
110

Apollo Tyres Ltd Annual Report 2017-18
ii) Non-Executive Directors: Sitting fee and commission paid/to be paid to the Non-Executive Directors is in pursuance of the resolution passed by the Board.
Name of Director Sitting fee (` in Million)Commission provided for
FY2018 (` in Million)No. of Shares held as on
March 31, 2018Mr. A. K. Purwar 0.70 4.83 5000
Mr. Akshay Chudasama 1.70 4.83 -
Ms. Anjali Bansal 0.50 2.00 -
Gen. Bikram Singh (Retd.) 0.90 4.83 -
Mr. Francesco Gori 0.60 4.83 -
Dr. M. Beena/Mr. Paul Antony (1)(2) 0.40 4.83 -
Mr. Nimesh N.Kampani 1.10 4.83 -
Ms. Pallavi Shroff 0.90 4.83 -
Mr. Robert Steinmetz 1.00 4.83 -
Dr. S. Narayan 1.60 4.83 -
Mr Sunam Sarkar 2.00 4.83 -
Mr. Vikram S. Mehta 0.60 4.83 6000
Mr. Vinod Rai 0.70 4.83 -
(1) Govt. of Kerala nominated Dr. M. Beena as Director of the Company in place of Mr. Paul Antony w.e.f. January 30, 2018. (2) Sitting fee/Commission is payable to Government of Kerala.
An amount of `60 million be paid and disbursed amongst the Directors of the Company (other than Managing Directors) equally in proportion to their tenure of Directorship for the financial year ended March 31, 2018.
No convertible instruments of the Company were outstanding as on March 31, 2018.
Apart from receiving Directors Remuneration, none of the Non-Executive Directors has any pecuniary relationships or transactions vis-a-vis the Company. However, the Company has paid a fee of `12.84 million during FY2018 to M/s. Shardul Amarchand Mangaldas & Co., Solicitors & Advocates, in which Ms. Pallavi Shroff & Mr. Akshay Chudasama are Managing Partners.
4. Directors and Officers Liability Insurance (D&O) As per the provisions of the Companies Act, 2013, the
Company has taken a Directors and Officers Liability Insurance (D&O) on behalf of all Directors including Independent Directors, Officers, Managers and Employees of the Company for indemnifying any of them against any liability in respect of any negligence, default, misfeasance, breach of duty or breach of trust for which they may be guilty in relation to the Company.
6. STAKEHOLDERS RELATIONSHIP COMMITTEE
Stakeholders Relationship Committee looks after the share transfer work besides redressal of shareholders complaints.
The Board of Directors of the Company has with a view to expediting the process of share transfers delegated the power of share transfer upto 10,000 shares to Company Secretary who attend to share transfer formalities as and when required. The share transfer requests for shares beyond the aforesaid limits are processed by the Committee itself.
(a) Constitution and Composition of the Committee The present Stakeholders Relationship Committee
comprises of following five Directors viz. Dr. S. Narayan, Mr. Onkar S. Kanwar, Mr. Neeraj Kanwar, Mr. Sunam Sarkar and Ms. Pallavi Shroff. Dr. S. Narayan, Independent Director, acts as the Chairman of the Committee.
Pursuant to Regulation 6 of SEBI (Listing Obligations and Disclosure Requirements) Regulations, 2015, Ms. Seema Thapar, Company Secretary, acts as the Compliance Officer and Secretary to the Committee.
(b) Terms of reference This Committee has been formed with a view to undertake
the following: -
> Approval of transfer/transmission of shares/debentures issued by the Company, issue of duplicate certificates and certificates after split/consolidation/ replacement.
> Looking into the redressal of shareholders’ and investors’ complaints and other areas of investor services.
(c) Meetings of Stakeholders Relationship Committee and attendance of members during the year During FY2018, 10 (ten) meetings of the Stakeholders Relationship Committee were held on April 21, 2017, July 10, 2017, August
4, 2017, September 11, 2017, October 10, 2017, November 3, 2017, November 27, 2017, December 21, 2017, February 1, 2018 and March 16, 2018.
Name of Director Designation Category of DirectorNo. of meetings
attended
Dr. S. Narayan Chairman Non-Executive Independent 1
Mr. Onkar S. Kanwar Member Executive 10
Mr. Neeraj Kanwar Member Executive 6
Mr. Sunam Sarkar Member Non-Executive Non-Independent 7
Ms. Pallavi Shroff Member Non-Executive Independent 3
The Committee was reconstituted on May 10, 2018 and comprise of Mr. Sunam Sarkar (Chairman), Mr. Onkar S. Kanwar (Member) and Mr. Akshay Chudasama (Member).
111
Corporate Overview / Statutory Reports / Financial Statements

(d) No. of shareholders’ complaints received During FY2018, the Company received 19 complaints. As
on date, no complaints are pending other than those, which are under litigation, disputes or court orders. All other complaints were attended and resolved to the satisfaction of the shareholders.
7. CORPORATE SOCIAL RESPONSIBILITY (CSR) COMMITTEE
(a) A brief outline of the Company’s CSR Policy The Company is committed to incorporating policies,
systems and approaches to achieve its positive impact growth objectives. Deeply inherent in our vision statement are the principles of sustainability. The CSR approach stems from our vision statement focusing on “continuously enhancing stakeholder value”, which includes the larger society and environment in which the Company operates. The CSR philosophy of the Company rests on the principle of sustainability and self reliance. It also embeds a dimension of philanthropy. At the core of Apollo’s responsibility belief
is stakeholder engagement. Consequently, all the projects the Company has link to its stakeholders, the issues they face and the issues organization has identified to support on philanthropy front.
(b) Composition of CSR Committee The Board of Directors had constituted a Corporate Social
Responsibility Committee in the year 2014. The present Corporate Social Responsibility Committee comprises of following four Directors viz. Mr. Onkar S. Kanwar, Ms. Anjali Bansal, Mr. Sunam Sarkar and General Bikram Singh (Retd.). CSR Committee was reconstituted on November 1, 2017 by inducting Ms. Anjali Bansal as a member of the Committee in place of Dr. S. Narayan. Mr.Onkar S. Kanwar acts as the Chairman of the Committee.
(c) Meeting of CSR Committee and attendance of members during the year
During FY2018, 3(three) meetings of CSR Committee were held on May 5, 2017, November 1, 2017 and February 6, 2018.
Name of Director Designation Category of DirectorNo. of meetings
attended
Mr. Onkar S. Kanwar Chairman Executive 3
Ms. Anjali Bansal (appointed as Member w.e.f. November 1, 2017)
Member Non-Executive Independent 1
Dr. S. Narayan (ceased as Member w.e.f. November 1, 2017)
Member Non-Executive Independent 2
Mr. Sunam Sarkar Member Non-Executive Non-Independent 3
Gen. Bikram Singh (Retd.) Member Non-Executive Independent 2
Your Company has also laid down a CSR Policy in order to execute its various CSR Initiatives.
The Company Secretary acts as the Secretary to the Committee.
8. BUSINESS RESPONSIBILITY (BR) COMMITTEE
SEBI (Listing Obligations and Disclosure Requirements) Regulations, 2015, mandates the top 500 listed Companies by market capitalisation to provide Business Responsibility Report (“BR Report”) in their Annual Report describing the initiatives taken by the Company from an environmental, social and governance perspective in the format specified by the SEBI.
The Company follows following nine core principles as prescribed by SEBI and the entire BR Report is based on actions taken by the Company for the adoption of these principles:
i. Businesses should conduct and govern themselves with Ethics, Transparency and Accountability.
ii. Businesses should provide goods and services that are safe and contribute to sustainability throughout their life cycle.
iii. Businesses should promote the wellbeing of all employees.
iv. Businesses should respect the interests of, and be responsive towards all stakeholders, especially those who are disadvantaged, vulnerable and marginalized.
v. Businesses should respect and promote human rights.
vi. Business should respect, protect, and make efforts to restore the environment.
vii. Businesses, when engaged in influencing public and regulatory policy, should do so in a responsible manner.
viii. Businesses should support inclusive growth and equitable development.
ix. Businesses should engage with and provide value to their customers and consumers in a responsible manner.
The Board of Directors at the meeting held on May 10, 2016, had constituted a Business Responsibility (BR) Committee.
(a) Composition of BR Committee The BR Committee comprises of following four Directors viz.
Mr. Onkar S. Kanwar, Mr. Neeraj Kanwar, Mr. Sunam Sarkar and Mr. Akshay Chudasama. Mr. Onkar S. Kanwar acts as the Chairman of the Committee.
(b) Meeting of BR Committee and attendance of members during the year
During FY2018, a meeting of BR Committee was held on May 5, 2017.
Name of Director Designation Category of DirectorNo. of meetings
attended
Mr. Onkar S. Kanwar Chairman Executive 1
Mr. Neeraj Kanwar Member Executive 1
Mr. Sunam Sarkar Member Non-Executive Non-Independent 1
Mr. Akshay Chudasama Member Non-Executive Independent 1
The Company Secretary acts as the Secretary to the Committee.
112

Apollo Tyres Ltd Annual Report 2017-18
9. CEO/CFO CERTIFICATION
The Managing Director and CFO have submitted certificate, in terms of Regulation 17(8) read with Part B of Schedule II of SEBI (Listing Obligations and Disclosure Requirements) Regulations, 2015, to the Board.
10. GENERAL BODY MEETINGS
(a) The last three Annual General Meetings were held as under:
Financial Year Date Time Venue Special Resolution Passed
2016-2017 July 5, 2017 10:00 AM Kerala Fine Arts Theatre, Fine Arts Avenue, Foreshore Road, Ernakulam, Kochi (Kerala)
The following resolutions were passed as Special Resolution:-
1) Re-appointment of Mr. Onkar S. Kanwar as Managing Director.
2) Authorization for Private Placement of NCDs.
2015-2016 August 9, 2016 -do- -do- No Special Resolution was passed.
2014-2015 August 11, 2015 -do- -do- No Special Resolution was passed.
(b) Resolutions passed last year through Postal Ballot: No Special Resolution was passed through Postal Ballot
during FY2018.
As on the date of this report, your Company does not propose to pass any Special Resolution for the time being by way of Postal Ballot.
11. DISCLOSURES
(a) Related Party Transactions In Compliance with Section 188 of the Companies Act,
2013, Regulation 23 of SEBI (Listing Obligations and Disclosure Requirements) Regulations, 2015 and rules as applicable, the Company has framed a Policy on Related Party Transactions including policy on materiality of related party transactions. The policy is to regulate transactions between the Company and its related parties based on the laws and regulations applicable to the Company. The policy has become effective from October 1, 2014.
During the year, no transaction of material nature has been entered into by the Company with its Promoters, the Directors or the Management, their subsidiary or relatives etc. that may have a potential conflict with the interests of the Company. Related Parties transactions with them as required under Indian Accounting Standard (Ind AS-24) are furnished under Notes on Accounts attached with the financial statements for the year ended March 31, 2018.
(b) Disclosure of accounting treatment There has not been any change in accounting policies of the
Company during the year.
(c) Risk Management The Company’s activities expose it to a variety of risks
including market risk, sales risk, raw material risk, regulatory risk, product liability and liquidity risk etc. The Company’s overall risk management seeks to minimise potential adverse effects on its performance.
A Risk Management Steering Committee of the Company has been formed headed by President (APMEA) and President (Europe) as Chairman of the respective Committees and represented by the functional heads as Chief Risk officers. The Committees embraces the identification, assessment,
mitigation, monitoring and reporting of material risks faced by the Company.
The Risk Management Steering Committee meets quarterly and discusses the updated profiles of major risks in each functional area together with possible mitigation controls and action plans. The objective is to assist the Board to maintain high standards of business conduct and to protect the Company’s assets, achieve sustainable business growth and ensure compliances with applicable legal and regulatory requirements.
The Company has made its Risk Charter and Risk Register etc. on the basis of comprehensive study undertaken by an independent consultancy firm to frame a risk management policy/internal control frame work. The risks duly aligned with the organisation objectives, documented in form of risk register are placed before Audit Committee, at its meeting(s). The Board/Audit Committee periodically reviews the risks and opportunities and plans to mitigate the same.
(d) Compliance by the Company The Company has materially complied with the requirements
of the SEBI and other statutory authorities on all matters relating to capital markets during the last three years. No penalties or strictures have been imposed on the Company by the stock exchanges, SEBI or any other statutory authorities relating to the above. The Company has developed an integrated compliance dashboard which provides reasonable assurance to the Management and the Board of Directors regarding effectiveness of timely compliances. All the compliances applicable to the Company have been captured in the Dash Board and are mapped amongst the respective users. The time lines are fixed based on the legal requirement and the system is aligned in such a manner that it alerts the users on a timely manner.
The Company in order to further strengthen its compliance reporting and management system for its overseas subsidiaries, had also rolled out a Global Regulatory Compliance System (“Compliance Management System/Tool”).
The Compliance dashboard captures the compliances applicable to the Company at Indian level as well as the international laws applicable to the overseas subsidiaries. The Compliance dashboard also covers the compliances relating to the codes and policies.
113
Corporate Overview / Statutory Reports / Financial Statements

The dashboard has been documented to provide a comprehensive view of:
> applicable laws to the Company
> key control points
> allocation of responsibilities
(e) Transfer of Unclaimed/Undelivered Shares In terms with the provisions of Regulation 39 (4) read with Schedule VI of SEBI (Listing Obligations and Disclosure Requirements)
Regulations, 2015, the unclaimed/undelivered shares lying in the possession of the Company are required to be dematerialised and transferred into a “Unclaimed Suspense Account” held by the Company. The status of unclaimed shares as on March 31, 2018 lying in “Unclaimed Suspense Account”/ “Transferred to IEPFA Account” is as under:-
Particulars No. of Shareholders No. of shares
Aggregate number of shareholders and the outstanding shares in the suspense account lying at the beginning of the year, i.e. April 1, 2017
2,034 1,404,300
Number of shareholders who approached to the Company for transfer of shares from suspense account during the year
10 10,000
Number of shareholders to whom shares were transferred from suspense account during the year
10 10,000
Shares transferred to IEPFA Account 1,723 1,093,760
Aggregate number of shareholders and the outstanding shares in the suspense account lying at the end of the year, i.e. March 31, 2018
301 300,540
In terms of Section 124(6) of the Companies Act, 2013 (“Act”) read with Rule 6 of Investors Education and Protection Fund Authority (Accounting, Audit, Transfer and Refund) Rules, 2016 (as amended from time to time) (“Rules”), members whose dividend amount has not been paid or claimed for seven consecutive years or more, shares held by them shall be credited to the DEMAT Account of the Investor Education and Protection Fund Authority (IEPFA). During FY2018, 2,037,549 shares held by aforesaid members, were transferred to the DEMAT Account of IEPFA constituted in accordance with the Rules, on November 30, 2017.
The unclaimed or unpaid dividend which have already been transferred and the shares which are transferred, can be claimed back by the shareholders from IEPFA by following the procedure given on its website i.e. http://iepf.gov.in/IEPFA/refund.html
Shareholders who have not yet claimed their shares are requested to immediately approach the Company by forwarding a request letter duly signed by all the shareholders furnishing aforesaid details to enable the Company to credit/ issue the shares to the rightful owner.
It may be noted that all the corporate benefits accruing on these shares like bonus, splits etc. also will be credited to the said “Unclaimed Suspense Account”/”Demat Account” and the voting rights on these shares shall remain frozen until the rightful owner has claimed the shares.
(f) Disclosure in terms of Regulation 34 (3) read with Schedule V Part C of SEBI (Listing Obligations and Disclosure Requirements) Regulations, 2015
There are no inter-se relationships between the Board members except Mr. Onkar S. Kanwar and Mr. Neeraj Kanwar being father and son.
12. MEANS OF COMMUNICATION
> As per Regulation 47(1)(b) of the SEBI (Listing Obligations and Disclosure Requirements) Regulations, 2015, an extract of the detailed format of Quarterly/Annual Financial Results are filed with the Stock Exchanges under Regulation 33 of
the SEBI (Listing Obligations and Disclosure Requirements) Regulations, 2015. The results in prescribed format are published in the Newspapers viz. Financial Express (National Daily) and Mangalam/Kerala Kaumudi (Regional Daily). The Quarterly/Annual Financial Results are also available on the Company’s website and Stock Exchange websites www.nseindia.com and www.bseindia.com.
> All material information about the Company is promptly sent to the stock exchanges and the Company regularly updates the media and investor community about its financial as well as other organisational developments.
> The transcript of the Analyst/Investor Conference Call is posted on the website of the Company.
13. GENERAL SHAREHOLDER INFORMATION
(a) Registered Office 3rd Floor Areekal Mansion, Near Manorama Junction, Panampilly Nagar, Kochi- 682036, Kerala Ph:-91 484 4012046, 4012047 Fax: 91 484 4012048
(b) Annual General Meeting: - Date August 1, 2018 - Day Wednesday - Time 10:00 AM - Venue Kerala Fine Arts Theatre, Fine
Arts Avenue, Foreshore Road, Ernakulam, Kochi (Kerala)
- Posting of Annual Report On or before July 8, 2018. - Last date of receipt of
Proxy formJuly 30, 2018 before 10:00 AM
(c) Financial Calendar for FY2019 Financial Reporting for the quarter ending June 30, 2018:
On or before August 14, 2018.
Financial Reporting for the quarter ending September 30, 2018: On or before November 14, 2018.
114

Apollo Tyres Ltd Annual Report 2017-18
Financial Reporting for the quarter ending December 31, 2018: On or before February 14, 2019.
Financial Reporting for the quarter/year ending March 31, 2019: On or before May 30, 2019.
(d) Dates of Book-Closure The dates of the book closure shall be from July 20, 2018 to
August 1, 2018 (both days inclusive).
(e) Dividend Payment The dividend of ̀ 3/- per equity share for the FY2018, subject
to approval from shareholders, has been recommended by the Board of Directors. The same shall be paid on or after August 1, 2018 but within the statutory time limit.
(f) Unclaimed Dividends In terms of Section 124(5) of the Companies Act, 2013 (“Act”) if
a member does not claim the dividend amount for a consecutive period of seven years or more, the unclaimed amount shall be transferred to the Investor Education and Protection Fund (IEPF) established by the Central Government.
During the year, the Company had transferred ̀ 3,474,334/- lying unclaimed in Unpaid Dividend Account in respect of Dividend for the year 2009-10 to the said Fund on October 3, 2017.
(g) Listing at Stock Exchanges 1. National Stock Exchange of India Ltd Exchange Plaza, Bandra Kurla Complex, Bandra (E), Mumbai-400 051 T: +91 22 26598100-14 F: +91 22 26598237-38 E: [email protected]
2. BSE Ltd Phiroje Jeejeebhoy Towers, 1st Floor, Dalal Street Mumbai 400 001 T: +91 22 22721233/34 F: +91 22 22721919/3027 E: [email protected]
The annual listing fee for FY2019 has been paid to all the aforesaid stock exchanges.
(h) Stock Code
BSE Ltd. 500877
National Stock Exchange of India Ltd. APOLLOTYRE
(i) Stock Market Price Data for the year FY2018: The Company’s share price on NSE and Nifty Index
MonthNSE
Volume (in million)Nifty Index
High (`) Low (`) High Low
April, 2017 249.90 208.65 75.72 9,367.15 9,075.15
May, 2017 254.25 217.25 83.31 9,649.60 9,269.90
June, 2017 266.60 227.50 94.00 9,709.30 9,448.75
July, 2017 269.90 241.00 66.59 10,114.85 9,543.55
August, 2017 288.45 246.15 117.21 10,137.85 9,685.55
September, 2017 269.00 239.30 63.53 10,178.95 9,687.55
October, 2017 249.70 236.00 55.72 10,384.50 9,831.05
November, 2017 259.60 228.15 69.59 10,490.45 10,094.00
December, 2017 271.50 236.80 58.15 10,552.40 10,033.35
January, 2018 288.65 250.75 58.76 11,171.55 10,404.65
February, 2018 279.95 229.55 70.69 11,117.35 10,276.30
March, 2018 281.80 250.50 45.64 10,525.50 9,951.90
The Company’s share price on BSE and Sensex
MonthBSE
Volume (in million)Sensex
High (`) Low (`) High Low
April, 2017 249.90 209.00 11.34 30,184.22 29,241.48
May, 2017 253.00 217.50 7.99 31,255.28 29,804.12
June, 2017 266.40 227.80 8.96 31,522.87 30,680.66
July, 2017 270.00 242.00 6.32 32,672.66 31,017.11
August, 2017 288.30 246.30 9.21 32,686.48 31,128.02
September,2017 268.75 240.00 4.57 32,524.11 31,081.83
October, 2017 249.95 236.00 3.70 33,340.17 31,440.48
November, 2017 259.50 228.30 4.76 33,865.95 32,683.59
December, 2017 271.00 236.75 3.64 34,137.97 32,565.16
January, 2018 288.80 251.00 3.07 36,443.98 33,703.37
February, 2018 279.90 229.60 4.61 36,256.83 33,482.81
March, 2018 279.50 251.00 1.87 34,278.63 32,483.84
115
Corporate Overview / Statutory Reports / Financial Statements

(j) Shares Traded during April 1, 2017 to March 31, 2018
Particulars BSE NSE
No. of shares traded (in million) 70.04 858.91
Highest Share Price (in ` ) 288.80 288.65
Lowest Share Price (in ` ) 209.00 208.65
Closing Share Price (as on March 31, 2018) 275.40 277.05
Market Capitalization (as on March 31, 2018) (in ` in Million) 157,542.56 158,486.45
(k) Elimination of Duplicate Mailing The shareholders who are holding physical shares in more
than one folio in identical name, or in joint holder’s name in similar order, may send the Share Certificate(s), along with request for consolidation of holding in one folio, to avoid mailing of multiple annual reports.
(l) Share Transfer System To expedite the share transfer in physical segment,
Stakeholders Relationship Committee has authorised Company Secretary to approve transfer of securities upto 10,000 received from individuals on weekly basis. In case of approval of transfer of securities over 10,000, the Stakeholders Relationship Committee meets at periodical intervals. In any case, all share transfers are completed within the prescribed time limit from the date of receipt, if
document meets the stipulated requirement of statutory provisions in all respects. In reference to SEBI directives, the Company is providing the facility for transfer and dematerialization of securities simultaneously. The total no. of shares transferred during the year were 64,370. All the transfers were completed within stipulated time.
As per the requirement of Regulation 40(9) of SEBI (Listing Obligations and Disclosure Requirements) Regulations, 2015, the Company has obtained the half yearly certificates from the Company Secretary in practice for due compliance of share transfer formalities.
(m) Distribution of Shareholding The following is the distribution of shareholding of equity
shares of the Company as on March 31, 2018:-
Category No. of Shareholders % of Shareholders No. of Shares Held % of shareholding
UPTO 5000 132,797 99.30 30,934,356 5.41
5001 - 10000 396 0.30 2,935,078 0.51
10001 - 20000 137 0.10 1,981,602 0.34
20001 - 30000 54 0.04 1,318,192 0.23
30001 - 40000 35 0.02 1,224,790 0.21
40001 - 50000 21 0.02 948,523 0.17
50001 - 100000 62 0.04 4,489,325 0.79
100001 and Above 234 0.18 528,218,114 92.34
Total 133,736 100.00 572,049,980 100.00
The Promoter and Promoter group hold 230.68 million shares constituting 40.32% of the share capital of the Company as on March 31, 2018.
(n) Reconciliation of Share Capital Audit As stipulated by SEBI, a qualified Company Secretary in
practice conducts the Reconciliation of Share Capital Audit of the Company for the purpose of reconciliation of total admitted capital with the depositories, i.e. NSDL and CDSL, and the total issued and listed capital of the Company.
The Company Secretary in practice conducts such audit in every quarter and issues a Reconciliation of Share Capital Audit Certificate to this effect to the Company. A copy of such audit report is submitted to the stock exchanges, where the Company’s shares are listed and is also placed before the Board.
(o) Dematerialisation of Shares and Liquidity The equity shares of the Company are being traded under
compulsorily demat form as per SEBI notification. The Company’s shares are tradable compulsorily in electronic form and are available for trading in the depository systems of both National Securities Depository Ltd. (NSDL) and Central Depository Services (India) Ltd. (CDSL). The International
Securities Identification Number (ISIN) of the Company, as allotted by NSDL and CDSL, is INE438A01022.
As on March 31, 2018, 98.34% of the share capital stands dematerialised. BSE and NSE have permitted trading of Apollo Tyres’ share into future and option (F&O) segment w.e.f. February 19, 2010.
(p) Share Transfer/Demat Registry work All share transfers/demat are being processed in house. The
Company has established direct connectivity with NSDL/CDSL for carrying out demat completely in house.
(q) Share Transfer Department All communications regarding change of address for shares
held in physical form, dividend etc. should be sent at the Company’s Corporate Office at:-
Apollo Tyres Ltd Apollo House, 7, Institutional Area Sector-32, Gurgaon–122 001(Haryana) T: +91 124 2721000 F: +91 124 238 3351 E: [email protected]
116

Apollo Tyres Ltd Annual Report 2017-18
(r) ECS Mandate All shareholders are requested to update their bank account
details with their respective depositories urgently. This would facilitate transfer of dividend directly to the bank account of the shareholders.
(s) E-Voting To widen the participation of shareholders in Company
decisions pursuant to provisions of Section 108 of Companies Act, 2013 read with Rule 20 of The Companies (Management and Administration) Rules, 2014 as amended, the Company has provided e-voting facility to its shareholders, in respect of all shareholder’s resolutions to be passed at General Meeting.
Register e-mail address To contribute towards greener environment, the Company
proposes to send documents like shareholders meeting notice/other notices, audited financial statements board’s report, auditors’ report or any other document, to members in electronic form at the e-mail address provided by them and/or available to the Company by the Depositories.
Members who have not yet registered their e-mail address (including those who wish to change their already registered e-mail address) may get the same registered/updated either with their depository participants or by writing to the Company.
(t) Plant Location: 1. Perambra, P O Chalakudy, Trichur 680689, Kerala
2. Limda, Taluka Waghodia, Dist. Vadodara 391760, Gujarat
3. SIPCOT Industrial Growth Centre, Oragadam, Chennai, Tamil Nadu
4. Kalamassery, Alwaye, Kerala – 683 104
5. Ir. E.L.C. Schiffstraat 370, 7547 RD Enschede, The Netherlands
6. H-3212 Gyöngyöshalász, Road no.: 3210, Plot no.: 0106, Hungary
(u) Address for correspondence for share transfer/demat of shares, payment of dividend and any other query relating to shares.
Secretarial Department Apollo Tyres Ltd. Apollo House, 7, Institutional Area, Sector 32, Gurgaon 122001 Tel: +91 124 2721000
(v) As on March 31, 2018, there were no outstanding GDRs/ADRs/Warrants or any convertible instruments.
(w) Adoption of mandatory and discretionary requirements of Corporate Governance as specified in Regulations 17 to 27 and Regulation 34 (3) read with Schedule V (C) of the SEBI (Listing Obligations and Disclosure Requirements) Regulations, 2015
The Company has complied with all mandatory requirements of corporate governance with respect to Regulations 17 to 27
of SEBI (Listing Obligations and Disclosure Requirements) Regulations, 2015. The Company has adopted following discretionary requirement of Regulation 27 read with Schedule II Part E of the Listing Regulations:-
Modified Opinion(s) in audit report The Company is in the regime of financial statements with
unmodified audit opinion.
Reporting of internal auditor The internal auditor is reporting directly to the Audit
Committee.
(x) As on March 31, 2018, our shares were not suspended from trading.
(y) There were no commodity price risk or foreign exchange risk and hedging activities during the FY2018.
14. ADDITIONAL INFORMATION
(a) Investor Relations Section The Investors Relations Section is located at the Corporate
Office of the Company.
Contact person : Ms. Seema Thapar, Compliance Officer
Time : 10:00 AM to 6:00 PM on all working days of the Company (except Saturdays and Sundays)
T: : +91 124 2721000
F: : +91 124 2383351E: : [email protected]
(b) Bankers Axis Bank Ltd. Bank of India BNP Paribas Canara Bank Citibank N.A. Federal Bank ICICI Bank Ltd. IDBI Bank Ltd. Kotak Mahindra Bank Ltd. Mizuho Bank Ltd Standard Chartered Bank State Bank of India Sumitomo Mitsui Banking Corporation The Bank of Nova Scotia The Bank of Tokyo-Mitsubishi UFJ Ltd. The Hongkong and Shanghai Banking Corporation Limited Union Bank of India
(c) Credit Rating For our bank facilities and other debt programs CRISIL has
provided us a long-term rating of ‘CRISIL AA+/ Stable’ and a short-term rating of ‘CRISIL A1+’.
(d) Auditors M/s. Walker Chandiok & Co LLP, Chartered Accountants.
(e) Cost Auditors M/s. N.P. Gopalakrishnan & Co., Cost Accountants.
117
Corporate Overview / Statutory Reports / Financial Statements

With reference to the General Circular No. 15/2011 – 52/5/CAB-2011 dated April 11, 2011, issued by the Government of India, Ministry of Corporate Affairs, Cost Audit Branch, New Delhi, following are the details of Cost Auditor and filing of cost audit report with Central Government:
Particulars of the Cost AuditorDetails of Cost Audit Report filed for the period ended March 31, 2017
Mr. N. P. Sukumaran(M No.4503)Apartment No.311,4th Floor, D. D. Vyapar Bhawan,K.P. Vallon Road, Kadavanthra P O,Kochi - 682 020(Kerala)E-mail : [email protected]
Filing date: September 7, 2017
(f) Code of Conduct for Prevention of Insider Trading In compliance with the SEBI regulations on prevention
of insider trading, the Company has formulated a comprehensive Code of Conduct for ‘Prevention of Insider Trading’ in the securities of the Company. This Code of Conduct is applicable to Promoters, Directors, Chiefs, Group Heads, Heads and such other employees of the Company who are expected to have access to unpublished price sensitive information.
The Board at its meeting held on May 12, 2015, has approved the revised Code of Conduct for Prevention of Insider Trading, in terms with the SEBI (Prohibition of Insider Trading) Regulations, 2015, effective from May 15, 2015.
The Code of Conduct lays down guidelines advising them on procedures to be followed and disclosures to be made while dealing with the shares of the Company, and cautioning them of consequences of violations. The Company Secretary of the Company is the Compliance Officer.
(g) Code of Conduct for Directors and Senior Management The Board of Directors of Apollo Tyres Ltd. has laid down a
code of business conduct called “The Code of Conduct for Directors and Senior Management”. The Code envisages that Board of Directors and Senior Management must act within the bounds of the authority conferred upon them and with a duty to make and keep themselves informed about the development in the industry in which the Company is involved and the legal requirements to be fulfilled.
The Code is applicable to all the Directors and Senior Management of the Company. The Company Secretary of the Company is the Compliance Officer.
(h) Whistle Blower Policy/ Vigil Mechanism Apollo Tyres Ltd. believes in the conduct of its business
affair in a fair and transparent manner by adopting highest standards of professionalism, honesty, integrity and ethical behavior. In order to inculcate accountability and transparency in its business conduct, the Company has been constantly reviewing its existing systems and procedures. Your Company has approved a Whistle Blower Policy which will enable all employees, Directors and other stakeholders to raise their genuine concerns internally in a responsible and effective manner if and when they discover information
which they believe shows serious malpractice or irregularity within the Company and/or to report to the management instances of unethical behavior, actual or suspected, fraud or violation of Company’s Code of Conduct or Ethics Policy.
In terms with the policy, an Internal Grievance Redressal Committee (IC) has been constituted by the Company, which is headed by the Chairman of the Audit Committee of the Board. Company Secretary of the Company acts as an Ombudsman who, on receipt of complaint, examines the possible intentions and genuineness of the disclosure in advance before referring it to the IC for investigations. The IC, after investigation, submits a report to the Audit Committee.
(i) Code of Practices and Procedures for Fair Disclosure The Board at its meeting held on May 12, 2015, has approved
the Code of Practices and Procedures for Fair Disclosure of Unpublished Price Sensitive Information, in terms with the SEBI (Prohibition of Insider Trading) Regulations, 2015, effective from May 15, 2015.
The Code lays down broad standards of compliance and ethics, as required by SEBI (Listing Obligations and Disclosure Requirements) Regulations, 2015 and other applicable SEBI regulations. The Code is required to be complied in respect of all corporate disclosures in respect of the Company and/or its Subsidiary Companies, including Overseas Subsidiaries.
The Company Secretary of the Company is the Compliance Officer.
(j) Policy to prevent and deal with sexual harassment The Company is an equal employment opportunity employer
and is committed to creating a healthy and productive work environment that enables employees to work without fear of prejudice, gender bias and sexual harassment. The Company believes that an act of sexual harassment results in the violation of the fundamental rights. Such acts violate the right to equality, right to life and to live with dignity and right to practice any profession or to carry on any occupation, trade or business, which also includes a right to have a safe and healthy work environment free from sexual harassment.
In keeping with its belief and in terms of the Sexual Harassment of Women at Workplace (Prevention, Prohibition and Redressal) Act, 2013 and Rule thereof, the Company adopts the policy to prevent and deal with sexual harassment at the workplace. The Company is committed to provide to all employees who are present at the workplace, a work environment free from sexual harassment, intimidation and exploitation.
(k) Familiarisation Programme for Independent Directors The Company has adopted a familiarisation programme
for Independent Directors with an objective of making the Independent Directors of the Company accustomed with the business and operations of the Company through various structured oriented programme. The familiarisation programme also intends to update the Directors on a regular basis on any significant changes therein so as to be in a position to take well informed and timely decision.
118

Apollo Tyres Ltd Annual Report 2017-18
The details of familiarisation programme imparted to Independent Directors during FY2018 are available on the website of the Company.
(l) Succession Policy In terms with the Nomination & Remuneration Policy of
the Company, the Nomination & Remuneration Committee periodically reviews the succession policy and assist the Board in ensuring that the plans are in place for succession for appointments to the Board and to Senior Management.
(m) Shareholders Satisfaction Survey An online survey is posted on the Company’s website at https://
s3.eu-central-1.amazonaws.com/apolloproducts/3985/shareholder-satisfaction-survey.pdf. Shareholders who have not yet participated in the survey can go to the above link and take part in the survey and provide us their valuable feedback.
(n) Dividend Distribution Policy The Company has formulated a Dividend Distribution Policy
in compliance of Regulation 43A of Listing Regulations which inter-alia specifies the external and internal factors including financial parameters that shall be considered while declaring dividend and the circumstances under which the shareholders of the Company may or may not expect dividend. Dividend Distribution Policy is available on the website of the Company at https://corporate.apollotyres.com/en-in/investors/corporate-governance/?filter=CodesPolicies.
The dividend declared in last five years are as follows:
Period Dividend (%)
FY2017 300FY2016 200FY2015 200FY2014 75FY2013 50
o) Global Code of Conduct The Company has designed a global “Code of Conduct Policy”
(“Code”) to conduct its business with honesty and integrity and in compliance with all applicable legal and regulatory requirements. This Code sets out the fundamental standards to be followed by all employees of the Company including
Associates, Subsidiaries and Joint Ventures. The Company has rolled out mandatory online training of all the employees for successful implementation of the Code.
(p) Governance of Subsidiary Companies The Company has a well-established corporate governance
framework to create sound governance practices and promote best practices for its various Subsidiaries in multiple jurisdictions across the world. The Company ensures that the governance of Subsidiaries especially the material Subsidiaries reflect the same values, ethics, controls and processes as being followed at the parent Company level.
The Company maintains close relationship with the Subsidiaries Board and regularly review and encourage regular feedback on the operation of subsidiary governance framework. The Company follows a fair, transparent and ethical governance practices for its overseas Subsidiaries which is essential for achieving long term corporate goals and to enhance stakeholder’s value.
(q) General Data Protection Regulation (GDPR) We have initiated the GDPR to perform detailed analysis of
our organization to ensure GDPR compliance. We will be analysing the regulations, their applicability and impact on our organization and a clear roadmap to ensure we address any potential gaps which require remediation to ensure compliance.
(r) Declaration by Independent Directors under sub-section (6) of Section 149 & Regulation 16 (1) (b) of the SEBI (Listing Obligations and Disclosure Requirements) Regulations, 2015
During FY2018, the Company received declaration in terms of the provisions of Section 149(6) & 149(7) of the Companies Act, 2013 and Regulation 16(1)(b) of SEBI (Listing Obligations and Disclosure Requirements) Regulations, 2015, from the following Independent Directors viz. Mr. A. K. Purwar, Mr. Akshay Chudasama, Ms. Anjali Bansal, Gen. Bikram Singh (Retd.), Mr. Nimesh N. Kampani, Ms. Pallavi Shroff, Dr. S. Narayan, Mr. Vinod Rai and Mr. Vikram S. Mehta.
119
Corporate Overview / Statutory Reports / Financial Statements

(s) Web link for various documents The following documents/information are linked with the website of the Company, i.e. www.apollotyres.com:-
Particulars Web linkFamiliarization programme for Independent Directors
https://corporate.apollotyres.com/en-in/investors/directors-information/?filter=Familiarisation Programme
Policy for determining ‘material’ subsidiaries
https://corporate.apollotyres.com/en-in/investors/corporate-governance/?filter=CodesPolicies
Policy on Related Party Transactions
https://corporate.apollotyres.com/en-in/investors/corporate-governance/?filter=CodesPolicies
CSR policy https://corporate.apollotyres.com/en-in/investors/corporate-governance/?filter=CodesPoliciesCode of Conduct for Directors and Senior Management
https://corporate.apollotyres.com/en-in/investors/corporate-governance/?filter=CodesPolicies
Whistle Blower Policy/Vigil Mechanism
https://corporate.apollotyres.com/en-in/investors/corporate-governance/?filter=CodesPolicies
Policy on preservation and archival of documents
https://corporate.apollotyres.com/en-in/investors/corporate-governance/?filter=CodesPolicies
Policy on determination of materiality of events or information
https://corporate.apollotyres.com/en-in/investors/corporate-governance/?filter=CodesPolicies
Code of Practices and Procedures for Fair Disclosure of UPSI
https://corporate.apollotyres.com/en-in/investors/corporate- governance/?filter=CodesPolicies
Dividend Distribution Policy https://corporate.apollotyres.com/en-in/investors/corporate-governance/?filter=CodesPolicies
Declaration Affirming Compliance of provisions of the Code of Conduct To the best of my knowledge and belief and on the basis of declarations given to me, I hereby affirm that all the Board members
and the Senior Management Personnel have fully complied with the provisions of the Code of Conduct for Directors and Senior Management Personnel during the financial year ended March 31, 2018.
Declaration Affirming Compliance of Whistle Blower Policy To the best of my knowledge and belief, I hereby affirm that no personnel of the Company has been denied access to the Audit
committee during FY2018
For and on behalf of Board of Directors
Place: Gurgaon ONKAR S. KANWARDate: May 10, 2018 Chairman & Managing Director
120

Apollo Tyres Ltd Annual Report 2017-18
Independent Auditor’s Certificate on Corporate Governance
To The Members of Apollo Tyres Limited
1. This certificate is issued in accordance with the terms of our engagement letter dated 25 July 2017.
2. We have examined the compliance of conditions of corporate governance by Apollo Tyres Limited (‘the Company’) for the year ended on 31 March 2018, as stipulated in Regulations 17 to 27, clauses (b) to (i) of Regulation 46(2), and paragraphs C, D and E of Schedule V of the Securities and Exchange Board of India (Listing Obligations and Disclosure Requirements) Regulations, 2015 (‘Listing Regulations’).
MANAGEMENT’S RESPONSIBILITY
3. The compliance of conditions of corporate governance is the responsibility of the management. This responsibility includes the designing, implementing and maintaining operating effectiveness of internal control to ensure compliance with the conditions of corporate governance as stipulated in the Listing Regulations.
AUDITOR’S RESPONSIBILITY
4. Pursuant to the requirements of the Listing Regulations, our responsibility is to express a reasonable assurance in the form of an opinion as to whether the Company has complied with the conditions of corporate governance as stated in paragraph 2 above. Our responsibility is limited to examining the procedures and implementation thereof, adopted by the Company for ensuring the compliance with the conditions of corporate governance. It is neither an audit nor an expression of opinion on the financial statements of the Company.
5. We have examined the relevant records of the Company in accordance with the applicable Generally Accepted Auditing Standards in India, the Guidance Note on Certification of
Corporate Governance issued by the Institute of Chartered Accountants of India (‘ICAI’), and Guidance Note on Reports or Certificates for Special Purposes issued by the ICAI which requires that we comply with the ethical requirements of the Code of Ethics issued by the ICAI.
6. We have complied with the relevant applicable requirements of the Standard on Quality Control (SQC) 1, Quality Control for Firms that Perform Audits and Reviews of Historical Financial Information, and Other Assurance and Related Services Engagements.
7. Based on the procedures performed by us and to the best of our information and according to the explanations provided to us, in our opinion, the Company has complied, in all material respects, with the conditions of corporate governance as stipulated in the Listing Regulations during the year ended 31 March 2018.
We state that such compliance is neither an assurance as to the future viability of the Company nor the efficiency or effectiveness with which the management has conducted the affairs of the Company.
RESTRICTION ON USE
8. This certificate is issued solely for the purpose of complying with the aforesaid regulations and may not be suitable for any other purpose.
For Walker Chandiok & Co LLPChartered Accountants
Firm Registration No. 001076N/N500013
David JonesPlace: Gurgaon PartnerDate: May 10, 2018 Membership No.: 98113
121
Corporate Overview / Statutory Reports / Financial Statements

CEO and CFO Certificate[Under Regulation 17(8) of SEBI (Listing Obligations and Disclosure Requirements) Regulations, 2015]
To,The Board of Directors,Apollo Tyres Ltd.
We hereby certify that:-
a) We have reviewed the financial statements including the cash flow statement of the Company for the year ended as on March 31, 2018 and that to the best of our knowledge and belief:
i. these statements do not contain any materially untrue statement or omit any material fact or contain statements that might be misleading;
ii. these statements including cash flow statement present a true and fair view of the Company’s affairs and are in compliance with existing accounting standards, applicable laws and regulations.
b) To the best of our knowledge and belief, there are no transactions entered into by the Company during the year which are fraudulent, illegal or violative of the Company’s code of conduct.
c) We accept the responsibility for establishing and maintaining internal controls for financial reporting and we have evaluated the effectiveness of internal control systems of the Company pertaining to financial reporting and have disclosed to the auditors. Further, no deficiencies have been observed in design or operation of such internal controls for the period covered by this report.
d) During the period under review, no significant changes were observed in the internal controls over financial reporting and accounting policies of the Company. Furthermore, no instance of fraud found by management or employees having a significant role in the Company’s internal control system over financial reporting.
For Apollo Tyres Limited
ONKAR S. KANWAR GAURAV KUMARDate: May 1, 2018 Chairman & Managing Director Chief Financial Officer
122

Independent Auditor’s ReportTo The Members of Apollo Tyres Limited
REPORT ON THE STANDALONE FINANCIAL STATEMENTS
1. We have audited the accompanying standalone financial statements of Apollo Tyres Limited (‘the Company’), which comprise the Balance Sheet as at 31 March 2018, the Statement of Profit and Loss (including Other Comprehensive Income), the Cash Flow Statement and the Statement of Changes in Equity for the year then ended, and a summary of the significant accounting policies and other explanatory information.
MANAGEMENT’S RESPONSIBILITY FOR THE STANDALONE FINANCIAL STATEMENTS
2. The Company’s Board of Directors is responsible for the matters stated in Section 134(5) of the Companies Act, 2013 (‘the Act’) with respect to the preparation of these standalone financial statements that give a true and fair view of the state of affairs (financial position), profit or loss (financial performance including other comprehensive income), cash flows and changes in equity of the Company in accordance with the accounting principles generally accepted in India, including the Indian Accounting Standards (‘Ind AS’) specified under Section 133 of the Act. This responsibility also includes maintenance of adequate accounting records in accordance with the provisions of the Act for safeguarding the assets of the Company and for preventing and detecting frauds and other irregularities; selection and application of appropriate accounting policies; making judgments and estimates that are reasonable and prudent; and design, implementation and maintenance of adequate internal financial controls, that were operating effectively for ensuring the accuracy and completeness of the accounting records, relevant to the preparation and presentation of the standalone financial statements that give a true and fair view and are free from material misstatement, whether due to fraud or error.
AUDITOR’S RESPONSIBILITY
3. Our responsibility is to express an opinion on these standalone financial statements based on our audit.
4. We have taken into account the provisions of the Act, the accounting and auditing standards and matters which are required to be included in the audit report under the provisions of the Act and the Rules made thereunder.
5. We conducted our audit in accordance with the Standards on Auditing specified under Section 143(10) of the Act. Those Standards require that we comply with ethical requirements and plan and perform the audit to obtain reasonable assurance about whether these standalone financial statements are free from material misstatement.
6. An audit involves performing procedures to obtain audit evidence about the amounts and the disclosures in the financial statements. The procedures selected depend on the auditor’s judgment, including the assessment of the risks of material misstatement of the financial statements, whether
due to fraud or error. In making those risk assessments, the auditor considers internal financial controls relevant to the Company’s preparation of the financial statements that give a true and fair view in order to design audit procedures that are appropriate in the circumstances. An audit also includes evaluating the appropriateness of the accounting policies used and the reasonableness of the accounting estimates made by the Company’s Directors, as well as evaluating the overall presentation of the financial statements.
7. We believe that the audit evidence we have obtained is sufficient and appropriate to provide a basis for our audit opinion on these standalone financial statements.
OPINION
8. In our opinion and to the best of our information and according to the explanations given to us, the aforesaid standalone financial statements give the information required by the Act in the manner so required and give a true and fair view in conformity with the accounting principles generally accepted in India including Ind AS specified under Section 133 of the Act, of the state of affairs (financial position) of the Company as at 31 March 2018, and its profit (financial performance including other comprehensive income), its cash flows and the changes in equity for the year ended on that date.
OTHER MATTER
9. The comparative financial statements for the year ended 31 March 2017 included in these standalone financial statements have been audited by Deloitte Haskins & Sells, Chartered Accountants, whose report dated 5 May 2017 expressed an unmodified opinion on the comparative financial statements. Our opinion is not modified in respect of this matter.
REPORT ON OTHER LEGAL AND REGULATORY REQUIREMENTS
10. As required by the Companies (Auditor’s Report) Order, 2016 (‘the Order’) issued by the Central Government of India in terms of Section 143(11) of the Act, we give in the Annexure I a statement on the matters specified in paragraphs 3 and 4 of the Order.
11. Further to our comments in Annexure I, as required by Section 143(3) of the Act, we report that:
a) we have sought and obtained all the information and explanations which to the best of our knowledge and belief were necessary for the purpose of our audit;
b) in our opinion, proper books of account as required by law have been kept by the Company so far as it appears from our examination of those books;
c) the standalone financial statements dealt with by this report are in agreement with the books of account;
d) in our opinion, the aforesaid standalone financial statements comply with Ind AS specified under Section 133 of the Act;
123Apollo Tyres Ltd Annual Report 2017-18
Corporate Overview / Statutory Reports / Financial Statements

e) on the basis of the written representations received from the directors and taken on record by the Board of Directors, none of the directors is disqualified as on 31 March 2018 from being appointed as a director in terms of Section 164(2) of the Act;
f) we have also audited the internal financial controls over financial reporting (IFCoFR) of the Company as on 31 March 2018 in conjunction with our audit of the standalone financial statements of the Company for the year ended on that date and our report dated 10 May 2018 as per Annexure II expressed an unmodified opinion; and
g) with respect to the other matters to be included in the Auditor’s Report in accordance with Rule 11 of the Companies (Audit and Auditors) Rules, 2014 (as amended), in our opinion and to the best of our information and according to the explanations given to us:
i. the Company, as detailed in Note C18 to the standalone financial statements, has disclosed the impact of pending litigations on its financial position;
ii. the Company has made provision, as required under the applicable law or Ind AS for material foreseeable losses, if any, on long-term contracts including derivative contracts;
iii. there has been no delay in transferring amounts, required to be transferred, to the Investor Education and Protection Fund by the Company other than ` 3.18 million (31 March 2017: ` 4.99 million) pertaining to amount of dividend which has not been transferred as per the orders/ instructions under the Special Court (Trial of Offences Relating to Transactions in Securities) Act, 1992; and
iv. the disclosure requirements relating to holdings as well as dealings in specified bank notes were applicable for the period from 8 November 2016 to 30 December 2016 which are not relevant to these standalone financial statements. Hence, reporting under this clause is not applicable.
For Walker Chandiok & Co LLP Chartered AccountantsFirm’s Registration No.: 001076N/N500013
David JonesPartner Membership No.: 98113
Place: GurgaonDate: 10 May 2018
124

Annexure IBased on the audit procedures performed for the purpose of reporting a true and fair view on the financial statements of the Company and taking into consideration the information and explanations given to us and the books of account and other records examined by us in the normal course of audit, and to the best of our knowledge and belief, we report that:
(i) (a) The Company has maintained proper records showing full particulars, including quantitative details and situation of fixed assets.
(b) The Company has a regular program of physical verification of its fixed assets under which fixed assets are verified in a phased manner over a period of three years, which, in our opinion, is reasonable having regard to the size of the Company and the nature of its assets. In accordance with this program, certain fixed assets were verified during the year and no material discrepancies were noticed on such verification.
(c) The title deeds of all the immovable properties are held in the name of the Company, except for certain land included under the head ‘Capital work in progress’, {admeasuring 124,150 square feet and carrying a cost of ` 11.19 million}, the title deeds to which, according to the information and explanation given to us, are yet to be transferred in the name of the company. Immovable properties in the nature of land whose title deeds have been pledged as security for loans are held in the name of the Company, which is verified from confirmations directly received by us from lenders. In respect of immovable properties in the nature of land that have been taken on lease and disclosed under the head property, plant and equipment in the standalone financial statements, the lease agreements are in the name of the Company, where the Company is the lessee as per the agreement.
(ii) In our opinion, the management has conducted physical verification of inventory at reasonable intervals during the year
and no material discrepancies between physical inventory and book records were noticed on physical verification.
(iii) The Company has not granted any loan, secured or unsecured to companies, firms, Limited Liability Partnerships (LLPs) or other parties covered in the register maintained under Section 189 of the Act. Accordingly, the provisions of clauses 3(iii)(a), 3(iii)(b) and 3(iii)(c) of the Order are not applicable.
(iv) In our opinion, the Company has complied with the provisions of Sections 185 and 186 of the Act in respect of loans, investments, guarantees and security.
(v) In our opinion, the Company has not accepted any deposits within the meaning of Sections 73 to 76 of the Act and the Companies (Acceptance of Deposits) Rules, 2014 (as amended). Accordingly, the provisions of clause 3(v) of the Order are not applicable.
(vi) We have broadly reviewed the books of account maintained by the Company pursuant to the Rules made by the Central Government for the maintenance of cost records under sub-section (1) of Section 148 of the Act in respect of Company’s products and are of the opinion that, prima facie, the prescribed accounts and records have been made and maintained. However, we have not made a detailed examination of the cost records with a view to determine whether they are accurate or complete.
(vii) (a) The Company is regular in depositing undisputed statutory dues including provident fund, employees’ state insurance, income-tax, sales-tax, service tax, duty of customs, duty of excise, value added tax, cess and other material statutory dues, as applicable, to the appropriate authorities. Further, no undisputed amounts payable in respect thereof were outstanding at the year-end for a period of more than six months from the date they become payable.
(b) The dues outstanding in respect of income-tax, sales-tax, service-tax, duty of customs, duty of excise and value added tax on account of any dispute, are as follows:
Statement of disputed dues
Name of the statute Nature of dues Amount (` in Million)Amount paid under protest (` in Million )
Period to which the amount relates
Forum where dispute is pending
Sales Tax Act applicable to various states
Sales tax 585.27 37.65 1992-93 to 2017-18
Various appellate authorities/ Revenue board/ High Court
Central Excise Act, 1944 Excise duty and additional excise duty
506.91 - 2002-03 to 2017-18
Various appellate authorities/ Supreme Court
Finance Act, 1994 Service tax 85.14 - 2004-05 to 2015-16
Various appellate authorities
Income Tax Act, 1961 Income tax 1,150.98 100.71 1988-89 to 2013-14
Various appellate authorities/ High Court
125Apollo Tyres Ltd Annual Report 2017-18
Corporate Overview / Statutory Reports / Financial Statements

(viii) The Company has not defaulted in repayment of loans or borrowings to any financial institution or a bank or any dues to debenture-holders during the year. The Company has no loans or borrowings payable to government.
(ix) The Company did not raise moneys by way of initial public offer or further public offer (including debt instruments). In our opinion, the term loans were applied for the purposes for which the loans were obtained, though idle/surplus funds which were not required for immediate utilisation have been invested in liquid investments, payable on demand.
(x) No fraud by the Company or on the Company by its officers or employees has been noticed or reported during the period covered by our audit.
(xi) Managerial remuneration has been provided by the Company in accordance with the requisite approvals mandated by the provisions of Section 197 of the Act read with Schedule V to the Act.
(xii) In our opinion, the Company is not a Nidhi Company. Accordingly, provisions of clause 3(xii) of the Order are not applicable.
(xiii) In our opinion all transactions with the related parties are in compliance with Sections 177 and 188 of Act, where applicable, and the requisite details have been disclosed in the financial statements etc., as required by the applicable Ind AS.
(xiv) During the year, the Company has made private placement of shares. In respect of the same, in our opinion, the Company has complied with the requirement of Section 42 of the Act and the Rules framed thereunder. Further, in our opinion, the amounts so raised were applied for the purposes for which these securities were issued, though idle funds which were not required for immediate utilisation have been invested in liquid investments, payable on demand. During the year, the Company did not make preferential allotment/ private placement of fully/partly convertible debentures.
(xv) In our opinion, the Company has not entered into any non-cash transactions with the directors or persons connected with them covered under Section 192 of the Act.
(xvi) The Company is not required to be registered under Section 45-IA of the Reserve Bank of India Act, 1934.
For Walker Chandiok & Co LLP Chartered AccountantsFirm’s Registration No.: 001076N/N500013
David JonesPartner Membership No.: 98113
Place: GurgaonDate: 10 May 2018
126

Independent Auditor’s Report on the Internal Financial Controls under Clause (i) of Sub-section 3 of Section 143 of the Companies Act, 2013 (‘the Act’)
Annexure II
1. In conjunction with our audit of the standalone financial statements of Apollo Tyres Limited (‘the Company’) as at and for the year ended 31 March 2018, we have audited the internal financial controls over financial reporting (‘IFCoFR’) of the Company as of that date.
MANAGEMENT’S RESPONSIBILITY FOR INTERNAL FINANCIAL CONTROLS
2. The Company’s Board of Directors is responsible for establishing and maintaining internal financial controls based on the internal control over financial reporting criteria established by the Company considering the essential components of internal control stated in the Guidance Note on Audit of Internal Financial Controls over Financial Reporting (‘the Guidance Note’) issued by the Institute of Chartered Accountants of India (‘ICAI’). These responsibilities include the design, implementation and maintenance of adequate internal financial controls that were operating effectively for ensuring the orderly and efficient conduct of the Company’s business, including adherence to the Company’s policies, the safeguarding of its assets, the prevention and detection of frauds and errors, the accuracy and completeness of the accounting records, and the timely preparation of reliable financial information, as required under the Act.
AUDITOR’S RESPONSIBILITY
3. Our responsibility is to express an opinion on the Company’s IFCoFR based on our audit. We conducted our audit in accordance with the Standards on Auditing issued by the ICAI and deemed to be prescribed under Section 143(10) of the Act, to the extent applicable to an audit of IFCoFR, and the Guidance Note issued by the ICAI. Those Standards and the Guidance Note require that we comply with ethical requirements and plan and perform the audit to obtain reasonable assurance about whether adequate IFCoFR were established and maintained and if such controls operated effectively in all material respects.
4. Our audit involves performing procedures to obtain audit evidence about the adequacy of the IFCoFR and their operating effectiveness. Our audit of IFCoFR includes obtaining an understanding of IFCoFR, assessing the risk that a material weakness exists, and testing and evaluating the design and operating effectiveness of internal control based on the assessed risk. The procedures selected depend on the auditor’s judgement, including the assessment of the risks of material misstatement of the financial statements, whether due to fraud or error.
5. We believe that the audit evidence we have obtained is sufficient and appropriate to provide a basis for our audit opinion on the Company’s IFCoFR.
MEANING OF INTERNAL FINANCIAL CONTROLS OVER FINANCIAL REPORTING
6. A company’s IFCoFR is a process designed to provide reasonable assurance regarding the reliability of financial reporting and the preparation of financial statements for external purposes in accordance with generally accepted accounting principles. A company’s IFCoFR include those policies and procedures that (1) pertain to the maintenance of records that, in reasonable detail, accurately and fairly reflect the transactions and dispositions of the assets of the company; (2) provide reasonable assurance that transactions are recorded as necessary to permit preparation of financial statements in accordance with generally accepted accounting principles, and that receipts and expenditures of the company are being made only in accordance with authorisations of management and directors of the company; and (3) provide reasonable assurance regarding prevention or timely detection of unauthorised acquisition, use, or disposition of the company’s assets that could have a material effect on the financial statements.
INHERENT LIMITATIONS OF INTERNAL FINANCIAL CONTROLS OVER FINANCIAL REPORTING
7. Because of the inherent limitations of IFCoFR, including the possibility of collusion or improper management override of controls, material misstatements due to error or fraud may occur and not be detected. Also, projections of any evaluation of the IFCoFR to future periods are subject to the risk that the IFCoFR may become inadequate because of changes in conditions, or that the degree of compliance with the policies or procedures may deteriorate.
OPINION
8. In our opinion, the Company has, in all material respects, adequate internal financial controls over financial reporting and such controls were operating effectively as at 31 March 2018, based on internal control over financial reporting criteria established by the Company considering the essential components of internal control stated in the Guidance Note issued by the ICAI.
For Walker Chandiok & Co LLP Chartered AccountantsFirm’s Registration No.: 001076N/N500013
David JonesPartner Membership No.: 98113
Place: GurgaonDate: 10 May 2018
127Apollo Tyres Ltd Annual Report 2017-18
Corporate Overview / Statutory Reports / Financial Statements

as on March 31, 2018Balance Sheet
` in Million
Particulars NotesAs on
March 31, 2018As on
March 31, 2017
A. ASSETS1. Non-current assets(a) Property, plant and equipment B1 56,793.23 47,709.47 (b) Capital work-in-progress 6,717.86 6,214.76 (c) Intangible assets B1 345.45 242.20 (d) Financial assets
i. Investments B2 16,393.76 10,048.62 ii. Loans B3 19.87 17.11 iii. Other financial assets B4 1,239.53 919.12
(e) Other non-current assets B5 1,146.86 1,718.89 Total non-current assets 82,656.56 66,870.17
2. Current assets(a) Inventories B6 17,214.91 17,293.98 (b) Financial assets
i. Investments B7 13,390.47 3,944.44 ii. Trade receivables B8 5,501.46 3,864.92 iii. Cash and cash equivalents B9 2,544.51 1,340.88 iv. Bank balances other than (iii) above B10 60.72 52.93 v. Loans B11 5,761.64 1,755.15 vi. Other financial assets B12 384.81 342.49
(c) Other current assets B13 3,910.70 3,295.17 Total current assets 48,769.22 31,889.96 Total Assets (1+2) 131,425.78 98,760.13
B. EQUITY AND LIABILITIES1. Equity(a) Equity share capital B14 572.05 509.02 (b) Other equity 72,034.06 52,802.87
Total equity 72,606.11 53,311.89 LIABILITIES
2. Non-current liabilities(a) Financial liabilities
i. Borrowings B15 18,643.88 8,340.25 ii. Other financial liabilities B16 131.60 142.64
(b) Provisions B17 450.73 391.71 (c) Deferred tax liabilities (net) C9 5,443.36 4,927.34 (d) Other non-current liabilities B18 3,433.39 2,884.35
Total non-current liabilities 28,102.96 16,686.29 3. Current liabilities(a) Financial liabilities
i. Borrowings B19 6,474.24 7,840.04 ii. Trade payables B20 15,125.72 10,407.54 iii. Other financial liabilities B21 3,193.21 4,961.49
(b) Other current liabilities B22 2,341.96 1,293.96 (c) Provisions B23 2,651.16 3,229.94 (d) Current tax liabilities (net) B24 930.42 1,028.98
Total current liabilities 30,716.71 28,761.95 Total Equity and Liabilities (1+2+3) 131,425.78 98,760.13
See accompanying notes forming part of the financial statements
In terms of our report attached For and on behalf of the Board of DirectorsFor Walker Chandiok & Co LLPChartered Accountants
ONKAR S. KANWAR NEERAJ KANWAR NIMESH N. KAMPANIChairman & Managing Director Vice Chairman & Managing Director Director
David JonesPartner GAURAV KUMAR SEEMA THAPAR
Chief Financial Officer Company SecretaryGurgaonMay 10, 2018
128

See accompanying notes forming part of the financial statements
In terms of our report attached For and on behalf of the Board of DirectorsFor Walker Chandiok & Co LLPChartered Accountants
ONKAR S. KANWAR NEERAJ KANWAR NIMESH N. KAMPANIChairman & Managing Director Vice Chairman & Managing Director Director
David JonesPartner GAURAV KUMAR SEEMA THAPAR
Chief Financial Officer Company SecretaryGurgaonMay 10, 2018
for the year ended March 31, 2018Statement of Profit and Loss
` in Million
Particulars Notes Year ended
March 31, 2018 Year ended
March 31, 2017
1. REVENUE FROM OPERATIONS:Sales 103,881.26 98,066.22 Other operating income B25 1,664.61 1,170.67
105,545.87 99,236.89 2. OTHER INCOME B26 1,218.49 1,353.34 3. TOTAL INCOME (1 +2) 106,764.36 100,590.23 4. EXPENSES :(a) Cost of materials consumed B27 62,811.50 53,132.29 (b) Purchase of stock-in-trade B27 2,517.58 2,209.55 (c) Changes in inventories of finished goods, stock-in-trade and work-in-progress B28 125.46 (3,181.54)(d) Excise duty on sales C25 2,548.91 9,899.20 (e) Employee benefits expense B27 7,096.78 6,207.81 (f) Finance costs B29 1,375.41 887.84 (g) Depreciation and amortisation expense B1 3,643.81 2,881.99 (h) Other expenses B27 17,971.80 17,696.75
Total expenses 98,091.25 89,733.89 5. PROFIT BEFORE EXCEPTIONAL ITEMS AND TAX (3 - 4) 8,673.11 10,856.34 6. EXCEPTIONAL ITEMS - - 7. PROFIT BEFORE TAX (5 - 6) 8,673.11 10,856.34 8. TAX EXPENSE:(a) Current tax expense 1,884.66 2,310.28 (b) Deferred tax 564.57 518.48
Total 2,449.23 2,828.76 9. NET PROFIT FOR THE YEAR (7 - 8) 6,223.88 8,027.58 10. OTHER COMPREHENSIVE INCOMEI i. Items that will not be reclassified to profit or loss
a. Remeasurements of the defined benefit plans (106.18) 13.53 ii. Income tax 36.75 (4.68)
(69.43) 8.85 II i. Items that may be reclassified to profit or loss
a. Effective portion of gain / (loss) on designated portionof hedging instruments in a cash flow hedge 204.43 (118.66)
ii. Income tax (70.75) 41.07 133.68 (77.59)
Other comprehensive income (I + II) 64.25 (68.74)Total comprehensive income for the year (9 + 10) 6,288.13 7,958.84 Earnings per equity share of Re. 1 each - C31(a) Basic 11.55 15.77 (b) Diluted 11.55 15.77
129Apollo Tyres Ltd Annual Report 2017-18
Corporate Overview / Statutory Reports / Financial Statements

Sta
tem
ent o
f Cha
nges
in E
quity
OT
HE
R E
QU
ITY
` in
Mill
ion
Par
ticu
lars
Res
erve
s an
d su
rplu
s (r
efer
not
e C
4)
Item
s of
oth
er c
ompr
ehen
sive
inco
me
Tota
lS
ecur
itie
s pr
emiu
m
rese
rve
Gen
eral
re
serv
e
Cap
ital
re
serv
e on
AM
HP
L m
erge
r
Deb
entu
re
rede
mpt
ion
rese
rve
Cap
ital
su
bsid
y
Cap
ital
re
dem
ptio
n re
serv
e
Cap
ital
re
serv
e on
fo
refe
itur
e of
sh
ares
Ret
aine
d ea
rnin
gs
Eff
ecti
ve
port
ion
of
cash
flow
he
dge
Rev
alua
tion
su
rplu
sA
ctua
rial
ga
in /
(los
s)
Bal
ance
as
on M
arch
31,
20
16 6
,085
.71
11,
00
6.63
1
,383
.68
375
.00
2
5.50
4
4.4
0
0.0
7 2
7,0
23.4
0
1.3
6 3
1.22
9
2.36
4
6,0
69.3
3 P
rofit
for
the
year
8,0
27.5
8 8
,027
.58
Oth
er c
ompr
ehen
sive
inco
me
(OC
I)
for
the
year
(118
.66)
13.
53
(10
5.13
)
Inco
me
tax
on O
CI
item
s 4
1.0
7 (4
.68)
36.
39
Tota
l com
preh
ensi
ve in
com
e fo
r
the
year
8,0
27.5
8 (7
7.59
) 8
.85
7,9
58.8
4 Tr
ansa
ctio
n w
ith o
wne
rs in
the
ir
capa
city
as
owne
rsP
aym
ent
of d
ivid
end
(` 2
per
sha
re)
(1,0
18.0
5) (1
,018
.05)
Tax
on d
ivid
end
(20
7.25
) (2
07.
25)
Tran
sfer
from
ret
aine
d ea
rnin
gs
1,0
00
.00
2
19.1
2 (1
,219
.12)
-
Tran
sfer
to
reta
ined
ear
ning
s (1
25.0
0)
125
.00
-
B
alan
ce a
s on
Mar
ch 3
1, 2
017
6,0
85.7
1 1
2,0
06.
63
1,3
83.6
8 4
69.1
2 2
5.50
4
4.4
0
0.0
7 3
2,73
1.56
(7
6.23
) 3
1.22
1
01.
21
52,
802.
87
Pro
fit fo
r th
e ye
ar 6
,223
.88
6,2
23.8
8 O
ther
com
preh
ensi
ve in
com
e (O
CI)
fo
r th
e ye
ar 2
04.
43
(10
6.18
) 9
8.25
Inco
me
tax
on O
CI
item
s (7
0.7
5) 3
6.75
(3
4.0
0)
Tota
l com
preh
ensi
ve in
com
e
for
the
year
6,2
23.8
8 1
33.6
8 (6
9.43
) 6
,288
.13
Secu
rity
prem
ium
on
issu
e of
sha
res,
net
14,
781.
01
14,
781.
01
Tran
sact
ion
with
ow
ners
in t
heir
ca
paci
ty a
s ow
ners
Pay
men
t of
div
iden
d (`
3 p
er s
hare
) (1
,527
.07)
(1,5
27.0
7)Ta
x on
div
iden
d (3
10.8
8) (3
10.8
8)Tr
ansf
er fr
om r
etai
ned
earn
ings
1
,00
0.0
0
410
.19
(1,4
10.1
9) -
Tr
ansf
er t
o re
tain
ed e
arni
ngs
(250
.00
) 2
50.0
0
-
Bal
ance
as
on M
arch
31,
20
18 2
0,8
66.7
2 1
3,0
06.
63
1,3
83.6
8 6
29.3
1 2
5.50
4
4.4
0
0.0
7 3
5,95
7.30
5
7.4
5 3
1.22
3
1.78
7
2,0
34.0
6
In t
erm
s of
our
rep
ort
atta
ched
For
and
on b
ehal
f of t
he B
oard
of D
irec
tors
For
Wal
ker
Ch
and
iok
& C
o L
LP
Cha
rter
ed A
ccou
ntan
ts
ON
KA
R S
. KA
NW
AR
NE
ER
AJ
KA
NW
AR
NIM
ES
H N
. KA
MP
AN
IC
hair
man
& M
anag
ing
Dir
ecto
rV
ice
Cha
irm
an &
Man
agin
g D
irec
tor
Dir
ecto
rD
avid
Jon
esP
artn
erG
AU
RA
V K
UM
AR
SE
EM
A T
HA
PA
RC
hief
Fin
anci
al O
ffice
rC
ompa
ny S
ecre
tary
Gur
gaon
May
10
, 20
18
130

for the year ended March 31, 2018Cash-Flow Statement - Indirect Method
` in Million
ParticularsYear ended
March 31, 2018 Year ended
March 31, 2017
A CASH FLOW FROM OPERATING ACTIVITIES(i) Net profit before tax 8,673.11 10,856.34
Add: Adjustments for:Depreciation and amortisation expenses 3,643.81 2,881.99 (Profit)/loss on sale of property, plant and equipment (net) (1.85) 33.96 (Profit) on sale of Investments (0.47) - Dividend from non-current and current investments (45.82) (84.59)Provision for constructive liability 95.66 (10.96)Provision for compensated absences (21.14) (22.64)Provision for superannuation 22.50 - Change in fair value of investments (140.68) - Liabilities / provisions no longer required written back (23.31) (63.90)Unwinding of deferred income (788.13) (329.87)Finance cost 1,375.41 887.84 Interest income (440.87) (384.73)Provision for contingencies - 365.00 Provision for estimated loss on derivatives (77.68) 4.93 Unrealised (gain)/loss on foreign exchange fluctuations (56.95) 3,540.48 (244.98) 3,032.05
(ii) Operating profit before working capital changes 12,213.59 13,888.39 Changes in working capitalAdjustments for (increase) / decrease in operating assets:Inventories 79.07 (7,096.49)Trade receivables (1,553.20) (951.48)Loan and advances given (current and non current) (4,016.14) (1,797.15)Other financial assets (current and non current) (60.10) 26.02 Other current assets (615.53) (6,165.90) (676.59) (10,495.69)
Adjustments for increase / (decrease) in operating liabilities:Trade payables 4,714.45 2,138.16 Other financial liabilities 187.79 (53.65)Other liabilities (current and non current) 983.46 (69.92)Provisions (616.78) 5,268.92 462.03 2,476.62
(iii) Cash generated from operations 11,316.61 5,869.32 Less: Direct taxes paid (net of refund) 1,983.22 2,570.83
Net cash generated from operating activities 9,333.39 3,298.49 B CASH FLOW FROM INVESTING ACTIVITIES
Purchase of property, plant and equipment (12,432.20) (15,584.12)Proceeds from sale of property, plant and equipment 311.98 78.74 Investments in mutual funds (49.41) (2,222.64)Investment in non-current investment (6,350.62) (3.44)Inter corporate deposits matured, net - 3,300.00 Investments in inter corporate deposits, net (9,250) - Dividends received (current and non current investments) 45.82 78.50 Interest received 183.93 399.15 Net cash used in investing activities (27,540.49) (13,953.81)
131Apollo Tyres Ltd Annual Report 2017-18
Corporate Overview / Statutory Reports / Financial Statements

` in Million
ParticularsYear ended
March 31, 2018 Year ended
March 31, 2017
C CASH FLOW FROM FINANCING ACTIVITIESProceeds from issue of shares (net) 14,761.49 - Proceeds from non-current borrowings 10,588.11 8,000.00 Repayment of non-current borrowings (1,647.28) (1,281.85)Current borrowings (net) (1,437.61) 4,129.21 Payment of dividend (including dividend tax) (1,837.95) (1,225.30)Finance charges paid (1,088.48) (561.58)Net cash generated from financing activities 19,338.28 9,060.48 Net (decrease) / increase in cash and cash equivalents 1,131.17 (1,594.84)Cash and cash equivalents as at the beginning of the year 1,340.88 2,867.68
Less: Cash credits as at the beginning of the year 71.58 2.55 1,269.30 2,865.13
(Gain) / loss on re-statement of foreign currency cash and cash equivalents 0.65 (0.34)Adjusted cash and cash equivalents as at beginning of the year 1,269.95 2,864.79 Cash and cash equivalents as at the end of the year 2,544.51 1,340.88
Less: Cash credits as at the end of the year 143.39 71.58 2,401.12 1,269.30
(Gain)/loss on re-statement of foreign currency cash and cash equivalents - 0.65 Adjusted cash and cash equivalents as at the end of the year 2,401.12 1,269.95
See accompanying notes forming part of the financial statements
In terms of our report attached For and on behalf of the Board of DirectorsFor Walker Chandiok & Co LLPChartered Accountants
ONKAR S. KANWAR NEERAJ KANWAR NIMESH N. KAMPANIChairman & Managing Director Vice Chairman & Managing Director Director
David JonesPartner GAURAV KUMAR SEEMA THAPAR
Chief Financial Officer Company SecretaryGurgaonMay 10, 2018
for the year ended March 31, 2018 (Contd.)Cash-Flow Statement - Indirect Method
132

forming Part of the Financial StatementsA. Notes1 CORPORATE INFORMATION
The principal business activity of Apollo Tyres Limited (‘the Company’) is manufacturing and sale of automotive tyres. The Company started its operations in 1972 with its first manufacturing plant at Perambra in Kerala.
The Company’s largest operations are in India and comprises of four tyre manufacturing plants, two located in Cochin and one each at Vadodara & Chennai and various sales & marketing offices spread across the country. The Company’s European subsidiaries Apollo Vredestein BV (‘AVBV;) and Apollo Tyres (Hungary) Kft. have a manufacturing plant in the Netherlands and Hungary respectively and has sales and marketing subsidiaries all over Europe. The Company also has sales and marketing subsidiaries in Middle East, Africa and ASEAN region.
Recent Accounting Prouncements2 STANDARDS ISSUED BUT NOT YET
EFFECTIVE
In March 2018, the Ministry of Corporate Affairs issued the Companies (Indian Accounting Standards) Amendment Rules, 2018 via notification dated 28 march 2018 to further amend Companies (Indian Accounting Standards) Rules, 2015, notifying a new revenue recognition standard Ind AS 115, ‘Revenue from Contracts with Customers’. This amendment replaces Ind AS 18, ‘Revenue’ and Ind AS 11, ‘Construction Contracts’. An insertion to Appendix B, ‘Foreign currency transaction and advance consideration’ to Ind AS 21, ‘The effect of change in exchange rates has also been notified. The amendments are applicable to the Company from April 1, 2018.
> IND AS 115 - Revenue from Contracts with Customers: IND AS 115 provides a single, principles based five-step model
to be applied to all contracts with customers. The five steps in the model are as follows:
a) Identify the contract(s) with the customer;
b) Identify the performance obligations in the contract;
c) Determine the transaction price;
d) Allocate the transaction price to the performance obligations in the contracts;
e) Recognise revenue when (or as) the entity satisfies a performance obligation.
> Insertion of Appendix B to IND AS 21 - The effects of changes in foreign exchange rates:
The amendment clarifies that, in determining the spot exchange rate to use on initial recognition of the related asset, expense or income (or part of it) on the derecognition of a non-monetary asset or non-monetary liability relating to advance consideration, the date of the transaction is the date on which an entity initially recognizes the non-monetary asset or non-monetary liability arising from the advance consideration. If there are multiple payments or receipts in advance, then the entity must determine the transaction date for each payment or receipt of advance consideration. Entities may apply the amendments on a fully retrospective basis. Alternatively, an
entity may apply the Interpretation prospectively to all assets, expenses and income in its scope that are initially recognized on or after:
(i) The beginning of the reporting period in which the entity first applies the interpretation or
(ii) The beginning of a prior reporting period presented as comparative information in the financial statements of the reporting period in which the entity first applies the interpretation.
The Company is evaluating the requirements of the amendments and its impact if any, on the financial statements.
3 BASIS OF ACCOUNTING AND PREPARATION OF FINANCIAL STATEMENTS
3.1 Statement of Compliance The financial statements have been prepared to comply in
all material respects with the Indian Accounting Standards (Ind AS) as notified by Ministry of Corporate Affairs under Section 133 of the Companies Act, 2013 (‘the Act’) read with the Companies (Indian Accounting Standards) Rules, 2015, as amended and other relevant provisions of the Act.
The financial statements are presented in Indian Rupee (‘INR’), which is also the functional currency of the Company.
The financial statements for the year ended March 31, 2018 were authorised and approved for issue by the Board of Directors on May 10, 2018.
3.2 Basis of preparation and presentation The financial statements have been prepared on accrual basis
under the historical cost convention except for certain financial instruments that are measured at fair values at the end of each reporting period, as explained in the accounting policies below.
Historical cost is generally based on the fair value of the consideration given in exchange for goods and services.
Fair value is the price that would be received to sell an asset or paid to transfer a liability in an orderly transaction between market participants at the measurement date, regardless of whether that price is directly observable or estimated using another valuation technique. In estimating the fair value of an asset or a liability, the Company takes into account the characteristics of the asset or liability if market participants would take those characteristics into account when pricing the asset or liability at the measurement date. Fair value for measurement and/or disclosure purposes in these financial statements is determined on above basis, except for share-based payment transactions that are within the scope of Ind AS 102 - Share Based Payment, lease transactions that are within the scope of Ind AS 17 - Leases, and measurements that have some similarities to fair value but are not fair value, such as net realisable value in Ind AS 2 - Inventories or value in use in Ind AS 36 - Impairment of Assets.
In addition, for financial reporting purposes, fair value measurements are categorised into Level 1, 2 or 3 based on the degree to which the inputs to the fair value measurements are observable and the significance of the inputs to the fair value measurement in its entirety, which are described as follows:
133Apollo Tyres Ltd Annual Report 2017-18
Corporate Overview / Statutory Reports / Financial Statements

> Level 1 inputs are quoted prices (unadjusted) in active markets for identical assets or liabilities that the entity can access at the measurement date;
> Level 2 inputs are inputs, other than quoted prices included within Level 1, that are observable for the asset or liability, either directly or indirectly; and
> Level 3 inputs are unobservable inputs for the asset or liability.
The principal accounting policies are set out below: 3.3 Business Combinations Common control business combinations includes transactions,
such as transfer of subsidiaries or businesses, between entities within a group.
Business combinations involving entities or businesses under common control shall be accounted for using the pooling of interests method.
The pooling of interest method is considered to involve the following:
(i) The assets and liabilities of the combining entities are reflected at their carrying amounts.
(ii) No adjustments are made to reflect fair values, or recognise any new assets or liabilities. The only adjustments that are made are to harmonise accounting policies.
(iii) The financial information in the financial statements in respect of prior periods should be restated as if the business combination had occurred from the beginning of the preceding period in the financial statements, irrespective of the actual date of the combination. However, if business combination had occurred after that date, the prior period information shall be restated only from that date.
(iv) The balance of the retained earnings appearing in the financial statements of the transferor is aggregated with the corresponding balance appearing in the financial statements of the transferee.
3.4 Inventories Inventories are valued at the lower of cost and estimated
net realizable value (net of allowances) after providing for obsolescence and other losses, where considered necessary. The cost comprises of cost of purchase, cost of conversion and other costs including appropriate production overheads in the case of finished goods and work in progress, incurred in bringing such inventories to their present location and condition. Trade discounts or rebates are deducted in determining the costs of purchase. Net realisable value represents the estimated selling price for inventories less all estimated costs of completion and costs necessary to make the sale.
In case of raw materials, stores & spares and traded goods, cost (net of tax credits wherever applicable) is determined on a moving weighted average basis, and, in case of work in progress and finished goods, cost is determined on a First In First Out basis.
3.5 Taxation Income tax expense recognised in Standalone Statement of
Profit and Loss comprised the sum of deferred tax and current tax except the ones recognised in other comprehensive income or directly in equity.
Current Tax Current tax is the amount of tax payable on the taxable income
for the year as determined in accordance with the applicable income tax laws of India. Taxable profit differs from ‘profit before tax’ as reported in the standalone statement of profit and loss because of items of income or expense that are taxable or deductible in other years and items that are never taxable or deductible. The current tax is calculated using tax rates that have been enacted or substantively enacted by the end of the reporting period.
Deferred tax Deferred tax is recognized on temporary differences between
the carrying amount of assets and liabilities in the financial statements and quantified using the tax rates and laws enacted or substantively enacted as on the Balance Sheet date. Deferred tax liabilities are recognised for all taxable temporary differences. Deferred tax assets are generally recognised for all deductible temporary differences to the extent that it is probable that taxable profits will be available against which those deductible temporary differences can be utilised. Such deferred tax assets and liabilities are not recognised if the temporary difference arises from the initial recognition of assets and liabilities in a transaction that affects neither the taxable profit nor the accounting profit.
The carrying amount of deferred tax assets is reviewed at the end of each reporting period and reduced to the extent that it is no longer probable that sufficient taxable profits will be available to allow all or part of the asset to be recovered.
Minimum alternate tax (‘MAT’) credit entitlement is recognised as an asset only when and to the extent there is convincing evidence that normal income tax will be paid during the specified period. In the year in which MAT credit becomes eligible to be recognised as an asset is created by way of a credit to the Standalone Statement of Profit and Loss. This is reviewed at each balance sheet date and the carrying amount of MAT credit entitlement is written down to the extent it is not reasonably certain that normal income tax will be paid during the specified period.
Deferred tax liabilities and assets are measured at the tax rates that are expected to apply in the period in which the liability is settled or the asset realised, based on tax rates (and tax laws) that have been enacted or substantively enacted by the end of the reporting period.
The measurement of deferred tax liabilities and assets reflects the tax consequences that would follow from the manner in which the Company expects, at the end of the reporting period, to recover or settle the carrying amount of its assets and liabilities.
Current and Deferred tax for the year Current and deferred tax are recognised in profit or loss,
except when they relate to items that are recognised in other
134

comprehensive income or directly in equity, in which case, the current and deferred tax are also recognised in other comprehensive income or directly in equity respectively. Where current tax or deferred tax arises from the initial accounting for a business combination, the tax effect is included in the accounting for the business combination.
3.6 Property, plant and equipment (‘PPE’) Land and buildings held for use in the production or supply of
goods or services, or for administrative purposes, are stated in the balance sheet at cost less accumulated depreciation and accumulated impairment losses. Freehold land is not depreciated.
Properties in the course of construction for production, supply or administrative purposes are carried at cost, less any recognised impairment loss. For qualifying assets, borrowing costs are capitalised in accordance with Ind AS 23 - Borrowing costs. Such properties are classified to the appropriate categories of property, plant and equipment when completed and ready for intended use. Depreciation of these assets, on the same basis as other property assets, commences when the assets are ready for their intended use.
Fixtures and equipment are stated at cost less accumulated depreciation and accumulated impairment losses.
Property, plant and equipment are capitalised at costs relating to the acquisition and installation (net of tax credits wherever applicable) and include finance cost on borrowed funds attributable to acquisition of qualifying fixed assets for the period up to the date when the asset is ready for its intended use, and adjustments arising from foreign exchange differences arising on foreign currency borrowings to the extent they are regarded as an adjustment to interest costs. Other incidental expenditure attributable to bringing the fixed assets to their working condition for intended use are capitalized. Subsequent expenditure relating to fixed assets is capitalised only if such expenditure results in an increase in the future benefits from such asset beyond its previously assessed standard of performance.
Depreciation is recognised so as to write off the cost or valuation of assets (other than freehold land and properties under construction) less their residual values over their useful lives, using the straight-line method. The estimated useful lives, residual values and depreciation method are reviewed at the end of each reporting period, with the effect of any changes in estimate accounted for on a prospective basis.
The management believes that these estimated useful lives are realistic and reflect fair approximation of the period over which the assets are likely to be used.
Assets held under finance leases are depreciated over their expected useful lives on the same basis as owned assets. However, when there is no reasonable certainty that ownership will be obtained by the end of the lease term, assets are depreciated over the shorter of the lease term and their useful lives.
The estimated useful life considered for the assets are as under.
Category of Assets No. of Years
Building 5 - 60Plant & Machinery 5 - 25Moulds 4 - 8Material Handling Equipments 4 - 15Computer Hardware 3 - 5Motor Vehicles 4 - 10Furniture & Fixtures 4 - 10Office Equipment 4 - 10
Leasehold land / Improvements thereon are amortized over the primary period of lease.
An item of property, plant and equipment is derecognised upon disposal or when no future economic benefits are expected to arise from the continued use of the asset. Any gain or loss arising on the disposal or retirement of an item of property, plant and equipment is determined as the difference between the sales proceeds and the carrying amount of the asset and is recognised in profit or loss.
3.7 Intangible assets Intangible assets with finite useful lives are carried at cost
less accumulated amortisation and impairment losses, if any. The cost of an intangible asset comprises its purchase price, including any import duties and other taxes (other than those subsequently recoverable from the tax authorities), and any directly attributable expenditure on making the asset ready for its intended use and net of any trade discounts and rebates. Subsequent expenditure on an intangible asset after its purchase / completion is recognised as an expense when incurred unless it is probable that such expenditure will enable the asset to generate future economic benefits in excess of its originally assessed standards of performance and such expenditure can be measured and attributed to the asset reliably, in which case such expenditure is added to the cost of the asset.
The intangible assets are amortized over their respective individual estimated useful lives on a straight-line basis, commencing from the date the asset is available to the Company for its use. The amortisation period are reviewed at the end of each financial year and the amortisation method is revised to reflect the changed pattern.
Derecognition of intangible assets An intangible asset is derecognised upon disposal or when
no future economic benefits are expected to arise from the continued use of the asset. Gains or losses arising from derecognition of an intangible asset, measured as the difference between the net disposal proceeds and the carrying amount of the asset, are recognised in profit or loss when the asset is derecognised.
135Apollo Tyres Ltd Annual Report 2017-18
Corporate Overview / Statutory Reports / Financial Statements

The useful life considered for the intangible assets are as under:
Category of Assets No. of Years
Computer Software 3-6
3.8 Revenue recognition Revenue is measured at the fair value of the consideration
received or receivable. Revenue is reduced for customer returns, taxes on sales, estimated rebates and other similar allowances.
Revenue from sale of goods is recognised when the following conditions are satisfied:
> the Company has transferred the significant risks and rewards of ownership of the goods to the buyer which generally coincides with the delivery of goods,
> the Company retains neither continuing managerial involvement to the degree usually associated with ownership nor effective control over goods sold;
> the amount of revenue can be measured reliably;
> it is probable that the economic benefits associated with the transaction will flow to the Company;
> the costs incurred or to be incurred in respect of the transaction can be measured reliably.
3.9 Other income Dividend income from investments is recognised when the right
to receive payment has been established (provided that it is probable that the economic benefits will flow to the Company and the amount of income can be measured reliably).
Interest income from a financial asset is recognised when it is probable that the economic benefits will flow to the Company and the amount of income can be measured reliably. Interest income is accrued on a time basis, by reference to the principle outstanding and at the effective interest rate applicable, which is the rate that exactly discounts estimated future cash receipts through the expected life of the financial asset to that asset’s net carrying amount on initial recognition.
Royalty income is recognised on accrual basis in accordance with the substance of the relevant agreement (provided that it is probable that the economic benefits will flow to the Company and the amount of income can be measured reliably).
3.10 Employee benefits Employee benefits include wages & salaries, provident fund,
superannuation fund, employee state insurance scheme, gratuity fund and compensated absences.
Defined Contribution Plans Contributions to defined contribution plans are recognised as
an expense when employees have rendered service entitling them to the contributions.
Defined Benefit Plans For defined benefit retirement plans, the cost of providing
benefits is determined using the projected unit credit method, with actuarial valuations being carried out at the end of each annual reporting period. Re-measurement, comprising actuarial
gains and losses, the effect of the changes to the asset ceiling (if applicable) and the return on plan assets (excluding net interest), is reflected immediately in the Balance Sheet with a charge or credit recognised in other comprehensive income in the period in which they occur. The re-measurements of the net defined benefit liability are recognised directly in the other comprehensive income in the period in which they arise. Past service cost is recognised in profit or loss in the period of a plan amendment. Net interest is calculated by applying the discount rate at the beginning of the period to the net defined benefit liability or asset. Defined benefit costs are categorised as follows:
> service cost (including current service cost, past service cost, as well as gains and losses on curtailments and settlements);
> net interest expense or income; and
> re-measurement
The retirement benefit obligation recognised in the balance sheet represents the actual deficit or surplus in the Company’s defined benefit plans. Any surplus resulting from this calculation is limited to the present value of any economic benefits available in the form of refunds from the plans or reductions in future contributions to the plans.
Other current and non-current employee benefits Liabilities recognised in respect of short-term employee
benefits are measured at the undiscounted amount of the benefits expected to be paid in exchange for the related service.
Liabilities recognised in respect of other long-term employee benefits are measured at the present value of the estimated future cash outflows expected to be made by the Company in respect of services provided by employees up to the reporting date.
3.11 Government grants, subsidies and export incentives Government grants and subsidies are recognised when there is
reasonable assurance that the Company will comply with the conditions attached to them and the grants / subsidy will be received.
Government grants whose primary condition is that the Company should purchase, construct or otherwise acquire non-current assets are recognised as deferred revenue in the balance sheet and transferred to profit or loss as and when the related obligations are met. Revenue grant is recognised as an income in the period in which related obligation is met.
Export Incentives earned in the year of exports are netted off from cost of raw material imported.
3.12 Foreign currency transactions and translations Foreign currency transactions are recorded at rates of exchange
prevailing on the date of transaction. Monetary assets and liabilities denominated in foreign currencies as at the balance sheet date are translated at the rate of exchange prevailing at the year-end. Non-monetary items carried at fair value that are denominated in foreign currencies are retranslated at the rates prevailing at the date when the fair value was determined. Non-monetary items that are measured in terms of historical cost in a foreign currency are not retranslated.
136

Exchange differences on monetary items are recognised in profit or loss in the period in which they arise except for:
> exchange differences on foreign currency borrowings relating to assets under construction for future productive use, which are included in the cost of those assets when they are regarded as an adjustment to interest costs on those foreign currency borrowings;
> exchange differences on transactions entered into in order to hedge certain foreign currency risks; and
> exchange differences on monetary items receivable from or payable to a foreign operation for which settlement is neither planned nor likely to occur (therefore forming part of the net investment in the foreign operation), which are recognised initially in other comprehensive income and reclassified from equity to profit or loss on repayment of the monetary items.
3.13 Employee share based payments Stock appreciation rights (Phantom stock units) are granted
to employees under the Cash-settled Employee Share-based Payment Plan (Phantom Stock Plan).
For cash-settled share-based payments, a liability is recognised for the goods or services acquired, measured initially at the fair value of the liability. At the end of each reporting period until the liability is settled, and at the date of settlement, the fair value of the liability is remeasured, with any changes in fair value recognised in profit or loss for the year.
3.14 Borrowing costs Borrowing costs directly attributable to the acquisition,
construction or production of qualifying assets, which are assets that necessarily take a substantial period of time to get ready for their intended use or sale, are added to the cost of those assets, until such time as the assets are substantially ready for their intended use or sale.
All other borrowing costs are recognised in profit or loss in the period in which they are incurred.
3.15 Leases Leases are classified as finance leases whenever the terms
of the lease transfer substantially all the risks and rewards of ownership to the lessee. All other leases are classified as operating leases.
The Company as lessee Finance lease: Assets held under finance leases are initially recognised as
assets of the Company at their fair value at the inception of the lease or, if lower, at the present value of the minimum lease payments. The corresponding liability to the lessor is included in the balance sheet as a finance lease obligation.
Lease payments are apportioned between finance expenses and reduction of the lease obligation so as to achieve a constant rate of interest on the remaining balance of the liability. Finance expenses are recognised immediately in profit or loss, unless they are directly attributable to qualifying assets, in which case they are capitalised in accordance with the Company’s general policy on borrowing costs. Contingent rentals are recognised as expenses in the periods in which they are incurred.
Operating lease: Operating lease payments are recognised as an expense on a
straight-line basis over the lease term, except where another systematic basis is more representative of the time pattern in which economic benefits from the leased asset are consumed or the payments to the lessor are structured to increase in line with expected general inflation to compensate for the lessor’s expected inflationary cost increases. Contingent rentals arising under operating leases are recognised as an expense in the period in which they are incurred.
In the event that lease incentives are received to enter into operating leases, such incentives are recognised as a liability. The aggregate benefit of incentives is recognised as a reduction of rental expense on a straight-line basis, except where another systematic basis is more representative of the time pattern in which economic benefits from the leased asset are consumed.
3.16 Earnings per share Basic earnings per share is computed by dividing the
profit / (loss) after tax (including the post tax effect of extraordinary items, if any) by the weighted average number of equity shares outstanding during the year. Diluted earnings per share is computed by dividing the profit / (loss) after tax (including the post tax effect of extraordinary items, if any) as adjusted for dividend, interest and other charges to expense or income (net of any attributable taxes) relating to the dilutive potential equity shares, by the weighted average number of equity shares considered for deriving basic earnings per share and the weighted average number of equity shares which could have been issued on the conversion of all dilutive potential equity shares. Potential equity shares are deemed to be dilutive only if their conversion to equity shares would decrease the net profit per share from continuing ordinary operations. Potential dilutive equity shares are deemed to be converted as at the beginning of the period, unless they have been issued at a later date. The dilutive potential equity shares are adjusted for the proceeds receivable had the shares been actually issued at fair value (i.e. average market value of the outstanding shares). Dilutive potential equity shares are determined independently for each period presented. The number of equity shares and potentially dilutive equity shares are adjusted for share splits / reverse share splits and bonus shares, as appropriate.
3.17 Impairment of tangible and intangible assets At the end of each reporting period, the Company reviews
the carrying amounts of its tangible and intangible assets or cash generating units to determine whether there is any indication that those assets have suffered an impairment loss. If any such indication exists, the recoverable amount of the asset is estimated in order to determine the extent of the impairment loss (if any). When it is not possible to estimate the recoverable amount of an individual asset, the Company estimates the recoverable amount of the cash-generating unit to which the asset belongs. When a reasonable and consistent basis of allocation can be identified, corporate assets are also allocated to individual cash-generating units, or otherwise they are allocated to the smallest group of cash-generating units for which a reasonable and consistent allocation basis can be identified.
Intangible assets with indefinite useful lives and intangible assets not yet available for use are tested for impairment at least annually, or whenever there is an indication that the asset may be impaired.
137Apollo Tyres Ltd Annual Report 2017-18
Corporate Overview / Statutory Reports / Financial Statements

Recoverable amount is the higher of fair value less costs of disposal and value in use. In assessing value in use, the estimated future cash flows are discounted to their present value using a pre-tax discount rate that reflects current market assessments of the time value of money and the risks specific to the asset for which the estimates of future cash flows have not been adjusted.
If the recoverable amount of an asset (or cash-generating unit) is estimated to be less than its carrying amount, the carrying amount of the asset (or cash-generating unit) is reduced to its recoverable amount. An impairment loss is recognised immediately in profit or loss, unless the relevant asset is carried at a revalued amount, in which case the impairment loss is treated as a revaluation decrease.
When an impairment loss subsequently reverses, the carrying amount of the asset (or a cash-generating unit) is increased to the revised estimate of its recoverable amount, but so that the increased carrying amount does not exceed the carrying amount that would have been determined had no impairment loss been recognised for the asset (or cash-generating unit) in prior years. A reversal of an impairment loss is recognised immediately in profit or loss, unless the relevant asset is carried at a revalued amount, in which case the reversal of the impairment loss is treated as a revaluation increase.
3.18 Provisions and contingencies A provision is recognized when the Company has a present
obligation (legal / constructive) as a result of past events and it is probable that an outflow of resources will be required to settle the obligation, in respect of which a reliable estimate can be made.
The amount recognised as a provision is the best estimate of the consideration required to settle the present obligation at the end of the reporting period, taking into account the risks and uncertainties surrounding the obligation. When a provision is measured using the cash flows estimated to settle the present obligation, its carrying amount is the present value of those cash flows (when the effect of the time value of money is material).
Contingent liability is disclosed for (i) Possible obligation which will be confirmed only by future events not wholly within the control of the Company or (ii) Present obligations arising from past events where it is not probable that an outflow of resources will be required to settle the obligation or a reliable estimate of the amount of the obligation cannot be made. When some or all of the economic benefits required to settle a provision are expected to be recovered from a third party, a receivable is recognised as an asset if it is virtually certain that reimbursement will be received and the amount of the receivable can be measured reliably.
Provisions for the expected cost of sales related obligations are recognised at the date of sale of the relevant products, at the management’s best estimate of the expenditure required to settle the Company’s obligation.
3.19 Financial instruments Financial assets and financial liabilities are recognised when
an entity becomes a party to the contractual provisions of the instruments.
Financial assets and financial liabilities are initially measured at fair value. Transaction costs that are directly attributable
to the acquisition or issue of financial assets and financial liabilities (other than financial assets and financial liabilities at fair value through profit or loss) are added to or deducted from the fair value of the financial assets or financial liabilities, as appropriate, on initial recognition. Transaction costs directly attributable to the acquisition of financial assets or financial liabilities at fair value through profit or loss are recognised immediately in profit or loss.
3.20 Financial assets All regular way purchases or sales of financial assets are
recognised and derecognised on a trade date basis. Regular way purchases or sales are purchases or sales of financial assets that require delivery of assets within the time frame established by regulation or convention in the marketplace.
All recognised financial assets are subsequently measured in their entirety at either amortised cost or fair value, depending on the classification of the financial assets.
3.20.1 Classification of financial asset a. Loans and receivable Financial assets that meet the following conditions are
subsequently measured at amortised cost less impairment loss (except for investments that are designated as at FVTPL on initial recognition):
> the asset is held within a business model whose objective is to hold assets in order to collect contractual cash flows; and
> the contractual terms of the instrument give rise on specified dates to cash flows that are solely payments of principal and interest on the principal amount outstanding.
The effective interest method is a method of calculating the amortised cost of a debt instrument and of allocating interest income over the relevant period. The effective interest rate is the rate that exactly discounts estimated future cash receipts (including all fees and points paid or received that form an integral part of the effective interest rate, transaction costs and other premiums or discounts) through the expected life of the debt instrument, or, where appropriate, a shorter period, to the net carrying amount on initial recognition.
Income is recognised on an effective interest basis for debt instruments other than those financial assets classified as at FVTPL. Interest income is recognised in profit or loss and is included in the ‘Other Income’ line item.
b. Assets available for sale Financial assets that meet the following conditions
are subsequently measured at fair value through other comprehensive income (‘FVTOCI’) (except for investments that are designated as at FVTPL on initial recognition):
> the asset is held within a business model whose objective is achieved both by collecting contractual cash flows and selling financial assets; and
> the contractual terms of the instrument give rise on specified dates to cash flows that are solely payments of principal and interest on the principal amount outstanding.
138

All other financial assets are subsequently measured at fair value.
c. Assets held for trading A financial asset is held for trading if:
> it has been acquired principally for the purpose of selling it in the near term; or
> on initial recognition it is part of a portfolio of identified financial instruments that the Company manages together and has a recent actual pattern of short-term profit-taking; or
> it is a derivative that is not designated and effective as a hedging instrument or a financial guarantee.
Dividends on these investments in equity instruments are recognised in profit or loss when the right to receive the dividends is established and it is probable that the economic benefits associated with the dividend will flow to the entity, the dividend does not represent a recovery of part of cost of the investment and the amount of dividend can be measured reliably.
d. Financial assets at fair value through profit or loss (‘FVTPL’)
Investments in equity instruments are classified as at FVTPL, unless the Company irrevocably elects on initial recognition to present subsequent changes in fair value in other comprehensive income for equity instruments which are not held for trading.
Debt instrument that do not meet the amortised cost criteria or fair value through other comprehensive income criteria (see above) are measured at FVTPL. In addition, debt instruments that meet the amortised cost criteria or the fair value through other comprehensive income criteria but are designated as at FVTPL are measured at FVTPL.
A financial asset may be designated as at FVTPL upon initial recognition if such designation eliminates or significantly reduces a measurement or recognition inconsistency that would arise from measuring assets or liabilities or recognising the gains and losses on them on different bases.
Financial assets at FVTPL are measured at fair value at the end of each reporting period, with any gains or losses arising on re-measurement recognised in profit or loss. The net gain or loss recognised in profit or loss is included in the ‘other income’ line item. Dividend on financial assets at FVTPL is recognised when the Company’s right to receive the dividends is established, it is probable that the economic benefits associated with the dividend will flow to the entity, the dividend does not represent a recovery of part of cost of the investment and the amount of dividend can be measured reliably.
3.20.2 Impairment of financial assets The Company applies the expected credit loss model for
recognising impairment loss on financial assets measured at amortised cost, debt instruments at FVTOCI, lease receivables, trade receivables, other contractual rights to receive cash or other financial assets, and financials guarantees not designated as at FVTPL.
Expected credit losses are the weighted average of credit losses with the respective risks of default occurring as the weights. Credit loss is the difference between all contractual cash flows that are due to the Company in accordance with the contract and all the cash flows that the Company expects to receive (i.e., all cash shortfalls), discounted at the original effective interest rate (or credit-adjusted effective interest rate for purchased or originated credit-impaired financial assets). The Company estimates cash flows by considering all contractual terms of the financial instrument (for example, prepayment, extension, call and similar options) through the expected life of that financial instruments.
The Company measures the loss allowance for a financial instrument at an amount equal to the lifetime expected credit losses if the credit risk on that financial instrument has increased significantly since initial recognition. If the credit risk on a financial instrument has not increased significantly since initial recognition, the Company measures the loss allowance for that financial instrument at an amount equal to 12-month expected credit losses.12-month expected credit losses are portion of the life-time expected credit losses and represent the lifetime cash shortfalls that will result if default occurs within the 12 months after the reporting date and thus, are not cash shortfalls that are predicted over the next 12 months.
If the Company measured loss allowance for a financial instrument at lifetime expected credit loss model in the previous period, but determines at the end of a reporting period that the credit risk has not increased significantly since initial recognition due to improvement in credit quality as compared to the previous period, the Company again measures the loss allowance based on 12- month expected credit losses.
When making the assessment of whether there has been a significant increase in credit risk since initial recognition, the Company uses the change in the risk of a default occurring over the expected life of the financial instrument. To make that assessment, the Company compares the risk of a default occurring on the financial instrument as at the reporting date with the risk of a default occurring on the financial instrument as at the date of initial recognition and considers reasonable and supportable information, that is available without undue cost or effort, that is indicative of significant increases in credit risk since initial recognition.
For trade receivables or any contractual right to receive cash or another financial asset that result from transactions that are within the scope of Ind AS 11 - Construction Contracts and Ind AS 18 - Revenue, the Company always measures the loss allowance at an amount equal to lifetime expected credit losses.
3.20.3 De-recognition of financial assets The Company derecognises a financial asset when the
contractual rights to the cash flows from the asset expire, or when it transfers the financial asset and substantially all the risks and rewards of ownership of the asset to another party. If the Company neither transfers nor retains substantially all the risks and rewards of ownership and continues to control the transferred asset, the Company recognises its retained interest in the asset and an associated liability for amounts
139Apollo Tyres Ltd Annual Report 2017-18
Corporate Overview / Statutory Reports / Financial Statements

it may have to pay. If the Company retains substantially all the risks and rewards of ownership of a transferred financial asset, the Company continues to recognise the financial asset and also recognises a collateralised borrowing for the proceeds received.
On de-recognition of a financial asset in its entirety, the difference between the asset’s carrying amount and the sum of the consideration received and receivable and the cumulative gain or loss that had been recognised in other comprehensive income and accumulated in equity is recognised in profit or loss if such gain or loss would have otherwise been recognized in profit or loss on disposal of that financial asset.
On de-recognition of a financial asset other than in its entirety (e.g. when the Company retains an option to repurchase part of a transferred asset), the Company allocates the previous carrying amount of the financial asset between the part it continues to recognise under continuing involvement, and the part it no longer recognises on the basis of the relative fair values of those parts on the date of the transfer. The difference between the carrying amount allocated to the part that is no longer recognised and the sum of the consideration received for the part no longer recognised and any cumulative gain or loss allocated to it that had been recognised in other comprehensive income is recognised in profit or loss if such gain or loss would have otherwise been recognized in profit or loss on disposal of that financial asset. A cumulative gain or loss that had been recognised in other comprehensive income is allocated between the part that continues to be recognised and the part that is no longer recognised on the basis of the relative fair values of those parts.
3.20.4 Foreign Exchange gains and losses The fair value of financial assets denominated in a foreign
currency is determined in that foreign currency and translated at the spot rate at the end of each reporting period.
For foreign currency denominated financial assets measured at amortised cost and FVTPL, the exchange differences are recognised in profit or loss except for those which are designated as hedging instruments in hedging relationship.
3.21 Financial liabilities and equity instruments 3.21.1 Classification as debt or equity Debt and equity instruments issued by the Company
are classified as either financial liabilities or as equity in accordance with the substance of the contractual arrangements and the definitions of a financial liability and an equity instrument.
3.21.2 Equity instruments An equity instrument is any contract that evidences a
residual interest in the assets of an entity after deducting all of its liabilities. Equity instruments issued by the Company are recognised at the proceeds received, net of direct issue costs.
3.21.3 Financial liabilities All financial liabilities are subsequently measured at
amortised cost using the effective interest method or at FVTPL. However, financial liabilities that arise when a transfer of a financial asset does not qualify for derecognition or when the continuing involvement approach applies, financial guarantee contracts issued by the Company are measured in accordance with the specific accounting policies set out below.
3.21.3.1 Financial liabilities at FVTPL Financial liabilities are classified as at FVTPL when
the financial liability is either held for trading or it is designated as at FVTPL.
A financial liability is classified as held for trading if:
> it has been incurred principally for the purpose of repurchasing it in the near term; or
> on initial recognition it is part of a portfolio of identified financial instruments that the Company manages together and has a recent actual pattern of short-term profit-taking; or
> it is a derivative that is not designated and effective as a hedging instrument.
A financial liability other than a financial liability held for trading may be designated as at FVTPL upon initial recognition if:
> such designation eliminates or significantly reduces a measurement or recognition inconsistency that would otherwise arise; or
> the financial liability forms part of a Company of financial assets or financial liabilities or both, which is managed and its performance is evaluated on a fair value basis, in accordance with the Company’s documented risk management or investment strategy, and information about the Companying is provided internally on that basis; or
> it forms part of a contract containing one or more embedded derivatives, and Ind AS 109 - Financial Instruments permits the entire combined contract to be designated as at FVTPL in accordance with Ind AS 109.
Financial liabilities at FVTPL are stated at fair value, with any gains or losses arising on remeasurement recognised in profit or loss.
3.21.3.2 Financial liabilities subsequently measured at amortised cost
Financial liabilities that are not held-for-trading and are not designated as at FVTPL are measured at amortised cost at the end of subsequent accounting periods. The carrying amounts of financial liabilities that are subsequently measured at amortised cost are determined based on the effective interest method. Interest expense that is not capitalised as part of costs of an asset is included in the ‘finance costs’ line item.
140

The effective interest method is a method of calculating the amortised cost of a financial liability and of allocating interest expense over the relevant period. The effective interest rate is the rate that exactly discounts estimated future cash payments (including all fees and points paid or received that form an integral part of the effective interest rate, transaction costs and other premiums or discounts) through the expected life of the financial liability, or (where appropriate) a shorter period, to the net carrying amount on initial recognition.
3.21.3.3 Financial guarantee contracts A financial guarantee contract is a contract that requires
the issuer to make specified payments to reimburse the holder for a loss it incurs because a specified debtor fails to make payments when due in accordance with the terms of a debt instrument.
Financial guarantee contracts issued by the Company are initially measured at their fair values and, if not designated as at FVTPL, are subsequently measured at:
> amount of loss allowance determined in accordance with impairment requirements of Ind AS 109 - Financial Instruments; and
> amount initially recognised less, where appropriate, cumulative amortisation recognised in accordance with the revenue recognition policies of Ind AS 18 - Revenue.
For financial liabilities that are denominated in a foreign currency and are measured at amortised cost at the end of each reporting period, the foreign exchange gains and losses are determined based on the amortised cost of the instruments and are recognised in the ‘Other Income’ line item.
The fair value of financial liabilities denominated in a foreign currency is determined in that foreign currency and translated at the spot rate at the end of the reporting period. For financial liabilities that are measured as at FVTPL, the foreign exchange component forms part of the fair value gains or losses and is recognised in profit or loss.
3.21.3.4 Derecognition of financial liabilities The Company derecognises financial liabilities when, and
only when, the Company’s obligations are discharged, cancelled or they expire. The difference between the carrying amount of the financial liability derecognised and the consideration paid and payable is recognised in profit or loss.
3.22 Derivative financial instruments The Company enters into a variety of derivative financial
instruments to manage its exposure to interest rate and foreign exchange rate risks, including options, foreign exchange forward contracts and cross currency swaps.
Derivatives are initially recognised at fair value at the date the derivative contracts are entered into and are subsequently remeasured to their fair value at the end of each reporting period. The resulting gain or loss is recognised in profit or
loss immediately unless the derivative is designated and effective as a hedging instrument, in which event the timing of the recognition in profit or loss depends on the nature of the hedging relationship and the nature of the hedged item.
3.23 Hedge Accounting The Company designates certain hedging instruments,
which include derivatives, embedded derivatives and non-derivatives in respect of foreign currency risk, as either fair value hedges, cash flow hedges, or hedges of net investments in foreign operations. Hedges of foreign exchange risk on firm commitments are accounted for as cash flow hedges.
At the inception of the hedge relationship, the entity documents the relationship between the hedging instrument and the hedged item, along with its risk management objectives and its strategy for undertaking various hedge transactions. Furthermore, at the inception of the hedge and on an ongoing basis, the Company documents whether the hedging instrument is highly effective in offsetting changes in fair values or cash flows of the hedged item attributable to the hedged risk.
Cash flow hedges The effective portion of changes in the fair value of derivatives
that are designated and qualify as cash flow hedges is recognised in other comprehensive income and accumulated under the heading of cash flow hedging reserve. The gain or loss relating to the ineffective portion is recognised immediately in profit or loss, and is included in the ‘Other income’/ ‘Other expense’ line item. Amounts previously recognised in other comprehensive income and accumulated in equity relating to (effective portion as described above) are reclassified to profit or loss in the periods when the hedged item affects profit or loss, in the same line as the recognised hedged item. However, when the hedged forecast transaction results in the recognition of a non-financial asset or a non-financial liability, such gains and losses are transferred from equity (but not as a reclassification adjustment) and included in the initial measurement of the cost of the non -financial asset or non-financial liability.
In cases where the designated hedging instruments are options and forward contracts, the Company has an option, for each designation, to designate on an instrument only the changes in intrinsic value of the options and spot element of forward contracts respectively as hedges. In such cases, the time value of the options is accounted based on the type of hedged item which those options hedge.
In case of transaction related hedged item in the above cases, the change in time value of the options is recognised in other comprehensive income to the extent it relates to the hedged item and accumulated in a separate component of equity i.e. Reserve for time value of options and forward elements of forward contracts in hedging relationship. This separate component is removed and directly included in the initial cost or other carrying amount of the asset or the liability (i.e. not as a reclassification adjustment thus not affecting other comprehensive income) if the hedged item subsequently results in recognition of a non-financial asset or a non-financial liability. In other cases, the amount accumulated is reclassified to profit or loss as a reclassification adjustment in the same period in which the hedged expected future cash flows affect profit or loss.
141Apollo Tyres Ltd Annual Report 2017-18
Corporate Overview / Statutory Reports / Financial Statements

In case of time-period related hedged item in the above cases, the change in time value of the options is recognised in other comprehensive income to the extent it relates to the hedged item and accumulated in a separate component of equity i.e. Reserve for time value of options and forward elements of forward contracts in hedging relationship. The time value of options at the date of designation of the options in the hedging relationships is amortised on a systematic and rational basis over the period during which the options’ intrinsic value could affect profit or loss. This is done as a reclassification adjustment and hence affects other comprehensive income.
In cases where only the spot element of the forward contracts is designated in a hedging relationship and the forward element of the forward contract is not designated, the Company makes the choice for each designation whether to recognise the changes in forward element of fair value of the forward contracts in profit or loss or to account for this element similar to the time value of an option.
Hedge accounting is discontinued when the hedging instrument expires or is sold, terminated, or exercised, or when it no longer qualifies for hedge accounting. Any gain or loss recognised in other comprehensive income and accumulated in equity at that time remains in equity and is recognised when the forecast transaction is ultimately recognised in profit or loss. When a forecast transaction is no longer expected to occur, the gain or loss accumulated in equity is recognised immediately in profit or loss.
3.24 Cash and cash equivalents Cash comprises cash on hand and demand deposits with banks.
Cash equivalents are short-term balances (with an original maturity of three months or less from the date of acquisition), highly liquid investments that are readily convertible into known amounts of cash and which are subject to insignificant risk of changes in value.
For the purpose of the statement of cash flows, cash and cash equivalents consist of cash and short-term balances, as defined above, net of outstanding cash credits as they are considered an integral part of the Company’s cash management.
3.25 Rounding off amounts All amounts disclosed in the financial statements and notes
have been rounded off to the nearest millions as per the requirements of Schedule III of the Act unless otherwise stated.
3.26 Critical accounting judgements and key sources of estimation uncertainty
The preparation of financial statements in conformity with Ind AS requires management to make certain judgements and estimates that may effect the application of accounting policies, reported amounts and related disclosures.
These judgments and estimates may have an impact on the assets and liabilities, disclosure of contingent liabilities at the date of the financial statements, and income and expense items for the period under review. Actual results may differ from these judgements and estimates.
All assumptions, expectations and forecasts that are used as a basis for judgments and estimates in the financial statements represent as accurately an outlook as possible for the Company. These judgements and estimates only represent the interpretation of the Company as of the dates on which they were prepared.
Important judgments and estimates relate largely to provisions, pensions, tangible and intangible assets (lives, residual values and impairment), deferred tax assets and liabilities and valuation of financial instruments.
142

B1
PR
OP
ER
TY,
PL
AN
T A
ND
EQ
UIP
ME
NT
AN
D I
NTA
NG
IBL
E A
SS
ET
S A
S O
N M
AR
CH
31,
20
18
` in
Mill
ion
Des
crip
tion
of a
sset
s
Gro
ss B
lock
Acc
umul
ated
Dep
reci
atio
n /
Am
orti
sati
onN
et B
lock
As
onM
arch
31,
20
17A
ddit
ions
Dis
posa
lsA
s on
Mar
ch 3
1, 2
018
As
on
Mar
ch 3
1, 2
017
Dep
reci
atio
n /
amor
tisa
tion
ex
pens
e
Elim
inat
ed o
n di
spos
al o
f as
sets
As
onM
arch
31,
20
18A
s on
Mar
ch 3
1, 2
018
As
onM
arch
31,
20
17
A.
Pro
pert
y, p
lant
and
equ
ipm
ent -
ow
ned
unle
ss o
ther
wis
e st
ated
Land
:Fr
eeho
ld la
nd 1
75.1
4 -
-
1
75.1
4 -
-
-
-
1
75.1
4 1
75.1
4
Leas
ehol
d la
nd *
189
.64
-
-
189
.64
18.
39
2.1
2 -
2
0.5
1 1
69.1
3 1
71.2
5 (a
) B
uild
ings
10
,652
.35
1,6
71.0
1 5
1.25
1
2,27
2.11
2
,553
.51
347
.91
8.5
6 2
,892
.86
9,3
79.2
5 8
,098
.84
(b)
(d)
(d)
Pla
nt a
nd e
quip
men
t **
56,
368.
55
10
,174
.64
489
.08
66,
054
.11
19,
150
.21
2,7
26.2
3 2
49.3
4 2
1,62
7.10
4
4,42
7.0
1 3
7,21
8.34
(b
) E
lect
rica
l ins
tall
atio
ns 1
,980
.55
30
4.42
3
.10
2
,281
.87
967
.36
20
7.41
2
.85
1,1
71.9
2 1
,10
9.95
1
,013
.19
(b)
Furn
iture
and
fixt
ures
1,5
94.1
1 3
87.2
2 7
.22
1,9
74.1
1 9
60.3
6 1
55.2
6 6
.19
1,1
09.
43
864
.68
633
.75
(b)
Vehi
cles
5
87.7
7 1
83.6
0
10
0.5
0
670
.87
264
.22
92.
97
74.
45
282
.74
388
.13
323
.55
(b)
Offi
ce e
quip
men
t 1
22.3
9 2
56.3
1 0
.47
378
.23
46.
98
51.
40
0.0
9 9
8.29
2
79.9
4 7
5.41
(b
) To
tal t
angi
ble
asse
ts 7
1,67
0.5
0
12,
977.
20
651
.62
83,
996.
08
23,
961.
03
3,5
83.3
0
34
1.4
8 2
7,20
2.85
5
6,79
3.23
4
7,70
9.4
7 B
.In
tang
ible
ass
ets:
Com
pute
r so
ftw
are
561
.32
163
.76
-
725
.08
319
.12
60
.51
-
379
.63
345
.45
242
.20
(b
) To
tal (
A +
B)
72,
231.
82
13,
140
.96
651
.62
84
,721
.16
24
,280
.15
3,6
43.
81
34
1.4
8 2
7,58
2.4
8 5
7,13
8.68
4
7,95
1.67
(c
)
forming an Integral Part of the AccountsB. Notes
143Apollo Tyres Ltd Annual Report 2017-18
Corporate Overview / Statutory Reports / Financial Statements

PR
OP
ER
TY,
PL
AN
T A
ND
EQ
UIP
ME
NT
AN
D I
NTA
NG
IBL
E A
SS
ET
S A
S O
N M
AR
CH
31,
20
17
` in
Mill
ion
Des
crip
tion
of a
sset
s
Gro
ss B
lock
Acc
umul
ated
Dep
reci
atio
n /
Am
orti
sati
onN
et B
lock
As
on
Mar
ch 3
1, 2
016
Add
itio
nsD
ispo
sals
As
onM
arch
31,
20
17 A
s on
M
arch
31,
20
16
Dep
reci
atio
n /
amor
tisa
tion
ex
pens
e fo
r th
e ye
ar
Elim
inat
ed o
n di
spos
al o
f as
sets
As
onM
arch
31,
20
17A
s on
Mar
ch 3
1, 2
017
As
onM
arch
31,
20
16
AP
rope
rty,
pla
nt a
nd e
quip
men
t -
owne
d un
less
oth
erw
ise
stat
edLa
nd:
Free
hold
land
175
.14
-
-
175
.14
-
-
-
-
175
.14
175
.14
Leas
ehol
d la
nd *
189
.64
-
-
189
.64
16.
27
2.1
2 -
1
8.39
1
71.2
5 1
73.3
7 (a
) B
uild
ings
8,3
00
.31
2,3
52.0
4 -
1
0,6
52.3
5 2
,270
.53
282
.98
-
2,5
53.5
1 8
,098
.84
6,0
29.7
8 (b
) (d
) (d
) P
lant
and
equ
ipm
ent
** 4
2,36
1.33
1
4,48
7.32
4
80.1
0
56,
368.
55
17,
404.
04
2,1
67.1
5 4
20.9
8 1
9,15
0.2
1 3
7,21
8.34
2
4,95
7.29
(b
) E
lect
rica
l ins
tall
atio
ns 1
,545
.80
4
35.6
3 0
.88
1,9
80.5
5 8
06.
37
161
.81
0.8
2 9
67.3
6 1
,013
.19
739
.43
(b)
Furn
iture
and
fixt
ures
1,2
90.8
4 3
11.1
1 7
.84
1,5
94.1
1 8
63.7
6 1
03.
63
7.0
3 9
60.3
6 6
33.7
5 4
27.0
8 (b
) Ve
hicl
es
576
.73
130
.11
119
.07
587
.77
230
.26
10
0.3
3 6
6.37
2
64.2
2 3
23.5
5 3
46.4
7 (b
) O
ffice
equ
ipm
ent
49.
31
73.
21
0.1
3 1
22.3
9 2
8.91
1
8.19
0
.12
46.
98
75.
41
20
.40
(b
) To
tal t
angi
ble
asse
ts 5
4,4
89.1
0
17,
789.
42
60
8.0
2 7
1,67
0.5
0
21,
620
.14
2
,836
.21
495
.32
23,
961.
03
47,
709.
47
32,
868.
96
BIn
tang
ible
ass
ets:
Com
pute
r so
ftw
are
40
2.60
1
58.7
2 -
5
61.3
2 2
73.3
4 4
5.78
-
3
19.1
2 2
42.2
0
129
.26
(b)
Tota
l (A
+ B
) 5
4,8
91.7
0
17,
948.
14
60
8.0
2 7
2,23
1.82
2
1,89
3.4
8 2
,881
.99
495
.32
24
,280
.15
47,
951.
67
32,
998.
22
(c)
* Le
aseh
old
land
is n
et o
f ` 5
.39
Mill
ion
(` 5
.39
Mill
ion)
sub
leas
ed t
o C
lass
ic A
uto
Tube
s Lt
d., a
Com
pany
in w
hich
dir
ecto
rs a
re in
tere
sted
sin
ce t
he y
ear
ende
d 20
09-
10.
**
Pla
nt a
nd e
quip
men
t in
clud
e jo
intl
y ow
ned
asse
ts w
ith g
ross
boo
k va
lue
of `
311
.28
Mill
ion
(` 3
11.2
8 M
illio
n) a
nd n
et b
ook
valu
e of
` 2
50.6
9 M
illio
n (`
263
.22
Mill
ion)
whi
ch r
epre
sent
s 50
% o
wne
rshi
p in
the
ass
et.
P
lant
and
equ
ipm
ent
incl
ude
asse
ts t
aken
on
finan
ce le
ase
with
gro
ss b
ook
valu
e of
` 4
00
.00
Mill
ion
(` 4
00
.00
Mill
ion)
, and
net
boo
k va
lue
of `
183
.25
Mill
ion
(` 2
00
.04
Mill
ion)
.(a
) R
epre
sent
s pr
opor
tiona
te le
ase
prem
ium
` 2
.12
Mill
ion
(` 2
.12
Mill
ion)
am
ortis
ed.
(b)
Bui
ldin
gs in
clud
e `
13.3
3 M
illio
n (`
22.
66 M
illio
n), p
lant
and
equ
ipm
ent
incl
ude
` 16
4.2
3 M
illio
n (`
85.
76 M
illio
n), e
lect
rica
l ins
tall
atio
ns in
clud
e N
il (`
0.1
6 M
illio
n), f
urni
ture
and
fixt
ures
incl
ude
` 0
.01
Mill
ion
(` 7
.03
Mill
ion)
, ve
hicl
es in
clud
e N
il (`
0.1
3 M
illio
n), o
ffice
equ
ipm
ent
incl
ude
` 0
.04
Mill
ion
(` 1
.46
Mill
ion)
and
com
pute
r so
ftw
are
incl
ude
` 12
9.70
Mill
ion
(` 1
2.0
5 M
illio
n) r
elat
ing
to r
esea
rch
and
deve
lopm
ent
(r
efer
not
e C
17).
(c)
Incl
udes
dir
ectl
y at
trib
utab
le e
xpen
ses
capi
talis
ed t
o th
e ex
tent
of `
674
.90
Mill
ion
(` 1
69.2
2 M
illio
n) in
clud
ing
` 14
7.37
Mill
ion
(Nil)
cap
italis
ed fr
om C
WIP
of p
revi
ous
year
and
bor
row
ing
cost
cap
italis
ed t
o th
e ex
tent
of `
58
3.78
Mill
ion
(` 2
33.1
1 M
illio
n) in
clud
ing
` 64
.86
Mill
ion
(Nil)
cap
italis
ed fr
om C
WIP
of p
revi
ous
year
.(d
) B
uild
ings
incl
ude
build
ings
con
stru
cted
on
leas
ehol
d la
nd w
ith g
ross
boo
k va
lue
of `
10
,54
9.38
Mill
ion
(` 9
,131
.32
Mill
ion)
and
net
boo
k va
lue
of `
8,0
72.9
6 M
illio
n (`
6,9
73.9
2 M
illio
n)(e
) C
arry
ing
amou
nt o
f tan
gibl
e as
sets
are
ple
dged
as
secu
rity
for
liabi
litie
s (r
efer
not
e B
15 (a
)).
(f)
Cap
ital w
ork-
in-p
rogr
ess
incl
udes
land
of `
11.
19 M
illio
n (`
11.
19 M
illio
n) a
cqui
red
by t
he C
ompa
ny a
nd is
in t
he p
roce
ss o
f get
ting
the
title
dee
ds t
rans
ferr
ed t
o its
nam
e.
144

FINANCIAL ASSETS (NON-CURRENT)
B2 INVESTMENTS
` in Million
ParticularsAs on
March 31, 2018As on
March 31, 2017
I At fair value through profit and lossA Quoted investments *(a) Investment in equity instruments:
16,394 (16,394) equity shares of ` 10/- each in Bharat Gears Limited - fully paid up 2.76 1.90 (b) Investment in mutual funds:
Nil (209,965) units of ` 10/- each in “UTI Balanced Fund - Dividend Plan - Reinvestment” - 6.33 2.76 8.23
B Unquoted investments **Investment in equity instruments:Other companies:312,000 (312,000) equity shares of ` 10 each in Green Infra Wind Power Projects Limited- fully paid up 3.12 3.12 1,389,000 (620,000) equity shares of ` 0.19 each in OPGS Power Gujarat Private Limited- fully paid up 0.26 0.12 399,100 (196,000) equity shares of ` 10 each in NSL Wind Power Company (Phoolwadi)Private Limited - fully paid up 3.99 1.96 Nil (12,500) equity shares of ` 10 each in Trishul Electric and Power Gen Limited- fully paid up - 0.13 Nil (3,032,875) equity shares of ` 10 each in Ind Barath Energies (Thoothukkudi) Limited- fully paid up - 3.43 6,000 (Nil) equity shares of ` 30 each in Suryadev Alloys and Power Private Limited- fully paid up 0.18 - 104,600 (Nil) equity shares of ` 11.50 each in OPG Power Generation Private Limited- fully paid up 1.20 - 5,000 (5,000) equity shares of ` 100/- each in Apollo Tyres Employees’ MultipurposeCo-operative Society Limited - fully paid up 0.50 0.50
9.25 9.26 Investments carried at fair vaule through profit and loss 12.01 17.49
II At amortised costUnquoted investments
(a) Investment in equity instruments:Subsidiary companies:800 (800) equity shares of US$ 1 each in Apollo Tyres (Cyprus) Private Limited - fully paid up 174.17 174.17 50,001 (50,001) equity shares of EUR 0.72 each in Apollo Tyres (Green Field) B. V.- fully paid up 2.74 2.74 Associate company:1,667 (Nil) equity shares of ` 13,500 each in KT Telematic Solutions Private Limited- fully paid up 22.50 -
(b) Investment in membership interest:Apollo Tyres Co-operatief U.A. - wholly owned subsidiary 16,182.34 9,854.22
Investments carried at amortised cost 16,381.75 10,031.13 16,393.76 10,048.62
* Aggregate amount of quoted investments at cost 0.36 5.14Aggregate amount of quoted investments at market value 2.76 8.23
** Aggregate amount of unquoted investments at cost 16,391.00 10,040.39
145Apollo Tyres Ltd Annual Report 2017-18
Corporate Overview / Statutory Reports / Financial Statements

FINANCIAL ASSETS (NON-CURRENT)
B3 LOANS
` in Million
ParticularsAs on
March 31, 2018 As on
March 31, 2017
(Unsecured, considered good unless otherwise stated)Employee advances - salary loan 19.87 17.11
19.87 17.11
B4 OTHER FINANCIAL ASSETS
` in Million
ParticularsAs on
March 31, 2018 As on
March 31, 2017
(Unsecured, considered good unless otherwise stated)Security deposits 130.68 104.05 Security deposits to related parties (refer note C23) 455.24 353.98 Security deposits with statutory authorities 262.14 216.25 Derivative assets measured at fair value (refer note C13) 254.24 95.06 Others 137.23 149.78
1,239.53 919.12
NON-FINANCIAL ASSETS (NON-CURRENT)
B5 OTHER NON - CURRENT ASSETS
` in Million
ParticularsAs on
March 31, 2018 As on
March 31, 2017
(Unsecured, considered good unless otherwise stated)Capital advances 1,070.39 1,609.86 Capital advances to related parties (refer note C23) 73.89 106.45 Doubtful capital advances 24.93 24.93 Provision for doubtful advances (24.93) (24.93)
1,144.28 1,716.31 Statutory balances recoverable 2.58 2.58
1,146.86 1,718.89
CURRENT ASSETS
B6 INVENTORIES *
` in Million
ParticularsAs on
March 31, 2018 As on
March 31, 2017
(valued at lower of cost and net realizable value)(i) Raw materials
- In hand 6,424.57 5,828.55 - In transit 918.75 558.99
7,343.32 6,387.54(ii) Work-in-progress # 1,069.24 986.06(iii) Finished goods
- In hand 6,988.44 7,500.03 - In transit 639.81 1,232.88
7,628.25 8,732.91(iv) Stock-in-trade
- In hand 202.20 256.30 - In transit 2.12 19.06
204.32 275.36 (v) Stores and spares 969.78 912.11
17,214.91 17,293.98
* The carrying amount of inventories are pledged as security for borrowings (refer note B15 (a)).# Work-in-progress consists of only automotive tyres.
146

FINANCIAL ASSETS (CURRENT)
B7 INVESTMENTS
` in Million
ParticularsAs on
March 31, 2018 As on
March 31, 2017
At fair value through profit and loss:Investment in mutual funds (quoted) * 3,640.47 3,444.44 At amortised cost:Investment in inter-corporate deposits (unquoted) # 9,750.00 500.00
13,390.47 3,944.44
` in Million
* Mutual Funds
As on March 31, 2018 As on March 31, 2017
Number of Units
Amount in (` in Million)
Number of Units
Amount in (` in Million)
ICICI Prudential Liquid - Direct Plan - Growth - - 4,747,917 1,101.04 ICICI Prudential Savings Fund - Direct Plan - Growth 6,744,803 1,823.42 - - Reliance Liquid Fund - Treasury Plan - Direct Growth Plan - - 121,298 481.23 Reliance Medium Term Fund - Direct Growth Plan 48,842,555 1,817.05 - - HDFC Liquid Fund - Direct Plan - Growth - - 15,599 50.06 Kotak Liquid Direct Plan Growth - - 151,876 500.81 UTI-Liquid Cash Plan-Institutional - Direct Plan - Growth - - 413,411 1,101.02 SBI Magnum Insta Cash Fund - Direct Plan - Growth - - 58,454 210.28
55,587,358 3,640.47 5,508,555 3,444.44
# Given for business purpose
` in Million
ParticularsAs on
March 31, 2018 As on
March 31, 2017
Aggregate amount of quoted investments at cost 3,500.00 3,443.37Aggregate amount of quoted investments at market value 3,640.47 3,444.44Aggregate amount of unquoted investments at cost 9,750.00 500.00
B8 TRADE RECEIVABLES *
` in Million
ParticularsAs on
March 31, 2018 As on
March 31, 2017
(Unsecured)Outstanding for a period exceeding six months from the date they were due for payment:Considered good 1.41 1.09 Considered doubtful 24.40 24.40 Others - Considered Good ** 5,500.05 3,863.83
5,525.86 3,889.32 Provision for doubtful trade receivables (24.40) (24.40)
5,501.46 3,864.92
* The carrying amount of trade receivable is pledged as security for borrowings (refer note B15 (a)).** Includes balances with related parties (refer note C23)
B9 CASH AND CASH EQUIVALENTS
` in Million
ParticularsAs on
March 31, 2018 As on
March 31, 2017
(i) Balances with banks:Current accounts 170.96 388.39 Other deposit accounts- original maturity of 3 months or less 1,003.34 208.92
(ii) Cheques on hand / remittances in transit 1,369.05 742.28 (iii) Cash on hand 1.16 1.29
2,544.51 1,340.88
147Apollo Tyres Ltd Annual Report 2017-18
Corporate Overview / Statutory Reports / Financial Statements

B10 BANK BALANCES OTHER THAN CASH AND CASH EQUIVALENTS
` in Million
ParticularsAs on
March 31, 2018 As on
March 31, 2017
Unpaid dividend accounts * 60.71 52.92 Deposits with maturity exceeding 3 months but less than 12 months 0.01 0.01
60.72 52.93
* These balances are not available for use by the Company and corresponding balance is disclosed as unclaimed dividend in note B21.
B11 LOANS
` in Million
ParticularsAs on
March 31, 2018 As on
March 31, 2017
(Unsecured, considered good unless otherwise stated)Employee advances - salary loan 16.89 22.84 Loans to related parties (refer note C23) * 5,744.75 1,732.31
5,761.64 1,755.15
* Given for business purpose
B12 OTHER FINANCIAL ASSETS
` in Million
ParticularsAs on
March 31, 2018 As on
March 31, 2017
Employee advances - others 10.10 6.73 Derivative assets measured at fair value (refer note C13) 102.06 307.50 Interest accrued on deposits / loans 272.65 28.26
384.81 342.49
NON-FINANCIAL ASSETS (CURRENT)
B13 OTHER CURRENT ASSETS
` in Million
ParticularsAs on
March 31, 2018 As on
March 31, 2017
(Unsecured, considered good unless otherwise stated)a. Advances given to related parties (refer note C23) 280.93 280.26 b. Trade advances: considered good 389.94 299.89
Doubtful advances 20.56 20.56 Provision for doubtful advances (20.56) (20.56)
389.94 299.89 c. Employee advances - others 59.44 60.92 d. Investment promotion subsidy receivable from
Government of Tamil Nadu (refer note C10) 757.74 1,000.71 e. Export obligations - advance licence benefit 236.35 - f. Export incentives recoverable 260.79 199.11 g. Balance with statutory authorities -
i. CENVAT recoverable 472.24 740.03 ii. VAT recoverable 44.47 487.72 iii. Service tax recoverable 2.42 108.01 iii. GST recoverable 1,323.52 -
h. Prepaid expenses 82.86 118.52 3,910.70 3,295.17
148

B14 EQUITY SHARE CAPITAL
` in Million
ParticularsAs on
March 31, 2018 As on
March 31, 2017
(a) Authorised 730,000,000 Nos. (730,000,000 Nos.) equity shares of Re.1 each 730.00 730.00200,000 Nos. (200,000 Nos.) cumulative redeemable preference 20.00 20.00shares of `100 each
750.00 750.00(b) Issued, subscribed, called and fully paid up
Equity shares of Re 1 each:572,049,980 Nos. (509,024,770 Nos.) equity shares 572.05 509.02
572.05 509.02
(c) Reconciliation of the number of equity shares and amount outstanding at the beginning and at the end of the year
` in Million
Particulars
As on March 31, 2018 As on March 31, 2017
Number of shares
Amount in ` in Million
Number of shares
Amount in ` in Million
Opening balance 509,024,770 509.02 509,024,770 509.02 Add: Issued during the year (refer note C5) 63,025,210 63.03 - - Closing balance 572,049,980 572.05 509,024,770 509.02
(d) Details of shareholders holding more than 5% of the paid up equity share capital of the Company with voting rights *
` in Million
Particulars
As on March 31, 2018 As on March 31, 2017
Number of shares
%ageNumber
of shares%age
Neeraj Consultants Limited 73,827,161 12.91% 72,138,999 14.17%Apollo Finance Limited 39,381,872 6.88% 36,759,650 7.22%Sunrays Properties and Investment Company Private Limited
36,307,648 6.35% 35,725,648 7.02%
Franklin Templeton Investment Funds 30,241,086 5.29% - -
* As per the records of the Company including its register of member.
(e) The rights, preferences and restrictions attached to equity shares of the Company The Company has only one class of issued shares referred to as equity shares having a par value of Re. 1 each. The holder of equity
shares are entitled to one vote per share.
(f) In the event of liquidation of the Company, the holders of equity shares will be entitled to receive remaining assets of the Company, after distribution of all preferential amounts. The distribution will be in proportion to the number of equity shares held by the shareholders.
(g) Over the period of five years immediately preceding March 31, 2018 and March 31, 2017, neither any bonus shares were issued nor any shares were allotted for consideration other than cash. Further, no shares were bought back during the said period.
NON-CURRENT LIABILITIES
B 15 BORROWINGS
` in Million
As onMarch 31, 2018
As on March 31, 2017
Measured at amortised costSecured *
(i) Debentures 10,737.85 6,250.00 (ii) Term loans
From banks:External commercial borrowings (ECB) 7,858.10 1,713.03 From others:International Finance Corporation - Loan A - 324.25
(iii) Finance lease - deferred payment liabilities (refer note C6)Deferred payment credit I 44.57 48.38 Deferred payment credit II 3.36 47.93 4.59 52.97 Total borrowings 18,643.88 8,340.25
* For details regarding repayment terms, interest rate and nature of security on non current borrowings (Note B15 (a))
149Apollo Tyres Ltd Annual Report 2017-18
Corporate Overview / Statutory Reports / Financial Statements

B15
(A) B
OR
RO
WIN
GS
Par
ticu
lars
Am
ount
out
stan
ding
as
on
Mar
ch 3
1, 2
018
(`
in M
illio
n)
Am
ount
out
stan
ding
as
on
Mar
ch 3
1, 2
017
(`
in M
illio
n)R
ate
of in
tere
st
per
annu
mTe
rms
of r
epay
men
tD
etai
ls o
f sec
urit
y of
fere
dN
on c
urre
nt
borr
owin
gs
Cur
rent
m
atur
itie
s of
no
n cu
rren
t bo
rrow
ings
Non
cur
rent
bo
rrow
ings
Cur
rent
m
atur
itie
s of
no
n cu
rren
t bo
rrow
ings
Non
-con
vert
ible
deb
entu
res
1,15
0 -
8.6
5 %
Non
-con
vert
ible
deb
entu
res
of
` 1
Mill
ion
each
1
,150
.00
-
1
,150
.00
-
8.
65%
Bul
let
paym
ent
on A
pril
30, 2
026
Ref
er n
ote
B1
belo
w
1,0
50 -
8.6
5 %
Non
-con
vert
ible
deb
entu
res
of
` 1
Mill
ion
each
1
,050
.00
-
1
,050
.00
-
8.
65%
Bul
let
paym
ent
on A
pril
30, 2
025
Ref
er n
ote
B1
belo
w
1,0
50 -
8.6
5 %
Non
-con
vert
ible
deb
entu
res
of
` 1
Mill
ion
each
1
,050
.00
-
1
,050
.00
-
8.
65%
Bul
let
paym
ent
on A
pril
30, 2
024
Ref
er n
ote
B1
belo
w
1,50
0 -
7.8
0 %
Non
-con
vert
ible
deb
entu
res
of
` 1
Mill
ion
each
1,4
95.9
5 -
-
-
7.
80%
Bul
let
paym
ent
on A
pril
30, 2
024
Ref
er n
ote
B1
belo
w
1,50
0 -
7.8
0 %
Non
-con
vert
ible
deb
entu
res
of
` 1
Mill
ion
each
1,4
95.9
5 -
-
-
7.
80%
Bul
let
paym
ent
on A
pril
28, 2
023
Ref
er n
ote
B1
belo
w
1,50
0 -
7.8
0 %
Non
-con
vert
ible
deb
entu
res
of
` 1
Mill
ion
each
1,4
95.9
5 -
-
-
7.
80%
Bul
let
paym
ent
on A
pril
29, 2
022
Ref
er n
ote
B1
belo
w
900
- 7
.50
% N
on-c
onve
rtib
le d
eben
ture
s of
`
1 M
illio
n ea
ch 9
00
.00
-
9
00
.00
-
7.
50%
Bul
let
paym
ent
on O
ctob
er
20, 2
023
Ref
er n
ote
B1
belo
w
1,0
50 -
7.5
0 %
Non
-con
vert
ible
deb
entu
res
of
` 1
Mill
ion
each
1,0
50.0
0
-
1,0
50.0
0
-
7.50
%B
ulle
t pa
ymen
t on
Oct
ober
21,
20
22R
efer
not
e B
1 be
low
1,0
50 -
7.5
0 %
Non
-con
vert
ible
deb
entu
res
of
` 1
Mill
ion
each
1,0
50.0
0
-
1,0
50.0
0
-
7.50
%B
ulle
t pa
ymen
t on
Oct
ober
21
, 20
21R
efer
not
e B
1 be
low
1,0
00
- 9
.40
% N
on-c
onve
rtib
le d
eben
ture
s of
`
1 M
illio
n ea
ch -
-
-
1
,00
0.0
0
9.40
%B
ulle
t pa
ymen
t on
Nov
embe
r
10, 2
017
Ref
er n
ote
A2
an
d B
1 be
low
Tota
l 1
0,7
37.8
5 -
6
,250
.00
1
,00
0.0
0
Ext
erna
l com
mer
cial
bor
row
ings
(E
CB
) fro
m b
anks
Ban
k 1
- EC
B I
-
-
-
131
.84
2-4%
abo
ve
US
D-L
IBO
RR
epay
men
t in
3 e
qual
ann
ual
inst
allm
ents
in U
SD
equ
ival
ent
to `
10
0 M
illio
n st
arte
d fr
om
Sep
tem
ber
29, 2
015
Ref
er n
ote
A1
an
d B
1 be
low
Ban
k 1
- EC
B I
I -
-
-
1
88.1
0
2-4%
abo
ve
US
D-L
IBO
RR
epay
men
t in
3 e
qual
ann
ual
inst
allm
ents
of U
SD
2.9
0 M
illio
n st
arte
d fr
om O
ctob
er 2
6, 2
015
Ref
er n
ote
A1
an
d B
1 be
low
Ban
k 2
- EC
B I
-
-
-
220
.49
2-4%
abo
ve
US
D-L
IBO
RR
epay
men
t in
3 e
qual
ann
ual
inst
allm
ents
of U
SD
3.3
3 M
illio
n st
arte
d fr
om S
epte
mbe
r 28
, 20
15
Ref
er n
ote
A1
and
B1
belo
w
Ban
k 3
- EC
B I
968
.50
-
9
63.6
1 -
0
-1%
abo
ve
US
D-L
IBO
RR
epay
men
t in
6 e
qual
sem
i-ann
ual
inst
allm
ents
sta
rtin
g fr
om F
Y
2019
-20
Ref
er n
ote
B1
belo
w
Ban
k 3
- EC
B I
I 3
76.6
2 -
3
74.7
1 -
0
-1%
abo
ve
US
D-L
IBO
RR
epay
men
t in
6 e
qual
sem
i-an
nual
inst
allm
ents
sta
rtin
g fr
om
Sep
tem
ber
30, 2
020
Ref
er n
ote
B1
belo
w
Ban
k 3
- EC
B I
II 3
76.6
2 -
3
74.7
1 -
0
-1%
abo
ve
US
D-L
IBO
RR
epay
men
t in
6 e
qual
sem
i-an
nual
inst
allm
ents
sta
rtin
g fr
om
Sep
tem
ber
30, 2
020
Ref
er n
ote
B1
belo
w
150

Par
ticu
lars
Am
ount
out
stan
ding
as
on
Mar
ch 3
1, 2
018
(`
in M
illio
n)
Am
ount
out
stan
ding
as
on
Mar
ch 3
1, 2
017
(`
in M
illio
n)R
ate
of in
tere
st
per
annu
mTe
rms
of r
epay
men
tD
etai
ls o
f sec
urit
y of
fere
dN
on c
urre
nt
borr
owin
gs
Cur
rent
m
atur
itie
s of
no
n cu
rren
t bo
rrow
ings
Non
cur
rent
bo
rrow
ings
Cur
rent
m
atur
itie
s of
no
n cu
rren
t bo
rrow
ings
Ban
k 4
- EC
B I
1,6
14.9
0
-
-
-
0-1
% a
bove
U
SD
-LIB
OR
3 Eq
ual a
nnua
l ins
tall
men
ts
star
ting
from
FY
20
22-2
3R
efer
not
e B
1 be
low
Ban
k 5
- EC
B I
1,6
14.5
2 -
-
-
0
.25-
1.25
%
abov
e U
SD
-LI
BO
R
3 Eq
ual a
nnua
l ins
tall
men
ts
star
ting
from
FY
20
22-2
3R
efer
not
e B
1 be
low
Ban
k 6
- EC
B I
1,6
15.9
7 -
-
-
0
-1%
abo
ve
US
D-L
IBO
R3
Equa
l ann
ual i
nsta
llm
ents
st
artin
g fr
om F
Y 2
022
-23
Ref
er n
ote
B1
belo
w
Ban
k 7
- EC
B I
1,2
90.9
7 -
-
-
0
.25-
1.25
%
abov
e U
SD
-LI
BO
R
3 Eq
ual a
nnua
l ins
tall
men
ts
star
ting
from
FY
20
22-2
3R
efer
not
e B
1 be
low
Tota
l 7
,858
.10
-
1
,713
.03
54
0.4
3 Te
rm lo
ans
from
oth
ers
IFC
- lo
an A
-
325
.90
3
24.2
5 3
24.2
5 2-
4% a
bove
U
SD
-LIB
OR
Rep
aym
ent
in 1
2 ha
lf-y
earl
y in
stal
lmen
ts o
f US
D 2
.50
Mill
ion
each
sta
rted
from
Jun
e 17
, 20
13
Ref
er n
ote
A1
and
B2
belo
w
Tota
l -
3
25.9
0
324
.25
324
.25
Fina
nce
leas
e -
defe
rred
pay
men
t lia
bilit
ies
Def
erre
d pa
ymen
t cr
edit
I 4
4.57
3
.82
48.
38
7.7
1 7-
8%R
epay
men
t al
ong
with
inte
rest
in
240
con
secu
tive
mon
thly
in
stal
lmen
ts s
tart
ed fr
om M
ay
15, 2
00
7
Win
d M
ills
purc
hase
d un
der
the
defe
rred
co
nsid
erat
ion
paym
ent
plan
Def
erre
d pa
ymen
t cr
edit
II 3
.36
1.6
1 4
.59
3.0
8 8-
9%R
epay
men
t al
ong
with
Int
eres
t in
20
equ
al q
uart
erly
inst
allm
ents
st
arte
d fr
om J
anua
ry 3
1, 2
011
Eng
inee
ring
m
ater
ials
pu
rcha
sed
unde
r th
e P
arts
M
anag
emen
t A
gree
men
t (P
MA
) sc
hem
eTo
tal
47.
93
5.4
3 5
2.97
1
0.7
9
Det
ails
of s
ecur
itie
s of
fere
d to
exi
stin
g le
nder
s
Not
e A
1
A p
ari p
assu
firs
t ch
arge
cre
ated
by
way
of m
ortg
age
on t
he C
ompa
ny’s
land
and
pre
mis
es a
t vi
llag
e K
odak
ara
in K
eral
a, a
t vi
llag
e Li
mda
in G
ujar
at, a
t S
IPC
OT
Ind
ustr
ial G
row
th
Cen
tre
at O
raga
dam
nea
r C
henn
ai, a
nd a
t H
ead
Offi
ce in
Gur
gaon
, Har
yana
tog
ethe
r w
ith t
he fa
ctor
y bu
ildin
gs, p
lant
, mac
hine
ry a
nd e
quip
men
ts, b
oth
pres
ent
and
futu
re.
Not
e A
2
A p
ari p
assu
firs
t ch
arge
cre
ated
by
way
of m
ortg
age
on t
he C
ompa
ny’s
land
and
pre
mis
es a
t vi
llag
e K
odak
ara
in K
eral
a an
d at
vill
age
Lim
da in
Guj
arat
tog
ethe
r w
ith t
he fa
ctor
y bu
ildin
gs, p
lant
, mac
hine
ry a
nd e
quip
men
ts, b
oth
pres
ent
and
futu
re.
Not
e B
1
A p
ari p
assu
firs
t ch
arge
by
way
of h
ypot
heca
tion
over
the
mov
able
pla
nt a
nd e
quip
men
t of
the
Com
pany
, bot
h pr
esen
t an
d fu
ture
(exc
ept
stoc
ks a
nd b
ook
debt
s).
Not
e B
2
A p
ari p
assu
firs
t ch
arge
on
the
mov
able
pla
nt a
nd e
quip
men
t an
d pa
ri p
assu
sec
ond
char
ge o
n th
e cu
rren
t as
sets
of t
he C
ompa
ny.
151Apollo Tyres Ltd Annual Report 2017-18
Corporate Overview / Statutory Reports / Financial Statements

NON - CURRENT LIABILITIES
B 16 OTHER FINANCIAL LIABILITIES
` in Million
ParticularsAs on
March 31, 2018 As on
March 31, 2017
Derivative liabilities measured at fair value (refer note C13) 131.60 142.64
B17 PROVISIONS
` in Million
ParticularsAs on
March 31, 2018 As on
March 31, 2017
Provision for constructive liability (refer note C8) 146.70 57.25 Provision for sales related obligations (refer note C8) 304.03 334.46
450.73 391.71
B18 OTHER NON CURRENT LIABILITIES
` in Million
ParticularsAs on
March 31, 2018 As on
March 31, 2017
Security deposits received from dealers 42.03 36.70 Security deposits received from employees 82.64 46.33 Deferred revenue arising from government grant (refer note C10) 3,308.72 2,801.32
3,433.39 2,884.35
CURRENT LIABILITIES
B19 BORROWINGS
` in Million
ParticularsAs on
March 31, 2018 As on
March 31, 2017
At amortised costSecured *From banks - cash credit 143.39 71.58 - Packing credit - 239.05 - Working capital demand loan 1,000.00 - UnsecuredFrom banks - packing credit 3,030.85 3,029.41 - Working capital demand loan 2,300.00 - From others - Commercial paper - 4,500.00
6,474.24 7,840.04
* Cash credits, packing credit and working capital demand loans are repayable on demand and are secured by a first charge on raw materials, work-in-progress, stocks, stores and book debts and by a second charge on the Company’s land at village Kodakara in Kerala, at Oragadam and Mathur village in Tamil Nadu and at head office in Gurgaon, Haryana together with the factory buildings, plant and machinery and equipment, both present and future.
B20 TRADE PAYABLES
` in Million
ParticularsAs on
March 31, 2018 As on
March 31, 2017
Payable to Micro, Small and Medium Enterprises (refer note C21) 133.27 38.44 Acceptances 600.02 - Accounts payable - raw materials and services 6,685.63 5,431.48 Freight and custom house agent charges payable 880.71 719.24 Expenses payable 645.73 346.90 Employee related payables ** 1,212.33 1,042.83 Payable to related parties (refer note C23) 4,968.03 2,828.65
15,125.72 10,407.54
** Employee related payables includes commission on net profits payable to whole-time directors ` 605 Million (` 560 Million).
152

B21 OTHER FINANCIAL LIABILITIES
` in Million
ParticularsAs on
March 31, 2018 As on
March 31, 2017
Current maturities of non current borrowings ***Secured
(a) Debentures - 1,000.00 (b) Term loan from banks:
External commercial borrowings (ECB) - 540.43 (c) Term loan from others:
International Finance Corporation - Loan A 325.90 324.25 (d) Finance lease - deferred payment liabilities (refer note C6)
Deferred payment credit I 3.82 7.71 Deferred payment credit II 1.61 3.08
5.43 10.79 Interest accrued but not due on borrowings 665.94 379.01 Unclaimed dividends # 60.71 52.92 Interest payable to Micro, Small and Medium Enterprises (refer note C21) 10.58 10.58 Accounts payable - capital vendors 1,024.52 1,680.22 Payable to Micro, Small and Medium Enterprises - capital vendors (refer note C21) 17.71 10.12 Payable to related parties (refer note C23) 76.64 35.71 Security deposits - vendors 288.00 289.33 Advances received from customers 542.20 401.60 Derivative liabilities measured at fair value (refer note C13) 175.58 226.53
3,193.21 4,961.49
*** For nature of security on current maturity of non current borrowings (refer note B15 (a)) # Includes ` 3.18 Million (` 4.99 Million) which has not been transferred to the Investor Education and Protection Fund under Section 124 of the Companies Act, 2013, as per the orders/ instructions of the Special Court (Trial of Offences Relating to Transactions in Securities) Act, 1992.
CURRENT LIABILITIES
B22 OTHER CURRENT LIABILITIES
` in Million
ParticularsAs on
March 31, 2018 As on
March 31, 2017
Excise duty on closing stock - 355.73 Statutory dues payable 2,141.50 893.10 Gratuity payable (refer note C11) 158.79 3.04 Others 41.67 42.09
2,341.96 1,293.96
B23 PROVISIONS
` in Million
ParticularsAs on
March 31, 2018 As on
March 31, 2017
Provision for constructive liability (refer note C8) 38.55 32.34 Provision for compensated absences (refer note C8 and C11) 197.32 218.46 Provision for superannuation 22.50 - Provision for contingencies (refer note C8) 790.00 790.00 Provision for sales related obligations (refer note C8) 1,602.79 2,189.14
2,651.16 3,229.94
B24 CURRENT TAX LIABILITIES (NET)
` in Million
ParticularsAs on
March 31, 2018 As on
March 31, 2017
Provision for taxation 18,507.88 16,623.22 Advance tax (17,577.46) (15,594.24)
930.42 1,028.98
153Apollo Tyres Ltd Annual Report 2017-18
Corporate Overview / Statutory Reports / Financial Statements

B25 OTHER OPERATING INCOME
` in Million
Particulars Year ended
March 31, 2018 Year ended
March 31, 2017
Investment promotion subsidy from Government of Tamil Nadu (refer note C10) 393.32 464.50 Unwinding of deferred income (refer note C10) 788.13 329.87 Sale of raw material scrap 388.73 293.36 Early payment discount received from raw material suppliers 94.43 82.94
1,664.61 1,170.67
B26 OTHER INCOME
` in Million
Particulars Year ended
March 31, 2018 Year ended
March 31, 2017
(a) Interest earned on deposits- Bank 40.64 49.08 - Inter corporate deposit 263.61 274.02 - Others 136.62 440.87 61.63 384.73
(b) Dividend income from non current investments - FVTPLUnit Trust of India 0.06 1.81
(c) Dividend income from current investments - FVTPLMutual funds 45.76 82.78
(d) Others Unclaimed credit balances / provisions no longerrequired written back 23.31 63.90 Profit on sale of property, plant and equipment (net) 1.85 - Gain on foreign cureency transactions and translations (net) 485.28 655.32 Gain on fair value change in investments 140.68 - Miscellaneous 80.68 731.80 164.80 884.02
1,218.49 1,353.34
B27 MANUFACTURING AND OTHER EXPENSES
` in Million
Particulars Year ended
March 31, 2018 Year ended
March 31, 2017
Cost of materials consumed (refer note C14(B))Opening stock 6,387.54 2,780.84 Add: Purchases 63,767.78 56,738.99 Less: Closing stock 7,343.82 6,387.54
62,811.50 53,132.29 Purchase of stock-in-trade:Purchase of finished goods - tyres, tubes and flaps 2,517.58 2,209.55 Employee benefits expense: *Salaries and wages 5,817.75 5,010.53 Contribution to provident and other funds (refer note C11) 399.58 359.15 Staff welfare expenses 879.45 838.13
7,096.78 6,207.81 Other expenses: *Consumption of stores and spare parts 798.65 763.84 Power and fuel 3,234.62 2,861.64 Conversion charges 1,445.10 1,292.27 Repairs and maintenance - Machinery 144.88 141.00 - Buildings 33.42 28.76 - Others 1,237.09 1,016.48 Rent (refer note C7) 459.35 427.78 Lease rent - factory (refer note C7) 600.13 504.37 Insurance 97.60 66.19 Rates and taxes 93.47 179.78 Directors’ sitting fees 12.70 7.50 Commission to non-executive directors (refer note C23) 60.00 60.00
154

` in Million
Particulars Year ended
March 31, 2018 Year ended
March 31, 2017
Loss on sale of property, plant and equipment (net) - 33.96 Travelling, conveyance and vehicle expenses 1,078.30 1,056.58 Postage, telephone and stationery 111.98 121.31 Conference 81.14 136.10 Royalty paid 13.63 12.80 Freight and forwarding 3,507.99 2,997.81 Commission on sales 73.86 114.59 Sales promotion 656.53 1,359.38 Advertisement and publicity 1,421.86 1,085.93 Corporate social responsibility (refer note C22) 215.68 185.00 Bank charges 20.60 34.35 Statutory auditors’ remuneration (refer note C16) 14.50 12.20 Legal and professional 693.34 729.96 Provision for contingencies (refer note C8) - 365.00 Miscellaneous 1,865.38 2,102.17
17,971.80 17,696.75 90,397.66 79,246.40
* Includes expense towards research and development (refer note C17)
B28 CHANGES IN INVENTORIES OF FINISHED GOODS, STOCK-IN-TRADE AND WORK-IN-PROGRESS
` in Million
Particulars Year ended
March 31, 2018 Year ended
March 31, 2017
Opening StockWork in progress 986.06 695.72 Finished goods 8,732.91 5,693.36 Stock-in-trade 275.36 176.98
9,994.33 6,566.06 Less:CLOSING STOCKWork in progress 1,069.24 986.06 Finished goods 7,628.25 8,732.91 Stock-in-trade 204.32 275.36
8,901.81 9,994.33 Decrease / (increase) 1,092.52 (3,428.27)Excise duty on increase / (decrease) of finished goods (967.06) 246.73
125.46 (3,181.54)
B29 FINANCE COSTS
` in Million
Particulars Year ended
March 31, 2018 Year ended
March 31, 2017
(a) Interest expense:Interest on fixed-term loans 215.55 151.84 Interest on debentures 538.62 182.42 Interest on current loans 201.19 130.17 Others 408.35 398.89
(b) Other borrowing costs 11.70 24.52 1,375.41 887.84
B27 MANUFACTURING AND OTHER EXPENSES (CONTD.)
155Apollo Tyres Ltd Annual Report 2017-18
Corporate Overview / Statutory Reports / Financial Statements

Forming Part of the Financial Statements (Contd.)C. Other Notes1 DIRECTLY ATTRIBUTABLE EXPENSES CAPITALIZED / INCLUDED IN CAPITAL WORK IN PROGRESS
` in Million
Particulars 2017-18 2016-17
Raw material consumed 238.98 35.29 Salaries, wages and bonus 30.67 32.03 Welfare expenses 24.42 20.80 Rent 1.92 2.25 Travelling, conveyance and vehicle 9.11 9.87 Postage, telephone and stationery 0.20 0.33 Power and fuel 211.09 77.62 Insurance 3.51 3.37 Legal and professional 3.16 132.44 Miscellaneous 4.47 2.59 Total* 527.53 316.59
*Out of the above Nil (` 147.37 Million) is included in capital work in progress.
2 Borrowing costs capitalized / transferred to capital work in progress during the year is ` 562.53 Million (` 297.97 Million) and the capitalisation rate used to determine the amount of borrowing costs to be capitalised is the weighted average interest rate applicable to the Company’s general borrowings during the year, in this case 6.75% (Nil).
3 INVENTORIES i. Out of the total inventories ` 17,214.91 Million (`
17,293.98 Million), the carrying amount of inventories carried at fair value less costs to sell ` 367.35 Million (`902.85 Million).
ii. The amount of write-down of inventories to net realizable value recognized as an expense was ` 65.68 Million (` 95.65 Million).
iii. The cost of inventories recognised as an expense during the year in respect of continuing operations was ` 66,253.19 Million (` 52,924.14 Million).
4 DESCRIPTION OF NATURE AND PURPOSE OF EACH RESERVE
i. Securities premium reserve Securities premium reserve is used to record the
premium on issue of shares. The reserve will be utilised in accordance with provisions of the Act.
ii. General reserve General reserve is created from time to time by way of
transfer of profits from retained earnings for appropriation purpose. General reserve is created by transfer from one component of equity to another and is not an item of other comprehensive income.
iii. Capital reserve on Apollo (Mauritius) Holdings Private Limited (“AMHPL”) merger
AMHPL erstwhile (subsidiary company) was merged with the Company resulting in a capital reserve.
iv. Debenture redemption reserve The Company is required to create a debenture
redemption reserve out of the profits which are available for redemption of debentures.
v. Capital subsidy This balance represents subsidy received under New
Industrial Policy 2007 of the Government of Tamil Nadu for expansion and employment generation within SIPCOT Industrial park.
vi. Capital redemption reserve The same has been created in accordance with provision of
the Act for the buy back of equity shares from the market.
vii. Capital reserve on forefeiture of shares This reserve was created on forfeiture of shares by the
Company. The reserve is not available for the distribution to the shareholders.
viii. Retained earnings Retained earnings are created from the profit of the
Company, as adjusted for distribution to owners, transfer to other reserve, etc.
5 The Company issued and allotted 63,025,210 equity shares of Re. 1 each (amounting to ` 63.03 Million) to Qualified Institutional Buyers on October 10, 2017 at an issue price of ` 238 per equity share including a premium of ` 237 per equity share (amounting to ` 14,781.01 Million net of share issue expenses), aggregating to ` 14,844.04 Million net of share issue expenses. Pursuant to the allotment of equity shares in the Qualified Institutional Placement, the paid up equity share capital of the Company stands increased to ` 572.05 Million.
156

6 FINANCE LEASE - DEFERRED PAYMENT LIABILITIES
The Company has executed certain finance lease arrangements for certain assets. The schedule of future minimum lease payments in respect of non-cancellable finance leases is set out below :
` in Million
Particulars
Total minimum lease payments Present value of lease payments
As on March 31, 2018
As on March 31, 2017
As on March 31, 2018
As on March 31, 2017
Within one year of the balance sheet date 9.62 12.45 5.43 10.79 Due in a period between one year and five years 33.56 38.07 21.97 27.02 Due after five years 30.35 30.35 25.96 25.95 Total 73.53 80.87 53.36 63.76 Future finance charges (20.17) (17.11)Present value of minimum lease payments 53.36 63.76
Break up of finance lease liability recognised in balance sheet between current and non current is as below :
` in Million
ParticularsAs on
March 31, 2018 As on
March 31, 2017
Non current (refer note B15) 47.93 52.97 Current (refer note B21) 5.43 10.79 Total 53.36 63.76
7 OPERATING LEASES
The Company has acquired assets under the operating lease agreements that are renewable on a periodic basis at the option of both the lessor and lessee. Rental expenses under those leases debited to statement of profit and loss was ` 1,059.48 Million (` 932.15 Million) net of rental income amounting to ` 18.15 Million (` 7.25 Million).
The schedule of future minimum lease payments in respect of non-cancellable operating leases is set out below` in Million
ParticularsAs on
March 31, 2018 As on
March 31, 2017
Within one year of the balance sheet date 663.02 536.44 Due in a period between one year and five years 2,400.00 2,028.38 Due after five years 4,200.00 -
8 PROVISIONS - NON CURRENT / CURRENT` in Million
Particulars
Non current Current
Provision for sales related
obligation *
Provision for constructive
liability
Provision for compensated
absences
Provision for sales related
obligation *
Provision for constructive
liability
Provision for contingencies
As on March 31, 2016 334.46 69.55 241.10 2,061.58 31.00 425.00 Addition during the year - 2,860.70 1.34 365.00 Utilisation/ reversal during the year - (12.30) (22.64) (2,398.68) - - As on March 31, 2017 334.46 57.25 218.46 2,189.14 32.34 790.00 Addition during the year - 89.45 - 2,425.69 6.21 - Utilisation/ reversal during the year (30.43) - (21.14) (3,012.04) - - As on March 31, 2018 304.03 146.70 197.32 1,602.79 38.55 790.00
* Represents estimates for payments to be made in future for sales related obligations (including warranties).
9 INCOME TAXES i. Reconciliation between average effective tax rate and applicable tax rate
Particulars2017-18 2016-17
` in Million Rate (%) ` in Million Rate (%)
Profit before tax 8,673.11 10,856.34 Income tax using the Company’s domestic tax rate 3,001.76 34.61% 3,757.38 34.61%Tax effect of : Non deductible expenses 88.25 1.02% 49.52 0.46%Tax exempt income (288.68) -3.33% (29.28) -0.27%Tax incentives and concessions (288.06) -3.32% (994.52) -9.16%Others (64.04) -0.74% 45.66 0.42%Income tax expenses recognised in the statement of Profit and Loss
2,449.23 28.24% 2,828.76 26.06%
157Apollo Tyres Ltd Annual Report 2017-18
Corporate Overview / Statutory Reports / Financial Statements

ii. Components of Deferred Tax Liability (Net)
` in Million
Particulars
Year ended March 31, 2018 Year ended March 31, 2017
Opening Balance
Recognised in statement of Profit and
Loss
Recognised in other
comprehensive income
Recognised directly in
equity
Closing Balance
Opening Balance
Recognised in
statement of Profit and
Loss
Recognised in other
comprehensive income
Closing Balance
Tax effect of items constituting deferred tax liabilitiesEmployee benefits 15.32 1.54 - - 16.86 3.69 6.95 4.68 15.32 Depreciation and amortisation 5,677.12 1,397.50 - - 7,074.62 4,825.17 851.95 - 5,677.12 Others 70.77 122.87 70.75 - 264.39 57.32 13.45 - 70.77 Gross deferred tax liabilities (a) 5,763.21 1,521.91 70.75 - 7,355.87 4,886.18 872.35 4.68 5,763.21 Tax effect of items constituting deferred tax assetsEmployee benefits 125.22 25.79 36.75 - 187.76 123.42 1.80 - 125.22 Provision for doubtful debts / advances 141.89 - - - 141.89 15.56 126.33 - 141.89 Minimum alternate tax entitlement 225.74 922.21 - - 1,147.95 225.74 - 225.74 Others 343.02 9.34 - 82.55 434.91 301.95 - 41.07 343.02 Gross deferred tax assets (b) 835.87 957.34 36.75 82.55 1,912.51 440.93 353.87 41.07 835.87 Net deferred tax liability (a - b) 4,927.34 564.57 34.00 (82.55) 5,443.36 4,445.25 518.48 (36.39) 4,927.34
10 GOVERNMENT GRANTS
(a) Investment promotion subsidy from Government of Tamil Nadu
Pursuant to the Memorandum of Understanding (MoU) executed between the Government of Tamil Nadu (GoTN) and the Company, the Company is entitled, interalia, for refund of an amount equal to Net Output (VAT + CST) / GST paid by the Company to GoTN in the form of Investment Promotion Subsidy.
As the Company has fulfilled the relevant obligations, the Company has recognized subsidy income of ` 393.32 Million (` 464.50 Million) as other operating income, being the eligible amount of refund of Net Output (VAT + CST) / GST paid by the Company to GoTN.
(b) Export Promotion Capital Goods The Company had imported Property, plant and equipment
under the Export Promotion Capital Goods (EPCG) scheme wherein the Company is allowed to import capital goods including spares without payment of customs duty, subject to certain export obligations which should be fulfilled within specified time period. During the year, the custom duty benefit received amounts to ` 1,295.52 Million with a corresponding increase in the value of property, plant and equipment and Capital Work in Progress. The grant amounting to ` 788.13 Million (` 329.87 Million) where export obligations have been met, have been recognized in Statement of Profit and Loss as other operating income. At the year end, the portion of grant for which the export obligation has not been met is retained in deferred revenue under other non current liabilities.
11 EMPLOYEE BENEFIT LIABILITY
A. Defined contribution plans a. Superannuation plan: The Company contributes a sum
equivalent to 15% of the eligible employees’ basic salary
to a superannuation fund administered and maintained by the Life Insurance Corporation of India (LIC). The Company has no liability for future superannuation fund benefits other than its annual contribution and recognizes such contributions as an expense in the year incurred. The amount of contribution paid by the Company to Superannuation Fund is ` 81.38 Million (` 69.05 Million).
b. Provident fund: Contributions are made to the Company’s employees’ provident fund trust / regional provident fund in accordance with the fund rules. The interest rate payable to the beneficiaries every year is being notified by the Government.
In the case of contribution to the trust, the Company has an obligation to make good the shortfall, if any, between the return from the investments of the trust and the notified interest rate and recognises such obligation as an expense.
The amount of contribution made by the Company to employees’ provident fund trust / regional provident fund is ` 238.22 Million (`222.61 Million)
B. Defined benefit plans Gratuity The Company operates a defined benefit gratuity plan. Every
employee who has completed five years or more of service receives gratuity on leaving the Company as per the Payments of Gratuity Act, 1972. The scheme is funded with LIC.
The following table summarizes the components of net benefit expense recognized in the Statement of Profit and Loss and the funded status and amounts recognized in the balance sheet for the respective plan:
158

Statement of profit and loss:
` in Million
Particulars 2017-18 2016-17
Current service cost ^ 79.98 67.49 Interest cost on benefit obligation * 71.93 71.66 Actual return on plan assets* (68.61) (69.87)Expense recognized in the statement of profit and loss 83.30 69.28
^ Included in employee benefit expense * Included in finance cost
Other comprehensive income (experience adjustment)
` in Million
Particulars 2017-18 2016-17
Actuarial loss/(gain) for the year on present benefit obligation 102.90 (9.02)Actuarial loss/(gain) for the year on plan asset 3.28 (4.51)Total 106.18 (13.53)
Balance sheet: Net asset / (liability) recognised in the balance sheet
` in Million
Particulars As onMarch 31, 2018
As on March 31, 2017
Fair value of plan assets at the end of the year (a) 969.30 950.96 Present value of defined benefit obligation at the end of the year (b) 1,128.09 954.00 Liability recognized in the balance sheet (a - b) (158.79) (3.04)
Changes in the present value of the defined benefit obligation` in Million
Particulars 2017-18 2016-17
Present value of obligations as on the beginning of the year 954.00 895.71 Interest cost 71.93 71.66 Current service cost 79.98 67.49 Benefits paid (80.72) (71.84)Actuarial loss/(gain) on obligation 102.90 (9.02)Present value of obligations as on the end of the year 1,128.09 954.00
Changes in the fair value of plan assets` in Million
Particulars 2017-18 2016-17
Fair value of plan assets as on the beginning of the year 950.96 817.10 Actual return on plan assets 68.61 69.87 Contributions 33.73 131.32 Benefits paid (80.72) (71.84)Actuarial (loss)/gain on plan assets (3.28) 4.51 Fair value of plan assets as on the end of the year 969.30 950.96
The Company’s gratuity funds are managed by the LIC and therefore the composition of the fund assets in not presently ascertained.
Principal assumptions for gratuity` in Million
ParticularsAs on
March 31, 2018 Rate (%)
As on March 31, 2017
Rate (%)
a) Discount rate 7.70 7.54b) Future salary increase* 6.00 6.00c) Expected rate of return on plan assets 8.00 8.40d) Retirement age (years) 58.00 58.00e) Mortality table IALM (2006-2008) IALM (2006-2008)f) Ages (withdrawal rate %) Up to 30 Years 3.00 3.00 From 31 to 44 Years 2.00 2.00 Above 44 Years 1.00 1.00
* The estimates of future salary increase take into account inflation, seniority, promotion and other relevant factors. Estimated amount of contribution in the immediate next year is ` 94.70 Million (` 90.93 Million)
159Apollo Tyres Ltd Annual Report 2017-18
Corporate Overview / Statutory Reports / Financial Statements

Sensitivity analysis of the defined benefit obligation
` in Million
Impact of change in Discount rate Salary increase Attrition rate
Present value of obligation as on March 31, 2018 1,128.09 1,128.09 1,128.09 Impact due to increase of 0.50% (45.43) 49.82 11.15 Impact due to decrease of 0.50% 49.25 (46.34) (12.25)
` in Million
Impact of change in Discount rate Salary increase Attrition rate
Present value of obligation as on March 31, 2017 954.00 954.00 954.00 Impact due to increase of 0.50% (38.53) 42.17 9.84 Impact due to decrease of 0.50% 41.74 (39.24) (11.27)
C. Other long term employee benefits Long term compensated absences Principal assumptions for long term compensated absences
` in Million
ParticularsAs on
March 31, 2018 Rate (%)
As on March 31, 2017
Rate (%)
a) Discount rate 7.70 7.54b) Future salary increase* 6.00 6.00c) Retirement age (years) 58.00 58.00d) Mortality table IALM (2006-2008) IALM (2006-2008)e) Ages (withdrawal rate %) Up to 30 Years 3.00 3.00 From 31 to 44 Years 2.00 2.00 Above 44 Years 1.00 1.00
* The estimates of future salary increase take into account inflation, seniority, promotion and other relevant factors.
12 EMPLOYEES STOCK APPRECIATION RIGHTS (EMPLOYEES PHANTOM STOCK PLAN 2010)
a) During the year 2010-11, the Company had announced Cash-settled Employee Share-based Payment Plan (Phantom Stock Plan) for the eligible employees of the Company. Under the scheme, 1,200,000 phantom stock unit (“Units”) have been granted on April 1, 2010, 900,000 Units have been granted on April 1, 2011 and another 75,000 Units have been granted on April 1, 2012 by the board appointed committee. Vesting schedule for aforesaid three options are as follows:
Percentage of Grant Vesting Schedule
25% On 1st anniversary of respective grant date25% On 2nd anniversary of respective grant date25% On 3rd anniversary of respective grant date25% On 4th anniversary of respective grant date
Pursuant to the above scheme, the eligible employees are entitled to get cash compensation upon exercise of the Units within seven years of the vesting date.
b) As on March 31, 2017, all Units were vested and exercised. On April 1, 2016, 272,500 Units were exercised/vested. Accordingly, no share based payment expense was recognized during the current or previous year.
13 FINANCIAL INSTRUMENT
A. Capital risk management The capital structure of the Company consists of debt, cash and cash equivalents and equity attributable to equity shareholders of the
Company which comprises issued share capital (including premium) and accumulated reserves disclosed in the Statement of Changes in Equity.
The Company’s capital management objective is to achieve an optimal weighted average cost of capital while continuing to safeguard the Company’s ability to meet its liquidity requirements (including its commitments in respect of capital expenditure) and repay loans as they fall due.
The Company manages its capital structure and makes adjustments in light of changes in economic conditions and the requirements of the financial covenants. To maintain or adjust the capital structure, the Company may adjust the dividend payment to shareholders,
160

return capital to shareholders or issue new shares. The Company monitors capital using a gearing ratio, which is debt divided by total equity. The Company’s policy is to keep an optimum gearing ratio. The Company includes within debt, interest bearing loans and borrowings.
` in Million
ParticularsAs on
March 31, 2018 As on
March 31, 2017
Borrowings (refer note B15 and B19) 25,118.12 16,180.29Current maturities of non current borrowings (refer note B21) 331.33 1,875.47Debt (a) 25,449.45 18,055.76Equity (refer note B14) 572.05 509.02Other equity 72,034.06 52,802.87Total equity (b) 72,606.11 53,311.89Debt to equity ((a) / (b)) 0.35 0.34
B. Financial risk management a. Market risk The Company’s activities expose it primarily to the financial risk of changes in foreign currency exchange rates and changes in interest
rates. The Company enters into a variety of derivate financial instrument to manage its exposure to foreign currency and interest rates. There have been no changes to the Company’s exposure to market risk or the manner in which it manages and measures the risk in recent past.
i) Currency risk The Company’s exposure arises mainly on import (of raw material and capital items) and export (of finished goods). The Company
follows a policy of matching of import and export exposures (natural hedge) to reduce the net exposure in any foreign currency. Whenever the natural hedge is not available or is not fully covering the foreign currency exposure of the Company, management uses certain derivative instruments to manage its exposure to the foreign currency risk. Foreign currency transactions are managed within approved policy parameters.
Currency wise net exposure of the Company
` in Million
CurrencyAs on
March 31, 2018Sensitivity + 1% Sensitivity -1%
As on March 31, 2017
Sensitivity + 1% Sensitivity -1%
USD (14,613.99) (146.14) 146.14 (9,235.21) (92.35) 92.35 Euro 5,795.69 57.96 (57.96) 442.78 4.43 (4.43)GBP (308.99) (3.09) 3.09 (110.84) (1.11) 1.11 Others 149.46 1.49 (1.49) 99.56 1.00 (1.00)
ii) Interest rate risk The Company is exposed to interest rate risk as the Company borrows funds at both fixed and floating interest rates. The risk is
managed by the Company by maintaining an appropriate mix between fixed and floating rate borrowings. The use of interest rate swaps are also entered into, especially to hedge the floating rate borrowings or to convert the foreign currency floating interest rates to the domestic currency floating interest rates.
b) Credit risk Credit risk is the risk that counterparty will default on its contractual obligations resulting in financial loss to the Company. The
Company has adopted a policy of only dealing with creditworthy customers.
In many cases an appropriate advance or letter of credit / bank guarentee is taken from the customers to cover the risk. In other cases credit limit is granted to customer after assessing the credit worthiness based on the information supplied by credit rating agencies, publicly available financial information or its own past trading records and trends.
On March 31, 2018, the Company did not consider there to be any significant concentration of credit risk which had not been adequately provided for. The carrying amount of the financial assets recorded in the financial statements, grossed up for any allowances for losses, represents the maximum exposure to credit risk.
c) Liquidity risk The Company manages liquidity risk by maintaining adequate reserves and banking facilities, by continuously monitoring
forecast and actual cash flows and by matching the maturity profiles of financial assets and liabilities for the Company. The Company has established an appropriate liquidity risk management framework for it’s short term, medium term and long term funding requirement.
The below tables summarise the maturity profile of the Company’s financial assets and financial liabilities
161Apollo Tyres Ltd Annual Report 2017-18
Corporate Overview / Statutory Reports / Financial Statements

i. Non derivative financial assets
` in Million
Particulars
As on March 31, 2018 As on March 31, 2017
Less than 1 year 1 to 5 years5 years and
aboveLess than 1 year 1 to 5 years
5 years and above
Non-interest bearing 10,770.81 1,005.16 16,393.76 8,523.81 841.17 10,048.62 Fixed interest rate instruments 16,770.75 - - 2,469.50 - -
ii. Non derivative financial liabilities
` in Million
Particulars
As on March 31, 2018 As on March 31, 2017
Less than 1 year 1 to 5 years5 years and
aboveLess than 1 year 1 to 5 years
5 years and above
Non-interest bearing 17,146.08 - - 12,888.02 - - Finance lease - deferred payment liabilities 5.43 21.97 25.96 10.80 27.02 25.95 Variable interest rate instruments 4,022.69 3,767.20 4,090.90 4,512.15 895.26 1,142.02 Fixed interest rate instruments 3,443.39 4,495.95 6,241.90 5,571.58 1,050.00 5,200.00
iii. Derivative assets / (liabilities)
` in Million
Particulars
As on March 31, 2018 As on March 31, 2017
Less than 1 year 1 to 5 years5 years and
aboveLess than 1 year 1 to 5 years
5 years and above
Net settled:Foreign currency forward contracts, futures and options (175.58) - - (139.43) - - Foreign currency forward contracts, futures and options 6.19 - - - - - Gross settled:Cross currency interest rate swaps - - - (87.10) - - Cross currency interest rate swaps 95.87 (131.60) 254.24 307.50 95.06 (142.64)Total (73.52) (131.60) 254.24 80.97 95.06 (142.64)
d) The below tables summarise the fair value of the financial assets / liabilities i. Fair value of derivative instruments carried at fair value
` in Million
ParticularsAs on
March 31, 2018As on
March 31, 2017Fair value hierarchy
(Level 1, 2 or 3) *
Derivative financial assets (a) - Cross currency interest rate swaps 350.11 402.56 2 - Foreign currency forward contracts, futures and options 6.19 - 2Total 356.30 402.56 Derivative financial liabilities (b) - Foreign currency forward contracts, futures and options 175.58 139.43 2 - Cross currency interest rate swaps 131.60 229.74 2Total 307.18 369.17 Net derivate financial assets (a - b) 49.12 33.39
ii. Fair value of financial assets (other than derivative instruments) carried at fair value
` in Million
ParticularsAs on
March 31, 2018As on
March 31, 2017Fair value hierarchy
(Level 1, 2 or 3) *
Financial assets– Current investments- mutual funds 3,640.47 3,444.44 1– Non current investments - quoted 2.76 8.23 1– Non current investments - unquoted 9.25 9.26 3Total 3,652.48 3,461.93
162

iii. Fair value of financial assets / liabilities (other than investment in subsidiaries) that are not measured at fair value The management considers that the carrying amount of financial assets and financial liabilities recognised at amortised cost in the
balance sheet approximates their fair value.
* Level 1 - Quoted price in an active market.
* Level 2 - Discounted cash flow. Future cash flows are estimated based on forward exchange rates and contract rates, discounted at a rate that reflects the credit risk of various counterparties.
* Level 3 - Discounted cash flow method is used to capture the present value of the expected future economic benefits that will flow to the company.
e) Details of outstanding contracts #
Currency pair CurrencyCurrency value
(Million)Average exchange
rateNominal value
(Million)Buy/Sell
As on March 31, 2018Foreign currency forward contractsUSD / INR US dollar 48.50 65.18 3,161.23 BuyEUR / INR Euro 31.25 80.25 2,507.94 SellUSD / ZAR US dollar 2.25 11.84 26.64 SellFutures and optionsUSD / INR US dollar 34.00 65.18 2,216.12 BuyCross currency interest rate swapsUSD / INR US dollar 126.42 65.18 8,240.06 BuyAs on March 31, 2017Foreign currency forward contractsUSD / INR US dollar 56.50 67.34 3,804.90 BuyEUR / INR Euro 25.00 73.61 1,840.19 SellUSD / ZAR US dollar 2.38 14.03 33.40 SellFutures and optionsUSD / INR US dollar 20.80 67.34 1,400.74 BuyCross currency interest rate swapsUSD / INR US dollar 44.75 67.34 3,013.62 Buy
# For fair value of outstanding contracts, refer note C13 (d)(i).
14 (A) Turnover and stock of finished goods and stock in trade
` in Million
ParticularsOpening Stock Turnover Closing Stock
2017-18 2016-17 2017-18 2016-17 2017-18 2016-17
Automobile tyres, tubes and flaps 8,851.66 5,715.18 1,03,153.21 97,312.80 7,647.29 8,851.66 Others 156.61 155.16 728.05 753.42 185.28 156.61 Total 9,008.27 5,870.34 1,03,881.26 98,066.22 7,832.57 9,008.27
(B) Raw materials consumed
` in Million
Particulars 2017-18 2016-17
Fabric 7,064.86 6,967.47 Rubber 33,284.22 27,995.96 Chemicals 6,911.36 5,470.03 Carbon black 7,858.46 5,914.70 Others 7,692.60 6,784.13 Total 62,811.50 53,132.29
(C) Break-up of consumption
Particulars 2017-18 2016-17
% ` in Million % ` in MillionRaw material - Imported 41.30% 25,941.82 40.60% 21,571.98 - Indigenous 58.70% 36,869.68 59.40% 31,560.31
100.00% 62,811.50 100.00% 53,132.29 Stores and spares - Imported 7.72% 61.66 7.21% 55.09 - Indigenous 92.28% 736.99 92.79% 708.75
100.00% 798.65 100.00% 763.84
163Apollo Tyres Ltd Annual Report 2017-18
Corporate Overview / Statutory Reports / Financial Statements

(D) C.I.F. value of imports
` in Million
Particulars 2017-18 2016-17
Raw material 28,657.42 23,245.86 Stores and spares 64.02 56.39 Capital goods 5,258.39 10,518.38
(E) Expenditure in foreign currency (remitted) (Excluding value of imports)
` in Million
Particulars 2017-18 2016-17
Interest 479.84 216.11 Dividend for the year 2016-17 (2015-16)* 5.93 3.96 Royalty 13.63 12.55 Others (including cross-charge of research and development expenses and management expenses paid to foreign subsidiary companies) 2,535.66 2,946.30
* Number of non-resident shareholders – 1 (2), Number of shares held by non resident shareholders - 1,977,000 (1,978,000).
15 EARNINGS IN FOREIGN EXCHANGE (GROSS)
` in Million
Particulars 2017-18 2016-17
FOB value of exports 8,954.90 8,069.64 Interest received 114.87 12.41 Royalty received 56.79 61.22 Cross charge of management expenses 69.03 54.20 Reimbursement of expenses received 537.12 141.41
16 STATUTORY AUDITORS’ REMUNERATION
` in Million
Particulars 2017-18 2016-17
For audits and quarterly reviews 8.50 8.74 For taxation matters 0.57 - For company law matters - 0.40 For other services * # 9.06 3.06 Total 18.13 12.20
* Includes ` 3.63 Million expense paid in relation to qualified institutional placement process (debited to securities premium), during the current year. # Includes payment to erstwhile auditor amounting to ` 4.77 Million, during the current year.
17 RESEARCH AND DEVELOPMENT EXPENDITURE
` in Million
Particulars 2017-18 2016-17
(A) Revenue expenditureMaterials 34.29 - Employee benefits expense 271.15 300.52 Travelling, conveyance and vehicle 87.38 45.42 Others 859.63 1,274.24 Total 1,252.45 1,620.18 (B) Capital expenditure 307.31 129.25 Total (A+B) 1,559.76 1,749.43
164

18 CONTINGENT LIABILITIES
` in Million
Particulars As on March 31, 2018
As on March 31, 2017
Sales tax 220.27 39.64 Income tax # 42.20 265.80 Claims against the Company not acknowledged as debts – Employee related 74.02 58.18 – Others 29.60 61.69 Excise duty and service tax * 167.05 137.50
# Excludes amount of ` 441.66 Million (` 441.66 Million) in appeals which have been decided by Appellate authorities in the Company’s favour but on which the department has gone for further appeal and a demand of ` 671.71 Million (` 663.70 Million)relating to the adjustments made in MAT computation, which in the opinion of the Company, is not sustainable and the probability of cash outflow is considered remote. * Show-cause notices received from various Government Agencies pending formal demand notices have not been considered as contingent liabilities.
In the opinion of the management, no provision is considered necessary for the disputes mentioned above on the ground that there are fair chances of successful outcome of appeals.
19 CAPITAL COMMITMENTS
` in Million
Particulars As on March 31, 2018
As on March 31, 2017
Estimated amount of contracts remaining to be executed on capital account and not provided for 2,820.24 4,450.95
20 The Company conducts international transactions with associated enterprises. For the current year, the management maintained necessary documents as prescribed by the Income tax Act, 1961 to establish that these international transactions are at arm’s length and the aforesaid legislation will not have any impact on the financial statements, particularly on the amount of tax expense and that of provision for taxation.
21 DISCLOSURES REQUIRED UNDER SECTION 22 OF THE MICRO, SMALL AND MEDIUM ENTERPRISES DEVELOPMENT ACT, 2006
` in Million
Particulars As on March 31, 2018
As on March 31, 2017
(i) Principal amount remaining unpaid to any supplier as at the end of the accounting year 150.98 48.56 (ii) Interest due thereon remaining unpaid to any supplier as at the end of the
accounting year 10.58 10.58 (iii) The amount of interest paid along with the amounts of the payment made to the
supplier beyond the appointed day - - (iv) The amount of interest due and payable for the year - - (v) The amount of interest accrued and remaining unpaid at the end of the accounting year 10.58 10.58 (vi) The amount of further interest due and payable even in the succeeding year, until such
date when the interest dues as above are actually paid 10.58 10.58
Dues to Micro and Small Enterprises have been determined to the extent such parties have been identified on the basis of information collected by the Management. This has been relied upon by the auditors.
22 EXPENDITURE TOWARDS CORPORATE SOCIAL RESPONSIBILITY (CSR) ACTIVITIES -
In accordance with the provisions of section 135 of the Act, the Board of Directors of the Company had constituted a CSR committee. The details for CSR activities are as follows:
` in Million
Particulars 2017-18 2016-17
i) Gross amount required to be spent by the Company during the year 215.66 184.37 ii) Amount spent during the year on the following: (a) Construction/acquisition of any asset - - (b) On purposes other than (a) above 215.68 185.00 Total 215.68 185.00
165Apollo Tyres Ltd Annual Report 2017-18
Corporate Overview / Statutory Reports / Financial Statements

23 DISCLOSURE 0F RELATED PARTY TRANSACTIONS IN ACCORDANCE WITH IND AS 24 - RELATED PARTY DISCLOSURES
Name of the related parties
Particulars 2017-18 2016-17
Subsidiaries
Apollo Tyres Cooperatief U.A.,(AT Coop), Netherlands Apollo Tyres Cooperatief U.A.,(AT Coop), Netherlands Apollo Tyres (Cyprus) Private Limited (ATCPL), Cyprus Apollo Tyres (Cyprus) Private Limited (ATCPL), Cyprus Apollo Tyres (Greenfield) B.V., Netherlands Apollo Tyres (Greenfield) B.V., NetherlandsApollo (South Africa) Holdings (Pty) Ltd. (ASHPL) (Subsidiary through AT Coop)
Apollo (South Africa) Holdings (Pty) Ltd. (ASHPL) (Subsidiary through AT Coop)
Apollo Tyres Africa (Pty) Ltd. (Subsidiary through ASHPL) Apollo Tyres Africa (Pty) Ltd. (Subsidiary through ASHPL)
Apollo Tyres (Thailand) Limited, Thailand (Subsidiary through AT Coop)
Apollo Tyres (Thailand) Limited, Thailand (Subsidiary through AT Coop)
Apollo Tyres (Middle East) FZE (ATFZE), Dubai (Subsidiary through AT Coop)
Apollo Tyres (Middle East) FZE (ATFZE), Dubai (Subsidiary through AT Coop)
Apollo Tyres Holdings (Singapore) Pte. Ltd., (ATHS), Singapore (Subsidiary through AT Coop)
Apollo Tyres Holdings (Singapore) PTE. Ltd., (ATHS), Singapore (Subsidiary through AT Coop)
Apollo Tyres (Malaysia) SDN. BHD (Subsidiary through ATHS)
Apollo Tyres (Malaysia) SDN. BHD (Subsidiary through ATHS)
Apollo Tyres (UK) Pvt. Ltd., United Kingdom (Subsidiary through AT Coop)
Apollo Tyres (UK) Pvt. Ltd., United Kingdom (Subsidiary through AT Coop)
Apollo Tyres (London) Pvt. Ltd. (Subsidiary through ATUK) Apollo Tyres (London) Pvt. Ltd. (Subsidiary through ATUK)
Apollo Tyres Global R&D B.V., Netherlands (Subsidiary through AT Coop)
Apollo Tyres Global R&D B.V., Netherlands (Subsidiary through AT Coop)
Apollo Tyres (Germany) GmbH (Subsidiary through AT Coop)
Apollo Tyres (Germany) GmbH (Subsidiary through AT Coop)
Apollo Tyres AG, Switzerland (AT AG) (Subsidiary through AT Coop)
Apollo Tyres AG, Switzerland (AT AG) (Subsidiary through AT Coop)
Apollo Tyres do (Brasil) LTDA, Brazil (Subsidiary through AT Coop and ATBV)
Apollo Tyres do (Brasil) LTDA, Brazil (Subsidiary through AT Coop and ATBV)
Apollo Tyres B.V. (ATBV), Netherlands (Subsidiary through AT Coop)
Apollo Tyres B.V. (ATBV), Netherlands (Subsidiary through AT Coop)
Apollo Tyres (Hungary) Kft (Subsidiary through ATBV) Apollo Tyres (Hungary) Kft (Subsidiary through ATBV)Reifencom GmbH, Bielefeld (Subsidiary through AT Coop) Reifencom GmbH, Bielefeld (Subsidiary through AT Coop)
Reifencom GmbH, Hannover (Subsidiary through Reifencom GmbH, Bielefeld)
Reifencom GmbH, Hannover (Subsidiary through Reifencom GmbH, Bielefeld)
Reifencom Einkaufsgesellschaft, mbH & Co. OHG, Hannover (Subsidiary through Reifencom GmbH, Bielefeld & Reifencom GmbH, Hannover)
Reifencom Einkaufsgesellschaft, mbH & Co. OHG, Hannover (Subsidiary through Reifencom GmbH, Bielefeld & Reifencom GmbH, Hannover)
Reifencom Tyre (Qingdao) Co., Ltd. (Subsidiary through Reifencom Einkaufsgesellschaft, mbH & Co. OHG, Hannover)
Reifencom Tyre (Qingdao) Co., Ltd. (Subsidiary through Reifencom Einkaufsgesellschaft, mbH & Co. OHG, Hannover)
Saturn F1 Pvt Ltd (Subsidiary through AT Coop) Saturn F1 Pvt Ltd (Subsidiary through AT Coop)Retail Distribution Holding B.V. (Subsidiary through AT Coop)
Retail Distribution Holding B.V. (Subsidiary through AT Coop)
Rubber Research LLC (Subsidiary through AT Coop) Rubber Research LLC (Subsidiary through AT Coop)ATL Singapore Pte Limited ATL Singapore Pte LimitedApollo Vredestein Tires Inc., USA (Subsidiary through AT Coop)
Apollo Vredestein Tires Inc., USA (Subsidiary through AT Coop)
Apollo Vredestein B.V., Netherlands (AVBV) (Subsidiary through ATBV)
Apollo Vredestein B.V., Netherlands (AVBV) (Subsidiary through ATBV)
Subsidiaries of Apollo Vredestein B.V (AVBV): Subsidiaries of Apollo Vredestein B.V (AVBV):Apollo Vredestein GmbH, Germany Apollo Vredestein GmbH, GermanyVredestein Marketing B.V. & Co. KG, Germany (Subsidiary through Apollo Vredestein GmbH)
Vredestein Marketing B.V. & Co. KG, Germany (Subsidiary through Apollo Vredestein GmbH)
Apollo Vredestein Nordic A.B., Sweden Apollo Vredestein Nordic A.B., SwedenApollo Vredestein U.K. Limited, United Kingdom Apollo Vredestein U.K. Limited, United KingdomApollo Vredestein SAS, France Apollo Vredestein SAS, FranceApollo Vredestein Belux, Belgium Apollo Vredestein Belux, BelgiumApollo Vredestein Gesellschaft m.b.H., Austria Apollo Vredestein Gesellschaft m.b.H., AustriaApollo Vredestein Schweiz AG, Switzerland Apollo Vredestein Schweiz AG, SwitzerlandApollo Vredestein Srl, Italy Apollo Vredestein Srl, ItalyApollo Vredestein Iberica SA, Spain Apollo Vredestein Iberica SA, SpainApollo Vredestein Kft, Hungary Apollo Vredestein Kft, HungaryS.C. Vredesetin R.O. Srl, Romania (Subsidiary through Apollo Vredestein Kft, Hungary)
S.C. Vredesetin R.O. Srl, Romania (Subsidiary through Apollo Vredestein Kft, Hungary)
Apollo Vredestein Opony Polska Sp. Zo.o., Poland Apollo Vredestein Opony Polska Sp. Zo.o., PolandVredestein Consulting B.V.,Netherlands Vredestein Consulting B.V.,NetherlandsFinlo B.V. Netherlands Finlo B.V. Netherlands Vredestein Marketing B.V., Netherlands Vredestein Marketing B.V., Netherlands
166

Particulars 2017-18 2016-17
Associates Pressurite (Pty) Ltd, South Africa Pressurite (Pty) Ltd, South AfricaKT Telematic Solutions Private Limited (Note (a)) N.A.
Joint venture PanAridus LLC, USA (JV through ATHS) PanAridus LLC, USA (JV through ATHS)
Companies in which directors are interested
Apollo International Limited Apollo International LimitedApollo International Trading LLC, Middle East Apollo International Trading LLC, Middle EastEncorp E Services Ltd. Encorp E Services Ltd.UFO Moviez India Ltd. UFO Moviez India Ltd.Landmark Farms & Housing Pvt. Ltd. Landmark Farms & Housing Pvt. Ltd.SunLife Tradelinks (P) Ltd. SunLife Tradelinks (P) Ltd. - Bespoke Tours & Travels Ltd.Dusk Valley Technologies Ltd. Dusk Valley Technologies Ltd.Classic Auto Tubes Ltd. Classic Auto Tubes Ltd.PTL Enterprises Ltd. PTL Enterprises Ltd.Apollo Finance Ltd. Apollo Finance Ltd.Artemis Medicare Services Ltd. Artemis Medicare Services Ltd.Artemis Health Sciences Ltd. Artemis Health Sciences Ltd.Shardul Amarchand Mangaldas & Co. Shardul Amarchand Mangaldas & Co.Regent Properties Regent PropertiesSwaranganga Consultants Pvt. Ltd. Swaranganga Consultants Pvt. Ltd.J & S Systems Corporation, U.K. J & S Systems Corporation, U.K.Sacred Heart Investment Co. Pvt. Ltd. Sacred Heart Investment Co. Pvt. Ltd.Milers Global Pvt. Ltd. Milers Global Pvt. Ltd.
Key management personnel (KMP)
Mr. Onkar S. Kanwar Mr. Onkar S. KanwarMr. Neeraj Kanwar Mr. Neeraj KanwarMr. Akshay Chudasama Mr. Akshay Chudasama Mr. A.K. Purwar Mr. A.K. PurwarGen. Bikram Singh (Retd.) Gen. Bikram Singh (Retd.)Mr. Francesco Gori Mr. Francesco GoriMr. Paul Antony Mr. Paul AntonyMr. Nimesh N. Kampani Mr. Nimesh N. KampaniMs. Pallavi Shroff Ms. Pallavi ShroffMr. Robert Steinmetz Mr. Robert SteinmetzMr. Sunam Sarkar Mr. Sunam SarkarDr. S. Narayan Dr. S. NarayanMr. Vikram S. Mehta Mr. Vikram S. Mehta Mr. Vinod Rai Mr. Vinod RaiMs. Anjali Bansal (Note (b))Dr. M Beena (Note (b))
Notes: Related parties and their relationships are as identified by the management and relied upon by the auditors.
(a) Invested during the year
(b) Appointed during the year
Transactions and balances with Related Parties: FY 2017-18
` in Million
Particulars SubsidiariesCompanies in
which Directors are interested
AssociateKey Management
PersonnelTotal
Description of Transactions:Sales: Finished GoodsApollo International Ltd. 721.21 721.21 Apollo Tyres Global R&D B.V. 3.14 3.14 Apollo Vredestein B.V. 2,018.77 2,018.77 Apollo Tyres (Middle East) FZE 1,468.51 1,468.51 Apollo Tyres (Thailand) Limited 1,886.19 1,886.19 Apollo Tyres Africa (Pty) Ltd. 709.70 709.70 Apollo Tyres (Malaysia) SDN. BHD 365.34 365.34
6,451.65 721.21 7,172.86 Sales: Raw MaterialsClassic Auto Tubes Ltd. 62.04 62.04 Sales: Semi Finished GoodsApollo Vredestein B.V. 10.79 10.79 Royalty Income:Apollo Tyres (Middle East) FZE 10.70 10.70 Apollo Tyres (Thailand) Limited 19.43 19.43 Apollo Tyres Africa (Pty) Ltd. 25.91 25.91 Apollo Tyres (Malaysia) SDN. BHD 0.76 0.76
56.80 56.80
167Apollo Tyres Ltd Annual Report 2017-18
Corporate Overview / Statutory Reports / Financial Statements

` in Million
Particulars SubsidiariesCompanies in
which Directors are interested
AssociateKey Management
PersonnelTotal
Cross Charge of Management & Other Expenses Received #:Apollo Vredestein B.V. 21.32 21.32 Apollo Tyres (Middle East) FZE 1.82 1.82 Apollo Tyres Global R&D B.V. 2.73 2.73 Apollo Tyres (UK) Pvt. Ltd. 1.92 1.92 Apollo Tyres (Thailand) Limited 2.61 2.61 PTL Enterprises Ltd. 0.85 0.85 Classic Auto Tubes Ltd. 1.71 1.71 Apollo Tyres Africa (Pty) Ltd. 1.44 1.44 Artemis Medicare Services Ltd. 0.71 0.71 Apollo Tyres (Hungary) Kft 13.83 13.83 Apollo Tyres Holdings (Singapore) Pte. Ltd. 22.62 22.62 Apollo Tyres (Malaysia) SDN. BHD 0.73 0.73
69.02 3.27 72.29 Rent Received:PTL Enterprises Ltd. 0.37 0.37 Classic Auto Tubes Ltd. 1.06 1.06
1.43 1.43 Interest income:Apollo Tyres Cooperatief U.A. 11.75 11.75 Apollo Tyres (Greenfield) B.V. 103.12 103.12
114.87 114.87 Reimbursement of Expenses Received:Apollo Vredestein B.V. 148.45 148.45 Apollo Tyres (Middle East) FZE 2.47 2.47 Apollo Tyres Global R&D B.V. 27.80 27.80 Apollo Tyres (Thailand) Limited 6.13 6.13 Apollo Tyres (UK) Pvt. Ltd. 10.86 10.86 Classic Auto Tubes Ltd. 7.44 7.44 Apollo Tyres Africa (Pty) Ltd. 2.09 2.09 Apollo International Ltd. 0.60 0.60 Apollo Tyres (Hungary) Kft 208.65 208.65 Apollo Tyres Holdings (Singapore) Pte. Ltd. 22.06 22.06 Apollo Tyres AG, Switzerland 106.43 106.43 Apollo Tyres (Malaysia) SDN. BHD 0.94 0.94 Reifencom GmbH 1.25 1.25
537.13 8.04 545.17 Freight and insurance recovered:Apollo Tyres (Middle East) FZE 25.37 25.37 Apollo Tyres (Thailand) Limited 15.54 15.54 Apollo Tyres Africa (Pty) Ltd. 22.73 22.73 Apollo Vredestein B.V. 87.88 87.88 Apollo Tyres Global R&D B.V 4.19 4.19 Apollo Tyres (Malaysia) SDN. BHD 1.84 1.84
157.55 157.55 Royalty Paid:Apollo Tyres AG, Switzerland 13.63 13.63 Purchase of raw materialApollo Vredestein B.V. 81.47 81.47 Apollo Tyres Holdings (Singapore) Pte. Ltd. 25,940.31 25,940.31
26,021.78 26,021.78 Purchase of assetsClassic Auto Tubes Ltd. 872.57 872.57 Artemis Medicare Services Ltd. 23.44 23.44
896.01 896.01 Legal and professional charges paid:Shardul Amarchand Mangaldas & Co 12.84 12.84 Reimbursement of expenses paid:PTL Enterprises Ltd. 588.74 588.74 Classic Auto Tubes Ltd. 188.57 188.57 Apollo Vredestein B.V. 3.71 3.71 Apollo Tyres (Thailand) Limited 33.72 33.72
168

` in Million
Particulars SubsidiariesCompanies in
which Directors are interested
AssociateKey Management
PersonnelTotal
Apollo Tyres (Middle East) FZE 8.88 8.88 Apollo Tyres (UK) Pvt. Ltd. 7.36 7.36 Apollo Tyres Global R&D B.V 1.57 1.57 Apollo Tyres Africa (Pty) Ltd. 0.53 0.53 Apollo Tyres Holdings (Singapore) Pte. Ltd. 0.07 0.07 Saturn F1 Pvt. Ltd. 3.14 3.14 Apollo Tyres (Malaysia) SDN. BHD 2.14 2.14 Milers Global Pvt. Ltd. 0.12 0.12
61.12 777.43 838.55 Payment for services received:Artemis Medicare Services Ltd. 20.34 20.34 Classic Auto Tubes Ltd. 1.69 1.69
22.03 22.03 Cross Charge of R & D expenses paid:Apollo Tyres Global R&D B.V 557.75 557.75 Cross charge of other expenses paid:Apollo Tyres (UK) Pvt. Ltd. 543.69 543.69 Apollo Tyres Holdings (Singapore) Pte. Ltd. 162.60 162.60
706.29 706.29 Lease rent paid:PTL Enterprises Ltd. 567.92 567.92 Rent paid:Sunlife Tradelinks (P) Ltd. 27.01 27.01 Land Mark Farms & Housing (P) Ltd. 24.20 24.20 Regent Properties 21.60 21.60 Classic Auto Tubes Ltd. 0.12 0.12 Milers Global Pvt. Ltd. 3.01 3.01
75.94 75.94 Conversion charges paid:Classic Auto Tubes Ltd. 1,097.45 1,097.45 Mixing charges Paid:Classic Auto Tubes Ltd. 250.38 250.38 Commission on Sales paidApollo Tyres (Thailand) Limited 21.36 21.36 Apollo Tyres (Middle East) FZE 19.39 19.39
40.75 40.75 Sale of assetsApollo Tyres (Hungary) Kft 6.72 6.72 Loan givenApollo Tyres Cooperatief U.A 4,734.79 4,734.79 Apollo Tyres (Greenfield) B.V. 2,557.20 2,557.20
7,291.99 7,291.99 Refund of loan givenApollo Tyres (Greenfield) B.V. 3,911.22 3,911.22 Investments made:Apollo Tyres Cooperatief U.A 6,328.12 6,328.12 KT Telematic Solutions Private Ltd. 22.50 22.50
6,328.12 22.50 6,350.62 Security deposit givenPTL Enterprises Ltd. 100.00 100.00 Managerial remuneration:Mr. Onkar S. Kanwar 495.82 495.82 Mr. Neeraj Kanwar 446.40 446.40
942.22 942.22 Sitting fees:Mr. Akshay Chudasama 1.70 1.70 Mr. A.K. Purwar 0.70 0.70 Ms. Anjali Bansal 0.50 0.50 Gen. Bikram Singh (Retd.) 0.90 0.90 Mr. Francesco Gori 0.60 0.60 Dr. M Beena 0.10 0.10 Mr. Nimesh N. Kampani 1.10 1.10 Ms. Pallavi Shroff 0.90 0.90
169Apollo Tyres Ltd Annual Report 2017-18
Corporate Overview / Statutory Reports / Financial Statements

` in Million
Particulars SubsidiariesCompanies in
which Directors are interested
AssociateKey Management
PersonnelTotal
Mr. Paul Antony 0.30 0.30 Mr. Robert Steinmetz 1.00 1.00 Mr. Sunam Sarkar 2.00 2.00 Dr. S. Narayan 1.60 1.60 Mr. Vikram S. Mehta 0.60 0.60 Mr. Vinod Rai 0.70 0.70
12.70 12.70 Commission:Mr. Akshay Chudasama 4.83 4.83 Mr. A.K. Purwar 4.83 4.83 Ms. Anjali Bansal 2.00 2.00 Gen. Bikram Singh (Retd.) 4.84 4.84 Mr. Francesco Gori 4.83 4.83 Mr. Nimesh N. Kampani 4.83 4.83 Ms. Pallavi Shroff 4.84 4.84 Mr. Paul Antony / Dr. M Beena 4.83 4.83 Mr. Robert Steinmetz 4.83 4.83 Mr. Sunam Sarkar 4.84 4.84 Dr. S. Narayan 4.83 4.83 Mr. Vikram S. Mehta 4.83 4.83 Mr. Vinod Rai 4.84 4.84
60.00 60.00 Amount outstandingOther Non current Assets (financial / non financial):PTL Enterprises Ltd. 600.00 600.00 Sunlife Tradelinks (P) Ltd. 5.86 5.86 Land Mark Farms & Housing (P) Ltd. 6.00 6.00 Regent Properties 5.40 5.40 Milers Global Pvt. Ltd. 0.75 0.75 Classic Auto Tubes Ltd. 73.89 73.89
691.90 691.90 Trade Receivable:Apollo Vredestein B.V. 769.06 769.06 Apollo Tyres Africa (Pty) Ltd. 153.77 153.77 Apollo Tyres (Middle East) FZE 126.47 126.47 Classic Auto Tubes Ltd. 8.14 8.14 Apollo International Ltd 44.17 44.17 Apollo Tyres (Thailand) Limited 168.87 168.87 Apollo Tyres Global R&D B.V. 5.42 5.42 Apollo Tyres (Malaysia) SDN. BHD 38.73 38.73
1,262.32 52.31 1,314.63 Other current assets (financial / non financial):Apollo Tyres Africa (Pty) Ltd. 24.34 24.34 Apollo Vredestein B.V. 13.24 13.24 Apollo Tyres (Thailand) Limited 21.20 21.20 PTL Enterprises Ltd. 36.31 36.31 Apollo International Ltd 0.67 0.67 Classic Auto Tubes Ltd. 1.46 1.46 Artemis Medicare Services Ltd. 0.71 0.71 Apollo Tyres (Hungary) Kft 120.78 120.78 Apollo Tyres (Middle East) FZE 5.05 5.05 Apollo Tyres Cooperatief U.A 4,826.99 4,826.99 Apollo Tyres (UK) Pvt. Ltd. 2.53 2.53 Apollo Tyres (Greenfield) B.V. 917.76 917.76 Apollo Tyres Global R&D B.V 27.25 27.25 Apollo Vredestein Tires Inc. 0.88 0.88 Apollo Tyres Holdings (Singapore) Pte Ltd. 24.99 24.99 Apollo Tyres (Malaysia) SDN. BHD 0.49 0.49 Reifencom GmbH 1.03 1.03
5,986.53 39.15 6,025.68 Trade Payable:Apollo Tyres AG, Switzerland 2.62 2.62
170

` in Million
Particulars SubsidiariesCompanies in
which Directors are interested
AssociateKey Management
PersonnelTotal
Apollo Vredestein B.V. 19.88 19.88 Apollo Tyres (UK) Pvt. Ltd. 89.95 89.95 Apollo Tyres Global R&D B.V. 51.20 51.20 Apollo Tyres (Middle East) FZE 17.57 17.57 Classic Auto Tubes Ltd. 99.73 99.73 Apollo Tyres (Thailand) Limited 62.03 62.03 Apollo Tyres Africa (Pty) Ltd. 0.56 0.56 Apollo Tyres Holdings (Singapore) Pte. Ltd. 4,617.47 4,617.47 Saturn F1 Pvt Ltd 3.10 3.10 Reifencom GmbH 0.15 0.15 Land Mark Farms & Housing (P) Ltd. 1.98 1.98 Milers Global Private Limited 0.12 0.12 Apollo Tyres (Malaysia) SDN. BHD 1.67 1.67
4,866.20 101.83 4,968.03 Other Current Liabilities (Financial):Classic Auto Tubes Ltd. 69.66 69.66 Apollo International Ltd. 0.52 0.52 Apollo Vredestein Tires Inc. 0.06 0.06 Apollo Tyres Global R&D B.V. 6.40 6.40
6.46 70.18 76.64
FY 2016-17
` in Million
Particulars Subsidiaries Companies in
which Directors are interested
Key Management Personnel
Total
Description of Transactions:Sales: Finished GoodsApollo International Trading LLC, Middle East 2.40 2.40 Apollo International Ltd. 1,236.31 1,236.31 Apollo Tyres Global R&D B.V 1.02 1.02 Apollo Vredestein B.V. 1,975.75 1,975.75 Apollo Tyres (Middle East) FZE 1,488.59 1,488.59 Apollo Tyres (Thailand) Limited 1,870.76 1,870.76 Apollo Tyres Africa (Pty) Ltd. 588.77 588.77 Apollo Tyres (Malaysia) SDN. BHD 230.85 230.85
6,155.74 1,238.71 7,394.45 Sales: Raw MaterialsClassic Auto Tubes Ltd. 21.42 21.42 Sales: Semi Finished GoodsApollo Vredestein B.V. 6.36 6.36 Royalty Income:Apollo Tyres (Middle East) FZE 14.18 14.18 Apollo Tyres (Thailand) Limited 22.10 22.10 Apollo Tyres Africa (Pty) Ltd. 24.61 24.61 Apollo Tyres (Malaysia) SDN. BHD 0.33 0.33
61.22 61.22 Cross Charge of Management & Other Expenses Received #:Apollo Vredestein B.V. 22.13 22.13 Apollo Tyres (Middle East) FZE 1.56 1.56 Apollo Tyres Global R&D B.V 4.53 4.53 Apollo Tyres (UK) Pvt. Ltd. 3.36 3.36 Apollo Tyres (Thailand) Limited 2.11 2.12 PTL Enterprises Ltd. 0.87 0.87 Classic Auto Tubes Ltd. 1.74 1.74 Apollo Tyres Africa (Pty) Ltd. 0.87 0.87 Artemis Medicare Services Ltd. 0.63 0.63 Apollo Tyres (Hungary) Kft 14.94 14.94 Apollo Tyres Holdings (Singapore) Pte. Ltd. 1.46 1.46
50.96 3.24 54.20
171Apollo Tyres Ltd Annual Report 2017-18
Corporate Overview / Statutory Reports / Financial Statements

` in Million
Particulars Subsidiaries Companies in
which Directors are interested
Key Management Personnel
Total
Rent Received:PTL Enterprises Ltd. 0.33 0.33 Bespoke Tours & Travels Ltd. 0.23 0.23 Classic Auto Tubes Ltd. 0.10 0.10
0.66 0.66 Interest income:Apollo Tyres Greenfield B.V. 12.41 12.41 Reimbursement of Expenses Received:Apollo Vredestein B.V. 168.24 168.24 Apollo Tyres (Middle East) FZE 4.29 4.29 Apollo Tyres Global R&D B.V 25.61 25.61 Apollo Tyres (Thailand) Limited 2.76 2.76 Apollo Tyres (UK) Pvt. Ltd. 11.61 11.61 Classic Auto Tubes Ltd. 6.95 6.95 Apollo Tyres Africa (Pty) Ltd. 0.86 0.86 PTL Enterprises Ltd. 0.02 0.02 Apollo International Ltd. 0.15 0.15 Apollo Tyres (Hungary) Kft 197.66 197.66 Apollo Tyres Holdings (Singapore) Pte. Ltd. 1.84 1.84 Apollo Tyres AG, Switzerland 108.72 108.72 Apollo Tyres (Malaysia) SDN. BHD 1.38 1.38 Reifencom GmbH 0.39 0.39 Apollo Vredestein Tyres North America 0.91 0.91 Apollo Tyres Co-Operatief U.A 1.33 1.33
525.60 7.12 532.72 Freight & Insurance recovered:Apollo Tyres (Middle East) FZE 23.65 23.65 Apollo Tyres (Thailand) Limited 16.50 16.50 Apollo Tyres Africa (Pty) Ltd. 17.46 17.46 Apollo Vredestein B.V. 81.33 81.33 Apollo Tyres Global R&D B.V 1.16 1.16 Apollo Tyres (Malaysia) SDN. BHD 1.31 1.31
141.41 - 141.41 Royalty Paid:Apollo Tyres AG, Switzerland 12.80 12.80 Purchase of raw materialsApollo Vredestein B.V. 85.95 85.95 Apollo Tyres Holdings (Singapore) Pte. Ltd. 13,556.16 13,556.16
13,642.11 13,642.11 Purchase of assetsClassic Auto Tubes Ltd. 823.77 823.77 Bespoke Tours & Travels Ltd 2.01 2.01
825.78 825.78 Legal and Professional Charges Paid:Shardul Amarchand Mangaldas & Co 11.76 11.76 Reimbursement of Expenses paid:PTL Enterprises Ltd. 552.58 552.58 Classic Auto Tubes Ltd. 371.39 371.39 Apollo Vredestein B.V. 3.42 3.42 Apollo Tyres (Thailand) Limited 15.78 15.78 Apollo Tyres (Middle East) FZE 7.82 7.82 Apollo Tyres (UK) Pvt. Ltd. 56.61 56.61 Apollo Tyres Global R&D B.V 9.49 9.49 Apollo Tyres Africa (Pty) Ltd 4.82 4.82 Apollo Tyres AG, Switzerland 1.77 1.77 Apollo Tyres (Malaysia) SDN. BHD 1.43 1.43
101.14 923.97 1,025.11 Payment for Services Received:Artemis Medicare Services Ltd. 17.28 17.28 Classic Auto Tubes Ltd. 0.62 0.62
17.90 17.90
172

` in Million
Particulars Subsidiaries Companies in
which Directors are interested
Key Management Personnel
Total
Cross Charge of R & D Expenses paid:Apollo Tyres Global R&D B.V 871.03 871.03 Cross Charge of Other Expenses paid:Apollo Tyres (UK) Pvt. Ltd. 577.24 577.24 Apollo Tyres Holdings (Singapore) Pte. Ltd. 173.22 173.22
750.46 750.46 Lease Rent paid:PTL Enterprises Ltd. 504.38 504.38 Rent Paid:Sunlife Tradelinks (P) Ltd. 27.19 27.19 Land Mark Farms & Housing (P) Ltd. 24.00 24.00 Regent Properties 21.60 21.60 Classic Auto Tubes Ltd. 0.12 0.12 Milers Global Pvt. Ltd. 3.03 3.03
75.94 75.94 Conversion charges Paid:Classic Auto Tubes Ltd. 1,008.29 1,008.29 Mixing Charges Paid:Classic Auto Tubes Ltd. 315.65 315.65 Travelling Expenses Paid:Bespoke Tours & Travels Ltd. 71.41 71.41 Conference ExpensesBespoke Tours & Travels Ltd. 7.06 7.06 Commission on Sales paidApollo Tyres (Thailand) Limited 26.16 26.16 Apollo Tyres (Middle East) FZE 47.33 47.33 Apollo Tyres (Malaysia) SDN. BHD 2.10 2.10
75.59 75.59 Sale of AssetsClassic Auto Tubes Ltd. 3.00 3.00 Loan GivenApollo Tyres (Greenfield) B.V. 1,732.31 1,732.31 Managerial Remuneration:Mr. Onkar S. Kanwar 457.37 457.37 Mr. Neeraj Kanwar 308.90 308.90
766.27 766.27 Sitting fees:Mr. Akshay Chudasama 1.20 1.20 Mr. A.K. Purwar 0.50 0.50 Gen. Bikram Singh (Retd.) 0.70 0.70 Mr. Francesco Gori 0.40 0.40 Mr. Nimesh N. Kampani 0.60 0.60 Ms. Pallavi Shroff 0.40 0.40 Mr. Paul Antony 0.20 0.20 Mr. Robert Steinmetz 0.70 0.70 Mr. Sunam Sarkar 0.80 0.80 Dr. S. Narayan 1.00 1.00 Mr. Vikram S. Mehta 0.50 0.50 Mr. Vinod Rai 0.50 0.50
7.50 7.50 Commission:Mr. Akshay Chudasama 5.00 5.00 Mr. A.K. Purwar 5.00 5.00 Gen. Bikram Singh (Retd.) 5.00 5.00 Mr. Francesco Gori 5.00 5.00 Mr. Nimesh N. Kampani 5.00 5.00 Ms. Pallavi Shroff 5.00 5.00 Mr. Paul Antony 5.00 5.00 Mr. Robert Steinmetz 5.00 5.00 Mr. Sunam Sarkar 5.00 5.00 Dr. S. Narayan 5.00 5.00 Mr. Vikram S. Mehta 5.00 5.00
173Apollo Tyres Ltd Annual Report 2017-18
Corporate Overview / Statutory Reports / Financial Statements

` in Million
Particulars Subsidiaries Companies in
which Directors are interested
Key Management Personnel
Total
Mr. Vinod Rai 5.00 5.00 60.00 60.00
Amount OutstandingOther Non current Assets (financial / non financial):PTL Enterprises Ltd. 500.00 500.00 Sunlife Tradelinks (P) Ltd. 5.86 5.86 Land Mark Farms & Housing (P) Ltd. 6.00 6.00 Regent Properties 5.40 5.40 Milers Global Pvt. Ltd. 0.75 0.75 Classic Auto Tubes Ltd. 106.45 106.45
624.46 624.46 Trade Receivable:Apollo Vredestein B.V. 411.16 411.16 Apollo Tyres Africa (Pty) Ltd. 92.41 92.41 Apollo Tyres (Middle East) FZE 101.43 101.43 Classic Auto Tubes Ltd. 1.54 1.54 Apollo International Ltd 116.03 116.03 Apollo Tyres (Thailand) Limited 229.68 229.68 Apollo Tyres (Malaysia) SDN. BHD 28.98 28.98
863.66 117.57 981.23 Other current assets (financial / non financial):Apollo Tyres Africa (Pty) Ltd 13.78 13.78 Apollo Vredestein B.V. 78.73 78.73 PTL Enterprises Ltd. 56.43 56.43 Apollo International Ltd 0.15 0.15 Classic Auto Tubes Ltd. 0.62 0.62 Apollo Tyres (Hungary) Kft 128.24 128.24 Apollo Tyres Co-Operatief U.A 1.33 1.33 Apollo Vredestein Tyres North America 0.90 0.90 Reifencom GmbH 0.08 0.08 Apollo Tyres (Greenfield) B.V. 1,732.31 1,732.31
1,955.37 57.20 2,012.57 Trade Payable:Apollo Tyres AG, Switzerland 2.61 2.61 Apollo Vredestein B.V. 14.13 14.13 Apollo Tyres (UK) Pvt. Ltd. 115.40 115.40 Apollo Tyres Global R&D B.V 53.55 53.55 Apollo Tyres (Middle East) FZE 3.54 3.54 Classic Auto Tubes Ltd. 31.26 31.26 Apollo Tyres (Thailand) Limited 16.47 16.47 Apollo Tyres Holdings (Singapore) Pte. Ltd. 2,590.84 2,590.84 Apollo Tyres (Malaysia) SDN. BHD 0.85 0.85
2,797.39 31.26 2,828.65 Other Current Liabilities (Financial):Classic Auto Tubes Ltd. 27.37 27.37 Apollo Vredestein Tires Inc. 0.06 0.06 Apollo Tyres Global R&D B.V. 8.28 8.28
8.34 27.37 35.71
Certain KMPs also participate in post employment benefits plans provided by the Company. The amount in respect of these towards the KMPs can not be segregated as these are based on actuarial valuation for all employees of the Company.
174

24 DISCLOSURE REQUIRED BY REGULATION 34 OF SEBI (LISTING OBLIGATIONS & DISCLOSURE REQUIREMENTS) REGULATIONS, 2015 REGARDING THE RELATED PARTIES
Amount of loans / advances in the nature of loans outstanding from Subsidiaries and Companies in which Directors are interested
` in Million
ParticularsOutstanding as at
the end of the year
Maximum amount outstanding during
the year
Investments outstanding
and maximum investment during
the year
Subsidiaries2017-18Apollo Tyres Co-op UA 4,826.99 4,826.99 16,182.34 Apollo Tyres (Green Field) B.V. 917.76 4,345.14 2.74 Apollo Tyres (Cyprus) Private Limited - - 174.17 2016-17Apollo Tyres (Green Field) B.V. 1,732.31 1,732.31 2.74 Apollo Tyres Co-op UA - - 9,854.22 Apollo Tyres (Cyprus) Private Limited - - 174.17 Companies in which directors are interestedPTL Enterprises Ltd. (PTL)2017-18 (Trade advance) 36.31 53.76 - 2016-17 (Trade advance) 56.43 56.43 -
At the year end, Apollo Tyres (Green Field) B.V. hold 1 unit in Apollo Tyres Co-op UA amounting to EURO 7,184 having face value of EURO 1,000.
25 Revenue for the period ended March 31, 2018 is net of Goods and Service Tax (GST) which is applicable from July 1, 2017, however, revenue for the period upto June 30, 2017 is net of VAT but gross of excise duty. Accordingly, revenue for the period ended March 31, 2018 is not comparable with the previous year presented in these financial statements. Similarly, expenses are also not comparable.
26 SEGMENT REPORTING
The company has opted to provide segment information in its consolidated Ind AS financial statement in accordance with para 4 of Ind AS 108 - Operating Segments.
27 EVENTS AFTER THE BALANCE SHEET DATE
The Board of Directors have recommended a final dividend of ` 3.00 (` 3.00) per share amounting to ` 1,716.15 Million (` 1,527.07 Million) on Equity Shares of Re. 1/- each for the year, subject to approval from Shareholders. Dividend distribution tax on such dividend amounts to ` 352.77 Million (` 310.88 Million).
28 Information on details of loans, gurantees and investments under section 186 of the Act read with Companies (Meetings of Board and its Powers) Rules, 2014
i) Details of investments made are given in note B2 and B7.*
ii) Details of loans given by the Company are given in note B11.
iii) There are no guarantees issued by the Company in accordance with Section 186 of the Act read with rules issued thereunder.
* All transactions are in the ordinary course of business
29 RECONCILIATION OF LIABILITIES FROM FINANCING ACTIVITIES
Effective April 1, 2017, the Company adopted the amendment to Ind AS-7, which require the entities to provide disclosures that enable users of financial statements to evaluate changes in liabilities arising from financing activities, including both changes arising from cash flows and non-cash changes, suggesting inclusion of a reconciliation between the opening and closing balances in the Balance Sheet for liabilities arising from financing activities, to meet the disclosure requirements. The adoption of the amendment did not have any material impact on the financial statements, accordingly, the reconciliation is not disclosed.
175Apollo Tyres Ltd Annual Report 2017-18
Corporate Overview / Statutory Reports / Financial Statements

30 EARNINGS PER SHARE (EPS) – THE NUMERATOR AND DENOMINATOR USED TO CALCULATE BASIC AND DILUTED EARNINGS PER SHARE
Particulars 2017-18 2016-17
Basic and diluted earnings per share Profit attributable to the equity shareholders used as numerator (` in Million) - (A) 6,223.88 8,027.58The weighted average number of equity shares outstanding during the year used as denominator - (B) 538,896,993 509,024,770Basic and diluted earnings per share (`) – (A) / (B) (Face value of Re 1 each) 11.55 15.77
For and on behalf of the Board of Directors
ONKAR S. KANWAR NEERAJ KANWAR NIMESH N. KAMPANIChairman & Managing Director Vice Chairman & Managing Director Director
GAURAV KUMAR SEEMA THAPARChief Financial Officer Company Secretary
GurgaonMay 10, 2018
176

Independent Auditor’s ReportTo The Members of Apollo Tyres Limited
REPORT ON THE CONSOLIDATED FINANCIAL STATEMENTS
1. We have audited the accompanying consolidated financial statements of Apollo Tyres Limited (‘the Holding Company’) and its subsidiaries (the Holding Company and its subsidiaries together referred to as ‘the Group’), its associates and joint venture, which comprise the Consolidated Balance Sheet as at 31 March 2018, the Consolidated Statement of Profit and Loss (including Other Comprehensive Income), the Consolidated Cash Flow Statement and the Consolidated Statement of Changes in Equity for the year then ended, and a summary of the significant accounting policies and other explanatory information.
MANAGEMENT’S RESPONSIBILITY FOR THE CONSOLIDATED FINANCIAL STATEMENTS
2. The Holding Company’s Board of Directors is responsible for the preparation of these consolidated financial statements in terms of the requirements of the Companies Act, 2013 (‘the Act’) that give a true and fair view of the consolidated state of affairs (consolidated financial position), consolidated profit or loss (consolidated financial performance including other comprehensive income), consolidated cash flows and consolidated changes in equity of the Group including its associates and joint venture in accordance with the accounting principles generally accepted in India, including the Indian Accounting Standards (Ind AS) specified under Section 133 of the Act. The Holding Company’s Board of Directors and the respective Board of Directors/management of the subsidiaries included in the Group, and its associates and joint venture are responsible for the design, implementation and maintenance of internal control relevant to the preparation and presentation of the financial statements that give a true and fair view and are free from material misstatement, whether due to fraud or error. Further, in terms of the provisions of the Act, the respective Board of Directors/management of the companies included in the Group, and its associate companies and joint venture company covered under the Act are responsible for maintenance of adequate accounting records in accordance with the provisions of the Act for safeguarding the assets and for preventing and detecting frauds and other irregularities; selection and application of appropriate accounting policies; making judgments and estimates that are reasonable and prudent; and design, implementation and maintenance of adequate internal financial controls, that were operating effectively for ensuring the accuracy and completeness of the accounting records, relevant to the preparation and presentation of the financial statements that give a true and fair view and are free from material misstatement, whether due to fraud or error. These financial statements have been used for the purpose of preparation of the consolidated financial statements by the Directors of the Holding Company, as aforesaid.
AUDITOR’S RESPONSIBILITY
3. Our responsibility is to express an opinion on these consolidated financial statements based on our audit.
4. While conducting the audit, we have taken into account the provisions of the Act, the accounting and auditing standards and matters which are required to be included in the audit report under the provisions of the Act and the Rules made thereunder.
5. We conducted our audit in accordance with the Standards on Auditing specified under Section 143(10) of the Act. Those Standards require that we comply with ethical requirements and plan and perform the audit to obtain reasonable assurance about whether these consolidated financial statements are free from material misstatement.
6. An audit involves performing procedures to obtain audit evidence about the amounts and the disclosures in the consolidated financial statements. The procedures selected depend on the auditor’s judgment, including the assessment of the risks of material misstatement of the consolidated financial statements, whether due to fraud or error. In making those risk assessments, the auditor considers internal financial controls relevant to the Holding Company’s preparation of the consolidated financial statements that give a true and fair view in order to design audit procedures that are appropriate in the circumstances. An audit also includes evaluating the appropriateness of the accounting policies used and the reasonableness of the accounting estimates made by the Holding Company’s Board of Directors, as well as evaluating the overall presentation of the consolidated financial statements.
7. We believe that the audit evidence obtained by us and the audit evidence obtained by the other auditors in terms of their reports referred to in paragraph 9 of the Other Matters paragraph below, is sufficient and appropriate to provide a basis for our audit opinion on these consolidated financial statements.
OPINION
8. In our opinion and to the best of our information and according to the explanations given to us and based on the consideration of the reports of the other auditors on separate financial statements and on the other financial information of the subsidiaries, associates and joint venture, the aforesaid consolidated financial statements give the information required by the Act in the manner so required and give a true and fair view in conformity with the accounting principles generally accepted in India, of the consolidated state of affairs (consolidated financial position) of the Group, its associates and joint venture as at 31 March 2018, and their consolidated profit (consolidated financial performance including other comprehensive income), their consolidated cash flows and consolidated changes in equity for the year ended on that date.
OTHER MATTERS
9. We did not audit the financial statements of 37 subsidiaries, whose financial statements reflect total assets of ` 98,406.98 million and net assets of ` 45,051.95 million as at 31 March 2018, total revenues of ̀ 86,190.60 million and net cash inflows amounting to ` 3,232.33 million for the year ended on that date, as considered in the consolidated financial statements. The consolidated financial statements also include the Group’s share of net profit (including other comprehensive income) of ` 0.01 million for the year ended 31 March 2018, as considered in the consolidated financial statements, in respect of one associate, whose financial statements have not been audited by us. These financial statements have been audited by other auditors whose reports have been furnished to us by the other auditors at the request of the management and our opinion on the consolidated financial statements, in so far as it relates to the amounts and disclosures included in respect of these subsidiaries and associate, and our report in terms of sub-section (3) of Section 143 of the Act, in so far as it relates to
177Apollo Tyres Ltd Annual Report 2017-18
Corporate Overview / Statutory Reports / Financial Statements

the aforesaid subsidiaries and associate, is based solely on the reports of the other auditors.
Further, all subsidiaries are located outside India whose financial statements and other financial information have been prepared in accordance with accounting principles generally accepted in their respective countries and which have been audited by other auditors under generally accepted auditing standards applicable in their respective countries. The Holding Company’s management has converted the financial statements of such subsidiaries located outside India from accounting principles generally accepted in their respective countries to accounting principles generally accepted in India. We have audited these conversion adjustments made by the Holding Company’s management. Our opinion in so far as it relates to the balances and affairs of such subsidiaries located outside India is based on the report of other auditors and the conversion adjustments prepared by the management of the Holding Company and audited by us.
Our opinion above on the consolidated financial statements, and our report on other legal and regulatory requirements below, are not modified in respect of the above matters with respect to our reliance on the work done by and the reports of the other auditors.
10. The comparative consolidated financial information for the year ended 31 March 2017 included in these consolidated financial statements has been audited by Deloitte Haskins & Sells, Chartered Accountants, whose report dated 5 May 2017 expressed an unmodified opinion on the comparative financial statements. Our opinion is not modified in respect of this matter.
REPORT ON OTHER LEGAL AND REGULATORY REQUIREMENTS
11. As required by Section 143(3) of the Act, based on our audit and on the consideration of the reports of the other auditors on separate financial statements and other financial information of the subsidiaries and associate company, we report, to the extent applicable, that:
a) We have sought and obtained all the information and explanations which to the best of our knowledge and belief were necessary for the purpose of our audit of the aforesaid consolidated financial statements;
b) In our opinion, proper books of account as required by law relating to preparation of the aforesaid consolidated financial statements have been kept so far as it appears from our examination of those books and the reports of the other auditors;
c) The consolidated financial statements dealt with by this report are in agreement with the relevant books of account maintained for the purpose of preparation of the consolidated financial statements;
d) In our opinion, the aforesaid consolidated financial statements comply with Ind AS specified under Section 133 of the Act;
e) On the basis of the written representations received from the directors of the Holding Company and taken on record
by the Board of Directors of the Holding Company and the reports of the other statutory auditors of one associate company covered under the Act, none of the directors of the Holding companies and its associate company covered under the Act, are disqualified as on 31 March 2018 from being appointed as a director in terms of Section 164(2) of the Act.
f) With respect to the adequacy of the internal financial controls over financial reporting of the Holding Company covered under the Act and the operating effectiveness of such controls, refer to our separate report in ‘Annexure I’; and
g) With respect to the other matters to be included in the Auditor’s Report in accordance with Rule 11 of the Companies (Audit and Auditor’s) Rules, 2014 (as amended), in our opinion and to the best of our information and according to the explanations given to us and based on the consideration of the reports of the other auditors on separate financial statements as also the other financial information of the subsidiaries, associates and joint venture:
(i) the consolidated financial statements disclose the impact of pending litigations on the consolidated financial position of the Group, its associates and joint venture as detailed in Note C18 to the consolidated financial statements;
(ii) provision has been made in the consolidated financial statements, as required under the applicable law or Ind AS, for material foreseeable losses, if any, on long-term contracts including derivative contracts;
(iii) there has been no delay in transferring amounts, required to be transferred, to the Investor Education and Protection Fund by the Holding Company other than ` 3.18 million (31 March 2017: ` 4.99 million) pertaining to amount of dividend which has not been transferred as per the orders/ instructions under the Special Court (Trial of Offences Relating to Transactions in Securities) Act, 1992. There was no amount which was required to be transferred to the Investor Education and Protection Fund by an associate company covered under the Act; and
(iv) the disclosure requirements relating to holdings as well as dealings in specified bank notes were applicable for the period from 8 November 2016 to 30 December 2016 which are not relevant to these consolidated financial statements. Hence, reporting under this clause is not applicable.
For Walker Chandiok & Co LLP Chartered AccountantsFirm’s Registration No.: 001076N/N500013
David JonesPartner Membership No.: 98113
Place: GurgaonDate: 10 May 2018
178

Independent Auditor’s Report on the Internal Financial Controls under Clause (i) of Sub-section 3 of Section 143 of the Companies Act, 2013 (‘the Act’)
Annexure I
1. In conjunction with our audit of the consolidated financial statements of Apollo Tyres Limited (‘the Holding Company’) and its subsidiaries (the Holding Company and its subsidiaries together referred to as ‘the Group’), its associates and joint venture as at and for the year ended 31 March 2018, we have audited the internal financial controls over financial reporting (‘IFCoFR’) of the Holding Company which is a company covered under the Act, as of that date.
MANAGEMENT’S RESPONSIBILITY FOR INTERNAL FINANCIAL CONTROLS
2. The Board of Directors of the Holding Company, which is a company covered under the Act, are responsible for establishing and maintaining internal financial controls based on the internal control over financial reporting criteria established by the Company considering the essential components of internal control stated in the Guidance Note on Audit of Internal Financial Controls over Financial Reporting (‘the Guidance Note’) issued by the Institute of Chartered Accountants of India (‘ICAI’). These responsibilities include the design, implementation and maintenance of adequate internal financial controls that were operating effectively for ensuring the orderly and efficient conduct of the company’s business, including adherence to the company’s policies, the safeguarding of its assets, the prevention and detection of frauds and errors, the accuracy and completeness of the accounting records, and the timely preparation of reliable financial information, as required under the Act.
AUDITOR’S RESPONSIBILITY
3. Our responsibility is to express an opinion on the IFCoFR of the Holding Company, as aforesaid, based on our audit. We conducted our audit in accordance with the Standards on Auditing issued by the ICAI and deemed to be prescribed under Section 143(10) of the Act, to the extent applicable to an audit of IFCoFR, and the Guidance Note issued by the ICAI. Those Standards and the Guidance Note require that we comply with ethical requirements and plan and perform the audit to obtain reasonable assurance about whether adequate IFCoFR were established and maintained and if such controls operated effectively in all material respects.
4. Our audit involves performing procedures to obtain audit evidence about the adequacy of the IFCoFR and their operating effectiveness. Our audit of IFCoFR includes obtaining an understanding of IFCoFR, assessing the risk that a material weakness exists, and testing and evaluating the design and operating effectiveness of internal control based on the assessed risk. The procedures selected depend on the auditor’s judgement, including the assessment of the risks of material misstatement of the financial statements, whether due to fraud or error.
5. We believe that the audit evidence we have obtained is sufficient and appropriate to provide a basis for our audit opinion on the IFCoFR of the Holding Company as aforesaid.
MEANING OF INTERNAL FINANCIAL CONTROLS OVER FINANCIAL REPORTING
6. A company’s IFCoFR is a process designed to provide reasonable assurance regarding the reliability of financial reporting and the preparation of financial statements for external purposes in accordance with generally accepted accounting principles. A company’s IFCoFR include those policies and procedures that (1) pertain to the maintenance of records that, in reasonable detail, accurately and fairly reflect the transactions and dispositions of the assets of the company; (2) provide reasonable assurance that transactions are recorded as necessary to permit preparation of financial statements in accordance with generally accepted accounting principles, and that receipts and expenditures of the company are being made only in accordance with authorisations of management and directors of the company; and (3) provide reasonable assurance regarding prevention or timely detection of unauthorised acquisition, use, or disposition of the company’s assets that could have a material effect on the financial statements.
INHERENT LIMITATIONS OF INTERNAL FINANCIAL CONTROLS OVER FINANCIAL REPORTING
7. Because of the inherent limitations of IFCoFR, including the possibility of collusion or improper management override of controls, material misstatements due to error or fraud may occur and not be detected. Also, projections of any evaluation of the IFCoFR to future periods are subject to the risk that the IFCoFR may become inadequate because of changes in conditions, or that the degree of compliance with the policies or procedures may deteriorate.
OPINION
8. In our opinion, the Holding Company, which is a company covered under the Act, has in all material respects, adequate internal financial controls over financial reporting and such controls were operating effectively as at 31 March 2018, based on the internal control over financial reporting criteria established by the Company considering the essential components of internal control stated in the Guidance Note issued by the ICAI.
For Walker Chandiok & Co LLP Chartered AccountantsFirm’s Registration No.: 001076N/N500013
David JonesPartner Membership No.: 98113
Place: GurgaonDate: 10 May 2018
179Apollo Tyres Ltd Annual Report 2017-18
Corporate Overview / Statutory Reports / Financial Statements

as on March 31, 2018Consolidated Balance Sheet
` in Million
Particulars Notes As on
March 31, 2018 As on
March 31, 2017
A. ASSETS1. Non-current assets(a) Property, plant and equipment B1 95,286.84 60,381.65(b) Capital work-in-progress 22,682.20 28,723.43(c) Goodwill C3 2,060.71 1,773.58(d) Other intangible assets B1 6,683.20 4,759.77(e) Intangible assets under development 358.49 427.49(f) Financial assets
i. Investment in associate / joint venture B2 22.51 -ii. Other investments B3 12.01 17.49iii. Loans B4 19.87 24.14iv. Other financial assets B5 1,420.38 1,068.88
(g) Deferred tax assets (net) C11 955.71 629.26(h) Other non-current assets B6 3,040.94 4,973.50
Total non-current assets 132,542.86 102,779.192. Current assets(a) Inventories B7 29,453.51 26,455.26(b) Financial assets
i. Investments B8 13,390.47 3,944.44ii. Trade receivables B9 14,350.30 11,274.96iii. Cash and cash equivalents B10 5,931.17 3,308.94iv. Bank balances other than (iii) above B11 60.72 60.23v. Loans B12 17.08 38.94vi. Other financial assets B13 740.41 497.86
(c) Other current assets B14 5,045.93 4,601.36Total current assets 68,989.59 50,181.99Total assets (1+2) 201,532.45 152,961.18
B. EQUITY AND LIABILITIES1. Equity(a) Equity share capital B15 572.05 509.02(b) Other equity 97,194.67 72,390.52
Total equity 97,766.72 72,899.54LIABILITIES
2. Non-current liabilities(a) Financial liabilities
i. Borrowings B16 37,002.20 21,559.04ii. Other financial liabilities B17 689.02 600.03
(b) Provisions B18 764.71 678.21(c) Deferred tax liabilities (net) C11 8,388.62 7,435.40(d) Other non-current liabilities B19 7,301.22 5,217.17
Total non-current liabilities 54,145.77 35,489.853. Current liabilities(a) Financial liabilities
i. Borrowings B20 7,454.48 10,886.27ii. Trade payables B21 24,470.78 17,317.56iii. Other financial liabilities B22 8,864.33 9,032.75
(b) Other current liabilities B23 4,379.44 2,553.23(c) Provisions B24 3,381.28 3,708.21(d) Current tax liabilities (net) B25 1,069.65 1,073.77
Total current liabilities 49,619.96 44,571.79Total equity and liabilities (1+2+3) 201,532.45 152,961.18
See accompanying notes forming part of the financial statements
In terms of our report attached For and on behalf of the Board of DirectorsFor Walker Chandiok & Co LLPChartered Accountants
ONKAR S. KANWAR NEERAJ KANWAR NIMESH N. KAMPANIChairman & Managing Director Vice Chairman & Managing Director Director
David JonesPartner GAURAV KUMAR SEEMA THAPAR
Chief Financial Officer Company SecretaryGurgaonMay 10, 2018
180

for the year ended March 31, 2018Consolidated Statement of Profit and Loss
` in Million
Particulars Notes Year ended
March 31, 2018 Year ended
March 31, 2017
1. REVENUE FROM OPERATIONS:Sales 149,289.52 140,528.89Other operating income B26 1,664.61 1,170.67
150,954.13 141,699.562. OTHER INCOME B27 1,165.39 1,518.123. TOTAL INCOME (1 +2) 152,119.52 143,217.684. EXPENSES:(a) Cost of materials consumed B28 73,906.52 60,449.61(b) Purchase of stock-in-trade B28 11,522.97 10,807.37(c) Changes in inventories of finished goods, stock-in-trade and work-in-progress (1,474.46) (2,356.44)(d) Excise duty on sales 2,548.91 9,899.20(e) Employee benefits expense B28 21,566.46 19,269.69(f) Finance costs B29 1,629.20 1,028.81(g) Depreciation and amortisation expense B1 5,925.54 4,618.13(h) Other expenses B28 26,371.08 25,142.81
Total expenses 141,996.22 128,859.185. PROFIT BEFORE SHARE OF PROFIT / (LOSS) IN ASSOCIATE /
JOINT VENTURE, EXCEPTIONAL ITEMS AND TAX (3 - 4) 10,123.30 14,358.506. SHARE OF PROFIT / (LOSS) IN ASSOCIATE / JOINT VENTURE 0.01 (3.05)7. PROFIT BEFORE EXCEPTIONAL ITEMS AND TAX (5 + 6) 10,123.31 14,355.458. EXCEPTIONAL ITEMS - -9. PROFIT BEFORE TAX (7 - 8) 10,123.31 14,355.4510. TAX EXPENSE:(a) Current tax expense 2,389.22 2,763.88(b) Deferred tax C11 495.27 601.58
Total 2,884.49 3,365.4611. NET PROFIT FOR THE YEAR (9 - 10) 7,238.82 10,989.9912. OTHER COMPREHENSIVE INCOME:I i. Items that will not be reclassified to profit or loss
(a) Remeasurement of defined benefit plans (61.99) (9.22)ii. Income tax 23.88 2.15
(38.11) (7.07)II i. Items that will be reclassified to profit or loss
(a) Exchange differences in translating the financial statements of foreign operations 4,526.70 (2,815.14)
(b) Effective portion of gain / (loss) on designated portion of hedging instruments in a cash flow hedge 204.43 (118.66)
ii. Income tax (70.75) 41.07 4,660.38 (2,892.73)
Other comprehensive Income (I + II) 4,622.27 (2,899.80)Total comprehensive Income for the year (11 + 12) 11,861.09 8,090.19Earnings per equity share of Re. 1 each: C31(a) Basic 13.43 21.59(b) Diluted 13.43 21.59
See accompanying notes forming part of the financial statements
In terms of our report attached For and on behalf of the Board of DirectorsFor Walker Chandiok & Co LLPChartered Accountants
ONKAR S. KANWAR NEERAJ KANWAR NIMESH N. KAMPANIChairman & Managing Director Vice Chairman & Managing Director Director
David JonesPartner GAURAV KUMAR SEEMA THAPAR
Chief Financial Officer Company SecretaryGurgaonMay 10, 2018
181Apollo Tyres Ltd Annual Report 2017-18
Corporate Overview / Statutory Reports / Financial Statements

Con
solid
ated
Sta
tem
ent o
f Cha
nges
in E
quity
OT
HE
R E
QU
ITY
` in
Mill
ion
Par
ticu
lars
Res
erve
s an
d su
rplu
s (r
efer
not
e C
6)It
ems
of o
ther
com
preh
ensi
ve in
com
e
Tota
lS
ecur
itie
s pr
emiu
m
rese
rve
Gen
eral
re
serv
e
Cap
ital
re
serv
e on
co
nsol
idat
ion
Cap
ital
re
serv
e on
AM
HP
L m
erge
r
Deb
entu
re
rede
mpt
ion
rese
rve
Cap
ital
su
bsid
y
Cap
ital
re
dem
ptio
n re
serv
e
Cap
ital
re
serv
e on
fo
rfei
ture
of
shar
es
Ret
aine
d ea
rnin
gsC
ash
flow
he
dge
Rev
alua
tion
su
rplu
s
Fore
ign
curr
ency
tr
ansl
atio
n re
serv
e
Act
uari
al
gain
/
(los
s)
Bal
ance
as
on M
arch
31,
20
16 6
,085
.71
11,
00
6.63
2,6
64.9
5 1
,383
.68
375
.00
25.
50 4
4.4
0 0
.07
46,
326.
03
1.3
6 3
1.22
(2,0
03.
24)
(40
4.1
8) 6
5,53
7.13
Pro
fit fo
r th
e ye
ar 1
0,9
89.9
9 1
0,9
89.9
9O
ther
com
preh
ensi
ve in
com
e (O
CI)
fo
r th
e ye
ar (1
18.6
6) (2
,815
.14)
(9.2
2) (2
,943
.02)
Inco
me
tax
on O
CI
item
s 4
1.0
7 2
.15
43.
22To
tal c
ompr
ehen
sive
inco
me
for
the
year
- -
- -
- -
- -
10
,989
.99
(77.
59)
- (2
,815
.14
) (7
.07)
8,0
90.1
9Tr
ansa
ctio
n w
ith o
wne
rs in
the
ir
capa
city
as
owne
rsP
aym
ent
of d
ivid
end
(` 2
per
sha
re)
(1,0
18.0
5) (1
,018
.05)
Tax
on d
ivid
end
(218
.75)
(218
.75)
Tran
sfer
from
ret
aine
d ea
rnin
gs 1
,00
0.0
021
9.12
(1,2
19.1
2) -
Tran
sfer
to
reta
ined
ear
ning
s (1
25.0
0)
125
.00
-B
alan
ce a
s on
Mar
ch 3
1, 2
017
6,0
85.7
1 1
2,0
06.
63 2
,664
.95
1,3
83.6
8 4
69.1
2 2
5.50
44
.40
0.0
7 5
4,9
85.1
0 (7
6.23
) 3
1.22
(4,8
18.3
8) (4
11.2
5) 7
2,39
0.5
2P
rofit
for
the
year
7,2
38.8
2 7
,238
.82
Oth
er c
ompr
ehen
sive
inco
me
(OC
I)
for
the
year
20
4.43
4,5
26.7
0 (6
1.99
) 4
,669
.14
Inco
me
tax
on O
CI
item
s (7
0.7
5) 2
3.88
(46.
87)
Tota
l com
preh
ensi
ve in
com
e fo
r th
e ye
ar -
- -
- -
- -
- 7
,238
.82
133
.68
- 4
,526
.70
(38.
11)
11,
861.
09
Secu
ritie
s pr
emiu
m o
n is
sue
of
shar
es, n
et 1
4,78
1.0
1 1
4,78
1.0
1Tr
ansa
ctio
n w
ith o
wne
rs in
the
ir
capa
city
as
owne
rsP
aym
ent
of d
ivid
end
(` 3
per
sha
re)
(1,5
27.0
7) (1
,527
.07)
Tax
on d
ivid
end
(310
.88)
(310
.88)
Tran
sfer
from
ret
aine
d ea
rnin
gs 1
,00
0.0
0 4
10.1
9 (1
,410
.19)
-Tr
ansf
er t
o re
tain
ed e
arni
ngs
(250
.00
) (9
3.40
) 3
43.4
0 -
Bal
ance
as
on M
arch
31,
20
18 2
0,86
6.72
13,
00
6.63
2,6
64.9
5 1
,383
.68
629
.31
25.
50 4
4.4
0 0
.07
58,
882.
38 5
7.4
5 3
1.22
(291
.68)
(10
5.96
) 9
7,19
4.6
7
In t
erm
s of
our
rep
ort
atta
ched
For
and
on b
ehal
f of t
he B
oard
of D
irec
tors
For
Wal
ker
Ch
and
iok
& C
o L
LP
Cha
rter
ed A
ccou
ntan
ts
ON
KA
R S
. KA
NW
AR
NE
ER
AJ
KA
NW
AR
NIM
ES
H N
. KA
MP
AN
IC
hair
man
& M
anag
ing
Dir
ecto
rV
ice
Cha
irm
an &
Man
agin
g D
irec
tor
Dir
ecto
rD
avid
Jon
esP
artn
erG
AU
RA
V K
UM
AR
SE
EM
A T
HA
PA
RC
hief
Fin
anci
al O
ffice
rC
ompa
ny S
ecre
tary
Gur
gaon
May
10
, 20
18
182

for the year ended March 31, 2018Consolidated Cash-Flow Statement- Indirect Method
` in Million
ParticularsYear ended
March 31, 2018 Year ended
March 31, 2017
A CASH FLOW FROM OPERATING ACTIVITIES(i) Net profit before tax 10,123.31 14,355.45
Adjustments forDepreciation and amortisation expenses 5,925.54 4,618.13(Profit) / loss on sale of property, plant and equipment (net) (8.13) 35.17(Profit) on sale of investments (0.47) -Dividend from non-current and current investments (45.82) (84.59)Gain on fair value change in investments (140.68) -Provision for doubtful debts / advances 160.14 -Provision for impairment of investment and loan in joint venture - 185.99Provision for constructive liability 95.66 28.29Provision for compensated absences 1.77 33.88Provision for superannuation 22.50 -Liabilities / provisions no longer required written back (23.31) (67.66)Provision for jubilee benefits 0.11 8.27Provision for contingencies - 365.00Finance cost 1,629.20 1,028.81Interest income (333.87) (389.91)Provision for estimated loss on derivatives (40.80) 7.05Unwinding of deferred income (788.13) (329.87)Unwinding of state aid subsidy (41.92) (1.89)Share of (profit)/ loss in associate and joint venture (0.01) 3.05Unrealized (gain) / loss on foreign exchange fluctuations (27.35) 6,384.43 (278.49) 5,161.23
(ii) Operating profit before working capital changes 16,507.74 19,516.68Changes in working capitalAdjustments for (increase) / decrease in operating assetsInventories (1,496.05) (7,827.86)Trade receivables (1,834.73) (1,114.08)Loans and advances given (current and non-current) 29.88 (6.88)Other financial assets (current and non-current) (338.61) (26.70)Other current assets (197.02) (3,836.53) (1,176.85) (10,152.37)Adjustments for increase / (decrease) in operating liabilitiesTrade payables 5,606.15 2,743.18Other financial liabilities (current and non-current) 197.27 17.49Other liabilities (current and non-current) 1,671.15 (218.20)Provisions (current and non-current) (484.23) 6,990.34 379.95 2,922.42
(iii) Cash generated from operations 19,661.55 12,286.73Direct taxes paid (net of refund) (2,464.82) (3,264.08)Net cash from operating activities 17,196.73 9,022.65
B CASH FLOW FROM INVESTING ACTIVITIESPurchase of property, plant and equipment (31,017.19) (33,189.89)Proceeds from sale of property, plant and equipment 345.32 77.53Proceeds from sale of assets held for sale - 475.93Investments in mutual funds (49.41) (2,222.64)Long term investment made (22.50) (5.52)Fixed term deposits with banks matured 7.30 7.30Investment in inter corporate deposits, net (9,250.00) 3,300.00Dividends received (current and non-current investments) 45.82 78.50State aid subsidy received 1,223.04 1,553.15Interest received 89.48 404.33Net cash used in investing activities (38,628.14) (29,521.31)
183Apollo Tyres Ltd Annual Report 2017-18
Corporate Overview / Statutory Reports / Financial Statements

` in Million
ParticularsYear ended
March 31, 2018 Year ended
March 31, 2017
C CASH FLOW FROM FINANCING ACTIVITIESProceeds from issue of shares (net) 14,761.49 -Proceeds from long term borrowings 15,037.93 17,569.02Repayment of long term borrowings (1,696.16) (1,339.04)Short term borrowings (net) (1,733.47) 4,611.40Payment of dividend (including dividend tax) (1,837.95) (1,236.80)Finance charges paid (1,323.03) (658.28)Net cash from financing activities 23,208.81 18,946.30
D EFFECT OF FOREIGN CURRENCY FLUCTUATION ARISING OUT OF CONSOLIDATION 2,836.97 (536.03)Net increase / (decrease) in cash & cash equivalents (A+B+C+D) 4,614.37 (2,088.39)Cash & cash equivalents as at the beginning of the year 3,308.94 5,899.93Less: Cash credits/bank overdrafts as at the beginning of the year 3,117.81 3,624.12
191.13 2,275.81Loss on reinstatement of foreign currency cash & cash equivalents 0.65 4.36Adjusted cash & cash equivalents as at the beginning of the year 191.78 2,280.17
Cash & cash equivalents as at the end of the year 5,931.17 3,308.94Less: Cash credits/bank overdrafts as at the end of the year 1,123.63 3,117.81
4,807.54 191.13(Gain) / loss on reinstatement of foreign currency cash & cash equivalents (1.39) 0.65Adjusted cash & cash equivalents as at the end of the year 4,806.15 191.78
for the year ended March 31, 2018 (Contd.)Consolidated Cash-Flow Statement- Indirect Method
In terms of our report attached For and on behalf of the Board of DirectorsFor Walker Chandiok & Co LLPChartered Accountants
ONKAR S. KANWAR NEERAJ KANWAR NIMESH N. KAMPANIChairman & Managing Director Vice Chairman & Managing Director Director
David JonesPartner GAURAV KUMAR SEEMA THAPAR
Chief Financial Officer Company SecretaryGurgaonMay 10, 2018
184

forming Part of the Consolidated Financial StatementsA. Notes1. GROUP CORPORATE INFORMATION
The Apollo Tyres Group consists of Apollo Tyres Limited (the ‘Company’), the ultimate holding company with several foreign subsidiaries, associates and a joint venture (together referred to as the ‘Group’). Established in 1972, the Group is in the business of manufacturing and sale of tyres. The Group has its headquarter in Gurgaon, India and operations spread all across the Globe.
The product portfolio of the Group consists of tyres of passenger car, sports utility vehicle, multi utility vehicle, light truck, truck–bus, agriculture, industrial, specialty, bicycle and off highway tyres, retreading material and tyres, alloy wheels and two wheeler tyres.
2. RECENT ACCOUNTING PROUNCEMENTS STANDARDS ISSUED BUT NOT YET EFFECTIVE
In March 2018, the Ministry of Corporate Affairs issued the Companies (Indian Accounting Standards) Amendment Rules, 2018 via notification dated March 28, 2018 to further amend Companies (Indian Accounting Standards) Rules, 2015, notifying a new revenue recognition standard Ind AS 115, ‘Revenue from Contracts with Customers’. This amendment replaces Ind AS 18, ‘Revenue’ and Ind AS 11, ‘Construction Contracts’. An insertion to Appendix B, ‘Foreign currency transaction and advance consideration’ to Ind AS 21, ‘The effect of change in exchange rates has also been notified. The amendments are applicable to the Group from April 1, 2018.
IND AS 115 “Revenue from Contracts with Customers”: IND AS 115 provides a single, principles based five-step model
to be applied to all contracts with customers. The five steps in the model are as follows:
a. Identify the contract(s) with the customer;
b. Identify the performance obligations in the contract;
c. Determine the transaction price;
d. Allocate the transaction price to the performance obligations in the contracts;
e. Recognise revenue when (or as) the entity satisfies a performance obligation.
IND AS 21 “Insertion of Appendix B to The effects of changes in foreign exchange rates”:
The amendment clarifies that, in determining the spot exchange rate to use on initial recognition of the related asset, expense or income (or part of it) on the derecognition of a non-monetary asset or non-monetary liability relating to advance consideration, the date of the transaction is the date on which an entity initially recognises the non-monetary asset or non-monetary liability arising from the advance consideration. If there are multiple payments or receipts in advance, then the entity must determine the transaction date for each payment or receipt of advance consideration. Entities may apply the amendments on a fully retrospective basis. Alternatively, an entity may apply the Interpretation prospectively to all assets, expenses and income in its scope that are initially recognised on or after:
(i) The beginning of the reporting period in which the entity first applies the interpretation or
(ii) The beginning of a prior reporting period presented as comparative information in the financial statements of the reporting period in which the entity first applies the interpretation.
The Group is evaluating the requirements of the amendments and its impact if any, on the financial statements.
3. BASIS OF CONSOLIDATION AND SIGNIFICANT ACCOUNTING POLICIES
3.1 Statement of compliance The consolidated financial statements have been prepared
to comply in all material respects with Indian Accounting Standards (hereinafter referred to as the ‘Ind AS’) as notified by Ministry of Corporate Affairs under Section 133 of the Companies Act, 2013 (‘the Act’) read with the Companies (Indian Accounting Standards) Rules, 2015, as amended and other relevant provisions of the Act.
The consolidated financial statements are presented in Indian Rupee (‘INR’), which is also the functional currency of the Company.
The consolidated financial statements for the year ended March 31, 2018 were authorised and approved for issue by the Board of Directors on May 10, 2018.
3.2 Basis of preparation and presentation of consolidated financial statements
The consolidated financial statements have been prepared on accrual basis under the historical cost convention except for certain financial instruments that are measured at fair value at the end of each reporting period, as explained in the accounting policies below.
Historical cost is generally based on the fair value of the consideration given in exchange for goods and services.
Fair value is the price that would be received to sell an asset or paid to transfer a liability in an orderly transaction between market participants at the measurement date, regardless of whether that price is directly observable or estimated using another valuation technique. In estimating the fair value of an asset or a liability, the Group takes into account the characteristics of the asset or liability if market participants would take those characteristics into account when pricing the asset or liability at the measurement date. Fair value for measurement and/or disclosure purposes in these consolidated financial statements is determined on above basis, except for share-based payment transactions that are within the scope of Ind AS 102 Share-based Payment, lease transactions that are within the scope of Ind AS 17 Leases, and measurements that have some similarities to fair value but are not fair value, such as net realisable value in Ind AS 2 Inventories or value in use in Ind AS 36 Impairment of Assets.
In addition, for financial reporting purposes, fair value measurements are categorised into Level 1, 2 or 3 based on the degree to which the inputs to the fair value measurements are observable and the significance of the inputs to the fair value measurement in its entirety, which are described as follows:
> Level 1 inputs are quoted prices (unadjusted) in active markets for identical assets or liabilities that the entity can access at the measurement date;
185Apollo Tyres Ltd Annual Report 2017-18
Corporate Overview / Statutory Reports / Financial Statements

> Level 2 inputs are inputs, other than quoted prices included within Level 1, that are observable for the asset or liability, either directly or indirectly; and
> Level 3 inputs are unobservable inputs for the asset or liability.
The principal accounting policies are set out below:
3.3 Basis of consolidation The consolidated financial statements includes the financial
statements of the Company, its subsidiaries and the entities controlled by the Group as at March 31, 2018. Control is achieved when the Group:
> has power over the investee;
> has the ability to use its power to affect its return; and.
> is exposed, or has rights, to variable returns from its involvement with the investee
The Group reassesses whether or not it controls an investee if facts and circumstances indicate that there are changes to one or more of the three elements of control listed above.
Consolidation of a subsidiary begins when the Group obtains control over the subsidiary and ceases when the Group loses control of the subsidiary. Specifically, income and expenses of a subsidiary acquired or disposed of during the year are included in the consolidated statement of profit and loss from the date the Group gains control until the date when the Group ceases to control the subsidiary.
Adjustments are made to the financial statements of subsidiaries to bring their accounting policies into line with the Group’s accounting policies.
The Group combines the financial statements of the Company and its subsidiaries line by line adding together like items of assets, liabilities, equity, income and expenses.
3.4 Business combinations Acquisitions of businesses are accounted for using the
acquisition method. The consideration transferred in a business combination is measured at fair value, which is calculated as the sum of the acquisition-date fair values of the assets transferred by the Group, liabilities incurred by the Group to the former owners of the acquiree and the equity interests issued by the Group in exchange of control of the acquiree. Acquisition-related costs are generally recognised in profit or loss as incurred.
At the acquisition date, the identifiable assets acquired and the liabilities assumed are recognised at their fair value, except that:
> deferred tax assets or liabilities, and assets or liabilities related to employee benefit arrangements are recognised and measured in accordance with Ind AS 12 Income Taxes and Ind AS 19 Employee Benefits respectively;
> liabilities or equity instruments related to share-based payment arrangements of the acquiree or share-based payment arrangements of the Group entered into to
replace share-based payment arrangements of the acquiree are measured in accordance with Ind AS 102 Share-based Payment at the acquisition date; and
> assets (or disposal groups) that are classified as held for sale in accordance with Ind AS 105 Non-current Assets Held for Sale and Discontinued Operations are measured in accordance with that Standard.
Goodwill is measured as the excess of the sum of the consideration transferred, the amount of any non-controlling interests in the acquiree, and the fair value of the acquirer’s previously held equity interest in the acquiree (if any) over the net of the acquisition-date amounts of the identifiable assets acquired and the liabilities assumed.
When the consideration transferred by the Group in a business combination includes assets or liabilities resulting from a contingent consideration arrangement, the contingent consideration is measured at its acquisition-date fair value and included as part of the consideration transferred in a business combination. Changes in the fair value of the contingent consideration that qualify as measurement period adjustments are adjusted retrospectively, with corresponding adjustments against goodwill or capital reserve, as the case maybe. Measurement period adjustments are adjustments that arise from additional information obtained during the ‘measurement period’ (which cannot exceed one year from the acquisition date) about facts and circumstances that existed at the acquisition date.
The subsequent accounting for changes in the fair value of the contingent consideration that do not qualify as measurement period adjustments depends on how the contingent consideration is classified. Contingent consideration that is classified as equity is not remeasured at subsequent reporting dates and its subsequent settlement is accounted for within equity. Contingent consideration that is classified as an asset or a liability is remeasured at fair values at subsequent reporting dates with the corresponding gain or loss being recognised in profit or loss.
When a business combination is achieved in stages, the Group’s previously held equity interest in the acquiree is remeasured to its acquisition-date fair value and the resulting gain or loss, if any, is recognised in profit or loss. Amounts arising from interests in the acquiree prior to the acquisition date that have previously been recognised in other comprehensive income are reclassified to profit or loss where such treatment would be appropriate if that interest were disposed of.
If the initial accounting for a business combination is incomplete by the end of the reporting period in which the combination occurs, the Group reports provisional amounts for the items for which the accounting is incomplete. Those provisional amounts are adjusted during the measurement period (see above), or additional assets or liabilities are recognised, to reflect new information obtained about facts and circumstances that existed at the acquisition date that, if known, would have affected the amounts recognised at that date.
Business combinations involving entities or businesses under common control has been accounted for using the pooling of interests method.
186

The pooling of interest method is considered to involve the following:
(i) The assets and liabilities of the combining entities are reflected at their carrying amounts.
(ii) No adjustments are made to reflect fair values, or recognise any new assets or liabilities. The only adjustments that are made are to harmonise accounting policies.
(iii) The financial information in the financial statements in respect of prior periods has been restated as if the business combination had occurred from the beginning of the preceding period in the financial statements, irrespective of the actual date of the business combination.
(iv) The identity of the reserves has been preserved and appear in the financial statements of the transferee in the same form in which they appeared in the financial statements of the transferor.
3.5 Investments in associates and joint venture An associate is an entity over which the Group has significant
influence. Significant influence is the power to participate in the financial and operating policy decisions of the investee but is not control or joint control over those policies.
A joint venture is a joint arrangement whereby the parties that have joint control of the arrangement have rights to the net assets of the joint arrangement. Joint control is the contractually agreed sharing of control of an arrangement, which exists only when decisions about the relevant activities require unanimous consent of the parties sharing control.
The results and assets and liabilities of associates or joint ventures are incorporated in these consolidated financial statements using the equity method of accounting, except when the investment, or a portion thereof, is classified as held for sale, in which case it is accounted for in accordance with Ind AS 105 Non-current Assets Held for Sale and Discontinued Operations. Under the equity method, an investment in an associate or a joint venture is initially recognised in the consolidated balance sheet at cost and adjusted thereafter to recognise the Group’s share of the profit and loss of the associate or joint venture. When the Group’s share of losses of an associate or a joint venture exceeds the Group’s interest in that associate or joint venture (which includes any long-term interests that, in substance, form part of the Group’s net investment in the associate or joint venture), the Group discontinues recognising its share of further losses. Additional losses are recognised only to the extent that the Group has incurred legal or constructive obligations or made payments on behalf of the associate or joint venture.
An investment in an associate or a joint venture is accounted for using the equity method from the date on which the investee becomes an associate or a joint venture. On acquisition of the investment in an associate or a joint venture, any excess of the cost of the investment over the Group’s share of the net fair value of the identifiable assets and liabilities of the investee is recognised as goodwill, which is included within the carrying amount of the investment. Any excess of the Group’s share of the net fair value of the identifiable assets and liabilities over the cost of the investment, after reassessment, is recognised directly in equity as capital reserve in the period in which the investment is acquired.
After application of the equity method of accounting, the Group determines whether there is any objective evidence of impairment as a result of one or more events that occurred after the initial recognition of the net investment in an associate or a joint venture and that event (or events) has an impact on the estimated future cash flows from the net investment that can be reliably estimated. If there exists such an objective evidence of impairment, then it is necessary to recognise impairment loss with respect to the Groups investment in an associate or a joint venture.
When necessary, the entire carrying amount of the investment (including goodwill) is tested for impairment in accordance with Ind AS 36 Impairment of Assets as a single asset by comparing its recoverable amount (higher of value in use and fair value less costs of disposal) with its carrying amount, any impairment loss recognised forms part of the carrying amount of the investment. Any reversal of that impairment loss is recognised in accordance with Ind AS 36 Impairment of Assets to the extent that the recoverable amount of the investment subsequently increases.
The Group discontinues the use of the equity method from the date when the investment ceases to be an associate or a joint venture, or when the investment is classified as held for sale. When the Group retains an interest in the former associate or joint venture and the retained interest is a financial asset, the Group measures the retained interest at fair value at that date and the fair value is regarded as its fair value on initial recognition in accordance with Ind AS 109 Financial Instruments. The difference between the carrying amount of the associate or joint venture at the date the equity method was discontinued, and the fair value of any retained interest and any proceeds from disposing of a part interest in the associate or joint venture is included in the determination of the gain or loss on disposal of the associate or joint venture. In addition, the Group accounts for all amounts previously recognised in other comprehensive income in relation to that associate or joint venture on the same basis as would be required if that associate or joint venture had directly disposed of the related assets or liabilities. Therefore, if a gain or loss previously recognised in other comprehensive income by that associate or joint venture would be reclassified to profit or loss on the disposal of the related assets or liabilities, the Group reclassifies the gain or loss from equity to profit or loss (as a reclassification adjustment) when the equity method is discontinued.
The Group continues to use the equity method when an investment in an associate becomes an investment in a joint venture or an investment in a joint venture becomes an investment in an associate. There is no remeasurement to fair value upon such changes in ownership interests.
When the Group reduces its ownership interest in an associate or a joint venture but the Group continues to use the equity method, the Group reclassifies to profit or loss the proportion of the gain or loss that had previously been recognised in other comprehensive income relating to that reduction in ownership interest if that gain or loss would be reclassified to profit or loss on the disposal of the related assets or liabilities.
When a group entity transacts with an associate or a joint venture of the Group, profits and losses resulting from the transactions with the associate or joint venture are recognised in the Group’s consolidated financial statements only to the extent of interests in the associate or joint venture that are not related to the Group.
187Apollo Tyres Ltd Annual Report 2017-18
Corporate Overview / Statutory Reports / Financial Statements

3.6 Inventories Inventories are valued at the lower of cost and estimated
net realisable value (net of allowances) after providing for obsolescence and other losses, where considered necessary. The cost comprises of cost of purchase, cost of conversion and other costs including appropriate production overheads in the case of finished goods and work in progress, incurred in bringing such inventories to their present location and condition. Trade discounts or rebates are deducted in determining the costs of purchase. Net realisable value represents the estimated selling price for inventories less all estimated costs of completion and costs necessary to make the sale.
In case of raw materials, stores & spares and traded goods, cost (net of tax credits wherever applicable) is determined on a moving weighted average basis, and, in case of work in progress and finished goods, cost is determined on a First In First Out basis.
3.7 Taxation Income tax expense recognised in consolidated statement
of profit and loss comprises of the sum of deferred tax and current tax except the ones recognised in other comprehensive income or directly in equity.
Current Tax Current tax is the amount of tax payable on the taxable income
for the year as determined in accordance with the applicable income tax laws of the country in which the respective entities in the group are incorporated. Taxable profit differs from ‘profit before tax’ as reported in the consolidated statement of profit and loss because of items of income or expense that are taxable or deductible in other years and items that are never taxable or deductible. The current tax is calculated using tax rates that have been enacted or substantively enacted by the end of the reporting period.
Deferred tax Deferred tax is recognised on temporary differences between
the carrying amount of assets and liabilities in the financial statements and quantified using the tax rates and laws enacted or substantively enacted as on the Balance Sheet date. Deferred tax liabilities are recognised for all taxable temporary differences. Deferred tax assets are generally recognised for all deductible temporary differences to the extent that it is probable that taxable profits will be available against which those deductible temporary differences can be utilised. Such deferred tax assets and liabilities are not recognised if the temporary difference arises from the initial recognition of assets and liabilities in a transaction that affects neither the taxable profit nor the accounting profit.
Deferred tax liabilities are recognised for taxable temporary differences associated with investments in subsidiaries and associates, and interests in joint ventures, except where the Group is able to control the reversal of the temporary difference and it is probable that the temporary difference will not reverse in the foreseeable future. Deferred tax assets arising from deductible temporary differences associated with such investments and interests are only recognised to the extent that it is probable that there will be sufficient taxable profits against which the temporary differences can be utilised and they are expected to reverse in the foreseeable future.
The carrying amount of deferred tax assets is reviewed at the end of each reporting period and reduced to the extent that it is no longer probable that sufficient taxable profits will be available to allow all or part of the asset to be recovered.
Minimum alternate tax (‘MAT’) credit entitlement is recognised as an asset only when and to the extent there is convincing evidence that normal income tax will be paid during the specified period. In the year in which MAT credit becomes eligible to be recognised as an asset is created by way of a credit to the consolidated statement of profit and loss. This is reviewed at each balance sheet date and the carrying amount of MAT credit entitlement is written down to the extent it is not reasonably certain that normal income tax will be paid during the specified period.
Deferred tax liabilities and assets are measured at the tax rates that are expected to apply in the period in which the liability is settled or the asset realised, based on tax rates (and tax laws) that have been enacted or substantively enacted by the end of the reporting period.
The measurement of deferred tax liabilities and assets reflects the tax consequences that would follow from the manner in which the Group expects, at the end of the reporting period, to recover or settle the carrying amount of its assets and liabilities.
Current and deferred tax for the year Current and deferred tax are recognised in profit or loss,
except when they relate to items that are recognised in other comprehensive income or directly in equity, in which case, the current and deferred tax are also recognised in other comprehensive income or directly in equity respectively. Where current tax or deferred tax arises from the initial accounting for a business combination, the tax effect is included in the accounting for the business combination.
3.8 Property, plant and equipment (PPE) Land and buildings held for use in the production or supply of
goods or services, or for administrative purposes, are stated in the consolidated balance sheet at cost less accumulated depreciation and accumulated impairment losses. Freehold land is not depreciated.
Properties in the course of construction for production, supply or administrative purposes are carried at cost, less any recognised impairment loss. For qualifying assets, borrowing costs are capitalised in accordance with the Ind AS 23 Borrowing Costs. Such properties are classified to the appropriate categories of property, plant and equipment when completed and ready for intended use. Depreciation of these assets, on the same basis as other property assets, commences when the assets are ready for their intended use.
Fixtures and equipment are stated at cost less accumulated depreciation and accumulated impairment losses.
Property, plant and equipment are capitalised at costs relating to the acquisition and installation (net of tax credits wherever applicable) and include finance cost on borrowed funds attributable to acquisition of qualifying fixed assets for the period up to the date when the asset is ready for its intended use, and adjustments arising from foreign exchange differences arising on foreign currency borrowings to the extent they are regarded as an adjustment to interest costs. Other incidental expenditure attributable to bringing the fixed assets to their working condition for intended use are capitalised. Subsequent expenditure relating to fixed assets is capitalised only if such expenditure results in an increase in the future benefits from such asset beyond its previously assessed standard of performance. Depreciation is recognised so as to write off the cost or valuation of assets (other than freehold land and
188

properties under construction) less their residual values over their useful lives, using the straight-line method. The estimated useful lives, residual values and depreciation method are reviewed at the end of each reporting period, with the effect of any changes in estimate accounted for on a prospective basis.
The management believes that these estimated useful lives are realistic and reflect fair approximation of the period over which the assets are likely to be used.
Assets held under finance leases are depreciated over their expected useful lives on the same basis as owned assets. However, when there is no reasonable certainty that ownership will be obtained by the end of the lease term, assets are depreciated over the shorter of the lease term and their useful lives.
The estimated average useful life considered for the assets are as under.
Category of assets No. of years
Building 5 - 60Plant and machinery 5 - 25Moulds 4 - 8Material handling equipment 4 - 15Computer hardware 3 - 5Motor vehicles 4 - 10Furniture and fixtures 4 - 10Office equipment 4 - 10
Leasehold land / Improvements thereon are amortised over the primary period of lease.
An item of property, plant and equipment is derecognised upon disposal or when no future economic benefits are expected to arise from the continued use of the asset. Any gain or loss arising on the disposal or retirement of an item of property, plant and equipment is determined as the difference between the sales proceeds and the carrying amount of the asset and is recognised in profit or loss.
3.9 Intangible assets Intangible assets with finite useful lives are carried at cost
less accumulated amortisation and impairment losses, if any. Intangible assets with indefinite useful lives that are acquired separately are carried at cost less accumulated impairment losses. The cost of an intangible asset comprises its purchase price, including any import duties and other taxes (other than those subsequently recoverable from the tax authorities), and any directly attributable expenditure on making the asset ready for its intended use and net of any trade discounts and rebates. Subsequent expenditure on an intangible asset after its purchase / completion is recognised as an expense when incurred unless it is probable that such expenditure will enable the asset to generate future economic benefits in excess of its originally assessed standards of performance and such expenditure can be measured and attributed to the asset reliably, in which case such expenditure is added to the cost of the asset.
The intangible assets are amortised over their respective individual estimated useful lives on a straight-line basis, commencing from the date the asset is available to the group for its use. The amortisation period are reviewed at the end of each financial year and the amortisation method is revised to reflect the changed pattern.
a) Derecognition of intangible assets An intangible asset is derecognised upon disposal or when
no future economic benefits are expected to arise from the continued use of the asset. Gains or losses arising from derecognition of an intangible asset, measured as the difference between the net disposal proceeds and the carrying amount of the asset, are recognised in profit or loss when the asset is derecognised.
b) Research and development expenses Internally generated intangible assets - Expenditure on
research activities is recognised as an expense in the period in which it is incurred.
An internally generated intangible asset arising from development (or from the development phase of an internal project) is recognised if, and only if, all of the following have been demonstrated:
> the technical feasibility of completing the intangible asset so that it will be available for use or sale
> the intention to complete the intangible asset and use or sell it;
> the ability to use or sell the intangible asset;
> how the intangible asset will generate probable future economic benefits;
> the availability of adequate technical, financial and other resources to complete the development and to use or sell the intangible asset; and
> the ability to measure reliably the expenditure attributable to the intangible asset during its development.
The amount initially recognised for internally-generated intangible assets is the sum of the expenditure incurred from the date when the intangible asset first meets the recognition criteria listed above. Where no internally-generated intangible asset can be recognised, development expenditure is recognised in profit or loss in the period in which it is incurred.
Subsequent to initial recognition, internally-generated intangible assets are reported at cost less accumulated amortisation and accumulated impairment losses, on the same basis as intangible assets that are acquired separately.
Development costs of products are also charged to the consolidated statement of profit and loss unless a product’s technological feasibility has been established, in which case such expenditure is capitalised. The amount capitalised comprises expenditure that can be directly attributed or allocated on a reasonable and consistent basis to creating, producing and making the asset ready for its intended use. Property, Plant and Equipment utilised for research and development are capitalised and depreciated in accordance with the policies stated for Property, Plant and Equipment.
The estimated average useful life considered for the major intangible assets are as under.
Category of assets No. of years
Computer software 3 - 6Capitalised development 6
189Apollo Tyres Ltd Annual Report 2017-18
Corporate Overview / Statutory Reports / Financial Statements

c) Intangible assets acquired in a business combination Intangible assets acquired in a business combination
and recognised separately from goodwill are initially recognised at their fair value at the acquisition date (which is regarded as their cost).
Subsequent to initial recognition, intangible assets acquired in a business combination are reported at cost less accumulated amortisation and accumulated impairment losses, on the same basis as intangible assets that are acquired separately.
3.10 Revenue recognition Revenue is measured at the fair value of the consideration
received or receivable. Revenue is reduced for customer returns, taxes on sales, estimated rebates and other similar allowances.
Revenue from sale of goods is recognised when the following conditions are satisfied:
> the Group has transferred the significant risks and rewards of ownership of the goods to the buyer which generally coincides with the delivery of goods;
> the Group retains neither continuing managerial involvement to the degree usually associated with ownership nor effective control over goods sold;
> the amount of revenue can be measured reliably;
> it is probable that the economic benefits associated with the transaction will flow to the Group;
> the costs incurred or to be incurred in respect of the transaction can be measured reliably.
Revenue from services is recognised when it is probable that the economic benefits associated with the transactions will flow to the group and related services have been rendered.
3.11 Other income Dividend income from investments is recognised when the right
to receive payment has been established (provided that it is probable that the economic benefits will flow to the Group and the amount of income can be measured reliably).
Interest income from a financial asset is recognised when it is probable that the economic benefits will flow to the group and the amount of income can be measured reliably. Interest income is accrued on a time basis, by reference to the principle outstanding and at the effective interest rate applicable, which is the rate that exactly discounts estimated future cash receipts through the expected life of the financial asset to that asset’s net carrying amount on initial recognition.
3.12 Employee benefits Employee benefits include wages and salaries, provident
fund, superannuation fund, employee state insurance scheme, gratuity fund, compensated absences, social security cost and other pension costs incurred by the group.
Defined contribution plans Contributions to defined contribution plans are recognised as
an expense when employees have rendered service entitling them to the contributions.
Defined benefit plans For defined benefit plans, the cost of providing benefits is
determined using the projected unit credit method, with actuarial valuations being carried out at the end of each annual reporting period. Re-measurement, comprising actuarial gains and losses, the effect of the changes to the asset ceiling (if applicable) and the return on plan assets (excluding net interest), is reflected immediately in the consolidated balance sheet with a charge or credit recognised in other comprehensive income in the period in which they occur. The re-measurements of the net defined benefit liability are recognised directly in the other comprehensive income in the period in which they arise. Past service cost is recognised in profit or loss in the period of a plan amendment. Net interest is calculated by applying the discount rate at the beginning of the period to the net defined benefit liability or asset. Defined benefit costs are categorised as follows:
> service cost (including current service cost, past service cost, as well as gains and losses on curtailments and settlements);
> net interest expense or income; and
> re-measurement
The retirement benefit obligation recognised in the consolidated balance sheet represents the actual deficit or surplus in the Group’s defined benefit plans. Any surplus resulting from this calculation is limited to the present value of any economic benefits available in the form of refunds from the plans or reductions in future contributions to the plans.
Other short-term and long-term employee benefits Liabilities recognised in respect of short-term employee
benefits are measured at the undiscounted amount of the benefits expected to be paid in exchange for the related service.
Liabilities recognised in respect of other long-term employee benefits are measured at the present value of the estimated future cash outflows expected to be made by the Group in respect of services provided by employees up to the reporting date.
3.13 Government grants, subsidies and export incentives Government grants and subsidies are recognised when there
is reasonable assurance that the Group will comply with the conditions attached to them and the grants / subsidy will be received.
Government grants whose primary condition is that the Group should purchase, construct or otherwise acquire non-current assets are recognised as deferred revenue in the consolidated balance sheet and transferred to profit or loss as and when the related obligations are met.
Revenue grant is recognised as an income in the period in which related obligation is met.
Export Incentives earned in the year of exports are treated as income and netted off from cost of raw material imported.
3.14 Foreign currency transaction and translations Foreign currency transactions are recorded at rates of exchange
prevailing on the date of transaction. Monetary assets and liabilities denominated in foreign currencies as at the balance
190

sheet date are translated at the rate of exchange prevailing at the year-end. Non-monetary items carried at fair value that are denominated in foreign currencies are retranslated at the rates prevailing at the date when the fair value was determined. Non-monetary items that are measured in terms of historical cost in a foreign currency are not retranslated.
Exchange differences on monetary items are recognised in profit or loss in the period in which they arise except for:
> exchange differences on foreign currency borrowings relating to assets under construction for future productive use, which are included in the cost of those assets when they are regarded as an adjustment to interest costs on those foreign currency borrowings;
> exchange differences on transactions entered into in order to hedge certain foreign currency risks; and
> exchange differences on monetary items receivable from or payable to a foreign operation for which settlement is neither planned nor likely to occur (therefore forming part of the net investment in the foreign operation), which are recognised initially in other comprehensive income and reclassified from equity to profit or loss on repayment of the monetary items.
For the purposes of presenting consolidated financial statements, the assets and liabilities of the Group’s foreign operations (including goodwill and fair value adjustments to identifiable assets acquired and liabilities assumed through acquisition of a foreign operation) are translated into Indian Rupees using exchange rates prevailing at the end of each reporting period. Income and expense items are translated at the average exchange rates for the period, unless exchange rates fluctuate significantly during that period, in which case the exchange rates at the dates of the transactions are used. Exchange differences arising on translation, if any, are recognised in other comprehensive income and accumulated in equity.
On the disposal of a foreign operation (i.e. a disposal of the Group’s entire interest in a foreign operation, a disposal involving loss of control over a subsidiary that includes a foreign operation, or a partial disposal of an interest in a joint arrangement or an associate that includes a foreign operation of which the retained interest becomes a financial asset), all of the exchange differences accumulated in equity in respect of that operation are reclassified to profit or loss.
In addition, in relation to a partial disposal of subsidiary that includes a foreign operation that does not result in the group losing control over the subsidiary, the proportionate share of accumulated exchange differences are re-attributed to the non controlling interests and are not recognised in the profit or loss. For all other partial disposals (i.e partial disposals of associates or joint arrangements that do not result in the group losing significant influence or joint control), the proportionate share of the accumulated exchange differences is reclassified to profit or loss.
Goodwill and fair value adjustments to the identifiable assets acquired and liabilities assumed through acquisition of a foreign operation are treated as assets and liabilities of the foreign operation and translated at the rate of exchange prevailing at the end of each reporting period. Exchange differences arising are recognised in other comprehensive income.
3.15 Employee share based payments Stock appreciation rights (Phantom stock units) are granted
to employees under the Cash-settled Employee Share-based Payment Plan (Phantom Stock Plan).
For cash-settled share-based payments, a liability is recognised for the goods or services acquired, measured initially at the fair value of the liability. At the end of each reporting period until the liability is settled, and at the date of settlement, the fair value of the liability is remeasured, with any changes in fair value recognised in profit or loss for the year.
3.16 Borrowing costs Borrowing costs directly attributable to the acquisition,
construction or production of qualifying assets, which are assets that necessarily take a substantial period of time to get ready for their intended use or sale, are added to the cost of those assets, until such time as the assets are substantially ready for their intended use or sale.
All other borrowing costs are recognised in consolidated statement of profit and loss in the period in which they are incurred.
3.17 Leases Leases are classified as finance leases whenever the terms
of the lease transfer substantially all the risks and rewards of ownership to the lessee. All other leases are classified as operating leases.
The Group as a lessee Finance lease: Assets held under finance leases are initially recognised as
assets of the Group at their fair value at the inception of the lease or, if lower, at the present value of the minimum lease payments. The corresponding liability to the lessor is included in the consolidated balance sheet as a finance lease obligation.
Lease payments are apportioned between finance expenses and reduction of the lease obligation so as to achieve a constant rate of interest on the remaining balance of the liability. Finance expenses are recognised immediately in profit or loss, unless they are directly attributable to qualifying assets, in which case they are capitalised in accordance with the Group’s general policy on borrowing costs. Contingent rentals are recognised as expenses in the periods in which they are incurred.
Operating lease: Operating lease payments are recognised as an expense on a
straight-line basis over the lease term, except where another systematic basis is more representative of the time pattern in which economic benefits from the leased asset are consumed or the payments to the lessor are structured to increase in line with expected general inflation to compensate for the lessor’s expected inflationary cost increases. Contingent rentals arising under operating leases are recognised as an expense in the period in which they are incurred.
In the event that lease incentives are received to enter into operating leases, such incentives are recognised as a liability. The aggregate benefit of incentives is recognised as a reduction of rental expense on a straight-line basis, except where another systematic basis is more representative of the time pattern in which economic benefits from the leased asset are consumed.
191Apollo Tyres Ltd Annual Report 2017-18
Corporate Overview / Statutory Reports / Financial Statements

3.18 Earnings per share Basic earnings per share is computed by dividing the
consolidated profit / (loss) after tax (including the post tax effect of extraordinary items, if any) by the weighted average number of equity shares outstanding during the year. Diluted earnings per share is computed by dividing the profit / (loss) after tax (including the post tax effect of extraordinary items, if any) as adjusted for dividend, interest and other charges to expense or income (net of any attributable taxes) relating to the dilutive potential equity shares, by the weighted average number of equity shares considered for deriving basic earnings per share and the weighted average number of equity shares which could have been issued on the conversion of all dilutive potential equity shares. Potential equity shares are deemed to be dilutive only if their conversion to equity shares would decrease the net profit per share from continuing ordinary operations. Potential dilutive equity shares are deemed to be converted as at the beginning of the period, unless they have been issued at a later date. The dilutive potential equity shares are adjusted for the proceeds receivable had the shares been actually issued at fair value (i.e. average market value of the outstanding shares). Dilutive potential equity shares are determined independently for each period presented. The number of equity shares and potentially dilutive equity shares are adjusted for share splits / reverse share splits and bonus shares, as appropriate.
3.19 Impairment of tangible and intangible assets other than goodwill
At the end of each reporting period, the Group reviews the carrying amounts of its tangible and intangible assets or cash generating units to determine whether there is any indication that those assets have suffered an impairment loss. If any such indication exists, the recoverable amount of the asset is estimated in order to determine the extent of the impairment loss (if any). When it is not possible to estimate the recoverable amount of an individual asset, the Group estimates the recoverable amount of the cash-generating unit to which the asset belongs. When a reasonable and consistent basis of allocation can be identified, corporate assets are also allocated to individual cash-generating units, or otherwise they are allocated to the smallest group of cash-generating units for which a reasonable and consistent allocation basis can be identified.
Intangible assets with indefinite useful lives and intangible assets not yet available for use are tested for impairment at least annually, or whenever there is an indication that the asset may be impaired.
Recoverable amount is the higher of fair value less costs of disposal and value in use. In assessing value in use, the estimated future cash flows are discounted to their present value using a pre-tax discount rate that reflects current market assessments of the time value of money and the risks specific to the asset for which the estimates of future cash flows have not been adjusted.
If the recoverable amount of an asset (or cash-generating unit) is estimated to be less than its carrying amount, the carrying amount of the asset (or cash-generating unit) is reduced to its recoverable amount. An impairment loss is recognised immediately in profit or loss, unless the relevant asset is carried at a revalued amount, in which case the impairment loss is treated as a revaluation decrease.
When an impairment loss subsequently reverses, the carrying amount of the asset (or a cash-generating unit) is increased
to the revised estimate of its recoverable amount, but so that the increased carrying amount does not exceed the carrying amount that would have been determined had no impairment loss been recognised for the asset (or cash-generating unit) in prior years. A reversal of an impairment loss is recognised immediately in profit or loss, unless the relevant asset is carried at a revalued amount, in which case the reversal of the impairment loss is treated as a revaluation increase.
3.20 Provisions and contingencies A provision is recognised when the Group has a present
obligation (legal / constructive) as a result of past events and it is probable that an outflow of resources will be required to settle the obligation, in respect of which a reliable estimate can be made.
The amount recognised as a provision is the best estimate of the consideration required to settle the present obligation at the end of the reporting period, taking into account the risks and uncertainties surrounding the obligation. When a provision is measured using the cash flows estimated to settle the present obligation, its carrying amount is the present value of those cash flows (when the effect of the time value of money is material).
Contingent liability is disclosed for (i) Possible obligation which will be confirmed only by future events not wholly within the control of the Group or (ii) Present obligations arising from past events where it is not probable that an outflow of resources will be required to settle the obligation or a reliable estimate of the amount of the obligation cannot be made. When some or all of the economic benefits required to settle a provision are expected to be recovered from a third party, a receivable is recognised as an asset if it is virtually certain that reimbursement will be received and the amount of the receivable can be measured reliably.
Provisions for the expected cost of sales related obligations are recognised at the date of sale of the relevant products, at the management’s best estimate of the expenditure required to settle the group’s obligation.
3.21 Financial instruments Financial assets and financial liabilities are recognised when
an entity becomes a party to the contractual provisions of the instruments.
Financial assets and financial liabilities are initially measured at fair value. Transaction costs that are directly attributable to the acquisition or issue of financial assets and financial liabilities (other than financial assets and financial liabilities at fair value through profit or loss) are added to or deducted from the fair value of the financial assets or financial liabilities, as appropriate, on initial recognition. Transaction costs directly attributable to the acquisition of financial assets or financial liabilities at fair value through profit or loss are recognised immediately in profit or loss.
3.22 Financial assets All regular way purchases or sales of financial assets are
recognised and derecognised on a trade date basis. Regular way purchases or sales are purchases or sales of financial assets that require delivery of assets within the time frame established by regulation or convention in the marketplace.
All recognised financial assets are subsequently measured in their entirety at either amortised cost or fair value, depending on the classification of the financial assets.
192

3.22.1 Classification of financial asset a. Loans and receivable Financial assets that meet the following conditions are
subsequently measured at amortised cost less impairment loss (except for investments that are designated as at fair value through profit or loss (FVTPL) on initial recognition):
> the asset is held within a business model whose objective is to hold assets in order to collect contractual cash flows; and
> the contractual terms of the instrument give rise on specified dates to cash flows that are solely payments of principal and interest on the principal amount outstanding.
The effective interest method is a method of calculating the amortised cost of a debt instrument and of allocating interest income over the relevant period. The effective interest rate is the rate that exactly discounts estimated future cash receipts (including all fees and points paid or received that form an integral part of the effective interest rate, transaction costs and other premiums or discounts) through the expected life of the debt instrument, or, where appropriate, a shorter period, to the net carrying amount on initial recognition.
Income is recognised on an effective interest basis for debt instruments other than those financial assets classified as at FVTPL. Interest income is recognised in profit or loss and is included in the ‘Other Income’ line item.
b. Assets available for sale Financial assets that meet the following conditions
are subsequently measured at fair value through other comprehensive income (FVTOCI) (except for investments that are designated as at FVTPL on initial recognition):
> the asset is held within a business model whose objective is achieved both by collecting contractual cash flows and selling financial assets; and
> the contractual terms of the instrument give rise on specified dates to cash flows that are solely payments of principal and interest on the principal amount outstanding.
All other financial assets are subsequently measured at fair value.
c. Assets held for trading A financial asset is held for trading if:
> it has been acquired principally for the purpose of selling it in the near term; or
> on initial recognition it is part of a portfolio of identified financial instruments that the Group manages together and has a recent actual pattern of short-term profit-taking; or
> it is a derivative that is not designated and effective as a hedging instrument or a financial guarantee.
Dividends on these investments in equity instruments are recognised in profit or loss when the Group’s right to
receive the dividends is established, it is probable that the economic benefits associated with the dividend will flow to the entity, the dividend does not represent a recovery of part of cost of the investment and the amount of dividend can be measured reliably.
d. Financial assets at fair value through profit or loss (‘FVTPL’)
Investments in equity instruments are classified as at FVTPL, unless the Group irrevocably elects on initial recognition to present subsequent changes in fair value in other comprehensive income for equity instruments which are not held for trading.
Debt instrument that do not meet the amortised cost criteria or fair value through other comprehensive income criteria (see above) are measured at FVTPL. In addition, debt instruments that meet the amortised cost criteria or the fair value through other comprehensive income criteria but are designated as at FVTPL are measured at FVTPL.
A financial asset may be designated as at FVTPL upon initial recognition if such designation eliminates or significantly reduces a measurement or recognition inconsistency that would arise from measuring assets or liabilities or recognising the gains and losses on them on different bases.
Financial assets at FVTPL are measured at fair value at the end of each reporting period, with any gains or losses arising on re-measurement recognised in profit or loss. The net gain or loss recognised in profit or loss is included in the other income line item. Dividend on financial assets at FVTPL is recognised when the group’s right to receive the dividends is established, it is probable that the economic benefits associated with the dividend will flow to the entity, the dividend does not represent a recovery of part of cost of the investment and the amount of dividend can be measured reliably.
3.22.2 Impairment of financial assets The Group applies the expected credit loss model for
recognising impairment loss on financial assets measured at amortised cost, debt instruments at FVTOCI, lease receivables, trade receivables, other contractual rights to receive cash or other financial assets, and financial guarantees not designated as at FVTPL.
Expected credit losses are the weighted average of credit losses with the respective risks of default occurring as the weights. Credit loss is the difference between all contractual cash flows that are due to the Group in accordance with the contract and all the cash flows that the group expects to receive (i.e., all cash shortfalls), discounted at the original effective interest rate (or credit-adjusted effective interest rate for purchased or originated credit-impaired financial assets). The group estimates cash flows by considering all contractual terms of the financial instrument (for example, prepayment, extension, call and similar options) through the expected life of that financial instruments.
The Group measures the loss allowance for a financial instrument at an amount equal to the lifetime expected credit losses if the credit risk on that financial instrument has increased significantly since initial recognition. If the
193Apollo Tyres Ltd Annual Report 2017-18
Corporate Overview / Statutory Reports / Financial Statements

credit risk on a financial instrument has not increased significantly since initial recognition, the Group measures the loss allowance for that financial instrument at an amount equal to 12-month expected credit losses. 12-month expected credit losses are portion of the life-time expected credit losses and represent the lifetime cash shortfalls that will result if default occurs within the 12 months after the reporting date and thus, are not cash shortfalls that are predicted over the next 12 months.
If the group measured loss allowance for a financial instrument at lifetime expected credit loss model in the previous period, but determines at the end of a reporting period that the credit risk has not increased significantly since initial recognition due to improvement in credit quality as compared to the previous period, the Group again measures the loss allowance based on 12- month expected credit losses.
When making the assessment of whether there has been a significant increase in credit risk since initial recognition, the Group uses the change in the risk of a default occurring over the expected life of the financial instrument. To make that assessment, the Group compares the risk of a default occurring on the financial instrument as at the reporting date with the risk of a default occurring on the financial instrument as at the date of initial recognition and considers reasonable and supportable information, that is available without undue cost or effort, that is indicative of significant increases in credit risk since initial recognition.
For trade receivables or any contractual right to receive cash or another financial asset that result from transactions that are within the scope of IND AS 11 Construction Contracts and IND AS 18 Revenue, the Group always measures the loss allowance at an amount equal to lifetime expected credit losses.
3.22.3 De-recognition of financial assets The Group derecognises a financial asset when the
contractual rights to the cash flows from the asset expire, or when it transfers the financial asset and substantially all the risks and rewards of ownership of the asset to another party. If the Group neither transfers nor retains substantially all the risks and rewards of ownership and continues to control the transferred asset, the Group recognises its retained interest in the asset and an associated liability for amounts it may have to pay. If the Group retains substantially all the risks and rewards of ownership of a transferred financial asset, the Group continues to recognise the financial asset and also recognises a collateralised borrowing for the proceeds received.
On de-recognition of a financial asset in its entirety, the difference between the asset’s carrying amount and the sum of the consideration received and receivable and the cumulative gain or loss that had been recognised in other comprehensive income and accumulated in equity is recognised in profit or loss if such gain or loss would have otherwise been recognised in profit or loss on disposal of that financial asset.
On de-recognition of a financial asset other than in its entirety (e.g. when the Group retains an option to repurchase part of a transferred asset), the Group allocates the previous carrying amount of the financial asset between the part it continues to recognise under
continuing involvement, and the part it no longer recognises on the basis of the relative fair values of those parts on the date of the transfer. The difference between the carrying amount allocated to the part that is no longer recognised and the sum of the consideration received for the part no longer recognised and any cumulative gain or loss allocated to it that had been recognised in other comprehensive income is recognised in profit or loss if such gain or loss would have otherwise been recognised in profit or loss on disposal of that financial asset. A cumulative gain or loss that had been recognised in other comprehensive income is allocated between the part that continues to be recognised and the part that is no longer recognised on the basis of the relative fair values of those parts.
3.22.4 Foreign exchange gains and losses The fair value of financial assets denominated in a foreign
currency is determined in that foreign currency and translated at the spot rate at the end of each reporting period.
For foreign currency denominated financial assets measured at amortised cost and FVTPL, the exchange differences are recognised in profit or loss except for those which are designated as hedging instruments in hedging relationship.
3.23 Financial liabilities and equity instruments 3.23.1 Classification as debt or equity Debt and equity instruments issued by the Group are
classified as either financial liabilities or as equity in accordance with the substance of the contractual arrangements and the definitions of a financial liability and an equity instrument.
3.23.2 Equity instruments An equity instrument is any contract that evidences a
residual interest in the assets of an entity after deducting all of its liabilities. Equity instruments issued by the Group are recognised at the proceeds received, net of direct issue costs.
3.23.3 Financial liabilities All financial liabilities are subsequently measured at
amortised cost using the effective interest method or at FVTPL. However, financial liabilities that arise when a transfer of a financial asset does not qualify for derecognition or when the continuing involvement approach applies, financial guarantee contracts issued by the Group, are measured in accordance with the specific accounting policies set out below:
3.23.3.1 Financial liabilities at FVTPL Financial liabilities are classified as at FVTPL when the
financial liability is either held for trading or it is designated as at FVTPL.
A financial liability is classified as held for trading if:
> it has been incurred principally for the purpose of repurchasing it in the near term; or
> on initial recognition it is part of a portfolio of identified financial instruments that the Group manages together and has a recent actual pattern of short-term profit-taking; or
194

> it is a derivative that is not designated and effective as a hedging instrument.
A financial liability other than a financial liability held for trading may be designated as at FVTPL upon initial recognition if:
> such designation eliminates or significantly reduces a measurement or recognition inconsistency that would otherwise arise; or
> the financial liability forms part of a group of financial assets or financial liabilities or both, which is managed and its performance is evaluated on a fair value basis, in accordance with the Group’s documented risk management or investment strategy, and information about the grouping is provided internally on that basis; or
> it forms part of a contract containing one or more embedded derivatives, and Ind AS 109 Financial Instruments permits the entire combined contract to be designated as at FVTPL in accordance with Ind AS 109 Financial Instruments.
Financial liabilities at FVTPL are stated at fair value, with any gains or losses arising on remeasurement recognised in profit or loss.
3.23.3.2 Financial liabilities subsequently measured at amortised cost Financial liabilities that are not held-for-trading and are not
designated as at FVTPL are measured at amortised cost at the end of subsequent accounting periods. The carrying amounts of financial liabilities that are subsequently measured at amortised cost are determined based on the effective interest method. Interest expense that is not capitalised as part of costs of an asset is included in the finance costs line item.
The effective interest method is a method of calculating the amortised cost of a financial liability and of allocating interest expense over the relevant period. The effective interest rate is the rate that exactly discounts estimated future cash payments (including all fees and points paid or received that form an integral part of the effective interest rate, transaction costs and other premiums or discounts) through the expected life of the financial liability, or (where appropriate) a shorter period, to the net carrying amount on initial recognition.
3.23.3.3 Financial guarantee contracts A financial guarantee contract is a contract that requires the
issuer to make specified payments to reimburse the holder for a loss it incurs because a specified debtor fails to make payments when due in accordance with the terms of a debt instrument.
Financial guarantee contracts issued by the Group are initially measured at their fair values and, if not designated as at FVTPL, are subsequently measured at:
> the amount of loss allowance determined in accordance with impairment requirements of Ind AS 109 Financial Instruments; and
> the amount initially recognised less, where appropriate, cumulative amortisation recognised in accordance with the revenue recognition policies of Ind AS 18 Revenue.
For financial liabilities that are denominated in a foreign currency and are measured at amortised cost at the end of each reporting period, the foreign exchange gains and losses are determined based on the amortised cost of the instruments and are recognised in the Other income.
The fair value of financial liabilities denominated in a foreign currency is determined in that foreign currency and translated at the spot rate at the end of the reporting period. For financial liabilities that are measured as at FVTPL, the foreign exchange component forms part of the fair value gains or losses and is recognised in profit or loss.
3.23.3.4 Derecognition of financial liabilities The Group derecognises financial liabilities when, and only
when, the Group’s obligations are discharged, cancelled or they expire. The difference between the carrying amount of the financial liability derecognised and the consideration paid and payable is recognised in profit or loss.
3.24 Derivative financial instruments The Group enters into a variety of derivative financial
instruments to manage its exposure to interest rate and foreign exchange rate risks, including foreign exchange forward contracts, options and cross currency swaps.
Derivatives are initially recognised at fair value at the date the derivative contracts are entered into and are subsequently remeasured to their fair value at the end of each reporting period. The resulting gain or loss is recognised in profit or loss immediately unless the derivative is designated and effective as a hedging instrument, in which event the timing of the recognition in profit or loss depends on the nature of the hedging relationship and the nature of the hedged item.
3.25 Hedge accounting The Group designates certain hedging instruments, which
include derivatives, embedded derivatives and non-derivatives in respect of foreign currency risk, as either fair value hedges, cash flow hedges, or hedges of net investments in foreign operations. Hedges of foreign exchange risk on firm commitments are accounted for as cash flow hedges.
At the inception of the hedge relationship, the entity documents the relationship between the hedging instrument and the hedged item, along with its risk management objectives and its strategy for undertaking various hedge transactions. Furthermore, at the inception of the hedge and on an ongoing basis, the Group documents whether the hedging instrument is highly effective in offsetting changes in fair values or cash flows of the hedged item attributable to the hedged risk.
Cash flow hedges The effective portion of changes in the fair value of derivatives
that are designated and qualify as cash flow hedges is recognised in other comprehensive income and accumulated under the heading of cash flow hedging reserve. The gain or loss relating to the ineffective portion is recognised immediately in profit or loss, and is included in the ‘Other income’/’Other expense’ line item. Amounts previously recognised in other comprehensive income and accumulated in equity relating to (effective portion as described above) are reclassified to profit or loss in the periods when the hedged item affects profit or loss, in the same line as the recognised hedged item. However, when the hedged forecast transaction results in the recognition of a non-financial asset or a non-financial liability, such gains and losses are transferred from equity (but not as a reclassification
195Apollo Tyres Ltd Annual Report 2017-18
Corporate Overview / Statutory Reports / Financial Statements

adjustment) and included in the initial measurement of the cost of the non -financial asset or non-financial liability.
In cases where the designated hedging instruments are options and forward contracts, the Group has an option, for each designation, to designate on an instrument only the changes in intrinsic value of the options and spot element of forward contracts respectively as hedges. In such cases, the time value of the options is accounted based on the type of hedged item which those options hedge.
In case of transaction related hedged item in the above cases, the change in time value of the options is recognised in other comprehensive income to the extent it relates to the hedged item and accumulated in a separate component of equity i.e. Reserve for time value of options and forward elements of forward contracts in hedging relationship. This separate component is removed and directly included in the initial cost or other carrying amount of the asset or the liability (i.e. not as a reclassification adjustment thus not affecting other comprehensive income) if the hedged item subsequently results in recognition of a non-financial asset or a non-financial liability. In other cases, the amount accumulated is reclassified to profit or loss as a reclassification adjustment in the same period in which the hedged expected future cash flows affect profit or loss.
In case of time-period related hedged item in the above cases, the change in time value of the options is recognised in other comprehensive income to the extent it relates to the hedged item and accumulated in a separate component of equity i.e. Reserve for time value of options and forward elements of forward contracts in hedging relationship. The time value of options at the date of designation of the options in the hedging relationships is amortised on a systematic and rational basis over the period during which the options’ intrinsic value could affect profit or loss. This is done as a reclassification adjustment and hence affects other comprehensive income.
In cases where only the spot element of the forward contracts is designated in a hedging relationship and the forward element of the forward contract is not designated, the Group makes the choice for each designation whether to recognise the changes in forward element of fair value of the forward contracts in profit or loss or to account for this element similar to the time value of an option.
Hedge accounting is discontinued when the hedging instrument expires or is sold, terminated, or exercised, or when it no longer qualifies for hedge accounting. Any gain or loss recognised in other comprehensive income and accumulated in equity at that time remains in equity and is recognised when the forecast transaction is ultimately recognised in profit or loss. When a forecast transaction is no longer expected to occur, the gain or loss accumulated in equity is recognised immediately in profit or loss.
3.26 Goodwill Goodwill arising on an acquisition of a business is carried at
cost as established at the date of acquisition of the business less accumulated impairment losses, if any. For the purposes of
impairment testing, goodwill is allocated to each of the Group’s cash –generating units (or groups of cash-generating units). A cash-generating unit to which goodwill has been allocated is tested for impairment annually, or more frequently when there is an indication that the unit may be impaired. If the recoverable amount of the cash-generating unit is less than its carrying amount, the impairment loss is allocated first to reduce the carrying amount of any goodwill allocated to the unit and then to the other assets of the unit pro rata based on the carrying amount of each asset in the unit. Any impairment loss for goodwill is recognised directly in profit or loss. An impairment loss recognised for goodwill is not reversed in subsequent periods. On disposal of the relevant cash-generating unit, the attributable amount of goodwill is included in the determination of the profit or loss on disposal.
3.27 Cash and cash equivalents Cash comprises cash on hand and demand deposits with banks.
Cash equivalents are short-term balances (with an original maturity of three months or less from the date of acquisition), highly liquid investments that are readily convertible into known amounts of cash and which are subject to insignificant risk of changes in value.
For the purpose of the statement of cash flows, cash and cash equivalents consist of cash and short-term balances, as defined above, net of outstanding cash credits as they are considered an integral part of the Groups’s cash management.
3.28 Rounding off amounts All amounts disclosed in the consolidated financial statements
and notes have been rounded off to the nearest millions as per the requirements of Schedule III of the Act unless otherwise stated.
4. CRITICAL ACCOUNTING JUDGEMENTS AND KEY SOURCES OF ESTIMATION UNCERTAINTY
The preparation of financial statements in conformity with Ind AS requires management to make certain judgments and estimates that may effect the application of accounting policies, reported amounts and related disclosures.
These judgments and estimates may have an impact on the assets and liabilities, disclosure of contingent liabilities at the date of the financial statements, and income and expense items for the period under review. Actual results may differ from these judgments and estimates.
All assumptions, expectations and forecasts that are used as a basis for judgments and estimates in the consolidated financial statements represent as accurately an outlook as possible for the group. These judgments and estimates only represent our interpretation of the Group as of the dates on which they were prepared.
Important judgments and estimates relate largely to provisions, pensions, tangible and intangible assets (lives, residual values and impairment), deferred tax assets and liabilities and valuation of financial instruments.
196

B1
PR
OP
ER
TY,
PL
AN
T A
ND
EQ
UIP
ME
NT
AN
D O
TH
ER
IN
TAN
GIB
LE
AS
SE
TS
AS
ON
MA
RC
H 3
1, 2
018
forming part of the Consolidated Financial StatementsB. Notes
` in
Mill
ion
Des
crip
tion
of a
sset
s
Gro
ss B
lock
Acc
umul
ated
Dep
reci
atio
n /
Am
orti
sati
onN
et B
lock
As
on M
arch
31
, 20
17A
ddit
ions
(c)
Dis
posa
lsE
ffec
t of f
orei
gn
curr
ency
tr
ansl
atio
n (e
)
As
on M
arch
31
, 20
18 A
s on
Mar
ch
31, 2
017
Dep
reci
atio
n / a
mor
tisa
tion
ex
pens
e
Elim
inat
ed o
n di
spos
al o
f as
sets
Eff
ect o
f for
eign
cu
rren
cy
tran
slat
ion
(e)
As
on M
arch
31
, 20
18A
s on
Mar
ch
31, 2
018
As
on M
arch
31
, 20
17
A.
Pro
pert
y, p
lant
and
eq
uipm
ent -
ow
ned
unle
ss o
ther
wis
e st
ated
Land
:Fr
eeho
ld la
nd
2,1
89.9
4 1
16.8
4 3
.14
30
5.48
2
,60
9.12
-
-
-
-
-
2
,60
9.12
2
,189
.94
Leas
ehol
d la
nd*
189
.64
-
-
-
189
.64
18.
39
2.1
2 -
-
2
0.5
1 1
69.1
3 1
71.2
5 (a
) B
uild
ings
14,
578.
06
8,6
54.2
6 6
1.44
1
,010
.61
24,
181.
49
4,6
85.7
9 5
14.0
4 1
8.75
3
66.7
7 5
,547
.85
18,
633.
64
9,8
92.2
7 (b
) (d
) P
lant
and
equ
ipm
ent*
* 9
2,39
2.48
2
5,34
8.17
8
90.6
3 6
,748
.26
123
,598
.28
46,
933.
58
4,2
11.1
5 6
33.7
6 4
,533
.08
55,
044
.05
68,
554.
23
45,
458.
90
(b)
Ele
ctri
cal i
nsta
llat
ions
1
,980
.55
2,0
07.
95
3.1
0
91.
10
4,0
76.5
0
967
.36
230
.06
2.8
5 1
.55
1,1
96.1
2 2
,880
.38
1,0
13.1
9 (b
) Fu
rnitu
re a
nd fi
xtur
es 2
,480
.63
455
.55
13.
47
146
.20
3
,068
.91
1,4
68.1
6 2
33.7
6 1
2.44
9
1.18
1
,780
.66
1,2
88.2
5 1
,012
.47
(b)
Vehi
cles
878
.44
215.
51 1
12.6
7 4
5.78
1
,027
.06
526
.78
10
7.23
8
3.16
4
1.72
5
92.5
7 4
34.4
9 3
51.6
6 (b
) O
ffice
equ
ipm
ent
888
.04
516
.89
87.
55
115
.31
1,4
32.6
9 5
96.0
7 1
15.9
0
83.
85
86.
97
715
.09
717
.60
2
91.9
7 (b
) To
tal t
angi
ble
asse
ts 1
15,5
77.7
8 3
7,31
5.17
1
,172
.00
8
,462
.74
1
60,1
83.6
9 5
5,19
6.13
5
,414
.26
834
.81
5,1
21.2
7 6
4,8
96.8
5 9
5,28
6.84
6
0,3
81.6
5 B
.O
ther
inta
ngib
le a
sset
sC
ompu
ter
soft
war
e 2
,840
.06
654
.36
-
394
.40
3
,888
.82
2,0
07.
70
288
.57
-
284
.55
2,5
80.8
2 1
,30
8.0
0
832
.36
(b)
Trad
emar
ks 1
,854
.47
0.1
5 -
2
96.6
4 2
,151
.26
41.
11
0.0
8 -
3
.85
45.
04
2,1
06.
22
1,8
13.3
6 C
apita
lised
dev
elop
men
t 3
,937
.93
987
.05
-
699
.82
5,6
24.8
0
2,1
22.7
0
222
.63
-
357
.68
2,7
03.
01
2,9
21.7
9 1
,815
.23
(b)
Oth
er in
tang
ible
s 2
98.8
2 -
-
4
8.37
3
47.1
9 -
-
-
-
-
3
47.1
9 2
98.8
2 To
tal o
ther
inta
ngib
le
asse
ts 8
,931
.28
1,6
41.
56
-
1,4
39.2
3 1
2,0
12.0
7 4
,171
.51
511
.28
-
64
6.0
8 5
,328
.87
6,6
83.2
0
4,7
59.7
7 To
tal (
A +
B)
124
,509
.06
38,
956.
73
1,1
72.0
0
9,9
01.
97
172
,195
.76
59,
367.
64
5,9
25.5
4
834
.81
5,7
67.3
5 7
0,2
25.7
2 1
01,9
70.0
4 6
5,14
1.4
2
197Apollo Tyres Ltd Annual Report 2017-18
Corporate Overview / Statutory Reports / Financial Statements

PR
OP
ER
TY,
PL
AN
T A
ND
EQ
UIP
ME
NT
AN
D O
TH
ER
IN
TAN
GIB
LE
AS
SE
TS
AS
ON
MA
RC
H 3
1, 2
017
` in
Mill
ion
Des
crip
tion
of a
sset
s
Gro
ss B
lock
Acc
umul
ated
Dep
reci
atio
n /
Am
orti
sati
onN
et B
lock
As
on M
arch
31
, 20
16A
ddit
ions
(c)
Dis
posa
lsE
ffec
t of f
orei
gn
curr
ency
tr
ansl
atio
n (e
)
As
on M
arch
31
, 20
17 A
s on
Mar
ch
31, 2
016
Dep
reci
atio
n / a
mor
tisa
tion
ex
pens
e
Elim
inat
ed o
n di
spos
al o
f as
sets
Eff
ect o
f for
eign
cu
rren
cy
tran
slat
ion
(e)
As
on M
arch
31
, 20
17A
s on
Mar
ch
31, 2
017
As
on M
arch
31
, 20
16
A.
Pro
pert
y, p
lant
and
eq
uipm
ent -
ow
ned
unle
ss o
ther
wis
e st
ated
Land
:Fr
eeho
ld la
nd 2
,419
.24
-
-
(229
.30
) 2
,189
.94
-
-
-
-
-
2,1
89.9
4 2
,419
.24
Leas
ehol
d la
nd*
189
.64
-
-
-
189
.64
16.
27
2.1
2 -
-
1
8.39
1
71.2
5 1
73.3
7 (a
) B
uild
ings
12,
540
.46
2,4
06.
01
-
(368
.41)
14,
578.
06
4,5
11.9
1 3
57.4
2 -
(1
83.5
4) 4
,685
.79
9,8
92.2
7 8
,028
.55
(b)
(d)
Pla
nt a
nd e
quip
men
t**
79,
210
.58
16,
834.
79
50
0.8
7 (3
,152
.02)
92,
392.
48
46,
545.
57
3,3
17.0
1 4
41.7
5 (2
,487
.25)
46,
933.
58
45,
458.
90
32,
665.
01
(b)
Ele
ctri
cal i
nsta
llat
ions
1,5
45.8
0
435
.63
0.8
8 -
1
,980
.55
80
6.37
1
61.8
1 0
.82
-
967
.36
1,0
13.1
9 7
39.4
3 (b
) Fu
rnitu
re a
nd fi
xtur
es 2
,224
.47
358
.94
20
.82
(81.
96)
2,4
80.6
3 1
,345
.38
185
.16
20
.01
(42.
37)
1,4
68.1
6 1
,012
.47
879
.09
(b)
Vehi
cles
880
.02
154
.98
130
.81
(25.
75)
878
.44
50
1.77
1
26.3
6 7
8.11
(2
3.24
) 5
26.7
8 3
51.6
6 3
78.2
5 (b
) O
ffice
equ
ipm
ent
851
.38
10
5.28
0
.72
(67.
90)
888
.04
574
.83
70
.00
0
.71
(48.
05)
596
.07
291
.97
276
.55
(b)
Tota
l tan
gibl
e as
sets
99,
861.
59
20
,295
.63
654
.10
(3
,925
.34
) 1
15,5
77.7
8 5
4,3
02.
10
4,2
19.8
8 5
41.
40
(2
,784
.45)
55,
196.
13
60
,381
.65
45,
559.
49
B.
Oth
er in
tang
ible
ass
ets
Com
pute
r so
ftw
are
2,8
03.
29
239
.11
-
(20
2.34
) 2
,840
.06
1,9
25.5
5 2
08.
14
-
(125
.99)
2,0
07.
70
832
.36
877
.74
(b)
Trad
emar
ks 2
,018
.80
1
.76
-
(166
.09)
1,8
54.4
7 4
3.77
0
.07
-
(2.7
3) 4
1.11
1
,813
.36
1,9
75.0
3 C
apita
lised
dev
elop
men
t 3
,534
.58
739
.68
-
(336
.33)
3,9
37.9
3 2
,118
.74
190
.04
-
(186
.08)
2,1
22.7
0
1,8
15.2
3 1
,415
.84
(b)
Oth
er in
tang
ible
s 3
25.5
9 -
-
(2
6.77
) 2
98.8
2 -
-
-
-
-
2
98.8
2 3
25.5
9 To
tal o
ther
inta
ngib
le
asse
ts 8
,682
.26
980
.55
-
(731
.53)
8,9
31.2
8 4
,088
.06
398
.25
-
(314
.80
) 4
,171
.51
4,7
59.7
7 4
,594
.20
To
tal (
A +
B)
108
,543
.85
21,
276.
18
654
.10
(4
,656
.87)
124
,509
.06
58,
390
.16
4,6
18.1
3 5
41.
40
(3
,099
.25)
59,
367.
64
65,
141.
42
50
,153
.69
* Le
aseh
old
land
is n
et o
f ` 5
.39
Mill
ion
(` 5
.39
Mill
ion)
sub
leas
ed t
o C
lass
ic A
uto
Tube
s Lt
d., a
Com
pany
in w
hich
dir
ecto
rs a
re in
tere
sted
sin
ce t
he y
ear
ende
d 20
09-
10.
**
Pla
nt a
nd e
quip
men
t in
clud
e jo
intl
y ow
ned
asse
ts w
ith g
ross
boo
k va
lue
of `
311
.28
Mill
ion
(` 3
11.2
8 M
illio
n) a
nd n
et b
ook
valu
e of
` 2
50.6
9 M
illio
n (`
263
.22
Mill
ion)
whi
ch r
epre
sent
s 50
% o
wne
rshi
p in
the
ass
et.
P
lant
and
equ
ipm
ent
incl
ude
asse
ts t
aken
on
finan
ce le
ase
with
gro
ss b
ook
valu
e of
` 4
00
.00
Mill
ion
(` 4
00
.00
Mill
ion)
, and
net
boo
k va
lue
of `
183
.25
Mill
ion
(` 2
00
.04
Mill
ion)
.(a
) R
epre
sent
s pr
opor
tiona
te le
ase
prem
ium
` 2
.12
Mill
ion
(` 2
.12
Mill
ion)
am
ortis
ed.
(b)
Bui
ldin
gs in
clud
e `
13.3
3 M
illio
n (`
22.
66 M
illio
n), p
lant
and
equ
ipm
ent
incl
ude
` 16
4.2
3 M
illio
n (`
85.
76 M
illio
n), e
lect
rica
l ins
tall
atio
ns in
clud
e N
il (`
0.1
6 M
illio
n), f
urni
ture
and
fixt
ure
incl
ude
` 0
.01
Mill
ion
(` 7
.03
Mill
ion)
, of
fice
equi
pmen
t in
clud
e `
0.0
4 M
illio
n (`
1.4
6 M
illio
n), v
ehic
les
incl
ude
Nil
(` 0
.13
Mill
ion)
, com
pute
r so
ftw
are
incl
ude
` 12
9.70
Mill
ion
(` 1
2.0
5 M
illio
n) a
nd c
apita
lised
dev
elop
men
t in
clud
e `
987.
05
Mill
ion
(` 7
39.6
8 M
illio
n)
for
capi
tal e
xpen
ditu
re o
n re
sear
ch a
nd d
evel
opm
ent
(ref
er n
ote
C17
).(c
) In
clud
es d
irec
tly
attr
ibut
able
exp
ense
s ca
pita
lised
to
the
exte
nt o
f ` 3
,352
.87
Mill
ion
(` 1
69.2
2 M
illio
n) in
clud
ing
` 2,
742.
62 M
illio
n (N
il) c
apita
lised
from
cap
ital w
ork
in p
rogr
ess
(CW
IP) o
f pre
viou
s ye
ar a
nd b
orro
win
g co
st
capi
talis
ed t
o th
e ex
tent
of `
819
.31
Mill
ion
(` 2
33.1
1 M
illio
n) in
clud
ing
` 30
0.3
9 M
illio
n (N
il) c
apita
lised
from
CW
IP o
f pre
viou
s ye
ar.
(d)
Bui
ldin
gs in
clud
e bu
ildin
gs c
onst
ruct
ed o
n le
aseh
old
land
with
gro
ss b
ook
valu
e of
` 1
0,5
49.
38 M
illio
n (`
9,1
31.3
2 M
illio
n) a
nd n
et b
ook
valu
e of
` 8
,072
.96
Mill
ion
(` 6
,973
.92
Mill
ion)
(e)
Rep
rese
nts
exch
ange
rat
e ad
just
men
t ar
isin
g on
con
solid
atio
n of
fore
ign
subs
idia
ries
due
to
diff
eren
ce in
ope
ning
, ave
rage
and
clo
sing
con
vers
ion
rate
s.(f
) C
arry
ing
amou
nt o
f tan
gibl
e as
sets
are
ple
dged
as
secu
rity
for
liabi
litie
s (r
efer
not
e B
16(a
)).
(g)
Cap
ital w
ork-
in-p
rogr
ess
incl
udes
land
of `
11.
19 M
illio
n (`
11.
19 M
illio
n) a
cqui
red
by t
he C
ompa
ny a
nd is
in t
he p
roce
ss o
f get
ting
the
title
dee
ds t
rans
ferr
ed t
o its
nam
e.
198

FINANCIAL ASSETS (NON-CURRENT)
B2 INVESTMENT IN ASSOCIATES / JOINT VENTURE
` in Million
ParticularsAs on
March 31, 2018As on
March 31, 2017
(a) Investment in associates:1,667 (Nil) equity shares of ` 13,500 each in KT Telematic Solutions Private Limited - fully paid up 22.51 - 99 (99) equity shares of Rand 1 each in Pressurite (Pty) Limited, fully impaired - -
(b) Investment in joint venture:9,550 (9,550) units in Pan Aridus LLC, fully impaired - -
22.51 -
B3 OTHER INVESTMENTS
` in Million
ParticularsAs on
March 31, 2018As on
March 31, 2017
(At fair value through profit and loss)A Quoted investments *(a) Investment in equity instruments:
16,394 (16,394) equity shares of ` 10/- each in Bharat Gears Limited - fully paid up 2.76 1.90 (b) Investment in mutual funds:
Nil (209,965) units of ` 10/- each in "UTI Balanced Fund - Dividend Plan - Reinvestment" - 6.33 2.76 8.23
B Unquoted investments **Investment in equity instruments:312,000 (312,000) equity shares of ` 10 each in Green Infra Wind Power Projects Limited - fully paid up 3.12 3.12 1,389,000 (620,000) equity shares of ` 0.19 each in OPGS Power Gujarat Private Limited - fully paid up 0.26 0.12 399,100 (196,000) equity shares of ` 10 each in NSL Wind Power Company (Phoolwadi) Private Limited - fully paid up 3.99 1.96 Nil (12,500) equity shares of ` 10 each in Trishul Electric and Power Gen Limited - fully paid up - 0.13 Nil (3,032,875) equity shares of ` 10 each in Ind Barath Energies (Thoothukkudi) Limited - fully paid up - 3.43 6,000 (Nil) equity shares of ` 30 each in Suryadev Alloys and Power Private Limited - fully paid up 0.18 - 104,600 (Nil) equity shares of ` 11.50 each in OPG Power Generation Private Limited - fully paid up 1.20 - 5,000 (5,000) equity shares of ` 100/- each in Apollo Tyres Employees' Multipurpose Co-operative Society Limited - fully paid up 0.50 0.50
9.25 9.26Investments carried at fair value through profit and loss (A+B) 12.01 17.49
* Aggregate amount of quoted investments at cost 0.36 5.14Aggregate amount of quoted investments at market value 2.76 8.23
** Aggregate amount of unquoted investments at cost 9.25 9.26
B4 LOANS
` in Million
ParticularsAs on
March 31, 2018 As on
March 31, 2017
(Unsecured, considered good unless otherwise stated)Employee advances - salary loan 19.87 24.14
19.87 24.14
199Apollo Tyres Ltd Annual Report 2017-18
Corporate Overview / Statutory Reports / Financial Statements

B5 OTHER FINANCIAL ASSETS
` in Million
ParticularsAs on
March 31, 2018 As on
March 31, 2017
(Unsecured, considered good unless otherwise stated)Security deposits 311.53 253.81 Security deposits to related parties 455.24 353.98 Security deposits with statutory authorities 262.14 216.25 Derivative assets measured at fair value (refer note C15) 254.24 95.06 Others 137.23 149.78
1,420.38 1,068.88
NON-FINANCIAL ASSETS (NON-CURRENT)
B6 OTHER NON-CURRENT ASSETS
` in Million
ParticularsAs on
March 31, 2018 As on
March 31, 2017
(Unsecured, considered good unless otherwise stated)Capital advances 2,555.46 4,566.48 Capital advances to related parties (refer note C23) 73.89 106.45 Doubtful capital advances 24.93 24.93 Provision for doubtful advances (24.93) (24.93)
2,629.35 4,672.93 Statutory balances recoverable 2.58 2.58 Advance tax (net) 409.01 297.99
3,040.94 4,973.50
CURRENT ASSETS
B7 INVENTORIES *
` in Million
ParticularsAs on
March 31, 2018 As on
March 31, 2017
(valued at lower of cost and net realizable value)(i) Raw materials
- In hand 7,129.78 6,576.92 - In transit 2,515.24 1,912.79
9,645.02 8,489.71 (ii) Work-in-progress # 1,602.14 1,232.84 (iii) Finished goods
- In hand 12,191.48 11,313.65 - In transit 948.32 1,542.08
13,139.80 12,855.73 (iv) Stock-in-trade
- In hand 2,906.73 2,233.24 - In transit 460.25 145.03
3,366.98 2,378.27 (v) Stores and spares 1,699.57 1,498.71
29,453.51 26,455.26
* The carrying amount of inventories are pledged as security for borrowings (refer note B16(a)). # Work-in-progress consists of only automotive tyres.
FINANCIAL ASSETS (CURRENT)
B8 INVESTMENTS
` in Million
ParticularsAs on
March 31, 2018 As on
March 31, 2017
At fair value through profit and loss:Investment in mutual funds (quoted) * 3,640.47 3,444.44 At amortised cost:Investment in inter-corporate deposits (unquoted) # 9,750.00 500.00
13,390.47 3,944.44
200

* Mutual Funds
As on March 31, 2018 As on March 31, 2017
Number of Units
Amount (` in Million)
Number of Units
Amount (` in Million)
ICICI Prudential Liquid - Direct Plan - Growth - - 4,747,917 1,101.04 ICICI Prudential Savings Fund - Direct Plan - Growth 6,744,803 1,823.42 - - Reliance Liquid Fund - Treasury Plan - Direct Growth Plan - - 121,298 481.23 Reliance Medium Term Fund - Direct Growth Plan 48,842,555 1,817.05 - - HDFC Liquid Fund - Direct Plan - Growth - - 15,599 50.06 Kotak Liquid Direct Plan Growth - - 151,876 500.81 UTI-Liquid Cash Plan-Institutional - Direct Plan - Growth - - 413,411 1,101.02 SBI Magnum Insta Cash Fund - Direct Plan - Growth - - 58,454 210.28
55,587,358 3,640.47 5,508,555 3,444.44
# Given for business purpose
` in Million
ParticularsAs on
March 31, 2018 As on
March 31, 2017
Aggregate amount of quoted investments at cost 3,500.00 3,443.37Aggregate amount of quoted investments at market value 3,640.47 3,444.44Aggregate amount of unquoted investments at cost 9,750.00 500.00
B9 TRADE RECEIVABLES *
` in Million
ParticularsAs on
March 31, 2018 As on
March 31, 2017
(Unsecured)Outstanding for a period exceeding six months from the date they were due for payment Considered good 1.41 1.09 Considered doubtful 466.31 299.43 Others - considered good ** 14,348.89 11,273.87
14,816.61 11,574.39 Provision for doubtful trade receivables (refer note C5) (466.31) (299.43)
14,350.30 11,274.96
* The carrying amount of trade receivables is pledged as security for borrowings (refer note B16(a)). ** Includes balances with related parties (refer note C23)
B10 CASH AND CASH EQUIVALENTS
` in Million
ParticularsAs on
March 31, 2018 As on
March 31, 2017
(i) Balances with banks: Current accounts 3,537.06 2,291.19 Other deposit accounts - original maturity of 3 months or less 1,003.34 271.23
(ii) Cheques on hand / remittances in transit 1,385.48 742.28 (iii) Cash on hand 5.29 4.24
5,931.17 3,308.94
B11 BANK BALANCES OTHER THAN CASH AND CASH EQUIVALENTS
` in Million
ParticularsAs on
March 31, 2018 As on
March 31, 2017
Unpaid dividend accounts * 60.71 52.92 Deposits with maturity exceeding 3 months but less than 12 months 0.01 7.31
60.72 60.23
* These balances are not available for use by the Company and corresponding balance is disclosed as unclaimed dividend in note B22.
201Apollo Tyres Ltd Annual Report 2017-18
Corporate Overview / Statutory Reports / Financial Statements

B12 LOANS
` in Million
ParticularsAs on
March 31, 2018 As on
March 31, 2017
(Unsecured, considered good unless otherwise stated)Employee advances - salary loan 17.08 38.94
17.08 38.94
B13 OTHER FINANCIAL ASSETS
` in Million
ParticularsAs on
March 31, 2018 As on
March 31, 2017
Employee advances - others 17.68 6.73 Derivative assets measured at fair value (refer note C15) 110.24 307.50 Security deposits 273.10 110.17 Interest accrued on deposits / loans 272.65 28.26 Loan (including interest accrued) given to joint venture 159.34 159.34Less: Provision for impairment 159.34 - 159.34 - Others 66.74 45.20
740.41 497.86
NON-FINANCIAL ASSETS (CURRENT)
B14 OTHER CURRENT ASSETS
` in Million
ParticularsAs on
March 31, 2018 As on
March 31, 2017
(Unsecured, considered good unless otherwise stated)a. Advances given to related parties (refer note C23) 39.15 57.20 b. Trade advances: considered good 404.38 354.22
Doubtful advances 20.56 20.56 Provision for doubtful advances (20.56) (20.56)
404.38 354.22 c. Employee advances - others 66.94 60.92 d. Investment promotion subsidy receivable from Government of Tamil Nadu (refer note C12) 757.74 1,000.71 e. Export obligations - advance licence benefit 236.35 - f. Export incentives recoverable 260.79 199.11 g. Balance with statutory authorities:
i. CENVAT recoverable 472.24 740.03 ii. VAT recoverable 849.29 1,517.60 iii. Service tax recoverable 2.42 108.01 iv. GST recoverable 1,326.75 -
h. Prepaid expenses 629.88 563.56 5,045.93 4,601.36
B15 EQUITY SHARE CAPITAL
` in Million
ParticularsAs on
March 31, 2018 As on
March 31, 2017
(a) Authorised730,000,000 Nos. (730,000,000 Nos.) equity shares of ` 1 each 730.00 730.00200,000 Nos. (200,000 Nos.) cumulative redeemable preference shares of ` 100 each 20.00 20.00
750.00 750.00(b) Issued, subscribed, called and fully paid up
Equity shares of ` 1 each:572,049,980 Nos. (509,024,770 Nos.) equity shares 572.05 509.02
572.05 509.02
202

(c) Reconciliation of the number of equity shares and amount outstanding at the beginning and at the end of the year
Particulars
As on March 31, 2018 As on March 31, 2017
Number of shares
Amount ` in Million
Number of shares
Amount ` in Million
Opening balance 509,024,770 509.02 509,024,770 509.02 Add: Issued during the year (refer note C7) 63,025,210 63.03 - -Closing balance 572,049,980 572.05 509,024,770 509.02
(d) Details of shareholders holding more than 5% of the paid up equity share capital of the Company with voting rights *
Name of the shareholder
As on March 31, 2018 As on March 31, 2017
Number of shares
%ageNumber
of shares%age
Neeraj Consultants Limited 73,827,161 12.91% 72,138,999 14.17%Apollo Finance Limited 39,381,872 6.88% 36,759,650 7.22%Sunrays Properties and Investment Company Private Limited 36,307,648 6.35% 35,725,648 7.02%Franklin Templeton Investment Funds 30,241,086 5.29% - -
* As per the records of the Company including its register of member.
(e) The rights, preferences and restrictions attached to equity shares of the Company The Company has only one class of issued shares referred to as equity shares having a par value of ` 1 each. The holder of equity
shares are entitled to one vote per share.
(f) In the event of liquidation of the Company, the holders of equity shares will be entitled to receive remaining assets of the Company, after distribution of all preferential amounts. The distribution will be in proportion to the number of equity shares held by the shareholders.
(g) Over the period of five years immediately preceding March 31, 2018 and March 31, 2017, neither any bonus shares were issued nor any shares were allotted for consideration other than cash. Further, no shares were bought back during the said period.
NON - CURRENT LIABILITIES
FINANCIAL LIABILITIES (NON-CURRENT)
B16 BORROWINGS
` in Million
ParticularsAs on
March 31, 2018 As on
March 31, 2017
At amortised costSecured *
(i) Debentures 10,737.85 6,250.00 (ii) Term loans
From banks: External commercial borrowings (ECB) 7,858.10 1,713.03 Other loans 13,814.67 9,867.98 From others: International Finance Corporation (IFC) - Loan A - 324.25 Magyar Import-Export Bank ZRT 4,513.39 3,280.29
(iii) Finance lease - deferred payment liabilities (refer note C8):Deferred payment credit I 44.57 48.38 Deferred payment credit II 3.36 4.59 Deferred payment credit III 30.26 70.52
37,002.20 21,559.04
* For details regarding repayment terms, interest rate and nature of security on non current borrowings (refer note B16(a)).
203Apollo Tyres Ltd Annual Report 2017-18
Corporate Overview / Statutory Reports / Financial Statements

B16
(A)
DE
BE
NT
UR
ES
Par
ticu
lars
Am
ount
out
stan
ding
as
on
Mar
ch 3
1, 2
018
(`
in M
illio
n)
Am
ount
out
stan
ding
as
on
Mar
ch 3
1, 2
017
(`
in M
illio
n)R
ate
of in
tere
st
per
annu
mTe
rms
of r
epay
men
tD
etai
ls o
f sec
urit
y of
fere
dN
on c
urre
nt
borr
owin
gs
Cur
rent
m
atur
itie
s of
no
n cu
rren
t bo
rrow
ings
Non
cur
rent
bo
rrow
ings
Cur
rent
m
atur
itie
s of
no
n cu
rren
t bo
rrow
ings
1,15
0 -
8.6
5 %
Non
-con
vert
ible
deb
entu
res
of
` 1
Mill
ion
each
1
,150
.00
-
1
,150
.00
-
8.
65%
Bul
let
paym
ent
on A
pril
30, 2
026
Ref
er n
ote
B1
belo
w
1,0
50 -
8.6
5 %
Non
-con
vert
ible
deb
entu
res
of
` 1
Mill
ion
each
1
,050
.00
-
1
,050
.00
-
8.
65%
Bul
let
paym
ent
on A
pril
30, 2
025
Ref
er n
ote
B1
belo
w
1,0
50 -
8.6
5 %
Non
-con
vert
ible
deb
entu
res
of
` 1
Mill
ion
each
1
,050
.00
-
1
,050
.00
-
8.
65%
Bul
let
paym
ent
on A
pril
30, 2
024
Ref
er n
ote
B1
belo
w
1,50
0 -
7.8
0 %
Non
-con
vert
ible
deb
entu
res
of
` 1
Mill
ion
each
1,4
95.9
5 -
-
-
7.
80%
Bul
let
paym
ent
on A
pril
30, 2
024
Ref
er n
ote
B1
belo
w
1,50
0 -
7.8
0 %
Non
-con
vert
ible
deb
entu
res
of
` 1
Mill
ion
each
1,4
95.9
5 -
-
-
7.
80%
Bul
let
paym
ent
on A
pril
28, 2
023
Ref
er n
ote
B1
belo
w
1,50
0 -
7.8
0 %
Non
-con
vert
ible
deb
entu
res
of
` 1
Mill
ion
each
1,4
95.9
5 -
-
-
7.
80%
Bul
let
paym
ent
on A
pril
29, 2
022
Ref
er n
ote
B1
belo
w
900
- 7
.50
% N
on-c
onve
rtib
le d
eben
ture
s of
`
1 M
illio
n ea
ch 9
00
.00
-
9
00
.00
-
7.
50%
Bul
let
paym
ent
on O
ctob
er 2
0,
2023
Ref
er n
ote
B1
belo
w
1,0
50 -
7.5
0 %
Non
-con
vert
ible
deb
entu
res
of
` 1
Mill
ion
each
1,0
50.0
0
-
1,0
50.0
0
-
7.50
%B
ulle
t pa
ymen
t on
Oct
ober
21,
20
22R
efer
not
e B
1 be
low
1,0
50 -
7.5
0 %
Non
-con
vert
ible
deb
entu
res
of
` 1
Mill
ion
each
1,0
50.0
0
-
1,0
50.0
0
-
7.50
%B
ulle
t pa
ymen
t on
Oct
ober
21,
20
21R
efer
not
e B
1 be
low
1,0
00
- 9
.40
% N
on-c
onve
rtib
le d
eben
ture
s of
`
1 M
illio
n ea
ch -
-
-
1
,00
0.0
0
9.40
%B
ulle
t pa
ymen
t on
Nov
embe
r 10
, 20
17R
efer
not
e A
2 an
d B
1 be
low
Tota
l 1
0,7
37.8
5 -
6,
250
.00
1,0
00
.00
E
xter
nal c
omm
erci
al b
orro
win
gs
(EC
B) f
rom
ban
ksB
ank
1 -
ECB
I -
-
-
1
31.8
4 2-
4% a
bove
U
SD
-LIB
OR
Rep
aym
ent
in 3
equ
al a
nnua
l in
stal
men
ts in
US
D e
quiv
alen
t to
` 1
00
Mill
ion
star
ted
from
S
epte
mbe
r 29
, 20
15
Ref
er n
ote
A1
and
B1
belo
w
Ban
k 1
- EC
B I
I -
-
-
1
88.1
0
2-4%
abo
ve
US
D-L
IBO
RR
epay
men
t in
3 e
qual
ann
ual
inst
alm
ents
of U
SD
2.9
0 M
illio
n st
arte
d fr
om O
ctob
er 2
6, 2
015
Ref
er n
ote
A1
and
B1
belo
w
Ban
k 2
- EC
B I
-
-
-
220
.49
2-4%
abo
ve
US
D-L
IBO
RR
epay
men
t in
3 e
qual
ann
ual
inst
alm
ents
of U
SD
3.3
3 M
illio
n st
arte
d fr
om S
epte
mbe
r 28
, 20
15
Ref
er n
ote
A1
and
B1
belo
w
Ban
k 3
- EC
B I
968
.50
-
9
63.6
1 -
0
-1%
abo
ve
US
D-L
IBO
RR
epay
men
t in
6 e
qual
sem
i-ann
ual
inst
alm
ents
sta
rtin
g fr
om F
Y
2019
-20
Ref
er n
ote
B1
belo
w
Ban
k 3
- EC
B I
I 3
76.6
2 -
3
74.7
1 -
0
-1%
abo
ve
US
D-L
IBO
RR
epay
men
t in
6 e
qual
sem
i-an
nual
inst
alm
ents
sta
rtin
g fr
om
Sep
tem
ber
30, 2
020
Ref
er n
ote
B1
belo
w
Ban
k 3
- EC
B I
II 3
76.6
2 -
3
74.7
1 -
0
-1%
abo
ve
US
D-L
IBO
RR
epay
men
t in
6 e
qual
sem
i-an
nual
inst
alm
ents
sta
rtin
g fr
om
Sep
tem
ber
30, 2
020
Ref
er n
ote
B1
belo
w
204

Par
ticu
lars
Am
ount
out
stan
ding
as
on
Mar
ch 3
1, 2
018
(`
in M
illio
n)
Am
ount
out
stan
ding
as
on
Mar
ch 3
1, 2
017
(`
in M
illio
n)R
ate
of in
tere
st
per
annu
mTe
rms
of r
epay
men
tD
etai
ls o
f sec
urit
y of
fere
dN
on c
urre
nt
borr
owin
gs
Cur
rent
m
atur
itie
s of
no
n cu
rren
t bo
rrow
ings
Non
cur
rent
bo
rrow
ings
Cur
rent
m
atur
itie
s of
no
n cu
rren
t bo
rrow
ings
Ban
k 4
- EC
B I
1,6
14.9
0
-
-
-
0-1
% a
bove
U
SD
-LIB
OR
3 eq
ual a
nnua
l ins
talm
ents
st
artin
g fr
om F
Y 2
022
-23
Ref
er n
ote
B1
belo
w
Ban
k 5
- EC
B I
1,6
14.5
2 -
-
-
0
.25-
1.25
%
abov
e U
SD
-LI
BO
R
3 eq
ual a
nnua
l ins
talm
ents
st
artin
g fr
om F
Y 2
022
-23
Ref
er n
ote
B1
belo
w
Ban
k 6
- EC
B I
1,6
15.9
7 -
-
-
0
-1%
abo
ve
US
D-L
IBO
R3
equa
l ann
ual i
nsta
lmen
ts
star
ting
from
FY
20
22-2
3R
efer
not
e B
1 be
low
Ban
k 7
- EC
B I
1,2
90.9
7 -
-
-
0
.25-
1.25
%
abov
e U
SD
-LI
BO
R
3 eq
ual a
nnua
l ins
talm
ents
st
artin
g fr
om F
Y 2
022
-23
Ref
er n
ote
B1
belo
w
Tota
l 7
,858
.10
-
1
,713
.03
54
0.4
3 O
ther
term
loan
s fr
om b
anks
Ban
k 1
9,2
77.5
1 7
52.2
3 6
,560
.59
-
EUR
IBO
R +
2.
25%
Rep
aym
ent
in 8
sem
i-ann
ual
inst
alm
ents
sta
rtin
g fr
om
Febr
uary
11,
20
19
Ref
er n
ote
C1
belo
w
Ban
k 2
4,5
13.3
9 5
01.
49
3,2
80.2
9 -
EU
RIB
OR
+
1.85
%R
epay
men
t in
10
equ
al s
emi-
annu
al in
stal
men
ts s
tart
ing
from
Fe
brua
ry 1
1, 2
019
Ref
er n
ote
C1
belo
w
Ban
k 3
18.
09
3.4
2 1
8.23
2
.62
2.0
4%M
onth
ly p
aym
ent
till A
ugus
t 30
, 20
24S
ecur
ed b
y m
ortg
age
on la
nd a
nd b
uild
ing
at B
iele
feld
, Ger
man
yB
ank
4 4
.41
6.4
1 8
.87
5.0
8 4.
25%
Mon
thly
pay
men
t til
l Nov
embe
r 30
, 20
19S
ecur
ed b
y m
ortg
age
on la
nd a
nd b
uild
ing
at C
olog
ne, G
erm
any
Ban
k 5
1.2
7 0
.53
-
2.0
0
3.90
%M
onth
ly p
aym
ent
till J
uly
31, 2
021
Sec
ured
by
mor
tgag
e on
Car
s
Tota
l 1
3,81
4.6
7 1
,264
.08
9,8
67.9
8 9
.70
Te
rm lo
an fr
om o
ther
sIF
C -
Loa
n A
-
325.
9032
4.25
324.
252-
4% a
bove
U
SD
-LIB
OR
Rep
aym
ent
in 1
2 ha
lf-y
earl
y in
stal
men
ts o
f US
D 2
.50
Mill
ion
each
sta
rted
from
Jun
e 17
, 20
13
Ref
er n
ote
A1
& B
2 be
low
Mag
yar
Impo
rt-E
xpor
t B
ank
ZRT
4,5
13.3
9 5
01.
49
3,2
80.2
9 -
EU
RIB
OR
+
1.85
%R
epay
men
t in
10
equ
al s
emi-
annu
al in
stal
men
ts o
f Eur
o 15
M
illio
n st
artin
g fr
om F
ebru
ary
11
, 20
19
Ref
er n
ote
C1
belo
w
Tota
l 4
,513
.39
827
.39
3,60
4.5
432
4.2
5
205Apollo Tyres Ltd Annual Report 2017-18
Corporate Overview / Statutory Reports / Financial Statements

Par
ticu
lars
Am
ount
out
stan
ding
as
on
Mar
ch 3
1, 2
018
(`
in M
illio
n)
Am
ount
out
stan
ding
as
on
Mar
ch 3
1, 2
017
(`
in M
illio
n)R
ate
of in
tere
st
per
annu
mTe
rms
of r
epay
men
tD
etai
ls o
f sec
urit
y of
fere
dN
on c
urre
nt
borr
owin
gs
Cur
rent
m
atur
itie
s of
no
n cu
rren
t bo
rrow
ings
Non
cur
rent
bo
rrow
ings
Cur
rent
m
atur
itie
s of
no
n cu
rren
t bo
rrow
ings
Fina
nce
leas
e -
defe
rred
pay
men
t lia
bilit
ies
Def
erre
d pa
ymen
t cr
edit
I44
.57
3.82
48.3
87.
717-
8%R
epay
men
t al
ong
with
inte
rest
in
240
con
secu
tive
mon
thly
in
stal
men
ts s
tart
ed fr
om M
ay 1
5,
200
7
Win
d M
ills
purc
hase
d un
der
the
defe
rred
con
side
ratio
n pa
ymen
t pl
an.
Def
erre
d pa
ymen
t cr
edit
II3.
361.
614.
593.
08
8-9%
Rep
aym
ent
alon
g w
ith in
tere
st in
20
equ
al q
uart
erly
inst
alm
ents
st
arte
d fr
om J
anua
ry 3
1, 2
011
Eng
inee
ring
mat
eria
ls
purc
hase
d un
der
the
Par
ts
Man
agem
ent
Agr
eem
ent
(PM
A) s
chem
eD
efer
red
paym
ent
cred
it II
I30
.26
57.8
670
.52
35.
03
Ave
rage
5-
6%M
onth
ly r
epay
men
ts
Item
s of
pla
nt a
nd
equi
pmen
t an
d ot
her
asse
ts
take
n on
leas
eTo
tal
78.
19
63.
29
123.
49
45.
82
Det
ails
of s
ecur
itie
s of
fere
d to
exi
stin
g le
nder
s
N
ote
A1
A p
ari p
assu
firs
t cha
rge
crea
ted
by w
ay o
f mor
tgag
e on
the
Com
pany
’s la
nd a
nd p
rem
ises
at v
illag
e K
odak
ara
in K
eral
a, a
t vill
age
Lim
da in
Guj
arat
, at S
IPC
OT
Ind
ustr
ial G
row
th C
entr
e at
Ora
gada
m n
ear
Che
nnai
, and
at
Hea
d O
ffice
in G
urga
on, H
arya
na t
oget
her
with
the
fact
ory
build
ings
, pla
nt, m
achi
nery
and
equ
ipm
ents
, bot
h pr
esen
t an
d fu
ture
.
Not
e A
2 A
par
i pas
su fi
rst
char
ge c
reat
ed b
y w
ay o
f m
ortg
age
on t
he C
ompa
ny’s
lan
d an
d pr
emis
es a
t vi
llag
e K
odak
ara
in K
eral
a an
d at
vill
age
Lim
da in
Guj
arat
tog
ethe
r w
ith t
he f
acto
ry
build
ings
, pla
nt, m
achi
nery
and
equ
ipm
ents
, bot
h pr
esen
t an
d fu
ture
.
Not
e B
1 A
par
i pas
su fi
rst
char
ge b
y w
ay o
f hyp
othe
catio
n ov
er t
he m
ovab
le p
lant
and
equ
ipm
ents
of t
he C
ompa
ny, b
oth
pres
ent
and
futu
re (e
xcep
t st
ocks
and
boo
k de
bts)
.
Not
e B
2 A
par
i pas
su fi
rst
char
ge o
n th
e m
ovab
le p
lant
and
equ
ipm
ents
and
par
i pas
su s
econ
d ch
arge
on
the
curr
ent
asse
ts o
f the
Com
pany
.
N
ote
C1
The
fac
ility
is s
ecur
ed o
n th
e cu
rren
t &
fut
ure
fixed
ass
ets
of t
he A
TH
Kft
and
AV
BV.
In
addi
tion,
the
fac
ility
is a
lso
secu
red
by t
he p
ledg
e on
: i)
the
shar
e of
AT
H K
ft; i
i) ri
ghts
an
d re
ceiv
able
s of
AT
H K
ft u
nder
pro
ject
agr
eem
ents
; iii)
rig
hts
and
rece
ivab
les
incl
udin
g in
sura
nce
rece
ivab
les,
inte
rcom
pany
rec
eiva
bles
and
sha
reho
lder
loa
ns (
othe
r th
an t
rade
re
ceiv
able
s) o
f AV
BV,
AT
BV
and
AT
H K
ft; a
nd iv
) ban
k ac
coun
ts o
f AT
BV
and
AT
H K
ft.
206

B17 OTHER FINANCIAL LIABILITIES
` in Million
ParticularsAs on
March 31, 2018 As on
March 31, 2017
Lease escalation 0.29 0.08 Deferred consideration payable on acquisition of subsidiary 557.13 457.31 Derivatve liabilties measured at fair value (refer note C15) 131.60 142.64
689.02 600.03
NON-FINANCIAL LIABILITIES (NON-CURRENT)
B18 PROVISIONS (REFER NOTE C10(I))
` in Million
ParticularsAs on
March 31, 2018 As on
March 31, 2017
(a) Provision for employee benefitsJubilee benefits 179.60 154.59
(b) Other provisionsProvision for constructive liability 281.08 189.16 Provision for sales related obligations 304.03 334.46
764.71 678.21
B19 OTHER NON-CURRENT LIABILITIES
` in Million
ParticularsAs on
March 31, 2018 As on
March 31, 2017
Security deposits received from dealers 42.03 36.70 Security deposits received from employees 82.64 46.33 Pension liability (refer note C13) 842.61 781.57 Deferred revenue arising from government grant (refer note C12) 6,333.94 4,352.57
7,301.22 5,217.17
CURRENT LIABILITIES
FINANCIAL LIABILITIES (CURRENT)
B20 BORROWINGS
` in Million
ParticularsAs on
March 31, 2018 As on
March 31, 2017
At amortised costSecured From banks: Cash credit* 143.39 71.58 Packing credit* - 239.05 Working capital demand loan* 1,000.00 - Bank overdrafts# 980.24 3,046.23 UnsecuredFrom banks: Packing credit 3,030.85 3,029.41 Working capital demand loan 2,300.00 - From others: Commercial paper - 4,500.00
7,454.48 10,886.27
* Cash credits, packing credit and working capital demand loans are repayable on demand and are secured by a first charge on raw materials, work-in-progress, stocks, stores and book debts and by a second charge on the Company’s land at village Kodakara in Kerala, at Oragadam and Mathur village in Tamil Nadu and at head office in Gurgaon, Haryana together with the factory buildings, plant and machinery and equipment, both present and future.
# Overdraft facility availed by Reifencom Gmbh is secured by a first charge on stock and receivables of Reifencom, both present and future and further supported by corporate guarantee issued by Apollo Tyres Cooperatief U.A. Loans taken by Apollo Vredestein B.V. (AVBV) are secured by a charge on bank balances, inventories and receivables of AVBV.
207Apollo Tyres Ltd Annual Report 2017-18
Corporate Overview / Statutory Reports / Financial Statements

B21 TRADE PAYABLES
` in Million
ParticularsAs on
March 31, 2018 As on
March 31, 2017
Payable to Micro, Small and Medium Enterprises (refer note C20) 133.27 38.44 Acceptances 3,982.84 2,636.00 Accounts payable - raw materials and services 14,498.97 10,421.37 Freight and custom house agent charges payable 884.84 723.87 Expenses payable 2,806.27 1,641.25 Employee related payables** 2,062.76 1,825.37 Payable to related parties (refer note C23) 101.83 31.26
24,470.78 17,317.56
** Employee related payables includes commission on net profits payable to whole-time directors ` 605 Million (` 560 Million).
B22 OTHER FINANCIAL LIABILITIES
` in Million
ParticularsAs on
March 31, 2018 As on
March 31, 2017
Current maturities of non-current borrowings***Secured
(a) Debentures - 1,000.00 (b) Term loan from banks:
External commercial borrowings (ECB) - 540.43 Others 1,264.08 9.70
(c) Term loan from others:International Finance Corporation (IFC) - Loan A 325.90 324.25 Magyar Import-Export Bank ZRT 501.49 -
(d) Finance lease - deferred payment liabilities (refer note C8):Deferred payment credit I 3.82 7.71 Deferred payment credit II 1.61 3.08 Deferred payment credit III 57.86 35.03
2,154.76 1,920.20 Interest accrued but not due on borrowings 736.90 430.73 Unclaimed dividends## 60.71 52.92 Interest payable to Micro, Small & Medium Enterprises (refer note C20) 10.58 10.58 Accounts payable - capital vendors 4,795.33 5,660.76 Payable to Micro, Small and Medium Enterprises - capital vendors (refer note C20) 17.71 10.12 Payable to related parties (refer note C23) 70.18 27.37 Security deposits - vendors 288.00 289.73 Advances received from customers 542.20 401.60 Derivative liabilities measured at fair value (refer note C15) 187.85 228.65 Lease escalation 0.11 0.09
8,864.33 9,032.75
*** For details regarding repayment terms, interest rate and nature of security on current maturities of non-current borrowings (refer note B16(a)).## Includes ` 3.18 Million (` 4.99 Million) which has not been transferred to the Investor Education and Protection Fund under Section 124 of the Companies Act, 2013, as per the orders/ instructions of the Special Court (Trial of Offences Relating to Transactions in Securities) Act, 1992.
NON-FINANCIAL LIABILITIES (CURRENT)
B23 OTHER CURRENT LIABILITIES
` in Million
ParticularsAs on
March 31, 2018 As on
March 31, 2017
Excise duty on closing stock - 355.73 Statutory dues payable 4,047.18 1,981.52 Gratuity payable (refer note C13) 158.79 3.04 Deferred revenue 43.74 54.21 Others 129.73 158.73
4,379.44 2,553.23
208

B24 PROVISIONS
` in Million
ParticularsAs on
March 31, 2018 As on
March 31, 2017
Provision for employee benefitsProvision for compensated absences (refer note C10 (ii) and C13) 235.21 251.60 Provision for superannuation 22.50 - Others (refer note C10 (ii))Provision for constructive liability 38.55 32.34 Provision for contingencies 790.00 790.00 Provision for sales related obligations 2,295.02 2,634.27
3,381.28 3,708.21
B25 CURRENT TAX LIABILITIES (NET)
` in Million
ParticularsAs on
March 31, 2018 As on
March 31, 2017
Provision for taxation 18,654.09 16,690.02 Advance tax (17,584.44) (15,616.25)
1,069.65 1,073.77
B26 OTHER OPERATING INCOME
` in Million
Particulars Year ended
March 31, 2018 Year ended
March 31, 2017
Investment promotion subsidy from Government of Tamil Nadu (refer note C12) 393.32 464.50 Unwinding of deferred income (refer note C12) 788.13 329.87 Sale of raw material scrap 388.73 293.36 Early payment discount received from raw material suppliers 94.43 82.94
1,664.61 1,170.67
B27 OTHER INCOME
` in Million
Particulars Year ended
March 31, 2018 Year ended
March 31, 2017
(a) Interest earned on deposits: - Bank 48.51 66.67 - Inter corporate deposit 263.61 274.02 - Others 21.75 49.22
(b) Dividend income from non current investments - FVTPLUnit Trust of India 0.06 1.81
(c) Dividend income from current investments - FVTPLMutual funds 45.76 82.78
(d) OthersUnclaimed credit balances / provisions no longer required written back 23.31 67.66 Gain on foreign exchange fluctuation (net) 459.22 680.84 Gain on fair value change in investments 140.68 - Profit on sale of property, plant and equipment (net) 8.13 - Miscellaneous 154.36 295.12
1,165.39 1,518.12
209Apollo Tyres Ltd Annual Report 2017-18
Corporate Overview / Statutory Reports / Financial Statements

B28 MANUFACTURING AND OTHER EXPENSES
` in Million
Particulars Year ended
March 31, 2018 Year ended
March 31, 2017
Cost of materials consumed:Raw materials consumed 73,906.52 60,449.61 Purchase of stock-in-trade:Purchase of finished goods - tyres, tubes and flaps 11,522.97 10,807.37 Employee benefits expense: *Salaries and wages 17,587.00 15,859.75 Contribution to provident and other funds (refer note C13) 2,678.69 2,412.23 Staff welfare 1,300.77 997.71
21,566.46 19,269.69 Other expenses: *Consumption of stores and spare parts 1,382.53 1,299.48 Power and fuel 3,791.62 3,267.19 Conversion charges 1,445.10 1,292.27 Repairs and maintenance - Machinery 641.54 551.70 - Buildings 33.42 28.76 - Others 1,780.94 1,441.41 Rent (refer note C9) 1,963.19 1,904.13 Lease rent - factory (refer note C9) 600.13 504.37 Insurance 274.56 212.41 Rates and taxes 183.09 218.45 Directors' sitting fees (refer note C23) 12.70 7.50 Commission to non-wholetime directors (refer note C23) 60.00 60.00 Loss on sale of property, plant and equipment (net) - 35.17 Provision for impairment of investment & loan in joint venture - 185.99 Travelling, conveyance and vehicle 1,665.95 1,565.19 Postage, telephone and stationery 294.80 301.30 Conference 92.74 143.23 Freight and forwarding 5,707.93 5,196.36 Commission on sales 34.04 41.04 Sales promotion 459.53 1,290.83 Advertisement and publicity 2,888.97 2,772.29 Corporate social responsibility (refer note C21) 215.68 185.00 Bank charges 144.38 147.37 Statutory auditors remuneration (refer note C16) 71.10 58.11 Provision for doubtful debts / advances (refer note C5) 160.14 - Legal and professional 749.97 627.34 Provision for contingencies (refer note C10(ii)) - 365.00 Miscellaneous 1,717.03 1,440.92
26,371.08 25,142.81 133,367.03 115,669.48
* Includes expense towards research and development (refer note C17).
B29 FINANCE COSTS ` in Million
Particulars Year ended
March 31, 2018 Year ended
March 31, 2017
(a) Interest expense:Interest on fixed-term loans 312.06 151.84 Interest on debentures 538.62 182.42 Interest on current loans 314.99 228.95 Others 408.35 398.89
(b) Other borrowing costs 55.18 66.71 1,629.20 1,028.81
210

forming part of the Consolidated Financial StatementsC. Other Notes1 DIRECTLY ATTRIBUTABLE EXPENSES CAPITALIZED / INCLUDED IN CAPITAL WORK IN PROGRESS:
` in Million
Particulars 2017-18 2016-17
Raw material consumed 298.07 35.29 Salaries, wages and bonus 549.74 695.76 Welfare expenses 68.03 73.76 Rent 29.74 6.27 Travelling, conveyance and vehicle 111.18 177.20 Postage, telephone and stationery 4.02 5.38 Power and fuel 276.15 79.08 Insurance 4.51 3.37 Legal and professional 46.98 229.86 Miscellaneous 550.43 403.93 Total* 1,938.85 1,709.90
* Out of the above ` 1,328.60 Million (` 1,540.68 Million) is included in capital work in progress.
Changes in the net carrying amount of goodwill are summarized as follows:
` in Million
ParticularsAs on
March 31, 2018 As on
March 31, 2017
Opening balance 1,773.58 1,982.37 Effect of change in value of deferred consideration payable - (45.79)Foreign exchange translation difference 287.13 (163.00)Closing balance 2,060.71 1,773.58
Impairment An impairment test was carried out as on March 31, 2018, details of the test are outlined below:
Particulars Trademarks#
Goodwill, Trademarks and Other intangible
assets*
Discount Rate 9.10% 8.20%Growth Rate 0% - 2% 2%Number of years for which cash flows were considered 5 5Test Result No impairment
lossNo impairment
loss
# pertains to AVBV acquisition * pertains to Reifencom Gmbh acquisition
Growth rates The growth rates used are in line with the growth rate of the industry and the countries in which the entities operates and are consistent
with internal / external sources of information.
Discount rates The discount rates takes into consideration market risk and specific risk factors of the cash generating unit. The cash flow projections
are based on the forecasts made by the management.
2 Borrowing costs capitalized / transferred to capital work in progress during the year is ` 867.99 Million (` 573.53 Million). The weighted average capitalisation rate for the year ended March 31, 2018 is 6.75% (Nil).
3 IMPAIRMENT TESTING OF INTANGIBLES WITH INDEFINITE LIFE
Intangibles with indefinite useful life comprise of goodwill, trademarks and other intangible assets.
For the purpose of annual impairment testing, goodwill is allocated to the cash generating units expected to benefit from the synergies of the business combinations in which the goodwill arises. The Group acquired 100% shareholding of Reifencom Gmbh, one of the largest tyre distributor in
Germany on January 1, 2016. Deferred consideration payable on acquisition of subsidiary, payable to erstwhile members of Reifencom Gmbh and the fair value of the assets acquired and intangibles recognised has been considered as a part of purchase consideration for computation of goodwill. In addition to goodwill, certain trademarks and other intangible assets were also recognized in the consolidated financial statements which were not recorded in the separate financial statement of the acquiree. Further, there are certain other trademarks that were acquired as part of acquisition of AVBV.
As on March 31, 2018, the carrying value of trademarks include an amount of ` 2,106.01 million (` 1,812.59 million) and the carrying value of other intangible assets amounting to ` 347.19 million (` 298.82 million) have been determined to have indefinite useful life.
211Apollo Tyres Ltd Annual Report 2017-18
Corporate Overview / Statutory Reports / Financial Statements

Sensitivity The management believes that any reasonable possible changes in the key assumptions would not cause the cash generating unit’s
carrying amount to exceed its recoverable amount.
4 INVENTORIES
i. Out of the total inventories of ` 29,453.51 Million (` 26,455.26 Million), the carrying amount of inventories carried at fair value less costs to sell is ` 496.21 Million (` 1,084.28 Million).
ii. The amount of write down of inventories to net realizable value recognised as an expense was ` 87.99 Million (` 107.95 Million).
iii. The cost of inventories recognised as an expense during the year in respect of continuing operations was ` 85,337.56 Million (` 70,200.02 Million).
5 MOVEMENT OF PROVISION FOR DOUBTFUL TRADE RECEIVABLES:
` in Million
ParticularsAs on
March 31, 2018 As on
March 31, 2017
Opening 299.43 413.57 Addition during the year 160.14 - Utilisation / reversal during the year (42.93) (90.62)Foreign exchange translation difference 49.67 (23.52)Closing 466.31 299.43
6 DESCRIPTION OF NATURE AND PURPOSE OF EACH RESERVE
i. Securities premium reserve Securities premium reserve is used to record the
premium on issue of shares. The reserve will be utilised in accordance with provisions of the Act.
ii. General reserve General reserve is created from time to time by way of
transfer of profits from retained earnings for appropriation purpose. General reserve is created by transfer from one component of equity to another and is not an item of other comprehensive income.
iii. Capital reserve on consolidation This balance represents excess of net assets of AVBV
acquired at fair value over the purchase consideration.
iv. Capital reserve on Apollo (Mauritius) Holdings Private Limited (“AMHPL”) merger
AMHPL erstwhile (subsidiary company) was merged with the Company resulting in a capital reserve.
v. Debenture redemption reserve The Company is required to create a debenture
redemption reserve out of the profits which are available for redemption of debentures.
vi. Capital subsidy This balance represents subsidy received under New
Industrial Policy 2007 of the Government of Tamil Nadu
for expansion and employment generation within SIPCOT Industrial park.
vii. Capital redemption reserve The same has been created in accordance with provision of
the Act for the buy back of equity shares from the market.
vii. Capital reserve on forefeiture of shares This reserve was created on forfeiture of shares by the
Company. The reserve is not available for the distribution to the shareholders.
ix. Retained earnings Retained earnings are created from the profit of the Group,
as adjusted for distribution to owners, transfer to other reserve, etc.
7 The Company issued and allotted 63,025,210 equity shares of Re. 1 each (amounting to ` 63.03 Million) to Qualified Institutional Buyers on October 10, 2017 at an issue price of ` 238 per equity share including a premium of ` 237 per equity share (amounting to ` 14,781.01 Million net of share issue expenses), aggregating to ` 14,844.04 Million net of share issue expenses. Pursuant to the allotment of equity shares in the Qualified Institutional Placement, the paid up equity share capital of the Company stands increased to ` 572.05 Million.
8 FINANCE LEASE - DEFERRED PAYMENT LIABILITIESi) The Group has executed certain finance lease arrangements for certain assets. The schedule of future minimum lease payments in
respect of non-cancellable finance leases is set out below:` in Million
Particulars
Total minimum lease payments
Present value of minimum lease payments
As on March 31, 2018
As on March 31, 2017
As on March 31, 2018
As on March 31, 2017
Within one year of the balance sheet date 71.24 51.06 63.29 45.82 Due in a period between one year and five years 63.41 113.42 51.75 96.84 Due after five years 30.91 31.11 26.44 26.65 Total 165.56 195.59 141.48 169.31 Future finance charges (24.08) (26.28)Present value of minimum lease payments 141.48 169.31
212

ii) Break up of finance lease liability recognised in balance sheet between current and non current is as below:
` in Million
ParticularsAs on
March 31, 2018 As on
March 31, 2017
Non current (refer note B16) 78.19 123.49 Current (refer note B22) 63.29 45.82 Total 141.48 169.31
9 OPERATING LEASES
i) The Group has acquired assets, office space and warehouses under the operating lease agreements that are renewable on a periodic basis at the option of both the lessor and lessee. Rental expense under those lease debited to consolidated statement of profit and loss was ` 2,563.32 Million (` 2,408.50 Million) net of rental income amounting to ` 18.15 Million (` 7.25 Million).
ii) The schedule of future minimum lease payments in respect of non-cancellable operating leases is set out below:
` in Million
ParticularsAs on
March 31, 2018 As on
March 31, 2017
Within one year of the balance sheet date 1,705.32 1,546.53 Due in a period between one year and five years 4,293.78 3,780.13 Due after five years 4,578.27 565.97
10 PROVISIONS - NON-CURRENT / CURRENT
i) Movement of non-current provisions is as below:` in Million
ParticularsProvision for sales
related obligations *
Provision for constructive liability
#
Provision for jubilee benefits ##
As on March 31, 2016 334.46 185.72 178.64 Addition during the year - 26.95 8.27 Utilisation / reversal during the year - (12.30) (18.25)Foreign exchange translation difference - (11.21) (14.07)As on March 31, 2017 334.46 189.16 154.59 Addition during the year - 89.45 0.11 Utilisation / reversal during the year (30.43) (14.80) (0.15)Foreign exchange translation difference - 17.27 25.05 As on March 31, 2018 304.03 281.08 179.60
* Represents estimates for payments to be made in future for sales related obligations (including warranties). # Provision for constructive liability represents an obligation of the Company to reimburse post employment benefits of certain sub-contracted workers and
provision on account of post employment medical benefit obligation for the subsidiary, Apollo Tyres Africa (Pty) Ltd. ## There is a jubilee scheme in place for the employees of Apollo Vredestein B.V. and Apollo Tyres Global R&D B.V. wherein the employees are eligible for benefit
upon completion of 12.50, 25 and 40 years of service. Risks in the case of claims and legal action are monitored closely and where necessary provisions are made.
ii) Movement of current provisions is as below:` in Million
ParticularsProvision for
compensated absences
Provision for sales related obligation *
Provision for constructive liability
Provision for contingencies
As on March 31, 2016 272.60 2,228.61 31.00 425.00 Addition during the year 33.88 3,690.72 1.34 365.00 Utilisation / reversal during the year (55.77) (3,244.82) - - Foreign exchange translation difference 0.89 (40.24) - - As on March 31, 2017 251.60 2,634.27 32.34 790.00 Addition during the year 1.77 3,851.97 6.21 - Utilisation / reversal during the year (23.42) (4,273.07) - - Foreign exchange translation difference 5.26 81.85 - - As on March 31, 2018 235.21 2,295.02 38.55 790.00
* Represents estimates for payments to be made in future for sales related obligations (including warranties).
213Apollo Tyres Ltd Annual Report 2017-18
Corporate Overview / Statutory Reports / Financial Statements

11 INCOME TAXES
i) Reconciliation between average effective tax rate and applicable tax rate
Particulars2017-18 2016-17
` in Million Rate (%) ` in Million Rate (%)
Profit before tax 10,123.31 14,355.45 Income tax using the Company's domestic tax rate 3,503.68 34.61% 4,968.42 34.61%Tax effect ofEffect of different tax rates in foreign jurisdictions 126.50 1.23% (352.80) -2.46%Non deductible expenses 106.55 1.05% 97.91 0.68%Tax exempt income (290.01) -2.86% (29.28) -0.20%Tax incentives and concessions (467.34) -4.61% (1,180.35) -8.22%Others (94.89) -0.94% (138.44) -0.97%Income tax expense recognised in the consolidated statement of profit and loss 2,884.49 28.48% 3,365.46 23.44%
ii) Components of deferred tax liability (net)
` in Million
ParticularsAs on
March 31, 2018 As on
March 31, 2017
Tax effect of items constituting deferred tax liabilitiesProperty, plant and equipments and Intangible assets 9,944.54 7,987.52 Employee benefits 16.86 15.32 Others 339.73 286.13 Gross deferred tax liability (a) 10,301.13 8,288.97 Tax effect of items constituting deferred tax assetsEmployee benefits 187.76 125.22 Provisions for doubtful debt / advances 141.89 141.89 Minimum alternate tax entitlement 1,147.95 225.74 Others 434.91 360.72 Gross deferred tax asset (b) 1,912.51 853.57 Deferred tax liability (net) (a - b) 8,388.62 7,435.40
iii) Components of deferred tax asset (net) The Group has recognised deferred tax asset on losses in certain subsidiaries
` in Million
ParticularsAs on
March 31, 2018 As on
March 31, 2017
Tax effect of items constituting deferred tax assetsCarry forward tax losses 699.63 402.19 Others 256.08 227.07 Deferred tax asset (net) 955.71 629.26
(iv) Components of deferred tax expense
` in Million
Particulars 2017-18 2016-17
Tax effect of items constituting deferred tax liabilitiesProperty, plant and equipments and Intangible assets 1,595.61 886.35 Employee benefits 1.54 6.95 Others 128.41 121.52 Sub-total (a) 1,725.56 1,014.82 Tax effect of items constituting deferred tax assetsEmployee benefits 89.55 20.02 Provisions for doubtful debt / advances - 126.33 Carry forward tax losses 218.53 28.44 Minimum alternate tax entitlement 922.21 225.74 Others - 12.71 Sub-total (b) 1,230.29 413.24 Total (a - b) 495.27 601.58
214

v) The movement in net deferred tax liability is as follows:
` in Million
Particulars 2017-18 2016-17
Net deferred tax liability at the beginning of the year 6,806.14 6,409.76 Deferred tax expense recognised in the consolidated statement of profit and loss 495.27 601.58 Deferred tax expense / (income) recognised in other comprehensive income 46.87 (43.22)Deferred tax expense / (income) recognised directly in equity (82.55) - Foreign exchange translation difference 167.18 (161.98)Net deferred tax liability at the end of the year 7,432.91 6,806.14
12 GOVERNMENT GRANTS
a) Investment promotion subsidy from Government of Tamil Nadu
Pursuant to the Memorandum of Understanding (MoU) executed between the Government of Tamil Nadu (GoTN) and the Company, the Company is entitled, interalia, for refund of an amount equal to Net Output (VAT + CST) / GST paid by the Company to GoTN in the form of Investment Promotion Subsidy.
As the Company has fulfilled the relevant obligations, the Company has recognized subsidy income of ` 393.32 Million (` 464.50 Million) as other operating income, being the eligible amount of refund of Net Output (VAT + CST) / GST paid by the Company to GoTN.
b) Export promotion capital goods The Company had imported property, plant and equipment
under the Export Promotion Capital Goods (EPCG) scheme wherein the Company is allowed to import capital goods including spares without payment of customs duty, subject to certain export obligations which should be fulfilled within specified time period. During the year, the custom duty benefit received amounts to ` 1,295.52 Million with a corresponding increase in the value of property, plant and equipment and capital work in progress. The grant amounting to ` 788.13 Million (` 329.87 Million) where export obligations have been met, have been recognized in consolidated statement of profit and loss as other operating income. At the year end, the portion of grant for which the export obligation has not been met is retained in deferred revenue under other non current liabilities.
c) The Group is in process of establishing a new green field radial tyre manufacturing facility in Gyöngyöshalász, Hungary through its subsidiary Apollo Tyres Hungary Kft (ATH Kft). For this purpose ATH Kft has entered into an agreement for grant with the Ministry of National Development, Government of Hungary on June 30, 2014. The project start date for this investment was June 23, 2014 and the investment completion date is December 31, 2019. Passenger car tyre facility production was started during the year and commercial tyres facility production is expected to start in next year.This grant is subject to fulfillment of certain obligations by ATH Kft.
As ATH Kft has fulfilled its periodical obligations as per the incentive agreement, an amount of ` 1,223.04 Million (` 1,553.15 Million) has been received during the year, being the eligible amount of grant during the year. This amount has been accounted as deferred revenue (included in other non-current liabilities).
Out of the total grant, ` 41.92 Million (` 1.89 Million) for which the capitalisation of property, plant and equipment (PPE) is
completed has been recognized as income in consolidated statement of profit and loss. The portion of grant for which the capitalisation of PPE is under construction phase has been retained in deferred revenue under other non-current liabilities.
13 EMPLOYEE BENEFIT LIABILITY
i. Defined contribution plans A. Indian operations a) Superannuation plan: The Company contributes a sum
equivalent to 15% of the eligible employees’ basic salary to a superannuation fund administered and maintained by the Life Insurance Corporation of India (LIC). The Company has no liability for future superannuation fund benefits other than its annual contribution and recognizes such contributions as an expense in the year incurred. The amount of contribution paid by the Company to Superannuation Fund is ` 81.38 Million (` 69.05 Million).
b) Provident fund: Contributions are made to the Company’s employees’ provident fund trust / regional provident fund in accordance with the fund rules. The interest rate payable to the beneficiaries every year is being notified by the Government.
In the case of contribution to the trust, the Company has an obligation to make good the shortfall, if any, between the return from the investments of the trust and the notified interest rate and recognises such obligation as an expense.
The amount of contribution made by the Company to employees’ provident fund trust / regional provident fund is ` 238.22 Million (`222.61 Million)
B. Foreign operations At reporting date, employees of Apollo Vredestein B.V.
participated in defined contribution pension plan. Under this pension plan, fixed contributions are paid to the pension fund. Apollo Vredestein B.V. has no legal or constructive obligation to pay further contribution if the pension fund does not hold sufficient assets to pay all employee benefits relating to employee service. Contributions that will not be settled within 12 months are discounted and recognized as liability.
The other foreign subsidiaries in the Group have contributed to various defined contribution plans as per the local laws of the respective countries.
The amount of contribution made by various foreign subsidiaries is ` 156.45 Million (` 142.26 Million).
215Apollo Tyres Ltd Annual Report 2017-18
Corporate Overview / Statutory Reports / Financial Statements
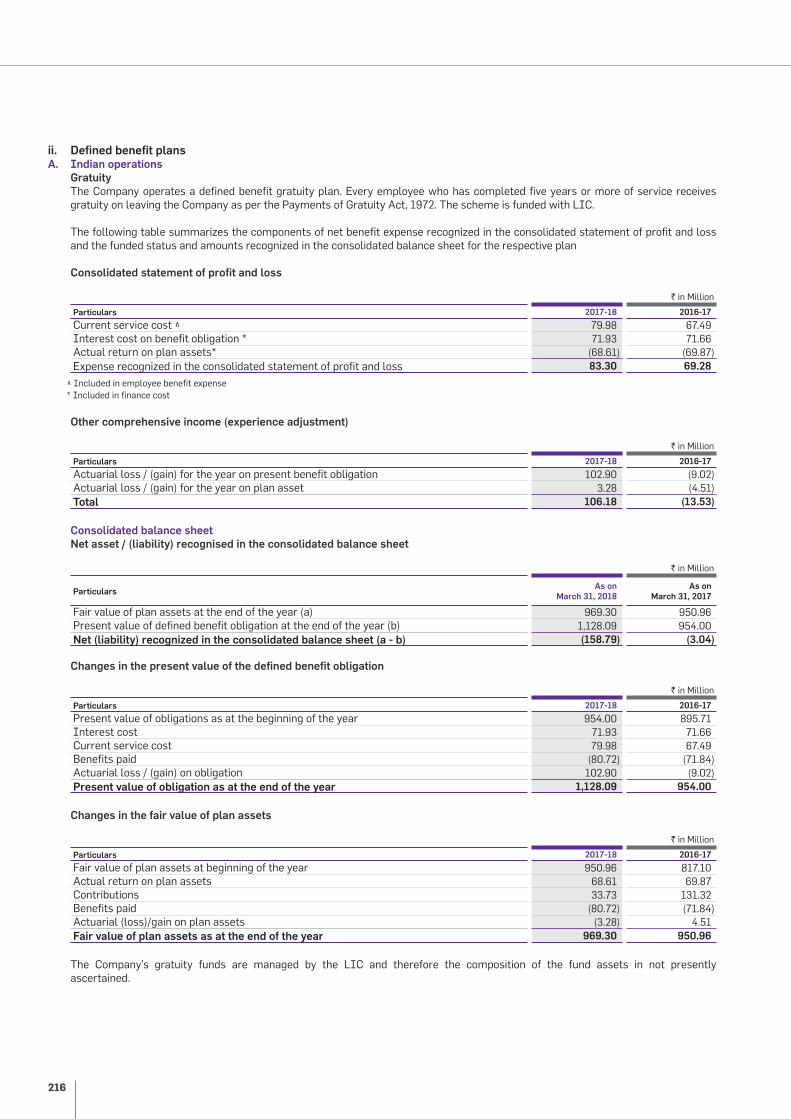
ii. Defined benefit plans A. Indian operations Gratuity The Company operates a defined benefit gratuity plan. Every employee who has completed five years or more of service receives
gratuity on leaving the Company as per the Payments of Gratuity Act, 1972. The scheme is funded with LIC.
The following table summarizes the components of net benefit expense recognized in the consolidated statement of profit and loss and the funded status and amounts recognized in the consolidated balance sheet for the respective plan
Consolidated statement of profit and loss
` in Million
Particulars 2017-18 2016-17
Current service cost ^ 79.98 67.49Interest cost on benefit obligation * 71.93 71.66Actual return on plan assets* (68.61) (69.87)Expense recognized in the consolidated statement of profit and loss 83.30 69.28
^ Included in employee benefit expense * Included in finance cost
Other comprehensive income (experience adjustment)
` in Million
Particulars 2017-18 2016-17
Actuarial loss / (gain) for the year on present benefit obligation 102.90 (9.02)Actuarial loss / (gain) for the year on plan asset 3.28 (4.51)Total 106.18 (13.53)
Consolidated balance sheet Net asset / (liability) recognised in the consolidated balance sheet
` in Million
ParticularsAs on
March 31, 2018As on
March 31, 2017
Fair value of plan assets at the end of the year (a) 969.30 950.96Present value of defined benefit obligation at the end of the year (b) 1,128.09 954.00Net (liability) recognized in the consolidated balance sheet (a - b) (158.79) (3.04)
Changes in the present value of the defined benefit obligation
` in Million
Particulars 2017-18 2016-17
Present value of obligations as at the beginning of the year 954.00 895.71Interest cost 71.93 71.66Current service cost 79.98 67.49Benefits paid (80.72) (71.84)Actuarial loss / (gain) on obligation 102.90 (9.02)Present value of obligation as at the end of the year 1,128.09 954.00
Changes in the fair value of plan assets
` in Million
Particulars 2017-18 2016-17
Fair value of plan assets at beginning of the year 950.96 817.10 Actual return on plan assets 68.61 69.87 Contributions 33.73 131.32 Benefits paid (80.72) (71.84)Actuarial (loss)/gain on plan assets (3.28) 4.51 Fair value of plan assets as at the end of the year 969.30 950.96
The Company’s gratuity funds are managed by the LIC and therefore the composition of the fund assets in not presently ascertained.
216

Principal assumptions for gratuity
ParticularsAs on
March 31, 2018 Rate (%)
As on March 31, 2017
Rate (%)
a) Discount rate 7.70 7.54b) Future salary increase* 6.00 6.00c) Expected rate of return on plan assets 8.00 8.40d) Retirement age (years) 58 58e) Mortality table IALM (2006-2008) IALM (2006-2008)f) Ages (withdrawal rate %) Up to 30 years 3.00 3.00 From 31 to 44 years 2.00 2.00 Above 44 years 1.00 1.00
* The estimates of future salary increase take into account inflation, seniority, promotion and other relevant factors. Estimated amount of contribution in the immediate next year is ` 94.70 Million (` 90.93 Million).
Sensitivity analysis of the defined benefit obligation
` in Million
Impact of change in Discount rate Salary increase Attrition rate
Present value of obligation as on March 31, 2018 1,128.09 1,128.09 1,128.09Impact due to increase of 0.50% (45.43) 49.82 11.15Impact due to decrease of 0.50% 49.25 (46.34) (12.25)
` in Million
Impact of change in Discount rate Salary increase Attrition rate
Present value of obligation as on March 31, 2017 954.00 954.00 954.00Impact due to increase of 0.50% (38.53) 42.17 9.84Impact due to decrease of 0.50% 41.74 (39.24) (11.27)
B. Foreign operations The pension liability as recorded in the consolidated balance sheet relates to the defined benefit plan of Apollo Vredestein GmbH and
Reifencom Gmbh. For the defined benefit plans of Apollo Vredestein GmbH and Reifencom Gmbh, actuarial calculation was performed by certified actuarial firms.
1 Apollo Vredestein GmbH Principal assumptions
ParticularsAs on
March 31, 2018 Rate (%)
As on March 31, 2017
Rate (%)
Inflation 1.75 1.75 Indexation non-active members 1.75 1.75 Mortality table Heubeck 2005G Heubeck 2005G Individual salary increase (dependent on age) 3.00 3.00 Discount rate 1.90 1.80
Changes in the present value of the defined benefit obligation
` in Million
Particulars 2017-18 2016-17
Defined benefit obligationPresent value of obligation as at the beginning of the year 583.34 607.91 Service cost 22.08 14.06 Interest cost 11.29 11.11 Benefits paid (20.31) (19.94)Remeasurements due to experience (13.74) 10.60 Remeasurements due to change in financial assumptions (11.47) 11.26
571.19 635.00 Foreign exchange translation differences 93.65 (51.66)Present value of obligation as at the end of the year 664.84 583.34
217Apollo Tyres Ltd Annual Report 2017-18
Corporate Overview / Statutory Reports / Financial Statements

Net asset / (liability) recognised in the consolidated balance sheet
` in Million
ParticularsAs on
March 31, 2018As on
March 31, 2017
Fair value of plan assets as at the end of the year (a) - - Present value of defined benefit obligation as at the end of the year (b) 664.84 583.34 Net (liability) recognized in the consolidated balance sheet (a - b) (664.84) (583.34)
Sensitivity analysis
Particulars Change in assumption Change in defined benefit obligation
Discount rate Increase by 1.00% (15.78)%Salary increase Increase by 0.50% 1.74%Inflation Increase by 0.25% 3.14%
2 Reifencom Gmbh Principal assumptions
ParticularsAs on
March 31, 2018 Rate (%)
As on March 31, 2017
Rate (%)
Inflation 1.75 1.75 Mortality table Heubeck 2005G Heubeck 2005GRetirement age (years) 65 65 Discount rate 1.90 1.80
Changes in the present value of the defined benefit obligation
` in Million
Particulars 2017-18 2016-17
Present value of obligation as at the beginning of the year / acquisition date 155.50 179.41 Service cost 8.44 7.90 Interest cost 3.06 3.33 Remeasurements due to experience (0.49) (0.54)Remeasurements due to change in financial assumptions (4.41) (20.46)
162.10 169.64 Foreign exchange translation difference 25.58 (14.14)Present value of obligation as at the end of the year 187.68 155.50
Changes in the fair value of plan assets
` in Million
Particulars 2017-18 2016-17
Fair value of plan assets as at the beginning of the year 108.75 115.48Return on plan assets 1.02 0.79 Interest income 2.14 2.15
111.91 118.42Foreign exchange translation difference 17.80 (9.67)Fair value of plan assets as at the end of the year 129.71 108.75
Net asset / (liability) recognised in the consolidated balance sheet
` in Million
ParticularsAs on
March 31, 2018 As on
March 31, 2017
Fair value of plan assets as at the end of the year (a) 129.71 108.75 Present value of defined benefit obligation as at the end of the year (b) 187.68 155.50 Net (liability) recognized in the consolidated balance sheet (a - b) (57.97) (46.75)
Sensitivity analysis
Particulars Change in assumption Change in defined benefit obligation
Discount rate Increase by 1.0% (21.41)%Inflation Increase by 0.25% 1.59%
218

iii Other long term employee benefits Long term compensated absences Principal assumptions for long term compensated absences
ParticularsAs on
March 31, 2018 Rate (%)
As on March 31, 2017
Rate (%)
a) Discount rate 7.70 7.54b) Future salary increase* 6.00 6.00c) Retirement age (years) 58 58d) Mortality table IALM (2006-
2008)IALM (2006-
2008)e) Ages (withdrawal rate %) Up to 30 years 3.00 3.00 From 31 to 44 years 2.00 2.00 Above 44 years 1.00 1.00
* The estimates of future salary increase take into account inflation, seniority, promotion and other relevant factors.
14 EMPLOYEES STOCK APPRECIATION RIGHTS (EMPLOYEES PHANTOM STOCK PLAN 2010)
a) During the year 2010-11, the Company had announced Cash-settled Employee Share-based Payment Plan (Phantom Stock Plan) for the eligible employees of the Company. Under the scheme, 1,200,000 phantom stock unit (“Units”) have been granted on April 1, 2010, 900,000 Units have been granted on April 1, 2011 and another 75,000 Units have been granted on April 1, 2012 by the board appointed committee. Vesting schedule for aforesaid three options are as follows:
Percentage of Grant Vesting Schedule
25% On 1st anniversary of respective grant date25% On 2nd anniversary of respective grant date25% On 3rd anniversary of respective grant date25% On 4th anniversary of respective grant date
Pursuant to the above scheme, the eligible employees are entitled to get cash compensation upon exercise of the Units within seven years of the vesting date.
b) As on March 31, 2017, all Units were vested and exercised. On April 1, 2016, 272,500 Units were exercised / vested. Accordingly, no share based payment expense was recognized during the current or previous year.
15 FINANCIAL INSTRUMENT
A) Capital risk management The capital structure of the Group consists of debt, cash and cash equivalents and equity attributable to equity shareholders which
comprises issued share capital (including premium) and accumulated reserves disclosed in the consolidated statement of changes in equity.
The Group’s capital management objective is to achieve an optimal weighted average cost of capital while continuing to safeguard the Group’s ability to meet its liquidity requirements (including its commitments in respect of capital expenditure) and repay loans as they fall due.
The Group manages its capital structure and makes adjustments in light of changes in economic conditions and the requirements of the financial covenants. To maintain or adjust the capital structure, the Group may adjust the dividend payment to shareholders, return capital to shareholders or issue new shares. The Group monitors capital using a gearing ratio, which is debt divided by total equity. The Group’s policy is to keep an optimum gearing ratio. The Group includes within debt, interest bearing loans and borrowings.
` in Million
As onMarch 31, 2018
As on March 31, 2017
Borrowings (refer note B16 and B20) 44,456.68 32,445.31Current maturities of non current borrowings (refer note B22) 2,154.76 1,920.20Debt (a) 46,611.44 34,365.51Equity (refer note B15) 572.05 509.02Other equity 97,194.67 72,390.52Total equity (b) 97,766.72 72,899.54Debt to equity ratio (a) / (b) 0.48 0.47
219Apollo Tyres Ltd Annual Report 2017-18
Corporate Overview / Statutory Reports / Financial Statements

B) Financial risk management a) Market risk The Group’s activities expose it primarily to the financial risk of changes in foreign currency exchange rates and changes in interest
rates. The Group enters into a variety of derivative financial instrument to manage its exposure to foreign currency and interest rates. There have been no major changes to the Group’s exposure to market risk or the manner in which it manages and measures the risk in recent past.
i) Currency risk The Group’s exposure arises mainly on import (of raw material and capital items) and export (of finished goods). Wherever possible, the
Group follows a policy of matching of import and export exposures (natural hedge) to reduce the net exposure in any foreign currency. However in European operations and at certain other subsidiaries, the natural hedge may not be available. Depending upon the risk and amount involved, certain derivatives are taken to minimize the impact of foreign currency fluctuations on the operations of the Group. Derivative counter parties are limited to high credit quality financial institutions. The local management continuously monitors the entity’s exposure to foreign currency risk as well as its use of derivative instruments as per the risk management policy of the respective entity.
Currency wise net exposure of the Group
` in Million
CurrencyAs on
March 31, 2018Sensitivity + 1% Sensitivity -1%
As on March 31, 2017
Sensitivity + 1% Sensitivity -1%
USD (11,101.96) (111.02) 111.02 (6,655.38) (66.55) 66.55 EURO (13,718.64) (137.19) 137.19 (8,726.12) (87.26) 87.26 GBP 248.38 2.48 (2.48) 370.56 3.71 (3.71)Others 1,346.48 13.46 (13.46) 967.10 9.67 (9.67)
ii) Interest rate risk The Group is exposed to interest rate risk because entities in
the Group borrows funds at both fixed and floating interest rates. The risk is managed by the Group by maintaining an appropriate mix between fixed and floating rate borrowings. The use of interest rate swaps are also entered into, especially to hedge the floating rate borrowings or to convert the foreign currency floating interest rates to the domestic currency floating interest rates.
b) Credit risk Credit risk is the risk that a counterparty will default on its
contractual obligations resulting in financial loss to the Group. All entities in the Group have their approved commercial policy based on which the credit risk is managed. The Group has adopted a policy of only dealing with creditworthy customers.
Trade receivables comprise a widespread customer base and each entity undertakes on going credit evaluations of the financial condition of its customers, which may be based on the information supplied by the credit rating agencies, publicly available financial information and its own trading records and trends. In many cases, an appropriate advance is taken from the customer. In other cases, the entities use various methods to limit the credit risk viz. credit insurance, bank guarantee, post dated cheques etc
On March 31, 2018, the Group did not consider there to be any significant concentration of credit risk which had not been adequately provided for. The carrying amount of the financial assets recorded in the financial statements, grossed up for any allowances for losses, represents the maximum exposure to credit risk.
c) Price risk One of the subsidiary in the Group has entered into commodity
future contracts which are transacted in standardised amounts on regulated exchanges.
The derivative financial instrument are measured at fair value through profit and loss and classified under Level 1 of the fair value measurement hierarchy.
d) Liquidity risk The Group manages liquidity risk by maintaining adequate
reserves and banking facilities, by continuously monitoring forecasts and actual cash flows and by matching the maturity profiles of financial assets and liabilities for each entity. The Group has established an appropriate liquidity risk management framework for each entity’s short term, medium term and long term funding requirement.
The below tables summarise the maturity profile of the Group’s financial assets and financial liabilites
i) Non derivative financial assets
` in Million
Particulars
As on March 31, 2018 As on March 31, 2017
Less than 1 year 1 to 5 years5 years and
aboveLess than 1 year 1 to 5 years
5 years and above
Non-interest bearing 23,353.91 1,062.80 157.73 18,011.07 997.96 17.49 Fixed interest rates instruments 11,026.00 - - 806.80 - -
220

ii) Non derivative financial liabilties
` in Million
Particulars
As on March 31, 2018 As on March 31, 2017
Less than 1 year 1 to 5 years5 years and
aboveLess than 1 year 1 to 5 years
5 years and above
Non-interest bearing 26,272.76 557.13 - 21,134.73 457.31 - Finance lease - deferred payment liabilities 63.29 51.75 26.44 45.82 96.84 26.65 Variable interest rate instruments 6,829.10 21,068.51 5,093.88 10,246.18 10,080.08 5,078.37 Fixed interest rates instruments 7,436.88 4,519.72 6,241.90 5,581.28 1,077.10 5,200.00
iii) Derivative assets / (liabilities)
` in Million
Particulars
As on March 31, 2018 As on March 31, 2017
Less than 1 year 1 to 5 years5 years and
aboveLess than 1 year 1 to 5 years
5 years and above
Net settled:– commodity future contract 1.38 - - - - -– commodity future contract (7.70) - - - - - – foreign currency forward
contracts, futures and options (180.15) - - (141.55) - - – foreign currency forward
contracts, futures and options 12.99 - - - - -Gross settled:– cross currency interest rate swaps - - - (87.10) - -– cross currency interest rate swaps 95.87 (131.60) 254.24 307.50 95.06 (142.64)Total (77.61) (131.60) 254.24 78.85 95.06 (142.64)
e) The below tables summarise the fair value of the financial asset / (liabilities):i) Fair value of derivative instruments carried at fair valiue
` in Million
ParticularsAs on
March 31, 2018As on
March 31, 2017Fair value hierarchy
(Level 1, 2 or 3) *
Derivative financial assets (a) - Foreign currency forward contracts, futures and options 12.99 - 2 - Cross currency interest rate swaps 350.11 402.56 2 - Commodity future contract 1.38 - 1Total 364.48 402.56Derivative financial liabilities (b) - Foreign currency forward contracts, futures and options 180.15 141.55 2 - Cross currency interest rate swaps 131.60 229.74 2 - Commodity future contract 7.70 - 1Total 319.45 371.29Net derivative financial asset (a- b) 45.03 31.27
ii) Fair Value of financial assets (other than derivative instruments) carried at fair value:
` in Million
ParticularsAs on
March 31, 2018As on
March 31, 2017Fair value hierarchy
(Level 1, 2 or 3) *
Financial assets– Current investments- mutual funds 3,640.47 3,444.44 1– Non current investments - quoted 2.76 8.23 1– Non current investments - unquoted 9.25 9.26 3Total 3,652.48 3,461.93
221Apollo Tyres Ltd Annual Report 2017-18
Corporate Overview / Statutory Reports / Financial Statements

iii) Fair value of financial assets / liabilities (other than investment in joint venture and associates) that are not measured at fair value:
The management considers that the carrying amount of financial assets and financial liabilities recognised at amortised cost in the consolidated balance sheet approximates their fair value.
* Level 1 - Quoted price in an active market.
Level 2 - Discounted cash flow. Future cash flows are estimated based on forward exchange rates and contract rates, discounted at a rate that reflects the credit risk of various counterparties.
Level 3 - Discounted cash flow method is used to capture the present value of the expected future economic benefits that will flow to the Group.
f) Details of outstanding forward exchange contracts #
Currency pair CurrencyCurrency value
(Million)Average exchange
rateNominal value
(Million)Buy/Sell
As on March 31, 2018USD / INR US dollar 48.50 65.18 3,161.23 BuyEUR / INR Euro 31.25 80.25 2,507.94 SellUSD / ZAR US dollar 2.25 11.84 26.64 SellUSD / MYR US dollar 0.50 3.94 1.97 Buy USD / EUR US dollar 3.65 0.82 3.00 Buy EUR / CHF Swiss franc 0.90 0.85 0.76 Sell EUR / GBP British pound 1.18 1.12 1.31 Sell EUR / PLN Polish zloty 6.50 0.24 1.54 Sell EUR / SEK Swedish krona 18.75 0.10 1.91 Sell Futures and optionsUSD / INR US dollar 34.00 65.18 2,216.12 Buy Cross currency interest rate swapsUSD / INR US dollar 126.42 65.18 8,240.06 Buy Commodity future contract US dollar 3.13 65.18 204.01 Buy / Sell As on March 31, 2017USD / INR US dollar 56.50 67.34 3,804.90 BuyEUR / INR Euro 25.00 73.61 1,840.19 SellUSD / ZAR US dollar 2.38 14.03 33.40 SellUSD / THB US dollar 2.00 35.10 70.20 BuyEUR / USD Euro 0.92 1.08 1.00 SellFutures and optionsUSD / INR US dollar 20.80 67.34 1,400.74 Buy Cross currency interest rate swapsUSD / INR US dollar 44.75 67.34 3,013.62 Buy
# For fair value of forward exchange contracts, refer note C15 (e)(i).
16 STATUTORY AUDITOR’S REMUNERATION
` in Million
Particulars 2017-18 2016-17
For audits, quarterly reviews and certification 56.68 51.82 For Company law matters - 0.40 For other services * # 18.05 5.89 Total 74.73 58.11
* Includes ` 3.63 Million expense paid in relation to qualified institutional placement process (debited to securities premium). # Includes payment to erstwhile auditor amounting to ` 4.77 Million.
17 RESEARCH AND DEVELOPMENT EXPENDITURE
` in Million
Particulars 2017-18 2016-17
(A) Revenue expenditureEmployee benefit expenses 1,119.38 966.80 Travelling, conveyance and vehicle 186.37 146.67 Others 627.29 855.74 Total 1,933.04 1,969.21 (B) Capital expenditure 1,294.36 868.93 Total (A + B) 3,227.40 2,838.14
222

18 CONTINGENT LIABILITIES
` in Million
ParticularsAs on
March 31, 2018As on
March 31, 2017
Sales tax 220.27 39.64 Income tax # 42.20 265.80 Claims against the Group not acknowledged as debt- Employee related 74.02 58.18 - Others 33.30 67.77 Excise duty and service tax * 167.05 137.50
# Excludes amount of ` 441.66 Million (` 441.66 Million) in appeals which have been decided by Appellate authorities in the Company’s favour but on which the department has gone for further appeal and a demand of ` 667.12 Million (` 663.70 Million) relating to the adjustments made in MAT computation, which in the opinion of the Company, is not sustainable and the probability of cash outflow is considered remote.
* Show-cause notices received from various Government Agencies pending formal demand notices have not been considered as contingent liabilities. In the opinion of the management, no provision is considered necessary for the disputes mentioned above on the ground that there are fair chances of successful
outcome of appeals.
19 CAPITAL COMMITMENTS
` in Million
ParticularsAs on
March 31, 2018As on
March 31, 2017
Estimated amount of contracts remaining to be executed on capital account and not provided for 7,311.53 15,471.55
20 DISCLOSURES REQUIRED UNDER SECTION 22 OF THE MICRO, SMALL AND MEDIUM ENTERPRISES DEVELOPMENT ACT, 2006
` in Million
ParticularsAs on
March 31, 2018As on
March 31, 2017
(i) Principal amount remaining unpaid to any supplier as at the end of the accounting year 150.98 48.56 (ii) Interest due thereon remaining unpaid to any supplier as at the end of the
accounting year 10.58 10.58 (iii) The amount of interest paid along with the amounts of the payment made to the
supplier beyond the appointed day - - (iv) The amount of interest due and payable for the year - - (v) The amount of interest accrued and remaining unpaid at the end of the accounting year 10.58 10.58 (vi) The amount of further interest due and payable even in the succeeding year, until such
date when the interest dues as above are actually paid 10.58 10.58
Dues to Micro and Small Enterprises have been determined to the extent such parties have been identified on the basis of information collected by the Management. This has been relied upon by the auditors.
21 EXPENDITURE TOWARDS CORPORATE SOCIAL RESPONSIBILITY (CSR) ACTIVITIES-
In accordance with the provisions of section 135 of the Act, the Board of Directors of the Company had constituted a CSR committee. The details for CSR activities are as follows:
` in Million
Particulars 2017-18 2016-17
i) Gross amount required to be spent by the Company during the year 215.66 184.37 ii) Amount spent during the year on the following: (a) Construction / acquisition of any asset - - (b) On purposes other than (a) above 215.68 185.00 Total 215.68 185.00
223Apollo Tyres Ltd Annual Report 2017-18
Corporate Overview / Statutory Reports / Financial Statements

22 FOLLOWING SUBSIDIARIES, JOINT VENTURE AND ASSOCIATES HAVE BEEN CONSIDERED IN THE PREPARATION OF THE CONSOLIDATED FINANCIAL STATEMENTS:
S. no.
Name of the entity RelationshipCountry of incorporation
Ownership held by
% of holding and voting power either directly or indirectly
through subsidiaryRemarks
As on March 31,
2018
As on March 31,
2017
1 Apollo Tyres (Cyprus) Pvt Ltd Subsidiary Cyprus Apollo Tyres Ltd.100% 100%
Note (a) & (b)
2 Apollo Tyres (Greenfield) B.V. Subsidiary Netherlands Apollo Tyres Ltd. 100% 100%3 Apollo Tyres Cooperatief U.A.
(Apollo Coop)Subsidiary Netherlands Apollo Tyres Ltd.
and Apollo Tyres (Greenfield) B.V. 100% 100%
Note (b)
4 Apollo (South Africa) Holdings (Pty) Ltd (ASHPL)
Subsidiary South Africa Apollo Coop100% 100%
5 Apollo Tyres Africa (Pty) Ltd Subsidiary South Africa ASHPL 100% 100%6 Apollo Tyres (Thailand)
LimitedSubsidiary Thailand Apollo Coop
100% 100%7 Apollo Tyres (Middle East) FZE Subsidiary Dubai Apollo Coop 100% 100%8 Apollo Tyres Holdings
(Singapore) Pte Ltd (ATHS)Subsidiary Singapore Apollo Coop
100% 100%9 ATL Singapore Pte Ltd. Subsidiary Singapore ATHS 100% - Note (e)10 Apollo Tyres (Malaysia) SDN
BHDSubsidiary Malaysia ATHS
100% 100%11 Apollo Tyres (UK) Pvt Ltd
(ATUK)Subsidiary United Kingdom Apollo Coop
100% 100%12 Apollo Tyres (London) Pvt Ltd Subsidiary United Kingdom ATUK 100% 100%13 Apollo Tyres Global R&D B.V. Subsidiary Netherlands Apollo Coop 100% 100%14 Apollo Tyres (Germany) GmbH Subsidiary Germany Apollo Coop 100% 100%15 Apollo Tyres AG Subsidiary Switzerland Apollo Coop 100% 100%16 Apollo Tyres Do (Brasil) Ltda Subsidiary Brazil Apollo Coop and
ATBV 100% 100%17 Apollo Tyres B.V. (ATBV) Subsidiary Netherlands Apollo Coop 100% 100%18 Apollo Tyres (Hungary) Kft.
(ATH Kft)Subsidiary Hungary ATBV
100% 100%19 Apollo Vredestein B.V. (AVBV) Subsidiary Netherlands ATBV 100% 100%20 Apollo Vredestein GmbH (AV
GmbH)Subsidiary Germany AVBV
100% 100%21 Vredestein Marketing B.V. &
Co. KGSubsidiary Germany AV GmbH
100% 100%22 Apollo Vredestein Nordic A.B. Subsidiary Sweden AVBV 100% 100%23 Apollo Vredestein UK Limited Subsidiary United Kingdom AVBV and Finlo B.V. 100% 100%24 Apollo Vredestein France SAS Subsidiary France AVBV and Finlo B.V. 100% 100%25 Apollo Vredestein Belux Subsidiary Belgium AVBV and Finlo B.V. 100% 100%26 Apollo Vredestein Gesellschaft
m.b.H.Subsidiary Austria AVBV
100% 100%27 Apollo Vredestein Schweiz AG Subsidiary Switzerland AVBV 100% 100%28 Apollo Vredestein Italia Srl Subsidiary Italy AVBV and Finlo B.V. 100% 100% Note (a)29 Apollo Vredestein Iberica SA Subsidiary Spain AVBV 100% 100%30 Apollo Vredestein Tires Inc. Subsidiary USA Apollo Coop 100% 100% Note (c)31 Apollo Vredestein Kft (AV Kft) Subsidiary Hungary AVBV 100% 100%32 S.C. Vredesetin R.O. Srl Subsidiary Romania AV Kft 100% 100%33 Apollo Vredestein Opony
Polska Sp. Zo.o. Subsidiary Poland AVBV and AV GmbH
100% 100%34 Vredestein Consulting B.V. Subsidiary Netherlands AVBV 100% 100%35 Finlo B.V. Subsidiary Netherlands AVBV 100% 100%
224

S. no.
Name of the entity RelationshipCountry of incorporation
Ownership held by
% of holding and voting power either directly or indirectly
through subsidiaryRemarks
As on March 31,
2018
As on March 31,
2017
36 Vredestein Marketing B.V. Subsidiary Netherlands AVBV 100% 100%37 Reifencom GmbH, Bielefeld Subsidiary Germany Apollo Coop 100% 100%38 Reifencom GmbH, Hannover Subsidiary Germany Reifencom GmbH,
Bielefeld 100% 100%39 Reifencom
Einkaufsgesellschaft, mbH & Co. OHG, Hannover
Subsidiary Germany Reifencom GmbH, Bielefeld and Reifencom GmbH, Hannover 100% 100%
40 Reifencom Tyre (Qingdao) Co., Ltd.
Subsidiary China Reifencom Einkaufsgesellschaft, mbH & Co. OHG, Hannover 100% 100%
41 Saturn F1 Pvt Ltd Subsidiary United Kingdom Apollo Coop 100% 100% Note (d)42 Retail Distribution Holding B.V. Subsidiary Netherlands Apollo Coop 100% 100% Note (d)43 Rubber Research LLC Subsidiary USA Apollo Coop 100% 100% Note (d)44 Pan Aridus LLC Joint Venture USA ATHS 50.00% 50.00% Note (f)45 Pressurite (Pty) Limited Associate South Africa ASHPL 28.00% 28.00% Note (g)46 KT Telematic Solutions
Private LimitedAssociate India Apollo Tyres Ltd.
14.00% - Note (h)Notes (a) Under liquidation (b) During previous year, subsequent to the merger of Apollo (Mauritius) Holdings Pvt Ltd with Apollo Tyres Ltd, these investments were transferred in the name of
Apollo Tyres Ltd. (c) During the previous year, investment in Apollo Vredestein Tires Inc was transferred by AVBV to Apollo Coop as a part of group restructuring.(d) Incorporated during the previous year. (e) Incorporated during the year. (f) During the previous year, provision has been made for impairment of the investment in Pan Aridus LLC. (g) The investment in Pressurite (Pty) Ltd, an associate of ASHPL, has been fully impaired in the prior years and the Group discontinued recognizing further losses in
accordance with Ind As 28 Investments in Associates and Joint Ventures. Further, the Group does not have any further obligations to satisfy with regard to this associate.
(h) Became an associate of the Company w.e.f. February 21, 2018.
23 DISCLOSURE OF RELATED PARTY TRANSACTIONS IN ACCORDANCE WITH IND AS 24 RELATED PARTY DISCLOSURES
i) Name of the related parties
Particulars 2017-18 2016-17
Companies in which directors are interested
Apollo International Ltd. Apollo International Ltd.Apollo International Trading LLC, Middle East Apollo International Trading LLC, Middle EastEncorp E Services Ltd. Encorp E Services Ltd.UFO Moviez India Ltd. UFO Moviez India Ltd.Landmark Farms & Housing (P) Ltd. Landmark Farms & Housing (P) Ltd.Sunlife Tradelinks (P) Ltd. Sunlife Tradelinks (P) Ltd.N.A. Bespoke Tours & Travels Ltd.Dusk Valley Technologies Ltd. Dusk Valley Technologies Ltd.Classic Auto Tubes Ltd. Classic Auto Tubes Ltd.PTL Enterprises Ltd. PTL Enterprises Ltd.Apollo Finance Ltd. Apollo Finance Ltd.Artemis Medicare Services Ltd. Artemis Medicare Services Ltd.Artemis Health Sciences Ltd. Artemis Health Sciences Ltd.Shardul Amarchand Mangaldas & Co. Shardul Amarchand Mangaldas & Co.Regent Properties Regent PropertiesSwaranganga Consultants Pvt. Ltd. Swaranganga Consultants Pvt. Ltd.J & S Systems Corporation, U.K. J & S Systems Corporation, U.K.Sacred Heart Investment Co. Pvt. Ltd. Sacred Heart Investment Co. Pvt. Ltd.Milers Global Pvt. Ltd. Milers Global Pvt. Ltd.
AssociatesPressurite (Pty) Ltd. Pressurite (Pty) Ltd.KT Telematic Solutions Private Limited (Note (a)) N.A.
225Apollo Tyres Ltd Annual Report 2017-18
Corporate Overview / Statutory Reports / Financial Statements

Particulars 2017-18 2016-17
Joint venture Pan Aridus LLC Pan Aridus LLC
Key management personnel
Mr. Onkar S. Kanwar Mr. Onkar S. KanwarMr. Neeraj Kanwar Mr. Neeraj KanwarMr. Akshay Chudasama Mr. Akshay Chudasama Mr. A.K. Purwar Mr. A.K. PurwarGen. Bikram Singh (Retd.) Gen. Bikram Singh (Retd.)Mr. Francesco Gori Mr. Francesco GoriMr. Paul Antony Mr. Paul AntonyMr. Nimesh N. Kampani Mr. Nimesh N. KampaniMs. Pallavi Shroff Ms. Pallavi ShroffMr. Robert Steinmetz Mr. Robert SteinmetzMr. Sunam Sarkar Mr. Sunam SarkarDr. S. Narayan Dr. S. NarayanMr. Vikram S. Mehta Mr. Vikram S. Mehta Mr. Vinod Rai Mr. Vinod RaiMs. Anjali Bansal (Note (b)) N.A.Dr. M Beena (Note (b)) N.A.
Note: Related parties and their relationships are as identified by the management and relied upon by the auditors. (a) Invested during the year (b) Appointed during the year
ii) Transactions and balances with related partiesa) Companies in which directors are interested
` in Million
Particulars FY 2017-18 FY 2016-17
Description of transactions:Sales: finished goodsApollo International Trading LLC, Middle East - 2.40Apollo International Ltd. 721.21 1,236.31
721.21 1,238.71Sales: raw materialsClassic Auto Tubes Ltd. 62.04 21.42
Cross charge of management & other expenses received:PTL Enterprises Ltd. 0.85 0.87Classic Auto Tubes Ltd. 1.71 1.74Artemis Medicare Services Ltd. 0.71 0.63
3.27 3.24Rent received:PTL Enterprises Ltd. 0.37 0.33Bespoke Tours & Travels Ltd. - 0.23Classic Auto Tubes Ltd. 1.06 0.10
1.43 0.66Reimbursement of expenses received:Classic Auto Tubes Ltd. 7.44 6.95PTL Enterprises Ltd. - 0.02Apollo International Ltd. 0.60 0.15
8.04 7.12Purchase of assets:Classic Auto Tubes Ltd. 872.57 823.77Bespoke Tours & Travels Ltd. - 2.01Artemis Medicare Services Ltd. 23.44 -
896.01 825.78Legal and professional charges paid:Shardul Amarchand Mangaldas & Co. 12.84 11.76
Reimbursement of expenses paid:PTL Enterprises Ltd. 588.74 552.58Classic Auto Tubes Ltd. 188.57 371.39Milers Global Pvt. Ltd. 0.12 -
777.43 923.97
226

` in Million
Particulars FY 2017-18 FY 2016-17
Payment for services received:Artemis Medicare Services Ltd. 20.34 17.28Classic Auto Tubes Ltd. 1.69 0.62
22.03 17.90Lease rent paid:PTL Enterprises Ltd. 567.92 504.38
Rent paid:Sunlife Tradelinks (P) Ltd. 27.01 27.19Landmark Farms & Housing (P) Ltd. 24.20 24.00Regent Properties 21.60 21.60Classic Auto Tubes Ltd. 0.12 0.12Milers Global Pvt. Ltd. 3.01 3.03
75.94 75.94Conversion charges paid:Classic Auto Tubes Ltd. 1,097.45 1,008.29
Mixing charges paid:Classic Auto Tubes Ltd. 250.38 315.65
Travelling expenses paid:Bespoke Tours & Travels Ltd. - 71.41
Conference expenses:Bespoke Tours & Travels Ltd. - 7.06
Sale of assets:Classic Auto Tubes Ltd. - 3.00
Security deposits given:PTL Enterprises Ltd. 100.00 -
Amount outstanding:Other non current assets (financial / non-financial):PTL Enterprises Ltd. 600.00 500.00Sunlife Tradelinks (P) Ltd. 5.86 5.86Landmark Farms & Housing (P) Ltd. 6.00 6.00Regent Properties 5.40 5.40Milers Global Pvt. Ltd. 0.75 0.75Classic Auto Tubes Ltd. 73.89 106.45
691.90 624.46Trade receivable:Classic Auto Tubes Ltd. 8.14 1.54Apollo International Ltd. 44.17 116.03
52.31 117.57Other current assets (non-financial):PTL Enterprises Ltd. 36.31 56.43Apollo International Ltd. 0.67 0.15Classic Auto Tubes Ltd. 1.46 0.62Artemis Medicare Services Ltd. 0.71 -
39.15 57.20Trade payable:Classic Auto Tubes Ltd. 99.73 31.26Landmark Farms & Housing (P) Ltd. 1.98 - Milers Global Pvt. Ltd. 0.12 -
101.83 31.26Other current liabilities (financial):Classic Auto Tubes Ltd. 69.66 27.37Apollo International Ltd. 0.52 -
70.18 27.37
227Apollo Tyres Ltd Annual Report 2017-18
Corporate Overview / Statutory Reports / Financial Statements

b) Associates
` in Million
Particulars 2017-18 2016-17
Investments made:KT Telematic Solutions Private Limited 22.50 -
c) Key management personnel (KMP)
` in Million
Particulars FY 2017-18 FY 2016-17
Managerial remuneration:Mr. Onkar S. Kanwar 495.82 457.37Mr. Neeraj Kanwar 446.40 308.90
942.22 766.27 Sitting fees:Mr. Akshay Chudasama 1.70 1.20Mr. A.K. Purwar 0.70 0.50Ms. Anjali Bansal 0.50 - Gen. Bikram Singh (Retd.) 0.90 0.70Mr. Francesco Gori 0.60 0.40Dr. M Beena 0.10 -Mr. Nimesh N. Kampani 1.10 0.60Ms. Pallavi Shroff 0.90 0.40Mr. Paul Antony 0.30 0.20Mr. Robert Steinmetz 1.00 0.70Mr. Sunam Sarkar 2.00 0.80Dr. S. Narayan 1.60 1.00Mr. Vikram S. Mehta 0.60 0.50Mr. Vinod Rai 0.70 0.50
12.70 7.50Commission:Mr. Akshay Chudasama 4.83 5.00Mr. A.K. Purwar 4.83 5.00Ms. Anjali Bansal 2.00 -Gen. Bikram Singh (Retd.) 4.84 5.00Mr. Francesco Gori 4.83 5.00Mr. Nimesh N. Kampani 4.83 5.00Ms. Pallavi Shroff 4.84 5.00Mr. Paul Antony / Dr. M Beena 4.83 5.00Mr. Robert Steinmetz 4.83 5.00Mr. Sunam Sarkar 4.84 5.00Dr. S. Narayan 4.83 5.00Mr. Vikram S. Mehta 4.83 5.00Mr. Vinod Rai 4.84 5.00
60.00 60.00
Certain KMP’s also participate in post employment benefits plans prepared by the Company. The amount in respect of these towards the KMP’s cannot be segregated as these are based on actuarial valuation for all employees of the Company.
24 SEGMENTAL REPORTING
The Group’s operations comprise of only one business segment – Automobile Tyres, Automobile Tubes & Automobile Flaps in the context of reporting business/geographical segment as required under Ind AS 108 - Operating Segments.
Based on the “management approach” as defined in Ind-AS 108 - Operating Segments, the Chief Operating Decision Maker evaluates the Company’s performance and allocates resources based on an analysis of various performance indicators by business segment. Accordingly, information has been presented along these business segments which have been defined based on the geographical presence of various entities:
a) APMEA (Asia Pacific, Middle East and Africa) b) Europe c) Others
APMEA segment includes manufacturing and sales operation through India and include entities in UAE, Thailand, Malaysia and South Africa. Europe segment includes manufacturing and sales operation through the entities in Europe. Others segment includes sales operations in Americas and all other corporate entities.
228

The
acc
ount
ing
prin
cipl
es u
sed
in t
he p
repa
ratio
n of
the
con
solid
ated
fina
ncia
l sta
tem
ents
are
con
sist
entl
y ap
plie
d in
indi
vidu
al s
egm
ent
to p
repa
re s
egm
ent
repo
rtin
g.
` in
Mill
ion
Par
ticu
lars
AP
ME
AE
urop
eO
ther
sE
limin
atio
nsTo
tal
2017
-18
2016
-17
2017
-18
2016
-17
2017
-18
2016
-17
2017
-18
2016
-17
2017
-18
2016
-17
1. R
even
ueTo
tal r
even
ue 1
06,
885.
61
10
1,12
1.22
4
6,29
1.91
4
2,93
7.38
2
8,0
81.6
9 1
5,0
37.2
4 (3
0,3
05.
08)
(17,
396.
28)
150
,954
.13
141
,699
.56
Inte
r se
gmen
t re
venu
e (2
,029
.57)
(1,9
75.7
5) (9
04.
08)
(779
.06)
(27,
371.
43)
(14,
641.
47)
30
,30
5.0
8 1
7,39
6.28
-
-
E
xter
nal r
even
ue 1
04
,856
.04
9
9,14
5.4
7 4
5,38
7.83
4
2,15
8.32
7
10.2
6 3
95.7
7 -
-
1
50,9
54.1
3 1
41,
699.
56
2. R
esul
tS
egm
ent
resu
lt 9
,863
.84
11,
781.
50
1,1
97.3
2 3
,093
.12
953
.72
411
.36
(262
.38)
10
1.33
1
1,75
2.50
1
5,38
7.31
In
tere
st e
xpen
se (1
,375
.55)
(889
.16)
(220
.43)
(10
5.86
) (2
08.
84)
(110
.70
) 1
75.6
2 7
6.91
(1
,629
.20
) (1
,028
.81)
Sha
re o
f pro
fit /
(los
s) in
ass
ocia
te /
join
t ve
ntur
e -
-
-
-
0
.01
(3.0
5) -
-
0
.01
(3.0
5)E
xcep
tiona
l ite
ms
-
-
-
-
-
-
-
-
-
-
Inco
me
taxe
s (2
,458
.43)
(2,8
19.8
3) (3
09.
40)
(513
.17)
(116
.66)
(32.
46)
-
-
(2,8
84.4
9) (3
,365
.46)
Net
pro
fit a
fter
tax
6,0
29.8
6 8
,072
.51
667
.49
2,4
74.0
9 6
28.2
3 2
65.
15
(86.
76)
178
.24
7
,238
.82
10
,989
.99
3. O
ther
Inf
orm
atio
nD
epre
ciat
ion
and
amor
tisat
ion
3,65
6.34
2,89
5.46
2,12
8.41
1,62
3.55
140
.79
99.1
2 -
-
5,
925.
544,
618.
13
` in
Mill
ion
Par
ticu
lars
AP
ME
AE
urop
eO
ther
sE
limin
atio
nsTo
tal
As
on M
arch
31
, 20
18A
s on
Mar
ch
31, 2
017
As
on M
arch
31
, 20
18A
s on
Mar
ch
31, 2
017
As
on M
arch
31
, 20
18A
s on
Mar
ch
31, 2
017
As
on M
arch
31
, 20
18A
s on
Mar
ch
31, 2
017
As
on M
arch
31
, 20
18A
s on
Mar
ch
31, 2
017
Seg
men
t as
sets
110
,667
.46
88,
571.
11
87,
930
.71
61,
882.
99
10
,443
.97
6,9
64.3
1 (7
,50
9.69
) (4
,457
.23)
20
1,53
2.45
1
52,9
61.1
8 S
egm
ent
liabi
litie
s 5
9,47
7.94
4
6,29
8.56
4
5,0
99.0
9 3
3,55
4.42
6
,590
.87
4,6
35.8
0
(7,4
02.
17)
(4,4
27.1
4) 1
03,
765.
73
80
,061
.64
Cap
ital e
mpl
oyed
51,
189.
52
42,
272.
55
42,
831.
62
28,
328.
57
3,8
53.1
0
2,3
28.5
1 (1
07.
52)
(30
.09)
97,
766.
72
72,
899.
54
Non
-cur
rent
ass
ets*
65,
022
.86
55,
894.
82
60
,988
.67
41,
715.
68
1,6
28.5
5 1
,354
.77
-
-
127
,640
.08
98,
965.
27
*Non
-cur
rent
ass
ets
cons
ists
of p
rope
rty,
pla
nt a
nd e
quip
men
t, ot
her
inta
ngib
le a
sset
s, c
apita
l wor
k-in
-pro
gres
s, in
tang
ible
ass
ets
unde
r de
velo
pmen
t an
d ca
pita
l adv
ance
s.
Info
rmat
ion
ab
out
maj
or c
ust
omer
s N
one
of
the
indi
vidu
al
cust
omer
ac
coun
ted
for
mor
e th
an
10%
of
th
e co
nsol
idat
ed
reve
nue
for
the
year
s en
ded
Mar
ch
31,
2018
an
d M
arch
31,
20
17.
229Apollo Tyres Ltd Annual Report 2017-18
Corporate Overview / Statutory Reports / Financial Statements

25
AD
DIT
ION
AL
IN
FO
RM
AT
ION
, AS
RE
QU
IRE
D U
ND
ER
SC
HE
DU
LE
III
TO
TH
E C
OM
PA
NIE
S A
CT,
20
13 O
F E
NT
ITIE
S C
ON
SO
LID
AT
ED
S.
No
Nam
e of
the
enti
ty
Net
ass
ets
as
on
Mar
ch 3
1, 2
018
Sha
re in
pro
fit o
r lo
ss
for
the
year
end
ed
Mar
ch 3
1, 2
018
Sha
re in
oth
er
com
preh
ensi
ve in
com
e
for
the
year
end
ed
Mar
ch 3
1, 2
018
Sha
re in
tota
l co
mpr
ehen
sive
inco
me
fo
r th
e ye
ar e
nded
M
arch
31,
20
18
As
a %
of
cons
olid
ated
ne
t ass
ets
` in
Mill
ion
As
a %
of
cons
olid
ated
pr
ofit o
r (l
oss)
` in
Mill
ion
As
a %
of
cons
olid
ated
ot
her
com
preh
ensi
ve
inco
me
` in
Mill
ion
As
a %
of
cons
olid
ated
to
tal
com
preh
ensi
ve
inco
me
` in
Mill
ion
Com
pany
1A
poll
o Ty
res
Lim
ited
74.
26
72,
606.
11
85.
98
6,2
23.8
8 1
.39
64.
25
53.
01
6,2
88.1
3 Fo
reig
n su
bsid
iari
es2
Apo
llo
Tyre
s (C
ypru
s) P
vt L
td
0.1
8 1
80.1
7 0
.06
4.4
5 -
-
0
.04
4.4
5 3
Apo
llo
Tyre
s (G
reen
field
) B.V
. 0
.03
27.
92
0.4
7 3
4.0
1 -
-
0
.29
34.
01
4A
poll
o Ty
res
Coo
pera
tief U
.A. &
Oth
ers
(ref
er N
ote
1 be
low
)15
0.5
414
7,17
6.41
3.73
269.
90 0
.68
31.
32
2.54
301.
22In
dian
ass
ocia
teK
T T
elem
atic
s S
olut
ions
Pri
vate
Lim
ited
-
-
0.0
0
0.0
1 -
-
0
.00
0
.01
Fore
ign
asss
ocia
teP
ress
urite
(Pty
) Ltd
-
-
-
-
-
-
-
-
Fore
ign
join
t ven
ture
Pan
Ari
dus
LLC
-
-
-
-
-
-
-
-
Add
/ (L
ess)
: Eff
ect
of a
djus
tmen
ts /
elim
inat
ions
ari
sing
ou
t of
con
solid
atio
n (1
25.0
1) (1
22,2
23.8
9)9.
7670
6.57
97.
93
4,5
26.7
0
44.1
25,
223.
27To
tal
10
0.0
0
97,
766.
72
10
0.0
0
7,2
38.8
2 1
00
.00
4
,622
.27
10
0.0
0
11,
861.
09
230

Note 1 Apollo Tyres Cooperatief U.A. and Others:
` in Million
S. No
Name of the entityNet assets
as on March 31, 2018
Share in profit or loss
for the year ended March 31, 2018
Share in other comprehensive
income for the year ended
March 31, 2018
Share in total comprehensive
income for the year ended
March 31, 2018
1 Apollo Tyres Cooperatief U.A. (Apollo Coop) 48,843.42 14.39 - 14.392 Apollo (South Africa) Holdings (Pty) Ltd (ASHPL) 359.63 0.26 - 0.26 3 Apollo Tyres Africa (Pty) Ltd 207.08 (53.05) - (53.05)4 Apollo Tyres (Thailand) Limited 255.84 (16.81) - (16.81)5 Apollo Tyres (Middle East) FZE 116.47 (67.07) - (67.07)6 Apollo Tyres Holdings (Singapore) Pte Ltd (ATHS) 1,363.64 668.99 - 668.99 7 ATL Singapore Pte Ltd. 307.19 (18.21) - (18.21)8 Apollo Tyres (Malaysia) SDN BHD 73.80 (16.93) - (16.93)9 Apollo Tyres (UK) Pvt Ltd (ATUK) 1,457.65 44.04 - 44.04 10 Apollo Tyres (London) Pvt Ltd 955.99 - - - 11 Apollo Tyres Global R&D B.V. 732.58 161.31 - 161.31 12 Apollo Tyres (Germany) GmbH 87.12 15.75 - 15.75 13 Apollo Tyres AG 104.75 (12.40) - (12.40)14 Apollo Tyres Do (Brasil) Ltda 6.66 (0.04) - (0.04)15 Apollo Tyres B.V. (ATBV) 39,469.37 596.31 - 596.31 16 Apollo Tyres (Hungary) Kft. (ATH Kft) 20,540.03 (2,191.95) - (2,191.95)17 Apollo Vredestein B.V. (AVBV) 21,778.36 1,673.46 - 1,673.46 18 Apollo Vredestein GmbH (AV GmbH) 5,769.65 (153.42) 27.18 (126.24)19 Vredestein Marketing B.V. & Co. KG 2,676.68 (80.25) - (80.25)20 Apollo Vredestein Nordic A.B. 73.68 21.48 - 21.48 21 Apollo Vredestein UK Limited 152.24 16.76 - 16.76 22 Apollo Vredestein France SAS 256.56 9.22 - 9.22 23 Apollo Vredestein Belux 72.05 33.86 - 33.86 24 Apollo Vredestein Gesellschaft m.b.H. (69.00) (78.80) - (78.80)25 Apollo Vredestein Schweiz AG 314.91 13.66 - 13.66 26 Apollo Vredestein Italia Srl (99.42) (11.17) - (11.17)27 Apollo Vredestein Iberica SA 390.20 6.72 - 6.72 28 Apollo Vredestein Tires Inc. (49.43) (217.13) - (217.13)29 Apollo Vredestein Kft (AV Kft) 9.84 (1.14) - (1.14)30 S.C. Vredesetin R.O. Srl - - - - 31 Apollo Vredestein Opony Polska Sp. Zo.o. 146.10 3.65 - 3.65 32 Vredestein Consulting B.V. 289.74 4.22 - 4.22 33 Finlo B.V. (18.06) - - - 34 Vredestein Marketing B.V. 2.01 - - - 35 Reifencom GmbH, Bielefeld 189.75 3.03 2.73 5.76 36 Reifencom GmbH, Hannover 162.36 (41.16) 1.41 (39.75)37 Reifencom Einkaufsgesellschaft, mbH
& Co. OHG, Hannover 133.90 3.56 - 3.56 38 Reifencom Tyre (Qingdao) Co., Ltd. 0.03 0.03 - 0.03 39 Saturn F1 Pvt Ltd 113.04 (61.27) - (61.27)40 Retail Distribution Holding B.V. - - - - 41 Rubber Research LLC - - - - Total 147,176.41 269.90 31.32 301.22
26 Revenue of the Company for the period ended March 31, 2018 is net of Goods and Service Tax (GST) which is applicable to the Company from July 1, 2017, however, revenue for the period upto June 30, 2017 is net of VAT but gross of excise duty. Accordingly, revenue for the period ended March 31, 2018 is not comparable with the previous year presented in these financial statements. Similarly expenses are also not comparable.
27 The Company conducts international transactions with associated enterprises. For the current year, the management maintained necessary documents as prescribed by the Income tax Act, 1961 to establish that these international transactions are at arm’s length and the aforesaid legislation will not have any impact on the consolidated financial statements, particularly on the amount of tax expense and that of provision for taxation.
28 EVENTS AFTER THE BALANCE SHEET DATE
The Board of Directors have recommended a final dividend of ` 3.00 (` 3.00) per share amounting to ` 1,716.15 Million (` 1,527.07 Million) on Equity Shares of Re. 1/- each for the year, subject to approval from Shareholders. Dividend distribution tax on such dividend amounts to ` 352.77 Million (` 310.88 Million).
231Apollo Tyres Ltd Annual Report 2017-18
Corporate Overview / Statutory Reports / Financial Statements

29 INFORMATION ON DETAILS OF LOANS, GURANTEES AND INVESTMENTS UNDER SECTION 186 OF THE ACT READ WITH COMPANIES (MEETINGS OF BOARD AND ITS POWERS) RULES, 2014
i) Details of investments made are given in note B2, B3 and B8.*ii) There are no loans given by the Company (other then to wholly owned subsidiary) in accordance with Section 186 of the Act read with
rules issued thereunder.iii) There are no guarantees issued by the Company in accordance with Section 186 of the Act read with rules issued thereunder. * All transactions are in the ordinary course of business
30 RECONCILIATION OF LIABILITIES FROM FINANCING ACTIVITIES
Effective April 1, 2017, the Group adopted the amendment to Ind AS-7, which require the entitities to provide disclosures that enable users of financial statements to evaluate changes in liabilities arising from financing activities, including both changes arising from cash flows and non-cash changes, suggesting inclusion of a reconciliation between the opening and closing balances in the consolidated balance sheet for liabilities arising from financing activities, to meet the disclosure requirements. The adoption of the amendment did not have any material impact on the consolidated financial statements, accordingly, the reconciliation is not disclosed.
31 EARNINGS PER SHARE (EPS) – THE NUMERATOR AND DENOMINATOR USED TO CALCULATE BASIC AND DILUTED EARNINGS PER SHARE:
Particulars 2017-18 2016-17
Basic and diluted earnings per share Profit attributable to the equity shareholders used as numerator (` in Million) - (A) 7,238.82 10,989.99 The weighted average number of equity shares outstanding during the year used as denominator - (B) 538,896,993 509,024,770 Basic / Diluted earnings per share (`) – (A) / (B) (Face value of Re 1 each) 13.43 21.59
For and on behalf of the Board of Directors
ONKAR S. KANWAR NEERAJ KANWAR NIMESH N. KAMPANIChairman & Managing Director Vice Chairman & Managing Director Director
GAURAV KUMAR SEEMA THAPARChief Financial Officer Company Secretary
GurgaonMay 10, 2018
232

FO
RM
AO
C 1
(p
ursu
ant
to fi
rst
prov
iso
to s
ub s
ectio
n (3
) of s
ec. 1
29 r
ead
with
rul
e 5
of C
ompa
nies
(Acc
ount
s) R
ules
, 20
14)
Sta
tem
ent c
onta
inin
g sa
lient
feat
ures
of t
he fi
nanc
ial s
tate
men
t of s
ubsi
diar
ies
/ as
soci
ate
/ jo
int v
entu
re
Par
t A: S
ubsi
diar
ies
` in
Mill
ion
S.
No
Nam
e of
the
Sub
sidi
ary
Dat
e on
whi
ch
subs
idia
ry
was
acq
uire
d /
inco
rpor
ated
Rep
orti
ng
curr
ency
Exc
hang
e ra
te a
s on
31
.03.
2018
As
on M
arch
31,
20
18Ye
ar e
nded
Mar
ch 3
1, 2
018
Sha
re c
apit
alR
eser
ves
&
surp
lus
Tota
l ass
ets
Tota
l lia
bilit
ies
Inve
stm
ent
(oth
er th
an in
su
bsid
iary
)
Turn
over
(in
clud
ing
othe
r in
com
e)
Pro
fit b
efor
e ta
xTa
x ex
pens
eP
rofit
aft
er
tax
1A
poll
o Ty
res
(Cyp
rus)
P
vt L
td
Aug
ust
14, 2
00
9EU
RO
80
.24
0.0
6 1
80.1
1 1
81.9
2 1
.75
-
5.6
1 5
.09
0.6
4 4
.45
2A
poll
o Ty
res
(Gre
enfie
ld)
B.V
.J
une
4, 2
014
EUR
O 8
0.2
4 2
.89
25.
03
946
.51
918
.59
-
132
.08
34.
01
-
34.
01
3A
poll
o Ty
res
Coo
pera
tief
U.A
. (A
poll
o C
oop)
May
1, 2
00
9EU
RO
80
.24
16,
576.
52
32,2
66.9
055
,354
.44
6,51
1.0
2 -
12
7.49
(3.1
8) (1
7.57
)14
.39
4A
poll
o (S
outh
Afr
ica)
H
oldi
ngs
(Pty
) Ltd
(A
SH
PL)
Sep
tem
ber
29,
200
6ZA
R 5
.50
-
3
59.6
3 3
60.0
1 0
.38
-
0.6
8 0
.63
0.3
7 0
.26
5A
poll
o Ty
res
Afr
ica
(Pty
) Lt
dJ
uly
29, 2
013
ZAR
5.5
0
2,2
00
.76
(1,9
93.6
8) 7
32.2
2 5
25.1
4 -
1
,261
.27
(40
.95)
12.
10
(53.
05)
6A
poll
o Ty
res
(Tha
iland
) Li
mite
dJ
anua
ry 2
2, 2
013
TH
B 2
.09
20
8.86
4
6.98
7
63.3
1 5
07.
47
-
2,7
85.4
8 (1
6.81
) -
(1
6.81
)7
Apo
llo
Tyre
s (M
iddl
e Ea
st) F
ZEJ
anua
ry 2
, 20
11A
ED
17.
73
35.
46
81.
01
312
.39
195
.92
-
1,8
48.7
7 (6
7.0
7) -
(6
7.0
7)8
Apo
llo
Tyre
s H
oldi
ngs
(Sin
gapo
re) P
te L
td
(AT
HS
)S
epte
mbe
r 8,
20
10U
SD
65.
12
853
.67
50
9.97
8
,263
.68
6,9
00
.04
-
27,
555.
40
741
.09
72.
10
668
.99
9AT
L S
inga
pore
Pte
Ltd
.M
ay 1
1, 2
017
US
D 6
5.12
3
25.5
8 (1
8.39
) 3
15.2
2 8
.03
-
1.7
8 (1
8.21
) -
(1
8.21
)10
Apo
llo
Tyre
s (M
alay
sia)
S
DN
BH
DM
arch
15,
20
16M
YR
16.
85
10
9.30
(3
5.50
) 1
60.7
2 8
6.92
-
4
53.1
0
(19.
22)
(2.2
9) (1
6.93
)11
Apo
llo
Tyre
s (U
K) P
vt L
td
(AT
UK
)M
arch
16,
20
12G
BP
91.
27
1.5
5 1
,456
.10
1
,674
.39
216
.74
-
1,2
91.3
4 6
4.33
2
0.2
9 4
4.0
4 12
Apo
llo
Tyre
s (L
ondo
n)
Pvt
Ltd
Dec
embe
r 12
, 20
14G
BP
91.
27
0.0
9 9
55.9
0
957
.51
1.5
2 -
-
-
-
-
13
Apo
llo
Tyre
s G
loba
l R&
D
B.V
.J
anua
ry 2
, 20
13EU
RO
80
.24
0.0
1 7
32.5
7 1
,40
7.24
6
74.6
6 -
2
,472
.44
195
.59
34.
28
161
.31
14A
poll
o Ty
res
(Ger
man
y)
Gm
bHN
ovem
ber
11,
2015
EUR
O 8
0.2
4 2
.01
85.
11
153
.70
6
6.58
-
3
16.6
9 2
2.57
6
.82
15.
75
15A
poll
o Ty
res
AG
Jul
y 4,
20
07
CH
F 6
8.29
2
56.0
0
(151
.25)
116
.06
11.
31
-
149
.74
(12.
34)
0.0
6 (1
2.40
)16
Apo
llo
Tyre
s D
o (B
rasi
l)
Ltda
Sep
tem
ber
15,
2011
BR
L 1
9.70
1
5.56
(8
.90
) 2
7.70
2
1.0
4 -
0
.49
0.0
1 0
.05
(0.0
4)17
Apo
llo
Tyre
s B
.V. (
ATB
V)
Mar
ch 2
, 20
12EU
RO
80
.24
1.4
4 3
9,46
7.93
4
9,53
1.31
1
0,0
61.9
4 -
1
,113
.63
60
4.57
8
.26
596
.31
18A
poll
o Ty
res
(Hun
gary
) K
ft. (
ATH
Kft
)J
une
4, 2
014
HU
F 0
.26
28.
50
20
,511
.53
41,
014
.59
20
,474
.56
-
2,1
83.1
7 (2
,191
.95)
-
(2,1
91.9
5)19
Apo
llo
Vred
este
in B
.V.
(AV
BV
)M
ay 1
5, 2
00
9EU
RO
80
.24
3.4
5 2
1,77
4.91
3
4,58
7.71
1
2,80
9.35
-
3
1,97
0.9
5 1
,973
.61
30
0.1
5 1
,673
.46
20A
poll
o Vr
edes
tein
Gm
bH
(AV
Gm
bH)
May
15,
20
09
EUR
O 8
0.2
4 4
1.0
8 5
,728
.57
9,0
57.5
0
3,2
87.8
5 -
1
0,4
84.3
3 (1
74.1
4) (2
0.7
2) (1
53.4
2)21
Vred
este
in M
arke
ting
B.V
. &
Co.
KG
May
15,
20
09
EUR
O 8
0.2
4 8
.83
2,6
67.8
5 2
,877
.17
20
0.4
9 -
7
67.7
5 (8
7.74
) (7
.49)
(80
.25)
22A
poll
o Vr
edes
tein
Nor
dic
A.B
. M
ay 1
5, 2
00
9S
EK
7.8
0
7.4
1 6
6.27
6
45.5
3 5
71.8
5 -
1
,125
.10
1
9.92
(1
.56)
21.
48
233Apollo Tyres Ltd Annual Report 2017-18
Corporate Overview / Statutory Reports / Financial Statements

` in
Mill
ion
S.
No
Nam
e of
the
Sub
sidi
ary
Dat
e on
whi
ch
subs
idia
ry
was
acq
uire
d /
inco
rpor
ated
Rep
orti
ng
curr
ency
Exc
hang
e ra
te a
s on
31
.03.
2018
As
on M
arch
31,
20
18Ye
ar e
nded
Mar
ch 3
1, 2
018
Sha
re c
apit
alR
eser
ves
&
surp
lus
Tota
l ass
ets
Tota
l lia
bilit
ies
Inve
stm
ent
(oth
er th
an in
su
bsid
iary
)
Turn
over
(in
clud
ing
othe
r in
com
e)
Pro
fit b
efor
e ta
xTa
x ex
pens
eP
rofit
aft
er
tax
23A
poll
o Vr
edes
tein
UK
Li
mite
dM
ay 1
5, 2
00
9G
BP
91.
27
91.
37
60
.87
744
.83
592
.59
-
2,1
12.4
3 2
1.82
5
.06
16.
76
24A
poll
o Vr
edes
tein
Fra
nce
SAS
May
15,
20
09
EUR
O 8
0.2
4 3
.36
253
.20
6
95.3
8 4
38.8
2 -
1
,740
.59
15.
46
6.2
4 9
.22
25A
poll
o Vr
edes
tein
Bel
uxM
ay 1
5, 2
00
9EU
RO
80
.24
4.9
7 6
7.0
8 3
55.1
4 2
83.0
9 -
1
,532
.31
52.
70
18.
84
33.
86
26A
poll
o Vr
edes
tein
G
esel
lsch
aft
m.b
.H.
May
15,
20
09
EUR
O 8
0.2
4 2
.92
(71.
92)
695
.22
764
.22
-
1,9
44.4
7 (7
8.51
) 0
.29
(78.
80)
27A
poll
o Vr
edes
tein
S
chw
eiz
AG
May
15,
20
09
CH
F 6
8.29
2
04.
87
110
.04
351
.25
36.
34
-
849
.06
16.
13
2.4
7 1
3.66
28
Apo
llo
Vred
este
in I
talia
S
rl
May
15,
20
09
EUR
O 8
0.2
4 1
6.0
5 (1
15.4
7) 3
.91
10
3.33
-
4
.67
(11.
17)
-
(11.
17)
29A
poll
o Vr
edes
tein
Ibe
rica
SA
M
ay 1
5, 2
00
9EU
RO
80
.24
248
.84
141
.36
456
.72
66.
52
-
1,1
01.
12
15.
66
8.9
4 6
.72
30A
poll
o Vr
edes
tein
Tir
es
Inc.
May
15,
20
09
US
D 6
5.12
3
.26
(52.
69)
149
.72
199
.15
-
712
.39
(217
.09)
0.0
4 (2
17.1
3)31
Apo
llo
Vred
este
in K
ft
(AV
Kft
)M
ay 1
5, 2
00
9H
UF
0.2
6 0
.77
9.0
7 3
19.4
7 3
09.
63
-
662
.41
0.0
5 1
.19
(1.1
4)32
S.C
. Vre
dese
tin R
.O. S
rlA
ugus
t 18
, 20
10EU
RO
80
.24
-
-
-
-
-
-
-
-
-
33A
poll
o Vr
edes
tein
Opo
ny
Pol
ska
Sp.
Zo.
o.
May
15,
20
09
PLN
19.
03
0.9
5 1
45.1
5 5
19.2
7 3
73.1
7 -
6
99.4
6 7
.89
4.2
4 3
.65
34Vr
edes
tein
Con
sult
ing
B.V
.M
ay 1
5, 2
00
9EU
RO
80
.24
1.8
2 2
87.9
2 3
05.
85
16.
11
-
10
.58
5.1
2 0
.90
4
.22
35Fi
nlo
B.V
.M
ay 1
5, 2
00
9EU
RO
80
.24
0.7
2 (1
8.78
) -
1
8.0
6 -
-
-
-
-
36
Vred
este
in M
arke
ting
B.V
.M
ay 1
5, 2
00
9EU
RO
80
.24
2.0
1 -
2
.01
-
-
-
-
-
-
37R
eife
ncom
Gm
bH,
Bie
lefe
ldJ
anua
ry 1
, 20
16EU
RO
80
.24
60
.18
129
.57
718
.65
528
.90
-
2
,835
.88
5.3
9 2
.36
3.0
3 38
Rei
fenc
om G
mbH
, H
anno
ver
Jan
uary
1, 2
016
EUR
O 8
0.2
4 1
23.2
5 3
9.11
1
,734
.65
1,5
72.2
9 -
7
,697
.57
(56.
31)
(15.
15)
(41.
16)
39R
eife
ncom
E
inka
ufsg
esel
lsch
aft,
mbH
& C
o. O
HG
, H
anno
ver
Jan
uary
1, 2
016
EUR
O 8
0.2
4 1
33.9
0
-
3,0
20.1
3 2
,886
.23
-
6,4
12.1
3 9
.30
5
.74
3.5
6 40
Rei
fenc
om T
yre
(Qin
gdao
) C
o., L
td.
Jan
uary
1, 2
016
CN
Y 1
0.2
9 5
.07
(5.0
4) 1
.34
1.3
1 -
0
.88
0.0
3 -
0
.03
41S
atur
n F1
Pvt
Ltd
Sep
tem
ber
16,
2016
GB
P 9
1.27
1
85.9
7 (7
2.93
) 1
19.3
8 6
.34
-
14.
42
(74.
77)
(13.
50)
(61.
27)
42R
etai
l Dis
trib
utio
n H
oldi
ng B
.V.
Febr
uary
14,
20
17EU
RO
80
.24
-
-
-
-
-
-
-
-
-
43R
ubbe
r R
esea
rch
LLC
Febr
uary
16,
201
7U
SD
65.
12
-
-
-
-
-
-
-
-
-
Not
e 1
Nam
e of
sub
sidi
arie
s w
hich
are
yet
to
com
men
ce o
pera
tions
/non
-ope
ratin
g:
-
S.C
. Vre
dese
tin R
.O. S
rl
-
Finl
o B
.V.
-
Vred
este
in M
arke
ting
B.V
.
- R
etai
l Dis
trib
utio
n H
oldi
ng B
.V.
-
Rub
ber
Res
earc
h LL
C
Not
e 2
Nam
e of
sub
sidi
arie
s w
hich
hav
e be
en li
quid
ated
or
sold
dur
ing
the
year
- N
one
N
ote
3 Fi
nanc
ial p
erio
d fo
r al
l the
sub
sidi
arie
s is
Apr
il to
Mar
ch.
Not
e 4
The
re is
no
prop
osed
div
iden
d in
any
sub
sidi
ary
as o
n M
arch
31,
20
18.
N
ote
5 Fo
r sh
areh
oldi
ng in
the
sub
sidi
arie
s, r
efer
not
e C
22
234

Part B: Joint Venture & Associates
1 Name of the Associate KT Telematic Solutions Private Limited
2 Latest Balance Sheet date March 31, 20183 Shares of associate entity held by the company at the year end
No. 1,667 Extent of Holding % 14%Amount of Investment in associate entity (` in Million) 22.51
4 Description of how there is significant influence Refer note 1 below5 Reason why the associate is not consolidated Not applicable 6 Net worth attributable to Shareholding as per latest Balance Sheet (` in Million) 3.28 7 Profit / (Loss) for the year
i. Considered in Consolidation (` in Million) 0.01 ii. Not Considered in Consolidation (` in Million) 0.08
Note 1 By virtue of significant influence in certan business decisions under an agreement, KT Telematic Solutions Private Limited had become an associate of the Company w.e.f. February 21, 2018.
Note 2 The management has provided an impairment loss of ` 185.99 Million during the previous year to fully impair its investment and loans (including interest accrued) in the joint venture (Pan Aridus LLC) and the group discontinued recognizing further losses in accordance with Ind AS 28 Investments in Associates and Joint Ventures. Further, the group does not have any further obligations to satisfy with regard to this joint venture.
Note 3 The investment in Pressurite (Pty) Ltd, an associate of ASHPL, has been fully impaired in the prior years and the group discontinued recognizing further losses in accordance with Ind AS 28 Investments in Associates and Joint Ventures. Further, the group does not have any further obligations to satisfy with regard to this associate.
Note 4 Name of associates or joint ventures which are yet to commence operations None
Note 5 Name of associates or joint ventures which have been liquidated or sold during the year None
For and on behalf of the Board of Directors
ONKAR S. KANWAR NEERAJ KANWAR NIMESH N. KAMPANIChairman & Managing Director Vice Chairman & Managing Director Director
GAURAV KUMAR SEEMA THAPARChief Financial Officer Company Secretary
GurgaonMay 10, 2018
235Apollo Tyres Ltd Annual Report 2017-18
Corporate Overview / Statutory Reports / Financial Statements

Notes

Apollo Tyres Ltd
Corporate Office
Apollo House7 Institutional Area, Sector 32,Gurgaon 122001, India
T: +91 124 2383002F: +91 124 2383821
www.apollotyres.com E: [email protected] CIN: L25111KL1972PLC002449
Registered Office
3rd Floor, Areekal Mansion,Panampilly Nagar,Kochi 682036, India
T: +91 484 4012046F: +91 484 4012048


ATTENDANCE SLIPFolio/DP ID Client ID No.* No. of Shares held:
* Applicable for the Member(s) holding shares in Electronic Form.
thI being a Member/ Proxy for the Member of the Company, hereby record my presence at the 45 Annual General Meeting of the Company at Kerala Fine Arts Theatre, Fine Arts Avenue, Foreshore Road, Ernakulam, Kochi (Kerala) on Wednesday, August 1, 2018 at 10:00 AM.
1. Please hand over the attendance slip at the entrance of the meeting venue.
2. This attendance is valid only in case shares are held on the date of meeting.
3. As per Section 118(10) of the Companies Act, 2013 read with the Secretarial Standards for General Meetings issued by Institute of Company Secretaries of India “No gifts, gift coupons or cash in lieu of gifts shall be distributed to members at or in connection with the meeting”.
E-VOTING PARTICULARS
E-Voting Event Number USER ID PASSWORD
thNote: Please read instructions given out at Note no. 12 of the Notice of the 45 Annual General Meeting of the Company before casting your vote through e-voting.
PROXY FORM[Pursuant to Section 105(6) of the Companies Act, 2013 and Rule 19(3) of the Companies (Management and Administration) Rules, 2014]
Folio/DP ID Client ID No.*
E-mail Id:
I/We, being the member(s) holding.....................................shares of Apollo Tyres Ltd, hereby appoint:
1) Name: ............................................................................................. Address: ......................................................................................................................
E-mail Id: ...................................................................................... Signature:....................................................................................or failing him/her
2) Name: ............................................................................................. Address: ......................................................................................................................
E-mail Id: ...................................................................................... Signature:......................................................................................or failing him/her
3) Name: ............................................................................................. Address: ......................................................................................................................
E-mail Id: ...................................................................................... Signature:.....................................................................................................................
Sl.No. Resolutions 1 To consider and adopt:
(a) the audited financial statement of the Company for the financial year ended March 31, 2018, the reports of the Board of Directors and Auditors thereon; and
(b) the audited consolidated financial statement of the Company for the financial year ended March 31, 2018.
To declare dividend on equity shares.
re-appointment. To appoint a Director in place of Mr. Sunam Sarkar (DIN-00058859), who retires by rotation, and being eligible offers himself for
Signed this……….......... day of …...........…. 2018
Signature of the Member .....................................................
Signature of the Proxy holder(s) ..............................................
Notes:
1. This form of proxy in order to be effective should be duly completed and deposited at the Registered Office of the Company, not less than 48 hours before the commencement of the meeting.
2. This Form of Proxy shall be signed by the member or his duly authorised attorney, or if the member is a body corporate, it shall be duly sealed and signed by an officer or an attorney. The Proxy Form which is unstamped or inadequately stamped or where the stamp has not been cancelled or is undated or which does not state the name of the Proxy shall not be considered valid.
3. Proxy need not be a member of the Company. Pursuant to the provisions of Section 105 of the Companies Act, 2013, a person can act as proxy on behalf of not more than fifty members and holding in aggregate not more than ten percent of the total share capital of the Company. Members holding more than ten percent of the total share capital of the Company may appoint a single person as proxy, who shall not act as proxy for any other member.
4. The submission by a member of this form of proxy will not preclude such member from attending in person and voting at the meeting. If both member and proxy attend the meeting, the proxy shall stand automatically revoked.
4 th ANNUAL GENERAL MEETING- AUGUST 1,2018
Name of the Member(s) & Registered address:
Name of the Member/Proxy # Signature of the Member/Proxy #
# Strikeout whichever is not
Name
applicable
of the Member(s) & Registered address:
* Applicable for the Member(s) holding shares in Electronic Form.
th45 ANNUAL GENERAL MEETING- AUGUST 1, 2018
Affix Revenue Stamp of not
less than
1
2
3
4
5
6
be distributed to members at or in connection with the meeting.”
APOLLO TYRES LTD(CIN-L25111KL1972PLC002449)
APOLLO TYRES LTD(CIN-L25111KL1972PLC002449)
as my/our proxy to attend and vote (on a poll) for me/us and on my/our behalf at the 45 Annual General Meeting of the Company, to be held onWednesday, August 1, 2018 at 10:00 AM at Kerala Fine Arts Theatre, Fine Arts Avenue, Foreshore Road, Ernakulam, Kochi (Kerala) and at any adjournment thereof in respect of such resolutions as are indicated below:
th
To appoint Ms. Anjali Bansal (DIN-00207746) as an Independent Director.
To authorise Private Placement of Non-Convertible Debentures.
1/- `
rdRegd. Office: 3 Floor, Areekal Mansion, Near Manorama Junction, Panampilly Nagar, Kochi-682036(Kerala)Tel: +91 484 4012046 Fax: +91 484 4012048, Email : [email protected]
Web: apollotyres.com
rdRegd. Office: 3 Floor, Areekal Mansion, Near Manorama Junction, Panampilly Nagar, Kochi-682036(Kerala)Tel: +91 484 4012046 Fax: +91 484 4012048, Email : [email protected]
Web: apollotyres.com
To ratify the payment of the remuneration to the Cost Auditor for the financial year 2018-19.
5