APHG Chapter 2: Population
150
APHG Chapter 2: Population Traquair
-
Upload
khangminh22 -
Category
Documents
-
view
0 -
download
0
Transcript of APHG Chapter 2: Population
APHG Chapter 2: PopulationTraquair

Day 1
Bellwork
•Grab an Overview. Find new seat!•Fold a page in half to make your cover page for Chapter 2!•In what kind of environments do people want to live?•Come up with 3 examples!
Agenda:
•Ch. 2 Overview
•Notes: Population Distribution
•4 Level Map Analysis pg. 46
•HW: #1-5, Map + capitals

Objective:
•You will be able to analyze a map of population density in writing.
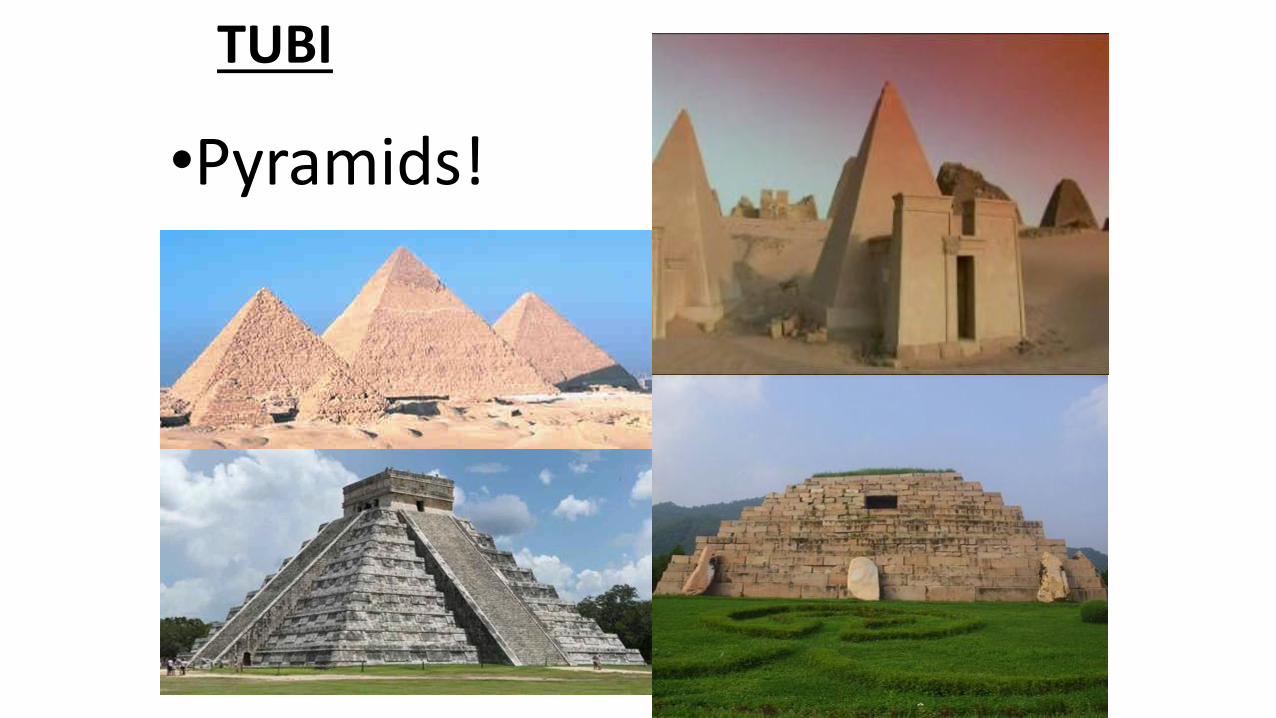
TUBI
•Pyramids!

Test Debrief
•ALL TEST MAKE UPS MUST BE DONE BY 9/1
•Test grades up by 5pm tonight
•50 points
•Test corrections ONCE a Quarter• but not this one

Reading Notes
•Great job!
•The most thorough you are the better your test grade!
• If you have the reading questions done when I do a spot check – extra credit point!
•Can do on separate piece of paper
Ch. 2 Population
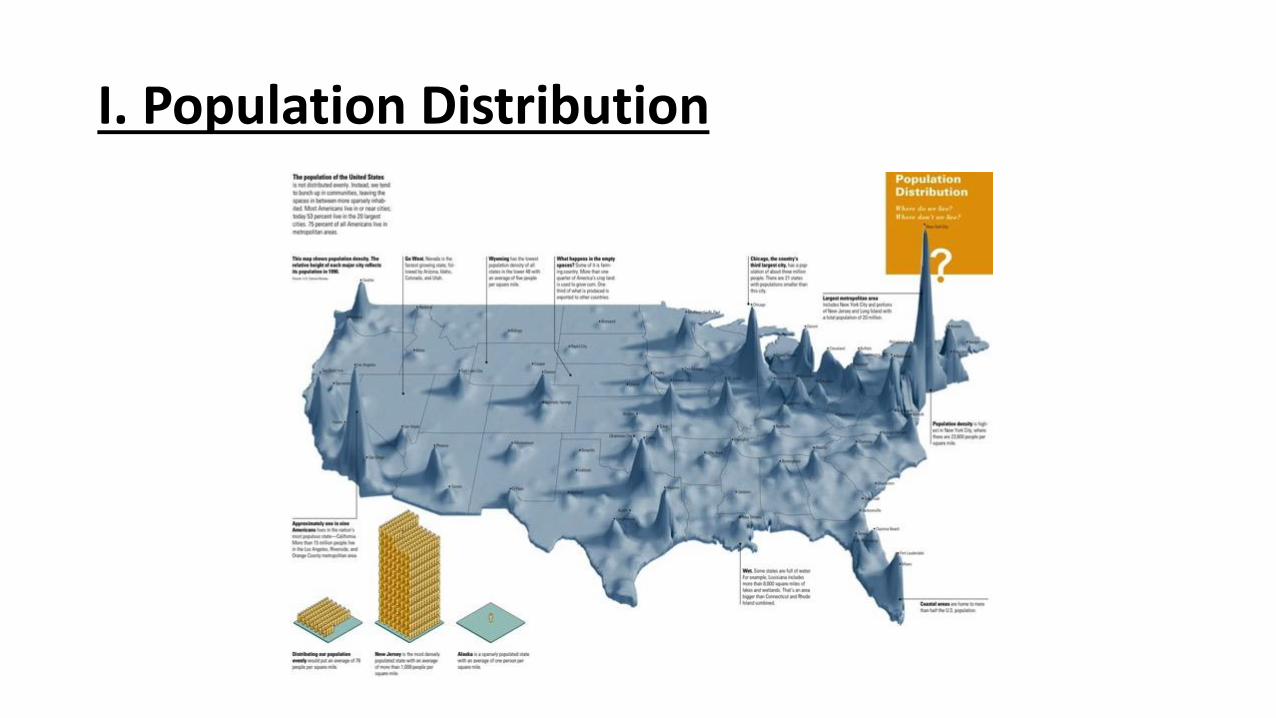
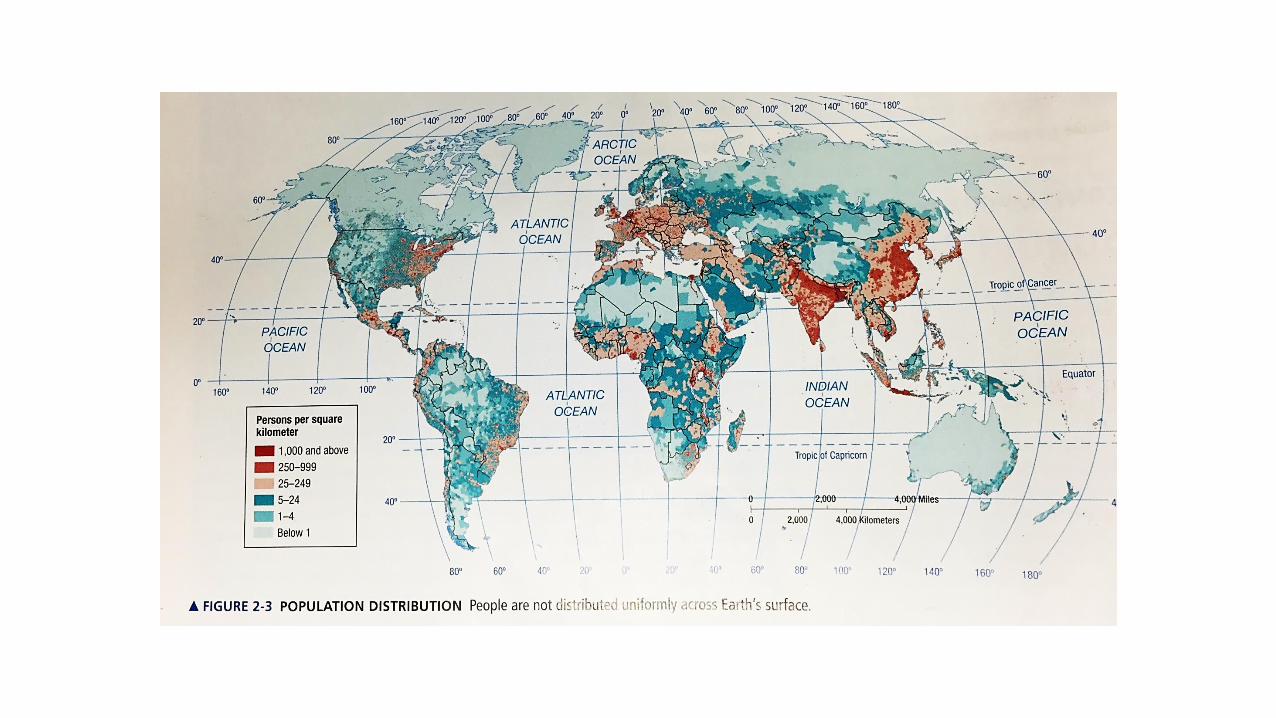
I. Population Distribution
A. Population Concentrations
1.Demography: the study of population
2.Ecumene: the portion of the Earth’s surface where people can live
3.Population clusters

a. East Asia
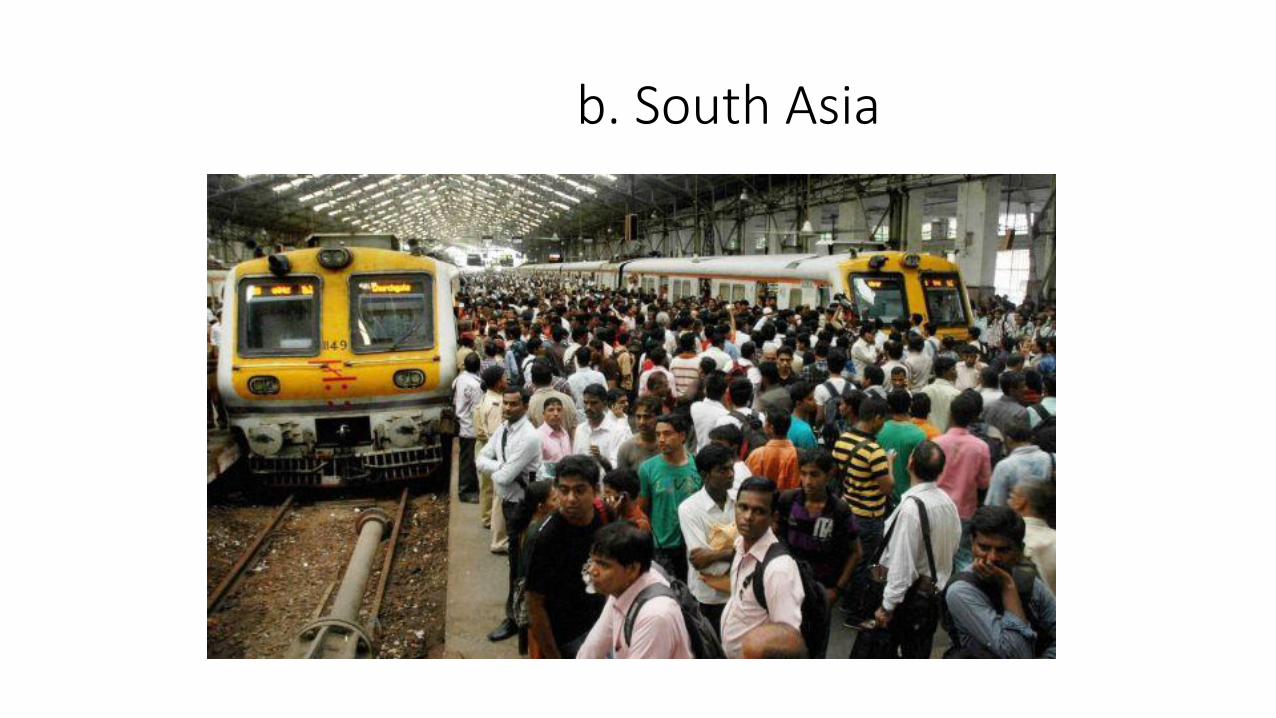
b. South Asia

c. Europe

d. Southeast Asia
B. Sparsely Populated
1. Aka where people don’t live
2. Nonecumene: the uninhabited parts of the planet, where people can’t easily survive

a. Deserts/Tundra
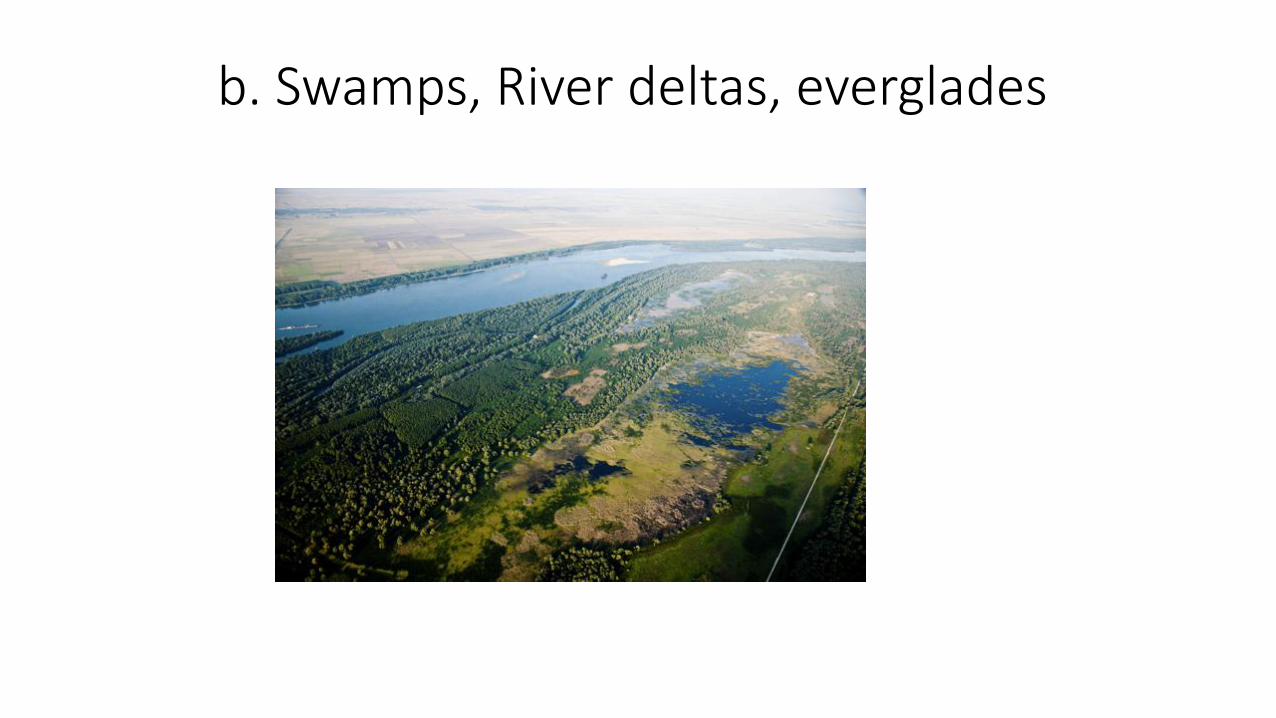
b. Swamps, River deltas, everglades

c. Arctic and Antartica

d. Tops of mountains, high plateaus

Geographic Connections
•Name a major geographic feature for each type of non-ecumene.
3. Natural Hazards
a. These show up in both Nonecumene AND ecumene
• Hurricanes, Typhoons, Flooding• Desertification, Earthquakes,
Volcanoes• Avalanches, Mudslides
Discuss
•What are some ways that humans change the environment so that we can turn nonecumene into ecumene?
Summary
•Define ecumene and nonecumene.
•Describe relationship between ecumeneand population.

4 Level Map Analysis – pg. 461. What do you see?• Do you comprehend the map?
2. Where do you see things? • (patterns, unique things)
3. Why there?4. So what?• Connect this to what we know about geography. Summarize what the map is saying. Why is this map important?
BU
LLET
P
OIN
TSC
OM
PLE
TE
SEN
TEN
CES

Day 2

Bellwork
•What country do you think has the highest birthrate? Why?
•Complete sentences!

Agenda:
•Finish 4 Level Map Analysis
•Notes: Population Growth
•HW: Map (countries + capitals)
Objective:
•You will be able to describe how geographers analyze population change in writing.
TUBI:
•Pangea!

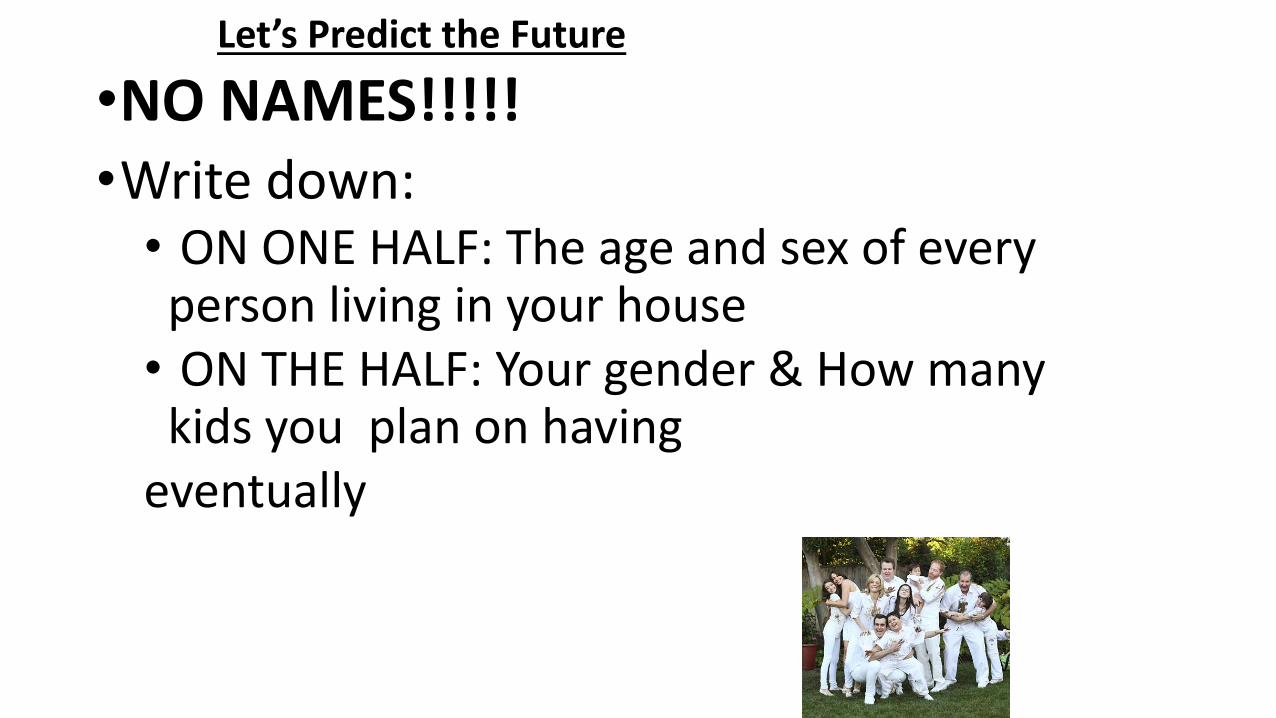
Let’s Predict the Future
•NO NAMES!!!!!•Write down:• ON ONE HALF: The age and sex of every person living in your house• ON THE HALF: Your gender & How many kids you plan on having
eventually
4 Level Map Analysis – pg. 461. What do you see?• Do you comprehend the map?
2. Where do you see things? • (patterns, unique things)
3. Why there?4. So what?• Connect this to what we know about geography. Summarize what the map is saying. Why is this map important?
BU
LLET
P
OIN
TSC
OM
PLE
TE
SEN
TEN
CES
DONE? WORK ON OVERVIEW MAP
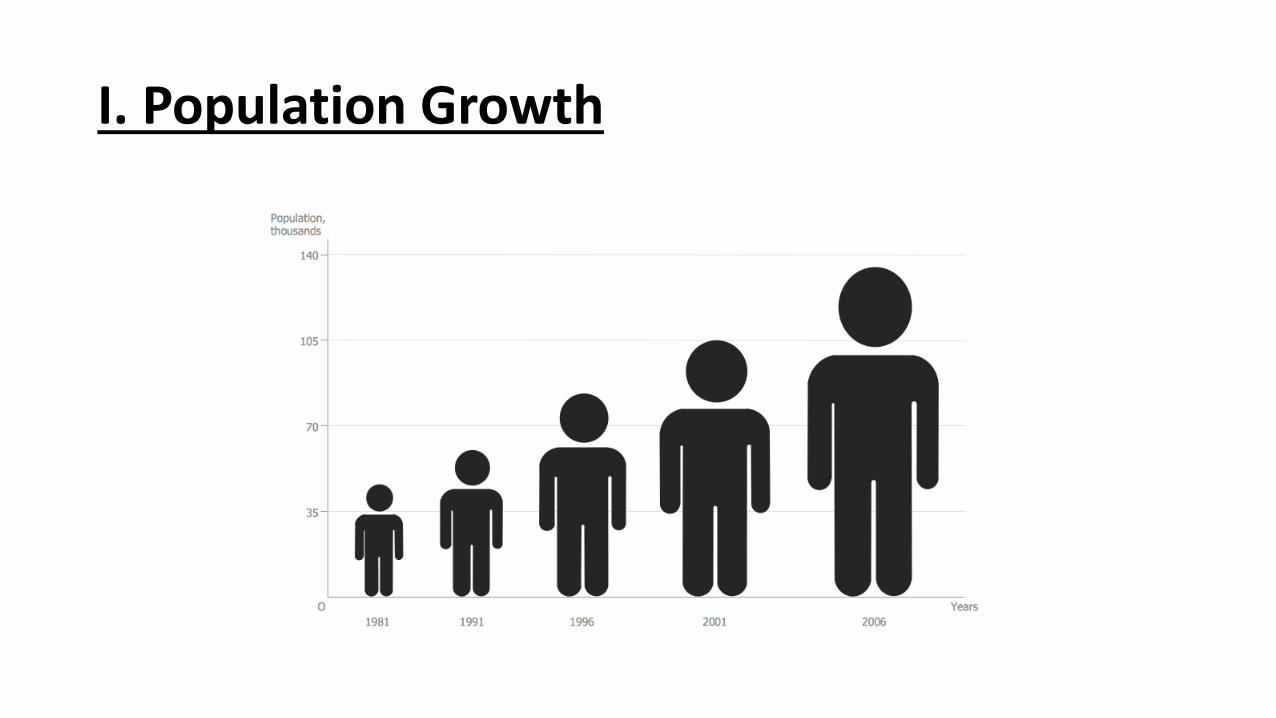
I. Population Growth
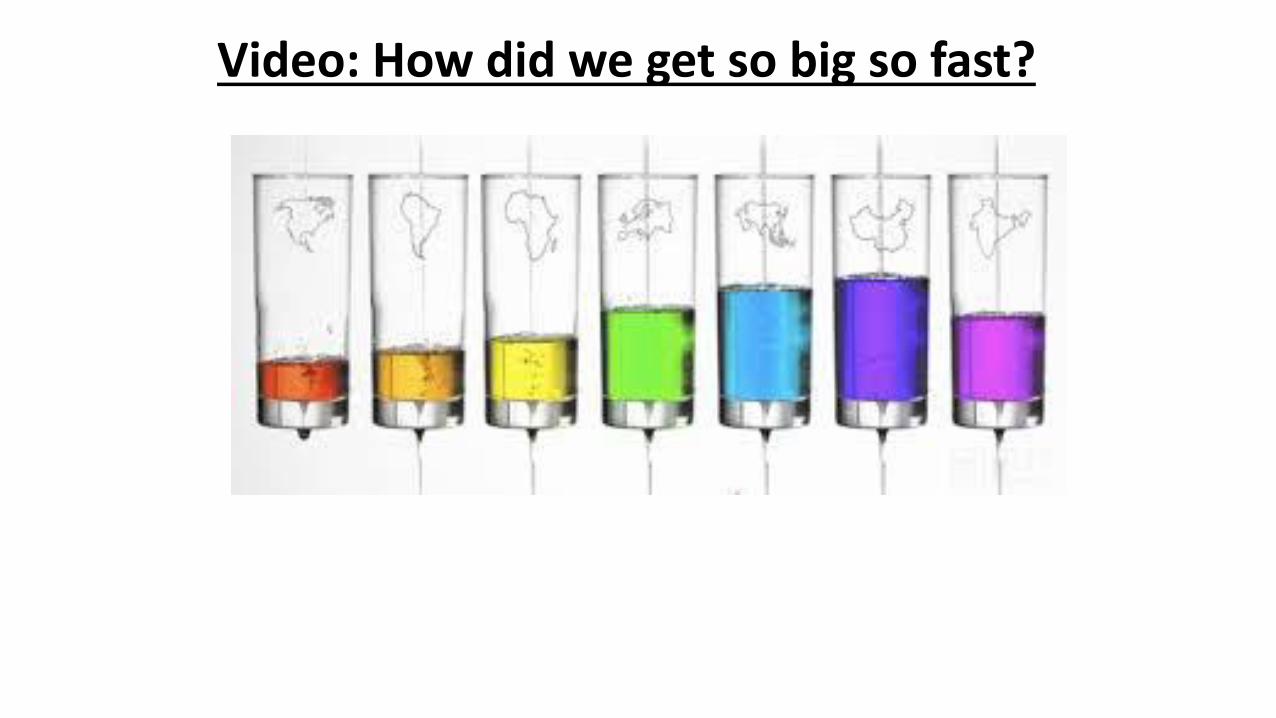
Video: How did we get so big so fast?
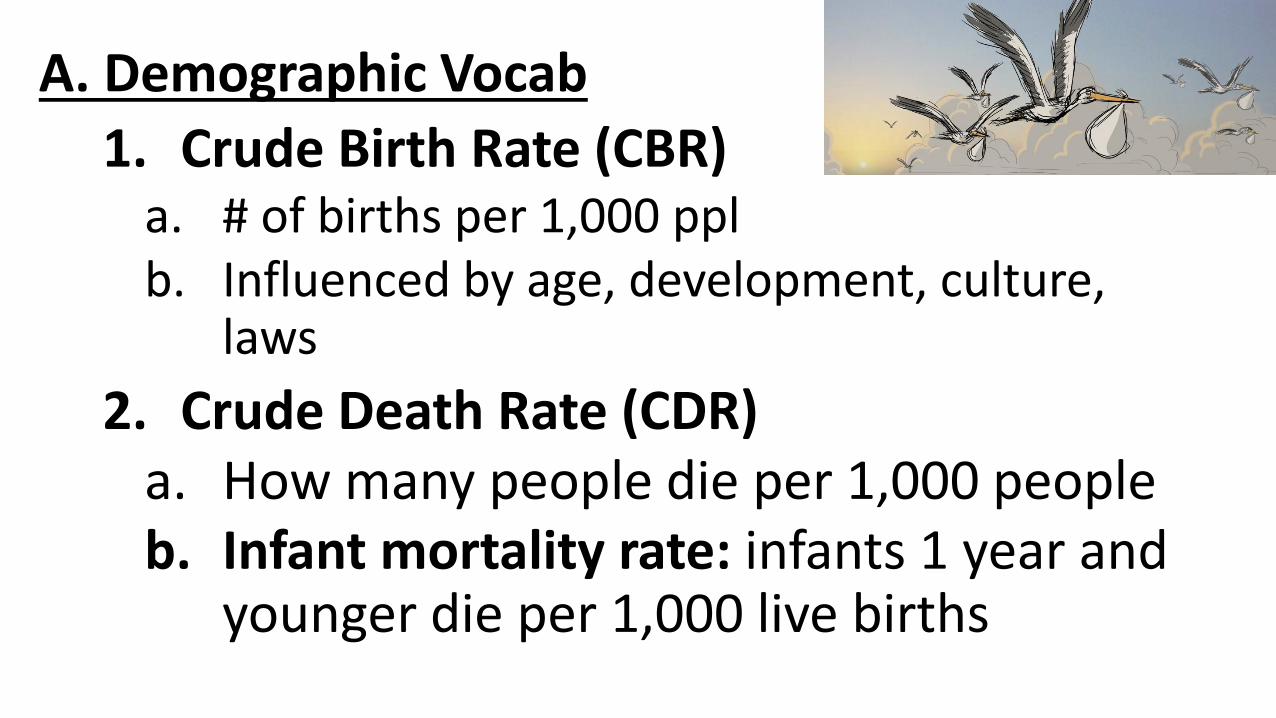
A. Demographic Vocab
1. Crude Birth Rate (CBR)a. # of births per 1,000 pplb. Influenced by age, development, culture,
laws
2. Crude Death Rate (CDR)a. How many people die per 1,000 peopleb. Infant mortality rate: infants 1 year and
younger die per 1,000 live births

B. Natural Increase Rate
1. CBR-CDR / Population x 100 =NIRa. Current NIR on Earth: 1.2b. NATURAL= birth not migration

2. 7.046 Billion people on Earth
3. Doubling time: how long it takes to double the population
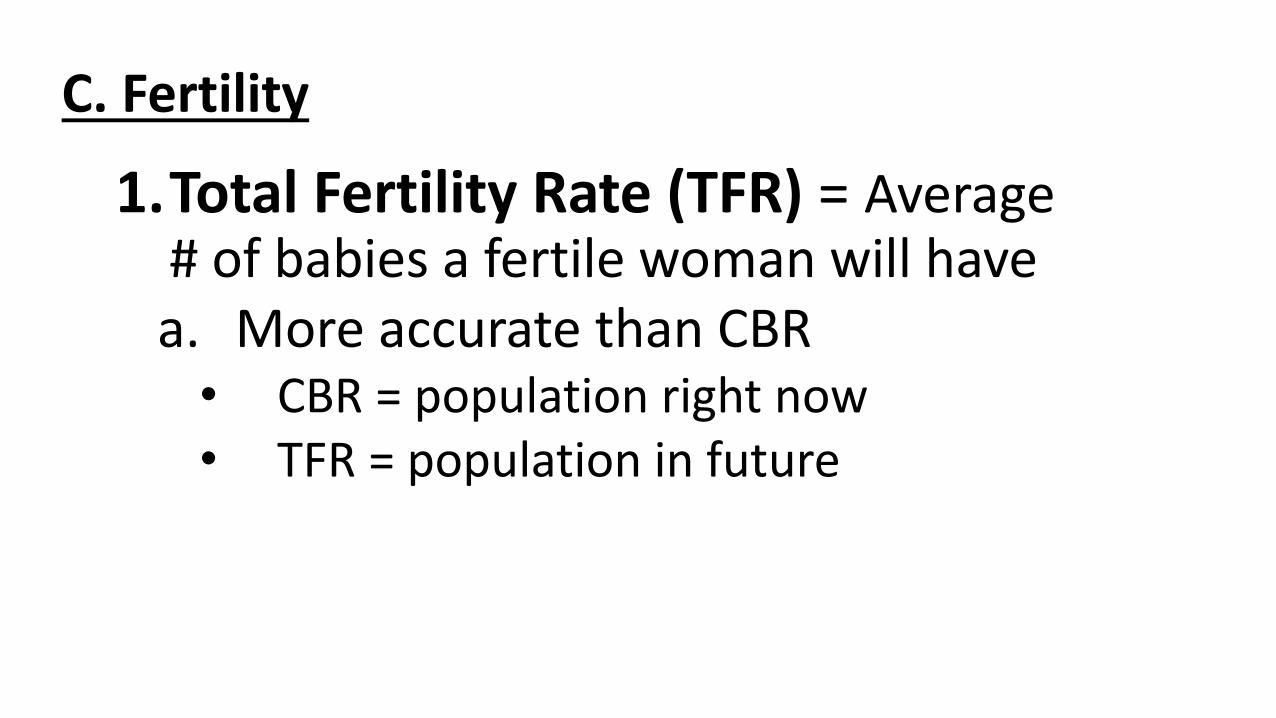
C. Fertility
1.Total Fertility Rate (TFR) = Average # of babies a fertile woman will havea. More accurate than CBR• CBR = population right now• TFR = population in future

0
1
2
3
4
5
6
7
Cen
tral
Afr
ica
Wes
t A
fric
a
East
Afr
ica
Wes
t A
sia
No
rth
Afr
ica
Sou
th C
en
tral
Asi
a
Sou
th A
fric
a
Cen
tral
Am
eric
a
Sou
thea
st A
sia
Car
ibb
ean
Sou
th A
mer
ica
Oce
ania
No
rth
Am
eric
a
No
rth
ern
Eu
rop
e
East
Asi
a
Wes
tern
Eu
rop
e
East
ern
Eu
rop
e
Sou
ther
n E
uro
pe
TFR

0
1
2
3
4
5
6
7
No
rth
Afr
ica
We
st A
fric
a
East
Afr
ica
Cen
tral
Afr
ica
Sou
th A
fric
a
No
rth
Am
eric
a
Cen
tral
Am
eric
a
Car
ibb
ean
Sou
th A
mer
ica
Wes
t A
sia
Sou
th C
en
tral
Asi
a
Sou
thea
st A
sia
East
Asi
a
No
rth
ern
Eu
rop
e
Wes
tern
Eu
rop
e
East
ern
Eu
rop
e
Sou
ther
n E
uro
pe
Oce
ania
Africa Americas Asia Europe Aus
TFR

2. Replacement Level Fertility: # of babies born ensure the same # of women will survive to have babies
a. So no population increase! Your population stays the same
b. You are replacing yourself

Discuss
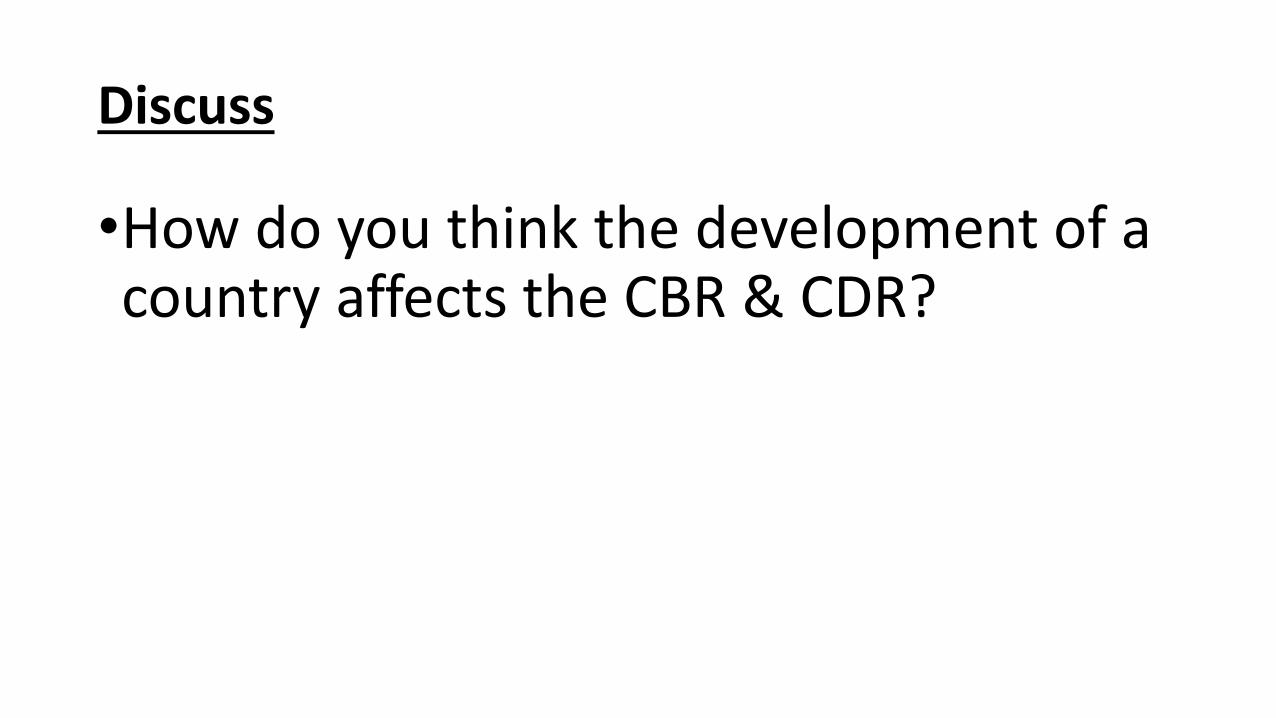
•How do you think the development of a country affects the CBR & CDR?

D. Population Density
1. Arithmetic Density: Crude density, population ÷ unit of land area
2. Physiological Density: # of ppl a unit of arable land can support
3. Agricultural Density: # of farmers to unit of arable land

DRAW THE FOLLOWING SLIDE

Arithmetic Density
PhysiologicalDensity
Agricultural Density
Country of BOX - Population: 6 Area: 6 sq miles
1 person per 1 Mile
LAVA
3 people per 1 Mileof ARABLE LAND
1 FARMER per 1 Mile of ARABLE LAND
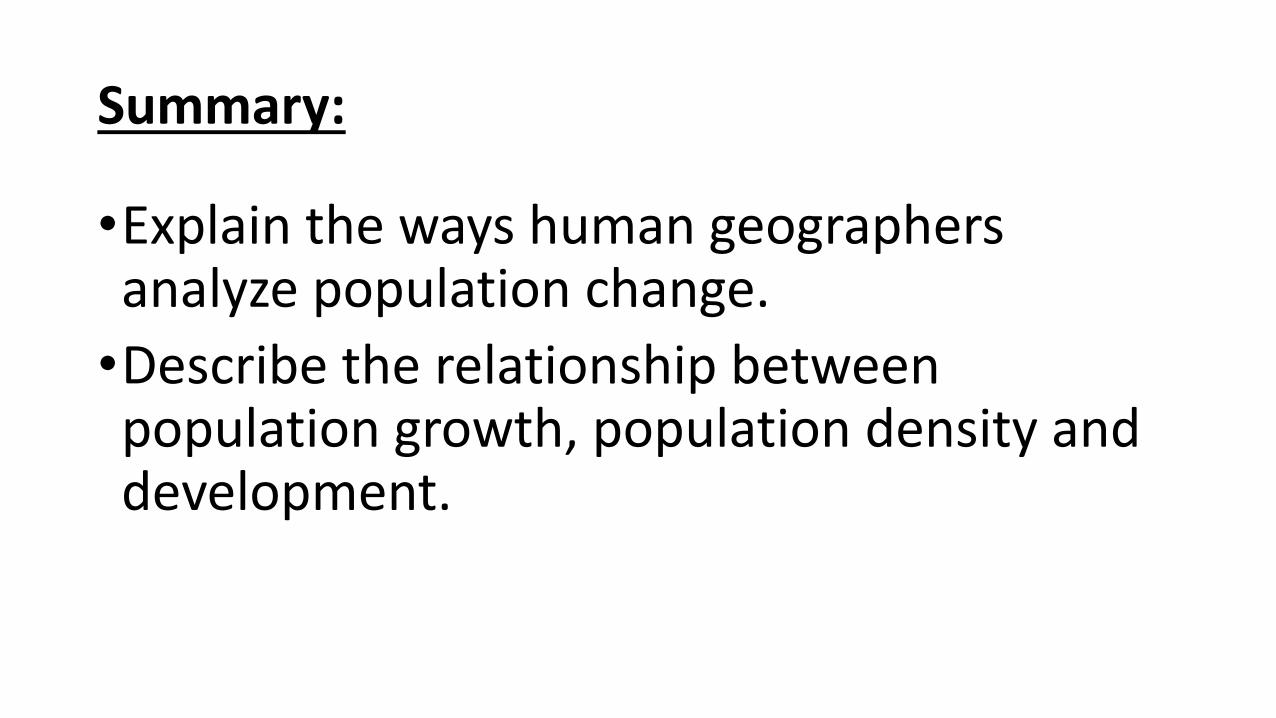
Summary:
•Explain the ways human geographers analyze population change.
•Describe the relationship between population growth, population density and development.

Day 3

Bellwork

Agenda:
•Notes: Population Structure
•Population Pyramid Activity
•HW: Overview Map, Finish Population Pyramid Activity
Objective:
•You will be able to create a population pyramid.

TUBI:•Where was the first dinosaur skeleton found?
•NEW JERSERY!

Class of 2021 TFR
2.1

So if we leave the future up to you guys,our population will increase

I. Population Structure

A. Vocab
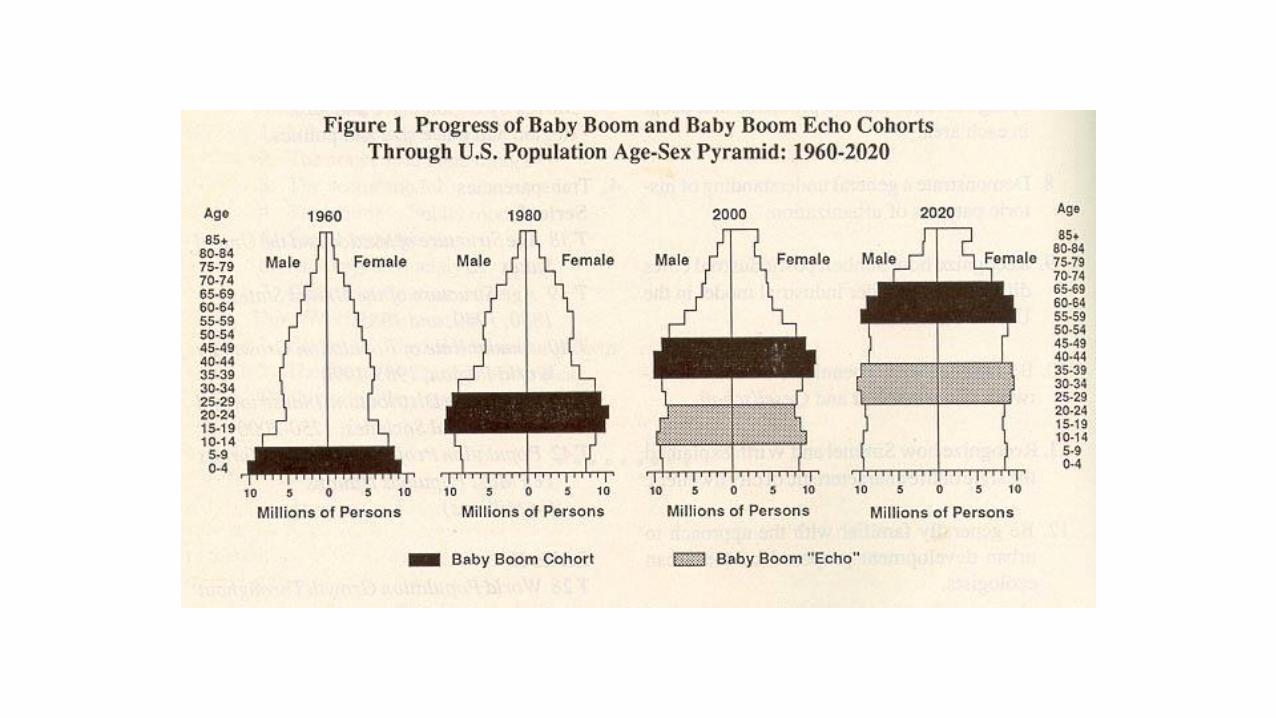
1. Population Pyramid: A bar graph to show population structure by comparing pop. age & sex a. Cohort: population group unified
by the same time constraints• CLASS OF 2020

POPULATION PYRAMID VIDEO

b. Dependency Ratio: # of people who are too young/old to work compared to people who can work
c. Life Expectancy: the average length of life

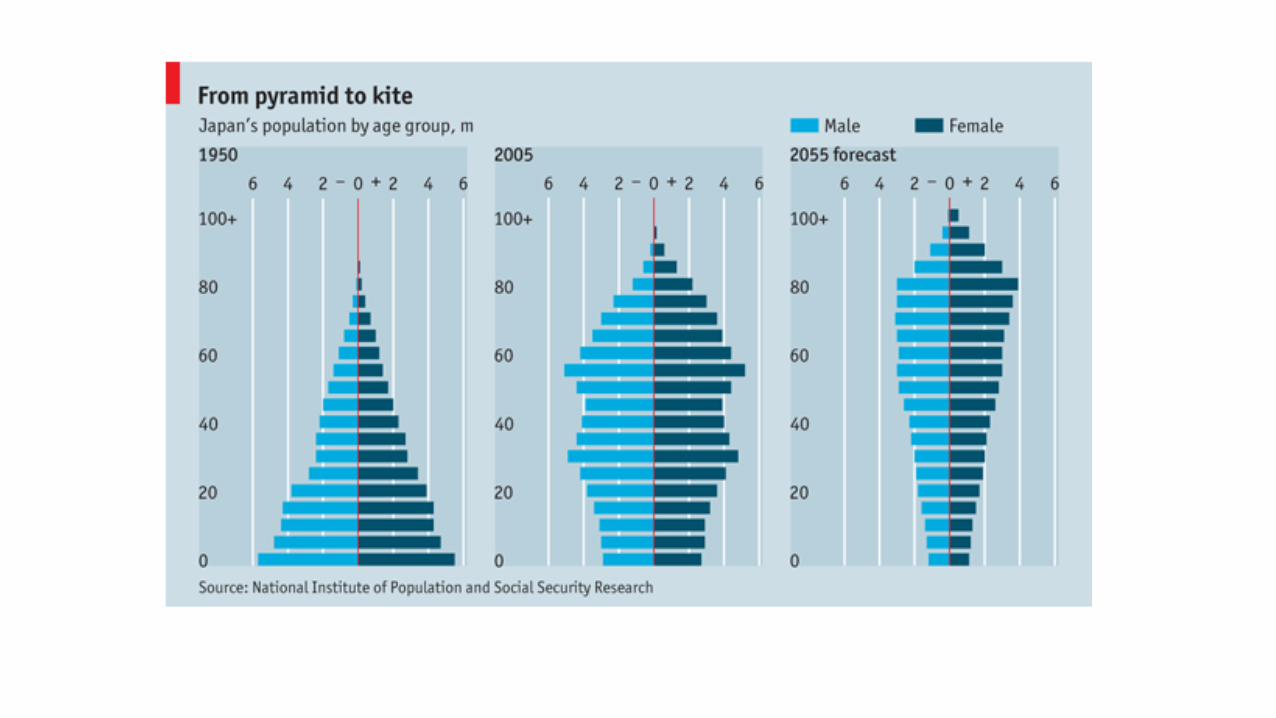
2. 3 Types of Pyramid
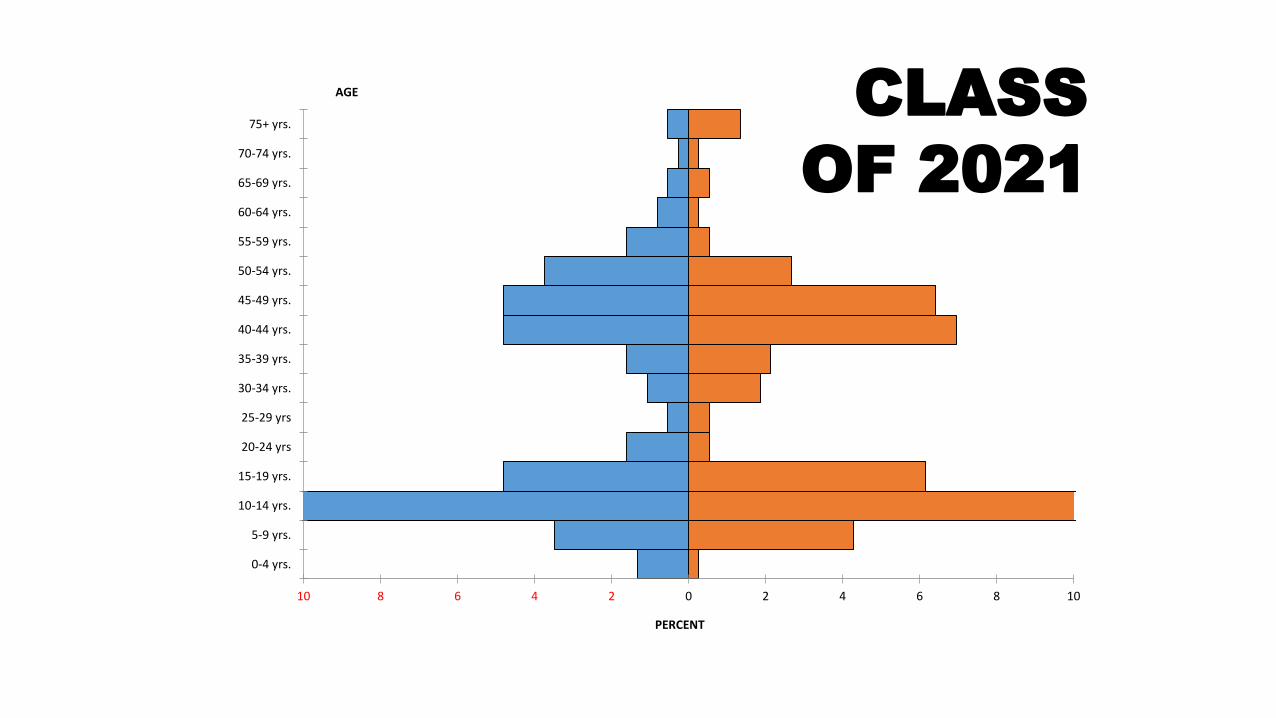
10 8 6 4 2 0 2 4 6 8 10
0-4 yrs.
5-9 yrs.
10-14 yrs.
15-19 yrs.
20-24 yrs
25-29 yrs
30-34 yrs.
35-39 yrs.
40-44 yrs.
45-49 yrs.
50-54 yrs.
55-59 yrs.
60-64 yrs.
65-69 yrs.
70-74 yrs.
75+ yrs.
PERCENT
AGE CLASS
OF 2021

Discuss
•Why would a population pyramid be useful for human geographers?

3. Sex ratio: # of males per 100 females in a population
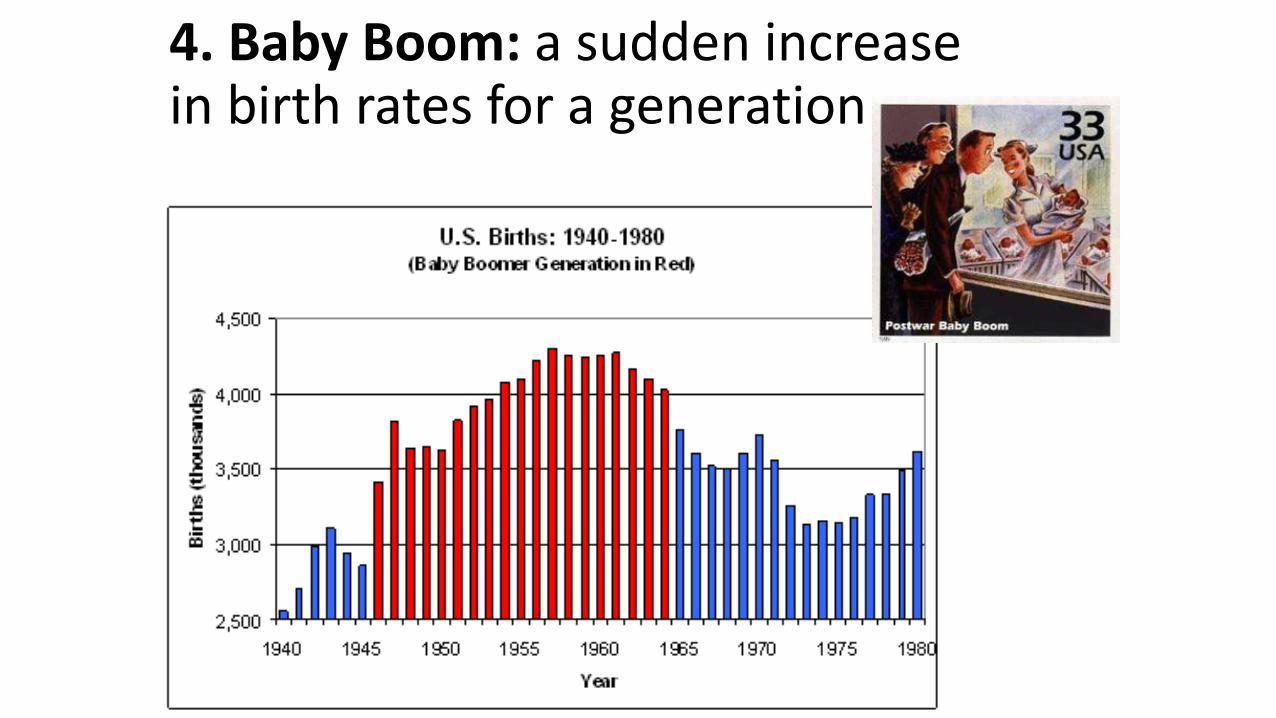
4. Baby Boom: a sudden increase in birth rates for a generation
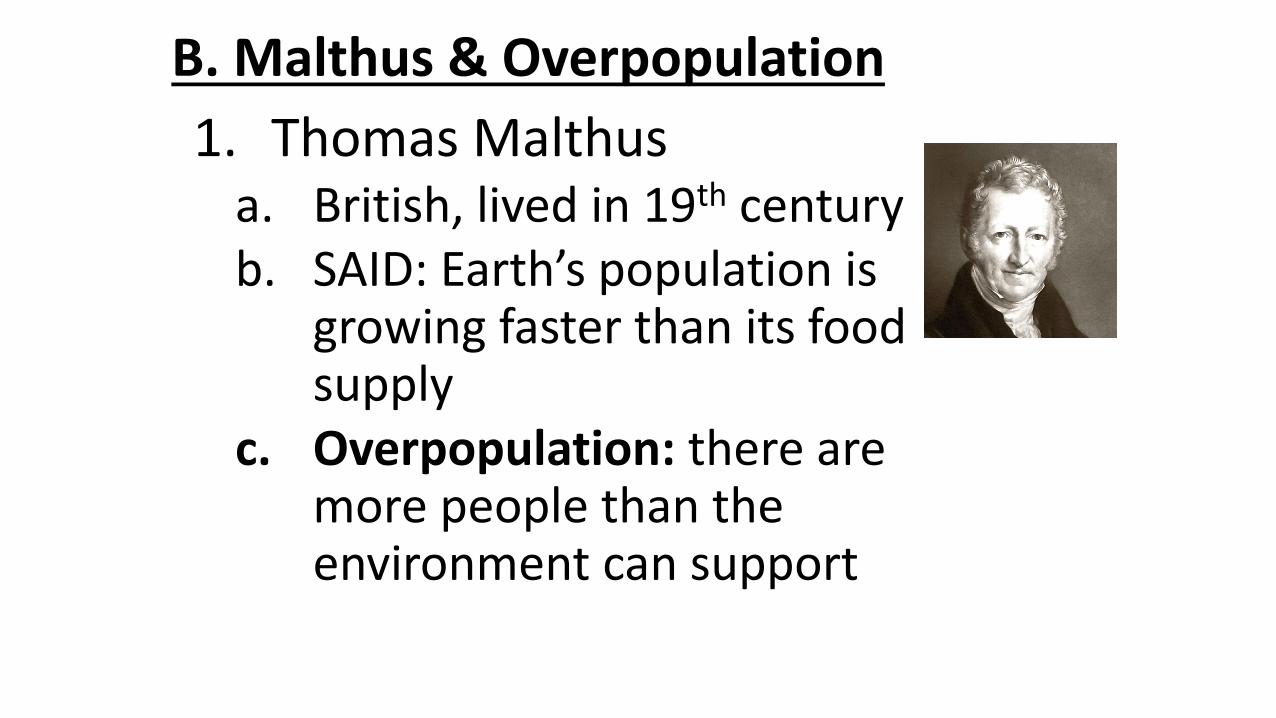
B. Malthus & Overpopulation
1. Thomas Malthusa. British, lived in 19th centuryb. SAID: Earth’s population is
growing faster than its food supply
c. Overpopulation: there are more people than the environment can support
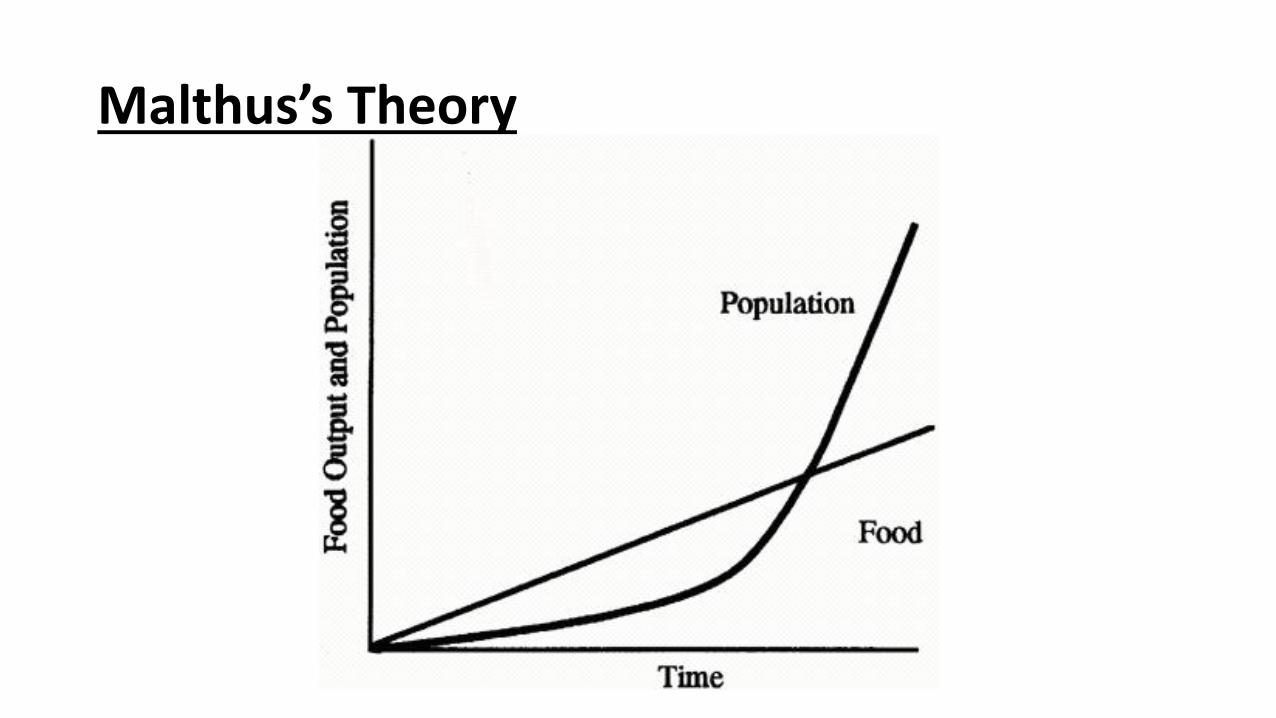
Malthus’s Theory

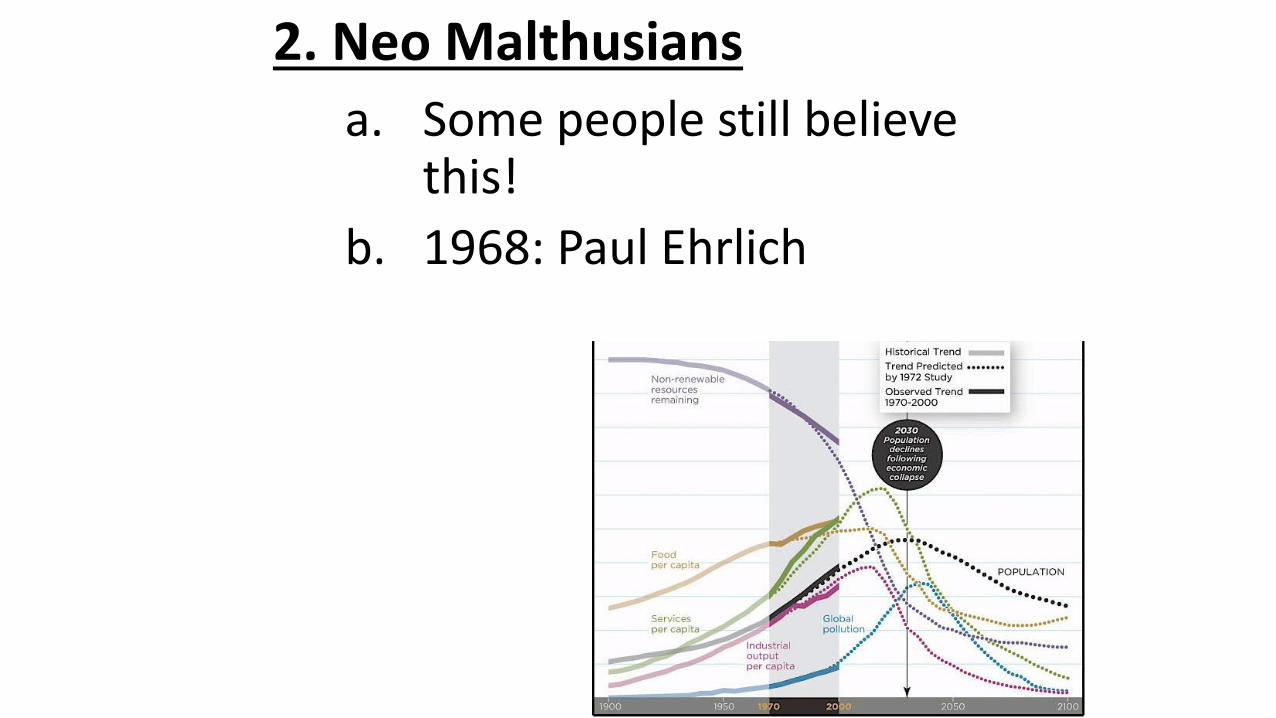
2. Neo Malthusians
a. Some people still believe this!
b. 1968: Paul Ehrlich

3. Critics
a. Resource Depletion• Our resources are expanding
b. Population Growth• More population isn’t
necessarily bad• More people = more
innovations
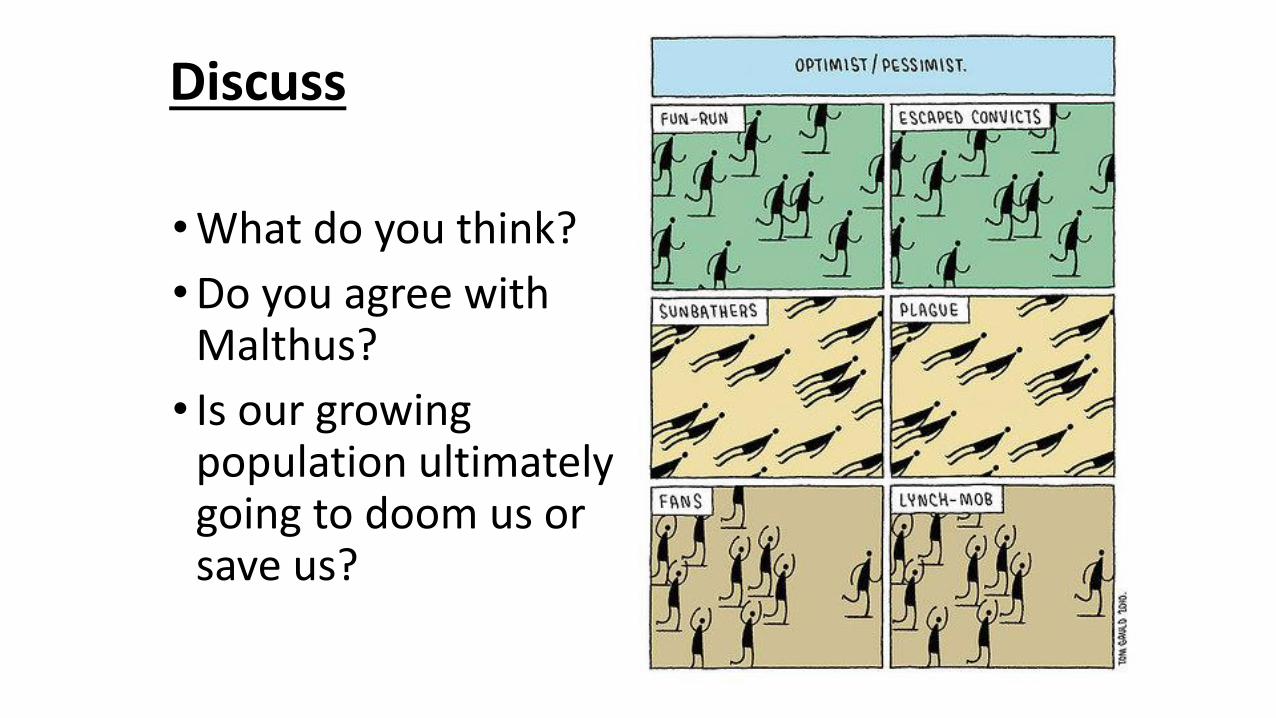
Discuss
•What do you think?
•Do you agree with Malthus?
• Is our growing population ultimately going to doom us or save us?
Summary
•Define population pyramid.
•Discuss the different challenges a country might face based on the shape of their population pyramid.
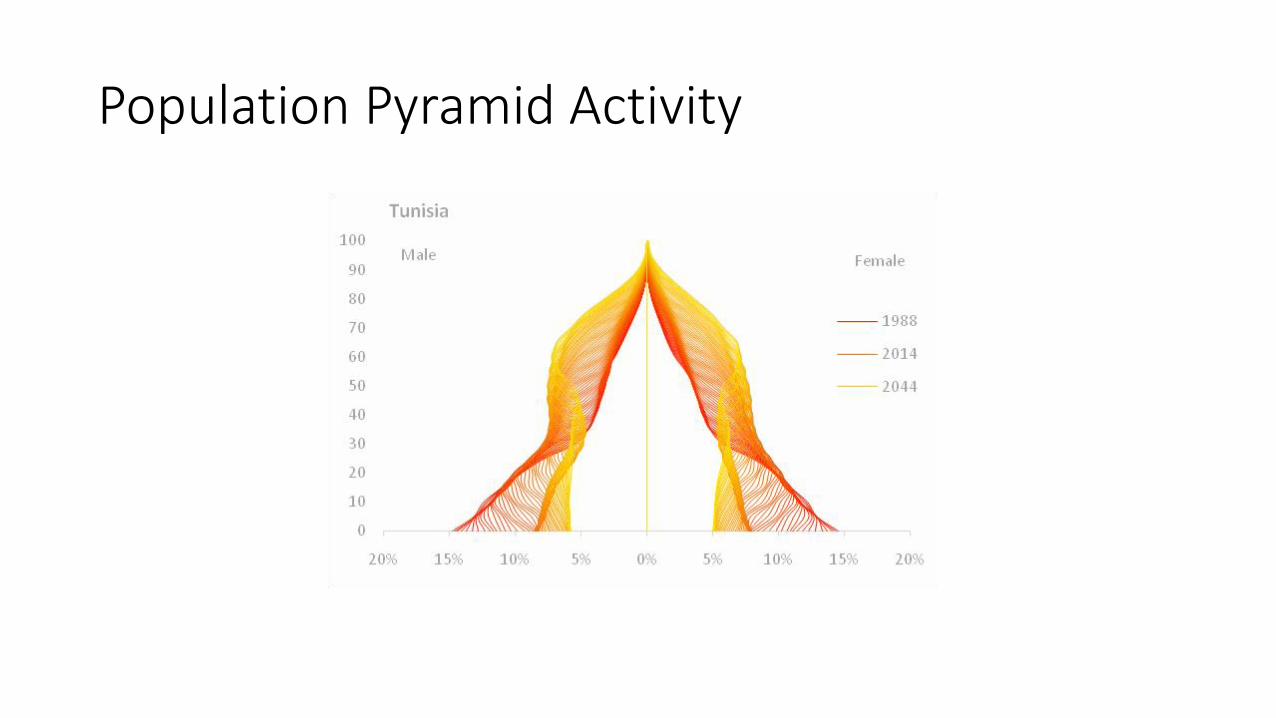
Population Pyramid Activity

Day 4
Bellwork:
•Turn in Population Pyramid! Get out your map!
•How old are your grandparents?
•What age do you want to live to? Why?

Agenda:
•Notes: Demographic Transition Model
•HW: #11-15, Quiz on Friday

Objective
•You will be able to describe the Demographic Transition Model in writing.
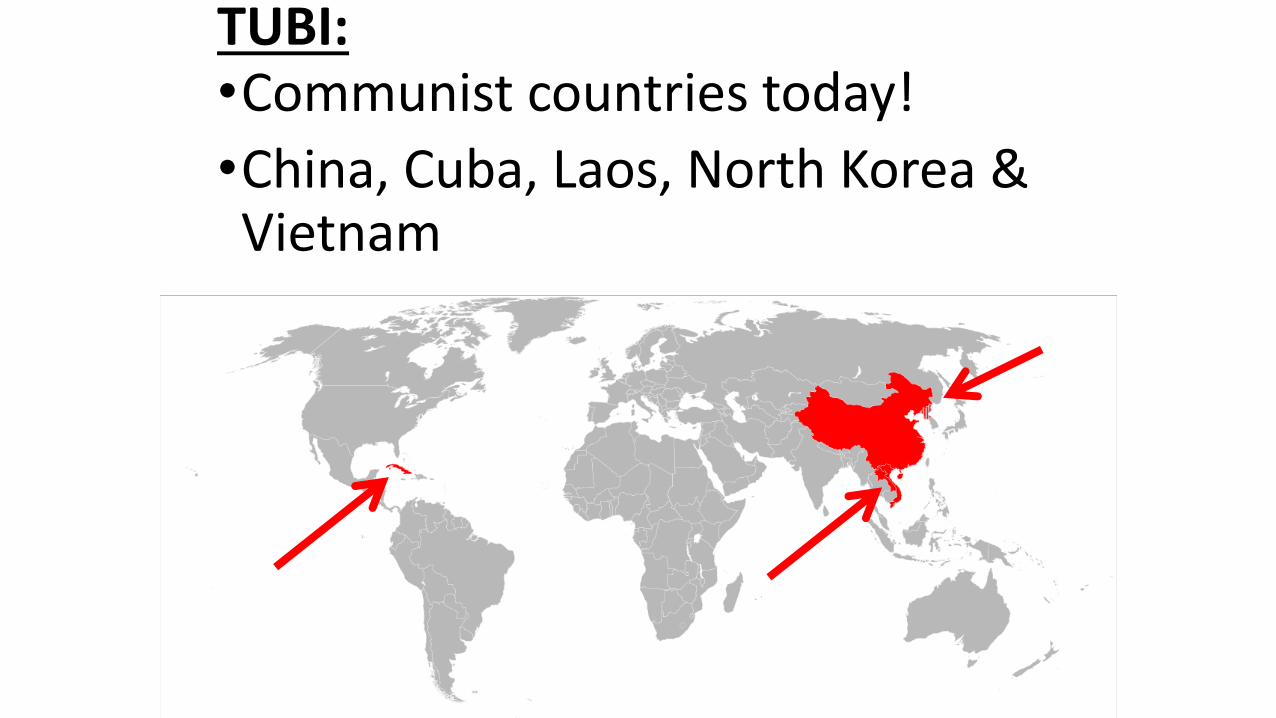
TUBI:•Communist countries today!
•China, Cuba, Laos, North Korea & Vietnam
Bellwork
•Why would a family choose to have 1 or 0 kids?•Complete sentences!
Bellwork:
•How old are your grandparents?
•What age do you want to live to? Why?
Agenda:
•Notes: Demographic Transition Model
•HW: #11-15, Quiz on Friday
Objective
•You will be able to describe the Demographic Transition Model in writing.

TUBI:•Communist countries today!
•China, Cuba, Laos, North Korea & Vietnam
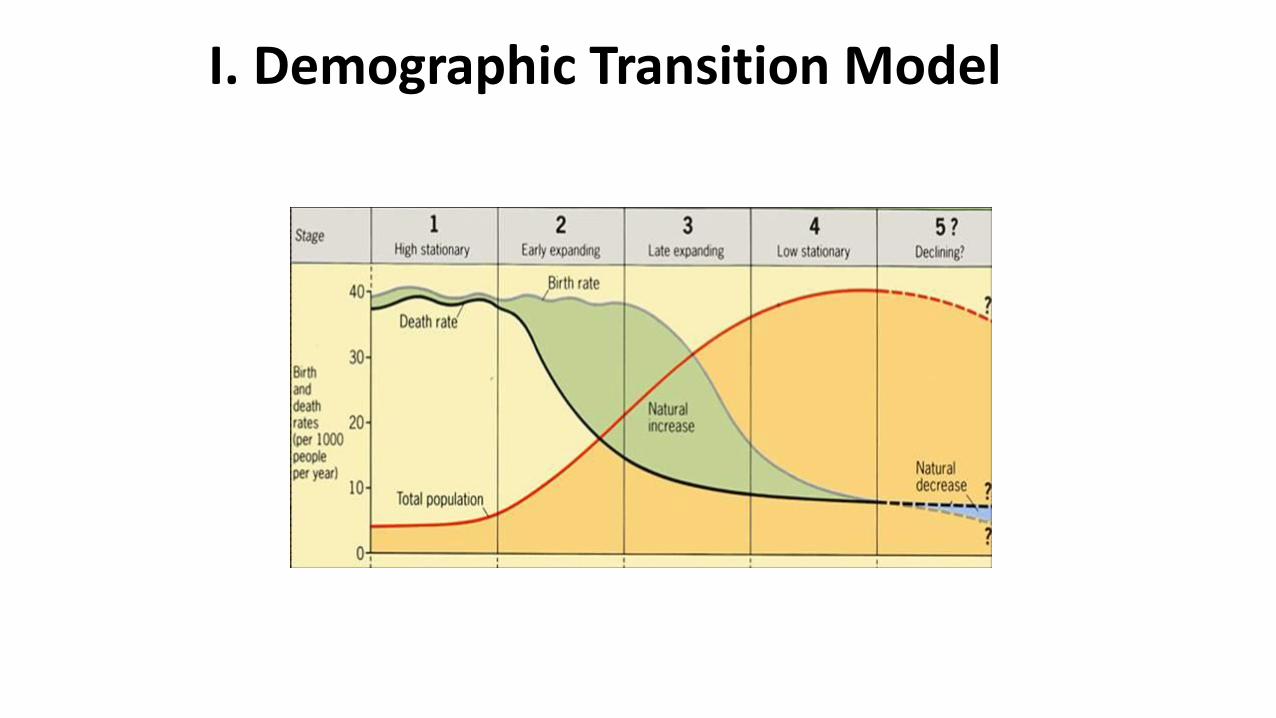
I. Demographic Transition Model

A. Demographic Transition Model*: the way a country’s demographics change as the country develops in 4 stages
*DTM is slightly different for APES
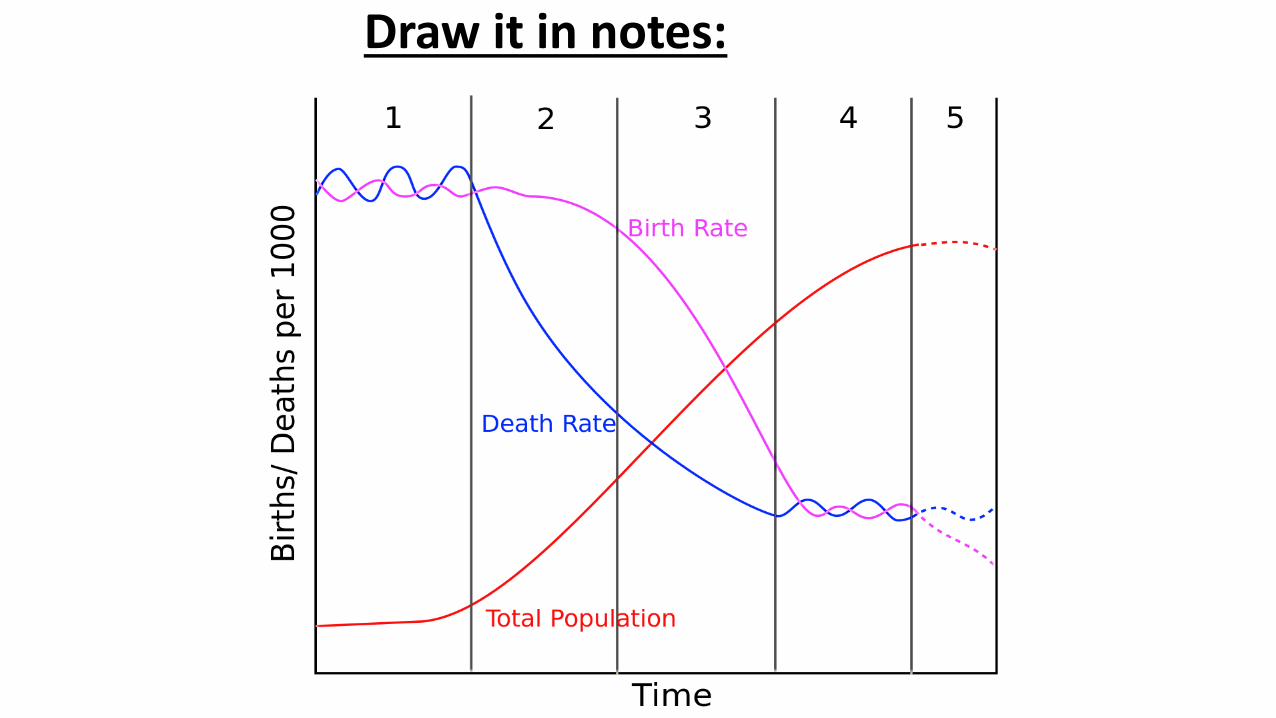
Draw it in notes:
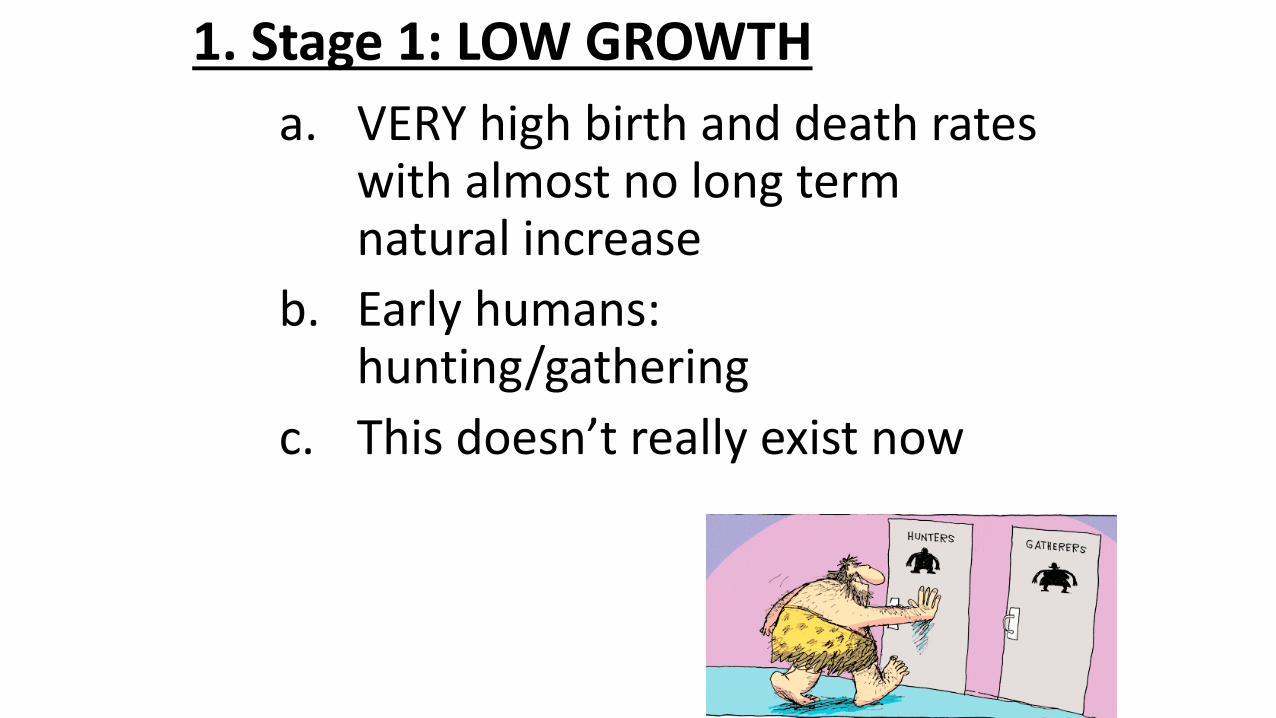
1. Stage 1: LOW GROWTH
a. VERY high birth and death rates with almost no long term natural increase
b. Early humans: hunting/gathering
c. This doesn’t really exist now

2. Stage 2: HIGH GROWTH
a. Rapid decline in death + high birth rates = high natural increase
b. Ex: Industrial Revolution

3. Stage 3: Decreasing Growth
a. Birth rates rapidly decline, death rates decline, and natural increase begin to balance
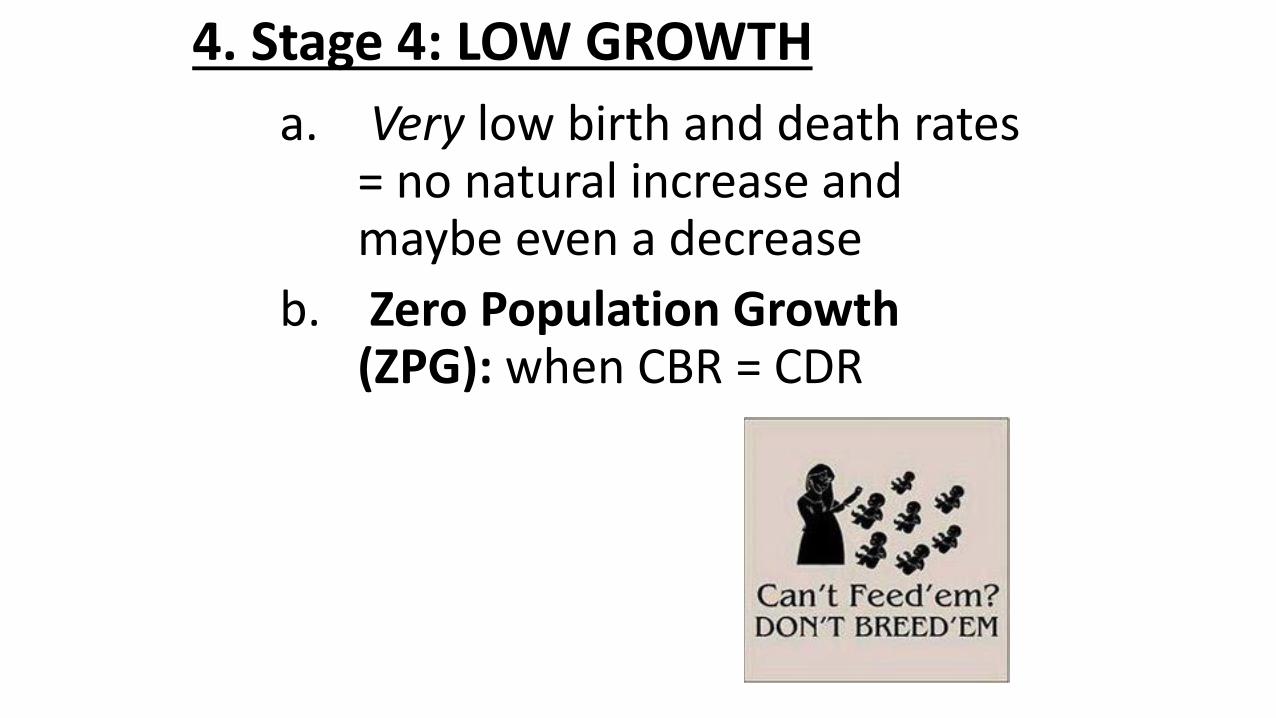
4. Stage 4: LOW GROWTH
a. Very low birth and death rates = no natural increase and maybe even a decrease
b. Zero Population Growth (ZPG): when CBR = CDR

5. HYPOTHETICAL STAGE 5
a. Population starts to decline, CDR > CBR, Negative NIR
b. Pro-Natalist Policies: Laws and programs to encourage reproduction (ex. Denmark)
• Anti-Natalist Policies: laws to discourage reproduction (China’s One Child Policy)

PRO NATALIST VIDEOS
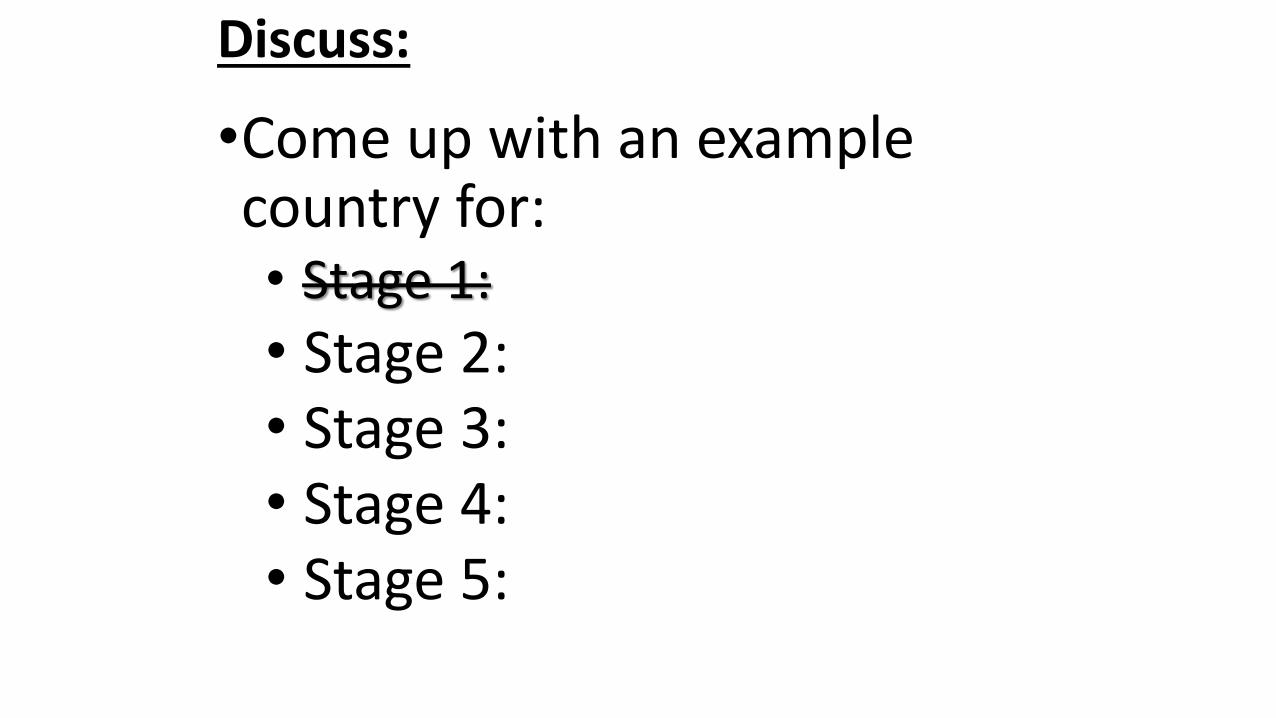
Discuss:
•Come up with an example country for:• Stage 1:
• Stage 2:• Stage 3:• Stage 4:• Stage 5:

0
5
10
15
20
25
30
35
40
45
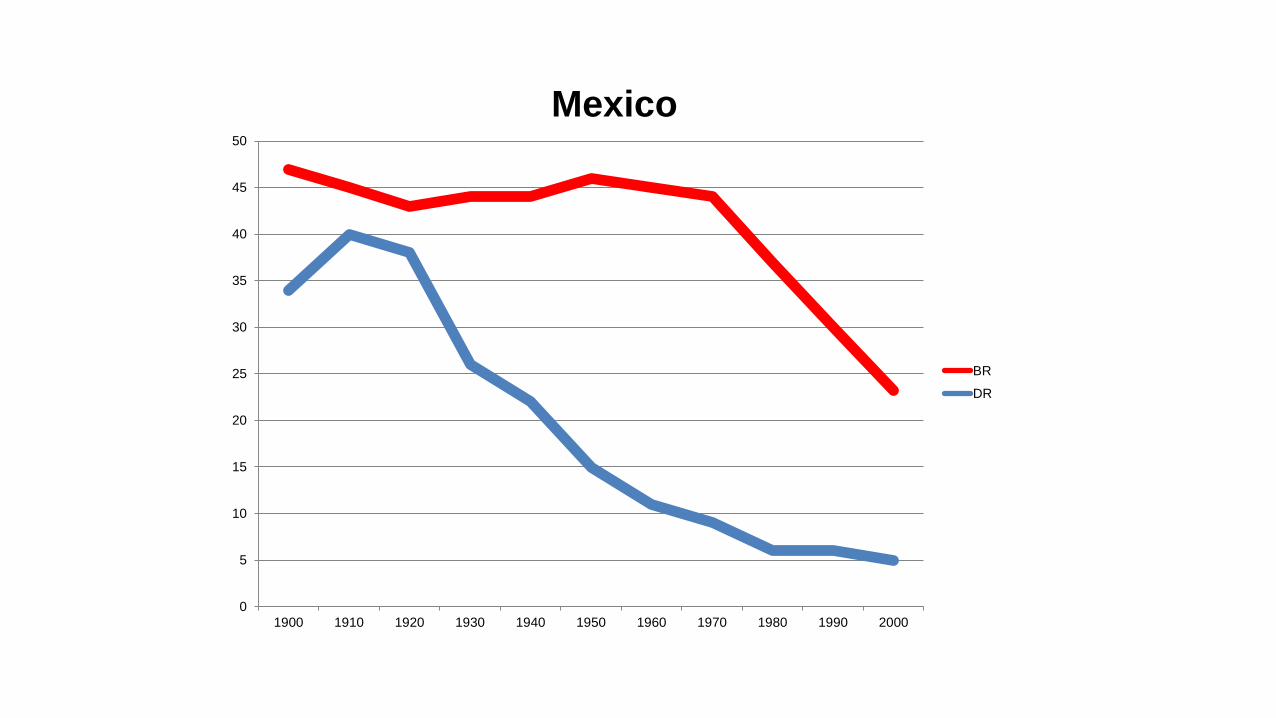
50
1900 1910 1920 1930 1940 1950 1960 1970 1980 1990 2000
Mexico
BR
DR
0
5
10
15
20
25
30
35
40
45
50
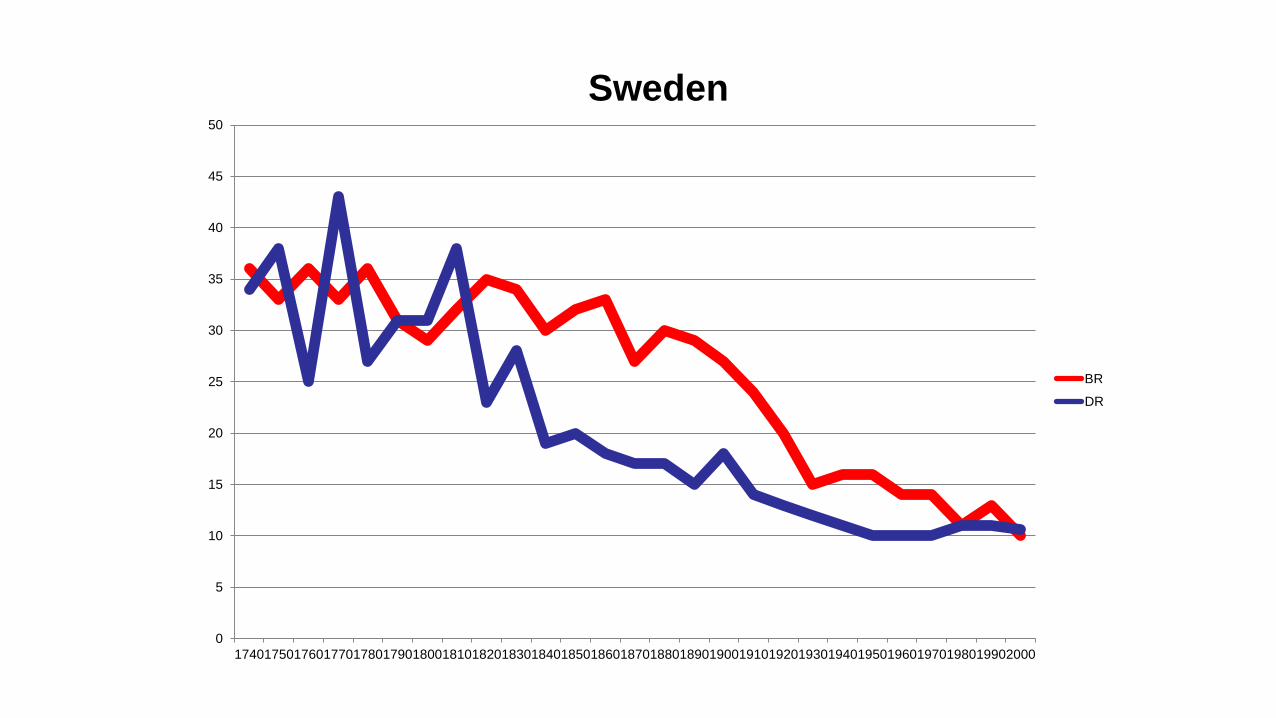
174017501760177017801790180018101820183018401850186018701880189019001910192019301940195019601970198019902000
Sweden
BR
DR
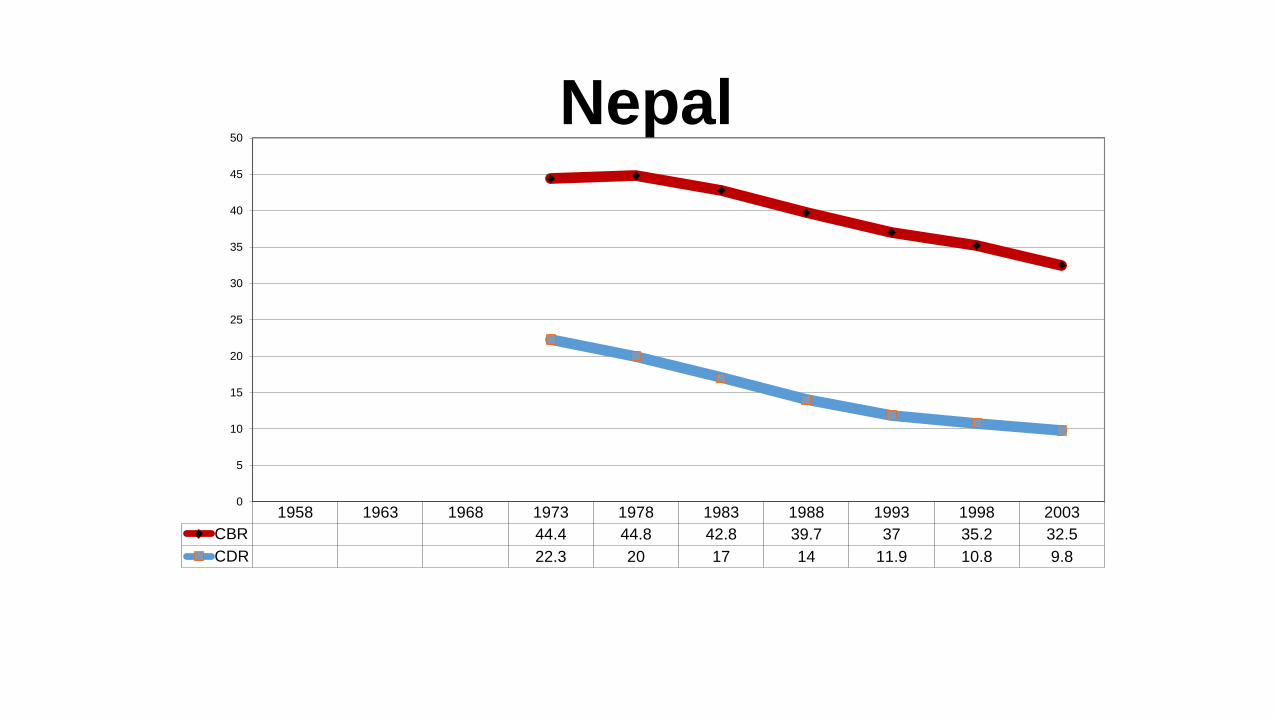
1958 1963 1968 1973 1978 1983 1988 1993 1998 2003
CBR 44.4 44.8 42.8 39.7 37 35.2 32.5
CDR 22.3 20 17 14 11.9 10.8 9.8
0
5
10
15
20
25
30
35
40
45
50
Nepal
1958 1963 1968 1973 1978 1983 1988 1993 1998 2003
CBR 41.1 33.2 23.5 22 16.8 16.2 20 15.4 12.7 12.8
CDR 7 5.7 5.5 5.4 5.1 5.3 5.2 4.4 4.1 4.3
0
5
10
15
20
25
30
35
40
45
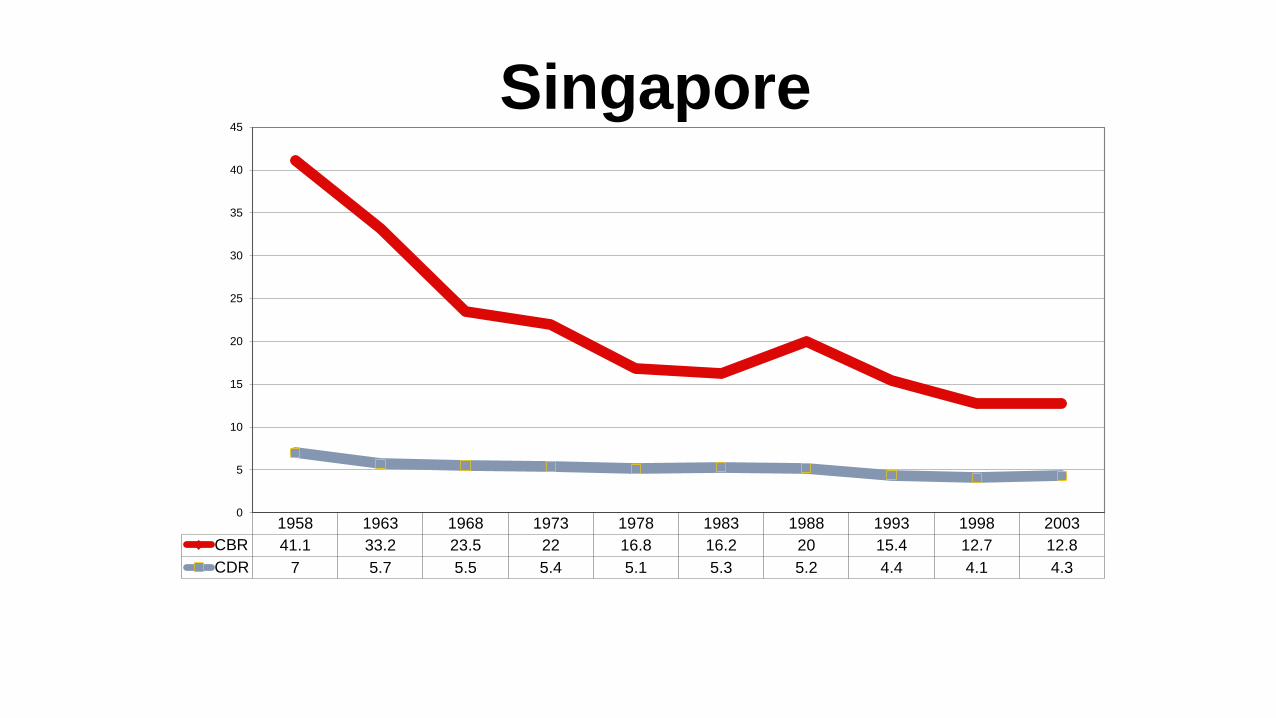
Singapore

1963 1968 1973 1978 1983 1988 1993 1998 2003
CBR 46.1 46.1 44.6 43.3 39.8 37.1 35.2
CDR 15.8 15.5 14.7 13 11.5 11.7 12.8
0
5
10
15
20
25
30
35
40
45
50
Cameroon

1963 1968 1973 1978 1983 1988 1993 1998 2003
CBR 40.4 31.6 23 27 20.9 19.8 20.2 17.1 16.1
CDR 9.7 9.2 7.8 7.1 6.5 6.5 6.7 6.9 6.8
0
5
10
15
20
25
30
35
40
45
Mauritius
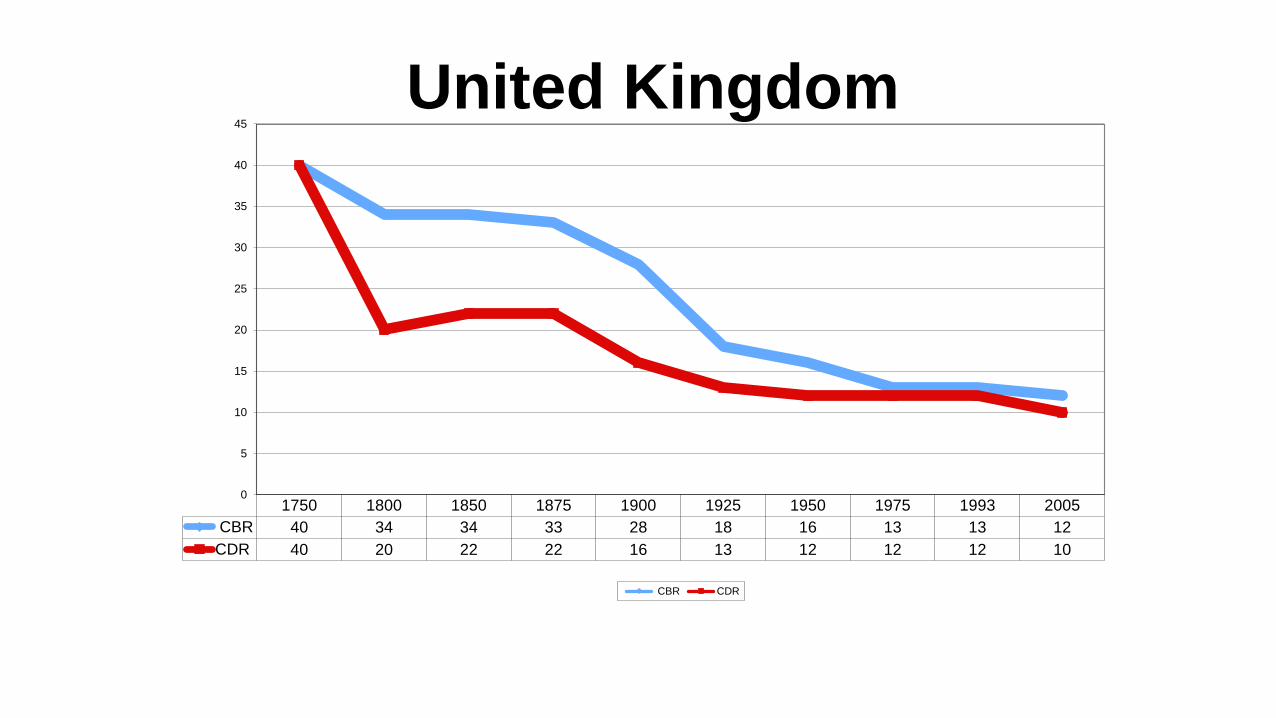
1750 1800 1850 1875 1900 1925 1950 1975 1993 2005
CBR 40 34 34 33 28 18 16 13 13 12
CDR 40 20 22 22 16 13 12 12 12 10
0
5
10
15
20
25
30
35
40
45
United Kingdom
CBR CDR

Video: Hans Rosling

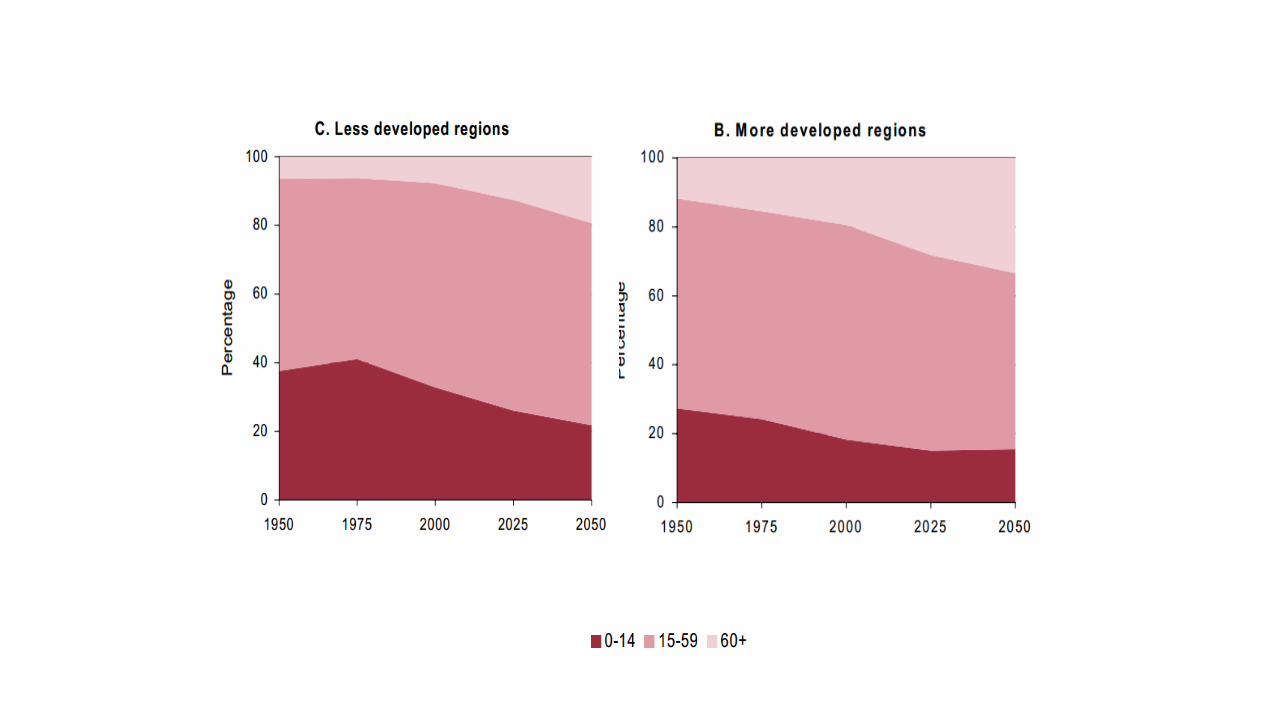
What does this mean for the old people?
Discuss
• What is the socio-economic status of the world’s aged population now?
• What will it be in the future?
Video: BBC
Summary
•Discuss the Demographic Transition Model and its significance.
•Describe a country in stage 2 verses a country in stage 4. Use real examples.
Demographic Transition Activity
• You may work with a partner to complete the demographic transition activity.
• #5 – Tell me the years for each stage as well as drawing them on the graph
•Due at the end of class.
•Done? Work reading questions or something for another class

Day 5

Bellwork:
•When was the last time you got sick? What did you have?
•What are some ways you can prevent yourself from becoming sick this semester?

Agenda:
•Notes: Health
•HW: #16-20, Quiz friday!
Objective:
•You will be able to discuss the relationship between demographics, development and health.
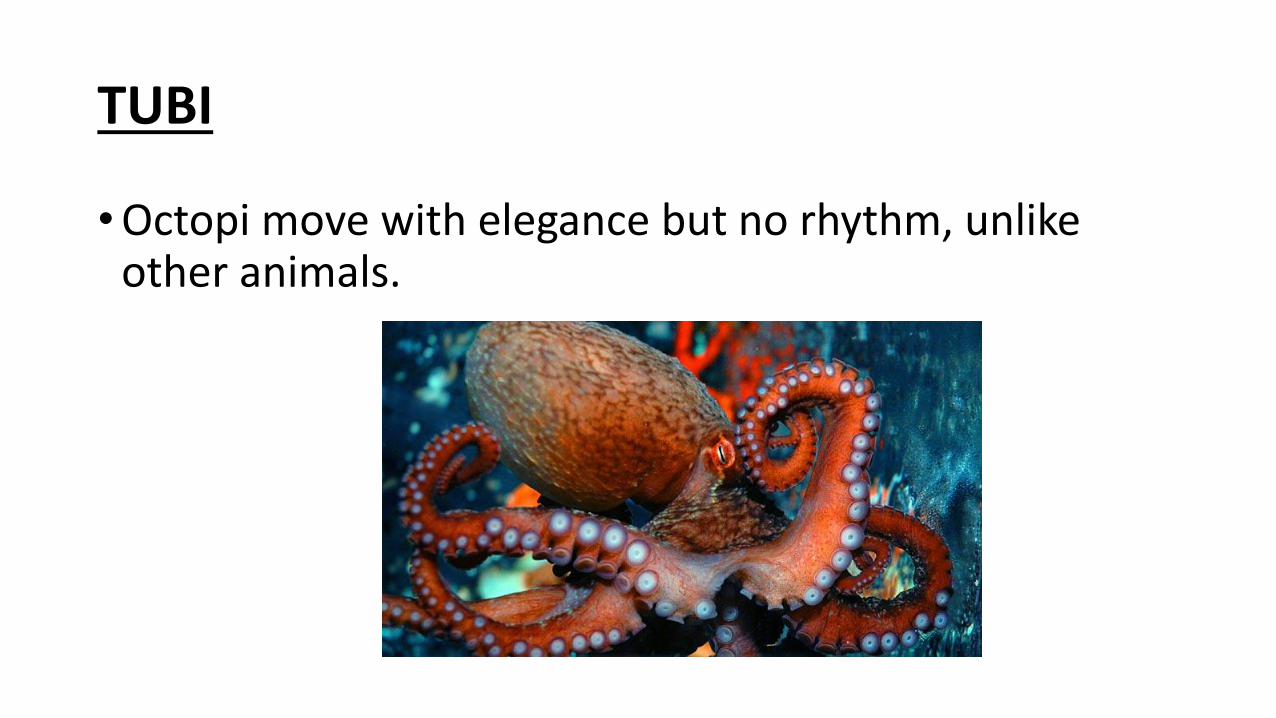
TUBI
•Octopi move with elegance but no rhythm, unlike other animals.
I. Population and Health

A. Epidemiologic Transition: The way health evolves as demographics and development change
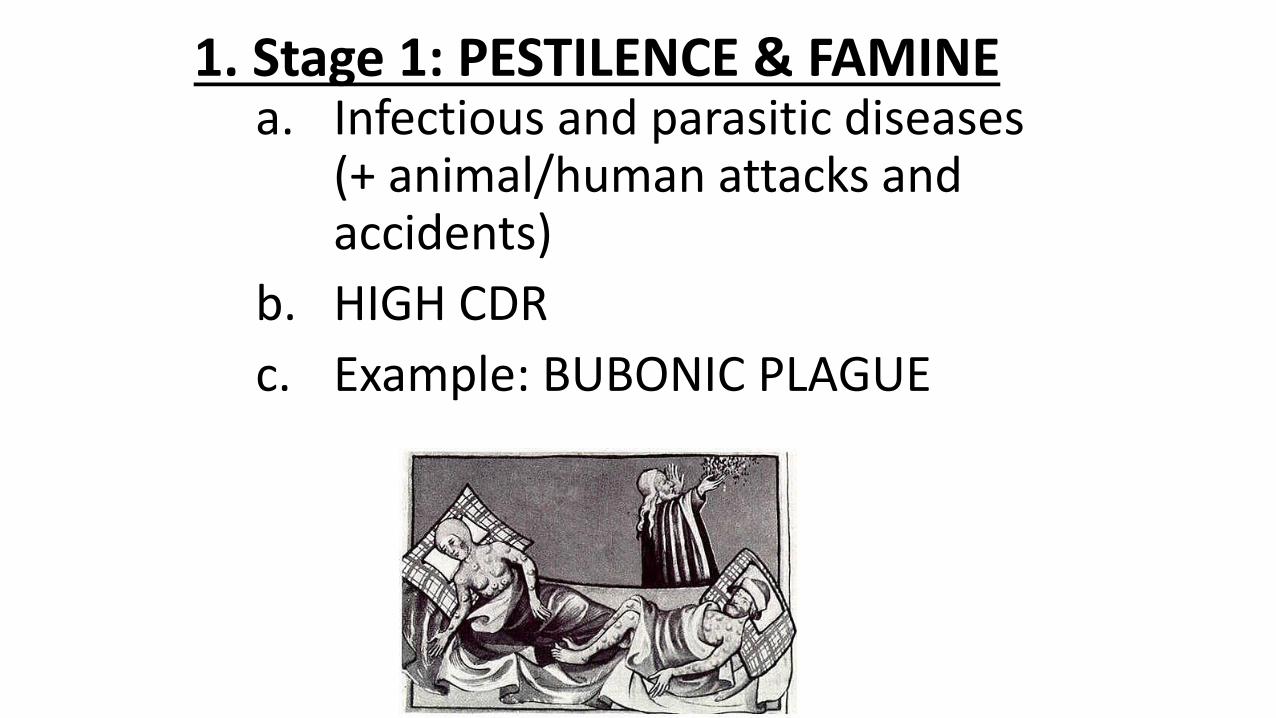
1. Stage 1: PESTILENCE & FAMINEa. Infectious and parasitic diseases
(+ animal/human attacks and accidents)
b. HIGH CDR
c. Example: BUBONIC PLAGUE

2. Stage 2: RECEDING PANDEMICS
a. Pandemic: disease that happens all over the world
b. Rapidly declining CDR
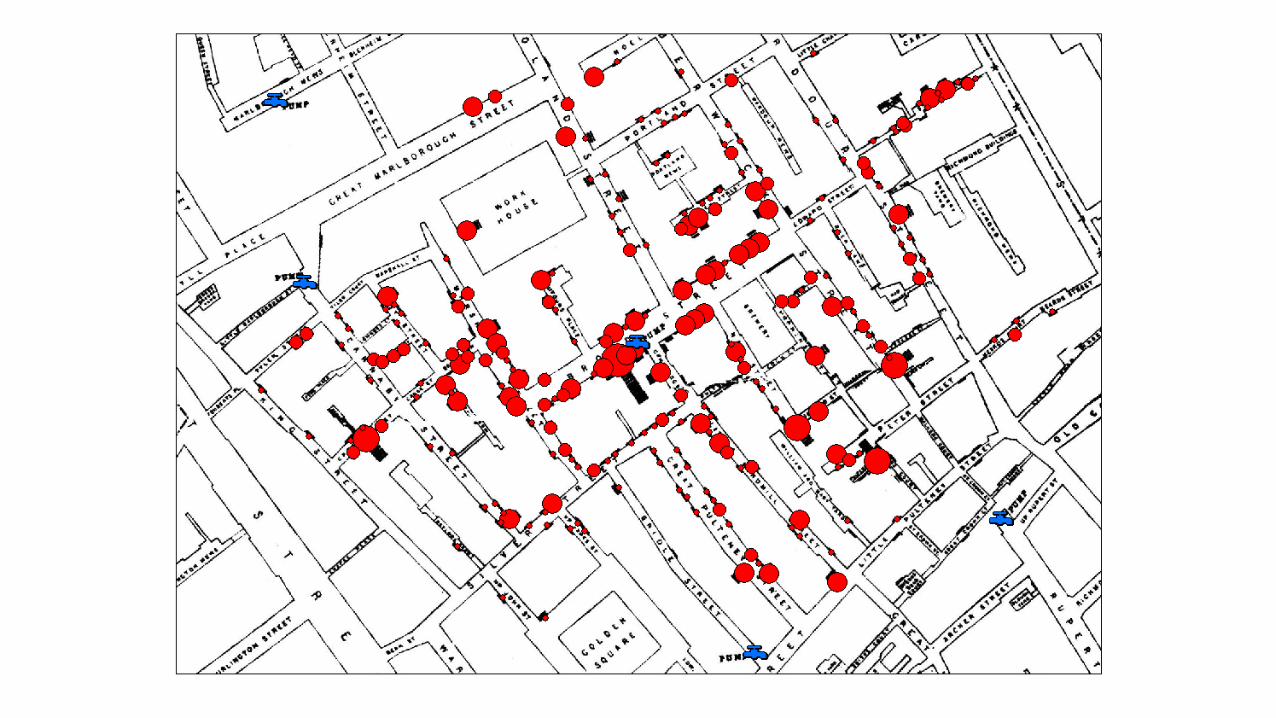
c. EX: Cholera!• Dr. John Snow figured out the
problem and fixed it!
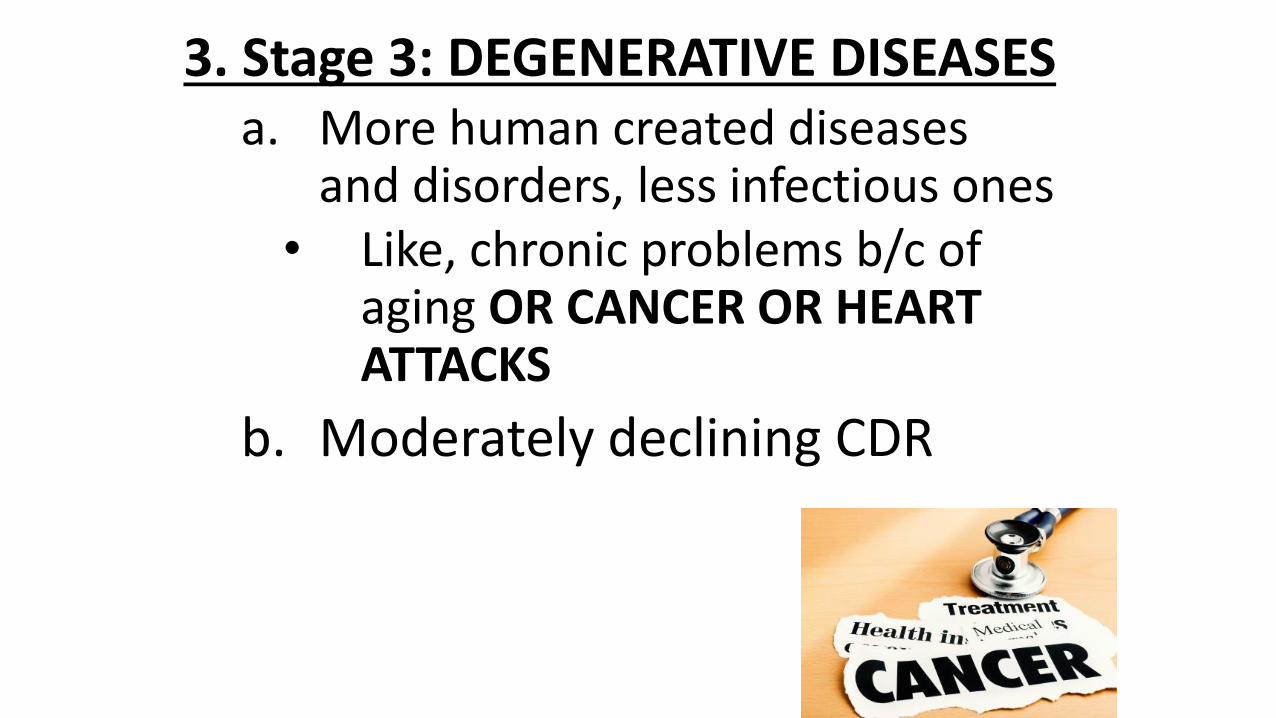
3. Stage 3: DEGENERATIVE DISEASESa. More human created diseases
and disorders, less infectious ones• Like, chronic problems b/c of
aging OR CANCER OR HEART ATTACKS
b. Moderately declining CDR

4. Stage 4: DELAYED DEGENERATIVEa. We are delaying the things that
could kill us with medicine
b. Ex: Heart surgery, chemotherapy

5. Infectious Diseasesa. Hypothetical Stage 5: Infectious
Diseases Return• EX: Ebola, Malaria, Polio,
Tuberculosis,
b. New Infectious Diseases!
• HIV/AIDS!!!

Discuss:
•What do you know about HIV/AIDS?
Why its So Hard To Cure AIDS

B. HIV/AIDS
1. 35 million people live with HIV/AIDS -3.2 million are children
2. Spreads through body fluids (blood, breast milk, or sexual contact)
3. The virus breaks down your immune system


C. Epidemic diseases become endemic
1. With more food, sanitation and hygiene
2. Epidemic: Widespread disease
3. Endemic: disease within a community
Discuss
•How can habitat, population and behavior affect human health?

D. Health Care
1. Habitat, population and behavior affect health
a. Habitat: Air or water quality, exposure to viruses, quality of home
b. Population: age, sex, geneticsc. Behavior: cultural practices, diet, smoking

2. More developed countries have better health care
a. Leads to lower CDR, IMR
b. Longer life expectancy
3. Immunizations save lives!!!
Summary
•Explain the difference between an endemic, epidemic, and pandemic disease.
•Discuss the relationship between demographics, development and health. Use at least 2 vocab words.

Day 6

Bellwork:
•SPOT CHECK #19
•Consider the Overview map:
•1 country that shares one border
•2 countries that share no borders
•2 countries that share two borders

Agenda
•QUIZ
•CASE STUDY
•HW: Read #21-26
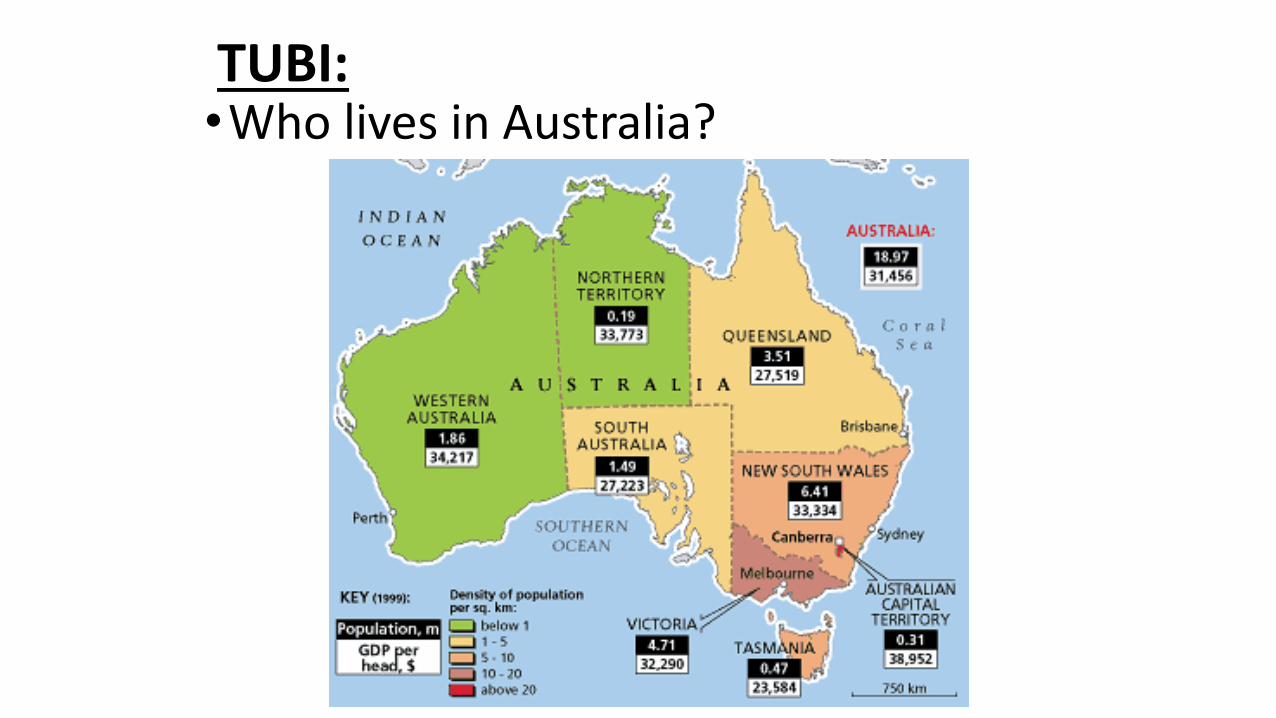
TUBI:•Who lives in Australia?

QUIZ
•Write clearly.
•# 6/7 HAVE NOTHING TO DO WITH #8/9/10• THEY ARE 2 DIFFERENT COUNTRIES
•Done? NO TECH!!

Day 7

Bellwork

Agenda:
•Practice FRQ
•HW: #21-25, quiz tomorrow!
Objective:
•You will be able to identify and explain the consequences of an aging population.

TUBI
•When we shiver, our bodies are doing the opposite of sweating. Sweating cools the body by putting a layer of liquid on the skin. Shivering tightens the skin and shakes the muscles, a process that conserves and generates heat.

FRQ
•Get out your FRQ cheat sheet and a piece of paper
•Mark up the prompt and write an outline –10 minutes!
•Use your notes and the people around you

WRITE THE FRQ
•20 minutes
•Write in pen
•You can still use your notes!
•Staple prompt to back and turn in when done.

SAMPLE FRQ RESPONSES
•What did these students do well?
•Is this what you expected?

SCORE THE FRQ
•USE A DIFFERENT COLORED PEN/PENCIL/HIGHLIGHTER
•Mark where they get the point
•Put the score at the top of the page

Day 8

Bellwork
•Spot Check #21
•Use a fresh page in your notes
•Draw and label the demographic transition model.• Label the Epidemiologic Transition Model

Agenda
• Test Review
•HW: Study, finish study questions and notes