Apartment Residents' and Day Care Workers' Exposures to Tetrachloroethylene and Deficits in Visual...
10
Environmental Health Perspectives • VOLUME 110 | NUMBER 7 | July 2002 655 Apartment Residents’ and Day Care Workers’ Exposures to Tetrachloroethylene and Deficits in Visual Contrast Sensitivity Judith S. Schreiber, 1 H. Kenneth Hudnell, 2 Andrew M. Geller, 2 Dennis E. House, 2 Kenneth M. Aldous, 3 Michael S. Force, 3 Karyn Langguth, 4 Elizabeth J. Prohonic, 4 and Jean C. Parker 5 1 State of New York, Office of Attorney General, Albany, New York, USA; 2 Office of Research and Development, National Health and Environmental Effects Research Laboratory, U.S. Environmental Protection Agency, Research Triangle Park, North Carolina, USA; 3 New York State Department of Health, Wadsworth Center, Albany, New York, USA; 4 New York State Department of Health, Center for Environmental Health, Troy, New York, USA; 5 Office of Research and Development, National Center for Environmental Assessment, U.S. Environmental Protection Agency, Washington, DC, USA Perchloroethylene (perc; also called tetra- chloroethylene or tetrachloroethene) is a polychlorinated organic compound (Cl 2 C=CCl 2 ) used by most dry-cleaning facilities and in other applications that require a nonpolar solvent ( 1). The U.S. Environmental Protection Agency (EPA) designated perc as one of 33 hazardous air pollutants in the Urban Air Toxics Strategy because of concerns for human health (2), and the International Agency for Research on Cancer classified perc as a probable human carcinogen (3). Occupational studies indicated that chronic perc exposure adversely affects the central nervous system, kidneys, liver, and the reproductive system (4), even at airborne exposure levels well below the 8-hr, time-weighted average, threshold limit value of 170,000 μg/m 3 (25 ppm; 6,800 μg/m 3 = 1ppm) proposed by the American Conference of Governmental Industrial Hygienists ( 5). Inhalation was usually the major route of exposure to perc because it is highly volatile. In addition to occupational exposure to perc, screening for environmental exposure indicated that 76% of the general population had detectable perc in urine (6). A survey identified 600 operat- ing dry-cleaning facilities in residential buildings in New York State (7) that were estimated to expose 170,000 residents and workers. Residential indoor air perc levels ranged from several hundred to thousands of micrograms per cubic meter (8), far in excess of background indoor air perc levels of 5–6 μg/m 3 (0.75–0.89 ppb) (9,10). The U.S. EPA has not yet issued a reference concentra- tion (RfC) guideline level for environmental exposure to airborne perc, but the New York State Department of Health (NYSDOH) developed an air quality guideline of 100 μg/m 3 (15 ppb) (11). The observations of perc-induced health effects in occupationally exposed populations (4) and of environmen- tal perc exposure in the general population (6–8) indicate that research is needed on which to base human-health risk assessments of environmental perc exposure. Address correspondence to H.K. Hudnell, MD- 74B, U.S. Environmental Protection Agency, Research Triangle Park, NC 27711 USA. Telephone: (919) 541-7866. Fax: (919) 541-4849. E-mail: [email protected] We thank S. House and D. Sharron of the New York State Department of Health for their assistance in sample collection and data analysis; R. Narang of the Wadsworth Laboratory of NYSDOH, D. Ashley of the Centers for Disease Control and Prevention, and W. Dekant of the University of Wurzburg, Germany, for sample analysis; and D. Monahan of Mt. Sinai Medical Center for blood sample collections. We also thank reviewers of the paper for the U.S. EPA clearance process—P. Bushnell, C. Scott, R. Hetes, within EPA’s Office of Research and Development, and F. Gobba, Universita di Modena e Reggio Emilia, Italy—for their insightful comments and sugges- tions. We express our appreciation to the families who participated in the study for their generous cooperation. This work was supported by U.S. EPA Cooperative Agreement CR824400-01. This manuscript was reviewed by the National Health and Environmental Effects Research Laboratory, U.S. EPA, and approved for publication. Approval does not signify that the contents necessarily reflect the views and policies of the agency, nor does mention of trade names or commercial products constitute endorse- ment or recommendation. This manuscript was reviewed by the Office of the New York State Attorney General and approved for publication. Approval does not signify that the contents necessar- ily reflect the views and policies of the Attorney General’s Office. J.S. Schreiber collected the data discussed in this article while employed at the New York State Department of Health prior to employ- ment with the Attorney General’s Office. Received 15 August 2001; accepted 2 January 2002. Articles Tetrachloroethylene (also called perchloroethylene, or perc), a volatile organic compound, has been the predominant solvent used by the dry-cleaning industry for many years. The U.S. Environmental Protection Agency (EPA) classified perc as a hazardous air pollutant because of its potential adverse impact on human health. Several occupational studies have indicated that chronic, airborne perc exposure adversely affects neurobehavioral functions in workers, particu- larly visual color discrimination and tasks dependent on rapid visual-information processing. A 1995 study by Altmann and colleagues extended these findings, indicating that environmental perc exposure at a mean level of 4,980 μg/m 3 (median=1,360 μg/m 3 ) alters neurobehavioral func- tions in residents living near dry-cleaning facilities. Although the U.S. EPA has not yet set a refer- ence concentration guideline level for environmental exposure to airborne perc, the New York State Department of Health set an air quality guideline of 100 μg/m 3 . In the current residential study, we investigated the potential for perc exposure and neurologic effects, using a battery of visual-system function tests, among healthy members of six families living in two apartment buildings in New York City that contained dry-cleaning facilities on the ground floors. In addi- tion, a day care investigation assessed the potential for perc exposure and effects among workers at a day care center located in the same one-story building as a dry-cleaning facility. Results from the residential study showed a mean exposure level of 778 μg/m 3 perc in indoor air for a mean of 5.8 years, and that perc levels in breath, blood, and urine were 1–2 orders of magnitude in excess of background values. Group-mean visual contrast sensitivity (VCS), a measure of the ability to detect visual patterns, was significantly reduced in the 17 exposed study participants relative to unexposed matched-control participants. The groups did not differ in visual acuity, suggesting that the VCS deficit was of neurologic origin. Healthy workers in the day care investigation were chronically exposed to airborne perc at a mean of 2,150 μg/m 3 for a mean of 4.0 years. Again, group-mean VCS, measured 6 weeks after exposure cessation, was significantly reduced in the nine exposed workers relative to matched controls, and the groups did not differ significantly in visual acuity. These results suggested that chronic, environmental exposure to airborne perc adversely affects neurobehavioral function in healthy individuals. Further research is needed to assess the susceptibility of the young and elderly to perc-induced effects, to determine whether persistent solvent-induced VCS deficits are a risk factor for the development of neurologic disease, and to identify the no observable adverse effect level for chronic, environmental, perc exposure in humans. Key words: color discrimination, human exposure, perchloroethylene, tetrachlorethylene, vision, visual contrast sensitivity. Environ Health Perspect 110:655–664 (2002). [Online 24 May 2002] http://ehpnet1.niehs.nih.gov/docs/2002/110p655-664schreiber/abstract.html
Transcript of Apartment Residents' and Day Care Workers' Exposures to Tetrachloroethylene and Deficits in Visual...
Environmental Health Perspectives • VOLUME 110 | NUMBER 7 | July 2002 655
Apartment Residents’ and Day Care Workers’ Exposures toTetrachloroethylene and Deficits in Visual Contrast Sensitivity
Judith S. Schreiber,1 H. Kenneth Hudnell,2 Andrew M. Geller,2 Dennis E. House,2 Kenneth M. Aldous,3
Michael S. Force,3 Karyn Langguth,4 Elizabeth J. Prohonic,4 and Jean C. Parker5
1State of New York, Office of Attorney General, Albany, New York, USA; 2Office of Research and Development, National Health andEnvironmental Effects Research Laboratory, U.S. Environmental Protection Agency, Research Triangle Park, North Carolina, USA;3New York State Department of Health, Wadsworth Center, Albany, New York, USA; 4New York State Department of Health, Center forEnvironmental Health, Troy, New York, USA; 5Office of Research and Development, National Center for Environmental Assessment, U.S. Environmental Protection Agency, Washington, DC, USA
Perchloroethylene (perc; also called tetra-chloroethylene or tetrachloroethene) is a polychlorinated organic compound(Cl2C=CCl2) used by most dry-cleaningfacilities and in other applications thatrequire a nonpolar solvent (1). The U.S.Environmental Protection Agency (EPA)designated perc as one of 33 hazardous airpollutants in the Urban Air Toxics Strategybecause of concerns for human health (2),and the International Agency for Researchon Cancer classified perc as a probablehuman carcinogen (3). Occupational studiesindicated that chronic perc exposureadversely affects the central nervous system,kidneys, liver, and the reproductive system
(4), even at airborne exposure levels wellbelow the 8-hr, time-weighted average,threshold limit value of 170,000 µg/m3 (25ppm; 6,800 µg/m3 = 1ppm) proposed by theAmerican Conference of GovernmentalIndustrial Hygienists (5). Inhalation wasusually the major route of exposure to percbecause it is highly volatile. In addition tooccupational exposure to perc, screening forenvironmental exposure indicated that 76%of the general population had detectable percin urine (6). A survey identified 600 operat-ing dry-cleaning facilities in residentialbuildings in New York State (7) that wereestimated to expose 170,000 residents andworkers. Residential indoor air perc levels
ranged from several hundred to thousands ofmicrograms per cubic meter (8), far in excessof background indoor air perc levels of 5–6µg/m3 (0.75–0.89 ppb) (9,10). The U.S.EPA has not yet issued a reference concentra-tion (RfC) guideline level for environmentalexposure to airborne perc, but the New YorkState Department of Health (NYSDOH)developed an air quality guideline of 100µg/m3 (15 ppb) (11). The observations ofperc-induced health effects in occupationallyexposed populations (4) and of environmen-tal perc exposure in the general population(6–8) indicate that research is needed onwhich to base human-health risk assessmentsof environmental perc exposure.
Address correspondence to H.K. Hudnell, MD-74B, U.S. Environmental Protection Agency,Research Triangle Park, NC 27711 USA.Telephone: (919) 541-7866. Fax: (919) 541-4849.E-mail: [email protected]
We thank S. House and D. Sharron of theNew York State Department of Health for theirassistance in sample collection and data analysis;R. Narang of the Wadsworth Laboratory ofNYSDOH, D. Ashley of the Centers for DiseaseControl and Prevention, and W. Dekant of theUniversity of Wurzburg, Germany, for sampleanalysis; and D. Monahan of Mt. Sinai MedicalCenter for blood sample collections. We also thankreviewers of the paper for the U.S. EPA clearanceprocess—P. Bushnell, C. Scott, R. Hetes, withinEPA’s Office of Research and Development, and F.Gobba, Universita di Modena e Reggio Emilia,Italy—for their insightful comments and sugges-tions. We express our appreciation to the familieswho participated in the study for their generouscooperation.
This work was supported by U.S. EPA CooperativeAgreement CR824400-01. This manuscript wasreviewed by the National Health and EnvironmentalEffects Research Laboratory, U.S. EPA, andapproved for publication. Approval does not signifythat the contents necessarily reflect the views andpolicies of the agency, nor does mention of tradenames or commercial products constitute endorse-ment or recommendation. This manuscript wasreviewed by the Office of the New York StateAttorney General and approved for publication.Approval does not signify that the contents necessar-ily reflect the views and policies of the AttorneyGeneral’s Office. J.S. Schreiber collected the datadiscussed in this article while employed at the NewYork State Department of Health prior to employ-ment with the Attorney General’s Office.
Received 15 August 2001; accepted 2 January2002.
Articles
Tetrachloroethylene (also called perchloroethylene, or perc), a volatile organic compound, hasbeen the predominant solvent used by the dry-cleaning industry for many years. The U.S.Environmental Protection Agency (EPA) classified perc as a hazardous air pollutant because of itspotential adverse impact on human health. Several occupational studies have indicated thatchronic, airborne perc exposure adversely affects neurobehavioral functions in workers, particu-larly visual color discrimination and tasks dependent on rapid visual-information processing. A1995 study by Altmann and colleagues extended these findings, indicating that environmentalperc exposure at a mean level of 4,980 µg/m3 (median=1,360 µg/m3) alters neurobehavioral func-tions in residents living near dry-cleaning facilities. Although the U.S. EPA has not yet set a refer-ence concentration guideline level for environmental exposure to airborne perc, the New YorkState Department of Health set an air quality guideline of 100 µg/m3. In the current residentialstudy, we investigated the potential for perc exposure and neurologic effects, using a battery ofvisual-system function tests, among healthy members of six families living in two apartmentbuildings in New York City that contained dry-cleaning facilities on the ground floors. In addi-tion, a day care investigation assessed the potential for perc exposure and effects among workersat a day care center located in the same one-story building as a dry-cleaning facility. Results fromthe residential study showed a mean exposure level of 778 µg/m3 perc in indoor air for a mean of5.8 years, and that perc levels in breath, blood, and urine were 1–2 orders of magnitude in excessof background values. Group-mean visual contrast sensitivity (VCS), a measure of the ability todetect visual patterns, was significantly reduced in the 17 exposed study participants relative tounexposed matched-control participants. The groups did not differ in visual acuity, suggestingthat the VCS deficit was of neurologic origin. Healthy workers in the day care investigation werechronically exposed to airborne perc at a mean of 2,150 µg/m3 for a mean of 4.0 years. Again,group-mean VCS, measured 6 weeks after exposure cessation, was significantly reduced in thenine exposed workers relative to matched controls, and the groups did not differ significantly invisual acuity. These results suggested that chronic, environmental exposure to airborne percadversely affects neurobehavioral function in healthy individuals. Further research is needed toassess the susceptibility of the young and elderly to perc-induced effects, to determine whetherpersistent solvent-induced VCS deficits are a risk factor for the development of neurologic disease,and to identify the no observable adverse effect level for chronic, environmental, perc exposure inhumans. Key words: color discrimination, human exposure, perchloroethylene, tetrachlorethylene,vision, visual contrast sensitivity. Environ Health Perspect 110:655–664 (2002). [Online24 May 2002]http://ehpnet1.niehs.nih.gov/docs/2002/110p655-664schreiber/abstract.html
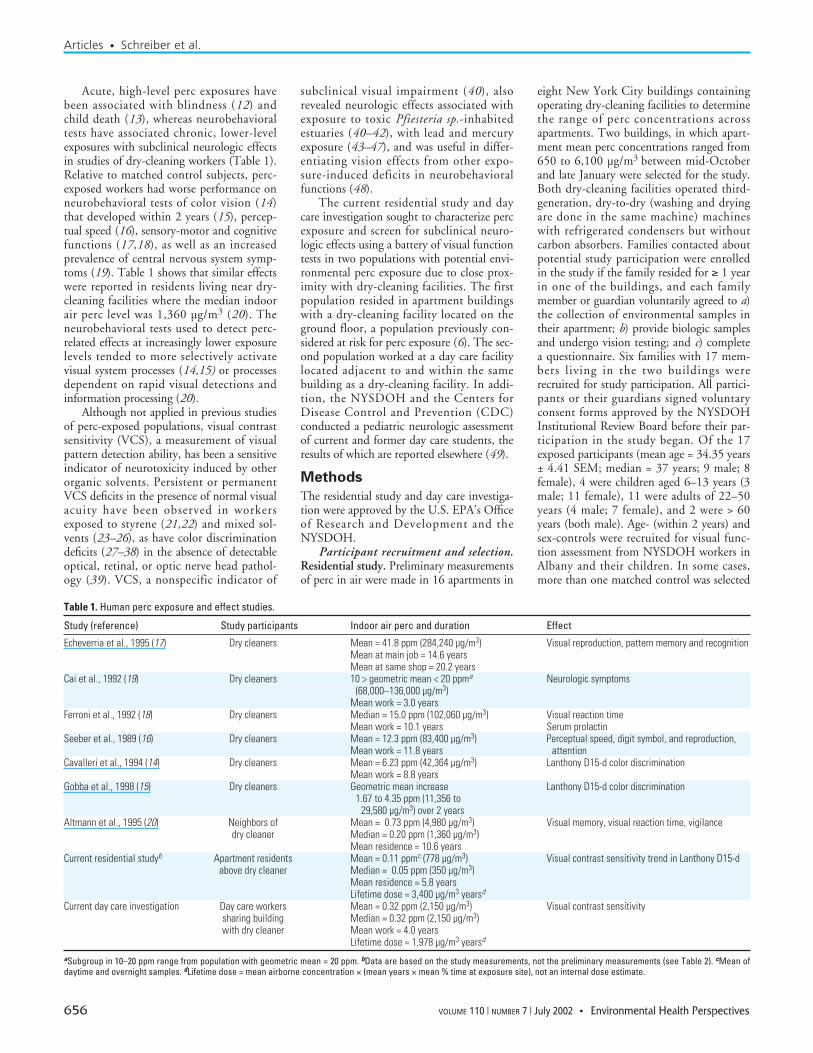
Acute, high-level perc exposures havebeen associated with blindness (12) andchild death (13), whereas neurobehavioraltests have associated chronic, lower-levelexposures with subclinical neurologic effectsin studies of dry-cleaning workers (Table 1).Relative to matched control subjects, perc-exposed workers had worse performance onneurobehavioral tests of color vision (14)that developed within 2 years (15), percep-tual speed (16), sensory-motor and cognitivefunctions (17,18), as well as an increasedprevalence of central nervous system symp-toms (19). Table 1 shows that similar effectswere reported in residents living near dry-cleaning facilities where the median indoorair perc level was 1,360 µg/m3 (20). Theneurobehavioral tests used to detect perc-related effects at increasingly lower exposurelevels tended to more selectively activatevisual system processes (14,15) or processesdependent on rapid visual detections andinformation processing (20).
Although not applied in previous studiesof perc-exposed populations, visual contrastsensitivity (VCS), a measurement of visualpattern detection ability, has been a sensitiveindicator of neurotoxicity induced by otherorganic solvents. Persistent or permanentVCS deficits in the presence of normal visualacuity have been observed in workersexposed to styrene (21,22) and mixed sol-vents (23–26), as have color discriminationdeficits (27–38) in the absence of detectableoptical, retinal, or optic nerve head pathol-ogy (39). VCS, a nonspecific indicator of
subclinical visual impairment (40), alsorevealed neurologic effects associated withexposure to toxic Pfiesteria sp.-inhabitedestuaries (40–42), with lead and mercuryexposure (43–47), and was useful in differ-entiating vision effects from other expo-sure-induced deficits in neurobehavioralfunctions (48).
The current residential study and daycare investigation sought to characterize percexposure and screen for subclinical neuro-logic effects using a battery of visual functiontests in two populations with potential envi-ronmental perc exposure due to close prox-imity with dry-cleaning facilities. The firstpopulation resided in apartment buildingswith a dry-cleaning facility located on theground floor, a population previously con-sidered at risk for perc exposure (6). The sec-ond population worked at a day care facilitylocated adjacent to and within the samebuilding as a dry-cleaning facility. In addi-tion, the NYSDOH and the Centers forDisease Control and Prevention (CDC)conducted a pediatric neurologic assessmentof current and former day care students, theresults of which are reported elsewhere (49).
Methods
The residential study and day care investiga-tion were approved by the U.S. EPA’s Officeof Research and Development and theNYSDOH.
Participant recruitment and selection.Residential study. Preliminary measurementsof perc in air were made in 16 apartments in
eight New York City buildings containingoperating dry-cleaning facilities to determinethe range of perc concentrations acrossapartments. Two buildings, in which apart-ment mean perc concentrations ranged from650 to 6,100 µg/m3 between mid-Octoberand late January were selected for the study.Both dry-cleaning facilities operated third-generation, dry-to-dry (washing and dryingare done in the same machine) machineswith refrigerated condensers but withoutcarbon absorbers. Families contacted aboutpotential study participation were enrolledin the study if the family resided for ≥ 1 yearin one of the buildings, and each familymember or guardian voluntarily agreed to a)the collection of environmental samples intheir apartment; b) provide biologic samplesand undergo vision testing; and c) completea questionnaire. Six families with 17 mem-bers living in the two buildings wererecruited for study participation. All partici-pants or their guardians signed voluntaryconsent forms approved by the NYSDOHInstitutional Review Board before their par-ticipation in the study began. Of the 17exposed participants (mean age = 34.35 years± 4.41 SEM; median = 37 years; 9 male; 8female), 4 were children aged 6–13 years (3male; 11 female), 11 were adults of 22–50years (4 male; 7 female), and 2 were > 60years (both male). Age- (within 2 years) andsex-controls were recruited for visual func-tion assessment from NYSDOH workers inAlbany and their children. In some cases,more than one matched control was selected
Articles • Schreiber et al.
656 VOLUME 110 | NUMBER 7 | July 2002 • Environmental Health Perspectives
Table 1. Human perc exposure and effect studies.
Study (reference) Study participants Indoor air perc and duration Effect
Echeverria et al., 1995 (17) Dry cleaners Mean = 41.8 ppm (284,240 µg/m3) Visual reproduction, pattern memory and recognitionMean at main job = 14.6 yearsMean at same shop = 20.2 years
Cai et al., 1992 (19) Dry cleaners 10 > geometric mean < 20 ppma Neurologic symptoms(68,000–136,000 µg/m3)
Mean work = 3.0 yearsFerroni et al., 1992 (18) Dry cleaners Median = 15.0 ppm (102,060 µg/m3) Visual reaction time
Mean work = 10.1 years Serum prolactinSeeber et al., 1989 (16) Dry cleaners Mean = 12.3 ppm (83,400 µg/m3) Perceptual speed, digit symbol, and reproduction,
Mean work = 11.8 years attentionCavalleri et al., 1994 (14) Dry cleaners Mean = 6.23 ppm (42,364 µg/m3) Lanthony D15-d color discrimination
Mean work = 8.8 yearsGobba et al., 1998 (15) Dry cleaners Geometric mean increase Lanthony D15-d color discrimination
1.67 to 4.35 ppm (11,356 to29,580 µg/m3) over 2 years
Altmann et al., 1995 (20) Neighbors of Mean = 0.73 ppm (4,980 µg/m3) Visual memory, visual reaction time, vigilancedry cleaner Median = 0.20 ppm (1,360 µg/m3)
Mean residence = 10.6 yearsCurrent residential studyb Apartment residents Mean = 0.11 ppmc (778 µg/m3) Visual contrast sensitivity trend in Lanthony D15-d
above dry cleaner Median = 0.05 ppm (350 µg/m3)Mean residence = 5.8 yearsLifetime dose = 3,400 µg/m3 yearsd
Current day care investigation Day care workers Mean = 0.32 ppm (2,150 µg/m3) Visual contrast sensitivitysharing building Median = 0.32 ppm (2,150 µg/m3)with dry cleaner Mean work = 4.0 years
Lifetime dose = 1,978 µg/m3 yearsd
aSubgroup in 10–20 ppm range from population with geometric mean = 20 ppm. bData are based on the study measurements, not the preliminary measurements (see Table 2). cMean ofdaytime and overnight samples. dLifetime dose = mean airborne concentration × (mean years × mean % time at exposure site), not an internal dose estimate.
for an exposed participant, resulting in thetesting of 25 control participants. Whenmore than one control participant wasmatched with an exposed participant, datafrom the controls were averaged for compar-ison to data from the exposed participant,yielding 17 matched-control (mean age =33.24 years ± 4.41 SEM; median = 36 years;9 male, 8 female) comparisons. Control par-ticipants were considered representative ofthe general population not living near dry-cleaning facilities, for whom nationwide sur-veys indicated that mean perc exposureswere much lower than for populationsexposed through proximity to a dry-cleaningfacility (Table 2).
Day care investigation. A day care centerin Albany County, New York, was located ina one-story building separated by an interiorwall from an operating dry-cleaning facilitythat used a third-generation machine. A par-ent of a day care student contacted theNYSDOH and expressed concern aboutperc exposure. Air samples showed elevatedperc levels in the absence of a detectable percodor. Upon notification, the owner of thedry-cleaning facility ceased active dry clean-ing. All nine adult staff (mean age = 27.20years ± 3.03 SEM; median = 24.5 years; allfemale) of the day care center were invitedand agreed to participate in the study. Thenine control participants (mean age = 27.67
years ± 2.81 SEM; median = 25.3 years; allfemale) were age- and sex-matched acquain-tances of the exposed participants, local retailshop employees, NYSDOH employees, orstaff from other local day care centers with noknown perc exposure. Both the exposed andcontrol participants volunteered and signedinformed consent forms approved by theNYSDOH Institutional Review Board, indi-cating their willingness to undergo visual func-tion testing and complete a questionnaire.
Test administration. Residential study.A questionnaire on sociodemographics,lifestyle factors, medical history, and neuro-toxicant exposures was administered to theexposed and control study participants.Sociodemographic questions assessed age,sex, ethnicity, residence location, presence ofodors in residence, and hours spent in theresidence during each day of the week.Lifestyle factors assessed included personal orfamily member smoking, alcohol consump-tion, and exercise. The medical assessmentincluded a 74-item symptom checklist,questions on suspected or diagnosedocular/visual, auditory, respiratory, liver,kidney, diabetic, neurologic, or psychiatricconditions, current and past medicationusage, general physical condition, and bodysize. Potential neurotoxicant exposure wasassessed using job title, 22 specific occupa-tions and work environments, hobbies that
might involve solvent exposure, in-home useof solvent-containing products, in-home drycleaning, and pumping gas. The Profile ofMood States (POMS) questionnaire wasadministered to exposed participants toassess affective status on six scales: tension,depression, anxiety, vigor, fatigue, and con-fusion. The vision tests were administered toall participants by investigators who wereaware of the participants’ group assignments.
Day care investigation. The vision testsand questionnaire were administered to allexposed and control study participants about6 weeks after the dry-cleaning facility ceasedcleaning on site. The questionnaire wasaltered as needed to obtain data relevant towork in the day care center as opposed toresidence in an apartment. All data were col-lected by investigators who were aware of theparticipants’ group assignments.
Sample collection. Residential study.The dry-cleaning facilities were located onthe first floors of the apartment buildings.Both buildings were of high-rise steel andconcrete construction. The ventilation andphysical layout of hallways, windows, doors,and stairwells varied between buildings. Inbuilding A, two families lived on the secondfloor, one directly above the dry-cleaningfacility and the other on the opposite side ofthe building. Four families lived in buildingB; one on the third floor vertically in linewith the dry-cleaning facility, another on theopposite side of third floor, and one each onthe fourth and sixth floors vertically in linewith the dry-cleaning facility. Other apart-ments in the buildings were not sampled.
All exposed subjects were asked to pro-vide urine and exhaled breath samples.Exposed subjects over age 17 were also askedto provide blood samples. Breast milk sam-ples were requested from two participatingnursing mothers. All samples were analyzedfor perc, and urine samples were also ana-lyzed for metabolites of perc. Multipleindoor air samples were collected at eachstudy residence. Neither building had centralair conditioning. Some rooms containedwindow air conditioners, and the windowswere open in some other rooms. All exposedparticipants wore passive organic vapor sam-pling devices (carbon type adsorbent badges)for measuring personal exposure to perc.
Continuous indoor air and personal airsamples were collected using 3M brand(Minnesota Mining and Manufacturing Co.,Minneapolis, MN) passive organic vaporsampling devices (PSDs). Perc concentra-tions in indoor air were measured in roomswhere residents spent significant amounts oftime, such as the living room, bedroom, andkitchen. Participants wore PSDs on theirouter clothing, clipped to the front on ashirt, coat, jacket, or nightclothes to sample
Articles • Environmental perchloroethylene exposure and vision
Environmental Health Perspectives • VOLUME 110 | NUMBER 7 | July 2002 657
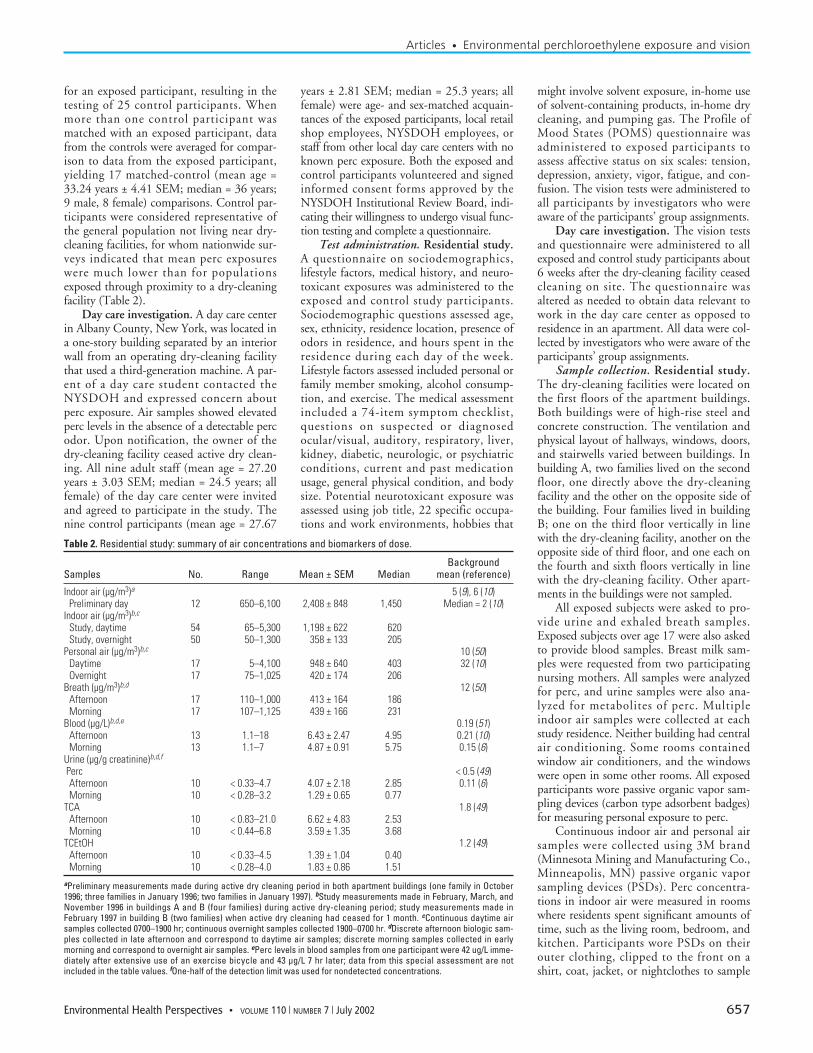
Table 2. Residential study: summary of air concentrations and biomarkers of dose.
BackgroundSamples No. Range Mean ± SEM Median mean (reference)
Indoor air (µg/m3)a 5 (9), 6 (10)Preliminary day 12 650–6,100 2,408 ± 848 1,450 Median = 2 (10)
Indoor air (µg/m3)b,c
Study, daytime 54 65–5,300 1,198 ± 622 620Study, overnight 50 50–1,300 358 ± 133 205
Personal air (µg/m3)b,c 10 (50)Daytime 17 5–4,100 948 ± 640 403 32 (10)Overnight 17 75–1,025 420 ± 174 206
Breath (µg/m3)b,d 12 (50)Afternoon 17 110–1,000 413 ± 164 186Morning 17 107–1,125 439 ± 166 231
Blood (µg/L)b,d,e 0.19 (51)Afternoon 13 1.1–18 6.43 ± 2.47 4.95 0.21 (10)Morning 13 1.1–7 4.87 ± 0.91 5.75 0.15 (6)
Urine (µg/g creatinine)b,d,f
Perc < 0.5 (49)Afternoon 10 < 0.33–4.7 4.07 ± 2.18 2.85 0.11 (6)Morning 10 < 0.28–3.2 1.29 ± 0.65 0.77
TCA 1.8 (49)Afternoon 10 < 0.83–21.0 6.62 ± 4.83 2.53Morning 10 < 0.44–6.8 3.59 ± 1.35 3.68
TCEtOH 1.2 (49)Afternoon 10 < 0.33–4.5 1.39 ± 1.04 0.40Morning 10 < 0.28–4.0 1.83 ± 0.86 1.51
aPreliminary measurements made during active dry cleaning period in both apartment buildings (one family in October1996; three families in January 1996; two families in January 1997). bStudy measurements made in February, March, andNovember 1996 in buildings A and B (four families) during active dry-cleaning period; study measurements made inFebruary 1997 in building B (two families) when active dry cleaning had ceased for 1 month. cContinuous daytime airsamples collected 0700–1900 hr; continuous overnight samples collected 1900–0700 hr. dDiscrete afternoon biologic sam-ples collected in late afternoon and correspond to daytime air samples; discrete morning samples collected in earlymorning and correspond to overnight air samples. ePerc levels in blood samples from one participant were 42 ug/L imme-diately after extensive use of an exercise bicycle and 43 µg/L 7 hr later; data from this special assessment are notincluded in the table values. fOne-half of the detection limit was used for nondetected concentrations.
perc near their breathing space. PSDs wereremoved from participants’ clothing at bed-time and placed near their pillows. PSDswere kept on a counter in the bathroomaway from direct water (humidity does notinterfere with PSDs) when participantsbathed or showered. Duplicate samples (twosamples collected simultaneously in the samelocation) were collected overnight (approxi-mately 12 hr), and again on the followingday (approximately 12 hr). An activity diarywas completed by each participant for 48 hrbefore and during PSD use to track theamount of time spent in the apartment andelsewhere. At the end of sampling periods,investigators sealed the PSD by affixing theimpermeable, hard plastic lid provided bythe manufacturer.
Participants forced air through taperedglass tubes equipped at both ends with stain-less-steel shut-off valves for alveolar breathcollection (52). Participants held their breathfor 10 sec before forceful exhalation, and thelast 40 mL of breath was captured for analy-sis. Blood samples were collected by a board-qualified phlebotomist according to astandard NYSDOH protocol (53), usingglass vials certified to be free of volatileorganic compounds. The vials had airtightcaps. Samples were collected in early morn-ing and late afternoon from participants ≥18 years of age. Breast milk samples werecollected in glass containers certified to befree of volatile organic compounds usingstandard procedures (54).
Urine samples were collected upon wak-ing (first void urine) by each exposed partic-ipant in containers certified to be free ofvolatile organic compounds, provided bythe investigators. Time of sample collectionwas noted by the participant on the con-tainer label and on a log sheet. All urinesamples were analyzed for perc, for the percmetabolites, trichloroacetic acid (TCA), andtrichloroethanol (TCEtOH), and for creati-nine, a normal component of urine. In addi-tion, the toxic end-urinary acetyl metabolitefrom the newly discovered mercapturic acidpathway (55–57) was assayed in urine sam-ples from four exposed participants.
Day care investigation. PSDs were usedto measure indoor air perc concentrations atthe day care center on one day in Augustwhile the dry cleaning facility was in opera-tion. Consultation between the facility oper-ator and NYSDOH personnel led to thecessation of active dry cleaning the day aftersample results were available, and the clean-ing equipment was subsequently removed.The questionnaire and vision data were col-lected 6 weeks after on-premises dry cleaningended. Personal air, breath, blood, and urinesamples were not collected in the day careinvestigation due to the 6-week time lag
between the closing of the dry cleaning facil-ity and issuance of approvals for the studyfrom appropriate boards. Perc eliminationhalf-lives range from about 12 to 40 hr invarious biologic tissues (58).
Sample analysis methods. The WadsworthCenter Laboratory for Organic AnalyticalChemistry performed the chemical analyses.The PSD analysis methods of Amin and col-leagues (59) were used for measurement ofperc in personal air, ambient air, and indoorair with a detection sensitivity of about 5µg/m3. Standards of perc in nitrogen wereused to calibrate the gas chromatograph/elec-tron capture (GC/EC) system response toperc. Breath samples were anlayzed by directinjection to a gas chromatograph equippedwith an election capture detector (60).Carbon dioxide levels in the breath sampleswere also measured using GC with a thermalconductivity detector.
The method of Ashley and colleagues(61) was adapted for the analysis of perc inblood using purge-and-trap gas chromatog-raphy/mass spectrometry (GC/MS). Resultsfrom split sample analyses performed by theCDC indicated good correspondencebetween laboratories. The detection limitwas 0.5 µg/L, with an average spike recoveryof 105%. Similar procedures were used tomeasure perc in breast milk.
Urine sample analyses used a purge-and-trap method with a Tekmar LSC-1(Tekmar-Dohrman, Mason, OH) unit fittedwith a #1 (tenax) trap configured to aHewlett-Packard 5890/5970 GC/MS. ARestek 105 meter Rtx 502.2 column (RestekCorp., Bellefonte, PA) was used to separatethe perc from other volatile components.Analyses of TCA and TCEtOH were per-formed using a modification of the U.S.EPA method 552 for haloacetic acids (62).These metabolites were measured by GC/ECafter methylation with diazomethane andmicro-extraction of the esters from the reac-tion mixture using methyl tertiary butylether (MTBE). The extract was then ana-lyzed using an HP 7673 liquid autosampler(Agilent Technologies, Wilmington, DE)configured to the same GC/EC systemdescribed above. Creatinine concentrationsin urine samples were determined by reactionwith alkaline picrate to produce a red color[Jaffe reaction (63)]. The spectrophotometrictest was performed using a Sigma DiagnosticsKit (Sigma, St. Louis, MO) and UV/visiblespectrophotometer (LKB Novaspec 4049;LKB Biochrome, Cambridge, England). Thedetection limit for perc, TCA, and TCEtOHwas 0.5 µg/L, with average spike recoveries of90, 95, and 115%, respectively.
Split urine samples from four exposedparticipants were analyzed for the mercapturicacid (glutathione conjugation) pathway perc
metabolite, N-acetyl-S-(1,2,2-trichlorovinyl)-L-cysteine (N-ac-TCVC), in the Universityof Wurzburg Institute of Toxicology,Wurzburg, Germany, using procedures pub-lished previously (64,65). A GC/MS capturemass spectometer with splitless injection (valvetime = 1.0 min) was used to measure N-ac-TCVC and the internal standard, d3-N-ac-TCVC. Characteristic fragments (m/z 178,m/z 180, m/z 181, and m/z 183) were moni-tored to quantitate the metabolite and standardusing methane chemical ionization and nega-tive ion detection procedures in the single ionmonitoring mode.
Visual function test methods. Three testsof visual function—near visual acuity, nearvisual contrast sensitivity, and color discrimi-nation—were administered in the study con-current with air sampling for perc. Thevision tests were administered separately toeach eye of each subject under standard con-ditions as described below. Test stimuli wereilluminated by a daylight flourescent lamp(correlated color temperature of approxi-mately 6,500°K; color rendering index > 90;intensity = 1,150 lux) which provided aluminance of approximately 70 foot-lam-bert. All subjects who normally used correc-tive lenses for near-point viewing wore themduring vision testing. A card holder placedjust under the cheek bones was used to posi-tion test cards at a constant distance fromthe eyes.
Visual acuity. To test visual acuity, weused the Rosenbaum Pocket Vision Screener(Grass Instrument Co., Quincy, MA). Thecard contained rows of numbers and figuresthat progressed from a larger angular sub-tense (size) at the top to a smaller angularsubtense at the bottom. The investigatorasked the subjects to read the numbers ineach row, progressing from top to bottom.The Snellen distance equivalent of the rowwith the smallest numbers that were all cor-rectly identified was recorded as the visualacuity score. An ideal score for near visualacuity was 20:20 vision, indicating that thesubject correctly identified numbers on thechart that were of an angular subtense thatwould yield a score of 20:20 on a far visualacuity test administered at a distance of 20feet. Higher scores (e.g., 20:40) indicatedworse performance (the angular subtense ofthe correctly identified stimuli correspondedin size to that which could be correctly iden-tified by a viewer with 20:20 far visual acuityat a distance of 40 feet).
Vision contrast sensitivity. To test visioncontrast sensitivity, we used the FunctionalAcuity Contrast Test, F.A.C.T. 101 (StereoOptical Co., Chicago, IL). The contrast sen-sitivity test measured the ability to distin-guish subtle differences in shades of gray.The test card contained a matrix (5 × 9) of
Articles • Schreiber et al.
658 VOLUME 110 | NUMBER 7 | July 2002 • Environmental Health Perspectives
circles filled with sinusoidal gratings (dark andlight bars). Spatial frequency [1.5, 3, 6, 12and 18 cycles per degree (cpd) of visual arc]increased from top to bottom, and contrastdecreased from left to right in steps of approx-imately 0.15 log units. The grating bars wereoriented either vertically or tilted 15 degreesto the left or right. As the investigator calledout each circle from left to right, row by row,subjects responded by saying either vertical,left, right, or blank. Participants were encour-aged to name an orientation if they had anyindication that the bars could be seen.Participants were asked to point in the direc-tion to which the top of the grating was tiltedif they had any difficulty in verbalizing theorientation. If orientation was misidentified,the subject was instructed to view each pre-ceding patch to the left until a correctresponse was again obtained. Testing thenproceeded to the right, and the last patchcorrectly identified was taken as the contrastsensitivity score for that spatial frequency.The procedure was repeated for each row indescending order. Scores were recorded on agraph showing the normative range (90%confidence interval).
Color discrimination test. To test color discrimination, we used Lanthony’sDesaturated 15 Hue Test according toFarnsworth-Munsell (D-15d) (LuneauOphthalmology, Paris, France). The colorvision test measures the ability to distin-guish differences in color tones (hues) andcan detect both congenital and acquired dis-crimination deficits (66). Subjects wereshown a rectangular box containing 16color chips arranged in chromatic order.The investigator removed 15 chips, leavingthe first as a standard, and randomized them in front of the subjects. Subjects wereinstructed to identify the chip which mostclosely matches the standard in hue, to placeit in the box next to the standard, and tocontinue the process until all chips were inthe box. Subjects were allowed to rearrangechips in the box at any time and to take aslong as needed to complete the test. Theorder of chip placement was recorded foruse in analyses.
Data analysis. SYSTAT for Windows,Version 5 computer software (SPSS, Inc.,Chicago, IL) was used to calculate means,medians, and ranges for all the environmen-tal and biologic data. Data from duplicatePSD samples were treated as separate resultsin the calculations. The results for bothPSDs in a duplicate sample were excludedfrom further analysis if their values differed≥ 20%. Eight of the 113 duplicate pairs(7%) of PSDs collected during the residen-tial study were excluded on this basis. Theeight pairs of PSDs that were excluded werenonsystematically distributed throughout
the range of perc concentrations. The indoorair study mean and medium perc concentra-tions in Table 2 were derived from meanvalues for each apartment. This approachprevented weighting the means with moresamples from one apartment than another.
For personal air and biologic media con-centrations, we calculated mean values foreach family to prevent weighting the overallstudy means with more samples from onefamily than another. First, the results for eachparticipant for a given medium were aver-aged. Then the individual means from allfamily members were averaged to produce afamily mean for that medium. The familymeans were used to calculate an overall studymean for each medium. Therefore, the studymeans in Table 2 represent the means of sixfamilies, whereas the range and median valueswere derived directly from individuals’ data.
The a priori criterion for the inclusion ofvision data in analyses was that the eye havea corrected visual acuity Snellen DistanceEquivalent score of 20:70 or better. Thisapproach avoided possible confounding ofthe color discrimination and VCS results byexcessive optical refraction error. In the resi-dential study, the data from one eye in eachof two exposed participants were excludedfrom analyses due to failure to meet this acu-ity criterion. No eyes failed to meet the crite-rion in the day care investigation. The unitof analysis for vision scores was the meanscore of the two eyes for each participant,except the two excluded eyes. In these cases,vision scores from the qualifying eyes of theparticipants were used in the analyses. Visualacuity was analyzed using two-tailedStudent’s t-tests with an α = 0.05 andmatched-pair techniques to determine if dif-ferences between exposed- and control-group scores were statistically significant.
The VCS data were analyzed with SASsoftware (version 6.0; SAS Institute, Cary,NC) using multivariate analyses of variance(MANOVA, with the Wilks’ lambda statis-tic) procedures suitable for repeated mea-sures and matched-pairs with an α = 0.05.The factors in the model were group, spatialfrequency, and their interaction term. MeanVCS scores for each eye of each exposed par-ticipant were compared to the percentileranking of control scores when significantgroup differences were observed.
Quantitative analyses of dyschromatop-sia used Bowman’s (66) method to describecolor-confusion space. A total color distancescore (TCDS) was calculated based on theorder of chip placement. We calculated acolor-confusion index (CCI), the ratio of theTCDS and the ideal score, for each partici-pant. Group differences in the CCI wereassessed using two-tailed Student’s t-tests (α= 0.05) for matched-pair analyses.
SYSTAT software was used to calculatePearson correlation coefficients to evaluatepossible associations between the environ-mental data and biologic and vision datafrom each exposed study participant.Multiple regression analyses, using the VCSscores at mid-spatial frequency (6 cpd) as thedependent variable and the independentvariables of years exposed in an apartment orthe day care center, percentage of time spentat the exposure site, and perc levels in indoorair, also assessed potential associations.
Results
Residential study. Questionnaires. Analysesof the questionnaire data indicated that theexposed and control groups did not differ sig-nificantly in age or sex, and that none of theparticipants had occupational or avocationalexposure to perc. Low to moderate alcoholconsumption, defined as consumption ofstandard serving sizes of beer, wine and/orliquor < 10/week, was reported by 61% ofthe exposed and 52% of the control, adultstudy participants. Alcohol consumption wasreported to be ≥ 10 per week by one partici-pant in each group. The other participantsdid not drink alcoholic beverages. Theexposed participants had no known expo-sures to other neurotoxicants, ongoing illness,current use of neuroactive drugs, or a medicalhistory indicative of neurologic dysfunction.The POMS test scores of all exposed partici-pants were within normal limits; no cases ofclinical depression or other neuropsychiatricconditions were observed.
Exposure. The 17 exposed participantsresided in their apartments for an average of5.75 years ± 0.82 SEM, with a median dura-tion of 6 years while the dry-cleaning facili-ties were in operation. The group spent amean of approximately 76% of their time inthe apartments. Preliminary apartmentindoor air measurements were made duringperiods of active dry cleaning in both build-ings (Table 2). Subsequent air and biologicsamples were collected before or about 1month after the facility operators wereordered to cease operation because of publichealth concern (Table 2). In the two apart-ments in building B (7 of 17 participants)where study samples were collected postop-eration, indoor air perc levels decreased by amean of 81% between the preliminary andpostoperation measurement periods.
Airborne perc levels in apartment roomswere elevated far above background levels inboth buildings during preliminary and study(daytime median = 620 µg/m3) measure-ment periods (Table 2). Nearly all of the airsamples exceeded the NYSDOH air guide-line of 100 µg perc/m3 (11). Only nightsamples from one apartment, collected afterthe dry-cleaning facility ceased operation for
Articles • Environmental perchloroethylene exposure and vision
Environmental Health Perspectives • VOLUME 110 | NUMBER 7 | July 2002 659
the day, showed a mean perc level below 100µg/m3. Measurements made 1 month afterthe both facilities permanently ceased oper-ating dry cleaning machines showed thatperc levels in indoor air in both buildingshad declined substantially but were still ele-vated up to eight times above guideline levels(10–800 µg/m3).
Perc in personal air followed the sametrend toward elevation as perc in room air(Table 2). Only one of 34 mean perc levelsin personal air was below the U.S. mean per-sonal air level of 10 µg/m3 (50). The per-sonal air samples correlated highly with theroom air samples. The overnight samples (r= 0.99) were more highly correlated thandaytime samples (r = 0.91), possibly becausesubjects spent more time in their apartmentsduring the overnight sampling periods.
Levels of perc in breath samples (Table2) were much higher than the mean perclevel in breath (12 µg/m3) reported by theU.S. EPA (50). Perc levels in breath werehighly correlated with perc levels in room air(overnight r = 0.91; daytime r = 0.78) andpersonal air (overnight r = 0.93; daytime r =0.86), indicating breath is a good biomarkerfor recent exposure to perc.
Blood samples collected from the 13adult participants contained perc at levelsmuch higher (Table 2) than the mean (0.19µg/L) and 95th percentile values (0.62 µg/L)from a U.S. survey (51). Follow-up samplescollected 1 month after dry cleaning opera-tions ceased showed perc levels in blood inbuilding B residents (mean <0.5 µg/L)decreased to background levels, butremained elevated in building A residents(mean = 6.9 µg/L), as did air levels. Perc lev-els in blood correlated well with perc levelsin room air (overnight r = 0.85; daytime r =0.93), personal air (overnight r = 0.91; day-time r = 0.99), and breath (overnight r =0.88; daytime r = 0.99), indicating thatblood is a good biomarker for recent expo-sure to perc.
Group-mean perc levels in urine weremore than an order of magnitude higherthan published background values (Table 2).The correlation of perc levels in urine,breath, and blood were low because of fail-ure to detect perc in some urine samples,indicating that perc in urine may not be assensitive an indicator as breath or blood forassessing recent exposure. However, 1month follow-up samples found that percconcentrations decreased to < 0.53–< 2.5µg/g creatinine in all urine samples. Theperc levels in urine from building A studyparticipants did not remain elevated for aslong as perc levels in air, breath, and blood.
Background values for urinary percmetabolite levels in the general populationwere unavailable. For comparison to
metabolite levels seen in the exposed studyparticipants, Table 2 shows levels observedin 21 nonexposed control children from theNYSDOH/U.S. CDC investigation of theday care students (49). Group-mean levels of urinary TCA and TCEtOH from theexposed participants ranged from below toabout twice as high as the levels observed inthe control children. The metabolite fromthe recently identified glutathione conjuga-tion pathway, N-ac-TCVC, was identified inurine samples from three of four exposedparticipants.
Two exposed participants were breast-feeding mothers who provided breast milksamples for analysis. The first participanthad been lactating for about 6 weeks whenthe first late day and early morning sampleswere collected, and for about 23 weeks whensampling was repeated. All samples were col-lected while the facility was operating drycleaning machines and mean airborne perclevels ranged from 60 to 2,800 µg/m3 in theapartment. Her mean concentrations of percin breast milk ranged from 13 to 75 µg/Land were elevated compared to the meanbackground level of perc in breast milk of6.2 µgL (54). The second participant wasexposed to perc in her home throughout herpregnancy and provided breast milk samplesbeginning several days postpartum. Thesesamples were collected 1 and 4 months afteractive dry cleaning ceased. One month afterdry cleaning ceased, mean breast milk percconcentration was 31 µg/L and mean air-borne perc concentration was 575 µg/m3.Three months later, mean perc concentra-tion in breast milk was 2.2 µg/L and meanairborne perc concentration was 65 µg/m3.For both participants, lipid content couldnot be determined because of small samplevolume, and no perc metabolites weredetected (<0.5 µg/L).
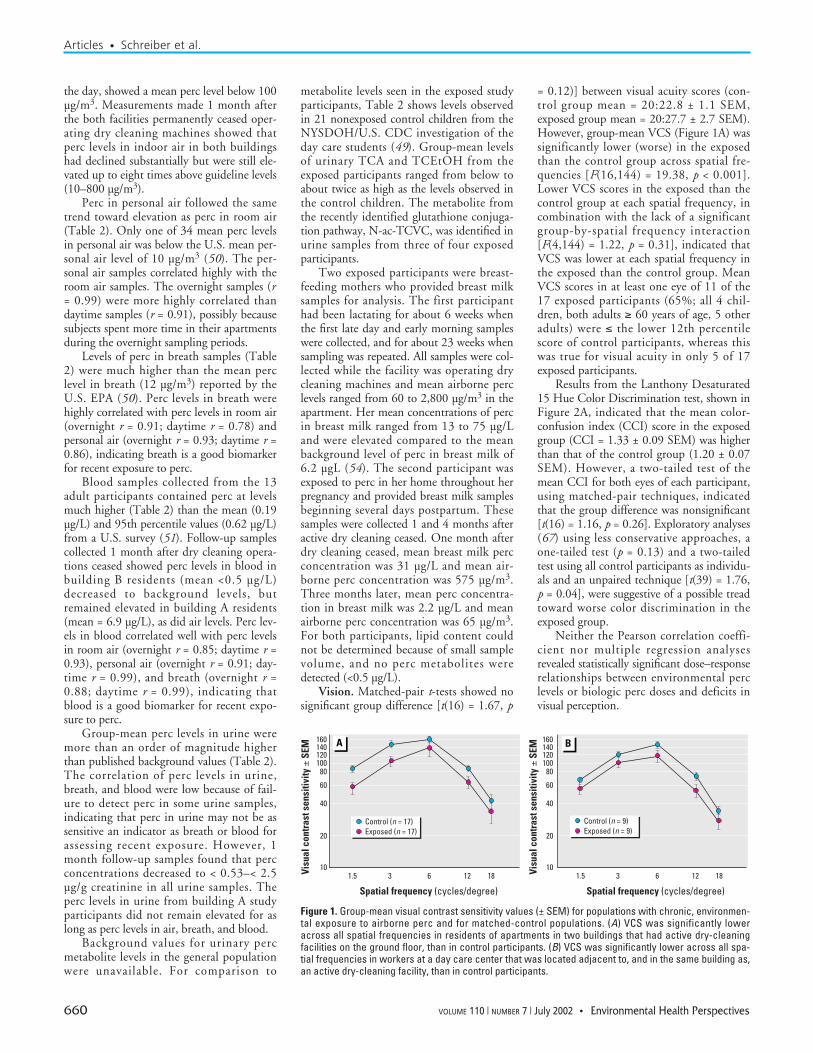
Vision. Matched-pair t-tests showed nosignificant group difference [t(16) = 1.67, p
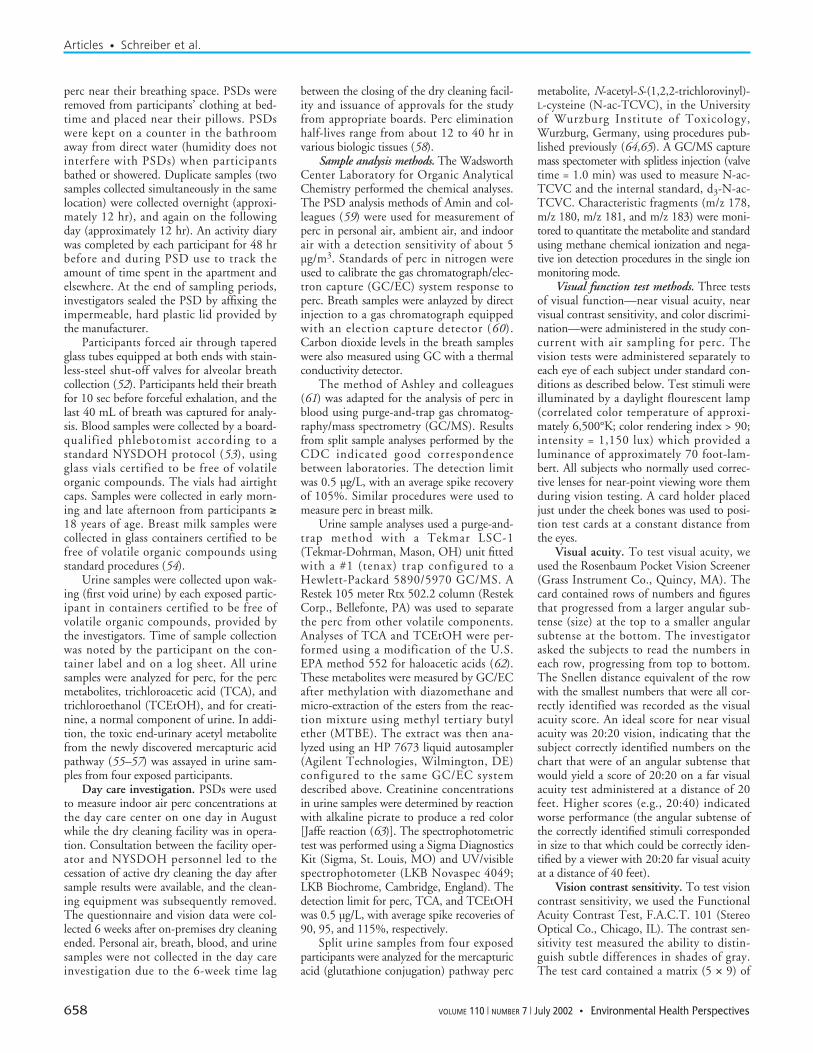
= 0.12)] between visual acuity scores (con-trol group mean = 20:22.8 ± 1.1 SEM,exposed group mean = 20:27.7 ± 2.7 SEM).However, group-mean VCS (Figure 1A) wassignificantly lower (worse) in the exposedthan the control group across spatial fre-quencies [F(16,144) = 19.38, p < 0.001].Lower VCS scores in the exposed than thecontrol group at each spatial frequency, incombination with the lack of a significantgroup-by-spatial frequency interaction[F(4,144) = 1.22, p = 0.31], indicated thatVCS was lower at each spatial frequency inthe exposed than the control group. MeanVCS scores in at least one eye of 11 of the17 exposed participants (65%; all 4 chil-dren, both adults ≥ 60 years of age, 5 otheradults) were ≤ the lower 12th percentilescore of control participants, whereas thiswas true for visual acuity in only 5 of 17exposed participants.
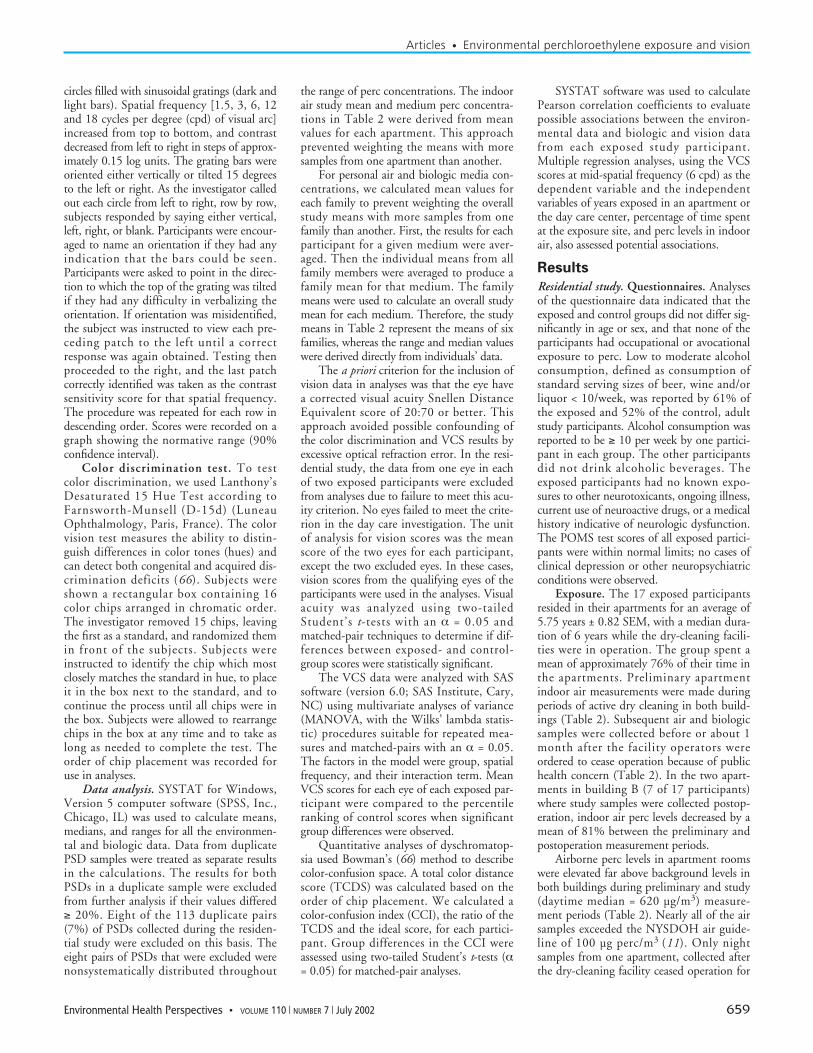
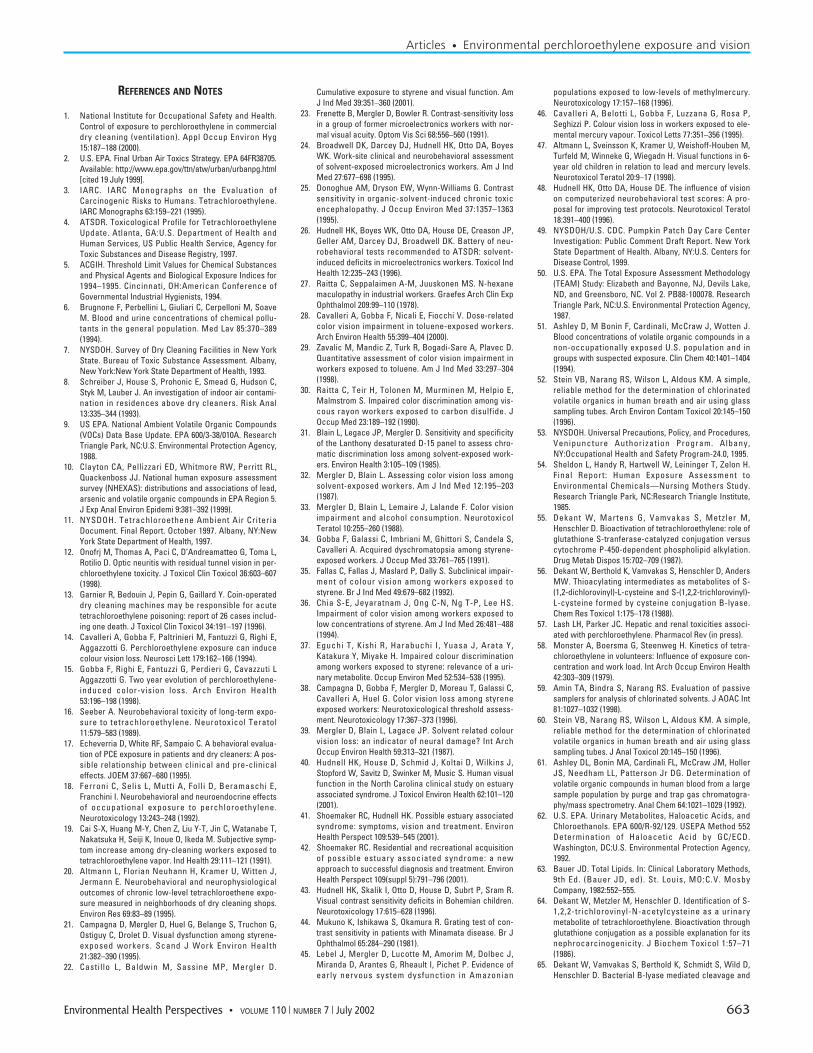
Results from the Lanthony Desaturated15 Hue Color Discrimination test, shown inFigure 2A, indicated that the mean color-confusion index (CCI) score in the exposedgroup (CCI = 1.33 ± 0.09 SEM) was higherthan that of the control group (1.20 ± 0.07SEM). However, a two-tailed test of themean CCI for both eyes of each participant,using matched-pair techniques, indicatedthat the group difference was nonsignificant[t(16) = 1.16, p = 0.26]. Exploratory analyses(67) using less conservative approaches, aone-tailed test (p = 0.13) and a two-tailedtest using all control participants as individu-als and an unpaired technique [t(39) = 1.76,p = 0.04], were suggestive of a possible treadtoward worse color discrimination in theexposed group.
Neither the Pearson correlation coeffi-cient nor multiple regression analysesrevealed statistically significant dose–responserelationships between environmental perclevels or biologic perc doses and deficits invisual perception.
Articles • Schreiber et al.
660 VOLUME 110 | NUMBER 7 | July 2002 • Environmental Health Perspectives
Figure 1. Group-mean visual contrast sensitivity values (± SEM) for populations with chronic, environmen-tal exposure to airborne perc and for matched-control populations. (A) VCS was significantly loweracross all spatial frequencies in residents of apartments in two buildings that had active dry-cleaningfacilities on the ground floor, than in control participants. (B) VCS was significantly lower across all spa-tial frequencies in workers at a day care center that was located adjacent to, and in the same building as,an active dry-cleaning facility, than in control participants.
160
Visu
al c
ontr
ast s
ensi
tivity
± S
EM
A B
Spatial frequency (cycles/degree)
1.5 3 6 12 18
Spatial frequency (cycles/degree)
1.5 3 6 12 18
140120100
80
60
40
20
10
160140120100
80
60
40
20
10Visu
al c
ontr
ast s
ensi
tivity
± S
EM
Control (n = 17)Exposed (n = 17)
Control (n = 9)Exposed (n = 9)

Day care investigation. Questionnaires.Analyses of the questionnaire data indicatedthat the exposed and control groups did notdiffer significantly in age, and none of theparticipants had direct occupational or avoca-tional exposure to perc. Alcohol consump-tion was low or moderate in all participants.Neither the exposed nor control participantshad known exposures to other neurotoxi-cants, ongoing illness, current use of neuroac-tive drugs, or a medical history indicative ofneurologic dysfunction.
Exposure. The nine female staff mem-bers had worked at the day care center for amean = 8,248 hr, a median = 3,735 hr, anda range = 475–30,084 hr. The mean numberof hours spent at work was equivalent to amean of approximately 4 years during whichtime the staff spent approximately 23% oftheir time in the center. The director of theday care was considerably older than theother workers and had worked considerablylonger at the center than the other staffmembers.
Airborne perc concentrations were mea-sured twice on one day in each of the threerooms of the day care center, the main,infant, and toddler rooms, and ranged from1,800 to 2,400 µg/m3, with a mean = 2,150± 84.7 SEM and median = 2,150 µg/m3
during active dry cleaning. Perc concentra-tions in two samples from outside the build-ing under the soffits were 180 and 200µg/m3. Six weeks after the facility operatorceased using and removed the dry cleaningmachines, levels of airborne perc in the daycare center ranged from 8 to 55 µg/m3.
Vision. Matched-pair t-tests showed nosignificant group difference [t(8) = 1.56, p =0.16) between visual acuity scores (controlgroup mean = 20:26.4 ± 2.4 SEM, exposedgroup mean = 20:22.2 ± 0.8 SEM). However,group-mean VCS (Figure 1B) was signifi-cantly lower in the exposed than the in con-trol group across spatial frequencies [F(8,72)= 21.01, p < 0.001]. Lower VCS scores in the
exposed than the control group at each spa-tial frequency, in combination with the lackof a significant group-by-spatial frequencyinteraction [F(4,72) = 1.01, p = 0.41], indi-cated that VCS was significantly lower ateach spatial frequency in the exposed thanthe control group. Among the nine partici-pants in the exposed group, VCS scores werelower than the control group mean for 7 of 9at the lowest spatial frequency of 1.5 cpd, for9 of 9 at 3 cpd, 6 of 9 at 6 cpd, 6 of 9 at 12cpd, and 6 of 9 at 18 cpd.
Mean CCI scores (Figure 2B) did notdiffer significantly [t(8) = 0.91, p = 0.39]between the exposed (CCI = 1.22 ± 0.07SEM) and control (CCI = 1.18 ± 0.08 SEM)groups.
Discussion
The residential study and the day care inves-tigation both indicated that operating dry-cleaning facilities generated perc emissions toair that spread throughout the buildings inwhich they were contained. Although thedry-cleaning facilities did not operate atnight, indoor and personal air levelsremained well above background values(Table 2) over night. The dry-cleaningmachines and dry-cleaned fabrics in thefacilities likely continued to emit some percto air at night (68). Furthermore, materialsin apartments may have acted as sinks,absorbing perc when air concentrations werehigher in the daytime and as emissionsources via desorption when air concentra-tions were lower at night (69). The elevatedperc levels in apartment air were stronglyassociated with elevated levels in residents’personal air, breath and blood. Perc levels inbreast milk from two nursing mothers notonly exceeded background values, but werefar above the U.S. EPA maximum contami-nant level (MCL) for perc in drinking waterof 5 µg/L (70). Urinary perc levels were wellabove background values in the residents butcorrelated weakly with airborne levels. Perc
metabolite levels in urine only slightlyexceeded background values in the exposedstudy participants and did not change sub-stantially in follow-up testing, even thoughroom air levels decreased after dry cleaningceased. Although the number of samples issmall and the metabolite background valueswere from the NYSDOH/U.S. CDC studycontrol children (49), urinary perc andmetabolite measures may not be as sensitiveor as reliable indicators as breath or bloodfor assessing recent perc exposure.
Measurements of VCS indicated thatchronic, environmental perc exposure mayadversely affect neurobehavioral function.VCS was significantly lower in the exposedgroups than matched-control groups in boththe residential study and day care investiga-tion. The VCS deficits were likely of neuro-logic origin because the exposed and controlgroups did not differ in visual acuity, indi-cating that the groups did not different inoptical refraction or in the ability to focusimages on the retina (40,48). The VCSdeficits spanned the spatial frequency spec-trum in both exposed groups, similar to theVCS deficit profiles seen in other solventexposed populations (21–26) and in contrastto the VCS spatial-frequency profilesobserved in populations exposed to methylmercury (44,45) and inorganic mercury(46,47). Differences between the shapes ofaltered VCS spatial-frequency profiles canindicate differential effects of various toxicexposures (40–48).
VCS deficits are clearly nonspecific indi-cators of alterations in neurobehavioral func-tion, having been observed in a number ofclinical conditions. A variety of alterations inthe VCS spatial-frequency profile have beenobserved in ocular diseases such as glaucoma,which manifests a low spatial-frequencydeficit (70–72), macular disease (73,74),retinitis pigmentosa (75–78), type 1 diabetesbefore observable retinopathy (79–81), andother distal visual conditions (82,83). Withdamage more proximal to the visual cortex,VCS deficits have been observed in cases ofoptic nerve neuropathy (84), optic nervecompression (85), and cerebral lesions (86).Patients that have recovered from optic neu-ritis with normal visual acuity retain severedeficits in VCS (87). Neurodegenerative dis-eases that are not well known for their effectson vision also manifested VCS deficits.Multiple sclerosis patients displayed VCSdeficits that were orientation specific, sug-gesting cortical rather than retinal or opticnerve damage (88,89). A primarily low spa-tial-frequency VCS deficit was present inParkinson (83) and Alzheimer (90–93)patients, the latter of whom showed anextent of cognitive impairment predicted byVCS scores (93). AIDS patients displayed
Articles • Environmental perchloroethylene exposure and vision
Environmental Health Perspectives • VOLUME 110 | NUMBER 7 | July 2002 661
Figure 2. Group-mean color-confusion index values (CCI; ± SEM) for populations with chronic, environ-mental exposure to airborne perc, and for matched-control populations. (A) Apartments in two buildingsthat had active dry-cleaning facilities on the ground floor; CCI scores in residents were nonsignificantlyhigher than control scores. (B) A day care center located adjacent to and in the same building as anactive dry-cleaning facility; there was no significance difference between CCI scores in control partici-pants and workers.
1.50
1.25
1.00
Colo
r con
fusi
on in
dex
± SE
M A B
Exposed ExposedControl Control
1.50
1.25
1.00
Colo
r con
fusi
on in
dex
± SE
M

marked color vision and VCS deficiencies(94), and cystic fibrosis patients showed aVCS deficit across spatial frequencies (95)that was thought to be a primary manifesta-tion of disease in patients taking vitamin Asupplements (96). Micronutrient deficien-cies, including the vitamin B complex, wereassociated with reversible VCS deficits, asseen in the “Cuban epidemic optic neuropa-thy” cases of the early 1990s (97,98). Theseobservations suggest that VCS is a sensitiveindicator of CNS susceptibilities to chemicaland physiologic abnormalities.
Color discrimination ability has beenamong the most sensitive indicators of sol-vent-induced neurotoxicity to date (99).Results, also obtained using the LanthonyDesaturated 15 Hue Color DiscriminationTest, from studies of dry-cleaning workersexposed for longer durations to much higherconcentrations of airborne perc have indi-cated exposure-induced deficits (Table 1).No significant group differences in color dis-crimination were observed in the currentstudies. The possible trend toward worsecolor discrimination seen in the residentialstudy, but not in the day care investigation,may have been caused by chance or a higherlifetime perc exposure (based on study meanperc concentration; Table 2) in the residen-tial study (3,400 µg/m3 years) than in theday care investigation (1,978 µg/m3 years).In either case, the current results suggestedthat VCS may surpass color discriminationin sensitivity, perhaps caused by higher vari-ability in color discrimination scores fromcontrol populations (99) than in VCS scores(40,42–48).
Although the similar VCS deficits inboth the residential study and day care inves-tigation were apparently associated withchronic low-level environmental perc expo-sures, methodologic limitations preclude adefinitive attribution of causation. The limi-tations included: a) the relatively small num-bers of participants may have resulted ingroup differences due to chance; b) a geo-graphic mismatch in residence city betweenthe residential study exposed and controlcohorts; c) possible unidentified group dif-ferences in socioeconomic factors, althoughno such influences on VCS have beenreported; and d) possible unidentified groupdifferences in medical conditions, alcoholconsumption, medication, or illicit drug useand exposure to other neurotoxicants,although the self-reported questionnaire dataindicated no such differences.
In addition, dose–response relationshipswere not observed. This may be attributableto a lack of such relationships, a relativelysmall perc exposure range, small sample sizes,or changes in exposure levels before dose andVCS were measured. Measurements of
airborne perc levels in the residential studydid not definitively establish the concentra-tion that may have caused the VCS deficits.Preliminary daytime indoor-air perc levels inthe study apartments were about twice as highas those measured during the study (Table 2).This difference may have resulted from a)improvements in perc containment requiredby regulatory authorities during the interven-ing period; and b) study measurements in twoof the six study apartments being obtainedabout 1 month after on-site cleaning ceased.The study mean indoor air perc concentra-tion, therefore, may underestimate the levelassociated with the VCS deficit.
It is also possible that the VCS deficits, ifattributable to perc, were caused by repeatedhigher-level perc exposures, rather than bychronic lower-level exposures. Some partici-pants reported previous occasional detec-tions of an odor that, if attributable to perc,would likely indicate higher airborne con-centrations. A reliable and detailed report onperc odor threshold measurements obtainedusing natural breathing conditions has notbeen published in peer-reviewed literature.One source, however, indicates that the percodor threshold may be between 8,160 and12,240 µg/m3 (100), above the highest con-centration observed in the residential studypreliminary measurements. The hypothesisof persistent neurobehavioral deficits fromrepeated higher-level exposures to airbornetrichloroethylene (101,102), styrene (103),and mineral spirits (104), however, has notbeen supported by rodent studies. Theseresults suggest that the VCS deficit was morelikely associated with cumulative perc expo-sure than short-term peak exposure levels.
If the residential study and day careinvestigation group differences in VCS werecaused by chronic perc exposure, the meanindoor air perc levels associated with adversehealth effects are much lower than those inoccupational study reports and lower thanthose observed by Altmann and colleagues(20) in the only previous environmentalexposure study (Table 1). High levels of air-borne perc in occupational exposure studies(280,060–83,080 µg/m3) have been associ-ated with increased neurologic symptoms(19) and deficits on cognitive and motor-speed tasks (16–18) that depend heavily onvisual system function (48). Deficits in colordiscrimination have been reported at lower-level (41,741–29,245 µg/m3) occupationalexposures (14,15). Altmann and colleagues(20) reported deficits in visual memory, sim-ple visual reaction times and complex visualreaction times in residents near dry-cleaningfacilities where mean indoor air perc concen-tration was 4,980 µg/m3 (median = 1,360µg/m3). A deficit in VCS was observed inthe residential study when preliminary
daytime mean airborne perc concentrationwas 2,408 µg/m3 (median = 1,450 µg/m3)and the mean measured during the studywas 778 µg/m3 (mean of daytime andovernight values in Table 2; median = 350µg/m3). A similar VCS deficit was observedin the day care investigation where workerswere exposed to a daytime mean of 2,150µg/m3 perc in air. The VCS deficit in the daycare investigation was measured about 6 weeksafter on-premises cleaning ceased, suggestingthat the effect is persistent or permanent, asreported in previous solvent exposure studies(23–26). Taken together, these data suggestthat the lowest observable adverse effect level(LOAEL) for airborne perc exposure may liewithin the range of indoor air perc concentra-tions bracketed by the Altmann and colleague(20) study (mean = 4,980 µg/m3; median =1,360 µg/m3) and the residential study (mean= 778 µg/m3; median = 350 µg/m3). Theseconcentrations are surprisingly low in thatthey are less than 3 orders of magnitude abovebackground or ambient indoor air perc levels(5–6 µg/m3) and the NYSDOH air qualityguideline (100 µg/m3). Neither our data northose collected by Altmann and colleagues(20) were sufficient to identify a no-observableadverse effect level (NOAEL).
Replication of the current results andextension with emphasis on susceptible pop-ulations is needed. Interindividual differ-ences in susceptibility were indicated by theobservation that not all exposed participantsscored below control values on the visualfunction tests. For example, the exercisingparticipant noted in Table 2 was a youngeradult who had excellent VCS and color dis-crimination. On the other hand, both partic-ipants > 60 years in age and all five childrenin the residential study had VCS scores ≤ the12th percentile of the control populationand showed deficiencies in color discrimina-tion (data not shown). Susceptibility factorsmay include age and interindividual differ-ences in perc absorption rates, metabolism,and elimination rates, as well as molecularmechanisms involved in damage, repair, andcompensatory processes.
These results suggest that chronic expo-sure to perc in buildings with operating dry-cleaning facilities may be an importantpublic health concern. Although the VCSdeficits are subclinical in that alone they arenot diagnostic of illness and are not knownto indicate a progressive disease process,they do represent a long-lasting, adversealteration in neurobehavioral function.Further research is needed to determinewhether VCS deficits induced by perc orother volatile organic compound exposuresare risk factors for the development of clini-cal conditions such as age-related maculardegeneration.
Articles • Schreiber et al.
662 VOLUME 110 | NUMBER 7 | July 2002 • Environmental Health Perspectives
REFERENCES AND NOTES
1. National Institute for Occupational Safety and Health.Control of exposure to perchloroethylene in commercialdry cleaning (ventilation). Appl Occup Environ Hyg15:187–188 (2000).
2. U.S. EPA. Final Urban Air Toxics Strategy. EPA 64FR38705.Available: http://www.epa.gov/ttn/atw/urban/urbanpg.html[cited 19 July 1999].
3. IARC. IARC Monographs on the Evaluation ofCarcinogenic Risks to Humans. Tetrachloroethylene.IARC Monographs 63:159–221 (1995).
4. ATSDR. Toxicological Profile for TetrachloroethyleneUpdate. Atlanta, GA:U.S. Department of Health andHuman Services, US Public Health Service, Agency forToxic Substances and Disease Registry, 1997.
5. ACGIH. Threshold Limit Values for Chemical Substancesand Physical Agents and Biological Exposure Indices for1994–1995. Cincinnati, OH:American Conference ofGovernmental Industrial Hygienists, 1994.
6. Brugnone F, Perbellini L, Giuliari C, Cerpelloni M, SoaveM. Blood and urine concentrations of chemical pollu-tants in the general population. Med Lav 85:370–389(1994).
7. NYSDOH. Survey of Dry Cleaning Facilities in New YorkState. Bureau of Toxic Substance Assessment. Albany,New York:New York State Department of Health, 1993.
8. Schreiber J, House S, Prohonic E, Smead G, Hudson C,Styk M, Lauber J. An investigation of indoor air contami-nation in residences above dry cleaners. Risk Anal13:335–344 (1993).
9. US EPA. National Ambient Volatile Organic Compounds(VOCs) Data Base Update. EPA 600/3-38/010A. ResearchTriangle Park, NC:U.S. Environmental Protection Agency,1988.
10. Clayton CA, Pellizzari ED, Whitmore RW, Perritt RL,Quackenboss JJ. National human exposure assessmentsurvey (NHEXAS): distributions and associations of lead,arsenic and volatile organic compounds in EPA Region 5.J Exp Anal Environ Epidemi 9:381–392 (1999).
11. NYSDOH. Tetrachloroethene Ambient Air CriteriaDocument. Final Report. October 1997. Albany, NY:NewYork State Department of Health, 1997.
12. Onofrj M, Thomas A, Paci C, D’Andreamatteo G, Toma L,Rotilio D. Optic neuritis with residual tunnel vision in per-chloroethylene toxicity. J Toxicol Clin Toxicol 36:603–607(1998).
13. Garnier R, Bedouin J, Pepin G, Gaillard Y. Coin-operateddry cleaning machines may be responsible for acutetetrachloroethylene poisoning: report of 26 cases includ-ing one death. J Toxicol Clin Toxicol 34:191–197 (1996).
14. Cavalleri A, Gobba F, Paltrinieri M, Fantuzzi G, Righi E,Aggazzotti G. Perchloroethylene exposure can inducecolour vision loss. Neurosci Lett 179:162–166 (1994).
15. Gobba F, Righi E, Fantuzzi G, Perdieri G, Cavazzuti LAggazzotti G. Two year evolution of perchloroethylene-induced color-vision loss. Arch Environ Health53:196–198 (1998).
16. Seeber A. Neurobehavioral toxicity of long-term expo-sure to tetrachloroethylene. Neurotoxicol Teratol11:579–583 (1989).
17. Echeverria D, White RF, Sampaio C. A behavioral evalua-tion of PCE exposure in patients and dry cleaners: A pos-sible relationship between clinical and pre-clinicaleffects. JOEM 37:667–680 (1995).
18. Ferroni C, Selis L, Mutti A, Folli D, Beramaschi E,Franchini I. Neurobehavioral and neuroendocrine effectsof occupational exposure to perchloroethylene.Neurotoxicology 13:243–248 (1992).
19. Cai S-X, Huang M-Y, Chen Z, Liu Y-T, Jin C, Watanabe T,Nakatsuka H, Seiji K, Inoue O, Ikeda M. Subjective symp-tom increase among dry-cleaning workers exposed totetrachloroethylene vapor. Ind Health 29:111–121 (1991).
20. Altmann L, Florian Neuhann H, Kramer U, Witten J,Jermann E. Neurobehavioral and neurophysiologicaloutcomes of chronic low-level tetrachloroethene expo-sure measured in neighborhoods of dry cleaning shops.Environ Res 69:83–89 (1995).
21. Campagna D, Mergler D, Huel G, Belange S, Truchon G,Ostiguy C, Drolet D. Visual dysfunction among styrene-exposed workers. Scand J Work Environ Health21:382–390 (1995).
22. Castil lo L, Baldwin M, Sassine MP, Mergler D.
Cumulative exposure to styrene and visual function. AmJ Ind Med 39:351–360 (2001).
23. Frenette B, Mergler D, Bowler R. Contrast-sensitivity lossin a group of former microelectronics workers with nor-mal visual acuity. Optom Vis Sci 68:556–560 (1991).
24. Broadwell DK, Darcey DJ, Hudnell HK, Otto DA, BoyesWK. Work-site clinical and neurobehavioral assessmentof solvent-exposed microelectronics workers. Am J IndMed 27:677–698 (1995).
25. Donoghue AM, Dryson EW, Wynn-Williams G. Contrastsensitivity in organic-solvent-induced chronic toxicencephalopathy. J Occup Environ Med 37:1357–1363(1995).
26. Hudnell HK, Boyes WK, Otto DA, House DE, Creason JP,Geller AM, Darcey DJ, Broadwell DK. Battery of neu-robehavioral tests recommended to ATSDR: solvent-induced deficits in microelectronics workers. Toxicol IndHealth 12:235–243 (1996).
27. Raitta C, Seppalaimen A-M, Juuskonen MS. N-hexanemaculopathy in industrial workers. Graefes Arch Clin ExpOphthalmol 209:99–110 (1978).
28. Cavalleri A, Gobba F, Nicali E, Fiocchi V. Dose-relatedcolor vision impairment in toluene-exposed workers.Arch Environ Health 55:399–404 (2000).
29. Zavalic M, Mandic Z, Turk R, Bogadi-Sare A, Plavec D.Quantitative assessment of color vision impairment inworkers exposed to toluene. Am J Ind Med 33:297–304(1998).
30. Raitta C, Teir H, Tolonen M, Murminen M, Helpio E,Malmstrom S. Impaired color discrimination among vis-cous rayon workers exposed to carbon disulfide. JOccup Med 23:189–192 (1990).
31. Blain L, Legace JP, Mergler D. Sensitivity and specificityof the Lanthony desaturated D-15 panel to assess chro-matic discrimination loss among solvent-exposed work-ers. Environ Health 3:105–109 (1985).
32. Mergler D, Blain L. Assessing color vision loss amongsolvent-exposed workers. Am J Ind Med 12:195–203(1987).
33. Mergler D, Blain L, Lemaire J, Lalande F. Color visionimpairment and alcohol consumption. NeurotoxicolTeratol 10:255–260 (1988).
34. Gobba F, Galassi C, Imbriani M, Ghittori S, Candela S,Cavalleri A. Acquired dyschromatopsia among styrene-exposed workers. J Occup Med 33:761–765 (1991).
35. Fallas C, Fallas J, Maslard P, Dally S. Subclinical impair-ment of colour vision among workers exposed tostyrene. Br J Ind Med 49:679–682 (1992).
36. Chia S-E, Jeyaratnam J, Ong C-N, Ng T-P, Lee HS.Impairment of color vision among workers exposed tolow concentrations of styrene. Am J Ind Med 26:481–488(1994).
37. Eguchi T, Kishi R, Harabuchi I, Yuasa J, Arata Y,Katakura Y, Miyake H. Impaired colour discriminationamong workers exposed to styrene: relevance of a uri-nary metabolite. Occup Environ Med 52:534–538 (1995).
38. Campagna D, Gobba F, Mergler D, Moreau T, Galassi C,Cavalleri A, Huel G. Color vision loss among styreneexposed workers: Neurotoxicological threshold assess-ment. Neurotoxicology 17:367–373 (1996).
39. Mergler D, Blain L, Lagace JP. Solvent related colourvision loss: an indicator of neural damage? Int ArchOccup Environ Health 59:313–321 (1987).
40. Hudnell HK, House D, Schmid J, Koltai D, Wilkins J,Stopford W, Savitz D, Swinker M, Music S. Human visualfunction in the North Carolina clinical study on estuaryassociated syndrome. J Toxicol Environ Health 62:101–120(2001).
41. Shoemaker RC, Hudnell HK. Possible estuary associatedsyndrome: symptoms, vision and treatment. EnvironHealth Perspect 109:539–545 (2001).
42. Shoemaker RC. Residential and recreational acquisitionof possible estuary associated syndrome: a newapproach to successful diagnosis and treatment. EnvironHealth Perspect 109(suppl 5):791–796 (2001).
43. Hudnell HK, Skalik I, Otto D, House D, Subrt P, Sram R.Visual contrast sensitivity deficits in Bohemian children.Neurotoxicology 17:615–628 (1996).
44. Mukuno K, Ishikawa S, Okamura R. Grating test of con-trast sensitivity in patients with Minamata disease. Br JOphthalmol 65:284–290 (1981).
45. Lebel J, Mergler D, Lucotte M, Amorim M, Dolbec J,Miranda D, Arantes G, Rheault I, Pichet P. Evidence ofearly nervous system dysfunction in Amazonian
populations exposed to low-levels of methylmercury.Neurotoxicology 17:157–168 (1996).
46. Cavalleri A, Belotti L, Gobba F, Luzzana G, Rosa P,Seghizzi P. Colour vision loss in workers exposed to ele-mental mercury vapour. Toxicol Letts 77:351–356 (1995).
47. Altmann L, Sveinsson K, Kramer U, Weishoff-Houben M,Turfeld M, Winneke G, Wiegadn H. Visual functions in 6-year old children in relation to lead and mercury levels.Neurotoxicol Teratol 20:9–17 (1998).
48. Hudnell HK, Otto DA, House DE. The influence of visionon computerized neurobehavioral test scores: A pro-posal for improving test protocols. Neurotoxicol Teratol18:391–400 (1996).
49. NYSDOH/U.S. CDC. Pumpkin Patch Day Care CenterInvestigation: Public Comment Draft Report. New YorkState Department of Health. Albany, NY:U.S. Centers forDisease Control, 1999.
50. U.S. EPA. The Total Exposure Assessment Methodology(TEAM) Study: Elizabeth and Bayonne, NJ, Devils Lake,ND, and Greensboro, NC. Vol 2. PB88-100078. ResearchTriangle Park, NC:U.S. Environmental Protection Agency,1987.
51. Ashley D, M Bonin F, Cardinali, McCraw J, Wotten J.Blood concentrations of volatile organic compounds in anon-occupationally exposed U.S. population and ingroups with suspected exposure. Clin Chem 40:1401–1404(1994).
52. Stein VB, Narang RS, Wilson L, Aldous KM. A simple,reliable method for the determination of chlorinatedvolatile organics in human breath and air using glasssampling tubes. Arch Environ Contam Toxicol 20:145–150(1996).
53. NYSDOH. Universal Precautions, Policy, and Procedures,Venipuncture Authorization Program. Albany,NY:Occupational Health and Safety Program-24.0, 1995.
54. Sheldon L, Handy R, Hartwell W, Leininger T, Zelon H.Final Report: Human Exposure Assessment toEnvironmental Chemicals—Nursing Mothers Study.Research Triangle Park, NC:Research Triangle Institute,1985.
55. Dekant W, Martens G, Vamvakas S, Metzler M,Henschler D. Bioactivation of tetrachloroethylene: role ofglutathione S-tranferase-catalyzed conjugation versuscytochrome P-450-dependent phospholipid alkylation.Drug Metab Dispos 15:702–709 (1987).
56. Dekant W, Berthold K, Vamvakas S, Henschler D, AndersMW. Thioacylating intermediates as metabolites of S-(1,2-dichlorovinyl)-L-cysteine and S-(1,2,2-trichlorovinyl)-L-cysteine formed by cysteine conjugation B-lyase.Chem Res Toxicol 1:175–178 (1988).
57. Lash LH, Parker JC. Hepatic and renal toxicities associ-ated with perchloroethylene. Pharmacol Rev (in press).
58. Monster A, Boersma G, Steenweg H. Kinetics of tetra-chloroethylene in volunteers: Influence of exposure con-centration and work load. Int Arch Occup Environ Health42:303–309 (1979).
59. Amin TA, Bindra S, Narang RS. Evaluation of passivesamplers for analysis of chlorinated solvents. J AOAC Int81:1027–1032 (1998).
60. Stein VB, Narang RS, Wilson L, Aldous KM. A simple,reliable method for the determination of chlorinatedvolatile organics in human breath and air using glasssampling tubes. J Anal Toxicol 20:145–150 (1996).
61. Ashley DL, Bonin MA, Cardinali FL, McCraw JM, HollerJS, Needham LL, Patterson Jr DG. Determination ofvolatile organic compounds in human blood from a largesample population by purge and trap gas chromatogra-phy/mass spectrometry. Anal Chem 64:1021–1029 (1992).
62. U.S. EPA. Urinary Metabolites, Haloacetic Acids, andChloroethanols. EPA 600/R-92/129. USEPA Method 552Determination of Haloacetic Acid by GC/ECD.Washington, DC:U.S. Environmental Protection Agency,1992.
63. Bauer JD. Total Lipids. In: Clinical Laboratory Methods,9th Ed. (Bauer JD, ed). St. Louis, MO:C.V. MosbyCompany, 1982:552–555.
64. Dekant W, Metzler M, Henschler D. Identification of S-1,2,2-trichlorovinyl-N-acetylcysteine as a urinarymetabolite of tetrachloroethylene. Bioactivation throughglutathione conjugation as a possible explanation for itsnephrocarcinogenicity. J Biochem Toxicol 1:57–71(1986).
65. Dekant W, Vamvakas S, Berthold K, Schmidt S, Wild D,Henschler D. Bacterial B-lyase mediated cleavage and
Articles • Environmental perchloroethylene exposure and vision
Environmental Health Perspectives • VOLUME 110 | NUMBER 7 | July 2002 663

mutagenicity of cysteine conjugates derived from thenephrocarcinogenic alkenes trichloroethylene, tetra-chloroethylene, and hexachlorobutadiene. Chem-BiolInteract 60:31–45 (1986).
66. Bowman K. A method for quantitative scoring of theFarnsworth panel D-15. Acta Ophthalmol (Copenhagen)60:907–916 (1982).
67. Muller KE, Barton CN, Benignus, VA. Recommendationsfor appropriate statistical practice in toxicological exper-iments. Neurotoxicology 5:113–126 (1984).
68. Tichenor BA, Sparks LE, Jackson MD, Guo Z, Mason MA,Plunket CM, Rason SA. Emissions of perchloroethylenefrom dry cleaned fabrics. Atmos Environ 24:1219–1229(1990).
69. Tichenor BA, Guo Z, Dunn JE, Sparks LE, Mason MA. Theinteraction of vapor phase organic compounds withindoor sinks. Indoor Air 1:23–25 (1991).
70. U.S. EPA. National Primary Drinking Water Regulations;Final Rule. U.S. Environmental Protection Agency. FedReg 56:3526–3597 (1991).
71. Atkin A, Wolkstein M, Bodis-Wollner I, Anders M, Kels B,Podos S. Interocular comparison of contrast sensitivitiesin glaucoma patients and suspects. Br J Ophthalmol64:858–862 (1980).
72. Ross JE, Bron AJ, Reeves BL, Emerson PG. Detection ofoptic nerve damage in ocular hypertension. Br JOphthalmol 69:897–903 (1985).
73. Sample PA, Pascal SC, Juang BS, Weinreb RN. Isolatingthe effects of primary open-angle glaucoma on the contrastsensitivity function. Am J Opthalmol 112:308–316 (1991).
74. Loshin DS, White J. Contrast sensitivity: The visual reha-bilitation of the patient with macular degeneration. ArchOphthalmol 102:1303–1306 (1984).
75. Greeves AL, Cole BL, Jacobs RJ. Assessment of contrastsensitivity of patients with macular disease usingreduced contrast near visual acuity charts. OphthalmolPhysiol Opt 8:371–377 (1988).
76. Gawande AA, Donovan WJ, Ginsburg AP, Marmor MF.Photophobia in retinitis pigmentosa. Br J Ophthalmol73:115–120 (1989).
77. Seiple WH, Holopigian K, Greenstein VC, Hood DC. Sitesof cone system sensitivity loss in retinitis pigmentosa.Invest Ophthalmol Vis Sci 34:2638–2645 (1993).
78. Alexander KR, Derlacki DJ, Fishman GA. Contrast thresh-olds for letter identification in retinitis pigmentosa. InvestOphthalmol Vis Sci 33:1846–1852 (1992).
79. Alexander KR, Derlacki DJ, Fishmann GA. Visual acuity
vs letter contrast sensitivity in retinitis pigmentosa.Vision Res 35:1495–1499 (1995).
80. Sokol S, Moskowitz A, Skarf B, Evans R, Molitch M,Senior B. Contrast sensitivity in diabetics with and with-out background retinopathy. Arch Ophthalmol 103:51–54(1985).
81. Trick GL, Burde RM, Gordon MO, Santiago JV, Kilo C. Therelationship between hue discrimination and contrastsensitivity deficits in patients with diabetes mellitus.Ophthalmology 95:693–698 (1988).
82. Bangstad HJ, Brinchmann-Hansen O, Hultgren S, Dahl-Jorgensen K, Hanssen KF. Impaired contrast sensitivityin adolescents and young type 1 (insulin-dependent) dia-betic patients with microalbuminuria. Acta OphthalmolCopenh 72:668–673 (1994).
83. Bodis-Wollner I, Camisa JM. Contrast sensitivity mea-surement in clinical diagnosis. Neurophthalmology1:373–401 (1980).
84. Regan D, Neima D. Low-contrast letter charts in earlydiabetic retinopathy, ocular hypertension, glaucoma andParkinson’s disease. Br J Ophthalmol 68:885–889 (1984).
85. Bodis-Wollner I. Methodological aspects of contrastsensitivity measurements in the diagnosis of optic neu-ropathy and maculopathy. In: Fifth International VisualField Symposium (Greve EL, Heijl A, eds). The Hague:Dr.W Junk Publishers, 1983;225–237.
86. Kupersmith MK, Siegel I, Carr RE. Subtle disturbances ofvision with compressive lesions of the anterior visualpathway measured by contrast sensitivity. Ophthalmology(Rochester) 89:68–72 (1982).
87. Bodis-Wollner I, Diamond S. The measurement of spatialcontrast sensitivity in cases of blurred vision associatedwith cerebral lesions. Brain 99:695–710 (1976).
88. Fleishman JA, Beck RW, Linares OA, Klein JW. Deficitsin visual function after resolution of optic neuritis.Ophthalmology 94:1029–1035 (1987).
89. Camisa J, Mylin L, Bodis-Wollner I. The effect of stimulusorientation on the visual evoked potential in multiplesclerosis. Ann Neurol 10:532–539 (1981).
90. Sadun AA, Borchert M, DeVita E, Hinton DR, Bassi CJ.Assessment of visual impairment in patients withAlzheimer’s disease. Am J Ophthalmol 104:113–120(1987).
91. Cronin-Golomb A, Corkin S, Rizzo JF, Cohen J, GrowdonJH, Banks KS. Visual dysfunction Alzheimer’s disease:relation to normal aging. Annals Neurol 29:41–52 (1991).
92. Gilmore GC, Levy JA. Spatial contrast sensitivity in
Alzheimer’s disease: a comparison of two methods.Optom Vis Sci 68: 790–794 (1991).
93. Cronin-Golomb A, Corkin S, Growdon JH. Visual dysfunc-tion predicts cognitive deficits in Alzheimer’s disease.Optom Vis Sci 72:168–176 (1995).
94. Chaconne JI, Chaparral E, Pharm D, Sadun AA, MangeD, Grant I, Listhaus A, Crapotta J, Lambert B, FreemanWR. Visual dysfunction without retinitis in patients withacquired immunodeficiency syndrome. Am J Ophthalmol113:8–13 (1992).
95. Leguire LE, Pappa KS, Kachmer ML, Rogers GL, BremerDL. Loss of contrast sensitivity in cystic fibrosis. Am JOphthalmol 111:427–429 (1991).
96. Morkeberg JC, Edmund C, Prause JU, Lanng S, Koch C,Michaelsen KF. Ocular findings in cystic fibrosis patientsreceiving vitamin A supplementation. Graefes Arch ClinExp Ophthalmol 233:709–713 (1995).
97. Sadun AA, Martone JF, Muci-Mendoza R, Reyes L,DuBois L, Silva JC, Roman G, Caballero B. Epidemic opticneuropathy in Cuba. Eye findings. Arch Ophthalmol112:691–699 (1994).
98. Roman GC. An epidemic in Cuba of optic neuropathy,sensorineural deafness, peripheral sensory neuropathyand dorsolateral myeloneuropathy. J Neurol Sci127:11–28 (1994).
99. Geller AM, Hudnell HK. Critical issues in the use andanalysis of the Lanthony desaturated color vision test.Neurotoxicol Teratol 19:455–465 (1997).
100. Hoshika Y, Imamura T, Muto G, Van Gemert LJ, Don JA,Walpot JI. International comparison of odor thresholdvalues of several odorants in Japan and in theNetherlands. Environ Res 61:78–83 (1993).
101. Kulig BM. The effects of chronic trichloroethylene expo-sure on neurobehavioral functioning in the rat.Neurotoxicol Teratol 9:171–178 (1987).
102. Bushnell PJ, WM Oshiro. Inhaled trichloroethylene (TCE)causes no residual effects on signal detection behaviorin adult rats. Presented at the annual meeting of theSociety for Neuroscience, 12 November 2001. San Diego,CA.
103. Kulig BM. The neurobehavioral effects of chronicstyrene exposure in the rat. Neurotoxicol Teratol10:511–517 (1989).
104. Ostergaard G, Lam HR, Ladefoged O, Arlien-Soborg P.Effects of six months white spirit inhalation exposure inadult and old rats. Pharmacol Toxicol 72:34–39 (1993).
Articles • Schreiber et al.
664 VOLUME 110 | NUMBER 7 | July 2002 • Environmental Health Perspectives