AP® Physics 1 and 2 Inquiry-Based Lab Investigations
115
AP ® Physics 1 and 2 Inquiry-Based Lab Investigations Teacher’s Manual Effective Fall 2021
-
Upload
khangminh22 -
Category
Documents
-
view
1 -
download
0
Transcript of AP® Physics 1 and 2 Inquiry-Based Lab Investigations

AP®
Physics 1 and 2 Inquiry-Based Lab Investigations
Teacher’s Manual Effective Fall 2021

AP
PH
YS
ICS
1 INV
ES
TIG
AT
ION
S
AP Physics 1 Investigation 1: 1D and 2D KinematicsHow is the translational motion of a ball described by kinematics?
Central ChallengeStudents observe a steel ball rolling down an inclined ramp, then across a horizontal track, and finally as a projectile off the end of the ramp onto the floor. In the three parts of this investigation, they are tasked with describing, with graphs and equations, the motion of the ball on the inclined ramp, the horizontal track, and as a projectile.
BackgroundThe complete description of motion includes a discussion of the position, velocity, and acceleration of an object at each point in time. The displacement of an object is the change in its position. The velocity of an object is the rate of change of its position. Velocity includes not only the magnitude of that rate of change but also the direction. The acceleration is the direction and rate of change of the velocity of the object.
These relationships can be represented graphically. The velocity can be obtained by finding the slope of the graph of position as a function of time. The acceleration can be obtained by finding the slope of the graph of velocity as a function of time. The critical concepts are contained in the equations for motion with constant acceleration in one dimension, as follows:
x x= +0 0v tx x+ 1 a t22
Equation 1
v vx x= +0 a tx Equation 2
In these equations, x is the position at time t and x0 is the position at time t = 0
of the object; vx is the velocity of the object along the direction of motion, x, at
time t, and vx0
is the velocity of the object along the direction of motion, x, at time t = 0; and a
x is the acceleration of the object along the direction of
motion, x.
© 2015 The College Board
45

AP
PH
YS
ICS
1 I
NV
ES
TIG
AT
ION
SAP Physics 1 Investigation 1
Real-World ApplicationKinematics is present in many aspects of students’ lives, such as driving or riding in automobiles and the sports they play. Driving involves acceleration in linear motion. Even the timing of traffic lights depends on kinematics; in order to keep traffic flowing efficiently, civil engineers need to time red lights at sequential cross streets so that cars aren’t stopped at each light, and on roads with higher speed limits they must extend the duration time of yellow lights so that drivers are able to stop safely before the light turns red. Examples of kinematics in sports include cross-country running, which involves constant-speed motion, distance, and displacement; and the motion of a volleyball, which can be approximated using projectile motion.
Inquiry Overview This multipart inquiry-based investigation introduces students to concepts in kinematics in one and two dimensions. Students perform three guided-inquiry investigations that involve the study of constant velocity (Part I), constant acceleration (Part II), and projectile motion (Part III), which simultaneously involves constant velocity horizontally and constant acceleration vertically.
Through guided inquiry, students are provided with a track that includes an inclined section and a horizontal section. The students are tasked to determine if the motion on the horizontal section is constant velocity and if the motion on the inclined section is constant acceleration. They are then asked to determine how the initial velocity of the ball in projectile motion affects its horizontal motion from the time it leaves the track until it lands on the ground.
Connections to the AP Physics 1 Curriculum Framework
Big Idea 3 The interactions of an object with other objects can be described by forces.
Enduring Understanding Learning Objectives
3A All forces share certain common characteristics when considered by observers in inertial reference frames.
3.A.1.1 The student is able to express the motion of an object using narrative, mathematical, and graphical representations. (Science Practices 1.5, 2.1, and 2.2)
3.A.1.2 The student is able to design an experimental investigation of the motion of an object. (Science Practice 4.2)
3.A.1.3 The student is able to analyze experimental data describing the motion of an object and is able to express the results of the analysis using narrative, mathematical, and graphical representations. (Science Practice 5.1)
[note: In addition to those listed in the learning objectives above, Science Practice 4.3 is also addressed in this investigation.]
46© 2015 The College Board

AP
PH
YS
ICS
1 INV
ES
TIG
AT
ION
S1D and 2D Kinematics
Skills and Practices Taught/Emphasized in This Investigation
Science Practices Activities
1.5 The student can re-express key elements of natural phenomena across multiple representations in the domain.
Students use data from the different parts of the investigation to create graphs of the motions and write equations that relate to those motions as part of the analysis of their lab.
2.1 The student can justify the selection of a mathematical routine to solve problems.
Students select appropriate equations to describe the ball’s motion in either constant velocity, constant acceleration, or projectile motion as part of the analysis of the lab.
2.2 The student can apply mathematical routines to quantities that describe natural phenomena.
Students use data they have collected in the appropriate equations; they also construct graphs from data to describe various motions.
4.2 The student can design a plan for collecting data to answer a particular scientific question.
Student groups, using the equipment provided, design a plan to collect enough data to plot the motions and to make calculations related to the motions, enabling them to determine which parts of the motion are constant velocity, constant acceleration, or projectile motion.
4.3 The student can collect data to answer a particular scientific question
Students collect displacement and time measurements to plot graphs of position vs. time or velocity vs. time.
5.1 The student can analyze data to identify patterns or relationships.
Students analyze the data they gather to make calculations and graphs to determine which parts of the motion are constant velocity, constant acceleration, or projectile motion. For example, they use the slope of the position–time graph to determine velocity and compare that to the velocity–time graph and calculations for the same part of the motion.
[note: Students should be keeping artifacts (lab notebook, portfolio, etc.) that may be used as evidence when trying to get lab credit at some institutions.]
Equipment and MaterialsPer lab group (two students):
▶ Ramp attached to a horizontal track (see below for one possible way to construct a ramp; if you choose a different type of track, make certain that the steel ball follows a straight-line path and does not veer off the track, as this will make data collection impossible)
▶ Stopwatch
▶ Meterstick
▶ Steel ball (1.5–2 cm in diameter)
▶ Carbon paper
© 2015 The College Board
47

AP
PH
YS
ICS
1 I
NV
ES
TIG
AT
ION
SAP Physics 1 Investigation 1
▶ Bubble level
▶ (Optional) Toy car that accelerates
The ramps are constructed from aluminum sliding door C-channel, and they can be built for approximately $10 per lab station from materials that are readily available at local home-improvement stores.
Per ramp:
▶ One 2-foot piece of 1/2-inch aluminum C-channel
▶ One 2-foot piece of 3/8-inch aluminum C-channel
▶ Two 6-inch pieces of aluminum C-channel (preferably 1 inch wide, but scraps will do)
▶ Two #6-32 × 1/2-inch machine screws
▶ Two nuts to fit the machine screws
To construct four ramps:
Get two 8-foot lengths of C-channel, one 1/2-inch wide to form the horizontal tracks at the base of the ramps and one 3/8-inch wide to form the inclined sections of the ramps. The bottom end of the 3/8-inch piece used for the upper, angled part of each ramp fits snugly into the upper end of the 1/2-inch horizontal track piece. Also purchase one piece of wider C-channel to cut into short sections to attach for “feet.”
Cut the ½-inch C-channel into four 2-foot lengths with a hacksaw or band saw to make the four horizontal sections. Cut the smaller 3/8-inch C-channel into four 2-foot lengths to make the four upper track pieces that will be angled.
Two feet are needed for each ramp. The feet can be made from larger or leftover C-channel turned upside down under the track piece so the nuts on the bottom fit inside the channel and attach to the ramp pieces with machine screws and nuts. Drill two 3/16-inch holes in each section of the C-channel, 6–8 inches from the ends. Attach the feet to the wider C-channel with the machine screws (wing nuts are preferable, but any #6-32 nut will do). It is very important that the screws be set so that they in no way interfere with the path of the ball. To make each foot, turn the short piece of 1-inch (or scrap) C-channel upside down under the track and attach the two together with the screws and nuts.
Duct tape or a C-clamp can be used to fasten the ramp and track to the table so that repeated trials are consistent and not affected by changing the elevation of the upper track. With this design, the inclined piece of C-channel is movable (necessary to perform the exercise in Part III of this investigation) since one end can be elevated to different heights with small wooden blocks.
Another option is to construct the tracks to be twice as long (i.e., with a 4-foot lower section and 4-foot upper section); these are harder to store, but they provide more length on which students can take measurements. Just double the cut lengths in the directions above to accomplish this.
48© 2015 The College Board

AP
PH
YS
ICS
1 INV
ES
TIG
AT
ION
S1D and 2D Kinematics
Figure 1 is a good picture of what the C-channel looks like, how the feet are attached, and how it should be supported.
Figure 1
© 2015 The College Board
49

AP
PH
YS
ICS
1 I
NV
ES
TIG
AT
ION
SAP Physics 1 Investigation 1
Figure 2 shows how the narrower piece of channel fits into the wider piece of channel to provide a smooth transition from the angled ramp part of the track to the horizontal section.
Figure 2
Alternate equipment ideas:
▶ Use 6-foot lengths of flexible vinyl threshold, which is also available from local home-improvement stores. These provide an ideal track for tennis balls and are very inexpensive. The inclined ramp portion would need to be supported by a board, as it is flexible and will move if unsupported as the tennis ball rolls along it. The tennis balls will not make a mark on the carbon paper so other methods would need to be used to determine the landing point of the projectile. [note: It is important that ramps are grooved so that the ball moves in a straight motion down the ramp without veering or falling off.]
▶ Commercially made ramps are also available from popular scientific equipment companies. These are, however, significantly more expensive, and in some of them the flat, horizontal section and the inclined section are all one piece, so the angle of incline is fixed. These do not offer students the flexibility of changing the incline.
▶ If the technology is available, give students photogates and the computer interfaces necessary to operate them. Avoid giving students motion detectors, however. They should be required to take simple displacement and time measurements to make their conclusions in this activity.
50© 2015 The College Board

AP
PH
YS
ICS
1 INV
ES
TIG
AT
ION
S1D and 2D Kinematics
Timing and Length of Investigation ▶ Teacher Preparation/Set-up: 10–15 minutes
The ramps are light and can be setup in at most 10 minutes. This time does not include construction of the ramp itself, which should take 20–30 minutes per ramp.
▶ Student Investigation: 70–80 minutes
Allow students time to observe the ramp, play with releasing the ball and watching it move along the track, and for small-group discussion in groups of a few lab pairs so that they can determine what they will measure and how they will measure those quantities as they approach each of the three parts to this investigation. Obtaining the data should take 10 minutes or less for each exercise and 20–30 minutes to conduct the multiple trials required for Part III.
▶ Postlab Discussion: 15–20 minutes
▶ Total Time: approximately 1.5–2 hours
Safety There are no specific safety concerns for this lab; however, all general lab safety guidelines should be followed. Sometimes, if the aluminum has been cut, the elevated end can be a little sharp — put a cushion on the elevated end, such as a foam ball, to protect students’ faces.
Preparation and PrelabThis activity should come after students work with motion detectors (or other motion analysis methods) to learn about graphs of motion and after you have helped them derive the equations of constant acceleration motion from the graphs of motion. Students should also be familiar with graphing techniques and creating graphs of position vs. time and velocity vs. time prior to the lab. Some activities are available in “Special Focus: Graphical Analysis” (see Supplemental Resources).
It is also useful to have students understand a little bit about measuring time with a stopwatch and the size of reaction-time uncertainties. You may want to have them time one oscillation of a short pendulum and compare measurements to compute an uncertainty. Then have several students in the class time one oscillation of a long pendulum (2 meters or more) and compare measurements. They should see that the percent uncertainty of the timing of the long pendulum is much less than the percent uncertainty for the short pendulum. This is true even though the absolute time uncertainty may be about the same. Reinforce for them the idea that, in order to reduce uncertainty, they need to time the motion over longer distances whenever possible.
© 2015 The College Board
51

AP
PH
YS
ICS
1 I
NV
ES
TIG
AT
ION
SAP Physics 1 Investigation 1
This experiment uses a rolling ball, so the motion description is only for linear (or translational) motion. Since a portion of the ball–Earth system’s original gravitational potential energy is converted to rotational kinetic energy of the ball, the ball’s linear speed on the horizontal portion of the track will be less than predicted by conservation of energy; also, the distance from the track that the ball lands on the floor will be less than predicted. Students will not yet have studied rotational kinematics, but it will not be difficult for them to understand that part of the system’s initial energy goes to rotational kinetic energy so that the ball has less linear (or translational) speed on the level track and as a consequence less range when it flies off onto the floor. If students have discussed rotational motion prior to this lab, they should record this and discuss it in their laboratory report as both an assumption and a source of uncertainty. Otherwise, you might not need to even address the conservation of energy or rotational motion; the data could be revisited when rotational motion is covered, to calculate the predicted distance including the rotational energy, and compare with the experimental observations.
The InvestigationThe following set of lab exercises provides an introduction to kinematics in one and two dimensions without the use of expensive sensors or low-friction tracks and carts. The exercises are all built around the ramp.
The three parts to this investigation involve:
1. The study of one-dimensional accelerated motion of the ball in its direction of motion down the incline;
2. A study of constant velocity one-dimensional motion along the horizontal portion of the track; and
3. A study of two-dimensional motion as the ball leaves the table.
Part I: Constant VelocityThe goal of the first part of this lab is for students to devise a plan to determine whether the motion on the horizontal portion of the track is constant-velocity motion. They can be given as much or as little instruction as you see fit. Instruct students to only to use stopwatches and metersticks and to present their results to the class at the end of the investigation and defend their answers.
Hopefully students will remember that a graph of constant velocity motion is a straight line with non-zero slope on a position vs. time graph, or a horizontal line on velocity vs. time graph and choose to create a graph of position vs. time or velocity vs. time. However, expect students’ creativity to prevail and several methods to emerge — both valid and invalid. The onus remains on students to justify why their chosen method is valid.
Conducting a class discussion at the end of this portion of the lab before proceeding to the next is optional. If you notice that several groups are headed in the wrong direction, you may wish to redirect their efforts in a class discussion before proceeding to Part II.
52© 2015 The College Board

AP
PH
YS
ICS
1 INV
ES
TIG
AT
ION
S1D and 2D Kinematics
Part II: Constant Acceleration The goal of the second exercise is for students to design an experiment to determine if the motion of the ball down the ramp is one of constant acceleration. This is more challenging for students. Since you are not directly telling students what to measure, they may need several chances to fail before they find the right measurements that will yield a valid claim about the motion of the ball.
Challenge students to present an analysis of the motion that justifies their claim that it is constant acceleration. Some students will recall that the graph of position vs. time for a constant acceleration motion is a parabola. However, it will be difficult for students to prove that the graph is a parabola unless they are familiar with curve-fitting programs on their calculator or a computer. In this case, you may choose to guide students to the realization that a plot of displacement vs. the square of time should yield a straight line with a slope of 1 a2 x for the motion on the inclined ramp, and therefore justifies their claim about
the motion.
Students may choose to plot a graph of velocity vs. time. Experience has shown that students tend to think they can calculate the velocity at any point by dividing the distance traveled by the time. Remind students that this is the average velocity over that interval and not the instantaneous velocity at the end of the interval.
Also remind them that they are not to assume that the acceleration is constant. You might need to stop the entire class to have them debrief and share measurement techniques if they head off in the wrong direction. They are to use data to demonstrate that acceleration is constant without necessarily finding its value. Students should not be allowed to use the equations of constant acceleration to prove the acceleration is constant. They must use a position vs. time graph or velocity vs. time graph.
Part III: Projectile MotionThe goal of the last part of the investigation is to provide students with an introduction to projectile motion. Ask the students to determine how the initial velocity of a projectile launched horizontally affects the distance it travels before it strikes the ground. Their experiments in Part I will prepare them to measure several different velocities for the ball as it leaves the track. The ball rolls off the end of the track and strikes the ground a distance from where it left the track. Give students as much direction as you want on how to reliably measure the x component of the displacement (the horizontal distance it travels). They likely have not had experience with carbon paper, so you may need to explain to them how it works: a steel ball landing on the paper will cause a dot to appear on a piece of paper placed under the carbon side of the paper.
Once students have displacement data for several different values of launch velocity, they use a graph to determine the relationship between the two variables. Once you have discussed the equations of constant acceleration applied to projectile motion, students refer back to their graph and how it supports the mathematical derivations.
© 2015 The College Board
53

AP
PH
YS
ICS
1 I
NV
ES
TIG
AT
ION
SAP Physics 1 Investigation 1
ExtensionOne possible extension for this lab is to challenge students to plot the vertical motion of the ball in projectile motion as a function of time. You can give them as much or as little direction as you want. Students know the horizontal speed of the projectile as it leaves the track. If they place a vertical board in the path of the ball with the carbon paper attached, the ball will strike it and the vertical height at that location can be measured. They then move the board away from the launch point in fixed intervals and record the vertical position of the ball for a series of horizontal distances.
The analysis of this is somewhat more complicated because students tend to confuse the horizontal and vertical motions and analyze the two together. A class discussion should lead them to the conclusion that, since the velocity in the horizontal direction is constant, the various equally spaced vertical-board positions represent equal time measurements; and thus a position vs. time graph can be obtained.
Another possible extension is to provide students with a toy car that accelerates and have them determine if the acceleration is constant, and if so, how long the acceleration lasts. (Arbor Scientific and other companies sell cars they market as “constant acceleration” cars.) Instruct students to support or refute the validity of their claim with data, graphs, and calculations.
Common Student ChallengesIt is essential for this lab that students are comfortable graphing position and velocity as functions of time.
If they still have difficulties with this, then you may want to take them outside and have them time the motion of students walking and running. Have students with stopwatches stand at 5-meter intervals along a straight line, and direct them to start timing when a student starts moving, and stop timing when the student passes them. The data of position vs. time is shared with the whole class. Students could then graph the data as practice for this lab.
A common student mistake is to assume they can apply the equations of constant acceleration to determine if an object executes constant acceleration motion. Experience has shown that students will study various sections of a larger motion and use the equations of constant acceleration to calculate the acceleration. They will then compare the various accelerations to determine if the acceleration is constant over the whole range of motion. For example, they will use the equations of constant acceleration to calculate the acceleration for the first 10 centimeters, then the first 20 centimeters, then the first 30 centimeters, etc.; then they will compare these to determine if the acceleration was constant. How long to allow students to pursue this incorrect path is up to you. You may decide to circulate amongst the groups and ask each what their plan is, and have individual discussions about the validity of their plans. Or you may choose to hold a class discussion after all of the groups have made some progress. In either case, if they choose this incorrect method, direct students to create and use graphs of position vs. time or instantaneous velocity vs. time.
54© 2015 The College Board

AP
PH
YS
ICS
1 INV
ES
TIG
AT
ION
S1D and 2D Kinematics
Students should use boxes or books to elevate the end of the ramp to change the acceleration and therefore the final horizontal velocity of the ball. They can use a piece of carbon paper taped to a piece of white paper on the floor to precisely determine the point of impact of the ball. Not allowing too great an incline keeps the velocity low so that the ball only travels about 30–35 centimeters in the horizontal direction after falling from the average 80-centimeter lab table.
Another challenge is the concept of rotational motion of the ball (discussed above), which students will not completely understand at this point. It is enough here for them to know that the rolling motion of the ball accounts for a different kind of kinetic energy (rotational) but the velocity they are calculating from linear kinetic energy is only part of the total energy. However, if energy has not yet been discussed in class, then students may not even worry about the rolling motion. [note: Discourage students from attempting to use conservation of energy calculations during this investigation to determine the final horizontal velocity of the ball: it does not address the learning objectives in this investigation.]
Analyzing ResultsWhether students break for a discussion of the results after each section of the lab or only at the end is up to you. It is highly recommended, however, that the discussion of the measurement of the velocity as it leaves the track is discussed prior to starting Part III.
The most convincing arguments for constant velocity involve a graph of position vs. time. Students should be able to articulate how they made the measurements that construct the graph. Some students may have measured the speed at different locations on the track and compared the values to each other. The discussion should center on the validity of the measurements: whether, in fact, they measured displacement and time. Depending on how the large the displacement is, the velocity they calculated may be an average velocity and not an instantaneous velocity. This discussion provides an excellent opportunity to reinforce the difference between the two.
The most convincing arguments for constant acceleration involve a graph of velocity vs. time or a graph of displacement vs. time squared. Both of these will yield a straight-line graph if the acceleration is constant. As mentioned above, the common misconception here is for students to confuse average velocity and instantaneous velocity. Experience has shown that students will measure the time it takes for the ball to roll significant distances (30–50 centimeters), measure the time, and then divide one by the other. They assume this is the velocity at the end of the motion rather than the average velocity. It is important to help students realize that this is not the case and how to calculate the instantaneous speed (which is the same size as the instantaneous velocity, since the ball does not change direction of motion).
The analysis of Part III is also best done using a graph. Ask the students to consider the following questions:
▶ How did you measure the speed of the ball just before it left the track?
▶ How consistent was the landing position of the ball for each individual speed?
© 2015 The College Board
55

AP
PH
YS
ICS
1 I
NV
ES
TIG
AT
ION
SAP Physics 1 Investigation 1
▶ What does the shape of the graph of horizontal displacement vs. speed imply about the relationship between the two?
▶ How does the ball’s time of flight depend on its initial horizontal speed?
▶ How could you improve the precision and accuracy of your measurements?
A discussion of sources and sizes of uncertainty of measurements is inevitable in this lab. Start by having students indicate what measurements were actually made and what the uncertainty was in each measurement. For example, they will probably measure time with a stopwatch. If they measure several trials, then they can take a standard deviation; otherwise the uncertainty is their reaction time.
Depending on the incline of the track, the speed of the ball may be significant, making timing with a stopwatch significantly affected by reaction-time error. Methods of decreasing this uncertainty can be discussed at any point during the measurement or in a discussion at the end. Ask the students to consider the following questions:
▶ What is the typical human reaction time when using a stopwatch?
▶ How does this time compare to the time intervals you were measuring?
▶ What percent uncertainty does this introduce into your time measurements and speed calculations?
▶ What could you do to reduce this uncertainty?
For example, a typical reaction time is between 0.1 and 0.25 seconds. Assuming the larger value, if the measurement is only 1.0 second, this represents a 25 percent uncertainty in the timing measurement. However, if the time measurement is 10 seconds, this represents a 2.5 percent uncertainty in the timing measurement and thus the speed measurement. One suggestion for reducing uncertainty would be to use a device that does not rely on human reaction time for measurement, such as a photogate.
Assessing Student UnderstandingAfter completing this investigation, students should be able to:
▶ Use measurements of displacement and time to create a position vs. time graph;
▶ Use measurements of displacement and time to create a velocity vs. time graph;
▶ Use graphs of position and velocity vs. time to analyze the motion of an object;
▶ Determine the speed of a ball on a horizontal track;
▶ Measure the horizontal distance a projectile travels before striking the ground; and
▶ Relate the initial velocity of a horizontally launched projectile to the horizontal distance it travels before striking the ground.
56© 2015 The College Board

AP
PH
YS
ICS
1 INV
ES
TIG
AT
ION
S1D and 2D Kinematics
Assessing the Science Practices
Science Practice 1.5 The student can re-express key elements of natural phenomena across multiple representations in the domain.
Proficient Plots correct graphs for all parts of the motion, and makes correct inferences about the motion from those graphs.
Nearly Proficient Plots correct graphs for all parts of the motion, but portions of the interpretation are incorrect.
On the Path to Proficiency
Plots a correct graph for one part of the motion (e.g., the velocity vs. time for the level section).
An Attempt Attempts graphs related to his or her observations and measurements, but graphs are inaccurate.
Science Practice 2.1 The student can justify the selection of a mathematical routine to solve problems.
Proficient Uses kinematic equations appropriately to verify displacement, velocity, and acceleration for all sections of the experiment, including correct interpretations of slope.
Nearly Proficient In most instances, uses correct equations for calculations related to motion, but there is an incorrect assumption in one step, such as forgetting that initial vertical velocity as the ball leaves the table is zero. This applies also to determination of slope and area from graphs.
On the Path to Proficiency
Uses some correct equations for calculations, but uses one or more incorrectly, such as using a kinematics equation to determine whether acceleration is constant. This applies also to determination of slope and area from graphs..
An Attempt Uses incorrect equations to calculate acceleration, velocity, and/or displacement, and uses incorrect equations in determination of slope and area from graphs.
Science Practice 2.2 The student can apply mathematical routines to quantities that describe natural phenomena.
Proficient Makes entirely correct calculations from equations or determinations of slope and area from graphs.
Nearly Proficient Makes mostly correct calculations from equations or determinations of slope and area from graphs.
On the Path to Proficiency
Makes some correct calculations from equations or determinations of slope and area from graphs.
An Attempt Attempts to make calculations from equations or determinations of slope and area from graphs, but none are correct.
© 2015 The College Board
57

AP
PH
YS
ICS
1 I
NV
ES
TIG
AT
ION
SAP Physics 1 Investigation 1
Science Practice 4.2 The student can design a plan for collecting data to answer a particular scientific question.
Proficient Follows directions and adds a thorough description of a design plan (with clearly labeled diagrams), including predictions and assumptions.
Nearly Proficient Follows directions and adds a design plan that is mostly complete (with diagrams), and including assumptions.
On the Path to Proficiency
Follows directions but does not clearly indicate a plan for experimental design and procedure.
An Attempt Misinterprets directions or does not indicate a viable plan for experimental design and procedure.
Science Practice 4.3 The student can collect data to answer a particular scientific question.
Proficient Collects accurate data in a methodical way and presents the data in an organized fashion.
Nearly Proficient Collects mostly but not entirely accurate and complete data or the presentation of the data is somewhat disorganized.
On the Path to Proficiency
Collects somewhat inaccurate or incomplete data and the presentation of the data lacks organization.
An Attempt Collects inaccurate or incomplete data and doesn’t provide any organization for this data.
Science Practice 5.1 The student can analyze data to identify patterns or relationships.
Proficient Appropriately uses a velocity–time graph to determine the acceleration of the ball and position–time graphs to determine the speed of the ball on the track. Accurately graphs horizontal displacement vs. speed and interprets the results.
Nearly Proficient Makes conclusions and calculations from data (perhaps graphs) but indicates no clear correlations.
On the Path to Proficiency
Requires significant assistance in analyzing velocity–time graphs or relating horizontal distance traveled for a projectile launched horizontally to the initial speed of the projectile.
An Attempt Attempts to use incorrect features of a velocity–time graph to determine the acceleration of an object.
58© 2015 The College Board

AP
PH
YS
ICS
1 INV
ES
TIG
AT
ION
S1D and 2D Kinematics
Supplemental ResourcesDrake, Stillman. Galileo: Two New Sciences. Madison, Wisconsin: University of Wisconsin Press, 1974.
“Mechanics: 1-Dimensional Kinematics.” The Physics Classroom. Accessed September 1, 2014. http://www.physicsclassroom.com/calcpad/1dkin/problems.cfm. [This website allows students to explore extra practice problems on kinematics.]
“The Moving Man.” PhET. University of Colorado Boulder. Accessed September 1, 2014. http://phet.colorado.edu/en/simulation/moving-man. [This simulation provides an interactive way to learn about position, velocity, and acceleration graphs.]
The Physlet Resource. Davidson College. Accessed September 1, 2014. http://webphysics.davidson.edu/physlet_resources. [This resource provides sample “physlet” illustrations, explorations, and problems in 1-dimensional kinematics.]
“Projectile Motion.” PhET. University of Colorado Boulder. Accessed September 1, 2014. http://phet.colorado.edu/en/simulation/projectile-motion. [Provides multiple visual representations of kinematics in one and two dimensions.]
“Special Focus: Graphical Analysis.” AP Physics 2006–2007 Professional Development Workshop Materials. College Board. Accessed September 1, 2014. http://apcentral.collegeboard.com/apc/public/repository/AP_Physics_Graphical_Analysis.pdf.
© 2015 The College Board
59

This page is intentionally left blank.

AP
PH
YS
ICS
1 INV
ES
TIG
AT
ION
S
AP Physics 1 Investigation 2: Newton’s Second LawWhat factors affect the acceleration of a system?
Central Challenge In this lab students investigate how the acceleration of an object is related to its mass and the force exerted on the object, and use their experimental results to derive the mathematical form of Newton’s second law.
Students should have already completed the study of kinematics and Newton’s first law.
BackgroundNewton’s laws are the basis of classical mechanics and enable us to make quantitative predictions of the dynamics of large-scale (macroscopic) objects. These laws, clearly stated in Isaac Newton’s Principia over 300 years ago, explain how forces arising from the interaction of two objects affect the motion of objects.
Newton’s first law states that an object at rest remains at rest, and an object moves in a straight line at constant speed unless the object has a net external force exerted on it.
Newton’s second law states that when a next external force is exerted on an object of mass m, the acceleration that results is directly proportional to the net force and has a magnitude that is inversely proportional to the mass. The direction of the acceleration is the same as the direction of the net force.
The mass of an object in Newton’s second law is determined by finding the ratio of a known net force exerted on an object to the acceleration of the object. The mass is a measure of the inertia of an object. Because of this relationship, the mass in Newton’s second law is called inertial mass, which indicates how the mass is measured.
Newton’s laws of motion are only true in frames of reference that are not accelerating, known as inertial frames.
Real-World ApplicationThere are numerous real-world applications of Newton’s second law that can spark student interest. Students can research their favorite sport and apply the concepts learned in this investigation to understand how the magnitude of the acceleration varies when a force is exerted on objects of different mass, such as golf balls, tennis balls, and baseballs.
© 2015 The College Board
61

AP
PH
YS
ICS
1 I
NV
ES
TIG
AT
ION
SAP Physics 1 Investigation 2
Another application could be the physics involved when a car encounters ice. Students think the engine makes the car move, but why doesn’t it work on ice? It doesn’t work because an external force must be exerted on an object by another object to cause acceleration; the tires push back on the ground, the ground pushes forward on the tires, and the car goes forward. Ice interferes with this interaction of external forces on the tires and the ground, and so the wheels just spin.
In this investigation, students use a modified Atwood’s machine. Atwood’s machines are systems with two masses connected by a cable and pulley, providing for a constant acceleration of any value required (see Figure 1). Some students might be interested in a real-life application of this technology, such as an elevator and its counterweight.
Inquiry OverviewThis investigation is structured as a guided inquiry. Students are presented with the question, “What factors affect the acceleration of a system?”
After observing the demonstrations suggested in Part I of the investigation, the students will be guided to discover the factors to be investigated. The students will also design the procedure of the investigation and the data collection strategy.
Students might need some guidance with the analysis of data and the construction of graphs. More specifically, they might be confused about how to merge the results of the two parts of the investigation to answer the overall lab question.
In the Investigation section, specific guiding questions are offered to support students in the design and interpretation of their experiments. Part II of the investigation is divided into two separate activities. The first is limited to the relation of acceleration to force, and the second is limited to the relation of acceleration to mass.
Connections to the AP Physics 1 Curriculum Framework
Big Idea 1 Objects and systems have properties such as mass and charge. Systems may have internal structure.
Enduring Understanding Learning Objectives
1.A The internal structure of a system determines many properties of the system.
1.C.1.1 The student is able to design an experiment for collecting data to determine the relationship between the net force exerted on an object, its inertial mass, and its acceleration. (Science Practice 4.2)
62© 2015 The College Board

AP
PH
YS
ICS
1 INV
ES
TIG
AT
ION
SNewton’s Second Law
Big Idea 3 The interactions of an object with other objects can be described by forces.
Enduring Understanding Learning Objectives
3.A The internal structure of a system determines many properties of the system.
3.A.2.1 The student is able to represent forces in diagrams or mathematically using appropriately labeled vectors with magnitude, direction, and units during the analysis of a situation. (Science Practice 1.1)
[note: In addition to those listed in the learning objectives above, the following science practices are also addressed in the various lab activities: 4.1, 4.3, 5.1, and 5.3.]
Skills and Practices Taught/Emphasized in This Investigation
Science Practices Activities
1.1 The student can create representations and models of natural or man-made phenomena and systems in the domain.
Students produce multiple representations of the data in the form of graphs and diagrams as follows:
w Graphs of the data:
› acceleration vs. force
› acceleration vs. mass
w Force diagrams that represent the forces exerted on the objects
4.1 The student can justify the selection of the kind of data needed to answer a particular scientific question.
Students identify the quantities that need to be measured in order to determine the acceleration of the system.
4.2 The student can design a plan for collecting data to answer a particular scientific question.
Students design a procedure to investigate the relationships among the net force exerted on an object, its inertial mass, and its acceleration.
4.3 The student can collect data to answer a particular scientific question.
Students gather the following data:
w net force and acceleration when the total mass is kept constant
w total mass and acceleration when the net force is kept constant
5.1 The student can analyze data to identify patterns or relationships.
Students analyze the graphs to identify the relationship between the variables
5.3 The student can evaluate the evidence provided by data sets in relation to a particular scientific question.
Students articulate an operational definition of Newton’s second law based on the evidence presented by the graphs.
[note: Students should be keeping artifacts (lab notebook, portfolio, etc.) that may be used as evidence when trying to get lab credit at some institutions.]
© 2015 The College Board
63

AP
PH
YS
ICS
1 I
NV
ES
TIG
AT
ION
SAP Physics 1 Investigation 2
Equipment and MaterialsPer lab group (three to four students):
▶ Dynamics track
▶ Cart
▶ Assorted masses
▶ Mass hanger and slotted masses
▶ Low-friction pulley
▶ String
▶ Meterstick
▶ Stopwatch
If you do not have a dynamics track, then any flat, smooth surface, perhaps even the lab tables themselves, will work just fine. The carts should have wheels with a small rotational-inertia and low-friction bearings.
Data acquisition using motion detectors or photogates is recommended when available, as it helps reduce experimental procedural errors. Another option is to record a video of the motion of the cart and use video analysis software to analyze the motion.
Timing and Length of Investigation▶ Teacher Preparation/Set-up: 15–20 minutes
This time is needed to prepare the demos and set out equipment from which students may choose for their investigation.
▶ Prelab: 30 minutes
It is advisable to conduct the activities and prelab discussion in one class or lab period.
▶ Student Investigation: 110–120 minutes
Design of procedure: 20–30 minutes
Data collection: 30 minutes
Data analysis: 60 minutes
You may assign the design of the data collection procedures as homework. Students gather the materials and do their own setup for their investigations. At the beginning of the lab period, have volunteers present their draft procedures to the class, and solicit feedback from the various groups.
▶ Postlab Discussion: 30 minutes
▶ Total Time: approximately 3.5 hours
[note: This investigation is designed to enable a deeper understanding of Newton’s second law and therefore it might take more time than investigations performed in the context of the previous AP Physics B course.]
64© 2015 The College Board

AP
PH
YS
ICS
1 INV
ES
TIG
AT
ION
SNewton’s Second Law
SafetyThere are no major safety concerns for this lab. However, pay attention to high speeds of carts, masses flying off carts, masses hitting the feet of students, and student fingers being squeezed when stopping a cart at the pulley when a high proportion of mass is on the hanger. Also, to keep students and equipment from being damaged, restrict the total slotted mass. General lab safety guidelines should always be observed.
Preparation and PrelabPrelab ActivitiesThe following activities are optional and could be conducted to assess students’ prior knowledge, skill levels, and understanding of key concepts. Setup the modified Atwood machine and pose questions such as those suggested below in this four-part prelab session:
Part I:What will a graph of the cart’s velocity (v) vs. time (t) look like after the system is released from rest?
After making and discussing their predictions, students carry out an experiment, using a motion detector to record v vs. t, or using video capture, in which case students will have to put some thought into how to produce the velocity vs. time graph. But the main point of this part is for students to see and make sense of the conclusion that the slope of the velocity vs. time graph is constant.
Part II: (a) If the cart’s mass is increased, will the new velocity vs. time graph look the same or different from the graph in Part I?
(b) If the hanging mass is increased, will the new velocity vs. time graph look the same or different from the graph in Part I?
Again, these are qualitative questions, but students can obtain quantitative data to answer them. As usual with these kinds of qualitative questions, the lab works well if students first make and discuss their predictions before designing and carrying out the experiments.
Part III:If both the cart’s mass and the hanging mass are doubled, will the new velocity vs. time graph look the same or different from the graph in Part I?
© 2015 The College Board
65

AP
PH
YS
ICS
1 I
NV
ES
TIG
AT
ION
SAP Physics 1 Investigation 2
Part IV:What if the cart is moving initially?
What will the velocity vs. time graph look like, compared to the graph from Part I, if the cart at t = 0 is given a brief push away from the pulley? Will the graph be the same? If not, what will be different?
Some students may spontaneously have the idea of doing another trial where the cart is given a brief push towards the pulley — and it would be great for them to try that! They should be able to identify that the y-intercept in the velocity–time graph represents the initial velocity of the cart.
The InvestigationPart I:In the first part of this activity, students observe a number of demonstrations that include variations of an object being accelerated.
A modified Atwood’s machine with a system consisting of a cart and a hanger with slotted masses like the one shown in Figure 1 is a suitable setup.
Figure 1
Examples include a demonstration where the total mass of the system is kept constant and the net force is varied, and a demonstration where the net force is kept constant and the total mass of the system is varied. Instructors could use any available lab equipment that allows for a variation of the force exerted on the object with added masses. Ask the students these three questions:
1. “What do you observe?”
2. “What can you measure?”
3. “What can you change?”
A guided discussion should yield some of the following answers to the questions:
1. The cart-mass hanger system is accelerated.
2. Quantities that can be measured include the mass of the cart, the mass of the hanger, distance traveled by the cart, distance traveled by the hanger and the slotted masses, the time of travel, etc.
3. Quantities that can be changed are the net force on the system and the total mass of the system.
66© 2015 The College Board

AP
PH
YS
ICS
1 INV
ES
TIG
AT
ION
SNewton’s Second Law
Students may have difficulty identifying the net force exerted on the system. Drawing free-body diagrams might help in determining that the net force on the system is equal to the gravitational force of Earth on the hanger and slotted masses. Some students will indicate that a force of kinetic friction is exerted on the cart.
Part II: After the discussion, instruct students to design two data collection strategies to determine how two factors affect the acceleration of the system: the net force on the system and the total mass of the system.
Activity 1: Students design procedures that include calculation of the acceleration when the total mass of the system is kept constant and the net force is varied.
Activity 2: Students design procedures that include calculation of the acceleration when the total mass of the system is varied and the net force is kept constant.
A few tips:
▶ Discourage students from trying to combine the two activities into one.
▶ Encourage students to be careful to keep the string parallel to the track throughout the data collection.
▶ The length of the string connecting the cart to the mass hanger should allow the mass hanger to reach the floor just before the cart reaches the pulley.
▶ Make sure that the string does not rub against anything, such as the pulley mount.
ExtensionAn extension to this lab is to investigate the effect of friction on the acceleration of the cart. Alternative investigations that use dynamics concepts can be provided as challenges. For examples of this type of activity, see “Turning a Common Lab Exercise into a Challenging Lab Experiment: Revisiting the Cart on an Inclined Track” and “Time Trials — An AP Physics Challenge Lab” in Supplemental Resources.
Another engaging extension activity consists of having students apply the concepts learned in this investigation to their favorite sports. Students could do short presentations in the class, or they could create a poster with their findings if time for presenting is a constraint.
The Science360 Video Library, sponsored by the National Science Foundation, gathers the latest science videos by scientists, colleges and universities, and science and engineering centers. “Newton’s Three Laws of Motion” and “Science of the Summer Olympics: Engineering In Sports” are recommended for students to explore (see Supplemental Resources).
© 2015 The College Board
67

AP
PH
YS
ICS
1 I
NV
ES
TIG
AT
ION
SAP Physics 1 Investigation 2
Common Student ChallengesSome of the common challenges that students have regarding Newton’s first law include the idea that forces are required for motion with constant velocity. When observing the demonstrations, students need to recognize that the velocity of the object is changing as a result of the net force exerted on the object. It should be clear that the net force determines an object’s acceleration, not its velocity. To counter this student misconception, you can use a motion detector and a force probe to study the motion of a cart being pulled by a mass hanging from a string that passes over a pulley (as shown in the Investigation section). Simultaneously graph the force on the cart and the motion of the cart. Direct students to notice the shape of the force graph (horizontal line) and acceleration graph are the same, but the velocity vs. time graph is a line with a positive slope. A constant forward force produces an increasing velocity and a constant acceleration.
Students might not see the connection between Newton’s laws and kinematics, so it is important for them to recognize Newton’s second law as “cause and effect.” It is important to present Newton’s second law in its operational form of
Σ Fa = m, as the commonly used
∑ F = am leads some students to believe that the
product of mass and acceleration (ma) is a force.
A specific student challenge in this investigation is to recognize that both the cart and the falling mass are included in the total inertial mass of the system being affected by the gravitational force on the falling mass. During the investigation, all masses to be used as falling masses should be placed in the cart when not pulling the cart. Students will be tempted to have the cart on the table and replace the falling mass with a different falling mass that is on the lab table. This, in effect, changes the total mass being pulled. This is a good opportunity to have students discuss the meaning of system. The system that is being accelerated is the cart and falling mass.
Another specific student challenge is the role of friction of the cart and the pulley as well as the rotational inertia of the wheels of the cart and the pulley. These can be ignored when conducting the investigation for sufficient hanging mass, but should be discussed at some point in the analysis of results.
Analyzing ResultsHow students analyze their results depends on how they decided to make measurements and complete the calculations. Some students may use a stopwatch to measure the time of the acceleration over a fixed distance. These students would then use the equations of constant acceleration motion to calculate the acceleration. Other students may choose to use motion sensors to plot the velocity vs. time for the cart. In that case, they would use the slope of the graph for the acceleration.
68© 2015 The College Board

AP
PH
YS
ICS
1 INV
ES
TIG
AT
ION
SNewton’s Second Law
The sources of experimental uncertainty depend on the equipment used as the precision is limited by the apparatus resolution. In this investigation, uncertainty might be related to the measurements of time, length, or mass (or combinations of each). Students can minimize the uncertainties by taking measurements in multiple trials and averaging the results. See Resources for options of support in this area.
The development of mathematical models from graphs of acceleration vs. force and acceleration vs. mass are an expectation of this investigation. In order to determine the relationship between net force and acceleration and between total mass and acceleration, students plot a graph with an independent variable on the horizontal axis and a dependent variable on the vertical axis. If students are not familiar with linearization methods, guide them as they linearize the acceleration vs. mass graph.
The use of multiple representations in this lab is highly recommended as it leads to a deeper conceptual understanding of Newton’s second law. The lab report should include verbal descriptions of their observations as well as labeled free-body diagrams of the forces exerted on the system.
Sample qualitative graphs for this lab include:
Force
Acc
eler
atio
n
Acc
eler
atio
n
Mass
Acc
eler
atio
n
Mass1
Figure 2
Following are several guiding questions that will help students interpret their graphs generated in Part II of the investigation:
Activity 1:
How does your data indicate if the acceleration was proportional to the force?
Students determine the relationship between the acceleration and the force from the graph. A straight line represents a direct variation between the acceleration and the net force.
What does the slope of the acceleration vs. force graph represent?
The slope of the acceleration vs. force graph represents the reciprocal of the mass of the system.
What is the algebraic relationship between acceleration and net force in this system?
The algebraic relationship between acceleration and net force is expressed as a F∝ Σ .
[note: You may want to point out to students that the graph does not go through zero. This accounts for the frictional force between the cart and the surface.]
© 2015 The College Board
69

AP
PH
YS
ICS
1 I
NV
ES
TIG
AT
ION
SAP Physics 1 Investigation 2
Activity 2:
How does the data indicate if the acceleration was inversely proportional to the mass?
Students determine the relationship between the acceleration and the mass from the graph. A hyperbola represents an inverse variation between the acceleration and the mass.
What does the slope of the acceleration vs. the inverse of the mass represent?
The slope of the acceleration vs. the inverse of the mass graph represents the net force of the system.
What is the algebraic relationship between acceleration and mass in this system?
The algebraic relationship between acceleration and mass is expressed as
a m∝ 1 .
As part of the analysis, students could find the percent difference between the theoretical value of the acceleration from one configuration of the masses using the free-body diagram of the system and the experimental value.
[note: Percent difference is applied when comparing two experimental quantities, E1 and E2, neither of which can be considered the “correct” value. The percent difference is the absolute value of the difference over the mean times 100.]
Assessing Student UnderstandingBy the end of the investigation, students should be able to:
▶ Articulate that the acceleration of an object is directly proportional to the net force: a F∝ Σ ;
▶ Articulate that the acceleration is inversely proportional to the mass:a m∝ 1 ;
▶ Determine a relationship between arbitrary combinations of mass, force, and acceleration using dimensional analysis;
▶ Calculate the proportionality constant (k) for the relationship derived from
dimensional analysis: a k Σ Fm= ;
▶ Obtain a proportionality constant value of 1.0; and
▶ Identify the sources of experimental uncertainty and ways to minimize experimental uncertainties.
70© 2015 The College Board

AP
PH
YS
ICS
1 INV
ES
TIG
AT
ION
SNewton’s Second Law
Assessing the Science Practices
Science Practice 1.1 The student can create representations and models of natural or man-made phenomena and systems in the domain.
Proficient Creates accurate and appropriate graphical representations of the relationship between acceleration and net force and between acceleration and mass.
Nearly Proficient Creates mostly correct graphical representations of the relationship between acceleration and net force and between acceleration and mass. The graphs may not fully reflect all aspects of the relationships among the variables.
On the Path to Proficiency
Creates flawed or incomplete graphical representations of the relationship between acceleration and net force and/or between acceleration and mass.
An Attempt Provides incorrect graphical representations of the relationship between acceleration and net force and/or between acceleration and mass.
Science Practice 4.1 The student can justify the selection of the kind of data needed to answer a particular scientific question.
Proficient Provides accurate and detailed justification explaining the relevance of the variation of mass and net force in the system.
Nearly Proficient Provides accurate justification for the relevance of the variation of mass and net force in the system with only an occasional or minor error.
On the Path to Proficiency
Provides justification for the relevance of the variation of mass and/or net force in the system with occasional and/or minor errors; justification may be correct but lacks completeness.
An Attempt Provides generally weak justification for the relevance of the variation of mass and/or net force in the system justification; includes minimal reasoning and evidence.
© 2015 The College Board
71

AP
PH
YS
ICS
1 I
NV
ES
TIG
AT
ION
SAP Physics 1 Investigation 2
Science Practice 4.2 The student can design a plan for collecting data to answer a particular scientific question.
Proficient Designs an effective data collection plan to answer the question via well-selected quantitative measurements of acceleration, providing rationales for all choices. Accurately evaluates uncertainty in measurements. Effectively explains equipment selection for acquiring data (balance and meterstick and stopwatch or motion detector or photogates). Accurately explains different sources of error in data. Accurately identifies and explains independent, dependent, and controlling variables, and justifies choices as follows:
(1) Determination of the acceleration when the total mass of the system is kept constant and the net force is varied.
(2) Determination of the acceleration when the total mass of the system is varied and the net force is kept constant.
Nearly Proficient Designs an appropriate data collection plan to answer the question via quantitative measurements of acceleration; measurements may lack complete details. Identifies equipment (balance and meterstick and stopwatch or motion detector or photogates). Identifies appropriate data sources and estimated error. Accurately identifies and describes independent, dependent, and controlling variables as follows:
(1) Determination of the acceleration when the total mass of the system is kept constant and the net force is varied.
(2) Determination of the acceleration when the total mass of the system is varied and the net force is kept constant.
On the Path to Proficiency
Designs a data collection plan to answer the question via quantitative measurements of acceleration; measurements may not be clearly defined or articulated. Acknowledges need to consider estimated error. Accurately identifies independent, dependent, and controlling variables with few errors as follows:
(1) Determination of the acceleration when the total mass of the system is kept constant and the net force is varied.
(2) Determination of the acceleration when the total mass of the system is varied and the net force is kept constant.
An Attempt Presents an incomplete data collection plan to answer the question. Makes errors in identifying the variables (independent, dependent, and controlling).
72© 2015 The College Board

AP
PH
YS
ICS
1 INV
ES
TIG
AT
ION
SNewton’s Second Law
Science Practice 4.3 The student can collect data to answer a particular scientific question.
Proficient Collects appropriate data to fully determine the relationship among the acceleration, net force, and inertial mass of the system with precision of observations, accuracy of records, and accurate use of scientific tools and conditions. Accurately applies mathematical routines and appropriately uses measurement strategies.
Nearly Proficient Collects appropriate and adequate data to answer some aspects of the relationship among the acceleration, net force, and inertial mass of the system with only minor errors in the precision of observation, record keeping, and use of tools and conditions. Selects appropriate mathematical routines and provides measurements with only few minor errors.
On the Path to Proficiency
Collects appropriate data to determine the relationship among the acceleration, net force, and inertial mass of the system. Provides observation logs and record keeping that contain several errors. Selects appropriate mathematical routines and provides measurements with few errors or only a single significant error.
An Attempt Collects relevant but significantly inadequate data to determine the relationship among the acceleration, net force, and inertial mass of the system. Provides observations and/or record keeping that are incomplete and/or inadequate for answering a particular question. Selects inappropriate mathematical routines; measurements contain many errors.
© 2015 The College Board
73

AP
PH
YS
ICS
1 I
NV
ES
TIG
AT
ION
SAP Physics 1 Investigation 2
Science Practice 5.1 The student can analyze data to identify patterns or relationships.
Proficient Comprehensively describes the patterns and relationships within data relative to the relationship among the acceleration, net force, and inertial mass of the system. Accurately applies appropriate mathematical routines. Correctly identifies all of the sources of experimental error, and suggests ways to minimize the uncertainties.
Nearly Proficient Identifies most patterns within data relative to the relationship among the acceleration, net force, and inertial mass of the system with only an occasional minor error. Selects appropriate mathematical routines and applies them with only minor errors. Correctly identifies most of the sources of experimental error, and suggests ways to minimize the uncertainties.
On the Path to Proficiency
Identifies the most obvious patterns within data, relative to the relationship among the acceleration, net force, and inertial mass of the system with some errors and inaccuracies. Selects appropriate mathematical routines but makes some application errors. Identifies some of the sources of experimental error, and suggests ways to minimize the uncertainties.
An Attempt Identifies a few legitimate patterns in data, though these may be irrelevant to determine the relationship among the acceleration, net force, and inertial mass of the system. Identifies some mathematical routines that are appropriate. Identifies some of the sources of experimental error, but does not suggest ways to minimize the uncertainties.
Science Practice 5.3 The student can evaluate the evidence provided by data sets in relation to a particular scientific question.
Proficient Provides a connection along with a clear justification, such as the calculation of the proportionality constant (k), for the relationship derived from dimensional analysis to determine the relationship between the acceleration and the inertial mass of the system and the relationship between the acceleration and the net force of the system.
Nearly Proficient Provides a connection but no justification is offered, or a justification is offered but it is vague regarding the relationship between the acceleration and the inertial mass of the system and/or the relationship between the acceleration and the net force of the system. Attempts to represent the proportionalities among acceleration, net force, and inertial mass as an equation; rearranges and solves for the constant of proportionality k.
On the Path to Proficiency
Provides a connection but the generalization of the relationship between the acceleration and the inertial mass of the system and/or the relationship between the acceleration and the net force of the system is not correct.
An Attempt Fails to recognize or provide a connection to the relationship between the acceleration and the inertial mass of the system, and the relationship between the acceleration and the net force of the system.
74© 2015 The College Board

AP
PH
YS
ICS
1 INV
ES
TIG
AT
ION
SNewton’s Second Law
Supplemental ResourcesAmato, Joseph C., and Roger E. Williams. “Turning a Common Lab Exercise into a Challenging Lab Experiment: Revisiting the Cart on an Inclined Track.” The Physics Teacher 48, no. 5 (2010): 322–323.
Bell, Stephanie. “Measurement Good Practice Guide No. 11: A Beginner’s Guide to Uncertainty of Measurement, Issue 2.” National Physical Laboratory. Accessed September 1, 2014. https://www.wmo.int/pages/prog/gcos/documents/gruanmanuals/UK_NPL/mgpg11.pdf.
Blanton, Patricia. “Three Questions Can Change Your Labs for the Better.” The Physics Teacher 47, no. 4 (2009): 248–249.
“Experimental Uncertainties.” Rutgers Physics and Astronomy Education Research Group. Accessed September 1, 2014. http://paer.rutgers.edu/ScientificAbilities/Downloads/DesExp/ExperUncertainties.pdf.
“Introducing Newton’s Laws with Learning Cycles.” Arbor Scientific. Accessed September 1, 2014. http://www.arborsci.com/cool/introducing-newtons-laws-with-learning-cycles.
Jones, David. “Time Trials — An AP Physics Challenge Lab.” The Physics Teacher 47, no. 5 (2009): 342–344.
“Newton’s Three Laws of Motion.” Science360. Video, 5:32. Accessed September 1, 2014. http://science360.gov/obj/video/642db496-d506-432e-85b4-4e38f75d9142/newtons-three-laws-motion.
“Science of NFL Football.” Science360. Accessed September 1, 2014. http://science360.gov/series/science-nfl-football/75c4deca-05f2-40f8-89ed-6756341d204f.
“Science of the Summer Olympics: Engineering In Sports.” Science360. Accessed September 1, 2014. http://science360.gov/series/science-summer-olympics-engineering-sports/84211b74-7ae1-4d9b-9024-5faa6300fc29.
“Special Focus: Graphical Analysis.” AP Physics: 2006–2007 Professional Development Workshop Materials. College Board. Accessed September 1, 2014. http://apcentral.collegeboard.com/apc/public/repository/AP_Physics_Graphical_Analysis.pdf.
Tung, Cecelia. “Newton’s 2nd Law: Inquiry Approach.” Understanding Science Lessons. University of California, Berkeley. Accessed September 1, 2014. http://undsci.berkeley.edu/lessons/newtons_2nd.html.
Wayne, Tony. “Newton’s Laws Stations.” Accessed September 1, 2014. http://www.mrwaynesclass.com/Newton/Activity/home.html.
© 2015 The College Board
75

This page is intentionally left blank.

AP
PH
YS
ICS
1 INV
ES
TIG
AT
ION
S
AP Physics 1 Investigation 3: Circular MotionHow do you determine the period of a conical pendulum?
Central ChallengeIn this investigation, students use a toy that executes motion in a conical pendulum to study circular motion. Given only a meterstick and a stopwatch, they must design a procedure and make measurements to predict the period of motion of the conical pendulum.
BackgroundA conical pendulum consists of an object moving in uniform circular motion at the end of a string of negligible mass (see Figure 1). A free-body diagram of the object is shown in Figure 2. F
T represents the tension in the string and the
gravitational force on the object is mg where m is the object’s mass and g is the acceleration due to gravity.
R
Lq
Figure 1
FT
mg
Figure 2
The circular motion of the object is in the horizontal plane, so the horizontal component of the tension is serving as the centripetal force. Since there is no vertical motion of the object, the vertical component of the tension is equal to the gravitational force on the object. In equation form:
F maT csinθ =
F mTvR
sinθ =2
and
F mgT cosθ =
© 2015 The College Board
77

AP
PH
YS
ICS
1 I
NV
ES
TIG
AT
ION
SAP Physics 1 Investigation 3
where R is the radius of the object’s motion, v is the speed, and θ is the angle the string makes with the vertical, as shown in Figure 1.
Combining these equations we get:
tanθ = vgR
2
The speed of an object in circular motion is given by v RT
= 2π where T is the
period of the circular motion. Substituting this relationship into the equation
above and rearranging we get T Rg
2 4 2
= πθtan
.
Thus, by measuring only lengths such as L and R (see Figure 1), and using them to calculate the angle from the vertical, students can predict the period of a conical pendulum.
[note: L is the length of the pendulum, as measured from the point of attachment of the string to the center of mass of the object at the end of the pendulum (assuming the string has negligible mass), and R is measured from the center of the circle to the center of mass of the object.]
Real-World ApplicationThere are many real-world applications of circular motion dealing with interchanges, intersections, and driving a car in general. You can talk about various amusement park rides as well — roller coasters deal heavily with circular motion. The swing ride is an example of a conical pendulum in which the riders sit in swings and move in circular motion around a central support structure (see Figure 3). Other rides, such as the rotor ride, Enterprise wheel, and Ferris wheel, spin the rider in circular motion either horizontally or vertically. NASA uses circular motion in a centrifuge to simulate the high g-forces on astronauts in flight. Medical equipment such as the centrifuge use circular motion principles to separate out components in test tubes.
Figure 3
78© 2015 The College Board

AP
PH
YS
ICS
1 INV
ES
TIG
AT
ION
SCircular Motion
Inquiry Overview This investigation is a guided inquiry in which students make measurements with a meterstick and use them to predict the period of a self-propelled mass, such as a flying airplane (or flying pig or cow), that moves like a conical pendulum. This is a new twist on what is a familiar lab (see “Circular Motion Studies with a Toy Airplane” in Supplemental Resources).
As part of their experimental design, students should also plan to make multiple measurements to determine or verify the relationship between the length of the pendulum and the angle the string makes with the vertical as the object executes circular motion. They can vary the length and plot graphs of period vs. length, speed vs. length, and angle vs. length, and compare the graphical results to the theoretical results derived using Newton’s second law.
Connections to the AP Physics 1 Curriculum Framework
Big Idea 3 The interactions of an object with other objects can be described
by forces.
Enduring Understanding Learning Objectives
3.B Classically, the acceleration of an object interacting with other
objects can be predicted
by using
a Fm= Σ
.
3.B.1.1 The student is able to predict the motion of an object subject to forces exerted by several objects using an application of Newton’s second law in a variety of physical situations with acceleration in one dimension. (Science Practice 6.4)
3.B.1.2 The student is able to design a plan to collect and analyze data for motion (static, constant, or accelerating) from force measurements and carry out an analysis to determine the relationship between the net force and the vector sum of the individual forces. (Science Practices 4.2 and 5.1)
3.B.2.1 The student is able to create and use free-body diagrams to analyze physical situations to solve problems with motion qualitatively and quantitatively. (Science Practices 1.1, 1.4, and 2.2)
3E A force exerted on an object can change the kinetic energy of the object.
3.E.1.3 The student is able to use force and velocity vectors to determine qualitatively or quantitatively the net force exerted on an object and qualitatively whether kinetic energy of that object would increase, decrease, or remain unchanged. (Science Practices 1.4 and 2.2)
© 2015 The College Board
79

AP
PH
YS
ICS
1 I
NV
ES
TIG
AT
ION
SAP Physics 1 Investigation 3
Big Idea 4 Interactions between systems can result in changes in those systems.
Enduring Understanding Learning Objectives
4.A The acceleration of the center of mass of a system is related to the net force exerted
on the system, where
a Fm= Σ
.
4.A.2.1: The student is able to make predictions about the motion of a system based on the fact that acceleration is equal to the change in velocity per unit time, and velocity is equal to the change in position per unit time. (Science Practice 6.4)
4.A.3.1: The student is able to apply Newton’s second law to systems to calculate the change in the center-of-mass velocity when an external force is exerted on the system. (Science Practices 2.2 and 5.1)
[note: In addition to those listed in the learning objectives above, Science Practice 4.3 is also addressed in this investigation.]
Skills and Practices Taught/Emphasized in This Investigation
Science Practices Activities
1.1 The student can create representations and models of natural or man-made phenomena and systems in the domain.
Students draw free-body diagrams of the object as it executes circular motion.
1.4 The student can use representations and models to analyze situations or solve problems qualitatively and quantitatively.
Students use the free-body diagram and Newton’s second law to write equations related to the motion of the object.
2.2 The student can apply mathematical routines to quantities that describe natural phenomena.
Students use equations derived from Newton’s second law to analyze the motion of the object.
4.2 The student can design a plan for collecting data to answer a particular scientific question.
Students design a plan to use only length measurements to predict the period of a conical pendulum.
4.3 The student can collect data to answer a particular scientific question.
Students make measurements of various lengths associated with the motion of the object as it moves in a circle.
5.1 The student can analyze data to identify patterns or relationships
Students apply mathematical routines to choose data that will allow them to predict the period of the object’s motion. Students analyze the uncertainty in their measurements and make adjustments to reduce these uncertainties where possible.
6.4 The student can make claims and predictions about natural phenomena based on scientific theories and models.
Students use Newton’s second law and length measurements to predict the period of an object moving in a circle.
[note: Students should be keeping artifacts (lab notebook, portfolio, etc.) that may be used as evidence when trying to get lab credit at some institutions.]
80© 2015 The College Board

AP
PH
YS
ICS
1 INV
ES
TIG
AT
ION
SCircular Motion
Equipment and Materials Per lab group (two to four students):
▶ Battery-operated toy airplane (or flying pig or cow — see Figure 4) with new 1.5-volt AA cells installed
▶ Meterstick
▶ Stopwatch (for verification only)
▶ (Optional) Extra sets of AA cells for the plane that have been drained so they are not at full operating potential difference. [note: The cells in the sets should be less than 1.5 V each under load, but each cell in the set of two should be at the same potential.]
▶ (Optional) Multimeter to test electric potential difference of each cell
[note: Ceiling-suspended, battery-operated airplanes (9-inch wingspan, two AA batteries required) can be obtained from The Physics Toolbox — see Supplemental Resources.]
Figure 4
Timing and Length of Investigation ▶ Teacher Preparation/Set-up: 15 minutes
The toys need to be suspended so they can execute circular motion — extend them from the ceiling or from a tall stick or pole. You should do this setup prior to the lab. [note: Strong hooked magnets can be attached to ceiling metal cross grids to support the swivel hook that comes with the flying toy. Avoid attaching the devices to the ceiling on or at the corners of light fixtures or on sprinkler system apparatus.]
▶ Prelab: 10 minutes
To demonstrate the conical pendulum, put students in groups and pose the problems to them.
© 2015 The College Board
81
AP
PH
YS
ICS
1 I
NV
ES
TIG
AT
ION
SAP Physics 1 Investigation 3
▶ Student Investigation: 45–60 minutes
Students design a plan to make measurements, and make the measurements and calculate the period.
▶ Postlab Discussion: 15–30 minutes
Students present their results, and share the method they used to predict the period.
▶ Total Time: 1.5–2 hours
Safety All general safety guidelines should be observed. In addition, some toy airplanes have small plastic propellers that rotate rapidly; students must take care to keep their fingers away from the propellers. Students should also not walk around too much to avoid getting hit in the head by a conical pendulum. Students should be wearing safety goggles on the off-chance that a string breaks.
To prevent students from climbing up on tables or chairs to change ceiling connections, it may be wise to preinstall multiple devices with new cells and with different lengths; then students can take multiple trials by simply moving to a different pendulum (assuming they all are constructed similarly).
Preparation and PrelabThis lab is best implemented at the end of the circular motion unit and used as a review. Students should already have solved many problems involving circular motion. They should be able to draw a free-body diagram and identify the radius of an object’s motion.
Demonstrate for students how to start the toy airplane flying in circular motion. All that remains after that is to present them with this task: using only a meterstick, make measurements that allow for calculation of the period of the plane’s motion. Students should not be shown the derivation above in the Background section; rather, they should be required to complete it themselves and decide what measurements to make.
The Investigation Students should work in groups of two to four. The number of students per group depends upon how many toy airplanes are available or the time available for groups to rotate through using the setup. Each group should have direct access to a device.
Each group designs and executes a plan for taking measurements with a meterstick to calculate the period of a conical pendulum. They then measure the period with a stopwatch and compare the stopwatch measurement to their prediction.
82© 2015 The College Board

AP
PH
YS
ICS
1 INV
ES
TIG
AT
ION
SCircular Motion
Some groups will start to measure before they have a plan. Some groups will ask if they can find the mass of the plane. They should not be allowed to use a balance to find the mass of the plane. If they can find the mass of the plane with only a meterstick (no other masses, etc.) then that’s fine, but the only measurement tool they are allowed is a meterstick.
Circulate among the groups and encourage students to draw a free-body diagram of the plane and use it to write some equations. Some groups will need more assistance than others. Most groups will measure the length of the pendulum (from pivot to center of object). Some groups will measure the radius of the circular motion (from center of circle to center of object); other groups will measure how far below the support point (ceiling) the circle is. Groups need to use this measurement to calculate the vertex angle of the conical pendulum (the angle the string makes with the vertical; see Figure 1). Encourage students to only run the plane when they are making measurements so the battery doesn’t run out too quickly — this will help maintain a constant speed for the plane during the experiment.
Once the students have completed their measurements and calculations, they share them with the rest of the class, perhaps using whiteboards or large sheets of paper, for a discussion related to methods of analysis.
ExtensionAn extension option is to provide students with AA cells that have different potential differences to power the planes, to first determine whether the potential difference affects speed. Then students can investigate how the speed affects the angle and the radius of the motion for a constant length of string supporting the plane.
Common Student ChallengesOne of the biggest problems students face with circular motion is the idea of centripetal force. Many students seem to think that a “magic” centripetal force is exerted on an object when it is in circular motion, and that the direction of this force is directed outward, not inward to the center of the circle. Students think this because they are confusing centripetal force with inertia. They think that if they were in a car making a fast turn and the door opened, they would be thrown out of the car. Thus, they believe there is a force related to circular motion directed to the outside of the circle.
It is important to emphasize that a force is an interaction between two objects and help students identify the object exerting the force toward the center of another object’s circular motion. Ask them to envision that to keep them in the car going around a circle, the door must exert an inward force, since their inertia would cause them to continue moving in a straight line. Trying to make an object, such as a basketball, roll in a circle by only tapping it with a meterstick will also emphasize in which direction the external force must act.
© 2015 The College Board
83

AP
PH
YS
ICS
1 I
NV
ES
TIG
AT
ION
SAP Physics 1 Investigation 3
Some teachers go so far as to tell students that there is no such thing as a centripetal force, just like there is no such thing as a down force. The word centripetal refers to a direction. Emphasize that some external force, such as the normal force, gravity, friction, or tension must act centripetally to allow an object to execute circular motion. An activity that will help students with this concept is as follows: students draw several free-body diagrams of objects in circular motion and then select (e.g., draw a circle around) the force or forces that act centripetally. In this particular lab, the centripetal direction is horizontally toward the center of the circle in which the plane is flying, so the horizontal component of the tension force is acting centripetally.
Students also need to be reminded, when making measurements of pendulum length (L) and radius of the circle (R) that the measurements should be made to the center of the moving object. Students often mistakenly take the length of a pendulum as the length of the string or chain supporting the object; however, the pendulum length is from pivot or connection to the center of mass of the pendulum/mass system. If the supporting chain or string has negligible mass, then the pendulum length is measured from the pivot to the center of mass of the object attached.
Analyzing ResultsAsk students to use a stopwatch and compare their calculated period (calculated using the length measurements) to a period measured directly with the stopwatch. They should compute a percent difference between the measured and calculated periods and describe how reasonable their results are. The “measured” period is what students measured with the stopwatch. This should be treated as the theoretical value in this case. The “calculated” period is the one derived from the distance measurements they made. This should be treated as the “experimental” value in their discussion of percent difference. Technically they are both measured values, but in calculating the percent difference, the period measured with the stopwatch has much less uncertainty, and thus can be used to approximate a true value for the period.
Encourage students to consider the uncertainties in their measurements. For example, if they measured the radius of the plane’s motion while it was moving, how precisely could they measure the radius? What is the uncertainty in each of their measurements? What do they think the total uncertainty is? Are their measured and calculated values the same within the limits of precision of their measurements? In other words, is the percent difference between the measured and calculated values less than the total uncertainty in their length measurements?
Students should also consider whether the speed of the plane was actually constant. Ask them how they might have noticed in their data that it wasn’t, and how that would affect their prediction.
84© 2015 The College Board

AP
PH
YS
ICS
1 INV
ES
TIG
AT
ION
SCircular Motion
Students then use the measurements of varying lengths to determine or verify the relationship between the length of the pendulum and the angle the string makes with the vertical, in order to determine the relationship between the length of the pendulum and the angle the string makes with the vertical as
the object executes circular motion. The equation derived above T R
g2 4 2
= πθtan
relates the radius to the period and the angle. The radius and length of string are related by R L= sinθ . Substitute this into the above equation and one
obtainsT Lg2 4 2
= π θcos .
Once students have contemplated these questions within their own groups, then the whole class has a discussion comparing the various groups’ methods and which methods were more precise than others. They also present their graphs for comparison and discussion.
Assessing Student Understanding After completing this investigation, students should be able to:
▶ Draw a free-body diagram of an object moving as a conical pendulum;
▶ Design a plan to make measurements to analyze the motion of a conical pendulum;
▶ Evaluate the uncertainties in the measurements of length made for a conical pendulum;
▶ Use Newton’s second law to analyze the motion of a conical pendulum;
▶ Predict the period of a conical pendulum using only length measurements;
▶ Calculate speed, period, and angle for various lengths; and
▶ Graph the relationships and compare them to Newton’s second law.
Assessing the Science Practices
Science Practice 1.1 The student can create representations and models of natural or man-made phenomena and systems in the domain.
Proficient Draws an accurate picture of the motion of a conical pendulum, and draws an accurate free-body diagram of the conical pendulum.
Nearly Proficient Draws an accurate free-body diagram of the conical pendulum but adds a fictitious centripetal force to the diagram.
On the Path to Proficiency
Draws an almost accurate free-body diagram with one or more additional forces that are incorrect.
An Attempt Draws an inaccurate free-body diagram of the conical pendulum.
© 2015 The College Board
85

AP
PH
YS
ICS
1 I
NV
ES
TIG
AT
ION
SAP Physics 1 Investigation 3
Science Practice 1.4 The student can use representations and models to analyze situations or solve problems qualitatively and quantitatively.
Proficient Makes no mistakes in using a free-body diagram to analyze the motion of a conical pendulum using Newton’s second law.
Nearly Proficient Makes minor mistakes in using the free-body diagram or picture to write equations to analyze the motion of a conical pendulum.
On the Path to Proficiency
Makes major mistakes in using Newton’s laws and the free-body diagram to analyze the conical pendulum.
An Attempt Unable to write equations using the free-body diagram.
Science Practice 2.2 The student can apply mathematical routines to quantities that describe natural phenomena.
Proficient Uses Newton’s second law to analyze the motion of a conical pendulum, using length measurements only to calculate period, speed, and angle.
Nearly Proficient Makes mostly correct calculations from equations; may confuse the use of sine and cosine.
On the Path to Proficiency
Makes some correct calculations from equations.
An Attempt Makes no correct calculations from equations.
Science Practice 4.2 The student can design a plan for collecting data to answer a particular scientific question.
Proficient Designs an accurate and appropriate plan to make length measurements to predict the period of a pendulum.
Nearly Proficient Follows directions and adds a design plan that is mostly complete, including diagrams and assumptions.
On the Path to Proficiency
Follows directions but does not clearly indicate a plan for experimental design and procedure.
An Attempt Misinterprets directions or does not indicate a plan for experimental design and procedure.
86© 2015 The College Board

AP
PH
YS
ICS
1 INV
ES
TIG
AT
ION
SCircular Motion
Science Practice 4.3 The student can collect data to answer a particular scientific question.
Proficient Collects accurate and appropriate length data from multiple trials using different lengths to predict the period of a conical pendulum.
Nearly Proficient Collects data that is missing a few minor pieces or is disorganized in its presentation. For example, doesn’t perform trials for multiple pendulum lengths.
On the Path to Proficiency
There are major gaps in the data collected, and the presentation lacks any organization.
An Attempt Collects inaccurate or incomplete data or doesn’t provide any organization for this data.
Science Practice 5.1 The student can analyze data to identify patterns or relationships.
Proficient Analyzes the uncertainties in the length measurements made and determines the uncertainty in the period calculated. Graphs the relationships from period, speed, and angle as functions of pendulum length and compares them to Newton’s second law.
Nearly Proficient Estimates uncertainties and calculates a total uncertainty without being clear on how to use this to evaluate the accuracy of the result.
On the Path to Proficiency
Estimates uncertainties in measurements but does not compute a total uncertainty or compare it to the percent difference.
An Attempt Cannot accurately evaluate the uncertainties in measurements.
Science Practice 6.4 The student can make claims and predictions about natural phenomena based on scientific theories and models.
Proficient Accurately predicts how changing the length of a conical pendulum will change the period of the pendulum and applies this prediction to changes in speed and angle.
Nearly Proficient Makes a minor mistake in the predictions about the motion of a conical pendulum.
On the Path to Proficiency
Makes only limited predictions about the motion of a conical pendulum.
An Attempt Cannot make accurate predictions about the motion of a conical pendulum.
© 2015 The College Board
87

AP
PH
YS
ICS
1 I
NV
ES
TIG
AT
ION
SAP Physics 1 Investigation 3
Supplemental Resources Butcher, Frank “Circular Motion Studies with a Toy Airplane.” The Physics Teacher 25, no. 9 (1987): 572–573.
“Circular Motion.” PBS LearningMedia. Accessed September 1, 2014. http://www.teachersdomain.org/resource/lsps07.sci.phys.maf.circmotion. [This website links to the circular motion videos available on the Rutgers PAER video website and also has background discussions, questions, and standard relations to circular motion. These can be used for a prelab demonstration to show that if an object is moving in a circle, there must be a force directed towards the center of the circle.]
“The Forbidden F-Word.” The Physics Classroom. Accessed September 1, 2014. http://www.physicsclassroom.com/class/circles/u6l1d.cfm. [This website provides some of the basics of circular motion that can easily be related to curves on roads and highways. The website provides some basic animations as well, and can be used for extensions where students go for further knowledge.]
“Ladybug Motion 2D.” PhET. University of Colorado Boulder. Accessed September 1, 2014. http://phet.colorado.edu/en/simulation/ladybug-motion-2d. [This simulation provides an interactive way to learn about position, velocity, and acceleration vectors.]
The Physics Toolbox. Accessed September 1, 2014. https://www.physicstoolboxinc.com/p-180-centripetal-force-airplane.aspx.
88© 2015 The College Board

AP
PH
YS
ICS
1 INV
ES
TIG
AT
ION
S
AP Physics 1 Investigation 4: Conservation of EnergyHow does the compression of a spring affect the motion of a cart?
Central Challenge In this investigation, students experiment with the concept of the conservation of energy by qualitatively investigating the relationship between elastic potential energy and gravitational potential energy. Students take a spring-loaded cart and release it so that it travels up a ramp. In addition to making observations and measurements, they make predictions as to what would happen if the angle of the ramp changed. Then, students experiment quantitatively with the relationship between the compression of the spring and the gravitational potential energy of the Earth-cart system. They do this by repeating measurements of the cart on the ramp for different compressions of the spring.
Background The gravitational potential energy (Ug) of an Earth-cart system can be calculated with the equation Ug mgy= . Total energy for a closed system is conserved and so the decrease in the spring potential energy (Uspring) is equal to the gain in the Ug as the cart moves up the incline.
Conservation of energy is the hallmark organizing principle in all sciences. As the total energy of a closed system remains constant, a loss of one form of energy must be equal to a gain in another form of energy. Potential energy of a system is due to the interactions and relative positions of its constituent objects. Energy transferred into or out of a system can change the kinetic, potential, and internal energies of the system. Energy transfers within a system can change the amount of kinetic energy in the system and the amount of potential and internal energy, or the amount of different types of potential energy. These transfers of energy can be seen in many instances: amusement parks, electric generators, fluid flow dynamics, and heating.
© 2015 The College Board
89

AP
PH
YS
ICS
1 I
NV
ES
TIG
AT
ION
SAP Physics 1 Investigation 4
Real-World Application In this lab, students find that the loss of spring potential energy is equal to the gain in kinetic energy of a cart. In turn, kinetic energy then decreases as the gravitational potential energy increases. Operators of trains and trucks use these principles for emergency stops. At the train station, a huge spring is compressed to bring the train to rest should the brakes fail. Similarly, a truck driver might use an uphill ramp on the side of a road to bring the truck to rest. In the case of the train, the loss in kinetic energy is equal to the gain in the spring potential energy. In the case of the truck, the loss in kinetic energy is equal to the gain in gravitational potential energy. In both cases, some energy is converted into thermal energy.
People seeking thrills jump off bridges secured by a bungee cord. In this case, the energy transformations include a loss of gravitational potential energy and a gain of kinetic energy. The kinetic energy then decreases and is accompanied by an increase in the spring potential energy. Once again, some energy is converted into thermal energy.
In designing amusement park or carnival rides, it is also necessary to apply the principle of conservation of mechanical energy. For example, to build a roller coaster one must accurately predict the speed at the top of a loop to insure that the ride is safe.
Inquiry Overview This investigation is divided into three different parts. Each part engages the student in guided-inquiry activities.
In Part I, a spring-loaded cart is placed on an incline and the cart’s motion is observed once the spring is released. Students design their own experiment to test how the angle of the ramp changes the motion of the cart for the same compression of the spring.
In Part II, students design their own experiment to determine how changes in the compression of the spring change the amount of increase of the gravitational potential energy of the Earth-cart system.
In Part III, students consider how to improve their experimental design to take into account overlooked aspects of the earlier experiments. As an extension, they can also begin a new experiment where the transfer of energy out of the Earth-cart system changes the compression of the spring.
90© 2015 The College Board

AP
PH
YS
ICS
1 INV
ES
TIG
AT
ION
SConservation of Energy
Connections to the AP Physics 1 Curriculum Framework
Big Idea 5 Changes that occur as a result of interactions are constrained
by conservation laws.
Enduring Understanding Learning Objectives
5.B The energy of a system is conserved.
5.B.3.1 The student is able to describe and make qualitative and/or quantitative predictions about everyday examples of systems with internal potential energy. (Science Practices 2.2, 6.4, and 7.2)
[note: In addition to those listed in the learning objective above, the following science practices are addressed in the various lab activities: 3.1, 4.1, 4.3, 4.4, 5.1, and 6.1.]
Skills and Practices Taught/ Emphasized in This Investigation
Science Practices Activities
2.2 The student can apply mathematical routines to quantities that describe natural phenomena.
Part II: Students find the mathematical relationship between the compression of the spring and the gain in gravitational potential energy. Since this is not a linear relationship, students need to find alternative means of graphing and analyzing the data to secure a linear relationship (i.e., plotting the square of the compression vs. the gain in Ug in the case of many data points).
Students with four data points or more should be able to show that the relation between compression of the spring and the energy the spring can provide a cart is not linear. They should also show that a quadratic relationship is supported by the data.
3.1 The student can pose scientific questions.
Part I: Students make observations of a cart going up a ramp and pose a question about how the angle of the incline will change the motion.
Part II: Students pose questions about the relationship between the compression of the spring and the gain in gravitational potential energy of the Earth-cart system.
4.1 The student can justify the selection of the kind of data needed to answer a particular scientific question.
Part II: Students decide how to measure the compression of the spring and the change in gravitational potential energy. They also decide on the number of trials required.
4.3 The student can collect data to answer a particular scientific question
Parts I, II, and III: Students collect data as they design their own experiments and/or engage in the different data collection activities.
© 2015 The College Board
91

AP
PH
YS
ICS
1 I
NV
ES
TIG
AT
ION
SAP Physics 1 Investigation 4
Science Practices Activities
4.4 The student can evaluate sources of data to answer a particular scientific question.
Part III: Students consider the role that friction played in their experimental design and data collection.
5.1 The student can analyze data to identify patterns or relationships
Part II: Students decide if their data better fits a linear model or a quadratic model.
6.1 The student can justify claims with evidence.
Part I: Students create a claim regarding the motion of the cart up different inclines (e.g., more time, more distance, more speed, more height) and then use their experimental evidence to support or refute their claim.
6.4 The student can make claims and predictions about natural phenomena based on scientific theories and models.
Part I: Although a cart on a steeper slope will travel at a different acceleration, a different distance, and for a different elapsed time, the Earth-cart system will gain an identical amount of Ug. This allows students to use the theory of conservation of energy to make claims and predictions about the investigation.
7.2 The student can connect concepts in and across domain(s) to generalize or extrapolate in and/or across enduring understandings and/or big ideas.
Part II: The relationship between the compression of the spring and the gain in height leads to an understanding of the conservation of energy where the compression of the spring is related to the spring potential energy and the gain in height corresponds to a gain in gravitational potential energy.
Part III: The conservation of energy principle (an enduring understanding) does not result in constant total energy in this experiment. Students recognize that this is due to the fact that the system is not closed since there are losses of energy due to friction.
[note: Students should be keeping artifacts (lab notebook, portfolio, etc.) that may be used as evidence when trying to get lab credit at some institutions.]
Equipment and Materials Per lab group:
▶ Low-friction dynamics cart with spring bumper (or spring-loaded plunger cart)
▶ Ramp
▶ Meterstick
▶ Stopwatch
▶ Assorted masses
▶ Books or blocks (to create incline)
▶ Poster-size whiteboards for sharing group work
92© 2015 The College Board

AP
PH
YS
ICS
1 INV
ES
TIG
AT
ION
SConservation of Energy
Timing and Length of Investigation▶ Teacher Preparation/Set-up: 10–15 minutes
▶ Part I:
Student Investigation: 20 minutes (this includes prelab time)
Postlab Discussion: 20 minutes (allow 5–10 minutes per group)
▶ Part II:
Prelab: 10–15 minutes
Student Investigation: 40 minutes
Postlab Discussion: 40 minutes (or allow 5–10 minutes per group)
▶ Part III:
Prelab: 15 minutes
Student Investigation (procedural time to repeat experiments): 30 minutes
Postlab Discussion: 20 minutes
▶ Total Time: approximately 3.5 hours
Safety Remind students that the carts should not be on the floor where someone could slip on one. They should also consider how the spring-loaded cart could hurt someone if the plunger released near the body, especially the eye. All general lab safety guidelines should always be observed.
Preparation and Prelab Part I of this investigation serves to determine students’ prior knowledge regarding the change in the gravitational potential energy of the Earth-cart system. This then serves as the prelab for Part II.
The Investigation
Part I: Introducing the Apparatus and Experimental Design
Introduce this part of the investigation by setting up a demonstration with a spring-loaded cart on an inclined ramp (see Figure 1). Release the cart and have the students observe the motion.
© 2015 The College Board
93

AP
PH
YS
ICS
1 I
NV
ES
TIG
AT
ION
SAP Physics 1 Investigation 4
Figure 1
Prompt students: If the cart were to be shot up a steeper vs. shallower ramp, describe how its motion will change.
[note:] You should not ask how the height changes, since that limits your ability to find out everything that a student is thinking about concerning the change. Expect some students to focus on greater height, greater distance, or greater time. Others may say that the cart will go a different amount up the slope or that it reaches the same height, and still others may say that it will take more or less time to reach the top. All are suitable responses, and all can be developed into experimental designs.
guide students: Instruct students to first make and justify their predictions individually, have them discuss those predictions in small groups, and then have a whole-class discussion (do NOT reveal the “right” answer). Next, have students design an experiment with the cart and ramp to investigate the question above. Each group should discuss their design and findings, and prepare to present them to the class (individual poster-size whiteboards are great for this). As a whole class, discuss the results. If there was enough friction that it affected the results, you may need to bring it into the discussion here. If there was negligible friction, the final height achieved would be the same in either case. However, since the distance travelled to reach the same height is larger on the smaller angle ramp, friction usually means it will not go as high. If not careful, students will use this observation to support the wrong conclusion.
In reviewing the experimental design, you should discuss whether multiple measurements should have been made for each angle and, if so, how many measurements would be sufficient. Ask students if one angle change was sufficient or if multiple angle changes should have been made.
If this did not come up in the class discussions, in reviewing the experimental designs and results, raise the question of the role of friction in the experiment. If there was much more friction, how would the results have changed?
Part II: Applying the Principle of Conservation of Energy
In this part of the investigation, students explore their understanding of energy and energy conservation.
94© 2015 The College Board

AP
PH
YS
ICS
1 INV
ES
TIG
AT
ION
SConservation of Energy
background: Traditionally, students have learned that the principle of conservation of energy states that energy can neither be created nor destroyed, and the total energy of a closed system remains constant. They should have also learned that the gravitational potential energy of the Earth-cart system can be calculated with the equation Ug mgy= . Remind them that if energy is indeed conserved, then the work on the spring from compressing it must give it some spring potential energy (Uspring).
Energy exists in the compression of the spring (spring potential energy [Uspring]), in the movement of the cart (kinetic energy [K]), and in the Earth-cart system (gravitational potential energy [Ug]).
ask students: As a way of testing student understanding of this principle for this part of the investigation, have students answer the following questions:
For each of the following four locations of the cart shown in Figure 2, what is the magnitude of the Uspring, K, and Ug at that location? Specifically, which is large, which is small, and which is zero?
Location 1: Cart is next to fully compressed spring
Location 2: Spring is no longer compressed; cart is slightly in front of spring
Location 3: Cart is halfway up the ramp
Location 4: Cart is at peak distance along the ramp
Figure 2
The students should recognize that the Uspring must then be equal to the Ug of the Earth-cart system after the cart gets to its peak position and no longer has any kinetic energy (K). Ask them if these statements are consistent with what they found in Part I of the investigation and to explain how they are or are not. If friction were eliminated, would the new expected experimental results be consistent with this energy explanation?
guide students: Introduce this part of the investigation by repeating the demonstration with a spring-loaded dynamics cart on an inclined ramp. Release the cart and have students observe the motion. Describe to the students that we can change the Uspring by compressing the spring different amounts. Some apparatus allow two possible compressions, while others allow for more possible compressions.
© 2015 The College Board
95

AP
PH
YS
ICS
1 I
NV
ES
TIG
AT
ION
SAP Physics 1 Investigation 4
Ask students to design an experiment to investigate how the energy (Uspring) stored in the spring depends on the distance by which it is compressed. Specifically, if you increase the compression by a factor of 2, what happens to the Uspring?
Part II (A): Qualitative Investigation of Potential Energy
Instruct students to design an experiment to qualitatively describe the relationship between compression of the spring and the gravitational potential energy. Students should be prepared to present a convincing argument and defend their results. Again, have small groups create a presentation to be shared with the whole class (individual poster-size whiteboards work well).
Part II (B): Quantitative Investigation of Potential Energy
Instruct students to design an experiment in which they collect data in order to quantitatively support their claim. Students should complete their experiment and share their results with the class.
Part III: Improving the Experimental Design
There are a number of potential experimental errors. If students did not take these into account as they conducted their experiments in Part II, they should now consider the following:
1. What role does friction play in the experiment? How can you minimize or take into account the frictional effects?
2. If the spring could only be compressed by two values (or if the spring could be compressed for multiple values), how would your experiment change?
3. How does the amount of compression of the plunger change the manner in which you measure the distance the cart moved and/or the maximum height?
Extension There are a number of possible extensions to this investigation that students can choose from as well as extensions they can create on their own, including:
1. How would the results change if the angle of the ramp were to change?
2. Should the experiment be done at multiple angles?
3. Which angle produces the most reliable results?
4. Do the wheels have an impact on the experimental results? Would the experiment work better with large wheels or small wheels?
5. Does the mass of the cart affect the experimental results? Which mass car would produce the most reliable results?
A more complex extension would be to have the cart descend the ramp and hit the spring. With this setup, students can investigate how much the spring compresses. They can also investigate at which point the cart is traveling the fastest.
96© 2015 The College Board

AP
PH
YS
ICS
1 INV
ES
TIG
AT
ION
SConservation of Energy
Common Student Challenges
Part I:Students should observe that changing the angle of the ramp will change the distance traveled, the acceleration of the cart, and the elapsed time to reach the top. They then design a way to accurately measure the distances the cart travels since the cart is only at its peak for a moment. Changing the angle will not have a large effect on the height above the ground that the cart reaches. It will not be obvious to many students why the most important variable is the one variable (height) that does not change, or why it does not change.
Part II:Since Part I should confirm that the gravitational potential energy gained by the Earth-cart system was always the same for the same compression, students should be comfortable with using the final gravitational potential energy as the quantity for the initial elastic potential energy. As students vary the compression distance, the observation should be that the cart’s final height is directly related to the compression; however, the relationship will not be linear. If students have only two possible compressions, they should try to look for a mathematical pattern with the two data points (linear or not linear). If there are multiple compressions permitted with the apparatus, then students should make a graph and find that it is not linear.
Analyzing Results
Part I:Having students report on large individual whiteboards is ideal. Since this investigation is qualitative in nature, students need only present their general findings. As small groups present, be sure to call particular attention to the presentations that include convincing data (especially graphic data). There are a number of variables that could have been studied (e.g., velocity, distance traveled, height attained, and elapsed time). If these have not been investigated by any group, ask them for their predictions and an explanation for that prediction.
If no team chose to investigate the height attained (and you did not encourage a team that identified height as a variable to measure it), then it will be necessary to have them do so now. Some students may wonder why you did not just tell them at the outset that height is the important variable instead of letting them “waste time” on variables that, in effect, are not as helpful. But doing so would have prevented you from being able to tap into students’ sense of what variables matter and what should determine their design of the experiment; it might also have misled them into thinking that their variables were just as valuable as height attained. Telling students which variables to study limits the inquiry-based methodology being encouraged.
© 2015 The College Board
97

AP
PH
YS
ICS
1 I
NV
ES
TIG
AT
ION
SAP Physics 1 Investigation 4
In reviewing the experimental design and results, you should once again discuss whether multiple measurements should have been made for each angle and, if so, how many measurements would be sufficient. You should also ask if one angle change was sufficient or if multiple angle changes should have been made.
At this point you should also raise the question of the role of friction in the experiment: if there was much more friction, how would the results have changed?
Part II:If the apparatus has only two settings for the spring compression, that will prevent a graph from being useful. Students can still investigate if twice the compression changes the Ug by a factor of 2 or more than 2. If the apparatus allows for multiple spring compressions, then students should consider the value of making a graph.
Students should create a presentation that will provide a convincing argument supporting their findings. Have students present and discuss what was observed. Each presentation should be followed by questions from the other groups challenging the experimental technique and asking how different factors were taken into account. Encourage students to come up with alternative interpretations of the data. While the whiteboard is useful for displaying procedure, data, and graphs in a way that can be easily shared, students should use a graphing program (calculator or computer software) to evaluate the trend-line; and if linear, include the equation of the line with their graph.
Students should include enough detail so that other groups could perform their experiment. This includes the mass of the cart, description of the ramp, measurement of the angle of the ramp, and description of how the compression of the spring and the final height (for Ug calculation) were measured.
When the compression distance is varied, students should observe that height increases, but the relationship is not linear, as shown in Graph 1. This function behaves as y = x2, so plotting the compression distance squared vs. the gravitational potential energy will yield a linear relationship.
98© 2015 The College Board

AP
PH
YS
ICS
1 INV
ES
TIG
AT
ION
SConservation of Energy
U = 50x2
0
0.02
0.04
0.06
0.08
0.1
0.12
0.14
0 0.01 0.02 0.03 0.04 0.05 0.06
Gra
vita
tiona
l Pot
entia
l Ene
rgy
(J)
Compression distance (m)
Graph 1: Gravitational Potential Energy vs. Compression Distance
An example of how to graph the compression distance vs. cart height is shown above in Graph 1, and an example of how the linearized data would appear is shown below in Graph 2:
0
0.02
0.04
0.06
0.08
0.1
0.12
0.14
0 0.0005 0.001 0.0015 0.002 0.0025 0.003
U = 50x2
Gra
vita
tiona
l Pot
entia
l Ene
rgy
(J)
(Compression Distance)2
Graph 2: Gravitational Potential Energy vs. (Compression Distance)2
Students more familiar with approaches to making a graph linear may choose to make a log-log plot of the gravitational potential energy vs. the compression distance. They will find that the log-log plot is linear and the slope is equal to 2, which can be interpreted as the quadratic relationship. You will have to decide whether graphs should be completed by hand or by using a computer (spreadsheet or graphing program) or calculator.
© 2015 The College Board
99

AP
PH
YS
ICS
1 I
NV
ES
TIG
AT
ION
SAP Physics 1 Investigation 4
With fewer than four data points, it is not possible to disprove a linear relationship graphically. With few data points, even if more than four, the graphs may not reveal the relationship that gravitational potential energy is proportional to the square of the compression distance. This can lead you to have the students investigate the uncertainties inherent in each of their measurements. What is the uncertainty in your measurement of height? How does this lead to uncertainty in the calculation of gravitational potential energy? Similarly, what is the uncertainty in the measurement of the spring compression?
Part III:This part speaks to subtleties in the interpretation of experimental results. As extensions, students can perform additional experiments and/or explain how they would respond to these questions and/or how they would design experiments to test them.
Students should record the final product of the experiments in either their lab journal, portfolio, or on a whiteboard display. Have students examine the best examples and give an opportunity to move around the room and record the general procedure, data and graph, and discuss the results.
Assessing Student Understanding
Part I:After completing this part of the investigation, students should be able to make the following statement regarding the transfer of energy from the spring to the cart:
For a given compression of the spring, the energy transferred from the spring to the Earth-cart system produced a consistent height traveled by the cart regardless of the angle of the incline.
Part II:Given a reminder about the calculation of Ug and the assumption that energy is conserved, students should be able to explain the energy decrease in the spring was equal to the energy gain by the Earth-cart system. After completing this part of the investigation, students should be able to make the following statements regarding the transfer of energy from the spring to the cart:
▶ When the compression of the spring is increased, the resulting height traveled by the cart increases nonlinearly.
▶ A doubling of the compression more than doubled the maximum height of the cart.
Students should be able to conclude that it is a quadratic relationship. They should be able to recognize that compressing the spring changed the value of the spring’s potential energy (Uspring). Students should also see that a quadratic relationship between spring compression and Uspring could account for the experimental results.
100© 2015 The College Board

AP
PH
YS
ICS
1 INV
ES
TIG
AT
ION
SConservation of Energy
Assessing the Science Practices
Science Practice 2.2 The student can apply mathematical routines to quantities that describe natural phenomena.
Proficient Using multiple data points, creates a new graph of the square of the compression vs. the gain in Ug, and determines the equation for this straight line as well as the significance of the slope and y-intercept.
Using only two data points (due to limitations of the apparatus), illustrates that the relationship between compression of the spring and the energy the spring can provide a cart is not linear.
Calculates the Uspring and the Ug from the data.
Nearly Proficient Using multiple data points, creates a new graph of the square of the compression vs. the gain in Ug and determines the equation for this straight line.
Using only two data points (due to limitations of the apparatus), illustrates that the relationship between compression of the spring and the energy the spring can provide a cart is not linear.
Calculates the Uspring and the Ug from the data.
On the Path to Proficiency
Using multiple data points, graphs the compression vs. the gain in Ug and determines that it is not linear.
Using only two data points (due to limitations of the apparatus), illustrates that the relationship between compression of the spring and the energy the spring can provide a cart is not linear; several errors may be present in the illustration.
Identifies the values needed to calculate the Uspring and the Ug from the data; attempted calculations contain several errors.
An Attempt Using a few data points, graphs the compression vs. the gain in Ug.
Using only two data points (due to limitations of the apparatus), illustrates that an increase in the compression of the spring increases the energy the spring can provide a cart; several errors may be present in the illustration.
Explains the quantities expressed by variables in the equation; no calculations of Uspring and Ug are attempted.
© 2015 The College Board
101

AP
PH
YS
ICS
1 I
NV
ES
TIG
AT
ION
SAP Physics 1 Investigation 4
Science Practice 3.1 The student can pose scientific questions.
Proficient Makes a claim regarding angle size and distance traveled, and provides a quantitative estimate for its justification.
Makes a quantitative statement about the ratio of the compression of the spring, Ug, and the measured height.
Poses scientific questions based on the translation of their claims and quantitative statements.
Nearly Proficient Makes a claim regarding angle size and distance traveled.
Makes a quantitative statement about the ratio of the compression of the spring, Ug, and the measured height; the statement contains minor errors.
Poses scientific questions based on a claim or quantitative statement.
On the Path to Proficiency
Makes a claim regarding angle size and distance traveled, but several errors are present.
Makes a statement regarding an increase in the spring compression and the increase in gravitational potential energy.
Poses scientific questions based on a claim.
An Attempt Makes an incomplete claim regarding angle size and distance traveled; major errors are present.
Attempts to identify the relationship between the compression of the spring and how it may affect the height that the cart attains; several errors in logic are present.
Science Practice 4.1 The student can justify the selection of the kind of data needed to answer a particular scientific question.
Proficient Demonstrates how to best measure the compression of the spring and the change in gravitational potential energy, and provides justification for measuring each.
Explains why at least three trials should be taken for each compression of the spring and how more will be needed if the data has too much spread.
Nearly Proficient Demonstrates how to best measure the compression of the spring and the change in gravitational potential energy.
Explains why at least three trials should be taken for each compression of the spring.
On the Path to Proficiency
Identifies that measurements of the compression of the spring must be made along with the change in gravitational potential energy.
Explains why multiple trials and measurement readings are made.
An Attempt Describes the type of data being collected.
102© 2015 The College Board

AP
PH
YS
ICS
1 INV
ES
TIG
AT
ION
SConservation of Energy
Science Practice 4.4 The student can evaluate sources of data to answer a particular scientific question.
Proficient Identifies and describes that the transfer of energy is due to the work done by frictional forces.
Explains how the results would differ if friction were somehow eliminated.
Describes the relationship between friction and the energy considerations of the experimental design.
Nearly Proficient Identifies that the transfer of energy is due to the work done by frictional forces.
Explains how the results would differ if friction were somehow eliminated.
On the Path to Proficiency
Articulates that there is a transfer of energy.
Describes the impact of friction on the data.
An Attempt Makes a statement regarding the presence of friction; some errors may be present.
Science Practice 5.1 The student can analyze data to identify patterns or relationships.
Proficient Demonstrates that the data are not linear and that a change of axes could produce a linear relationship.
Observes the graph to be quadratic and draws a new graph with the square of the compression distance on the x-axis. Using the regression line, writes an equation (for this line) and determines the spring constant. Demonstrates how a quadratic relationship is supported by the data.
Nearly Proficient Observes that the data are not linear and that a change of axes could produce a linear relationship.
Observes the graph to be quadratic and draws a new graph with the square of the compression distance on the x-axis. Draws the regression line.
On the Path to Proficiency
Observes that the data are not linear and that a change of axes could produce a linear relationship.
An Attempt Observes that the data are not linear but cannot demonstrate why.
© 2015 The College Board
103

AP
PH
YS
ICS
1 I
NV
ES
TIG
AT
ION
SAP Physics 1 Investigation 4
Science Practice 6.1 The student can justify claims with evidence.
Proficient Makes a claim regarding the motion of the cart up different inclines, and provides experimental evidence and reasoning to support or refute the claim; the evidence is based on experimental data; the reasoning includes the concepts of energy transfer and the role of frictional forces.
Nearly Proficient Makes a claim regarding the motion of the cart up different inclines, and provides experimental evidence and reasoning to support or refute the claim; the evidence is based on experimental data; minor errors are present.
On the Path to Proficiency
Makes a claim but provides insufficient evidence; the evidence is based on a statement referring to possible data.
An Attempt Makes a claim.
Science Practice 6.4 The student can make claims and predictions about natural phenomena based on scientific theories and models.
Proficient Applies the conservation of energy, and explains how the spring’s compression can be used to calculate the spring potential energy.
Uses the height the cart attains to calculate the gravitational potential energy from the data.
Nearly Proficient Defines the principle of conservation of energy, and explains how the spring’s compression can be used to calculate the spring potential energy.
Identifies that the height the cart attains can be used to calculate the gravitational potential energy from the data; calculations are attempted with several errors.
On the Path to Proficiency
States the principle of conservation of energy, and identifies that the spring’s compression is one measure of energy and that the height the cart attains represents the gravitational potential energy from the data.
An Attempt States the principle of the conservation of energy with minor errors, and identifies that spring potential energy and gravitational potential energy are both present in the system.
104© 2015 The College Board

AP
PH
YS
ICS
1 INV
ES
TIG
AT
ION
SConservation of Energy
Science Practice 7.2 The student can connect concepts in and across domain(s) to generalize or extrapolate in and/or across enduring understandings and/or big ideas.
Proficient Connects the concepts of spring potential energy, the kinetic energy, and the gravitational potential energy to the big idea of conservation of energy.
Tracks the total energy, the spring potential energy, the kinetic energy, and the gravitational potential energy at all points on the incline.
Explains where energy losses occur and/or what energy has not been accounted for in the experiment.
Provides upper limits to the loss of energy, and makes reasonable predictions of how the system would behave if the frictional forces were eliminated.
Nearly Proficient Connects the concepts of spring potential energy, the kinetic energy, and the gravitational potential energy to the big idea of conservation of energy.
Tracks the total energy, the spring potential energy, the kinetic energy, and the gravitational potential energy at many of the points on the incline with minor errors.
Explains where energy losses occur and/or what energy has not been accounted for in the experiment.
On the Path to Proficiency
Connects the concepts of spring potential energy, the kinetic energy, and the gravitational potential energy to the big idea of conservation of energy with minor errors. States where each energy is a maximum.
Describes the sources of energy losses.
An Attempt Articulates the relationship that exists between spring potential energy, kinetic energy, and gravitational potential energy with several errors in logic.
Identifies that energy losses occur.
Supplemental Resources“Elastic Potential Energy.” HyperPhysics. Georgia State University. Accessed September 1, 2014. http://hyperphysics.phy-astr.gsu.edu/hbase/pespr.html. [This website provides a basic explanation of the energy stored in a spring.]
Froehle, Peter, and Charles H. Miller. “Student Misconceptions and the Conservation of Energy.” The Physics Teacher 50, no. 6 (2012): 367–368.
“Gravitational Potential Energy.” Zona Land Education. Accessed September 1, 2014. http://zonalandeducation.com/mstm/physics/mechanics/energy/gravitationalPotentialEnergy/gravitationalPotentialEnergy.html. [This website provides a good definition of gravitational potential energy. It shows a basic derivation of the equation from work. There are also sample problems to solve.]
“Potential Energy.” The Physics Classroom. Accessed September 1, 2014. http://www.physicsclassroom.com/class/energy/u5l1b.cfm. [This website outlines many applications of the conservation of energy.]
© 2015 The College Board
105

This page is intentionally left blank.

AP
PH
YS
ICS
1 INV
ES
TIG
AT
ION
S
AP Physics 1 Investigation 5: Impulse and MomentumHow are force and impulse related to linear momentum and conservation of momentum?
Central Challenge In this multipart investigation, students investigate concepts of impulse and momentum both qualitatively and quantitatively. After they explore the basic concepts of momentum, they gather the data needed to calculate changes in momentum and impulse, make predictions about motions of objects before and after interactions, and determine whether momentum is conserved.
BackgroundLinear momentum describes the translational motion or motion of the center of mass of an object or system in terms of its mass and velocity (
p mv= ). Momentum is a vector quantity that has the same direction as the velocity. A net external force exerted on a body or system will change its momentum; this change in momentum is called impulse (Dp). The rate of impulse, or impulse divided by time of interaction, is equal to the net force exerted on the object or system. Newton’s third law of motion, then, arises from the conservation of momentum and describes interactions in terms of impulse and force: the impulse one object or system exerts on another is equal in magnitude and opposite in direction to the impulse the second object or system exerts on the first object or system.
F pt
= DD
The area between the plot line and the x-axis for a graph of force exerted on an object as a function of time is the change in momentum of the object. For example, if a force is exerted by a tennis racket while serving a tennis ball, the force exerted by the racket on the ball is forward, and the increase in momentum of the ball is also forward. The force exerted by the ball on the racket is equal in magnitude to the force exerted by the racket on the ball, and the impulse delivered by the ball to the racket is equal and opposite to the impulse delivered by the racket to the ball.
© 2015 The College Board
107

AP
PH
YS
ICS
1 I
NV
ES
TIG
AT
ION
SAP Physics 1 Investigation 5
In Graph 1 below, the area between the graph line and the time axis (a triangular shape here) represents the change in momentum (Dp) of the object on which the force is exerted. If this area is divided by the mass (m) of the object, the change in velocity (Dv ) of the object can be determined.
0 0.0005
For
ce, F
(N
)
0
2000
4000
6000
8000
0.001 0.0015
Time, t (s)
Force versus Time
Graph 1
Linear momentum is always conserved. This means that if no net external force is exerted on the system, the linear momentum of the system cannot change. So, total linear momentum of objects within a system prior to an interaction of those objects is equal to the total linear momentum of the objects after the interaction when there is no external force acting on the system during the interaction. For example, if two carts on a level, frictionless track collide, the total momentum of both carts prior to the collision (
1 1 2 2+m v m vo o o o) is equal to the total momentum of both carts after the collision (
1 1 2 2+m v m vf f f f ). In isolated collisions, momentum is constant and if the collision is elastic, kinetic energy is also restored, so that the final is equal to the initial for momentum and kinetic energy.
Real-World Application Sports provide a lot of real-world applications regarding momentum and impulse. In boxing or karate you can talk about the differences between a quick jab, which produces a large change in momentum over a short time and so a large force, or a follow-through punch, which may deliver the same change in momentum, but over a longer time so a smaller force. In baseball, you can talk about how the bat changes the momentum of the ball.
Seatbelts and airbags are designed to increase the amount of time it takes a body to stop, thus decreasing the amount of force exerted on a body by the car, since the impulse exerted on a body is always equal to its change in momentum. Similarly, crumple zones in cars are also designed to increase the amount of time over which a collision occurs, thus reducing the amount of force being exerted on objects as they come into contact during the collision.
Inquiry Overview In this lab students first pursue a qualitative examination of interactions between objects, making predictions and observations about the motions of objects before and after interactions in response to these three questions:
▶ How do forces exerted on an object by another object change the linear momentum of the object?
108© 2015 The College Board

AP
PH
YS
ICS
1 INV
ES
TIG
AT
ION
SImpulse and Momentum
▶ What is impulse?
▶ How are force and impulse related to conservation of linear momentum?
Depending on equipment selected (or available), students design their investigations to include collisions of two moving carts of equal and of unequal mass — both elastically and inelastically. If possible, they include an “explosion” where two carts connected by a spring and at rest are released so that the carts move apart. They use the terminology that includes linear momentum, force, impulse, and conservation of momentum to write their observations. They then share those observations with the larger group, refining their descriptions in readiness for the quantitative part of the lab.
The quantitative portion of the lab is guided inquiry, where the teacher provides the recommended equipment and sets some parameters, such as providing the purpose and setting the requirement that the analysis should include at least one graph. Students then meet in small working groups to decide how to gather and record data for the same situations they have observed qualitatively. Students decide how to make the necessary measurements of the speeds of the carts, set experimental controls, and process the data in order to answer the central question: How are force and impulse related to linear momentum and conservation of linear momentum?
Connections to the AP Physics 1 Curriculum Framework
Big Idea 5 Changes that occur as a result of interactions are constrained by
conservation laws.
Enduring Understanding Learning Objectives
5.D The linear momentum of a system is conserved.
5.D.1.1 The student is able to make qualitative predictions about natural phenomena based on conservation of linear momentum and restoration of kinetic energy in elastic collisions. (Science Practices 6.4 and 7.2)
5.D.1.6 The student is able to make predictions of the dynamical properties of a system undergoing a collision by application of the principle of linear momentum conservation and the principle of the conservation of energy in situations in which an elastic collision may also be assumed. (Science Practice 6.4)
5.D.2.1 The student is able to qualitatively predict, in terms of linear momentum and kinetic energy, how the outcome of a collision between two objects changes depending on whether the collision is elastic or inelastic. (Science Practices 6.4 and 7.2)
5.D.2.4 The student is able to analyze data that verify conservation of momentum in collisions with and without an external friction force. (Science Practices 4.1, 4.2, 4.4, 5.1, and 5.3)
[note: In addition to those listed in the learning objectives above, Science Practice 4.3 is also addressed in this investigation.]
© 2015 The College Board
109

AP
PH
YS
ICS
1 I
NV
ES
TIG
AT
ION
SAP Physics 1 Investigation 5
Skills and Practices Taught/ Emphasized in This Investigation
Science Practices Activity
4.1 The student can justify the selection of the kind of data needed to answer a particular scientific question.
Students meet in advance of the experiment to determine the data they need to collect in order to calculate change in momentum and impulse. They also decide what data they need to determine whether linear momentum is conserved. They may decide, for example, to collide carts moving on a track, measuring cart velocities before and after the collision and measuring the carts’ masses to determine change in momentum in order to determine impulse.
4.2 The student can design a plan for collecting data to answer a particular scientific question.
Students make decisions in their small working groups about how to conduct the experiment to gather the necessary data to answer the question. They decide how many trials are appropriate and the method(s) they will use to gather data. For example, students may decide to use motion sensors at each end of the track to record and plot velocities.
4.3 The student can collect data to answer a particular scientific question.
Students collect the data they have determined they need, using the collection method(s) available to them. If motion sensors are available, students may decide to use them to plot velocities. If a camera and computer analysis tools are available, they may use this method to find velocities and changes in velocity. In the absence of these tools, students may need to use distance–time measurements to directly calculate velocities.
4.4 The student can evaluate sources of data to answer a particular scientific question
From the results of their experiment, students may compare momenta before and after a collision, with the goal of demonstrating that linear momentum is conserved. If the results are different, students examine sources of uncertainty in the experiment. For example, if momentum seems to have been lost or gained due to the collision, students may consider how carefully they derived values from motion sensor graphs or may re-evaluate whether friction played a role in exerting an external force on the system.
5.1 The student can analyze data to identify patterns or relationships.
In the quantitative portion of this lab, students answer the experimental questions by calculating impulse, force, changes in momentum, and whether momentum is constant for the system. They also determine what data can be used to create a plot that reveals meaningful results. If they have used motion sensors or video analysis, they have to use the velocity–time plots to determine changes in momentum and to assign correct signs to the quantities measured, based on direction of motion.
5.3 The student can evaluate the evidence provided by data sets in relation to a particular scientific question.
After calculating and graphing data, students compare results to predictions to determine whether the data produced reasonable results. For example, in making calculations related to conservation of momentum, students need to decide whether differences between original and final momentum are within reasonable limits and uncertainties to conclude that momentum is constant.
110© 2015 The College Board

AP
PH
YS
ICS
1 INV
ES
TIG
AT
ION
SImpulse and Momentum
6.4 The student can make claims and predictions about natural phenomena based on scientific theories and models.
From the qualitative portion of the lab, students gather observations and are introduced to terminology that they will use to make predictions about results from the quantitative portion. They then evaluate their predictions, comparing the qualitative data to their predictions.
7.2 The student can connect concepts in and across domain(s) to generalize or extrapolate in and/or across enduring understandings and/or big ideas.
In the final analysis, students should extrapolate their findings to other experiments that might be performed to gather further data. As a required part of each analysis they also discuss practical applications of the lab. For example, students might decide to discuss how the collision of carts on a track reveals information about how cars collide on a road, particles collide in a cloud chamber, or meteorites collide with planets.
[note: Students should be keeping artifacts (lab notebook, portfolio, etc.) that may be used as evidence when trying to get lab credit at some institutions.]
Equipment and Materials Per lab group (three to five students):
▶ Two spring-loaded carts
▶ Track
▶ Bubble level
▶ Known calibrated masses (three to four per station, in the range of 200–500 g) and at least two objects with unknown mass (also in the range of 200–500 g)
▶ Calculator
▶ Meterstick
▶ Stopwatch
▶ Computer with Internet access
▶ (Optional) Video camera and analysis software
▶ (Optional) Force sensor
▶ (Optional) Motion sensor with calculator or computer interface
Most schools have access to spring-loaded carts, but a simple substitution can be contrived using any two similar objects with wheels on a track or level surface. The wheeled carts can be launched by constructing a rubber band launcher (similar to a sling shot) at each end of the track area. By pulling each cart back and releasing, the carts will move toward each other and collide. Moving carts on an air track will also work for this experiment.
© 2015 The College Board
111

AP
PH
YS
ICS
1 I
NV
ES
TIG
AT
ION
SAP Physics 1 Investigation 5
Timing and Length of Investigation▶ Teacher Preparation/Set-up: 15 minutes
Setting up the equipment for Parts I–III should take about 15 minutes.
▶ Student Investigation: 70 minutes
Prelab should take under 5 minutes if you choose to talk about each section of the lab individually. You can have students work on the entire lab and turn it in when completed, at which time it will take about 10 minutes to go over the lab, or you can have them all work on Part I, then stop, discuss it, and move on to Parts II and III.
Part I: 10 minutes (Qualitative Construction of Momentum)
Part II: 30 minutes (Collisions of Carts)
Part III: 20 minutes (Explosions of Carts)
▶ Postlab Discussion: 25 minutes
Student presentation time after Part I (the qualitative section) should take about 25 minutes. If you have eight groups, each group should have about 2–5 minutes to present their findings. After Parts II and III, the postlab presentation of results might take about the same: 2–5 minutes per group. It will most likely be necessary to split the lab up over two or three days, at which time Part I and the postlab discussion might take one full class period, and Parts II and III could be done the next day with their presentations on the third day.
▶ Total Time: 85 minutes to 2 hours
[note: This lab could be split into two class periods, with the setup, collisions, and qualitative analysis on the first day and the explosions of carts and postlab discussion on the second day. Of course, the amount of time spent depends on how you choose to setup the prelab, quantitative report-out, and postlab discussions.]
Safety Safety is of minimal concern with this lab. Make sure students do not have the carts going excessively fast. The biggest risk may be to equipment; students should be warned not to allow carts to hit the motion sensors or the camera, or to allow carts to roll onto the floor from a raised track. The carts should NOT be considered skateboards by students trying to ride on them.
112© 2015 The College Board

AP
PH
YS
ICS
1 INV
ES
TIG
AT
ION
SImpulse and Momentum
Preparation and Prelab Prior to this lab, students should have an introduction to linear momentum, with definitions and equations related to linear momentum, force, impulse, and conservation of momentum so they can more effectively design investigations related to those concepts. This might include just a single day or a single lesson, with students assigned a set of related problems from the textbook prior to the lab. You may decide to use one or more of the recommended resources listed as portions of assigned work to help develop concepts. However, the lab itself should be the vehicle for clarification of these concepts, so that students are truly “investigating” the meaning of concepts.
The Investigation Students begin the lab with a qualitative investigation of the basics of momentum in Part I, where they examine the movements of carts and learn to apply the vocabulary to a description of momentum, force, and impulse. In Parts II and III, students design investigations to qualitatively gather data to examine force and impulse when carts interact — followed by measurements they then use to examine conservation of linear momentum. You should keep the pulse of how the student groups progress, depending on student proficiency. It may be necessary to convene for small-group reporting between each part in order to ensure that students understand the concepts before proceeding to the next part. This may be particularly important after Part II, which is longer and requires the application of several different concepts.
Part I: Qualitative Introduction (~10 minutes)The first part of this activity is a qualitative introduction to the concept of momentum and how objects interact when they collide.
Have students in each group use their hands to stop as quickly as possible two identical carts rolling towards them (both carts should be stopped at roughly the same time). One cart should be moving about twice as fast as the other. Then they should repeat this procedure with both carts moving at the same speed but with one having additional masses on it. To achieve these nearly identical speeds, students can push both carts simultaneously by placing each cart against a bent ruler that then acts like a spring launcher. (Commercial devices will have a rubber band or spring launcher at each end of a track.) This part can be done on one track or on parallel tracks. The students should then discuss which cart was more difficult to stop and why they think it was more difficult to stop. Ask the students to come up with a way that would enable them to demonstrate that the force needed to be exerted on the cart in order to stop it can differ depending on the means used to stop it (e.g., by using a spring and then a ball of clay to stop each cart, and then comparing the compression of the spring to the indentation made in the clay as a means of distinguishing the force necessary to stop the cart). The point is for students to get a qualitative understanding of the stopping force as a function of cart speed and cart mass.
© 2015 The College Board
113

AP
PH
YS
ICS
1 I
NV
ES
TIG
AT
ION
SAP Physics 1 Investigation 5
The property of the carts students are describing and observing is called momentum. Students should also discuss the forces and impulses exerted by their hands (and by the springs or the clay) on the carts in the process of stopping them. In which case(s) does time play a role?
Part II: Colliding Carts (~30 minutes)In this activity students design an experiment in which two carts gently collide with each other in different ways.
Task the students to calculate the velocities of the carts before and after different types of collisions. They should report their methods and their uncertainty, and then calculate the momentum of the system before and after each type of collision. Students should design at least four different variations, with the collisions ranging, for example, from one with a moving cart colliding with a parked cart, to one with two carts moving towards each other, to one with two carts moving in the same direction where the faster cart collides with the slower cart. Students should record masses and velocities before and after each collision.
Acting as a facilitator, help students to understand and realize the importance of running trials numerous times. Students should ultimately run the trials multiple times to look for patterns in the data which indicate the role mass plays in each collision. Then they should look at the data and see if they can come up with a rule for each collision. For example, they could collide equal mass carts and unequal mass carts, and see if they notice a pattern. After that they can play around and see if the rule still holds when both carts are moving. The student groups should then make presentations to the larger group that include discussions of the forces the carts exert on each other as well as the impulses delivered.
Part III: Explosions (~20 minutes)In this activity, students build up to the idea of conservation of momentum via “explosions” of two objects moving away from one another. This can be done with two identical carts with a spring compressed between them. Releasing the spring will cause the carts to move apart, and students then calculate the momentum of both carts. [note: Students may need to be prompted with the idea that since the center of mass of the spring does not accelerate, the force exerted by the spring on one cart is equal and opposite to the force exerted by the spring on the other cart.] Prior to releasing the carts, have the students predict what they expect to happen when the carts are released. They should come up with the expectation that if the carts start at rest, the final total momentum of the two carts should be zero. Then have students extend the activity to carts of unequal mass to again show that total momentum is constant.
114© 2015 The College Board

AP
PH
YS
ICS
1 INV
ES
TIG
AT
ION
SImpulse and Momentum
Guide students to consider another way of looking at their data (i.e., using the conservation of momentum of the cart, to calculate the ratio of the two velocities during the trials where carts of unequal mass were used). For example, for one velocity to be twice the size of the other, they would need to double the mass of the other cart. Have the students write up their procedures and their experiments.
[note: If students calculate velocities using direct distance–time measurements, their results may not show conservation as clearly as if the velocities are determined using motion sensors or video analysis methods.]
Extension Students could follow up with an experiment where they stop a moving cart with a rubber band attached to a force sensor. That would show the force/time/impulse relationship. The cart is attached by a string/rubber band combination to a force sensor: it moves away from the sensor, extends the rubber band, stops, and then moves backward toward the force sensor. If used in conjunction with a motion detector, a full force/time/impulse/momentum analysis can be done. Several commercial types of equipment include motion sensors and force sensors that can be used for this extension. Students could produce from this data a “Force vs. Time” graph and use the area under the graph to calculate impulse.
Common Student ChallengesOne of the large challenges students face with momentum is that they think momentum and inertia are the same thing. They think that larger objects will always have a larger momentum, which is not necessarily the case. In terms of conservation of momentum, students tend to place a higher value on the velocity aspect. If a small object moving quickly hits a larger object, they might expect that the larger object would move fast, because they don’t realize that objects can be moving at different speeds and still have the same momentum. Students also tend to believe that conservation of momentum is only true in elastic collisions or (better but still wrong) in isolated systems. The difference between constant and conserved is often lost.
Another challenge with this topic is that students tend to think that force and impulse are synonymous. They do not realize that impulse also involves how long the force is acting on an object. Students should be required to create and/or analyze a plot of force vs. time to determine impulse (and change in momentum), either as a part of this lab or as a follow-up assignment, to reinforce this concept. If a force sensor is available, comparing the area under the curve (either by counting squares or using the computer to calculate it) of the force acting on a cart vs. time to the change in momentum of the cart is a powerful way to show that impulse on an object is the change in momentum of that object.
© 2015 The College Board
115

AP
PH
YS
ICS
1 I
NV
ES
TIG
AT
ION
SAP Physics 1 Investigation 5
Particularly important is the demonstration (along with calculations) of the vector nature of change in momentum (e.g., a ball hitting a wall and bouncing back) to emphasize that the change in direction generates a much larger change in momentum (and thus larger force) than a ball that hits the wall and stops. It is important here for the teacher to emphasize the vector property of momentum by pointing out that if the ball hits the wall horizontally moving at a velocity v
, after an elastic collision with the wall the ball bounces back with a velocity v− . The change in momentum of the ball is proportional to its final velocity minus initial velocity:
( ) ( ) 2p m v m v v m v v mvf oD = D = − = − − = −
On the other hand, if the ball hits the wall and stops, the change in momentum of the ball is less:
( ) (0 )p m v m v v m v mvf oD = D = − = − = −
Analyzing Results
Part I: In the first part of this lab, students qualitatively explore and report (either verbally to their partners and/or in a journal) how hard they had to push on the cart — or how much force was exerted by another object, as designed by the students earlier — to make it stop. Once the two procedures in this part are done, you might want to confirm their understanding by asking if it was possible for the larger mass cart to require the same force to stop as the smaller mass cart (which was moving faster). Students should use the terms momentum, force, and impulse correctly in their reporting from this part in readiness for Parts II and III. If time allows, small student groups can prepare 2–3 minute presentations to the class, with you acting as facilitator, to gain feedback on improvement in procedure and correct use of terminology before proceeding to the quantitative measurements.
Questions to ask students might include:
▶ What quantities affect momentum?
▶ How is force related to change in momentum?
▶ When two carts collide, how do the forces they exert on each other compare?
▶ How is impulse related to force and to change in momentum?
▶ When two carts collide, how do the impulses they deliver to each other compare?
116© 2015 The College Board

AP
PH
YS
ICS
1 INV
ES
TIG
AT
ION
SImpulse and Momentum
Part II: In the second part, students develop a method to calculate velocity. Ask them about uncertainty in the experiment. The largest will be a reaction-time error, such as a delay in starting and stopping the stopwatch. Have the students create a data table where they calculate the momentum of a system before and after each collision. Students should calculate the theoretical value for total momentum of both carts after each collision, based on the total momentum of the carts before the collision, and compare that calculated value to the experimental value for total momentum after collision, based on measurements after each collision.
Students should discuss possible sources of difference in the two values. If motion sensors or video analysis are used, students should also be able to determine the time of collision and from that calculate the impulses and forces the carts exert on each other.
Part III: In this part the goal is to see if the previous pattern (initial momentum equals final momentum) still holds true in a situation where there is an explosion (i.e., two carts are held stationary with a compressed spring between them). The same procedures as in Part II can be used to measure and determine total momentum after the explosion to compare to the theoretical value of zero, since that was the total momentum prior to the collision. Students will have some difficulty here, as they may lose a sense of the magnitude of the uncertainty. Additionally, poor measurement techniques for both carts may, in fact, yield an answer near to the “correct” sum of zero.
You might want to provide prompts, such as: “What conclusions can be drawn about the change in momentum of cart 1 compared to that of cart 2?” Be sure to discuss how force, time, mass, and velocity play a role in your observations.
If students have been required to create at least one meaningful graph that can be used in analysis, the graph produced might be a “Velocity vs. Time” graph for one or both of the moving carts produced to show change in sign with change in direction before and after collision. If motion sensors or data analysis equipment are used, these graphs can be selected from those produced on the computer. Students should realize and comment that the amount of uncertainty in their measurements will depend upon the measurement methods employed (e.g., students using motion sensors may have a smaller amount of uncertainty than students making direct measurements with marked distances and stopwatches).
Assessing Student Understanding After completing this investigation, students should be able to use the terms momentum, force, and impulse correctly to describe the motions of a system of objects before and after interactions. They should also be able to explain the meaning of conservation of linear momentum and the conditions under which momentum is constant.
Students should be able to:
© 2015 The College Board
117

AP
PH
YS
ICS
1 I
NV
ES
TIG
AT
ION
SAP Physics 1 Investigation 5
▶ Design an experiment to show that in either an explosion (where a single object becomes multiple objects) or a collision (where multiple objects come into contact and exert forces on each other) the total momentum before the collision or explosion has to equal the total momentum afterward (providing there are no net external forces acting on the system);
▶ Demonstrate situations in which different forces are required to stop objects with different momenta;
▶ Calculate momentum and impulse (and also force if data analysis or sensors are used);
▶ Use calculations to show that linear momentum is conserved; and
▶ Produce a graph that can be used to show meaningful relationships related to momentum, such as force vs. time or velocity vs. time.
Assessing the Science Practices
Science Practice 4.1 The student can justify the selection of the kind of data needed to answer a particular scientific question.
Proficient Uses the velocity–time data accurately to calculate forces and impulses and also to calculate conservation of momentum in Parts II and III of the investigation.
Nearly Proficient Uses the data to calculate cart velocities, forces, and impulses but has some errors in calculations.
On the Path to Proficiency
Connects the concepts of spring potential energy, the kinetic energy, and the gravitational potential energy to the big idea of conservation of energy with minor errors. States where each energy is a maximum.
Describes the sources of energy losses.
An Attempt Gathers data for cart collisions but data interpretation is not present.
Science Practice 4.2 The student can design a plan for collecting data to answer a particular scientific question.
Proficient Designs an experimental plan that is well communicated and leads to values for cart velocities that can be used to accurately calculate forces, impulses, and momentum conservation values.
Nearly Proficient Designs an experimental plan to collect data for cart velocities before and after interactions that might prove effective; however, the plan is not clearly communicated or has a flaw that will produce errors.
On the Path to Proficiency
Designs an experimental plan to determine cart velocities but makes multiple errors in the plan that will lead to erroneous values.
An Attempt Designs an experimental plan to determine cart velocities, but the design will not prove effective in answering the experimental questions.
118© 2015 The College Board

AP
PH
YS
ICS
1 INV
ES
TIG
AT
ION
SImpulse and Momentum
Science Practice 4.3 The student can collect data to answer a particular scientific question.
Proficient Collects data in such a way to as to minimize uncertainty; the data collected is adequate to make all calculations for cart velocities, forces, and momentum before and after interactions.
Nearly Proficient Collects data that can be used to determine cart velocities, but does not follow through with additional data necessary to complete all calculations for force, impulse, and momentum.
On the Path to Proficiency
Collects data but collection methods are such that uncertainty is so large that calculated values will not be meaningful.
An Attempt Collects data but the data collected will not answer any portion of the questions posed.
Science Practice 4.4 The student can evaluate sources of data to answer a particular scientific question.
Proficient Addresses assumptions in the experimental design effectively, and discusses uncertainties in data gathering appropriately. If electronic methods are used to gather data, selects appropriate ranges from graphs produced by the computer, for example.
Nearly Proficient Discusses uncertainties in the measurements in gathering data, but the discussion is incomplete or has flaws; for example, a systematic error such as a nonlevel track is evident but not realized or addressed.
On the Path to Proficiency
Collects data that can be used to calculate cart velocities, but attempts at explanations of uncertainty in the measurements are flawed.
An Attempt Collects data but does not address uncertainty in their measurements.
Science Practice 5.1 The student can analyze data to identify patterns or relationships.
Proficient Determines values for velocity, force, impulse and momentum in each scenario correctly. Constructs a correct graph from the data, such as the use of force vs. time to verify impulse calculations from velocities.
Nearly Proficient Makes accurate calculations and graphical representation. Calculates cart velocities, forces, impulses, and momenta, but there may be errors in calculations or the graphical representation is attempted but has an error.
On the Path to Proficiency
Attempts the calculations and the graphical representation, and then makes attempts to calculate forces and impulses, but there is confusion in how the terms are used or there are errors in the calculations and the graphical representation is incorrect.
An Attempt Unable to calculate forces, impulses, and momenta correctly from the data collected. Does not attempt a graphical representation.
© 2015 The College Board
119

AP
PH
YS
ICS
1 I
NV
ES
TIG
AT
ION
SAP Physics 1 Investigation 5
Science Practice 5.3 The student can evaluate the evidence provided by data sets in relation to a particular scientific question.
Proficient Reports correct relationships among force, momentum, and impulse in all three parts of the experiment, and demonstrates insight into these concepts during postlab discussions.
Nearly Proficient Makes correct conclusions about force and momentum that need only minimal correction during postlab discussion.
Makes correct conclusions about relationships between force and momentum, or about conservation of momentum during collisions, needing only minimal refinement.
On the Path to Proficiency
Makes some correct conclusions about force and momentum that need correction during postlab discussion.
Makes incorrect conclusions about relationships between force and momentum or about conservation of momentum during collisions.
An Attempt Unable to make correct conclusions about force and momentum.
Unable to make correct conclusions about relationships between force and momentum or about conservation of momentum during collisions.
Science Practice 6.4 The student can make claims and predictions about natural phenomena based on scientific theories and models.
Proficient Makes meaningful predictions about momentum concepts that are effectively applied to the quantitative portions of the lab.
Nearly Proficient Makes meaningful predictions after the qualitative portion of the lab, and needs only minimal guidance on how to proceed during the quantitative portions.
On the Path to Proficiency
Makes only a few meaningful predictions after the qualitative portion of the lab, and needs guidance on how to proceed during the quantitative portions.
An Attempt Unable to make meaningful predictions during the qualitative portion of the lab that will apply to quantitative measurements.
120© 2015 The College Board

AP
PH
YS
ICS
1 INV
ES
TIG
AT
ION
SImpulse and Momentum
Science Practice 7.2 The student can connect concepts in and across domain(s) to generalize or extrapolate in and/or across enduring understandings and/or big ideas.
Proficient Describes a practical application in the analysis section of the lab report that is complete and accurate.
Nearly Proficient Describes a practical application in the analysis section of the lab report that is generally correct but is not complete or contains an incorrect step.
On the Path to Proficiency
Makes an attempt to describe a practical application in the analysis section of the lab report that is partially correct, but the connection contains some incorrect physics.
An Attempt Makes an attempt to describe a practical application in the analysis section of the lab report but the connection is flawed.
Supplemental Resources“Collision Lab.” PhET. University of Colorado Boulder. Accessed September 1, 2014. https://phet.colorado.edu/en/simulation/collision-lab. [This simulation could be assigned work to follow up the investigation.]
ComPADRE. Accessed September 1, 2014. www.compadre.org. [This website has a free collection of resources and publications for physics educators. Click on “Classical Mechanics” under the “By Topic” section in the lower left of the landing page; then click on linear momentum which provides a list of physics education research documents relating to momentums.]
“Elastic and Inelastic Collision.” Walter Fendt. Accessed September 1, 2014. http://www.walter-fendt.de/ph14e/collision.htm. [This is an applet to help simulate the results of collisions and can help differentiate between elastic and inelastic collisions.]
“Learning Cycle on Newton’s Third Law using the Momentum Approach.” Rutgers Physics and Astronomy Education Research Group. Accessed September 1, 2014. http://paer.rutgers.edu/pt3/experimentindex.php?topicid=3&cycleid=4. [A series of videos highlighting Newton’s Third Law from a momentum approach. Though these videos are set up for Newton’s Third Law, they revolve around momentum. You will find the “Happy and Sad Ball” experiment here.]
O’Brien Pride, Tanya, Stamatis Vokos, and Lillian C. McDermott. “The Challenge of Matching Learning Assessments to Teaching Goals: An Example from the Work–Energy and Impulse–Momentum Theorems.” American Journal of Physics 66, no. 2 (1998): 147–157.
Rosengrant, David, and Mzoughi, Taha. “Preliminary Study of Impulse Momentum Diagrams.” Paper presented at the Physics Education Research Conference, Part of the PER Conference series, Edmonton, Canada: July 23–24, 2008.
Singh, Chandralekha, and David Rosengrant. “Students’ Conceptual Knowledge of Energy and Momentum.” Paper presented at the Physics Education Research Conference, Part of the PER Conference series, Rochester, New York: July 25–26, 2001.
© 2015 The College Board
121

This page is intentionally left blank.

AP
PH
YS
ICS
1 INV
ES
TIG
AT
ION
S
AP Physics 1 Investigation 6: Harmonic MotionWhat factors affect the motion of a pendulum?
Central ChallengeIn this investigation, students explore the motion of a pendulum in two parts. In the first part, students experimentally determine what factors affect the period of a pendulum. In the second part, students create the motion graphs resulting from the periodic motion.
BackgroundA simple pendulum is a system that can be modeled as a point mass (m) at the end of a string of negligible mass and of length (L). The pendulum executes oscillatory motion because gravity (or more specifically, the component of gravity perpendicular to the string) provides a restoring force that pulls the pendulum back toward equilibrium at every point in its motion. The gravitational force is dependent on the mass of the pendulum bob, and since
a Fm= Σ , the acceleration of the bob is independent of its mass, and so the period
of the pendulum is independent of its mass. For small angles of oscillation, the period is also independent of the amplitude, so the motion approximates simple harmonic motion. So the period of a simple pendulum depends only on its length and the acceleration due to gravity (g).
An example of a system that exhibits simple harmonic motion is an object attached to an ideal spring and set into oscillation. The spring’s restoring force depends on the displacement from equilibrium but not on the mass of the object in oscillation. The period can be shown to be equal to T m k= 2π if the mass of the spring can be neglected. Refer to any calculus-based introductory physics textbook for the derivation of this period (and for a pendulum) from a second-order linear differential equation.
© 2015 The College Board
123

AP
PH
YS
ICS
1 I
NV
ES
TIG
AT
ION
SAP Physics 1 Investigation 6
Real-World Application The most obvious real-world application of harmonic motion for students is the idea of time keeping. Everything from traditional grandfather clocks to atomic clocks use periodic oscillations to keep time. For those who study music, metronomes are a type of pendulum that keeps time. A child on a swing in the playground is a reasonable approximation of a simple pendulum, assuming he or she does not swing too high (i.e., at too great an amplitude). A good discussion could be had about under what conditions a child on swing acts like a simple pendulum, and under what conditions he or she does not. The period of an old-fashioned metronome depends on the position of the mass on the vertical post. Having students first visualize these types of oscillations is a useful way to start discussion about this investigation.
Inquiry OverviewIn this investigation, students explore the motion of a pendulum in two parts.
In Part I, students experimentally determine which quantity or quantities affect the period of a pendulum. This part of the lab can be more open inquiry if implemented at the start of a simple harmonic motion unit; or it can have more structured, guided inquiry if implemented as the first lab (or very early in the course), in accordance with the modeling curriculum out of Arizona State University (see Supplemental Resources). As the first lab it would then serve to teach students about designing experiments, making measurements, and calculating or estimating uncertainties.
In Part II, students create the harmonic motion graphs resulting from the periodic motion. This part of the lab can either be open inquiry, allowing students to determine how to graph the motion of the pendulum as a function of time, or it can be more guided inquiry depending on the experience and sophistication of your students at the time you decide to implement this lab.
124© 2015 The College Board
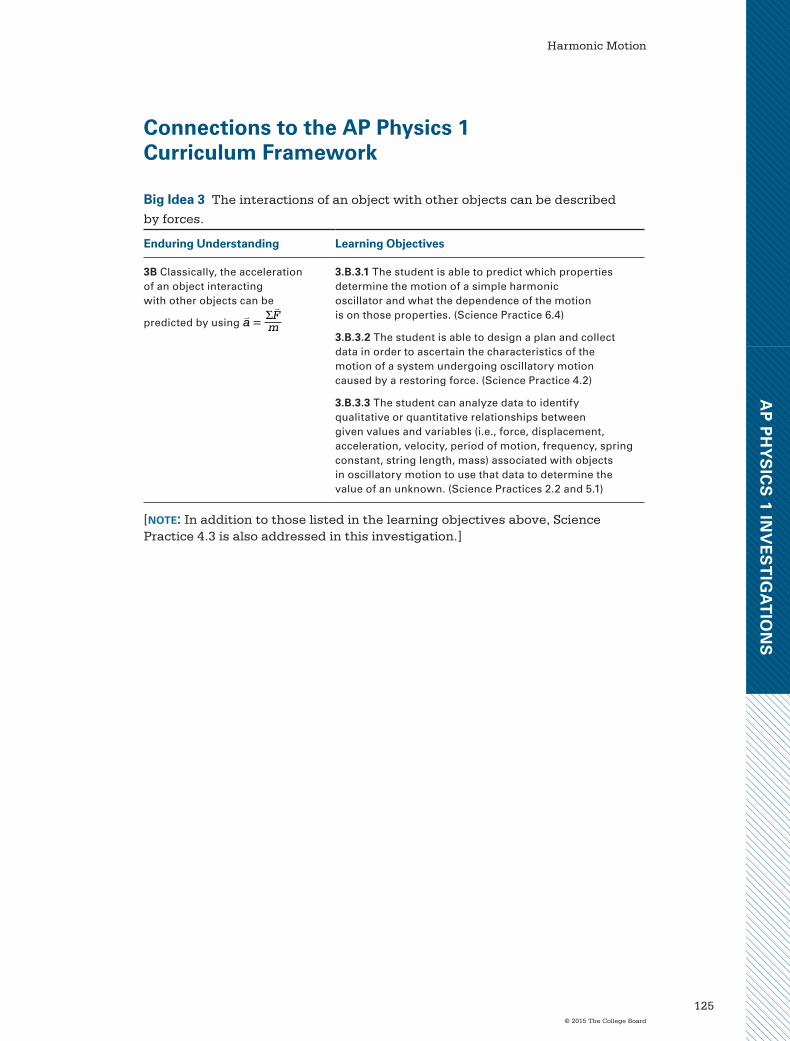
AP
PH
YS
ICS
1 INV
ES
TIG
AT
ION
SHarmonic Motion
Connections to the AP Physics 1 Curriculum Framework
Big Idea 3 The interactions of an object with other objects can be described
by forces.
Enduring Understanding Learning Objectives
3B Classically, the acceleration of an object interacting with other objects can be
predicted by using
a Fm= Σ
3.B.3.1 The student is able to predict which properties determine the motion of a simple harmonic oscillator and what the dependence of the motion is on those properties. (Science Practice 6.4)
3.B.3.2 The student is able to design a plan and collect data in order to ascertain the characteristics of the motion of a system undergoing oscillatory motion caused by a restoring force. (Science Practice 4.2)
3.B.3.3 The student can analyze data to identify qualitative or quantitative relationships between given values and variables (i.e., force, displacement, acceleration, velocity, period of motion, frequency, spring constant, string length, mass) associated with objects in oscillatory motion to use that data to determine the value of an unknown. (Science Practices 2.2 and 5.1)
[note: In addition to those listed in the learning objectives above, Science Practice 4.3 is also addressed in this investigation.]
© 2015 The College Board
125

AP
PH
YS
ICS
1 I
NV
ES
TIG
AT
ION
SAP Physics 1 Investigation 6
Skills and Practices Taught/ Emphasized in This Investigation
Science Practices Activities
2.2 The student can apply mathematical routines to quantities that describe natural phenomena.
Students graph the period as a function of mass, angle, and length. Students derive an equation relating the period of a pendulum to the length of the pendulum using their data.
4.2 The student can design a plan for collecting data to answer a particular scientific question.
Students design a plan for collecting data to determine what factors affect the period of a simple pendulum.
4.3 The student can collect data to answer a particular scientific question.
Students collect data while varying several factors (mass, length, angle) to determine which affect the period of a pendulum and how they affect it.
5.1 The student can analyze data to identify patterns or relationships
Students analyze the data for period vs. mass, length, and angle to identify which factors affect the period of a pendulum and to determine the mathematical relationship from the data.
6.4 The student can make claims and predictions about natural phenomena based on scientific theories and models.
Students predict the period of a pendulum based on its length, mass, and angle of release.
[note: Students should be keeping artifacts (lab notebook, portfolio, etc.) that may be used as evidence when trying to get lab credit at some institutions.]
Equipment and Materials Per lab group:
Part I:
▶ String
▶ Set of calibrated masses (20–500 g)
▶ Stopwatch or timer
▶ Meterstick
▶ Protractor
▶ Support rod
▶ (Optional) Pendulum clamp
126© 2015 The College Board

AP
PH
YS
ICS
1 INV
ES
TIG
AT
ION
SHarmonic Motion
Part II: ▶ Paper and tape (to create a scroll)
▶ Leaking bob (can be made by placing a paper towel in a small funnel and soaking it with colored water)
▶ (Optional) Constant speed buggy
▶ (Optional) Motion detector, software, and computer
▶ (Optional) Video camera and analysis software
Extension:
▶ Spring
Timing and Length of Investigations ▶ Teacher Preparation/Set up: 10–15 minutes
▶ Student Investigation: 170 minutes
▶ Part I: 85 minutes
Prelab/demonstration/discussion: 10 minutes
Student-centered investigation: 45 minutes
Student-led discussion of results: 15 minutes
Postlab data linearization activity and discussion: 15 minutes
▶ Part II: 85 minutes
Prelab/demonstration/discussion: 10 minutes
Student-centered investigation: 45 minutes
Student-led discussion of results: 15 minutes
▶ Postlab Discussion: 15 minutes
▶ Total Time: approximately 3.5 hours
Safety General lab safety should be observed. Instruct students to exercise special caution as they swing masses in the classroom. Make sure all members of the group are clear of the swinging area and are aware when the pendulum will be released.
In addition to student safety, motion sensors and other equipment should be protected when using springs. If you decide to do the extension to this lab, warn students to keep attached masses small enough and amplitudes small enough that springs are not extended beyond their elastic limits. Also, if motion sensors are used, they should be protected from swinging pendulums or masses falling from springs.
© 2015 The College Board
127

AP
PH
YS
ICS
1 I
NV
ES
TIG
AT
ION
SAP Physics 1 Investigation 6
Preparation and Prelab
Part I: This part of the investigation works well for introducing the skills of taking data and modeling the behavior of an object graphically and mathematically.
If used at the beginning of the course, it will probably be necessary to discuss how to reduce uncertainties in timing measurements. You can start with a short pendulum, around 30 centimeters long, and distribute the stopwatches among students in the class. Then, as a class, time one complete oscillation of the pendulum. Record the values and have students calculate the average and uncertainty in the period. Given that the period is less than 1 second, human reaction time error will be a large percentage of the period. Have the class time ten complete oscillations. If all goes well, the uncertainty in the time measurement will be the same, but the percentage uncertainty of the total time will decrease. For example, 0.25 second reaction time uncertainty is 25 percent of a 1.0 second period measurement, but only 2.5 percent of a 10 second measurement of ten oscillations of the same pendulum.
How much instruction you give students before the lab will depend on when you choose to implement it. If this lab is done as a first lab, it might be useful to have a class discussion brainstorming factors that might affect the period of a pendulum. Since this is an easy system to analyze, students have many ideas about what might affect the period. They will make suggestions like “the force with which you push it to start the motion” and “air resistance.” This can lead to a discussion about how to make measurements, what we can actually measure, and what factors we can control. Air resistance may play a role, but at the speeds of these pendula, it is not large, nor can it be controlled or eliminated. A discussion of measuring the initial force should lead students to realize that this is not easy to measure, and it is directly related to the amplitude of the pendulum, which is much more easily measured and thus controlled.
A class discussion such as this can help new physics students narrow the field of possibilities to mass, length, and angle as factors that may affect the period of a pendulum. This narrows the scope for them and makes the task more manageable. If you choose to implement this lab later in the year when students will have more experience designing labs, then you may wish to skip the class discussion and let students decide for themselves how to narrow the scope of the investigation. Depending on how much time you have for this lab, you may also choose to have several groups study the effect of angle on period, several groups study mass, and several groups study length; then have the groups share the data and results with each other.
Part II: If Part I is done as the first experiment of the year, then this part can be delayed until the oscillations unit, which should come after the kinematics and forces units. Part II works well at the beginning of a unit on simple harmonic motion. At that time, you can revisit the period vs. length experiment and have students do a more mathematical analysis.
128© 2015 The College Board

AP
PH
YS
ICS
1 INV
ES
TIG
AT
ION
SHarmonic Motion
The Investigation Part I:Start with a demonstration of a pendulum about 30–50 centimeters long. Pull the pendulum bob back and release, and catch the bob when it returns. Explain to students that the time for the pendulum to complete one complete cycle is referred to as the period. Next, pose the question, “What factors affect the period of a pendulum, and what factors do not?” You could also phrase the question as, “What could we change about this system that would change the time it takes the pendulum to swing back and forth once?”
At this point, you could choose to have a class discussion or release them to their groups to discuss and plan their data-taking strategies. If you choose to have a whole-class discussion, help students focus on what can be measured and what tools they will use to measure the quantities they decide to measure. This would be a good time to discuss the benefits of timing multiple periods. Students should also refrain from having multiple students involved in the timing such that one person says “start” and another person releases the pendulum. To reduce uncertainty, the pendulum should be set in motion, and then the student with the stopwatch starts timing at some point in the motion, and stops when it returns to that position after multiple periods. It is up to you how much guidance you want to give before releasing students to their groups to design and execute their plan.
As you circulate, remind students to manipulate one variable at a time and record their data neatly in tables, and encourage students to display the data in the best way to represent the relationship. Students will usually choose to vary the mass of the pendulum, the angle of release from the equilibrium position, and the length of the pendulum. Consideration needs to be taken as to where to measure the length of the pendulum: the top of the bob, the middle, or the bottom. You might want to provide some guidance by reminding them a simple pendulum models the object as a point mass and asking them where the point would be (center of mass).
Most guidance in an inquiry lab should take the form of questions to students as to what they are doing and why they are doing it that way. Make them articulate what they know about best scientific practice, and remind them to engage in that.
At the conclusion of the first part of this investigation, students should observe, from their data, a significant relationship between length and time (period). They may assume that the mass affects the period as well, given that they are not likely to get the exact same value for the period for each different mass. At this point, encourage students to plot the period as a function of mass and period as a function of length and observe the results. As students analyze the relationships, they should ultimately linearize the data in order to determine the relationship between time (period) and length.
Have students present their results to the class (or otherwise share and discuss them) before proceeding to the next part.
© 2015 The College Board
129

AP
PH
YS
ICS
1 I
NV
ES
TIG
AT
ION
SAP Physics 1 Investigation 6
Part II:To start this part of the investigation, ask students to consider, “How could we graphically express periodic motion?”
Challenge students to draw a prediction of the position-vs.-time graph of the motion of the pendulum for one full period. Suggest the equilibrium position to be where x = 0. Once students have completed their graph prediction, instruct students to design an experiment that allows them to directly record position and time.
This part may be very challenging to many students. Allow each group enough time to discuss and brainstorm some ideas for collecting this data. Students may choose to use a motion detector to collect this data or, depending on their level of sophistication, video analysis. A lower-budget alternative is a leaking bob, which drops colored liquid onto a moving piece of paper, although this introduces a small error in the length of the pendulum and will concern those students who believe mass is a factor.
Students should design a method of tracing the position of the swinging pendulum bob (the leaking bob) onto a constantly moving scroll/paper. Remind them to use small amplitude, based on their results from Part I. Encourage them to think carefully about how to move the paper at a constant rate.
ExtensionAnother example of periodic motion is an object oscillating at the end of a spring. Ask students to determine mathematically the relationship between period and mass for an object oscillating at the end of a spring hung vertically from a support rod. Depending on when you choose to implement this lab, you could hand students a spring and a stopwatch and ask them to find the spring constant of the spring. In this case, they should already know the relationship, T m k= 2π where m is the mass of the object and k is the spring constant. They can compare the spring constant obtained using the slope of a graph of T2 vs. mass to one using the relationship using F k x= D , where F is the force applied to the spring and Dx is the spring extension from equilibrium.
Common Student ChallengesPart I:One common challenge for students is how to measure the length of the pendulum, and how to keep the length of the pendulum constant while varying mass, angle, or other factors they might choose to study. If a set of hooked masses is used, the different masses will have different heights, and thus the length of the pendulum from support point to the bottom of the mass will vary by up to 5 centimeters depending on which masses are used. This will most likely present itself in a slight increase in the period of a pendulum with increasing mass. Address this uncertainty with each group individually as you circulate, or address it in a class discussion when students present their results.
130© 2015 The College Board

AP
PH
YS
ICS
1 INV
ES
TIG
AT
ION
SHarmonic Motion
A robust discussion of measurement uncertainty can now take place. Some guiding questions for this discussion include:
▶ How much longer was the pendulum with the 500-gram mass compared to the 50-gram mass?
▶ Was it 10 times longer or only about 5 percent longer?
▶ Was the length of the pendulum really constant when the mass was varied?
▶ To which part of the hooked mass should you measure when you measure the length of a pendulum?
▶ If the length of the pendulum was 30 cm, and the 500-gram mass was 5 cm taller, how much uncertainty does this introduce?
Another common student challenge relates to timing. Students regularly time by having one student watch the motion and say “start” and “stop,” while another student operates the stopwatch. Students should learn that the person operating the stopwatch is the one who observes the motion and counts the oscillations. This results in less human reaction-time error. Sometimes timing demonstrations work to show students the added uncertainty. It might suffice to tell them that each time one student says “start” and the other one reacts, they introduce more reaction-time uncertainty. A good point of discussion may be whether to measure from the bottom of the arc or the top of the arc and why.
When graphing, a common mistake students make is to limit the vertical axis range on graphs to the range of data collected. If they do this, in particular for the period-vs.-mass data, they will miss the fact that the period is independent of the mass. During the analysis portion, encourage students to start each axis at zero and continue beyond the greatest value of their data.
Part II:If students have a difficult time drawing a position vs. time graph for the pendulum, ask them if they have ever seen a polygraph (lie detector) or seismograph record data (see Supplemental Resources for videos of these devices). Both of these have a piece of paper moving under a needle that writes. Have students imagine a pen attached to the pendulum that writes on a moving piece of paper.
Marking the position of the pendulum on the paper becomes the second challenge. Some will want to attach a marker to the pendulum to draw on the paper; however, this causes both friction and incomplete data, because the marker will not keep contact with the paper as it swings. The “leaking bob” will mark the position without adding external forces to the system. If students find it challenging to pull the paper scroll at a constant rate, suggest attaching it to a constant speed buggy (available online for under $10).
© 2015 The College Board
131

AP
PH
YS
ICS
1 I
NV
ES
TIG
AT
ION
SAP Physics 1 Investigation 6
Analyzing Results
Part I:Due to the investigative nature of this experiment, having students report on individual large whiteboards is ideal (or large poster/bulletin board paper). The whiteboards are useful for displaying procedure, data, and graphs in a way that they may be easily shared. Having students sketch a graph of their data in a large format that can be shared during the discussion will give students the opportunity to see how others approached the investigation.
The following are prompts for discussion as students analyze their results. It is up to you which factor to address first. If the students agree that length affects period, then they might see that the objects with more mass are longer/taller and thus add to the length of the pendulum. Thus, small variations in period as the mass is changed could then be attributed to the variations in sizes of the different objects used to vary the mass.
1. Does mass matter? Many students will expect that it should. Students will probably obtain slightly different periods for different masses, and some will think these differences are “real.” This is an opportunity, not a problem. After the small groups have presented their results, challenge the whole class — including groups that measured other quantities — to take the shared data and make the best argument they can that period depends on mass, or that it doesn’t depend on mass. This could lead to an authentic discussion about uncertainty. In particular, as mentioned above, students should consider whether, when changing mass, the length of the pendulum changed significantly.
Sample student data for this part of the experiment is as follows:
Mass (g) Period (s)
20 1.451
100 1.46
200 1.473
500 1.515
1000 1.542
Table 1
Students frequently claim that the period for the 1000-gram mass is greater than that for the 20 grams, and thus the mass affects the period. This is when to ask the question, “You increased the mass by a factor of 50 (for example), by how much did this increase the period?”
132© 2015 The College Board

AP
PH
YS
ICS
1 INV
ES
TIG
AT
ION
SHarmonic Motion
A graph of the data yields the following:
Mass (g)0
0
0.5
1
1.5
2
200 400 600 800 1000 1200
Peri
od (s
)
Graph 1
Groups using graphical representations will make the most convincing arguments, and you can turn this into a meta-discussion: What way of showing the data best clarifies whether the differences between the measured periods for different masses are significant vs. the result of measurement uncertainty? One source of measurement uncertainty that comes in to play if students are using hooked masses is that that larger hooked masses are much taller than the smaller hooked masses. Thus, if the students merely keep the string length constant while changing masses, they will be inadvertently changing the length as well as the mass when they change to larger masses. This can be pointed out to explain the slight increase in period for larger masses. Or students could be advised to keep the length the same and always measure to the center of mass of the pendulum bob.
2. Does angle matter? This discussion can go the same way as the discussion above, except now ask students from all small groups to represent the data in a way that best helps decide the issue, as decided in question #1 above. This discussion could also take advantage of another teachable moment regarding conceptual learning. Students will likely come to consensus that the angle doesn’t matter, or only matters a little for larger angles, but they will likely find this result counterintuitive.
Typical data for this section:
Angle (degrees) Period (s)
15 1.308
30 1.305
45 1.335
60 1.35
75 1.404
90 1.512
Table 2
© 2015 The College Board
133

AP
PH
YS
ICS
1 I
NV
ES
TIG
AT
ION
SAP Physics 1 Investigation 6
Angle (Degrees)
00
0.5
1
1.5
2
20 40 60 80
Peri
od (s
)
Graph 2
Students can see from this graph that for angles less than about 30 degrees, the period is relatively constant; but as the angle increases, the period increases. The mathematics of the dependence of period on angle beyond 30 degrees is too complex for students at this level, so instruct them to make sure that for future pendulum measurements, as long as the angle is less than 20–30 degrees, the period is relatively constant. If you wish for more precision in your students’ data, instruct them to do further investigations of the dependence of period on angle. Specifically, they could measure the period for many different angles between 0 and 30 degrees to see the variation in that range. The sine of an angle (in radians) is within 10 percent of the angle for angles less than 30 degrees, and within about 2 percent for angles less than 20 degrees.
It is a useful exercise to have students put their calulator in radian mode and compare the sine of an angle to value of that angle for angles less than one radian. For example, 20 degrees is equal to 0.35 radians. The sine of 0.35 radians is 0.343, which is approximately 2 percent smaller than 0.35.
3. Does length matter? Since students will quickly agree that string length does matter, the discussion can quickly transition to focus on figuring out what the relation is. Is it linear, square, square root, or something else? At this point a discussion of straightening graphs is imperative, if it has not already been done. Once again, the “Modeling Instruction” website has excellent resources for this discussion.
134© 2015 The College Board

AP
PH
YS
ICS
1 INV
ES
TIG
AT
ION
SHarmonic Motion
Sample data for this section:
Length (cm) Period (s)
15 0.93
26 1.14
36 1.32
48 1.49
58 1.63
Table 3
00 10 20 30
Length (cm)
Peri
od (s
)
40 50 60 70
0.2
0.4
0.6
0.8
1
1.2
1.4
1.6
1.8
Graph 3
The range of the data shown above is very small, and demonstrates the fact that, for small ranges of data, the difference between a straight line and a square-root curve can be difficult to see. Encourage students to take a much larger range of data if their results look like Graph 3. As an alternative, lead a class discussion and time the period of a pendulum that is much longer (1.5–2 meters or more depending on the height of your classroom). This data can then be added to the data set to more clearly illustrate the nature of the curve. It is difficult to time the period of a pendulum shorter than 10 centimeters, since even the smallest masses are 2–3 centimeters tall. However, it might be worth attempting, in order to extend the data range even more; and the length measurements can be made more accurate by measuring to the center of mass of the pendulum bob in each case.
© 2015 The College Board
135
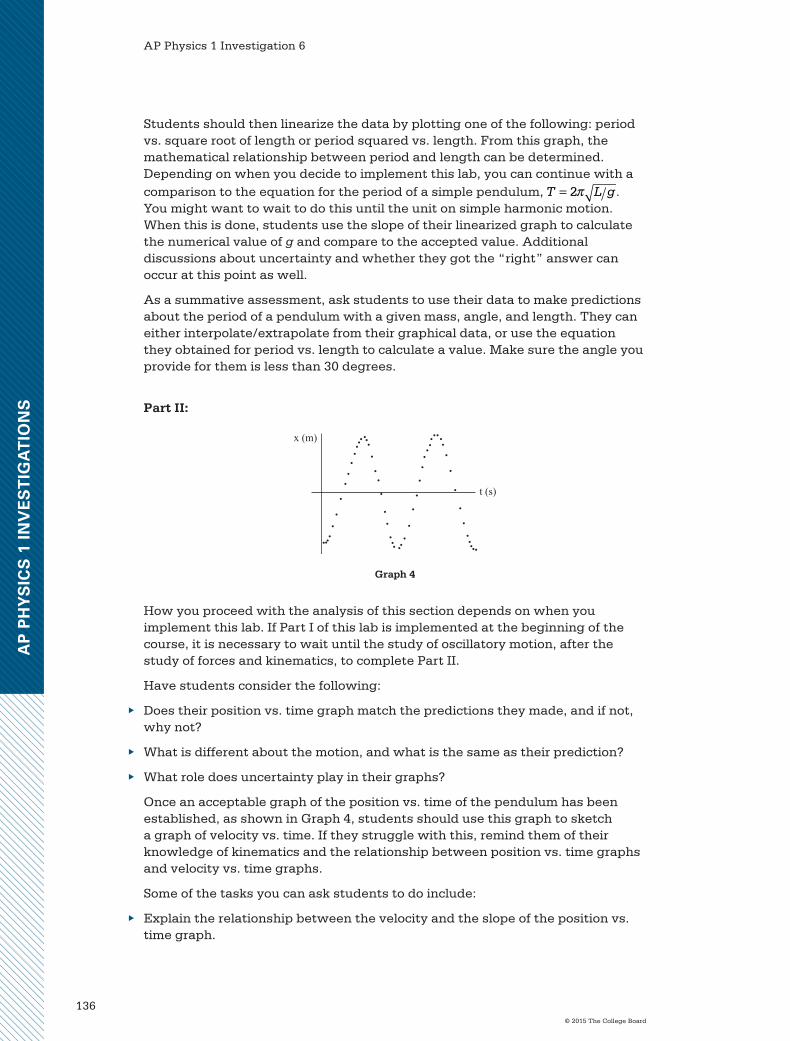
AP
PH
YS
ICS
1 I
NV
ES
TIG
AT
ION
SAP Physics 1 Investigation 6
Students should then linearize the data by plotting one of the following: period vs. square root of length or period squared vs. length. From this graph, the mathematical relationship between period and length can be determined. Depending on when you decide to implement this lab, you can continue with a comparison to the equation for the period of a simple pendulum, T L g= 2π . You might want to wait to do this until the unit on simple harmonic motion. When this is done, students use the slope of their linearized graph to calculate the numerical value of g and compare to the accepted value. Additional discussions about uncertainty and whether they got the “right” answer can occur at this point as well.
As a summative assessment, ask students to use their data to make predictions about the period of a pendulum with a given mass, angle, and length. They can either interpolate/extrapolate from their graphical data, or use the equation they obtained for period vs. length to calculate a value. Make sure the angle you provide for them is less than 30 degrees.
Part II:
x (m)
t (s)
Graph 4
How you proceed with the analysis of this section depends on when you implement this lab. If Part I of this lab is implemented at the beginning of the course, it is necessary to wait until the study of oscillatory motion, after the study of forces and kinematics, to complete Part II.
Have students consider the following:
▶ Does their position vs. time graph match the predictions they made, and if not, why not?
▶ What is different about the motion, and what is the same as their prediction?
▶ What role does uncertainty play in their graphs?
Once an acceptable graph of the position vs. time of the pendulum has been established, as shown in Graph 4, students should use this graph to sketch a graph of velocity vs. time. If they struggle with this, remind them of their knowledge of kinematics and the relationship between position vs. time graphs and velocity vs. time graphs.
Some of the tasks you can ask students to do include:
▶ Explain the relationship between the velocity and the slope of the position vs. time graph.
136© 2015 The College Board

AP
PH
YS
ICS
1 INV
ES
TIG
AT
ION
SHarmonic Motion
▶ Identify when and where the bob reaches the maximum and minimum velocities.
▶ Explain how to construct the acceleration vs. time graph from the velocity vs. time graph and locate when and where maximum and minimum accelerations occur.
Once they have made these predictions, they check their predictions using a motion detector and computer interface (assuming this equipment is available). Ask them to label all the points of zero speed on both the position graphs and velocity graphs and to comment on similarities between the multiple points. They should comment on the relationship between the acceleration graph and the position graph. Students should notice that the acceleration graph is the negative of the position graph.
Assessing Student Understanding
Part I: After completing this investigation, students should be able to:
▶ Design an experiment to determine the effect of mass, angle, and length on the period of a pendulum;
▶ Measure the period of a pendulum by timing multiple oscillations; and
▶ Determine the relationship between mass, angle, or length and the period of a pendulum by examining data in the form of tables or graphs.
Part II:Students should also be able to:
▶ Graph the position of a pendulum as a function of time;
▶ Determine an equation relating the period of a pendulum to its length;
▶ Predict the period of a simple pendulum given the length, mass, and release angle; and
▶ Draw the graph of velocity vs. time and acceleration vs. time from their graph of position vs. time.
© 2015 The College Board
137

AP
PH
YS
ICS
1 I
NV
ES
TIG
AT
ION
SAP Physics 1 Investigation 6
Assessing the Science Practices
Science Practice 2.2 The student can apply mathematical routines to quantities that describe natural phenomena.
Proficient Uses and applies mathematical routines to detect and describe patterns in the data, and compares the period of a pendulum in terms of its length, mass, and/or amplitude (in terms of angle).
Nearly Proficient Uses and applies mathematical routines that describe the patterns in the period of a pendulum in terms of its length with only occasional or minor errors.
On the Path to Proficiency
Uses and applies mathematical routines to describe the period of a pendulum in terms of its length with some inconsistency and/or errors.
An Attempt Incorrectly identifies patterns in the mathematical data or incorrectly applies routines to describe them, and description contains major errors.
Science Practice 4.2 The student can design a plan for collecting data to answer a particular scientific question.
Proficient Designs a plan that will allow a determination of the factors that affect the period of a pendulum.
Nearly Proficient Designs a plan for measuring the period of a pendulum in terms of angle but cannot articulate how that plan will lead to a rule for the period.
On the Path to Proficiency
Designs a plan to measure the period of a pendulum but it’s not clearly defined or articulated — it doesn’t take into account varying length, mass, or angle.
An Attempt Presents an incomplete design for a plan that attempts to measure period as a function of other variables; makes errors in identifying variables.
Science Practice 4.3 The student can collect data to answer a particular scientific question.
Proficient Collects appropriate, adequate, and accurate data in a methodical way, and presents the data in an organized fashion.
Nearly Proficient Collects appropriate and adequate data; some minor errors are present, and/or the presentation is logical but lacking in an organized format.
On the Path to Proficiency
Collects inadequate or irrelevant data with significant gaps or errors, and presents data in a way that is disorganized and lacks logic.
An Attempt Collects irrelevant, inaccurate, or incomplete data and doesn’t provide any organization for this data.
138© 2015 The College Board

AP
PH
YS
ICS
1 INV
ES
TIG
AT
ION
SHarmonic Motion
Science Practice 5.1 The student can analyze data to identify patterns or relationships.
Proficient Constructs a graph to analyze the data and accurately determine the effect of mass, angle, and length on the period of a pendulum. Uses the graph of period squared vs. length to derive a mathematical relationship between period and length.
Nearly Proficient Constructs a graph to analyze the data and qualitatively determine the effect of mass, angle, and length on the period of a pendulum, but unable to derive a mathematical relationship between period and length.
On the Path to Proficiency
Identifies patterns in the data for the period of a pendulum, but unable to form a complete conclusion from this analysis.
An Attempt Forms some accurate analysis of the graphs of the period of a pendulum, but unable to come to an accurate conclusion.
Science Practice 6.4 The student can make claims and predictions about natural phenomena based on scientific theories and models.
Proficient Predicts the period of a pendulum accurately from a graph of period squared vs. length or period vs. square root of length.
Nearly Proficient Uses a graph to make a prediction, but fails to take the square root of the period.
On the Path to Proficiency
Makes estimates of the period of a pendulum based on data, but cannot make accurate calculations using an equation or a graph.
An Attempt Makes incorrect predictions about the period of a pendulum using the data collected and graphed.
Supplemental Resources Carvalhaes, Claudio G., and Patrick Suppes. “Approximations for the Period of the Simple Pendulum Based on the Arithmetic-Geometric Mean.” American Journal of Physics 76, no. 12 (2008): 1150–1154. [This article discusses methods for approximating the period for large angles; a resource for the teacher only, and only if the teacher enjoys a good challenge.]
“Cut the Rope Trailer.” YouTube. Video, 1:22. Accessed September 1, 2014. http://www.youtube.com/watch?v=8xPUdFaraoQ&. [This trailer for a “Cut the Rope” video has several good instances of pendulum motion.]
“How a Seismograph Works.” YouTube. Video, 1:04. Accessed September 1, 2014. http://www.youtube.com/watch?v=Gbd1FcuLJLQ. [Good video of how a seismograph works.]
© 2015 The College Board
139

AP
PH
YS
ICS
1 I
NV
ES
TIG
AT
ION
SAP Physics 1 Investigation 6
“I Didn’t Know That - Beating a Lie Detector Test.” National Geographic. YouTube. Video, 4:37. Accessed September 1, 2014. http://www.youtube.com/watch?v=JcDr7O-Wmuk. [A video describing the pendulum motion and marking of a Lie Detector Machine.]
Kuhn, Jochen, and Patrik Vogt. “Analyzing Spring Pendulum Phenomena with a Smart-Phone Acceleration Sensor.” The Physics Teacher 50, no. 8 (2012): 504. [Alternative methods for measuring the properties of a pendulum.]
“Modeling Instruction.” Arizona State University. Accessed September 1, 2014. http://modeling.asu.edu/.
Mires, Raymond W., and Randall D. Peters. “Motion of a Leaky Pendulum.” American Journal of Physics 62, no. 2 (1997): 137–139.
“Properties of Periodic Motion.” The Physics Classroom. Accessed September 1, 2014. http://www.physicsclassroom.com/class/waves/u10l0b.cfm. [This website is a good source for properties of periodic motion.]
“Simple Pendulum.” Walter Fendt. Accessed September 1, 2014. http://www.walter-fendt.de/ph14e/pendulum.htm.
140© 2015 The College Board

AP
PH
YS
ICS
1 INV
ES
TIG
AT
ION
S
AP Physics 1 Investigation 7: Rotational MotionWhat physical characteristics of an object affect the translational speed of the object after it has rolled to the bottom of an incline?
Central Challenge This investigation introduces students to concepts of rotational motion as they analyze how characteristics of objects such as mass, radius, and shape affect the linear speeds of those objects at the bottom of a ramp. This lab provides instructions for both qualitative and quantitative investigations in rotational motion, giving you the option of choosing which type of investigation is best for your students. If time permits, you might choose to have them complete both investigations.
Background Without friction, an object at the top of an incline would slide down the incline without rolling, resulting in only linear (or translational) motion. A friction force exerts a torque on the object, allowing it to roll down the incline. Basic kinematic equations already familiar to students can describe the linear (or translational) motion of the center of mass of the object as it changes position, but rotational motion equations must be incorporated to describe the rotational motion of each object as it rolls without slipping down the ramp. Additionally, the way in which an object rotates depends upon the rotational inertia of the object. Although students will not calculate rotational inertia in this course, they will use the concept of rotational inertia in calculations of quantities such as torque and rotational kinetic energy. This lab helps to provide a conceptual understanding of the physics properties of an object that define the object’s rotational inertia.
Real-World Application It is not difficult for students to visualize numerous everyday objects that rotate. Understanding how an object’s properties impact rotational motion allows students to critically examine designs used for rotating objects. For example, bicycle racers will choose wheel designs that have properties that can enhance their racing performance. Wheels that are fairly uniform from hub to rim with light rims have low rotational inertia, so they start quickly for a short race. However, bicycle wheels with light spokes and heavier rims have higher rotational inertia, which make the bicycle more difficult to start, but once these wheels are turning they are less influenced by other forces and require more torque to stop — better for a long race or for stability on a rough terrain.
© 2015 The College Board
141

AP
PH
YS
ICS
1 I
NV
ES
TIG
AT
ION
SAP Physics 1 Investigation 7
Another common example is a spinning skater. The skater can exert a torque by pushing on the ice with an extended toe. Once the skater starts rotating, bringing legs and arms in close to the spin axis causes a faster spin. Extending the arms or a leg slows the spinner down to a stop. With arms and legs spinning close to the body (and close to the spin axis), the skater has a lower effective radius of spin and lower rotational inertia. Since angular momentum is the product of rotational inertia and angular speed, angular momentum is conserved when that product remains constant. If no external torque is exerted on the skater, reducing the rotational inertia results in a faster angular speed (and faster spin), and extending to increase the rotational inertia results in lower angular speed.
Inquiry Overview Students are provided with materials to setup a ramp and objects of various shapes, sizes, and masses to design an experiment to test how objects rotate as they roll down a ramp. If students are provided with a large assortment of objects and options to create the inclined plane, they are given more opportunity for guided inquiry that approaches open inquiry, which is recommended. Students should be given latitude to make decisions about which objects to use, how many trials are adequate, how to make measurements to determine the speed of the object at the bottom of the ramp, and how to analyze their results. Students should be provided with the opportunity prior to actual lab time to meet in groups to design their lab procedure (even though some directions are provided). It adds to the inquiry process for students to report out their procedural plans to the other groups in order to gain feedback about oversights or gain suggestions prior to actually conducting the experiment. This can also happen postlab, giving students the opportunity to engage in critical discussions with the other groups.
Initially, student groups will make qualitative predictions about how object shape, size, and mass will affect the speed of the object as it reaches the bottom of the ramp. These predictions will be discussed and compared in small student groups and recorded. Then students will run the trials and make qualitative observations. Finally, students will design methods to make measurements of the speeds of the objects at the bottom of the ramp to compare to their predictions and observations.
142© 2015 The College Board

AP
PH
YS
ICS
1 INV
ES
TIG
AT
ION
SRotational Motion
Connections to the AP Physics 1 Curriculum Framework
Big Idea 3 The interactions of an object with other objects can be
described by forces.
Enduring Understanding Learning Objectives
3.A All forces share certain common characteristics when considered by observers in inertial reference frames.
3.A.1.1 The student is able to express the motion of an object using narrative, mathematical, and graphical representations. (Science Practices 1.5, 2.1, and 2.2)
3.A.1.2 The student is able to design an experimental investigation of the motion of an object. (Science Practice 4.2)
3.A.1.3 The student is able to analyze experimental data describing the motion of an object and is able to express the results of the analysis using narrative, mathematical, and graphical representations. (Science Practice 5.1)
Big Idea 4 Interactions between systems can result in changes in
those systems.
Enduring Understanding Learning Objectives
4.C Interactions with other objects or systems can change the total energy of a system.
4.C.1.1 The student is able to calculate the total energy of a system and justify the mathematical routines used in the calculation of component types of energy within the system whose sum is the total energy. (Science Practices 1.4, 2.1, and 2.2)
Big Idea 5 Changes that occur as a result of interactions are constrained by
conservation laws.
Enduring Understanding Learning Objectives
5.E The angular momentum of a system is conserved.
5.E.2.1 The student is able to describe or calculate the angular momentum and rotational inertia of a system in terms of the locations and velocities of objects that make up the system. Students are expected to do qualitative reasoning with compound objects. Students are expected to do calculations with a fixed set of extended objects and point masses. (Science Practice 2.2)
[note: In addition to those listed in the learning objectives above, Science Practice 4.3 is also addressed in this investigation.]
© 2015 The College Board
143

AP
PH
YS
ICS
1 I
NV
ES
TIG
AT
ION
SAP Physics 1 Investigation 7
Skills and Practices Taught/Emphasized in This Investigation
Science Practices Activities
1.4 The student can use representations and models to analyze situations or solve problems qualitatively and quantitatively.
Students include diagrams of objects and experimental setups in order to describe procedures, and they provide qualitative explanations and/or mathematical calculations as part of their analysis.
1.5 The student can re-express key elements of natural phenomena across multiple representations in the domain.
Students support work with written observations of the objects’ motion as part of the analysis, and they include diagrams as part of background and analysis. If the quantitative method is used, students also express the motion with equations and calculations.
2.1 The student can justify the selection of a mathematical routine to solve problems.
If the quantitative method is selected, students use equations and calculations to support predictions about which objects move with greater translational speed at the bottom of the ramp.
2.2 The student can apply mathematical routines to quantities that describe natural phenomena.
Students apply selected mathematical routines to the calculations of speed if the qualitative method is selected.
4.2 The student can design a plan for collecting data to answer a particular scientific question.
Students make decisions about which objects to test, how to design ramps, how to measure translational speed at the bottom of the ramp, and how to appropriately analyze the data.
4.3 The student can collect data to answer a particular scientific question.
Students use observations in the qualitative method or numerical measurements in the quantitative method.
5.1 The student can analyze data to identify patterns or relationships.
Students decide what methods will be used to analyze the data, such as graphing speed at the bottom of the ramp as a function of object radius for objects of the same mass and shape.
[note: Students should be keeping artifacts (lab notebook, portfolio, etc.) that may be used as evidence when trying to get lab credit at some institutions.]
Equipment and Materials Per lab group (three to four students):
▶ Objects of different shapes, masses, and diameters (that can roll down an incline)
▶ Inclined plane or inclined grooved track (with sufficient coefficient of friction that chosen objects only roll and do not slide)
144© 2015 The College Board

AP
PH
YS
ICS
1 INV
ES
TIG
AT
ION
SRotational Motion
▶ Objects to prop up the inclined plane (books, bricks, pieces of wood, clamps on ring stands, etc.)
▶ Metersticks
▶ Rulers
▶ Stopwatch
▶ Mass scale
▶ (Optional) Motion sensor or video analysis tools
The number of different shapes of objects to roll down the incline is up to you, but it is recommended to have at least three. Examples of the most common shapes used include a hoop (a PVC or metal pipe cut into thin pieces); spherical cylinder (small sections of pipe or small metal cans); solid cylinder (samples of different metal cylinders available from lab supply density sets, or 1- and 2-inch wooden dowels cut into short sections); hollow sphere (ping pong ball, tennis ball); and solid sphere (ball bearings, marbles, or wooden balls of various diameters found in craft stores). Other shapes can be included depending on time and teacher preference.
[note: On a larger scale, students can take identical small empty food cans and refill them with various types of solid material (wood putty, cement, marshmallow fluff) and then reseal them. To make objects of the same diameter and radius but different mass, pieces of PVC pipe can be cut and materials can be stuffed inside the PVC pieces to create different masses. note also: If the distribution of mass inside the PVC is different or if the mass inside the PVC can move, that introduces another factor in rotational inertia. The distribution of material inside the pipe pieces must be uniform.]
For the qualitative investigation you will need the same shapes with varying masses and radii so that students have enough to test their predictions and to come to the appropriate conclusions. Examples include a set of spheres of the same diameter but different masses (such as 1-inch steel or wooden balls) or the small metal cans as described above.
The inclined plane can be any material that allows a smooth path for the objects to roll. However, since this investigation may require timing the objects, it is recommended that the length of the inclined plane be more than 1 meter to minimize timing errors. Examples of materials you can use to construct an inclined plane include boards, ring stands, and wood strips or metersticks (which can be taped to the boards to create channels of different widths for objects to roll through). Aluminum sliding door C-channel track also works (it can be cut with a hacksaw and bent into tracks for balls to roll on).
If the analysis is done correctly, students should realize that the masses and radii of the objects do not affect the final linear speed of the objects, making the mass scale and ruler unnecessary.
© 2015 The College Board
145

AP
PH
YS
ICS
1 I
NV
ES
TIG
AT
ION
SAP Physics 1 Investigation 7
Timing and Length of Investigation▶ Total Time: 3.5–4.5 hours
▶ Teacher Preparation/Set-up: 5–10 minutes
Most of this time will be spent gathering the equipment. If you also setup the equipment for students (not highly recommended) or if you need to saw dowels, etc., into sections, more time will be needed.
Qualitative Investigation
▶ Total Student Time: 135–200 minutes
▶ Part I: 45–65 minutes
Prediction/Setup/Observation Time: 10–15 minutes
Data Collection/Calculations: 15–20 minutes
Discussion: 20–30 minutes
▶ Parts II and III: 30–45 minutes each
Prediction/Setup/Observation Time: 10–15 minutes
Data Collection/Calculations: 15–20 minutes
Discussion: 5–10 minutes
▶ Part IV: 30–45 minutes
Prediction/Setup/Observation Time: 5–10 minutes
Answer questions: 15–20 minutes
Discussion: 10–15 minutes
Quantitative Investigation
▶ Total Student Time: 45–65 minutes
Prediction/Setup/Observation Time: 10–15 minutes
Equation Derivation: 15–20 minutes (or more), depending on students’ algebraic abilities; includes equations involving energy analysis and kinematic analysis
Data Collection/Calculations: 15–20 minutes; includes both energy and kinematic calculations
Error Analysis: 5–10 minutes
[note: If you need to fit this investigation into a shorter class period (50–55 minutes), have the prediction/observation portion done on one day, assign the equation derivation portion as homework, and complete the rest of the investigation the next day.]
Safety There are no specific safety concerns for this lab. However, all general lab safety guidelines should always be observed.
146© 2015 The College Board

AP
PH
YS
ICS
1 INV
ES
TIG
AT
ION
SRotational Motion
Preparation and Prelab Students should have previously studied and developed proficiency with applications of kinematics equations to solutions of problems on linear motion. They should also have had previous laboratory experience determining speeds of objects in linear motion. The “Ladybug Revolution” interactive simulation on the PhET web site (see Supplemental Resources) has teacher materials available that provide ideas for student assignments and “clicker” questions to assess students’ understanding of the differences between translational and rotational motion.
Students may have previously done a similar lab for an object sliding down a ramp in which they used a rolling ball. In that situation, they may have already noticed that the ball consistently had less linear speed than predicted by energy calculations. This is an opportunity to build on that lab by giving students the opportunity to rethink the uncertainty in that previous experiment in terms of the rotational kinetic energy of the ball.
If students are still learning experimental protocols, it may be necessary to point out that they need to think about the independent and dependent variables and control other variables. For example, if students are examining the effect of mass on speed of the object, they should keep the object’s radius constant.
The Investigation You have significant leeway here in how to proceed with this investigation. If time is limited, have students proceed with only the qualitative or the quantitative investigation. To make the lab more inquiry based, simply set out a variety of objects (disks, hoops, spheres, etc.) and have students design their own investigation to determine which factors affect the speed of an object after it has rolled to the bottom of a ramp.
QUALITATIVE INVESTIGATION
The qualitative investigation is divided into three parts as follows. Each part may be conducted by each lab group or different parts may be assigned to different lab groups, with the groups sharing their observations in a larger group discussion for final analysis.
Part I: Students investigate the question, “How does the mass of a rolling object affect its final speed at the bottom of an incline if radius and shape are held constant?”
Have students make a prediction about whether heavy or light objects will reach the bottom with more speed. After their predictions are made, they design an experiment with the provided equipment that can be used to answer the investigation question.
© 2015 The College Board
147

AP
PH
YS
ICS
1 I
NV
ES
TIG
AT
ION
SAP Physics 1 Investigation 7
This part of the investigation should lead to two sets of good discussions, within the groups and also in a whole-class debrief. The first set is about control of variables: When comparing heavier versus lighter, did students hold the shape of the objects constant? The second set is about uncertainty: The heavy and light objects will not reach the bottom with exactly the same speed. How do students decide whether the small difference in speed is a “real” difference? Depending on how deep you want to go, this issue could lead to students taking more data, representing the dispersion in their data points in some way, and using those representations to make arguments about whether the differences are real. Ideally, students would choose which representations to create and the all-class discussion would be about which representations most convincingly supported the related arguments. In any case, the class should arrive at a consensus about the (non) effect of mass on final speed before proceeding to Part II. In both the small group and all-class discussions, students should also explain why the mass didn’t matter.
Part II: Students investigate the question, “How does the radius of a rolling object affect its final speed at the bottom of an incline if mass and shape are held constant?”
Students repeat the same type of procedure as in Part I and come to a conclusion. There will be less discussion about controlled variables and uncertainty, since time may have already been spent on this in Part I. More discussion can be devoted to why the radius doesn’t affect the final speed.
Part III: Students investigate the question, “How does the shape of a rolling object affect its final speed at the bottom of an incline if radius and mass are held constant?”
Students again repeat the same type of procedure as in Part I and come to a conclusion. However, this time there should be an obvious difference in the final speeds of the different shapes. More discussion can be devoted to why the shape does affect the final speed and this discussion can lead into energy concepts and the difference between translational and rotational kinetic energies.
Part IV: Students investigate the question, “Would a cart that has four solid disks for wheels have a final speed that is greater than, less than, or equal to the final speed of a single disc that has the same mass as the cart and wheels?”
Students then reason through the question, using observations and conclusions from Part I. In their small groups they work through the following questions to help guide their thinking, and then come together as a class to discuss their results and answers:
148© 2015 The College Board

AP
PH
YS
ICS
1 INV
ES
TIG
AT
ION
SRotational Motion
1. Suppose a cart with four wheels and a disk whose mass is equal to the total mass of the cart roll down the ramp. Which, if either, has more gravitational potential energy at the top?
2. Which of those objects has more kinetic energy at the bottom? Why?
3. Imagine the disk just spinning in place instead of rolling. Would it have kinetic energy? Why?
4. Why does the cart have more speed at the bottom even though it doesn’t have more kinetic energy than the disk? Build upon your answers to questions 1 and 2 to answer.
QUANTITATIVE INVESTIGATION
Give students several objects of different shapes (not necessarily the same mass or radius, but they can be) that are capable of rolling down an incline. Then pose the question: “If each of these objects were rolled down an incline, each starting at the same height, how would their linear speeds compare at the bottom of the incline?” Ask the students to predict the results of the investigation before the investigation is performed.
After the predictions are made, students setup the equipment and allow the different shapes to roll down the incline, finding an appropriate method to measure the speed of each object at the bottom. (For example, students might decide to use a motion sensor to determine speed or might decide to allow each object to roll onto a level section and measure distance and time on that section to calculate linear speed.) After these initial observations are made, students must then take the necessary measurements and complete the required calculations to support their observations.
Students must use the law of conservation of energy to derive equations for the linear speed of each object at the bottom of the incline. To do this, rotational inertia equations (see Equations 1–4 below) for each object and the relationship between linear speed and angular speed will be needed; you can choose to provide these or have students research and find the equations themselves.
Next, ask the students to calculate the linear speed of each shape using kinematics. (For example, students may allow each object to roll off a table onto the floor and measure the range to determine initial speed. Or they may leave a long level section at the bottom of the ramp and measure distance and time for the object after it leaves the slope and rolls along the level section to calculate a velocity.) Necessary measurements need to be made and calculations shown for the kinematic analysis. Students should then do an error analysis since the linear speed should be the same whether it was determined experimentally using kinematics or calculated using measurements and energy conservation. After the investigation is complete, ask students if their predictions were correct. If not, have them explain why the prediction did not match the observations (i.e., resolve inconsistencies).
© 2015 The College Board
149

AP
PH
YS
ICS
1 I
NV
ES
TIG
AT
ION
SAP Physics 1 Investigation 7
The following equations should be provided to students for this investigation:
I mrcylinder = 12
2
[Equation 1]
I mrhoop = 2
[Equation 2]
I mrhollow sphere = 23
2
[Equation 3]
I mrsolid sphere = 25
2
[Equation 4]
v rcm = ω[Equation 5]
E Einitial final= [Equation 6]
Students should be able to derive these equations for their use in the experiment:
U K Kgravitational translational rotationalD = D + D[Equation 7]
12
12
2 2mg h m v I ω( ) ( )D = D + D
[Equation 8]
The following equations are the results students should get for the final speed of each shape at the bottom of the incline using conservation of energy. (You might prefer students to derive an equation for an object of I = kmr2 and then substitute k for each of the shapes.)
v ghcylinder = 43
[Equation 9]
v ghhoop =
[Equation 10]
v ghhollow sphere = 65
[Equation 11]
v ghsolid sphere = 107
[Equation 12]
150© 2015 The College Board

AP
PH
YS
ICS
1 INV
ES
TIG
AT
ION
SRotational Motion
Extension
Small student groups select an activity or sport that operates on wheels, such as bicycle racing or skateboarding. Each group researches wheel design and how it relates to the performance in that activity. They should incorporate conclusions from the lab in their final reporting to the class. Each group should also include a diagram of the wheels and how the structure relates to the activity, estimating rotational inertia, if possible.
A more challenging experiment might be for students to repeat part or all of their investigative procedures with objects and ramp heights where the object slides and rolls (rolls with slipping) down the ramp. This would be a qualitative investigation, as the quantitative measurements and calculations are beyond the scope of the course.
Common Student ChallengesFirst, students may have an incomplete understanding of the role of friction. If each object rolls without sliding, the friction force is necessary to provide the torque to roll the object. Without friction, the object would not roll but would slide down the ramp. Since both investigations presented in this lab introduce a new topic, they are not designed to deal with specific misconceptions or conceptual challenges. However, they will demonstrate that different shapes roll/rotate differently, and that the final speed of the object at the bottom of the incline does not depend on the mass or radius of the object, which may be surprising to many students.
Since they have been taught and have learned that objects of different mass fall at the same rate with no air resistance and that those same objects will slide down an incline at the same rate if there is no friction, students may predict that all the objects will roll down the incline and reach the bottom at the same time and with the same speed. The observations made in either investigation may surprise some students. It is important to bring the discussion around to what causes objects to roll and help students justify that what they have learned in the case of no friction is still valid.
In the quantitative investigation, the biggest challenge students face is the derivation of the equations for the final speeds of the objects using the conservation of energy, because they are usually not yet familiar with the rotational inertia equations and the equation that relates linear speed to angular speed. A possible way to help students is to show them an example of a derivation in class, using the equations from the AP Physics 1 Equations Sheet using a shape not involved in the investigation. Then students may derive the necessary equations for those shapes that will be used. You might want to limit the number of shapes so that students can spend more time on developing an understanding of the underlying concepts rather than getting bogged down in the algebra. It depends on how much class time you have to devote to the investigation and how comfortable your students are with algebraic manipulation.
© 2015 The College Board
151

AP
PH
YS
ICS
1 I
NV
ES
TIG
AT
ION
SAP Physics 1 Investigation 7
Analyzing Results
Qualitative Investigation:
One method of having students analyze their results is to compare their observations to the predictions made at the beginning of the investigation. If the prediction does not match the observations, then ask students to explain/resolve the inconsistencies. This means that students need to provide an explanation of WHY they obtained the observed results. This can be done in small groups and then reported to the larger group for discussion and refinement prior to conducting the quantitative investigation.
Quantitative Investigation:
Students should calculate the percent difference between the theoretical energy analysis and the experimental finding using the kinematic method.
% differenceresult fromenergy analysis result
=− ffrom kinematic method
average of the two results×1100%
You could also ask them to identify sources of uncertainty in measurement, identify the source of the largest uncertainty, and explain what can be done to minimize the uncertainty if the experiment were performed again.
Possible questions you could ask during postlab discussions, or provide for students to consider during their laboratory analysis, include:
1. How well do the final linear speeds, calculated using the theoretical energy analysis and determined by experiment, compare to your predictions? Does one method consistently produce a larger or smaller value? Why?
2. What specific evidence from this investigation supports your answer?
3. How does the rotational inertia of a rolling object affect its final speed at the bottom of an incline?
4. What specific evidence from this investigation supports your answer?
5. Suppose you repeated the experiment with objects of the same radius but larger masses. Would the results of this investigation change? If so, how? If not, why not?
6. Suppose you repeated the experiment with objects of the same mass but larger radii. Would the results of this investigation change? If so, how? If not, why not?
7. If the objects in this investigation were not rolling down an incline, but were each just rotating on their own stationary, fixed axis located through the center of the object, would the mass of the object have an effect on the rotational inertia of the object? Why?
8. If the objects in this investigation were not rolling down an incline, but were each just rotating on their own stationary, fixed axis located through the center of the object, would the radius of the object have an effect on the rotational inertia of the object? Why?
152© 2015 The College Board

AP
PH
YS
ICS
1 INV
ES
TIG
AT
ION
SRotational Motion
9. Based on your observations in this investigation, rank the following objects, which all have the same mass, in terms of rotational inertia, largest to smallest. Explain the reasoning for your ranking.
10. If you were to allow these three objects to roll from rest down an incline simultaneously, in what order would they reach the bottom? Why?
You can either create or find other qualitative and quantitative questions and problems, such as TIPERS (ranking tasks) that would be an effective measure of students’ understanding (see Supplemental Resources).
Assessing Student Understanding Qualitative Investigation:
After completing this investigation, students should be able to:
▶ Demonstrate an understanding of what rotational inertia means;
▶ Explain how and why different shapes roll/rotate differently using evidence from the investigation;
▶ Develop ideas and questions about how and why the location of the mass of a rotating object affects the ease or difficulty of rotating that object and experimental means of verifying this; and
▶ Design and analyze an experiment to test the rotational properties of objects of various shapes, masses, and radii.
Quantitative Investigation:
Students will also be able to:
▶ Use measurements to calculate the speed of an object after it rolls to the bottom of a ramp based on conservation of energy principles;
▶ Use an experimental method to determine the speed of an object after it rolls to the bottom of a ramp based on kinematic principles; and
▶ Relate calculations of speed of a rolling object at the bottom of a ramp to a specific aspect of the physical properties of the object, when other factors are held constant.
The quantitative investigation is not intended to get students to derive rotational inertia equations. The equations are given to students or students acquire them for the purpose of using them in the investigation.
© 2015 The College Board
153

AP
PH
YS
ICS
1 I
NV
ES
TIG
AT
ION
SAP Physics 1 Investigation 7
Assessing the Science Practices
Science Practice 1.4 The student can use representations and models to analyze situations or solve problems qualitatively and quantitatively.
Proficient Uses diagrams of objects of various shapes to describe the rotational motions of those objects, both verbally and mathematically.
Nearly Proficient Uses diagrams of objects to determine rotational motions of those objects in most cases, and/or uses equations to describe rotational motions for most shapes.
On the Path to Proficiency
Partially applies diagrams to the analysis of the rotational motion of several shapes or applies equations to the analysis of the motions of several shapes.
An Attempt Uses only one type of model — either a diagram or kinematic equation — to analyze the motion of a shape.
Science Practice 1.5 The student can re-express key elements of natural phenomena across multiple representations in the domain.
Proficient Applies qualitative observations accurately for all the shapes used, and/or correctly makes mathematical derivations for all the shapes provided.
Nearly Proficient Applies qualitative observations to correct conclusions for most of the shapes provided or to derive most mathematical relationships correctly for the quantitative method.
On the Path to Proficiency
Applies qualitative observations to correct conclusions for several shapes or to derive more than one (but not most) mathematical relationship(s) correctly for the quantitative method.
An Attempt Applies qualitative observations to correct conclusions for only one shape or to derive only one mathematical relationship correctly for the quantitative method.
154© 2015 The College Board

AP
PH
YS
ICS
1 INV
ES
TIG
AT
ION
SRotational Motion
Science Practice 2.1 The student can justify the selection of a mathematical routine to solve problems.
Proficient Selects all the appropriate equations applying to various shapes and correctly relates variable for linear and rotational motion in a conservation of energy statement.
Nearly Proficient Selects all the appropriate equations but unable to connect them to all the correct shapes. Possibly addresses conservation of energy with some errors in the derivation.
On the Path to Proficiency
Selects some appropriate equations but unable to connect them to all the correct shapes. Possibly addresses conservation of energy with equations, but not correctly.
An Attempt Selects some appropriate equations but unable to connect them to the correct shapes. [Applies to quantitative method only.]
Science Practice 2.2 The student can apply mathematical routines to quantities that describe natural phenomena.
Proficient Correctly calculates rotational inertia for all shapes, and correctly applies these calculations to determination of velocity using conservation of energy.
Nearly Proficient Calculates rotational inertia for most shapes, and calculates velocity from energy conservation with minor errors.
On the Path to Proficiency
Makes some calculations, but they are incomplete; for example, missing some shapes or with a consistent error throughout.
An Attempt Unable to make complete or correct calculations for any of the shapes, though an attempt is made for each shape.
Conservation of energy calculations are missing or incomplete. [Applies to quantitative method only.]
© 2015 The College Board
155

AP
PH
YS
ICS
1 I
NV
ES
TIG
AT
ION
SAP Physics 1 Investigation 7
Science Practice 4.2 The student can design a plan for collecting data to answer a particular scientific question.
Proficient Designs a plan that is appropriate, clearly thought out, and clearly described. Presents an oral or written laboratory report that has all of the following elements: labeled diagram of the setup, succinctly outlined procedure, multiple trials, clearly shown derivation of mathematical model used (if qualitative treatment is pursed).
Nearly Proficient Designs a plan that is well thought out with good experimental controls but with a weakness that may affect one set of conclusions or is not clearly described. Offers an oral or written laboratory report that is missing one of the following elements: labeled diagram of the setup, succinctly outlined procedure, multiple trials, clearly shown derivation of mathematical model used (if qualitative treatment is pursed).
On the Path to Proficiency
Designs a plan for the assignment given (quantitative or qualitative or a particular shape) that is generally well thought out but has a flaw (e.g., trying to compare 1” steel balls to 2” wooden balls) that will affect results. Offers an oral or written laboratory report that is missing a significant number of essential elements and contains many errors in labeling, identification, mathematical calculations, and derivations.
An Attempt Fails to think out the design plan for the assignment given (quantitative or qualitative or a particular shape) well enough to get relevant results from the experiment.
Science Practice 4.3 The student can collect data to answer a particular scientific question.
Proficient Collects all relevant data on all rotational shapes, organized in a data table with appropriate units.
Nearly Proficient Collects all relevant data with some important element missing (e.g., units).
On the Path to Proficiency
Collects data but some relevant data is missing or there are not an appropriate number of trials.
An Attempt Collects minimal data and presentation is not coherent.
Science Practice 5.1 The student can analyze data to identify patterns or relationships.
Proficient Presents a complete analysis, addressing all aspects of the data, includes analysis of sources of uncertainty, and compares results using the energy method to the kinematic method.
Nearly Proficient Presents a mostly complete analysis with only some flawed conclusions or final calculations, or doesn’t make an attempt at error analysis.
On the Path to Proficiency
Clearly states data and/or observations but analysis methods are somewhat incomplete or contain some flawed conclusions.
An Attempt Attempts an analysis but the approach is flawed.
156© 2015 The College Board

AP
PH
YS
ICS
1 INV
ES
TIG
AT
ION
SRotational Motion
Supplemental ResourcesHieggelke, Curtis, J., David P. Maloney, Steve Kanim, and Thomas L. O’Kuma. TIPERs: Sensemaking Tasks for Introductory Physics. Boston: Addison-Wesley, 2013.
“Ladybug Revolution.” PhET. University of Colorado Boulder. Accessed September 1, 2014. http://phet.colorado.edu/en/simulation/rotation. [In this simulation students can move a ladybug to different locations on a rotating disk and observe the rotational speed and rotational inertia of the system, as well as several other variables.]
Rolling Ranking Tasks Solutions. College Board. Accessed September 1, 2014. http://apcentral.collegeboard.com/apc/public/repository/ap07_Rolling_Ranking_Tasks_Solutions.pdf.
© 2015 The College Board
157

This page is intentionally left blank.