ap møller holding a/s annual report
122
A.P. MØLLER HOLDING A/S ANNUAL REPORT 2019
-
Upload
khangminh22 -
Category
Documents
-
view
1 -
download
0
Transcript of ap møller holding a/s annual report

A.P. MØLLER HOLDING A/S ANNUAL REPORT 2019

A.P. MØLLER HOLDING A/S ANNUAL REPORT 2019 · MANAGEMENT REVIEW
0

A.P. MØLLER HOLDING A/S ANNUAL REPORT 2019 · MANAGEMENT REVIEW
3
CONTENTS
The Annual Report of A.P. Møller Holding A/S (hereafter referred to as A.P. Moller Holding), includes the financial statements of A.P. Møller - Mærsk A/S (A.P. Moller - Maersk), Danske Bank A/S (Danske Bank), The Drilling Company of 1972 A/S (Maersk Drilling), Maersk Tankers A/S (Maersk Tankers), Maersk Product Tankers A/S (Maersk Product Tankers), KK Wind Solutions Holding A/S (KK Wind Solutions), and A.P. Møller Capital P/S (A.P. Moller Capital) as well as the financial statements of A.P. Moller Holding’s investment companies. A.P. Moller Holding is the parent company of the A.P. Moller Group (the Group) which includes all the above mentioned companies. The term A.P. Moller Holding group (the group) is used in the Annual Report for controlled and consolidated companies. The 2018 comparative figures are stated in brackets. The financials are impacted by the implementation of IFRS 16.
MANAGEMENT REVIEW 4 Letter from the CEO .................................................................................................... 5 Five year summary ....................................................................................................... 9 Financial performance ............................................................................................. 10 Investment strategy .................................................................................................. 14
Our holdings 16 A.P. Moller - Maersk ................................................................................................. 18 Danske Bank .............................................................................................................. 20 Maersk Drilling .......................................................................................................... 22 Maersk Tankers ......................................................................................................... 24 Maersk Product Tankers .......................................................................................... 26 KK Wind Solutions .................................................................................................... 28 A.P. Moller Capital .................................................................................................... 30
Our leadership 32 Board of Directors .................................................................................................... 33 Executive Board & leadership team ....................................................................... 34
Our CSR & Risk management 36 Corporate social responsibility ............................................................................... 38 Risk management ..................................................................................................... 39
FINANCIAL STATEMENTS 40
Consolidated financial statements 42 Parent company financial statements 102
REPORTS 114 Management’s Statement ..................................................................................... 117 Independent Auditor’s Report .............................................................................. 118

A.P. MØLLER HOLDING A/S ANNUAL REPORT 2019 · MANAGEMENT REVIEW
4
MANAGEMENT REVIEW
A.P. MØLLER HOLDING A/S ANNUAL REPORT 2019 · MANAGEMENT REVIEW

A.P. MØLLER HOLDING A/S ANNUAL REPORT 2019 · MANAGEMENT REVIEW
5
ROBERT M. UGGLA CEO
The A.P. Moller Group reflects on another eventful year. Finan-cially, it ended on a fairly satisfactory note, with a 2019 revenue of DKK 275bn, a net result of DKK 6.6bn and consolidated assets of DKK 462bn (consolidated equity of DKK 263bn). A.P. Moller Holding, the Group’s parent company, remains debt free and saw a net cash inflow of DKK 5.1bn. The gap between book value of equity and market value of equity was reduced during the year, alt-hough portfolio company returns have to improve further for such discount to be completely removed. While the overall financial figures and year-on-year development paint a relatively rosy picture, and we acknowledge the many posi-tive steps taken over the last year to strengthen our portfolio com-panies’ market position and the balance sheets of the Group, we are mindful of the recent, very negative developments and dark clouds on the horizon, resulting from the COVID-19 pandemic. A.P. MOLLER - MAERSK TURNS A PAGE Our portfolio’s single biggest holding, A.P. Moller - Maersk, con-cluded its separation process in 2019. The objective has been to create sufficient focus on the various businesses, which have their
own set of opportunities and challenges, to increase capital disci-pline and enhance agility. This means that companies like Maersk Tankers and Maersk Drilling now operate with their own manage-ment teams and boards, who have relevant expertise in these spe-cific industries. We believe all our group companies will continue to benefit from being part of the A.P. Moller Group, which encom-passes a deep network of talent and know-how, but is based on a structure of independent companies, and not a corporate con-glomerate. Moreover, following A.P. Moller - Maersk’s sale of Maersk Oil, our Group has divested the portfolio’s single biggest exposure to hydrocarbons, including the abandonment liabilities of our oil activities, seemingly at an opportune point in the cycle. A.P. Moller - Maersk’s strategy entails leveraging the liner activi-ties’ customer footprint, to provide an enhanced service and build a stronger presence ashore, through continued investments in the terminal and related infrastructure activities and in container related logistics. The financial merits of investments in infrastruc-ture activities are well proven at this point, and we recognise the continued good performance of A.P. Moller Terminals in 2019, while the logistics acquisitions carry more uncertainty, as it is an area where A.P. Moller - Maersk has less of a record. With this in mind, we are encouraged by the approach of A.P. Moller - Maersk to make small logistics investments initially, to assess how to best adjust the operating model and harness promising synergies. As owners, we are also glad to see the increased capital discipline of A.P. Moller - Maersk, which is vital for the company in the coming period of great macro-economic uncertainty and slowdown in trade. While the demerger of Maersk Drilling has started out as a bumpy ride, and with more headwind in 2020’s depressed oil environ-ment, we are grateful that the company has been separated from the container related activities allowing sufficient focus on its own activities. Maersk Drilling has a strong team in place, second to none balance sheet, a fairly robust backlog of contracts and a dedicated Board of Directors. The latter is not just highly qualified, but also one of the most diverse boards of all listed companies in Denmark.
LETTER FROM THE CEO
A.P. MØLLER HOLDING A/S ANNUAL REPORT 2019 · MANAGEMENT REVIEW

A.P. MØLLER HOLDING A/S ANNUAL REPORT 2019 · MANAGEMENT REVIEW
6
With the recent election of new Directors, the company now have a board with five different nationalities, of which four are women and five men. As a separate listed company, we expect that Maersk Drilling may have more flexibility and options to find struc-tural opportunities in what has become a very distressed industry. In 2019, Maersk Tankers continued its transformation journey, initi-ated after A.P. Moller Holding acquired the company from A.P. Moller - Maersk. Having separated out its entire fleet of assets in a new company (Maersk Product Tankers), Maersk Tankers is now an asset light, agile services platform, using software to optimise vessel flows and reduce the carbon footprint of tramp shipping. 2019 was a momentous year for the company, as it became profitable in its own right, and with a growing fleet of vessels under management - out of the 200 vessels, a majority come from third party vessel owners. We are equally encouraged by the development of A.P. Moller Capital, trying to be part of the bigger solution for a continent, holding 60% of the world’s population growth. Africa is in dire need of foreign direct investments to create economic growth for a young workforce, in order to pre-empt the spread of poverty, radicalisation and large-scale migration. In 2019, A.P. Moller Capital expanded its team of investment professionals and industry advisors, and pursued several projects to support Africa’s significant demand for energy and transport infrastructure. A.P. Moller Capital has just started its journey and we look forward to following its progress in the coming years. DANSKE BANK MOVES FORWARD During 2019, A.P. Moller Holding was pleased to see fundamental changes to the board and management of Danske Bank, as a first step in regaining the credibility of the bank. The new CEO, Chris Vogelzang, is facing a highly challenging leadership task, as he
has to rebuild trust in the bank from customers and society at large, but also improve its financial situation. We have a belief that Denmark benefits from a large-scale bank with its headquarters in Copenhagen, not least because the bank is a source of vital knowledge, talent and capital for the local business community. We welcome and support Chris and his team’s societal and financial plans for the bank. Our ownership in the bank is based on the premise that the bank acts with integrity and that it gene-rates an attractive risk adjusted return over the cycle. In our view, this is essential for any bank to remain independent in a global consolidating banking industry. We are witnessing an increased regulatory burden on banks. If fi-nancial institutions fail to live up to society’s expectations of them, as was the case with Danske Bank, relevant directors of such com-panies should be replaced at the general meeting by the share-holders. As owners and through our participation in several board nomination committees, we are seeing a worrying trend that many qualified directors no longer have an interest in joining the boards of financial institutions, especially in Denmark. Potential directors express concerns about the personal liabilities of being on a bank board (exemplified by the Amagerbanken case), an overwhelming work burden (a single board meeting of a Danish bank may in-clude more than a thousand pages of pre-reading) and with less time available in the boardroom for strategic, commercial and technology related topics. Politicians and regulators should closely follow this development as the Nordic financial sector needs directors with integrity, who hold relevant experience and domain expertise, including from the
Performance vs. indices CAGR
2015 2016 2017 2018 2019 (2015-2019)
Our Net Asset Value Index (DKK) 106,871 134,229 135,857 98,085 116,605 2.2% MSCI World Index (DKK) 11,421 12,345 13,025 12,282 15,694 8.3% SCFI Index (USD) 837 952 824 911 959 3.4% Brent oil price (per BBL, USD) 37 57 67 54 66 15.3%

A.P. MØLLER HOLDING A/S ANNUAL REPORT 2019 · MANAGEMENT REVIEW
7
financial sector and from the technology sector. From our vantage point, making a director’s role more attractive in financial institu-tions is as pressing as it is paramount for the long-term viability of the sector. Regulation alone, will not create a better banking system. We need to be able to attract the best qualified managers and directors to the sector. THE INVESTMENT STRATEGY EVOLVES FROM OUR HISTORY An important part of our mission is to ensure the Group remains relevant over time. Some of our future direction is guided by our past learnings. As the shipping industry moved from sail to hydrocarbons, more than a century ago, the master Peter Mærsk Møller and his son Arnold Peter founded, what is today, the A.P. Moller Group. The initial investments were tramp ships, propelled by coal and steam, but soon the company became more diversified. Much of the Group’s value creation came as a result of the two great tailwinds of the 20th century: the rise of the combustion engine, which created demand for oil products, and the rise of trade, creating demand for shipping. As a Group, we have so far managed to navigate difficult waters, and survive hardship, whether it has been world wars or great recessions, but we are now facing maybe our most daunting task: how to revive the Group’s growth prospects, by finding the next tailwind. An important part of our long-term continued importance and relevance will happen in our current portfolio businesses. As an example, A.P. Moller - Maersk is at the forefront of trying to address the global shipping industry’s carbon footprint (today the shipping industry emits 2-3% of all greenhouse gases). A.P. Moller - Maersk’s vocal industry leadership and 2050 zero carbon plan does not only make sense for society and our environment, but is also integral to creating a viable business model long-term. The A.P. Moller Group’s continued importance and relevance is also closely linked to A.P. Moller Holding’s plans to invest in and develop a portfolio of new companies. Over the last 1.5 years, we have hired a diverse team of highly capable investment profes-sionals, who have worked diligently on defining our investment
strategy and developing a pipeline of opportunities. This invest-ment strategy is based on three important criteria: Firstly, we invest in companies and activities that have a positive impact on society. In the 1950s, our family established the A.P. Moller Foundation, the ultimate owner of A.P. Moller Holding, to secure the long-term ownership of the Maersk activities, and, as it is specifically spelled out in the charter, to re-invest proceeds in ‘nyttig virksomhed’. This mindset of being a good corporate citi-zen running a profitable business, while also supporting wide ranging societal goals, is also an important parameter for our future investments. Secondly, we invest in companies benefiting from long-term macro tailwinds. As long-term owners of companies, we rely on the overall macro environment of such companies. Thirdly, we invest in companies, where we, as engaged owners, can impact the outcome or degree of success and add value, e.g. by bringing certain insights or networks to the table or attracting highly qualified and talented directors. In this respect, we are also mindful that there are better owners for certain industries, where we as a Group do not have the relevant expertise or capabilities. NEW INVESTMENTS IN THE RESOURCE EFFICIENCY SEGMENT The above three criteria were fulfilled when we acquired KK Wind Solutions during 2019. The investment case started with an extensive review of how the increased demand for resource efficiency impacts industries, such as the shift to green power and energy, including electrification. We eventually turned our sights to KK Wind Solutions, which is a world leading supplier of electromechanical systems and solu-tions to the wind industry, with products today generating wind power to approximately five million additional homes every year. KK Wind Solutions is not only benefiting from the strong and global long-term demand for wind power, but also from a general industry trend with large OEM’s outsourcing a bigger part of their production to suppliers like KK Wind Solutions, to reduce costs and capital deployed.
Access to goods, energy and financial services remains the
backbone of a well-functioning society. In this respect, I am encouraged to see how our
organisations take necessary precautions to minimise the risks
for our employees and their families, while we try our best to continue to
serve our communities across the world.
A.P. MØLLER HOLDING A/S ANNUAL REPORT 2019 · MANAGEMENT REVIEW
8
KK Wind Solutions is headquartered in Denmark, but with a desire to follow its customers to other parts of the world, with new inte-resting projects in Asia and the Americas. We are excited to be part of KK Wind Solutions’ journey to build an industrial champion in the renewables space, to create meaningful jobs in Denmark and internationally and to be part of the solution for the green energy transition. We are also excited that the KK Wind Solutions team is part of our network, as they bring new important insights and capabilities to our Group. A.P. Moller Holding is also exploring the opportunity to establish a geothermal company, with a team of highly talented and qualified colleagues, who hold vast knowledge and experience from the upstream industry. The objective of our incubation effort is to develop geothermal energy for district heating in Denmark and, potentially, internationally. The Aarhus municipality stands out in its ambition to create Europe’s biggest geothermal plant, as a greener and more sustainable replacement of biomass. However, the viability of the project largely depends on the government implementing a robust regulatory framework, to enable what con-stitutes an investment of up to several billion DKK in a new form of green energy. KUDOS TO OUR TEAMS As a concluding remark, let me as CEO extend my sincere thanks to our team members in A.P. Moller Holding for their relentless efforts, long hours and valuable contributions during 2019. We are blessed to have a team of talent, who often stand out in their en-deavours, and with a joint desire to not just build a great company, but also a company that makes a real difference, as owner and investor. I would also like to extend my gratitude to the many hard-working and diligent directors and executives in our portfolio companies, for their many efforts and for a constructive dialogue with A.P. Moller Holding. At times, we may appear to be very demanding owners, but we share the same long-term aspirations and passion for our portfolio companies. I know the entire team of A.P. Moller Holding feels very blessed to be part of the same Group and net-work as you!
A BLACK SWAN AND STORM: COVID-19 As the last decade was coming to an end, the world suddenly found itself in dire straits. At the time of writing this letter, COVID-19 is having a profound impact on our society and economy in many ways. Lives and livelihoods have been extinguished by the virus. Most of our businesses are hit very hard by the pandemic and the economic outlook is uncertain. We have faced adversity in the past. I am confident that we have the means and capabilities to also overcome these challenges, by working closely together and by applying ‘constant care’. Access to goods, energy and financial services remains the backbone of a well-functioning society. In this respect, I am encouraged to see how our organisations take necessary precautions to minimise the risks for our employees and their families, while we try our best to continue to serve our communities across the world. As seafarers have said for centuries: make sure to keep one hand for yourself and one for the ship for a safe voyage.
We believe all our group companies will continue to benefit from being
part of the A.P. Moller Group, which encompasses a deep network of
talent and know-how, but is based on a structure of independent
companies, and not a corporate conglomerate.

A.P. MØLLER HOLDING A/S ANNUAL REPORT 2019 · MANAGEMENT REVIEW
9
FIVE YEAR SUMMARY
Amounts in DKKm 2019 2018 2017 2016 2015
INCOME STATEMENT Revenue 275,032 262,613 220,930 207,171 230,777 Share of profit in associated companies 3,944 2,201 4,863 502 3,200 Profit/loss before financial items (EBIT) 15,187 10,325 - 5,276 - 9,318 27,225 Financial items, net - 5,281 - 2,891 - 4,290 - 4,003 - 2,982 Profit/loss for the year 6,577 22,464 - 2,991 - 11,051 7,656 A.P. Møller Holding A/S share of profit/loss 4,772 10,942 1,388 - 1,349 3,466 Average number of employees 88,006 86,113 82,306 83,737 83,934
BALANCE SHEET Total assets as of 31 December 462,222 413,113 435,298 464,366 458,279 Equity as of 31 December 262,940 255,758 229,502 256,376 267,107
CASH FLOW STATEMENT Cash flow from operating activities 43,846 24,795 25,011 11,715 32,332 Purchase of property, plant and equipment - 16,037 - 19,857 - 38,927 - 15,818 - 32,957
FINANCIAL RATIOS Return on equity 2.5% 9.3% - 1.2% - 4.2% 2.9% Equity ratio 56.9% 61.9% 52.7% 55.2% 58.3%
The five-year key figures are based on the consolidation for A.P. Moller Holding group and have been adjusted for discontinued operations (Maersk Oil).
IFRS 16 Leases have been applied from 1 January 2019 in accordance with the modified retrospective approach. Therefore, comparative figures from
previous periods (2015-2018), are not adjusted.
A.P. MØLLER HOLDING A/S ANNUAL REPORT 2019 · MANAGEMENT REVIEW
HIGHLIGHTS A.P. Moller - Maersk completed its transformation to become a focused global container integrator by the successful demerger and subsequent listing of The Drilling Company of 1972 (Maersk Drilling) in April 2019. A.P. Moller - Maersk initiated a share buy-back programme running for 15 months at a total value of DKK 10bn. A.P. Moller Holding is participating pro-rata.
Following the election of the new chairmanship in late 2018, Danske Bank has spent 2019 focusing on establishing the new leadership team, which can regain trust and drive the develop-ment of the bank to reach its potential. Also, Danske Bank launched its new strategy ‘Better Bank 2023’.
A.P. Moller Holding holds a 41.6% stake in Maersk Drilling following its separate stock listing. The offshore drilling industry has in recent years been challenged by subdued activity; how-ever, Maersk Drilling has a strong competitive position with unique assets, a solid revenue backlog and a strong balance sheet.
Maersk Tankers operates as a platform company and saw solid improvement during the year. Furthermore, Maersk Tankers launched a number of digital solutions including SimBunker and applications aiming at reducing the tramp shipping industry’s CO2 emissions, while optimising earnings for the vessel owners.
Maersk Product Tankers benefited from the improved tanker markets during 2019 with rates reaching a ten-year high. The im-proved markets supported the efforts of optimising the fleet during 2019 through a total of 25 vessel transactions.
A.P. Moller Capital closed the first investment in the “Africa Infra-structure Fund I’. The fund has developed its investment pipeline in 2019 and in Q1 2020 closed further investments resulting in total capital committed, reaching approximately 1/3 of the total committed funds of USD 1bn.
A.P. Moller Holding continued the progress on its geothermal project and advanced the dialogue with Aarhus municipality on delivering geothermal energy.
A.P. Moller Holding made its first direct investment outside of the Maersk group of companies by acquiring KK Wind Solutions in September 2019. The company is a global leader in the wind turbine supply industry and saw revenue growth of 40% in 2019.
9

A.P. MØLLER HOLDING A/S ANNUAL REPORT 2019 · MANAGEMENT REVIEW
10
A.P. Moller Holding is the parent company of the fully consoli-dated activities of A.P. Moller - Maersk, Maersk Drilling, Maersk Tankers, Maersk Product Tankers, KK Wind Solutions, A.P. Moller Capital and the financial activities of A.P. Moller Holding and accounts for its share of Danske Bank’s results. A.P. Moller Hold-ing delivered a consolidated revenue of DKK 275bn, a net result of DKK 6.6bn and consolidated equity of DKK 263bn. Operating profit and earnings for the continuing operations increased com-pared to 2018, reflecting improvements in the underlying perfor-mance mainly in A.P. Moller - Maersk and Maersk Product Tankers. Our financial portfolio also contributed positively to the overall results supported by strong financial markets. A.P. Moller Holding recorded a cash inflow from its holdings of DKK 5.1bn and spent DKK 1.5bn on new direct investments. The cash flow from investment activities ended at DKK 140m when adjusting for the activity in the financial investment portfolio. Net asset values increased by 19% with mainly A.P. Moller - Maersk driving the recovery in 2019 in a mixed portfolio. Danske Bank’s share price declined 19%, A.P. Moller - Maersk’s share
price increased 37% and Maersk Drilling saw a decline following the listing date. The privately-owned portfolio has developed posi-tively throughout the year. In April 2019, Maersk Drilling was separated from A.P. Moller - Maersk and listed on Nasdaq Copenhagen. On the day of listing, DKK 4bn of value was generated from the separation compared to prior date closing prices. In September 2019, A.P. Moller Holding acquired all shares in KK Wind Solutions, a market leading manufacturer and developer of systems and technology for on- and offshore wind turbines. OPERATING ACTIVITIES Revenue for 2019 grew with 4.6% to DKK 275bn (DKK 263bn), as a result of the acquisition of KK Wind Solutions and increased activ-ity in Maersk Product Tankers, partly offset by flat and declining revenues in A.P. Moller - Maersk and Maersk Drilling. Total income in Danske Bank increased by 2.6%. The financial result was impacted by a number of positive non-recurring items.
FINANCIAL PERFORMANCE
A.P. Moller Holding delivered a consolidated result of DKK 6.6bn (DKK 22.5bn) and a return on equity of 2.5% (9.3%). We benefited from cash inflow of DKK 5.1bn, seeing net asset values increased to DKK 117bn.
A.P. MØLLER HOLDING A/S ANNUAL REPORT 2019 · MANAGEMENT REVIEW
REVENUE* (DKKm)
TOTAL ASSETS* (DKKm)
CONSOLIDATED EQUITY (DKKm)
*) IFRS 16, Leases has been implemented as from 1 January 2019
230,777 207,171
220,930
262,613 275,032
2015 2016 2017 2018 2019
458,279 464,366
435,298
413,113
462,222
2015 2016 2017 2018 2019
267,107
256,376
229,502
255,758
262,940
2015 2016 2017 2018 2019
10

A.P. MØLLER HOLDING A/S ANNUAL REPORT 2019 · MANAGEMENT REVIEW
11
Volatile financial markets, low interest rates, margin pressure and higher impairments impacted the bank’s trading results nega-tively. TOTAL COSTS Operating costs declined with 1% during 2019, mainly related to a lower cost base in A.P. Moller - Maersk due to strong capacity management and lower bunker prices. A.P. Moller Holding’s administrative costs have increased as a result of the continuing development of the organisation, which is managing the company’s reporting, compliance and investment functions. We have hired 14 new employees during 2019, mainly to strengthen our investment team further. At the end of 2019, the organisation counted 37 employees, up from 23 the year before. EBITDA Our operational profit increased to DKK 42.2bn from DKK 28.6bn in 2018, partly due to the implementation of IFRS 16, and reflects a flat cost development and improved revenue especially in A.P. Moller - Maersk’s Ocean and Terminals & Towage segments. Maersk Product Tankers is another main contributor to the improvements. EBIT EBIT increased to DKK 15.2bn from DKK 10.3bn in 2018, reflecting the implementation of IFRS 16, the improved profitability in our holdings as well as improvement in the performance of associated companies. Our share of profit from associated companies increased to DKK 3.9bn from DKK 2.2bn in 2018. EBIT was nega-tively impacted by net impairments mainly related to A.P. Moller - Maersk. FINANCIAL EXPENSES The financial expenses ended at DKK 9.9bn (DKK 9.6bn) and net financial expenses increased with DKK 2.4bn to DKK 5.3bn reflec-ting interest expenses on lease liabilities due to the implementa-tion of IFRS 16 partly set off by the lower interest rate levels and reduced borrowings.
TAX Tax for the year amounted to DKK 3.3bn compared to DKK 2.7bn in 2018, reflecting the higher activity levels. The corporate tax rate is affected by the allocation of net profit before tax between tonnage tax and other activities. PROFIT FOR THE YEAR Profit for the year dropped to DKK 6.6bn from DKK 22.5bn in 2018. The 2018 result was positively impacted by a gain of DKK 16.4bn relating to A.P. Moller - Maersk’s sale of Maersk Oil. A.P. Moller Holding’s share of the profit ended at DKK 4.8bn, a decline of DKK 6.2bn compared to 2018. The results were positively impacted by an increase in the USD average exchange rate of 5.6% compared to last year, as A.P. Moller - Maersk, Maersk Drilling, Maersk Tankers and Maersk Product Tankers report in USD. The result for the year was in line with our expectations, with the continuing operations in general seeing improvement of results in our holdings. EQUITY As of 31 December 2019, total equity amounted to DKK 263bn (DKK 256bn) reflecting an increase of 2.7%. The improvement was mainly the result of the distribution of net profit for the year as well as exchange rate adjustments. The return on equity amounted to 2.5% (9.3%) and on equity ratio 56.9% (61.9%). A.P. Moller Holding’s share of the equity increased to DKK 133bn (DKK 126bn) corresponding to 5.6%. DIVIDEND Based on the financial result for 2019, the Board of Directors pro-poses a dividend of DKK 250m to A.P. Møller og Hustru Chastine Mc-Kinney Møllers Fond til almene Formaal (A.P. Moller Founda-tion).
IFRS16 has impacted EBITDA positively by DKK 7.6bn
compared to 2018.

A.P. MØLLER HOLDING A/S ANNUAL REPORT 2019 · MANAGEMENT REVIEW
12
INVESTMENT ACTIVITY We have continued to build our investment team during 2019 and have concluded our investment strategy, which is further described on page 14-15. Cash flow used for investing activities was mainly impacted by the acquisition of KK Wind Solutions. The remaining part of invest-ment activities relates to the development in our financial invest-ment portfolio. The total capital inflow from dividends and share buy-back programmes was DKK 5.1bn (DKK 4.1bn). The return from A.P. Moller Holding’s financial investment portfo-lio was 14.8%, reflecting a solid risk adjusted return during the year.
A.P. Moller Holding recorded a cash inflow from its holdings of DKK 5.1bn
and invested DKK 1.5bn in new direct investments.
Amounts in DKKm 2019 2018 2017 2016 2015
KEY FIGURES: A.P. Moller Holdings investment activities Cash flow from operating activities - 172 - 47 2,886 1,523 - 303 Cash flow used for investing activities inflow 5,099 7,146 5,452 5,601 2,357 Cash flow used for investing activities outflow - 4,959 - 1,397 - 5,873 0 - 30,541 Cash flow from financing activities - 477 - 5,334 1,304 - 2,858 27,785 Net asset value (market value) 116,605 98,085 135,857 134,229 106,871 Dividend to A.P. Moller Foundation 250 500 500 500 1,000 Average number of employees 28 21 12 3 2
A.P. MØLLER HOLDING A/S ANNUAL REPORT 2019 · MANAGEMENT REVIEW
INVESTMENT COMMITMENTS (DKKm)
CASH INFLOW (DIVIDENDS AND SHARE BUY-BACK) (DKKm)
DISTRIBUTION OF CASH INFLOW
36,664
0
8,721
0 2,500
2015 2016 2017 2018 2019
17,600
5,601 5,416 4,055 5,050
2015 2016 2017 2018 2019
69%
31%
Cash inflowDKK 5.1bn
A.P.Moller - Maersk Danske Bank
12

A.P. MØLLER HOLDING A/S ANNUAL REPORT 2019 · MANAGEMENT REVIEW
13
NET ASSET VALUE The net asset value increased to DKK 116.6bn corresponding to 18.9%. The improvement in the share price of A.P. Moller - Maersk reflects the positive market momentum and the value from the Maersk Drilling shares received in connection with the demerger. The value of the Danske Bank shares continued to decline during 2019 as the uncertainty around the anti-money laundering case (the AML case) remains, coupled with a challenging market envi-ronment. The net asset value is a volatile measurement, not least over a shorter period, given the portfolio’s significant exposure to three main holdings. DKKbn Change in
Entity Value 2019
A.P. Moller - Maersk¹ 77.2 9.2 Danske Bank 19.8 - 3.8 Maersk Drilling¹ 7.6 7.6 Maersk Tankers 0.4 0.2 Maersk Product Tankers 3.8 0.8 KK Wind Solutions 1.5 1.5 Financial Portfolio 6.0 3.2 Other net assets 0.3 - 0.2 Total 116.6 18.5 1 Due to the demerger in April 2019, Maersk Drilling is presented separately in 2019 The net asset value calculation is based on different valuation methods. A.P. Moller - Maersk, Danske Bank and Maersk Drilling are assessed using their share prices at Nasdaq Copenhagen. Maersk Product Tankers is based on third-party valuation of the fleet, KK Wind Solutions is based on the acquisition value, while other holdings are based on recognised valuation methods, and the financial investment portfolio is based on market capitalisation (primarily quoted prices). The market value of A.P. Moller - Maersk and Danske Bank corre-sponds to 83.2% (93.4% in 2018) of the total net asset value as of 31 December 2019. The change is mainly due to the separate listing of Maersk Drilling (7%). Over time, we expect that A.P. Moller - Maersk’s and Danske Bank’s relative share of our portfolio will further decrease.
FINANCIAL OUTLOOK A.P. Moller Holding’s portfolio is generally exposed to the global economic activity levels. Hence, our outlook for 2020 is subject to significant uncertainties and will be impacted by the current out-break of COVID-19, which is expected to have an impact on our holdings and has lowered the visibility of our 2020 performance significantly. Furthermore, all our shipping activities are exposed to the implementation of new low sulphur regulations (IMO 2020), impacting the bunker fuel prices and freight rates, which further in-creases the uncertainties in the guidance. Our financial performance is closely linked to the development of the commercial activities in our main holdings A.P. Moller - Maersk, Danske Bank, Maersk Drilling, Maersk Tankers, Maersk Product Tankers and KK Wind Solutions as well as the develop-ment in the global financial markets. In March 2020, A.P. Moller - Maersk and Danske Bank suspended their financial guidance for 2020 because of the current situation with high uncertainties re-lated to global container demand and macroeconomic prospects as well as the measures being taken by governments to contain the outbreak. As a consequence of the significant uncertainties and lack of visi-bility related to our Group and businesses at the time of present-ing these Financial Statements, we are not able to make a relevant and reliable statement of the financial effect and impact on future reporting periods and therefore we cannot express any expecta-tions for 2020 either.
13
A.P. MØLLER HOLDING A/S ANNUAL REPORT 2019 · MANAGEMENT REVIEW
NET ASSET VALUE ( DKKm)
DISTRIBUTION OF NET ASSET VALUE
106,871
134,229 135,857
98,085116,605
2015 2016 2017 2018 2019
66%
17%
7%
3%0%
1%
5%
Net asset value DKK 116.6bn
A.P.Moller - Maersk Danske BankMaersk Drilling Maersk Product TankersMaersk Tankers KK Wind SolutionsFinancial Investments
13

A.P. MØLLER HOLDING A/S ANNUAL REPORT 2019 · MANAGEMENT REVIEW
14
In the past year, A.P. Moller Holding has been working on refining the investment strategy including framework and approach. This has been an interactive process involving many people in the A.P. Moller Group – on the one hand attempting to create a robust strategy for the future, while at the same time seeking inspiration from the Group’s legacy, assets and network over the past 115 years. Dialogue, interaction and alignment have been essential. THE CORE OF THE INVESTMENT FOCUS In defining the strategy for where to focus future investments, several choices have been made, all rooted in how (in the best possible way) to realise the ambition of being engaged owners in businesses, that have enduring financial potential, while delivering a positive contribution to society (‘nyttig virksomhed’). The core focus is at the intersection of the three circles – seeking to invest in businesses or incubation projects that: • are rooted in and driven by long-term megatrends, • deliver a positive impact on society, and • where A.P. Moller Holding can impact the outcome or degree
of success by being a value-add and engaged owner.
The main focus is to make investments in large, global and esta-blished businesses; but, adhering to A.P. Moller Holding’s entre-preneurial genes, also evaluating incubation platforms such as the current geothermal project. A STRUCTURE TO SUPPORT THE LONG-TERM FOCUS A.P. Moller Holding is a long-term owner of businesses, so the core focus must be on the long-term drivers of value and less on short-term opportunities to optimise. This approach implies investing time and resources in seeking investments within a theme that will be relevant for several business cycles. Invest-ments will be made across multiple sectors and countries, but the work is initiated around long-term trends. To ensure this focus, the investment team is organised around themes and, unlike institu-tional investors, not focused on traditional sectors. Once invested, A.P. Moller Holding exercises engaged ownership from the boards of the respective companies. By leveraging the company’s network, it is possible to recruit highly capable, international pro-files that, together with the investment team, can help drive the respective businesses forward.
RESOURCE EFFICIENCY In 2019, a key theme, or mega trend, has been ‘resource effi-ciency’. It is a very broad theme that offsets the fact that global consumption of several resources is under pressure. For some resources, this implies that more sustainable replacements are being adapted and for others it implies that use and utilisation of such resources must be optimised. The shift to green power and energy, including electrification, is therefore part of the resource efficiency thematic. In 2019, A.P. Moller Holding invested in KK Wind Solutions, which is a company that addresses and grows as this trend proliferates. With its products and solutions, KK Wind Solutions is creating wind power generating assets, that each year power approxi-mately five million additional homes. During 2019, A.P. Moller Holding also advanced the work on the geothermal incubation project, which is another investment within resource efficiency. In both cases, engaged ownership is exer-cised by providing network, capital and relevant capabilities to the businesses in line with A.P. Moller Holding’s strategic approach. LONG-TERM OWNERSHIP The above two examples also highlight the different roles A.P. Moller Holding seeks to have as long-term engaged owners, con-sidering incubation projects such as the geothermal start-up as well as large existing businesses with a promising future. The desire is, however, to invest large amounts of capital and the focus is on investments with deployment opportunities of several hun-dred million dollars at a minimum, once scale is reached. This is a way to maintain a lean internal structure with focus and discipline. The investment team continues to increase human capital and now counts ten professionals up from four at the end of 2018. The plan is to continue to selectively add relevant expertise, aiming for a diverse team that presently includes six different nationalities and working experiences from three different continents. A.P. Moller Group has had a global footprint for 115 years, so the team and thinking must have the same global outlook to be able to build on the legacy.
INVESTMENT STRATEGY
During 2019, A.P. Moller Holding continued to make progress on the mission to drive portfolio renewal. Highlights for the year include adding six additional members to the investment team, achieving internal alignment on the investment strategy and making the first large investment by committing DKK 1.5bn of equity to KK Wind Solutions.

A.P. MØLLER HOLDING A/S ANNUAL REPORT 2019 · MANAGEMENT REVIEW
15
INVESTMENT STRATEGY FROM HIGH-LEVEL MEGA TRENDS TO THREE TANGIBLE INVESTMENT THEMES
‘NYTTIG VIRKSOMHED’
OURVALUE
ADD
LONG-TERM MEGA
TRENDS
FOCUS AREA
A.P. MØLLER HOLDING A/S ANNUAL REPORT 2019 · MANAGEMENT REVIEW
OUR STRATEGIC BELIEFS A.P. Moller Holding is the cultural custodian of the Maersk name and values. We safeguard the name and we make sure it is developed in the spirit of our forefathers. We ensure the values are understood and lived by the Supervisory and Executive Boards of the Maersk companies. A.P. Moller Holding is an engaged and influential long-term owner with a point of view on key matters, acknowledged as a valued parent. A.P. Moller Holding is an investor in the spirit of our founder A.P. Møller; investing in and building new businesses – based on access to certain insights, market positions, assets, capabilities and networks – to safeguard the growth and renewal, and thus viability of our portfolio for the next decades. We believe portfo-lio renewal comes from building new businesses inside and out-side of our core holdings. A.P. Moller Holding is open to reconsider ownership of a busi-ness in our portfolio, if its business model does not have a posi-tive impact on our name or society, and/or lacks prospects for competitive value creation over a long time. A.P. Moller Holding wants to hold a diversified and financially robust portfolio to sustain black swans and unforeseen negative events. A.P. Moller Holding wants to safeguard our ability to pay divi-dends to the A.P. Moller Foundation over the next decades, in order for the Foundation to contribute to society in the form of donations.
15
A.P. MØLLER HOLDING A/S ANNUAL REPORT 2019 · MANAGEMENT REVIEW
16
Our holdings
A.P. MØLLER HOLDING A/S ANNUAL REPORT 2019 · MANAGEMENT REVIEW

A.P. MØLLER HOLDING A/S ANNUAL REPORT 2019 · MANAGEMENT REVIEW
17
A.P. MOLLER HOLDING AT A GLANCE
A.P. MØLLER HOLDING A/S ANNUAL REPORT 2019 · MANAGEMENT REVIEW

A.P. MØLLER HOLDING A/S ANNUAL REPORT 2019 · MANAGEMENT REVIEW
18
A.P. Moller - Maersk was founded by A.P. Møller in 1904. The A.P. Moller Foundation has since its establishment in 1953 been the controlling shareholder of the entities which today make up A.P. Moller - Maersk. The Foundation’s shareholding is held by A.P. Møller Holding A/S, which holds 41.51% of the shares and 51.45% of the voting rights in A.P. Møller - Mærsk A/S. THE YEAR IN BRIEF A.P. Moller - Maersk continued to progress on the transformation journey which was initiated in the autumn of 2016. In 2019, a num-ber of important milestones were met, including the completion of the energy separation with the demerger and separate listing of Maersk Drilling and the integration of Hamburg Süd. In connection with the full year 2018 results released in February 2019, A.P. Moller - Maersk announced four metrics to measure the progress on the strategic transformation (i) cash return on invested capital (CROIC), (ii) non-ocean revenue, (iii) gross profit in Logistics & Services and (iv) synergy target related to the Hamburg Süd acquisition. A.P. Moller - Maersk has during 2019 seen
improvement on all four measures highlighted by an improve-ment in CROIC from 2.8% in 2018 to 9.3% in 2019. The transformation from a conglomerate to one focused company continues, including forming a new global frontline simplifying engagement with customers and integrating support functions into global teams, improving service offering while reducing costs. In February 2020, A.P. Moller - Maersk announced the acquisition of the US based warehousing and distribution company Perfor-mance Team, to further strengthen its capabilities as an integrated container logistics company, offering end-to-end supply chain solutions to its customers. Safety remains a priority for A.P. Moller - Maersk. Regrettably, three people lost their lives while engaged in operational activities in 2019. A.P. Moller - Maersk works continuously on improving the safety standards, and launched a new safety approach focusing on leadership, accountability and culture in 2019.
A.P. MOLLER - MAERSK
A.P. Moller - Maersk delivered a solid EBITDA of USD 5.7bn (USD 5.0bn) and continues to execute on the strategy transforming the conglomerate to an integrated global transport and logistics company.
EXECUTIVE BOARD • Søren Skou (CEO) • Patrick Jany (CFO as of May 2020) • Henriette Thygesen • Morten H. Engelstoft • Vincent Clerc BOARD OF DIRECTORS • Jim Hagemann Snabe (Chairman) • Ane M. M. Uggla (Vice Chairman) • Arne Karlsson • Bernard Bot • Blythe Masters • Dorothee Blessing • Marc Engel • Robert M. Uggla • Jacob Andersen Sterling • Thomas Lindegaard Madsen
A.P. MØLLER HOLDING A/S ANNUAL REPORT 2019 · MANAGEMENT REVIEW
19
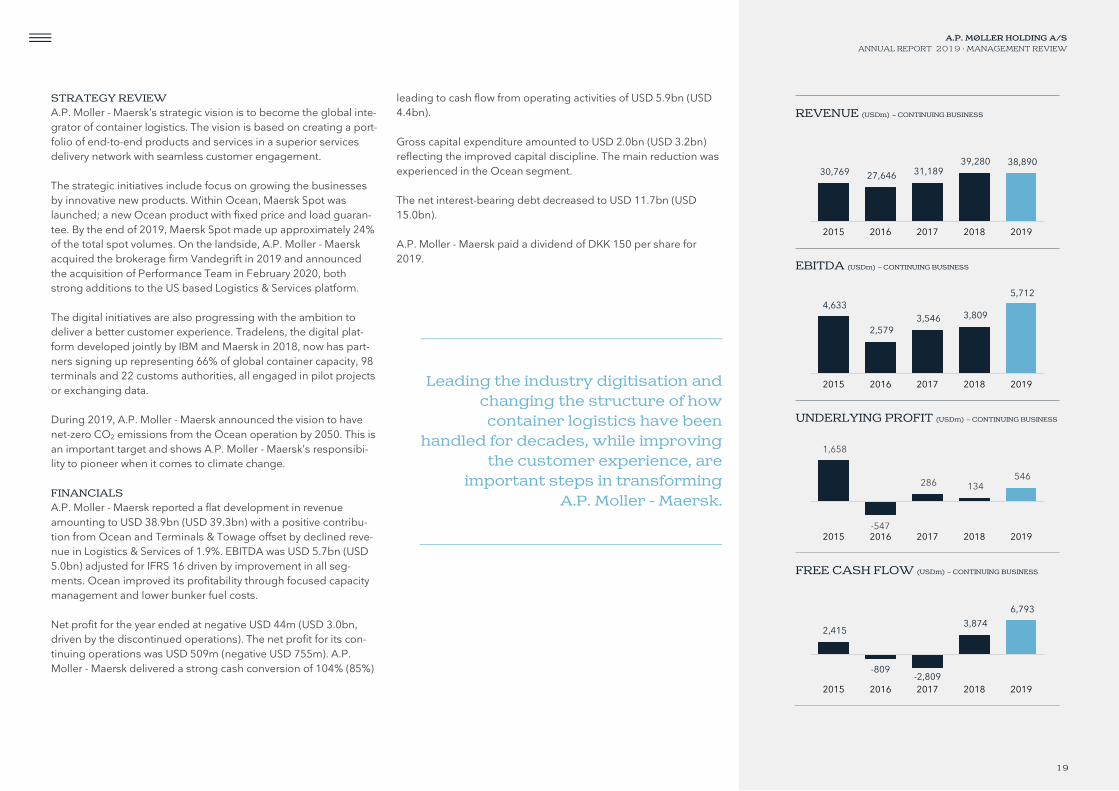
STRATEGY REVIEW A.P. Moller - Maersk’s strategic vision is to become the global inte-grator of container logistics. The vision is based on creating a port-folio of end-to-end products and services in a superior services delivery network with seamless customer engagement. The strategic initiatives include focus on growing the businesses by innovative new products. Within Ocean, Maersk Spot was launched; a new Ocean product with fixed price and load guaran-tee. By the end of 2019, Maersk Spot made up approximately 24% of the total spot volumes. On the landside, A.P. Moller - Maersk acquired the brokerage firm Vandegrift in 2019 and announced the acquisition of Performance Team in February 2020, both strong additions to the US based Logistics & Services platform. The digital initiatives are also progressing with the ambition to deliver a better customer experience. Tradelens, the digital plat-form developed jointly by IBM and Maersk in 2018, now has part-ners signing up representing 66% of global container capacity, 98 terminals and 22 customs authorities, all engaged in pilot projects or exchanging data. During 2019, A.P. Moller - Maersk announced the vision to have net-zero CO2 emissions from the Ocean operation by 2050. This is an important target and shows A.P. Moller - Maersk’s responsibi-lity to pioneer when it comes to climate change. FINANCIALS A.P. Moller - Maersk reported a flat development in revenue amounting to USD 38.9bn (USD 39.3bn) with a positive contribu-tion from Ocean and Terminals & Towage offset by declined reve-nue in Logistics & Services of 1.9%. EBITDA was USD 5.7bn (USD 5.0bn) adjusted for IFRS 16 driven by improvement in all seg-ments. Ocean improved its profitability through focused capacity management and lower bunker fuel costs. Net profit for the year ended at negative USD 44m (USD 3.0bn, driven by the discontinued operations). The net profit for its con-tinuing operations was USD 509m (negative USD 755m). A.P. Moller - Maersk delivered a strong cash conversion of 104% (85%)
leading to cash flow from operating activities of USD 5.9bn (USD 4.4bn). Gross capital expenditure amounted to USD 2.0bn (USD 3.2bn) reflecting the improved capital discipline. The main reduction was experienced in the Ocean segment. The net interest-bearing debt decreased to USD 11.7bn (USD 15.0bn). A.P. Moller - Maersk paid a dividend of DKK 150 per share for 2019.
Leading the industry digitisation and changing the structure of how container logistics have been
handled for decades, while improving the customer experience, are
important steps in transforming A.P. Moller - Maersk.
A.P. MØLLER HOLDING A/S ANNUAL REPORT 2019 · MANAGEMENT REVIEW
REVENUE (USDm) – CONTINUING BUSINESS
EBITDA (USDm) – CONTINUING BUSINESS
UNDERLYING PROFIT (USDm) – CONTINUING BUSINESS
FREE CASH FLOW (USDm) – CONTINUING BUSINESS
30,769 27,646 31,189 39,280 38,890
2015 2016 2017 2018 2019
4,633
2,579 3,546 3,809
5,712
2015 2016 2017 2018 2019
1,658
-547
286 134 546
2015 2016 2017 2018 2019
2,415
-809 -2,809
3,874
6,793
2015 2016 2017 2018 2019
19

A.P. MØLLER HOLDING A/S ANNUAL REPORT 2019 · MANAGEMENT REVIEW
20
Danske Bank is a Nordic focused universal bank with four core Nordic markets – Denmark, Norway, Sweden and Finland – that are addressed via its four customer focused business units: Banking Denmark, Banking Nordic, Corporate and Institutions and Wealth Management. A.P. Møller has been involved in Danske Bank since 1928. At the end of 2019, A.P. Moller Holding held just above 20% of the shares in Danske Bank. A.P. Moller Holding continues to see the importance and value of a leading Nordic bank with a strong pre-sence in Denmark. THE YEAR IN BRIEF In May 2019, Danske Bank announced Chris Vogelzang as its new CEO, to lead the efforts in rebuilding trust in the bank while deve-loping the bank in line with customer expectations and technolo-gical developments, ensuring that Danske Bank will remain a leading bank in the Nordic region. 2019 proved to be yet a challenging year with difficult financial markets, interest rates declining further, a slight worsening of the
macroeconomic environment and strong competition in all mar-kets. Furthermore, the industry saw further regulatory and compli-ance related requirements that impacted the performance. The AML case continued to be a focus point for Danske Bank in 2019, and the bank has embarked on a multi-year enhancement programme, designed to materially upgrade systems and controls related to money laundering and financial crime. The bank has over the past couple of years increased costs by more than DKK 2bn in AML programmes and compliance related activities (inclu-ding the AML case), and will continue to invest in these activities. Currently, the bank has around 2,800 full time employees working with compliance and AML in order to strengthen its lines of defence and secure progress on digitalisation efforts. Danske Bank remains a fundamentally strong bank, however given recent years’ developments and a number of structural challenges in the banking industry, including negative interest rates, digitali-sation, rising customer expectations, increased costs and increased compliance focus, the bank needed to focus its priori-ties to accommodate these changes.
DANSKE BANK
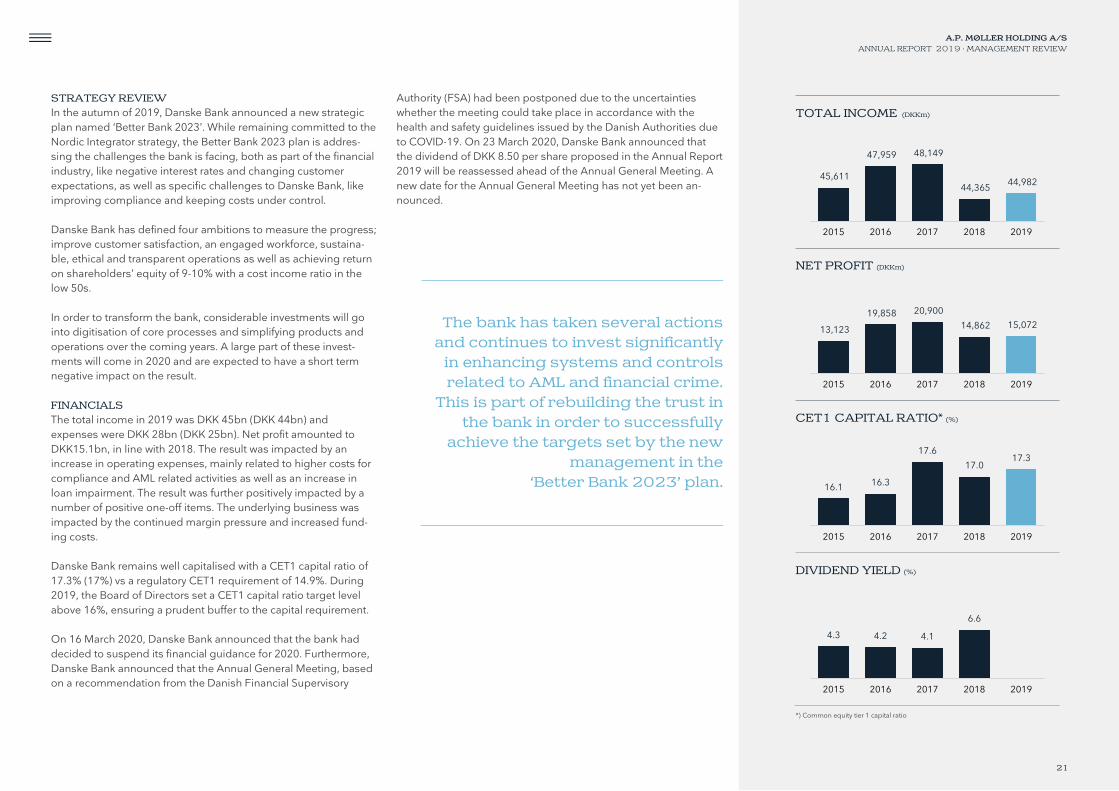
Danske Bank delivered a financial result with a net profit of DKK 15.1bn (DKK 14.9bn) and a return on shareholders’ equity of 9.6% (9.8%). The financial result was impacted by a number of positive non-recurring items. During the year, Danske Bank announced its ambitions for the period towards 2023.
EXECUTIVE BOARD • Chris Vogelzang (CEO) • Stephan Engels (CFO) • Berit Behring • Carsten Rasch Egeriis • Frans Woelders • Glenn Söderholm • Jacob Aarup-Andersen • Jakob Groot • Phillippe Vollot BOARD OF DIRECTORS • Karsten Dybvad (Chairman) • Carol Sergeant (Vice Chairman) • Jan T. Nielsen (Vice Chairman) • Bente Avnung Landsnes • Christian Sagild • Gerrit Zalm • Lars-Erik Brenøe • Bente Bang • Charlotte Hoffmann • Kirsten Ebbe Brich • Thorbjørn Lundholm Dahl
A.P. MØLLER HOLDING A/S ANNUAL REPORT 2019 · MANAGEMENT REVIEW
21
STRATEGY REVIEW In the autumn of 2019, Danske Bank announced a new strategic plan named ‘Better Bank 2023’. While remaining committed to the Nordic Integrator strategy, the Better Bank 2023 plan is addres-sing the challenges the bank is facing, both as part of the financial industry, like negative interest rates and changing customer expectations, as well as specific challenges to Danske Bank, like improving compliance and keeping costs under control. Danske Bank has defined four ambitions to measure the progress; improve customer satisfaction, an engaged workforce, sustaina-ble, ethical and transparent operations as well as achieving return on shareholders’ equity of 9-10% with a cost income ratio in the low 50s. In order to transform the bank, considerable investments will go into digitisation of core processes and simplifying products and operations over the coming years. A large part of these invest-ments will come in 2020 and are expected to have a short term negative impact on the result. FINANCIALS The total income in 2019 was DKK 45bn (DKK 44bn) and expenses were DKK 28bn (DKK 25bn). Net profit amounted to DKK15.1bn, in line with 2018. The result was impacted by an increase in operating expenses, mainly related to higher costs for compliance and AML related activities as well as an increase in loan impairment. The result was further positively impacted by a number of positive one-off items. The underlying business was impacted by the continued margin pressure and increased fund-ing costs. Danske Bank remains well capitalised with a CET1 capital ratio of 17.3% (17%) vs a regulatory CET1 requirement of 14.9%. During 2019, the Board of Directors set a CET1 capital ratio target level above 16%, ensuring a prudent buffer to the capital requirement. On 16 March 2020, Danske Bank announced that the bank had decided to suspend its financial guidance for 2020. Furthermore, Danske Bank announced that the Annual General Meeting, based on a recommendation from the Danish Financial Supervisory
Authority (FSA) had been postponed due to the uncertainties whether the meeting could take place in accordance with the health and safety guidelines issued by the Danish Authorities due to COVID-19. On 23 March 2020, Danske Bank announced that the dividend of DKK 8.50 per share proposed in the Annual Report 2019 will be reassessed ahead of the Annual General Meeting. A new date for the Annual General Meeting has not yet been an-nounced.
The bank has taken several actions and continues to invest significantly
in enhancing systems and controls related to AML and financial crime.
This is part of rebuilding the trust in the bank in order to successfully
achieve the targets set by the new management in the
‘Better Bank 2023’ plan.
A.P. MØLLER HOLDING A/S ANNUAL REPORT 2019 · MANAGEMENT REVIEW
TOTAL INCOME (DKKm)
NET PROFIT (DKKm)
CET1 CAPITAL RATIO* (%)
DIVIDEND YIELD (%)
*) Common equity tier 1 capital ratio
45,611
47,959 48,149
44,365 44,982
2015 2016 2017 2018 2019
13,123
19,858 20,900
14,862 15,072
2015 2016 2017 2018 2019
16.1 16.3
17.6
17.017.3
2015 2016 2017 2018 2019
4.3 4.2 4.1
6.6
2015 2016 2017 2018 2019
21
A.P. MØLLER HOLDING A/S ANNUAL REPORT 2019 · MANAGEMENT REVIEW
22
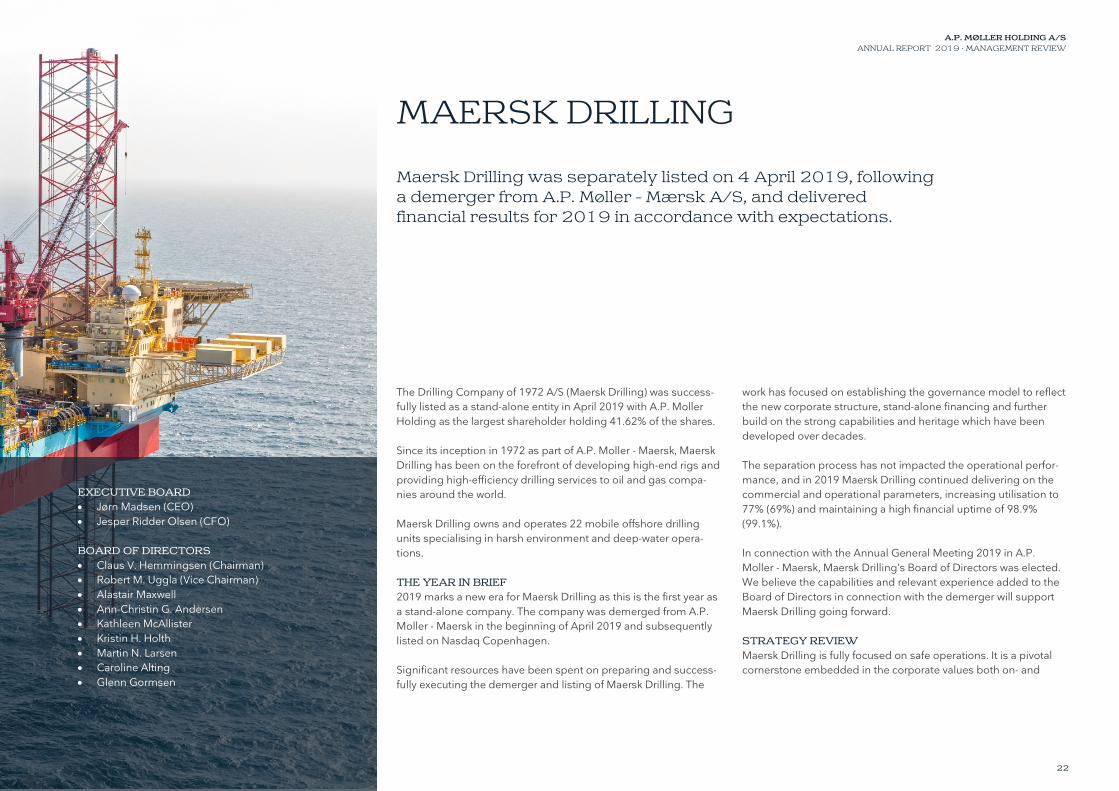
The Drilling Company of 1972 A/S (Maersk Drilling) was success-fully listed as a stand-alone entity in April 2019 with A.P. Moller Holding as the largest shareholder holding 41.62% of the shares. Since its inception in 1972 as part of A.P. Moller - Maersk, Maersk Drilling has been on the forefront of developing high-end rigs and providing high-efficiency drilling services to oil and gas compa-nies around the world. Maersk Drilling owns and operates 22 mobile offshore drilling units specialising in harsh environment and deep-water opera-tions. THE YEAR IN BRIEF 2019 marks a new era for Maersk Drilling as this is the first year as a stand-alone company. The company was demerged from A.P. Moller - Maersk in the beginning of April 2019 and subsequently listed on Nasdaq Copenhagen. Significant resources have been spent on preparing and success-fully executing the demerger and listing of Maersk Drilling. The
work has focused on establishing the governance model to reflect the new corporate structure, stand-alone financing and further build on the strong capabilities and heritage which have been developed over decades. The separation process has not impacted the operational perfor-mance, and in 2019 Maersk Drilling continued delivering on the commercial and operational parameters, increasing utilisation to 77% (69%) and maintaining a high financial uptime of 98.9% (99.1%). In connection with the Annual General Meeting 2019 in A.P. Moller - Maersk, Maersk Drilling’s Board of Directors was elected. We believe the capabilities and relevant experience added to the Board of Directors in connection with the demerger will support Maersk Drilling going forward. STRATEGY REVIEW Maersk Drilling is fully focused on safe operations. It is a pivotal cornerstone embedded in the corporate values both on- and
MAERSK DRILLING
Maersk Drilling was separately listed on 4 April 2019, following a demerger from A.P. Møller - Mærsk A/S, and delivered financial results for 2019 in accordance with expectations.
EXECUTIVE BOARD • Jørn Madsen (CEO) • Jesper Ridder Olsen (CFO) BOARD OF DIRECTORS • Claus V. Hemmingsen (Chairman) • Robert M. Uggla (Vice Chairman) • Alastair Maxwell • Ann-Christin G. Andersen • Kathleen McAllister • Kristin H. Holth • Martin N. Larsen • Caroline Alting • Glenn Gormsen

A.P. MØLLER HOLDING A/S ANNUAL REPORT 2019 · MANAGEMENT REVIEW
23
offshore and is Maersk Drilling’s ‘license to operate’, as well as a determinant factor in attracting new business. Maersk Drilling is well positioned in the more attractive segments of the offshore drilling industry with its modern and high spec drilling units. At the end of 2019, Maersk Drilling owned and ope-rated 22 units. ‘Smarter Drilling for Better Value’ has since 2018 defined Maersk Drilling’s strategy. The company intends to continue its proven operational efficiency combined with customer centricity and smarter IT solutions increasing value for its customers. Further-more, it aims to increase the collaboration across the industry which eliminates inefficiencies and creates joint value through new service- and business models. One example is the alliance with Aker BP, which aims to lower the cost per barrel and increase profitability for all alliance partners through the implementation of digital solutions, increased colla-boration efficiency and standardisation and simplification of pro-cesses. FINANCIALS The result for 2019 was a loss of USD 113m (profit of USD 941m including an impairment reversal of USD 810m). Maersk Drilling continued its historically strong operational performance (financial uptime 98.9% vs. 99.1% in 2018) despite challenging market con-ditions. Maersk Drilling saw an increase in activity levels leading to the number of contracted days increasing with 5% to 6,310 days (6,024 days), which leads to a utilisation of the assets of 77% (69%). Maersk Drilling benefited from a solid contract backlog and deli-vered an EBITDA before special items of USD 415m (USD 611m) – an industry leading margin of 34% (43%) based on a revenue of USD 1.2bn (USD 1.4bn). Maersk Drilling delivered a free cash flow of USD 109m (USD 457m) after cash flow from investments (excluding sales
proceeds) of USD 311m (USD 136m). The company’s balance sheet remained strong with a net interest-bearing debt of USD 1.1bn (leverage of 2.6x (NIBD/EBITDA)) and a liquidity reserve of USD 710m (USD 772m), comprising of USD 310m cash and USD 400m in committed long-term credit lines. Maersk Drilling left 2019 with a committed contract backlog of USD 2.1bn (excluding value of options) (USD 2.5bn), which includes USD 828m (USD 503m) of new contracts added to the contract backlog during 2019. This implies a book-to-bill ratio of 75% (39%). The company enters 2020 with a contract coverage of 66%, slightly higher than last year (63%). In connection with its Annual Report 2019, Maersk Drilling announced a capital allocation policy reflecting its robust capital structure and solid cash flow generation with the aspiration of creating long-term shareholder value while enabling the company to manage the cyclicality of the industry. Maersk Drilling will gene-rally work towards a leverage target of around 2.5x (NIBD/EBITDA). Maersk Drilling did not pay out a dividend for 2019.
Maersk Drilling continues to deliver a strong operational and industry
leading financial performance in the year of the demerger and separate
listing on Nasdaq Copenhagen.
A.P. MØLLER HOLDING A/S ANNUAL REPORT 2019 · MANAGEMENT REVIEW
REVENUE (USDm)
EBITDA (USDm)
ADJUSTED FREE CASH FLOW* (USDm)
REVENUE BACKLOG (USDbn)
*) Adjusted free cash flow defined as cash flow from operating activities less cash flow used for investing activities, adjusted for newbuild cash flow and proceeds from the divestment of assets or activities
2,518 2,297
1,439 1,429 1,222
2015 2016 2017 2018 2019
1,403 1,397
685 595 399
2015 2016 2017 2018 2019
1,186 1,267
593 457
109
2015 2016 2017 2018 2019
5.4
3.7 3.32.5 2.1
2015 2016 2017 2018 2019
23

A.P. MØLLER HOLDING A/S ANNUAL REPORT 2019 · MANAGEMENT REVIEW
24
Maersk Tankers dates back to 1928 and was established as an independent services business in 2017 following the spin-off of Maersk Product Tankers as the vessel owning entity. Since then, focus has been on developing a leading commercial manager in the product tanker segment, using digital tools to grow and improve profitability. During the year, Maersk Tankers has suc-cessfully transformed itself from being a loss-making business to a profitable one. THE YEAR IN BRIEF Maersk Tankers increased its vessels under management to 189 compared to 166 at the beginning of the year primarily driven by 25 third party vessels (net) entering the fleet from new and exis-ting owners, as well as a new strategic partnership with Cargill. The development validates the company’s business model, and the company will focus on increasing the number of vessels under management in the coming period, with a promising pipeline going into 2020. Maersk Tankers supported its customers to achieve a cost leader-ship position as measured by external benchmarks and has
outperformed the market by taking advantage of Maersk Tankers’ newly developed digital and data-driven trading platform. The vessels in the Maersk Tankers pools have outperformed the spot market measured on time-charter equivalent earnings, and the results have been achieved through solid commercial decision-making drawing on Maersk Tankers’ unique trading capabilities, processes and data utilisation. In the beginning of January 2020, Maersk Tankers announced the launch of its new standalone digital business to reduce CO2 emis-sions and optimise vessels’ earnings. The digital solution, Sim-Bunker, optimises bunker spend which accounts for up to 60% of total voyage costs by determining optimal solutions for factors such as speed, bunker purchase and route. The business is an example of how focus on digital innovative solutions has given concrete results. Maersk Tankers also launched a test version of SimTankers for the LR2 segment during the year. The system offers the charterers a decision-making process with data-driven trade signals based on historical trading data. The testing will continue in 2020, and
MAERSK TANKERS
Maersk Tankers delivered a profit of USD 17.3m (loss of USD 14.2m) primarily due to reduced costs as well as an increased number of vessels under management.
EXECUTIVE BOARD • Christian M. Ingerslev (CEO) • Morten M. Christensen (CFO) BOARD OF DIRECTORS • Robert M. Uggla (Chairman) • Paul Reed (Vice Chairman) • Ibrahim Gokcen • Maria Pejter • Martin N. Larsen

A.P. MØLLER HOLDING A/S ANNUAL REPORT 2019 · MANAGEMENT REVIEW
25
Maersk Tankers expects this to further support their competitive edge. STRATEGY REVIEW Maersk Tankers launched a three-year strategy in April 2019, ‘Shaping the Future’, with the aim of becoming the industry leader, deliver returns above 10% and drive the sustainability agenda within the tanker industry. The strategy is based on the company’s purpose and mission statement; specifically, that it keeps the world moving and that it facilitates the trade of energy to meet the world’s needs. As a frontrunner in digitisation, Maersk Tankers is building new digital solutions, improving the commercial performance, increas-ing efficiencies and reducing costs through a scalable IT platform. The data-driven operating model and access to cargo program-mes through its trading capabilities is used to lock in high returns for partners. This creates the potential for maximising earnings over the life of the business cycle and becoming an attractive part-ner for other shipowners. While tanker shipping is an efficient and cost-effective method of transporting energy to meet the world’s growing energy demand, Maersk Tankers is part of the fossil fuel value chain, and manages vessels that discharge emissions, having a negative impact on the climate. Maersk Tankers is focused on reducing its CO2 footprint through investments, tests and use of fuel-efficient technologies, commer-cial initiatives and digital solutions. This can be exemplified by the test of wind-propulsion technology onboard a vessel in 2019 resulting in an 8.2% reduction in fuel and emissions. Furthermore, Maersk Tankers, Mitsui and Cargill have established a partnership with the ambition to accelerate the reduction of global green-house gases within shipping. FINANCIALS Maersk Tankers reported a profit for the year of USD 17.3m (loss of USD 14.2m), as the cost base was reduced following the carve out, and momentum in the business picked up, supported by good
market conditions. The company reported a free cash flow of USD 56m driven by reduced costs and working capital improvements. Despite some owners opting for time charter or selling vessels, pool growth is stable and the service revenues have been growing steadily quarter by quarter, from more vessels trading in pools and improved market conditions.
Maersk Tankers has successfully transformed into a profitable
commercial manager, continuing to focus on developing digital solutions
to improve profitability for the pool partners, while aiming to reduce CO2
emissions from the fleet under management.
A.P. MØLLER HOLDING A/S ANNUAL REPORT 2019 · MANAGEMENT REVIEW
REVENUE (USDm)
EBITDA (USDm)
NET PROFIT (USDm)
FREE CASH FLOW (USDm)
305416
2018 2019
-18
32
2018 2019
-14
17
2018 2019
-15
56
2018 2019
25

A.P. MØLLER HOLDING A/S ANNUAL REPORT 2019 · MANAGEMENT REVIEW
26
Maersk Product Tankers, established in 2017 as a joint venture between A.P. Moller Holding and Mitsui & Co., is a leading com-pany in the product tanker industry and owns one of the largest fleets in the industry with more than 80 vessels in the LR2, MR, Handy and intermediate segments. THE YEAR IN BRIEF The product tanker market improved across all segments in 2019 and Maersk Product Tankers delivered an improved financial result, solid safety performance and continued to reduce its CO2 emissions. Maersk Product Tankers saw the positive impact of reduced vessel running costs from USD 5,696 per day compared to USD 6,055 per day in 2018 on average. This was achieved through optimised procurement agreements, increased cost transparency and focus, as well as the use of new technology. Maersk Product Tankers remains committed to continue to work with the cost base. Market rates had a solid start to the year followed by a more natu-ral seasonal pattern, before again gaining momentum towards the
end of Q3 and throughout Q4 2019. The positive development in rates was impacted by several factors, amongst others, continued growth in demand, imposed sanctions limiting the supply of ves-sels towards the end of 2019 and the implementation of new low sulphur regulations (IMO 2020), increasing the transported distances. The market is characterised by significant volatility and is expected to continue to fluctuate going forward. While markets have benefited from greater tonne-miles demand and a slow growth in operational vessel capacity in the early part of 2020, the outlook for the full year is uncertain. The outbreak and spread of COVID-19 and countries’ containment measures have led to global reductions in transport, industrial and commercial activity. This has caused a decline in the demand for oil and could eventu-ally affect product tanker markets and freight rates. During 2019, Maersk Product Tankers continued its fleet renewal strategy with the focus to remain competitive and enable attractive solutions for its customers. During the year, the company con-firmed the order of four LR2s and acquired seven second hand Handy vessels and one MR, while divesting a total of 12 vessels
MAERSK PRODUCT TANKERS
Maersk Product Tankers delivered a profit of USD 92m (loss of USD 33m) mainly due to improved market conditions across all product tanker vessel segments and positive sales gains.
EXECUTIVE BOARD • Christian M. Ingerslev (CEO) • Morten M. Christensen (CFO) • Claus Grønborg • Prakash Thangachan • Søren C. Meyer • Tommy Thomassen BOARD OF DIRECTORS • Robert M. Uggla (Chairman) • Paul J. Reed (Vice Chairman) • Ibrahim Gokcen • Maria Pejter • Martin N. Larsen • Tatsuya Okamoto

A.P. MØLLER HOLDING A/S ANNUAL REPORT 2019 · MANAGEMENT REVIEW
27
some of which will be handed over in 2020. Maersk Product Tankers had a fleet of 84 vessels at the end of the year. Over the past decades, the company has developed a strong framework for acting dynamically and opportunistically in terms of fleet composition and renewal of the same. As a consequence of the vessel transactions during 2019, Maersk Product Tankers booked USD 43m of sales gains and net impairment reversals in 2019. Maersk Product Tankers is well positioned going into 2020 with relevant exposure to attractive markets. However, the company will continue its opportunistic approach to fleet renewal where attrac-tive opportunities arise. STRATEGY REVIEW Maersk Product Tankers continued to deliver on its strategic priori-ties during 2019: Dynamic vessel portfolio, allowing an agile deci-sion process aiming to deliver financially solid returns and retai-ning a cost leadership position. IMO 2020 has in many ways attracted significant attention during 2019 and for good reason. Maersk Product Tankers will be compli-ant with IMO 2020 implemented as of 1 January 2020. In addition to operating on compliant fuel, the company decided to install scrubbers on four of its LR2 vessels while simultaneously investi-gating and testing new vessel technology to actively drive the environmental agenda forward. In 2019, Maersk Product Tankers has successfully installed and tested solutions to reduce bunker fuel costs which account for up to 60% of a vessel’s total voyage costs and is expected to increase, when the global sulphur cap is introduced in 2020. An example hereof is the rotor sails installed on Maersk Pelican saving more than 8% fuel over 12 months equivalent to 1,400 tonnes CO2. To stay relevant to its customers Maersk Product Tankers will con-tinue its efforts to reduce its environmental footprint and develop improved climate solutions.
FINANCIALS Maersk Product Tankers reported improved financial results with revenue increasing to USD 728m (USD 647m) and net profit of USD 92m (loss of USD 33m). The result was positively impacted by an average day rate for the fleet of USD 14.6k/day (USD 12k/day) and an improved average daily running cost. The cash flow from operating activities ended at USD 158m (USD 91m) and invest-ment activities ended at a loss of USD 169m (loss of USD 119m) resulting in a negative free cash flow of USD 11m for the year (neg-ative USD 28m). The company has outstanding payments related to ten LR2 new-builds being delivered between 2020 and 2022 with an out- standing capital commitment of USD 421m.
The prospects for the product tanker industry are positive, and in 2019
Maersk Product Tankers took important steps towards
strengthening its position and securing long-term profitable
growth, while continuing to optimise the fleet by taking initiatives to
reduce its CO2 footprint through innovative digital solutions and fuel-
efficient technologies.
A.P. MØLLER HOLDING A/S ANNUAL REPORT 2019 · MANAGEMENT REVIEW
REVENUE (USDm)
EBITDA (USDm)
NET PROFIT (USDm)
FREE CASH FLOW (USDm)
647
728
2018 2019
110
203
2018 2019
-33
92
2018 2019
-28
-11
2018 2019
27

A.P. MØLLER HOLDING A/S ANNUAL REPORT 2019 · MANAGEMENT REVIEW
28
For decades, KK Wind Solutions has developed innovative and reliable electro-mechanical solutions for wind turbines. The com-pany serves approximately 50% of the largest original equipment manufacturers (OEMs) globally and has operations spread across Asia, Europe and the US. Headquartered in Denmark, KK Wind Solutions has operations in six countries, including production facilities in Poland and India and Sales & Engineering offices in Spain, China and the US. The company has more than 1,400 employees. In September 2019, KK Wind Solutions was acquired by A.P. Moller Holding. A.P. Moller Holding welcomes KK Wind Solutions and its employees to the A.P. Moller Group. THE YEAR IN BRIEF In 2019, KK Wind Solutions delivered a record year with revenue of DKK 2.3bn (DKK 1.6bn) outgrowing the market significantly with an organic growth of 40%. The growth was primarily driven by high demand on existing products as well as the introduction of new products; all business units contributed to the revenue growth.
The impressive results in 2019 is the effect of KK Wind Solutions’ strategy towards 2025 starting to materialise, successfully diversi-fying the customer portfolio with solutions in advanced techno-logy and world class electro-mechanical system supply, and hereby further solidifying themselves as the leading system supplier within the wind industry. A journey that is expected to continue in the coming years. Subsequent to the acquisition by A.P. Moller Holding, a new Board of Directors has been elected for KK Wind Solutions to further support the global expansion. STRATEGY REVIEW KK Wind Solutions is a leading player in the wind energy market. A market which has seen significant underlying growth in the last decade and which shows significant continued growth prospects, largely driven by the offshore wind market. Overall, the wind tur-bine generator market is expected to continue to grow and market forecasts support the positive outlook. The combined annual growth rate for on- and offshore is expected to be around 6%
KK WIND SOLUTIONS
KK Wind Solutions is a market leading manufacturer and developer of systems and technology for on- and offshore wind turbines including full range services across the supply chain: manufacturing, installation, operations and maintenance.
EXECUTIVE BOARD • Chlinton A. Nielsen (CEO) • Søren Bæk Just (CFO) BOARD OF DIRECTORS • Jan T. Nielsen (Chairman) • Elke Eckstein • Fabrice Bregier • Jesper Ridder Olsen • Simon Krogsgaard Ibsen • Dorrit Zenner Torp • Jacob Steffensen • Paw Rosenvard

A.P. MØLLER HOLDING A/S ANNUAL REPORT 2019 · MANAGEMENT REVIEW
29
towards 2028 with onshore growing approximately 3% and off-shore around 16% in capacity terms. Within the market, there are key trends for which KK Wind Solutions is uniquely positioned to benefit from. KK Wind Solu-tions expects to see a continued outsourcing trend from OEMs increasing KK Wind Solutions’ addressable market. Additionally, the trend of growing turbine dimensions and search for techno-logy innovations to boost power and efficiency, increases the tur-bines’ electrical systems and implies greater need for KK Wind Solutions’ products. FINANCIALS Revenue for the year was DKK 2.3bn (DKK 1.6bn) representing a 40% organic growth with a positive contribution from all business units. The cash flow from operations was DKK 66m impacted negatively by an increase in networking capital, resulting from the significant growth. The free cash flow for the year was DKK 16m. From the acquisition date to 31 December 2019, KK Wind Solutions contributed with a revenue of DKK 672m, while the result was immaterial. The company is delivering according to plan and is expected to continue to develop positively over the coming years given the continued drive towards green energy transition and increased deployment of wind turbines particularly offshore. KK Wind Solutions is well positioned to benefit from the underlying market growth as well as to capture market share at the large OEMs both on new and existing platforms.
KK Wind Solutions delivered a 40% organic revenue growth in the year
of acquisition by A.P. Moller Holding, further solidifying themselves as the
leading system supplier within the wind industry.
A.P. MØLLER HOLDING A/S ANNUAL REPORT 2019 · MANAGEMENT REVIEW
REVENUE* (DKKbn)
ORDER BOOK* (DKKbn)
* A.P. Moller Holding acquired the company in September 2019
1.6 1.6
2.3
2017 2018 2019
0.5
0.9 0.9
2017 2018 2019
29

A.P. MØLLER HOLDING A/S ANNUAL REPORT 2019 · MANAGEMENT REVIEW
30
A.P. Moller Capital has reached financial close on its first fund, the Africa Infrastructure Fund I (AIF), with a total commitment of USD 992m. The fund aims to build/acquire and operate infrastructure opportunities in Africa, targeting projects mainly within transporta-tion and energy such as rail, roads, ports and warehousing as well as power plants, transmission, pipelines and distribution. The company aims to create a positive social impact through job crea-tion and industrial growth, while delivering an acceptable return to its investors. The main investors of AIF are PKA, PensionDanmark, Lægernes Pension (The Medical Doctors’ Pension Fund), PFA, Danica, Lærernes Pension (The Teachers’ Pension Fund) as well as A.P. Moller Holding. THE YEAR IN BRIEF 2019 marked the year where the first investments were committed by AIF. In total, A.P. Moller Capital has now committed more than 1/3 of the capital to three projects including the port and logistics investment announced in early 2020.
STRATEGY REVIEW The investment thesis for AIF is strong. With the population of Africa estimated to double by 2050, and an already existing infra-structure gap, the need for enhancing infrastructure in Africa is clear. The investments to be done by AIF are critical to build a foundation for job creation and prosperity in Africa. A.P. Moller related companies have more than a century of history and engagement in Africa. Their global mindset, long experience and local knowledge will support the continued development in Africa. RECENT DEVELOPMENTS AIF committed its first investment during 2019. AIF acquired 90% of Impala Energy Holdings (Impala) which holds comprehensive experience and capabilities within the capital power projects. The remaining 10% ownership share is held by Pegasus Capital LLC. Impala’s core strategy is to deliver clean and reliable power to both the commercial and industrial power markets in Nigeria and potentially other countries. In Q4 2019, AIF signed an agreement to acquire 100% of the shares in a thermal power plant in Kenya. The investment is
A.P. Moller Capital
A.P. Moller Capital was established in 2017 with A.P. Moller Holding as the largest shareholder and with the purpose of managing stand-alone capital funds. A.P. Moller Capital is headquartered in Denmark and is regulated by the Danish Financial Supervisory Authority (FSA).
EXECUTIVE BOARD • Kim Fejfer (Managing Partner and CEO) • Lars Reno Jakobsen (Senior Partner) • Jens Thomassen (Partner) • Joe N. Nielsen (Partner and CFO) BOARD OF DIRECTORS • Robert M. Uggla (Chairman) • Jan T. Nielsen • Martin N. Larsen

A.P. MØLLER HOLDING A/S ANNUAL REPORT 2019 · MANAGEMENT REVIEW
31
subject to the usual condition precedents and approvals and expected to close in Q1 2020. Furthermore, AIF signed an agreement to invest in the UK based platform company ARISE Ports & Logistics, focusing on ports and logistics activities in West-Africa. AIF holds a 43% ownership in the joint venture with Olam (31%) and Africa Finance Corporation (26%). The investment includes both brownfield and greenfield projects. The platform is an infrastructure ecosystem of ports, trucking, warehouses and rail services, which facilitates effective trade and creates a foundation for local growth. At the outset, the focus will be on investing in and expanding the ecosystem in con-nection with an existing general cargo port and a mineral port in Gabon, as well as developing new infrastructure ecosystems in other west African cargo centres. Through 2019, A.P. Moller Capital continued to build the organisa-tion in order to have the best capabilities for investments in trans-portation and energy sectors in Africa and now employs around 30 employees across its offices in Copenhagen and Dubai. The four partners forming the executive leadership team have more than century of combined industry and investment experience and are personally invested in the fund. A.P. Moller Capital has, during 2019, further developed its corpo-rate governance in terms of structures and systems to ensure a robust foundation for committed and future investments. Amongst other initiatives, A.P. Moller Capital has committed to UN’s Principles for Responsible Investment (UNPRI). Solid corporate governance principles and actively incorporating ESG as part of the investment process are key principles for the fund manager and is from A.P. Moller Capital’s perspective viewed as its ‘license to operate’. READY FOR OPPORTUNITIES A.P. Moller Capital remains interested in exploring a range of op-portunities related to its target sectors. The team is looking into opportunities, and the investment pipeline is strong within various sectors.
A.P. Moller Capital committed to its first investments in 2019 and is
seeing solid traction in the investment pipeline for opportunities
to mature in the transport and energy sectors also in 2020.

A.P. MØLLER HOLDING A/S ANNUAL REPORT 2019 · MANAGEMENT REVIEW
32
Our leadership
A.P. MØLLER HOLDING A/S ANNUAL REPORT 2019 · MANAGEMENT REVIEW
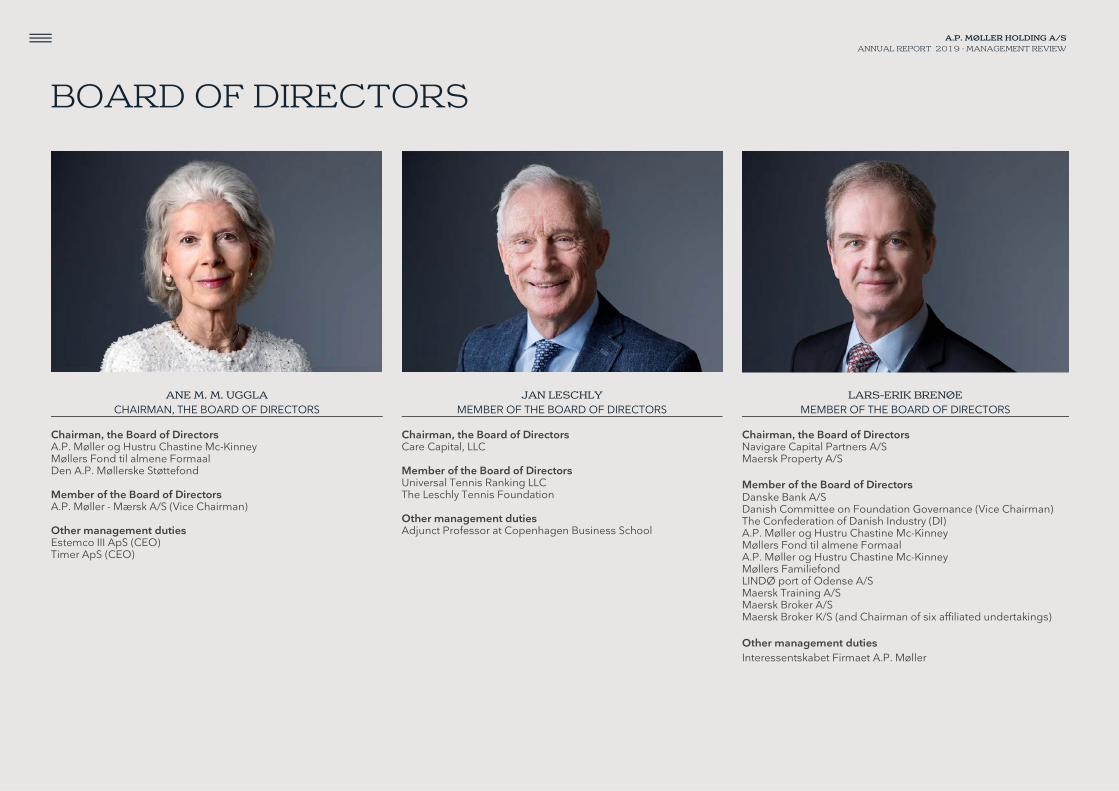
A.P. MØLLER HOLDING A/S ANNUAL REPORT 2019 · MANAGEMENT REVIEW
33
BOARD OF DIRECTORS
ANE M. M. UGGLA
CHAIRMAN, THE BOARD OF DIRECTORS JAN LESCHLY
MEMBER OF THE BOARD OF DIRECTORS LARS-ERIK BRENØE
MEMBER OF THE BOARD OF DIRECTORS Chairman, the Board of Directors A.P. Møller og Hustru Chastine Mc-Kinney Møllers Fond til almene Formaal Den A.P. Møllerske Støttefond Member of the Board of Directors A.P. Møller - Mærsk A/S (Vice Chairman) Other management duties Estemco III ApS (CEO) Timer ApS (CEO)
Chairman, the Board of Directors Care Capital, LLC Member of the Board of Directors Universal Tennis Ranking LLC The Leschly Tennis Foundation Other management duties Adjunct Professor at Copenhagen Business School
Chairman, the Board of Directors Navigare Capital Partners A/S Maersk Property A/S Member of the Board of Directors Danske Bank A/S Danish Committee on Foundation Governance (Vice Chairman) The Confederation of Danish Industry (DI) A.P. Møller og Hustru Chastine Mc-Kinney Møllers Fond til almene Formaal A.P. Møller og Hustru Chastine Mc-Kinney Møllers Familiefond LINDØ port of Odense A/S Maersk Training A/S Maersk Broker A/S Maersk Broker K/S (and Chairman of six affiliated undertakings) Other management duties Interessentskabet Firmaet A.P. Møller
A.P. MØLLER HOLDING A/S ANNUAL REPORT 2019 · MANAGEMENT REVIEW

A.P. MØLLER HOLDING A/S ANNUAL REPORT 2019 · MANAGEMENT REVIEW
34
EXECUTIVE BOARD & LEADERSHIP TEAM
ROBERT MÆRSK UGGLA CHIEF EXECUTIVE OFFICER
JAN THORSGAARD NIELSEN CHIEF INVESTMENT OFFICER
MARTIN NØRKJÆR LARSEN CHIEF FINANCIAL OFFICER
Robert M. Uggla, MSc in Business Administration, joined A.P. Moller - Maersk in 2004 and has held various roles, latest as CEO for Svitzer A/S. Chairman, the Board of Directors A.P. Møller Capital P/S Maersk Tankers A/S Maersk Product Tankers A/S Member of the Board of Directors A.P. Møller - Mærsk A/S Foundation Board of IMD The Drilling Company of 1972 A/S (Maersk Drilling) (Vice Chairman) Other management duties Agata ApS Estemco XII ApS Robert M. Uggla is appointed to the Board of Directors in a number of entities fully owned by A.P. Møller Holding A/S
Jan T. Nielsen, MSc in Economics, has extensive experience in private equity and investment banking from his role as Senior Managing Director at Blackstone Private Equity, Hong Kong. Chairman, the Board of Directors KK Wind Solutions Holding A/S Member of the Board of Directors Danske Bank A/S (Vice Chairman) A.P. Møller Capital P/S LEGO A/S Jan T. Nielsen is appointed to the Board of Directors in a number of entities fully owned by A.P. Møller Holding A/S
Martin N. Larsen, MSc in Economics & Finance, joined A.P. Moller - Maersk in 2003 and has held several roles, latest as VP, Head of Financial Planning & Analysis. Member of the Board of Directors The Drilling Company of 1972 A/S (Maersk Drilling) Maersk Tankers A/S Maersk Product Tankers A/S A.P. Møller Capital P/S Navigare Capital Partners A/S Assuranceforeningen SKULD (Gjensidige) Martin N. Larsen is appointed to the Board of Directors in a num-ber of entities fully owned by A.P. Møller Holding A/S

A.P. MØLLER HOLDING A/S ANNUAL REPORT 2019 · MANAGEMENT REVIEW
35
ANNE MARIE VIG HEAD OF COMPLIANCE & RISK
BIRGITTE SCHOU HEAD OF ACCOUNTING & TAX
ERIK BERGOO HEAD OF FINANCIAL INVESTMENTS
Anne Marie Vig, MSc in Economics, has comprehensive experi-ence heading compliance and risk management at group level in the financial sector.
Birgitte Schou, MSc in Business Administration & Auditing, is a state-authorised public accountant and has a strong track record as a former Partner in a leading global audit firm.
Erik Bergoo, MSc in Industrial Engineering & Management, has considerable experience from various roles in global financial markets in Scandinavia, UK and Singapore.
MARIA PEJTER HEAD OF HUMAN RESOURCES
MIKA B. LASSEN HEAD OF BRANDING & COMMUNICATIONS
MORTEN STAKROGE GENERAL COUNSEL
Maria Pejter, BSc in Political Science, has since 1997 held several top-level positions within organisational strategy and develop-ment in A.P. Moller - Maersk.
Mika Bildsøe Lassen, MSc in Communication & Public Relations, has extensive experience in international corporate communica-tion and brand management.
Morten Stakroge, LL.M and attorney-at-law, has substantial experi-ence from practicing law, primarily within M&A and corporate matters.

A.P. MØLLER HOLDING A/S ANNUAL REPORT 2019 · MANAGEMENT REVIEW
36
Our CSR & Risk management
A.P. MØLLER HOLDING A/S ANNUAL REPORT 2019 · MANAGEMENT REVIEW

A.P. MØLLER HOLDING A/S ANNUAL REPORT 2019 · MANAGEMENT REVIEW
37
WE ARE GUIDED BY OUR FIVE CORE VALUES
A.P. MØLLER HOLDING A/S ANNUAL REPORT 2019 · MANAGEMENT REVIEW

A.P. MØLLER HOLDING A/S ANNUAL REPORT 2019 · MANAGEMENT REVIEW
38
‘Nyttig virksomhed’ (purposeful business) is a key element in our investment strategy, and we are open to reconsider our ownership of a business, if its business model does not have a positive impact on society. Hence, social responsibility is integrated into our purpose and is core to everything we do. In 2019, we continued the implementation of new policies and systems to secure a solid basis for our future activities as an engaged investment company. We focus highly on mitigating the risks of being abused for money laundering or financing of terror-ism by third parties that A.P. Moller Holding engages with. This is especially relevant in relation to our investments, where we always conduct proper and adequate due diligence measures on relevant counterparties being advisors, co-investors etc. An example is our Anti-Bribery and Anti-Corruption Policy which illustrates our zero tolerance towards fraud and bribery. This is one of the cornerstones in our overall framework for how to exercise due care to prevent bribery and corruption internally as well as in relation to third parties acting on behalf of A.P. Moller Holding. The policy gives the overall guidelines in relation to procedures to
be followed when investing and when interacting with other busi-ness relationships, e.g. government officials, in relation to gifts and hospitality, etc. STATUTORY REPORT CF. SECTION 99A OF THE DANISH FINANCIAL STATEMENTS ACT As an international investment company with a broad range of investment activities, A.P. Moller Holding has a significant influ-ence on society. We acknowledge the responsibilities that this entails and make an effort to ensure that we are recognised as a trustworthy group of companies. The Board of Directors of each of our large investments, A.P. Moller - Maersk, Danske Bank, Maersk Drilling, Maersk Tankers, Maersk Product Tankers, KK Wind Solutions as well as A.P. Moller Capital, define their own specific CSR policies and Codes of Con-duct. We are represented on each board, and these representa-tives ensure that CSR policies, including human rights, climate change and environmental impact, are enforced. Policies are adapted to meet the circumstances in which each of the affiliates operate.
For A.P. Moller Holding’s statutory statement on CSR in accor-dance with section 99a of The Danish Financial Statements Act, please refer to: https://www.apmoller.com/wp-content/up-loads/2020/03/AP-Moller-Holding-CSR-Report-2019.pdf STATUTORY REPORT CF. SECTION 99B OF THE DANISH FINANCIAL STATEMENTS ACT The Board of Directors counts one woman and two men. This con-stitutes gender balance in accordance with the guidelines issued by The Danish Business Authority in March 2016. A.P. Moller Holding has not set a consolidated target for the under-represented gender across its holdings, but has ensured that all subsidiaries which fall under the requirements as reporting class large C or D have set targets for their supreme management body individually. Furthermore, our subsidiaries report on their individual targets in their annual reports, as well as for their indi-vidual policies concerning gender balance at other management levels, if applicable.
CORPORATE SOCIAL RESPONSIBILITY
A.P. Moller Holding invests in and builds businesses with a positive impact on society, ‘nyttig virksomhed’ – as defined by our founder A.P. Møller.

A.P. MØLLER HOLDING A/S ANNUAL REPORT 2019 · MANAGEMENT REVIEW
39
Risk management reporting is an integrated part of our business processes, allowing A.P. Moller Holding to respond appropriately to the changing environments our businesses are operating in. The Board of Directors receives portfolio performance reports including risk management measures on a regular basis through-out the year. During 2019, we have continued to grow the organisation and have built operational capabilities within the organisation. Being an investor focusing on capital risk, we continuously develop our risk framework and have embedded controls and operational risk mitigation processes in our critical daily operations. We have a constant focus on good governance and have implemented pro-cedures to continuously assess and ensure that we follow market standards and developments. Further, in line with the purpose of the A.P. Moller Foundation, and to ensure the long-term viability and longevity of A.P. Moller - Maersk, our holdings are structured as per visualisation on page 96.
OUR HOLDINGS Risks related to our holdings include business and financial risks associated with the operation and performance of our holdings. Management of such risks is effectively anchored with the Board of Directors in each of the individual holdings. Each entity has defined and implemented their own risk management framework, managing specific defined risks. As owners, we monitor business performance in the holdings closely, and reports on business and risk-related issues are appropriately provided to our Board of Directors. Our investment team is focusing on large and long-term invest-ments and brings valuable global investment expertise. As we evaluate investment opportunities, the investments will undergo committees and investment gates where thorough risk analysis, due diligence and mitigation are natural parts of the investment evaluation process. Our risk management framework allows us to critically evaluate such risks and where risks/rewards are not deemed attractive and in line with our values as well as our finan-cial and strategic beliefs, investments will not be committed.
As our investments are expected to have a long-term ownership horizon, we focus on the inherent risks related to such invest-ments. At all times, it is part of our strategic beliefs to invest in and build businesses that have a positive impact on soci-ety. Hence, we strive to ensure that all our partners acknowledge our values and share our commitment to conduct business in an ethical, legal and socially responsible manner. FINANCIAL INVESTMENTS A.P. Moller Holding has a financial portfolio primarily with expo-sure to global equity markets managed by our own internal invest-ment team. The overall objective of the portfolio is i) to create eco-nomic value in line with our values ii) ensure a part of our portfolio remains highly liquid, acting as a buffer in order for the company to be flexible and able to react as needed in relation to our large investments or to significant changes in our cash flows and iii) deliver performance in line with a fixed benchmark. The Board of Directors approves the investment policy and defines the acceptable risk limits including a variety of risk man-agement factors such as single line limits, currency exposures and asset class weights. These, in combination with internal invest-ment principles, guide the financial investments on a daily basis. We manage the market, credit, liquidity and currency risks related to our portfolio investments by limiting maximum exposure to individual asset classes and underlying assets. The guidelines are reviewed regularly to ensure they reflect the market situation, and our financial situation at any given time.
RISK MANAGEMENT
Our risk management setup allows us to safeguard the longevity of our portfolio companies by understanding the inherent risks associated with each of our holdings and to support the companies in managing these risks in a changing environment.

A.P. MØLLER HOLDING A/S ANNUAL REPORT 2019 · CONSOLIDATED FINANCIAL STATEMENTS
40
0
FINANCIAL STATEMENTS
A.P. MØLLER HOLDING A/S ANNUAL REPORT 2019 · FINANCIAL STATEMENTS

A.P. MØLLER HOLDING A/S ANNUAL REPORT 2019 · CONSOLIDATED FINANCIAL STATEMENTS
41
0
A.P. MØLLER HOLDING A/S ANNUAL REPORT 2019 · FINANCIAL STATEMENTS

A.P. MØLLER HOLDING A/S ANNUAL REPORT 2019 · CONSOLIDATED FINANCIAL STATEMENTS
42
CONSOLIDATED
FINANCIAL STATEMENTS
A.P. MØLLER HOLDING A/S ANNUAL REPORT 2019 · CONSOLIDATED FINANCIAL STATEMENTS

A.P. MØLLER HOLDING A/S ANNUAL REPORT 2019 · CONSOLIDATED FINANCIAL STATEMENTS
43
Consolidated financial statements ................................................................ 42 Consolidated income statement for 1 January to 31 December .............................................................. 44 Consolidated statement of comprehensive income ................................................................................... 44 Consolidated balance sheet as of 31 December ......................................................................................... 45 Consolidated cash flow statement ................................................................................................................. 46 Consolidated statement of changes in equity.............................................................................................. 47
Notes to consolidated financial statements ............................................... 48 — Note 1: Revenue ............................................................................................................................................ 50 — Note 2: Operating costs .............................................................................................................................. 51 — Note 3: Gain on sale of non-current assets, etc., net ............................................................................. 52 — Note 4: Financial income and expenses .................................................................................................. 52 — Note 5: Tax ..................................................................................................................................................... 53 — Note 6: Intangible assets ............................................................................................................................. 54 — Note 7: Property, plant and equipment .................................................................................................... 56 — Note 8: Right-of-use assets ......................................................................................................................... 58 — Note 9: Investments in joint ventures and associated companies ...................................................... 58 — Note 10: Deferred tax ................................................................................................................................... 59 — Note 11: Discontinued operations and assets held for sale ................................................................. 60 — Note 12: Share capital .................................................................................................................................. 61 — Note 13: Share-based payment ................................................................................................................. 62 — Note 14: Non-controlling interests ............................................................................................................ 65 — Note 15: Borrowings and net debt reconciliation ................................................................................... 66 — Note 16: Pensions and similar obligations .............................................................................................. 67 — Note 17: Provisions ...................................................................................................................................... 70 — Note 18: Derivatives ..................................................................................................................................... 70 — Note 19: Financial instruments by category ............................................................................................ 73 — Note 20: Financial risks, etc. ....................................................................................................................... 75 — Note 21: Commitments ............................................................................................................................... 78 — Note 22: Contingent liabilities .................................................................................................................... 79 — Note 23: Cash flow specifications .............................................................................................................. 80 — Note 24: Acquisition/sale of subsidiaries and activities ........................................................................ 80 — Note 25: Related parties .............................................................................................................................. 81 — Note 26: Events after the balance sheet date .......................................................................................... 82 — Note 27: Significant accounting policies .................................................................................................. 82 — Note 28: Significant accounting estimates and judgments .................................................................. 91 — Note 29: Company overview....................................................................................................................... 96
FINANCIAL STATEMENTS
CONTENTS
A.P. MØLLER HOLDING A/S ANNUAL REPORT 2019 · CONSOLIDATED FINANCIAL STATEMENTS

A.P. MØLLER HOLDING A/S ANNUAL REPORT 2019 · CONSOLIDATED FINANCIAL STATEMENTS
44
Note Amounts in DKKm 2019 2018
1 Revenue 275,032 262,613 2, 13 Operating costs - 232,587 - 235,187 Other income 4,285 2,219 Other costs - 4,537 - 1,082 Profit before depreciation, amortisation and impairment losses, etc. 42,193 28,563 6, 7, 8 Depreciation, amortisation and impairment losses, net - 32,156 - 22,285 3 Gain on sale of non-current assets, etc., net 572 1,119 Share of profit/loss in joint ventures 634 727 Share of profit/loss in associated companies 3,944 2,201 Profit/loss before financial items 15,187 10,325 4 Financial income 4,584 6,729 4 Financial expenses - 9,865 - 9,620 Profit/loss before tax 9,906 7,434 5 Tax - 3,329 - 2,719 Profit for the year - continuing operations 6,577 4,715 11 Profit for the year - discontinued operations 0 17,749 Profit/loss for the year 6,577 22,464 Of which: 14 Non-controlling interests 1,805 11,522 A.P. Møller Holding A/S share of profit for the year 4,772 10,942
In 2019, Maersk Supply Service ceased to be classified as discontinued operations. In accordance with IFRS, the income statement and cash flow statement have been restated for previous periods. In 2018, Maersk Oil was classified as discontinued operations and presented separately on an aggregated level in the income statement, balance sheet and cash flow statement until disposal.
Note Amounts in DKKm 2019 2018
Profit/loss for the year 6,577 22,464 Translation to functional currency Translation impact arising during the year - 538 - 2,179
Reclassified to income statement, gain on sale of non-current assets, etc., net 40 0
Cash flow hedges 18 Value adjustment of hedges for the year - 1,135 - 1,006 18 Reclassified to income statement 820 158 18 Reclassified to cost of property, plant and equipment 13 - 38 5 Tax on other comprehensive income 87 51
9 Share of other comprehensive income of joint ventures and associated companies, net of tax - 7 - 36
Total items that have been or may be reclassified subsequently to the income statement - 720 - 3,050
19 Other equity investments (FVOCI), fair value adjustments for the year 1,100 - 846 16 Actuarial gains/losses on defined benefit plans, etc. 608 - 45 Translation from functional currency to presentation currency 5,218 10,109 5 Tax on other comprehensive income 67 - 236
9 Share of other comprehensive income of joint ventures and associated companies, net of tax 136 - 53
Total items that will not be reclassified to the income statement 7,129 8,929 Other comprehensive income, net of tax 6,409 5,879 Total comprehensive income for the year 12,986 28,343
Of which: 14 Non-controlling interests 5,440 15,208 A.P. Møller Holding A/S share 7,546 13,135
CONSOLIDATED INCOME STATEMENT FOR 1 JANUARY TO 31 DECEMBER
CONSOLIDATED STATEMENT OF COMPREHENSIVE INCOME

A.P. MØLLER HOLDING A/S ANNUAL REPORT 2019 · CONSOLIDATED FINANCIAL STATEMENTS
45
Note Amounts in DKKm 2019 2018
6 Intangible assets 30,724 28,281 7 Property, plant and equipment 223,338 236,682 8 Right-of-use assets 57,062 0 9 Investments in joint ventures 8,025 8,693 9 Investments in associated companies 40,430 37,480 Other equity investments 651 356 18 Derivatives 1,075 880 16 Pensions, net assets 2,731 1,859 Loans receivable 1,068 1,122 Other receivables 2,137 1,794 Financial non-current assets, etc. 56,117 52,184 10 Deferred tax 1,604 1,676 Total non-current assets 368,845 318,823 Inventories 10,060 7,132 19 Trade receivables 26,700 27,139 Tax receivables 1,063 900 18 Derivatives 294 524 Loans receivable 1,791 1,304 Other receivables 6,268 5,863 Prepayments 3,860 4,063 Receivables, etc. 39,976 39,793 Securities 5,169 17,338 Cash and bank balances 36,467 23,395 11 Assets held for sale 1,705 6,632 Total current assets 93,377 94,290 Total assets 462,222 413,113
Note Amounts in DKKm 2019 2018
12 Share capital 2,000 2,000 Reserves 130,804 123,565 Proposed dividend 250 500 Equity attributable to A.P. Møller Holding A/S 133,054 126,065 14 Non-controlling interests 129,886 129,693 Total equity 262,940 255,758 15 Borrowings, non-current 64,212 65,980 15 Lease liabilities, non-current 49,123 12,117 16 Pensions and similar obligations 1,816 1,682 17 Provisions 4,292 4,872 18 Derivatives 2,431 1,578 10 Deferred tax 2,944 2,691 Tax payable, non-current 2,236 2,002 Other payables 341 274 Other non-current liabilities 14,060 13,099 Total non-current liabilities 127,395 91,196 15 Borrowings, current 6,432 11,641 15 Lease liabilities, current 8,787 2,632 17 Provisions 3,201 3,358 Trade payables 39,697 35,154 Tax payables 2,394 2,502 18 Derivatives 622 841 Other payables 8,824 6,776 Deferred income 1,429 1,527 Other current liabilities 56,167 50,158 11 Liabilities associated with assets held for sale 501 1,728 Total current liabilities 71,887 66,159 Total liabilities 199,282 157,355 Total equity and liabilities 462,222 413,113
CONSOLIDATED BALANCE SHEET AS OF 31 DECEMBER
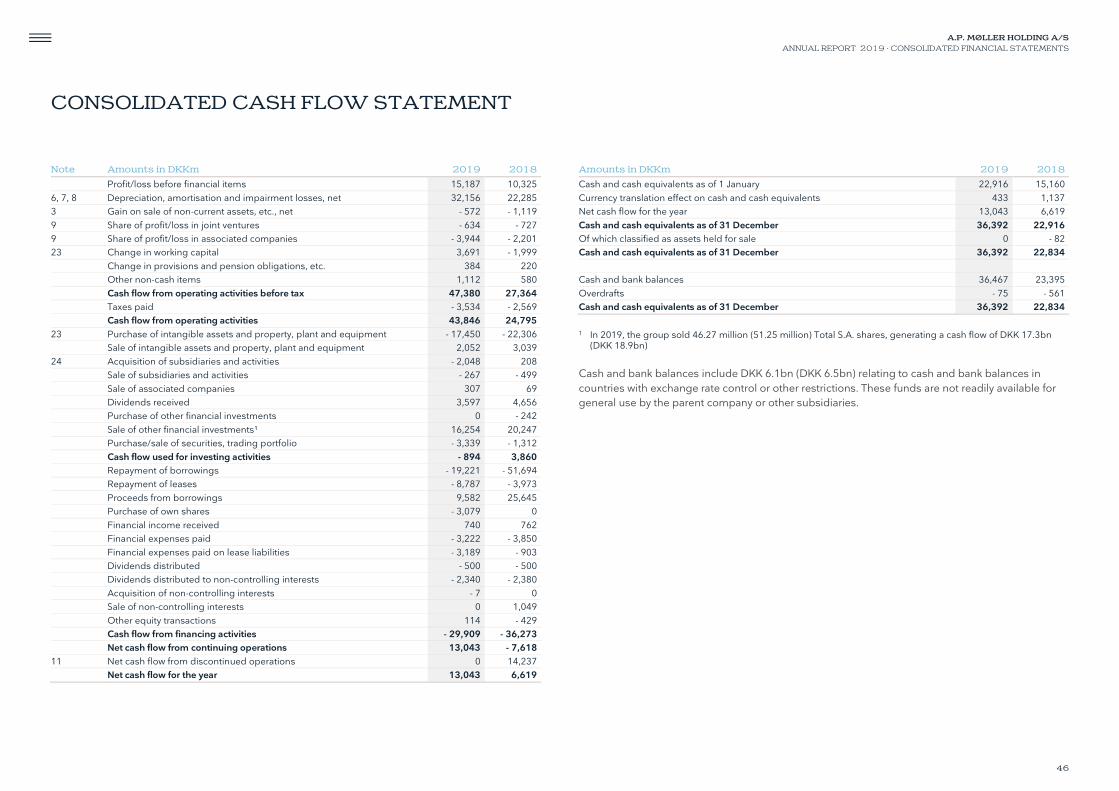
A.P. MØLLER HOLDING A/S ANNUAL REPORT 2019 · CONSOLIDATED FINANCIAL STATEMENTS
46
Note Amounts in DKKm 2019 2018
Profit/loss before financial items 15,187 10,325 6, 7, 8 Depreciation, amortisation and impairment losses, net 32,156 22,285 3 Gain on sale of non-current assets, etc., net - 572 - 1,119 9 Share of profit/loss in joint ventures - 634 - 727 9 Share of profit/loss in associated companies - 3,944 - 2,201 23 Change in working capital 3,691 - 1,999 Change in provisions and pension obligations, etc. 384 220 Other non-cash items 1,112 580 Cash flow from operating activities before tax 47,380 27,364 Taxes paid - 3,534 - 2,569 Cash flow from operating activities 43,846 24,795 23 Purchase of intangible assets and property, plant and equipment - 17,450 - 22,306 Sale of intangible assets and property, plant and equipment 2,052 3,039 24 Acquisition of subsidiaries and activities - 2,048 208 Sale of subsidiaries and activities - 267 - 499 Sale of associated companies 307 69 Dividends received 3,597 4,656 Purchase of other financial investments 0 - 242 Sale of other financial investments¹ 16,254 20,247 Purchase/sale of securities, trading portfolio - 3,339 - 1,312 Cash flow used for investing activities - 894 3,860 Repayment of borrowings - 19,221 - 51,694 Repayment of leases - 8,787 - 3,973 Proceeds from borrowings 9,582 25,645 Purchase of own shares - 3,079 0 Financial income received 740 762 Financial expenses paid - 3,222 - 3,850 Financial expenses paid on lease liabilities - 3,189 - 903 Dividends distributed - 500 - 500 Dividends distributed to non-controlling interests - 2,340 - 2,380 Acquisition of non-controlling interests - 7 0 Sale of non-controlling interests 0 1,049 Other equity transactions 114 - 429 Cash flow from financing activities - 29,909 - 36,273 Net cash flow from continuing operations 13,043 - 7,618 11 Net cash flow from discontinued operations 0 14,237 Net cash flow for the year 13,043 6,619
Amounts in DKKm 2019 2018
Cash and cash equivalents as of 1 January 22,916 15,160 Currency translation effect on cash and cash equivalents 433 1,137 Net cash flow for the year 13,043 6,619 Cash and cash equivalents as of 31 December 36,392 22,916 Of which classified as assets held for sale 0 - 82 Cash and cash equivalents as of 31 December 36,392 22,834 Cash and bank balances 36,467 23,395 Overdrafts - 75 - 561 Cash and cash equivalents as of 31 December 36,392 22,834
1 In 2019, the group sold 46.27 million (51.25 million) Total S.A. shares, generating a cash flow of DKK 17.3bn
(DKK 18.9bn) Cash and bank balances include DKK 6.1bn (DKK 6.5bn) relating to cash and bank balances in countries with exchange rate control or other restrictions. These funds are not readily available for general use by the parent company or other subsidiaries.
CONSOLIDATED CASH FLOW STATEMENT

A.P. MØLLER HOLDING A/S ANNUAL REPORT 2019 · CONSOLIDATED FINANCIAL STATEMENTS
47
Amounts in DKKm Share
capital
Transla-tion re-
serve
Reserve for other
equity in-vest-
ments
Reserve for
hedges Retained earnings
Proposed dividend Total
Non- control-
ling interests
Total equity
Equity as of 1 January 2018 2,000 - 739 67 67 111,654 500 113,549 115,953 229,502 Other comprehensive income, net of tax 0 - 933 - 465 - 375 3,966 0 2,193 3,686 5,879 Profit/loss for the year 0 0 0 0 10,442 500 10,942 11,522 22,464 Total comprehensive income for the year 0 - 933 - 465 - 375 14,408 500 13,135 15,208 28,343 Dividends to shareholders 0 0 0 0 0 - 500 - 500 - 2,380 - 2,880 Value of share-based payment 0 0 0 0 36 0 36 52 88 Sale of non-controlling interests 0 0 0 0 - 82 0 - 82 - 297 - 379 Sale of own shares 0 0 0 0 37 0 37 1,077 1,114 Capital increases and decreases 0 0 0 0 - 6 0 - 6 70 64 Transfer of loss on disposal of equity investments at FVOCI to retained earnings 0 0 - 150 0 150 0 0 0 0 Change in non-controlling interests 0 0 0 0 - 39 0 - 39 39 0 Other equity movements 0 0 0 0 - 4 0 - 4 - 29 - 33 Total transactions with shareholders 0 0 - 150 0 92 - 500 - 558 - 1,468 - 2,026 Equity as of 31 December 2018 2,000 - 1,672 - 548 - 308 126,154 500 126,126 129,693 255,819 2019 Impact due to implementation of new accounting standards 0 0 0 0 - 61 0 - 61 0 - 61 Adjusted equity as of 1 January 2019 2,000 - 1,672 - 548 - 308 126,093 500 126,065 129,693 255,758 Other comprehensive income, net of tax 0 - 251 489 - 113 2,649 0 2,774 3,635 6,409 Profit/loss for the year 0 0 0 0 4,522 250 4,772 1,805 6,577 Total comprehensive income for the year 0 - 251 489 - 113 7,171 250 7,546 5,440 12,986 Dividends to shareholders 0 0 0 0 0 - 500 - 500 - 2,340 - 2,840 Value of share-based payment 0 0 0 0 36 0 36 51 87 Purchase of own shares 0 0 0 0 0 0 0 - 3,080 - 3,080 Capital increases and decreases 0 0 0 0 0 0 0 74 74 Transfer of loss on disposal of equity investments at FVOCI to retained earnings 0 0 50 0 - 50 0 0 0 0 Other equity movements 0 0 0 0 - 93 0 - 93 48 - 45 Total transactions with shareholders 0 0 50 0 - 107 - 500 - 557 - 5,247 - 5,804 Equity as of 31 December 2019 2,000 - 1,923 - 9 - 421 133,157 250 133,054 129,886 262,940
CONSOLIDATED STATEMENT OF CHANGES IN EQUITY

A.P. MØLLER HOLDING A/S ANNUAL REPORT 2019 · CONSOLIDATED FINANCIAL STATEMENTS
48
Notes to
consolidated financial statements
A.P. MØLLER HOLDING A/S ANNUAL REPORT 2019 · CONSOLIDATED FINANCIAL STATEMENTS

A.P. MØLLER HOLDING A/S ANNUAL REPORT 2019 · CONSOLIDATED FINANCIAL STATEMENTS
49
A.P. MØLLER HOLDING A/S ANNUAL REPORT 2019 · CONSOLIDATED FINANCIAL STATEMENTS

A.P. MØLLER HOLDING A/S ANNUAL REPORT 2019 · CONSOLIDATED FINANCIAL STATEMENTS
50
Note 1: Revenue
TYPES OF REVENUE Amounts in DKKm 2019 2018
A.P. Moller - Maersk 259,104 247,801 Maersk Drilling 8,130 9,026 Maersk Tankers 2,273 1,671 Maersk Product Tankers 4,853 4,115 KK Wind Solutions 672 0 Total 275,032 262,613
CONTRACTS WITH CUSTOMERS Set out below is the reconciliation of the revenue from contracts with customers to the amounts dis-closed as total revenue: Amounts in DKKm 2019 2018
Revenue from contracts with customers 262,995 250,826 Revenue from other sources Vessel-sharing and slot charter income 7,923 6,512 Lease income 3,735 5,148 Others 379 127 Total 275,032 262,613
CONTRACT BALANCES Amounts in DKKm 2019 2018
Trade receivables 22,853 25,655 Accrued income - contract assets 819 456 Deferred income - contract liabilities 687 711
Accrued income included in trade receivables in the balance sheet, constitutes contract assets com-prising unbilled amounts, including mobilisation and demobilisation costs to customers, represent-ing the group’s right to consideration for the services transferred to date. Any amount previously recognised as accrued income is reclassified to trade receivables at the time it is invoiced to the customer.
Under the payment terms generally applicable to the group’s revenue generating activities, prepay-ments are received only to a limited extent. Typically, payment is due upon or after completion of the services. Part of the deferred income presented in the balance sheet constitutes contract liabilities which rep-resent advance payments and billings in excess of the recognised revenue. There were no significant changes in accrued income and deferred income during the reporting period. Impairment losses disclosed in note 20 relate to receivables arising from contracts with customers. PERFORMANCE OBLIGATIONS The transaction price allocated to the performance obligations that are to be completed under existing contracts, relates to the service element, which means that the amounts below exclude the estimated lease elements, which are presented in note 7. Jointly the two elements amount to the group's revenue backlog. Future performance obligations Amounts in DKKm 2019 2018
Within one year 5,479 3,116 Between one and five years 3,087 4,301 After five years 100 202 Total 8,666 7,619

A.P. MØLLER HOLDING A/S ANNUAL REPORT 2019 · CONSOLIDATED FINANCIAL STATEMENTS
51
Note 2: Operating costs
Amounts in DKKm 2019 2018
Cost of goods sold 7,136 7,466 Bunker costs 32,318 34,416 Terminal costs 45,185 44,656 Intermodal costs 27,684 26,263 Port costs 16,043 16,021 Rent and lease costs 10,788 19,641 Staff costs 36,138 33,924 Other costs 57,295 52,800 Total operating costs 232,587 235,187
Remuneration of employees Wages and salaries 31,058 29,222 Severance payments 814 473 Pension costs, defined benefit plans 227 224 Pension costs, defined contribution plans 2,038 1,903 Other social security costs 2,793 2,525 Total remuneration 36,930 34,347 Of which: Recognised in the cost of assets - 178 - 126 Included in other costs - 614 - 297 Expensed as staff costs 36,138 33,924 Average number of employees 88,006 86,113
Customary agreements have been entered into with employees regarding compensation in con-nection with resignation in line with local legislation and collective agreements. For information about share-based payment, reference is made to note 13.
FEES AND REMUNERATION TO THE EXECUTIVE BOARD AND BOARD OF DIRECTORS Amounts in DKKm 2019 2018
Executive Board Fixed annual fee and short-term cash incentive 29 17 Long-term cash incentive 16 4 Total remuneration to the Executive Board 45 21
Board of Directors Annual fee 3 5 Total fee to the Board of Directors 3 5
Fees and remuneration to the Board of Directors and Executive Board 48 26
The group has introduced a cash-settled incentive plan to members of the Executive Board. The incentive plan provides an annual bonus and long-term incentive programmes, which are deter-mined by the development of the investments. FEES TO STATUTORY AUDITORS PricewaterhouseCoopers including network firms Amounts in DKKm 2019 2018
Statutory audit 96 91 Other assurance services 13 13 Tax and VAT advisory services 8 6 Other services 22 21 Total fees 139 131
Fees for other services than the statutory audit of the financial statements provided by Pricewater-houseCoopers Statsautoriseret Revisionspartnerselskab to the group, mainly consist of audits of non-statutory financial statements, financial due diligence and transaction advice, accounting advi-sory services, tax advice and other services related to separating A.P. Moller - Maersk and Maersk Drilling, the listing of Maersk Drilling, review of the half-year interim report and other advisory ac-counting and tax services.

A.P. MØLLER HOLDING A/S ANNUAL REPORT 2019 · CONSOLIDATED FINANCIAL STATEMENTS
52
Note 3: Gain on sale of non-current assets, etc., net
Amounts in DKKm 2019 2018
Gains 953 1,688 Losses - 381 - 569 Gain on sale of non-current assets, etc., net 572 1,119
Gains in 2019 were primarily related to the sale of containers of DKK 540m, the sale and leaseback of vessels of DKK 126m and the sale of other assets of DKK 152m. In 2018, gains were primarily related to the disposal of shares in associates of DKK 497m, the sale and leaseback of vessels of DKK 240m and from container sales of DKK 107m.
Note 4: Financial income and expenses
Amounts in DKKm 2019 2018
Interest expenses on liabilities - 4,204 - 5,538 Of which borrowing costs capitalised on assets¹ 170 408 Interest expenses on lease liabilities - 3,195 0 Interest income on loans and receivables 719 530 Fair value adjustment transferred from equity hedge reserve (loss) - 207 - 335 Unwind of discount on provisions 0 - 6 Net interest expenses - 6,717 - 4,941 Exchange rate gains on bank balances, borrowings and working capital 2,312 4,133 Exchange rate losses on bank balances, borrowings and working capital - 1,873 - 3,714 Net foreign exchange gains/losses 439 419 Fair value gains from derivatives 653 512 Fair value losses from derivatives - 273 - 393 Fair value gains from securities 782 34 Fair value losses from securities - 336 - 183 Fair value gains on issued bonds 5 1 Fair value losses on issued bonds - 1 - 4 Net fair value gains/losses 830 - 33 Dividends received from securities 113 1,519 Impairment losses on financial non-current receivables - 13 - 19 Reversal of write-downs of loans and other non-current receivables 67 164 Financial expenses, net² - 5,281 - 2,891 Of which: Financial income 4,584 6,729 Financial expenses - 9,865 - 9,620
1 The capitalisation rate used to determine the amount of borrowing costs eligible for capitalisation
is 5.2% (4.3%) 2 Of which DKK 80m relates to a loss on the prepayment of issued bonds For an analysis of gains and losses from derivatives, reference is made to note 18.

A.P. MØLLER HOLDING A/S ANNUAL REPORT 2019 · CONSOLIDATED FINANCIAL STATEMENTS
53
Note 5: Tax
Amounts in DKKm 2019 2018
Tax recognised in the income statement Current tax on profits for the year 2,699 3,104 Adjustment for current tax of prior periods 177 - 565 Utilisation of previously unrecognised deferred tax assets - 40 - 38 Total current tax 2,836 2,501 Origination and reversal of temporary differences - 119 - 429 Adjustment for deferred tax of prior periods - 68 - 158 Adjustment attributable to changes in tax rates and laws - 20 6 Recognition of previous unrecognised deferred tax assets - 28 - 44 Reassessment of recoverability of deferred tax assets, net 187 265 Total deferred tax - 48 - 360 Total income tax 2,788 2,141 Tonnage and freight tax 541 578 Total tax expenses 3,329 2,719
Amounts in DKKm 2019 2018
Tax reconciliation Profit/loss before tax 9,906 7,434 Profit/loss subject to Danish and foreign tonnage taxation, etc. - 3,771 2,742 Internal gain/loss on sale of assets 0 - 6 Share of profit/loss in joint ventures - 634 - 727 Share of profit/loss in associated companies - 3,944 - 2,201 Profit/loss before tax, adjusted 1,557 7,242 Tax using the Danish corporation tax rate (22%) 343 1,593 Tax rate deviations in foreign jurisdictions - 162 - 57 Non-taxable income - 500 - 478 Non-deductible expenses 1,843 781 Adjustment to previous years taxes 109 - 715 Effect of changed tax rate - 20 6 Change in recoverability of deferred tax assets 119 183 Deferred tax asset not recognised 911 829 Other differences, net 145 - 1 Total income tax 2,788 2,141
Tax recognised in other comprehensive income and equity 153 - 186 Of which: Current tax 193 - 192 Deferred tax - 40 6
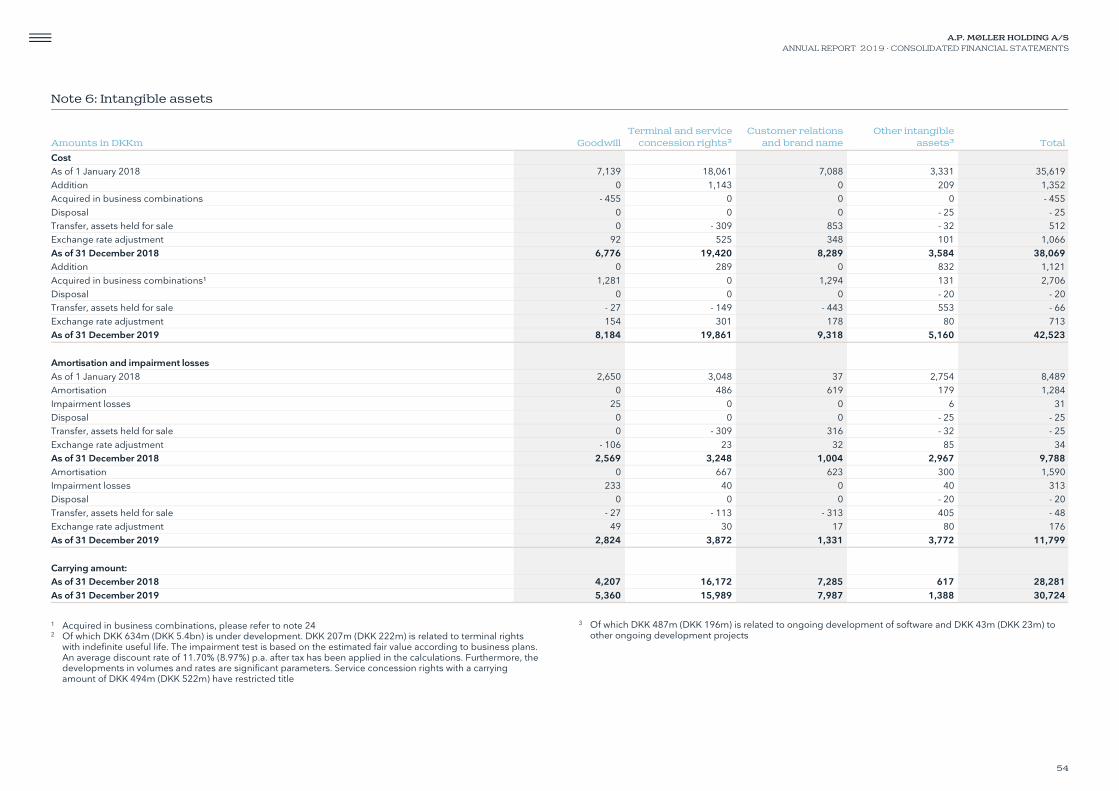
A.P. MØLLER HOLDING A/S ANNUAL REPORT 2019 · CONSOLIDATED FINANCIAL STATEMENTS
54
1 Acquired in business combinations, please refer to note 24 2 Of which DKK 634m (DKK 5.4bn) is under development. DKK 207m (DKK 222m) is related to terminal rights
with indefinite useful life. The impairment test is based on the estimated fair value according to business plans. An average discount rate of 11.70% (8.97%) p.a. after tax has been applied in the calculations. Furthermore, the developments in volumes and rates are significant parameters. Service concession rights with a carrying amount of DKK 494m (DKK 522m) have restricted title
3 Of which DKK 487m (DKK 196m) is related to ongoing development of software and DKK 43m (DKK 23m) to other ongoing development projects
Note 6: Intangible assets
Amounts in DKKm Goodwill Terminal and service
concession rights² Customer relations
and brand name Other intangible
assets³ Total
Cost As of 1 January 2018 7,139 18,061 7,088 3,331 35,619 Addition 0 1,143 0 209 1,352 Acquired in business combinations - 455 0 0 0 - 455 Disposal 0 0 0 - 25 - 25 Transfer, assets held for sale 0 - 309 853 - 32 512 Exchange rate adjustment 92 525 348 101 1,066 As of 31 December 2018 6,776 19,420 8,289 3,584 38,069 Addition 0 289 0 832 1,121 Acquired in business combinations¹ 1,281 0 1,294 131 2,706 Disposal 0 0 0 - 20 - 20 Transfer, assets held for sale - 27 - 149 - 443 553 - 66 Exchange rate adjustment 154 301 178 80 713 As of 31 December 2019 8,184 19,861 9,318 5,160 42,523
Amortisation and impairment losses As of 1 January 2018 2,650 3,048 37 2,754 8,489 Amortisation 0 486 619 179 1,284 Impairment losses 25 0 0 6 31 Disposal 0 0 0 - 25 - 25 Transfer, assets held for sale 0 - 309 316 - 32 - 25 Exchange rate adjustment - 106 23 32 85 34 As of 31 December 2018 2,569 3,248 1,004 2,967 9,788 Amortisation 0 667 623 300 1,590 Impairment losses 233 40 0 40 313 Disposal 0 0 0 - 20 - 20 Transfer, assets held for sale - 27 - 113 - 313 405 - 48 Exchange rate adjustment 49 30 17 80 176 As of 31 December 2019 2,824 3,872 1,331 3,772 11,799
Carrying amount: As of 31 December 2018 4,207 16,172 7,285 617 28,281 As of 31 December 2019 5,360 15,989 7,987 1,388 30,724

A.P. MØLLER HOLDING A/S ANNUAL REPORT 2019 · CONSOLIDATED FINANCIAL STATEMENTS
55
Note 6: Intangible assets - continued
IMPAIRMENT ANALYSIS The recoverable amount of each cash generating unit (CGU) is determined on the basis of the higher of its value in use or fair value less cost to sell. The value in use is calculated using certain key assumptions for the expected future cash flows and applied discount factor. The cash flow projections are based on financial budgets and business plans approved by manage-ment. By nature, these projections are subject to judgments and estimates that are uncertain, though based on experience and external sources where available. The discount rates applied re-flect the time value of money as well as the specific risks related to the underlying cash flows, i.e. project and/or country specific risk premium. Further, any uncertainties reflecting past performance and possible variations in the amount or timing of the projected cash flows, are generally reflected in the discount rates. For the intangible assets, the impairment losses can be specified as follows:
Applied discount rate
p.a. after tax Impairment losses
Amounts in DKKm 2019 2018 2019 2018
Goodwill Terminals & Towage 13.0% 6.6% 40 25 Logistics & Services 8.7% 7.5% 193 Terminal and service concession rights Terminals & Towage 40 0 Other rights Terminals & Towage 13.0% 6.6% 20 6 Logistics & Services 20 Total 313 31
GOODWILL IMPAIRMENT TEST The carrying amount of goodwill has been allocated to the following operating cash generating units based on the management structure. Cash generating unit Carrying amount
Amounts in DKKm 2019 2018
Ocean 2,110 2,061 Multiple terminals 1,656 1,617 KK Wind Solutions 1,108 0 Other 486 529 Total 5,360 4,207
The most significant goodwill amount relates to Ocean, where the impairment test is based on the estimated value in use from five-year business plans and a calculated terminal value with growth equal to the expected economic growth of 2% p.a. in both 2019 and 2018. A discount rate of 7.7% (7.7%) has been applied. The key assumptions for Terminals & Towage’s value calculations are container moves, revenue and cost per move and discount rates. The cash flow projections cover the concession period and extension options where deemed likely that they will be exercised. The growth rates assumed reflect current market expectations for the relevant period. The recoverable value of KK Wind Solutions is based on a fair value corresponding to the acquisi-tion price less costs to sell, since the company was acquired in a recent market transaction, and the business has performed in line with expectations.

A.P. MØLLER HOLDING A/S ANNUAL REPORT 2019 · CONSOLIDATED FINANCIAL STATEMENTS
56
Note 7: Property, plant and equipment
Amounts in DKKm
Ships, contain-ers, etc.
Produc-tion facili-
ties and equip-
ment, etc. Rigs
Construc-tion work
in pro-gress and
payment on ac-count Total
Cost As of 1 January 2018 284,886 41,149 0 9,642 335,677 Addition 4,895 523 455 13,984 19,857 Acquired in business combinations - 51 164 0 6 119 Disposal - 5,325 - 626 - 1,289 - 32 - 7,272 Transfer 12,216 1,459 720 - 14,395 0 Transfer, assets held for sale - 171 - 196 66,801 613 67,047 Exchange rate adjustment 13,947 932 2,164 269 17,312 As of 31 December 2018 310,397 43,405 68,851 10,087 432,740 Transfer of IAS 17 finance lease 20,823 1,109 - 1,030 1,304 22,206 Addition 3,612 627 0 11,798 16,037 Acquired in business combinations 0 110 0 9 119 Disposal - 7,040 - 852 - 3,335 - 74 - 11,301 Transfer 9,008 6,556 1,107 - 15,990 681 Transfer, assets held for sale - 1,295 - 2,354 - 1,554 0 - 5,203 Reclassification from/to right-of-use assets - 27,805 - 920 0 0 - 28,725 Exchange rate adjustment 7,815 607 1,606 167 10,195 As of 31 December 2019 315,515 48,288 65,645 7,301 436,749
Amounts in DKKm
Ships, contain-ers, etc.
Produc-tion facili-
ties and equip-
ment, etc. Rigs
Construc-tion work
in pro-gress and
payment on ac-count Total
Depreciation and impairment losses As of 1 January 2018 116,467 18,877 0 378 135,722 Depreciation 16,934 2,425 3,228 0 22,587 Impairment losses 69 928 0 82 1,079 Reversal of impairment losses - 6 - 13 - 5,116 0 - 5,135 Disposal - 3,562 - 461 - 1,017 - 44 - 5,084 Transfer 145 0 - 114 - 32 - 1 Transfer, assets held for sale - 101 - 297 39,578 0 39,180 Exchange rate adjustment 6,133 396 1,187 - 6 7,710 As of 31 December 2018 136,079 21,855 37,746 378 196,058 Transfer of IAS 17 finance lease 15,349 378 - 241 1,109 16,595 Depreciation 16,105 2,550 2,361 0 21,016 Impairment losses 504 233 227 0 964 Reversal of impairment losses - 440 - 353 0 - 73 - 866 Disposal - 5,665 - 803 - 3,335 - 13 - 9,816 Transfer 1,362 227 0 - 1,342 247 Transfer, assets held for sale - 866 - 1,867 - 1,300 0 - 4,033 Reclassification from/to right-of-use assets - 11,505 - 200 0 0 - 11,705 Exchange rate adjustment 3,727 302 888 34 4,951 As of 31 December 2019 154,650 22,322 36,346 93 213,411
Carrying amount: As of 31 December 2018 174,318 21,550 31,105 9,709 236,682 As of 31 December 2019 160,865 25,966 29,299 7,208 223,338
Of which carrying amount of finance leased as-sets: As of 31 December 2018 15,938 659 0 26 16,623
Following the IFRS 16 implementation in 2019, right-of-use assets are shown separately in note 8.

A.P. MØLLER HOLDING A/S ANNUAL REPORT 2019 · CONSOLIDATED FINANCIAL STATEMENTS
57
Note 7: Property, plant and equipment - continued
IMPAIRMENT ANALYSIS For information on impairment tests, reference is made to note 6 and note 28. In the cash generating units, the tests gave rise to impairment losses and reversals. Cash generating unit
Amounts in DKKm
Impair-ment
losses
Reversal of
impair-ment
losses
Applied discount rate p.a. after tax
Re- coverable
amount
2019
Towage 107 0 13.0% 427 Jack-up rigs¹ 227 0 254 Supply vessels² 207 0 Tanker vessels 197 440 8.0% 694 Container manufacturing facilities 0 340 Others 226 86 Total 964 866
2018 Terminals 126 0 8.5% 126 Floaters 0 2,811 10.0% 12,171 Jack-up rigs 0 2,305 10.0% 18,191 Container manufacturing facilities 884 0 284 Others 69 19 Total 1,079 5,135
1 Impairment loss of DKK 227m relates to the impairment losses recognised on assets held for sale 2 Impairment loss of DKK 207m relates to the impairment losses recognised on newbuildings in the previous
years (onerous contracts) and reflected as impairment upon delivery in 2019 Impairment reversal 2019 Reversal of impairments in 2019 includes vessels sold during the year and reversal due to sale and leaseback transactions, DKK 440m.
Impairment reversal 2018 The value in use calculations for jack-up rigs and floaters are sensitive to the day rates expected to apply when contracts expire and to the risks of idle periods in the forecasts. In addition, the dis-count rate, growth rate and EBITDA margin after the budget period are critical variables. The sensitivity analysis shows that the impairment reversals in 2018, for the cash generating units where impairment reversals were recognised, would have been respectively: • DKK 7.5bn and DKK 3.0bn with a +/- 1 percentage point change in the discount rate, keeping all
other assumptions unchanged • DKK 6.0bn and DKK 4.2bn with a +/- 1 percentage point change in growth rate after
budget period, keeping all other assumptions unchanged • DKK 9.0bn and DKK 1.7bn with a +/- 5 percentage point change in EBITDA margin, keeping all
other assumptions unchanged OPERATING LEASES AS LESSOR Property, plant and equipment include assets which are leased out as part of the group’s activities. The amounts below comprise the calculated future minimum lease payments for the assets and ex-cludes the estimated service elements, which are presented in note 1. Jointly the two elements amount to the group’s revenue backlog. Operating lease receivables Amounts in DKKm 2019 2018
Within one year 3,307 3,646 Between one and five years 4,100 4,614 After five years 360 228 Total 7,767 8,488
PLEDGES Property, plant and equipment with a carrying amount of DKK 50.4bn (DKK 51.8bn) have been pledged as security for loans of DKK 20.8bn (DKK 23.3bn).

A.P. MØLLER HOLDING A/S ANNUAL REPORT 2019 · CONSOLIDATED FINANCIAL STATEMENTS
58
Note 8: Right-of-use assets
Amounts in DKKm
Ships, contain-ers, etc.
Conces-sion
agree-ments
Real estate and
other leases Total
Right-of-use assets As of 1 January 2019 20,790 15,332 5,158 41,280 Transfer from provisions - 23 0 0 - 23 Transfer from IAS 17 finance lease 16,300 0 720 17,020 Additions 3,543 5,202 1,453 10,198 Acquired in business combinations 0 0 130 130 Disposal - 2,141 - 13 - 120 - 2,274 Depreciation cost - 6,872 - 1,254 - 1,291 - 9,417 Transfer, assets held for sale - 26 - 387 - 7 - 420 Transfer to owned assets, etc. - 393 - 7 - 33 - 433 Exchange rate adjustment 503 381 117 1,001 As of 31 December 2019 31,681 19,254 6,127 57,062
As part the group’s activities, customary leasing agreements are entered into, especially regarding the chartering of vessels, leasing of containers and other equipment and real estate. In some cases, leasing agreements comprise purchase options exercisable by the group and options for extending the lease term. The group also enters into arrangements that provide the right to use some existing infrastructure or land as required to carry out the terminal business. I 2018, The group recognised leased assets and corresponding liabilities in relation to leases that were classified as ‘finance leases’ under IAS 17. The assets were presented in property, plant and equipment and the finance lease liabilities as part of the group’s borrowings. Following the adop-tion of IFRS 16, all capitalised leases are presented as right-of-use assets, including those previously presented under property, plant and equipment. To optimise lease costs during the contract period, the group sometimes provides residual value guarantees in relation to equipment leases. At the end of 2019, the expected residual values were reviewed to reflect the actual residual values achieved on comparable assets and expectations about future prices. As of 31 December 2019, DKK 3.3bn is expected to be payable and is included in the measurement of lease liabilities. Leases to which the group is committed, but for which the lease term has not yet commenced have an undiscounted value of DKK 3.2bn. They comprise 48 contracts commencing in 2020 and 2021. The maturity of lease liabilities is presented in note 20.
Total cash outflow for leases amounts to DKK 12.0bn. Certain terminal concession agreements contain variable payment terms that are linked to future performance, i.e. number of containers handled, depend on an index or a combination hereof. Such payments are recognised in the income statement in the period in which the condition that triggers those payments occurs. Amount recognised in profit and loss Total
Amounts in DKKm 2019
Depreciation cost on right-of-use assets 9,417 Interest expenses (included in financial expenses) 3,195 Expenses relating to service elements of leases 5,742 Expenses relating to short-term leases 3,532 Expenses relating to variable lease payments 1,347 Expenses relating to lease of low-value assets 173 Income from sublease of right-of-use assets - 10 Total recognised in operating costs 10,784
Note 9: Investments in joint ventures and associated companies
Investments in joint ventures Amounts in DKKm 2019 2018
A.P. Møller Holding A/S share of: Profit for the year 634 727 Comprehensive income - 7 12
Investments in associated companies Amounts in DKKm 2019 2018
A.P. Møller Holding A/S share of: Profit for the year 3,944 2,201 Comprehensive income 136 - 102

A.P. MØLLER HOLDING A/S ANNUAL REPORT 2019 · CONSOLIDATED FINANCIAL STATEMENTS
59
Note 9: Investments in associated companies - continued
Below is summarised financial information for individual associates, material for the group: The associated company Danske Bank A/S (100%) only Amounts in DKKm 2019 2018
Total income 154,227 98,033 Operating costs, depreciations, financials, tax, etc. - 139,155 - 83,344 Profit for the year 15,072 14,689 Comprehensive income 639 - 482 Comprehensive income, total 15,711 14,207
Non-current assets 2,588,338 2,292,579 Current assets 1,172,711 1,285,888 Non-current liabilities - 2,736,326 - 2,412,003 Current liabilities - 854,216 - 1,017,486 Total assets, net 170,507 148,978
Cash and bank balances 99,035 40,997
A.P. Moller Holding's share of the associated company Danske Bank A/S: Amounts in DKKm 2019 2018
A.P. Møller Holding A/S share of: Profit for the year 3,037 2,927 Comprehensive income 135 - 102
Dividends received during the year 1,558 1,874
A.P. Møller Holding A/S share of: Ownership interest 33,210 31,599 Goodwill 964 964 Carrying amount 34,174 32,563
A.P. Møller Holding A/S’ share of Danske Bank A/S’ market value at 31 December 2019 amounted to DKK 19.8bn (DKK 23.6bn).
Danske Bank remains in dialogue with various authorities regarding the terminated non-resident portfolio at Danske Bank’s Estonian branch, which was active between 2007 and 2015. This includes criminal and regulatory investigations by authorities in Estonia, Denmark, France and the US. Danske Bank continues to cooperate with all authorities. The overall timing of completion and the outcome of the investigations by, and subsequent discus-sions with, the authorities, are uncertain. It is not yet possible to reliably estimate the timing, form of resolution, or amount of potential settlement or fines, if any, which could be material. Based on orders from the Danish FSA, Danske Bank’s solvency need has been increased in 2018 by a Pillar II add-on in total DKK 10bn to ensure adequate capital coverage of the increased compli-ance and reputational risks in relation to the Estonian AML matter. Reference is made to note 28. Note 10: Deferred tax
Recognised deferred tax assets and liabilities are attributable to the following: Assets Liabilities Net liabilities
Amounts in DKKm 2019 2018 2019 2018 2019 2018
Intangible assets 210 0 1,629 0 1,419 0 Property, plant and equipment 412 459 1,717 1,826 1,305 1,367 Provisions, etc. 769 773 280 39 - 489 - 734 Tax loss carry-forwards 870 1,083 0 0 - 870 - 1,083 Other 316 392 291 1,857 - 25 1,465 Total 2,577 2,707 3,917 3,722 1,340 1,015 Offsets - 973 - 1,031 - 973 - 1,031 0 0 Total 1,604 1,676 2,944 2,691 1,340 1,015

A.P. MØLLER HOLDING A/S ANNUAL REPORT 2019 · CONSOLIDATED FINANCIAL STATEMENTS
60
Note 10: Deferred tax - continued
Change in deferred tax, net during the year Amounts in DKKm 2019 2018
As of 1 January 1,015 952 Intangible assets - 120 0 Property, plant and equipment - 20 147 Provisions, etc. 200 - 464 Tax loss carry-forwards 217 164 Other - 325 - 207 Recognised in the income statement - 48 - 360 Other including business combinations 343 58 Transfer, assets held for sale 0 298 Exchange rate adjustments 30 67 As of 31 December 1,340 1,015
Unrecognised deferred tax assets Amounts in DKKm 2019 2018
Deductible temporary differences 942 796 Tax loss carry-forwards 5,305 4,290 Unused tax credit 87 85 Total 6,334 5,171
The unrecognised deferred tax assets have no significant time limitations. There are no substantial unrecognised tax liabilities on investments in subsidiaries, associated companies or joint ventures. Deferred taxes are subject to uncertainties due to tax disputes in certain countries. Reference is made to note 28.
Note 11: Discontinued operations and assets held for sale
Discontinued operations include Maersk Oil until closing in March 2018. The results of the discon-tinued operations are presented in one separate line in the income statement, cash flow statement and balance sheet. Amounts in DKKm 2019 2018
Profit/loss for the period - discontinued operations Revenue 0 3,474 Expenses 0 - 1,181 Gains/losses on sale of assets and businesses 0 16,631 Profit/loss before tax, etc. 0 18,924 Tax 0 - 1,175 Profit/loss for the year - discontinued operations 0 17,749 Cash flow from discontinued operations Cash flow from operating activities 0 2,059 Cash flow used for investing activities 0 12,165 Cash flow from financing activities 0 13 Net cash flow from discontinued operations 0 14,237
1 The tax relates to the profit from the ordinary activities of discontinued operations. There is no tax related to the
gain on the sale of Maersk Oil, DKK 16.7bn in 2018 Amounts in DKKm 2019 2018
Balance sheet items comprise Intangible assets 47 39 Property, plant and equipment 1,155 5,595 Other assets 0 359 Non-current assets 1,202 5,993 Current assets 503 639 Assets held for sale 1,705 6,632 Provisions 7 606 Deferred tax liabilities 7 0 Other liabilities 487 1,122 Liabilities associated with assets held for sale 501 1,728
As of 31 December 2019, assets held for sale relate to a jack-up rig and vessels.

A.P. MØLLER HOLDING A/S ANNUAL REPORT 2019 · CONSOLIDATED FINANCIAL STATEMENTS
61
Note 11: Discontinued operations and assets held for sale - continued
MAERSK OIL On 21 August 2017, A.P. Moller - Maersk announced the sale of Maersk Oil to Total S.A. for USD 7.450m (approx. DKK 49.2bn) in a combined share and debt transaction. The transaction, which was based on a locked box mechanism from 30 June 2017, closed on 8 March 2018 with an ac-counting gain of DKK 16bn. In addition to the net cash proceeds of DKK 13bn after closing adjustments and free cash flow of DKK 2bn up to closing, A.P. Moller - Maersk received 97.5m shares in Total S.A., equivalent to an ownership interest of 3.7%. The market value of the Total S.A. shares was DKK 34bn at closing on 8 March 2018. The accounting gain comprises the original gain calculated on 30 June 2017 of DKK 18bn, reduced by the profit of DKK 7bn recognised in the period from 1 July 2017 up to closing of DKK 6.6bn, and the addition of the locked box interest and positive Total S.A. share price development totalling DKK 5bn. Period ended 8 March 2018 Maersk Oil reported a profit of DKK 0.9bn in 2018 before the elimination of internal interests. The gain and cash flow from closing the transaction is summarised below: Cash flow from sale Amounts in DKKm 2018
Carrying amount Intangible assets 4,920 Property, plant and equipment 42,635 Financial assets - non-current 2,735 Deferred tax assets 1,472 Current assets 8,451 Provisions - 17,477 Liabilities - 24,198 Net assets sold 18,538 Non-controlling interests 0 A.P. Møller Holding A/S share 18,538 Gain/loss on sale 16,625 Repayment of loan 15,791 Locked box interest received 985 Total consideration 51,939 Shares in Total S.A. received - 35,163 Contingent consideration assets 0 Cash and bank balances transferred at closing - 3,998 Cash flow from sale of subsidiaries and activities 12,778
SECONDARY DECOMMISSIONING LIABILITY As part of the divestment of Mærsk Olie & Gas A/S (MOGAS) to Total S.A., A.P. Møller - Mærsk A/S has assumed a secondary liability related to the decommissioning of the offshore facilities in Den-mark by issuance of a declaration. A.P. Møller - Mærsk A/S assesses the risk of economic outflows due to this secondary liability as very remote. Note 12: Share capital
The share capital comprises 2,000 shares of DKK 1m. Development in the number of shares and par value: Shares DKKm
As of 31 December 2018 2,000 2,000 As of 31 December 2019 2,000 2,000
All shares are fully issued and paid up. No shares hold special rights.

A.P. MØLLER HOLDING A/S ANNUAL REPORT 2019 · CONSOLIDATED FINANCIAL STATEMENTS
62
Note 13: Share-based payment
A.P. MØLLER - MÆRSK A/S (APMM) Restricted shares plan
Members of APMM
Executive Board¹
APMM employ-
ees¹ Total Total fair
value¹
Outstanding restricted shares No. No. No. DKKm
Outstanding as of 1 January 2018 0 14,532 14,532 Granted 1,002 4,241 5,243 51 Exercised 0 - 5,324 - 5,324 Forfeited 0 - 663 - 663 Outstanding as of 31 December 2018 1,002 12,786 13,788 Granted 1,310 4,319 5,629 47 Granted in connection with the Maersk Drilling demerger 294 1,286 1,580 Exercised 0 - 4,756 - 4,756 Forfeited - 739 - 1,700 - 2,439 Outstanding as of 31 December 2019 1,867 11,935 13,802
At the time of grant The restricted shares plan was introduced in 2013 and grants have been awarded to employees on a yearly basis since 2013. Grants have also been awarded to members of APMM’s Executive Board from 2018. The transfer of restricted shares is contingent upon the employee still being employed and not be-ing under notice of termination and takes place when three years have passed from the time of granting. For members of APMM’s Executive Board the vesting period is five years. The members of APMM’s Executive Board as well as other employees are not entitled to any divi-dends during the vesting period. Special conditions apply regarding illness, death and resignation as well as changes in APMM’s capital structure, etc. A part of APMM’s holding of own B shares will be used to meet APMM’s obligations in connection with the restricted shares plan. The fair value of restricted shares (APMM B shares) granted to 92 (105) employees and five (five) members of APMM’s Executive Board was DKK 47m (DKK 51m) at the time of grant. The total value of granted restricted shares recognised in the income statement is DKK 33m (DKK 51m).
The fair value per restricted share at the time of grant is DKK 8,668 (DKK 9,273), which is equal to the volume-weighted average share price on the date of grant, i.e. 1 April 2019. On 1 April 2019, the restricted shares originally granted in 2016 were settled with the employees. The weighted average share price on that date was DKK 8,668. The average remaining contractual life for the restricted shares as per 31 December 2019 is 1.7 years (1.4 years). Share option plan
Members of APMM
Executive Board¹
APMM employ-
ees¹ Total
Average exercise
price² Total fair
value¹
Outstanding restricted shares No. No. No. DKK DKKm
Outstanding as of 1 January 2018 4,928 20,602 25,530 10,647 Granted 6,230 18,137 24,367 9,382 44 Forfeited - 1,173 - 2,032 - 3,205 - 10,375 Outstanding as of 31 December 2018 9,985 36,707 46,692 10,006 Exercisable as of 31 December 2018 0 0 0
Granted 7,894 22,444 30,338 7,622 60 Forfeited - 6,080 - 3,125 - 9,205 - 9,141 Outstanding as of 31 December 2019 11,799 56,026 67,825 9,057 Exercisable as of 31 December 2019 0 18,435 18,435 10,630
At the time of grant 2 Average exercise prices were reduced following the demerger of Maersk Drilling and have been restated In addition to the plan described above, APMM has share option plans for members of APMM’s Ex-ecutive Board and other employees. Each share option granted is a call option to buy an existing B share of nominal DKK 1,000 in APMM.

A.P. MØLLER HOLDING A/S ANNUAL REPORT 2019 · CONSOLIDATED FINANCIAL STATEMENTS
63
Note 13: Share-based payment - continued
The share options are granted at an exercise price corresponding to 110% of the average market price on the first five trading days following the release of A.P. Møller - Mærsk A/S’ Annual Report. Exercising the share options is contingent upon the option holder still being employed at the time of exercise. The share options can be exercised when at least three years and no more than six years (seven years for share options granted to employees who are not members of APMM’s Execu-tive Board) have passed from the time of grant. Special conditions apply regarding illness, death and resignation as well as changes in APMM’s capital structure, etc. The share options can only be settled in shares. A part of APMM’s holding of own B shares will be used to meet APMM’s obligations in connection with the share option plans. The fair value of awards granted to five (five) members of APMM’s Executive Board and 75 (80) em-ployees was DKK 60m (DKK 44m) at the time of grant. The total value of granted share options rec-ognised in the income statement is DKK 33m (DKK 38m). No share options were exercised during 2018 and 2019. The average remaining contractual life is 5.2 years (5.5 years) as of 31 December 2019, and the exercise price for outstanding share options is DKK 9,057 (DKK 10,006). The following principal assumptions are used in the valuation:
Share options granted to members
of APMM Executive Board
Share options granted to employ-ees not members of
APMM Executive Board
2019 2018 2019 2018
Share price, volume-weighted average at the date of grant, 1 April, DKK 8,668 9,273 8,668 9,273 Share price, five days volume weighted average after publication of Annual Report, DKK 8,682 10,476 8,682 10,476 Exercise price, DKK 9,550 11,524 9,550 11,524 Exercise price following the demerger of Maersk Drilling, 2 April 2019, DKK 7,670 9,435 7,605 9,345 Expected volatility (based on historic volatility) 32% 33% 32% 33% Expected term 5.00 5.00 5.75 5.75 Expected dividend per share, DKK 150 150 150 150 Risk free interest rate - 0.36% 0.21% - 0.28% 0.29%
The fair value per option granted to members of APMM’s Executive Board is calculated at DKK 1,782 (DKK 1,712) at the time of grant, based on Black & Scholes’ option pricing model. The fair value per option granted to employees who are not members of APMM’s Executive Board is calcu-lated at DKK 1,914 (DKK 1,875) at the time of grant based on the same option pricing model. THE DRILLING COMPANY OF 1972 A/S (MD) Restricted shares units (RSU)
MD key manage-
ment per-sonnel¹
MD other employ-
ees¹ Total Total fair
value¹
Outstanding restricted shares No. No. No. DKKm
Outstanding as of 1 January 2019 0 0 0 Granted 116,599 26,104 142,703 73 Forfeited/cancelled - 10,772 - 1,618 - 12,390 Outstanding as of 31 December 2019 105,827 24,486 130,313
At the time of grant Following the listing on 4 April 2019, Maersk Drilling implemented a long-term incentive pro-gramme (the ‘LTI’) and a one-time transition grant. Maersk Drilling believes that providing remuner-ation in the form of shares to appropriate levels of management, promotes sustainable long-term value creation and ensures alignment of interest with its shareholders. Under the LTI and transition grant the Executive Management, key employees and certain other em-ployees in Maersk Drilling will receive a number of restricted share units. The vesting period for the RSUs is three years from the date of grant. Except for RSUs granted as part of the exchange grant, Maersk Drilling’s Executive Management will not be able to sell any shares vesting until the total pe-riod from grant (inclusive of the vesting period) is five years, i.e. a holding period of two years in ad-dition to the three-year vesting period. Maersk Drilling’s Executive Management and other key man-agement personnel are also subject to a share ownership requirement of twice the annual LTI grant level applicable.

A.P. MØLLER HOLDING A/S ANNUAL REPORT 2019 · CONSOLIDATED FINANCIAL STATEMENTS
64
Note 13: Share-based payment - continued
The transfer of restricted shares is contingent on the participants still being employed and not be-ing under notice of termination and generally takes place when three years have passed from the time of granting. The participants are not entitled to any dividend during the vesting period. Special conditions apply regarding illness, death and resignation as well as changes in capital structure, etc. In 2019, 48,188 RSUs have been granted under the LTI and 94,515 RSUs have been granted under the one-time transition grant, inclusive of 20,803 RSUs that represent the exchange grant for for-feited unvested restricted shares and options in A.P. Møller - Mærsk A/S (see below). The fair value of restricted shares granted to eight key management personnel and to 33 other em-ployees was DKK 73m at the time of the grant. Total expenses recognised in the income statement in 2019 for granted restricted shares were a cost of DKK 13m. The average fair value per restricted share at the time of grant was DKK 510, which is equal to the average closing price for the first five trading days on Nasdaq Copenhagen or, for subsequent grants, the five trading days after the publication of the half year results. The average remaining contractual life for the restricted shares as per 31 December 2019 was 2.3 years. The A.P. Moller - Maersk Group’s Restricted Shares Plan
B shares in A.P. Møller - Mærsk A/S
MD key manage-
ment per-sonnel¹
MD other employ-
ees¹ Total Total fair
value¹
Outstanding restricted shares No. No. No. DKKm
Outstanding as of 1 January 2018 752 553 1,305 Granted 354 156 510 6 Forfeited - 219 - 170 - 389 Outstanding as of 31 December 2018 887 539 1,426
Adjustment 94 - 255 - 161 1 Vested 0 - 50 - 50 Converted to restricted shares in The Drilling Company of 1972 A/S - 981 - 157 - 1,138 Outstanding as of 31 December 2019 0 77 77
At the time of grant
In previous years, certain Executives and employees participated in A.P. Moller - Maersk Group’s in-centive programmes. To ensure that Maersk Drilling Executive Management, other key executives and certain other em-ployees in Maersk Drilling had an equity interest in Maersk Drilling from the date of the demerger, they were required to forfeit all unvested APMM shares and share options as of 1 January 2019. The individuals instead received restricted share units in Maersk Drilling (the ‘exchange grant’). A total of 1,138 restricted share units (B-shares in APMM) were converted to restricted share units in The Drill-ing Company of 1972 A/S of a corresponding value. 981 of these related to key management per-sonnel and 157 related to other employees. Total expenses recognised in the income statement in 2019 for restricted shares granted in previ-ous years were a cost of DKK 1m (DKK 6m).

A.P. MØLLER HOLDING A/S ANNUAL REPORT 2019 · CONSOLIDATED FINANCIAL STATEMENTS
65
Note 13: Share-based payment - continued
MAERSK TANKERS A/S (MT) Cash-settled incentive plan
Cash-settled performance shares plan MT em-
ployees¹ Total fair
value¹
Carrying amount of
liabilities
Outstanding awards No. DKKm No.
Outstanding as of 1 January 2018 0 Granted 6 24 16 Exercised 0 Adjustment 2 Outstanding as of 31 December 2018 6 18
Granted 10 7 Exercised - 4 Adjustment 11 Outstanding as of 31 December 2019 6 32
At the time of grant In 2018, Maersk Tankers A/S introduced a performance shares plan to Executive Management. To participate in the shares plan, the Executive Management member is required to invest the same amount as the granted awards as a loan to Maersk Tankers. The Executive Management member is entitled to a new grant every year based on approval by MT’s Board of Directors. The actual cash settlement of the shares plan is dependent on the development of a synthetic share price for the sister company, Maersk Product Tankers A/S, and the Executive Management member still being employed at the date of settlement. The Executive Management member is entitled to a pro rata share upon termination before the shares plan expires. The fair value of awards granted to six (six) Maersk Tankers’ Executive Management members was DKK 10m (DKK 24m) at the time of grant. The total value of the awards recognised in the income statement is DKK 13m (DKK 18m). The average remaining contractual life for the cash-settled incentive plan is 2.25 years (3 years) as of 31 December 2019.
Note 14: Non-controlling interests
Amounts in DKKm 2019 2018
Non-controlling interests as of 1 January 129,693 115,953 Share of profit/loss for the year 1,805 11,522 Share of other comprehensive income for the year 3,635 3,686 Dividends to shareholders - 2,340 - 2,380 Value share-based payment 51 52 Purchase of own shares - 3,080 0 Acquisition of non-controlling interests 0 - 297 Sale of non-controlling interests¹ 0 1,077 Capital increase 74 70 Change in non-controlling interests 0 39 Other equity movements 48 - 29 Non-controlling interests as of 31 December 129,886 129,693
1 Including disposal of 30% shareholding in Maersk Product Tankers A/S in 2018 The group’s subsidiaries with significant non-controlling interests include:
Amounts in DKKm Registered
office
Non-con-trolling
interests
Percen-tage of
votes
A.P. Møller - Mærsk A/S Copenhagen 58.5 48.6 The Drilling Company of 1972 A/S Lyngby-Taarbæk 58.4 58.4 Maersk Product Tankers A/S Copenhagen 30.0 20.0 A.P. Møller Capital P/S Copenhagen 49.0 32.0

A.P. MØLLER HOLDING A/S ANNUAL REPORT 2019 · CONSOLIDATED FINANCIAL STATEMENTS
66
Note 14: Non-controlling interests - continued
Summarised financial information for each subsidiary with non-controlling interests that are material to the group:
A.P. Møller - Mærsk
A/S¹ The Drilling Company
of 1972 A/S Maersk Product
Tankers A/S
Amounts in DKKm 2019 2018 2019 2018 2019 2018
Statement of comprehensive income Revenue 259,371 246,465 8,150 9,026 4,853 4,087 Profit (loss) for the year - 293 20,345 - 754 5,944 616 - 196 Total comprehensive income 927 16,245 - 907 5,925 588 - 221 Profit (loss) for the year attributa-ble to non-controlling interests 2,046 11,564 - 440 2,466 185 - 59 Balance sheet Non-current assets 291,735 246,551 32,051 32,020 7,751 7,565 Current assets, including assets classified as held for sale 78,109 122,782 4,780 5,269 2,446 1,298 Non-current liabilities 111,669 77,193 8,973 9,371 5,109 4,624 Current liabilities, including liabili-ties classified as held for sale 177,328 74,388 3,291 3,045 6,572 1,193 Equity 192,516 217,759 24,568 24,872 3,626 3,039 Carrying amount of non- controlling interests of equity 114,444 128,757 14,343 10,352 1,088 911 Cash flow statement Cash flow from operating activities 39,476 20,370 2,801 3,745 1,343 575 Cash flow from investing activities 5,829 6,184 - 2,021 - 859 - 312 - 752 Cash flow from financing activities - 32,013 - 41,991 - 1,200 - 846 - 757 309 Cash flow from discontinued operations - 2,481 21,608 0 0 0 13 Net cash flow for the year 10,811 6,171 - 420 2,040 274 145 Dividends paid to the non-con-trolling interests during the year - 2,340 - 2,380 0 0 0 0
1 Including Maersk Drilling up to the distribution of shares in April 2019
Note 15: Borrowings and net debt reconciliation
Non-cash changes
Net debt as of 31
December Cash
flows¹ IFRS 16
adoption Additions,
net²
Foreign exchange
move-ments Other³
Net debt as of 31
December
Amounts in DKKm 2018 2019
Borrowings:
Bank and other credit institutions 42,584 - 6,018 0 759 964 176 38,465 Issued bonds 35,037 - 3,621 0 0 454 309 32,179 Total borrowings 77,621 - 9,639 0 759 1,418 485 70,644 Classified as non-current 65,980 64,212 Classified as current 11,641 6,432 Leases: Lease liabilities 14,749 - 8,787 41,280 9,607 1,199 - 138 57,910 Total leases 14,749 - 8,787 41,280 9,607 1,199 - 138 57,910 Classified as non-current 12,117 49,123 Classified as current 2,632 8,787 Total borrowings and leases 92,370 - 18,426 41,280 10,366 2,617 347 128,554 Derivatives hedge of borrowings, net 1,145 - 560 0 0 405 158 1,148
1 Total cash outflow impact for leases for 2019 was DKK 12.0bn, of which DKK 3.2bn relates to interest expenses
which are disclosed separately in note 4 2 Including business combinations 3 Other includes fair value changes and amortisation of fees

A.P. MØLLER HOLDING A/S ANNUAL REPORT 2019 · CONSOLIDATED FINANCIAL STATEMENTS
67
Note 15: Borrowings and net debt reconciliation - continued
Non-cash changes
Net debt as of 31
December Cash
flows¹ Acquisi-
tions
Foreign exchange
move-ments Other²
Net debt as of 31
December
Amounts in DKKm 2017 2018
Bank and other credit institutions 50,692 - 10,479 1,566 650 155 42,584 Finance lease liabilities 17,029 - 4,188 0 948 960 14,749 Issued bonds 48,435 - 14,262 0 453 411 35,037 Total 116,156 - 28,929 1,566 2,051 1,526 92,370 Borrowings: Classified as non-current 95,743 78,097 Classified as current 20,413 14,273 Derivatives hedge of borrowings, net - 546 10 0 1,524 157 1,145
1 Cash flows include prepayments of DKK 40.4bn of which DKK 35.4bn relates to prepayments made during
Q4 2018 2 Other includes new finance leases and fair value changes Note 16: Pensions and similar obligations
As an employer, the group participates in pension plans according to normal practice in the coun-tries in which it operates. Generally, the pension plans within the group are defined contribution plans, where contributions are recognised in the income statement on an accrual basis. A number of entities have defined benefit plans, in which retirement benefits are based on length of service and salary level. To a limited extent, these defined benefit plans also include payment of medical expenses, etc. Pension and medical plans which, as part of collective bargaining agreements, have been entered into with other enterprises (known as multi-employer plans) are treated as other pension plans. Such defined benefit plans are treated as defined contribution plans, when sufficient information for calculating the individual enterprise’s share of the obligation is not available. In 2020, the group expects to pay contributions totalling DKK 180m to funded defined benefit plans (DKK 176m in 2019).
UK Other Total UK Other Total
Amounts in DKKm 2019 2019 2019 2018 2018 2018
Specification of net liability Present value of funded plans 15,008 3,311 18,319 13,036 3,137 16,173 Fair value of plan assets - 17,959 - 2,630 - 20,589 - 15,013 - 2,491 - 17,504 Net liability of funded plans - 2,951 681 - 2,270 - 1,977 646 - 1,331 Present value of unfunded plans 0 921 921 0 756 756 Impact of minimum funding requirement/ asset ceiling 434 0 434 398 0 398 Net liability as of 31 December - 2,517 1,602 - 915 - 1,579 1,402 - 177 Of which: Pensions, net assets 2,731 1,859 Pensions and similar obligations - 1,816 - 1,682
The majority of the group’s defined benefit liabilities are in the UK, 78% and the US, 13%. All of the plans in the UK and the majority of the plans in the US are funded. Although all of the UK plans are now closed to new entrants, active members in the two largest plans continue to accrue new bene-fits. The smaller UK plans are all closed to new accruals, although a salary link remains in some of the plans. Overall, the plans have an average duration of 16 years and approx. 57% of the obligation is in re-spect of pensioner members. As well as being subject to the risks of falling interest rates, which would increase the obligation, poor asset returns and pensioners living longer than anticipated, the group is also subject to the risk of higher than expected inflation. This is because many pension benefits, particularly in the UK plans, increase in line with inflation, although some minimum and maximum limits apply.

A.P. MØLLER HOLDING A/S ANNUAL REPORT 2019 · CONSOLIDATED FINANCIAL STATEMENTS
68
Note 16: Pensions and similar obligations - continued
UK Total UK Total
Significant financial assumptions 2019 2019 2018 2018
Discount rate 1.9% 1.9% 2.8% 3.0% Inflation rate 3.1% 3.1% 3.4% 3.1%
Rates of life expectancy reflect the most recent mortality investigations, and in line with market prac-tice, an allowance is made for future improvements in life expectancy. The group assumes that future improvements will be in line with the latest projections, 1.25% for all UK plans. 31 December
Life expectancy 2019 2039 2018 2038
65 year old male in the UK 21.6 23.0 21.7 23.1
The liabilities are calculated using assumptions that are the group’s best estimate of future experi-ence bearing in mind the requirements of IAS 19. The group’s plans are funded in accordance with applicable local legislation. In the UK, each plan has a trustee board that is required to act in the best interest of plan members. Every three years, a formal valuation of the plan’s liabilities is carried out using a prudent basis, and if the plan is in deficit, the trustees agree with the group or the sponsoring employer on a plan for recovering that deficit. The expected contributions to the UK plans for 2020 are DKK 154m (DKK 137m in 2019) of which DKK 134m (DKK 0m in 2019) is deficit recovery contributions. In most of the UK plans, any surplus remaining after the last member dies may be returned to the group. However, the Merchant Navy Ratings Pension Fund (MNRPF) and the Merchant Navy Officers Pension Fund (MNOPF) contribu-tions paid by the group are not refundable in any circumstance and the balance sheet liability reflects an adjustment for any agreed deficit recovery contributions in excess of deficit determined using the group’s assumptions. In 2019, an adjustment of DKK 13m (DKK 13m) was applied in this respect.
The sensitivity of the liabilities and pension cost to the key assumptions are as follows: Sensitivities to key assumptions in the UK Increase Decrease
Factors ''Change in liability'' 2019 2019
Discount rate Increase/(decrease) by
25 basis points - 588 628
Inflation rate Increase/(decrease) by
25 basis points 307 - 354
Life expectancy Increase/(decrease)
by one year 754 - 734
Except for an insignificant portion, the plan assets held by the group are quoted investments. Specification of plan assets UK Other Total UK Other Total
Amounts in DKKm 2019 2019 2019 2018 2018 2018
Shares 1,195 875 2,070 1,702 861 2,563 Government bonds 9,366 661 10,027 6,300 567 6,867 Corporate bonds 4,353 527 4,880 3,567 450 4,017 Real estate 60 27 87 176 33 209 Other assets 2,984 501 3,485 3,261 580 3,841 Fair value as of 31 December 17,958 2,592 20,549 15,006 2,491 17,497
MULTI-EMPLOYER PLANS Under collective agreements, certain entities in the group participate together with other employers in defined benefit pension plans as well as welfare/medical plans (multi-employer plans). For the defined benefit pension plans, the group has joint and several liabilities to fund total obliga-tions. In 2019, the group’s contributions are estimated at DKK 554m (DKK 467m), while the contri-butions to be paid in 2020 are estimated at DKK 527m. In general, the contributions to the schemes are based on man-hours worked or cargo tonnage handled, or a combination hereof. No reliable basis exists for allocation of the schemes’ obligations and plan assets to individual employer participants. For the plans where the group has an interest and there is a deficit, the net obligations for all employers totalled DKK 4.7bn (DKK 5.9bn). This net obligation is based on the most recent available financial data from the plan’s trustees, calculated in accordance with the rules for such actuarial calculation in US GAAP. The deficit in some of the schemes may necessitate increased contributions in the future.
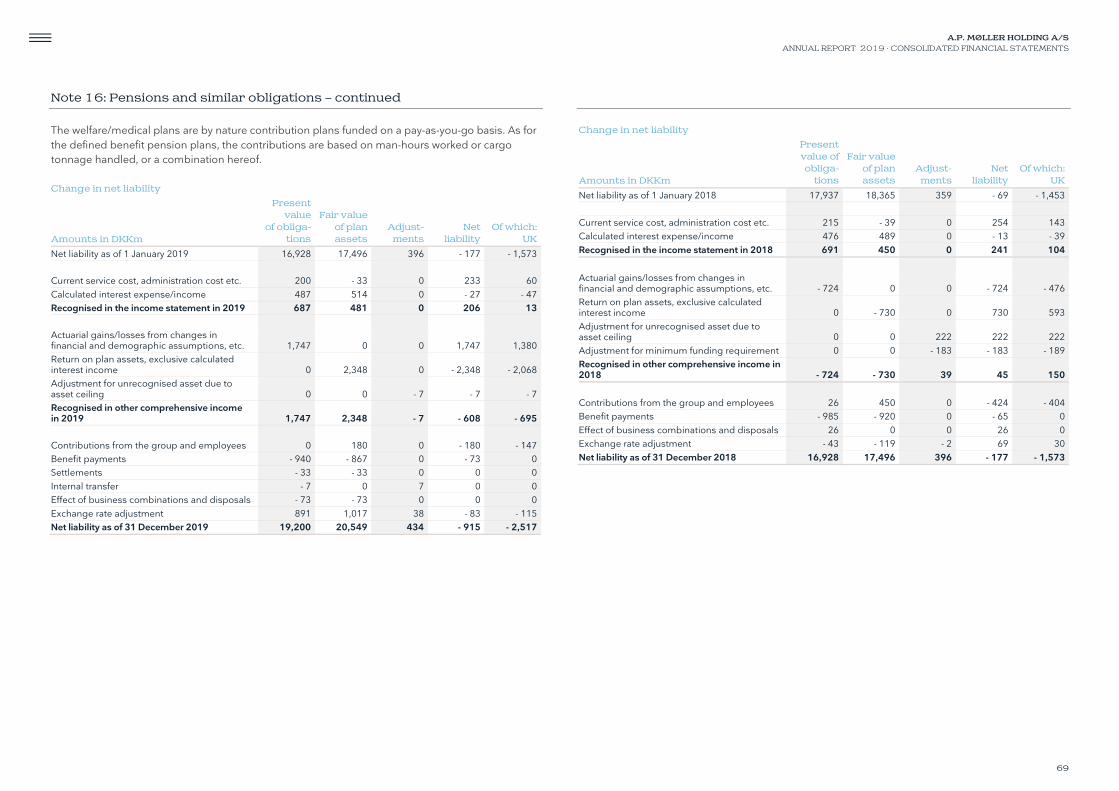
A.P. MØLLER HOLDING A/S ANNUAL REPORT 2019 · CONSOLIDATED FINANCIAL STATEMENTS
69
Note 16: Pensions and similar obligations – continued
The welfare/medical plans are by nature contribution plans funded on a pay-as-you-go basis. As for the defined benefit pension plans, the contributions are based on man-hours worked or cargo tonnage handled, or a combination hereof. Change in net liability
Amounts in DKKm
Present value
of obliga-tions
Fair value of plan assets
Adjust-ments
Net liability
Of which: UK
Net liability as of 1 January 2019 16,928 17,496 396 - 177 - 1,573 Current service cost, administration cost etc. 200 - 33 0 233 60 Calculated interest expense/income 487 514 0 - 27 - 47 Recognised in the income statement in 2019 687 481 0 206 13 Actuarial gains/losses from changes in financial and demographic assumptions, etc. 1,747 0 0 1,747 1,380 Return on plan assets, exclusive calculated interest income 0 2,348 0 - 2,348 - 2,068 Adjustment for unrecognised asset due to asset ceiling 0 0 - 7 - 7 - 7 Recognised in other comprehensive income in 2019 1,747 2,348 - 7 - 608 - 695 Contributions from the group and employees 0 180 0 - 180 - 147 Benefit payments - 940 - 867 0 - 73 0 Settlements - 33 - 33 0 0 0 Internal transfer - 7 0 7 0 0 Effect of business combinations and disposals - 73 - 73 0 0 0 Exchange rate adjustment 891 1,017 38 - 83 - 115 Net liability as of 31 December 2019 19,200 20,549 434 - 915 - 2,517
Change in net liability
Amounts in DKKm
Present value of obliga-
tions
Fair value of plan assets
Adjust-ments
Net liability
Of which: UK
Net liability as of 1 January 2018 17,937 18,365 359 - 69 - 1,453 Current service cost, administration cost etc. 215 - 39 0 254 143 Calculated interest expense/income 476 489 0 - 13 - 39 Recognised in the income statement in 2018 691 450 0 241 104
Actuarial gains/losses from changes in financial and demographic assumptions, etc. - 724 0 0 - 724 - 476 Return on plan assets, exclusive calculated interest income 0 - 730 0 730 593 Adjustment for unrecognised asset due to asset ceiling 0 0 222 222 222 Adjustment for minimum funding requirement 0 0 - 183 - 183 - 189 Recognised in other comprehensive income in 2018 - 724 - 730 39 45 150
Contributions from the group and employees 26 450 0 - 424 - 404 Benefit payments - 985 - 920 0 - 65 0 Effect of business combinations and disposals 26 0 0 26 0 Exchange rate adjustment - 43 - 119 - 2 69 30 Net liability as of 31 December 2018 16,928 17,496 396 - 177 - 1,573

A.P. MØLLER HOLDING A/S ANNUAL REPORT 2019 · CONSOLIDATED FINANCIAL STATEMENTS
70
Note 17: Provisions
Amounts in DKKm Restruc-
turing Legal dis-
putes, etc.
Onerous and unfa-vourable
contracts Other Total
As of 1 January 2019 528 4,845 1,289 1,815 8,477 Transfer to right-of-use assets 0 0 - 23 0 - 23 Provision made 687 1,835 134 1,724 4,380 Amount used - 334 - 1,515 - 193 - 323 - 2,365 Amount reversed - 100 - 921 - 1,236 - 740 - 2,997 Addition from business combinations 0 0 0 48 48 Transfer 0 - 173 0 - 14 - 187 Transfer, assets held for sale 0 - 87 0 47 - 40 Exchange rate adjustment 13 181 29 - 23 200 As of 31 December 2019 794 4,165 0 2,534 7,493 Of which: Classified as non-current 26 2,844 0 1,422 4,292 Classified as current 768 1,321 0 1,112 3,201 Non-current provisions expected to be realised after more than five years 240 174 414
Restructuring includes provisions for decided and publicly announced restructurings. Legal dis-putes, etc. include among other things tax, indirect tax and duty disputes. Other includes provisions for warranties and risk under certain self-insurance programmes. The provisions are subject to considerable uncertainty. Reference is made to note 28. Reversals of provisions primarily relate to unfavourable contracts, which were adjusted to right-of-use assets as a practical expedient upon application of IFRS 16, and to legal disputes and contrac-tual disagreements, which are recognised in the income statement under operating costs and tax.
Note 18: Derivatives
Amounts in DKKm 2019 2018
Non-current receivables 1,075 880 Current receivables 294 524 Non-current liabilities - 2,431 - 1,578 Current liabilities - 622 - 841 Liabilities, net - 1,684 - 1,015 Hedges comprise primarily currency derivatives and interest rate derivatives. Foreign exchange for-wards and option contracts are used to hedge the currency risk related to recognised and unrecog-nised transactions. Interest rate and cross currency swaps are used to hedge interest rate exposure on borrowings. Price hedge derivatives are used to hedge crude oil prices and bunker prices. The hedges are expected to be highly effective due to the nature of the economic relationship be-tween the exposure and hedge. The source of ineffectiveness is the credit risk of the hedging instru-ments. For hedges where cost of hedging is applied, the forward points and change in basis spread are recognised in other comprehensive income and transferred with the effective hedge, when the hedged transaction occurs. The cost of hedging reserve amounts to a gain of DKK 40m (DKK 7m). For information about risk management strategy, currencies, maturities, etc., reference is made to note 19.

A.P. MØLLER HOLDING A/S ANNUAL REPORT 2019 · CONSOLIDATED FINANCIAL STATEMENTS
71
Note 18: Derivatives - continued
HEDGE OF BORROWINGS The fair value of derivatives held at the balance sheet date can be allocated by type as follows:
Fair value,
asset Fair value,
liability
Nominal amount of derivative
Fair value, asset
Fair value, liability
Nominal amount of derivative
Amounts in DKKm 2019 2019 2019 2018 2018 2018
Hedge of borrowings Cross currency swaps - DKK 0 0 0 0 7 0 - EUR 354 634 10,682 633 920 17,588 - GBP 0 441 2,630 0 483 2,478 - JPY 67 73 1,375 65 78 1,330 - NOK 0 407 3,946 0 339 3,887 Interest rate swaps - cash flow hedges 547 925 16,290 215 75 13,961 - fair value hedges 94 0 6,008 0 98 3,261 Total 1,062 2,480 913 2,000
Hedge of operating cash flow and investment in foreign currencies Main currencies hedged - DKK 7 34 2,521 0 68 1,874 - EUR 20 48 4,405 0 80 3,448 - GBP 0 0 0 0 13 443 - NOK 0 1 50 0 0 0 Other currencies 189 46 8,576 13 66 3,225 Total 216 129 13 227
Held for trading Fair value Fair value
Amounts in DKKm 2019 2018
Currency derivatives - 186 117 Price hedges - 167 169 Total as of 31 December - 353 286
Cross currency swaps are used to swap all non-USD issued bonds. Fixed to floating rate swaps are designated as a combination of fair value and cash flow hedges. The principal amounts hereof are (USD equivalents): EUR 733m (EUR 1,723m), GBP 92m (GBP 89m), JPY 206m (JPY 204m) and NOK 250m (NOK 252m). The remaining swaps are fixed to fixed rate or floating to fixed rate swaps and are designated as cash flow hedges of currency and interest risk. The hedge ratio is 1:1. The maturity of the hedge instruments 0-5 years are (USD equivalents): EUR 671m (EUR 1,746m), JPY 92m (JPY 91m) and NOK 341m (NOK 344m). 5-10 years: EUR 839m (EUR 859m), GBP 394m (380m), JPY 114m (JPY 113m) and NOK 250m (NOK 252m). Above 10 years: EUR 90m (EUR 92m). Cross currency swaps are designated as a combination of hedge of principal cash flow and hedge of interests at a weighted average rate of 4.0% (4.5%). Interest rate swaps are all denominated in USD and pay either floating (fair value hedge) or fixed in-terest rates (cash flow hedge). The hedge ratio is 1:1 and the weighted average interest rate is 2.4% (2.5%), excluding margin on loans. The maturity of the interest rate swaps 0-5 years: DKK 15.4bn (DKK 6.0bn) and 5-10 years DKK 9.0bn (DKK 7.4bn). OTHER COMPREHENSIVE INCOME – CASH FLOW HEDGES Amounts in DKKm 2019 2018
Value adjustment of hedges for the year - 1,135 - 1,006 Reclassified to income statement: - revenue 33 6 - operating costs 547 0 - financial expenses 233 196 - discontinued operations 7 - 44 Total reclassified to income statement 820 158 Reclassified to non-current assets 13 - 38
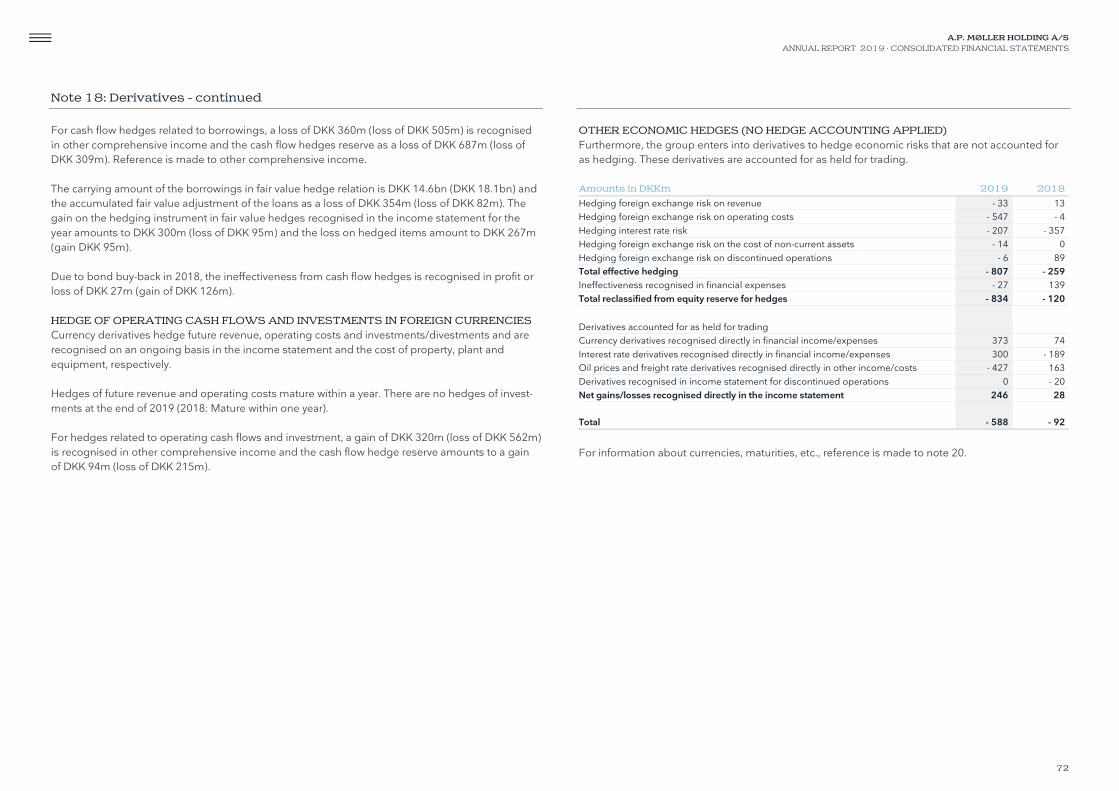
A.P. MØLLER HOLDING A/S ANNUAL REPORT 2019 · CONSOLIDATED FINANCIAL STATEMENTS
72
Note 18: Derivatives - continued
For cash flow hedges related to borrowings, a loss of DKK 360m (loss of DKK 505m) is recognised in other comprehensive income and the cash flow hedges reserve as a loss of DKK 687m (loss of DKK 309m). Reference is made to other comprehensive income. The carrying amount of the borrowings in fair value hedge relation is DKK 14.6bn (DKK 18.1bn) and the accumulated fair value adjustment of the loans as a loss of DKK 354m (loss of DKK 82m). The gain on the hedging instrument in fair value hedges recognised in the income statement for the year amounts to DKK 300m (loss of DKK 95m) and the loss on hedged items amount to DKK 267m (gain DKK 95m). Due to bond buy-back in 2018, the ineffectiveness from cash flow hedges is recognised in profit or loss of DKK 27m (gain of DKK 126m). HEDGE OF OPERATING CASH FLOWS AND INVESTMENTS IN FOREIGN CURRENCIES Currency derivatives hedge future revenue, operating costs and investments/divestments and are recognised on an ongoing basis in the income statement and the cost of property, plant and equipment, respectively. Hedges of future revenue and operating costs mature within a year. There are no hedges of invest-ments at the end of 2019 (2018: Mature within one year). For hedges related to operating cash flows and investment, a gain of DKK 320m (loss of DKK 562m) is recognised in other comprehensive income and the cash flow hedge reserve amounts to a gain of DKK 94m (loss of DKK 215m).
OTHER ECONOMIC HEDGES (NO HEDGE ACCOUNTING APPLIED) Furthermore, the group enters into derivatives to hedge economic risks that are not accounted for as hedging. These derivatives are accounted for as held for trading. Amounts in DKKm 2019 2018
Hedging foreign exchange risk on revenue - 33 13 Hedging foreign exchange risk on operating costs - 547 - 4 Hedging interest rate risk - 207 - 357 Hedging foreign exchange risk on the cost of non-current assets - 14 0 Hedging foreign exchange risk on discontinued operations - 6 89 Total effective hedging - 807 - 259 Ineffectiveness recognised in financial expenses - 27 139 Total reclassified from equity reserve for hedges - 834 - 120
Derivatives accounted for as held for trading Currency derivatives recognised directly in financial income/expenses 373 74 Interest rate derivatives recognised directly in financial income/expenses 300 - 189 Oil prices and freight rate derivatives recognised directly in other income/costs - 427 163 Derivatives recognised in income statement for discontinued operations 0 - 20 Net gains/losses recognised directly in the income statement 246 28 Total - 588 - 92
For information about currencies, maturities, etc., reference is made to note 20.
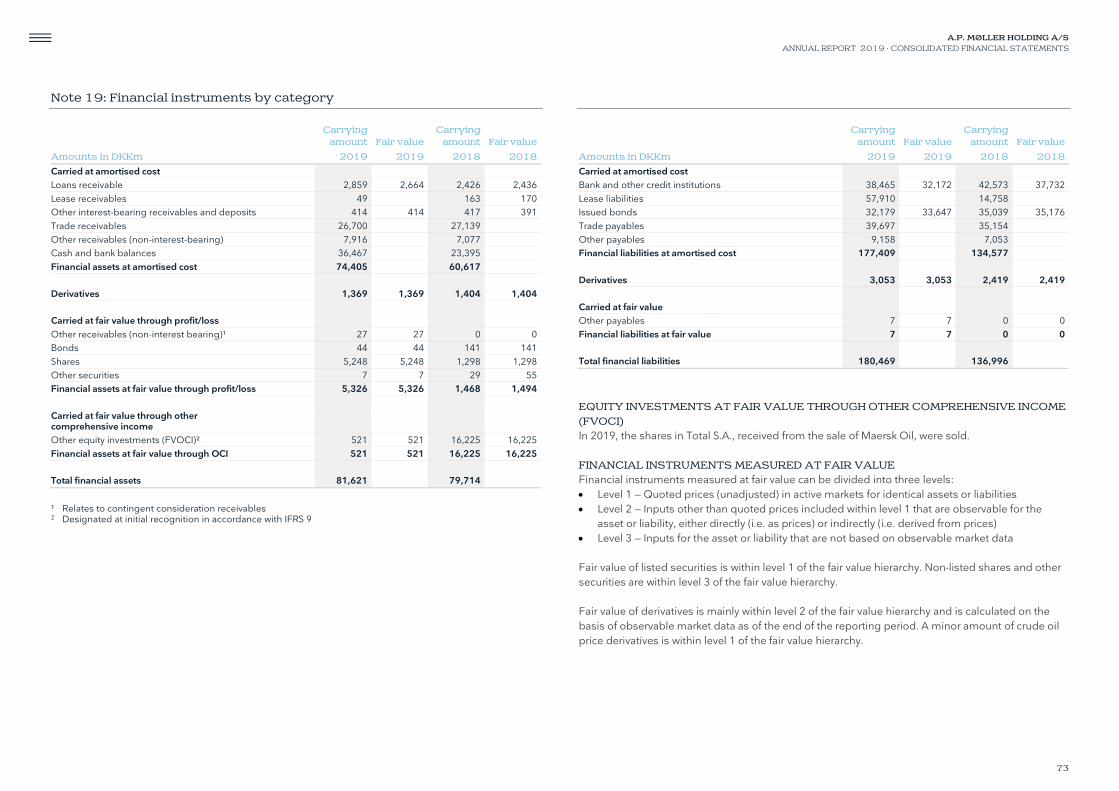
A.P. MØLLER HOLDING A/S ANNUAL REPORT 2019 · CONSOLIDATED FINANCIAL STATEMENTS
73
Note 19: Financial instruments by category
Carrying
amount Fair value Carrying
amount Fair value
Amounts in DKKm 2019 2019 2018 2018
Carried at amortised cost Loans receivable 2,859 2,664 2,426 2,436 Lease receivables 49 163 170 Other interest-bearing receivables and deposits 414 414 417 391 Trade receivables 26,700 27,139 Other receivables (non-interest-bearing) 7,916 7,077 Cash and bank balances 36,467 23,395 Financial assets at amortised cost 74,405 60,617 Derivatives 1,369 1,369 1,404 1,404 Carried at fair value through profit/loss Other receivables (non-interest bearing)¹ 27 27 0 0 Bonds 44 44 141 141 Shares 5,248 5,248 1,298 1,298 Other securities 7 7 29 55 Financial assets at fair value through profit/loss 5,326 5,326 1,468 1,494 Carried at fair value through other comprehensive income Other equity investments (FVOCI)² 521 521 16,225 16,225 Financial assets at fair value through OCI 521 521 16,225 16,225 Total financial assets 81,621 79,714
¹ Relates to contingent consideration receivables 2 Designated at initial recognition in accordance with IFRS 9
Carrying
amount Fair value Carrying
amount Fair value
Amounts in DKKm 2019 2019 2018 2018
Carried at amortised cost Bank and other credit institutions 38,465 32,172 42,573 37,732 Lease liabilities 57,910 14,758 Issued bonds 32,179 33,647 35,039 35,176 Trade payables 39,697 35,154 Other payables 9,158 7,053 Financial liabilities at amortised cost 177,409 134,577 Derivatives 3,053 3,053 2,419 2,419 Carried at fair value Other payables 7 7 0 0 Financial liabilities at fair value 7 7 0 0 Total financial liabilities 180,469 136,996
EQUITY INVESTMENTS AT FAIR VALUE THROUGH OTHER COMPREHENSIVE INCOME (FVOCI) In 2019, the shares in Total S.A., received from the sale of Maersk Oil, were sold. FINANCIAL INSTRUMENTS MEASURED AT FAIR VALUE Financial instruments measured at fair value can be divided into three levels: • Level 1 — Quoted prices (unadjusted) in active markets for identical assets or liabilities • Level 2 — Inputs other than quoted prices included within level 1 that are observable for the
asset or liability, either directly (i.e. as prices) or indirectly (i.e. derived from prices) • Level 3 — Inputs for the asset or liability that are not based on observable market data Fair value of listed securities is within level 1 of the fair value hierarchy. Non-listed shares and other securities are within level 3 of the fair value hierarchy. Fair value of derivatives is mainly within level 2 of the fair value hierarchy and is calculated on the basis of observable market data as of the end of the reporting period. A minor amount of crude oil price derivatives is within level 1 of the fair value hierarchy.

A.P. MØLLER HOLDING A/S ANNUAL REPORT 2019 · CONSOLIDATED FINANCIAL STATEMENTS
74
Note 19: Financial instruments by category - continued
Fair value of level 3 assets and liabilities is primarily based on the present value of expected future cash flows. A reasonable possible change in the discount rate is not estimated to affect the group’s profit or equity significantly. FINANCIAL INSTRUMENTS CARRIED AT AMORTISED COST Fair value of the short-term financial assets and other financial liabilities carried at amortised cost is not materially different from the carrying amount. In general, fair value is determined primarily based on the present value of expected future cash flows. However, where a market price was avail-able this was deemed to be the fair value. Financial assets and liabilities measured at fair value as of 31 December 2019
Amounts in DKKm Level 1 Level 2 Level 3
Financial assets Derivatives 0 1,369 0 Securities 5,303 0 517 Loan receivables 0 0 20 Financial assets at fair value as of 31 December 5,303 1,369 537 Financial liabilities Derivatives 0 3,053 0 Other payables 0 0 7 Financial liabilities at fair value as of 31 December 0 3,053 7
Financial assets and liabilities measured at fair value as of 31 December 2018
Amounts in DKKm Level 1 Level 2 Level 3
Financial assets Derivatives 0 1,404 0 Securities 17,463 0 256 Loan receivables 0 0 27 Financial assets at fair value as of 31 December 17,463 1,404 283 Financial liabilities Derivatives 0 2,419 0 Financial liabilities at fair value as of 31 December 0 2,419 0
Movement during the year in level 3
Amounts in DKKm
Other equity
invest-ments
(FVOCI)
Other equity
invest-ments
Other receiva-
bles
Total financial
assets
Carrying amount as of 1 January 2018 146 0 62 208 Addition 82 22 25 129 Gains/losses recognised in the income statement 0 0 - 63 - 63 Exchange rate adjustment, etc. 7 0 2 9 Carrying amount as of 31 December 2018 235 22 26 283 Addition 253 62 0 315 Disposal 0 - 23 - 7 - 30 Gains/losses recognised in other comprehensive income - 20 0 0 - 20 Exchange rate adjustment, etc. - 6 1 1 - 4 Carrying amount as of 31 December 2019 462 62 20 544
Movement during the year in level 3
Amounts in DKKm Other
payables
Total financial
liabilities
Carrying amount as of 1 January 2018 43 43 Disposal - 32 - 32 Gains/losses recognised in the income statement - 13 - 13 Exchange rate adjustment, etc. 2 2 Carrying amount as of 31 December 2018 0 0 Addition 7 7 Carrying amount as of 31 December 2019 7 7

A.P. MØLLER HOLDING A/S ANNUAL REPORT 2019 · CONSOLIDATED FINANCIAL STATEMENTS
75
Note 20: Financial risks, etc.
Risk management is most effectively managed de-centrally. Consequently, management in A.P. Moller Holding, A.P. Moller - Maersk, Maersk Drilling, Maersk Tankers, Maersk Product Tankers, KK Wind Solutions and A.P. Moller Capital define their own risk management policies and procedures, respectively. A.P. Moller Holding monitors business performance in the affiliates closely by ensuring presence in the Board of Directors. The group’s activities expose it to a variety of financial risks: • Market risks, i.e. currency risk, interest rate risk, and share price risk • Credit risk • Liquidity risk The group’s risk management programmes focus on the unpredictability of financial markets and seek to minimise the potential adverse effects on the group’s financial performance. The group uses derivative financial instruments to hedge certain risk exposures. MARKET RISK Market risk is the risk that changes in market prices, such as foreign exchange rates, interest rates, and share prices, which will affect the group’s profit or the value of its holdings of financial instru-ments. The sensitivity analyses below relate to the position of financial instruments as of 31 Decem-ber 2019. The sensitivity analyses for currency risk, interest rate risk and share price risk have been prepared on the basis that the amount of net debt, the ratio of fixed to floating interest rates of the debt and the proportion of financial instruments in foreign currencies remain unchanged from hedge desig-nations in place at 31 December 2019. Furthermore, it is assumed that the exchange rate and interest rate sensitivities have a symmetrical impact, i.e. an increase in rates results in the same ab-solute movement as a decrease in rates. The sensitivity analyses show the effect on profit or loss and equity of a reasonable possible change in exchange rates, interest rates and share prices.
CURRENCY RISK The group’s currency risk relates to the fact that while income from shipping and oil-related activi-ties is denominated mainly in USD, the related expenses are incurred in both USD and a wide range of other currencies such as CAD, DKK, EUR, HKD, NOK and SGD. As the net income is primarily in USD, this is also the primary financing currency. Income and expenses from other activities are mainly denominated in local currencies, thus reducing the group’s exposure to these currencies. The main purpose of hedging the group’s currency risk is to hedge the USD value of the group’s net cash flow and reduce fluctuations in the group’s profit. The group uses various financial derivatives, including forwards, option contracts and cross-currency swaps, to hedge these risks. The key as-pects of the currency hedging policy are as follows: • Net cash flows in other significant currencies than USD are hedged using a layered model with a
12-month horizon • Significant capital commitments or divestments in other currencies than USD are hedged • Most non-USD debt is hedged, however, depending on the asset-liability match and the cur-
rency of the generated cash flow Cash kept in countries with limited access to repatriating surplus cash is subject to currency risk. An increase in the USD exchange rate of 10% against all other significant currencies to which the group is exposed, is estimated to have a positive impact on the group’s profit before tax by DKK 1.4bn (negative by DKK 0.7bn) and to affect the group’s equity, excluding tax, by DKK 0.0bn (negative by DKK 2.0bn). The sensitivities are based only on the impact of financial instruments that are outstanding at the balance sheet date, cf. notes 18 and 19, and are thus not an expression of the group’s total currency risk. INTEREST RATE RISK The group has most of its debt denominated in USD, but part of the debt (e.g. issued bonds) is in other currencies such as EUR, NOK, GBP and JPY.

A.P. MØLLER HOLDING A/S ANNUAL REPORT 2019 · CONSOLIDATED FINANCIAL STATEMENTS
76
Note 20: Financial risks, etc. - continued
The group strives to maintain a combination of fixed and floating interest rates on its net debt, reflecting expectations and risks. The hedging of the interest rate risk is governed by a duration range and is primarily obtained using interest rate swaps. The duration of the group’s debt portfolio is 2.2 years (2.2 years) excluding IFRS 16 leases. A general increase in interest rates by one percentage point is estimated, all other things being equal, to affect profit before tax and equity, excluding the tax effect, positively by approximately DKK 33m and positively DKK 40m, respectively (negatively by approximately DKK 107m and DKK 120m, respectively). This analysis assumes that all other variables, in particular foreign currency rates, remain constant. Borrowings by interest rate levels inclusive of interest rate swaps Next interest rate fixing
Amounts in DKKm Carrying
amount 0-1 year 1-5 years 5- years
2019 0-3% 13,365 8,965 1,128 3,272 3-6% 108,961 37,954 40,869 30,138 6%- 6,228 708 1,691 3,829 Total 128,554 47,627 43,688 37,239 Of which: Bearing fixed interest 87,951
Bearing floating interest 40,603 2018 0-3% 1,356 1,056 254 46 3-6% 83,782 40,710 29,700 13,372 6%- 7,232 117 2,811 4,304 Total 92,370 41,883 32,765 17,722 Of which: Bearing fixed interest 52,555 Bearing floating interest 39,815
CREDIT RISK Trade receivables The group has exposure to financial and commercial counterparties, but has no particular concen-tration of customers or suppliers. To minimise the credit risk, financial vetting is undertaken for all major customers and financial institutions, adequate security is required for commercial counterpar-ties, and credit limits are set for financial institutions and key commercial counterparties. The group applies the simplified approach to providing the expected credit losses prescribed by IFRS 9, which permits the use of the lifetime expected loss provision for all trade receivables. To measure the expected credit losses, trade receivables have been grouped based on shared credit risk characteristics and the days past due. In accordance with IFRS 9, non-due trade receivables have also been impaired. Approx. 69% (68%) of the provision for bad debt is related to trade receivables overdue by more than one year. Maturity analysis of trade receivables
Amounts in DKKm 2019 2018
Receivables not due 18,671 17,837 Less than 90 days overdue 7,352 8,113 91-365 days overdue 1,133 1,759 More than 1 year overdue 1,030 1,228 Receivables, gross 28,186 28,937 Provision for bad debt - 1,486 - 1,798 Carrying amount as of 31 December 26,700 27,139

A.P. MØLLER HOLDING A/S ANNUAL REPORT 2019 · CONSOLIDATED FINANCIAL STATEMENTS
77
Note 20: Financial risks, etc. - continued
The loss allowance provision for trade receivables as of 31 December 2019 reconciles to the open-ing loss allowance as follows: Change in provision for bad debt
Amounts in DKKm 2019 2018
Provision as of 1 January 1,798 1,720 Provision made 1,469 1,272 Amount used - 1,003 - 763 Amount reversed - 835 - 525 Transfer, assets held for sale 21 19 Exchange rate adjustment 36 75 Provision as of 31 December 1,486 1,798
OTHER FINANCIAL ASSETS AT AMORTISED COST Other financial assets at amortised cost comprise loans receivable, finance lease receivables and other receivables. All of these financial assets are considered to have a low credit risk, and thus the impairment provision calculated basis of 12 months expected losses is considered immaterial. The financial assets are considered to be low risk when they have low risk of default and the issuer has a strong capacity to meet its contractual cash flow obligations in the near term.
LIQUIDITY RISK Capital is managed de-centrally for the group. The equity share of total equity and liabilities was 56.9% as of 31 December 2019 (61.9%). Amounts in DKKm 2019 2018
Borrowings¹ 128,554 92,370 Net interest-bearing debt 90,003 67,494 Liquidity reserve² 84,191 85,823
1 Including IFRS 16, Leases as from 1 January 2019 2 Liquidity reserve is defined as undrawn committed revolving facilities with more than one year to expiry, securi-
ties and cash and bank balances, excluding securities and balances in countries with exchange control or other restrictions
Based on the liquidity reserve, the maturity of outstanding loans and the current investment profile, the group’s financial resources are deemed satisfactory. The average term to maturity of loan facilities in the group was about five years (about four years as of 31 December 2018). It is of great importance for the group to maintain a financial reserve to cover the group’s obliga-tions and investment opportunities and to provide the capital necessary to offset changes in the group’s liquidity due to changes in the cash flow from operating activities. The flexibility of the financial reserve is subject to ongoing prioritisation and optimisation, among other things, by focusing on release of capital and following up on the development in working capital.

A.P. MØLLER HOLDING A/S ANNUAL REPORT 2019 · CONSOLIDATED FINANCIAL STATEMENTS
78
Note 20: Financial risks, etc. - continued
Maturities of liabilities and commitments Cash flows including interest
Amounts in DKKm Carrying
amount 0-1 year 1-5 years 5- years Total
2019 Bank and other credit institutions 38,465 5,986 26,997 10,977 43,960 Finance lease liabilities 57,910 11,764 34,037 35,680 81,481 Issued bonds 32,179 2,864 15,321 19,367 37,552 Trade payables 39,697 39,697 0 0 39,697 Other payables 9,165 8,920 214 80 9,214 Non-derivative financial liabilities 177,416 69,231 76,569 66,104 211,904 Derivatives 3,053 619 887 1,544 3,050 Total recognised in balance sheet 180,469 69,850 77,456 67,648 214,954 Operating lease commitments 1,537 0 0 1,537 Capital commitments 6,197 5,546 4,279 16,022 Total 77,584 83,002 71,927 232,513
2018 Bank and other credit institutions 42,584 9,717 31,098 9,844 50,659 Finance lease liabilities 14,749 3,391 10,197 4,663 18,251 Issued bonds 35,037 4,806 16,336 18,860 40,002 Trade payables 35,154 35,154 0 0 35,154 Other payables 7,053 6,779 215 59 7,053 Non-derivative financial liabilities 134,577 59,847 57,846 33,426 151,119 Derivatives 2,419 841 248 1,330 2,419 Total recognised in balance sheet 136,996 60,688 58,094 34,756 153,538
Operating lease commitments 13,741 30,888 34,660 79,289 Capital commitments 8,266 4,843 5,680 18,789 Total 82,695 93,825 75,096 251,616
Note 21: Commitments
OPERATING LEASE COMMITMENTS As part of the group’s activities, customary agreements are entered into regarding charter and operating leases of ships, containers, port facilities, etc. From 1 January 2019, the group has recog-nised right-of-use assets for these leases, except for short-term and low-value leases, see note 8 for further information. The future charter and operating lease payments are:
Amounts in DKKm A.P. Moller - Maersk¹
Maersk Drilling
Maersk Tankers Total
2019 Within one year 1,449 0 88 1,537 Between one and two years 0 0 0 0 Between two and three years 0 0 0 0 Between three and four years 0 0 0 0 Between four and five years 0 0 0 0 After five years 0 0 0 0 Total 1,449 0 88 1,537 2018 Within one year 13,337 59 345 13,741 Between one and two years 9,899 52 127 10,078 Between two and three years 8,008 46 25 8,079 Between three and four years 6,678 39 0 6,717 Between four and five years 5,974 39 0 6,013 After five years 34,589 72 0 34,661 Total 78,485 307 497 79,289 Net present value² 57,459 269 452 58,180
1 In 2018, about 35% of the time charter payments are estimated to relate to operational costs for the assets. In
2019, the short-term and low-value leases do not include any payment for operational costs 2 The net present value has been calculated using a discount rate of 6% in 2018

A.P. MØLLER HOLDING A/S ANNUAL REPORT 2019 · CONSOLIDATED FINANCIAL STATEMENTS
79
Note 21: Capital commitments - continued
CAPITAL COMMITMENTS The group has the following capital commitments as of 31 December 2019 and 31 December 2018, respectively:
Amounts in DKKm A.P. Moller
- Maersk
Maersk Product Tankers Other Total
2019 Capital commitments relating to acquisition of non-current assets 3,739 2,812 1,580 8,131 Commitments towards concession grantors 7,891 0 0 7,891 Total capital commitments 11,630 2,812 1,580 16,022 2018 Capital commitments relating to acquisition of non-current assets 6,913 2,477 1,256 10,646 Commitments towards concession grantors 8,143 0 0 8,143 Total capital commitments 15,056 2,477 1,256 18,789
The decrease in capital commitments is primarily related to contractual payments during 2019. The capital commitments will be financed by cash flow from operating activities as well as existing and new loan facilities. No.
Newbuilding programme as of 31 December 2019 2020 2021 Total
Tanker vessels 5 4 9 Tugboats 9 1 10 Total 14 5 19
DKKm
Capital commitments relating to the newbuilding programme as of 31 December 2019 2020 2021 Total
Tanker vessels 1,281 1,058 2,339 Tugboats 280 73 353 Total 1,561 1,131 2,692
The capital commitments will be financed by cash flow from operating activities as well as existing and new loan facilities.
Note 22: Contingent liabilities
The necessary facility of DKK 1.6bn (DKK 1.6bn) has been established in order to meet the require-ments for using US waters under the American Oil Pollution Act of 1990 (Certificate of Financial Responsibility). Custom bonds of DKK 3.2bn (DKK 2.9bn) have been provided to various port authorities in India. Guarantees of DKK 1.9bn have been issued by the group to make specific payments if debtors fail to meet their obligations. A.P. Moller - Maersk has entered into certain agreements with terminals and port authorities, etc. containing volume commitments including an extra payment in case minimum volumes are not met. The group is involved in a number of legal disputes. The group is also involved in tax disputes in certain countries. Some of these involve significant amounts and are subject to considerable uncertainty. Tax may crystallise on repatriation of dividends.

A.P. MØLLER HOLDING A/S ANNUAL REPORT 2019 · CONSOLIDATED FINANCIAL STATEMENTS
80
Note 23: Cash flow specifications
Amounts in DKKm 2019 2018
Change in working capital Inventories - 50 - 20 Trade receivables 1,643 - 209 Other receivables and prepayments - 129 583 Trade payables and other payables 2,231 - 1,989 Exchange rate adjustment of working capital - 4 - 364 Total 3,691 - 1,999 Purchase of intangible assets and property, plant and equipment Addition - 68,981 - 23,952 Of which right-of-use assets, etc. 53,282 796 Of which borrowing costs capitalised on assets 170 408 Change in trade payables regarding purchase of assets - 1,921 455 Total - 17,450 - 22,293 Financial investments Addition, joint ventures - 27 0 Disposal, associated companies 0 886 Addition, receivables 76 0 Payments regarding receivables - 196 0 Addition, other equity investments - 40 0 Disposal, other equity investments 16,441 19,119 Total 16,254 20,005
Other non-cash items related primarily to adjustment of provisions for bad debt regarding trade receivables.
Note 24: Acquisition/sale of subsidiaries and activities
ACQUISITIONS DURING 2019 Cash flow used for acquisitions in 2019
Amounts in DKKm KK Wind
Solutions Other Total
Fair value at time of acquisition Intangible assets¹ 1,258 167 1,425 Property, plant and equipment 119 0 119 Right-of-use assets 130 0 130 Financial assets 1 0 1 Current assets² 944 173 1,117 Provisions - 48 0 - 48 Liabilities³ - 1,743 - 133 - 1,876 Net assets acquired 661 207 868 Non-controlling interests 0 0 0 A.P. Møller Holding A/S share 661 207 868 Goodwill 1,108 173 1,281 Purchase price 1,769 380 2,149 Contingent consideration - 8 0 - 8 Cash and bank balances assumed 0 - 93 - 93 Cash flow used for acquisition of subsidiaries and activities 1,761 287 2,048
1 Intangible assets consist mainly of customer relations and order backlog 2 Current assets consist mainly of inventories and trade receivables 3 Liabilities consist mainly of borrowings, lease liabilities, deferred tax and trade payables KK Wind Solutions Holding KK Wind Solutions is a leading global supplier of power electronics solutions to the wind turbine industry. As the wind industry has gained momentum globally, KK Wind Solutions must expand its global footprint and follow its customers’ international expansion. With A.P. Moller Holding’s global mindset, network and expertise, we believe we can be a good partner and an engaged owner to support KK Wind Solutions on this exciting journey. The date of acquisition for accounting purposes is 4 September 2019. Goodwill is made of other intangible assets not separable from the business and expected future results. Goodwill is not deductible for tax purposes. From the acquisition date to 31 December 2019, KK Wind Solutions contributed with a revenue of DKK 672m, while the result was immaterial. If the acquisition had occurred on 1 January 2019, the impact on A.P. Moller Holding group’s revenue would have been DKK 2.3bn, while the result would have increased by DKK 0.1bn. For 2019, the acquisition costs amounted to DKK 33m.

A.P. MØLLER HOLDING A/S ANNUAL REPORT 2019 · CONSOLIDATED FINANCIAL STATEMENTS
81
Note 24: Acquisition/sale of subsidiaries and activities - continued
Other acquisitions during 2019 No other acquisitions of subsidiaries or activities, significant to the group, were completed i 2019. ACQUISITIONS DURING 2018 Hamburg Südamerikanische Dampfschifffahrts-Gesellschaft KG (Hamburg Süd) In Q4 2018, the provisional purchase price allocation regarding Hamburg Süd, prepared at closing 30 November 2017, was finalised, resulting in a reduction of the calculated goodwill by DKK 0.4bn to DKK 2.1bn. The changes were primarily related to working capital balances. SALES DURING 2019 AND 2018 No material sales were performed during 2019 and 2018, respectively.
Note 25: Related parties
Associated companies Joint ventures Management¹
Amounts in DKKm 2019 2018 2019 2018 2019 2018
Income statement Revenue 233 259 760 663 0 0 Operating costs² 3,495 1,806 3,668 5,072 53 57 Remuneration to Executive Board 0 0 0 0 50 20 Financial income 148 150 0 0 0 0 Financial expenses 117 99 0 0 0 0 Other costs 0 0 0 6 0 0 Other income 7 6 0 0 0 0 Assets Other receivables, non-current 0 0 828 1,083 0 0 Other receivables, current 180 287 0 0 0 0 Trade receivables 387 235 267 202 0 0 Cash and bank balances 6,453 3,737 0 72 0 0 Liabilities Guarantees etc. 435 1,461 0 0 0 0 Issued bank guarantees 288 416 0 0 0 0 Credit institutions including loan commitments 5,987 7,549 0 163 0 0 Trade payables 474 222 501 724 7 7 Other payables 388 0 0 0 0 0 Equity Capital increase 0 215 0 69 0 0 Dividends 2,172 2,316 1,041 777 0 0
1 The Board of Directors and the Executive Board in A.P. Møller Holding A/S and their close relatives (including
undertakings under their significant influence). Trade receivables and payables include customary business related accounts in connection with shipping activities
2 Operating costs regarding Management includes commission and commercial receivables to Maersk Broker K/S from chartering as well as purchase and sale of ships
Dividends distributed to A.P. Møller og Hustru Chastine Mc-Kinney Møllers Fond til almene Formaal are not included. A.P. Møller og Hustru Chastine Mc-Kinney Møllers Fond til almene Formaal, Denmark is the parent company and the ultimate owner.

A.P. MØLLER HOLDING A/S ANNUAL REPORT 2019 · CONSOLIDATED FINANCIAL STATEMENTS
82
Note 26: Events after the balance sheet date
The global outbreak of the Coronavirus (COVID-19) is leading to significant uncertainties and lack of visibility related to A.P. Moller Holding Group and our businesses. The COVID-19 is a non-adjusting event after the reporting period. Therefore, amounts recognised in the financial statements shall not be adjusted based on this event. However, due to the material negative impact of the pandemic on financial markets, oil prices, global transport operations, business-critical supply chains, etc., future economic decision to be made on the basis of the financial statements should carefully take all sub-sequent facts and circumstances into consideration. Due to the very difficult situation with signifi-cant uncertainties and lack of visibility at the time of presenting this Financial Statements, manage-ment is not able to make any relevant and reliable estimate of the financial effect of the event and the impact to future reporting periods. Such effect could potential have a material impact.
No other events of importance to the Annual Report have occurred during the period from the balance sheet date until the presentation of the financial statements. Note 27: Significant accounting policies
BASIS OF PREPARATION The consolidated financial statements for 2019 for A.P. Møller Holding A/S have been prepared on a going concern basis and in accordance with the International Financial Reporting Standards (IFRS) as adopted by the EU and additional Danish disclosure requirements for large enterprises in class C. The consolidated financial statements are also in accordance with IFRS as issued by the Interna-tional Accounting Standards Board (IASB). The accounting policies are consistent with those applied in the consolidated financial statements for 2018 except for the changes to the accounting standards that were effective from 1 January 2019 and were endorsed by the EU: • Leases (IFRS 16) • Uncertainty over income tax treatments (IFRIC 23) Furthermore, the company has voluntarily changed its accounting policy for calculating the provi-sion for health and accident insurance contracts, with the risk coverage period no longer than one year. Retrospective application is impracticable without the use of hindsight and due to lack of data. The cumulative impact is recognised as a reduction in shareholders’ equity at 1 January 2019 of DKK 61.2m. The impact on net profit for 2019 is insignificant.
Leases (IFRS 16) Effective 1 January 2019, A.P. Moller Holding applied the new reporting standard on Leases, IFRS 16. All leases are recognised as right-of-use assets with corresponding lease liabilities classified at the date on which the leased asset is available for use by A.P. Moller Holding. Each lease payment is allocated between a reduction of the liability and an interest expense. The interest expense is charged to the income statement over the lease period to produce a constant periodic rate of interest on the remaining balance of the liability for each period. The right-of-use asset is depreciated over the shorter of the asset’s useful life and the lease term on a straight-line basis. A.P. Moller Holding transitioned to IFRS 16 in accordance with the modified retrospective approach, therefore previous period comparative figures are not adjusted in the financial statements. Additionally, the IAS 17 definition of a lease and its related interpretations have been retained. Lease liabilities classified as finance leases at 31 December 2018 were transitioned to IFRS 16 at their carrying amount of DKK 16.6bn. As of 31 December 2018, A.P. Moller Holding had non-cancellable operating lease commitments of DKK 79.3bn. As part of the transition, A.P. Moller Holding applied the following adjustments before discounting lease payments: • Service components included in the pricing of vessel charter fees are not included as part of the
lease liability. These costs are recognised in the income statement as incurred
• Terminal concession agreements to which A.P. Moller Holding is committed, but which will only begin operations during Q1 2019 or later were not capitalised at transition
• A.P. Moller Holding did not apply the new standard to leases with a remaining term of 12 months or less from 1 January 2019. Additionally, leases with a maximum lease term less than 12 months are exempt from provisions of the new standard
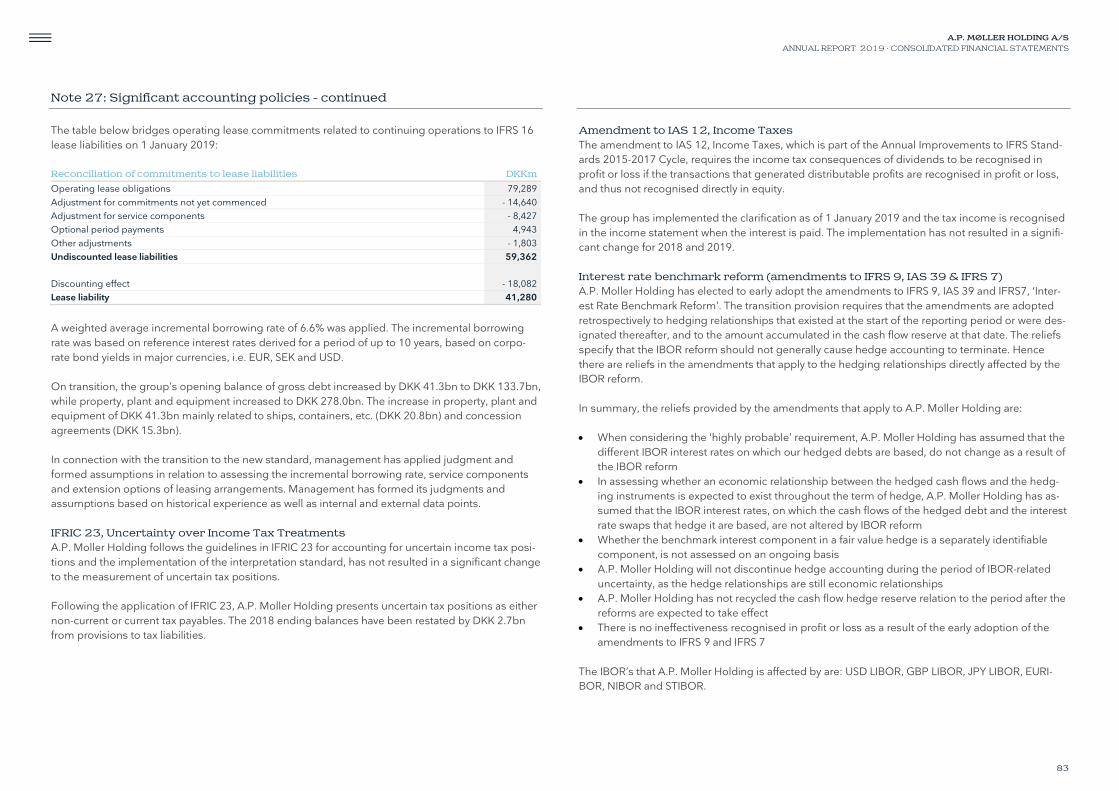
A.P. MØLLER HOLDING A/S ANNUAL REPORT 2019 · CONSOLIDATED FINANCIAL STATEMENTS
83
Note 27: Significant accounting policies - continued
The table below bridges operating lease commitments related to continuing operations to IFRS 16 lease liabilities on 1 January 2019: Reconciliation of commitments to lease liabilities DKKm
Operating lease obligations 79,289 Adjustment for commitments not yet commenced - 14,640 Adjustment for service components - 8,427 Optional period payments 4,943 Other adjustments - 1,803 Undiscounted lease liabilities 59,362 Discounting effect - 18,082 Lease liability 41,280
A weighted average incremental borrowing rate of 6.6% was applied. The incremental borrowing rate was based on reference interest rates derived for a period of up to 10 years, based on corpo-rate bond yields in major currencies, i.e. EUR, SEK and USD. On transition, the group’s opening balance of gross debt increased by DKK 41.3bn to DKK 133.7bn, while property, plant and equipment increased to DKK 278.0bn. The increase in property, plant and equipment of DKK 41.3bn mainly related to ships, containers, etc. (DKK 20.8bn) and concession agreements (DKK 15.3bn). In connection with the transition to the new standard, management has applied judgment and formed assumptions in relation to assessing the incremental borrowing rate, service components and extension options of leasing arrangements. Management has formed its judgments and assumptions based on historical experience as well as internal and external data points. IFRIC 23, Uncertainty over Income Tax Treatments A.P. Moller Holding follows the guidelines in IFRIC 23 for accounting for uncertain income tax posi-tions and the implementation of the interpretation standard, has not resulted in a significant change to the measurement of uncertain tax positions. Following the application of IFRIC 23, A.P. Moller Holding presents uncertain tax positions as either non-current or current tax payables. The 2018 ending balances have been restated by DKK 2.7bn from provisions to tax liabilities.
Amendment to IAS 12, Income Taxes The amendment to IAS 12, Income Taxes, which is part of the Annual Improvements to IFRS Stand-ards 2015-2017 Cycle, requires the income tax consequences of dividends to be recognised in profit or loss if the transactions that generated distributable profits are recognised in profit or loss, and thus not recognised directly in equity. The group has implemented the clarification as of 1 January 2019 and the tax income is recognised in the income statement when the interest is paid. The implementation has not resulted in a signifi-cant change for 2018 and 2019. Interest rate benchmark reform (amendments to IFRS 9, IAS 39 & IFRS 7) A.P. Moller Holding has elected to early adopt the amendments to IFRS 9, IAS 39 and IFRS7, ‘Inter-est Rate Benchmark Reform’. The transition provision requires that the amendments are adopted retrospectively to hedging relationships that existed at the start of the reporting period or were des-ignated thereafter, and to the amount accumulated in the cash flow reserve at that date. The reliefs specify that the IBOR reform should not generally cause hedge accounting to terminate. Hence there are reliefs in the amendments that apply to the hedging relationships directly affected by the IBOR reform. In summary, the reliefs provided by the amendments that apply to A.P. Moller Holding are: • When considering the ‘highly probable’ requirement, A.P. Moller Holding has assumed that the
different IBOR interest rates on which our hedged debts are based, do not change as a result of the IBOR reform
• In assessing whether an economic relationship between the hedged cash flows and the hedg-ing instruments is expected to exist throughout the term of hedge, A.P. Moller Holding has as-sumed that the IBOR interest rates, on which the cash flows of the hedged debt and the interest rate swaps that hedge it are based, are not altered by IBOR reform
• Whether the benchmark interest component in a fair value hedge is a separately identifiable component, is not assessed on an ongoing basis
• A.P. Moller Holding will not discontinue hedge accounting during the period of IBOR-related uncertainty, as the hedge relationships are still economic relationships
• A.P. Moller Holding has not recycled the cash flow hedge reserve relation to the period after the reforms are expected to take effect
• There is no ineffectiveness recognised in profit or loss as a result of the early adoption of the amendments to IFRS 9 and IFRS 7
The IBOR’s that A.P. Moller Holding is affected by are: USD LIBOR, GBP LIBOR, JPY LIBOR, EURI-BOR, NIBOR and STIBOR.

A.P. MØLLER HOLDING A/S ANNUAL REPORT 2019 · CONSOLIDATED FINANCIAL STATEMENTS
84
Note 27: Significant accounting policies - continued
CONSOLIDATION The consolidated financial statements comprise the parent company A.P. Møller Holding A/S, its subsidiaries and proportionate shares in joint arrangements classified as joint operations. Subsidiaries are entities controlled by A.P. Møller Holding A/S. Control is based on the power to direct the relevant activities of an entity and the exposure, or right, to variable returns arising from it. In that connection, relevant activities are those that significantly affect the investee’s returns. Control is usually achieved by directly or indirectly owning or in other ways controlling more than 50% of the voting rights, or by other rights, such as agreements on management control. Joint arrangements are entities in which A.P. Moller Holding, according to contractual agreements with one or more other parties, has joint control. The arrangements are classified as joint ventures, if the contracting parties’ rights are limited to net assets in separate legal entities, and as joint opera-tions, if the parties have direct and unlimited rights to the assets and obligations for the liabilities of the arrangement. Entities in which A.P. Moller Holding exercises a significant but non-controlling influence are con-sidered associated companies. A significant influence is usually achieved by directly or indirectly owning or controlling 20-50% of the voting rights. Agreements and other circumstances are consid-ered when assessing the degree of influence. Consolidation is performed by summarising the financial statements of the parent company and its subsidiaries, including the proportionate share of joint operations, part-owned vessels and pool ar-rangements, which have been prepared in accordance with A.P. Moller Holding’s accounting poli-cies. Intra-group income and expenses, shareholdings, dividends, intra-group balances and gains on intra-group transactions are eliminated. Unrealised gains on transactions with associated com-panies and joint arrangements are eliminated in proportion to A.P. Moller Holding’s ownership share. Unrealised losses are eliminated in the same way, unless they indicate impairment. Non-controlling interests’ share of profit/loss for the year and of equity in subsidiaries is included as part of A.P. Moller Holding’s profit and equity respectively but shown as separate items.
FOREIGN CURRENCY TRANSLATION The consolidated financial statements are presented in DKK. The functional currency of the parent company is USD. In the translation to the presentation currency for the parent, subsidiaries, associ-ates or joint arrangements with functional currencies other than DKK, the total comprehensive income is translated into DKK at average exchange rates and the balance sheet is translated at the exchange rates as per the balance sheet date. Exchange rate differences arising from such transla-tions are recognised directly in other comprehensive income and in a separate reserve of equity (translation to the functional currency). The functional currency varies from business area to business area. For A.P. Møller Holding A/S and its subsidiaries’ principal shipping and drilling activities, the functional currency is typically USD. This means, among other things, that the carrying amounts of property, plant and equipment and intangible assets and, hence, depreciation and amortisation are maintained in USD from the date of acquisition. For other activities, including container terminal activities and land-based container ac-tivities, the functional currency is generally the local currency of the country in which such activities are performed, unless circumstances suggest a different currency is appropriate. Transactions in currencies other than the functional currency are translated at the exchange rate prevailing at the date of the transaction. Monetary items in foreign currencies not settled by the balance sheet date are translated at the exchange rate as per the balance sheet date. Foreign exchange gains and losses are included in the income statement as financial income or financial expenses. INCOME STATEMENT Revenue Revenue for all businesses is recognised when the performance obligation has been satisfied, which happens upon the transfer of control to the customer at an amount that reflects the consider-ation to which the group expects to be entitled in exchange for the goods and services. Revenue from shipping activities is recognised over time as the performance obligation is satisfied, including a share of revenue from incomplete voyages at the balance sheet date. Invoiced revenue related to an estimated proportion of remaining voyage time and activities at the destination port is deferred. Detention and demurrage fees are recognised over time up until the time of customers’ late return or pick-up of containers. Retrospective volume rebates provided to certain customers which give rise to variable considerations, are based on the expected value method and allocated to ocean freight revenue.

A.P. MØLLER HOLDING A/S ANNUAL REPORT 2019 · CONSOLIDATED FINANCIAL STATEMENTS
85
Note 27: Significant accounting policies - continued
Revenue from terminal operations and towing activities is recognised upon completion of the ser-vice. In container terminals operated under certain restrictive terms of pricing and service etc., the value of tangible assets constructed on behalf of the concession grantor is recognised as revenue during the construction. Revenue from drilling activities typically comprises fixed amounts for each day the rig is under con-tract differentiated by the activities undertaken (‘day rate revenue’) and other revenue components such as lump sum payments for rig mobilisation and demobilisation and payments for investments in equipment or rig upgrades required to meet the operational needs of the drilling campaign, both of which are amortised over the contract period; bonuses linked to performance in terms of time, efficiency or drilling outcome measures such as reservoir targeting; or payments for third-party ser-vices to be delivered to the customer. Revenue from most freight forwarding activities is recognised over time. Revenue from the sale of goods is recognised upon the transfer of control to the buyer. Operating costs Operating costs comprise costs incurred in generating revenue for the year, including costs for crew, repair and maintenance, and administrative costs. Share of profit/loss in associated companies and joint ventures Share of profit/loss in associated companies and joint ventures is recognised net of tax and cor-rected for the share of unrealised intra-group gains and losses. The item also comprises any impair-ment losses for such investments and their reversal. Financial income and financial expenses Financial income and financial expenses comprise interest income and expenses, including the in-terest element of lease payments related to leases capitalised under IFRS 16, foreign exchange gains and losses, realised and unrealised gains and losses on financial instruments and bank fees and transaction costs related to borrowings. Financial income and financial expenses are recognised in the income statement on an accrual basis.
Tax Tax comprises an estimate of current and deferred income tax as well as adjustments to previous years of those. Income tax is tax on taxable profits and consists of corporation tax, withholding tax of dividends, etc. In addition, tax comprises tonnage tax. Tonnage tax is classified as tax when cred-itable in, or paid in lieu of, income tax. Tax is recognised in the income statement to the extent it arises from items recognised in the income statement, including tax of gains on intra-group transactions that have been eliminated in the consolidation. STATEMENT OF COMPREHENSIVE INCOME Other comprehensive income consists of income and costs not recognised in the income state-ment, including exchange rate adjustments arising from the translation from functional currency to presentation currency, fair value adjustments of other equity investments (at FVOCI), cash flow hedges, forward points and currency basis spread as well as actuarial gains/losses on defined ben-efit plans, etc. The group’s share of other comprehensive income in associated companies and joint ventures is also included. On disposal or discontinuation of an entity, the group’s share of the accumulated exchange rate ad-justment relating to the relevant entity compared to the functional currency is reclassified to the in-come statement. Accumulated value adjustments of equity instruments classified as equity instru-ments at fair value through other comprehensive income will remain in equity upon disposal. Other comprehensive income includes current and deferred income tax to the extent the items rec-ognised in other comprehensive income are taxable or deductible.

A.P. MØLLER HOLDING A/S ANNUAL REPORT 2019 · CONSOLIDATED FINANCIAL STATEMENTS
86
Note 27: Significant accounting policies - continued
BALANCE SHEET Intangible assets Intangible assets are measured at cost less accumulated amortisation and impairment losses. Amortisation is calculated on a straight-line basis over the estimated useful lives of the assets. Intan-gible assets regarding acquired customer relationships and brand names are amortised over a use-ful life of up to 15 and 20 years, respectively. IT software is amortised over a useful life of 3-5 years. For container terminals operated under certain restrictive price and service conditions, etc., conces-sional rights to collect usage charges are included under intangible assets. The cost includes the present value of minimum payments under concession agreements and the cost of property, plant and equipment constructed on behalf of a grantor of a concession. The rights are amortised from the commencement of operations over the concession period. Property, plant and equipment Property, plant and equipment are valued at cost less accumulated depreciation and impairment losses. Depreciation is charged to the income statement on a straight-line basis over the useful lives at an estimated residual value. The useful lives of assets are typically as follows: Ships, etc. 20-25 years Containers, etc. 12 years Buildings 10-75 years Terminal infrastructure 10-20 years or concession period, if shorter Plant and machinery, cranes and other terminal equipment 5-20 years Rigs and drilling equipment 5-25 years (residual value 0-30%) Other operating equipment, fixtures, etc. 3-10 years
Estimated useful lives and residual values are reassessed on a regular basis. The cost of an asset is divided into separate components, which are depreciated separately if the useful lives of the individual components differ. Dry-docking costs are recognised in the carrying amount of ships when incurred and depreciated over the period until the next dry-docking. The cost of assets constructed by the group includes directly attributable expenses. For assets with a long construction period, borrowing costs during the construction period from specific as well as general borrowings are attributed to cost. In addition, the cost includes the net present value of esti-mated costs of removal and restoration.
Right-of-use assets The group mainly leases vessels, containers, concession agreements, and real estate property. Lease contracts for vessels and containers are typically made for fixed periods of about five years but may have extension options as described below. Concession arrangements and real estate con-tracts are negotiated on an individual basis and contain a wide range of terms and conditions. Leases are recognised as a right-of-use asset with a corresponding liability at the date at which the leased asset is available for use by the group. The right-of-use asset is depreciated over the shorter of the asset’s useful life and the lease term on a straight-line basis. Impairment of intangible assets and property, plant and equipment Impairment losses are recognised when the carrying amount of an asset or a cash generating unit exceeds the higher of the estimated value in use and fair value less costs of disposal. Goodwill is attributed to cash generating units on acquisition and impaired before other assets. Intangible assets and property, plant and equipment are tested for impairment, if there is an indica-tion of impairment. However, annual impairment tests are carried out for goodwill and other intangi-ble assets with indefinite useful lives as well as intangible assets that are not yet in use. Assets held for sale Assets are held for sale, when the carrying amount of an individual non-current asset, or disposal groups, will be recovered principally through a sale transaction rather than through continuing use. Assets are classified as held for sale, when activities to carry out a sale have been initiated, the activ-ities are available for immediate sale in their present condition and when the activities are expected to be disposed of within 12 months. Liabilities directly associated with assets held for sale are pre-sented separately from other liabilities. Assets held for sale are measured at the lower of carrying amount immediately before classification as held for sale and fair value less costs to sell, and impairment tests are performed immediately before classification as held for sale. Non-current assets are not depreciated or amortised while classified as held for sale. Measurement of deferred tax and financial assets and liabilities is un-changed.

A.P. MØLLER HOLDING A/S ANNUAL REPORT 2019 · CONSOLIDATED FINANCIAL STATEMENTS
87
Note 27: Significant accounting policies - continued
Investment in associated companies and joint ventures Investments in associated companies and joint ventures are recognised at the group’s share of the equity value inclusive of goodwill less any impairment losses. Goodwill is an integral part of the value of associated companies and joint ventures and is therefore subject to an impairment test together with the investment as a whole. Impairment losses are reversed to the extent the original value is considered recoverable. Other financial investments Equity instruments, etc., including shares, bonds and similar securities, are recognised on the trading date at fair value, and subsequently measured at the quoted market price for listed securi-ties and at estimated fair value for non-listed securities. Fair value adjustments from equity invest-ments are classified in the following measurement categories: • Through other comprehensive income, or • Through the income statement Fair value adjustments from equity investments at fair value through other comprehensive income (FVOCI) remain in equity upon disposal. Dividends are recognised in the income statement. Inventories Inventories mainly consist of bunker, containers (manufacturing), spare parts not qualifying as prop-erty, plant and equipment and other consumables. Inventories are measured at cost, primarily according to the FIFO method. The cost of finished goods and work in progress includes direct and indirect production costs. Loans and receivables Loans and receivables are initially recognised at fair value, plus any direct transaction costs and sub-sequently measured at amortised cost using the effective interest method. For loans and other receivables, write-down is made for anticipated losses based on specific individual or group assess-ments. For trade receivables, the loss allowance is measured in accordance with IFRS 9, applying a provision matrix to calculate the minimum impairment. The provision matrix includes an impair-ment for non-due receivables.
Equity Equity includes total comprehensive income for the year comprising the profit/loss for the year and other comprehensive income. Proceeds on the purchase and sale of own shares and dividends from such shares are recognised in equity. The translation reserve comprises A.P. Møller Holding A/S’ share of accumulated exchange rate differences arising on translation to the functional currency. Differences arising from translation to the presentation currency are recognised in other comprehensive income and will not be reclassified to the income statement. The reserve for other equity investments comprises accumulated changes in the fair value of equity investments (at FVOCI), net of tax. Reserve for hedges includes the accumulated fair value of derivatives qualifying for cash flow hedge accounting, net of tax as well as forward points and currency basis spread. Share-based payments Equity settled performance shares, restricted shares and share options allocated to employees as part of the group’s long-term incentive programmes are recognised as staff costs over the vesting period at estimated fair value at the grant date and a corresponding adjustment in equity. Cash settled performance awards allocated to employees as part of the group’s long-term incentive programmes are recognised as staff costs over the vesting period and a corresponding adjustment in other payables. At the end of each reporting period, the group revises its estimates of the number of awards that are expected to vest based on the non-market vesting conditions and service conditions. Any impact of the revision is recognised in the income statement with a corresponding adjustment to equity or other payables. Provisions Provisions are recognised when the group has a present legal or constructive obligation from past events. The item includes, among others, legal disputes, provision for onerous contracts, unfavour-able contracts acquired as part of a business combination as well as provisions for incurred, but not yet reported, incidents under certain insurance programmes, primarily in the US. Provisions are recognised based on best estimates and are discounted where the time element is significant and where the time of settlement is reasonably determinable.

A.P. MØLLER HOLDING A/S ANNUAL REPORT 2019 · CONSOLIDATED FINANCIAL STATEMENTS
88
Note 27: Significant accounting policies - continued
Defined benefit plans Pension obligations are the net liabilities of defined benefit obligations and the dedicated assets adjusted for the effect of minimum funding and asset ceiling requirements. Plans with a funding surplus are presented as net assets on the balance sheet. The defined benefit obligations are meas-ured at the present value of expected future payments to be made, in respect of services provided by employees, up to the balance sheet date. Plan assets are measured at fair value. The pension cost charged to the income statement consists of calculated amounts for vested benefits and inter-est in addition to settlement gains or losses, etc. Interest on plan assets is calculated with the same rates as used for discounting the obligations. Actuarial gains/losses are recognised in other com-prehensive income. Pension plans where the group, as part of collective bargaining agreements, participates together with other enterprises – so called multi-employer plans – are treated as other pension plans in the financial statements. For defined benefit multi-employer plans where sufficient information to apply defined benefit accounting is not available, the plans are treated as defined contribution plans. Deferred tax Deferred tax is calculated on temporary differences between the carrying amounts and tax bases of assets and liabilities. Deferred tax is not recognised for differences on the initial recognition of assets or liabilities where at the time of the transaction neither accounting nor taxable profit/loss is affected, unless the differences arise in a business combination. In addition, no deferred tax is rec-ognised for undistributed earnings in subsidiaries, when A.P. Moller Holding controls the timing of dividends, and no taxable dividends are currently expected. A deferred tax asset is recognised to the extent that it is probable that it can be utilised within a foreseeable future. Financial liabilities Financial liabilities are initially recognised at fair value less transaction costs. Subsequently, the financial liabilities are measured at amortised cost using the effective interest method, whereby transaction costs and any premium or discount, are recognised as financial expenses, over the term of the liabilities. Fixed interest loans, subject to fair value hedge accounting, are measured at amor-tised cost, with an adjustment for the fair value of the hedged interest component. Liabilities in respect of finance leases are measured at the interest rate implicit in the lease, if practicable to determine, or else at the group’s incremental borrowing rate.
Lease liabilities Lease liabilities are initially measured at the present value of the lease payments, discounted by us-ing the incremental borrowing rate. The following the lease payments are included in the net present value: • Fixed payments (including in-substance fixed payments), less any lease incentives receivable • Variable lease payments which are based on an index or a rate • Amounts expected to be payable by the lessee under residual value guarantees • The exercise price of a purchase option if the lessee is reasonably certain to exercise that op-
tion, and payments of penalties for terminating the lease, if the lease term reflects the lessee exercising that option
Payments associated with short-term leases and leases of low-value assets are recognised on a straight-line basis as an expense in profit or loss. If extension and termination options in lease contracts are included, A.P. Moller Holding will proba-bly exercise those options. These terms are used to maximise operational flexibility in terms of managing contracts. In determining the lease term, management considers all facts and circum-stances that create an economic incentive to exercise an extension option, or not exercise a termi-nation option. Extension options (or periods after termination options) are only included in the lease term if the lease is reasonably certain to be extended (or not terminated). Most of the extension and termination options held, are exercisable only by A.P. Moller Holding and not by the respective les-sor. The assessment is reviewed if a significant event or a significant change in circumstances occurs, which affects this assessment and is within the control of the lessee. Where A.P. Moller Holding will probably exercise specific purchase options, those options are included in the measurement of the lease liability with the corresponding right-of-use asset depreciated over the asset’s useful life rather than lease term. Lease payments are discounted at the implicit interest rate, to the extent this can be determined, otherwise discounted using incremental borrowing rates (IBRs). The applied IBR reflects the group’s credit risk, leased amount and contract duration; nature and quality of the asset’s security and eco-nomic environment, in which the leased assets operate. To determine the IBR, where possible, A.P. Moller Holding uses recent third-party financing conditions since the financing was received. Where such financing is not available, A.P. Moller Holding uses a build-up approach that starts with a risk-free interest rate adjusted by credit risk and specific risks faced by the lessee such as asset type, geographical risks, etc.

A.P. MØLLER HOLDING A/S ANNUAL REPORT 2019 · CONSOLIDATED FINANCIAL STATEMENTS
89
Note 27: Significant accounting policies - continued
Subsequently, lease liability is measured at amortised cost, with each lease payment allocated be-tween the repayment of the liability and financing cost. The finance cost is charged to the income statement over the lease period using the IBR that was used to discount the lease payments. OTHER AREAS Derivative financial instruments Derivative financial instruments are recognised on the trading date and measured at fair value using generally acknowledged valuation techniques based on relevant observable swap curves and exchange rates. The effective portion of changes in the value of derivative financial instruments designated to hedge highly probable future transactions is recognised in other comprehensive income until the hedged transactions are realised. At that time, the accumulated gains/losses are transferred to the items under which the hedged transactions are recognised. The effective portion of changes in the value of derivative financial instruments used to hedge the value of recognised financial assets and liabili-ties is recognised in the income statement together with changes in the fair value of the hedged assets or liabilities that can be attributed to the hedging relationship. Currency basis spread, and forward points are considered a cost of hedge and deferred in equity. The ineffective portion of hedge transactions and changes in the fair values of derivative financial instruments, which do not qualify for hedge accounting, are recognised in the income statement as financial income or expenses for interest and currency-based instruments, and as other income/costs for oil price hedges and forward freight agreements. Cash flow statement Cash flow from operating activities includes all cash transactions other than cash flows arising from investments and divestments, received dividends, principal payments of loans, instalments on finance lease liabilities, paid and received financial items and equity transactions. Capitalisation of borrowing costs is considered non-cash items, and the actual payments of these borrowing costs are included in cash flow from financing. Cash and cash equivalents comprise cash and bank balances net of bank overdrafts where over-draft facilities form an integral part of the group’s cash management.
Business combinations and disposal of subsidiaries Upon acquisition of new entities, the acquired assets, liabilities and contingent liabilities are measured at fair value at the date when control was achieved using the acquisition method. Identifi-able intangible assets are recognised if they arise from a contractual right or can otherwise be sepa-rately identified. The difference between the fair value of the acquisition cost and the fair value of the acquired identifiable net assets is recognised as goodwill. Contingent consideration is measured at fair value and any subsequent changes to contingent consideration are recognised as other income or other costs in the income statement. Transaction costs are recognised as operating costs as they are incurred. When the group ceases to have control of a subsidiary, the value of any retained investment is re-measured at fair value and the value adjustment is recognised in the income statement as gain (or loss) on the sale of non-current assets. The difference between sales proceeds and the carrying amount of the subsidiary is recognised in the income statement, including fair value of the contin-gent consideration at the time of sale. Contingent consideration is re-measured at fair value with changes recognised in the income statement. The effect of the purchase and sale of non-controlling interests without changes in control is in-cluded directly in equity. Discontinued operations and assets held for sale Discontinued operations represent a separate major line of business disposed of or in preparation for sale. The results of discontinued operations are presented separately in the income statement, and the cash flows from discontinued operations are presented separately in the cash flow state-ment with restatement of comparative figures. Assets held for sale and associated liabilities from discontinued operations are presented as sepa-rate items in the balance sheet with no restatement of comparative figures. Elimination between continuing and discontinued operations are presented to reflect continuing operations as post-sep-aration, which entails elimination of interest, borrowing, dividends and capital increases.

A.P. MØLLER HOLDING A/S ANNUAL REPORT 2019 · CONSOLIDATED FINANCIAL STATEMENTS
90
Note 27: Significant accounting policies - continued
Assets and liabilities from discontinued operations and assets held for sale except financial assets, etc., are measured at the lower of carrying amount immediately before classification as held for sale and fair value less cost to sell, and impairment tests are performed immediately before classifica-tion as held for sale. Non-current assets held for sale are not depreciated. In addition to the above general accounting policies, the following are significant in regard to dis- continued operations. Oil and gas revenue is recognised as revenue upon discharge from the production site, reflecting the production entitlement quantities. In agreements where tax is settled in oil, an amount corre-sponding to the sales value is recognised as both revenue and tax. Income tax consists of oil tax based on gross measures. Oil tax on gross measures is a special tax in certain countries on the production of hydrocarbons and is separately disclosed within tax. Intangible assets regarding acquired oil resources (concession rights, etc.) are amortised over a useful life of production until the fields’ expected production periods end – a period of up to 20 years until classification as assets held for sale. In property, plant and equipment, oil production facilities, where oil is received as payment for the investment (cost oil), depreciation generally takes place concurrently with the receipt of cost oil until the classification as assets held for sale. The cost includes the net present value of the estimated costs of abandonment. The useful lives of assets are up to 20 years for oil and gas production facilities, etc. and based on the expected production periods of the fields. Provisions include provisions for abandonment of oil fields.
NEW FINANCIAL REPORTING REQUIREMENTS IN 2020 OR LATER A.P. Moller Holding has not yet adopted the following standards/requirements: • Amendments to IAS 1 and IAS 8: Definition of Material • Amendments to IFRS 3 – Business Combinations: Definition of a Business • IFRS 17 – Insurance contracts Amendments to IAS 1 and IAS 8 are effective from 1 January 2020 and are endorsed by the EU. Amendments to IFRS 3 are also effective from 1 January 2020 and are expected to be endorsed by the EU. IFRS 17 is effective from 1 January 2021, but there is some uncertainty as to its EU endorse-ment date. A.P. Moller Holding follows most of the guidelines in the Amendments to IAS 1 and IAS 8, therefore the implementation is not expected to result in a significant change to the presentation of the finan-cial statements. In respect to IFRS 17, an analysis of the impact is being assessed and is expected to be concluded in due course, ahead of the implementation date. The IASB has also issued amendments to IFRS 9, IAS 39 and IFRS 7 that are effective from 1 January 2020 and are endorsed by the EU. In December 2019, A.P. Moller Holding has elected to early adopt those amendments. DEFINITIONS OF FINANCIAL RATIOS Return on equity after tax is calculated as profit for the year after tax in proportion to average equity for the year. Equity interest is calculated as equity end of year in proportion to balance sheet total end of year.
A.P. MØLLER HOLDING A/S ANNUAL REPORT 2019 · CONSOLIDATED FINANCIAL STATEMENTS
91
Note 28: Significant accounting estimates and judgments
The preparation of the consolidated financial statements requires management, on an ongoing basis, to make judgments and estimates and form assumptions that affect the reported amounts. Management forms its judgments and estimates based on historical experience, independent advi-sors and external data points, as well as in-house specialists and on other factors believed to be rea-sonable under the circumstances. In certain areas, the outcome of business plans, including ongoing negotiations with external par-ties to execute those plans or to settle claims that are raised against the group, is highly uncertain. Therefore, assumptions may change, or the outcome may differ in the coming years, which could require a material upward or downward adjustment to the carrying amounts of assets and liabilities. This note includes the areas in which A.P. Moller Holding is particularly exposed to a material ad-justment of the carrying amounts as at the end of 2019. GENERAL Aspects of uncertainty In its assumption setting, management deals with different aspects of uncertainty. One aspect of uncertainty is whether an asset or liability exists where the assessment forms the basis for recogni-tion or derecognition decisions, including assessment of control. Another aspect is the measure-ment uncertainty, where management makes assumptions about the value of the assets and liabili-ties that are deemed to exist. These assumptions concern the timing and amount of future cash flows and the risks inherent in these. Container freight rates The future development in the container freight rates is an uncertain and significant factor impact-ing especially A.P. Moller - Maersk’s activities, whose financial results are directly affected by the fluctuation in container freight rates. Freight rates are influenced by the global economic environ-ment and trade patterns, as well as industry specific trends in respect of supply and demand. In ad-dition, the new global low sulphur bunker regulation (IMO 2020), which came into effect in January 2020, is expected to increase the cost of compliant fuels significantly. Alternatively, in-stalling scrubbers on vessels enables the use of lower cost fuels, but requires capital expenditure. There is significant uncertainty that the increased cost, regarding implementation and compliance with the IMO 2020 requirements, cannot be recovered from customers through freight rates.
Oil and bunker prices The future development in oil price is an uncertain and significant factor impacting accounting esti-mates across the group either directly or indirectly. The group is directly impacted by the price of bunker oil, where the competitive landscape determines the extent to which the development is re-flected in the freight rates charged to the customer. A.P. Moller - Maersk is indirectly impacted by the oil price as terminals located in oil producing countries, e.g. Nigeria, Angola, Egypt, Russia, and Brazil, are indirectly impacted by the develop-ment in oil prices and the consequences on the countries’ economies, which not only affect volume handled in the terminals, but also exchange rates. Maersk Drilling is impacted by the demand for rigs as the oil and gas companies may cancel or de-fer projects and exert pressure for lower rates, more contract flexibility and low cost solutions when oil prices are low. Hence, the future long-term development in the oil price is indirectly impacting accounting estimates for Maersk Drilling through the demand for drilling rigs. This in turn impacts expectations towards future utilisation and day rates which could be impairment indicators and im-pact value in use estimates if impairment testing is done. BUSINESS COMBINATIONS Fair value measurement When applying the acquisition method of accounting, fair value assessments are made for identifia-ble assets acquired and liabilities assumed. Determining fair values at the date of acquisition, by nature, entails management to apply estimates. Significant estimates are particularly applied in the valuation of customer relationships and real estate. The inherent uncertainties in the fair value esti-mates may result in measurement adjustments in the 12 months following the closing of the trans-action. Goodwill has been assessed as recoverable at 31 December 2019. Acquired material net assets for which significant accounting estimates have been applied are rec-ognised using the following valuation techniques:

A.P. MØLLER HOLDING A/S ANNUAL REPORT 2019 · CONSOLIDATED FINANCIAL STATEMENTS
92
Note 28: Significant accounting estimates and judgments - continued
Intangible assets Customer relationships have been measured using the excess earnings method (MEEM), in which the present value of future cash flows from recurring customers expected to be retained after the date of acquisition is valued. The main input value drivers are estimated future retention rates and net cash flows of the acquired customer base. These have been estimated based on management’s analysis of the acquired customer base, historical data and general business insights. The useful life of customer relationships is estimated at 8-13 years. The valuation of intangible assets reflects market participants’ view applying a discount rate of 13.3%. Property, plant and equipment Fair value of real estate is measured using the market comparison method based on internally pre-pared valuations compared with external valuations. INTANGIBLE ASSETS AND PROPERTY, PLANT AND EQUIPMENT The group carries goodwill of DKK 5,360m (DKK 4,207m) and intangible assets with indefinite lives of DKK 207m (DKK 222m). The majority of other non-current assets are amortised over their useful economic lives. Management assesses impairment indicators across this asset base. Judgment is applied in the definition of cash generating units and in the selection of methodologies and assumptions for impairment tests. The determination of cash generating units differs for the various businesses. Ocean operates its fleet of container vessels, container and hub terminals in an integrated network, for which reason the Ocean activities are tested for impairment as a single cash generating unit. In addition, the inter-modal activities are included in Ocean’s cash generating unit for impairment testing to apply con-sistency between the asset base and related cash flows. In Logistics & Services, apart from Inter-modal, each entity is defined as a cash generating unit. In gateway terminals, each terminal is considered individually in impairment tests, except when the capacity is managed as a portfolio, which is the case for certain terminals in Northern Europe and Global Ports Investments, Russia. Towage groups vessels according to type, size, etc. in accordance with the structure governing management’s ongoing follow-up. Maersk Drilling considers rigs with similar functionality and operating environment as cash generat-ing units due to largely interdependent cash flows. Maersk Product Tankers considers vessels with similar functionality (LR2, MR, Intermediate and Handy) and operating environment as cash generating units.
KK Wind Solutions is considered as one cash generating unit. Projected cash flow models are used when fair value is not obtainable or when fair value is deemed lower than value in use. External data is used to the extent possible and centralised processes, involving corporate functions, ensure that indexes or data sources are selected consistently while observing differences in risks and other circumstances. Current market values for vessels, rigs etc. are estimated using acknowledged brokers. The fair value estimates, using the market approach, are highly uncertain due to the character of the assets and few transactions. The value in use calculations for the individual cash generating units carried out in 2018 are sensitive to the assumptions applied and to the risks of idle periods in the forecasts. In addition, the discount rate, growth rate and EBITDA margin after the budget period are critical variables. Refer to notes 6 and 7 for information about impairment losses, recoverable amounts and discount rates. Impairment considerations A.P. Møller - Mærsk A/S In Ocean, although average bunker costs were reduced by 2.9%, the impact of IMO 2020 on bunker supply and the uncertainty around cost recovery, in addition to the weakness in the broader macro-economic backdrop, are impairment indicators. Trade protectionism has reduced the global con-tainer outlook and recession risks have increased. In addition, the estimated fair value of the fleet continues to be lower than the carrying amount. Consequently, an estimate of the recoverable amount has been prepared by a value in use calculation. The cash flow projection is based on fore-casts as per Q3 2019 covering plans for 2020-2024. The key sensitivities are: development in freight rates, container volumes, bunker costs, effect of cost savings as well as the discount rate. Manage-ment has applied an assumption of growth in volumes and continued pressure on, but increasing freight rates, and continued cost efficiency. The impairment test continues to show headroom from value in use to the carrying amount. Management is of the opinion that the assumptions applied are sustainable.

A.P. MØLLER HOLDING A/S ANNUAL REPORT 2019 · CONSOLIDATED FINANCIAL STATEMENTS
93
Note 28: Significant accounting estimates and judgments - continued
In Terminals & Towage, management assesses impairment triggers, and based on these estimates, recoverable amounts on the individual terminals. For Terminals’ interest in Global Port Investments, being the share of equity and significant intangible assets acquired, management assesses the re-coverable amount of its interest on an ongoing basis. Uncertain variables in the estimate are the economic outlook in Russia, local competition, effect on volume, operating expenses and discount rate. The carrying amount of the investment may not be sustainable in the next few years, if markets develop significantly adversely compared to current expectations. Estimates of recoverable amounts were also prepared for other terminals where decreasing volumes triggered impairment tests. Key sensitivities are: expected volumes, local port rates, concession right extensions as well as discount rates. The impairment tests showed headroom from value in use calculations compared to carrying amount. Therefore, no impairment was recognised in 2019 compared to DKK 126m in 2018 related to terminals in markets with challenging commercial conditions. Continued economic deterioration and lack of cash repatriation opportunities in certain oil producing countries can po-tentially put further pressure on carrying amounts on terminals in these countries. Maersk Container Industry decided to consolidate the manufacture of reefer containers at the facility in Qingdao, China, and exit the dry container business completely. Consequently, operation ceased at the facility in San Antonio, Chile, and Dongguan, China. The closure of the facilities triggered a write-down of assets of DKK 417m in 2018. The recoverable amounts for both closed factories are measured at fair value categorised as level 3 in the fair value hierarchy, as measurements are not based on observable market data and relate mainly to land and buildings which by nature are un-certain. In 2019, a DKK 347m reversal of the write-down was recognised. Maersk Drilling Oil and gas operators continued to optimise their business models and structurally reduce offshore project costs through project optimisation, standardisation, digitisation, simplification, and service deflation. As a result of the structural approach to reducing offshore project costs, offshore project economics have improved significantly both in absolute terms as well as relative to other sources, including unconventional sources (shale oil). Consequently, offshore rig utilisation levels have been positively impacted by these demand- and supply-side factors. In line with management expectations, operator demand for offshore drilling rigs continued to rise during 2019, with demand for jack-up rigs growing slightly higher than the demand for floaters. Drilling contractors also continued to reduce offshore drilling rig supply. Leading indicators contin-ued to provide support for future drilling activities, as increased tendering activity translated into more awarded contracts throughout the year. Contracting activity also exhibited an element of di-rect award, where operators, either through alliances or directly with selected drilling contractors, bypassed the tendering process.
In line with analysts who cover the market, management continues to expect a gradual move to-wards more economically sustainable rates in the long-term. No indicators of additional impairment or reversal of impairment have been identified as of 31 December 2019, as the development in the offshore drilling market, with increased activity and improved long-term projections, is considered to be in line with the expectations underlying the impairment test conducted in 2018. Amortisation, depreciation and residual values Useful lives are estimated based on experience. Management decides from time to time to revise the estimates for individual assets or groups of assets with similar characteristics due to factors such as quality of maintenance and repair, technical development and environmental requirements. Refer to note 27 for the useful lives typically used for new assets. Residual values are difficult to estimate given the long lives of vessels and rigs, the uncertainty as to future economic conditions and the future price of steel, which is considered as the main determi-nant of the residual price. Generally, the residual values of vessels are initially estimated at 10% of the purchase price excluding dry-docking costs. The long-term view is prioritised to disregard, to the extent possible, temporary market fluctuations which may be significant. INVESTMENTS IN ASSOCIATED COMPANIES As of 31 December 2019, the carrying amount of the shares in Danske Bank amounted to DKK 34.2bn (DKK 32.6bn), including group goodwill of DKK 1.0bn and the market value amounted to DKK 19.8bn (DKK 23.6bn). An impairment test has been prepared and supports that there is no impairment as of 31 December 2019. Danske Bank remains in dialogue with various authorities regarding the terminated non-resident portfolio at Danske Bank’s Estonian branch, which was active between 2007 and 2015. This includes criminal and regulatory investigations by authorities in Estonia, Denmark, France and the US. Danske Bank continues to cooperate with all authorities. In 2018, the Estonian Office of the Prosecutor General opened a criminal investigation into former employees of the Estonian branch. In November 2018, Danske Bank was preliminarily charged by the Danish State Prosecutor for Serious Economic and international Crime (SØIK) with violating the Danish AML Act on four counts, all relating to the Estonian branch in the period from 1 February 2007 to the end of January 2016.

A.P. MØLLER HOLDING A/S ANNUAL REPORT 2019 · CONSOLIDATED FINANCIAL STATEMENTS
94
Note 28: Significant accounting estimates and judgments - continued
In February 2019, Danske Bank was placed under formal investigation by an investigating judge of the Tribunal de Grande Instance de Paris in the context of an on-going French criminal investigation and on the grounds of money laundering suspicions relating to certain transactions in the termi-nated portfolio of non-resident customers of Danske Bank’s Estonian branch, amounting to around DKK 160m and performed between 2007 and 2014. Danske Bank has posted bail in the amount of DKK 80m. Danske Bank is reporting to, responding to and cooperating with various authorities, including the U.S. Department of Justice (DOJ) and the U.S. Securities and Exchange Commission (SEC), relating to Danske Bank’s Estonian branch. The overall timing of completion and the outcome of the investigations by, and subsequent discus-sions with, the authorities are uncertain. It is not yet possible to reliably estimate the timing, form of resolution, or amount of potential settlement or fines, if any, which could be material. Based on orders from the Danish FSA, Danske Bank’s solvency need has been increased in 2018 by a Pillar II add-on of in total DKK 10bn to ensure adequate capital coverage of the increased compli-ance and reputational risks in relation to the Estonian AML matter. On 9 January 2019, an action was filed in the United States District Court for the Southern District of New York by an alleged holder of Danske Bank’s American Depositary Receipts, representing its or-dinary shares, against Danske Bank and certain of its officers and former officers and/or directors. The complaint alleges that the defendants violated Section 10(b) and Sections 20(a) of the Securi-ties Exchange Act of 1934 by, among other things, making false and misleading statements and/or failing to disclose adverse information regarding Danske Bank’s business and operations in relation to AML matters relating to Danske Banks’s Estonian branch and related matters. The complaint seeks unspecified damages on behalf of a putative class of purchasers of Danske Bank’s American Depositary Receipts between 9 January 2014 and 29 April 2019. Danske Bank intends to defend against these claims. The timing of the completion of the lawsuit and the outcome are uncertain. On 3 March 2019, a court case was initiated against Danske Bank for approval of a class action lead by a newly formed association with the aim to represent former and current shareholders in a liabil-ity action relating to the Estonian AML matter. On 14 March 2019 (168), October 2019 (64) and in January 2020 (9), 241 separate cases were initiated against Danske Bank with a total claim amount of approximately DKK 1.3bn. These court actions filed with the Copenhagen City Court relate to al-leged violations in Danske Bank’s branch in Estonia of the rules on prevention of money laundering and alleged failure to timely inform the market of such violations. Danske Bank intends to defend itself against these claims. The timing of completion of any such lawsuits (pending or threatening) and their outcome are uncertain.
OPERATIONS IN COUNTRIES WITH LIMITED ACCESS TO REPATRIATING SURPLUS CASH The group operates worldwide, and in this respect, has operations in countries where the access to repatriating surplus cash is limited. In these countries, management makes judgments as to how these transactions and balance sheet items are recognised in the financial statement. PROVISIONS FOR PENSION AND OTHER EMPLOYEE BENEFITS For defined benefit schemes, management makes assumptions about future remuneration and pension changes, employee attrition rates, life expectancy, inflation and discount rates. When set-ting those assumptions, management takes advice from the actuaries performing the valuation. The inflation and discount rates are determined centrally for the major plans on a country-by-country basis. All other assumptions are determined on a plan-by-plan basis. Refer to note 16 for infor-mation about key assumptions and the sensitivity of the liability to changes in these assumptions. Plan assets are measured at fair value by fund administrators. PROVISIONS FOR LEGAL DISPUTES, UNCERTAIN TAX POSITIONS, ETC. Management’s estimate of the provisions regarding legal disputes, including disputes on taxes and duties, is based on the knowledge available on the actual substance of the cases and a legal as-sessment of these. The resolution of legal disputes, through either negotiations or litigation, can take several years to complete and the outcome is subject to considerable uncertainty. The group is engaged in a number of disputes with tax authorities of varying scope. Appropriate provisions and recognition of uncertain tax positions have been made where the probability of the group’s tax positions being upheld in individual cases is considered less than 50%. Claims, for which the probability of the group’s tax position being upheld is assessed by management to be at least 50%, are not provided for. Such risks are instead evaluated on a portfolio basis by geograph-ical area, and country risk provisions and uncertain tax liabilities are recognised where the aggre-gated probability of the group’s tax position being upheld is considered less than 50%.

A.P. MØLLER HOLDING A/S ANNUAL REPORT 2019 · CONSOLIDATED FINANCIAL STATEMENTS
95
Note 28: Significant accounting estimates and judgments - continued
DEFERRED TAX ASSETS Judgment has been applied in the measurement of deferred tax assets with respect to the group’s ability to utilise the assets. Management considers the likelihood of utilisation based on the latest business plans and recent financial performances of the individual entities. Net deferred tax assets recognised in entities having suffered an accounting loss in either the current or preceding period amounting to DKK 0.6bn (DKK 0.9bn), excluding entities participating in joint taxation schemes. These assets mainly relate to unused tax losses or deductible temporary differences generated, during construction of terminals, where taxable profits have been generated either in the current period or are expected within a foreseeable future. VESSEL SHARING AGREEMENTS (COST SHARING ARRANGEMENTS) Vessel sharing agreements in shipping require that some vessels are committed towards specific service routes. The committed vessel’s capacity is then shared with one or more container shipping providers in proportion to each party’s contribution to the joint service. In practice, it is not always possible to provide tonnage precisely as agreed in the sharing arrangements, therefore financial settlement often takes place on the basis of relative capacity over/under utilised on a monthly or other mutually agreed cycle. At the group, these capacity adjustments are settled as close to actual costs incurred as possible, based on market rates applicable at that time. LEASING The group enters into a substantial amount of lease contracts, some of which combine leasing and service components in the same leasing arrangement, such as time charter contracts. Judgment is applied in determining the stand-alone value of each component using specialised tools to stream-line the valuation process. Similarly, determining variable lease payments requires significant judg-ment and understanding of facts and circumstances that give rise to variable payments. In the group, variable payments are linked to the uncertain period for which container equipment is used outside the firm contract period, due to flexible redelivery periods and certain terminal concession agreements for which payments are linked to future performance, such as number of TEUs handled, or depend on an index.
A significant amount of lease contracts contains extension or purchase options or termination op-tions or various combinations of these options. Assessment of the exercise or non-exercise of such options impacts the value of right-of-use assets recognised. Such assessments are reviewed when-ever a significant event or change in circumstances occurs. IFRS 16 requires that a discount rate is applied to determine the present value of lease payments. Significant judgment is required in determining appropriate rates, therefore management applies a formalised process for determining applicable discount rates using specialist staff. DISCONTINUED OPERATIONS AND ASSETS HELD FOR SALE Discontinued operations represent a separate major line of business disposed of or in preparation for sale. During 2019, Maersk Supply Service no longer fulfilled the requirement to be classified as discontinued operations and assets held for sale and was thus reclassified as continuing opera-tions. Comparison figures for the income statement and cash flow statement have been restated as if Maersk Supply Service had always been part of continuing operations. The impact on 2019 of the reclassifications on key accounting lines were: Revenue (DKK 1.7bn), EBITDA (DKK 20m) and Loss for the period – continuing operations (DKK 2.6bn).

A.P. MØLLER HOLDING A/S ANNUAL REPORT 2019 · CONSOLIDATED FINANCIAL STATEMENTS
96
Note 29: Company overview

A.P. MØLLER HOLDING A/S ANNUAL REPORT 2019 · CONSOLIDATED FINANCIAL STATEMENTS
97
Note 29: Company overview - continued
A.P. Moller Holding group of companies comprises more than 900 companies. COMPANIES OWNED BY A.P. MØLLER HOLDING A/S ARE LISTED BELOW
Subsidiary Country of incorporation Ownership share
A.P. Møller - Mærsk A/S¹ Denmark 41.5% APMH Invest A/S Denmark 100%
1 Voting rights 51.45% MAJOR COMPANIES OF A.P. MØLLER - MÆRSK A/S ARE LISTED BELOW
Subsidiary Country of incorporation Ownership share
A.P. Moller Finance SA Switzerland 100% A.P. Moller Singapore Pte. Ltd. Singapore 100% A/S Maersk Aviation Holding Denmark 100% Addicks & Kreye Container Service GmbH & Co. KG Germany 51% Aliança Navegação e Logística Ltda. Brazil 100% APM Terminals - Aarhus A/S Denmark 100% APM Terminals Algeciras S.A. Spain 100% APM Terminals Apapa Ltd. Nigeria 94% APM Terminals B.V. The Netherlands 100% APM Terminals Bahrain B.S.C. Bahrain 80% APM Terminals Callao S.A. Peru 51% APM Terminals China Co. Ltd. Hong Kong 100% APM Terminals Elizabeth, LLC USA 100% APM Terminals Gothenburg AB Sweden 100% APM Terminals India Pvt. Ltd. India 100% APM Terminals Inland Services S.A. Peru 100% APM Terminals Lazaro Cardenas S.A. de C.V. Mexico 100% APM Terminals Liberia Ltd. Liberia 75% APM Terminals Management B.V. The Netherlands 100% APM Terminals Mobile, LLC USA 100% APM Terminals Moin S.A. Costa Rica 100% APM Terminals Maasvlakte II B.V. The Netherlands 100% APM Terminals North America B.V. The Netherlands 100% APM Terminals Pacific LLC USA 100%
Subsidiary Country of incorporation Ownership share
APM Terminals Rotterdam B.V. The Netherlands 100% APM Terminals Tangier SA Morocco 90% Aqaba Container Terminal Company Ltd. Jordan 50% Bermutine Transport Corporation Ltd. Bermuda 100% Coman SA Benin 100% Container Operators S.A. Chile 100% Damco (UAE) FZE United Arab Emirates 100% Damco A/S Denmark 100% Damco Australia Pty. Ltd. Australia 100% Damco Belgium NV Belgium 100% Damco China Ltd. China 100% Damco Distribution Services Inc. USA 100% Damco France SAS France 100% Damco India Pvt. Ltd. India 100% Damco International A/S Denmark 100% Damco Logistics Uganda Ltd. Uganda 100% Damco Sweden AB Sweden 100% Damco UK Ltd. Great Britain 100% Damco USA Inc. USA 100% Farrell Lines Inc. USA 100% Gateway Terminals India Pvt. Ltd. India 74% Hambürg Sudamerikanische Dampfschifffahrts-Gesellschaft A/S and Co KG Germany 100% Lilypond Container Depot Nigeria Ltd. Nigeria 100% Maersk (China) Shipping Company Ltd. China 100% Maersk A/S Denmark 100% Maersk Agency U.S.A. Inc. USA 100% Maersk B.V. The Netherlands 100% Maersk Bangladesh Ltd. Bangladesh 100% Maersk Container Industry A/S Denmark 100% Maersk Container Industry Qingdao Ltd. China 100% Maersk Denizcilik A.Ş. Turkey 100% Maersk Egypt For Maritime Transport SAE Egypt 100% Maersk FPSOs A/S Denmark 100% Maersk Gabon SA Gabon 100% Maersk Global Service Centres (Chengdu) Ltd. China 100% Maersk Global Service Centres (India) Pvt. Ltd. India 100% Maersk Holding B.V. The Netherlands 100% Maersk Hong Kong Ltd. Hong Kong 100%

A.P. MØLLER HOLDING A/S ANNUAL REPORT 2019 · CONSOLIDATED FINANCIAL STATEMENTS
98
Note 29: Company overview - continued
Subsidiary Country of incorporation Ownership share
Maersk Inc. USA 100% Maersk Inter Holding B.V. The Netherlands 100% Maersk Line Agency Holding A/S Denmark 100% Maersk Line UK Ltd. UK 100% Maersk Line, Limited USA 100% Maersk Logistics Warehousing China Company Ltd. Hong Kong 100% Maersk Oil Trading and Investments A/S Denmark 100% Maersk Oil Trading Inc. USA 100% Maersk Shipping Hong Kong Ltd. Hong Kong 100% Maersk Supply Service (Angola) Lda. Angola 49% Maersk Supply Service A/S Denmark 100% Maersk Supply Service Canada Ltd. Canada 100% Maersk Supply Service International A/S Denmark 100% Maersk Supply Service UK Ltd. Great Britain 100% Maersk Vietnam Ltd. Vietnam 100% New Times International Transport Service Co. Ltd. China 100% Poti Sea Port Corporation Georgia 100% PT Damco Indonesia Indonesia 98% Rederiaktieselskabet Kuling Denmark 100% Rederiet A.P. Møller A/S Denmark 100% Safmarine (Pty) Ltd. South Africa 100% Safmarine MPV NV Belgium 100% Sealand Europe A/S Denmark 100% Sealand Maersk Asia Pte. Ltd. Singapore 100% Sogester - Sociedade Gestora De Terminals S.A. Angola 51% Suez Canal Container Terminal SAE Egypt 55% Svitzer A/S Denmark 100% Svitzer Australia Pty Ltd Australia 100% Svitzer Marine Ltd. Great Britain 100% Terminal 4 S.A. Argentina 100% U.S. Marine Management, Incorporated USA 100% West Africa Container Terminal Nigeria Ltd. Nigeria 100%
Associate Country of incorporation Ownership share
Abidjan Terminal SA Ivory Coast 49% Brigantine International Holdings Ltd. Hong Kong 30% Brigantine Services Ltd. Hong Kong 30% Congo Terminal Holding SAS France 30% Congo Terminal SA Republic of the Congo 23% Cosco Ports (Nansha) Ltd. British Virgin Islands 34% Guangzhou South China Oceangate Container Terminal Co. Ltd. China 20% Gujarat Pipavav Port Ltd. India 43% Höegh Autoliners Holdings AS Norway 39% Meridian Port Services Ltd. Ghana 42% Pelabuhan Tanjung Pelepas Sdn. Bhd. Malaysia 30% Salalah Port Services Company SAOG Oman 30% Shanghai Tie Yang Multimodal Transportation Co. Ltd. China 29% South Asia Gateway Pvt. Ltd. Sri Lanka 33% Tianjin Port Alliance International Container Terminal Co. Ltd. China 20%
Joint ventures Country of incorporation Ownership share
Anchor Storage Ltd. Bermuda 51% Brasil Terminal Portuario S.A. Brazil 50% Cai Mep International Terminal Co. Ltd. Vietnam 49% Douala International Terminal SA Cameroon 40% Eurogate Container Terminal Wilhelmhaven Beteiligungsge-sellschaft GmbH Germany 30% First Container Terminal ZAO Russia 31% Global Ports Investments PLC Cyprus 31% North Sea Terminal Bremerhaven Verwaltungsgesellschaft GmbH Germany 50% Petrolesport OAO Russia 31% Qingdao New Qianwan Container Terminal Co. Ltd. China 19% Qingdao Qianwan Container Terminal Co. Ltd. China 20% Shanghai East Container Terminal Co. Ltd. China 49% Smart International Logistics Company Ltd. China 49% South Florida Container Terminal LLC USA 49% Vostochnaya Stevedore Company OOO Russia 31% Xiamen Songyu Container Terminal Co. Ltd. China 25%

A.P. MØLLER HOLDING A/S ANNUAL REPORT 2019 · CONSOLIDATED FINANCIAL STATEMENTS
99
Note 29: Company overview - continued
COMPANIES OF APMH INVEST A/S ARE LISTED BELOW
Subsidiary Country of incorporation Ownership share
The Drilling Company of 1972 A/S¹ Denmark 41.6% Maersk Tankers A/S Denmark 100% Maersk Product Tankers A/S Denmark 70% KK Wind Solutions Holding A/S Denmark 100% A.P. Møller Capital P/S Denmark 51% AIF I Sponsor Invest K/S Denmark 100% A.P. Møller Capital GP ApS Denmark 100% Africa Infrastructure Fund I GP ApS Denmark 100% APMH Invest IV A/S Denmark 100% APMH Invest V ApS Denmark 100% APMH Invest VI ApS Denmark 100% APMH Invest VII ApS Denmark 100% APMH Invest VIII A/S Denmark 100%
1 APMH Invest A/S is considered to hold a controlling interest in The Drilling Company of 1972 A/S
Associate Country of incorporation Ownership share
Danske Bank A/S Denmark 21.3%
COMPANIES OF THE DRILLING COMPANY OF 1972 A/S ARE LISTED BELOW
Subsidiary Country of incorporation Ownership share
Maersk Drilling Holding A/S Denmark 100% Maersk Drilling A/S Denmark 100% Maersk Drilling Services A/S Denmark 100% Maersk Drilling UK Limited UK 100% Maersk Drilling (UAE) FZE United Arab Emirates 100% Maersk Drilling International A/S Denmark 100% Maersk Offshore Crew Management (Guernsey) Ltd. Guernsey 100% Maersk Drilling Deepwater A/S Denmark 100% Maersk Drilling Services LLC Azerbaijan 100% Maersk Drilling Labuan Ltd Malaysia 100% Maersk Inspirer Operations AS Norway 100% Maersk Reacher Operations AS Norway 100% Maersk Intrepid Operations AS Norway 100% Maersk Integrator Operations AS Norway 100% Maersk Drilling Norge AS Norway 100% Maersk Invincible Norge A/S Denmark 100% Maersk Intrepid Norge A/S Denmark 100% Maersk Interceptor Norge A/S Denmark 100% Maersk Integrator Norge A/S Denmark 100% Mærsk Innovator Norge A/S Denmark 100% Mærsk Inspirer Norge A/S Denmark 100% Maersk Reacher Norge A/S Denmark 100% Mærsk Gallant Norge A/S Denmark 100% Maersk Drilling DS A/S Denmark 100% Maersk Drilling Americas A/S Denmark 100% Maersk Drilling USA Inc USA 100% Maersk Viking LLC USA 100% Maersk Drilling Brasil Servicos de Perfuracao Maritmos Ltda Brazil 100%

A.P. MØLLER HOLDING A/S ANNUAL REPORT 2019 · CONSOLIDATED FINANCIAL STATEMENTS
100
Note 29: Company overview - continued
Subsidiary Country of incorporation Ownership share
Maersk Drilling Mexico S.A. de C.V. Mexico 100% Maersk Drilling Services S.A. de C.V. Mexico 100% Maersk Drilling Australia Pty Ltd. Australia 100% Maersk Drilling Holdings Singapore Pte Ltd. Singapore 100% Maersk Highlander UK Ltd UK 100% Maersk Drillship I Singapore Pte.Ltd. Singapore 100% Maersk Drillship II Singapore Pte.Ltd. Singapore 100% Maersk Drillship III Singapore Pte Ltd. Singapore 100% Maersk Drillship IV Singapore Pte Ltd. Singapore 100% Maersk Drilling Nigeria Holdings Pte. Ltd. Singapore 100% Maersk Drilling Nigeria Operations Limited Nigeria 100% Maersk Drilling Services Singapore Pte. Ltd. Singapore 100% Maersk Drilling Deepwater Egypt LLC Egypt 100% Maersk Drilling North Sea A/S Denmark 100% Maersk Drilling Poland sp. z o.o (8 April 2019) Poland 100% Maersk Drilling Netherlands BV Netherlands 100% Maersk Drilling India Private Limited India 100% MD Viking Company Limited Myamar 100% Maersk Drilling Abu Dhabi Ltd. (W.L.L.)¹ Abu Dhabi 33% Maersk JS-Services Lda Angola JV¹ Angola 49% Maersk Drilling Qatar W.L.L¹ Qatar 49% Maersk Drilling Malaysia SDN ¹ Malaysia 49% Maersk Rigworld Ghana Limited¹ Ghana 65% Maersk Drilling Nigeria JVCO Limited¹ Nigeria 49%
Joint ventures Country of incorporation Ownership share
Maersk Decom A/S¹ Denmark 50% PMD Viking Ghana Ltd UK 50%
1 Maersk Decom A/S is owned jointly with A.P. Moller - Maersk. Ownership share amounts to 100% in total
COMPANIES OF MAERSK TANKERS A/S ARE LISTED BELOW
Subsidiary Country of incorporation Ownership share
Brostrom AB Sweden 100% Brostrom General Partner A/S Denmark 100% Brostrom K/S Denmark 100% Handytankers General Partner A/S Denmark 100% Handytankers K/S Denmark 100% Maersk Tankers Afra General Partner A/S Denmark 100% Maersk Tankers Afra K/S Denmark 100% Maersk Tankers Holland BV Holland 100% Maersk Tankers India Pvt. Ltd. India 100% Maersk Tankers LR2 General Partner A/S Denmark 100% Maersk Tankers LR2 K/S Denmark 100% Maersk Tankers MR General Partner A/S Denmark 100% Maersk Tankers MR K/S Denmark 100% Maersk Tankers Romania SRL Romania 100% Maersk Tankers US Inc. USA 100% Maersk Tankers US Personnel Inc. USA 100% OPSA Operadora Portuaria Venezuela 100%
Joint ventures Country of incorporation Ownership share
Long Range 2 A/S Denmark 50% LR 2 Management K/S Denmark 50%

A.P. MØLLER HOLDING A/S ANNUAL REPORT 2019 · CONSOLIDATED FINANCIAL STATEMENTS
101
Note 29: Company overview - continued
COMPANIES OF MAERSK PRODUCT TANKERS A/S ARE LISTED BELOW
Subsidiary Country of incorporation Ownership share
Maersk Tankers Singapore Pte Ltd Singapore 100% Maersk Tankers UK Ltd. UK 100%
COMPANIES OF KK WIND SOLUTIONS HOLDING A/S ARE LISTED BELOW
Subsidiary Country of incorporation Ownership share
KKWSH ApS Denmark 100% KK Wind Solutions A/S Denmark 100% KK-ELECTRONIC DENMARK ApS Denmark 100% KK Wind Solutions International ApS Denmark 100% KK Wind Solutions India Pvt. Ltd. Denmark 100% KK Wind Solutions Service A/S Denmark 100% KK Wind Solutions Service Holding US Inc. Denmark 100% KK Wind Solutions Service US Inc. Denmark 100% KK Wind Solutions Polska Sp. Z.o.o Denmark 100% KK-GROUP A/S Denmark 100%

A.P. MØLLER HOLDING A/S ANNUAL REPORT 2019 · PARENT COMPANY FINANCIAL STATEMENTS
102
PARENT COMPANY FINANCIAL STATEMENTS
A.P. MØLLER HOLDING A/S ANNUAL REPORT 2019 · PARENT COMPANY FINANCIAL STATEMENTS

A.P. MØLLER HOLDING A/S ANNUAL REPORT 2019 · PARENT COMPANY FINANCIAL STATEMENTS
103
Parent company financial statements ....................................................... 102 Income statement ........................................................................................................................................... 104 Balance sheet as of 31 December................................................................................................................ 105 Statement of changes in equity .................................................................................................................... 106
Notes to parent company financial statements ...................................... 108 — Note 1: Investments in subsidiaries ....................................................................................................... 110 — Note 2: Staff costs ...................................................................................................................................... 110 — Note 3: Property ......................................................................................................................................... 110 — Note 4: Other financial income ............................................................................................................... 111 — Note 5: Other financial expenses ........................................................................................................... 111 — Note 6: Tax on profit for the year ............................................................................................................ 111 — Note 7: Distribution of net profit for the year ........................................................................................ 111 — Note 8: Deferred tax .................................................................................................................................. 111 — Note 9: Share capital ................................................................................................................................. 111 — Note 10: Related parties ........................................................................................................................... 111 — Note 11: Commitments ............................................................................................................................ 112 — Note 12: Contingent liabilities ................................................................................................................. 112 — Note 13: Events after the balance sheet date ....................................................................................... 112 — Note 14: Accounting policies .................................................................................................................. 112
PARENT COMPANY FINANCIAL STATEMENTS
CONTENTS
A.P. MØLLER HOLDING A/S ANNUAL REPORT 2019 · PARENT COMPANY FINANCIAL STATEMENTS

A.P. MØLLER HOLDING A/S ANNUAL REPORT 2019 · PARENT COMPANY FINANCIAL STATEMENTS
104
Note Amounts in DKKm 2019 2018
1 Share of profit in subsidiaries 5,021.6 10,292.7 2 Staff costs - 92.3 - 53.0 Other external expenses - 37.1 - 27.7 3 Depreciation -0.8 0.0 Other income 11.8 9.4 Profit before financial items 4,903.2 10,221.4 4 Other financial income 436.6 195.3 5 Other financial expenses - 228.7 - 90.6 Profit before tax 5,111.1 10,326.1 6 Tax on profit for the year - 23.8 - 6.6 7 Net profit for the year 5,087.3 10,319.5
INCOME STATEMENT
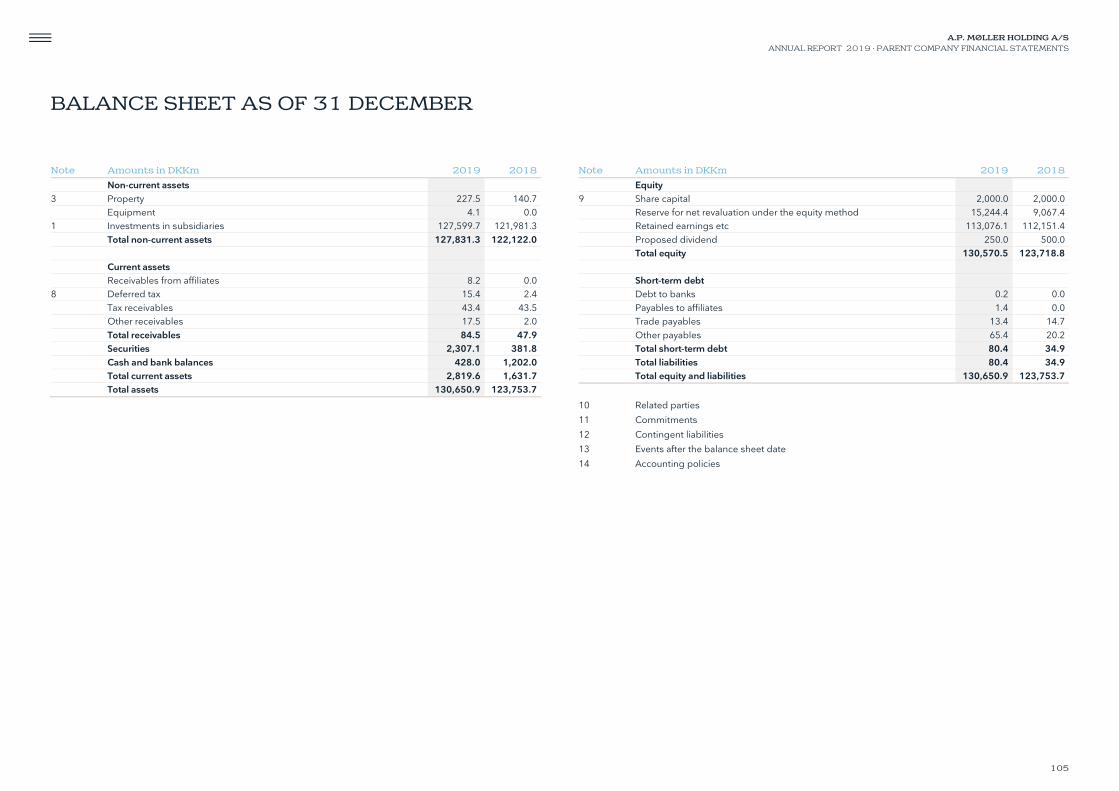
A.P. MØLLER HOLDING A/S ANNUAL REPORT 2019 · PARENT COMPANY FINANCIAL STATEMENTS
105
Note Amounts in DKKm 2019 2018
Non-current assets 3 Property 227.5 140.7 Equipment 4.1 0.0 1 Investments in subsidiaries 127,599.7 121,981.3 Total non-current assets 127,831.3 122,122.0 Current assets Receivables from affiliates 8.2 0.0 8 Deferred tax 15.4 2.4 Tax receivables 43.4 43.5 Other receivables 17.5 2.0 Total receivables 84.5 47.9 Securities 2,307.1 381.8 Cash and bank balances 428.0 1,202.0 Total current assets 2,819.6 1,631.7 Total assets 130,650.9 123,753.7
Note Amounts in DKKm 2019 2018
Equity 9 Share capital 2,000.0 2,000.0 Reserve for net revaluation under the equity method 15,244.4 9,067.4 Retained earnings etc 113,076.1 112,151.4 Proposed dividend 250.0 500.0 Total equity 130,570.5 123,718.8 Short-term debt Debt to banks 0.2 0.0 Payables to affiliates 1.4 0.0 Trade payables 13.4 14.7 Other payables 65.4 20.2 Total short-term debt 80.4 34.9 Total liabilities 80.4 34.9 Total equity and liabilities 130,650.9 123,753.7
10 Related parties 11 Commitments 12 Contingent liabilities 13 Events after the balance sheet date 14 Accounting policies
BALANCE SHEET AS OF 31 DECEMBER

A.P. MØLLER HOLDING A/S ANNUAL REPORT 2019 · PARENT COMPANY FINANCIAL STATEMENTS
106
Amounts in DKKm Share
capital
Reserve for net
revalua-tion under the equity
method
Retained earnings
etc. Proposed
dividend Total
Equity at 1 January 2018 2,000.0 -346.2 109,257.3 500.0 111,411.1 Dividend paid for the year 0.0 0.0 0.0 -500.0 -500.0 Net profit/loss for the year 0.0 10,292.7 -473.2 500.0 10,319.5 Dividend from subsidiaries 0.0 -1,296.3 1,296.3 0.0 0.0 Other adjustments¹ 0.0 478.4 2,071.0 0.0 2,549.4 Equity at 31 December 2018 2,000.0 9,128.6 112,151.4 500.0 123,780.0 Impact due to implementation of new accounting standards 0.0 -61.2 0.0 0.0 -61.2 Adjusted equity as of 1 January 2019 2,000.0 9,067.4 112,151.4 500.0 123,718.8 Dividend paid for the year 0.0 0.0 0.0 -500.0 -500.0 Net profit/loss for the year 0.0 5,021.6 -184.3 250.0 5,087.3 Dividend from subsidiaries 0.0 -1,296.3 1,296.3 0.0 0.0 Other adjustments¹ 0.0 2,451.7 -187.3 0.0 2,264.4 Equity at 31 December 2019 2,000.0 15,244.4 113,076.1 250.0 130,570.5
¹ Other adjustments primarily comprise exchange rate adjustments
STATEMENT OF CHANGES IN EQUITY

A.P. MØLLER HOLDING A/S ANNUAL REPORT 2019 · PARENT COMPANY FINANCIAL STATEMENTS
107

A.P. MØLLER HOLDING A/S ANNUAL REPORT 2019 · PARENT COMPANY FINANCIAL STATEMENTS
108
Notes to parent company financial statements
A.P. MØLLER HOLDING A/S ANNUAL REPORT 2019 · PARENT COMPANY FINANCIAL STATEMENTS

A.P. MØLLER HOLDING A/S ANNUAL REPORT 2019 · PARENT COMPANY FINANCIAL STATEMENTS
109
A.P. MØLLER HOLDING A/S ANNUAL REPORT 2019 · PARENT COMPANY FINANCIAL STATEMENTS

A.P. MØLLER HOLDING A/S ANNUAL REPORT 2019 · PARENT COMPANY FINANCIAL STATEMENTS
110
Note 1: Investments in subsidiaries
Amounts in DKKm 2019 2018
Cost as of 1 January 112,913.3 112,929.9 Additions 1,800.0 215.8 Disposals - 2,358.0 - 232.4 Cost as of 31 December 112,355.3 112,913.3 Adjustment to carrying amount as of 1 January 9,068.0 - 2,073.2 Impact due to implementation of new accounting standards 0.0 - 61.2 Share of profit for the year 5,021.6 10,292.7 Dividend - 1,296.3 - 1,296.3 Disposals - 139.3 0.0 Other adjustments incl. exchange rate adjustments 2,590.4 2,206.0 Adjustment to carrying amount as of 31 December 15,244.4 9,068.0 Carrying amount as of 31 December 127,599.7 121,981.3
COMPANY OVERVIEW AS AT 31 DECEMBER 2019
Subsidiary Country of incorporation
Owner-ship
share¹ Voting
share
A.P. Møller - Mærsk A/S Denmark 41.51% 51.45% APMH Invest A/S Denmark 100.00% 100.00%
1 Percentage of total number of issued shares Please refer to the company overview for A.P. Moller Holding’s group of companies as stated in note 29, which is an integrated part of this note.
Note 2: Staff costs
Amounts in DKKm 2019 2018
Wages and salaries 90.3 51.3 Pensions 1.8 1.6 Other social security costs 0.2 0.1 Total 92.3 53.0 Average number of employees 28 21 Remuneration to the Executive Board 41.9 20.2 Remuneration to the Board of Directors 0.8 1.0
A.P. Møller Holding A/S has introduced a cash-settled incentive plan to members of the Executive Board. The incentive plan provides an annual bonus and long-term incentive programmes, which depend on the development of the company’s investments. Long-term incentive programmes are included in Remuneration to the Executive Board with DKK 16m (DKK 4m). Note 3: Property
Amounts in DKKm 2019 2018
Cost as of 1 January 140.7 90.4 Additions 87.6 50.3 Disposals 0.0 0.0 Cost as of 31 December 228.3 140.7 Depreciation as of 1 January 0.0 0.0 Depreciation for the year - 0.8 0.0 Depreciation as of 31 December - 0.8 0.0 Carrying amount as of 31 December 227.5 140.7
Property was acquired in 2017 and has been under reconstruction until October 2019.

A.P. MØLLER HOLDING A/S ANNUAL REPORT 2019 · PARENT COMPANY FINANCIAL STATEMENTS
111
Note 4: Other financial income
Amounts in DKKm 2019 2018
Interest income 33.2 25.8 Dividends 13.7 5.6 Exchange rate gains 104.0 155.7 Gains on securities 285.7 8.2 Total 436.6 195.3
Note 5: Other financial expenses
Amounts in DKKm 2019 2018
Interest expenses 1.4 0.1 Exchange rate losses 78.9 44.6 Losses on securities 148.4 45.9 Total 228.7 90.6
Note 6: Tax on profit for the year
Amounts in DKKm 2019 2018
Tax on profit for the year 31.3 7.6 Adjustment of tax concerning previous years 5.5 - 0.7 Adjustment of deferred tax - 13.0 - 0.3 Total 23.8 6.6
Note 7: Distribution of net profit for the year
Amounts in DKKm 2019 2018
Proposed dividend 250.0 500.0 Reserve for net revaluation under the equity method 5,021.6 10,292.7 Retained earnings -184.3 -473.2 Net profit for the year 5,087.3 10,319.5
Note 8: Deferred tax
Amounts in DKKm 2019 2018
Deferred tax asset as of 1 January 2.4 2.1 Adjustment of deferred tax for the year 13.0 0.3 Deferred tax asset as of 31 December 15.4 2.4
Deferred tax is calculated based on the difference between the carrying amount and the tax base of assets and liabilities. Management expects the deferred tax asset to be utilised by the company itself or by the group of jointly taxed companies within a few years. Note 9: Share capital
Amounts in DKKm
Changes in share capital in the past 5 years Share capital as of 1 January 2015 1,000.0 Capital increase through non-cash contribution at 2 March 2015 1,000.0 Share capital as of 31 December 2019 2,000.0
The share capital consists of 2,000 shares with a nominal value of DKK 1m. Note 10: Related parties
A.P. Møller og Hustru Chastine Mc-Kinney Møllers Fond til almene Formaal (A.P. Moller Founda-tion) holds 100% of the company’s capital. Related parties exercising controlling interest in the company: • A.P. Moller Foundation, Esplanaden 50, Copenhagen, Denmark The company has not entered into any transactions with related parties that were not on an arm’s length basis.
A.P. MØLLER HOLDING A/S ANNUAL REPORT 2019 · PARENT COMPANY FINANCIAL STATEMENTS
112
Note 11: Commitments
As part of the company’s activities, lease agreements are entered into regarding lease of office equipment and cars. The total amount of lease commitments regarding short term and low value asset leases as of 31 December 2019 amounts to DKK 1.0m. During 2019, the company has low-value leases amounting to DKK 0.4m. Commitments regarding supplier contracts amount to DKK 0.0m (DKK 50.0m). Note 12: Contingent liabilities
The company is included in national joint taxation with other Danish companies in the A.P. Moller Holding Group. The company is jointly and severally liable for the payment of taxes and withholding tax. Note 13: Events after the balance sheet date
The global outbreak of the Coronavirus (COVID-19) is leading to significant uncertainties and lack of visibility related to A.P. Moller Holding Group and our businesses. The COVID-19 is a non-adjusting event after the reporting period. Therefore, amounts recognised in the financial statements shall not be adjusted based on this event. However, due to the material negative impact of the pandemic on financial markets, oil prices, global transport operations, business-critical supply chains, etc., future economic decision to be made on the basis of the financial statements should carefully take all sub-sequent facts and circumstances into consideration. Due to the very difficult situation with signifi-cant uncertainties and lack of visibility at the time of presenting this Financial Statements, manage-ment is not able to make any relevant and reliable estimate of the financial effect of the event and the impact to future reporting periods. Such effect could potential have a material impact.
No other events of importance to the Annual Report have occurred during the period from the balance sheet date until the presentation of the financial statements.
Note 14: Accounting policies
The Financial Statements for 2019 for A.P. Møller Holding A/S have been prepared on a going con-cern basis and in accordance with the provisions of the Danish Financial Statements Act applying to large enterprises of reporting class C. A few adjustments have been made to the presentation form and designations in view of the nature of the company. The adjustments have no effect on either profit or equity. With reference to section 86(4) of the Danish Financial Statements Act, no cash flow statement has been prepared for the company. With reference to section 96(3) of the Danish Financial Statements Act, the company has not pre-sented fees to statutory auditors. Compared to the accounting policies described for A.P. Møller Holding A/S as stated in note 27 to the consolidated financial statements, the company’s accounting policies differ mainly in the follow-ing areas: • Shares in subsidiaries are measured under the equity method. The share of profit/loss after tax
in the subsidiaries, is recognised as a separate line item in the income statement. Goodwill and other intangible assets with indefinite useful lives are recognised as part of the investment and amortised over a maximum of 25 years
• Dividends from subsidiaries are recognised as a receivable at the time of declaration • All equity instruments where A.P. Møller Holding A/S does not have either control, joint control
or significant influence is measured at fair value and the fair value adjustment is recognised in the income statement. Therefore equity instruments classified at fair value through other com-prehensive income in the consolidated financial statement are recognised in the income state-ment
The Financial Statements have been prepared under the same accounting policies as last year except for the below mentioned changes regarding recognition of leases, uncertain tax positions and health and accident insurance. The Financial Statements are presented in DKK million.

A.P. MØLLER HOLDING A/S ANNUAL REPORT 2019 · PARENT COMPANY FINANCIAL STATEMENTS
113
Note 15: Accounting policies - continued
CHANGE IN ACCOUNTING POLICIES Effective 1 January 2019, the company applied the new reporting standard on Leases, IFRS 16. The change will mainly affect share of profits in subsidiaries and associated companies. All leases are recognised as right-of-use assets with corresponding lease liabilities at the date on which the leased asset is available for use. Each lease payment is allocated between a reduction of the liability and an interest expense. The interest expense is charged to the income statement over the lease period, to produce a constant periodic rate of interest on the remaining balance of the liability for each period. The right-of-use as-set is depreciated over the shorter of the asset’s useful life and the lease term on a straight-line ba-sis. The company transitioned to IFRS 16 in accordance with the modified retrospective approach, therefore previous period comparative figures are not adjusted in the financial statements. Addi-tionally, the IAS 17 definition of a lease and its related interpretations have been retained. The change in accounting policies due to leases had no change on the equity of A.P. Møller Holding A/S as well as on total assets and total liabilities. The company follows the guidelines in IFRIC 23 for accounting for uncertain income tax positions and the implementation of the interpretation standard has not resulted in a significant change to the measurement of uncertain tax positions. The company has voluntarily changed its accounting policy for calculating the provision for health and accident insurance contracts, with the risk coverage period no longer than one year. Retrospec-tive application is impracticable without the use of hindsight and due to lack of data. The cumulative impact is recognised as a reduction in shareholders’ equity at 1 January 2019 of DKK 61.2m. The impact on net profit for 2019 is insignificant.
INCOME STATEMENT Share of profit/loss in subsidiaries and associated companies Share of profit/loss in subsidiaries and associated companies is recognised net of tax and corrected for the share of unrealised intra-group gains and losses. The line item also includes amortisation and impairment of goodwill recognised as part of the equity investment. Expenses Other external expenses comprise expenses for administration, office supplies, etc. Other income Other income comprises service fees. BALANCE SHEET Investment in subsidiaries and associates Investment in subsidiaries and associates are accounted for under the equity method. The invest-ments are initially recognised at cost and adjusted thereafter to recognise the company’s share of the post-acquisition profits or losses of the investee, and the company’s share of movements in equity of the investee. Accounting policies of equity accounted investees have been changed where necessary to ensure consistency with the policies adopted by the company. Dividends received or receivable from subsidiaries and associates are recognised as a reduction in the carrying amount of the investment. When the company’s share of losses in an equity-accounted investment equals or exceeds its interest in the entity, including any other unsecured long-term receivables, the company does not recognise further losses, unless it has incurred obligations or made payments on behalf of the other entity. Unrealised gains on transactions between the company and its subsidiaries are eliminated in full. Unrealised gains on transactions between the company and its associates are eliminated to the extent of the group’s interest in these entities. Business combinations under common control are accounted for at carrying values using predeces-sor accounting i.e. pooling of interest when the entity acquired has been under control of another member of the same group company before the acquisition. A difference between the carrying value and the consideration paid are recognised directly in equity.

A.P. MØLLER HOLDING A/S ANNUAL REPORT 2019 · REPORTS
114
REPORTS
A.P. MØLLER HOLDING A/S ANNUAL REPORT 2019 · REPORTS

A.P. MØLLER HOLDING A/S ANNUAL REPORT 2019 · REPORTS
115
A.P. MØLLER HOLDING A/S ANNUAL REPORT 2019 · REPORTS

A.P. MØLLER HOLDING A/S ANNUAL REPORT 2019 · REPORTS
116

A.P. MØLLER HOLDING A/S ANNUAL REPORT 2019 · REPORTS
117
The Board of Directors and the Executive Board have today considered and adopted the Annual Report of A.P. Møller Holding A/S for the financial year 1 January – 31 December 2019. The Consolidated Financial Statements have been prepared in accordance with International Finan-cial Reporting Standards as adopted by the EU and further requirements in the Danish Financial Statements Act, and the parent company Financial Statements have been prepared in accordance with the Danish Financial Statements Act. Management Review has been prepared in accordance with the Danish Financial Statements Act. In our opinion, the Consolidated Financial Statements and the parent company Financial State-ments give a true and fair view of the financial position at 31 December 2019 of the group and the parent company and of the results of the group and parent company operations and consolidated cash flows for the financial year 1 January - 31 December 2019. In our opinion, Management Review includes a true and fair account of the development in the op-erations and financial circumstances of the group and the parent company, of the results for the year and of the financial position of the group and the parent company, as well as a description of the most significant risks and elements of uncertainty facing the group and the parent company.
We recommend that the Annual Report be adopted at the Annual General Meeting. Copenhagen, 15 April 2020 Executive Board
Robert Mærsk Uggla CEO
Jan Thorsgaard Nielsen
Martin Nørkjær Larsen
Board of Directors
Ane Mærsk Mc-Kinney Uggla Chairman
Jan Leschly
Lars-Erik Brenøe
MANAGEMENT’S STATEMENT

A.P. MØLLER HOLDING A/S ANNUAL REPORT 2019 · REPORTS
118
OPINION In our opinion, the Consolidated Financial Statements give a true and fair view of the group’s financial position as of 31 December 2019 and of the results of the group’s operations and cash flows for the financial year 1 January to 31 December 2019 in accordance with International Finan-cial Reporting Standards as adopted by the EU and further requirements in the Danish Financial Statements Act. Moreover, in our opinion, the parent company Financial Statements give a true and fair view of the parent company’s financial position as of 31 December 2019 and of the results of the parent company’s operations for the financial year 1 January - 31 December 2019 in accordance with the Danish Financial Statements Act. We have audited the Consolidated Financial Statements and the parent company Financial Statements of A.P. Møller Holding A/S for the financial year 1 January - 31 December 2019, which comprise income statement, balance sheet, statement of changes in equity and notes, including a summary of significant accounting policies, for both the group and the parent company, as well as statement of comprehensive income and cash flow statement for the group (‘financial statements’). BASIS FOR OPINION We conducted our audit in accordance with International Standards on Auditing (ISAs) and the addi-tional requirements applicable in Denmark. Our responsibilities under those standards and
requirements are further described in the Auditor’s Responsibilities for the Audit of the Financial Statements section of our report. We are independent of the group in accordance with the Interna-tional Ethics Standards Board for Accountants’ Code of Ethics for Professional Accountants (IESBA Code) and the additional requirements applicable in Denmark, and we have fulfilled our other ethi-cal responsibilities in accordance with these requirements. We believe that the audit evidence we have obtained is sufficient and appropriate to provide a basis for our opinion. STATEMENT ON MANAGEMENT REVIEW Management is responsible for Management Review. Our opinion on the financial statements does not cover Management Review, and we do not express any form of assurance conclusion thereon. In connection with our audit of the financial statements, our responsibility is to read Management Review and, in doing so, consider whether Management Review is materially inconsistent with the financial statements or our knowledge obtained during the audit, or otherwise appears to be materi-ally misstated. Moreover, it is our responsibility to consider whether Management Review provides the information required under the Danish Financial Statements Act. Based on the work we have performed, in our view, Management Review is in accordance with the Consolidated Financial Statements and the parent company Financial Statements and has been prepared in accordance with the requirements of the Danish Financial Statements Act. We did not identify any material misstatement in Management Review. MANAGEMENT’S RESPONSIBILITIES FOR THE FINANCIAL STATEMENTS Management is responsible for the preparation of Consolidated Financial Statements that give a true and fair view in accordance with International Financial Reporting Standards as adopted by the EU and further requirements in the Danish Financial Statements Act and for the preparation of the parent company Financial Statements that give a true and fair view in accordance with the Dan-ish Financial Statements Act, and for such internal control as management determines is necessary to enable the preparation of financial statements that are free from material misstatement, whether due to fraud or error.
INDEPENDENT AUDITOR’S REPORT
To the shareholder of A.P. Møller Holding A/S

A.P. MØLLER HOLDING A/S ANNUAL REPORT 2019 · REPORTS
119
In preparing the financial statements, management is responsible for assessing the group’s and the parent company’s ability to continue as a going concern, disclosing, as applicable, matters related to going concern and using the going concern basis of accounting in preparing the financial state-ments unless management either intends to liquidate the group or the parent company or to cease operations, or has no realistic alternative but to do so. AUDITOR’S RESPONSIBILITIES FOR THE AUDIT OF THE FINANCIAL STATEMENTS Our objectives are to obtain reasonable assurance about whether the financial statements as a whole are free from material misstatement, whether due to fraud or error, and to issue an auditor’s report that includes our opinion. Reasonable assurance is a high level of assurance, but is not a guarantee that an audit conducted in accordance with ISAs and the additional requirements appli-cable in Denmark will always detect a material misstatement when it exists. Misstatements can arise from fraud or error and are considered material if, individually or in the aggregate, they could rea-sonably be expected to influence the economic decisions of users taken on the basis of these finan-cial statements. As part of an audit conducted in accordance with ISAs and the additional requirements applicable in Denmark, we exercise professional judgment and maintain professional scepticism throughout the audit. We also: • Identify and assess the risks of material misstatement of the financial statements, whether due
to fraud or error, design and perform audit procedures responsive to those risks, and obtain audit evidence that is sufficient and appropriate to provide a basis for our opinion. The risk of not detecting a material misstatement resulting from fraud is higher than for one resulting from error as fraud may involve collusion, forgery, intentional omissions, misrepresentations, or the override of internal control.
• Obtain an understanding of internal control relevant to the audit in order to design audit proce-dures that are appropriate in the circumstances, but not for the purpose of expressing an opin-ion on the effectiveness of the group’s and the parent company’s internal control.
• Evaluate the appropriateness of accounting policies used and the reasonableness of account-ing estimates and related disclosures made by management.
• Conclude on the appropriateness of management’s use of the going concern basis of account-ing in preparing the financial statements and, based on the audit evidence obtained, whether a material uncertainty exists related to events or conditions that may cast significant doubt on the group’s and the parent company’s ability to continue as a going concern. If we conclude that a material uncertainty exists, we are required to draw attention in our auditor’s report to the related disclosures in the financial statements or, if such disclosures are inadequate, to modify our opinion. Our conclusions are based on the audit evidence obtained up to the date of our auditor’s report. However, future events or conditions may cause the group and the parent com-pany to cease to continue as a going concern.
• Evaluate the overall presentation, structure and contents of the financial statements, including the disclosures, and whether the financial statements represent the underlying transactions and events in a manner that gives a true and fair view.
• Obtain sufficient appropriate audit evidence regarding the financial information of the entities or business activities within the group to express an opinion on the Consolidated Financial Statements. We are responsible for the direction, supervision and performance of the group audit. We remain solely responsible for our audit opinion.
We communicate with those charged with governance regarding, among other matters, the planned scope and timing of the audit and significant audit findings, including any significant defi-ciencies in internal control that we identify during our audit. Copenhagen, 15 April 2020 PricewaterhouseCoopers Statsautoriseret Revisionspartnerselskab CVR No 33 77 12 31 Mogens Nørgaard Mogensen State Authorised Public Accountant MNE-number 21404
Thomas Wraae Holm State Authorised Public Accountant MNE-number 30141

A.P. MØLLER HOLDING A/S ANNUAL REPORT 2019 · REPORTS
120
Photos P. 22: Maersk Drilling, P. 24 + 26: Maersk Tankers, P. 28: KK Wind Solutions, P. 30: Zute Lightfoot/Alamy Stock, P. 121: Ursula Bach, Adam Mørk/C.F. Møller, Adam Mørk/Henning Larsen Architects, Jasper Carlberg, Colourbox, Rasmus Hjortshøj

A.P. MØLLER HOLDING A/S ANNUAL REPORT 2019 · REPORTS
121
Examples of the Foundation’s recent donations
OWNED BY THE A.P. MOLLER FOUNDATION
The A.P. Moller Foundation was established by A.P. Møller, with the support of his children, in 1953 to safeguard the long-term viability of the Group and control by the Mærsk family. Over the years, the Foundation has donated proceeds to a number of social, cultural and educational projects.
The Copenhagen Common ‘Fælledparken’
(2012)
The Royal Danish Opera House
(2004)
Museum Tirpitz
(2017) Inderhavnen Bridge
(2016)
Maersk Tower
(2017)
Danish State School Donation
(2013-)

A.P. MØLLER HOLDING A/S ANNUAL REPORT 2019 · REPORTS
122