
Antibody-based detection of protein phosphorylation status to track the efficacy of novel therapies...
20
© 2014 Nature America, Inc. All rights reserved. PROTOCOL NATURE PROTOCOLS | VOL.10 NO.1 | 2015 | 149 INTRODUCTION Mapping cancer cell signaling pathways using finite clinical material can support new treatment development and further our understanding of cancer biology. The assessment of signal- ing cascades using conventional proteomic technologies often necessitates protein quantities in excess of that which is available, especially when considering human biopsy material or primitive stem cells derived from human or mouse sources. The development of protein cIEF coupled to antibody-based detection has proven to be both extremely sensitive and frugal in terms of demands on finite samples. The original work by O’Neill et al. 1 used a prototype cIEF system to demonstrate sensitivity down to 25 cells (human prostate cancer cell line LNCaP) for the detection of extracellular signal–related kinases 1 and 2 (ERK1 and ERK2) and their associated phosphorylated states. Different iterations of the technology have subsequently been used in a range of studies, starting with the Firefly instrument (Protein Simple, formerly Cell Biosciences) in which imatinib-induced changes in ERK1 and ERK2 activation status were assessed in human CML cells isolated from total blood, whereas a range of phosphorylation changes in proteins including STAT3 and STAT5 were defined for the K562 CML cell line 2 . Next-generation systems (NanoPro 1000, formerly CB1000) have been used to study proteins including AKT, 4EBP1, MET, PTPRC/CD45 and CrkL in a number of leukemias, using different primary cell types including mouse CD138 + cells isolated from bone marrow, human CD34-selected acute myeloid leukemia (AML) cells, CML-derived CD34 + cells and dendritic cells (DCs) 3–6 . Many malignant diseases are understood to have an under- lying stem cell population 7–9 , which this technology is capable of probing. For myeloproliferative neoplasms and leukemias, this stem cell population has been associated with deregu- lated protein tyrosine kinase (PTK) activity (for a review, see Mitelman et al. 10 ), including FMS-like tyrosine kinase 3 (FLT3) in AML 11 , Janus kinase 2 (JAK2) in erythroid neoplasia 12 and BCR-ABL in CML 13,14 . TKI therapy using imatinib mesylate (IM) has been shown to inhibit PTK activity in CML 15–18 . The use of TKIs has improved clinical outcomes markedly for the majority of patients with chronic-phase CML who achieve sus- tained cytogenetic and molecular response 19,20 . Nevertheless, second- and third-generation TKIs have been developed in response to BCR-ABL mutations inferring resistance to treatment (for a review, see O’Hare et al. 21 ). Despite continued TKI therapy in CML patients, the minimal effect of TKIs on primitive CML hemopoietic cells results in the persistence of minimal residual disease, which causes disease relapse upon drug withdrawal 22–27 . Given that CML is a stem cell–driven disease, any new potentially curative therapies must be tested on primary stem cells, which are only available in finite quantities. Thus, methods to screen drug action on suitably limited stem cell populations are of great interest to the scientific community. Comparison with other methods Early comparisons of the effect of novel compounds or drugs on very limited numbers of patient stem cells would be of great value to clinicians, both for stratifying treatment response and for devising new therapeutic or curative strategies. Defining these effects in terms of cellular signaling requires the identi- fication of proteins and their state of activation in response to post-translational modifications (PTMs) such as phosphoryla- tion. Numerous approaches can be taken to characterize the pro- tein state in biological samples, which either use targeted mass spectrometry (MS) or indirect analysis using antibody-based techniques. MS methods such as selected reaction monitoring (SRM) 28 , also known as multiple reaction monitoring (MRM), Antibody-based detection of protein phosphorylation status to track the efficacy of novel therapies using nanogram protein quantities from stem cells and cell lines Mark Aspinall-O’Dea 1 , Andrew Pierce 1 , Francesca Pellicano 2 , Andrew J Williamson 1 , Mary T Scott 2 , Michael J Walker 1 , Tessa L Holyoake 2 & Anthony D Whetton 1 1 Stem Cell and Leukaemia Proteomics Laboratory, Manchester Academic Health Science Centre, The University of Manchester, Manchester, UK. 2 Paul O’Gorman Leukaemia Research Centre, Institute of Cancer Sciences, University of Glasgow, Glasgow, UK. Correspondence should be addressed to A.D.W. ([email protected]). Published online 18 December 2014; doi:10.1038/nprot.2015.007 This protocol describes a highly reproducible antibody-based method that provides protein level and phosphorylation status information from nanogram quantities of protein cell lysate. Nanocapillary isoelectric focusing (cIEF) combines with UV-activated linking chemistry to detect changes in phosphorylation status. As an example application, we describe how to detect changes in response to tyrosine kinase inhibitors (TKIs) in the phosphorylation status of the adaptor protein CrkL, a major substrate of the oncogenic tyrosine kinase BCR-ABL in chronic myeloid leukemia (CML), using highly enriched CML stem cells and mature cell populations in vitro. This protocol provides a 2.5 pg/nl limit of protein detection (<0.2% of a stem cell sample containing <10 4 cells). Additional assays are described for phosphorylated tyrosine 207 (pTyr207)-CrkL and the protein tyrosine phosphatase PTPRC/CD45; these assays were developed using this protocol and applied to CML patient samples. This method is of high throughput, and it can act as a screen for in vitro cancer stem cell response to drugs and novel agents.
Transcript of Antibody-based detection of protein phosphorylation status to track the efficacy of novel therapies...
©20
14 N
atu
re A
mer
ica,
Inc.
All
rig
hts
res
erve
d.
protocol
nature protocols | VOL.10 NO.1 | 2015 | 149
IntroDuctIonMapping cancer cell signaling pathways using finite clinical material can support new treatment development and further our understanding of cancer biology. The assessment of signaling cascades using conventional proteomic technologies often necessitates protein quantities in excess of that which is available, especially when considering human biopsy material or primitive stem cells derived from human or mouse sources.
The development of protein cIEF coupled to antibodybased detection has proven to be both extremely sensitive and frugal in terms of demands on finite samples. The original work by O’Neill et al.1 used a prototype cIEF system to demonstrate sensitivity down to 25 cells (human prostate cancer cell line LNCaP) for the detection of extracellular signal–related kinases 1 and 2 (ERK1 and ERK2) and their associated phosphorylated states. Different iterations of the technology have subsequently been used in a range of studies, starting with the Firefly instrument (Protein Simple, formerly Cell Biosciences) in which imatinibinduced changes in ERK1 and ERK2 activation status were assessed in human CML cells isolated from total blood, whereas a range of phosphorylation changes in proteins including STAT3 and STAT5 were defined for the K562 CML cell line2. Nextgeneration systems (NanoPro 1000, formerly CB1000) have been used to study proteins including AKT, 4EBP1, MET, PTPRC/CD45 and CrkL in a number of leukemias, using different primary cell types including mouse CD138+ cells isolated from bone marrow, human CD34selected acute myeloid leukemia (AML) cells, CMLderived CD34+ cells and dendritic cells (DCs)3–6.
Many malignant diseases are understood to have an underlying stem cell population7–9, which this technology is capable of probing. For myeloproliferative neoplasms and leukemias, this stem cell population has been associated with deregulated protein tyrosine kinase (PTK) activity (for a review,
see Mitelman et al.10), including FMSlike tyrosine kinase 3 (FLT3) in AML11, Janus kinase 2 (JAK2) in erythroid neoplasia12 and BCRABL in CML13,14. TKI therapy using imatinib mesylate (IM) has been shown to inhibit PTK activity in CML15–18. The use of TKIs has improved clinical outcomes markedly for the majority of patients with chronicphase CML who achieve sustained cytogenetic and molecular response19,20. Nevertheless, second and thirdgeneration TKIs have been developed in response to BCRABL mutations inferring resistance to treatment (for a review, see O’Hare et al.21). Despite continued TKI therapy in CML patients, the minimal effect of TKIs on primitive CML hemopoietic cells results in the persistence of minimal residual disease, which causes disease relapse upon drug withdrawal22–27. Given that CML is a stem cell–driven disease, any new potentially curative therapies must be tested on primary stem cells, which are only available in finite quantities. Thus, methods to screen drug action on suitably limited stem cell populations are of great interest to the scientific community.
Comparison with other methodsEarly comparisons of the effect of novel compounds or drugs on very limited numbers of patient stem cells would be of great value to clinicians, both for stratifying treatment response and for devising new therapeutic or curative strategies. Defining these effects in terms of cellular signaling requires the identification of proteins and their state of activation in response to posttranslational modifications (PTMs) such as phosphorylation. Numerous approaches can be taken to characterize the protein state in biological samples, which either use targeted mass spectrometry (MS) or indirect analysis using antibodybased techniques. MS methods such as selected reaction monitoring (SRM)28, also known as multiple reaction monitoring (MRM),
Antibody-based detection of protein phosphorylation status to track the efficacy of novel therapies using nanogram protein quantities from stem cells and cell linesMark Aspinall-O’Dea1, Andrew Pierce1, Francesca Pellicano2, Andrew J Williamson1, Mary T Scott2, Michael J Walker1, Tessa L Holyoake2 & Anthony D Whetton1
1Stem Cell and Leukaemia Proteomics Laboratory, Manchester Academic Health Science Centre, The University of Manchester, Manchester, UK. 2Paul O’Gorman Leukaemia Research Centre, Institute of Cancer Sciences, University of Glasgow, Glasgow, UK. Correspondence should be addressed to A.D.W. ([email protected]).
Published online 18 December 2014; doi:10.1038/nprot.2015.007
this protocol describes a highly reproducible antibody-based method that provides protein level and phosphorylation status information from nanogram quantities of protein cell lysate. nanocapillary isoelectric focusing (cIeF) combines with uV-activated linking chemistry to detect changes in phosphorylation status. as an example application, we describe how to detect changes in response to tyrosine kinase inhibitors (tKIs) in the phosphorylation status of the adaptor protein crkl, a major substrate of the oncogenic tyrosine kinase Bcr-aBl in chronic myeloid leukemia (cMl), using highly enriched cMl stem cells and mature cell populations in vitro. this protocol provides a 2.5 pg/nl limit of protein detection (<0.2% of a stem cell sample containing <104 cells). additional assays are described for phosphorylated tyrosine 207 (ptyr207)-crkl and the protein tyrosine phosphatase ptprc/cD45; these assays were developed using this protocol and applied to cMl patient samples. this method is of high throughput, and it can act as a screen for in vitro cancer stem cell response to drugs and novel agents.
©20
14 N
atu
re A
mer
ica,
Inc.
All
rig
hts
res
erve
d.
protocol
150 | VOL.10 NO.1 | 2015 | nature protocols
are highly sensitive and capable of quantitatively detecting attomolar concentrations of protein in complex biological samples (for a review, see Hjelle et al.29). Antibodybased techniques, which can detect down to femtomolar protein concentrations, include western blotting, ELISA, reversephase protein arrays and flow cytometry, as well as the cIEF assay described here.
In CML peripheral blood cells, CrkL, a protein phosphorylated on tyrosine 207 via BCRABL action30, is an essential adaptor protein for p210BCRABLinduced leukemogenic transformation31, and it has been used as a marker for BCRABL status and TKI activity32,33. Direct assay of primitive cells in the CML clone is technically challenging, thus limiting our understanding of the leukemic stem cell response to targeted therapies. The SRM approach can be applied to the measurement of PTM, although this can be very challenging depending on the site of the modification and the concentration of the modified isoform of the protein. SRM has been used to monitor the phosphorylation of ERK1 from mouse vascular smooth muscle tissue; however, to measure the PTMs, the starting amount of material was 400 µg and immunoprecipitation was required to enrich the protein before analysis34. This requirement would reduce the utility of an SRM assay for highthroughput analysis, whereas the required starting material could be challenging when dealing with scarce primitive stem cells.
Western blot studies have previously been used to detect BCRABL expression status; however, the instability of the oncogenic tyrosine kinase upon cellular lysis leads to inaccuracies when estimating oncogenic activity35,36. In contrast, detection of activated CrkL by western blotting provides an indirect method of determining BCRABL inhibition in response to TKI treatment32. However, this approach is of low throughput, with limited scope for multiplexed sample analysis, and, owing to the requirement for bulk CD34+ cells, it is of little use for the analysis of more primitive cells, specifically CD34+ cell subsets in this study.
Flow cytometry can detect activated CrkL in CML CD34+ cells17, with singlecell profiling used to explore signaling networks in a number of leukemic cell backgrounds (for a review, see Bendall and Nolan37). Multiplex signaling data can be acquired from as few as 1 × 10⁴ cells, meaning that multiple subsets of cells can be identified within a heterogeneous population38. Up to 15 distinct signaling events can be assayed simultaneously in live cells. Interference between fluorescent probes is an inherent issue with flow cytometry, which becomes more acute with an increasing number of assayed parameters in any one experiment (for a review, see Bendall et al.39). Nonspecific antibody interactions within the cell can also be problematic. ELISA represents an alternative to these approaches, and it has been used in previous studies to determine BCRABL activity in Philadelphiapositive cells40. ELISA is of high throughput and is capable of processing large sample numbers while using less material than a western blot assay, yet it uses considerably more than flow cytometry.
To enhance the limit of detection (LOD) for markers in stem cells, we used technology that combines cIEF with immunoassay on a new platform (NanoPro 1000; Protein Simple)1. This system has been developed on the basis of earlier work, which showed the potential for capillary isoelectric focusing to resolve proteins with high sensitivity while proving to be compatible with immunoassay and chemiluminescence detection (CID; for an overview, see O’Neill et al.1). Therefore, it is theoretically possible for the user
to undertake such studies without the NanoPro 1000; however, we have not undertaken an assessment of this option. Key advantages include the ability to handle nanoliter sample volumes with reproducible, highresolution detection of protein phosphorylation profiles simultaneously for multiple protein targets on extremely small quantities of human tissue. Multiplexed assay times are short, and they allow up to 96 assays to be processed in <18 h. Specifically, we have been able to demonstrate changes in CrkL phosphorylation status using 0.1% of available patient material (<104 cells per individual). From this sample, it would be possible to probe for up to 64 different protein targets simultaneously. This approach is not without limitations; novel protein targets would require assay development, which can be timeconsuming, and all potential assays are dependent upon antibody availability. In addition, cIEF immunoassay must be combined with alternative techniques such as flowbased cell sorting to probe different cell lineages (as described in this protocol). Nevertheless, the system is compatible with a wide range of tissue types, including plasma or serum, resected lung tissue, lung and endometrial biopsy material, sputum and cellular organelles. The ability of this platform to handle such a variety of biological samples enables it to be embedded into laboratory workflows that focus on biomarker validation in blood or biopsy samples, targeted protein PTM assessment in conjunction with MS approaches and signaling cascade mapping in defined primary cell populations.
Experimental designThis protocol defines how cIEF immunoassay can be applied to material from cell lines and the clinic. Specifically, the chronic myelogenous and acute promyelocytic leukemic cell lines K562 and HL60 have been used in Step 1A to develop an assay for the protein CrkL, which is sensitive enough to be applied to clinical material containing ≤5,000 cells (Step 1B). Although this cell line protocol has principally been used for the development of a stem cell–compatible assay here, the method described has been applied to a range of cell lines (i.e., mouse Ba/F3 cells, embryonic stem cells, A549 and HEK 293 human cell lines) and protein targets (for an uptodate list of developed assays, please refer to http://www.scalpl.org/) in our hands. This method is fully transferable, and it can be used to develop assays for any protein using mouse and human cell line material (other cell line sources will probably also be compatible; however, we cannot verify this).
Assay development involves a number of steps, each defining an important aspect of the final protocol for a given protein. It is important to note that the majority of these development steps are determined by the protein of interest; specifically, these relate to a protein’s basal isoelectric point (pI), associated isoelectric range (with increasing phosphorylation) and capillary immobilization chemistry. Acquisition of suitable antibodies for total and phosphorylated entities is essential. Those antibodies that have been shown to work with other immunoassays (i.e., western blot and immunohistochemistry) do not necessarily function well in the cIEF environment; however, we have had considerable success with antibodies developed as part of the Human Protein Atlas (http://www.proteinatlas.org/) program. Assay development should incorporate suitable controls including test for secondary antibody crossreaction with sample minus primary antibody (also test for streptavidin–horseradish peroxidase (HRP) crossreaction if using the threestep approach; see Step 2)
©20
14 N
atu
re A
mer
ica,
Inc.
All
rig
hts
res
erve
d.
protocol
nature protocols | VOL.10 NO.1 | 2015 | 151
together with λ phosphatase–treated samples (Steps 19–23) to confirm that protein observations are a result of phosphorylation as opposed to other PTMs. It is worth observing that this protocol is nondenaturing, with secondary and tertiary protein structure preserved after isoelectric focusing and immobilization. Consequently, knowledge of a protein’s folding structure can be useful when selecting antibodies for assay development, and a focus on antibodies raised to hydrophilic regions is advisable.
It is essential that the LOD for an assay be defined, specifically for those assays designed to probe finite numbers of stem cells. As a guide, a detection limit of ≥20 pg/nl total protein would not be suitable; typically, 2–8 pg/nl total protein is required to probe stem cells, especially when dealing with lowcopynumber proteins and proteins that undergo transient PTMs. Once developed, if an assay is compatible with lowcellnumber clinical samples, then it is possible to assess the signaling behavior of a given protein in human and mouse cells purified using flowbased sorting (Step 1B(i)). Issues surrounding high salt content of sample and cell loss during preparation are addressed in this protocol, allowing for the assessment of specific cell linage populations, pertinent in this case for CML therapy but equally applicable to other disease areas. In the majority of cases, the protein concentration of samples derived from clinical samples (i.e., resected lung tissue) is greatly in excess of the protein requirements for this platform, and the simple protocol used with cell lines can be applied (Step 1A). For samples with protein concentrations of <0.1 mg/ml, the dilution step can be omitted and the approach to sample preparation taken here for stem cells should be used (Step 5). When processing a large number of clinical samples, a number of controls should be applied, including triplicate sample loading, positive control (i.e., cell line; n = 1) and a clinical sample pool for intercycle and interexperiment referencing. In addition, during assay development, controls that assess secondary antibody and streptavidinHRP crossreaction with sample and primary antibodies must be used.
The cIEF immunoassay platform uses UVactivated linking chemistry (for details of chemistry used, see O’Neill et al.1), which immobilizes isoelectrically separated proteins to the capillary wall, allowing downstream immunoassay without the need for protein blocking steps. Previous work has shown that the pI of a protein shifts to more alkali values with the inhibition of phosphorylation1,41. Compass software (Protein Simple) is used for every aspect of an assay via three perspectives: ‘Assay’, ‘Run’ and ‘Analysis’. The assay perspective allows the user to design the assay plate and program the NanoPro 1000 system to process samples in a specific order using defined settings (e.g., antibody incubation or UV exposure), thus allowing flexibility when designing complex experiments. Once an assay has been started, the ‘Run’ perspective gives a realtime display of sample separation on capillary and provides the user with information relating to each stage of the experiment (e.g., sample loading, incubation times and estimated assay completion time). With data acquisition complete, the ‘Analysis’ perspective provides a range of tools to enable the user to analyze results from capillaries. Given the nature of this system, alternative software is not required, with the exception of total area under the curve (AUC) calculations, which require thirdparty software; specifically, we use MedCalc (MedCalc Software).
This technology offers a more sensitive method for assessing protein phosphorylation status when our workflow is used (Fig. 1). Specifically, when compared with the prototype systems used in earlier studies1,2 (Firefly, Protein Simple; formerly Cell Biosciences), the NanoPro 1000 has a number of mechanical enhancements including improved robotic zscheme mapping and liquid handling, a smaller form factor with improved camera and UV attributes. In addition, numerous iterative improvements have been made to consumables chemistry, such as the threestep secondarybiotin to streptavidinHRP detection kit, which can be used in place of conventional secondaryHRP antibody; XDR peroxide for improved chemiluminescence detection with lowcopynumber proteins; secondgeneration ampholyte premixes, including acidic pH nesting to prevent sample runoff during isoelectric separation; and a host of subtle changes to other consumable solutions.
Here we use a cIEF immunoassay to study the phosphorylation status of the CrkL adaptor protein in CD34+CD38+ and primitive CD34+CD38− CML cells. The primary tissue is isolated by flow cytometry using leukapheresis samples, followed by culture in growth factors and TKIs, as previously described42. A lowionicstrength buffer wash (20 mM bicine and 250 mM sucrose, pH 7.5) is used before lysis with zwitterionic detergent (20 mM bicine, pH 7.6, and 0.6% (wt/vol) CHAPS). Lysates are combined with cIEF reagents (see Steps 2–18) and loaded onto a multiwell plate. The separation gradients have been optimized for the CrkL assay, taking into account the small number of primary cells used in stem cell studies. After isoelectric separation, proteins are immobilized using a UVsensitive technique that links the proteins to the capillary wall at their native pI. The CrkL assay was developed using control cell lines to determine suitability for clinical sample analysis.
This protocol has been successfully used in two recently published studies involving finite quantities of CML patient material5,6. In one of these studies, Brown et al.6 focused on the defective function of BCRABLexpressing mature DCs derived from CML patient monocytes and found that dysregulation of ABL1 protein distribution in CMLDCs resulted in changes to CrkL (a substrate protein of ABL1), thereby altering the formation of complexes involved in the control of Factin responses. Specifically, CrkL displayed elevated levels of phosphorylation in CMLDCs when compared with normal DCs6. Here, we define and compare the proportional degree of phosphorylation for these two cell types, with particular emphasis on the ABL1target residue Tyr207 of CrkL, using both antiCrkL and antipTyr207CrkL antibodies. Analysis with antibodies that detect total protein produces a profile encompassing PTMs and isoform expression, which can induce changes in the pI of a protein. Antibodies that can detect specific events, such as phosphorylation, are required to further define a protein profile.
In the other study, proteomic analysis of signaling mediated by the chemokine CXCL12 in hematopoietic progenitor cells identified a novel phosphorylation site on the protein tyrosine phosphatase PTPRC/CD45 at residue Ser962. Phosphorylation at this site was shown to be upregulated in the presence of BCRABL in CD34+ cells derived from patients with CML when compared with control samples (from patients without CML), using cIEF with both commercially available and inhouse antibodies,
©20
14 N
atu
re A
mer
ica,
Inc.
All
rig
hts
res
erve
d.
protocol
152 | VOL.10 NO.1 | 2015 | nature protocols
respectively5. By using the fully optimized PTPRC/CD45 assay developed in our laboratory (for assay development data, see Supplementary Fig. 1), we validated the approach using clinical samples, specifically looking at novel signaling differences between more primitive CD34+CD38− CML cells that coenrich with stem cells and more mature CML CD34+CD38+ progenitor
populations, both in TKItreated samples and in untreated controls. The quantity of clinical starting material needed for this approach is substantially smaller than that required in previous studies using a cIEF platform1,2, and this technique also enables a more detailed analysis of protein phosphorylation than was possible with earlier technologies.
Tha
win
g
Chronic myeloid leukaemia sample
Leukapheresis
Cryogenic storage
Overnight culture
Unlabeled cells
Fluorescently Unlabeled cells
Laser detection
Flo
w c
ytom
etry
Sorted cells:Highly ionic PBS buffer
Wash in low ionic strengthbuffer
Zwitterionic detergent usedfor cell lysis in small volumes
Prim
ativ
e ce
llpr
oces
sing
& s
tora
ge
Patient to protein
Sys
tem
exp
erim
enta
l des
ign
Primary antibody
Secondary-biotin antibody
Tertiary streptavadin-HRP
Chemiluminescence
J
ABCD
Loading
pH
UV immobilization to capillary wall
Sample
Sep
arat
ion
Sep
arat
ion,
imm
obili
zatio
nan
d ex
posu
reRegistration standards
This allows for direct comparison betweencapillaries
Dat
a an
alys
is
Sam
ple
colle
ctio
n
Physiological growth factors and inhibitors(SCF; G-CSF; GM-CSF; IL-6; LIF; MIP-α)
Sample ×12
7 11 12108 95 64321Primative sample mixed 1:3 withampholyte/fluorescent ladder premixprior to loading
(Luminol:XDR-peroxide)
96 capillary system(min. 12 caps)
1–8 cycles/run
40 min
2 8Capillaries aligned using fluorescent
registration standards
5
4
3
2
1
0
5
4
3
2
1
04 6 8 10 4 6 8 10
Sample 1 Sample 2
Wash, probe and develop
10 min
5 min
384-well format
NanoPro 1000 preparation and analysis
CD34+ CD34+/38+
Pellet & wash
Cell sorting & collection
Pellet & lysis
Snap freeze & store at –80°C
96 Antibodies versus 12 samples96 Samples versus 1 antibody
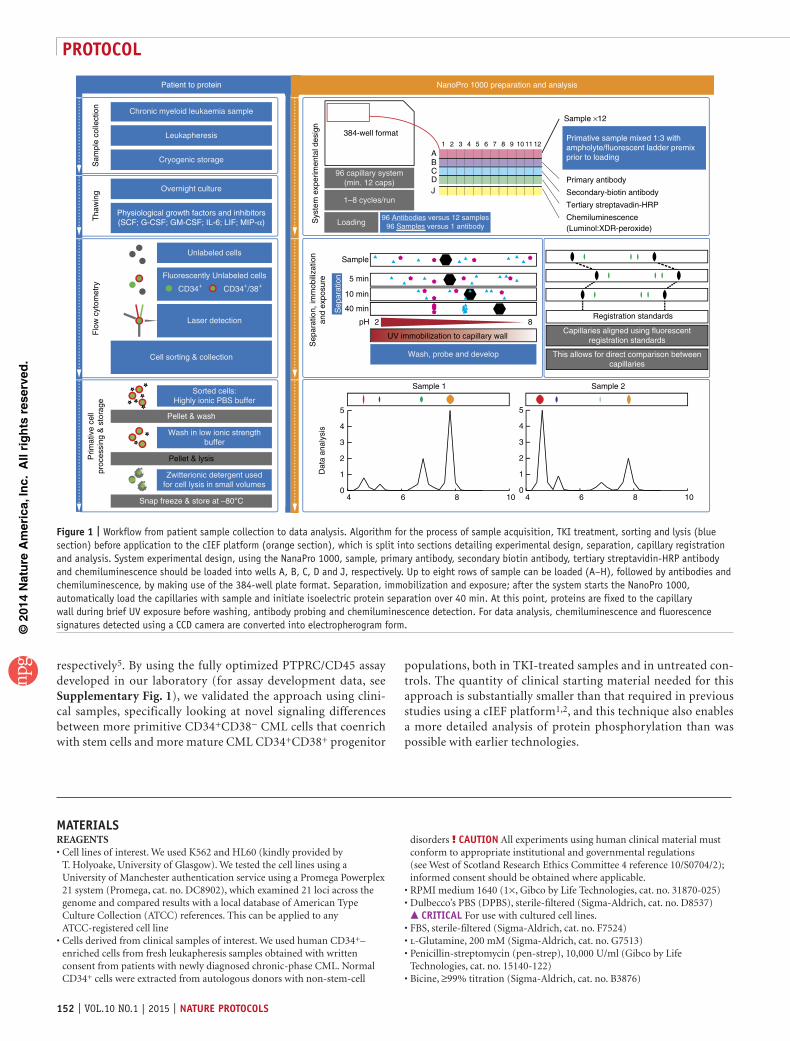
Figure 1 | Workflow from patient sample collection to data analysis. Algorithm for the process of sample acquisition, TKI treatment, sorting and lysis (blue section) before application to the cIEF platform (orange section), which is split into sections detailing experimental design, separation, capillary registration and analysis. System experimental design, using the NanaPro 1000, sample, primary antibody, secondary biotin antibody, tertiary streptavidin-HRP antibody and chemiluminescence should be loaded into wells A, B, C, D and J, respectively. Up to eight rows of sample can be loaded (A–H), followed by antibodies and chemiluminescence, by making use of the 384-well plate format. Separation, immobilization and exposure; after the system starts the NanoPro 1000, automatically load the capillaries with sample and initiate isoelectric protein separation over 40 min. At this point, proteins are fixed to the capillary wall during brief UV exposure before washing, antibody probing and chemiluminescence detection. For data analysis, chemiluminescence and fluorescence signatures detected using a CCD camera are converted into electropherogram form.
MaterIalsREAGENTS
Cell lines of interest. We used K562 and HL60 (kindly provided by T. Holyoake, University of Glasgow). We tested the cell lines using a University of Manchester authentication service using a Promega Powerplex 21 system (Promega, cat. no. DC8902), which examined 21 loci across the genome and compared results with a local database of American Type Culture Collection (ATCC) references. This can be applied to any ATCCregistered cell lineCells derived from clinical samples of interest. We used human CD34+– enriched cells from fresh leukapheresis samples obtained with written consent from patients with newly diagnosed chronicphase CML. Normal CD34+ cells were extracted from autologous donors with nonstemcell
•
•
disorders ! cautIon All experiments using human clinical material must conform to appropriate institutional and governmental regulations (see West of Scotland Research Ethics Committee 4 reference 10/S0704/2); informed consent should be obtained where applicable.RPMI medium 1640 (1×, Gibco by Life Technologies, cat. no. 31870025)Dulbecco’s PBS (DPBS), sterilefiltered (SigmaAldrich, cat. no. D8537) crItIcal For use with cultured cell lines.FBS, sterilefiltered (SigmaAldrich, cat. no. F7524)lGlutamine, 200 mM (SigmaAldrich, cat. no. G7513)Penicillinstreptomycin (penstrep), 10,000 U/ml (Gibco by Life Technologies, cat. no. 15140122)Bicine, ≥99% titration (SigmaAldrich, cat. no. B3876)
••
•••
•
©20
14 N
atu
re A
mer
ica,
Inc.
All
rig
hts
res
erve
d.
protocol
nature protocols | VOL.10 NO.1 | 2015 | 153
CHAPS (Sigma Life Science, cat. no. C9426)Protease inhibitor cocktail (SigmaAldrich, cat. no. P8340)Phosphatase inhibitor cocktail 2 (SigmaAldrich, cat. no. P5726)Phosphatase inhibitor cocktail 3 (SigmaAldrich, cat. no. P0044)Benzonase nuclease HC, 99% purity (MerckMillipore, cat. no. 71206)Sodium orthovanadate, 100 mM (SigmaAldrich, cat. no. S6508) ! cautIon Solution preparation involves boiling this reagent in the microwave, which carries a risk of burning.Sodium fluoride, 500 mM (SigmaAldrich, cat. no. S7920)Premix G2, 310 separation gradient (Protein Simple, cat. no. 040968) crItIcal Owing to the high viscosity of the premix solutions, it is essential that the user employ a reverse pipetting technique to accurately measure the required volume. Failure to do so can lead to inaccuracies in sample preparation and an inadequate amount of premix in the samples under analysis.Premix G2, 5–8 (nested) separation gradient (Protein Simple, cat. no. 040972) crItIcal Owing to the high viscosity of the premix solutions, it is essential that the user employ a reverse pipetting technique to accurately measure the required volume. Failure to do so can lead to inaccuracies in sample preparation and an inadequate amount of premix in the samples under analysis.DMSO inhibitor mix (Protein Simple, cat. no. 040510)Antibody diluent (Protein Simple, cat. no. 040309)pI standard ladder 3 (Protein Simple, cat. no. 040646)Wash concentrate (Protein Simple, cat. no. 041108)Peroxide XDR (Protein Simple, cat. no. 041084)Luminol (Protein Simple, cat. no. 040652)Anolyte solution, 0.1 M phosphoric acid (H3PO4; SigmaAldrich, cat. no. 438081)Catholyte solution, 0.1 M sodium hydroxide (NaOH; BDH, cat. no. 102524X)Type I ultrapure laboratory water, 18.2 MΩ cm (Elga Process Water) crItIcal Highpurity water is essential for interassay consistency.Amplified rabbit secondary antibody detection kit (Protein Simple, cat. no. 041126)AntiCrkL (C20) antibody (Santa Cruz, cat. no. sc319)Antiphospho CrkL (Tyr 207) antibody (Cell Signaling, cat. no. 3181S)AntiPTPRC/CD45 antibody (BD Transduction Laboratories, cat. no. 610266)AntipS962 PTPRC/CD45 antibody (Eurogentec, custom antibody)AntiAKT (1+2+3) antibody (Cell Signaling Technology, cat. no. 9272)Imatinib mesylate (IM), STI571 (Selleckchem, cat. no. S1026)Dasatinib, monohydrate (DAS; Santa Cruz, cat. no. sc21808)λ protein phosphatase, 20,000 U (Merck Millipore, cat. no. 14405)Trypan blue solution, 0.4% (wt/vol; SigmaAldrich, cat. no. T8154)BioRad protein assay dye reagent concentrate (BioRad, cat. no. 5000006)Albumin from bovine serum (SigmaAldrich, cat. no. A3059100G)ProtoFlowGel, 30% (wt/vol) acrylamide: 0.8% (wt/vol) Bisacrylamide (Flowgen Bioscience, cat. no. H16996)Trizma base (SigmaAldrich, cat. no. T1503)Glycine (SigmaAldrich, cat. no. G8898)Hydrochloric acid (HCl), 30% (vol/vol; BDH, cat. no. 262743N)SDS (BDH, cat. no. 442444H)Ammonium persulfate (SigmaAldrich, cat. no. A3678)N, N, N′, N′Tetramethylethylenediamine bioreagent (SigmaAldrich, cat. no. T7024)Bromophenol blue sodium salt (SigmaAldrich, cat. no. B7021)Glycerol (Fisher Scientific, cat. no. BP229)2Mercaptoethanol (SigmaAldrich, cat. no. M7154) crItIcal When used with Laemmli buffer, store the aliquots at −80 °C to avoid oxidization. Do not freezethaw.2Mercaptoethanol, 50 mM (Gibco by Life Technologies, cat. no. 31350101) crItIcal For use with primary cells.AnalR NORMAPUR methanol (VWR, cat. no. 20847.307)Ponceau S solution (SigmaAldrich, cat. no. P7170)Tween20 (SigmaAldrich, cat. no. P1379)Nonfat dried milk powder (SigmaAldrich, cat. no. M7409)SuperSignal West Pico chemiluminescent substrate (Thermo Scientific, cat. no. 34078)Acetic acid, ≥99.0% purity (SigmaAldrich, cat. no. 45740)Interleukin 6 (IL6), recombinant human (Life Technologies, cat. no. PHC0066)
••••••
••
•
•••••••
•
•
•
•••
•••••••••
••••••
•••
•
•••••
••
Granulocyte colonystimulating factor (GCSF), recombinant human (Life Technologies, cat. no. PHC2035)Granulocytemacrophage colonystimulating factor (GMCSF), recombinant human (Life Technologies, cat. no. PHC2015)Stem cell factor (SCF) CKit ligand, human recombinant (Life Technologies, cat. no. PHC2116)Leukemia inhibitory factor (LIF), recombinant human, 10 µg/ml (Merck Millipore, cat. no. LIF1010)Macrophage inflammatory protein1α (MIP1α), recombinant human (Life Technologies, cat. no. PHC1104)BIT (BSA/insulin/transferrin; Stem Cell Technologies, cat. no. 09500)Lowdensity lipoprotein, 10 mg/ml (SigmaAldrich, cat. no. L4646)Iscove’smodified Dulbecco’s medium (SigmaAldrich, cat. no. I3390)DNase I, ~2,500 U/vial (Stem Cell Technologies, cat. no. 07900)Magnesium chloride (MgCl2; 1 M; SigmaAldrich, cat. no. M8266)Trisodium citrate (SigmaAldrich, cat. no. S1804)Albunorm, 20%, 200 g/l (Octapharma) crItIcal Store it at room temperature (RT; 21 °C) before use.Dulbecco’s PBS, Mg2+/Ca+ free (Gibco by Life Technologies, cat. no. 14190169) crItIcal For use with primary cells.Antihuman CD34APC (Becton Dickinson, cat. no. 555824; ref. 42)Antihuman CD38FITC (Becton Dickinson, cat. no. 555821; ref. 42)DMSO, ACS spectrophotometric grade, ≥99.9% (SigmaAldrich, cat. no. 154938)Rely+On Virkon powder (DuPont)
EQUIPMENTFACSAria cell sorting system (Becton Dickinson)Capillariescharge separation for Peggy/NanoPro 1000 (Protein Simple, cat. no. CBS700) crItIcal Capillaries are light and moisturesensitive; they should be stored in a dark dry place at RT.Sponge pack for Peggy/NanoPro 1000 (Protein Simple, cat. no. 041528)NanoPro 1000 simple western chargebased assay system (Protein Simple)Compass software, version 1.8.2 (Protein Simple). This software is used to set up, run and analyze data generated using the Peggy systemMedCalc, version 13.3.3 (MedCalc Software). This software is used to calculate total AUC values for data generated by CompassPurelab Ultra laboratory water purification system (Elga Process Water)Eppendorf SafeLock tubes, 0.5 ml (Eppendorf, cat. no. 0030121023)Eppendorf SafeLock tubes, 1.5 ml (Eppendorf, cat. no. 0030120086)Plastic tips for P10, P200 and P1000 pipettesTerumo 60 cc Luerlock tip syringe without needle, graduation 1 cc, 60 cc total (Terumo Medical Products, cat. no. SS60L)Millex syringe filter unit, sterile, 25mm diameter, 0.2µm pore size (Merck Millipore, cat. no. SLFG025LS)Microcentrifuge, 5415D (Eppendorf)Centrifuge, SL16R (Thermo Scientific)Vortex PV1 (GrantBio)Microscope, DMIL (Leica)Water bath (Grant Instruments)Corning flask, 25cm2 cell culture flask, angled neck, 0.2µm vented cap (Corning, cat. no. 3056)Corning flask, 75cm2 cell culture flask, canted neck, 0.2µm vented cap (Corning, cat. no. 430641)Adam automatic cell counter (NanoEnTek, cat. no. ADAMMC)Adam AccuChip4X kit (NanoEnTek, cat. no. AD4K200)Double Cell Neubauer hemocytometer counting chamber, 0.1 mm, 1/400 mm2 (Hawksley, cat. no. AC2000)Hemocytometer cover glass, 20 mm × 26 mm (Fisher Scientific, cat. no. 12352168)Finnpipette Novus 10–100 µl singlechannel electronic pipette (Thermo Scientific, cat. no. 4620040)Pipette controller (Starlab, cat. no. E48660021)Costar 5ml Stripette (Corning, cat. no. 4487)Costar 10ml Stripette (Corning, cat. no. 4488)Costar 25ml Stripette (Corning, cat. no. 4489)SafeFlow 1.2 microbiological safety cabinet, class IIB3 (BioAir Instruments, IT)Heracell 240i CO2 incubator (Thermo Scientific, cat. no. 51026331)Corning CentriStar 15ml centrifuge tube (Corning, cat. no. 430791)Corning CentriStar 50ml centrifuge tube (Corning, cat. no. 430829)Microtiter plate, 96well/flat bottom, nonsterile (Sterilin, cat. no. 611F96)Multiskan Ascent plate reader (Lab Systems)
•
•
•
•
•
•••••••
•
•••
•
••
•••
•
•••••
•
••••••
•
•••
•
•
•••••
•••••
©20
14 N
atu
re A
mer
ica,
Inc.
All
rig
hts
res
erve
d.
protocol
154 | VOL.10 NO.1 | 2015 | nature protocols
Amersham Hybond enhanced chemiluminescence (ECL) nitrocellulose blotting membrane (GE Healthcare Life Sciences, cat. no. RPD203D)Hoefer power pack (EPS2A/200)Stuart magnetic stirrer (UC151)Spinbar magnetic stirring fleas (SigmaAldrich)Sterile Duran laboratory bottles 100, 500 and 1,000ml sizespH meter (MP220) with an Inlab Expert Pro pH probe (Metter Toledo)Stuart roller mixer (SRT2)MiniPROTEAN Tetra Cell (BioRad, cat. no. 1658001)Chemidoc XRS system (BioRad)Quantity One 1D analysis software, version 4.6.0 (BioRad)
REAGENT SETUPBicine/CHAPS buffer and sample diluent (20 mM bicine and 0.6% (wt/vol) CHAPS; pH 7.6) Prepare a solution containing 326 mg of bicine and 600 µl of CHAPS, and adjust the final volume to 100 ml with Purelab ultrapure water. Adjust the pH to 7.6 using a magnetic stirrer and a pH meter. Store the buffer at 4 °C for up to 2 months.Bicine/CHAPS lysis buffer For 1 ml of buffer, combine 957 µl of bicine/CHAPS buffer, 3 µl of benzonase nuclease, 10 µl of protease inhibitor cocktail, 10 µl of phosphatase inhibitor cocktail 2, 10 µl of phosphatase inhibitor cocktail 3, 10 µl of 100 mM sodium orthovanadate and 1 µl of 500 mM sodium fluoride. When lysing cell lines, 50 µl of buffer is required for every 1 × 10⁶ cells. Primary cells will require <10 µl for every 1 × 10⁶ cells, and the user should be cautious not to overdilute the lysate by using too large a volume of lysis buffer. Add the 10 µl of lysis buffer 2 µl at a time until the primary cell pellet begins to dissolve. Make lysis buffer just before use, and keep it on ice for a maximum of 2 h.Sample diluent/DMSO inhibitor mix solution (SSD) Mix 10 µl of DMSO inhibitor mix with 490 µl of sample diluent. Vortex the solution and store it at 4 °C for up to 6 months.Anolyte solution (0.1 M H3PO4) Take 6.9 ml of H3PO4 and bring the final volume to 1 liter with Purelab ultrapure water. Check the pH with pHydrion instacheck paper. Store the solution at 4 °C for up to 6 months. ! cautIon Take care when decanting H3PO4, as it is very corrosive. Ensure that correct personal protective equipment is used, and decant using a pipette controller.Catholyte solution (0.1 M NaOH) Dissolve 4 g of NaOH pellets and bring the final volume to 1 liter with Purelab ultrapure water. Check the pH with pHydrion instacheck paper. Store the solution at 4 °C for up to 6 months.Tris-HCl resolving solution (1.5 M, pH 8.8) Dissolve 18.2 g of Trizma base in 30 ml of Purelab ultrapure water, and set the pH with HCl using a pH meter and a magnetic stirrer. Adjust the final volume to 100 ml and store it at RT for up to 6 months.Tris-HCl stacking solution (0.5 M, pH 6.8) Dissolve 6.1 g of Trizma in 30 ml of Purelab ultrapure water, and set the pH with HCl using a pH meter and a magnetic stirrer. Adjust the volume to 100 ml and store it at RT for up to 6 months.SDS stock solution Dissolve 10 g of SDS in 50 ml of Purelab ultrapure water using a magnetic stirrer. Bring the volume to 100 ml and store it at RT for up to 2 months. ! cautIon This solution is toxic if inhaled; dispense the detergent in a fume hood.Ammonium persulfate solution Mix 500 mg of ammonium sulfate in 4.5 ml of Purelab ultrapure water and vortex the mixture to dissolve the contents. Freshly prepare the solution before use.Bromophenol blue stock solution (1%, wt/vol) Dissolve 100 mg of bromophenol blue sodium salt into 2 ml of Purelab ultrapure water and vortex to mix. Adjust the final volume to 10 ml and store it at RT for up to 6 months.Reservoir buffer stock solution (25 mM Tris and 142 mM glycine) Make 10× stock solution by adding 30.33 g of Trizma to 144 g of glycine, and bring the volume up to 500 ml with Purelab ultrapure water until it is dissolved. Adjust the final volume to 1,000 ml. Store the solution at RT for up to 6 months.Reservoir buffer/SDS (wt/vol) 0.05% solution Take 100 ml of reservoir buffer stock solution, add 1 ml of SDS stock solution and bring the volume to 1,000 ml with Purelab ultrapure water. Freshly prepare the buffer before use.Western transfer buffer Dilute 90 ml of reservoir buffer stock solution at a 1:10 ratio with Purelab ultrapure water (add 100 ml of methanol for use with proteins of <40 kDa). Freshly prepare the buffer before use.
•
•••••••••
Laemmli stock sample buffer 5× (60 mM Tris-HCl, pH 6.8; 2% (wt/vol) SDS; 10% (vol/vol) glycerol; 5% (vol/vol) 2-mercaptoethanol; and 0.01% (wt/vol) bromophenol blue) Mix 4 ml of 1.5 M TrisHCl stacking solution, 10 ml of glycerol, 5 ml of 2mercaptoethanol and 1 ml of bromophenol blue stock solution. Vortex until fully mixed, and then divide the solution into aliquots of suitable volumes. Store the aliquots at −20 °C for up to 1 year.PBS-Tween solution Add 2.5 ml of Tween20 to 500 ml of DPBS solution and mix it using a magnetic stirrer. Store the solution at RT for up to 3 months.Nonfat dried milk (NFDM) solution, 5% (wt/vol) This solution is used for membrane blocking and secondary antibody incubation. Mix 2.5 g of NFDM in 25 ml of PBSTween solution using a magnetic stirrer. Adjust the final volume to 50 ml. Store the solution at 4 °C for up to 3 d.NFDM solution, 1% (wt/vol) This solution is used for primary antibody incubation. Mix 0.5 g of NFDM in 25 ml of PBSTween solution using a magnetic stirrer. Adjust the final volume to 50 ml. Store the solution at 4 °C for up to 3 d.ECL solution Combine SuperSignal West Pico chemiluminescent substrates A and B in a 1:1 volume to make a final volume of 2 ml. Use the solution immediately.Acetic acid (100 mM) solution Dilute 5.75 µl of acetic acid (>99.0%) to 1 ml with Purelab ultrapure water and store it at RT for up to 6 months. Filtersterilize the solution using a 0.2µm sterile filter before use.PBS/Tween (0.02%, vol/vol) solution Dilute 200 µl of Tween20 in 99.8 ml of DPBS. Filtersterilize the solution using a 0.2µm sterile filter before use. Store the solution at RT for up to 5 d.MgCl2 (1 M) stock Dissolve 952.1 mg of MgCl2 in 5 ml of Purelab ultrapure water using a magnetic stirrer. Adjust the final volume to 10 ml. Filter sterilize the solution using a 0.2µm sterile filter before use. Store it at 4 °C for up to 6 months.Trisodium citrate, 0.155 M Dissolve 45.59 g in 500 ml of Purelab ultrapure water using a magnetic stirrer. Adjust the final volume to 1,000 ml. Filtersterilize the solution using a 0.2µm sterile filter before use. Store the solution at 4 °C for up to 6 months.Base serum-free medium (SFM) Make the medium in a sterile Duran bottle in a Class II hood. For a 125ml stock, combine 97.25 ml of Iscove’smodified Dulbecco’s medium, 25 ml of BIT, 1.25 ml of 200 mM lglutamine, 1.25 ml of 10,000U/ml penstrep, 250 µl of 50 mM 2mercaptoethanol and 500 µl of 10 mg/ml lowdensity lipoprotein while mixing the solution with a magnetic stirrer. Filtersterilize the solution using a 0.2µm sterile filter before storage at 4 °C for up to 1 week.SFM plus growth factors The growth factors are prepared at the following concentrations: SCF, 0.2 ng/ml; GCSF, 1 ng/ml; GMCSF, 0.2 ng/ml; IL6, 1 ng/ml; LIF, 0.05 ng/ml; and MIP1α, 0.2 ng/ml. Once the growth factors are prepared, store them at 4 °C and use them within 2 weeks.IL-6 stock IL6 is supplied as a 25µg lyophilized, carrierfree powder. To regain full activity, IL6 requires reconstitution in 250 µl of 100 mM acetic acid to a concentration of 0.1 mg/ml. Make 20µl aliquots and store them at −20 °C until needed. For a working concentration, freshly prepare the stock. Dilute the stock at a 1:20 ratio with DPBS to a concentration of 0.005 mg/ml. Use 2 µl/10 ml of SFM to give a final concentration of 1 ng/ml. crItIcal Prepare the reagent under sterile conditions using a Class II microbiological safety cabinet. Do not store it in a frostfree freezer.G-CSF stock GCSF is supplied as a 25µg lyophilized, carrierfree powder. To regain full activity, GCSF requires reconstitution in 250 µl of Purelab ultrapure water to a concentration of 0.1 mg/ml. Make 20µl aliquots and store them at −20 °C until needed. For a working concentration, freshly prepare the stock. Dilute the stock at a 1:50 ratio with DPBS to a concentration of 0.002 mg/ml. Use 5 µl/10 ml of SFM to give a final concentration of 1 ng/ml. crItIcal Prepare the reagent under sterile conditions using a Class II microbiological safety cabinet. Do not store it in a frostfree freezer.GM-CSF stock GMCSF is supplied as a 10µg lyophilized, carrierfree powder. To regain full activity, GMCSF requires reconstitution in 100 µl of Purelab ultrapure water to a concentration of 0.1 mg/ml. Make 10µl aliquots and store them at −20 °C until needed. For a working concentration, freshly prepare the stock. Dilute the stock at a 1:1,000 ratio with DPBS to a concentration of 0.0001 mg/ml. Use 20 µl/10 ml of SFM to give a final
©20
14 N
atu
re A
mer
ica,
Inc.
All
rig
hts
res
erve
d.
protocol
nature protocols | VOL.10 NO.1 | 2015 | 155
concentration of 0.2 ng/ml. crItIcal Prepare the reagent under sterile conditions using a Class II microbiological safety cabinet. Do not store it in a frostfree freezer.SCF stock SCF is supplied as a 25µg lyophilized, carrierfree powder. To regain full activity, SCF requires reconstitution in 250 µl of Purelab ultrapure water to a concentration of 0.1 mg/ml. Make 20µl aliquots and store them at −20 °C until needed. For a working concentration, freshly prepare the stock. Dilute the stock at a 1:200 ratio with DPBS to a concentration of 0.0005 mg/ml. Use 4 µl/10 ml of SFM to give a final concentration of 0.2 ng/ml. crItIcal Prepare the reagent under sterile conditions using a Class II microbiological safety cabinet. Do not store it in a frostfree freezer.MIP-1a stock MIP1α is supplied as a 10µg lyophilized, carrierfree powder. To regain full activity, MIP1α requires reconstitution in 100 µl of Purelab ultrapure water to a concentration of 0.1 mg/ml. Make 10µl aliquots and store them at −20 °C until needed. Prepare the stock under sterile conditions using a Class II microbiological safety cabinet. For a working concentration, freshly prepare the stock. Dilute the stock at a 1:1,000 ratio with DPBS to a concentration of 0.0001 mg/ml. Use 20 µl/10 ml of SFM to give a final concentration of 0.2 ng/ml. crItIcal Prepare the reagent under sterile conditions using a Class II microbiological safety cabinet. Do not store it in a frostfree freezer.LIF stock LIF is supplied as a 10 µg/ml solution. Dilute the stock at a 1:100 ratio in DPBS/Tween solution to a final concentration of 0.1 µg/ml. Prepare the stock under sterile conditions using a Class II microbiological safety cabinet. Store the stock at 4 °C for up to 1 month.Physiological low-growth factor cocktail (PGF) To 10 ml of SFM medium, add working concentrations of growth factors SCF, GCSF, GMCSF, IL6, LIF and MIP1α (as detailed in the associated text for each stock solution). Prepare the cocktail under sterile conditions using a Class II microbiological safety cabinet. Once the reagent is prepared, store it at 4 °C and use it within 2 weeks.DAMP solution From stock solutions, combine 2 ml of DNase I, 1.25 ml of MgCl2, 53 ml of trisodium citrate and 25 ml of Albunorm (20%), and
adjust the volume to 500 ml with DPBS. Prepare the solution under sterile conditions using a Class II microbiological safety cabinet. Store the solution in 50ml aliquots at 4 °C for up to 6 months. Warm the solution to 37.5 °C before use.IM stock solution, 10 mM Imatinib is supplied as a 100mg lyophilized powder. Prepare the solution under sterile conditions using a Class II microbiological safety cabinet. Dissolve the solution in 900 µl of DMSO by vortexing, giving a bulk stock concentration of 169.58 mM, which should be stored at −20 °C until needed. Take 58.97 µl of this solution and dilute it to 1 ml with DPBS (giving 10 mM stock). Divide the solution into aliquots and store them at −20 °C. For a final concentration of 5 µM, use 5 µl of 10 mM stock for every 10 ml of cultured cells (2 × 10⁵ cells per milliliter).Dasatinib (DAS) stock solution (150 µM) Dasatinib is supplied as a 10mg lyophilized powder. Prepare the solution under sterile conditions using a Class II microbiological safety cabinet. Dissolve the solution in 5 ml of DMSO by vortexing, adjust the final bulk stock volume to 10 ml (1.976 mM) and store it at −20 °C until needed. Take 75.9 µl of solution and dilute it to 1 ml with DPBS (giving 150 µM stock). Divide the solution into aliquots and store them at −20 °C. For a final concentration of 150 nM, use 10 µl of 150 µM stock for every 10 ml of cultured cells (2 × 10⁵ cells per milliliter).RPMI base medium (10% (vol/vol) FBS; 20 mM l-glutamine and 36 U/ml pen-strep) To 500 ml of RPMI 1640 medium, add 50 ml of FBS, 2 ml of penstrep (10,000 U/ml) and 5 ml of 200 mM lglutamine. Prepare the medium under sterile conditions using a Class II microbiological safety cabinet. Store the medium at 4 °C for up to 2 weeks. Warm the medium to 37.5 °C before use.K562 and HL60 cells Store K562 and HL60 cells in liquid nitrogen in 1 ml of 90% (vol/vol) FBS and 10% (vol/vol) DMSO at densities of 3 × 10⁶ and 5 × 10⁶ per ampule, respectively.Rely+On Virkon solution (1%, wt/vol) With 10 g of Virkon powder, adjust the volume to 1 liter using lukewarm water in a fume hood. Store the solution at RT for up to 6 months.
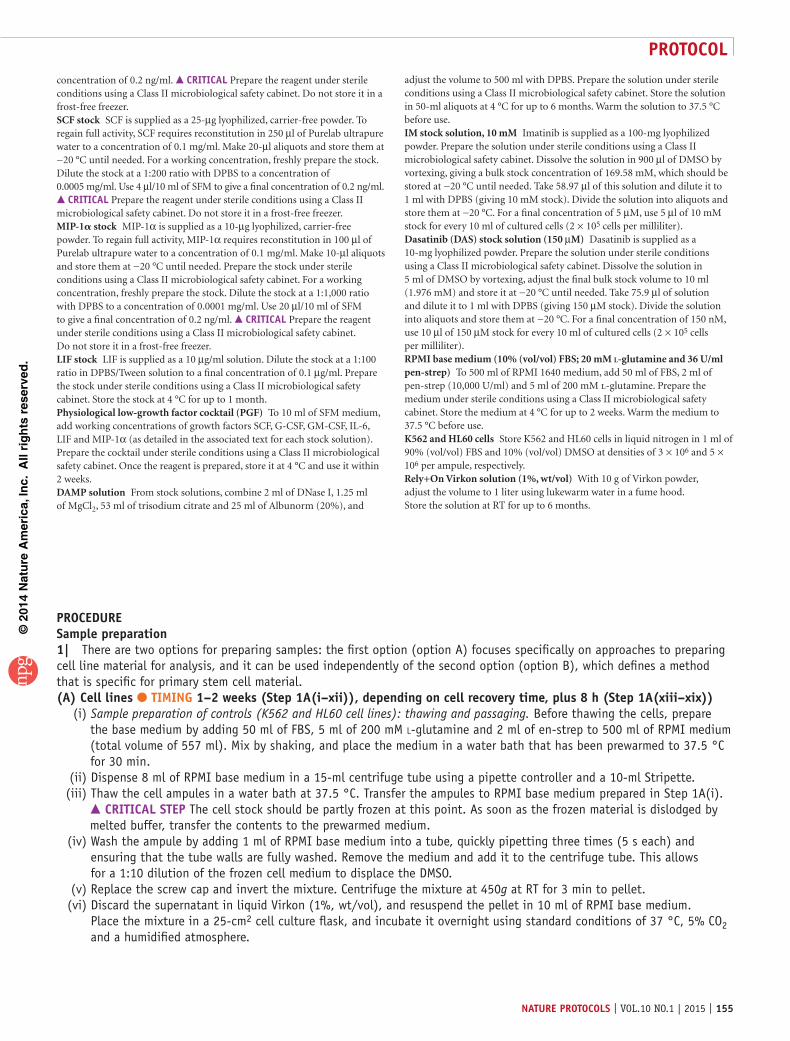
proceDuresample preparation1| There are two options for preparing samples: the first option (option A) focuses specifically on approaches to preparing cell line material for analysis, and it can be used independently of the second option (option B), which defines a method that is specific for primary stem cell material.(a) cell lines tIMInG 1–2 weeks (step 1a(i–xii)), depending on cell recovery time, plus 8 h (step 1a(xiii–xix)) (i) Sample preparation of controls (K562 and HL60 cell lines): thawing and passaging. Before thawing the cells, prepare
the base medium by adding 50 ml of FBS, 5 ml of 200 mM l-glutamine and 2 ml of en-strep to 500 ml of RPMI medium (total volume of 557 ml). Mix by shaking, and place the medium in a water bath that has been prewarmed to 37.5 °C for 30 min.
(ii) Dispense 8 ml of RPMI base medium in a 15-ml centrifuge tube using a pipette controller and a 10-ml Stripette. (iii) Thaw the cell ampules in a water bath at 37.5 °C. Transfer the ampules to RPMI base medium prepared in Step 1A(i).
crItIcal step The cell stock should be partly frozen at this point. As soon as the frozen material is dislodged by melted buffer, transfer the contents to the prewarmed medium.
(iv) Wash the ampule by adding 1 ml of RPMI base medium into a tube, quickly pipetting three times (5 s each) and ensuring that the tube walls are fully washed. Remove the medium and add it to the centrifuge tube. This allows for a 1:10 dilution of the frozen cell medium to displace the DMSO.
(v) Replace the screw cap and invert the mixture. Centrifuge the mixture at 450g at RT for 3 min to pellet. (vi) Discard the supernatant in liquid Virkon (1%, wt/vol), and resuspend the pellet in 10 ml of RPMI base medium.
Place the mixture in a 25-cm2 cell culture flask, and incubate it overnight using standard conditions of 37 °C, 5% CO2 and a humidified atmosphere.
©20
14 N
atu
re A
mer
ica,
Inc.
All
rig
hts
res
erve
d.
protocol
156 | VOL.10 NO.1 | 2015 | nature protocols
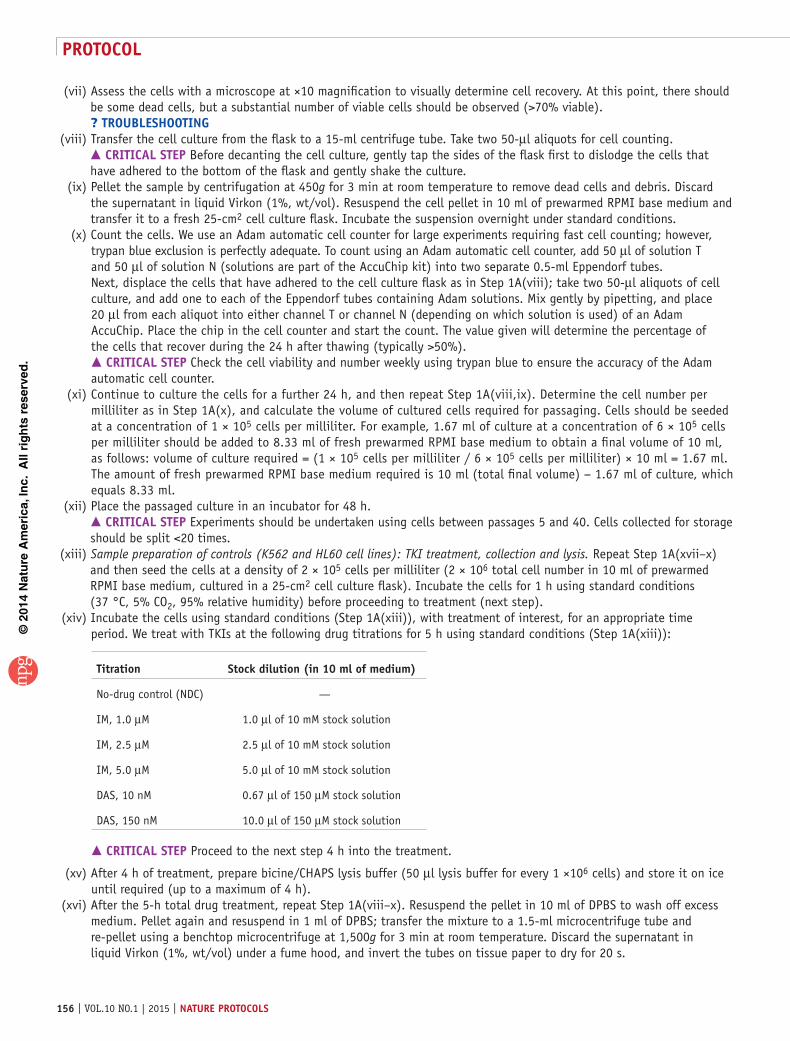
(vii) Assess the cells with a microscope at ×10 magnification to visually determine cell recovery. At this point, there should be some dead cells, but a substantial number of viable cells should be observed (>70% viable). ? trouBlesHootInG
(viii) Transfer the cell culture from the flask to a 15-ml centrifuge tube. Take two 50-µl aliquots for cell counting. crItIcal step Before decanting the cell culture, gently tap the sides of the flask first to dislodge the cells that have adhered to the bottom of the flask and gently shake the culture.
(ix) Pellet the sample by centrifugation at 450g for 3 min at room temperature to remove dead cells and debris. Discard the supernatant in liquid Virkon (1%, wt/vol). Resuspend the cell pellet in 10 ml of prewarmed RPMI base medium and transfer it to a fresh 25-cm2 cell culture flask. Incubate the suspension overnight under standard conditions.
(x) Count the cells. We use an Adam automatic cell counter for large experiments requiring fast cell counting; however, trypan blue exclusion is perfectly adequate. To count using an Adam automatic cell counter, add 50 µl of solution T and 50 µl of solution N (solutions are part of the AccuChip kit) into two separate 0.5-ml Eppendorf tubes. Next, displace the cells that have adhered to the cell culture flask as in Step 1A(viii); take two 50-µl aliquots of cell culture, and add one to each of the Eppendorf tubes containing Adam solutions. Mix gently by pipetting, and place 20 µl from each aliquot into either channel T or channel N (depending on which solution is used) of an Adam AccuChip. Place the chip in the cell counter and start the count. The value given will determine the percentage of the cells that recover during the 24 h after thawing (typically >50%). crItIcal step Check the cell viability and number weekly using trypan blue to ensure the accuracy of the Adam automatic cell counter.
(xi) Continue to culture the cells for a further 24 h, and then repeat Step 1A(viii,ix). Determine the cell number per milliliter as in Step 1A(x), and calculate the volume of cultured cells required for passaging. Cells should be seeded at a concentration of 1 × 10⁵ cells per milliliter. For example, 1.67 ml of culture at a concentration of 6 × 10⁵ cells per milliliter should be added to 8.33 ml of fresh prewarmed RPMI base medium to obtain a final volume of 10 ml, as follows: volume of culture required = (1 × 10⁵ cells per milliliter / 6 × 10⁵ cells per milliliter) × 10 ml = 1.67 ml. The amount of fresh prewarmed RPMI base medium required is 10 ml (total final volume) − 1.67 ml of culture, which equals 8.33 ml.
(xii) Place the passaged culture in an incubator for 48 h. crItIcal step Experiments should be undertaken using cells between passages 5 and 40. Cells collected for storage should be split <20 times.
(xiii) Sample preparation of controls (K562 and HL60 cell lines): TKI treatment, collection and lysis. Repeat Step 1A(xvii–x) and then seed the cells at a density of 2 × 10⁵ cells per milliliter (2 × 10⁶ total cell number in 10 ml of prewarmed RPMI base medium, cultured in a 25-cm2 cell culture flask). Incubate the cells for 1 h using standard conditions (37 °C, 5% CO2, 95% relative humidity) before proceeding to treatment (next step).
(xiv) Incubate the cells using standard conditions (Step 1A(xiii)), with treatment of interest, for an appropriate time period. We treat with TKIs at the following drug titrations for 5 h using standard conditions (Step 1A(xiii)):
titration stock dilution (in 10 ml of medium)
No-drug control (NDC) —
IM, 1.0 µM 1.0 µl of 10 mM stock solution
IM, 2.5 µM 2.5 µl of 10 mM stock solution
IM, 5.0 µM 5.0 µl of 10 mM stock solution
DAS, 10 nM 0.67 µl of 150 µM stock solution
DAS, 150 nM 10.0 µl of 150 µM stock solution
crItIcal step Proceed to the next step 4 h into the treatment.
(xv) After 4 h of treatment, prepare bicine/CHAPS lysis buffer (50 µl lysis buffer for every 1 ×10⁶ cells) and store it on ice until required (up to a maximum of 4 h).
(xvi) After the 5-h total drug treatment, repeat Step 1A(viii–x). Resuspend the pellet in 10 ml of DPBS to wash off excess medium. Pellet again and resuspend in 1 ml of DPBS; transfer the mixture to a 1.5-ml microcentrifuge tube and re-pellet using a benchtop microcentrifuge at 1,500g for 3 min at room temperature. Discard the supernatant in liquid Virkon (1%, wt/vol) under a fume hood, and invert the tubes on tissue paper to dry for 20 s.
©20
14 N
atu
re A
mer
ica,
Inc.
All
rig
hts
res
erve
d.
protocol
nature protocols | VOL.10 NO.1 | 2015 | 157
(xvii) Add the required volume of lysis buffer to each cell pellet (50 µl of lysis buffer to every 1 × 10⁶ cells). Vortex until the pellet is suspended. Incubate on ice for 15 min. Sonicate the resuspended cells for 10 s, vortex them for 10 s and return them to ice for 15 min. Precool the benchtop microcentrifuge to 4 °C. Repeat the vortex and incubation two more times. crItIcal step Visually inspect the sample; the buffer should appear cloudy owing to CHAPS dissolution on ice, whereas the solution should appear clear. ? trouBlesHootInG
(xviii) Centrifuge the sample in the prechilled benchtop microcentrifuge for 15 min at 4 °C and 18,188g. The pellet should be very small and compact. If the pellet is similar in size to the original cell pellet, lysis is incomplete. The pellet should be resuspended, and the volume of the lysis buffer should increase by 50 µl. Repeat until the pellet has diminished. Remove the supernatant and place it in a fresh 0.5-ml microtube. Discard the pellet.
(xix) Determine the protein concentration of the supernatant using a suitable assay (i.e., Bradford assay). Divide the samples into aliquots at a protein concentration of 2 mg/ml and store them at −80 °C until required. pause poInt Aliquots can be stored for several years at this temperature if unthawed. Thawed samples should be used and discarded.
(B) sample preparation of primary material (clinical cells) tIMInG 8 h (i) To isolate the CD34+CD38− population, thaw the cells in DAMP solution and stain them simultaneously with
anti-human CD34-APC and anti-human CD38-FITC antibodies. Sort the cells into CD34+CD38− and CD34+CD38+ subpopulations using a BD FACSAria cell-sorting system42.
(ii) Culture the sorted cells overnight in SFM plus growth factors. (iii) Treat the cells for 24 h with a TKI32, as previously described in Step 1A(xiv) using final concentrations of 150 nM DAS
and 5 µM IM. (iv) After 23 h, prepare 1 ml of bicine/CHAPS lysis buffer and store it on ice until required or for a maximum of 3 h. (v) Prechill the benchtop microcentrifuge to 4 °C.
crItIcal step To minimize changes in protein phosphorylation status, ensure that the samples are kept at 4 °C up until the point of lysis.
(vi) Stain the cells in a 1:1 mixture of trypan blue solution and cultured cells (100 µl total volume). Briefly vortex and take 10 µl of stained cells to count using a double-cell Neubauer hemocytometer counting chamber (0.1 mm; 1/400 mm2).
(vii) Use cell counts to calculate the volume of solution containing 10,000 cells, and divide them into aliquots in 1.5-ml Eppendorf tubes.
(viii) Centrifuge the cells at 200g for 10 min in a prechilled microcentrifuge (4 °C), and discard the supernatant in liquid Virkon (1%, wt/vol). crItIcal step Be careful not to disturb the cell pellet. If it is difficult to see, make a note of the Eppendorf tube orientation while it is in the centrifuge, and ensure that the supernatant is carefully removed from the opposite side of the tube to the direction of the centrifugal force.
(ix) Resuspend and wash the cells in 1 ml of low-ionic buffer (i.e., sucrose/bicine) to remove excess salt. crItIcal step Buffer salt concentrations used with SFM plus physiological low-growth-factor cocktail exceed the maximum salt tolerance of the cIEF platform (150 mM), which results in poor protein separation in the capillary (supplementary Video 1). ? trouBlesHootInG
(x) Centrifuge the washed cells at 200g for 10 min at room temperature and discard the supernatant in liquid Virkon (1%, wt/vol). Invert the tubes on tissue paper to remove excess liquid, and dry them for 20 s. crItIcal step It is essential that liquid carryover be avoided at this point, as excess wash buffer will reduce lysis efficiency and dilute the final sample concentration. ? trouBlesHootInG
(xi) Immediately add 5 µl of lysis buffer, gently vortex the mixture for 10 s and incubate it on ice for 15 min. Sonicate the cells for 10 s, gently vortex them for 10 s and return them to ice for a further 15 min. Repeat gentle vortexing and incubation two more times.
(xii) Centrifuge the cells in a prechilled benchtop microcentrifuge for 15 min at 4 °C and 10,000g. Remove the supernatant and place it in a fresh 0.5-ml microtube. Discard the pellet. pause poInt Samples can be snap-frozen and stored at −80 °C until required (>1 year).
©20
14 N
atu
re A
mer
ica,
Inc.
All
rig
hts
res
erve
d.
protocol
158 | VOL.10 NO.1 | 2015 | nature protocols
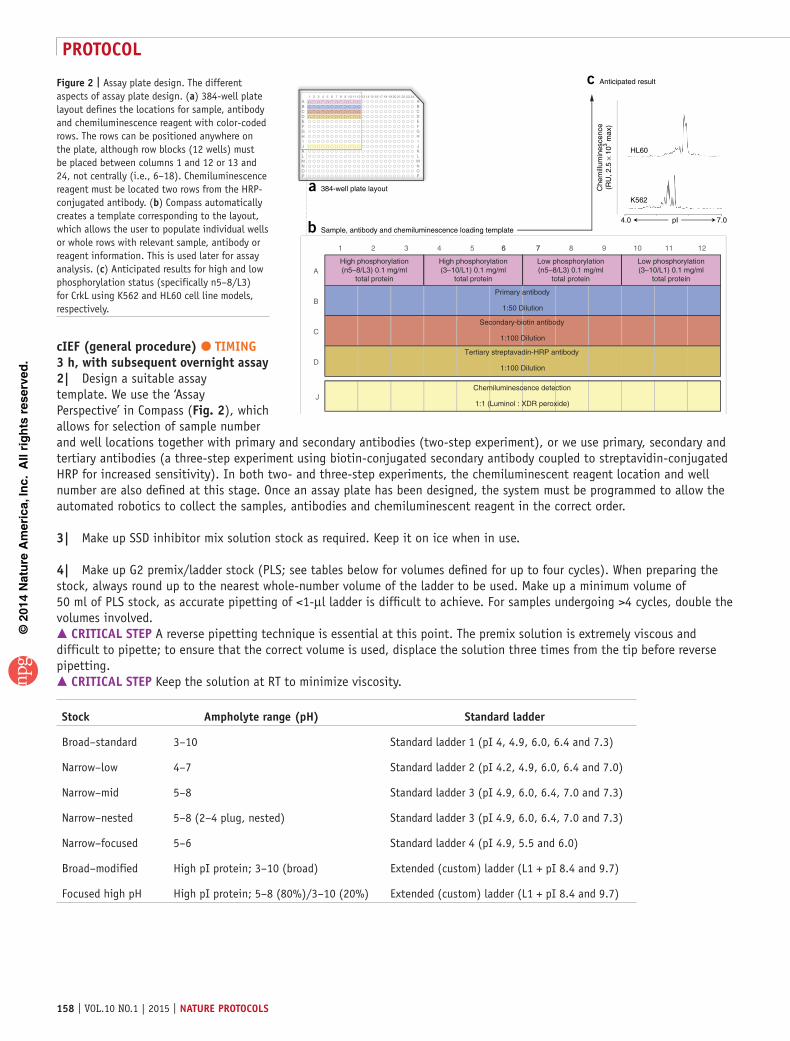
cIeF (general procedure) tIMInG 3 h, with subsequent overnight assay2| Design a suitable assay template. We use the ‘Assay Perspective’ in Compass (Fig. 2), which allows for selection of sample number and well locations together with primary and secondary antibodies (two-step experiment), or we use primary, secondary and tertiary antibodies (a three-step experiment using biotin-conjugated secondary antibody coupled to streptavidin-conjugated HRP for increased sensitivity). In both two- and three-step experiments, the chemiluminescent reagent location and well number are also defined at this stage. Once an assay plate has been designed, the system must be programmed to allow the automated robotics to collect the samples, antibodies and chemiluminescent reagent in the correct order.
3| Make up SSD inhibitor mix solution stock as required. Keep it on ice when in use.
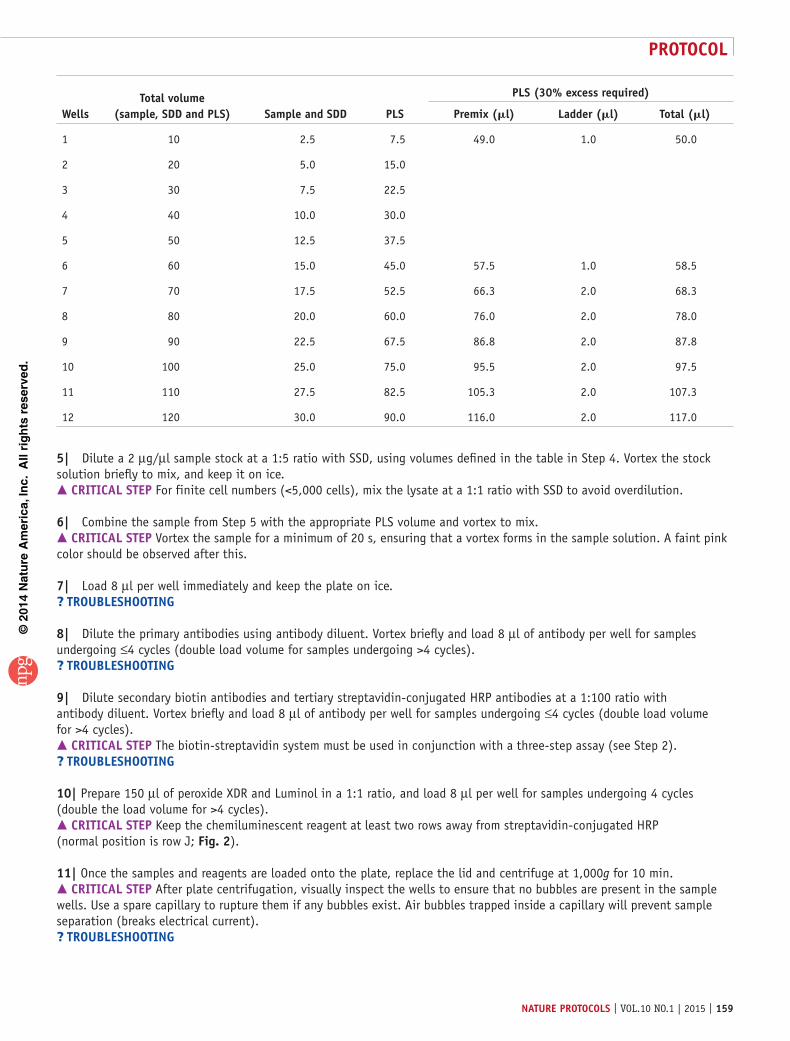
4| Make up G2 premix/ladder stock (PLS; see tables below for volumes defined for up to four cycles). When preparing the stock, always round up to the nearest whole-number volume of the ladder to be used. Make up a minimum volume of 50 ml of PLS stock, as accurate pipetting of <1-µl ladder is difficult to achieve. For samples undergoing >4 cycles, double the volumes involved. crItIcal step A reverse pipetting technique is essential at this point. The premix solution is extremely viscous and difficult to pipette; to ensure that the correct volume is used, displace the solution three times from the tip before reverse pipetting. crItIcal step Keep the solution at RT to minimize viscosity.
stock ampholyte range (pH) standard ladder
Broad–standard 3–10 Standard ladder 1 (pI 4, 4.9, 6.0, 6.4 and 7.3)
Narrow–low 4–7 Standard ladder 2 (pI 4.2, 4.9, 6.0, 6.4 and 7.0)
Narrow–mid 5–8 Standard ladder 3 (pI 4.9, 6.0, 6.4, 7.0 and 7.3)
Narrow–nested 5–8 (2–4 plug, nested) Standard ladder 3 (pI 4.9, 6.0, 6.4, 7.0 and 7.3)
Narrow–focused 5–6 Standard ladder 4 (pI 4.9, 5.5 and 6.0)
Broad–modified High pI protein; 3–10 (broad) Extended (custom) ladder (L1 + pI 8.4 and 9.7)
Focused high pH High pI protein; 5–8 (80%)/3–10 (20%) Extended (custom) ladder (L1 + pI 8.4 and 9.7)
A
B
C
D
J
1 2 3 4 5 6 6 77 8 9 1110 12
High phosphorylation(n5–8/L3) 0.1 mg/ml
total protein
Primary antibody
1:50 Dilution
High phosphorylation(3–10/L1) 0.1 mg/ml
total protein
b Sample, antibody and chemiluminescence loading template
Low phosphorylation(n5–8/L3) 0.1 mg/ml
total protein
Low phosphorylation(3–10/L1) 0.1 mg/ml
total protein
Secondary-biotin antibody
1:100 Dilution
Tertiary streptavadin-HRP antibody
1:100 Dilution
Chemiluminescence detection
1:1 (Luminol : XDR peroxide)
ABCDEFGHIJKLMNOP
ABCDEFGHIJKLMNOP
12 221 2 3 4 5 6 8 9 13 15 18 23
HL60
K562
4.0 7.0pI
Che
mill
umin
esce
nce
(RU
, 2.5
× 1
03 max
)
a 384-well plate layout
c Anticipated result
2421201917161411107
Figure 2 | Assay plate design. The different aspects of assay plate design. (a) 384-well plate layout defines the locations for sample, antibody and chemiluminescence reagent with color-coded rows. The rows can be positioned anywhere on the plate, although row blocks (12 wells) must be placed between columns 1 and 12 or 13 and 24, not centrally (i.e., 6–18). Chemiluminescence reagent must be located two rows from the HRP-conjugated antibody. (b) Compass automatically creates a template corresponding to the layout, which allows the user to populate individual wells or whole rows with relevant sample, antibody or reagent information. This is used later for assay analysis. (c) Anticipated results for high and low phosphorylation status (specifically n5–8/L3) for CrkL using K562 and HL60 cell line models, respectively.
©20
14 N
atu
re A
mer
ica,
Inc.
All
rig
hts
res
erve
d.
protocol
nature protocols | VOL.10 NO.1 | 2015 | 159
Wellstotal volume
(sample, sDD and pls) sample and sDD pls
pls (30% excess required)
premix (ml) ladder (ml) total (ml)
1 10 2.5 7.5 49.0 1.0 50.0
2 20 5.0 15.0
3 30 7.5 22.5
4 40 10.0 30.0
5 50 12.5 37.5
6 60 15.0 45.0 57.5 1.0 58.5
7 70 17.5 52.5 66.3 2.0 68.3
8 80 20.0 60.0 76.0 2.0 78.0
9 90 22.5 67.5 86.8 2.0 87.8
10 100 25.0 75.0 95.5 2.0 97.5
11 110 27.5 82.5 105.3 2.0 107.3
12 120 30.0 90.0 116.0 2.0 117.0
5| Dilute a 2 µg/µl sample stock at a 1:5 ratio with SSD, using volumes defined in the table in Step 4. Vortex the stock solution briefly to mix, and keep it on ice. crItIcal step For finite cell numbers (<5,000 cells), mix the lysate at a 1:1 ratio with SSD to avoid overdilution.
6| Combine the sample from Step 5 with the appropriate PLS volume and vortex to mix. crItIcal step Vortex the sample for a minimum of 20 s, ensuring that a vortex forms in the sample solution. A faint pink color should be observed after this.
7| Load 8 µl per well immediately and keep the plate on ice.? trouBlesHootInG
8| Dilute the primary antibodies using antibody diluent. Vortex briefly and load 8 µl of antibody per well for samples undergoing ≤4 cycles (double load volume for samples undergoing >4 cycles).? trouBlesHootInG
9| Dilute secondary biotin antibodies and tertiary streptavidin-conjugated HRP antibodies at a 1:100 ratio with antibody diluent. Vortex briefly and load 8 µl of antibody per well for samples undergoing ≤4 cycles (double load volume for >4 cycles). crItIcal step The biotin-streptavidin system must be used in conjunction with a three-step assay (see Step 2).? trouBlesHootInG
10| Prepare 150 µl of peroxide XDR and Luminol in a 1:1 ratio, and load 8 µl per well for samples undergoing 4 cycles (double the load volume for >4 cycles). crItIcal step Keep the chemiluminescent reagent at least two rows away from streptavidin-conjugated HRP (normal position is row J; Fig. 2).
11| Once the samples and reagents are loaded onto the plate, replace the lid and centrifuge at 1,000g for 10 min. crItIcal step After plate centrifugation, visually inspect the wells to ensure that no bubbles are present in the sample wells. Use a spare capillary to rupture them if any bubbles exist. Air bubbles trapped inside a capillary will prevent sample separation (breaks electrical current).? trouBlesHootInG
©20
14 N
atu
re A
mer
ica,
Inc.
All
rig
hts
res
erve
d.
protocol
160 | VOL.10 NO.1 | 2015 | nature protocols
12| Replace ultrapure water reservoir and empty waste reservoir (decontaminate as required). Open the Compass and run a cleanup cycle (Instrument → Cleanup → OK). Cleanup takes ~10 min to complete. crItIcal step Ensure that all capillaries have been removed from the reagents tray before running the cleanup, as the system will move any unused capillaries to waste, which is unnecessary (opened, unused capillaries can be placed in dark, moisture-free storage for later use).
13| Once the cleanup cycle has been completed, select ‘Assay Perspective’ in Compass and open the assay file. Check that each cycle is picking up the correct sample and antibody combinations before clicking START. After pressing START, Compass will prompt you to save settings if any unsaved changes have been made to the assay file. It will not be possible to proceed without saving.
14| Follow onscreen instructions, which should prompt you to replace water and empty waste, and to replace the sponge.? trouBlesHootInG
15| Replace or top up the wash concentrate, anolyte and catholyte buffers in the reagents tray. Load the capillaries. crItIcal step Reagent buffers can be topped up over a 48-h period; however, they should be regularly replaced and the containers should be washed in ultrapure water.? trouBlesHootInG
16| Place the plate onto a cooled sample tray. crItIcal step Ensure that the lid is on, as the system will not run without a plate lid.
17| Select the suitable location to save the data after the run has been completed, and click START. The Compass will automatically switch to ‘Run Perspective’ and provide an estimated time of completion, together with a pictorial breakdown of each cycle and a live camera feed of the separation, including the fluorescence ladder.
18| Upon completion, Compass will create a data file containing the original assay file, run summary information and video, together with the results data. Compass will automatically switch to ‘Analysis Perspective’ at this point in preparation for data analysis. pause poInt Results can be analyzed at a time point of your choice.
assay controls—sample phosphatase treatment plus secondary antibody and streptavidin cross-reaction tIMInG 3 h plus overnight assay crItIcal The following section describes methods for assay controls to confirm phosphorylate peaks using λ phosphatase together with cross-reaction controls for secondary antibodies and/or tertiary streptavidin-HRP depending upon which approach is taken (two- or three-step approach; Step 2).
19| Thaw the λ phosphatase kit on ice.
20| In a fresh 0.5-ml microtube, dilute 1.25 µl of 1 M DTT with 25 µl of 10× reaction buffer.
21| Transfer 8 µl of lysate (2 mg/ml) into a fresh 0.5-ml microtube and add 1 µl of λ phosphatase together with 1 µl of diluted DTT made in Step 32. Vortex briefly to mix, and pulse-centrifuge the mixture (10 s at 16,100g). Assessing both K562 and HL60 samples treated with TKI provides a detailed analysis of the phosphorylation profile for CrkL, both in the presence and absence of oncogenic tyrosine kinase activity.
22| Incubate the samples at 37 °C in a water bath for 60 min.
23| Remove the samples and place them on ice.
24| Process the samples as described in Steps 2–18 using the assay plate design shown in supplementary Figure 1.
©20
14 N
atu
re A
mer
ica,
Inc.
All
rig
hts
res
erve
d.
protocol
nature protocols | VOL.10 NO.1 | 2015 | 161
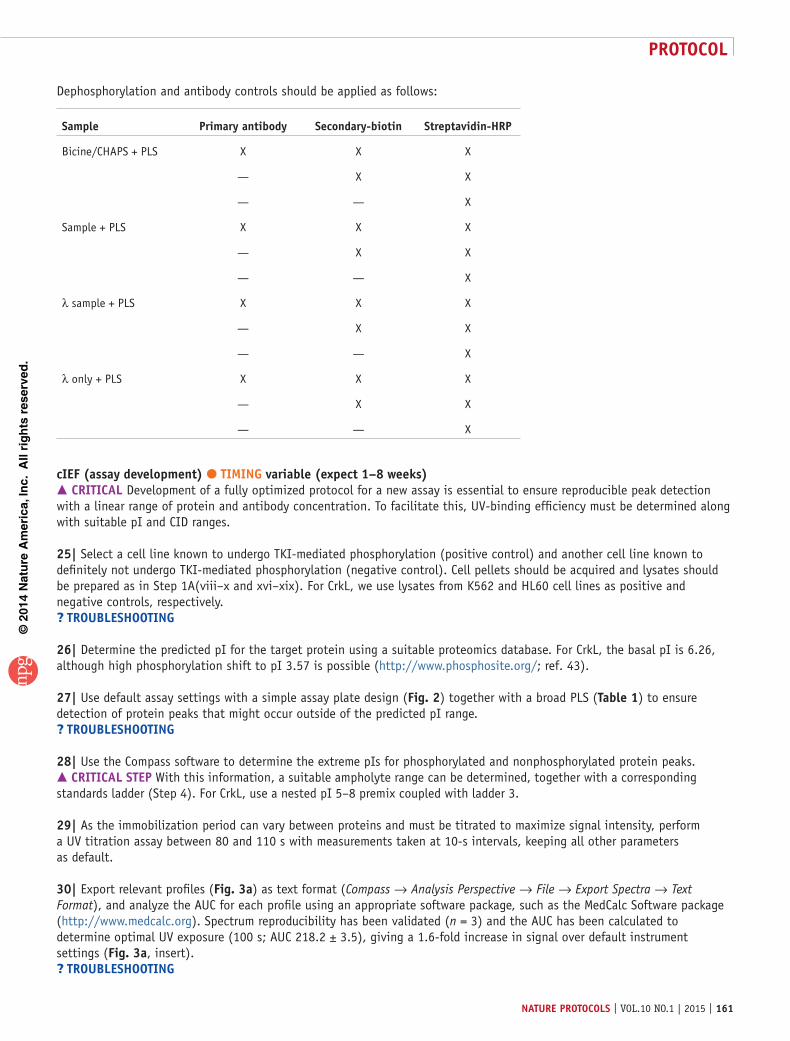
Dephosphorylation and antibody controls should be applied as follows:
sample primary antibody secondary-biotin streptavidin-Hrp
Bicine/CHAPS + PLS X X X
— X X
— — X
Sample + PLS X X X
— X X
— — X
λ sample + PLS X X X
— X X
— — X
λ only + PLS X X X
— X X
— — X
cIeF (assay development) tIMInG variable (expect 1–8 weeks) crItIcal Development of a fully optimized protocol for a new assay is essential to ensure reproducible peak detection with a linear range of protein and antibody concentration. To facilitate this, UV-binding efficiency must be determined along with suitable pI and CID ranges.
25| Select a cell line known to undergo TKI-mediated phosphorylation (positive control) and another cell line known to definitely not undergo TKI-mediated phosphorylation (negative control). Cell pellets should be acquired and lysates should be prepared as in Step 1A(viii–x and xvi–xix). For CrkL, we use lysates from K562 and HL60 cell lines as positive and negative controls, respectively.? trouBlesHootInG
26| Determine the predicted pI for the target protein using a suitable proteomics database. For CrkL, the basal pI is 6.26, although high phosphorylation shift to pI 3.57 is possible (http://www.phosphosite.org/; ref. 43).
27| Use default assay settings with a simple assay plate design (Fig. 2) together with a broad PLS (table 1) to ensure detection of protein peaks that might occur outside of the predicted pI range.? trouBlesHootInG
28| Use the Compass software to determine the extreme pIs for phosphorylated and nonphosphorylated protein peaks. crItIcal step With this information, a suitable ampholyte range can be determined, together with a corresponding standards ladder (Step 4). For CrkL, use a nested pI 5–8 premix coupled with ladder 3.
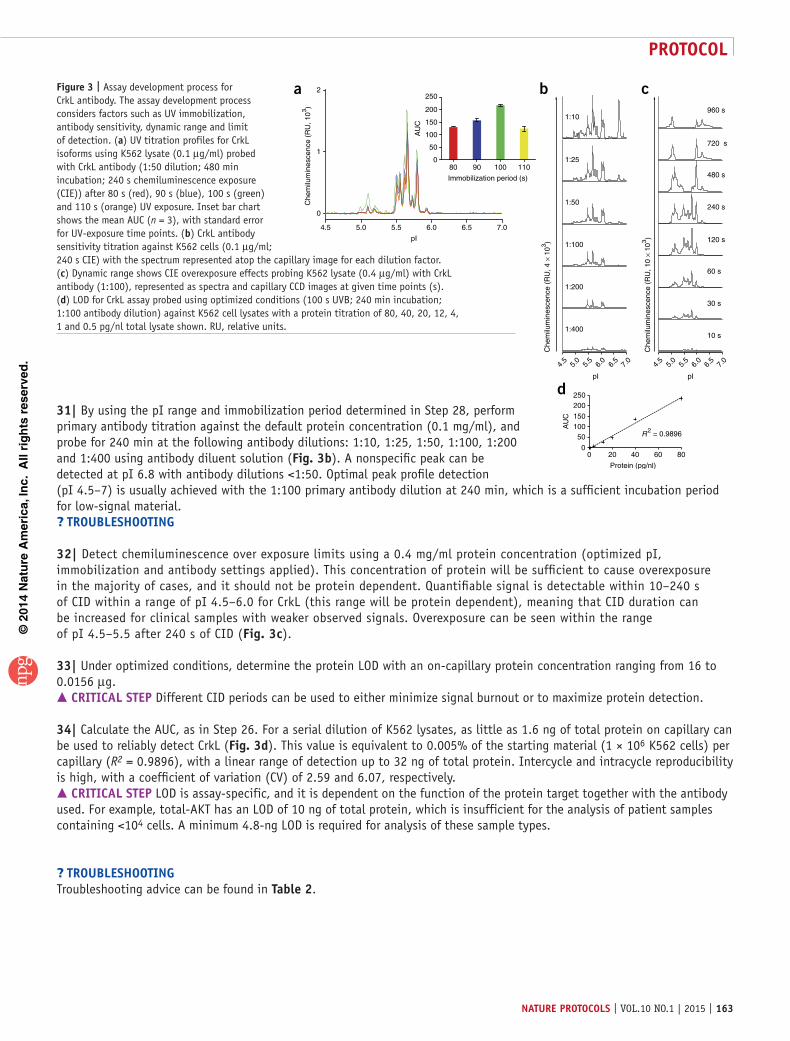
29| As the immobilization period can vary between proteins and must be titrated to maximize signal intensity, perform a UV titration assay between 80 and 110 s with measurements taken at 10-s intervals, keeping all other parameters as default.
30| Export relevant profiles (Fig. 3a) as text format (Compass → Analysis Perspective → File → Export Spectra → Text Format), and analyze the AUC for each profile using an appropriate software package, such as the MedCalc Software package (http://www.medcalc.org). Spectrum reproducibility has been validated (n = 3) and the AUC has been calculated to determine optimal UV exposure (100 s; AUC 218.2 ± 3.5), giving a 1.6-fold increase in signal over default instrument settings (Fig. 3a, insert).? trouBlesHootInG
©20
14 N
atu
re A
mer
ica,
Inc.
All
rig
hts
res
erve
d.
protocol
162 | VOL.10 NO.1 | 2015 | nature protocols
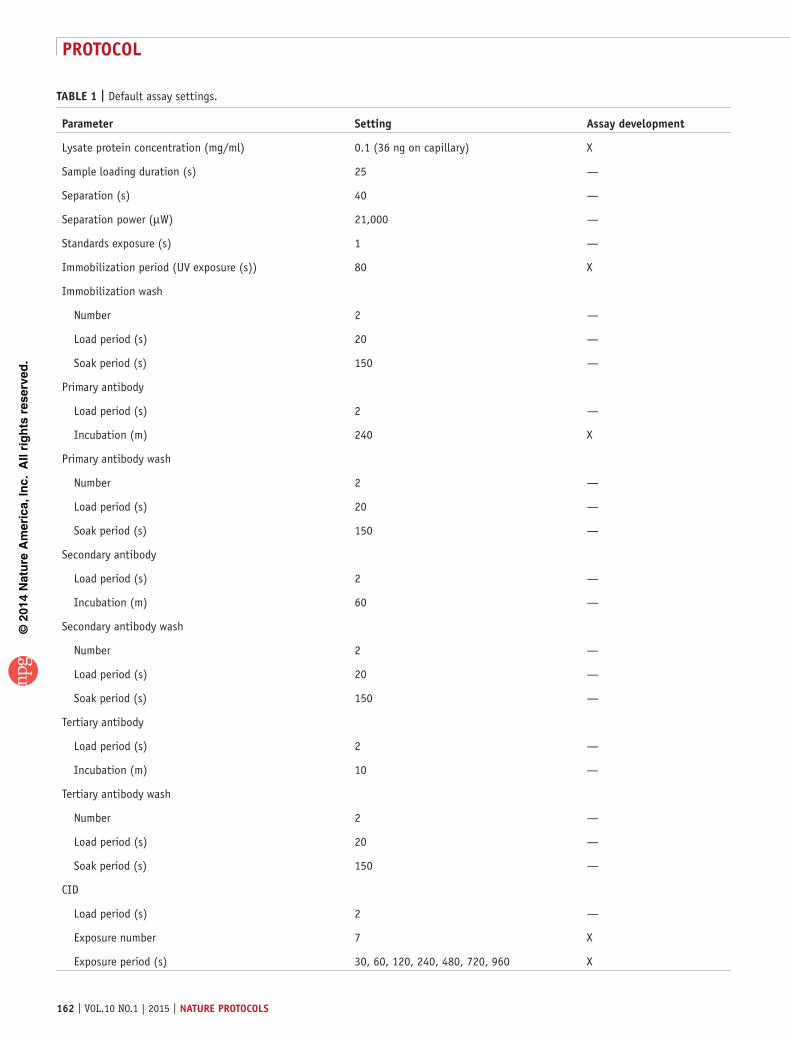
taBle 1 | Default assay settings.
parameter setting assay development
Lysate protein concentration (mg/ml) 0.1 (36 ng on capillary) X
Sample loading duration (s) 25 —
Separation (s) 40 —
Separation power (µW) 21,000 —
Standards exposure (s) 1 —
Immobilization period (UV exposure (s)) 80 X
Immobilization wash
Number 2 —
Load period (s) 20 —
Soak period (s) 150 —
Primary antibody
Load period (s) 2 —
Incubation (m) 240 X
Primary antibody wash
Number 2 —
Load period (s) 20 —
Soak period (s) 150 —
Secondary antibody
Load period (s) 2 —
Incubation (m) 60 —
Secondary antibody wash
Number 2 —
Load period (s) 20 —
Soak period (s) 150 —
Tertiary antibody
Load period (s) 2 —
Incubation (m) 10 —
Tertiary antibody wash
Number 2 —
Load period (s) 20 —
Soak period (s) 150 —
CID
Load period (s) 2 —
Exposure number 7 X
Exposure period (s) 30, 60, 120, 240, 480, 720, 960 X
©20
14 N
atu
re A
mer
ica,
Inc.
All
rig
hts
res
erve
d.
protocol
nature protocols | VOL.10 NO.1 | 2015 | 163
1:10
1:25
1:50
1:100
1:200
1:400
b
Che
milu
min
esce
nce
(RU
, 4 ×
103 )
pI
4.5
5.0
5.5
6.0
6.5
7.0
4.5
5.0
5.5
6.0
6.5
7.0
pI
Che
milu
min
esce
nce
(RU
, 10
× 10
3 )
10 s
30 s
60 s
120 s
240 s
480 s
720 s
960 s
c
d
R2 = 0.9896
0
50100150
200250
0 20 40 60 80
AU
C
Protein (pg/nl)
a
Che
milu
min
esce
nce
(RU
, 103 )
0
1
2
4.5 5.0 5.5 6.0 6.5 7.0
pI
AU
C
0
50
100
150
200
250
80 90 100 110
Immobilization period (s)
Figure 3 | Assay development process for CrkL antibody. The assay development process considers factors such as UV immobilization, antibody sensitivity, dynamic range and limit of detection. (a) UV titration profiles for CrkL isoforms using K562 lysate (0.1 µg/ml) probed with CrkL antibody (1:50 dilution; 480 min incubation; 240 s chemiluminescence exposure (CIE)) after 80 s (red), 90 s (blue), 100 s (green) and 110 s (orange) UV exposure. Inset bar chart shows the mean AUC (n = 3), with standard error for UV-exposure time points. (b) CrkL antibody sensitivity titration against K562 cells (0.1 µg/ml; 240 s CIE) with the spectrum represented atop the capillary image for each dilution factor. (c) Dynamic range shows CIE overexposure effects probing K562 lysate (0.4 µg/ml) with CrkL antibody (1:100), represented as spectra and capillary CCD images at given time points (s). (d) LOD for CrkL assay probed using optimized conditions (100 s UVB; 240 min incubation; 1:100 antibody dilution) against K562 cell lysates with a protein titration of 80, 40, 20, 12, 4, 1 and 0.5 pg/nl total lysate shown. RU, relative units.
31| By using the pI range and immobilization period determined in Step 28, perform primary antibody titration against the default protein concentration (0.1 mg/ml), and probe for 240 min at the following antibody dilutions: 1:10, 1:25, 1:50, 1:100, 1:200 and 1:400 using antibody diluent solution (Fig. 3b). A nonspecific peak can be detected at pI 6.8 with antibody dilutions <1:50. Optimal peak profile detection (pI 4.5–7) is usually achieved with the 1:100 primary antibody dilution at 240 min, which is a sufficient incubation period for low-signal material.? trouBlesHootInG
32| Detect chemiluminescence over exposure limits using a 0.4 mg/ml protein concentration (optimized pI, immobilization and antibody settings applied). This concentration of protein will be sufficient to cause overexposure in the majority of cases, and it should not be protein dependent. Quantifiable signal is detectable within 10–240 s of CID within a range of pI 4.5–6.0 for CrkL (this range will be protein dependent), meaning that CID duration can be increased for clinical samples with weaker observed signals. Overexposure can be seen within the range of pI 4.5–5.5 after 240 s of CID (Fig. 3c).
33| Under optimized conditions, determine the protein LOD with an on-capillary protein concentration ranging from 16 to 0.0156 µg. crItIcal step Different CID periods can be used to either minimize signal burnout or to maximize protein detection.
34| Calculate the AUC, as in Step 26. For a serial dilution of K562 lysates, as little as 1.6 ng of total protein on capillary can be used to reliably detect CrkL (Fig. 3d). This value is equivalent to 0.005% of the starting material (1 × 10⁶ K562 cells) per capillary (R2 = 0.9896), with a linear range of detection up to 32 ng of total protein. Intercycle and intracycle reproducibility is high, with a coefficient of variation (CV) of 2.59 and 6.07, respectively. crItIcal step LOD is assay-specific, and it is dependent on the function of the protein target together with the antibody used. For example, total-AKT has an LOD of 10 ng of total protein, which is insufficient for the analysis of patient samples containing <104 cells. A minimum 4.8-ng LOD is required for analysis of these sample types.
? trouBlesHootInGTroubleshooting advice can be found in table 2.
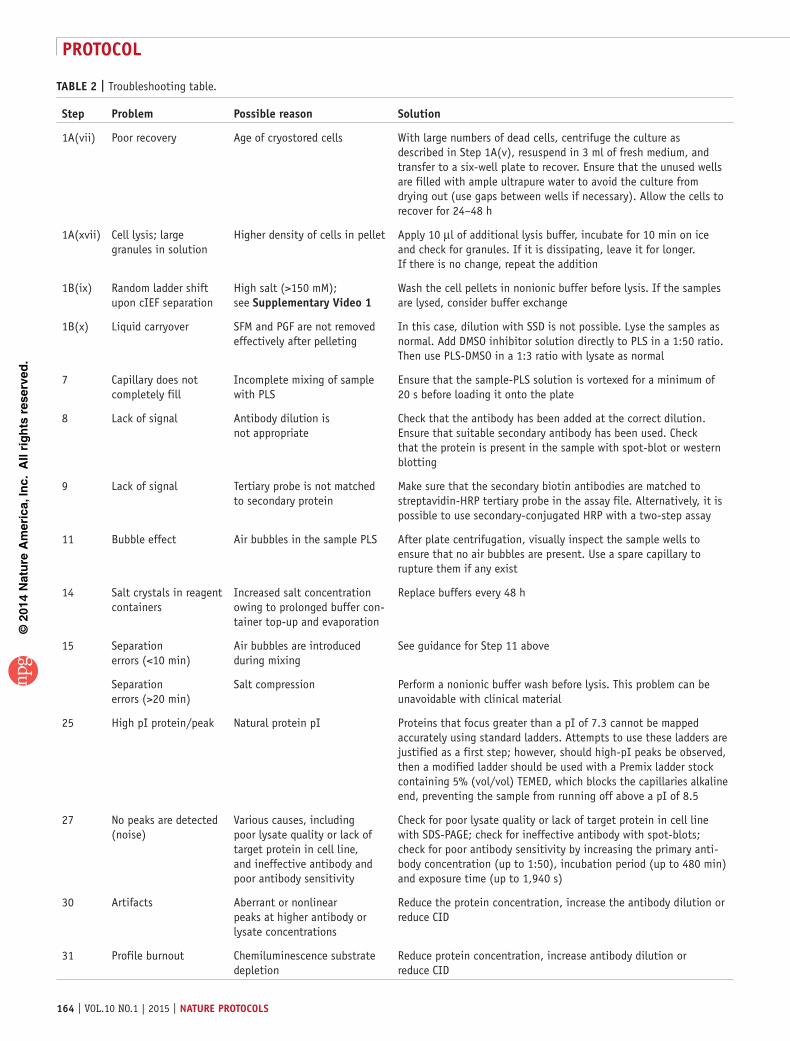
©20
14 N
atu
re A
mer
ica,
Inc.
All
rig
hts
res
erve
d.
protocol
164 | VOL.10 NO.1 | 2015 | nature protocols
taBle 2 | Troubleshooting table.
step problem possible reason solution
1A(vii) Poor recovery Age of cryostored cells With large numbers of dead cells, centrifuge the culture as described in Step 1A(v), resuspend in 3 ml of fresh medium, and transfer to a six-well plate to recover. Ensure that the unused wells are filled with ample ultrapure water to avoid the culture from drying out (use gaps between wells if necessary). Allow the cells to recover for 24–48 h
1A(xvii) Cell lysis; large granules in solution
Higher density of cells in pellet Apply 10 µl of additional lysis buffer, incubate for 10 min on ice and check for granules. If it is dissipating, leave it for longer. If there is no change, repeat the addition
1B(ix) Random ladder shift upon cIEF separation
High salt (>150 mM); see supplementary Video 1
Wash the cell pellets in nonionic buffer before lysis. If the samples are lysed, consider buffer exchange
1B(x) Liquid carryover SFM and PGF are not removed effectively after pelleting
In this case, dilution with SSD is not possible. Lyse the samples as normal. Add DMSO inhibitor solution directly to PLS in a 1:50 ratio. Then use PLS-DMSO in a 1:3 ratio with lysate as normal
7 Capillary does not completely fill
Incomplete mixing of sample with PLS
Ensure that the sample-PLS solution is vortexed for a minimum of 20 s before loading it onto the plate
8 Lack of signal Antibody dilution is not appropriate
Check that the antibody has been added at the correct dilution. Ensure that suitable secondary antibody has been used. Check that the protein is present in the sample with spot-blot or western blotting
9 Lack of signal Tertiary probe is not matched to secondary protein
Make sure that the secondary biotin antibodies are matched to streptavidin-HRP tertiary probe in the assay file. Alternatively, it is possible to use secondary-conjugated HRP with a two-step assay
11 Bubble effect Air bubbles in the sample PLS After plate centrifugation, visually inspect the sample wells to ensure that no air bubbles are present. Use a spare capillary to rupture them if any exist
14 Salt crystals in reagent containers
Increased salt concentration owing to prolonged buffer con-tainer top-up and evaporation
Replace buffers every 48 h
15 Separation errors (<10 min)
Air bubbles are introduced during mixing
See guidance for Step 11 above
Separation errors (>20 min)
Salt compression Perform a nonionic buffer wash before lysis. This problem can be unavoidable with clinical material
25 High pI protein/peak Natural protein pI Proteins that focus greater than a pI of 7.3 cannot be mapped accurately using standard ladders. Attempts to use these ladders are justified as a first step; however, should high-pI peaks be observed, then a modified ladder should be used with a Premix ladder stock containing 5% (vol/vol) TEMED, which blocks the capillaries alkaline end, preventing the sample from running off above a pI of 8.5
27 No peaks are detected (noise)
Various causes, including poor lysate quality or lack of target protein in cell line, and ineffective antibody and poor antibody sensitivity
Check for poor lysate quality or lack of target protein in cell line with SDS-PAGE; check for ineffective antibody with spot-blots; check for poor antibody sensitivity by increasing the primary anti-body concentration (up to 1:50), incubation period (up to 480 min) and exposure time (up to 1,940 s)
30 Artifacts Aberrant or nonlinear peaks at higher antibody or lysate concentrations
Reduce the protein concentration, increase the antibody dilution or reduce CID
31 Profile burnout Chemiluminescence substrate depletion
Reduce protein concentration, increase antibody dilution or reduce CID
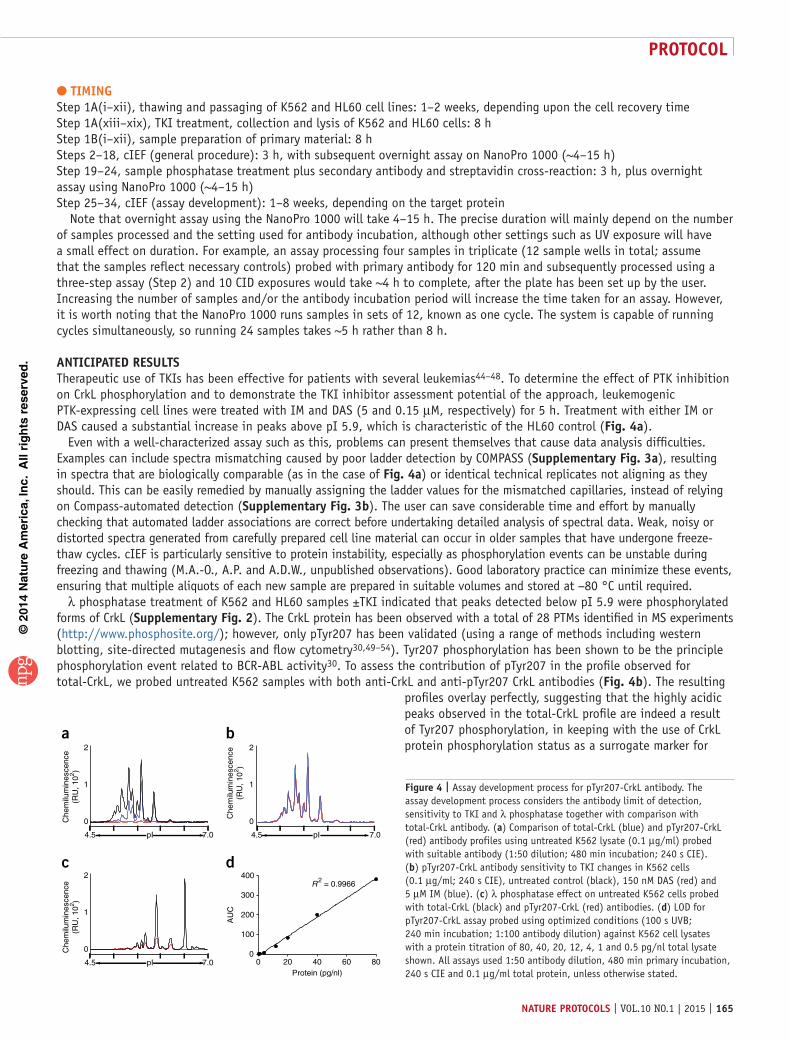
©20
14 N
atu
re A
mer
ica,
Inc.
All
rig
hts
res
erve
d.
protocol
nature protocols | VOL.10 NO.1 | 2015 | 165
tIMInGStep 1A(i–xii), thawing and passaging of K562 and HL60 cell lines: 1–2 weeks, depending upon the cell recovery timeStep 1A(xiii–xix), TKI treatment, collection and lysis of K562 and HL60 cells: 8 hStep 1B(i–xii), sample preparation of primary material: 8 hSteps 2–18, cIEF (general procedure): 3 h, with subsequent overnight assay on NanoPro 1000 (~4–15 h)Step 19–24, sample phosphatase treatment plus secondary antibody and streptavidin cross-reaction: 3 h, plus overnight assay using NanoPro 1000 (~4–15 h)Step 25–34, cIEF (assay development): 1–8 weeks, depending on the target protein Note that overnight assay using the NanoPro 1000 will take 4–15 h. The precise duration will mainly depend on the number of samples processed and the setting used for antibody incubation, although other settings such as UV exposure will have a small effect on duration. For example, an assay processing four samples in triplicate (12 sample wells in total; assume that the samples reflect necessary controls) probed with primary antibody for 120 min and subsequently processed using a three-step assay (Step 2) and 10 CID exposures would take ~4 h to complete, after the plate has been set up by the user. Increasing the number of samples and/or the antibody incubation period will increase the time taken for an assay. However, it is worth noting that the NanoPro 1000 runs samples in sets of 12, known as one cycle. The system is capable of running cycles simultaneously, so running 24 samples takes ~5 h rather than 8 h.
antIcIpateD resultsTherapeutic use of TKIs has been effective for patients with several leukemias44–48. To determine the effect of PTK inhibition on CrkL phosphorylation and to demonstrate the TKI inhibitor assessment potential of the approach, leukemogenic PTK-expressing cell lines were treated with IM and DAS (5 and 0.15 µM, respectively) for 5 h. Treatment with either IM or DAS caused a substantial increase in peaks above pI 5.9, which is characteristic of the HL60 control (Fig. 4a).
Even with a well-characterized assay such as this, problems can present themselves that cause data analysis difficulties. Examples can include spectra mismatching caused by poor ladder detection by COMPASS (supplementary Fig. 3a), resulting in spectra that are biologically comparable (as in the case of Fig. 4a) or identical technical replicates not aligning as they should. This can be easily remedied by manually assigning the ladder values for the mismatched capillaries, instead of relying on Compass-automated detection (supplementary Fig. 3b). The user can save considerable time and effort by manually checking that automated ladder associations are correct before undertaking detailed analysis of spectral data. Weak, noisy or distorted spectra generated from carefully prepared cell line material can occur in older samples that have undergone freeze-thaw cycles. cIEF is particularly sensitive to protein instability, especially as phosphorylation events can be unstable during freezing and thawing (M.A.-O., A.P. and A.D.W., unpublished observations). Good laboratory practice can minimize these events, ensuring that multiple aliquots of each new sample are prepared in suitable volumes and stored at −80 °C until required.
λ phosphatase treatment of K562 and HL60 samples ±TKI indicated that peaks detected below pI 5.9 were phosphorylated forms of CrkL (supplementary Fig. 2). The CrkL protein has been observed with a total of 28 PTMs identified in MS experiments (http://www.phosphosite.org/); however, only pTyr207 has been validated (using a range of methods including western blotting, site-directed mutagenesis and flow cytometry30,49–54). Tyr207 phosphorylation has been shown to be the principle phosphorylation event related to BCR-ABL activity30. To assess the contribution of pTyr207 in the profile observed for total-CrkL, we probed untreated K562 samples with both anti-CrkL and anti-pTyr207 CrkL antibodies (Fig. 4b). The resulting
profiles overlay perfectly, suggesting that the highly acidic peaks observed in the total-CrkL profile are indeed a result of Tyr207 phosphorylation, in keeping with the use of CrkL protein phosphorylation status as a surrogate marker for 2
1
0Che
milu
min
esce
nce
(RU
, 102 )
7.04.5 pI
2
1
0
Che
milu
min
esce
nce
(RU
, 102 )
7.04.5 pI
2
1
0Che
milu
min
esce
nce
(RU
, 102 )
7.04.5 pI 0 20 40 60 800
100
200
300
400
Protein (pg/nl)
AU
C
R2 = 0.9966
ba
dc
Figure 4 | Assay development process for pTyr207-CrkL antibody. The assay development process considers the antibody limit of detection, sensitivity to TKI and λ phosphatase together with comparison with total-CrkL antibody. (a) Comparison of total-CrkL (blue) and pTyr207-CrkL (red) antibody profiles using untreated K562 lysate (0.1 µg/ml) probed with suitable antibody (1:50 dilution; 480 min incubation; 240 s CIE). (b) pTyr207-CrkL antibody sensitivity to TKI changes in K562 cells (0.1 µg/ml; 240 s CIE), untreated control (black), 150 nM DAS (red) and 5 µM IM (blue). (c) λ phosphatase effect on untreated K562 cells probed with total-CrkL (black) and pTyr207-CrkL (red) antibodies. (d) LOD for pTyr207-CrkL assay probed using optimized conditions (100 s UVB; 240 min incubation; 1:100 antibody dilution) against K562 cell lysates with a protein titration of 80, 40, 20, 12, 4, 1 and 0.5 pg/nl total lysate shown. All assays used 1:50 antibody dilution, 480 min primary incubation, 240 s CIE and 0.1 µg/ml total protein, unless otherwise stated.
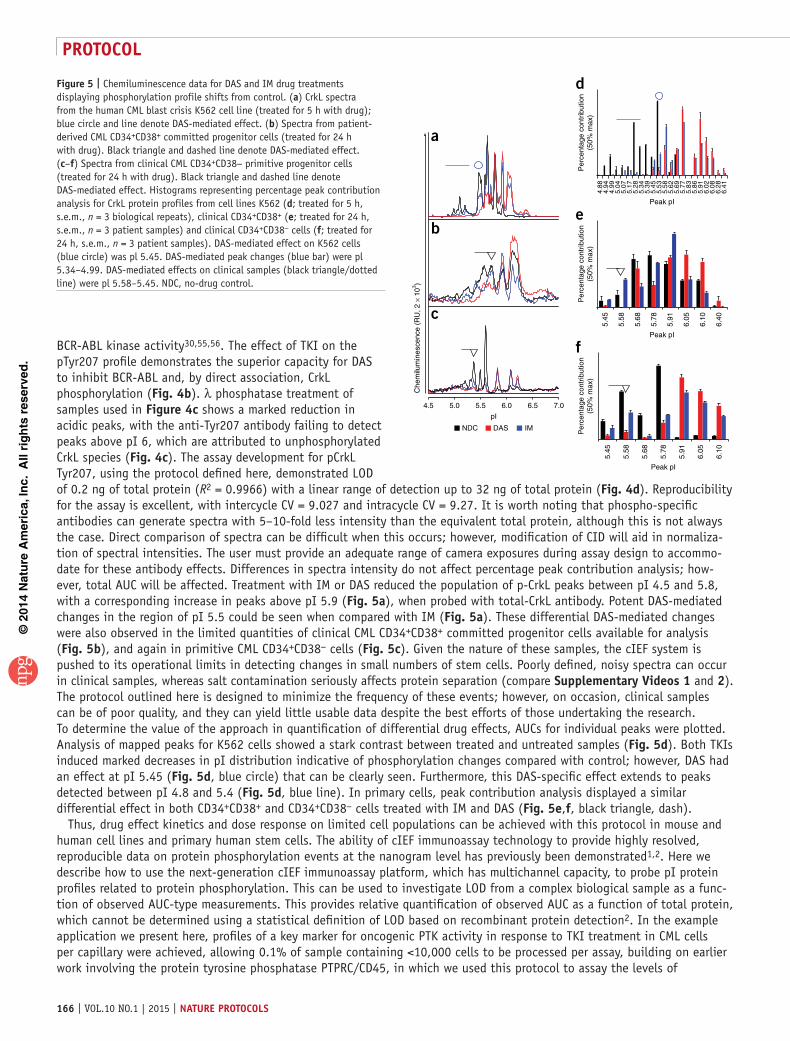
©20
14 N
atu
re A
mer
ica,
Inc.
All
rig
hts
res
erve
d.
protocol
166 | VOL.10 NO.1 | 2015 | nature protocols
BCR-ABL kinase activity30,55,56. The effect of TKI on the pTyr207 profile demonstrates the superior capacity for DAS to inhibit BCR-ABL and, by direct association, CrkL phosphorylation (Fig. 4b). λ phosphatase treatment of samples used in Figure 4c shows a marked reduction in acidic peaks, with the anti-Tyr207 antibody failing to detect peaks above pI 6, which are attributed to unphosphorylated CrkL species (Fig. 4c). The assay development for pCrkL Tyr207, using the protocol defined here, demonstrated LOD of 0.2 ng of total protein (R2 = 0.9966) with a linear range of detection up to 32 ng of total protein (Fig. 4d). Reproducibility for the assay is excellent, with intercycle CV = 9.027 and intracycle CV = 9.27. It is worth noting that phospho-specific antibodies can generate spectra with 5–10-fold less intensity than the equivalent total protein, although this is not always the case. Direct comparison of spectra can be difficult when this occurs; however, modification of CID will aid in normaliza-tion of spectral intensities. The user must provide an adequate range of camera exposures during assay design to accommo-date for these antibody effects. Differences in spectra intensity do not affect percentage peak contribution analysis; how-ever, total AUC will be affected. Treatment with IM or DAS reduced the population of p-CrkL peaks between pI 4.5 and 5.8, with a corresponding increase in peaks above pI 5.9 (Fig. 5a), when probed with total-CrkL antibody. Potent DAS-mediated changes in the region of pI 5.5 could be seen when compared with IM (Fig. 5a). These differential DAS-mediated changes were also observed in the limited quantities of clinical CML CD34+CD38+ committed progenitor cells available for analysis (Fig. 5b), and again in primitive CML CD34+CD38− cells (Fig. 5c). Given the nature of these samples, the cIEF system is pushed to its operational limits in detecting changes in small numbers of stem cells. Poorly defined, noisy spectra can occur in clinical samples, whereas salt contamination seriously affects protein separation (compare supplementary Videos 1 and 2). The protocol outlined here is designed to minimize the frequency of these events; however, on occasion, clinical samples can be of poor quality, and they can yield little usable data despite the best efforts of those undertaking the research. To determine the value of the approach in quantification of differential drug effects, AUCs for individual peaks were plotted. Analysis of mapped peaks for K562 cells showed a stark contrast between treated and untreated samples (Fig. 5d). Both TKIs induced marked decreases in pI distribution indicative of phosphorylation changes compared with control; however, DAS had an effect at pI 5.45 (Fig. 5d, blue circle) that can be clearly seen. Furthermore, this DAS-specific effect extends to peaks detected between pI 4.8 and 5.4 (Fig. 5d, blue line). In primary cells, peak contribution analysis displayed a similar differential effect in both CD34+CD38+ and CD34+CD38− cells treated with IM and DAS (Fig. 5e,f, black triangle, dash).
Thus, drug effect kinetics and dose response on limited cell populations can be achieved with this protocol in mouse and human cell lines and primary human stem cells. The ability of cIEF immunoassay technology to provide highly resolved, reproducible data on protein phosphorylation events at the nanogram level has previously been demonstrated1,2. Here we describe how to use the next-generation cIEF immunoassay platform, which has multichannel capacity, to probe pI protein profiles related to protein phosphorylation. This can be used to investigate LOD from a complex biological sample as a func-tion of observed AUC-type measurements. This provides relative quantification of observed AUC as a function of total protein, which cannot be determined using a statistical definition of LOD based on recombinant protein detection2. In the example application we present here, profiles of a key marker for oncogenic PTK activity in response to TKI treatment in CML cells per capillary were achieved, allowing 0.1% of sample containing <10,000 cells to be processed per assay, building on earlier work involving the protein tyrosine phosphatase PTPRC/CD45, in which we used this protocol to assay the levels of
4.88
4.94
4.99
5.04
5.07
5.17
5.28
5.34
5.39
5.45
5.53
5.58
5.62
5.69
5.77
5.83
5.86
5.91
6.02
6.08
6.28
6.41
Peak pI
Per
cent
age
cont
ribut
ion
(50%
max
)
Peak pI
Per
cent
age
cont
ribut
ion
(50%
max
)
5.45
6.40
6.10
6.05
5.91
5.78
5.68
5.58
Peak pI
5.45
6.10
6.05
5.91
5.78
5.68
5.58
Per
cent
age
cont
ribut
ion
(50%
max
)
d
e
f
Che
milu
min
esce
nce
(RU
, 2 ×
103 )
4.5 5.0 5.5 6.0 6.5 7.0
pI
a
b
c
NDC DAS IM
Figure 5 | Chemiluminescence data for DAS and IM drug treatments displaying phosphorylation profile shifts from control. (a) CrkL spectra from the human CML blast crisis K562 cell line (treated for 5 h with drug); blue circle and line denote DAS-mediated effect. (b) Spectra from patient-derived CML CD34+CD38+ committed progenitor cells (treated for 24 h with drug). Black triangle and dashed line denote DAS-mediated effect. (c–f) Spectra from clinical CML CD34+CD38− primitive progenitor cells (treated for 24 h with drug). Black triangle and dashed line denote DAS-mediated effect. Histograms representing percentage peak contribution analysis for CrkL protein profiles from cell lines K562 (d; treated for 5 h, s.e.m., n = 3 biological repeats), clinical CD34+CD38+ (e; treated for 24 h, s.e.m., n = 3 patient samples) and clinical CD34+CD38− cells (f; treated for 24 h, s.e.m., n = 3 patient samples). DAS-mediated effect on K562 cells (blue circle) was pl 5.45. DAS-mediated peak changes (blue bar) were pl 5.34–4.99. DAS-mediated effects on clinical samples (black triangle/dotted line) were pl 5.58–5.45. NDC, no-drug control.
©20
14 N
atu
re A
mer
ica,
Inc.
All
rig
hts
res
erve
d.
protocol
nature protocols | VOL.10 NO.1 | 2015 | 167
pS962 PTPRC/CD45 in CML and normal CD34+ patient samples. Assay development for PTPRC/CD45 was again developed in accordance with our protocol (supplementary Fig. 1), displaying an LOD down to 1.6 ng of total protein with interassay and intra-assay CV of 7.82 and 4.41, respectively.
Our work has enabled differential effects of inhibitors on CrkL to be recorded in a format that lends itself to high- throughput use on extremely low-availability cell populations from clinical trials or patients at presentation (for drug screening before decisions on appropriate therapy). We have demonstrated the system’s ability to directly target proteins of interest in very small samples (<104 cells), without the need for larger quantities of starting material, recombinant protein expression (to define LOD) or validation in cell lines, and the inference for further use is clear. The procedure we have used in relation to primary patient material is well documented for the study of TKI effects, and as such it applies to a wider audience, given the likelihood of access to biobanked primary cell material. This builds on earlier published work using CML patient material5,6, and makes a case for focusing this technology toward personalized medicine, for use in assessing patient stratification (in selecting suitable TKI treatment) or in potentially monitoring the development of drug resistance in patients undergoing chemotherapy for CML. Nevertheless, users need to be aware of the limitations of the technology. The presence of reproducibly detectable changes in protein profiles can support patient stratification (perhaps in terms of treatment); however, such complex spectra, while being very informative, also pose complex biochemical questions relating to the origin of observed peaks.
Note: Any Supplementary Information and Source Data files are available in the online version of the paper.
acKnoWleDGMents This work was supported by Leukaemia and Lymphoma Research UK (08004 to F.P., M.T.S. and T.L.H.), Cancer Research UK (C11074/A11008 to F.P., M.T.S. and T.L.H.) and the Chief Scientist Office (CZB/4/690 to F.P., M.T.S. and T.L.H.), and also by the Glasgow and Manchester Experimental Cancer Medicine Centres, which are funded by Cancer Research UK and the Chief Scientist Office in Scotland.
autHor contrIButIons A.D.W. and T.L.H. devised the study; M.A.-O. performed the experimental and study design and wrote the manuscript with A.D.W.; A.P. contributed to study design and instrument setup; F.P. and M.T.S. prepared clinical material; A.J.W. provided the Src inhibitor; and all authors contributed experimental methods and reviewed the manuscript.
coMpetInG FInancIal Interests The authors declare no competing financial interests.
Reprints and permissions information is available online at http://www.nature.com/reprints/index.html.
1. O’Neill, R.A. et al. Isoelectric focusing technology quantifies protein signaling in 25 cells. Proc. Natl. Acad. Sci. USA 103, 16153–16158 (2006).
2. Fan, A.C. et al. Nanofluidic proteomic assay for serial analysis of oncoprotein activation in clinical specimens. Nat. Med. 15, 566–571 (2009).
3. Maiso, P. et al. Defining the role of TORC1/2 in multiple myeloma. Blood 118, 6860–6870 (2011).
4. Kentsis, A. et al. Autocrine activation of the MET receptor tyrosine kinase in acute myeloid leukemia. Nat. Med. 18, 1118–1122 (2012).
5. Williamson, A.J.K. et al. A specific PTPRC/CD45 phosphorylation event governed by stem cell chemokine CXCL12 regulates primitive hematopoietic cell motility. Mol. Cell. Proteom. 12, 3319–3329 (2013).
6. Brown, S. et al. Monocyte-derived dendritic cells from chronic myeloid leukaemia have abnormal maturation and cytoskeletal function that is associated with defective localisation and signalling by normal ABL1 protein. Eur. J. Haematol. 93, 96–102 (2014).
7. Al-Hajj, M., Wicha, M.S., Benito-Hernandez, A., Morrison, S.J. & Clarke, M.F. Prospective identification of tumorigenic breast cancer cells. Proc. Natl. Acad. Sci. USA 100, 3983–3988 (2003).
8. Li, C. et al. Identification of pancreatic cancer stem cells. Cancer Res. 67, 1030–1037 (2007).
9. Prince, M. et al. Identification of a subpopulation of cells with cancer stem cell properties in head and neck squamous cell carcinoma. Proc. Natl. Acad. Sci. USA 104, 973–981 (2007).
10. Mitelman, F., Johansson, B. & Mertens, F. The impact of translocations and gene fusions on cancer causation. Nat. Rev. Cancer 7, 233–245 (2007).
11. Sanz, M., Burnett, A., Lo-Coco, F. & Lowenberg, B. FLT3 inhibition as a targeted therapy for acute myeloid leukemia. Curr. Opin. Oncol. 21, 594–600 (2009).
12. Verstovsek, S. Therapeutic potential of JAK2 inhibitors. Hematol. Am. Soc. Hematol. Educ. Prog. 2009, 636–642 (2009).
13. Rowley, J.D. Letter: a new consistent chromosomal abnormality in chronic myelogenous leukaemia identified by quinacrine fluorescence and Giemsa staining. Nature 243, 290–293 (1973).
14. Groffen, J. et al. Philadelphia chromosomal breakpoints are clustered within a limited region, bcr, on chromosome 22. Cell 36, 93–99 (1984).
15. Druker, B.J. et al. Effects of a selective inhibitor of the Abl tyrosine kinase on the growth of Bcr-Abl–positive cells. Nat. Med. 2, 561–566 (1996).
16. Gambacorti-Passerini, C. et al. Inhibition of the ABL kinase activity blocks the proliferation of BCR/ABL+ leukemic cells and induces apoptosis. Blood Cells Mol. Dis. 23, 380–394 (1997).
17. Hamilton, A. et al. BCR-ABL activity and its response to drugs can be determined in CD34+ CML stem cells by CrkL phosphorylation status using flow cytometry. Leukemia 20, 1035–1039 (2006).
18. Copland, M. et al. Dasatinib (BMS-354825) targets an earlier progenitor population than imatinib in primary CML but does not eliminate the quiescent fraction. Blood 107, 4532–4539 (2006).
19. Hochhaus, A. et al. Six-year follow-up of patients receiving imatinib for the first-line treatment of chronic myeloid leukemia. Leukemia 23, 1054–1061 (2009).
20. Hochhaus, A. et al. Favorable long-term follow-up results over 6 years for response, survival, and safety with imatinib mesylate therapy in chronic-phase chronic myeloid leukemia after failure of interferon-α treatment. Blood 111, 1039–1043 (2008).
21. O’Hare, T., Zabriskie, M.S., Eiring, A.M. & Deininger, M.W. Pushing the limits of targeted therapy in chronic myeloid leukaemia. Nat. Rev. Cancer 12, 513–526 (2012).
22. Graham, S.M. et al. Primitive, quiescent, Philadelphia-positive stem cells from patients with chronic myeloid leukemia are insensitive to STI571. Blood 99, 319–325 (2002).
23. Holtz, M.S. Imatinib mesylate (STI571) inhibits growth of primitive malignant progenitors in chronic myelogenous leukemia through reversal of abnormally increased proliferation. Blood 99, 3792–3800 (2002).
24. Mahon, F.X. et al. Discontinuation of imatinib in patients with chronic myeloid leukaemia who have maintained complete molecular remission for at least 2 years: the prospective, multicentre Stop Imatinib (STIM) trial. Lancet Oncol. 11, 1029–1035 (2010).
25. Chu, S. et al. Persistence of leukemia stem cells in chronic myelogenous leukemia patients in prolonged remission with imatinib treatment. Blood 118, 5565–5572 (2011).
26. Rousselot, P. et al. Imatinib mesylate discontinuation in patients with chronic myelogenous leukemia in complete molecular remission for more than 2 years. Blood 109, 58–60 (2007).
©20
14 N
atu
re A
mer
ica,
Inc.
All
rig
hts
res
erve
d.
protocol
168 | VOL.10 NO.1 | 2015 | nature protocols
27. Druker, B.J. et al. Five-year follow-up of patients receiving imatinib for chronic myeloid leukemia. N. Engl. J. Med. 355, 2408–2417 (2006).
28. Addona, T.A. et al. Multi-site assessment of the precision and reproducibility of multiple reaction monitoring-based measurements of proteins in plasma. Nat. Biotechnol. 27, 633–641 (2009).
29. Hjelle, S.M. et al. Clinical proteomics of myeloid leukemia. Genome Med. 2, 41 (2010).
30. de Jong, R., ten Hoeve, J., Heisterkamp, N. & Groffen, J. Tyrosine 207 in CRKL is the BCR/ABL phosphorylation site. Oncogene 14, 507–513 (1997).
31. Seo, J.H. et al. A specific need for CRKL in p210BCR-ABL-induced transformation of mouse hematopoietic progenitors. Cancer Res. 70, 7325–7335 (2010).
32. Konig, H. et al. Effects of dasatinib on SRC kinase activity and downstream intracellular signaling in primitive chronic myelogenous leukemia hematopoietic cells. Cancer Res. 68, 9624–9633 (2008).
33. Oda, T. et al. Crkl is the major tyrosine-phosphorylated protein in neutrophils from patients with chronic myelogenous leukemia. J. Biol. Chem. 269, 22925–22928 (1994).
34. Liu, X. et al. Constrained selected reaction monitoring: quantification of selected post-translational modifications and protein isoforms. Methods 61, 304–312 (2013).
35. Maxwell, S.A. et al. Analysis of p210bcr-abl tyrosine protein kinase activity in various subtypes of Philadelphia chromosome-positive cells from chronic myelogenous leukemia patients. Cancer Res. 47, 1731–1739 (1987).
36. Copland, M., Hamilton, A. & Holyoake, T.L. Response: conventional western blotting techniques will not reliably quantify p210 BCR-ABL. Blood 109, 1336 (2007).
37. Bendall, S.C. & Nolan, G.P. From single cells to deep phenotypes in cancer. Nat. Biotechnol. 30, 639–647 (2012).
38. Irish, J.M. et al. Single-cell profiling of potentiated phospho-protein networks in cancer cells. Cell 118, 217–228 (2004).
39. Bendall, S.C., Nolan, G.P., Roederer, M. & Chattopadhyay, P.K. A deep profiler’s guide to cytometry. Trends Immunol. 33, 323–332 (2012).
40. Hamilton, A., Alhashimi, F., Myssina, S., Jorgensen, H.G. & Holyoake, T.L. Optimization of methods for the detection of BCR-ABL activity in Philadelphia-positive cells. Exp. Hematol. 37, 395–401 (2009).
41. Protein Simple, Inc. Application Brief, Vol. 1023 http://www.proteinsimple.com/technical_library.html?product=simplewestern&def_list=list (Protein Simple, 2010).
42. Hamilton, A. et al. Chronic myeloid leukemia stem cells are not dependent on Bcr-Abl kinase activity for their survival. Blood 119, 1501–1511 (2012).
43. Hornbeck, P.V. et al. PhosphoSitePlus: a comprehensive resource for investigating the structure and function of experimentally determined post-translational modifications in man and mouse. Nucleic Acids Res. 40, D261–D270 (2012).
44. Konopka, J.B., Watanabe, S.M. & Witte, O.N. An alteration of the human c-abl protein in K562 leukemia cells unmasks associated tyrosine kinase activity. Cell 37, 1035–1042 (1984).
45. Golub, T.R., Barker, G.F., Lovett, M. & Gilliland, D.G. Fusion of PDGF receptor β to a novel ets-like gene, tel, in chronic myelomonocytic leukemia with t(5;12) chromosomal translocation. Cell 77, 307–316 (1994).
46. Cools, J. et al. A tyrosine kinase created by fusion of the PDGFRA and FIP1L1 genes as a therapeutic target of imatinib in idiopathic hypereosinophilic syndrome. N. Engl. J. Med. 348, 1201–1214 (2003).
47. Morris, S.W. et al. Fusion of a kinase gene, ALK, to a nucleolar protein gene, NPM, in non-Hodgkin’s lymphoma. Science 263, 1281–1284 (1994).
48. Nagata, H. et al. Identification of a point mutation in the catalytic domain of the proto-oncogene c-kit in peripheral blood mononuclear cells of patients who have mastocytosis with an associated hematologic disorder. Proc. Natl. Acad. Sci. USA 92, 10560–10564 (1995).
49. Ziegler, S. et al. A novel protein kinase D phosphorylation site in the tumor suppressor Rab interactor 1 is critical for coordination of cell migration. Mol. Biol. Cell 22, 570–580 (2011).
50. Shah, N.P. et al. Transient potent BCR-ABL inhibition is sufficient to commit chronic myeloid leukemia cells irreversibly to apoptosis. Cancer Cell 14, 485–493 (2008).
51. Young, M.A. et al. Structure of the kinase domain of an imatinib-resistant Abl mutant in complex with the Aurora kinase inhibitor VX-680. Cancer Res. 66, 1007–1014 (2006).
52. Zipfel, P.A., Zhang, W., Quiroz, M. & Pendergast, A.M. Requirement for Abl kinases in T cell receptor signaling. Curr. Biol. 14, 1222–1231 (2004).
53. Uemura, N. & Griffin, J.D. The adapter protein Crkl links Cbl to C3G after integrin ligation and enhances cell migration. J. Biol. Chem. 274, 37525–37532 (1999).
54. Senechal, K., Heaney, C., Druker, B. & Sawyers, C.L. Structural requirements for function of the Crkl adapter protein in fibroblasts and hematopoietic cells. Mol. Cell Biol. 18, 5082–5090 (1998).
55. Nichols, G.L. et al. Identification of CRKL as the constitutively phosphorylated 39-kDa tyrosine phosphoprotein in chronic myelogenous leukemia cells. Blood 84, 2912–2918 (1994).
56. ten Hoeve, J., Arlinghaus, R.B., Guo, J.Q., Heisterkamp, N. & Groffen, J. Tyrosine phosphorylation of CRKL in Philadelphia+ leukemia. Blood 84, 1731–1736 (1994).