Antibiotic mediated synthesis of gold nanoparticles with potent ...
10
Antibiotic mediated synthesis of gold nanoparticles with potent antimicrobial activity and their application in antimicrobial coatings† Akhilesh Rai, a Asmita Prabhune b and Carole C. Perry * a Received 24th March 2010, Accepted 8th June 2010 DOI: 10.1039/c0jm00817f We report a one-pot synthesis of spherical gold nanoparticles (52–22 nm) and their capping with cefaclor, a second-generation antibiotic, without use of other chemicals. The differently sized gold nanoparticles were fabricated by controlling the rate of reduction of gold ions in aqueous solution by varying the reaction temperature (20–70 C). The primary amine group of cefaclor acted as both the reducing and capping agent for the synthesis of gold nanoparticles leaving the b-lactam ring of cefaclor available for activity against microbes. Antimicrobial testing showed that cefaclor reduced gold nanoparticles have potent antimicrobial activity against both Gram-positive (Staphylococcus aureus) and Gram-negative (Escherichia coli) bacteria as compared to cefaclor or gold nanoparticles alone. The minimum inhibition concentrations (MICs) of cefaclor reduced gold nanoparticles were 10 mg mL 1 and 100 mg mL 1 for S. aureus and E. coli respectively. The cefaclor reduced gold nanoparticles were further coated onto poly(ethyleneimine) (PEI) modified glass surfaces to obtain antimicrobial coatings suitable for biomedical applications and were tested against E. coli as an exemplar of activity. The antimicrobial coatings were very robust under adverse conditions (pH 3 and 10), inhibited the growth of E. coli on their surfaces, and could be used many times with retained activity. Results from a combined spectroscopic (FTIR) and microscopic study (AFM) suggest that the action of these novel particles is through the combined action of cefaclor inhibiting the synthesis of the peptidoglycan layer and gold nanoparticles generating ‘‘holes’’ in bacterial cell walls thereby increasing the permeability of the cell wall, resulting in the leakage of cell contents and eventually cell death. Introduction There is great interest in tailoring the size of nanomaterials to achieve unique chemical and physical properties with these materials having increasing importance in biological, 1–3 biomedical, 4,5 catalytic, 6,7 optoelectronic 8–10 and pharmaceu- tical 11,12 applications. For example, metal nanoparticles, magnetic nanoparticles and semiconductor quantum dots and their composite nanomaterials have been conjugated with small molecules such as DNA, drugs and proteins for delivery appli- cations. 13–16 Among drug molecules, many types of antibiotics are commercially available to combat Gram-positive and Gram- negative bacteria; however, the broad use of these antibiotics has caused bacteria to develop resistance against them. It is reported that bacteria have developed a new kind of b-lactamase that gives resistance against b-lactam antibiotics. 17–19 Some approaches to overcome bacterial resistance have been developed such as to change the structure of b-lactam moiety of antibiotics 20–22 and to synthesize new antibiotics of high efficiency 23–26 although these methods are time consuming and are often not economically feasible. Many reports are available in the literature on the antimicro- bial effect of antibiotics conjugated with different nano- particles. 27–32 Due to their large surface area to volume ratio and biocompatibility, inorganic nanoparticles are considered as ideal candidates for carrying large amounts of antibiotics without compromising their activity. 1–12 Additionally, antibiotics and inorganic nanoparticles are often used together as advanced antimicrobial agents due to their ability to act in concert, often having enhanced effectiveness. The advantage of using both antibiotics and inorganic nanoparticles together is that if bacteria have resistance against one of the components, a further component could kill them in a different manner. As examples, Gu et al. have reported the enhanced antimicrobial activity of vancomycin coated gold nanoparticles on vancomycin resistant enterococci (VRE). 27 Similarly Grace and Pandian and Saha et al. have shown that coatings of aminoglycosidic antibiotics on gold nanoparticles have an antibacterial effect on a range of Gram-positive and Gram-negative bacteria. 28,29 Li’s group have shown the synergistic effect of the antibiotic (amoxicillin) with silver nanoparticles against Escherichia coli bacteria. 30 Cipro- floxacin coated SiO 2 31 and lysozyme coated single walled carbon nanotubes (SWNTs) 32 have also been used against microorgan- isms as antibacterial agents. However, the above-mentioned approaches require a large amount of the specific antibiotic and a sequence of multiple steps such as synthesis of nanoparticles followed by the functionalization of the surface and finally binding of antibiotics on the surface of nanoparticles is required before they can be used. To our knowledge, there is only one paper in the literature where an attempt has been made to a School of Science and Technology, Nottingham Trent University, Clifton Lane, Nottingham, NG, 11 8NS, UK. E-mail: [email protected] b Biochemical Sciences Division, National Chemical Laboratory, Pune, 411008, India † Electronic supplementary information (ESI) available: TEM images of NaBH 4 reduced gold nanoparticles, UV-vis spectra of gold nanoparticles, digital images of S. aureus and E. coli plates and FTIR spectra of gold-coated surfaces. See DOI: 10.1039/c0jm00817f This journal is ª The Royal Society of Chemistry 2010 J. Mater. Chem., 2010, 20, 6789–6798 | 6789 PAPER www.rsc.org/materials | Journal of Materials Chemistry
-
Upload
khangminh22 -
Category
Documents
-
view
3 -
download
0
Transcript of Antibiotic mediated synthesis of gold nanoparticles with potent ...
PAPER www.rsc.org/materials | Journal of Materials Chemistry
Antibiotic mediated synthesis of gold nanoparticles with potent antimicrobialactivity and their application in antimicrobial coatings†
Akhilesh Rai,a Asmita Prabhuneb and Carole C. Perry*a
Received 24th March 2010, Accepted 8th June 2010
DOI: 10.1039/c0jm00817f
We report a one-pot synthesis of spherical gold nanoparticles (52–22 nm) and their capping with
cefaclor, a second-generation antibiotic, without use of other chemicals. The differently sized gold
nanoparticles were fabricated by controlling the rate of reduction of gold ions in aqueous solution by
varying the reaction temperature (20–70 �C). The primary amine group of cefaclor acted as both the
reducing and capping agent for the synthesis of gold nanoparticles leaving the b-lactam ring of cefaclor
available for activity against microbes. Antimicrobial testing showed that cefaclor reduced gold
nanoparticles have potent antimicrobial activity against both Gram-positive (Staphylococcus aureus)
and Gram-negative (Escherichia coli) bacteria as compared to cefaclor or gold nanoparticles alone. The
minimum inhibition concentrations (MICs) of cefaclor reduced gold nanoparticles were 10 mg mL�1
and 100 mg mL�1 for S. aureus and E. coli respectively. The cefaclor reduced gold nanoparticles were
further coated onto poly(ethyleneimine) (PEI) modified glass surfaces to obtain antimicrobial coatings
suitable for biomedical applications and were tested against E. coli as an exemplar of activity. The
antimicrobial coatings were very robust under adverse conditions (pH 3 and 10), inhibited the growth
of E. coli on their surfaces, and could be used many times with retained activity. Results from
a combined spectroscopic (FTIR) and microscopic study (AFM) suggest that the action of these novel
particles is through the combined action of cefaclor inhibiting the synthesis of the peptidoglycan layer
and gold nanoparticles generating ‘‘holes’’ in bacterial cell walls thereby increasing the permeability of
the cell wall, resulting in the leakage of cell contents and eventually cell death.
Introduction
There is great interest in tailoring the size of nanomaterials
to achieve unique chemical and physical properties with
these materials having increasing importance in biological,1–3
biomedical,4,5 catalytic,6,7 optoelectronic8–10 and pharmaceu-
tical11,12 applications. For example, metal nanoparticles,
magnetic nanoparticles and semiconductor quantum dots and
their composite nanomaterials have been conjugated with small
molecules such as DNA, drugs and proteins for delivery appli-
cations.13–16 Among drug molecules, many types of antibiotics
are commercially available to combat Gram-positive and Gram-
negative bacteria; however, the broad use of these antibiotics has
caused bacteria to develop resistance against them. It is reported
that bacteria have developed a new kind of b-lactamase that gives
resistance against b-lactam antibiotics.17–19 Some approaches
to overcome bacterial resistance have been developed such as to
change the structure of b-lactam moiety of antibiotics20–22 and to
synthesize new antibiotics of high efficiency23–26 although these
methods are time consuming and are often not economically
feasible.
aSchool of Science and Technology, Nottingham Trent University, CliftonLane, Nottingham, NG, 11 8NS, UK. E-mail: [email protected] Sciences Division, National Chemical Laboratory, Pune,411008, India
† Electronic supplementary information (ESI) available: TEM images ofNaBH4 reduced gold nanoparticles, UV-vis spectra of goldnanoparticles, digital images of S. aureus and E. coli plates and FTIRspectra of gold-coated surfaces. See DOI: 10.1039/c0jm00817f
This journal is ª The Royal Society of Chemistry 2010
Many reports are available in the literature on the antimicro-
bial effect of antibiotics conjugated with different nano-
particles.27–32 Due to their large surface area to volume ratio and
biocompatibility, inorganic nanoparticles are considered as ideal
candidates for carrying large amounts of antibiotics without
compromising their activity.1–12 Additionally, antibiotics and
inorganic nanoparticles are often used together as advanced
antimicrobial agents due to their ability to act in concert, often
having enhanced effectiveness. The advantage of using both
antibiotics and inorganic nanoparticles together is that if
bacteria have resistance against one of the components, a further
component could kill them in a different manner. As examples,
Gu et al. have reported the enhanced antimicrobial activity of
vancomycin coated gold nanoparticles on vancomycin resistant
enterococci (VRE).27 Similarly Grace and Pandian and Saha
et al. have shown that coatings of aminoglycosidic antibiotics on
gold nanoparticles have an antibacterial effect on a range of
Gram-positive and Gram-negative bacteria.28,29 Li’s group have
shown the synergistic effect of the antibiotic (amoxicillin) with
silver nanoparticles against Escherichia coli bacteria.30 Cipro-
floxacin coated SiO231 and lysozyme coated single walled carbon
nanotubes (SWNTs)32 have also been used against microorgan-
isms as antibacterial agents. However, the above-mentioned
approaches require a large amount of the specific antibiotic and
a sequence of multiple steps such as synthesis of nanoparticles
followed by the functionalization of the surface and finally
binding of antibiotics on the surface of nanoparticles is required
before they can be used. To our knowledge, there is only one
paper in the literature where an attempt has been made to
J. Mater. Chem., 2010, 20, 6789–6798 | 6789

synthesize quasi-spherical and anisotropic gold nanoparticles
using the antibiotic cephalexin but the antibacterial effect of
these particles was not studied.33 In this paper, we describe
a single pot synthesis of spherical gold nanoparticles of different
sizes using the b-lactam antibiotic, cefaclor, as both reducing and
capping agent at a range of temperatures (20 �C to 70 �C) and
describe their potent antimicrobial activity.
The modification of surfaces with antimicrobial agents to
prevent the growth of harmful microorganisms has received
much attention for application in biomedical devices and health
as well as in the food and personal hygiene industries. Antimi-
crobial coatings are required to have antibacterial efficacy, ease
of fabrication and low toxicity. Copper and copper alloy
surfaces,34,35 bacteriophage modified surfaces,36 polymers,37–39
polycationic modified surfaces,40–42 photosensitiser coated
surfaces43,44 as well as silver and silver containing surfaces45,46
have been extensively used as antimicrobial coatings, albeit
increasing exposure of these materials to microbes eventually
leads to the increased occurrence of resistance to treatment. In
our study, cefaclor reduced gold nanoparticles have been used to
coat poly(ethyleneimine) (PEI) modified glass surfaces to obtain
highly effective and robust antimicrobial coatings. This proce-
dure might be useful for coating biomedical devices,47–49
implants,47–49 textile fibres for the treatment of wounds or
burns50,51 and glass windows and other surfaces to maintain
hygienic conditions in the home, in hospitals and elsewhere.
Experimental
Materials
All chemicals (HAuCl4, cefaclor (C15H14ClN3O4S, (6R,7R)-7-
{[(2R)-2-amino-2-phenylacetyl]amino}3-chloro-8-oxo-5-thia-
1-azabicyclo[4.2.0]oct-2-ene-2-carboxylic acid), sodium boro-
hydride, and poly(ethyleneimine)) were purchased from Sigma
Aldrich and used as received. All glassware were cleaned
with soap solution followed by aqua regia (1 mL HNO3
(15.9 M) : 3 mL HCL (12 M)) and rinsed with double-distilled
water. Cellulose dialysis membrane (10 kDa) was purchased
from Spectrum Laboratory Inc. Staphylococcus aureus and
E. coli cultures were used for the antibacterial study.
Synthesis and characterization of nanoparticles
An example synthesis is as follows. 100 mL of 10�2 M gold ions
(AuCl4�) were added to 9.8 mL water followed by the addition of
100 mL of 10�2 M cefaclor for the reduction of gold ions at
different temperatures (20–70 �C). Time dependent UV-vis
spectra (0–24 h) were recorded using a Unicam UV2 UV-Vis
spectrophotometer at resolution of 0.5 nm to monitor the
reduction of gold ions. Transmission electron microscopy (TEM)
measurements of the size and shape of gold nanoparticle samples
were carried out on Jeol 2010 instrument operated at accelerating
voltage of 200 kV. Samples for TEM measurements were
prepared by placing a drop of the gold nanoparticle solution on
carbon-coated copper grids and air-drying for 5 min. After
5 min, any remaining solution was carefully removed by wicking
with a tissue paper and the grids were left to dry completely
at room temperature. A minimum of 100 particles was measured
using ImageJ software. The size of gold nanoparticles
6790 | J. Mater. Chem., 2010, 20, 6789–6798
synthesized at different temperatures was also measured by
dynamic light scattering (DLS) using a Malvern Instrument
(model Nano-S). Samples of gold nanoparticles for atomic force
microscopy (AFM) were prepared by solution casting onto
silicon wafers (111) to make thin films. These films were analysed
in non-contact mode using a Pacific Nanotechnology Nano-R2
instrument with SiN probes at a scan rate of 0.5 Hz in air.
The synthesized gold nanoparticle solutions were dialyzed
using 10 kDa cut-off cellulose membrane against double-distilled
water for 24 h. Before dialysis, the membrane was processed to
remove any organic contamination according to the procedure
suggested by the manufacturer. The dialyzed gold nanoparticles
were frozen in liquid nitrogen and freeze-dried at 223 K using
a Christ alpha freeze dryer. The binding of cefaclor to gold
nanoparticles was analyzed by FTIR spectroscopy in trans-
mission mode using a Nicolet Magna IR-750 spectrophotometer
at 4 cm�1 resolution with 64 scans. 2 mg of the dried powder
(cefaclor reduced Au nanoparticles/cefaclor) were mixed with
198 mg KBr and pellatized at 10 tons pressure to make discs.
Thermogravimetric analysis (TGA) of cefaclor reduced gold
nanoparticles and cefaclor powder was performed using a
Mettler-Toledo (TGA/SDTA851e) instrument over a tempera-
ture range of 30–700 �C at a heating rate of 10 �C min�1 in the
presence of N2 gas.
Antimicrobial activity testing
S. aureus and E. coli were grown at 37 �C and maintained on LB
plates (Luria–Bertani broth with 1.5% agar). Bacteria were also
grown in LB media for 24 h at 37 �C and cell counts were
quantified by OD590 measurements. Different amounts of cefa-
clor reduced gold nanoparticles and cefaclor (10–500 mg mL�1) as
well as gold nanoparticles (500 mg mL�1) were added into
bacterial suspensions (108 CFU mL�1) and incubated for 6 h at
37 �C. 100 mL aliquots were taken out from the respective
suspensions at 2 h intervals and diluted in saline to give 103
bacteria per mL and plated on LB agar plates followed by
incubation at 37 �C. Colonies were visualized after 24 h and
digital images of plates were captured. 100 mL treated and
untreated bacterial suspensions were dried to make films on Si
wafers (111) and AFM measurements in non-contact mode were
performed immediately. Cross-sectional analysis of AFM images
was performed to understand the depth of holes formed in the
treated bacteria.
Film formation and antimicrobial study
Glass slides were rigorously cleaned before use by submerging
into piranha solution (30% H2O2 + 70% H2SO4) for 1 h.
Subsequently they were washed with copious amounts of double
distilled water. The washed glass slides were dipped in 5 mg mL�1
PEI solution for 12 h followed by washing with water to remove
unbound PEI. PEI coated glass slides were treated with cefaclor
reduced gold nanoparticle solution (synthesized at 20 �C) for 24 h
to deposit gold films followed by drying using a stream of N2 gas.
The deposition of gold nanoparticles was monitored as a func-
tion of time using UV-vis spectroscopy. Gold coated glass slides
were dipped in HCl (pH 3) and KOH (pH 10) solutions and time
dependent UV-vis spectra of slides were recorded to estimate the
This journal is ª The Royal Society of Chemistry 2010

leaching of gold nanoparticles from the coated slides. To test
antimicrobial activity of the treated gold slides, the treated gold
slides (coated surface faced upward) and a plain glass slide were
placed on LB agar plates and 100 mL E. coli suspension were
cultured and incubated at 37 �C. The digital images of growing
bacterial colonies were captured the next day. The same slides
were removed from plates followed by washing with copious
amounts of water and reused five times to check the reusability
and remaining antimicrobial activity.
Fig. 2 Representative TEM images of the gold nanoparticles synthe-
sized at 20 �C (A), 30 �C (B), 40 �C (C), 50 �C (D), 60 �C (E) and 70 �C
(F). Scale bar presented in TEM images (A–F) is 200 nm. Insets show
Results and discussion
The synthesis of gold nanoparticles by the reduction of aqueous
gold ion solution (10�4 M) after exposure to cefaclor solution
(10�4 M) at various temperatures (20–70 �C) was followed by
UV-vis spectroscopy. It is well known that gold nanoparticles
exhibit a ruby red colour in aqueous solution due to the surface
plasmon resonance (SPR) of metal nanoparticles.52 Fig. 1A
shows UV-vis spectra of the aqueous gold nanoparticle solutions
synthesized as a function of increasing temperature (20–70 �C),
spectra being recorded after completion of the reaction. The UV-
vis spectrum of gold nanoparticles synthesized at 20 �C clearly
shows an intense surface plasmon resonance (SPR) band at
540 nm along with a small hump in a range from 620 to 750 nm
(curve 1, Fig. 1A). The presence of the small hump could be due
to the formation of a small population of triangular nano-
particles.52 Supporting evidence for this observation was
obtained by TEM analysis of nanoparticles from this solution
Fig. 1 (A) Representative UV-vis spectra of gold nanoparticles
synthesized using cefaclor at 20 �C (curve 1), 30 �C (curve 2), 40 �C (curve
3), 50 �C (curve 4), 60 �C (curve 5) and 70 �C (curve 6). Inset shows the
absorbance maxima of curves 1–6 vs. temperature. The absorption
maxima of the gold nanoparticle spectra were determined after spectra
were smoothed (11 point adjacent averaging) and the derivative spectra
obtained (Origin software). (B) DLS data, the size of gold nanoparticles
versus temperature. (C) Maximum time for the complete reduction of
gold ions using cefaclor at different temperatures. (D) UV-vis spectra of
gold nanoparticles synthesized using NaBH4 (curve 1), after binding
of cefaclor to NaBH4 reduced gold nanoparticles (curve 2) and the gold
nanoparticles synthesized using cefaclor at 20 �C (curve 3).
particle size distributions of gold nanoparticles at different temperatures.
Different bin sizes were used to obtain information on the size distribu-
tion of the particles appropriate to the samples investigated.
This journal is ª The Royal Society of Chemistry 2010
(Fig. 2A). Curves 2–6 correspond to UV-vis spectra of gold
nanoparticles synthesized at 30, 40, 50, 60 and 70 �C respectively.
A comparison of the spectra showed that as the temperature
increased, the surface plasmon resonance (SPR) band blue shif-
ted monotonically to lower wavelength from 540 at 20 �C to
532 nm at 60 and 70 �C (Fig. 1A, inset). The blue shift in the SPR
band is symptomatic of a reduction in the size of gold nano-
particles synthesized with increasing temperature. The similar
effect on the size of triangular gold nanoparticles synthesized
using a biological approach has also been observed by Sastry’s
group.53,54 This result is also in agreement with TEM images and
DLS analysis of gold nanoparticles synthesized using cefaclor in
this study that show a decrease in size of nanoparticles from
52� 1.5 nm to 23� 2 nm with increasing temperature from 20 to
60 �C of the reaction solution (Fig. 1B and 2, insets). The particle
size distribution of gold nanoparticles using TEM images
correlates well with the DLS analysis. TEM images clearly show
the presence of a few triangular nanoparticles produced in the
lower temperature reaction solutions (20–40 �C) due to the slow
reduction of gold ions using cefaclor (Fig. 2A).53,54 Interestingly,
there is no change in the SPR band position and the size of gold
nanoparticles synthesized at 60 and 70 �C, indicating that satu-
ration of gold ion (AuCl4�) reduction using cefaclor has been
reached by 60 �C (Fig. 1A and 2).
The synthesis of gold nanoparticles using cefaclor at different
temperatures (20–70 �C) was followed as a function of time by
J. Mater. Chem., 2010, 20, 6789–6798 | 6791

UV-vis spectroscopy (raw data not shown). The results are
shown as a time vs. temperature plot (Fig. 1C). The reduction
of gold ions (AuCl4�) using cefaclor was completed after 24 h of
reaction in solution at 20 �C. A drastic reduction in the time of
gold ion reduction was observed when the reaction was performed
at higher temperatures. With increasing temperatures from 30 to
70 �C, the reaction time was reduced to 4 h and finally to 30 min
respectively (Fig. 1C). It is well known that amine groups can
easily protonate in acidic or neutral solution and transfer elec-
trons to gold ions (Au3+), leading to the formation of Au0 (nuclei)/
Au–amine complexes via simple amine chemistry.55–60 The
synthesis of gold nanoparticles of different sizes is a kinetically
driven process.54 Increasing the reaction temperature during the
reduction of gold ions (AuCl4�) using cefaclor leads to an increase
in the rate of reduction of the gold ions, which promotes an
enhanced nucleation rate with the formation of a large population
of nuclei.61–63 Gold ions are further reduced on the surface of gold
nuclei, thus promoting the formation of spherical gold nano-
particles of smaller sizes, which are subsequently capped and
stabilized by cefaclor (Scheme 1).59 Within another possible three-
step growth mechanism, gold nuclei (2 nm) first form bigger
particles (4 nm) through coalescence64 or Oswald ripening.65 The
second stage comprises the slow growth of particles by diffusion
of reduced gold precursors. In the final stage, the particles from
the second stage again coalesce and particles grow to their final
size, the size being dependent on the complete consumption of
gold ions or reducing agents (Scheme 1).66 An increase of reaction
temperature causes each phase of the reaction to proceed faster,
leading to the formation of smaller gold nanoparticles. The
increase in formation rate suggests that the reduction rate of gold
ions is a critical factor that determines the size of nanoparticles in
this system.
UV-vis spectra of NaBH4 reduced gold nanoparticles and
cefaclor bound to NaBH4 reduced gold nanoparticles are shown
in Fig. 1D. Curve 1 corresponds to NaBH4 reduced gold nano-
particles and shows a sharp SPR band with an absorbance
maximum at 520 nm, indicating the formation of monodisperse
gold nanoparticles, which is in agreement with TEM analysis
(Fig. S1A, ESI†). The red shift of 7 nm with respect to curve 1
Scheme 1 Schematic representation of two possible mechanisms for the
synthesis of gold nanoparticles. It should be noted that the scheme is not
to scale.
6792 | J. Mater. Chem., 2010, 20, 6789–6798
and a broad SPR band centred at 528 nm (curve 2) can be
attributed to the surface modification of NaBH4 reduced gold
nanoparticles using cefaclor and the formation of a small pop-
ulation of aggregated gold nanostructures in solution as also
observed using TEM analysis (Fig. S1B†). The nature of curve 3
(corresponds to the gold nanoparticles synthesized using cefaclor
at 20 �C) differs from curves 1 and 2, suggesting that the synthesis
method using cefaclor at 20 �C produces a small population of
triangular gold nanoparticles in addition to spherical particles as
discussed above (Fig. 2A).
Solutions of cefaclor reduced gold nanoparticles at different
temperatures had a long-term stability and showed no sign of
aggregation even after storage for six months. Such long-term
stability of the gold nanoparticles indicated that nanoparticles
were well bound with cefaclor. Cefaclor bound on the surface of
the gold nanoparticles did not show an increase in intensity of
signal at ca. 264 nm in the UV region, characteristic of cefaclor,
indicating no leaching of cefaclor from the surface of the gold
nanoparticles (Fig. S2A†).67–69 The freeze-dried powder of gold
nanoparticles synthesized at different temperatures were easily
redispersed in water after ultrasonication for 15 min, showing
stability and easy storage of cefaclor bound gold nanoparticles in
the form of a powder (Fig. S2B†).
The cefaclor bound gold nanoparticles were analyzed by
thermogravimetric analysis (TGA) in order to obtain quantita-
tive information on cefaclor content. The initial 1.5% to 8%
weight loss in temperature region of 30 to 200 �C is due to
desorption of water molecules from the surface of the gold
nanoparticles (Fig. 3A). A total weight loss (100%) of cefaclor
was observed in multiple distinct steps until 660 �C (curve 1) with
initial gradual and then rapid loss at higher temperature. TGA
data of cefaclor reduced gold nanoparticles synthesized at 20, 40
and 70 �C show 60, 57 and 52% weight loss, respectively, of
cefaclor in three distinct steps of weight losses at 200 to 276 �C,
276 to 470 �C and 470 to 660 �C temperature regions respectively
(curves 2–4, Fig. 3A and B). From TGA measurements, it was
confirmed that a larger amount of cefaclor was used in the
reduction of gold ions and subsequent binding to the gold
nanoparticles during synthesis and post-synthesis at 20 �C than
at higher temperatures (Fig. 3A and B). The formation of larger
gold nanoparticles requires more gold nuclei/Au–amine
complexes to coalesce to form the final gold nanoparticles, which
mirrored a higher loading of cefaclor on the gold nanoparticles
synthesized at 20 �C (Fig. 3A and B). We suggest that the slow
rate of reduction at 20 �C also provides a long-time for the
interaction of cefaclor with gold nanoparticles in the reaction
solution, leading to the binding of a large amount of cefaclor.
The three distinct weight losses at three different temperature
regions indicate that there may be three different modes of
interaction between cefaclor and gold nanoparticles.70,71 A small
amount of weight loss in the lower temperature region is
suggestive of the physical adsorption of cefaclor on the surface of
gold nanoparticles via rearrangement of bound cefaclor mole-
cules.70 The maximum weight loss in the 276 to 470 �C region is
a result of the covalent interaction of an amine group with the
gold nanoparticles, indicating that higher energy is required to
decompose/desorb the cefaclor from gold nanoparticles.71 The
third loss at higher temperature region (515 to 660 �C) is most
likely due to the electrostatic interaction of the amine group of
This journal is ª The Royal Society of Chemistry 2010

Fig. 3 (A) TGA analysis of cefaclor (curve 1), cefaclor reduced gold nanoparticles at 20 �C (curve 2), 40 �C (curve 3), 70 �C (curve 4) and cefaclor bound
on NaBH4 reduced gold nanoparticles (curve 5). (B) TGA analysis of cefaclor content (%) in the gold nanoparticles synthesized at different temper-
atures. (C) FTIR measurement of cefaclor (curve 1) and cefaclor reduced gold nanoparticles at 20 �C (curve 2). An inset shows the chemical structure of
cefaclor. The square in the chemical structure indicates the b-lactam ring of the antibiotic.
cefaclor with negatively charged AuCl4� ions present on the
surface of gold nanoparticles. Gold is known to bind strongly
with organic molecules containing amine groups.72,73 TGA data
suggest that after being electrostatically attached to gold nano-
particles, cefaclor binds to gold nanoparticles through covalent
and physical interactions. Curve 5 shows a 42% weight loss for
cefaclor bound on NaBH4 reduced gold nanoparticles, which is
less than the weight loss of cefaclor reduced gold nanoparticles,
indicating the weaker interaction of cefaclor to gold surfaces.
To complement the TGA data, Fourier transform infrared
(FTIR) spectroscopy was performed to analyze the binding of
cefaclor on the surface of gold nanoparticles. Curve 1, Fig. 3C,
shows the characteristic FTIR spectrum of cefaclor with bands at
1770 cm�1 (C]O group of four membered ring lactams and
COOH functional group), 1697 cm�1 (C]O group), 1605 cm�1
(primary amine), 1505 cm�1 (C]C ring stretch) and 1415 cm�1
(C–N stretch).74–76 The characteristic b-lactam ring vibrations
were also observed at 1418, 1395 and 1357 cm�1 in curve 1,
Fig. 3C, as suggested by Gil et al.76 The band at 1625 cm�1 for
cefaclor reduced gold nanoparticles (curve 2, Fig. 3C) could be
assigned to an amine group, which is shifted to a higher wave-
number compared to the primary amine of pure cefaclor
(1604 cm�1), indicating that the primary amine group of cefaclor
acts as the reducing and capping agent for the synthesis of gold
nanoparticles. Other FTIR bands corresponding to different
functional groups and the b-lactam ring of cefaclor reduced gold
nanoparticles (curve 2) do not show shifts in band positions
Fig. 4 Histogram plot showing antimicrobial activity of cefaclor reduced g
E. coli bacteria (B) after different times of incubation at 37 �C.
This journal is ª The Royal Society of Chemistry 2010
compared to the FTIR spectrum of the plain cefaclor (curve 1,
Fig. 3C). It could be inferred from this result that the b-lactam
ring, which is responsible for antimicrobial activity of cefaclor, is
present in free form on the surface of gold nanoparticles (an inset
of Fig. 3C).
After characterization of cefaclor bound gold nanoparticles
using various techniques, gold nanoparticles synthesized at
20 �C, due to the high loading of cefaclor on the surface of the
nanoparticles, were tested for antibacterial activity against
Gram-positive (S. aureus) and Gram-negative (E. coli) bacteria.
All antibacterial activity tests were performed in triplicate and
were performed at different times to certify the reproducibility of
behaviour. 10 mg mL�1 to 500 mg mL�1 cefaclor bound gold
nanoparticle solutions were added to S. aureus and E. coli
suspensions and were incubated for 24 h at 37 �C. Antibacterial
kinetics was analyzed by plotting colony forming unit (CFU)
versus incubation time, which provides evidence for the effec-
tiveness of the nanomaterials (Fig. 4). As the incubation time
increases, CFU of the bacterial population (S. aureus) decreased
with increasing amount of cefaclor bound gold nanoparticles.
Fig. 4A showed that after 4 h of incubation, no bacterial
colony (S. aureus) was observed for the lowest concentration
(10 mg mL�1) of cefaclor reduced gold nanoparticles although
200 mg mL�1 cefaclor reduced gold nanoparticles was adequate to
kill most bacteria (99%) in 2 h. In contrast, a small population of
bacteria (32 CFU) compared to the control (320 CFU) was
observed for a 10 mg mL�1 concentration of cefaclor after 4 h,
old nanoparticles, gold nanoparticles and cefaclor on S. aureus (A) and
J. Mater. Chem., 2010, 20, 6789–6798 | 6793

indicating a slow rate of inhibition of bacterial growth as
compared to the result obtained with the cefaclor reduced gold
nanoparticles (Fig. 4A). No bactericidal activity was observed
for 500 mg mL�1 gold nanoparticles without cefaclor (Fig. 4)
most likely due to the presence of a peptidoglycan layer on cell
wall of S. aureus that does not allow the penetration of gold
nanoparticles. The images of bacterial growth with increasing
incubation time and increasing concentration of cefaclor bound
gold nanoparticles are shown in Fig. S3.† The minimum time
required to inhibit the complete growth of S. aureus in solution
using cefaclor was 6 h. The MIC (minimum inhibition concen-
tration) is defined as the lowest concentration (mg mL�1) of drug
that inhibits visible growth of microorganisms on the culture
plate.77 The MICs of Gram-positive bacteria (S. aureus)
obtained from cefaclor reduced gold nanoparticles and cefaclor
were 10 mg mL�1 and 50 mg mL�1 respectively (Fig. 4A). A lower
MIC corresponds to a higher antibacterial effectiveness, indi-
cating the superior antimicrobial activity of cefaclor reduced
gold nanoparticles than cefaclor or gold nanoparticles alone. A
single gold nanoparticle, having a high surface to volume ratio,
would contain a large number of cefaclor molecules, acting as
a single group against bacteria. Perhaps this is the reason that
cefaclor reduced gold nanoparticles rather than cefaclor are more
potent antimicrobial agents against bacteria. Cefaclor, as
a second-generation antibiotic of the cephalosporin family, has
the same mode of antibacterial action as other b-lactam
Fig. 5 Representative height mode AFM images of S. aureus treated with ce
and plain S. aureus without the treatment (C). Phase mode images (D–F) and
(A–C).
6794 | J. Mater. Chem., 2010, 20, 6789–6798
antibiotics by disrupting the synthesis of the peptidoglycan layer
of bacterial cell walls. Cefaclor interacts strongly with the outer
peptidoglycan layer of Gram-positive bacteria, resulting in the
loss of membrane integrity along with the development of pores
on the cell wall, as evidenced by AFM analysis (Fig. 5A and D).
The presence of pores in the cell wall leads to increased perme-
ability, leakage of the cell contents and ultimately cell death.
A height mode AFM image shows that the cell wall structure
of S. aureus changed significantly after treatment with cefaclor
reduced gold nanoparticles (Fig. 5B). The cell wall was observed
to be severely damaged and punctured after treatment while
a smooth cell wall of S. aureus is observed in the control exper-
iment (without exposure to cefaclor reduced gold nanoparticles)
(Fig. 5C). The origin of the ‘‘holes’’ in the cell wall can be
described as fissures, which are formed due to the penetration of
gold nanoparticles through a porous membrane. The ‘‘holes’’ in
the AFM images are observed due to the free movement of
damaged membrane as compared to the surrounding intact
structure when force is applied on them by the AFM tip during
scanning.78 The formation of grooves and pore-like lesions as
well as the collapse of cell wall structures can also be seen after
treatment with both cefaclor and cefaclor reduced gold nano-
particles in contrast to the uniform cell wall of S. aureus (without
treatment) in the phase mode AFM images (Fig. 5D–F). The
leakage of a substantial amount of the cell contents from
damaged cells can be found around the bacterial cell as assessed
faclor (A), S. aureus treated with cefaclor reduced gold nanoparticles (B)
cross-sectional analysis (G-I), of the corresponding height mode images
This journal is ª The Royal Society of Chemistry 2010
in both height and phase mode images (Fig. 5). Other researchers
have also observed the same features in AFM images of anti-
bacterial peptide damaged bacteria.79 In the phase images it was
clearly visible that the outer rigid peptidoglycan layer of the cell
was almost intact after treatment (Fig. 5D–F). However, cross-
sectional analysis reveals that the smoothness, roughness and
height of the cell wall have changed dramatically (Fig. 5G–I).
The damaged cell shows increased roughness with decreased
height due to the collapsed cell wall compared to that of the
smooth surface of S. aureus (without treatment) in AFM imaging
mode and as assessed by cross-sectional analysis (Fig. 5). It can
also be observed in cross-sectional analysis that pores on the
surface of cefaclor reduced gold nanoparticle treated bacteria
are much deeper than those on cefaclor treated bacteria (Fig. 5G
and H).
It is also important to observe the antimicrobial effect of
cefaclor reduced gold nanoparticles and cefaclor on Gram-
negative bacteria that have a thin peptidoglycan layer adjacent to
the inner cytoplasmic membrane, which makes them have little
resistance against cefaclor. In case of E. coli, a longer incubation
time of 6 h with 100 mg mL�1 cefaclor reduced gold nanoparticles
was required to inhibit the complete growth of bacteria in culture
media (Fig. 4B and S4†). The MIC of cefaclor reduced gold
nanoparticles on E. coli is 100 mg mL�1, which is ten times higher
than the MIC of S. aureus. There is a gradual decrease in the
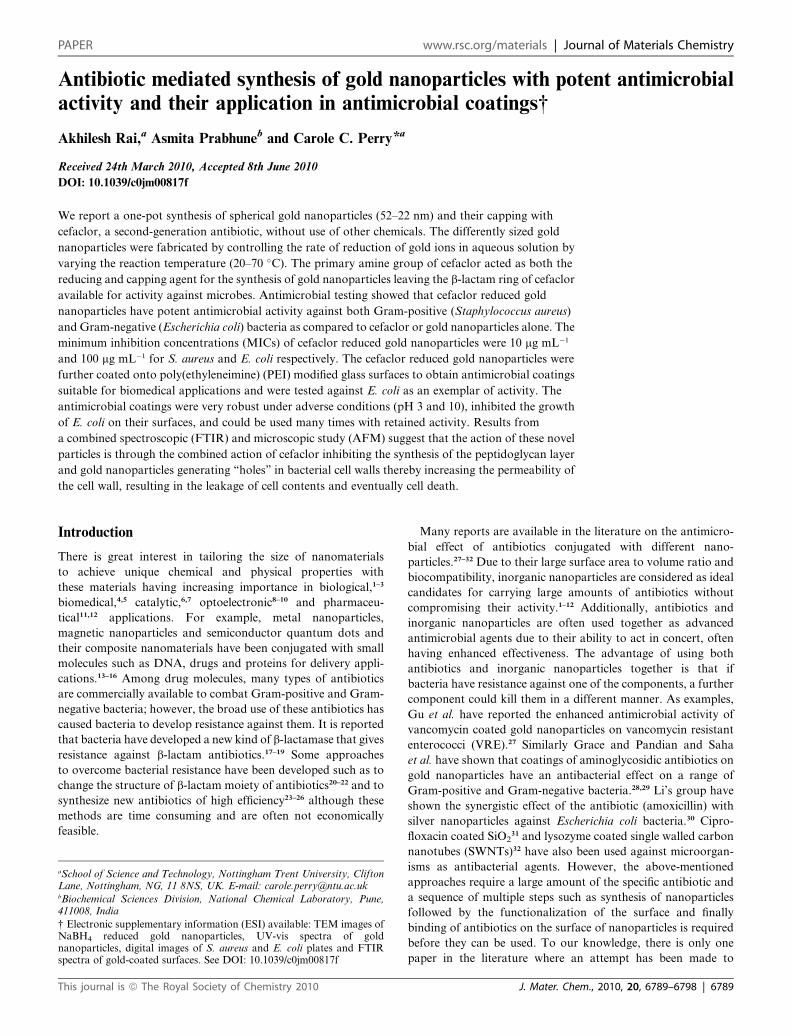
Fig. 6 Representative height mode AFM images of E. coli treated with cefacl
treated with NaBH4 reduced gold nanoparticles (C) and plain E. coli without th
cross-sectional analysis (I–L) are shown.
This journal is ª The Royal Society of Chemistry 2010
population of E. coli with increasing doses and incubation time
(Fig. 4B and S4†). Interestingly, 500 mg mL�1 gold nanoparticles
showed a weak bactericidal activity (10%) with 90% survival.
Cefaclor alone (500 mg mL�1) did not show 100% growth inhi-
bition after 6 h of incubation in contrast to the total growth
inhibition (100%) of S. aureus by cefaclor after a similar incu-
bation time (Fig. 4). This result indicates that cefaclor bound
gold nanoparticles have superior antibacterial activity over both
cefaclor and gold nanoparticles on Gram-negative bacteria.
AFM analysis (Fig. 6A) showed that distinct holes were formed
on the surface of the bacteria along with highly roughened cell
walls due to disruption of the cell wall integrity after treatment
with cefaclor reduced gold nanoparticles.
The formation of holes in the membrane leads to leakage of the
cell contents and death of the bacteria. Gold nanoparticles
embedded inside the bacterial membrane (marked by arrows) as
well as protrusions of the membrane can also be observed in
AFM images (Fig. 6A). A phase mode AFM image (Fig. 6E)
clearly demonstrates different sizes of embedded gold nano-
particles at three places that are covered by the cell contents and
damaged membranes, indicating the penetration depth of gold
nanoparticles at that time, in agreement with data from the cross-
sectional analysis (Fig. 6I). The AFM images (height and phase
modes) of cefaclor treated bacteria (Fig. 6B and F) show a highly
roughened surface along with the presence of leaked cell contents
or reduced gold nanoparticles (A), E. coli treated with cefaclor (B), E. coli
e treatment (D). The corresponding phase mode AFM images (E–H) and
J. Mater. Chem., 2010, 20, 6789–6798 | 6795

Fig. 7 (A) UV-vis spectra of cefaclor reduced gold nanoparticle films after coating at 0 min (curve 1), 30 min (curve 2), 60 min (curve 3), 2 h (curve 4),
4 h (curve 5), 6 h (curve 5), 8 h (curve 6), 22 h (curve 7) and 24 h (curve 8). Curve 9 corresponds to the UV-vis spectrum of the gold films after drying. (B
and C) UV-vis spectra of gold films treated at pH 3 and 10 for 0 min (curve 1), 1 h (curve 2), 4 h (curve 2), 8 h (curve 3), 12 h (curve 4) and 24 h (curve 5).
to the surrounding area, indicating the soft and fragile nature of
the cell wall after treatment. E. coli treated with only gold
nanoparticles showed bulge like structures on the surface of the
cell wall, which could be gold nanoparticles that contrast with the
smooth cell wall surface of E. coli (Fig. 6C and D). Cross-
sectional analysis shows an increase in height of ca. 53 nm from
the bulge area to the smooth area of the bacteria, which is similar
to the size of the gold nanoparticles used (Fig. 6K and L). It may
be possible that gold nanoparticles interact with the outer
membrane of the bacteria that is composed of lipopolysaccharide
and protein and deposit on the membrane (Fig. 6C and G) in
accordance with the literature on the interaction of gold nano-
particles with lipopolysaccharide and protein.80–84 The deposited
gold nanoparticles could slowly penetrate through porin chan-
nels of the membrane14,85 and/or diffuse through the membrane
bilayer matrix86 and disrupt the membrane integrity, which could
explain the low antibacterial activity of gold nanoparticles after 6
h of incubation.
The mechanism of enhanced antibacterial activity and
advantages of cefaclor reduced gold nanoparticles can be
explained as follows: (1) cefaclor reacts with the outer peptido-
gylcan layer of Gram-positive bacteria thereby increasing the
membrane’s porosity. Subsequently gold nanoparticles penetrate
through the membrane and may be bound to the bacterial DNA,
preventing DNA from unwinding and transcription occur-
ring.13,14,87 Therefore, the combined action of cefaclor and Au
nanoparticles leads to enhanced antibacterial activity. (2) In the
case of Gram-negative bacteria, gold nanoparticles first diffuse
through the membrane as described above and then cefaclor
reacts with the inner peptidogylcan layer, promoting the
formation of holes in the membrane. The penetration process
and subsequent binding of gold nanoparticles to DNA result in
a slower antibacterial effect as compared to the fast activity
observed for Gram-positive bacteria. (3) Cefaclor reduced gold
nanoparticles used after 5 days of synthesis showed 100% anti-
bacterial activity, although pure cefaclor has a half-life of ca. 9 h
with 11% activity in solution,88 indicating gold nanoparticles
enhance the half-life and the activity of cefaclor. (4) Cefaclor and
gold nanoparticles alone have low antibacterial effects compared
to cefaclor reduced gold nanoparticles.
Further, we used cefaclor reduced gold nanoparticles to coat
glass slides in order to obtain antimicrobial coatings. Cefaclor
reduced gold nanoparticles were coated on poly(ethyleneimine)
(PEI) functionalized glass surfaces at pH 5. Amine molecules are
6796 | J. Mater. Chem., 2010, 20, 6789–6798
often employed to functionalize surfaces to provide compatibility
to biomolecules89 as amine containing polymers are known to
interact strongly via physisorption on glass surfaces.89 Time
dependent UV-vis spectra (Fig. 7) show that the intensity of the
SPR band at 545 nm wavelength increases with increasing
incubation time in gold nanoparticle solution, indicating the
deposition of gold nanoparticles on the PEI coated surface as
observed in the optical image of the glass slide (an inset of
Fig. 8A). The saturation of adsorption was reached after 24 h of
deposition without a substantial increase in the absorption
intensity (curves 7 and 8, Fig. 7A). After drying of the gold film,
a large red shift of 24 nm in SPR band position was observed due
to aggregation of gold nanoparticles on the surface (curve 9,
Fig. 7A).
Gold nanoparticle coated slides were treated under acidic (pH
3) and alkaline (pH 10) conditions for 24 h to analyse the stability
of the coatings. UV-vis spectra recorded as a function of time
show that there is no change in the intensity of the absorption
band, indicating strong binding of the gold nanoparticles to PEI
functionalized surfaces (Fig. 7B and C). This result was
concomitant with digital images where no significant visual
changes in the colour of the slides were observed (insets of
Fig. 8B and C). Gold nanoparticles interact with PEI surfaces via
electrostatic interaction at pH 5 as PEI is positively charged and
gold nanoparticles are negatively charged at this pH. AFM
analysis showed that gold nanoparticles were uniformly depos-
ited on PEI coated surfaces and the uniformity and integrity of
gold films were not changed after treatment under different
conditions (Fig. 8A–C).
The antibacterial activity of coated surfaces after treatment
under adverse conditions showed that E. coli did not grow on the
top surface of gold-coated slides (Fig. 8D and E). In contrast,
a plain glass slide showed growth of bacteria on the surface
(Fig. 8F). A clear zone of inhibition around the gold coated glass
slides and the bacterial colony grown up around a plain glass
slide can also be observed (Fig. 8D–F), indicating the effective-
ness and maintenance of antimicrobial activity of surfaces after
treatment under adverse conditions. This observation is sup-
ported by FTIR analysis that shows the characteristic signatures
of cefaclor in the coated surfaces after treatment under adverse
conditions (Fig. S5†). The narrow zone of inhibition was due to
the slow diffusion of cefaclor reduced gold nanoparticles in LB
agar plate. The slow diffusion most probably occurred due to
strong interaction of the amine coated surface with the cefaclor
This journal is ª The Royal Society of Chemistry 2010

Fig. 8 3D-AFM images of cefaclor reduced gold nanoparticle films (A) and after treatment at pH 3 (B) and pH 10 (C). Insets of A–C correspond to
digital images of gold films at different conditions, which were used to obtain AFM images. Antibacterial activity of gold slides treated at pH 3 (D), at
pH 10 (E) and a bare glass slide (F) against E. coli. Insets of (D) and (E) demonstrate higher magnification images of gold slides present inside E. coli
cultured Petri dishes to indicate clearly the zone of inhibition.
reduced gold nanoparticles. It may be possible that the gold
nanoparticles protect the cefaclor from adverse conditions and/
or gold nanoparticles slowly diffuse inside the bacteria to kill
them. We reused the gold coated glass slides 5 times and did not
observe any growth of bacteria on top surface of coated glass
surfaces (data not shown), indicating stability and long term
usage of these slides for the coating purposes under adverse
conditions.
Conclusions
In summary, we have described a simple way to synthesise
spherical gold nanoparticles of size range from 52 to 22 nm using
cefaclor (a second-generation b-lactam antibiotic) at different
temperatures. The rate of reduction of gold ions in solution plays
an important role in determining the size of the synthesized gold
nanoparticles. The amine group of cefaclor acts as both
a reducing and capping agent and therefore the antibacterial
activity of cefaclor is preserved due to the presence of the free b-
lactam ring being available on the surface of the nanoparticles. In
this paper, we have shown that cefaclor reduced gold nano-
particles have potent antimicrobial activity on both Gram-
positive (S. aureus) and Gram-negative bacteria (E. coli)
compared to cefaclor and gold nanoparticles alone. Cefaclor
inhibits the synthesis of the peptidoglycan layer, making cell
walls porous and further the gold nanoparticles generate holes in
the cell wall, resulting in the leakage of cell contents and cell
death. It may also be possible that gold nanoparticles bind to the
DNA of bacteria and inhibit the uncoiling and transcription of
DNA thus promoting the death of bacteria. This paper also
describes the fabrication of robust antimicrobial coatings on
glass slides that retain their antimicrobial activity even under
adverse conditions. The described procedure can further be used
to coat a wide variety of surfaces for instance implants, fabrics
This journal is ª The Royal Society of Chemistry 2010
for treatment of wounds and glass surfaces to maintain hygienic
conditions in the home, in hospitals and other places.
References
1 D. Zhang, O. Neumann, H. Wang, V. M. Yuwono, A. Barhoumi,M. Perham, J. D. Hartgerink, P. Wittung-Stafshede andN. J. Halas, Nano Lett., 2009, 9, 666–671.
2 J. Won, M. Kim, Y.-W. Yi, Y. H. Kim, N. Jung and T. K. Kim,Science, 2005, 309, 121–125.
3 X. Wang and Y. Li, Chem. Commun., 2007, 2901–2910.4 E. L. Que, D. W. Domaille and C. J. Chang, Chem. Rev., 2008, 108,
1517–1549.5 B. G. Trewyn, S. Giri, I. I. Slowing and S.-Y. V. Lin, Chem. Commun.,
2007, 3236–3245.6 H. Tsunoyama, H. Sakurai, N. Ichikuni, Y. Negishi and T. Tsukuda,
Langmuir, 2004, 20, 11293–11296.7 P. Migowski and J. Dupont, Chem.–Eur. J., 2007, 13, 32–39.8 M. A. El-Sayed, Acc. Chem. Res., 2001, 34, 257–264.9 P. Mulvaney, Langmuir, 1996, 12, 788–800.
10 W. P. McConnell, J. P. Novak, L. C. Brousseau, III, R. R. Fuierer,R. C. Tenent and D. L. Feldheim, J. Phys. Chem. B, 2000, 104,8925–8930.
11 R. Bhattacharya and P. Mukherjee, Adv. Drug Delivery Rev., 2008,60, 1289–1306.
12 C. F. Shaw, Chem. Rev., 1999, 99, 2589–2600.13 L. A. Baeur, N. S. Birenbaun and G. J. Meyer, J. Mater. Chem., 2004,
14, 517–526.14 E. Katz and I. Willner, Angew. Chem., Int. Ed., 2004, 43, 6042–6108.15 S. Mornet, S. Vasseur, F. Grasset and E. Duguet, J. Mater. Chem.,
2004, 14, 2161–2175.16 C. M. Niemeyer, Angew. Chem., Int. Ed., 2001, 40, 4128–4158.17 M. Babic, A. M. Hujer and R. A. Bonomob, Drug Resist. Updates,
2006, 9, 142–156.18 B. Helena, L. Andrea, J. Sylvia, M. P. Wolfgang, K. Janka, M. Peter
and K. Milan, Int. J. Antimicrob. Agents, 1998, 10, 135–141.19 H. C. Neu, Science, 1992, 257, 1064–1073.20 M. Souli, B. W. Christine and M. E. George, Int. J. Antimicrob.
Agents, 1998, 10, 23–30.21 H. F. Chambers, Trends Microbiol., 2003, 11, 145–148.22 H. C. Neu, Am. J. Med., 1985, 79, 2–13.23 E. Fonze, M. Vanhove, G. Dive, E. Sauvage, J. M. Frere and
P. Charlier, Biochemistry, 2002, 41, 1877–1885.
J. Mater. Chem., 2010, 20, 6789–6798 | 6797
24 J. Kant and D. G. Walker, in The Organic Chemistry of b-Lactames,ed. G. I. Georg, VCH, New York, 1993, p. 121.
25 J. D. Buynak, D. V. Ramana and G. Adam, Bioorg. Med. Chem.Lett., 2000, 10, 853–857.
26 P. Kirkpatrick, Nat. Rev. Drug Discovery, 2006, 5, 284.27 H. Gu, P. L. Ho, E. Tong, L. Wang and B. Xu, Nano Lett., 2003, 3,
1261–1263.28 A. N. Grace and K. Pandian, Colloids Surf., A, 2007, 297, 63–70.29 B. Saha, J. Bhattacharya, A. Mukherjee, A. K. Ghosh, C. R. Santra,
A. K. Dasgupta and P. Karmarker, Nanoscale Res. Lett., 2007, 2,614–622.
30 P. Li, J. Li, C. Wu, Q. Wu and J. Li, Nanotechnology, 2005, 16, 1912–1917.
31 M. J. Rosemary, I. MacLaren and T. Pradeep, Langmuir, 2006, 22,10125–10129.
32 D. Nepal, S. Balasubramanian, A. Simonian and V. A. Davis, NanoLett., 2008, 8, 1896–1901.
33 R. Jagannathan, P. Poddar and A. Prabhune, J. Phys. Chem. C, 2007,111, 6933–6938.
34 G. Faundez, M. Troncoso, P. Navarrete and G. Figueroa, BMCMicrobiol., 2004, 4, 19.
35 L. J. Wheeldon, T. Worthington, P. A. Lambert, A. C. Hilton,C. J. Lowden and T. S. J. Elliott, J. Antimicrob. Chemother., 2008,62, 522–525.
36 R. Stone, Science, 2002, 298, 728–731.37 M. F. Ilker, K. Nusslein, G. N. Tew and B. E. Coughlin, J. Am. Chem.
Soc., 2004, 126, 15870–15875.38 N. P. Desai, S. F. Hossainy and J. A. Hubbell, Biomaterials, 1992, 13,
417–420.39 B. Dizman, M. O. Elasri and L. Mathias, J. Appl. Polym. Sci., 2004,
94, 635–642.40 A. M. Klibanov, J. Mater. Chem., 2007, 17, 2479–2482.41 J. Haldar, An. D. Q. Cienfuegos, J. Z. Chen and A. M. Klibanov,
Proc. Natl. Acad. Sci. U. S. A., 2006, 103, 17667–17671.42 K. Mukerjee, J. Rivera and A. M. Klibanov, Appl. Biochem.
Biotechnol., 2008, 151, 61–70.43 V. Decraene, J. Pratten and M. Wilson, Appl. Environ. Microbiol.,
2006, 72, 4436–4439.44 R. Bonnett, Chem. Soc. Rev., 1995, 24, 19–33.45 S. Silver, FEMS Microbiol. Rev., 2003, 27, 341–353.46 K. Page, M. Wilson and I. P. Parkin, J. Mater. Chem., 2009, 19, 3819–
3831.47 M. Strathmann and J. Wingerder, Int. J. Antimicrob. Agents, 2004, 24,
234–240.48 U. Samuel and J. P. Guggenbichler, Int. J. Antimicrob. Agents, 2004,
23, 75–S78.49 M. E. Rupp, T. Fitzgerald, N. Marion, V. Helget, S. Puumala,
J. R. Anderson and P. D. Fey, Am. J. Infect. Control, 2004, 32,445–450.
50 D. Lee, R. E. Cohen and M. F. Rubner, Langmuir, 2005, 21, 9651–9659.
51 E. Ulkur, O. Oncul, H. Karagoz, E. Yeniz and B. Celikoz, Burns,2005, 31, 874–877.
52 S. Link and M. A. El-Sayed, Annu. Rev. Phys. Chem., 2003, 54, 331–366.
53 S. S. Shankar, A. Rai, A. Absar and M. Sastry, Chem. Mater., 2005,17, 566–572.
54 A. Rai, A. Singh, A. Ahmad and M. Sastry, Langmuir, 2006, 22, 736–741.
55 X. Sun, S. Dong and E. Wang, Mater. Chem. Phys., 2006, 96, 29–33.56 N. Wangoo, K. K. Bhasin, S. K. Mehta and C. R. Suri, J. Colloid
Interface Sci., 2008, 323, 247–254.57 P.-L. Kuo, C.-C. Chen and M.-W. Jao, J. Phys. Chem. B, 2005, 109,
9445–9450.
6798 | J. Mater. Chem., 2010, 20, 6789–6798
58 P. R. Selvakannan, S. Mandal, R. Pasricha, S. D. Adyanthaya andM. Sastry, Chem. Commun., 2002, 1334–1335.
59 A. Aslam, L. Fu, M. Su, K. Vijaymohan and V. P. Dravid, J. Mater.Chem., 2004, 14, 1795–1797.
60 X. Peng, J. Wickman and A. P. Alivisatos, J. Am. Chem. Soc., 1998,120, 5343–5344.
61 S. S. Shankar, S. Bhargava and M. Sastry, J. Nanosci. Nanotechnol.,2005, 5, 1721–1727.
62 Y.-S. Chiang and J. Turkevich, J. Colloid Sci., 1963, 18, 772–783.63 J. Engelbrecht and H. Shyman, Gold Bull., 1983, 16, 66–69.64 M. Mandal, S. K. Ghosh, S. Kundu, K. Esumi and T. Pal, Langmuir,
2002, 18, 7792–7797.65 G. Madras and B. J. McCoy, J. Chem. Phys., 2002, 117, 8042–8050.66 J. Polte, T. T. Ahner, F. Delissen, S. Sokolov, F. Emmerling,
A. F. Thunemann and R. Kraehnert, J. Am. Chem. Soc., 2010, 132,1296–1301.
67 T. Yamana and A. Tsuji, J. Pharm. Sci., 1976, 65, 1563–1574.68 L. J. Lorens, F. N. Bachore and B. A. Olsen, J. Chromatogr. Sci.,
1992, 30, 211–216.69 R. R. Chauvehe, E. H. Flynn, B. G. Jackson, E. R. Lavagnino,
R. B. Morin, R. A. Muller, R. W. P. Roeske, C. W. Ryan,J. L. Spencer and E. V. Heyningen, J. Am. Chem. Soc., 1962, 84,3401–3402.
70 N. C. Nayak and K. Shin, J. Nanosci. Nanotechnol., 2006, 6, 3512–3516.
71 R. Bhattacharya, C. R. Patra, A. Earl, S. Wang, A. Katarya, L. Lu,J. N. Kizhakkedathu, M. J. Yaszemski, P. R. Greipp,D. Mukhopadhyay and P. Mukherjee, Nanomed.: Nanotechnol.,Biol. Med., 2007, 3, 224–238.
72 L.-H. Chen, A. Dudek, Y.-H. Lee and C.-H. Chang, Langmuir, 2007,23, 3123–3127.
73 K. M. Mayya, A. Gole, N. Jain, S. Phadtare, D. Langevin andM. Sastry, Langmuir, 2003, 19, 9147–9154.
74 W. Bouhedja, G. D. Sockalingham, P. Pina, P. Allouch, C. Bloy,R. Labia, J. M. Millot and M. Manfait, FEBS Lett., 1997, 412, 39–42.
75 N. S. Sosnowska, A. Ocios and L. Fuks, J. Mol. Struct., 2006, 792–793, 110–114.
76 M. Gil, J. L. Nunez, M. A. Palafox and N. Iza, Biopolymers, 2001, 62,278–294.
77 V. Sambhy, M. M. MacBride, B. R. Peterson and A. Sen, J. Am.Chem. Soc., 2006, 128, 9798–9808.
78 P. K. Stoimenov, R. S. Klinger, G. L. Marchin and K. J. Klabunde,Langmuir, 2002, 18, 6679–6686.
79 M. Meinchen, D. L. Holroyd and M. Rautenbach, Antimicrob. AgentsChemother., 2005, 49, 4085–4092.
80 A. Verma, O. Uzun, Y. Hu, Y. Hu, H.-S. Han, N. Watson, S. Chen,D. J. Irvine and F. Stellacci, Nat. Mater., 2008, 7, 588–595.
81 P. He and X. Zhu, Mater. Res. Bull., 2007, 42, 1310–1315.82 A. S. Urban, M. Fedoruk, M. R. Horton, J. O. Radler, F. D. Stefani
and J. Feldmann, Nano Lett., 2009, 9, 2903–2908.83 N. Wangoo, C. R. Suri and G. Shekhawat, Appl. Phys. Lett., 2008, 92,
133104.84 J. Chen, J. A. Hessler, K. Putchakayala, B. K. Panama, D. P. Khan,
S. Hong, D. G. Mullen, S. C. DiMaggio, A. Som, G. N. Tew,A. N. Lopatin, J. R. Baker, M. M. Banaszak Holl and B. G. Orr,J. Phys. Chem. B, 2009, 113, 11179–11185.
85 H. Nikaido and M. Vaara, Microbiol. Rev., 1985, 49, 1–32.86 J. S. Chapman and N. H. Geogopapadakou, Antimicrob. Agents
Chemother., 1988, 32, 438–442.87 K. I. J. Batarsch, J. Antimicrob. Chemother., 2004, 54, 546–548.88 F. M. MacKenzie, K. E. Milne and I. M. Gould, Int. J. Antimicrob.
Agents, 2004, 23, 337–342.89 J. Song, J. Chen, C. M. Klapperich, V. Eng and C. R. Bertozzi,
J. Mater. Chem., 2004, 14, 2643–2648.
This journal is ª The Royal Society of Chemistry 2010