Anthropometric Geography Applied to the Analysis of Socio-economic Disparities: Cohort Trends and...
16
Anthropometric Geography Applied to the Analysis of Socio-economic Disparities: Cohort Trends and Spatial Patterns of Height and Robustness in 20th-Century Spain Antonio D. Camara 1, * and Joan Garcia-Roman 2 1 Centre d’Estudis Demografics, Barcelona, Spain 2 Minnesota Population Center, Minneapolis, MN, USA ABSTRACT Anthropometrics have been widely used to study the influence of environmental factors on health and nutritional status. In contrast, anthropometric geography has not often been employed to approximate the dynamics of spatial disparities associated with socio- economic and demographic changes. Spain exhibited intense disparity and change during the middle decades of the 20th century, with the result that the life courses of the corresponding cohorts were associated with diverse environ- mental conditions. This was also true of the Spanish territories. This paper presents insights concerning the relationship between socio-economic changes and living conditions by combining the analysis of cohort trends and the anthropometric cartog- raphy of height and physical build. This analysis is conducted for Spanish male cohorts born in 1934–1973 who were recorded in the Spanish military statistics. This information is interpreted in light of region-level data on gross domestic product and infant mortality. Our results show an anthropometric convergence across regions that, nevertheless, did not substantially modify the spatial patterns of robustness, featuring primarily robust north- eastern regions and weak central-southern re- gions. These patterns persisted until the 1990s (cohorts born during the 1970s). For the most part, anthropometric disparities were associated with socio-economic disparities, although the former lessened over time to a greater extent than the latter. Interestingly, the various anthropometric indicators utilised here do not point to the same conclusions. There have been some discrepan- cies found between height and robustness pat- terns that moderate the statements from the analysis of cohort height alone regarding the level and evolution of living conditions across Spanish regions. Copyright © 2014 John Wiley & Sons, Ltd. Accepted 11 February 2014 Keywords: height; robustness; anthropometric geography; spatial disparities; cohort trends; living conditions INTRODUCTION A nthropometric measures have been used in developmental and historical studies to understand the impact of environmen- tal factors on the living conditions of individuals and populations. Stature alone or combined with other physical measures is the main parameter used in these approaches. The final height that an individual attains in adulthood results from two types of determinants: (1) genetic determinants, in that genes establish a maximum potential for each individual, and (2) en- vironmental determinants (these taken in a broad sense), in that socio-economic and epidemiological *Correspondence to: Antonio D. Camara, Centre d’Estudis Demografics, Barcelona, Spain. E-mail: [email protected] Copyright © 2014 John Wiley & Sons, Ltd. POPULATION, SPACE AND PLACE Popul. Space Place 21, 704–719 (2015) Published online 7 April 2014 in Wiley Online Library (wileyonlinelibrary.com) DOI: 10.1002/psp.1850
Transcript of Anthropometric Geography Applied to the Analysis of Socio-economic Disparities: Cohort Trends and...

POPULATION, SPACE AND PLACEPopul. Space Place 21, 704–719 (2015)Published online 7 April 2014 in Wiley Online Library
Anthropometric Geography Applied to theAnalysis of Socio-economic Disparities:Cohort Trends and Spatial Patterns ofHeight and Robustness in 20th-CenturySpainAntonio D. Camara1,* and Joan Garcia-Roman21Centre d’Estudis Demografics, Barcelona, Spain2Minnesota Population Center, Minneapolis, MN, USA
(wileyonlinelibrary.com) DOI: 10.1002/psp.1850
ABSTRACT
Anthropometrics have been widely used tostudy the influence of environmental factors onhealth and nutritional status. In contrast,anthropometric geography has not often beenemployed to approximate the dynamics ofspatial disparities associated with socio-economic and demographic changes. Spainexhibited intense disparity and change duringthe middle decades of the 20th century, with theresult that the life courses of the correspondingcohorts were associated with diverse environ-mental conditions. This was also true of theSpanish territories.This paper presents insights concerning the
relationship between socio-economic changesand living conditions by combining the analysisof cohort trends and the anthropometric cartog-raphy of height and physical build. This analysisis conducted for Spanish male cohorts born in1934–1973 who were recorded in the Spanishmilitary statistics. This information is interpretedin light of region-level data on gross domesticproduct and infant mortality.Our results show an anthropometric
convergence across regions that, nevertheless,did not substantially modify the spatial patternsof robustness, featuring primarily robust north-eastern regions and weak central-southern re-gions. These patterns persisted until the 1990s(cohorts born during the 1970s). For themost part,
*Correspondence to: Antonio D. Camara, Centre d’EstudisDemografics, Barcelona, Spain.E-mail: [email protected]
anthropometric disparities were associated withsocio-economic disparities, although the formerlessened over time to a greater extent than thelatter. Interestingly, the various anthropometricindicators utilised here do not point to the sameconclusions. There have been some discrepan-cies found between height and robustness pat-terns that moderate the statements from theanalysis of cohort height alone regarding thelevel and evolution of living conditions acrossSpanish regions. Copyright © 2014 JohnWiley &Sons, Ltd.
Accepted 11 February 2014
Keywords: height; robustness; anthropometricgeography; spatial disparities; cohort trends;living conditions
INTRODUCTION
A nthropometric measures have been usedin developmental and historical studiesto understand the impact of environmen-
tal factors on the living conditions of individualsand populations. Stature alone or combined withother physical measures is the main parameterused in these approaches.
The final height that an individual attains inadulthood results from two types of determinants:(1) genetic determinants, in that genes establish amaximumpotential for each individual, and (2) en-vironmental determinants (these taken in a broadsense), in that socio-economic and epidemiological
Copyright © 2014 John Wiley & Sons, Ltd.

705Anthropometric Geography
factors determine to what extent that biologicalpotential will be attained (Silventoinen, 2003).
At a population level, it is apparent that geneticchanges associated with natural selection occurover a much longer period than social and histori-cal changes. For instance, in the past century,covering just three to five generations, there havebeen substantial changes in stature that geneticchange cannot fully explain. For this reason, eco-nomic and environmental processes have beenused preferably to explain the anthropometricvariations observed over time (Fogel & Costa,1997). This said, it must be acknowledged thatdemographic change in itself may play some role.Selection forces from the interaction of mortality,fertility, and fecundity may influence inter-generational trends in height and other physicaltraits especially of populations that experiencedrapid declines of vital rates during the initial stageof the demographic transition (Courtiol et al., 2013;Moorad, 2013). For instance, at very high levels ofpre-adult mortality and/or short-term demo-graphic shocks, the selection of taller and strongersurvivors might theoretically result in a taller-than-expected adult population because of livingconditions (Alter, 2004; Bozzoli et al., 2009).Although plausible, these scenarios have beensupported by little empirical evidence so far(Gørgens et al., 2012). More commonly, it isaccepted that structural deprivation, prolongedscarcity, or frequent epidemics leading to highmortality levels also tend to produce shorterpopulations, as both pre-adult mortality andheight are a reflection of the biological status ofthe population. As such, they have a good numberof common environmental determinants (nutritionor the degree of exposure to illness). To be sure, thisis the case of mortality contexts in 20th-centuryEurope whereby the stunting effect of poor livingconditions at childhood clearly dominates anypossible selection effect of pre-adult mortality onthe average height of cohorts in adulthood (Bozzoliet al., 2009; Spijker et al., 2012). Therefore, we mayexpect taller populations to exhibit lowermortality,which also seems to apply among individualswithin contemporary societies (Waaler, 1984).
The relationship between the patterns of humangrowth and the environment is firstly establishedby auxology (the discipline that studies physicalgrowth) and human biology (Bogin, 1988) and sub-sequently integrated in the historical debate fromthe 1970s through the so-called technophysio
Copyright © 2014 John Wiley & Sons, Ltd.
evolution theory (see Fogel & Costa, 1997; Floudet al., 2011, for an updated view and review articleswith citation of early works in Steckel, 2009, 2013).This theory addresses the dramatic changes in sur-vival and health, which have taken place duringthe last three centuries. With regard to body size,height in particular, this theory underlines the roleof socio-economic changes for the improvement ofthe net balances of energy inputs (quantity andquality of food intake) and major energy outflowssuch as exposure to illness. As stated by auxology,an adequate balance between energy inputs andenergy outflows contributes to a normal growthpattern and makes the attainment of the geneti-cally inherited stature likely. Conversely, an energyimbalance associated with prolonged environ-mental stress during the growth cycle (e.g. due tochronic malnutrition or continuous exposure toillness) may eventually result in losses from the po-tential inherited height (Bogin, 1988). Accordingly,height variations between genetically uniformpopulations and over time may be interpreted asfunctions of these environmental factors. This hasmade human stature a widely used indicator tostudy different dimensions of well-being as wellas the positive or negative effects that socio-economic processes have had on populations overtime (e.g. Komlos & Baten, 2004; Floud et al., 2011;Martínez-Carrión, 2012). Additionally, a number ofstudies have examined the relationship betweencohort height and other developmental indicatorssuch as infant mortality and gross domestic prod-uct (GDP) (e.g. Akachi & Canning, 2007; Bozzoliet al., 2009; Peracchi and Arcaleni, 2011).
To a much lesser extent, heights have also beenused to study spatial disparities within countries(Tassenaar, 1995; Salvatore, 2004; Arcaleni, 2006),and to our knowledge, only a few works haveused, together with height, other anthropometricmeasures or indexes such as the body mass index(BMI) and the robustness index (RI) to study theseissues. When this was performed, the time spanwas very limited and therefore the possibility toanalyse time–cohort trends. Recently, Peracchiand Arcaleni (2011) explored the relationshipbetween disease burden (captured by infantmortality) and economic conditions (representedby GDP or per-capita consumption), height, andBMI among six cohorts ofmodern Italianmen bornbetween 1973 and 1978. Some data on physicalrobustness (height, weight, and thorax circum-ference) were provided for the study of the labour
Popul. Space Place 21, 704–719 (2015)DOI: 10.1002/psp
706 A. D. Camara and J. Garcia-Roman
conditions of some 20th-century populations(Cleveland, 2011).
In thiswork,we analyse regional anthropometricdata from Spanish male cohorts born in 1934–1973to obtain further insights on the evolution of socio-economic disparities and their effects on the bio-logical status of the population. To do this, changesin the anthropometric geography of Spain over timeare examined through continuous series of adultcohort height, BMI, and RI for Spanish regions.The results are discussed in light of socio-economicprocesses in the mid-20th century.
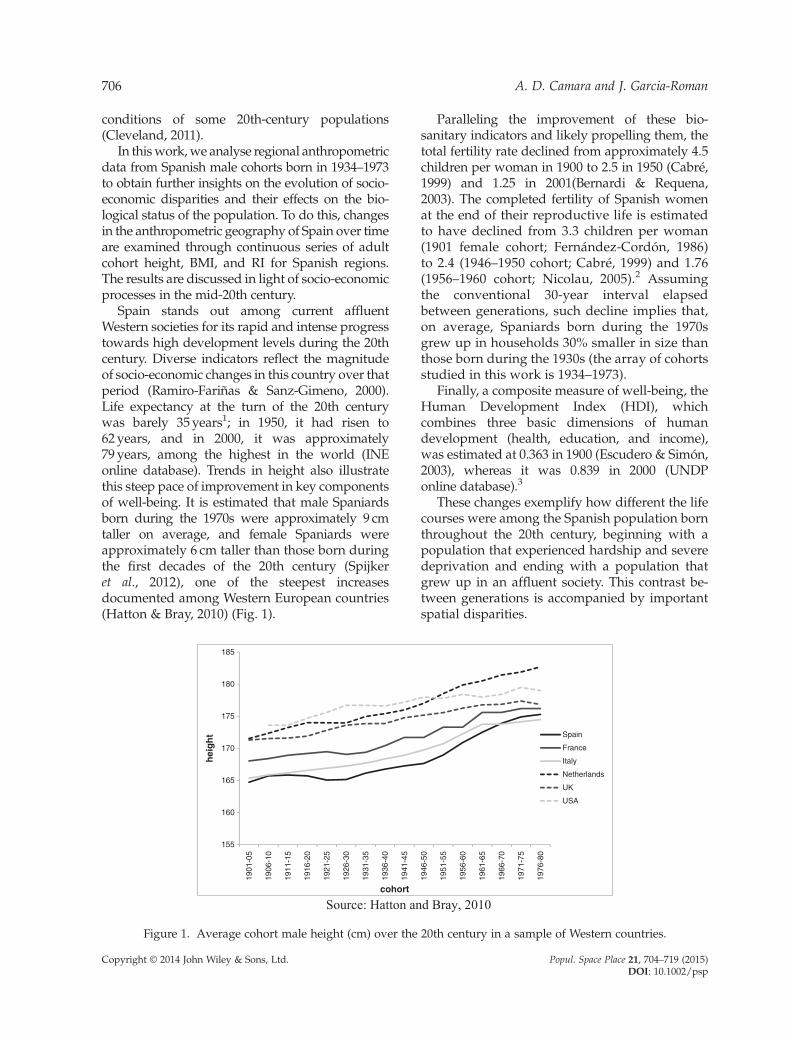
Spain stands out among current affluentWestern societies for its rapid and intense progresstowards high development levels during the 20thcentury. Diverse indicators reflect the magnitudeof socio-economic changes in this country over thatperiod (Ramiro-Fariñas & Sanz-Gimeno, 2000).Life expectancy at the turn of the 20th centurywas barely 35years1; in 1950, it had risen to62 years, and in 2000, it was approximately79 years, among the highest in the world (INEonline database). Trends in height also illustratethis steep pace of improvement in key componentsof well-being. It is estimated that male Spaniardsborn during the 1970s were approximately 9 cmtaller on average, and female Spaniards wereapproximately 6 cm taller than those born duringthe first decades of the 20th century (Spijkeret al., 2012), one of the steepest increasesdocumented among Western European countries(Hatton & Bray, 2010) (Fig. 1).
155
160
165
170
175
180
185
1901
-05
1906
-10
1911
-15
1916
-20
1921
-25
1926
-30
1931
-35
1936
-40
1941
-45
hei
gh
t
cohort
Source: Hatton an
Figure 1. Average cohort male height (cm) over the
Copyright © 2014 John Wiley & Sons, Ltd.
Paralleling the improvement of these bio-sanitary indicators and likely propelling them, thetotal fertility rate declined from approximately 4.5children per woman in 1900 to 2.5 in 1950 (Cabré,1999) and 1.25 in 2001(Bernardi & Requena,2003). The completed fertility of Spanish womenat the end of their reproductive life is estimatedto have declined from 3.3 children per woman(1901 female cohort; Fernández-Cordón, 1986)to 2.4 (1946–1950 cohort; Cabré, 1999) and 1.76(1956–1960 cohort; Nicolau, 2005).2 Assumingthe conventional 30-year interval elapsedbetween generations, such decline implies that,on average, Spaniards born during the 1970sgrew up in households 30% smaller in size thanthose born during the 1930s (the array of cohortsstudied in this work is 1934–1973).
Finally, a composite measure of well-being, theHuman Development Index (HDI), whichcombines three basic dimensions of humandevelopment (health, education, and income),was estimated at 0.363 in 1900 (Escudero & Simón,2003), whereas it was 0.839 in 2000 (UNDPonline database).3
These changes exemplify how different the lifecourses were among the Spanish population bornthroughout the 20th century, beginning with apopulation that experienced hardship and severedeprivation and ending with a population thatgrew up in an affluent society. This contrast be-tween generations is accompanied by importantspatial disparities.
1946
-50
1951
-55
1956
-60
1961
-65
1966
-70
1971
-75
1976
-80
Spain
France
Italy
Netherlands
UK
USA
d Bray, 2010
20th century in a sample of Western countries.
Popul. Space Place 21, 704–719 (2015)DOI: 10.1002/psp

707Anthropometric Geography
During the intense economic growth processexperienced by the country between 1950 and1975, industry, services, and population wereconcentrated in the most dynamic regions (e.g.Madrid, Catalonia, or the Basque Country), whichis reflected by the regional distribution of GDP(Carreras, 1990) and also by a regional gradient inbio-sanitary indicators such as life expectancy(Blanes, 2007) and height. Regarding the latter,Martínez-Carrión (2005) analysed region-levelheights in the 1950s and 2000s, concluding that aconvergence across regions had taken place.However, the precise evolution of anthropometricpatterns as a function of the economic trajectoriesof the Spanish regions deserves further study, asdoes the relationship between the height gradientand other anthropometric measures.
This work aims to review and discuss the socio-economic development of Spanish regions over themiddle decades of the 20th century in light ofcontinuous cohort trends of adult height, bodymass, and physical robustness. These trends andthe evolution of the anthropometric geography ofSpain are compared with the evolution of spatialdisparities in two traditional developmental indi-cators, infant mortality (a widespread indicator ofthe disease environment) and GDP (an indicatorof economic conditions). Our study makes threemain contributions. First, it demonstrates theability of anthropometric geography to shed lighton socio-economic disparities. Second, it illustrateshow socio-economic disparities within a countrycan be analysed from the spatial (i.e. inter-regional)and demographic (i.e. inter-generational) perspec-tives simultaneously. Finally, it contributes to thespecific literature on anthropometrics by compar-ing height patterns with patterns of two compositeanthropometric indexes: BMI and RI. Discrepan-cies between these indicators are of particular inter-est because they may show determinants of thebiological status of the population infrequentlyappreciated in contextual analyses.
The paper contains three additional sections.The Data and Methods section describes oursources and the analyses performed. The Resultssection presents a selection of materials from thetrends and cartography that were produced aswell as the results from the analytical tools usedhere, including multivariate linear regressionand changes in the variation coefficients of theindicators involved in the study. The paperconcludes with a Discussion section.
Copyright © 2014 John Wiley & Sons, Ltd.
DATA AND METHODS
Anthropometric Data
Country-level and region-level anthropometricinformation were obtained from the militarystatistics of the Spanish Statistic Yearbooks. Thesestatistics summarise individual data obtained frommen during compulsory military service in Spain,which lasted until 1995.4 To our knowledge, noprevious study has systematically exploited thesedata. Although the yearbooks have been publishedin Spain since the middle of the 19th century, thosevalid for the construction of continuous cohortseries and anthropometric cartography have beenproduced since 1955.
The information is listed according to enlist-ment year and does not report the birth years ofthe recruits. Therefore, birth cohorts weredetermined as a function of the age at enlistmentand the enlistment year. The enlistment age was21 years in 1955; thus, the first cohort under anal-ysis is 1934. Although the enlistment age changedseveral times in subsequent years, every cohorthad to perform military service; thus, every subse-quent enlistment corresponded to a birth cohort,resulting in a cohort span of 1934–1973.
The anthropometric information provided inthese statistics consists of relative distributions(i.e. percentages) of stature (in centimetres),weight (in kilogrammes), and chest circumfer-ence (CC, in centimetres). The data were tabu-lated in five-unit intervals; thus, we calculatedweighted averages using the central value withineach interval across the distribution. Open inter-vals were assumed to have a length of five units.The lower limits of the open intervals varied, butthis does not substantially affect our resultsbecause (1) variations tracked with the trend overtime and (2) the percentage of recruits within theseopen intervals remained very low. Although somedepartures from normal distributions are ob-served, the data seem to be adequate for the pur-poses of this work (Fig. 2).
The BMI and the RI are two summarymeasuresof the average physique of a population. BMI is theratio between the mean weight (in kilogrammes)divided by the square of the mean height (in me-tres). The categories commonly accepted for thisindex are underweight (<18.5 kg/m2), normal weight(18.5–24.9 kg/m2), overweight (25.0–29.9kg/m2),and obese (>30.0 kg/m2). RI is determined by
Popul. Space Place 21, 704–719 (2015)DOI: 10.1002/psp

Height (cm)
%
Height
1934-38
%
Height
1954-58
%
Height
1964-68
Weight (kg)
%
Weight
1934-38
%
Weight
1954-58
%
Weight
1964-68
CC (cm)
%
Chest circumference
1934-38
%
Chest circumference
1954-58
%
Chest circumference
1964-68
Source: Spanish Yearbooks, Military Statistics
Figure 2. Frequency distributions (%) of height, weight, and chest circumference by birth cohort for Spanish menborn between 1934 and 1968.
708 A. D. Camara and J. Garcia-Roman
subtracting the sum of weight (in kg) and CC(in cm) from height (in cm). Lower RI scores indi-cate a greater robustness, potentially resultingfrom a relatively short average height or fromrelatively high values ofweight andCC. This indexwas originally constructed as a fitness measure forthe screening of conscripts and workers inphysically demanding positions.5 Subsequently,anthropological and developmental studies alsomade use of this measure because of its straight-forward nature and its relationship to economiccircumstances (e.g. Bhattacharya et al., 1981;Pandey, 2006). RI categories have also beenestablished, namely 0–10 (very sturdy), 11–15(sturdy), 16–20 (good), 21–25 (average), 26–30(weak), 31–35 (very weak), and >35 (poor).6
The mean values of height, BMI, and RI werecomputed for 5-year cohort groups.7 These meanswere compared with those from some previousworks that used local-levelmicrodata. Our averages
Copyright © 2014 John Wiley & Sons, Ltd.
fall solidly within the range of those obtained fordifferent areas of Spain (Martínez-Carrión, 2009).
As weight and, to a lesser extent, CC mayrespond to short-term environmental influencesrather than to cumulative environmental influ-ences over time, at a contextual level, the correla-tion between height and weight is expected to belower than the correlation between height andCC and that between weight and CC (Table 1).Additionally, the association between height,body mass, and robustness appears to be greateramong the older cohorts analysed here.
It can be noted that the usual categories of BMIand RI do not apply in this study because the rangeacross regions is not sufficiently large (i.e. we donot find obese regions vs underweight regions asthe BMI of each region is comprised of many indi-viduals who, on average, tend to possess a normalweight). Therefore, these indicators are mapped inintervals of 0.5 and 2 units, respectively. This
Popul. Space Place 21, 704–719 (2015)DOI: 10.1002/psp
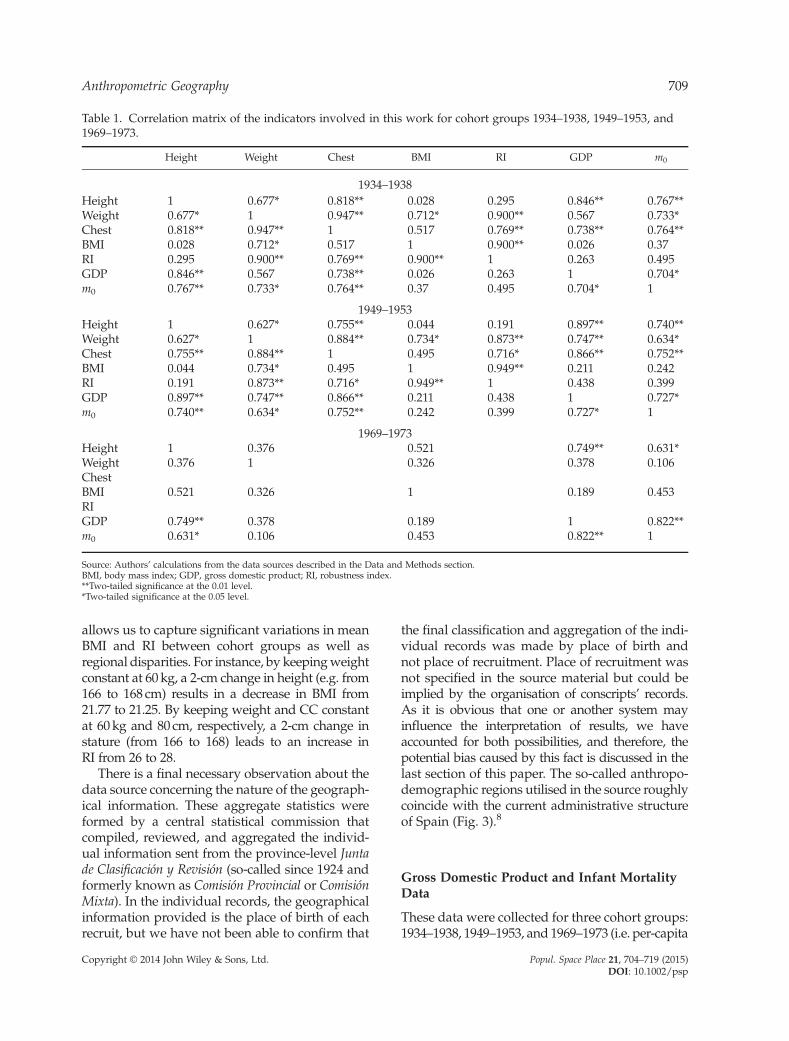
Table 1. Correlation matrix of the indicators involved in this work for cohort groups 1934–1938, 1949–1953, and1969–1973.
Height Weight Chest BMI RI GDP m0
1934–1938Height 1 0.677* 0.818** 0.028 �0.295 0.846** �0.767**Weight 0.677* 1 0.947** 0.712* �0.900** 0.567 �0.733*Chest 0.818** 0.947** 1 0.517 �0.769** 0.738** �0.764**BMI 0.028 0.712* 0.517 1 �0.900** 0.026 �0.37RI �0.295 �0.900** �0.769** �0.900** 1 �0.263 0.495GDP 0.846** 0.567 0.738** 0.026 �0.263 1 �0.704*m0 �0.767** �0.733* �0.764** �0.37 0.495 �0.704* 1
1949–1953Height 1 0.627* 0.755** �0.044 �0.191 0.897** �0.740**Weight 0.627* 1 0.884** 0.734* �0.873** 0.747** �0.634*Chest 0.755** 0.884** 1 0.495 �0.716* 0.866** �0.752**BMI �0.044 0.734* 0.495 1 �0.949** 0.211 �0.242RI �0.191 �0.873** �0.716* �0.949** 1 �0.438 0.399GDP 0.897** 0.747** 0.866** 0.211 �0.438 1 �0.727*m0 �0.740** �0.634* �0.752** �0.242 0.399 �0.727* 1
1969–1973Height 1 0.376 �0.521 0.749** �0.631*Weight 0.376 1 0.326 0.378 �0.106ChestBMI �0.521 0.326 1 �0.189 0.453RIGDP 0.749** 0.378 �0.189 1 �0.822**m0 �0.631* �0.106 0.453 �0.822** 1
Source: Authors’ calculations from the data sources described in the Data and Methods section.BMI, body mass index; GDP, gross domestic product; RI, robustness index.**Two-tailed significance at the 0.01 level.*Two-tailed significance at the 0.05 level.
709Anthropometric Geography
allows us to capture significant variations in meanBMI and RI between cohort groups as well asregional disparities. For instance, by keepingweightconstant at 60kg, a 2-cm change in height (e.g. from166 to 168 cm) results in a decrease in BMI from21.77 to 21.25. By keeping weight and CC constantat 60kg and 80 cm, respectively, a 2-cm change instature (from 166 to 168) leads to an increase inRI from 26 to 28.
There is a final necessary observation about thedata source concerning the nature of the geograph-ical information. These aggregate statistics wereformed by a central statistical commission thatcompiled, reviewed, and aggregated the individ-ual information sent from the province-level Juntade Clasificación y Revisión (so-called since 1924 andformerly known as Comisión Provincial or ComisiónMixta). In the individual records, the geographicalinformation provided is the place of birth of eachrecruit, but we have not been able to confirm that
Copyright © 2014 John Wiley & Sons, Ltd.
the final classification and aggregation of the indi-vidual records was made by place of birth andnot place of recruitment. Place of recruitment wasnot specified in the source material but could beimplied by the organisation of conscripts’ records.As it is obvious that one or another system mayinfluence the interpretation of results, we haveaccounted for both possibilities, and therefore, thepotential bias caused by this fact is discussed in thelast section of this paper. The so-called anthropo-demographic regions utilised in the source roughlycoincide with the current administrative structureof Spain (Fig. 3).8
Gross Domestic Product and Infant MortalityData
These data were collected for three cohort groups:1934–1938, 1949–1953, and 1969–1973 (i.e. per-capita
Popul. Space Place 21, 704–719 (2015)DOI: 10.1002/psp

710 A. D. Camara and J. Garcia-Roman
GDP and m0 correspond to the birth years of theconscripts).
Gross domestic product data come fromAlcaide(2003), one of the few available estimates of regionalGDP for the first half of the 20th century in Spain,which has been regarded in previous review workas indicative of the regional patterns and trajectoriesof economic development in this country (Carreraset al., 2005). As Alcaide’s work provides GDP dataevery 5years, averages between the two dates wereused when necessary. For instance, the GDPassociated with the 1934–1938 cohort is an averageof the 1935 and 1940 GDPs divided by the averagemid-year populations of 1935 and 1940. AsAlcaide’sfigures correspond to the current adminis-trative regions, we merged GDP and populationdata to compute per-capita GDP for the anthropo-demographic regions.
Infant mortality rates were drawn fromGómez-Redondo (1992). As her data were origi-nally provided by provinces, they had to be fittedto the regional setting of the military statistics. Asprovinces within any region differ in size, popu-lation, and socio-economic characteristics, therates were weighted by the number of live birthsrecorded in each province. Data on live birthswere obtained from the historical vital statisticsof the Spanish population (MNP) (INE onlinedatabase). Additionally, as we are working withfive-unit birth cohorts, five annual mortality ratesby province were averaged to obtain the appro-priate rate for each cohort.
The results of this harmonisation betweensources are presented in Table 2. This table con-tains two sections, GDP and infant mortality withthree columns for each section and cohort group:(1) absolute value or rate; (2) relative value, withSpain equaling 100; and (3) the ordinal rankamong Spanish regions. Between 1930 and 1970,the economic rankings exhibited little variation,
Figure 3. Current administrative division of Spain (left) and a
Copyright © 2014 John Wiley & Sons, Ltd.
with Madrid and some north-eastern regions con-sistently ranked at the top. For the most part,infant mortality was also lower in those regions.Actually, GDP and m0 maintained a strong linearrelationship throughout the period analysed here,with few exceptions (Fig. 4). Madrid, a markedlyurban region, had high GDP and high infant mor-tality levels during the central decades of the cen-tury. This most likely resulted from an urbanpenalty until improved sanitation and hygieneconventions and facilities were adopted anddisseminated in subsequent phases of theurbanisation process in Spain (Reher, 2001). Thisspeculation fits with the observation that by themiddle of the 1970s, Madrid was already amongthe regions with lower infant mortality rates.
Anthropometric series and cartography aresupplemented with the analysis of the coefficient ofvariation of all the indicators involved in the study,and with a series of multivariate regression modelswhere height, BMI, and RI are regressed on per-capita GDP and infant mortality. Eventually, thestrong association between GDP and m0 makes theregression coefficients ofm0 insignificant as a regres-sor of the anthropometric outcomes. This analysiswas performed using ordinary least squares regres-sion in which both GDP and m0 were transformedinto their natural logarithms.
RESULTS
The average stature of Spanish men increasedapproximately 9 cm (or 5.4%) from the 1934 cohortto the 1973 cohort. The average weight increasedfrom 62 to 69.4 kg (or 11.9%), and the average CCincreased from 87 to 89 cm (or 2.3%) for the1964–1968 cohort. BMI and RI do not exhibit auniform trend over time because of the changingrelationship between their components. BMI roseamong the 1934–1948 cohorts and decreased
nthropo-demographic regions used in this work (right).
Popul. Space Place 21, 704–719 (2015)DOI: 10.1002/psp

Table2.
Per-capita
GDP(incu
rren
tva
lues;m
illionpesetas)
andinfant
mortalityrates(per
thou
sand
)in
Span
ishregion
s.
Reg
ion
GDP
m0
Index
numbe
rs
GDP
m0
1935–
1940
1950–
1955
1970–
1975
1934–
1938
1949–
1953
1969–
1973
1930
1950
1970
1934–1938
1949–1
953
1969–1973
AND
1,576
8,448
98,174
136.81
70.75
31.96
76.4
972.5
972.5
10105.7
998.3
6111.6
8ARA-RIO
2,236
12,824
143,168
120.1
73.18
27.01
112
4110.03
5108.9
492.8
6101.7
894.3
5CAN
1,893
9,829
117,661
127.16
71.45
27.28
92.1
783.2
885.2
798.2
899.3
795.2
6CANT
2,224
13,431
137,402
105.69
61.49
29.3
100.45
5114.3
4105.4
581.7
385.5
4102.3
7CAT
3,292
18,840
177,980
82.92
52.06
22.12
148.75
2138.9
3133.2
264.1
172.4
177.2
1CyL
1,823
10,630
112,567
163.09
94.48
33.85
89.7
892.6
683.5
8126
11131.3
11118.2
9EXT-MAN
1,386
8,066
91,335
161.24
85.43
35.32
66.55
1166.9
1164.8
11124.6
10118.7
10123.3
10GAL
1,529
8,625
102,549
116.63
79.27
38.32
74.7
1072.1
1078.8
990.1
5110.2
9133.8
11LEV
2,102
12,016
132,944
106.58
58.22
26.34
92.4
689.95
791.75
682.3
480.9
391.9
4MAD
3,176
18,168
183,572
124.37
65.53
25.24
145.7
3148.3
2132.9
396.1
791.1
588.1
2PV
3,473
21,761
184,973
91.23
52.81
26.26
161.2
1181.6
1142
170.5
273.4
291.6
3
Source:A
utho
r’sad
aptation
from
datain
Alcaide(2003)
andGóm
ez-Red
ondo(1992).
GDP,
grossdom
esticprod
uct.m
0,infant
mortalityrate.
711Anthropometric Geography
Copyright © 2014 John Wiley & Sons, Ltd. Popul. Space Place 21, 704–719 (2015)DOI: 10.1002/psp

1.25
1.5
1.75
2
2.25
2.5
3 3.5 4 4.5 5 5.5
1934-38 1949-53 1969-73
Figure 4. Scatter plots showing the association betweengross domestic product (GDP) and infant mortality by
region in Spain for three cohort groups.
712 A. D. Camara and J. Garcia-Roman
among subsequent cohort groups because of thestrong increase in mean cohort height. Robustnessincreased among the 1934–1948 cohorts becauseof limited progress in stature and proportionallyhigher increases in weight and CC. This trendwas reversed among cohorts born after 1949,because of the dramatic increase in cohort heightobserved during the second half of the 20th century.
The anthropometric map of Spain becameprogressively more homogeneous over the lifecourses of the aforementioned cohorts (Fig. 5).For instance, the height difference between thetallest region (región Vasca) and the shortest (regiónAndaluza) was approximately 4 cm among oldercohorts. This difference decreased by more thanhalf among cohorts born at the beginning of the1970s (less than 2 cm between the tallest andshortest regions at the time, región Aragonesa-riojana and región Galaica, respectively) (Fig. 6).Therefore, short regions grew more than tallregions during the central decades of the 20thcentury, a trend that was also observed inneighbouring countries (Arcaleni, 2006). Regionaldifferences in mean weight and CC also lessened,which altogether led BMI and RI to convergeacross regions.
Despite this anthropometric convergence,spatial patterns remained quite persistent, andfew regions changed positions in the ordinalranking over the course of the 20th century, withSpain consisting of a north-eastern arch of talland robust regions and a group of shorter and
Copyright © 2014 John Wiley & Sons, Ltd.
weaker central-southern regions. This patterndisappeared for BMI but remained true for stat-ure and RI among cohorts born at the end of the1960s (Fig. 5).
As for the relationship between anthropomet-rics, GDP and m0, regions with short averageheights have relatively low GDPs and relativelyhigh infant mortality levels, but these associationsare somewhat ambiguous among tall regions. Onthe one hand, tall regions exhibited a broad rangeof infant mortality (e.g. during the 1930s, m0 inthe Canary Islands and Madrid was over 120 perthousand, whereas it was 91 and 82 per thousandin región Vasca and región Catalana, respectively9).On the other hand, we find that the Canary Islandswere historically tall but had a relatively low GDP.BMI and RI partly resolve these paradoxes in thatthese indexes group the Canary Islands with theless-developed regions (i.e. poorly nourished) andMadrid with the high-infant-mortality regionsduring the first stage of the modern process ofurbanisation.
Finally, although the anthropometric conver-gence across Spanish regions was already occur-ring among cohorts born during the 1940s, theprocess gained momentum among cohorts bornduring the 1950s and the 1960s, thus matchingan effective reduction of economic disparities(Fig. 7). However, economic and sanitary dispar-ities remained significantly higher than anthropo-metric disparities as indicated by the coefficientsof variation in Figure 7. Furthermore, the explan-atory ability of GDP (good explanatory ability forcohort height but non-existent ability for BMI andRI, likely owing to the different temporal natureof the variations of their components) and m0
decreased over the life course of the cohorts bornafter the 1950s (this is indicated by both theregression coefficients and R2 in Table 3).
DISCUSSION
This work analysed the evolution of the anthro-pometric geography of Spain among malecohorts born over the central decades of the20th century by examining adult height and com-posite indexes of body mass and physical robust-ness. These data were interpreted in light ofsocio-economic disparities captured by GDP andinfant mortality.
In our view, the strong anthropometric dispar-ities that were initially observed across regions
Popul. Space Place 21, 704–719 (2015)DOI: 10.1002/psp

Figure 5. Cohort height, cohort body mass index (BMI), and cohort robustness index (RI) across Spanish regions forSpanish men born from 1934 to 1968.
Height Robustness Index
- -
ARA-RIO CAN CyL CAT EXT-MAN GAL SPAIN
10
12
14
16
18
20
22165.0
170.0
175.0
180.0
1934-38 1939-43 1944-48 1949-53 1954-58 1959-63 1964-681934-38 1939-43 1944-48 1949-53 1954-58 1959-63 1964-68 1969-73
Source: Calculated from the Military Statistics of Spanish Yearbooks.
Figure 6. Trends in cohort height (cm) and cohort robustness (units) in selected Spanish regions.
713Anthropometric Geography
resulted from a long-term process of differentia-tion that, at least in the case of height, can betraced back to the second half of the 19th century(Gómez-Mendoza & Pérez-Moreda, 1985). To be
Copyright © 2014 John Wiley & Sons, Ltd.
sure, Spanish regions appeared in a very similarordinal ranking (to that observed among cohorts1934–1938) of height among cohorts born in1875–1934 (Quiroga, 1998, 2001). This ordinal
Popul. Space Place 21, 704–719 (2015)DOI: 10.1002/psp

Figure 7. Variation coefficients (VC) of height, bodymassindex (BMI), robustness index (RI), m0, and per-capitagross domestic product (GDP) across regions in Spain,
1934–1973.
Table 3. Ordinary least squares regression coefficientsand R2.
On height On BMI On RI
1934–1938logGDP 6.473** �1.87 2.92logm0 �5.14 �4.11 14.42R2 0.78 0.26 0.27
1949–1953logGDP 6.617*** 0 �3.3logm0 �2.33 �1.32 4.06R2 0.83 0.07 0.21
1969–1973logGDP 5.035* 0.99logm0 1 2.38R2 0.58 0.3
Height, BMI, and RI regressed on GDP and infant mortality.BMI, body mass index; GDP, gross domestic product; RI, robustnessindex.***Significant at 99%.**Significant at 95%.*Significant at 90%.
714 A. D. Camara and J. Garcia-Roman
ranking of statures remained headed almostinvariably by the Basque Country, Catalonia,and the Canary Islands until the middle of the20th century, and the rest of positions alsoremained largely stable.
All three anthropometric indicators, height,BMI, and RI converged across regions over theperiod analysed here, which was particularly thecase among cohorts born between 1950 and 1960.This is in accordance with the existence of a com-pensation effect among worse-off populations.
Copyright © 2014 John Wiley & Sons, Ltd.
These populations would respond more positivelyto improvements in environmental conditions(Wolanski, 1985). Structural scarcity in Spaincame to an end during the 1950s, which wasfollowed by a diversification of foodstuffs duringthe 1960s and the 1970s, thus representing anutritional transition (Cussó, 2005). Addi-tionally, exposure to illness was dramaticallyreduced as hygiene measures and sanitary provi-sions were substantially improved.
Nevertheless, some of our findings need to beinterpreted with caution because taller-than-average regions such as the Basque Country,Catalonia, or Madrid were also the main destina-tions of internal migration flows, which wereparticularly intense during the 1950s and the1960s (García-Barbancho & Delgado-Cabeza,1988). Also, within regions, these flows tended toprovoke rural depopulation (Collantes et al.,2013). Although the empirical evidence in thisregard is partial and sparse, previous studiesindicate that migrants are relatively tall withrespect to either those who stayed or those bornin the destination place (Mascie-Taylor, 1984;Danubio et al., 2005; Cámara, 2007:300; Szklarskaet al., 2008).10
It is unfortunate that few and highly incompletesources are available in Spain to improve precisionon this issue. Some military records indicate theprovince of enlistment and the province of birth,but this is not sufficient to disentangle the effectsof migration on the anthropometric patterns asthe age at migration is unknown. In other words,it is not possible to determine whether migrants’heights fully reflect the original environment oralso partly capture the new environment at desti-nation. Some scenarios can be hypothesisednotwithstanding.
If migrants were systematically taller thannon-migrants and/or taller than the natives attheir destination, this might cause the anthropo-metric disparities across regions to increase. InSpain, the cohorts born during the 1930s and the1940s exhibited the most intense migratory flowsas they presumably migrated during the 1950sand the 1960s. As a consequence, a portion ofthe large initial disparities and the slow pace ofconvergence among those cohorts might be duein part to the aforementioned selective effect.Also, some unexpected results might have to dowith this, such as the coexistence of tallness, lowrobustness, and high infant mortality in Madrid
Popul. Space Place 21, 704–719 (2015)DOI: 10.1002/psp

715Anthropometric Geography
among the earlier cohorts analysed. In Madrid,selective immigration might have produced highmean heights without a significant improvementof living standards. The latter is suggested bylow BMI and RI in Madrid among the earliercohorts analysed. Other economically developedregions could experience this, but in such cases,the effect was buffered by either a better nutri-tional status of natives, better living conditionsamong the immigrants, or a larger dispersion inliving conditions within the region. We must notforget that Madrid is a uni-provincial region,whereas other urban provinces such as Barcelona(in Catalonia) or Biscay (in the Basque Country)belong to regions with several provinces.
In the main and notwithstanding, we believethat the trends and patterns found in this workhave more to do with socio-economic factors thanwith migratory flows in themselves. On onehand, it is worth noting that not all the relativelytall regions were net-immigrant regions. On theother hand, net-migrant regions such as Castille-Leon experienced an outstanding and continuousprogress in height and robustness that spannedcohorts born from 1940 to 1970 (i.e. cohorts thatessentially ceased their physical growth between1960 and 1990), a period with a varying intensityof migratory flows. Finally, previous worksfound that until the second half of the 1960s, therewere many net-migrant provinces but few net-immigrant ones. Thereafter, a diversification oforigins and destinations occurred (Cardelús &Solana, 2003), and therefore, the potential selectionforces mentioned earlier could have tended tomoderate as the general mobility increased.
Another limitation of this study is that theresults only capture between-region dispersionin anthropometric and socio-economic indicators.Provincial or even municipal (e.g. urban vs rural)variations are not accounted for because of thecharacteristics of the data utilised. Thus, it isimportant to acknowledge that regional data mostprobably mask differences at lower geographicallevels. This issue has additional implications infavour of the arguments developed earlier. Forinstance, migrants from Andalusia (South Spain)to other regions (mainly to Catalonia) mainly camefrom the Eastern provinces (Jaen, Córdoba,Granada, and Almeria), which were the poorestand probably the shortest on average. This wouldhave moderated the effects of potential heighttransfers between regions.
Copyright © 2014 John Wiley & Sons, Ltd.
The anthropometric patterns depicted in thiswork cannot be dissociated from the socio-economic disparities among Spanish regions.However, it is apparent that poor regions caughtup in terms of height and robustness moresuccessfully than in economic terms. This seemsto us relevant given the absence of specific policiesaimed at correcting socio-economic disparitiesacross the country until the arrival of democracyin the late 1970s (García-Ballesteros, 1990). As anillustration, poor regions decreased in relativeimportance to the national GDP over the periodanalysed here (Carreras, 1990). Actually, althoughGDP remained significant as an explanatory factorof height differences in Spain, its strength andsignificance diminished among cohorts born afterthe 1950s. Meaningfully, GDP (as a proxy of eco-nomic conditions) and m0 (as a proxy of sanitaryconditions) explained nearly 80% of height differ-ences across regions among cohorts born from1934 to 1938, whereas this decreased at nearly60% among cohorts born in 1969–1973. As for theexplanatory capacity of GDP and m0 on BMI andRI differences, this was negligible over the wholeperiod analysed.
Some discrepancies between height and robust-ness that are worth comment have been found.Southern regions were invariably poor, short, andless robust than average. In contrast, the robustnorth-eastern arch of regions was to some extentindependent of economic performance. In otherwords, high robustness scores were shared byeconomically developed and underdevelopedregions. Moreover, among northern Spaniards,both relatively tall (e.g. Basque) and relativelyshort populations (i.e. Galician) are found, but allpopulations were significantly more robust onaverage than southern Spaniards. This implies thatregions such as Galicia and Castille-Leon were notas disadvantaged as would have been concludedon the basis of an analysis of height alone.
Northern robustness was most likely associ-ated with a better provision and/or easier accessto high protein and caloric foodstuffs such asmeat and milk. For instance, in 1910–1912, thearea of robust regions very much coincided withcheaper meat and dairy products among theSpanish provinces (Nicolau & Pujol, 2006). Theseauthors concluded that these patterns were indic-ative of actual consumption and that northernprovinces generally had easier access to highprotein and caloric foodstuffs than inner and
Popul. Space Place 21, 704–719 (2015)DOI: 10.1002/psp

716 A. D. Camara and J. Garcia-Roman
southern provinces. Along with Simpson (1995),we hypothesise that meat and dairy productsremained rare in these areas until well into thesecond half of the 20th century. This suppositionhas several explanations, none of which aremutually exclusive: the historical agriculturalspecialisation by region, the physical constraintsto the development of mixed agrarian systems,the limited demand from urban markets, and thepoor market integration of the country (Simpson,1995). Furthermore, an estimated food cost indexadjusted by wages among 12 Spanish provincesin different regions uncovered systematicallyhigher costs for a set of basic foodstuffs in thesouthern and inner provinces (Ballesteros, 1997).
The Canary Islands also exemplify an unex-pected relationship between height and otherdevelopmental indicators as well as compositeanthropometric indicators. Any hypothetical envi-ronmental (i.e. socio-economic and/or epidemio-logic) advantage attributed to this region in lightof its tallness should be questioned in light ofrobustness outcomes. Men from the CanaryIslands were tall but not robust, leading us to thinkabout more than just environmental conditions inexplaining their above-average height (e.g. ethnicorigins; Hooton, 1925). Furthermore, infantmortal-ity for the Canary Islands was among the highestin Spain at the beginning of the 20th century, andtherefore, height cannot easily be related to a lowexposure to morbidity.
NOTES
(1) In 1900, life expectancy in other Europeancountries was 32.4 years in Russia, 42.8 years inItaly, 44.4 years in Germany, 47.4 years in France,48.2 years in the UK, 49.9 years in the Netherlands,and 54.0 years in Sweden (Livi-Bacci, 1990).
(2) Fertility in the most economically developed areasof the country, which also transited earlier towardsa modern demographic regime, was systematicallylower during the first half of the 20th century. Forinstance, in Catalonia (Northeast Spain), the totalnumber of children per woman was 2.1 (1901–1904cohort), whereas it was 3.3 in the whole country.Among subsequent female cohorts, the figurestended to converge across regions. For example,women in Catalonia born in 1946–1950 gavebirth to 2.26 children on average (the figurefor Spain was 2.45) and 1.97 (1.76), respectively,among women born in 1956–1960 ( Cabré, 1999;Nicolau, 2005).
Copyright © 2014 John Wiley & Sons, Ltd.
(3) HDI ranges from 0 to 1. A value of 0.8 is usuallyaccepted as indicative of high development,whereas values under 0.5 are indicative of lowdevelopment.
(4) The degree to which these data are representativeof the overall male population decreased since thebeginning of the 1990s, as an increasing numberof individuals opted for social service instead ofmilitary service. These individuals were not in-cluded in the military statistics, or at least they werenot measured as illustrated by the increasing per-centage of missing cases reported in the sources.This compels us to omit the results on thorax circum-ference and RI for the last cohort group analysed inthis work (1969–1973). Thus, the cohort group1964–1968 was chosen to close the map series.
(5) This index is also known as the body build indexor the Pignet index in reference to the French armydoctor Maurice Charles Joseph Pignet who firstutilised it at the beginning of the 20th century.
(6) The meaning of these categories was adapted bythe Spanish army as follows: very strong, strong,good, intermediate, weak, very weak, and pathologicproblems (Guillén-Rodríguez, 1959). At the end ofthe 1930s, the mining company Diamang in thecolonial state of Angola set 33 as the thresholdfor acceptance or rejection of workers, as this scorewas indicative of extreme weakness (Cleveland,2011: 75–77). The mean RI in a sample of 27 mod-ern Onge women (out of a population of 95 people)in Little Andaman (India) was 23.91 (Pandey,2006). Bhattacharya et al. (1981) found that RIaveraged 38.28 among 27 adult men of an Indianrural community in Mirpur with clear traces ofundernutrition. As expected, no Spanish regionhad an average below the normal RI values, andour data do not indicate the RI distribution of thepopulation.
(7) The average of the 1955–1959 enlistments (the1934–1938 cohort) is derived from 3years of databecause regional data were not provided for 1956and 1957. The average of the 1970–1974 enlist-ments (the 1949–1953 cohort) is a 3-year average(1970, 1973, and 1974). The enlistment years 1971and 1972 were discarded because of the strongdecreases observed in all three anthropometricmeasures. This may be related to tabulation errorsor, more likely, to the earlier age at measurement.
(8) The data are provided in anthropo-demographic‘zones’ and ‘regions’ (Hoyos-Sainz, 1942). Regionsaremore convenient for our purposes because theybetter approximate the current administrativestructure of Spain. Anthropometric zones werediscarded because they were too broad for ourpurposes. For instance, the Northern Zone includesAsturias, Cantabria, País Vasco, and Navarra. Theequivalence between the anthropo-demographic
Popul. Space Place 21, 704–719 (2015)DOI: 10.1002/psp

717Anthropometric Geography
regions and the current autonomous regions ofSpain is as follows (current regions appear inparentheses): regiónGalaica (Galicia), región Cántabra(Asturias and Cantabria), región Vasca (País Vasco),región Aragonesa-Riojana (Aragón, La Rioja, andNavarra), región Castellano-leonesa (Castilla-León),región Catalana (Catalunya and Illes Balears), regiónLevantina (Comunitat Valenciana and Murcia),región Extremeño-manchega (Extremadura and Castilla-La Mancha), and región Andaluza (Andalucia).Note that Hoyos’ criterion results in some socio-economic and cultural caveats. For instance, regiónLevantina includes the current autonomous regionsComunitat Valenciana and Murcia. Per-capitaGDP was systematically higher in the formerduring the central decades of the 20th century,and Murcia was economically more similar tothe southern region of Andalusia. Also, most ofComunitat Valenciana speaks Catalan, thus mak-ing it culturally closer to región Catalana.
(9) The latter is mainly due to the very low infantmortality rates in the Balearic Islands, 72.3 perthousand in 1934–1938 (Gómez-Redondo, 1992).
(10) Cámara (2007: 300) reported that the average heightof 30migrants from theAndalusian town of Santafe(province of Granada) whose military records werefilled in Catalonia and sent to that townwas 1.67m,whereas the mean of the corresponding enlistmentsin Santafe was 1.66m (n=417). These recruits wereborn between 1940 and 1952, and they weremeasured between 1959 and 1963, thus coincidingwith the peak of migration from Andalusia toCatalonia. That migration is selective is alsoexemplified by the socio-demographic profileof the returned people. At the end of the1990s, Andalusian returnees were younger andowned a higher level of education by age thanthe average Andalusian population (Rodríguezet al., 2002).
REFERENCES
Akachi Y, Canning D. 2007. The height of women inSub-Saharan Africa: the role for health, nutrition,and income in childhood. Annals of Human Biology34: 397–410.
Alcaide J. 2003. Evolución económica de las regiones yprovincias españolas en el siglo XX. BBVA: Bilbao.
Alter G. 2004. Height, frailty, and the standard ofliving: modeling the effects of diet and disease on de-clining mortality and increasing height. PopulationStudies 58(3): 265–279.
Arcaleni E. 2006. Secular trend and regional differencesin the stature of Italians, 1854–1980. Economics andHuman Biology 4: 24–38.
Copyright © 2014 John Wiley & Sons, Ltd.
Ballesteros E. 1997. Una estimación del coste de la vidaen España, 1861-1936. Revista de Historia Económica15(2): 363–395.
Bernardi F, RequenaM. 2003. La caída de la fecundidad yel déficit de natalidad en España. Revista Española deSociología (3): 29–49.
Bhattacharya K, Bharati P, Gupta R, Basu A. 1981. Astudy on diet and nutritional anthropometry of thepopulation of Mirpur, District Midnapore, WestBengal. Collgm Antropolgm 5: 51–58.
Blanes A. 2007. La mortalidad en la España del siglo XX.Análisis demográfico y territorial. Universitat Autónomade Barcelona: Bellaterra.
Bogin B. 1988. Patterns of Human Growth. CambridgeUniversity Press: Cambridge.
Bozzoli C, Deaton A, Quintana-Domeque C. 2009.Adult height and childhood disease. Demography46(4): 647–669.
Cabré A. 1999. El sistema català de reproducció. Proa:Barcelona.
Cámara AD. 2007. Niveles de vida en el medio rural deAndalucía Oriental. Universidad de Granada: Gra-nada; 1750–1950.
Cardelús J, Solana M. 2003. Opcions individuals ipautes collectives: mobilitat i poblament a Espanyaa la segona meitat del segle XX. Documents d’anàlisigeográfica 42: 37–70.
Carreras A. 1990. Fuentes y datos para el anàlisisregional de la industrialización española, Pautasregionales de la industrialización española (siglos XIXy XX). in Nadal J, and Carreras A (dirs). Ariel:Barcelona; 3–20.
Carreras A, Prados de la Escosura L, Rosés JR.2005. Renta y riqueza. In Estadísticas Históricasde España. Siglos XIX y XX, 2nd edn, CarrerasA, Tafunell X (eds). Fundación BBVA: Madrid;1298–1376.
Cleveland TC. 2011. Rock Solid: African Laborers on theDiamond Mines of the Companhia de Diamantes deAngola (Diamang), 1917–1975. PhD thesis, Universityof Michigan.
Collantes F, Pinilla V, Sáez LA, Silvestre J. 2013.Reducing depopulation in rural Spain: the impactof immigration. Population, Space and Place. DOI:10.1002/psp.1797
Courtiol A, Rickard IJ, Lummaa V, Prentice AM,Fulford AJC, Stearns SC. 2013. The demographictransition influences variance in fitness and selectionon height and BMI in rural Gambia. Current Biology23(1): 884–889.
Cussó X. 2005. El estado nutritivo de la poblaciónespañola, 1900–1970. Análisis de las necesidades ydisponibilidades de nutrientes. Historia Agraria 36:329–358.
Danubio ME, Amicone E, Vargiu R. 2005. Height andBMI of Italian immigrants to the USA, 1908–1970.Economics and Human Biology 3: 33–43.
Popul. Space Place 21, 704–719 (2015)DOI: 10.1002/psp

718 A. D. Camara and J. Garcia-Roman
Escudero A, Simón H. 2003. El bienestar en España:una perspectiva de largo plazo (1850–1991). Revistade Historia Económica 21(3): 525–565.
Fernández-Cordón JA. 1986. Análisis longitudinal de lafecundidad en España. In Tendencias demográficas yplanificación económica, Olano A (ed.) (comp.)Ministerio de Economía y Hacienda: Madrid; 49–75.
Floud R, Fogel RW, Harris B, Chul-Hong S. 2011. TheChanging Body. Health, Nutrition and HumanDevelopment in the Western World since 1700. CambridgeUniversity Press: Cambridge.
Fogel RW, Costa DL. 1997. A theory of technophysioevolution, with some implications for forecastingpopulation, health care costs, and pension costs.Demography 34(1): 49–66.
García-Ballesteros A. 1990. Desequilibrios interter-ritoriales en la España de las autonomías. Boletín dela Asociación de Geógrafos Españoles 11: 1–14.
García-Barbancho A, Delgado-Cabeza M. 1988. Losmovimientos migratorios interregionales enEspaña desde 1960. Papeles de Economía Española34: 241–266.
Gómez-Mendoza A, Pérez-Moreda V. 1985. Estatura ynivel de vida en la España del primer tercio del sigloXX. Moneda y Crédito 174: 29–64.
Gómez-Redondo R. 1992. La mortalidad infantil españolaen el siglo XX. C.I.S.-Siglo XXI: Madrid.
Gørgens T, Meng X, Vaithianathan R. 2012. Stuntingand selection effects of famine: a case study of the greatChinese famine. Journal of Development Economics 97(1):99–111.
Guillén-Rodríguez M. 1959. La estadística deReemplazo y Reclutamiento de los Ejércitos.Estadística Española (3): 71–75.
Hatton TJ, Bray BE. 2010. Long run trends in theheights of European men, 19th–20th centuries.Economics and Human Biology 8: 405–413.
Hooton EA. 1925. The Ancient Inhabitants of the CanaryIslands. Harvard University Peabody Museum:Harvard.
Hoyos-Sainz L. 1942. Antropodemografía española.Regiones y razas. Real Sociedad Geográfica: Madrid.
United Nations Development Programme online data-base (UNDP). 2011. Human Development Reports,viewed 02/01/2014, http://hdr.undp.org/en/data.
Instituto Nacional de Estadística online database (INE).n.d. Instituto Nacional de Estadística, viewed 10/01/2013, http://www.ine.es/inebaseweb/hist.do.
Komlos J, Baten J (eds). 2004. Recent research inanthropometric history. Social Science History 28(2).Special Issue.
Livi-Bacci M. 1990. Historia mínima de la poblaciónmundial. Ariel: Barcelona; 115.
Martínez-Carrión JM. 2005. Estaturas, desigualdadregional y desarrollo económico en Italia y Españadurante el siglo XX.Mediterráneo Económico 7: 206–228.
Copyright © 2014 John Wiley & Sons, Ltd.
Martínez-Carrión JM. 2009 (ed). La HistoriaAntropométrica y la Historiografía Iberoamericana(monograph). Historia Agraria 47: 3–10.
Martínez-Carrión JM. 2012. La talla de los europeos,1700–2000: ciclos, crecimiento y desigualdad.Investigaciones de Historia Económica 8: 176–187.
Mascie-Taylor CGN. 1984. The interaction betweengeographical and social mobility. In Migration andMobility, Biosocial Aspects of Human Movement, AJBoyce (ed.). Symposia of the Society for the Studyof Human Biology, 23. Taylor & Francis: Londonand Philadelphia; 161–178.
Moorad JA. 2013. A demographic transition alteredthe strength of selection for fitness and age-specific survival and fertility in a 19th centuryAmerican population. Evolution 67(6): 1622–1634.
Nicolau R. 2005. Población, salud y actividad. InEstadísticas Históricas de España. Siglos XIX y XX,2nd edn, Carreras A, Tafunell X (coords.). FundaciónBBVA: Madrid; 79–154.
Nicolau R, Pujol J. 2006. Variaciones regionales de losprecios de consumo y de las dietas en España, en losinicios de la transición demográfica. Revista de HistoriaEconómica. Journal of Iberian and Latin AmericanEconomic History 24(3): 521–554.
Pandey AK. 2006. Anthropometry of female Onges oflittle Andaman. Anthropologist 8(2): 99–102.
Peracchi F, Arcaleni E. 2011. Early-life environment,height and BMI of young men in Italy. Economicsand Human Biology 9: 251–264.
Quiroga G. 1998. Height evolution in Spain, 1893–1954.An analysis by regions and professions. In TheBiological Standard of Living in ComparativePerspective, Komlos J, Baten J (eds). Franz Steiner:Stuttgart; 359–383.
Quiroga G. 2001. Estatura, diferencias regionales ysociales y niveles de vida en España (1893–1954).Revista de Historia Económica 19 (1): 175–200.
Ramiro-Fariñas D, Sanz-Gimeno A. 2000. Struc-tural changes in childhood mortality in Spain,1860–1990. International Journal of Population Geography6: 61–82.
Reher DS. 2001. In search of the ‘urban penalty’:exploring urban and rural mortality patterns inSpain during the demographic transition. Interna-tional Journal of Population Geography 7: 105–127.
Rodríguez V, Egea C, Nieto JA. 2002. Return migrationin Andalusia, Spain. International Journal of PopulationGeography 8: 233–254.
Salvatore R. 2004. Stature, nutrition, and regionalconvergence: the Argentine Northwest in the firsthalf of the twentieth century. Social Science History28(2): 297–324.
Silventoinen K. 2003. Determinants of variation inadult body height. Journal of Biosocial Science 35:263–85.
Popul. Space Place 21, 704–719 (2015)DOI: 10.1002/psp

719Anthropometric Geography
Simpson J. 1995. Spanish Agriculture: The LongSiesta, 1765–1965. Cambridge University Press:Cambridge.
Spijker J, Cámara AD, Blanes A. 2012. The health transi-tion and biological living standards: adult height andmortality in 20th-century Spain. Economics and HumanBiology 10(3): 276–288.
Steckel RH. 2009. Heights and human welfare: recentdevelopments and new directions. Explorations inEconomic History 46(1): 1–23.
Steckel RH. 2013. Biological measures of economichistory. Annual Review of Economics 5(1): 401–23.
Copyright © 2014 John Wiley & Sons, Ltd.
Szklarska A, Lipowicz A, Lopuszanska M, Bielicki T,Koziel S. 2008. Biological condition of adult migrantsand nonmigrants inWroclaw, Poland.American Journalof Human Biology 20: 139–145.
Tassenaar V. 1995. Regional differences in standard of liv-ing in the Netherlands, 1800–1875: a study based on an-thropometric data. University ofGroningen,Groningen.
Waaler HT. 1984. Height, weight and mortality: the Nor-wegian experience.ActaMedica Scandinavica. 679: 1–51.
Wolanski N. 1985. Secular trend, secular changes, orlong-term adaptational fluctuations? Acta MedicaAuxologica 17(1): 7–19.
Popul. Space Place 21, 704–719 (2015)DOI: 10.1002/psp