Annual Report to Congress on Federal Government Energy ...
210
Annual Report to Congress on Federal Government Energy Management and Conservation Programs Fiscal Year 2000 December 13, 2002 U.S. Department of Energy Assistant Secretary, Energy Efficiency and Renewable Energy Federal Energy Management Program Washington, DC 20585
-
Upload
khangminh22 -
Category
Documents
-
view
1 -
download
0
Transcript of Annual Report to Congress on Federal Government Energy ...

Annual Report to Congress on Federal GovernmentEnergy Management andConservation ProgramsFiscal Year 2000
December 13, 2002
U.S. Department of EnergyAssistant Secretary, Energy Efficiency and Renewable EnergyFederal Energy Management ProgramWashington, DC 20585
TABLE OF CONTENTS
EXECUTIVE SUMMARY . . . . . . . . . . . . . . . . . . . . . . . . . . . . . . . . . . . . . . . . . . . . . . . . . . . 1
I. OVERVIEW OF FEDERAL ENERGY MANAGEMENT ACTIVITIES . . . . . . 7A. Overview of Federal Energy Management Policy and Legislative Mandates . . 7B. Overall Federal Energy Consumption, Costs, and Carbon Emissions . . . . . . . 10C. Energy Management Infrastructure and Tools . . . . . . . . . . . . . . . . . . . . . . . . . 19
1. Federal Coordination . . . . . . . . . . . . . . . . . . . . . . . . . . . . . . . . . . . . . . 192. Training . . . . . . . . . . . . . . . . . . . . . . . . . . . . . . . . . . . . . . . . . . . . . . . . 213. Awards and Recognition . . . . . . . . . . . . . . . . . . . . . . . . . . . . . . . . . . . 224. Federal Energy Saver Showcase Facilities . . . . . . . . . . . . . . . . . . . . . . 265. Energy Awareness . . . . . . . . . . . . . . . . . . . . . . . . . . . . . . . . . . . . . . . . 276. Public Education Programs . . . . . . . . . . . . . . . . . . . . . . . . . . . . . . . . . 28
D. Financing Mechanisms for Energy Efficiency Improvements inFederal Facilities . . . . . . . . . . . . . . . . . . . . . . . . . . . . . . . . . . . . . . . . . . . . . . . 311. Direct Appropriations . . . . . . . . . . . . . . . . . . . . . . . . . . . . . . . . . . . . . 312. Federal Energy Efficiency Fund . . . . . . . . . . . . . . . . . . . . . . . . . . . . . . 353. Energy Savings Performance Contracting . . . . . . . . . . . . . . . . . . . . . . 364. Utility Energy Service Contracts . . . . . . . . . . . . . . . . . . . . . . . . . . . . . 415. Life-Cycle Costing (LCC) . . . . . . . . . . . . . . . . . . . . . . . . . . . . . . . . . . 42
E. ENERGY STAR® and Energy Efficient Product Procurement . . . . . . . . . . . . . . 43F. Integrated Whole Building Efficiency . . . . . . . . . . . . . . . . . . . . . . . . . . . . . . . 45
1. Federal Building Energy Performance Standards . . . . . . . . . . . . . . . . 452. ENERGY STAR® Buildings . . . . . . . . . . . . . . . . . . . . . . . . . . . . . . . . . . 453. Sustainable Building Design . . . . . . . . . . . . . . . . . . . . . . . . . . . . . . . . 464. Highly Efficient Systems . . . . . . . . . . . . . . . . . . . . . . . . . . . . . . . . . . . 475. Water Conservation . . . . . . . . . . . . . . . . . . . . . . . . . . . . . . . . . . . . . . . 48
G. Renewable Energy . . . . . . . . . . . . . . . . . . . . . . . . . . . . . . . . . . . . . . . . . . . . . . 49
II. ENERGY MANAGEMENT IN STANDARD BUILDINGS . . . . . . . . . . . . . . . . . 51A. Energy Consumption and Costs for Standard Buildings . . . . . . . . . . . . . . . . . 51B. Progress Toward the Mandated Goals for Standard Buildings . . . . . . . . . . . . 59
III. INDUSTRIAL, LABORATORY, AND OTHER ENERGY INTENSIVEFACILITIES . . . . . . . . . . . . . . . . . . . . . . . . . . . . . . . . . . . . . . . . . . . . . . . . . . . . . . . 65A. Energy Consumption and Costs for Energy Intensive Facilities . . . . . . . . . . . 65B. Statutory Background and Progress Toward Goals for Energy
Intensive Facilities . . . . . . . . . . . . . . . . . . . . . . . . . . . . . . . . . . . . . . . . . . . . . . 68
IV. EXEMPT FACILITIES . . . . . . . . . . . . . . . . . . . . . . . . . . . . . . . . . . . . . . . . . . . . . . 72A. Energy Consumption and Costs for Exempt Facilities . . . . . . . . . . . . . . . . . . 72
i

V. ENERGY MANAGEMENT IN VEHICLES AND EQUIPMENT . . . . . . . . . . . . 75A. Energy Consumption and Costs for Vehicles and Equipment . . . . . . . . . . . . . 75
VI. FEDERAL AGENCY ENERGY MANAGEMENT ACTIVITIES . . . . . . . . . . . 81A. Department of Agriculture . . . . . . . . . . . . . . . . . . . . . . . . . . . . . . . . . . . . . . . . 81B. Department of Commerce . . . . . . . . . . . . . . . . . . . . . . . . . . . . . . . . . . . . . . . . 86C. Department of Defense . . . . . . . . . . . . . . . . . . . . . . . . . . . . . . . . . . . . . . . . . . 89D. Department of Energy . . . . . . . . . . . . . . . . . . . . . . . . . . . . . . . . . . . . . . . . . . . 94E. Department of Health and Human Services . . . . . . . . . . . . . . . . . . . . . . . . . . . 99F. Department of the Interior . . . . . . . . . . . . . . . . . . . . . . . . . . . . . . . . . . . . . . . 104G. Department of Justice . . . . . . . . . . . . . . . . . . . . . . . . . . . . . . . . . . . . . . . . . . 108H. Department of Labor . . . . . . . . . . . . . . . . . . . . . . . . . . . . . . . . . . . . . . . . . . . 111I. Department of State . . . . . . . . . . . . . . . . . . . . . . . . . . . . . . . . . . . . . . . . . . . . 113J. Department of Transportation . . . . . . . . . . . . . . . . . . . . . . . . . . . . . . . . . . . . 118K. Department of the Treasury . . . . . . . . . . . . . . . . . . . . . . . . . . . . . . . . . . . . . . 120L. Department of Veterans Affairs . . . . . . . . . . . . . . . . . . . . . . . . . . . . . . . . . . . 123M. Environmental Protection Agency . . . . . . . . . . . . . . . . . . . . . . . . . . . . . . . . . 126N. General Services Administration . . . . . . . . . . . . . . . . . . . . . . . . . . . . . . . . . . 131O. National Aeronautics and Space Administration . . . . . . . . . . . . . . . . . . . . . . 135P. National Archives and Records Administration . . . . . . . . . . . . . . . . . . . . . . 141Q. Nuclear Regulatory Commission . . . . . . . . . . . . . . . . . . . . . . . . . . . . . . . . . . 142R. Office of Personnel Management . . . . . . . . . . . . . . . . . . . . . . . . . . . . . . . . . 144S. Social Security Administration . . . . . . . . . . . . . . . . . . . . . . . . . . . . . . . . . . . 146T. Railroad Retirement Board . . . . . . . . . . . . . . . . . . . . . . . . . . . . . . . . . . . . . . 149U. Tennessee Valley Authority . . . . . . . . . . . . . . . . . . . . . . . . . . . . . . . . . . . . . . 150V. United States Postal Service . . . . . . . . . . . . . . . . . . . . . . . . . . . . . . . . . . . . . 154
TABLES Table 1-A Total Primary Energy Consumption by Federal Agencies . . . . . . . . . . . . . . . . 11Table 1-B Total Site-Delivered Energy Consumption by Federal Agencies . . . . . . . . . . 12Table 2 Federal Petroleum Usage in FY 2000 . . . . . . . . . . . . . . . . . . . . . . . . . . . . . . . 15Table 3 Carbon Emissions from Federal Agency Facility Energy Use . . . . . . . . . . . . . 18Table 4-A Agency Direct Appropriations for Energy Conservation Retrofits and Capital
Equipment, FY 1985 through FY 2000 (Thousands of Nominal Dollars) . . 32Table 4-B Agency Direct Appropriations for Energy Conservation Retrofits and Capital
Equipment, FY 1985 through FY 2000 (Thousands of Constant 2000 Dollars) . . . . . . . . . . . . . . . . . . . . . . . . . . . . . . . . . . . . . . . . . . . . . . . . . 33
Table 5-A Federal Primary Energy Consumption in Standard Buildings . . . . . . . . . . . . . 52Table 5-B Federal Site-Delivered Energy Consumption in Standard Buildings . . . . . . . . 53Table 6 Petroleum-Based Fuel Consumption in Standard Buildings . . . . . . . . . . . . . . 56Table 7-A Defense and Civilian Federal Costs for Buildings Energy in FY 2000 . . . . . . 57Table 7-B Consumption and Costs of Federal Buildings Energy
by Fuel Type in FY 2000, FY 1999, and FY 1985 . . . . . . . . . . . . . . . . . . . . 58
ii

Table 8-A Federal Standard Buildings Site-Delivered Energy UsePer Gross Square Foot, FY 1985 and FY 2000 . . . . . . . . . . . . . . . . . . . . . . . 61
Table 8-B Federal Standard Buildings Primary Energy UsePer Gross Square Foot, FY 1985 and FY 2000 . . . . . . . . . . . . . . . . . . . . . . . 62
Table 9 Federal Site-Delivered Energy Consumption in Energy Intensive Facilities . . 66Table 10 Defense and Civilian Federal Costs for Energy Intensive Facilities
in FY 2000 . . . . . . . . . . . . . . . . . . . . . . . . . . . . . . . . . . . . . . . . . . . . . . . . . . . 67Table 11 Energy Consumption, Costs, and Gross Square Footage of
Federal Exempt Facilities, FY 2000 . . . . . . . . . . . . . . . . . . . . . . . . . . . . . . . . 73Table 12 Consumption and Costs of Federal Exempt Facility Energy
By Fuel Type in FY 2000 . . . . . . . . . . . . . . . . . . . . . . . . . . . . . . . . . . . . . . . . . 73Table 13 Federal Energy Consumption in Vehicle and Equipment Operations . . . . . . . 76Table 14-A Defense and Civilian Federal Costs for Vehicle and Equipment
Energy in FY 2000 . . . . . . . . . . . . . . . . . . . . . . . . . . . . . . . . . . . . . . . . . . . . . 78Table 14-B Consumption and Costs of Vehicle and Equipment Energy
by Fuel Type in FY 2000, FY 1999, and FY 1985 . . . . . . . . . . . . . . . . . . . . 79Table C Federal Energy Expenditures, FY 1985 through FY 2000 . . . . . . . . . . . . . . . C-2
FIGURES
Figure ES-1 Decrease in Btu per Gross Square Foot in Federal StandardBuildings from FY 1985 . . . . . . . . . . . . . . . . . . . . . . . . . . . . . . . . . . . . . . . . . 4
Figure ES-2 Federal Consumption of Petroleum-Based FuelsFY 1985 through FY 2000 . . . . . . . . . . . . . . . . . . . . . . . . . . . . . . . . . . . . . . . . 5
Figure 1 Federal Energy Consumption, FY 2000 . . . . . . . . . . . . . . . . . . . . . . . . . . . . . . 13Figure 2 Federal Energy Costs, FY 2000 . . . . . . . . . . . . . . . . . . . . . . . . . . . . . . . . . . . . 14Figure 3 Carbon Emissions from Federal Energy Consumption,
FY 1990 to FY 2000 . . . . . . . . . . . . . . . . . . . . . . . . . . . . . . . . . . . . . . . . . . . . 16Figure 4 Direct Appropriations for Energy Conservation Retrofits . . . . . . . . . . . . . . . . 34Figure 5 Defense and Civilian Energy Consumption
in Standard Buildings by Fuel Type, FY 2000 . . . . . . . . . . . . . . . . . . . . . . . . 51Figure 6 Consumption of Electricity and Other Fuels
in Standard Buildings, FY 1985 through FY 2000 . . . . . . . . . . . . . . . . . . . . 54Figure 7 Energy Costs (Constant 2000 Dollars) in Standard Buildings,
FY 1985 through FY 2000 . . . . . . . . . . . . . . . . . . . . . . . . . . . . . . . . . . . . . . . . 55Figure 8 Progress Toward the Energy Reduction Goals for Federal
Standard Buildings, FY 1985 through FY 2000 . . . . . . . . . . . . . . . . . . . . . . . 59Figure 9 Progress of Individual Agencies Toward the Federal Reduction Goal
for Standard Buildings, FY 2000 . . . . . . . . . . . . . . . . . . . . . . . . . . . . . . . . . . . 63Figure 10 Defense and Civilian Federal Energy Consumption
in Vehicles and Equipment by Fuel Type, FY 2000 . . . . . . . . . . . . . . . . . . . . 77
iii

APPENDICES
Appendix A List of Authorities . . . . . . . . . . . . . . . . . . . . . . . . . . . . . . . . . . . . . . . . . . . . . A-1Appendix B Data Collection . . . . . . . . . . . . . . . . . . . . . . . . . . . . . . . . . . . . . . . . . . . . . . . B-1Appendix C Federal Energy Expenditures FY 1985 through FY 2000 . . . . . . . . . . . . . . . C-1Appendix D Industrial, Laboratory, Research, and Other Energy Intensive Facilities
in FY 2000 . . . . . . . . . . . . . . . . . . . . . . . . . . . . . . . . . . . . . . . . . . . . . . . . . . . D-1Appendix E Exempt Facilities in FY 2000 . . . . . . . . . . . . . . . . . . . . . . . . . . . . . . . . . . . . E-1Appendix F Federal Interagency Energy Policy Committee . . . . . . . . . . . . . . . . . . . . . . . F-1Appendix G Personnel of the Department of Energy’s Federal
Energy Management Program . . . . . . . . . . . . . . . . . . . . . . . . . . . . . . . . . . . G-1
iv

AGENCY ACRONYMS
Commodity Futures Trading CommissionCentral Intelligence AgencyDepartment of AgricultureDepartment of CommerceDepartment of DefenseDepartment of EnergyDepartment of Health and Human Services Department of Housing and Urban DevelopmentDepartment of the InteriorDepartment of JusticeDepartment of LaborDepartment of StateDepartment of TransportationDepartment of the TreasuryDepartment of Veterans AffairsEnvironmental Protection AgencyEqual Employment Opportunity CommissionFederal Communications CommissionFederal Emergency Management AgencyFederal Energy Regulatory CommissionFederal Trade CommissionGeneral Services AdministrationInternational Broadcasting BureauNational Aeronautics and Space AdministrationNational Archives and Records AdministrationNational Science FoundationNuclear Regulatory CommissionOffice of Personnel ManagementPanama Canal CommissionRailroad Retirement BoardSocial Security AdministrationTennessee Valley AuthorityUnited States Information AgencyUnited States Postal Service
CFTC CIA USDA DOC DOD DOE HHS HUD DOI DOJ DOL ST DOT TRSY VA EPA EEOC FCC FEMA FERC FTC GSA IBB NASA NARA NSF NRC OPM PCC RRB SSA TVA USIA USPS
INTERNET WEB SITES CITED IN THIS REPORT
Federal Energy Management Program www.eren.doe.gov/femp Energy Efficiency and Renewable
Energy Clearinghouse www.eren.doe.gov National Energy Information Center www.eia.doe.gov Alternative Fuels Data Center www.afdc.nrel.gov Clean Cities Program www.ccities.doe.gov
v

This page intentionally left blank.
vi

EXECUTIVE SUMMARY
This report on Federal Energy Management for Fiscal Year (FY) 2000 provides information on energy consumption in Federal buildings, operations, and vehicles and equipment, and documents activities conducted by Federal agencies to meet the statutory requirements of Title V, Part 3, of the National Energy Conservation Policy Act (NECPA), as amended, 42 U.S.C. §§ 8251-8259, 8262, 8262b-k, and Title VIII of NECPA, 42 U.S.C. § 8287-8287c. Implementation activities undertaken during FY 2000 by the Federal agencies under the Energy Policy Act of 1992 (EPACT) and Executive Order 13123, Greening the Government through Efficient Energy Management, are also discussed in this report. FY 2000 is the first full reporting year for Executive Order 13123, which was signed in June 1999.
Based on reports submitted to the Department of Energy (DOE) by 29 Federal agencies, the total primary energy consumption of the Government of the United States, including energy consumed to produce, process, and transport energy, was 1.39 quadrillion British Thermal Units (quads) during FY 2000.1 These 1.39 quads consumed by the Government in buildings and operations to provide essential services to its citizens, including the defense of the Nation, represent approximately 1.4 percent of the total 99.08 quads2 used in the United States. In total, the Federal Government is the single largest energy consumer in the Nation, although its pattern of consumption is widely dispersed geographically.
The Government consumed 0.98 quads during FY 2000 when measured in terms of energy actually delivered to the point of use (site-delivered energy consumption). Unless otherwise noted, this report uses the site-measured conversion factors to convert common units for electricity and steam to British Thermal Units (Btu). The total site-delivered energy consumption in FY 2000 was 32.4 percent less than the FY 1985 base year. This reduction of 470.8 trillion Btu, which reflects both a drop in Government activity and the success of energy management efforts, could satisfy the energy needs of the State of Montana for more than one year.3 The total cost of the 0.98 quads was $7.4 billion in FY 2000.4 This is $3.5 billion less than the $10.5
1Primary energy consumption considers all energy resources used to generate and transport electricity and steam. Tables 1-A, 5-A, and 8-B show primary energy consumption for comparison with site-delivered consumption shown in Tables 1-B, 5-B, and 8-A respectively. Conversion factors of 10,346 Btu per kilowatt hour for electricity and 1,390 Btu per pound of steam are used to calculate gross energy consumption.
2DOE/EIA-0035(2001/7), Monthly Energy Review, July 2001.
3Based on site-delivered energy consumption estimates for 1999 in the residential, commercial, industrial, and transportation sectors (312.4 trillion Btu). Source: DOE/EIA-0214(99), State Energy Data Report, 1999, Table 9; May 2001.
4Unless otherwise noted, all costs cited in this report are in constant 2000 dollars, calculated using Gross Domestic Product implicit price deflators. See DOE/EIA-0384(99), Annual Energy Review 2000, Table E1; July 2001). Costs noted as nominal dollars reflect the price paid at the time of the transaction and have not been adjusted to remove the effect of changes in the spending power of the dollar.
1

billion reported in FY 1985, a 30.0 percent5 decrease in nominal costs. In constant 2000 dollars, this equates to a decrease of 51.8 percent from $15.3 billion in FY 1985 to $7.4 billion in FY 2000. The Federal energy bill for FY 2000 decreased 9.3 percent from the previous year. These reductions in energy costs are attributable primarily to reduced energy prices and reduced Government activity, although they also reflect the effects of agency energy management efforts. Many other variables also contribute to fluctuations in annual energy consumption and costs, including changes in building square footage, building stock, weather, tempo of operations, fuel mix, and vehicle, naval, and aircraft fleet composition.
Federal agencies report energy consumption under four categories: standard buildings; industrial, laboratory and other energy intensive facilities; exempt facilities; and vehicles and equipment.
Standard Buildings In FY 2000, the Federal Government used 326.8 trillion British Thermal Units (Btu) to provide energy to almost 3.1 billion square feet of standard buildings space. This consumption represents a 22.6 percent decrease compared to FY 1985 and a 2.1 percent decrease relative to FY 1999. These significant drops reflect the success of Federal energy management efforts in reducing fossil fuel use in Federal facilities. The cost of energy for buildings and facilities in FY 2000 was $3.4 billion, a decrease of approximately $61.3 million from FY 1999 expenditures, and a decrease of 35.3 percent from the FY 1985 expenditure of $5.2 billion.6 These cost savings are attributable largely to reduced energy prices and successful energy management.
Industrial, Laboratory and Other Energy Intensive Facilities Under section 543(a)(2) of NECPA, as amended by EPACT, 42 U.S.C. § 8253, buildings that house energy-intensive activities may be excluded from NECPA’s performance goal for buildings. Most energy used in these facilities is process energy. Process energy is consumed in industrial operations, laboratories, certain R&D activities, and in electronic-intensive facilities.
Section 203 of Executive Order 13123 sets a goal for these facilities that requires each agency to reduce energy consumption per square foot, per unit of production, or per other unit as applicable by 20 percent by 2005 and 25 percent by 2010 relative to 1990.
In FY 2000, the Federal Government used 67.0 trillion Btu of energy in energy intensive operations, approximately 6.8 percent of the total 0.98 quads consumed. Total energy consumption in this category decreased 10.9 percent relative to FY 1990 and increased 8.0 percent relative to FY 1999. These changes resulted from both changes in activity levels and energy management efforts.
The Federal Government spent $611.2 million on energy intensive operations energy in FY 2000, $60.6 million more than the FY 1999 expenditure of $550.6 million constant dollars.
5Calculation of percent changes in this report do not account for rounding of numbers in text.
6Cost and consumption figures for FY 1985 may be different from those published in last year’s Annual Report since Federal agencies update their files and provide revisions to their data.
2

Exempt Facilities Sec. 704 of the Executive Order 13123 defines “Exempt facility” as “a facility. . .for which an agency uses DOE-established criteria to determine that compliance with the Energy Policy Act of 1992 or [Executive Order 13123] is not practical.” Five agencies, the Departments of Defense, Health and Human Services, and Transportation, the National Aeronautics and Space Administration, and the General Services Administration (GSA) have chosen to exempt facilities from Executive Order requirements. In addition, the U.S. Postal Service has reported electricity consumption used in mail processing automation under this exempt category without reporting associated facility square footage. Energy used in exempt facilities accounts for approximately 2.1 percent of the total 0.98 quads used by the Federal Government. Electricity constitutes 74.8 percent of the energy used in exempt facilities, 4.8 percent is accounted for by natural gas, and 13.7 percent by fuel oil. Small amounts of purchased steam, liquefied petroleum gas (LPG)/propane, and “other” energy account for the remaining 6.7 percent.
The energy used in exempt facilities in FY 2000 accounted for approximately 3.6 percent of the total Federal energy bill. The Federal Government spent approximately $264.0 million for this category’s energy during the fiscal year. FY 2000 was the first year agencies reported energy data under this category and agencies were not consistent in revising all previous years’ data. Therefore, comparisons of overall exempt energy use with previous years are not appropriate.
Vehicles and Equipment The vehicles and equipment category includes aircraft and naval fuels, automotive gasoline, diesel fuel consumed by Federally-owned and leased vehicles and privately-owned vehicles used for official business, and the energy used in Federal construction.
In FY 2000, the Federal Government used approximately 566.1 trillion Btu of energy in vehicles and equipment, 57.7 percent of the total 0.98 quads consumed. Total energy consumption in vehicles and equipment decreased 39.4 percent relative to FY 1985 and was 6.8 percent less than the FY 1999 consumption of 607.5 trillion Btu. Most of these decreases are attributable to declines in the operation of vehicles and aircraft by the Department of Defense. The Department of Defense consumed 521.7 trillion Btu or 92.2 percent of all vehicles and equipment energy used by the Federal Government.
The Federal Government spent $3.1 billion on vehicles and equipment energy in FY 2000, $888.2 million less than the FY 1999 expenditure.
Investments in Energy Efficiency During FY 2000, Federal agencies had three primary options for financing energy efficiency, water conservation, and renewable energy projects in buildings and facilities: direct appropriated funding, energy savings performance contracts (ESPCs), and utility energy service contracts (UESCs). Known funding from the three sources totaled approximately $599 million in FY 2000. Direct appropriations accounted for approximately $121 million. ESPC contracts awarded in FY 2000 resulted in approximately $287 million in estimated contractor investment ($62 million from DOE Super ESPC delivery orders and $225 million from other agency ESPCs), and approximately $191 million in private sector investment came from utility energy service contracts. While these three categories of funding are not entirely comparable, they do indicate
3

that ESPCs and UESCs have become the dominant source of support for efficiency investments throughout the Federal Government. Energy efficiency investment from ESPCs and UESCs increased 17.4 percent from $395.3 million in FY 1999 to $478.5 million in FY 2000. In FY 1998, investment from these sources totaled only $142.6 million. In FY 2000, direct funding identified by agencies for energy conservation retrofits and capital equipment decreased 41.0 percent to $121.1 million from $205.2 million dollars in FY 1999.
Since 1985, The Government has invested approximately $3.8 billion in energy efficiency, $2.5 billion of which was direct appropriations and $1.3 billion from alternative financing mechanisms ($0.8 billion from ESPCs and $0.5 billion from UESCs).
Agency Progress in Meeting Energy Reduction Goals NECPA, as amended by EPACT, requires agencies to take the steps necessary to reduce energy consumption in Federal buildings by 10 percent by 1995 compared to 1985 consumption levels, based on Btu per gross square foot, and requires a 20 percent reduction by 2000 compared to 1985 consumption levels. The 10 percent goal was met by the Government in FY 1995 with a 12.7 percent reduction from FY 1985. Executive Order 12902 added a goal of reducing energy consumption by 30 percent by the year 2005 relative to 1985 consumption levels. Executive Order 13123 adds an additional goal of a 35 percent reduction by 2010, compared to FY 1985. During FY 2000 agencies provided data to DOE that indicated a decrease in energy consumption per gross square foot of 23.6 percent relative to FY 1985. The Government’s performance for each year since FY 1985 is illustrated in Figure ES-1. This reduction was the result of significant decreases in the consumption of fuel oil, natural gas, and coal. The use of non-electric fuels in Federal buildings has declined 61.0 percent since 1985, while the consumption of electricity has increased by only 1.1 percent. The installation and increased use of electricity-driven electronic equipment contributed to increases in electricity through the years. Electricity now represents about 74.0 percent of the total energy costs of Federal buildings and accounts for 44.7 percent of total site-delivered energy consumption in buildings. This is compared to 31.1 percent of the total site-delivered energy consumption in buildings in FY 1985. Agency efforts undertaken in FY 2000 to increase energy efficiency in buildings included:
Btu
per
Gro
ss S
quar
e Fo
ot
FIGURE ES-1Decrease in Btu per Gross Square Foot
in Federal Standard Buildings and Facilities from FY 1985
145,000
140,000
135,000
130,000
125,000
120,000
115,000
110,000
105,000
100,000
95,000 85 86 87 88 89 90 91 92 93 94 95 96 97 98 99 00 01 02 03 04 05
10% Goal - 1995
20% Goal - 2000
30% Goal - 2005
Actual Energy Use
23.6% Reduction, 2000
FISCAL YEAR
4

# improvement of operations and maintenance procedures; # implementation of no-cost, low-cost efficiency measures; # energy-efficient building retrofits and capital improvements; # energy awareness activities and employee training programs; and # procurement of energy-efficient goods and products.
Reducing Petroleum-Based Fuel Consumption Effective management of energy resources is of strategic importance to the Federal Government as well as the Nation. In FY 2000, petroleum-based fuels accounted for 0.61 quads of the total 0.98 quads consumed by the Federal Government, with 0.56 quads used by the Department of Defense, primarily for jet fuel and distillate/diesel for vehicles and equipment. The Federal Government consumed 42.1 percent less petroleum-based fuel in FY 2000 than in FY 1985. Figure ES-2 illustrates the trend in the Federal Government’s use of petroleum fuels.
TRIL
LIO
N B
TU
FIGURE ES-2 Federal Consumption of Petroleum-Based Fuels FY 1985
through FY 2000 1,200
1,000
800
600
400
200
0 1985 1986 1987 1988 1989 1990 1991 1992 1993 1994 1995 1996 1997 1998 1999 2000
702 617
762 732 775 628 612 551 522 513 476 446 445 403
348 322 367
335
292 290 276
248 231 239
222 220 236 227 206 207
710 706
FISCAL YEAR Jet Fuel Other Fuels
Section 205 of Executive Order 13123 directs agencies to minimize the use of petroleum-based fuels in buildings and facilities. Federal agencies have made significant progress in reducing their dependence on petroleum-based fuels in their buildings and facilities. For example, Federal agencies report that in FY 2000, 34.0 trillion Btu of petroleum-based fuels were used for buildings and facilities energy, a 65.1 percent decrease from FY 1985 and a 6.7 percent decrease from FY 1999. This represents 10.4 percent of total buildings and facilities energy consumption.
Renewable Energy Section 204 of Executive Order 13123 restates the goal of the Million Solar Roofs Initiative, which is 2,000 solar roof installations in the Federal Government by 2000, and 20,000 installations by 2010. In the period from June 1997 to April 2000 the Federal Government installed 1,745 solar energy systems. This total included 1,682 solar hot water systems, 58 photovoltaic power systems and 5 transpired solar thermal collectors. The U.S. Navy installed an additional 1000 solar hot water systems by the end of FY 2000. This brought total installations to just over 2,700 systems by the end of 2000, accomplishing the Federal goal.
5

Federal Energy Management Highlights Progress is being made in increasing Federal energy efficiency, although there remain opportunities for greater efficiency and cost reduction. Several of the most important findings of this report are listed below:
# The overall real cost of energy consumption in the Federal Government measured in constant 2000 dollars has fallen from $15.3 billion in FY 1985 to $7.4 billion in FY 2000. While most of this drop is attributable to declining energy prices and reduced Defense-related activity, energy management efforts made a significant contribution.7
# Total site-delivered energy consumption in FY 2000 decreased 32.4 percent from FY 1985; again, a reflection of both reduced Defense-related activity and successful energy management efforts.7
# Energy consumption in buildings in FY 2000 decreased 22.6 percent from FY 1985.7
# On a Btu-per-gross-square-foot basis, the 23.6 percent reduction in buildings site-delivered energy puts the Federal Government past the 20 percent reduction goal for 2000—a good indicator of the success of energy management efforts.
# Nine agencies, the Departments of Agriculture, Commerce, Defense, Energy, Justice, Transportation, the General Services Administration, the National Aeronautics and Space Administration, and the Tennessee Valley Authority have surpassed a 20 percent reduction in buildings energy use per gross square foot from 1985.
# Energy consumption in FY 2000 was used for the following purposes:
End Use Percentage Cost Standard Buildings 33.3 percent $3.4 billion Energy Intensive Facilities 6.8 percent $0.6 billion Exempt Facilities 2.1 percent $0.3 billion Vehicles & Equipment 57.7 percent $3.1 billion
7Many other variables also contribute to fluctuations in annual energy consumption and costs, including changes in building square footage, building stock, weather, tempo of operations, fuel mix, and vehicle, naval, and aircraft fleet composition.
6

I. OVERVIEW OF FEDERAL ENERGY MANAGEMENT ACTIVITIES
A. Overview of Federal Energy Management Policy and Legislative Mandates
This report on Federal Energy Management for Fiscal Year (FY) 2000 provides information on energy consumption in Federal buildings and operations and documents activities conducted by Federal agencies to meet the statutory requirements of Title V, Part 3, of the National Energy Conservation Policy Act (NECPA), as amended, 42 U.S.C. §§ 8251-8259, 8262, 8262b-k and Title VIII of NECPA, 42 U.S.C. § 8287-8287c. Implementation activities undertaken during FY 2000 by the Federal agencies under the Energy Policy Act of 1992 (EPACT) and Executive Order 13123, Greening the Government through Efficient Energy Management, are also discussed in this report. FY 2000 is the first full reporting year for Executive Order 13123, which was signed in June 1999. In compliance with section 381(c) of the Energy Policy and Conservation Act (EPCA), as amended, 42 U.S.C. § 6361c, this report also describes the energy conservation and management activities of the Federal Government under the authorization of section 381 of EPCA, 42 U.S.C. § 6361.
Requirements of National Energy Conservation Policy Act (NECPA) and Energy Policy Act of 1992 (EPACT)
NECPA provides major policy guidance to Federal agencies to improve energy management in their facilities and operations. Amendments to NECPA made by the Federal Energy Management Improvement Act of 1988, 42 U.S.C. § 8253 (a)(1), required each agency to achieve a 10 percent reduction in energy consumption in its Federal buildings by FY 1995, when measured against a FY 1985 baseline on a Btu-per-gross-square-foot basis. It also directed DOE to establish life-cycle costing methods and coordinate Federal conservation activities through the Interagency Energy Management Task Force. Section 152 of Subtitle F of EPACT, Federal Agency Energy Management, further amends NECPA and contains provisions regarding energy management requirements, life-cycle cost methods and procedures, budget treatment for energy conservation measures, incentives for Federal facility energy managers, reporting requirements, new technology demonstrations, and agency surveys of energy-saving potential.
Requirements of Executive Order 13123
On June 3, 1999, the President signed Executive Order 13123, Greening the Government Through Efficient Energy Management, superseding Executive Order 12902. This new Executive Order addresses greenhouse gas emissions from Federal facilities, and makes energy-efficiency targets more stringent.
The key requirements of the legislation and Executive Order authorities are outlined in the exhibit below along with current findings.
7

KEY REQUIREMENTS OF LEGISLATIVE AND EXECUTIVE ORDER AUTHORITIES
Statute/Directive Requirement FY 2000 Findings Annual Report Discussion
Section 543, NECPA, 42 U.S.C., § 8253(a)(1)
Executive Order 13123
20 percent reduction (Btu/GSF) in Federal buildings by 2000 from 1985.
30 percent reduction (Btu/GSF) by 2005 from 1985. 35 percent reduction by 2010 from 1985.
Federal agencies reported a 23.6 percent decrease in energy consumption in buildings in FY 2000, compared to FY 1985.
Section II (B), page 59
Section 544, NECPA, 42 U.S.C., § 8254
DOE to establish life-cycle cost methods to determine cost-effectiveness of proposed energy efficiency projects.
The 2000 edition of the energy price indices and discount factors for life-cycle cost analysis was published and distributed to Federal energy managers.
Section I (D), page 42
Section 545, NECPA, 42 U.S.C., § 8255
Transmit to Congress the amount of appropriations requested in each agency budget for electric and energy costs incurred in operating and maintaining facilities and for compliance with applicable statutes and directives.
Approximately $121.1 million was appropriated and spent on energy efficiency projects in Federal facilities.
Section I (D), page 31
Section 546, NECPA, 42 U.S.C., § 8256(a)
Establishment of a program of incentives within Federal agencies to expedite Energy Savings Performance Contracts.
In FY 2000, 81 ESPC contracts and delivery orders were awarded under DOE Super ESPCs and other agency contracts.
Section I (D), page 36
Section 546, NECPA, 42 U.S.C., § 8256(b)
DOE to establish a Federal Energy Efficiency Fund to provide grants to agencies.
There were no appropriations for the Fund in FY 2000; FY 1995 funds were allocated and progress of the few remaining projects is being monitored.
Section I (D), page 35
Section 157, EPACT, 42 U.S.C., § 8262(c)
Federal agencies to establish and maintain programs to train energy managers and to increase the number of trained energy managers within each agency.
DOE’s FEMP conducted 59 training workshops and symposia for more than 5,353 attendees in the efficient use and conservation of energy, water, and renewable energy in Federal facilities.
Section I (D), page 21; Section VI, Agency Reports, page 81
8

Statute/Directive Requirement FY 2000 Findings Annual Report Discussion
Executive Order 13123 20 percent reduction for Federal industrial/laboratory facilities by 2005 from 1990. 25 percent reduction by 2010 from 1990.
Findings are specific to individual agencies.
Section III (B), page 65
Executive Order 13123 30 percent reduction in greenhouse gas emissions attributed to Federal facilities by 2010 from 1990.
Carbon emissions from energy used in non-exempt Federal facilities declined 18.4 percent in FY 2000 compared to FY 1990.
Section I(B), page 16
Executive Order 13123 Expand use of renewable energy by implementing renewable energy projects and by purchasing electricity from renewable sources. The Federal Government will strive to install 20,000 solar roofs by 2010.
Findings are specific to individual agencies.
Section I(G), page 49 Section VI, Agency Reports, page 81
Executive Order 13123 Minimize petroleum use within Federal facilities through use of non-petroleum energy sources and eliminating unnecessary fuel use.
The consumption of petroleum-based fuels in buildings during FY 2000 decreased 65.1 percent compared to FY 1985 and 6.7 percent from FY 1999.
Section II(A), page 51
Executive Order 13123 Reduce total energy use and greenhouse gas emissions, as measured at the source. Agencies shall undertake projects to reduce source energy, even if site energy use increases.
Primary energy consumed in buildings and facilities in FY 2000 decreased 9.1 percent from FY 1985 and 0.7 percent from FY 1999.
Measured in terms of source energy, Federal buildings show a reduction of 9.9 percent in Btu/GSF during FY 2000 compared to FY 1985.
Section II(A), page 52, 54, and 62
Executive Order 13123 Reduce water consumption and associated energy use.
Findings are specific to individual agencies.
Section I(F), page 48 Section VI, Agency Reports, page 75
9

B. Overall Federal Energy Consumption, Costs, and Carbon Emissions
As shown in Table 1-A, the total primary energy consumption of the Government of the United States, including energy consumed to produce, process, and transport energy, was 1.39 quadrillion British Thermal Units (quads) or 1,385,104.8 billion Btu during FY 2000. Primary energy consumption considers all resources used to generate and transport electricity and steam. (The source conversion factors of 10,346 Btu per kilowatt hour for electricity and 1,390 Btu per pound of steam are used to calculate primary energy consumption. See Appendix B for conversion factors used to calculate site-delivered energy consumption.) Federal agencies reported a 23.1 percent decrease in total primary energy consumption compared to FY 1985, and a 1.0 percent decrease from FY 1999. These reductions resulted from a combination of reduced Federal activity and successful energy management efforts. The 1.39 quads used in FY 2000 represent approximately 1.4 percent of the total 99.08 quads8 used in the United States, and reflect Government energy consumption in buildings and operations to provide essential services to its citizens, including the defense of the Nation. In total, the Federal Government is the single largest energy consumer in the Nation, although its pattern of consumption is widely dispersed.
Based on reports submitted to DOE by 29 Federal agencies, the Federal Government consumed 0.98 quads during FY 2000 when measured in terms of energy actually delivered to the point of use. As shown in Table 1-B, Federal agencies reported a 32.4 percent decrease in total site-delivered energy consumption compared to FY 1985, and a 3.2 percent decrease from FY 1999. The cost of this energy was $7.4 billion and represented approximately 0.4 percent of the total Federal expenditures of $1.789 trillion9 for all purposes in FY 2000. The Federal energy bill for FY 2000 fell 9.3 percent from the previous year, decreasing $756.3 million in constant dollars compared to FY 1999.10 Many variables in addition to Federal energy management activities contribute to changes in annual energy use and costs, including changes in square footage, building stock, weather, tempo of operations, fuel mix, fuel prices, and vehicle, naval, and aircraft fleet composition.
In FY 2000, the Department of Defense spent $5.0 billion for energy out of the total Federal energy expenditure of $7.4 billion. Overall, the Department of Defense used 38.1 percent less site-delivered energy in FY 2000 than in FY 1985—a reflection of reduced Defense-related activity and successful energy management efforts.
Figures 1 and 2 depict the percentage of total energy used by the Federal Government in FY 2000 and its cost. As illustrated, jet fuel and electricity account for approximately 60.9 percent of the total energy consumption represented in Figure 1 and approximately 74.2 percent of the total energy costs in Figure 2.
8DOE/EIA-0035(2001/7), Monthly Energy Review, July 2001.
9Analytical Perspectives, Budget of the United States Government, Fiscal Year 2002
10Appendix C indicates the annual cost of energy used in Federal buildings and facilities, vehicles and equipment, and energy intensive operations for FY 1985 through FY 2000. The combined cost per Btu for energy in each fiscal year is also shown in the table.
10

TABLE 1-ATOTAL PRIMARY ENERGY CONSUMPTION BY FEDERAL AGENCIES
(In Billions of Btu, with Conversions to Millions of Barrels of Oil Equivalent [MBOE], and Petajoules [Joule x 1015])
CIVILIAN FY FY FY FY FY FY FY FY FY FY FY FY %CHANGE %CHANGEAGENCY 1985 1990 1991 1992 1993 1994 1995 1996 1997 1998 1999 2000 85-00 99-00
USPS 47,439.3 54,767.8 56,017.0 57,697.8 61,629.9 63,646.5 65,828.1 67,412.9 71,636.0 71,861.1 72,898.5 80,175.8 69.0 10.0DOE 90,591.6 82,462.0 79,414.4 82,561.6 79,588.9 78,662.9 81,131.1 80,948.9 70,016.2 64,211.0 64,034.7 63,448.0 -30.0 -0.9VA 40,266.0 41,421.0 42,232.9 42,374.9 43,203.9 43,487.6 43,909.9 45,441.5 46,267.8 46,877.0 47,069.4 46,401.8 15.2 -1.4GSA 43,052.8 34,789.6 33,524.8 32,994.1 33,742.8 33,253.4 32,839.0 33,660.0 33,822.4 33,583.7 34,448.6 38,271.6 -11.1 11.1DOT 27,287.5 26,939.8 27,491.0 28,618.9 31,616.7 28,321.4 27,789.3 30,288.1 28,755.8 29,597.7 36,377.8 36,652.3 34.3 0.8DOJ 10,595.9 10,790.3 13,230.3 12,139.6 13,964.4 15,825.8 16,133.4 19,539.4 19,077.5 23,560.3 23,451.8 26,748.9 152.4 14.1NASA 21,581.2 25,979.3 26,865.0 27,120.9 26,857.8 27,461.4 26,648.8 24,638.8 26,049.2 25,322.1 24,682.8 23,487.1 8.8 -4.8HHS 9,692.6 12,112.2 11,073.7 11,995.7 12,806.5 13,016.8 11,110.8 11,722.2 13,699.4 13,680.5 13,233.0 14,197.2 46.5 7.3USDA 11,576.9 13,655.1 13,830.4 13,287.1 13,650.6 13,766.7 14,108.1 13,574.8 11,755.2 12,432.5 12,197.1 11,739.3 1.4 -3.8DOI 10,933.6 10,337.7 10,368.8 10,089.3 11,167.8 11,507.0 9,810.3 7,038.3 9,608.7 9,542.0 10,611.1 9,421.3 -13.8 -11.2TRSY 3,715.2 6,627.1 7,851.0 8,589.2 8,271.4 8,210.2 7,469.3 6,946.5 8,918.0 8,496.8 8,729.3 8,669.0 133.3 -0.7ST1 6,224.6 6,358.0 6,347.8 747.0 1,162.4 1,248.5 1,288.9 1,830.2 7,623.4 7,572.6 7,178.5 7,266.7 16.7 1.2TVA 2 7,432.2 6,894.8 6,845.0 6,367.7 5,866.3 6,685.6 6,737.9 6,464.1 6,282.8 6,074.4 6,737.4 7,091.5 -4.6 5.3DOL 3,688.0 3,842.5 3,923.8 3,944.2 4,050.7 4,119.3 3,992.2 4,094.5 4,123.2 4,168.6 3,337.1 4,001.9 8.5 19.9DOC 3,804.6 6,110.9 4,261.0 4,083.2 4,287.4 5,007.0 5,173.4 4,930.3 4,866.3 4,558.3 4,777.1 3,577.0 -6.0 -25.1EPA 1,621.0 1,483.3 1,635.6 1,662.7 1,845.1 1,922.8 2,108.8 2,070.5 2,113.8 2,108.0 2,341.7 1,910.4 17.9 -18.4HUD 315.2 384.2 407.0 378.7 346.0 324.0 310.6 326.8 318.0 303.2 310.2 287.0 -8.9 -7.5FCC 39.2 46.1 46.5 38.1 38.9 42.2 42.2 33.5 35.9 35.4 35.4 39.6 1.2 12.0PCC 1,118.1 1,318.9 1,274.6 1,378.7 1,382.4 1,393.9 1,598.5 1,591.0 1,540.5 0.0 0.0 0.0 -100.0 N/AOTHER* 898.6 3,847.7 2,890.6 2,963.4 3,406.8 4,137.8 6,310.7 8,573.8 9,320.9 8,915.7 8,719.0 8,510.9 847.1 -2.4
CIVILIAN AGENCIESTOTAL 341,874.1 350,168.3 349,531.2 349,032.6 358,886.6 362,041.0 364,341.1 371,126.1 375,831.1 372,900.9 381,170.2 391,897.6 14.6 2.8
DOD 1,459,945.7 1,497,346.8 1,519,110.8 1,352,815.6 1,292,793.5 1,213,755.8 1,153,527.4 1,122,862.5 1,092,230.0 1,045,560.2 1,018,045.4 993,207.2 -32.0 -2.4
ALL AGENCIES 1,801,819.8 1,847,515.1 1,868,642.0 1,701,848.2 1,651,680.2 1,575,796.8 1,517,868.5 1,493,988.5 1,468,061.0 1,418,461.1 1,399,215.6 1,385,104.8 -23.1 -1.0MBOE 309.3 317.2 320.8 292.2 283.6 270.5 260.6 256.5 252.0 243.5 240.2 237.8Petajoules 1,900.9 1,949.1 1,971.3 1,795.4 1,742.5 1,662.4 1,601.3 1,576.1 1,548.8 1,496.4 1,476.1 1,461.2
DATA AS OF 11/30/01 *Other includes, for certain years, CFTC, CIA, EEOC, FEMA, FTC, NARA, NSF, NRC, OPM, RRB, SSA, USIA/IBB, and FERC. 1In 1998, the State Department developed a statistical method for estimating the energy consumption in the large number of foreign buildings it owns and leases. This method was subsequently applied to estimate FY 1991 energy consumption and is now used annually to assess progress. The FY 1991 foreign building estimates were combined with domestic building data for the fiscal years 1985 and 1990, since these are base years for performance goals.2TVA’s increase in energy consumption beginning in FY 1994 is the result of first-time reporting of energy consumed at generation sites. Note: This table uses a conversion factor for electricity of 10,346 Btu per kilowatt hour and 1,390 Btu per pound of steam. Agencies are listed in descending order of consumption for the current year. Sum of components may not equal total due to independent rounding. Source: Federal Agency Annual Energy Management Data Reports
11

TABLE 1-BTOTAL SITE-DELIVERED ENERGY CONSUMPTION BY FEDERAL AGENCIES
(In Billions of Btu, with Conversions to Millions of Barrels of Oil Equivalent [MBOE], and Petajoules [Joule x 1015])
CIVILIAN FY FY FY FY FY FY FY FY FY FY FY FY %Change %Change AGENCY 1985 1990 1991 1992 1993 1994 1995 1996 1997 1998 1999 2000 85-00 99-00
USPS 27,762.5 30,616.2 30,817.0 31,674.2 33,725.1 34,950.8 36,220.9 36,427.1 40,760.0 39,487.3 39,774.0 42,295.1 52.3 6.3 DOE 52,211.6 43,465.5 42,178.6 44,300.2 43,688.5 42,279.2 47,089.7 44,424.9 33,926.3 31,450.1 30,363.9 29,483.8 -43.5 -2.9 VA 25,144.7 24,898.4 25,050.4 25,254.9 25,741.2 25,587.8 25,428.9 26,832.9 27,261.1 27,597.2 27,472.4 26,994.9 7.4 -1.7 DOT 19,568.1 18,965.2 18,971.4 17,027.3 19,360.1 19,772.6 18,652.3 19,564.1 19,125.8 18,509.9 20,508.1 20,380.1 4.1 -0.6 DOJ 8,176.0 6,961.6 8,018.3 7,544.3 9,081.7 10,263.6 10,193.3 12,127.7 11,999.9 15,805.1 15,366.2 17,718.5 116.7 15.3 GSA 19,256.1 15,656.6 13,985.0 13,842.0 14,149.4 13,963.0 13,671.8 14,499.2 14,364.3 14,095.0 14,359.9 17,667.9 -8.2 23.0 NASA 10,843.7 12,401.4 12,541.1 12,622.9 12,366.2 12,576.6 12,397.0 11,461.7 11,996.4 11,731.5 11,434.1 10,953.5 1.0 -4.2 USDA 8,358.7 9,519.6 9,599.6 9,100.6 9,332.9 9,412.9 9,728.8 9,056.9 7,370.7 7,917.0 7,828.6 7,446.7 -10.9 -4.9 HHS 5,953.5 6,968.7 6,222.5 6,794.0 7,215.5 7,519.0 6,129.7 6,628.9 7,852.7 7,400.8 7,131.2 7,443.7 25.0 4.4 DOI 7,816.3 7,391.9 7,094.8 6,992.4 7,482.1 7,892.2 6,378.4 4,326.6 6,612.2 6,427.3 7,456.0 5,970.1 -23.6 -19.9 TRSY 2,868.3 ST1 2,771.7 TVA 2 2,851.9
3,576.4 2,827.4 2,605.4
4,177.1 2,799.0 2,623.2
4,628.4 273.8
2,380.9
4,912.7 390.2
2,246.2
4,558.2 422.3
2,534.9
4,132.6 437.3
2,607.3
3,764.1 653.3
2,547.8
4,597.6 3,278.0 2,396.9
4,816.3 3,258.4 2,295.9
4,899.4 3,368.6 2,510.1
4,780.6 3,207.6 2,893.4
66.7 15.7 1.5
-2.4 -4.8 15.3
DOL 2,385.2 2,376.0 2,446.0 2,452.4 2,514.9 2,527.9 2,385.7 2,491.5 2,490.2 2,540.4 2,048.1 2,125.7 -10.9 3.8 DOC 2,489.1 4,476.3 2,722.2 2,460.1 2,338.4 2,858.3 2,882.8 2,883.1 2,721.4 2,470.3 2,684.3 1,757.3 -29.4 -34.5 EPA 904.5 747.0 822.4 839.7 994.8 1,041.3 1,120.5 1,100.0 1,149.3 1,120.4 1,290.8 982.5 8.6 -23.9 HUD 116.9 140.3 164.9 156.7 147.8 144.2 131.3 140.8 137.6 126.4 129.6 106.5 -8.9 -17.8 FCC 23.6 23.9 22.1 19.9 20.2 20.7 20.7 17.5 19.9 19.4 19.4 22.9 -2.9 18.2 PCC 724.2 873.1 808.1 923.5 914.9 921.0 1,108.0 1,080.8 1,021.9 0.0 0.0 0.0 -100.0 N/A OTHER* 408.2 2,175.0 1,382.0 1,460.4 1,604.1 1,981.0 2,979.7 3,716.2 3,998.7 3,870.0 3,846.5 3,710.7 809.0 -3.5
CIVILIAN AGENCIES TOTAL 200,635.1 196,665.8 192,445.6 190,748.5 198,226.8 201,227.6 203,696.8 203,745.2 203,080.8 200,938.6 202,491.5 205,941.7 2.6 1.7
DOD 1,250,613.8 1,241,655.8 1,269,291.5 1,103,990.1 1,048,772.9 977,040.4 926,022.9 904,150.2 880,007.7 837,115.8 810,663.0 774,546.8 -38.1 -4.5
ALL AGENCIES 1,451,248.9 1,438,321.7 1,461,737.1 1,294,738.6 1,246,999.8 1,178,268.0 1,129,719.7 1,107,895.4 1,083,088.5 1,038,054.4 1,013,154.5 980,488.5 -32.4 -3.2MBOE 249.1 246.9 250.9 222.3 214.1 202.3 193.9 190.2 185.9 178.2 173.9 168.3Petajoules 1,531.0 1,517.4 1,542.1 1,365.9 1,315.5 1,243.0 1,191.8 1,168.8 1,142.6 1,095.1 1,068.8 1,034.4
DATA AS OF 11/30/01 *Other includes, for certain years, CFTC, CIA, EEOC, FEMA, FTC, NARA, NSF, NRC, OPM, RRB, SSA, USIA/IBB, and FERC. 1In 1998, the State Department developed a statistical method for estimating the energy consumption in the large number of foreign buildings it owns and leases. This method was subsequently applied to estimate FY 1991 energy consumption and is now used annually to assess progress. The FY 1991 foreign building estimates were combined with domestic building data for the fiscal years 1985 and 1990, since these are base years for performance goals.2TVA’s increase in energy consumption beginning in FY 1994 is the result of first-time reporting of energy consumed at generation sites. Note: This table uses a conversion factor for electricity of 3,412 Btu per kilowatt hour and 1,000 Btu per pound of steam. Agencies are listed in descending order of consumption for the current year. Sum of components may not equal total due to independent rounding. Source: Federal Agency Annual Energy Management Data Reports
12

FIGURE 1Federal Energy Consumption, FY 2000
Total by Energy Type: 0.98 quads
FUEL OIL 4.2% OTHER
8.8%
DIST/DIESEL 12.5%
NATURAL GAS 13.6%
JET FUEL 41.1%
ELECTRICITY 19.8%
Standard Buildings: 0.33 quads
OTHER 5.8%
COAL 5.9%
FUEL OIL 9.7%
NATURAL GAS 33.9%
ELECTRICITY 44.7%
Exempt Facilities: 0.02 quads
NATURAL GAS 4.8%
OTHER 6.7%
FUEL OIL 13.7%
ELECTRICITY 74.8%
Total by Sector: 0.98 quads
6.8%
EXEMPT FACILITIES
2.1%
E.I. FACILITIES
VEHICLES 57.7%
STANDARD BUILDINGS
33.3%
Energy Intensive Facilities: 0.07 quads
OTHER 3.9%
COAL 5.3%
FUEL OIL 9.9%
NATURAL GAS 32.4%
ELECTRICITY 48.4%
Vehicles & Equipment: 0.57 quads
OTHER 1.6%
GASOLINE 5.6%
DIST/DIESEL 21.6%
JET FUEL 71.2%
Data as of 11/30/01
Source: Federal Agency Annual Energy Management Data Reports Note: Sum of components may not equal 100 percent due to independent rounding.
13

FIGURE 2Federal Energy Costs, FY 2000
Total by Energy Type: $7.37 Billion
OTHER 7.8%
FUEL OIL 2.7%
DIST/DIESEL 7.5%
NATURAL GAS 7.9%
JET FUEL 30.6%
ELECTRICITY 43.6%
Standard Buildings: $3.39 Billion
COAL 1.2%
FUEL OIL 4.6%
OTHER 5.8%
NATURAL GAS 14.5%
ELECTRICITY 74.0%
Exempt Facilities: $0.26 Billion
NATURAL GAS 2.0%
OTHER 5.0%
FUEL OIL 4.7%
ELECTRICITY 88.3%
Total by Sector: $7.37 Billion
EXEMPT FACILITIES
3.6%
E.I. FACILITIES 8.3%
VEHICLES 42.1%
STANDARD BUILDINGS
46.0%
Energy Intensive Facilities: $0.61 Billion
COAL 1.0%
OTHER 3.5%
FUEL OIL 4.7%
NATURAL GAS 13.7% ELECTRICITY
77.1%
Vehicles & Equipment: $3.10 Billion
OTHER 1.0%
AUTO GAS 8.5%
DIST/DIESEL 17.8% JET FUEL
72.7%
Data as of 11/30/00 Source: Federal Agency Annual Energy Management Data Reports Note: Sum of components may not equal 100 percent due to independent rounding.
14

Petroleum-based fuels used by the Federal Government are shown in Table 2. In FY 2000, petroleum-based fuels accounted for 0.61 quads (609,830.6 billion Btu) of the total 0.98 quads consumed by the Federal Government. Of that, approximately 0.56 quads (556,949.9 billion Btu) were used by the Department of Defense primarily for jet fuel and distillate/diesel for vehicles and equipment energy. Only 0.03 quads (33,996.2 billion Btu) of petroleum-based fuels were used for Federal buildings and facilities energy.
TABLE 2 FEDERAL PETROLEUM USAGE IN FY 2000
(in Thousands of Gallons, Billions of Btu, and Petajoules [Joule x 1015])
Unit Total BBTU* BBTU* BBTU* Petajoules* (KGal) DOD Civilian Total Total
Buildings & Facilities Fuel Oil 229,351.2 26,455.3 5,355.7 31,811.0 33.56 LPG/Propane 22,882.1 1,527.2 658.0 2,185.2 2.31
Energy Intensive Operations Fuel Oil LPG/Propane
Exempt Buildings Fuel Oil LPG/Propane
Vehicles & Equipment Motor GasDist-Diesel & Petrol.Aviation GasJet FuelNavy SpecialLPG/PropaneOther
Total
47,991.0 4,701.7 1,954.7 6,656.4 7.02 2,527.8 64.5 176.9 241.4 0.25
20,247.9 2,475.4 333.0 2,808.4 2.96 496.0 0.0 47.4 47.4 0.05
255,091.5 9,357.9 22,528.6 31,886.4 33.64 881,877.0 110,108.5 12,207.9 122,316.3 129.07
1,535.9 1.6 190.4 192.0 0.20 3,100,394.4 395,127.6 7,923.7 403,051.3 425.20
46,336.1 6,426.6 0.2 6,426.8 6.78 414.9 23.2 16.5 39.6 0.04
2,168.4 680.4 1,488.0 2,168.4 2.29
556,949.9 52,880.8 609,830.6 643.30
DATA AS OF 11/30/01 *Uses a conversion factor of:
95,500 Btu/gallon for LPG/propane 138,700 Btu/gallon for fuel oil, distillate-diesel & petroleum, and navy special 125,000 Btu/gallon for motor gasoline and aviation gasoline 130,000 Btu/gallon for jet fuel 947.9 Billion Btu/Petajoule
Note: FY 2000 contains estimated data for the following agencies: EEOC, NSF, OPM, IBB. Sum of components may not equal total due to independent rounding.
Source: Federal Agency Annual Energy Management Data Reports
15

Carbon emissions from Federal Government energy consumption have decreased significantly since FY 1990. As shown in Figure 3, the Federal Government has reduced carbon emissions across the three non-exempt end-use sectors by 29.7 percent from 32.8 million metric tons of carbon equivalent (MMTCE) in FY 1990 to 23.0 MMTCE in FY 2000.11 The largest contribution to this reduction is from the vehicles and equipment sector, which has seen a decrease in carbon emissions of 39.0 percent. This is a result of a reduction of almost 6.4 MMTCE emissions from jet fuel, as well as smaller reductions from diesel, aviation gasoline, navy special (a residual fuel oil), and LPG/propane.
Carbon emissions have decreased by 19.9 percent in the standard buildings sector since 1990. Contributing to this reduction was a 9.2 percent reduction in gross square footage since FY 1990 and an 8.3 percent decrease in primary energy intensity (224,244 Btu/GSF in FY 1990, 205,657 Btu/GSF in FY 2000). Carbon emissions from energy intensive activities in industrial, laboratory, and other buildings decreased 10.0 percent (0.2 million metric tons) since FY 1990.
FIGURE 3Carbon Emissions from Federal Energy Consumption, FY 1990 through FY 2000
(Million Metric Tons of Carbon Equivalent [MMTCE])
35
30
25
20
15
10
5
0 1990 1991 1992 1993 1994 1995 1996 1997 1998 1999 2000
2.3 2.6 2.9 2.2 2.1 2.2 2.2 2.2 2.0 1.9 2.1
12.5 11.7 11.8 11.7 11.0 10.6 10.3 10.1 10.1 10.1 10.0
18.0 18.8 15.1
14.9 13.9 13.2 12.8 12.7 12.1 11.8 11.0
Fiscal Year Energy Intensive Facilities Standard Buildings Vehicles & Equipment
Mill
ion
Met
ric T
ons
11Carbon emissions were calculated by multiplying energy consumption for each fuel type by an associated carbon coefficient shown in Appendix B.
16

Section 201 of Executive Order 13123 establishes a greenhouse gas reduction goal for Federal Government facilities. This goal applies to standard buildings subject to the energy efficiency goals of Section 202 and industrial, laboratory, and other energy-intensive facilities subject to the goals of Section 203. The requirement states:
“Through life-cycle cost-effective energy measures, each agency shall reduce its greenhouse gas emissions attributed to facility energy use by 30 percent by 2010 compared to such emissions levels in 1990. In order to encourage optimal investment in energy improvements, agencies can count greenhouse gas reductions from improvements in nonfacility energy use toward this goal to the extent that these reductions are approved by the Office of Management and Budget (OMB).”
As shown in Table 3, when the carbon emissions from non-exempt facilities are combined, the Government shows a reduction of 18.4 percent from 14.8 MMTCE in FY 1990 to 12.0 MMTCE in FY 2000.
Carbon emission calculations were adjusted in FY 2000 for eight agencies to reflect purchases of renewable energy. These agencies, and their corresponding credit for renewable energy purchases are shown below:
AgencyDepartment of DefenseU.S. Postal ServiceEnvironmental Protection AgencyDepartment of AgricultureGeneral Services AdministrationDepartment of the InteriorDepartment of EnergyTennessee Valley Authority
TOTAL
MTCE 54,230
581 244 148 122
56 39 24
55,444
17

TABLE 3CARBON EMISSIONS FROM FEDERAL AGENCY FACILITY ENERGY USE
(In Metric Tons of Carbon Equivalent [MTCE])
CIVILIAN FY FY FY FY FY FY FY FY FY FY FY %CHANGE %CHANGE AGENCY 1990 1991 1992 1993 1994 1995 1996 1997 1998 1999 2000 90-00 99-00
USPS 687,516 704,295 729,898 786,519 764,341 781,885 805,984 724,512 772,307 784,284 893,086 † 29.9 13.9 DOE 1,121,485 1,061,910 1,085,728 1,050,971 1,053,982 1,165,049 1,128,630 1,085,002 872,272 890,693 872,080 † -22.2 -2.1 VA 665,288 676,624 676,063 688,980 674,610 678,289 702,452 701,307 709,187 712,775 712,680 7.1 -0.01 GSA 576,465 547,107 538,150 548,957 510,255 500,452 523,980 522,925 531,401 547,685 587,494 † 1.9 7.3 DOJ 151,026 192,962 150,733 190,656 200,586 211,621 258,891 257,427 266,555 276,209 315,577 109.0 14.3 NASA 274,477 273,938 275,950 270,484 265,557 265,204 257,278 263,394 272,023 267,788 262,477 -4.4 -2.0 HHS 218,216 194,929 213,473 222,189 212,968 183,414 197,046 217,171 217,720 214,647 228,784 4.8 6.6 ST 123,002 123,473 14,909 20,906 21,674 22,485 32,063 138,798 143,034 137,521 138,912 12.9 1.0 USDA 140,752 137,793 131,456 138,104 130,495 129,733 133,786 127,553 135,547 128,569 128,611 † -8.6 0.03 DOI 124,663 127,882 113,716 138,001 128,478 119,447 96,585 109,071 112,139 112,460 123,058 † -1.3 9.4 DOT 105,548 97,026 121,017 121,993 111,813 121,939 120,961 124,863 116,034 119,772 117,097 10.9 -2.2 TRSY 78,782 91,364 98,735 88,342 87,311 82,611 81,572 105,194 94,436 97,038 101,072 28.3 4.2 TVA 96,751 95,029 89,714 81,503 96,625 96,462 91,542 90,356 88,239 98,827 98,101 † 1.4 -0.7 DOL 65,669 64,182 64,748 66,957 64,930 62,918 64,636 65,211 66,983 51,838 69,856 6.4 34.8 DOC 46,893 46,471 49,502 52,605 60,615 67,454 68,680 58,832 59,906 62,301 57,017 21.6 -8.5 EPA 25,722 28,371 28,882 30,197 29,870 32,525 32,132 31,698 32,765 35,925 30,008 † 16.7 -16.5 NARA 3,491 3,495 3,733 10,170 17,572 20,791 17,054 18,131 18,029 18,219 17,378 397.8 -4.6 USIA/IBB 32,969 22,302 21,848 21,202 19,846 20,894 22,378 26,267 24,571 22,420 22,429 -32.0 0.0 FEMA 7,623 7,245 7,358 6,698 6,107 6,107 6,106 6,107 6,368 6,609 6,571 -13.8 -0.6 HUD 6,347 6,072 5,629 5,229 4,677 4,415 4,768 4,540 4,544 4,680 4,680 -26.3 0.0 NRC 1,861 2,891 2,559 2,607 2,575 3,408 3,648 3,791 3,934 4,007 3,801 104.3 -5.1 OPM 3,221 3,377 3,461 3,727 3,491 3,491 3,490 3,491 3,654 4,357 3,206 -0.5 -26.4 FTC 997 986 976 960 903 903 903 903 943 968 1,246 25.0 28.8 RRB 1,368 1,438 1,582 1,532 1,493 1,460 1,420 1,448 1,276 1,203 1,136 -16.9 -5.6 FCC 586 619 483 501 521 521 426 426 441 442 426 -27.3 -3.6 Other* 20,089 11,012 10,614 10,902 10,089 37,245 72,535 75,500 63,802 65,069 65,672 226.9 0.9
Civilian Agencies Total 4,580,806 4,522,791 4,440,918 4,560,894 4,481,385 4,620,724 4,728,946 4,763,918 4,618,110 4,666,306 4,862,455 † 6.1 4.2
DOD 10,184,471 9,788,747 10,286,884 9,312,036 8,555,023 8,091,409 7,788,012 7,481,295 7,418,175 7,394,256 7,192,174 † -29.4 -2.7
Total 14,765,277 14,311,539 14,727,802 13,872,930 13,036,409 12,712,133 12,516,958 12,245,213 12,036,285 12,060,562 12,054,629 † -18.4 -0.05*Other includes, for certain years, CFTC, CIA, NSF, PCC, and SSA. DATA AS OF 11/30/01†Indicates where adjustments were made to reflect purchases of renewable energy.Note: Sum of components may not equal total due to independent rounding.Source: Calculated from energy consumption data from Federal Agency Annual Energy Management Data Reports, see Appendix B.
18

C. Energy Management Infrastructure and Tools
1. Federal Coordination
Federal Interagency Energy Policy Committee (656 Committee) The Federal Interagency Energy Policy Committee (656 Committee) was established in accordance with Section 656 of the Department of Energy Organization Act (P.L. 95-91) to strengthen Government programs that emphasize productivity through the efficient use of energy, and concurrently, to encourage interagency cooperation in energy conservation. At the Committee’s January 24, 2000 meeting, the following items were discussed:
• The U.S. Army’s initiative to utilize wind-generated electricity at Fort Bliss in Texas.
• Executive Order 13123 requirements pertaining to sustainable design principles to be applied by agencies when siting, designing, and constructing new facilities.
• The General Services Administration’s activities (required under Executive Order 13123) in developing model lease provisions for ensuring energy efficiency in space leased by the Federal Government.
• The Environmental Protection Agency’s efforts in green power purchasing, including the purchase of 100 percent green power for its laboratory in Richmond, California.
• The Green Energy Parks Initiative partnership between DOE and the Interior Department, which will present the 250 National Parks and wildlife reserves as models of efficiency and environmental preservation.
• FEMP’s efforts to develop a comprehensive interagency agreement that can be used to access any of FEMP’s services, including ESPC and utility financing support, energy audits, and design assistance.
Federal Interagency Energy Management Task Force The Federal Interagency Energy Management Task Force (Task Force) was established in accordance with the Federal Energy Management Improvement Act of 1988 to stimulate increased energy efficiency in the Federal sector. The Task Force serves as technical advisor to the 656 Committee by coordinating the activities of the Federal Government in promoting energy conservation and the efficient use of energy.
The Director of FEMP serves as the Executive Director of the Task Force. The Task Force, composed of the chief energy managers of the agencies represented on the 656 Committee, addresses energy issues affecting Federal facilities and operations and provides the 656 Committee with in-depth analysis and recommendations concerning current and pending legislation, technical issues, and implementation of coordinated Federal activities.
The Task Force assesses the progress of agencies toward achieving energy savings, and collects and disseminates information on effective survey techniques, technologies that promote
19

conservation and efficient use of energy, and innovative programs and contracting methods. To accomplish its mission, the Task Force establishes working groups to resolve specific technical or programmatic issues, to develop new initiatives for Federal implementation, and to address legislative requirements and topics presented by the 656 Committee, the Executive Director, or member agencies.
In FY 2000, meetings of the Task Force were held on November 10, 1999; January 12, 2000; May 10, 2000; and July 10, 2000. Issues highlighted in the these meetings included the following:
• The Federal Commercial Building Energy Standard (FEDCOM).
• A draft Combined Heat and Power Plan developed by FEMP.
• You Have the Power energy awareness campaign.
• Utility metering and billing issues and how they affect Federal agencies.
• Executive Order 13123, including numerous reports from Task Force working groups implementing provisions of the Order.
• Aggregation of agency electricity purchases and green power issues.
• Federal participation in DOE’s Wind Powering America program.
• Executive Orders 13148, 13149, and 13150.
• Guidance for completing annual reports, complying with Executive Order 13123, and water efficiency improvements at Federal facilities.
Senior Energy Officials Section 304 of Executive Order 13123, states that “Each agency shall designate a senior official, at the Assistant Secretary level or above, to be responsible for meeting the goals and requirements of this order, including preparing the annual report to the President. Designated officials shall participate in the Interagency Energy Policy Committee. . . [and] shall communicate its activities to all designated officials to assure proper coordination and achievement of the goals and requirements of this order.”
A meeting of the Senior Energy Officials was convened and chaired by OMB on October 13, 2000. Energy Manager Paul Allen, Walt Disney Company, talked about how Disney manages its energy consumption through internal metering, competitions among its hotels and parks, and distributing mock bills to their facilities. The Senior Vice President for Environmental Policy also spoke and showed a helpful video featuring energy saving tips. The Senior Officials were very interested in how the private sector manages its energy consumption.
20

2. Training
Many agencies have their own internal training and recognition programs. These are discussed individually in Section VI of this report. Overall, Federal agencies reported spending $2.5 million to train 9,220 Federal personnel in energy efficiency, renewable energy, and water conservation subjects, including energy efficient product procurement and alterative financing techniques for energy and water projects.
During FY 2000, FEMP conducted 59 training workshops and symposia for more than 5,353 attendees in the efficient use and conservation of energy, water, and renewable energy in Federal facilities.
FEMP supplemented its classroom workshops with “distance learning” training, via satellite. The Energy Management Teleworkshop, a 10-module survey of FEMP courses, attracted 2,836 viewers. It included modules for life-cycle costing; buying energy efficient products; water resource management; operations and maintenance management; financing; and, engineering.
Eight workshops on energy savings performance contracting were conducted in FY 2000 for 207 participants. In each workshop, facility managers, contract specialists, and building engineers were instructed on the statutory provisions for this innovative contracting/financial method, and how to identify suitable projects. ESPCs allow energy-efficient improvements to be installed by private contractors with no up-front capital costs.
FEMP’s Utility Project Financing/Utility Restructuring workshop was presented 6 times for 203 students.
The Designing Low Energy Buildings course was presented twice for 56 participants. The two-day course included analyses and case studies of building design using passive solar heating, natural ventilation and cooling, and day lighting, as well as glazing and overhangs.
The FEMP Lights course was conducted twice for a total of 36 participants. The objective was to provide guidance on energy-efficient lighting consistent with other facility lighting considerations, quality and cost, and whole building analysis. Topics included: basic lighting concepts; a comprehensive process for Federal relighting project development and implementation; and the use of professional lighting design services.
Two Facility Energy Decision Screening (FEDS) workshops were held during FY 2000 for 36 attendees. This is a training course for Federal facility managers on whole-site analysis of energy conservation, technical, and financial opportunities utilizing the FEDS project screening software and the project implementation software.
The Operations and Maintenance Management classroom course was presented once for 25 students.
FEMP, in conjunction with the National Institute of Standards and Technology, conducted 2 workshops on life-cycle costing and building retrofit simulation for 63 students.
21

The Implementing Renewable Energy Projects course was presented twice for 69 students.
FEMP continued to offer its Water Resource Management course with two workshops for 30 attendees in FY 2000. The course is designed to assist Federal site managers and agencies in meeting the water conservation requirements of Energy Policy Act of 1992 (EPACT) and Executive Order 12902.
During FY 2000, FEMP participated in the organization and presentation of 24 panel discussions on Federal energy efficiency, water conservation, and renewable energy topics at national energy management conferences around the country, attracting 1,916 attendees.
“Energy 2000,” the energy efficiency workshop and exposition sponsored by FEMP, Department of Defense, and General Services Administration was held August 21-23, 2000, in Pittsburgh, Pennsylvania. The conference provided participants with opportunities to explore such topics as strategies for energy projects, selling energy projects, and alternative financing. The conference also had panel discussions, an exhibit hall showcasing energy technologies, and chances for relationship building.
FEMP continued to offer its Training Course Locator System to assist Federal agencies in training energy managers and in meeting the requirements of the EPACT. The Locator System connects those seeking particular training courses with the sponsoring organizations for those courses. During FY 2000, FEMP implemented significant improvements to the Locator system. Locator was upgraded to a Web-based application which is readily available to through the Internet. During August and September 2000, more than 100 unique visitors to Locator viewed 1,647 pages from the Locator Web site.
3. Awards and Recognition
Federal Energy and Water Management Awards Outstanding accomplishments in energy efficiency and water conservation in the Federal sector were recognized with the presentation of the 2000 Federal Energy and Water Management Awards on October 12, 2000, in Washington, D.C. The Awards Program is sponsored by the 656 Committee and the Department of Energy. Awards were selected from outstanding Federal energy managers and contributors who:
# Implemented proven energy efficiency, energy and water conservation techniques; # Developed and implemented energy-related training programs and employee energy
awareness programs; # Succeeded in receiving utility incentives, or awarding ESPC and other Federal-approved
performance-based energy and water contracts; # Made successful efforts to fulfill compliance with energy and water reduction mandates; # Improved energy efficiency or reduction in energy costs for Federal mobile equipment
including aircrafts, ships, and vehicles; # Improved tracking of energy consumption, costs and energy efficient investments;
22
# Provided leadership in purchasing or supplying energy-efficient, renewable energy or water-conserving products to one or more Federal agencies; and
# Demonstrated cost-beneficial landscape practices which utilize techniques that seek to minimize the adverse effects of landscaping.
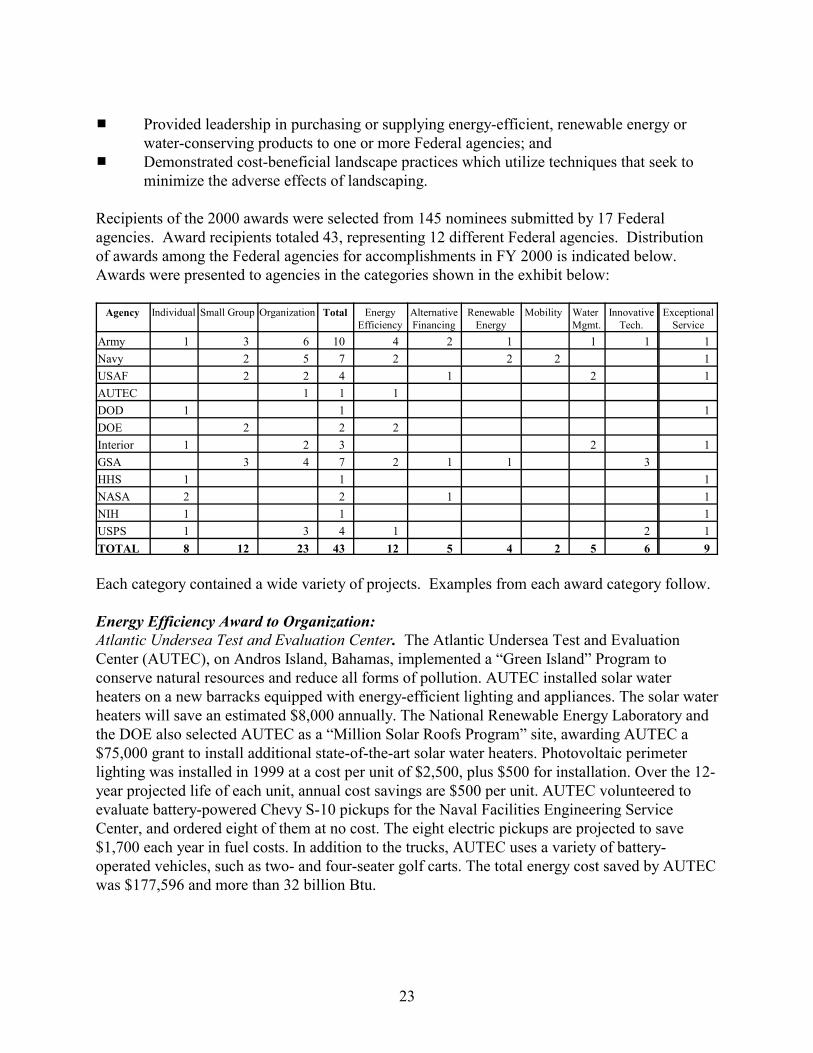
Recipients of the 2000 awards were selected from 145 nominees submitted by 17 Federal agencies. Award recipients totaled 43, representing 12 different Federal agencies. Distribution of awards among the Federal agencies for accomplishments in FY 2000 is indicated below. Awards were presented to agencies in the categories shown in the exhibit below:
Agency Individual Small Group Organization Total Energy Efficiency
Alternative Financing
Renewable Energy
Mobility Water Mgmt.
Innovative Tech.
Exceptional Service
Army 1 3 6 10 4 2 1 1 1 1 Navy 2 5 7 2 2 2 1 USAF 2 2 4 1 2 1 AUTEC 1 1 1 DOD 1 1 1 DOE 2 2 2 Interior 1 2 3 2 1 GSA 3 4 7 2 1 1 3 HHS 1 1 1 NASA 2 2 1 1 NIH 1 1 1 USPS 1 3 4 1 2 1 TOTAL 8 12 23 43 12 5 4 2 5 6 9
Each category contained a wide variety of projects. Examples from each award category follow.
Energy Efficiency Award to Organization: Atlantic Undersea Test and Evaluation Center. The Atlantic Undersea Test and Evaluation Center (AUTEC), on Andros Island, Bahamas, implemented a “Green Island” Program to conserve natural resources and reduce all forms of pollution. AUTEC installed solar water heaters on a new barracks equipped with energy-efficient lighting and appliances. The solar water heaters will save an estimated $8,000 annually. The National Renewable Energy Laboratory and the DOE also selected AUTEC as a “Million Solar Roofs Program” site, awarding AUTEC a $75,000 grant to install additional state-of-the-art solar water heaters. Photovoltaic perimeter lighting was installed in 1999 at a cost per unit of $2,500, plus $500 for installation. Over the 12-year projected life of each unit, annual cost savings are $500 per unit. AUTEC volunteered to evaluate battery-powered Chevy S-10 pickups for the Naval Facilities Engineering Service Center, and ordered eight of them at no cost. The eight electric pickups are projected to save $1,700 each year in fuel costs. In addition to the trucks, AUTEC uses a variety of battery-operated vehicles, such as two- and four-seater golf carts. The total energy cost saved by AUTEC was $177,596 and more than 32 billion Btu.
23

Energy Efficiency Award to Small Group: Environmental Technology Building and Energy and Environmental Sciences Building Recommissioning Project, Pacific Northwest National Laboratory. The Environmental Technology Building (ETB) and Energy and Environmental Sciences Building (EESB) Recommissioning Project led to significantly improved occupant comfort and reduced energy costs in the ETB and the EESB Buildings on the Pacific Northwest National Laboratory (PNNL) campus. Before the recommissioning, occupants complained of poor heating, cooling, and drafts. Also, energy use was high with ETB, which used 40 percent more energy in 1998 than in 1995. PNNL’s team carefully designed and implemented a 3-week controlled test of the buildings’ energy performance. This required returning the buildings’ energy management control systems to their original, “as-designed” operating strategy and set points. After adjustments were made to erroneous settings, the improvements in occupant comfort and building energy performance were significant and immediate. The cost savings in electricity was an estimated $95,000 and 11 billion Btu.
Alternative Financing Award: Dennis M. Klekar, Johnson Space Center, National Aeronautics and Space Administration. Mr. Klekar was the initiator and champion of the energy savings performance contract awarded at NASA Johnson Space Center. He has worked tenaciously since 1994 to implement an energy savings contract at the Center and saw the project through its evolution from an attempted shared energy savings contract, a combined Base Operations Support Services/ESPC contract and finally through to a Regional Super ESPC delivery order. The delivery order, valued at approximately $43 million over its 23-year term, was issued to Honeywell, Inc., through DOE’s Central Regional Super ESPC. It includes installing energy-efficient lighting and compressed air systems, variable speed pumping systems, cooling tower control systems, reducing water consumption and improving HVAC controls at the Johnson Space Center, the Sonny Carter Training Facility, and Ellington Field. Additionally, an advanced energy management system will be installed that will further enhance NASA’s ability to cost-effectively monitor and manage the site environment, and improve comfort for NASA personnel. The savings reaped from this project will pay for the cost of the system replacement, about $20 million, with no cost to the taxpayer. Once the project is completed in May 2000, Johnson Space Center is guaranteed to save more than $1.7 million in energy and water costs and $340,000 in maintenance savings per year.
Renewable Energy Award: GSA New England Region, General Services Administration. The GSA New England Region has implemented a project that has proven to be a significant step forward in the goal to make renewable power sources a part of every day building operations. GSA partnered with FEMP to install one of the nation’s largest solar arrays at the John F. Williams Federal Building in downtown Boston. This project has also substantially contributed to the President’s Million Solar Roof Initiative. Phase I included the building integrated photovoltaics system, with approximately 4,000 square feet of roof surface covered by solar panels. The system will result in an annual estimated energy savings of 28 megawatt-hours. Phase II will include the replacement of two 100-ton chillers with chillers that use non-chlorofluorocarbon-based refrigerants; the retrofit of fans, motors, and lighting; the substitution of high-priced district steam for “in-house”
24

gas-fired boilers; and the installation of two 75 kilowatt cogeneration units to decrease the facility’s utility bills.
Mobility Energy Management Award: Fleet Logistics Support Squadron Fifty-Eight, Department of the Navy. Comprehensive energy savings measures have been undertaken in Support Squadron Fifty-Eight (VR-58). Through innovative ideas solicited from the entire chain of command, efficient operational planning, and the command’s commitment to energy conservation, the Squadron achieved a 15 percent savings in aircraft fuel consumption. This reduction represents more than $1 million in annual cost savings, compared to the FY 1995 baseline. This achievement also surpasses the Chief of Naval Operations goal of 5 percent reduction by FY 2000. Administrative vehicle use was reduced 25 percent by consolidating runs, resulting in reduced fuel consumption. In addition, 30 percent of all Squadron spaces have been fitted with motion sensors and 10 percent of passageways are now using energy-efficient lighting fixtures. Through these efforts, VR-58 achieved a total energy cost savings of more than $1 million.
Water Management Award: Mora National Fish Hatchery & Technology Center, United States Department of the Interior. The Mora National Fish Hatchery and Technology Center has incorporated extensive water reuse facilities and sophisticated water recycling systems into its hatchery design. Water savings due to innovative, state-of-the-art water reuse systems will be approximately 2.2 billion gallons per year, based on a remarkable water reuse rate of 95 percent. Cost savings for the water reuse system are estimated at $9.3 million annually, after operations and maintenance costs. Engineering design of the final phase is currently 70 percent complete and will include a visitor center with displays that will describe the various water conservation systems in the hatchery building. These displays will help to educate the public about both the environmental and financial benefits of water efficiency measures. The Mora National Fish Hatchery and Technology Center’s efforts to make water conservation a priority in its operation and maintenance will enhance the Department of the Interior’s reputation as a Government leader in innovative water conservation technologies.
Exceptional Service Award: Frank Kutlak, Department of Health and Human Services, National Institutes of Health. Mr. Kutlak is managing a $93 million budget to design and construct a state-of-the-art laboratory facility, known as Building 50, on the National Institutes of Health Bethesda Campus in Bethesda, Maryland. Building 50’s design employs the latest energy saving technologies and will consume roughly 40 percent less energy than a comparable, standard design laboratory. For project construction, Mr. Kutlak reviewed bids based on contractors that were of the “best value” to the Government, not necessarily the “lowest cost.” Even through this strategy, the standard appropriated budget had hardly been used and therefore, enough funding remained to build an additional floor to the laboratory. The project also received a $2 million utility rebate to the Government. To keep others up-to-date on the project developments, Mr. Kutlak developed a Web site on the design and construction of Building 50 and established a list serve to provide E-mail updates on the construction. Mr. Kutlak’s devotion to this project, from formulating the design team to obtaining management approval, to the creation of an energy-efficient and
25

environmentally-sound building has resulted in the recognition of Building 50 as a state-of-the-art energy-efficient laboratory.
Innovative Technology Award:Rodeo Post Office, United States Postal Service/Lawrence Berkeley National Laboratory. Usinga new integrated lighting technology developed by the Lawrence Berkeley National Laboratory,the Rodeo Post Office has achieved more than 50 percent savings in energy for lighting, whilegreatly improving the lighting quality in letter sorting areas. This new unified system approachintegrated a unique high efficiency task light, a low glare ambient lighting system, and lightingcontrols. Surveys of the letter carriers showed an increased level of satisfaction with the newlighting, demonstrating the value of coupling lighting quality with energy efficiency. In FY 1999,the installation of this integrated system resulted in a 71 percent reduction in the total load, a totalenergy cost savings of $3,500, and a Btu savings of 34,000 kilowatt-hours.
Presidential Awards for Federal Energy Management Success On October 20, 2000, the White House honored four Federal agency energy management teams and more than 30 Federal employee participants of these teams for their support, leadership, and efforts in promoting and improving Federal energy management, and thereby saving millions of dollars in energy costs.
The Presidential Awards for Federal Energy Management Success were presented for the first time as required by Executive Order 13123, Greening the Government through Efficient Energy Management. Winners included representatives from the Environmental Protection Agency, the Department of State – Office of Foreign Building Operations, the Department of the Interior’s National Park Service, along with the Department of Energy and the U.S. Army Energy Team. Award recipients were recommended to the President by the Office of Management and Budget and FEMP.
Award winners were as follows:
Implementation: Environmental Protection Agency, Architecture, Engineering, and Real Estate Branch
Institutionalization: Department of State, Office of Foreign Buildings Operations Outreach: Department of the Interior/Department of Energy, Green Parks Initiative Results: U.S. Army, Energy Team
4. Federal Energy Saver Showcase Facilities
To promote wise energy and water use throughout the Federal government, agencies are showcasing cost-effective energy efficiency, water-conserving, and renewable energy technologies in their facilities.
To highlight these successful energy efficiency projects, Executive Order 13123 requires that agencies designate “exemplary new and existing facilities with significant public access and exposure as showcase facilities to highlight energy or water efficiency and renewable energy improvements.” The showcase program functions as a management strategy by assisting agencies
26

in implementing the goals of EO 13123. When facilities are designated as showcases, agencies can receive assistance from the Federal Energy Management Program and have the advantage of partnering with other agencies, energy services companies, utilities, and national laboratories.
Since 1995, FEMP has recognized more than 80 sites across the country as Federal Energy Saver Showcases. Each showcase site prominently displays a plaque notifying visitors that the Government building they are entering uses energy and water, as well as taxpayer dollars, wisely. A call for nominations has been distributed to urge agencies to identify and designate their best projects, or potential projects, so that others may benefit by example.
5. Energy Awareness
The Federal Government, as the largest single employer in the United States, has the responsibility to set an example for the nation by conducting energy awareness programs. Most agencies have ridesharing, carpooling, and/or public transportation programs in effect. Many agencies also participate in recycling programs. The following exhibit shows the employee awareness activities at the various Federal agencies.
Agency Award
Programs Recycling Ridesharing Transit
Subsidies Information
Dissemination
USDA T T T T DOC T T T DOD T T T T T DOE T T T T T HHS T T T T T HUD T T T T DOI T T T T T DOJ T T T T T DOL T T T T T ST T T
DOT T T T T T TRSY T T T T
VA T EPA T T T T T GSA T T T
NASA T T T T T NARA T NRC T T T T RRB T T SSA T T T T T TVA T T T USPS T T T T
27

6. Public Education Programs
NECPA, 42 U.S.C. § 8258(b), requires the Secretary of Energy to include in this and subsequent annual reports information on public education programs carried out by Federal agencies and previously reported under the authority of section 381 of the Energy Policy and Conservation Act (EPCA), 42 U.S.C. § 6361(b). EPCA requires the Secretary of Energy to establish and carry out public education programs to encourage energy conservation and energy efficiency and to promote vanpooling and carpooling arrangements. The Department of Transportation (DOT) has promoted ride sharing activities, while DOE has been responsible for other energy conservation education programs.
Through its Federal Highway Administration, DOT obligates Federal aid funds to assist State and local agencies in implementing programs designed to encourage the use of car pools, van pools, and buses by commuters. DOT efforts have included van pool acquisition programs, fringe and corridor parking facilities, ride-matching projects, preferential treatments for high occupancy vehicles, and transit service improvement. Since 1974, more than $875 million in Federal aid highway funds have been spent on such projects in an effort to establish self-sufficient programs across the Nation.
The Department of Transportation’s Technology Sharing Program (TSP) makes high quality reports in a user-friendly format available to the non-scientist or technical person to understand and act on transportation problems of state and local governments. This low-cost program disseminates technical reports on a variety of topics to this user community, thus saving them the time and cost of researching the information on an individual basis, or not having the information at all. The TSP products consist of reports, manuals, and summary documents which can be ordered at the following Internet site: http://www.tsp.dot.gov. Subjects include commuter issues and travel demand, traffic congestion, land-use development, and risk assessment.
DOE’s public education programs encompass a wide variety of services, objectives, and audiences, covering all major areas of conservation and renewable energy. DOE has organized its technology transfer programs to meet the specific information requirements of various audiences.
Three services are managed through subcontracts at the National Renewable Energy Laboratory (NREL): DOE’s Energy Efficiency and Renewable Energy Clearinghouse (EREC), DOE’s Energy Efficiency and Renewable Energy Network (EREN), and the FEMP Help Desk.
EREC provides basic, technical, and financial information on various energy efficiency and renewable energy technologies and programs. The audience served by EREC includes the general public, business and industry, educational community, media, utility companies, and state and local governments. Information is provided in the form of fact sheets, DOE and National Laboratory books and brochures, bibliographies, and on-line computer-generated technology synopses. Some requests are handled completely over the phone and the caller receives no publications. EREC’s telephone number is 800-DOE-EREC (800-363-3732) and its Web site is at www.eren.doe.gov/consumerinfo. In FY 2000, EREC staff responded to 49,738 inquiries and disseminated 241,196 publications.
28

EREN is the official Web site of the U.S. Department of Energy’s Office of Energy Efficiency and Renewable Energy (EERE). The audience served by EREN includes business and industry, the general public, the educational community, the media, and state and local governments. EREN’s Web address is www.eren.doe.gov. The site is a comprehensive resource for energy information, providing links to more than 600 energy-related Web sites, allowing keyword searches, and offering a full range of information on topics such as building energy efficiency, wind power, and alternative fuels. In addition, EERE provides its organizational chart, major initiatives, and budget. The site also features current press releases, consumer information, and lists of discussion groups on various energy-related topics. There are even forms to submit energy-related questions and to subscribe to the EREN Network News e-mail newsletter.
The FEMP Help Desk provides Federal energy managers with specialized information on effective energy management practices, technical assistance on implementing Federal sector energy projects, financing information, energy modeling software, publications, and energy management training programs. The Help Desk responds to requests for information via a toll-free telephone service, electronic mail, and through the Internet. The Help Desk was merged into EREC in FY 1997. The telephone number is 800-DOE-3732. The Web site is www.eren.doe.gov/femp.
The National Energy Information Center (NEIC) responds to public and private sector questions on energy production, consumption, prices, resource availability, and projections of supply and demand. It also makes available the publications produced by the DOE Energy Information Administration. NEIC provides information to Federal employees and the public at www.eia.doe.gov. Electronic inquiries may be sent to [email protected]. In FY 2000, NEIC staff responded to 29,000 inquiries and distributed approximately 28,900 publications.
The Office of Scientific and Technical Information (OSTI), as part of the Office of Science, provides coordination and direction for the management of scientific and technical information resulting from the DOE’s multi-billion dollar research and development activities. As a cross-cutting Headquarters office, OSTI accomplishes its mission through the Scientific and Technical Information Program (STIP). STIP operates in partnership with program offices, operations offices, and contractors to develop and implement information management “best business practices” to ensure that DOE maximizes the return on its $6 billion annual R&D investment.
OSTI collects, processes, and disseminates DOE-originated research information and selected worldwide research literature on subjects of interest. OSTI also provides scientific and technical information services to, or on behalf of, DOE elements in support of DOE mandates, missions, and objectives. OSTI serves the public directly or indirectly through agreements with the National Technical Information Service, Government Printing Office, depository libraries, and commercial vendors. EnergyFiles is a publicly available, web-based gateway to an array of energy information. Included among the EnergyFiles family is the DOE Information Bridge, an electronic full-text collection of 81,320 documents available to the DOE research community.
OSTI manages a comprehensive collection of approximately one million scientific and technical information documents, representing 50 years of energy-related activities. The organization also maintains the Energy Science and Technology Database (EDB), which has more than 3.5 million
29

summaries of DOE and worldwide information. EDB is made available to the public on-line and on CD-ROM through commercial vendors. The majority of its users are industry, Federal and State officials, contractors, libraries, research institutions, and the public. In FY 2000, OSTI added 112,999 research summaries to the database and provided 11,582 full-text documents for public availability to the National Technical Information Service and the Government Printing Office Depository Library Program.
FY 2000 initiatives included a strategic effort to process and disseminate information in an increasingly decentralized environment. As a continuing step towards a “National Library of Energy Science and Technology,” the effort will significantly improve DOE and public access to bibliographic and full-text information without major additional investment. In addition to the core program activities, OSTI’s other services include developing Internet-based applications for DOE offices, providing information management advice and consultation to the Departmental community, managing and disseminating DOE and Nuclear Regulatory Commission scientific and technical software, and representing the United States in multilateral and bilateral international information exchange agreements.
The DOE public information mechanisms include several direct service programs designed to provide technical assistance to specific target groups. Some of these include:
# The State Energy Program, a formula grant program, which provides a flexible, supportive framework to enable the States to address their own energy priorities, as well as focus on national initiatives and strengthens their capabilities to deliver energy services. This customer-driven program seeks to increase the extent to which Federal, State, and local governments work with other public and private sector entities to achieve widespread adoption of available energy efficiency and renewable energy technologies, and to demonstrate the use of emerging technologies which benefit the entire economy.
# The Special Projects component of the State Energy Program offers States the opportunity to apply for competitively selected grants covering a wide range of activities that may expand upon a State’s formula grant activities or offer an opportunity to take new initiatives. These projects are designed to utilize the State’s skills in forming and sustaining partnerships with local governments, industry, utilities, and private organizations. Many of these projects involve the dissemination of information about, and/or the demonstration of the viability of a variety of energy efficiency and renewable energy applications.
# The Industrial Assessment Center (IAC) Program provides no-cost energy, waste, and productivity assessments to help small and mid-sized manufacturers identify measures to maximize energy-efficiency, reduce waste, and improve productivity. The assessments are conducted by local teams of engineering faculty and students from 30 participating universities across the country. This program not only improves manufacturing efficiency, but at the same time provides valuable, hands-on technical training and experience for engineering students throughout the U.S. Additional information can be obtained by visiting the program Web site at www.oit.doe.gov.
30

D. Financing Mechanisms for Energy Efficiency Improvements in Federal Facilities
During FY 2000, Federal agencies had three primary options for financing energy efficiency, water conservation, and renewable energy projects in buildings and facilities: direct appropriated funding, ESPCs, and utility energy service contracts (UESCs). The latter two options utilize non-Government sources of funding and can be used to supplement Government funding. Each of these three sources can be combined with another. Formerly, the DOE’s Federal Energy Efficiency Fund grant program was a fourth option available to agencies for funding projects; however, there were no appropriations for the Fund in FY 2000.
To the extent that agencies have been able to provide complete reporting, funding from the three sources totaled approximately $599 million in FY 2000. While these three categories of funding are not entirely comparable, they do indicate that ESPCs and UESCs have become the dominant source of support for efficiency investments throughout the Federal Government. Energy efficiency investment from ESPCs and UESCs increased 17.4 percent from $395.3 million in FY 1999 to $478.5 million in FY 2000. In FY 1998, investment from these sources totaled only $142.6 million.
Since 1985, The Government has invested approximately $3.8 billion in energy efficiency, $2.5 billion of which was direct appropriations and $1.3 billion from alternative financing mechanisms ($0.8 billion from ESPCs and $0.5 billion from UESCs).
1. Direct Appropriations
The National Energy Conservation Policy Act requires each agency, in support of the President’s annual budget request to Congress, to specifically set forth and identify funds requested for energy conservation measures. Table 4-A presents agency funding (in nominal dollars) reported from FY 1985 through FY 2000 for energy conservation retrofits and capital equipment. Table 4-B presents the same information in constant 2000 dollars. In constant dollars, funding for energy conservation declined from $375.3 million in FY 1985 to a low of $67.0 million in FY 1989. Reports from Federal agencies indicated that $121.1 million was spent on retrofit expenditures in FY 2000, compared with $209.4 million in FY 1999. In some cases, the data provided by the agencies include funding from operation and maintenance accounts that was specifically identified as contributing to energy efficiency. Figure 4 illustrates agency spending trends for the five largest energy-consuming agencies and the remaining group of Federal agencies.
The Defense Department funded $44.4 million in expenditures for energy efficiency projects in FY 2000, $48.7 million less than the previous year.
31

Table 4-AAgency Direct Appropriations for Energy Conservation Retrofits and Capital Equipment,
FY 1985 through FY 2000 (Thousands of Nominal Dollars)
1985 1986 1987 1988 1989 1990 1991 1992 1993 1994 1995 1996 1997 1998 1999 2000
DOC 0 0 0 0 0 0 0 872 0 51 0 0 NA 330 N/A 257 DOD 136,100 120,000 5,550 5,280 1,500 1,020 10,000 49,669 14,444 109,000 189,600 112,487 118,970 191,446 91,243 44,442 DOE 14,800 14,500 16,500 18,900 19,400 19,500 20,400 20,650 20,950 24,850 30,200 0 0 0 0 0 DOI 3,198 5,535 0 0 4,338 0 1,272 9,800 4,859 1,662 779 891 0 160 1,730 23,999 DOJ 0 0 0 195 484 6,100 26,400 0 N/A 1,284 994 1,559 2,091 1,500 1,615 1,170 DOL 238 31 106 142 584 17 35 16 0 0 N/A 366 0 0 40 0 DOT 13,650 15,000 12,104 12,700 2,908 0 460 143 593 5,970 3,793 2,585 3,176 3,000 9,005 2,664 EPA 0 0 0 0 0 0 0 0 500 0 1,720 1,600 1,600 0 0 0 GSA 6,700 6,100 2,900 9,400 4,868 11,125 30,123 37,000 30,000 37,000 7,242 7,400 20,000 0 25,000 17,000 HHS 0 0 0 427 427 427 427 0 1,813 1,915 1,271 2,676 2,879 2,200 4,793 8,440 HUD 0 0 0 0 0 0 0 0 43 30 43 0 2,418 0 0 0 NASA 11,800 12,100 1,700 1,400 4,499 2,943 7,556 7,086 25,072 24,658 20,666 30,266 15,919 13,813 18,509 11,731 PCC 1,274 73 1,174 600 378 361 807 249 500 608 14 23 3 104 N/A N/A RRB 0 0 0 0 0 0 0 0 16 13 33 0 38 23 0 0 SSA 0 0 0 0 0 0 0 0 0 0 0 0 0 0 0 1,000 STATE 0 0 0 0 0 0 0 0 0 67 0 0 1,902 51 1,238 0 TRSY 0 0 2,977 2,393 2,823 1,134 836 0 1,344 4,826 2,810 170 2,990 1,400 1,495 2,152 TVA 0 0 0 0 0 0 0 0 475 844 4,277 522 1,158 1,466 1,022 284 USDA 2,500 0 0 500 500 1,547 1,752 7,300 7,045 7,277 2,894 5,983 3,891 1,765 994 1,954 USPS 55,300 9,300 5,100 3,800 4,000 4,000 4,000 2,293 1,116 1,123 10,050 9,000 16,000 31,000 38,000 6,000 VA 13,000 11,500 9,500 9,860 5,500 11,200 9,970 10,000 12,100 9,050 11,960 3,700 7,400 13,000 10,500 0
Total 258,560 194,139 57,611 65,597 52,209 59,374 114,038 145,078 120,870 230,228 288,346 179,228 200,435 261,258 205,184 121,093
Notes: Bold indicates top five energy users in buildings and facilities (DOD, DOE, VA, USPS, GSA). In past years, DOE also included funds for energy surveys. Does not include energy savings performance contracts and utility demand side management incentives.
Source: Federal Agency Annual Energy Management Data Reports
32

Table 4-BAgency Direct Appropriations for Energy Conservation Retrofits and Capital Equipment,
FY 1985 through FY 2000 (Thousands of Constant 2000 Dollars)
1985 1986 1987 1988 1989 1990 1991 1992 1993 1994 1995 1996 1997 1998 1999 2000
DOC 0 0 0 0 0 0 0 1,015 0 57 0 0 0 342 0 257 DOD 197,533 170,455 7,645 7,040 1,926 1,261 11,919 57,822 16,414 121,381 206,536 120,307 124,706 198,390 93,105 44,442 DOE 21,480 20,597 22,727 25,200 24,904 24,104 24,315 24,040 23,807 27,673 32,898 0 0 0 0 0 DOI 4,642 7,862 0 0 5,569 0 1,516 11,409 5,522 1,851 849 953 0 166 1,765 23,999 DOJ 0 0 0 260 621 7,540 31,466 0 0 1,430 1,083 1,667 2,192 1,554 1,648 1,170 DOL 345 44 146 189 750 21 42 19 0 0 0 391 0 0 41 0 DOT 19,811 21,307 16,672 16,933 3,733 0 548 166 673 6,648 4,132 2,765 3,329 3,109 9,189 2,664 EPA 0 0 0 0 0 0 0 0 568 0 1,874 1,711 1,677 0 0 0 GSA 9,724 8,665 3,994 12,533 6,249 13,752 35,903 43,073 34,091 41,203 7,889 7,914 20,964 0 25,510 17,000 HHS 0 0 0 569 548 528 509 0 2,060 2,133 1,385 2,862 3,018 2,280 4,891 8,440 HUD 0 0 0 0 0 0 0 0 49 33 47 0 2,535 0 0 0 NASA 17,126 17,188 2,342 1,867 5,775 3,638 9,006 8,249 28,491 27,459 22,512 32,370 16,687 14,314 18,887 11,731 PCC 1,849 104 1,617 800 485 446 962 290 568 677 15 25 3 108 0 0 RRB 0 0 0 0 0 0 0 0 19 14 36 0 40 24 0 0 SSA 0 0 0 0 0 0 0 0 0 0 0 0 0 0 0 1,000 STATE 0 0 0 0 0 0 0 0 0 75 0 0 1,994 53 1,263 0 TRSY 0 0 4,101 3,191 3,624 1,402 996 0 1,527 5,374 3,061 182 3,134 1,451 1,526 2,152 TVA 0 0 0 0 0 0 0 0 540 940 4,659 558 1,214 1,519 1,043 284 USDA 3,628 0 0 667 642 1,912 2,088 8,498 8,006 8,104 3,153 6,399 4,079 1,829 1,014 1,954 USPS 80,261 13,210 7,025 5,067 5,135 4,944 4,768 2,669 1,269 1,251 10,948 9,626 16,771 32,124 38,776 6,000 VA 18,868 16,335 13,085 13,147 7,060 13,844 11,883 11,641 13,750 10,078 13,028 3,957 7,757 13,472 10,714 0
Total 375,269 275,766 79,354 87,463 67,021 73,392 135,921 168,892 137,353 256,379 314,102 191,688 210,099 270,733 209,371 121,093
Notes: Bold indicates top five energy users in buildings and facilities (DOD, DOE, VA, USPS, GSA). In past years, DOE also included funds for energy surveys. Does not include energy savings performance contracts and utility demand side management incentives.
Source: Federal Agency Annual Energy Management Data Reports
33

FIGURE 4Direct Appropriations for Energy Conservation Retrofit
(In Constant 2000 Dollars)
400,000
350,000
300,000
250,000
200,000
150,000
100,000
50,000
0 1985 1986 1987 1988 1989 1990 1991 1992 1993 1994 1995 1996 1997 1998 1999 2000
Fiscal Year DOD DOE GSA USPS VA Other
Source: Federal Agency Annual Energy Management Data Reports
Thou
sand
s of
Dol
lars
34

2. Federal Energy Efficiency Fund
The Federal Energy Efficiency Fund was established by section 152 of EPACT, which amendedsection 546 of NECPA, to provide grants to agencies to assist them in meeting the mandatedenergy efficiency and water conservation requirements. The limited spending authority availablein FY 1994 and FY 1995 was applied to those proposals which were most competitive,considering the five following factors:
# The cost-effectiveness of the project (saving-to-investment ratio).# The net dollar cost savings to the Federal Government.# The amount of energy savings to the Federal Government.# The amount of funding committed by the agency requesting financial assistance.# The amount of funding leveraged from non-Federal sources.
No spending authority has been provided beyond FY 1995. A total of 114 proposals werereceived during FY 1994 and FY 1995 and Fund grants were provided for 37 projects. Of these,35 projects provide energy savings of 5.8 trillion Btu and two projects result in waterconservation in the amount of 738 million cubic feet, with an estimated energy and water costsavings of $54 million (before payback of the initial investment) over the useful lives of theprojects. The total Fund investment to realize these savings was $7.9 million, which leveraged$3.6 million in Federal-agency funding and $0.9 million in non-Federal funding. The projectsencompass 14 states and the District of Columbia, with one project located in the Caribbean.
35

3. Energy Savings Performance Contracting
Section 155 of EPACT amended Title VIII of NECPA, sections 801 and 804, relating to energy savings contracts. Section 801, as amended, gives agencies the authority to enter into ESPCs and describes the methodology of contract implementation. The ESPC program was created to provide agencies with a quick and cost-effective way to increase the energy efficiency of Federal buildings. Under an ESPC, a private sector energy service company (ESCO) will assume the capital costs of installing energy conservation equipment and renewable energy systems. The ESCO guarantees the agency a fixed amount of energy cost savings throughout the life of the contract and is paid from those cost savings. Agencies retain the remainder of the energy cost savings.
On April 10, 1995, DOE published in the Federal Register (10 CFR Part 436) a final rule that sets forth the regulations for energy savings performance contracting. An application process for a Qualified List of ESCOs was also released with the ESPC regulations. Only firms on the Qualified List may receive an ESPC contract award. Firms that wish to be on the Qualified List must submit an application to DOE and possess the required experience and expertise. The List is continually updated.
On November 2, 1998, the Energy Conservation Reauthorization Act was signed by President Clinton to become Public Law 105-388. The law made several significant changes to EPACT and NECPA. Section 4 of Public Law 105-388 amends NECPA section 801 to extend the authority of Federal agencies to enter into ESPCs through September 30, 2003. Without this amendment, the authority would have expired on April 10, 2000. Section 4 also amends the definition of “Federal agency” in NECPA Section 804 to include each authority of the U.S. Government, whether or not it is within or subject to review by another agency.
On June 3, 1999, President Clinton signed Executive Order 13123. Section 403(a) states that “Agencies shall maximize their use of available alternative financing contracting mechanisms, including Energy Savings Performance Contracts.” This Section goes on to state that “Energy Savings Performance Contracts...provide significant opportunities for making Federal facilities more energy efficient at no net cost to taxpayers.”
During FY 2000, 81 ESPC contracts or delivery orders were awarded at 10 agencies. These include delivery orders awarded through the DOE/FEMP Regional and Tech-Specific ESPC programs as well as projects awarded by the Department of Defense and other agencies. Total contractor investment from these projects is approximately $287.0 million, providing the Government with an opportunity to save almost 1.7 trillion Btu each year. These ESPCs include 58 by the Department of Defense, six by the General Services Administration and the Department of Veteran’s Affairs, three by the National Aeronautic and Space Administration, two by the Departments of Labor and Agriculture, and one each by the Department of Energy, Department of the Interior, the Environmental Protection Agency and the U.S. Postal Service.
36

Energy Savings Performance Contracts and Delivery Orders Awarded by Federal Agencies in FY 2000
Allocation of Project Cost Savings (Thousand $)
Agency Number of
Delivery Orders/ Contracts
Contractor Investment
(Thousand $)
Guaranteed Total
Cost Savings Less Payment to Contractor
Net Savings to Government
Annual Energy Savings
(MMBTU) Agriculture 2 $7,018 $89 33,329 Defense 58 $237,628 $56,352 1,274,866 Energy 1 $4,450 $9,685 $716 86,713 EPA 1 $4,276 $279 11,199 Interior 1 $2,047 $151 10,931 Labor 2 $1,689 $36 28,489 GSA 6 $14,799 $189 90,571 NASA 3 $4,073 $0 43,880 U.S. Postal Service 1 $1,626 $2,131 $1,951 $180 13,442 Veterans Affairs 6 $9,033 $1,062 98,286
Total 81 $286,638 $59,053 1,691,706
$14,045 $14,134 $414,563 $487,252
$10,401 $8,688 $8,967 $5,575 $5,726 $3,417 $3,452
$23,148 $23,337 $8,910 $8,910
$17,974 $19,036
$507,956 $583,347
In FY 2000, the Department of Defense through a decentralized approach, awarded the largest number of contracts/delivery orders with 58 ESPC projects. These contracts include many infrastructure upgrades and new equipment to help DOD installations reduce energy and water consumption. Examples include new thermal storage systems, chillers, boilers, lights, motors, EMCS systems and water reducing devices. Normally, cost savings are used to first pay the contractor, and then are used to offset other base operating support expenses. In some cases, however, installations decide to seek a shorter contract term and defer all Government cost savings until contract completion. In these cases, the savings generated by ESPCs help to reduce the energy consumption, but do not reduce the total cost of operation until the contracts expire. After contract expiration and the retrofits are paid for, the Department of Defense will be able to obtain full cost savings.
In FY 2000, the Department of Defense received Congressional funding of $4 million to facilitate implementation of ESPC contracts. A similar $4 million Congressional appropriation for ESPCs was made in FY 2001.
Awarding ESPCs on a one-by-one basis has often proven to be complex and time consuming. To make it easier to use ESPCs, DOE/FEMP developed Regional and Technology-Specific Super ESPCs. Both Regional and Technology-Specific Super ESPCs share the same general contract terminology and provisions with conventional ESPCs and they present several significant advantages to Federal agencies.
Super ESPCs are unlike conventional ESPCs in two fundamental ways. First, a Super ESPC blankets a large geographic territory; a conventional ESPC is used for a specific site. Second, Super ESPCs substantially reduce the lead time to contract with an ESCO for energy services. Super ESPCs are broad area indefinite delivery, indefinite quantity (IDIQ) contracts that allow agencies to negotiate site-specific delivery orders with an ESCO without having to start the
37

contracting process from scratch. Demand on agency resources to develop and award contracts, as well as lead times, will be greatly reduced, and energy savings will be realized more quickly.
The Western Regional Super ESPC was awarded to five ESCOs in May 1997 and covered the states of Alaska, Arizona, California, Hawaii, Idaho, Nevada, Oregon, Washington, and U.S. Pacific Territories. The Southeast (covering Alabama, Arkansas, Florida, Georgia, Kentucky, Mississippi, North Carolina, South Carolina, Tennessee, Puerto Rico and the U.S. Virgin Islands) Midwest (covering Illinois, Indiana, Iowa, Michigan, Minnesota, Missouri, Ohio and Wisconsin), and Central Regional Super ESPCs (covering Colorado, Kansas, Louisiana, Montana, Nebraska, New Mexico, North Dakota, Oklahoma, South Dakota, Texas, Utah and Wyoming) were awarded to various ESCOs during FY 1998 and FY 1999.
The Mid-Atlantic (covering Delaware, Maryland, New Jersey, Pennsylvania, Virginia, West Virginia and the District of Columbia) and Northeast Regional Super ESPCs (covering Connecticut, Maine, Massachusetts, New Hampshire, New York, Rhode Island, and Vermont) were awarded two ESCOs during FY 2000. The Mid-Atlantic Regional ESPC was awarded to one ESCO (ERI Services, Inc.) Also, the Northeast Regional Super ESPC was awarded to one ESCO (Honeywell, Inc.).
During FY 2000, 19 Regional Super ESPC delivery orders were awarded. Total contractor investment is more than $57 million, providing almost 540 billion Btu of energy savings to the Government. These delivery orders include six by the GSA, four by the Department of Defense, two by the Department of Agriculture and the Department of Labor, and one each by the DOE, the Environmental Protection Agency, the Department of the Interior, the Department of Veteran’s Affairs, and the National Aeronautics and Space Administration. Also during FY 2000, one Technology-Specific Super ESPC delivery order was awarded by the Department of Defense at the Patuxent River Naval Air Station in Maryland.
Technology-Specific Super ESPCs emphasize a particular advanced energy-efficiency or renewable energy technology to advance these proven, yet still emerging, technologies in the Federal marketplace. They blanket the entire nation and carry the same agency resource and time saving benefits as Regional Super ESPCs. ESCOs chosen for these awards have unique capabilities and experience in providing energy savings through installation of the technology, thereby greatly reducing the risks of misapplying emerging technologies. Technology-Specific Super ESPCs can also be comprehensive projects employing multiple energy conservation measures, as long as the named technology is the focus of the project.
38

Delivery Orders Awarded with DOE Super ESPC Program Support
Project Name/Location Project Description Contractor Investment
Savings (MMBTU)
Agriculture, National Animal Disease Center, Agricultural Research Services, Ames, IA
Boilers, EMCS, HVAC, Lighting, Electric Motors, Electrical/Cogeneration Systems, Electric Distribution System, Rate Reduction/Audit
$6,363,685 26,031
Agriculture, National Agricultural Library, Beltsville, MD
Lighting, Burner Replacement, Chiller Plant Automation, Building Automation System
$654,100 6,298
Defense, Presidio of Monterey, Monterey, CA
Lighting $1,786,056 4,632
Defense, National Imagery & Mapping Agency
Lighting, Occupancy Sensor installation and PCU consolidation
$949,114 9,328
Defense, Fort Rucker, Fort Benning, Fort Gordon, Fort Jackson, & Fort Stewart Medical Commands
Chiller, EMCS, HVAC, Lighting, Building Envelope Modifications, Piping and Distr. Systems, Motors and Drives
$11,781,507 110,068
Defense, Fox Army Health Center, Huntsville, AL
EMCS, Chiller and Lighting Improvements
$1,326,355 12,391
Defense, Patuxent River Naval Air Station, Patuxent River, MD
Tech-Specific Super ESPC - Geothermal Heat Pumps and EMCS
$4,785,168 44,705
Energy, Pantex Plant, Amarillo, TX
Lighting, Chilled water and steam distribution piping systems, air handling units, solar water heaters, temperature controllers, ozone laundry system, preheat coil controls, BAS/EMS system
$4,449,685 86,713
Environmental Protection Agency, National Risk Management Research Laboratory, Ada, OK
Renewable Energy Systems $4,275,612 24,900
General Services Administration, Ft. Worth Office for Project in Austin, Ft. Worth, TX
Chillers, EMCS, Lighting, Water $3,721,661 15,295
General Services Administration, Dallas -Ft.Worth Office for Project in South Texas Sites, Ft.Worth, TX
Lighting, Chiller Replacements, Solar, EMCS, VFDs, Water
$956,335 5,733
General Services Administration, Leo O’Brien Federal Building, Albany, NY
Boiler, Chiller, Building Automation, HVAC, Lighting, Building Envelope Mods., Motors and Drives
$983,215 6,693
39

Project Name/Location Project Description Contractor Investment
Savings (MMBTU)
General Services Administration, Denver Federal Center, Lakewood, CO
EMCS, chillers, pump w/VFD, Variable volume chilled water system, Lighting, Irrigation system controls, Solar domestic hot water system repair/rehabilitation
$2,426,454 34,201
General Services Administration, Lincoln Courthouse and Federal Building, NE
Boilers, Chillers, EMCS VAV, Lighting, Steam Traps and Water
$4,120,128 20,784
General Services Administration, Releigh, NC
EMCS, Boiler and Chiller Improvements $2,591,453 24,210
Interior, Sherman Indian High School, Riverside, CA
Lighting, PV System, HVAC mods, Pool Cover and Ventilation Controls, Pump VFD and Controls
$2,366,270 10,931
Labor, Job Corps Centers, San Bernadino & Sactramento, CA
Lighting $205,475 8,800
Labor, Gary Job Corps Center, San Marcos, TX
EMCS, HVAC, Lighting, Renewables, Water
$1,483,360 19,689
National Aeronautics and Space Administration, Ames Research Center, San Francisco, CA
EMCS, Lighting, and Renewable Energy Systems
$1,916,688 24,133
Veterans Affairs, Medical Center, Salt Lake City, UT
Chiller, EMCS, HVAC, Lighting, RE systems, Electric distribution system, Rate reduction/audit
$4,921,796 52,386
The first Technology-Specific Super ESPC was awarded in September 1996 to provide solar hot water heating with parabolic troughs. The contract value was $30 million. During FY 1998, the photovoltaics Technology-Specific Super ESPC was awarded to two ESCOs. This contract was worth $50 million. In February 1999, the geothermal heat pump Technology-Specific Super ESPC was awarded to five ESCOs. This contract was worth $500 million. In September 2000, a geothermal heat pump Technology-Specific Super ESPC was awarded for a project at the U.S. Navy’s Patuxent River Naval Air Station. Contractor investment in this project is almost $4.4 million. Annual energy savings include 952,466 kWh of electricity, 9,964 gallons of fuel oil, and 121,979 thems of natural gas. In addition, the project conserves 16.5 million gallons of water per year. The total annual value of the energy and water savings will be approximately $330,070 per year over the 20 year term of the project. Savings are due primarily to lighting retrofits and replacement of conventional HVAC equipment with geothermal heat pumps. In addition, cooling requirements for a mission-critical environmental test chamber – currently met by circulating treated domestic water, which is then ejected to the building storm sewer – will now be met with a closed-loop geothermal system.
40

Over the next several years, it is anticipated that more Technology-Specific Super ESPCs will be awarded covering a wide range of energy and cost saving technologies.
4. Utility Energy Service Contracts
Section 403(a) of Executive Order 13123 provides that Federal agencies maximize their use of available alternative financing contracting mechanisms, including utility energy service contracts (UESCs), when life-cycle cost-effective, to meet the energy reduction goals of the order. Agencies are encouraged to partner with the private sector to implement facility and energy improvements, streamline contracts, and maximize purchasing power. UESCs provide significant opportunities for making Federal facilities more energy efficient at no net cost to taxpayers.
The financing mechanism offered through UESCs enables agencies to implement energy and water efficiency projects without obtaining direct appropriations. These energy contracts are designed to leverage private sector financing to pay for energy efficiency improvements. The net cost to the participating Federal agency remains minimal, as the projects pay for themselves from a share of the energy cost savings. The financing tool also helps the agency save time and resources by using the services provided by the utility. Utility services range from rebates on energy-efficient equipment to energy audits, feasibility studies, design, finance, and delivery of complete turn-key projects, with contract terms generally limited to 10 years. Projects typically begin with an energy audit and feasibility study, and proceed to engineering, design, and installation phases.
FEMP helps Federal agencies and their utility companies work together to save energy and dollars at Federal facilities. FEMP supports agencies and their utilities by promoting Federal/utility partnerships through the Federal Utility Partnership Working Group and supplying alternative financing information. FEMP provides comprehensive assistance and services to agencies with the support of partners, including DOE offices, DOE national laboratories, and private sector contractors. Six DOE Regional Offices serve as the initial customer contact points and customer advocates. FEMP also sponsors utility-related training, helps remove regulatory barriers, and provides information on utility restructuring and its effects on Federal agencies to help agencies to take advantage of the partnerships.
In FY 2000, a total of 84 UESCs were implemented by all Federal agencies. Private sector investment in the projects totaled $191.3 million. The estimated annual energy cost savings from the 84 projects is $40 million.
Projects were undertaken by agencies to accomplish a wide variety of energy efficiency improvements. Of the 84 UESCs awarded in FY 2000, 41 were implemented by the Department of Defense. Contracts were put in place to perform infrastructure upgrades and purchase new equipment to help installations reduce energy and water consumption. Examples of equipment purchased with the UESC financing tool include: new thermal storage systems, chillers, boilers, lights, motors, EMCS systems and water reducing devices.
GSA awarded three utility financed projects in FY 2000 with a total value of $9.9 million and expected annual energy cost savings of 11.4 billion Btu. The contracts were used to implement a
41

large number of energy retrofits at three GSA facilities in Region 11. Combined with those already in progress, GSA has 13 UESC projects in place.
In FY 2000, the Department of Health and Human Services focused its efforts on promoting and facilitating the use of alternative financing mechanisms to implement energy and water efficiency projects. NIH entered into three UESCs for a total of $38.9 million in FY 2000. These projects included the construction and operation of a 23-megawatt cogeneration facility, the installation of an energy management control system, and the upgrade of lighting and motors at the main campus.
The Office of Personnel Management entered into a $2 million UESC with its Washington, D.C. utility provider in FY 2000. This contract led to the retrofitting of all of the lights in the Theodore Roosevelt Building with new energy efficient fluorescent tubes and ballasts. The contract was later amended and enlarged to include the air conditioning chiller plant replacement, begun in FY 2000 and continued in FY 2001.
5. Life-Cycle Costing (LCC)
Section 544 of NECPA, as amended in 1988, requires DOE to establish practical and effective methods for estimating and comparing the life-cycle costs for Federal buildings using the sum of all capital and operating costs for energy systems of new buildings involved over the expected life of such systems or during a period of 25 years, whichever is shorter, and using average fuel costs and a discount rate determined by the Secretary of Energy. In addition, section 544 requires that procedures be developed in applying and implementing the methods that are established. EPACT further amends NECPA to require, after January 1, 1994, agencies which lease buildings to fully consider the efficiency of all potential building space at the time of renewing or entering into a new lease.
In the past, FEMP has published updated fuel price projections for life-cycle cost analyses on October 1 of each year to coincide with the beginning of the fiscal year. The FY 2000 update of the Energy Price Indices and Discount Factors for Life-Cycle Cost Analysis, Annual Supplement to Handbook 135 was published and distributed to Federal energy managers in April 1999.
42

E. ENERGY STAR® and Energy Efficient Product Procurement
Executive Order 13123 directs Federal agencies to purchase ENERGY STAR labeled products, or, for those product types not covered by the EPA/DOE ENERGY STAR labeling program, products “in the upper 25 percent of energy efficiency as designated by FEMP.” Reinforcing the message is a stipulation in the Federal Acquisition Regulations (48 CFR 23.704) that “Agencies shall implement cost-effective contracting preference programs favoring the acquisition of . . . energy-efficient products. . . ., i.e., products that are in the upper 25 percent of energy-efficiency for all similar products.” This FAR provision was initiated in response to Executive Order 12902 (1994), and efforts are presently under way to modify the language in accordance with E.O. 13123 (e.g., to refer to ENERGY STAR products).
The ENERGY STAR labeling program is a joint effort between EPA and DOE to get manufacturers (and some retailers) to identify efficient products with an easily recognizable logo, the ENERGY STAR. Since this is a nation-wide labeling program covering multiple products, it makes it very simple for customers to identify truly efficient models among those offered – for instance, on a retail floor, or among various models listed in a product catalog. In FY 2000, the program included a wide variety of office equipment and home heating and cooling products, as well as many consumer audio and video products (e.g., TVs, VCRs, and DVD players), appliances, and residential windows. Some commercial equipment was also covered, such as exit signs, low-voltage distribution transformers, and roof products.
To assist Federal agencies in meeting the requirements of the Executive Order and FAR directives, FEMP publishes a series of Product Energy Efficiency Recommendations, which delineate the efficiency levels that meet the ENERGY STAR and “upper 25%” requirements of the Executive Order. The Recommendations also provide cost-effectiveness examples, tips on important product selection parameters such as sizing and fuel choice, and information about buying efficient products from the Federal supply agencies: the Defense Logistics Agency (DLA) and the GSA. The Recommendations, which now cover more than 30 products, are available on FEMP’s Web site at www.eren.doe.gov/femp/procurement, as well as in print, through a loose-leaf binder called “Buying Energy Efficient Products.” The binder is available free of charge from FEMP’s clearinghouse (800-363-3732); subscribers receive new and updated material as it is printed, approximately every six months.
To be most effective, FEMP’s product efficiency recommendations need to be incorporated into other purchasing guidance, such as technical specifications and agency-specific policies and practices. Pursuant to this concern, FEMP has made considerable progress in partnership with the two major Government supply agencies, DLA and GSA. During FY 2000, FEMP worked with GSA’s Federal Supply Service (FSS) and with DLA to identify energy-efficient equipment among supply offerings. As a result of FEMP’s joint effort with GSA/FSS on electronic product coding, GSA customers shopping on-line can, in many cases, distinguish models that are ENERGY STAR or FEMP-compliant.
DLA’s customers rely heavily on the information in the Federal Logistics Information System (FLIS) database to procure products and equipment. The FLIS catalogs millions of items by “national stock numbers” (NSNs), which can be accessed by vendor name or code.
43

DLA has established a database field within the FLIS that highlights positive environmental attributes, such as energy efficiency or recycled materials, using the FEMP efficiency thresholds to define “energy-efficient” and “water-conserving” (for plumbing fixtures such as showerheads and toilets).
By the end of FY 2000, FEMP’s biggest success with its energy-efficient purchasing program was the incorporation by several large Federal construction agencies of FEMP-recommended product efficiency levels into agency master, or guide, specifications for construction and major renovation. When an agency writes a FEMP recommendation into a “guide spec” for a given product, it generally assures that virtually all the buildings constructed by that agency will use only models that comply with the highly efficient levels – affecting millions of dollars worth of product. On the vanguard of this movement are the Army Corps of Engineers and the Navy. Products for which guide specifications incorporating FEMP’s recommended efficiency levels had been written by the end of fiscal year 2000 include electric chillers, fluorescent lighting, exit signs, distribution transformers, and roof products.
Finally, FEMP partnered with DLA and DOE's Office of Building Technologies in FY 2000 to issue a solicitation for a new generation of unitary air conditioners that are significantly more energy-efficient than models typically purchased. This type of "packaged" unit is often found on rooftops of low-rise federal and commercial buildings, and is typically specified on the basis of lowest first-cost rather than lowest life-cycle cost, including electricity (and peak demand) costs which are the focus of this solicitation. The intent is to use federal buying power to help establish an initial market demand that reduces the risk to manufacturers of developing and marketing a much more efficient and cost-effective line of products. The DLA solicitation will result in a separate basic ordering agreement that will also allow commercial and other non-federal organizations to buy high-performance rooftop units from winning bidders on the same terms as federal agencies.
44

F. Integrated Whole Building Efficiency
1. Federal Building Energy Performance Standards
The Energy Conservation and Protection Act (ECPA), as amended by the Energy Policy Act of 1992, mandates that new Federal buildings must contain energy saving and renewable energy specifications that meet or exceed the energy saving and renewable energy specifications of the American Society of Heating, Refrigerating and Air Conditioning Engineers (ASHRAE)/ Illuminating Engineering Society of North America (IESNA) Standard 90.1-1989 and the Council of American Building Officials Model Energy Codes (MEC) 1992.
A final rule on the Energy Code for New Federal Commercial and Multi-Family High Rise Residential Buildings was published in the Federal Register on October 6, 2000 and became effective on October 8, 2001. The Energy Code revised the prior interim Federal standards to conform generally with the codified version of ASHRAE Standard 90.1-1989 and incorporated changes in the areas of lighting, mechanical ventilation, motors, building envelope, and fenestration rating test procedures, and test procedures for heating and cooling equipment. Additionally, the new lighting provisions are more stringent than those in Standard 90.1-1989 and reflect new information concerning energy requirements needed to achieve adequate lighting levels. In FY 2002, DOE initiated another update of the Federal commercial building standards using ASHRAE 90.1-1999 as the model, and expected to solicit public comments on this new proposed rule in a Federal Register notice during the latter part of 2002.
A separate proposed rule for new Federal residential buildings was issued by DOE in the Federal Register in May 1997. DOE has determined that the 1997 proposed rule does not contain sufficient cost effective, energy efficient requirements for new Federal residential buildings. Therefore, DOE will propose a new rule containing updated energy efficient measures.
2. ENERGY STAR® Buildings
Section 403 of Executive Order 13123 calls upon agencies to strive to meet the ENERGY STAR® building criteria for energy performance and indoor environmental quality in their eligible facilities to the maximum extent practicable by the end of 2002. Agencies have the option of using energy savings performance contracts, utility energy-efficiency service contracts, or other means to conduct evaluations and make improvements to their buildings in order to meet the criteria. Buildings that rank in the top 25 percent in energy efficiency relative to comparable commercial and Federal buildings will receive the ENERGY STAR® building label.
ENERGY STAR® is a program that was developed by EPA with DOE as a co-sponsor to promote energy efficiency through the use of online software that benchmarks and ranks office buildings in terms of energy efficiency. In FY 2000, only office buildings were able to be benchmarked by EPA’s benchmarking tool. Other building types will be included in future years, beginning with laboratories and classroom buildings. Actual ENERGY STAR® Building certification and labeling is based upon measured building data and a comparison with archetypes in various regions of the country. Many agencies are using the five-stage ENERGY STAR® implementation strategy, which
45

consists of lighting upgrades, building tune-up, other load reductions, fan system upgrades, andheating and cooling systems upgrades.
The ENERGY STAR® Building program is currently being implemented and utilized by manydifferent agencies. To spotlight a few examples:# Energy consumption in the TVA’s Chattanooga Office Complex was less than 50,000
Btu/GSF, which exceeds both TVA's target for facility design and the FY 2010 building energy reduction goal established in Executive Order 13123.
# The USPS is working to develop specific ENERGY STAR® criteria for postal facilities. During FY 2000, a beta test was conducted on the criteria using data collected from USPS “Do It Yourself” energy surveys and financial performance data. When completed, this effort will provide an ENERGY STAR® benchmarking model addressing USPS buildings.
# NASA analyzed 64 facilities at nine locations and as a result, two buildings will receive the ENERGY STAR® Label. Recommended ESPCs and UESCs were also developed to require pre- and post-retrofit ENERGY STAR® analyses of projects involving significant energy improvements in NASA office buildings.
# GSA has earned the ENERGY STAR® Building Label for 70 of its own facilities and one of its leased facilities. The total square footage for the facilities is 17.4 million GSF.
# Three EPA office buildings, either owned or leased by GSA, have been awarded the ENERGY STAR® label.
3. Sustainable Building Design
As required by Section 403(d) of Executive Order 13123, DOD and GSA, in consultation with DOE and EPA, have developed sustainable design principles. Agencies are required to apply such principles to the development, design, and construction of new facilities. Agencies shall optimize life-cycle costs, pollution, and other environmental and energy costs associated with the construction, life-cycle operation, and decommissioning of the facility. Agencies have the option of using ESPCs or UESCs as well, to aid them in constructing sustainably designed buildings.
All agencies are either developing or have implemented the Whole Building Design Guide (WBDC) and the U.S. Green Building Council’s Leadership in Energy and Environment Design (LEED) programs into their facilities design standards and master planning process, as well as applying integrated design approaches to the life-cycle of buildings and infrastructures. The WBDG and LEED are part of a complete Internet resource to a wide range of building-related design guidance, criteria and technology allowing the integrating of sustainable building design. The WBDG is an up-to-date, knowledge-based, creatively linked to information across disciplines and traditional professional boundaries, intended to encourage the “whole building approach” to design and construction, and used by Federal, military and private sector architects, engineers, and project managers. The “whole buildings” design approach asks the members of the planning, design and construction team to look at the materials, systems and assemblies from many different perspectives. The design is evaluated for cost, quality-of-life, future flexibility, efficiency, overall environmental impact, productivity, creativity, and how the occupants will be enlivened.
46

Examples of criteria that have been incorporated in many facilities include the installation of high performance windows, direct-digital control remote control systems, high efficient electric lighting, new energy HVAC equipment, and increased insulation in roofs, walls and foundations. Many agencies are incorporating low-cost projects such as: replacing high volume water fixtures, purchasing solar power generation and installing solar lighting, upgrading lighting with motion detectors and occupancy sensors, installing or replacing insulation, replacing mechanical ventilation systems with natural ventilation, and installing water conserving toilets.
Integrated sustainable building design is demonstrated at a Weather Forecast Office (WFO) built for the National Weather Service (NWS) in Tlyan, Guam. The facility, located in an area with extreme weather and environmental conditions, is required to operate 24-hours a day, 365-days a year. The facility houses sensitive electronic systems and complex communication equipment necessary to fulfill its critical mission of providing weather data for the region. The design team looked at opportunities to integrate sustain sustainable features as: low maintenance and energy efficient equipment, use of alternate energy resources, waste reduction, use of recycled materials, and optimizing indoor environmental quality. Using DOE 2.1 E Software, a benchmark-model of typical energy use in previous NWS facilities was created. This benchmark was used in analyzing various design and material specification options. The sustainable building design elements incorporated in the WFO include building siting, landscape, maintenance, daylighting, energy efficient sensors, alternate energy resources, indoor air quality measures, and recycled/renewable materials. The steps taken at the WFO facility are expected to result in annual energy cost savings of approximately 22 percent, compared to a typical American Society of Heating, Refrigerating, and Air-Conditioning Engineers-compliant building.
4. Highly Efficient Systems
Under Section 403(g) of Executive Order 13123, agencies are to implement district energy systems and other highly efficient systems in new construction or retrofit projects. Agencies are to consider combined cooling, heat, and power when upgrading and assessing facility power needs and survey local natural resources to optimize use of available biomass, bioenergy, geothermal, or other naturally occurring energy sources.
Highly efficient systems are being installed and utilized by nearly every reporting agency. In many cases, agencies are forming ESPCs with energy service companies to install cogeneration, geothermal and biomass systems. In FY 2000 the Army was in the third year of a 5-year, $300 million central boiler plant modernization program. The goals of this program are to update the aging central boiler plant infrastructure that is currently found on many installations. These projects have resulted in upgraded or new boilers, new distribution systems, improved high efficiency pumps and motors, and updated system controls in all of these plants.
Three programs at DOE’s Lawrence Livermore National Laboratory (LLNL), Energy Management, Geothermal and Environmental Technologies, and Environmental Remediation, worked together to conceive, develop, evaluate, and advocate a method of extracting energy from an untapped renewable energy resource. This resource is the treated effluent from pollution prevention groundwater remediation pump-and-treat installations. LLNL has successfully
47

demonstrated the utilization of this resource as condenser water in a nearby building’s water-source heat pumps, and, further as irrigation water.
In FY 2000, the National Institutes of Health (NIH), a component of the Department of Health and Human Services, signed a UESC with the local utility to construct a 23-megawatt cogeneration unit that is a prime example of a highly efficient energy system. Another example is under construction at the NIH Clinical Research Center (CRC), and involves the use of steam driven electric generating turbines as a means of conserving steam energy that would otherwise be lost in the normal pressure reducing process.
5. Water Conservation
Under Section 207 of Executive Order 13123, agencies are required to reduce water consumptionand associated energy use in their facilities to reach the goals set under section 503(f) of the order.
The water conservation goals require agencies to implement life-cycle cost-effective waterefficiency programs that include developing a comprehensive water management plan and at leastfour separate Water Efficiency Improvement Best Management Practices (BMP), as defined inDOE guidance documents. The goals include the following schedule for program implementationin agencies’ facilities: 05 percent of facilities by 2002, 15 percent of facilities by 2004, 30 percentof facilities by 2006, 50 percent of facilities by 2008, and 80 percent of facilities by 2010.
FY 2000 water consumption data are used by agencies as baseline usage to measure progress inwater conservation efforts. Agencies use actual data where available or develop estimates whereactual data are not available. Water usage was reported to the Department of Energy in the FY2000 annual energy reports. Federal water usage will thereafter be reported every two yearsbeginning in 2002. Water conservation measures implemented and water saved on an annual basiswill also be reported.
In FY 2000, all reporting agencies combined consumed nearly 256.4 billion gallons of water at acost of more than $432 million. It is likely that actual consumption is higher due to under-reporting by agencies. This is the first year that agencies were asked to submit data on waterconsumption and many agencies are still putting in place accurate systems for capturing this data.
Conservation efforts undertaken by agencies in FY 2000 included the installation orimplementation of the following:
# Recycled effluent water,# Computer control systems programmed to operate wells and pumps,# Low-flow faucets,# Ultra-low consumption toilets with electric flush sensors,# Electric sensor-controlled lavatories,# Chilled water consumption has been monitored,# Performed leak detection on distribution systems,# Reviewed water management operation procedures,
48
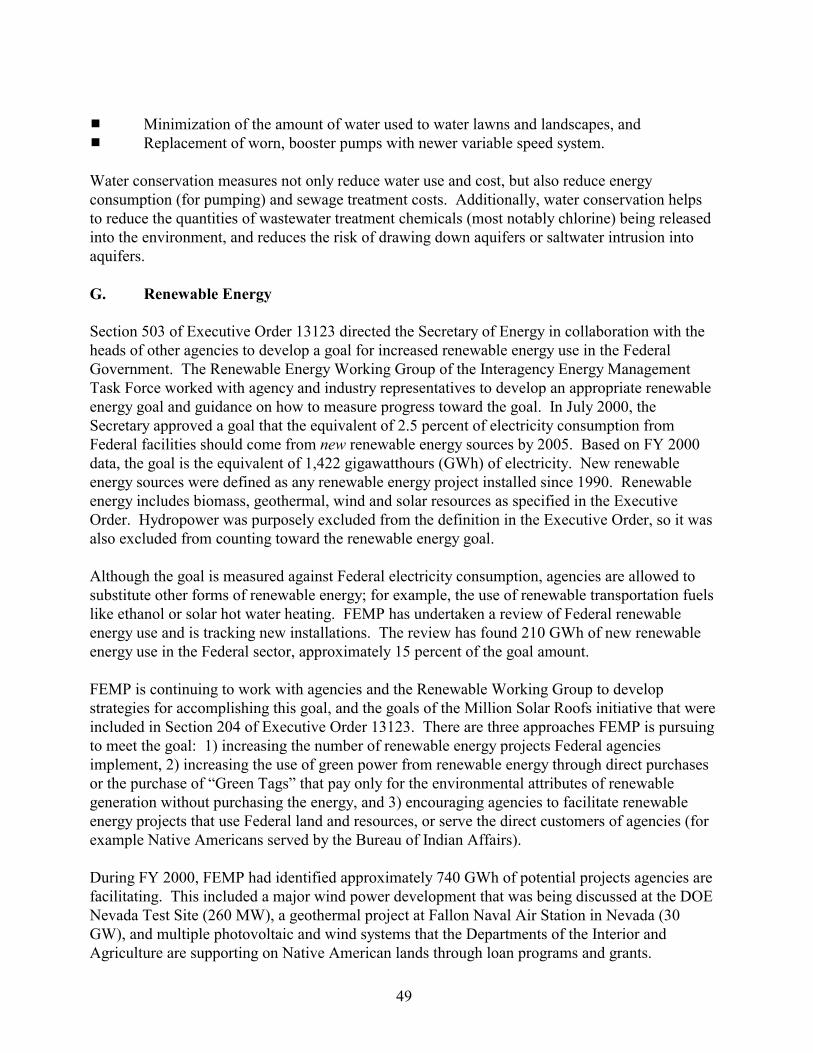
# Minimization of the amount of water used to water lawns and landscapes, and # Replacement of worn, booster pumps with newer variable speed system.
Water conservation measures not only reduce water use and cost, but also reduce energy consumption (for pumping) and sewage treatment costs. Additionally, water conservation helps to reduce the quantities of wastewater treatment chemicals (most notably chlorine) being released into the environment, and reduces the risk of drawing down aquifers or saltwater intrusion into aquifers.
G. Renewable Energy
Section 503 of Executive Order 13123 directed the Secretary of Energy in collaboration with the heads of other agencies to develop a goal for increased renewable energy use in the Federal Government. The Renewable Energy Working Group of the Interagency Energy Management Task Force worked with agency and industry representatives to develop an appropriate renewable energy goal and guidance on how to measure progress toward the goal. In July 2000, the Secretary approved a goal that the equivalent of 2.5 percent of electricity consumption from Federal facilities should come from new renewable energy sources by 2005. Based on FY 2000 data, the goal is the equivalent of 1,422 gigawatthours (GWh) of electricity. New renewable energy sources were defined as any renewable energy project installed since 1990. Renewable energy includes biomass, geothermal, wind and solar resources as specified in the Executive Order. Hydropower was purposely excluded from the definition in the Executive Order, so it was also excluded from counting toward the renewable energy goal.
Although the goal is measured against Federal electricity consumption, agencies are allowed to substitute other forms of renewable energy; for example, the use of renewable transportation fuels like ethanol or solar hot water heating. FEMP has undertaken a review of Federal renewable energy use and is tracking new installations. The review has found 210 GWh of new renewable energy use in the Federal sector, approximately 15 percent of the goal amount.
FEMP is continuing to work with agencies and the Renewable Working Group to develop strategies for accomplishing this goal, and the goals of the Million Solar Roofs initiative that were included in Section 204 of Executive Order 13123. There are three approaches FEMP is pursuing to meet the goal: 1) increasing the number of renewable energy projects Federal agencies implement, 2) increasing the use of green power from renewable energy through direct purchases or the purchase of “Green Tags” that pay only for the environmental attributes of renewable generation without purchasing the energy, and 3) encouraging agencies to facilitate renewable energy projects that use Federal land and resources, or serve the direct customers of agencies (for example Native Americans served by the Bureau of Indian Affairs).
During FY 2000, FEMP had identified approximately 740 GWh of potential projects agencies are facilitating. This included a major wind power development that was being discussed at the DOE Nevada Test Site (260 MW), a geothermal project at Fallon Naval Air Station in Nevada (30 GW), and multiple photovoltaic and wind systems that the Departments of the Interior and Agriculture are supporting on Native American lands through loan programs and grants.
49

Another 55 GWh of potential green power or green tag purchases have been identified, and 36 GWh of potential on-site projects.
In order to better track Federal renewable energy use, FEMP, with technical support from NREL, integrated information from the Million Solar Roofs Initiative solar system project registry, Sandia National Laboratory’s assessment of solar systems at U.S. Department of the Interior and U.S. Department of Agriculture Forest Service facilities and other disparate data sources into a single database and Web-enabled project registry. During FY 2000, the Internet site for this system was in its testing phase. The database contains information on renewable energy usage at more than 25,000 sites, including information on green power purchases, on-site power generation, and thermal applications. FEMP and NREL are continuing to enter system data into the registry to more accurately reflect a baseline for Federal renewable energy use.
Million Solar Roofs Section 204 of Executive Order 13123 restated a goal of 2,000 solar roof installations in the Federal Government by 2000, and 20,000 installations by 2010. The goal was first articulated in the 1997 announcement of the Million Solar Roofs Initiative. In the period from June 1997 to April 2000 the Federal government installed 1,745 solar energy systems. This total included 1,682 solar hot water systems, 58 photovoltaic power systems and 5 transpired solar thermal collectors. The U.S. Navy installed an additional 1,000 solar hot water systems by the end of FY 2000. This brought total installations to just over 2,700 systems by the end of 2000, accomplishing the Federal goal.
50

12Process energy is that energy used in buildings for operations other than standard building services. caseswhere separate reporting was not possible, due to the lack of meters or estimation techniques, process energy wasreported as though it was part of the energy used for standard building services.
13The General Services Administration (GSA) is the primary leasing agent for the Federal Government, althoughmost of the other agencies do have some leasing authority. n some cases, GSA will delegate operations andmaintenance responsibility to individual agencies for leased space, requiring the agency to be responsible for payingthe utility bills and reporting energy consumption.
14Conversion factors of 10,346 Btu per kilowatt hour for electricity and 1,390 Btu per pound of steam are used tocalculate primary energy consumption. See Appendix B for conversion factors for site-delivered energyconsumption.
51
29
86
70
26
9
41
5
61
0
10
20
30
40
50
60
70
80
90
Electricity Fuel Oil Natural Gas Other
TRIL
LIO
N B
TU
DOD Civilian Agencies
FIGURE 5Defense and Civilian Energy Consumption in
Standard Buildings by Fuel Type, FY 2000
II. NERGY MANAGEMENT IN STANDARD BUILDINGS
A. Energy Consumption and Costs for Standard Buildings
During FY 2000, the Federal Government provided energy to approximately 500,000 buildingsand facilities comprising approximately 3.4 billion square feet of floor area. Of this,approximately 3.06 billion square feet was reported as standard building space in FY 2000. remaining space is reported as energy intensive facilities or exempt facilities and is discussed inSections III and IV respectively. The energy is used in standard buildings provides lighting,heating, ventilation, air conditioning, and other standard building services, and is used for certainprocess operations that are not reported separately.12 Federal buildings include both Federally-owned and leased buildings. ver, in many instances the lessor pays the energy bill, andconsumption and cost data may not be available to the Government. Accordingly, Federalagencies report data for leased space to the maximum extent practicable.13
Table 5-A shows the total primary energy consumed in Federal buildings and facilities, includingenergy resources used to generate, process, and transport electricity and steam.14 Primary energyconsumed in buildings and facilities in FY 2000 decreased 9.1 percent from FY 1985 and 0.7percent from FY 1999.
Table 5-B shows that agencies have decreased site-delivered energy consumption in buildings by 22.6percent, from 422.3 trillion Btu in FY 1985 to 326.8trillion Btu in FY 2000. Y 1999shows a decrease of 2.1 percent in total buildingsenergy consumption.
Of the 29 agencies represented on the tables for FY2000, 11, including DOD, consume approximately97 percent of the reported buildings energy use. Energy used in buildings accounts forapproximately 33.3 percent of the total 0.98 quadsused by the Federal Government. ofFederal buildings energy use for Defense and civilian agencies is depicted in Figure 5. ctricity
In
I
E
The
Howe
A comparison to F
The mixEle

TABLE 5-AFEDERAL PRIMARY ENERGY CONSUMPTION IN STANDARD BUILDINGS
(In Billions of Btu, with Conversions to Millions of Barrels of Oil Equivalent [MBOE], and Petajoules [Joule x 1015])
CIVILIAN FY FY FY FY FY FY FY FY FY FY FY FY %Change %ChangeAGENCY 1985 1990 1991 1992 1993 1994 1995 1996 1997 1998 1999 2000 85-00 99-00
USPS 35,915.2 42,631.6 43,820.8 45,472.7 49,064.6 50,297.9 51,256.8 53,195.9 48,869.8 50,939.9 52,058.2 58,913.2 64.0 13.2VA 39,673.2 40,902.8 41,915.5 41,740.0 42,540.0 43,113.2 43,556.3 44,780.8 45,068.6 45,496.7 45,731.8 45,527.5 14.8 -0.4DOE 53,567.0 50,827.2 49,154.4 52,211.1 53,011.7 51,148.3 49,739.6 49,759.9 46,277.4 45,107.4 43,445.8 41,629.3 -22.3 -4.2GSA 36,001.5 28,471.0 31,461.5 31,129.0 31,050.0 30,558.4 29,845.2 31,186.6 31,339.2 31,278.2 31,527.5 28,241.8 -21.6 -10.4DOJ 8,531.9 8,692.4 11,106.3 8,464.4 11,128.5 10,588.5 10,996.1 13,343.0 13,678.7 14,132.4 14,696.6 16,987.3 99.1 15.6NASA 7,995.0 9,647.3 9,770.6 9,621.1 9,716.0 9,655.0 10,189.9 10,392.7 10,252.1 10,266.3 9,959.5 9,848.7 23.2 -1.1DOT 7,857.2 6,601.8 6,104.4 7,677.4 7,954.1 7,736.2 8,377.2 8,397.2 8,691.9 7,865.2 7,808.8 7,631.1 -2.9 -2.3DOI 7,879.7 6,985.2 7,160.1 6,270.2 7,660.0 7,537.0 7,028.1 5,690.7 6,665.0 6,862.1 6,949.6 7,457.8 -5.4 7.3ST 1 6,209.8 6,323.1 6,347.8 747.0 119.9 212.2 230.4 706.0 6,531.3 6,532.6 6,173.0 6,388.4 2.9 3.5USDA 4,008.4 4,937.7 5,109.3 4,855.2 4,985.2 4,785.1 4,657.8 4,831.6 4,293.5 4,538.2 4,045.5 4,416.3 10.2 9.2DOL 3,455.8 3,603.6 3,521.9 3,555.5 3,681.6 3,749.7 3,635.3 3,756.8 3,786.9 3,818.4 2,986.9 3,988.1 15.4 33.5TVA 1,180.5 1,260.5 1,270.9 1,269.4 1,308.1 1,988.7 2,202.4 2,133.7 2,007.6 1,981.0 1,959.6 1,861.4 57.7 -5.0TRSY 1,560.2 672.0 3,933.6 4,350.4 3,843.4 3,936.9 3,399.3 3,287.8 4,363.8 4,126.0 4,172.5 1,297.3 -16.8 -68.9DOC 1,092.9 855.4 2,945.7 1,340.6 1,499.9 1,851.9 1,231.1 1,190.5 1,175.6 1,090.5 1,125.3 1,094.0 0.1 -2.8HHS 603.9 653.9 578.6 546.9 550.1 495.9 525.2 520.0 508.9 477.9 465.7 518.2 -14.2 11.3HUD 315.2 384.2 374.3 345.2 314.4 293.4 285.2 301.4 289.7 279.9 286.8 286.8 -9.0 0.0FCC 26.7 37.0 39.3 30.6 31.7 35.5 35.5 28.8 28.8 28.8 28.8 10.1 -62.4 -65.1PCC 80.8 86.7 98.3 91.2 98.5 95.2 96.9 98.4 102.8 0.0 0.0 0.0 -100.0 N/AOTHER* 859.4 1,398.8 974.4 961.2 945.5 932.2 2,772.5 4,551.1 4,792.4 4,568.8 4,805.5 4,705.9 447.6 -2.1
CIVILIAN AGENCIESTOTAL 216,814.1 214,972.2 225,687.9 220,679.3 229,503.3 229,011.3 230,060.9 238,152.9 238,724.1 239,390.3 238,227.3 240,803.2 11.1 1.1
DOD 475,614.7 541,109.0 487,672.6 489,972.8 486,658.5 466,182.5 441,755.4 419,879.3 405,417.0 397,287.8 395,675.6 388,867.4 -18.2 -1.7
ALL AGENCIES 692,428.8 756,081.2 713,360.5 710,652.1 716,161.8 695,193.8 671,816.3 658,032.2 644,141.1 636,678.1 633,902.8 629,670.6 -9.1 -0.7 MBOE 118.9 129.8 122.5 122.0 122.9 119.3 115.3 113.0 110.6 109.3 108.8 108.1 Petajoules 730.5 797.6 752.6 749.7 755.5 733.4 708.7 694.2 679.5 671.7 668.7 664.3
DATA AS OF 11/30/01 *Other includes for certain years the CFTC, CIA, EEOC, FEMA, FTC, NARA, NSF, NRC, OPM, RRB, SSA, USIA/IBB, and FERC. Note: This table uses a conversion factor for electricity of 10,346 Btu per kilowatt hour and 1,390 Btu per pound of steam. Contains estimated data for the following agencies: FEMA (1997, 1998), FCC (1997, 1998, 1999), FTC (1997, 1998, 1999), and OPM. (1997, 1998, 1999, 2000). Sum of components may not equal total due to independent rounding.
1In 1998, the State Department developed a statistical method for estimating the energy consumption in the large number of foreign buildings it owns and leases. This method was subsequently applied to estimate FY 1991 energy consumption and is now used annually to assess progress. The FY 1991 foreign building estimates were combined with domestic building data for the fiscal years 1985 and 1990, since these are base years for performance goals.
Source: Federal Agency Annual Energy Management Data Reports
52

TABLE 5-BFEDERAL SITE-DELIVERED ENERGY CONSUMPTION IN STANDARD BUILDINGS
(In Billions of Btu, with Conversions to Millions of Barrels of Oil Equivalent [MBOE], and Petajoules [Joule x 1015])
CIVILIAN FY FY FY FY FY FY FY FY FY FY FY FY %Change %ChangeAGENCY 1985 1990 1991 1992 1993 1994 1995 1996 1997 1998 1999 2000 85-00 99-00
VA 24,552.0 24,380.1 24,733.0 24,620.0 25,077.2 25,213.4 25,075.4 26,172.3 26,062.0 26,216.9 26,134.8 26,120.6 6.4 -0.1USPS 16,238.3 18,480.0 18,620.8 19,449.2 21,159.8 21,602.2 21,649.7 22,210.0 22,006.4 22,683.9 23,127.0 25,238.3 55.4 9.1DOE 32,757.8 29,149.5 28,077.6 29,564.3 30,546.8 29,193.0 28,011.6 25,987.3 23,746.2 23,126.7 21,730.4 20,611.8 -37.1 -5.1GSA 15,897.7 11,174.5 13,116.3 13,061.4 13,075.2 12,832.9 12,366.7 13,439.4 13,353.7 13,123.7 13,083.9 11,728.0 -26.2 -10.4DOJ 6,112.0 4,863.8 5,894.3 3,869.2 6,245.8 6,143.9 6,303.9 7,490.6 8,003.7 7,783.0 8,047.1 9,374.6 53.4 16.5NASA 3,781.0 4,383.3 4,342.8 4,290.7 4,235.7 4,161.0 4,383.6 4,438.1 4,350.9 4,404.9 4,304.0 4,280.7 13.2 -0.5DOI 4,762.4 4,039.4 3,886.2 3,173.4 3,974.3 3,922.1 3,596.3 2,979.1 3,668.5 3,747.4 3,794.6 4,006.6 -15.9 5.6DOT 4,561.2 3,750.4 3,297.6 3,918.0 3,886.6 3,903.0 3,912.2 3,961.1 3,870.3 3,691.4 3,735.2 3,608.8 -20.9 -3.4ST1 2,756.9 2,792.5 2,799.0 273.8 45.3 82.9 92.9 289.2 2,894.1 2,893.3 3,012.2 2,892.7 4.9 -4.0DOL 2,153.0 2,137.1 2,044.1 2,063.7 2,145.8 2,158.3 2,028.8 2,153.9 2,153.9 2,190.2 1,697.9 2,111.8 -1.9 24.4USDA 2,096.3 2,363.0 2,342.4 2,151.6 2,234.8 2,164.5 2,083.1 2,261.3 1,996.0 2,111.1 1,901.8 2,052.5 -2.1 7.9TVA 402.4 427.8 426.6 425.6 439.8 664.0 748.5 728.4 665.6 658.4 650.8 617.7 53.5 -5.1TRSY 713.4 396.0 1,494.7 1,749.1 1,568.0 1,624.7 1,418.3 1,484.9 1,904.4 1,741.2 1,815.0 530.0 -25.7 -70.8DOC 540.3 399.4 1,406.9 531.0 571.9 752.9 494.9 490.1 457.2 429.9 449.4 437.0 -19.1 -2.8HHS 253.0 273.1 224.5 215.8 214.1 172.1 201.7 204.7 200.1 188.8 184.8 212.3 -16.1 14.8HUD 116.9 140.3 132.2 123.1 116.2 113.5 105.9 115.4 109.3 103.1 106.3 106.3 -9.1 0.0FCC 11.2 14.8 14.9 12.4 12.9 14.1 14.1 12.8 12.8 12.8 12.8 5.1 -54.6 -60.3PCC 26.6 28.6 32.4 30.1 32.5 31.4 31.9 32.4 33.9 0.0 0.0 0.0 -100.0 N/AOTHER* 369.0 616.7 421.6 429.6 426.0 403.9 1,189.7 1,884.6 1,989.1 1,898.7 1,969.9 1,941.2 426.1 -1.5
CIVILIAN AGENCIESTOTAL 118,101.4 109,810.3 113,307.9 109,951.7 116,008.6 115,153.9 113,708.9 116,335.5 117,478.1 117,005.2 115,757.8 115,876.1 -1.9 0.1
DOD 304,190.0 321,101.6 286,885.7 295,719.8 279,726.5 262,661.5 247,166.9 235,688.1 227,070.0 220,567.6 217,958.2 210,965.0 -30.6 -3.2
ALL AGENCIES 422,291.4 430,911.9 400,193.6 405,671.4 395,735.1 377,815.4 360,875.9 352,023.7 344,548.1 337,572.8 333,715.9 326,841.1 -22.6 -2.1 MBOE 72.5 74.0 68.7 69.6 67.9 64.9 62.0 60.4 59.1 58.0 57.3 56.1 Petajoules 445.5 454.6 422.2 428.0 417.5 398.6 380.7 371.4 363.5 356.1 352.1 344.8
DATA AS OF 11/30/01 *Other includes for certain years the CFTC, CIA, EEOC, FEMA, FTC, NARA, NSF, NRC, OPM, RRB, SSA, USIA/IBB, and FERC. Note: This table uses a conversion factor for electricity of 3,412 Btu per kilowatt hour. Contains estimated data for the following agencies: FEMA (1997, 1998), FCC (1997, 1998, 1999), FTC (1997, 1998, 1999), and OPM. (1997, 1998, 1999, 2000). Sum of components may not equal total due to independent rounding.
1In 1998, the State Department developed a statistical method for estimating the energy consumption in the large number of foreign buildings it owns and leases. This method was subsequently applied to estimate FY 1991 energy consumption and is now used annually to assess progress. The FY 1991 foreign building estimates were combined with domestic building data for the fiscal years 1985 and 1990, since these are base years for performance goals.
Source: Federal Agency Annual Energy Management Data Reports
53

constitutes 44.7 percent (146.2 trillion Btu) of Federal buildings energy use; 33.9 percent is accounted for by natural gas (110.8 trillion Btu), and 9.7 percent by fuel oil (31.8 trillion Btu). Coal, purchased steam, liquefied petroleum gas (LPG)/propane, and energy reported as “other” (comprised mainly of chilled water), account for the remaining 11.6 percent.
Figure 6 illustrates the proportion of energy consumption in buildings and facilities that is attributable to electricity for FY 1985 through FY 2000. The figure also breaks out the amount of Btu lost through the generation and transmission processes and amount of Btu delivered to the site. In FY 2000, electricity consumption, including energy used at the source of generation,
FIGURE 6Consumption of Electricity and Other Fuels in Standard Buildings,
FY 1985 through FY 2000
900
800
700
600
500
400
300
200
100
0
294 311 324 308 288 279 253 266 247 230 216 212 206 199 195 186
131 139 149
142 157 157 152 147 155 153 150 147 144 144 145 146
267 283
302 289 319 320
308 298 314 312
305 299 293 293 294 297
85 86 87 88 89 90 91 92 93 94 95 96 97 98 99 00 FISCAL YEAR
Non-Electric Fuels1 Site Electricity2 Conversion Losses3
1Includes Fuel Oil, Natural Gas, LPG/Propane, Coal, Purchased Steam, and Other. Uses a conversion factor for steam of 1,390 Btu per pound (source conversion).
2Uses a conversion factor of 3,412 Btu per kilowatt hour. Amount of energy which reaches the site of use when generation and transmission losses are subtracted.
3Amount of energy lost through generation and transmission processes. When added to amount of energy reaching the point of use, the total equals amount of Btu consumed at the source. The source conversion factor is 10,346 Btu per kilowatt hour.
Source: Federal Agency Annual Energy Management Data Reports
TRIL
LIO
NS
OF
BTU
54

accounted for approximately 70.4 percent (443,296.3 billion Btu) of the total primary Btu used inbuildings and facilities (629,670.6 billion Btu; see Table 5-A). Of this amount, 33.0 percent or146.2 trillion Btu reached the site of use. The remaining 67.0 percent, 297.1 trillion Btu, was lostduring the generation and transmission processes. Decreases in consumption relative to FY 1999were seen in fuel oil (7.3 percent), natural gas (5.7 percent), and purchased steam (6.5 percent). Increases from the previous year were seen in electricity (1.0 percent), coal (7.0 percent),LPG/propane (4.1 percent), and in fuels reported under the category of “other” (33.3 percent).
The mix of fuels consumed by Government buildings has changed notably from FY 1985through FY 2000. The actual consumption of electricity in FY 2000 increased 11.2 percent sinceFY 1985. The proportion of energy consumed in Federal buildings and facilities that iselectricity has increased from 31.1 percent in FY 1985 to 44.7 percent in FY 2000. Over thesame period, fuel oil use decreased from 22.3 percent of the total in FY 1985 to only 9.7 percentin FY 2000. The portion of the Federal buildings fuel mix comprised by natural gas hasincreased from 30.6 percent in FY 1985 to 33.9 percent in FY 2000. The use of coal as a fuelsource, which accounted for 12.4 percent of the total energy consumed in FY 1985, has declinedto 5.9 percent of the total in FY 2000. Contributing to this has been the practice of agencies,such as DOE, to purchase steam rather than generating their own in coal-fired plants.
As shown in Table 6 the consumption of petroleum-based fuels in buildings during FY 2000decreased 65.1 percent compared to FY 1985 and 6.7 percent from FY 1999. Efforts by agenciesto utilize natural gas as a cost-effective substitute for petroleum-based fuels in buildings, as wellas conservation of fuel oil and LPG/propane in buildings contributed to these reductions. Petroleum fuel consumption in buildings during FY 2000 represented only 10.4 percent of allenergy consumed in Federal buildings. Of this amount, 93.6 percent is attributed to fuel oil andthe remaining 6.4 percent to LPG/propane.
The energy used in buildings in FY 2000 accounted for approximately 46.0 percent of the totalFederal energy bill. Tables 7-A and 7-B show that the Federal Government spent approximately$3,390.2 million for buildings energy during the fiscal year, a decrease in constant dollars ofapproximately $61.3 million from FY 1999 expenditures. The combined cost of buildingsenergy in FY 2000 was $10.37 per million Btu,up 0.3 percent from the combined cost of $10.34 FIGURE 7reported in FY 1999. Energy Costs in Standard Buildings
FY 1985 through FY 2000 Figure 7 illustrates energy expenditures for $6.0
buildings and facilities from FY 1985 through FY $5.02000. In constant 2000 dollars, Federal energy
costs for buildings and facilities decreased 35.3 $4.0
percent from $5,240.7 million in FY 1985 to $3.0
$3,390.2 million in FY 2000. The combined cost for buildings energy in constant dollars in FY $2.0
2000 was $10.39 per million Btu, down 16.4 $1.0
percent from $12.41 per million Btu in FY 1985. $0.0
3.4 3.5 3.6 3.7 3.8 3.9 4.2 4.4 4.2
4.5 4.8
4.4 4.8
5.3 5.3 5.2
BIL
LIO
NS
OF
CO
NST
AN
T 20
00 D
OLL
AR
S
85 86 87 88 89 90 91 92 93 94 95 96 97 98 99 00 FISCAL YEAR
Electricity Fuel Oil Natural Gas Other
55

TABLE 6 PETROLEUM-BASED FUEL* CONSUMPTION IN STANDARD BUILDINGS
(In Billions of Btu)
CIVILIAN FY FY FY FY FY FY FY FY FY FY FY FY %Change %Change AGENCY 1985 1990 1991 1992 1993 1994 1995 1996 1997 1998 1999 2000 85-00 99-00
DOD 84,366.6 69,030.1 59,451.5 65,654.1 55,585.9 50,285.7 42,939.0 42,861.7 35,214.4 32,354.5 30,506.7 27,982.5 -66.8 -8.3 VA 2,176.7 2,219.3 1,404.9 1,506.0 1,533.9 1,827.4 1,292.9 2,098.2 1,186.3 954.6 954.8 1,045.4 -52.0 9.5 USPS 1,673.2 1,502.2 1,219.4 1,195.8 988.8 983.7 813.9 595.2 819.0 1,139.4 821.7 857.9 -48.7 4.4 DOT 2,376.9 1,524.1 1,308.4 1,426.0 854.0 1,001.6 911.7 709.2 670.5 816.8 823.9 814.7 -65.7 -1.1 ST 817.8 817.8 817.8 0.0 0.0 0.0 0.0 21.8 706.0 706.0 1,098.0 774.2 -5.3 -29.5 DOE 1,650.8 1,900.5 2,063.7 2,042.7 1,943.5 1,924.4 1,973.5 1,554.1 1,394.0 1,174.5 646.5 769.1 -53.4 19.0 DOI 1,591.6 1,273.9 1,141.1 919.1 1,181.9 1,560.6 1,574.3 1,177.7 799.6 964.7 835.1 996.7 -37.4 19.4 DOL 437.8 331.2 258.3 263.6 276.1 277.5 210.8 220.6 254.2 226.1 188.9 193.2 -55.9 2.3 DOJ 381.7 371.6 503.7 383.8 250.8 234.8 182.8 234.3 134.9 103.1 115.0 129.5 -66.1 12.7 NASA 334.1 495.6 428.4 449.0 318.4 291.8 166.8 132.2 83.6 100.0 88.4 77.7 -76.7 -12.0 GSA 944.2 668.1 443.1 418.2 359.4 379.8 199.0 242.3 143.0 54.8 68.4 68.2 -92.8 -0.3 TRSY 22.5 138.4 127.7 84.2 190.5 160.8 116.6 116.2 57.0 44.8 60.3 64.3 186.4 6.8 CIA 0.0 0.0 0.0 0.0 0.0 0.0 49.6 87.9 84.6 60.2 53.6 57.0 0.0 6.3 FEMA 56.7 72.3 59.1 66.9 67.6 49.1 49.1 49.1 49.1 49.1 30.6 32.2 -43.2 5.3 USDA 414.2 260.0 291.3 242.9 255.6 236.3 244.1 242.5 272.2 270.6 114.1 122.8 -70.4 7.6 DOC 130.3 22.5 13.1 9.8 23.8 52.4 10.8 33.4 9.3 8.7 6.1 5.3 -95.9 -12.6 SSA 0.0 0.0 0.0 0.0 0.0 0.0 0.0 8.2 11.8 8.9 3.5 3.4 N/A -3.2 TVA 4.2 3.2 0.1 1.3 2.7 3.5 3.9 4.1 0.0 3.0 2.9 1.9 -55.3 -34.8 FCC 1.7 1.9 1.0 1.3 1.3 1.3 1.3 1.7 1.7 1.7 1.7 0.2 -91.2 -91.3 HHS 34.5 39.3 29.8 34.5 31.3 0.0 0.0 2.9 1.9 1.9 1.9 0.0 -100.0 -100.0 EEOC 0.0 1.9 0.0 0.0 0.0 0.0 0.0 0.0 0.0 0.0 0.0 0.0 N/A N/A NSF 19.4 9.5 0.0 0.0 0.0 0.0 0.0 0.0 0.0 0.0 0.0 0.0 -100.0 N/A USIA/IBB 0.0 0.0 0.0 0.3 0.0 0.0 0.0 0.0 0.0 0.0 0.0 0.0 N/A N/A
TOTAL 97,435.0 80,683.4 69,562.2 74,699.6 63,865.5 59,270.7 50,740.0 50,393.3 41,893.3 39,043.6 36,421.9 33,996.3 -65.1 -6.7
DATA AS OF 11/30/01 *Petroleum-based fuels include fuel oil and LPG/propane. Note: Contains estimated data for the following agencies: FEMA (1997, 1998), FCC (1997, 1998, 1999), FTC (1997, 1998, 1999), and OPM. (1997, 1998, 1999, 2000). Sum of components may not equal total due to independent rounding.1In 1998, the State Department developed a statistical method for estimating the energy consumption in the large number of foreign buildings it owns and leases. This method was subsequently applied to estimate FY 1991 energy consumption and is now used annually to assess progress. The FY 1991 foreign building estimates were combined with domestic building data for the fiscal years 1985 and 1990, since these are base years for performance goals.
Source: Federal Agency Annual Energy Management Data Reports
56

TABLE 7-ADEFENSE AND CIVILIAN FEDERAL COSTS FOR STANDARD BUILDINGS ENERGY
IN FY 2000 (In Millions of Dollars)
ELECTRICITY FUEL OIL NATURAL LPG/ COAL PURCHASED OTHER TOTAL GAS PROPANE STEAM
DEFENSE 1,441.793 120.958 303.670 12.424 35.036 117.777 0.604 2,032.261 CIVILIAN 1,067.849 33.734 186.258 5.188 4.199 52.832 7.844 1,357.905
TOTAL 2,509.642 154.692 489.928 17.611 39.235 170.609 8.449 3,390.166
AVERAGE COST PER UNIT, BASED ON REPORTS FROM AGENCIES
ELECTRICITY = 58.57 / MWH FUEL OIL = 0.67 / GALLON NATURAL GAS = 4.56 / THOUSAND CUBIC FEET LPG/PROPANE = 0.77 / GALLON COAL = 50.36 / SHORT TON PURCHASED STEAM = 11.62 / MILLION BTU OTHER = 4.17 / MILLION BTU
DATA AS OF 11/30/01
Note: Contains estimated data for the following agencies: NSF and OPM. Sum of components may not equal total due to independent rounding.
Source: Federal Agency Annual Energy Management Data Reports.
57

TABLE 7-BCONSUMPTION AND COSTS OF FEDERAL BUILDINGS ENERGY
BY FUEL TYPE IN FY 2000, FY 1999, AND FY 1985 (Constant 2000 Dollars)
ENERGY TYPE
FY 2000 ELECTRICITYFUEL OILNATURAL GASLPG/PROPANECOALPURCHASED STEAMOTHER
TOTAL
BILLIONS OF BTU
146,194.4 31,811.0
110,787.8 2,185.2
19,151.8 14,686.1 2,024.8
326,841.1
AVERAGE COST PER MMBTU = $10.373
FY 1999 ELECTRICITYFUEL OILNATURAL GASLPG/PROPANECOALPURCHASED STEAMOTHER
TOTAL
144,699.4 34,322.6
117,468.9 2,099.4
17,906.9 15,700.1 1,518.7
333,715.9
AVERAGE COST PER MMBTU = $10.343
FY 1985 ELECTRICITYFUEL OILNATURAL GASLPG/PROPANECOALPURCHASED STEAMOTHER
TOTAL
131,475.4 94,258.3
129,222.5 3,176.6
52,397.2 7,558.8 4,202.6
422,291.4
COST PER MMBTU
17.1665 4.8628 4.4222 8.0593 2.0486
11.6171 4.1725
17.4684 5.0960 3.9714 8.8344 2.1151
13.8309 5.7884
24.2720 8.6595 6.7038
10.0444 3.3700
17.0447 7.0538
COST (IN MILLIONS OF DOLLARS)
2,509.640 154.692 489.928 17.611 39.235
170.609 8.449
3,390.170
2,527.669 174.907 466.521 18.547 37.876
217.147 8.791
3,451.459
3,191.167 816.234 866.280 31.907
176.581 128.837 29.644
5,240.650
AVERAGE COST PER MMBTU = $12.411
DATA AS OF 11/30/01
Note: FY 1999 contains estimated data for: FCC, FTC, and OPM. FY 2000 contains estimated data for: NSF and OPM.
This table uses a conversion factor for electricity of 3,412 Btu per kilowatt hour. Sum of components may not equal total due to independent rounding.
Source: Federal Agency Annual Energy Management Data Reports
58

Electricity costs of $2,509.6 million represent approximately 74.0 percent of total expenditures of $3,390.2 million for buildings energy in FY 2000. Natural gas costs account for approximately 14.5 percent of the total, expenditures for fuel oil account for 4.6 percent, with the remaining 7.0 percent attributable to expenditures for LPG/propane, coal, purchased steam, and “other.”
In FY 2000, the cost of all energy used in Federal buildings was $1.11 per gross square foot. Of the $1.11 spent per square foot Government-wide, $0.82 was spent for electricity, $0.16 was spent for natural gas, $0.05 was spent for fuel oil, and the remaining $0.08 was spent for purchased steam, coal, LPG/propane, and other fuels.
B. Progress Toward the Mandated Goals for Buildings and Facilities
Both the magnitude of energy consumption and the potential for energy savings have prompted legislative and executive branch initiatives to achieve energy conservation in the Federal buildings sector.15 Federal Government progress toward the 10, 20, and 30 percent energy reduction goals of NECPA and Executive Order 13123 is illustrated in Figure 8.
FIGURE 8 Progress Toward the Energy Reduction Goals for Federal Standard Buildings
FY 1985 through FY 2000
145,000
140,000
135,000
130,000
125,000
120,000
115,000
110,000
105,000
100,000
95,000 85 86 87 88 89 90 91 92 93 94 95 96 97 98 99 00 01 02 03 04 05
10% Goal - 1995
20% Goal - 2000
30% Goal - 2005
Actual Energy Use
23.6% Reduction, 2000
FISCAL YEAR
Btu
per
Gro
ss S
quar
e Fo
ot
15The legislative authorities for Federal agencies are detailed in Appendix A.
59

(Executive Order 13123 also establishes a 35 percent reduction goal for 2010.) Overall, the Federal Government reduced its site-delivered energy consumption in buildings and facilities by 23.6 percent in FY 2000 compared to FY 1985 when measured in terms of British Thermal Units consumed per gross square foot (Btu/GSF) of floor area.
Table 8-A shows the FY 2000 performance of the individual agencies in site-delivered Btu/GSF compared to FY 1985. Site-delivered Btu reflects the amount of energy delivered to the point of use and is used to measure agency performance toward the mandated goals.
Table 8-B shows the performance of the agencies measured in terms of primary Btu/GSF. Primary Btu represents the average amount of energy required at the source of generation (primary energy) rather than the actual Btu delivered to the site. Primary Btu includes energy resources used to generate, process, and transport electricity and steam. Measured in terms of source energy, the Federal Government shows a reduction of 9.9 percent in FY 2000 compared to FY 1985. This large difference from the site-delivered Btu/GSF reduction of 23.6 percent reflects the significant declines in direct use of fossil fuels and the offsetting increases in the share of the fuel mix contributed by electricity.
Contributing to the overall reduction of 23.6 percent in site-delivered Btu/GSF were the percentage reductions greater than 20 percent made by the following nine agencies: the Departments of Agriculture, Commerce, Defense, Energy, Justice, Transportation, GSA, the National Aeronautics and Space Administration, and the Tennessee Valley Authority. The progress of each agency toward the goal for standard buildings is illustrated in Figure 9.
The Social Security Administration is shown in the Figure 9 with an increase in Btu/GSF of 9.4 percent (-9.4 percent reduction). This is based on a base year of FY 1996 rather than FY 1985, since SSA was not delegated control of all of its buildings until that date. (Because of this SSA’s data for FY 2000 is included in the “Other” line in Tables 8-A and 8-B.) SSA’s Btu/GSF rose from 87,367 in FY 1996 to 95,565 in FY 2000 for its 8.8 million square feet of space.
The agencies used a variety of strategies to reduce their energy consumption. Operations and maintenance (O&M) procedures continued to be emphasized as a major component in the effort to achieve the energy reduction goals. Improvements in energy efficiency were achieved through improved energy systems operations and both preventive maintenance and improved maintenance. O&M funding, used for the replacement of boilers, HVAC equipment, windows, and lighting systems, continued to benefit energy conservation.
In FY 2000, the implementation of many no-cost and low-cost energy conservation measures was continued, such as reducing lighting levels, lowering hot water temperatures, turning off unused equipment, and installing energy-efficient windows, insulation, weather stripping, and set-back thermometers.
60

TABLE 8-AFEDERAL STANDARD BUILDINGS SITE-DELIVERED ENERGY USE
PER GROSS SQUARE FOOT, FY 1985 AND FY 2000
FISCAL YEAR 1985 FISCAL YEAR 2000
GSF BTU GSF BTU %CHANGE (Thousands) (Billions) BTU/GSF (Thousands) (Billions) BTU/GSF 1985-2000
VA 123,650.0 24,552.0 198,560 155,445.0 26,120.6 168,037 -15.4 USPS 189,400.0 16,238.3 85,736 339,707.2 25,238.3 74,194 † -13.5 DOE 73,836.1 32,757.8 443,656 82,454.0 20,611.8 249,969 † -43.7 GSA 189,976.9 15,897.7 83,682 175,535.6 11,728.0 66,791 † -20.2 DOJ 20,768.8 6,112.0 294,289 53,714.5 9,374.6 174,527 -40.7 NASA 14,817.5 3,781.0 255,171 21,104.1 4,280.7 202,838 -20.5 DOI 54,154.4 4,762.4 87,940 51,535.8 4,006.6 77,720 † -11.6 DOT 32,312.4 4,561.2 141,158 36,160.3 3,608.8 99,800 -29.3 ST 44,674.4 2,756.9 61,711 47,642.4 2,892.7 60,717 -1.6 DOL 18,268.3 2,153.0 117,852 20,503.5 2,111.8 102,999 -12.6 USDA 24,709.9 2,096.3 84,837 31,404.0 2,052.5 65,259 † -23.1 TVA 4,886.6 402.4 82,357 10,286.9 617.7 59,995 † -27.2 TRSY 7,182.6 713.4 99,317 6,065.4 530.0 87,384 -12.0 DOC 4,522.6 540.3 119,476 5,545.1 437.0 78,814 -34.0 HHS 2,649.8 253.0 95,491 2,692.8 212.3 78,829 -17.4 HUD 1,432.0 116.9 81,668 1,432.0 106.3 74,235 -9.1 OTHER* 3,172.0 406.8 128,249 15,692.7 1,946.3 124,025 -3.3
CIVILIAN AGENCIES TOTAL 810,414.3 118,101.4 145,730 1,056,921.3 115,876.1 109,594 † -24.8
DOD 2,224,527.3 304,190.0 136,744 2,004,828.5 210,965.0 104,543 † -23.5
TOTAL 3,034,941.6 422,291.4 139,143 3,061,749.8 326,841.1 106,287 † -23.6
DATA AS OF 11/30/01
*Other includes the Federal Communications Commission, Federal Trade Commission, Federal Emergency Management Agency, National Archives and Records Administration, National Science Foundation, Nuclear Regulatory Commission, Office of Personnel Management, Panama Canal Commission, Railroad Retirement Board, Social Security Administration, the U.S. Information Agency, and the Federal Energy Regulatory Commission.
†Indicates where reductions were made to Btu/GSF to reflect purchases of renewable energy. When calculating Btu/GSF, the following amounts were subtracted from agency energy use shown above for FY 2000: DOD, 1,373.4 BBtu; USPS, 34.1 BBtu; DOE, 0.9 BBtu; GSA, 3.8 BBtu; DOI, 1.2 BBtu; USDA, 3.1 BBtu; and TVA, 0.5 BBtu.
Note: This table uses a conversion factor for electricity of 3,412 Btu per kilowatt hour. Sum of components may not equal total due to independent rounding.
Source: Federal Agency Annual Energy Management Data Reports
61

TABLE 8-BFEDERAL STANDARD BUILDINGS PRIMARY ENERGY USE
PER GROSS SQUARE FOOT, FY 1985 AND FY 2000
FISCAL YEAR 1985 FISCAL YEAR 2000
GSF BTU GSF BTU %CHANGE (Thousands) (Billions) BTU/GSF (Thousands) (Billions) BTU/GSF 1985-2000
USPS 189,400.0 35,915.2 189,626 339,707.2 58,913.2 173,423 -8.5 VA 123,650.0 39,673.2 320,851 155,445.0 45,527.5 292,885 -8.7 DOE 73,836.1 53,567.0 725,485 82,454.0 41,629.3 504,879 -30.4 GSA 189,976.9 36,001.5 189,504 175,535.6 28,241.8 160,889 -15.1 DOJ 20,768.8 8,531.9 410,805 53,714.5 16,987.3 316,253 -23.0 NASA 14,817.5 7,995.0 539,563 21,104.1 9,848.7 466,672 -13.5 DOT 32,312.4 7,857.2 243,165 36,160.3 7,631.1 211,036 -13.2 DOI 54,154.4 7,879.7 145,504 51,535.8 7,457.8 144,710 -0.5 ST 44,674.4 6,209.8 139,002 47,642.4 6,388.4 134,090 -3.5 USDA 24,709.9 4,008.4 162,218 31,404.0 4,416.3 140,629 -13.3 DOL 18,268.3 3,455.8 189,167 20,503.5 3,988.1 194,507 2.8 TVA 4,886.6 1,180.5 241,575 10,286.9 1,861.4 180,951 -25.1 TRSY 7,182.6 1,560.2 217,217 6,065.4 1,297.3 213,889 -1.5 DOC 4,522.6 1,092.9 241,648 5,545.1 1,094.0 197,292 -18.4 HHS 2,649.8 603.9 227,888 2,692.8 518.2 192,434 -15.6 HUD 1,432.0 315.2 220,090 1,432.0 286.8 200,300 -9.0 OTHER* 3,172.0 966.9 304,811 15,692.7 4,716.0 300,520 -1.4
CIVILIAN AGENCIES TOTAL 810,414.3 216,814.1 267,535 1,056,921.3 240,803.2 227,835 -14.8
DOD 2,224,527.3 475,614.7 213,805 2,004,828.5 388,867.4 193,965 -9.3
TOTAL 3,034,941.6 692,428.8 228,152 3,061,749.8 629,670.6 205,657 -9.9
DATA AS OF 11/30/01
*Other includes the Federal Communications Commission, Federal Trade Commission, Federal Emergency Management Agency, National Archives and Records Administration, National Science Foundation, Nuclear Regulatory Commission, Office of Personnel Management, Panama Canal Commission, Railroad Retirement Board, Social Security Administration, the U.S. Information Agency, and the Federal Energy Regulatory Commission.
Note: This table uses a conversion factor for electricity of 10,346 Btu per kilowatt hour and 1,390 Btu per pound of steam. Sum of components may not equal total due to independent rounding.
1In 1998, the State Department developed a statistical method for estimating the energy consumption in the large number of foreign buildings it owns and leases. This method was subsequently applied to estimate FY 1991 energy consumption and is now used annually to assess progress. The FY 1991 foreign building estimates were combined with domestic building data for the fiscal years 1985 and 1990, since these are base years for performance goals.
Source: Federal Agency Annual Energy Management Data Reports
62

FIGURE 9Progress of Individual Agencies Toward the Federal Reduction Goal for Standard Buildings
FY 2000 Compared to FY 1985
Age
ncy
-9.4%
1.6%
9.1%
11.6%
12.0%
12.6%
13.5%
15.4%
17.4%
20.2%
20.5%
23.1%
23.5%
27.2%
29.3%
40.7%
43.7%
34.0%
SSA
ST
HUD
DOI
TRSY
DOL
USPS
VA
HHS
GSA
NASA
USDA
DOD
TVA
DOT
DOC
DOJ
DOE
-10% -5% 0% 5% 10% 15% 20% 25% 30% 35% 40% 45%
FY 2000 Btu/Square Foot Reduction
Numerous energy-efficient building retrofits and energy conservation projects were undertaken to supplement the no-cost, low-cost measures. These initiatives can be categorized by lighting system replacement, HVAC equipment modernization, building envelope improvements, and other miscellaneous projects, such as installation of energy management control systems. Utility-sponsored demand side management programs were often pursued as supplemental sources of funding, as well as energy savings performance contract initiatives. Other activities include energy awareness programs featuring energy awareness seminars, the identification of no-cost or low-cost measures, the designation of building energy monitors, publication of materials promoting energy efficiency, the procurement of energy-efficient goods and products, increased maintenance training, and increased engineering assistance.
A number of agencies began submitting energy data to DOE starting in FY 1989 in compliance with NECPA as amended by the Federal Energy Management Improvement Act of 1988 (Pub. L. 100-615). Among these agencies are the Department of State, the Office of Personnel Management, and the Federal Energy Regulatory Commission. These three agencies submitted historical energy data back to FY 1985.
For FY 1990 and forward, Federal Energy Regulatory Commission energy consumption is reported as part of DOE and is therefore grouped under the category of “Other” for the years prior to FY 1990. Other agencies grouped under the category of “Other” in the tables had no
63

buildings data to report for FY 1985. These agencies include the Federal Trade Commission, the National Archives and Records Administration, the Nuclear Regulatory Commission, the Railroad Retirement Board, Social Security Administration, and the U.S. Information Agency. The National Science Foundation, Federal Emergency Management Agency, and Office of Personnel Management also are grouped under this category due to lack of reporting in more recent years.
In FY 2000, GSA continued to delegate building management authority to agencies that occupy buildings owned and operated by GSA. As a result, several agencies reported increased gross square footage and energy consumption relative to FY 1985, while GSA reported decreases in these categories during the same period. The GSA delegation accounts for the significant inter-year changes in energy consumption reported by various individual agencies. Two agencies, the Department of Health and Human Services and the Department of Commerce, adjusted their baseline year consumption and GSF figures during FY 1988 to reflect GSA delegations. DOC added the Jeffersonville Federal Center to its data reports, which greatly increased its gross square footage. In addition, three Commerce Bureaus, the Bureau of Economic Affairs, the National Technical Information Service, and the Patent and Trademark Office, all became eligible for reporting in FY 1989 as a result of leasing delegation.
64

III. INDUSTRIAL, LABORATORY, AND OTHER ENERGY INTENSIVE FACILITIES
A. Energy Consumption and Costs for Energy Intensive Facilities
NECPA, as amended, 42 U.S.C. § 8253, allows agencies to exclude from the buildings goal, facilities which house energy intensive activities. The energy consumed in these facilities is reported under the category of “industrial, laboratory, and other energy intensive facilities.”
The designation of these facilities is at the discretion of each agency. Currently, 16 agencies are excluding specific facilities from the NECPA goal and reporting them as energy intensive facilities under Executive Order 13123: the Departments of Agriculture, Commerce, Defense, Energy, Health and Human Services, Justice, State, and the Treasury, the Environmental Protection Agency, Federal Communications Commission, GSA, the National Aeronautics and Space Administration, the National Archives and Records Administration, the Social Security Administration, the Tennessee Valley Authority, and the U.S. Information Agency (now known as the International Broadcasting Bureau. Lists of the energy intensive facilities that have been identified by the agencies are included in Appendix D.
Table 9 shows that energy consumed in industrial, laboratory, and other energy intensive facilities have decreased 10.9 percent compared to FY 1990 and increased 8.0 percent from FY 1999. During FY 2000, the Department of Defense consumed 32.3 trillion Btu of this category’s energy, 48.2 percent of all energy used by the Federal Government in energy intensive facilities.
Some of the fluctuations in energy consumption in energy intensive facilities resulted from agencies changing data collection and reporting procedures. The Social Security Administration began reporting its energy separately from the Department of Health and Human Services in FY 1996 and has elected to designate check processing facilities as energy intensive. The Department of Justice commenced reporting energy consumption in its energy intensive facilities during FY 1994, but has not backed out the consumption for these facilities from the standard buildings category for previous years. NASA began reporting energy under this category in FY 1989 and has revised its prior year data to reflect the removal of its energy intensive facilities from the standard building category. GSA began reporting energy in excluded buildings in FY 1990 and has backed out this energy consumption from its FY 1985 standard buildings data. The Departments of Agriculture and Commerce both began excluding buildings where energy intensive activities occur in FY 1992. USDA revised all of its prior year buildings data back to FY 1985 to reflect the exclusion of the Agricultural Research Service. The Commerce Department revised its standard buildings data for FY 1985 and FY 1999 only to reflect the exclusion of its energy intensive facilities. The State Department and NARA began reporting energy in energy intensive facilities separately in FY 1993 and have not revised data for any prior years.
65

TABLE 9FEDERAL SITE-DELIVERED ENERGY CONSUMPTION IN ENERGY-INTENSIVE FACILITIES
(In Billions of Btu, with Conversions to Millions of Barrels of Oil Equivalent [MBOE], and Petajoules [Joule x 1015])
CIVILIAN FY FY FY FY FY FY FY FY FY FY FY %CHANGE %CHANGE AGENCY 1990 1991 1992 1993 1994 1995 1996 1997 1998 1999 2000 90-00 99-00
DOE 11,795.6 11,541.3 12,657.8 10,900.5 11,000.3 17,236.2 16,876.6 8,209.1 6,367.8 7,188.9 7,650.0 -35.1 6.4 HHS GSA 1
6,695.6 4,354.0
5,998.0 746.2
6,578.2 677.6
6,824.1 994.6
7,170.6 1,060.2
5,822.6 1,213.8
6,405.6 961.0
7,217.7 890.7
6,764.3 849.2
6,498.6 1,150.8
7,138.8 6.6 9.8 5,093.8 17.0 342.6
NASA 4,142.9 3,910.8 4,012.9 3,816.2 4,070.7 3,900.6 3,535.9 3,835.6 3,897.9 3,794.5 3,584.6 -13.5 -5.5 USDA 2,204.2 2,133.3 1,966.3 2,166.9 2,119.3 2,824.0 2,140.8 2,221.6 2,416.5 2,589.0 2,368.5 7.5 -8.5 TRSY 1,707.2 1,026.8 814.1 923.7 771.8 941.0 928.3 1,131.8 996.5 964.2 2,303.7 34.9 138.9 TVA 1,701.0 1,661.9 1,546.5 1,354.1 1,390.6 1,317.1 1,235.6 1,251.8 1,208.4 1,436.1 1,453.8 -14.5 1.2 DOC 976.6 0.0 976.6 770.8 1,110.2 1,627.4 1,823.0 1,335.2 1,332.0 1,400.4 1,315.8 34.7 -6.0 USIA/IBB 1,406.9 850.6 828.5 796.8 861.1 878.2 936.2 1,092.2 1,020.4 951.4 951.4 -32.4 0.0 EPA 747.0 822.4 839.7 894.1 943.3 1,020.9 1,023.5 1,012.1 1,022.7 1,170.2 940.3 25.9 -19.6 DOJ 0.0 0.0 0.0 0.0 668.4 707.8 944.1 846.9 850.7 862.8 862.2 N/A -0.1 NARA 81.9 82.2 88.8 274.7 610.7 792.2 562.9 572.7 591.8 582.1 544.6 565.3 -6.5 ST 0.0 0.0 0.0 337.4 339.4 344.4 364.1 339.1 324.2 315.5 273.3 N/A -13.4 SSA 0.0 0.0 0.0 0.0 0.0 0.0 215.5 204.7 211.4 199.1 237.5 N/A 19.3 FCC 0.0 0.0 0.0 0.0 0.0 0.0 0.0 0.0 0.0 0.0 6.3 N/A N/A PCC 190.8 197.1 193.9 197.5 201.3 209.4 218.6 221.2 0.0 0.0 0.0 -100.0 N/A
CIVILIAN AGENCIES TOTAL 36,003.5 28,970.5 31,180.9 30,251.3 32,317.7 38,835.4 38,171.9 30,382.2 27,853.9 29,103.8 34,724.2 -3.6 19.3
DOD 39,209.1 56,372.1 67,913.1 41,159.3 39,781.4 37,962.6 37,260.1 35,702.3 36,588.4 32,919.0 32,280.9 -17.7 -1.9
ALL AGENCIES 75,212.6 85,342.6 99,094.0 71,410.7 72,099.1 76,798.0 75,431.9 66,084.5 64,442.3 62,022.8 67,005.2 -10.9 8.0 MBOE 12.9 14.7 17.0 12.3 12.4 13.2 12.9 11.3 11.1 10.6 11.5 Petajoules 79.3 90.0 104.5 75.3 76.1 81.0 79.6 69.7 68.0 65.4 70.7
DATA AS OF 11/30/01 Note: This table uses a conversion factor for electricity of 3,412 Btu per kilowatt hour. Sum of components may not equal total due to independent rounding.
1 GSA’s large increase in energy reported under this category for FY 2000 compared to FY 1999 is a result of the agency reclassifying buildings from the standard buildings inventory for FY 1990 and FY 2000 without adjusting data for the intervening years.
Source: Federal Agency Annual Energy Management Data Reports
66

Energy used in energy intensive facilities accounts for approximately 6.8 percent of the total 0.98 quads used by the Federal Government. Electricity constitutes 48.4 percent of the energy used in energy intensive facilities, 32.4 percent is accounted for by natural gas, 5.3 percent by coal, and 9.9 percent by fuel oil. Small amounts of purchased steam, liquefied petroleum gas (LPG)/propane, and “other” energy account for the remaining 3.9 percent.
The energy used in energy intensive operations in FY 2000 accounted for approximately 8.3 percent of the total Federal energy bill. Table 10 shows that the Federal Government spent approximately $611.2 million for this category’s energy during the fiscal year. The combined cost of energy intensive facility energy in FY 2000 was $9.12 per million Btu, up 2.8 percent from the combined cost of $8.88 reported in FY 1999 (see Appendix C).
TABLE 10DEFENSE AND CIVILIAN FEDERAL COSTS FOR ENERGY INTENSIVE FACILITIES
ENERGY IN FY 2000 (In Millions of Dollars)
ELECTRICITY FUEL OIL NATURAL LPG/ COAL PURCHASED OTHER TOTAL GAS PROPANE STEAM
DEFENSE 185.597 16.068 34.096 0.631 6.101 4.549 0.187 247.228 CIVILIAN 285.800 12.377 49.815 1.065 0.109 13.825 0.970 363.962
TOTAL 471.397 28.445 83.911 1.696 6.210 18.374 1.157 611.190
AVERAGE COST PER UNIT, BASED ON REPORTS FROM AGENCIES
ELECTRICITY = 49.59 / MWHFUEL OIL = 0.59 / GALLONNATURAL GAS = 3.98 / THOUSAND CUBIC FEETLPG/PROPANE = 0.67 / GALLONCOAL = 42.59 / SHORT TONPURCHASEDSTEAM = 8.25 / MILLION BTUOTHER = 9.65 / MILLION BTU
DATA AS OF 11/30/01
Note: Sum of components may not equal total due to independent rounding.
Source: Annual energy cost data submitted to DOE by Federal agencies.
67

B. Statutory Background and Progress Toward Goals for Energy Intensive Facilities
Under section 543(a)(2) of NECPA, as amended by EPACT, 42 U.S.C. § 8253, buildings that house energy-intensive activities may be excluded from NECPA’s performance goal for buildings. These buildings are listed in Appendix D. Most energy used in excluded buildings is process energy. Process energy is consumed in industrial operations, laboratories certain R&D activities, and in electronic-intensive facilities.
Executive Order 12902 expanded the scope of Federal energy management activities beyond the NECPA mandates by establishing goals for industrial operations. It required industrial facilities to increase in energy efficiency by at least 20 percent by 2005 as compared to 1990. Section 203 of Executive Order 13123 further expands this goal by requiring each agency to reduce energy consumption per square foot, per unit of production, or per other unit as applicable by 20 percent by 2005 and 25 percent by 2010 relative to 1990. This goal covers laboratory and other energy-intensive facilities in addition to industrial facilities. Measures undertaken to achieve this goal must be life-cycle cost-effective, and agencies are also directed to implement all cost-effective water conservation projects.
During FY 1999, the Energy Intensive Facilities Working Group worked to produce a guidance document entitled Guidelines: Executive Order 13123, Section 203 Performance Goals for Industrial, Laboratory, Research, and Other Energy-Intensive Facilities. The document was reviewed and approved by the Interagency Energy Management Task Force and issued in January 2000. The guidelines fulfill two requirements under the Executive Order. These are that the Secretary of Energy shall:
# Issue guidelines to assist agencies in measuring energy per square foot, per unit of production, or other applicable unit in industrial, laboratory, research, and other energy-intensive facilities (Section 502(a)); and
# Develop guidance to assist agencies in calculating appropriate energy baselines for previously exempt facilities and facilities occupied after 1990 in order to measure progress toward goals (Section 502(c)).
The guidance presents three options for measuring performance. These are: a rate-based measure of annual energy consumed per number of production units; a rate-based measure of annual energy consumed per number of other applicable units (for example, number of experiments, labor hours, customers served); and Btu per gross square foot. The guidance provides advise on which measurement option is appropriate, depending on agency-specific factors. The guidance also advises agencies on the proper manner of calculating appropriate energy baselines for previously exempt buildings and facilities. The Executive Order contains strict criteria for exemption that will mean agencies having to re-examine previously exempt buildings and possibly reassign them to one of the goal categories.
More detail on each agency’s approach to tracking and achieving progress toward the energy intensive facility goals are contained in the individual agency’s narratives in Section VI.
68
The Department of Defense reports facilities that perform production or industrial functions under the energy intensive facilities category. Because the relationship between energy consumption and production varies widely between processes, DOD has decided to use energy usage per gross square foot as the performance measure for the industrial and laboratory facility category. Additionally, to simplify data collection, and the associated metering and reporting costs, DOD considers an entire base an industrial facility if 60 percent or more of the base-wide energy use is for industrial purposes. DOD established a FY 1990 baseline of 213,349 Btu/GSF for the energy intensive facilities category. During FY 2000, DOD achieved a 22.7 percent reduction in Btu/GSF consumption relative to the FY 1990 base year.
DOE reports its use of metered energy in extensive experimental research and production processes under the energy intensive facility category. This energy is consumed in: production nuclear reactors, industrial-type operations for weapons and nuclear fuel production, and research and development facilities such as experimental nuclear reactors and linear accelerators. Metered process energy totaled almost 7.7 trillion Btu in FY 2000, which represents 27.1 percent of all facility energy consumed by DOE. The use of metered process energy by DOE in FY 2000 was 35.1 percent less than in FY 1990, and 6.4 percent more than FY 1999. The primary contributor to the substantial drop beginning in FY 1997 was the sale by DOE of the Naval Petroleum Reserve, California, and subsequent decreases in natural gas consumption. DOE anticipates exempting appropriate facilities from the requirements of Executive Order 13123 during the FY 2001 reporting period and updating its reporting system to accommodate this change. Most of the facilities proposed for exemption are currently reported under the metered process category and have been scaled back operationally to prepare for decontamination and decommissioning. As part of the reporting change for FY 2001, some laboratory buildings currently being reported under the standard buildings category may also be reclassified under the energy intensive facility category.
Eighty-nine percent of the Department of Health and Human Service’s square footage is energy intensive facilities including laboratories, hospitals, animal centers, health clinics, and other related support space. The performance measure used for the HHS energy intensive facilities is Btu/GSF. In FY 2000, the energy consumption of HHS energy intensive facilities declined 10.4 percent compared to FY 1990.
At USDA, Agricultural Research Service (ARS) facilities energy performance is measured based on Air-Quality-Adjusted Btu/GSF, which removes the impact of present day requirements for increased laboratory ventilation air for safety and health reasons. Since 1990, ARS has undertaken an extensive conversion program of systematically modifying space-conditioning systems in its laboratory facilities to use far less re-circulating air, and more fresh air from outside the building, in order to protect ARS and university researchers from the health and safety risks of hazardous chemicals and airborne pathogens. These requirements have become more stringent and require greater energy use than the standards that were in place in 1990, the base year of the goal. Removing the effect of the modernization-related increase results in a reduction of approximately 23 percent from the baseline consumption in FY 1990 based on Air-Quality Adjusted Btu/GSF.
69

The Justice Department’s energy intensive facilities are comprised of large data centers, FBI labs, the FBI headquarters facility, and the training facility in Quantico, Virginia. These facilities operate 24 hours per day, 365 days per year and are not typical office buildings. DOJ did not report developing a baseline for FY 1990 or designate a performance indicator for these facilities.
Treasury reports energy consumption for 3.3 million square feet of industrial space. The Bureau of Engraving and Printing and the U.S. Mint occupied the majority of the space. As of FY 2000, Treasury’s industrial facilities have achieved a 2.9 percent reduction in consumption over their FY 1990 baseline on a Btu/GSF basis.
Since 1985, the EPA has measured and reported laboratory energy and water consumption using its standard facility 1985 baseline and reduction requirements. Starting in FY 2000 EPA is no longer reporting its laboratory energy and water consumption under the standard facility designation and is now using the more appropriate energy intensive facility designation. EPA reduced energy consumption in Agency-owned laboratories from 399,907 Btu/GSF. in 1985 to 348,401 Btu/GSF in FY 2000—a reduction of 12.9 percent. Energy use fell from 357,348 Btu/GSF in 1990 to 348,401 Btu/GSF in FY 2000—a decrease of only 2.5 percent—because the Agency built seven additional facilities during those years. EPA received credit for purchases of 7.6 billion Btu of renewable electricity. This lowered the energy intensity of its laboratories from 351,251 Btu/GSF to 348,401 Btu/GSF.
GSA’s energy usage in its energy intensive facilities during FY 2000 was 287,476 Btu/GSF compared to 432,313 Btu/GSF in FY 1990. This represents a decrease of 33.5 percent compared with the 1990 base year. In 2000, GSA invested $495,744 of energy program appropriations in its industrial and laboratory facilities.
NASA has elected to use Btu/GSF as the agency-wide aggregate performance measure for energy intensive facilities. Other performance measures are utilized for individual industrial facilities, space flight tracking stations, and clean rooms. The average energy intensity for NASA’s energy intensive buildings was 256,613 Btu/GSF by the end of FY 2000, as compared to the FY 1990 baseline value of 323,955 Btu/GSF. This represents a decrease of 20.8 percent.
The Department of Commerce’s energy intensive buildings are operated by three of its agencies: the National Institute of Standards and Technology (NIST), the National Oceanic and Atmospheric Administration (NOAA), and the Bureau of the Census. NIST installations are comprised of general purpose and special laboratories that require constant environmental space control and base electrical loads for scientific equipment and computer systems. NOAA Weather Service facilities operate 24 hours a day and consist of radar towers, computers, special gauges, meters and other sophisticated equipment. Marine Fisheries and Laboratories conduct marine biology research and utilize refrigerators, freezers, incubators, coolers, seawater pumps, and compressors that operate 24 hours a day. The Bureau of Census Charlotte Computer Center is a leased facility and is used solely as a computer center. The building is operated 24 hours a day.
The International Broadcasting Bureau (formerly the U.S. Information Agency) designates domestic and overseas Voice of America Relay Stations as energy-intensive facilities.
70

The State Department includes in this category unique, special-use facilities with special security and operational requirements including the President’s guest house, a computer facility, the International Chancery Center, and the Harry S. Truman Headquarters Building.
NARA designates all 12 of its facilities as energy intensive because of stringent records storage requirements which demand that documents and records be maintained in a controlled environment 24 hours per day, 365 days per year.
The Social Security Administration, which began reporting energy consumption this year as an independent agency, has designated its National Computer Center as an energy intensive facility. The Center contains SSA’s main database and operates 24 hours per day and 365 days per year.
71
IV. EXEMPT FACILITIES
A. Energy Consumption and Costs for Exempt Facilities
Sec. 704 of the Order defines “Exempt facility” as “a facility. . .for which an agency uses DOE-established criteria to determine that compliance with the Energy Policy Act of 1992 or [Executive Order 13123] is not practical.” Section 502(b) of Executive Order 13123 requires the Secretary of Energy, in collaboration with other agency heads, to “establish criteria for determining which facilities are exempt from the Order. In addition, DOE must provide guidance for agencies to report proposed exemptions.” This guidance was issued in December 1999. The following facilities may be exempted from Section 201, Greenhouse Gas Reduction Goal, Section 202, Energy Efficiency Improvement Goals for standard buildings and facilities, and the goals of Section 203, Industrial and Laboratory Facilities of Executive Order 13123:
# Structures such as outside parking garages which consume essentially only lighting energy, yet are classed as buildings.
# Buildings where energy usage is skewed significantly due to reasons such as: buildings entering or leaving the inventory during the year, buildings down-scaled operationally to prepare for decontamination, decommissioning and disposal, and buildings undergoing major renovation and/or major asbestos removal.
# Federal ships that consume “Cold Iron Energy,” (energy used to supply power and heat to ships docked in port) and airplanes or other vehicles that are supplied with utility-provided energy.
# Buildings and facilities in which it is technically infeasible to implement energy efficiency measures or where conventional performance measures are rendered meaningless by an overwhelming proportion of process-dedicated energy. For these exemptions, a finding of impracticability must be approved by the DOE as outlined in Section 543(c) of the National Energy Conservation Policy Act, as amended by the Energy Policy Act of 1992. For buildings where exemptions are granted, agencies should undertake energy audits and are strongly encouraged to implement all life-cycle cost-effective measures per the recommendation of the audit.
Five agencies, the Departments of Defense, Health and Human Services, and Transportation, the National Aeronautics and Space Administration, and the GSA have chosen to exempt facilities from Executive Order requirements. These facilities are listed in Appendix E. The U.S. Postal Service has reported electricity consumption used in mail processing automation under the exempt category without reporting associated facility square footage. Table 11 presents an accounting of energy use and costs in exempt facilities for FY 2000 and shows what percentage of each agency’s facility energy use, costs, and space is considered exempt.
72

TABLE 11ENERGY CONSUMPTION, COSTS, AND GROSS SQUARE FOOTAGE OF
FEDERAL EXEMPT FACILITIES, FY 2000
Energy Consumption Energy Costs Facility Gross Square Feet
Agency (BBtu) % of Agency's Total Facility Use ($ Million) % of Agency's Total
Facility Costs (Thou. Sq. Ft.) % of Agency's Total Facility Space
DOD 9,575.1 3.8% $124.102 5.2% 0.0 N/A DOT 6,443.4 64.1% $64.260 53.6% 16,533.2 31.4% USPS 2,069.6 7.6% $45.607 11.0% 0.0 N/A NASA 1,781.5 18.5% $18.732 18.0% 4,962.2 12.4% GSA 683.5 3.9% $11.112 4.4% 10,964.8 5.4% HHS 8.3 0.1% $0.143 0.2% 882.8 3.5% Total 20,561.4 $263.956 33,343.0
DATA AS OF 11/30/01
TABLE 12CONSUMPTION AND COSTS OF FEDERAL EXEMPT FACILITY ENERGY
BY FUEL TYPE IN FY 2000
ENERGY TYPE
ELECTRICITYFUEL OILNATURAL GASLPG/PROPANECOALPURCHASED STEAMOTHER
TOTAL
BILLIONS OF COST PER BTU MMBTU
15,387.1 15.1430 2,808.4 4.4038
985.0 5.4490 47.4 12.8396
0.0 0.0000 572.3 7.1518 761.2 11.1838
20,561.4
COST (IN MILLIONS OF DOLLARS)
233.007 12.368
5.367 0.608 0.000 4.093 8.513
263.956
DATA AS OF 11/30/01
AVERAGE COST PER MMBTU = $12.8375
This table uses a conversion factor for electricity of 3,412 Btu per kilowatt hour. Sum of components may not equal total due to independent rounding.
Source: Federal Agency Annual Energy Management Data Reports
Table 12 illustrates total exempt energy consumption and costs by fuel type for FY 2000. Energy used in exempt facilities accounts for approximately 2.1 percent of the total 0.98 quads used by the Federal Government. Electricity constitutes 74.8 percent of the energy used in exempt facilities, 4.8 percent is accounted for by natural gas, and 13.7 percent by fuel oil. Small amounts of purchased steam, liquefied petroleum gas (LPG)/propane, and “other” energy account for the remaining 6.7 percent.
The energy used in exempt facilities in FY 2000 accounted for approximately 3.6 percent of the total Federal energy bill. The Federal Government spent approximately $264.0 million for this
73

category’s energy during the fiscal year. The combined cost of energy intensive facility energy in FY 2000 was $12.84 per million Btu.
Under DOD, the Navy is the only Military Service to list facilities classified as exempt. The Navy exempts mission-critical, concentrated energy use transmitters, simulators, cold iron support to ships, and some privately-owned facilities. These are non-production-oriented facilities with little or no square footage, making conventional performance measures meaningless. (DOD did not report any square footage for this category.) The mission criticality of these end users is such that energy efficiency measures are evaluated on a case-by-case basis.
Within the Department of Transportation, the Federal Aviation Administration excludes all buildings involved in implementing the National Airspace System Plan. These buildings house energy-intensive electronic equipment with the associated HVAC requirements to maintain an environment for reliable equipment operation.
GSA exempts those buildings and facilities where energy usage is skewed significantly due to reasons such as: buildings entering or leaving the inventory during the year; buildings down-scaled operationally to prepare for disposal; buildings undergoing major renovation and/or major asbestos removal; or buildings functions like that of outside parking garages which consume essentially only lighting energy, yet are classed as buildings.
NASA exempts 5.0 million square feet of its mission-variable (MV) facilities or 12.4 percent of its total facility space. These facilities are highly specialized and energy intensive, having been constructed for specific space flight and research programs. Examples are wind tunnels driven by multi-thousand horsepower electric motors, space simulation chambers, and space communication facilities. Energy consumption in these facilities varies directly with the level and intensity of program activities. NASA provided justifications for each MV facility exemption to explain why it is either technically infeasible to implement energy efficiency measures or to apply conventional performance measures due to the overwhelming proportion of process-dedicated energy consumed in these facilities.
The only exempted facilities at HHS are outdoor multilevel parking garages on the NIH Bethesda Campus that consume lighting energy only. These facilities are not metered separately. Therefore, the energy consumption of these structures has been estimated based on the number of lighting fixtures and the time of use.
The Postal Service energy consumption reported under this category reflects process energy consumed by mail processing equipment. This consumption has been factored out of energy consumption of Postal Service standard buildings in order to provide a better measure of their energy efficiency status.
74

V. ENERGY MANAGEMENT IN VEHICLES AND EQUIPMENT
A. Energy Consumption and Costs for Vehicles and Equipment
Vehicle and equipment energy consists of energy used by equipment ranging in size and function from aircraft carriers to forklifts. It includes aircraft and naval fuels, automotive fuels consumed by Federally-owned and leased vehicles and privately-owned vehicles used for official business, and the energy used in Federal construction.
Table 13 shows that in FY 2000, the Federal Government used approximately 566.1 trillion Btu of energy for vehicles and equipment, a decrease of 39.4 percent relative to FY 1985. DOD’s vehicle and equipment energy consumption decreased 41.4 percent from FY 1985, while the civilian agencies increased consumption by 1.8 percent. Overall, vehicle and equipment consumption decreased 6.8 percent from FY 1999. Federal energy consumption in vehicles and equipment is at its lowest level since Federal agencies began reporting consumption in 1975. This is mainly attributable to decreased operations by the Department of Defense.
Jet fuel consumption accounted for 71.2 percent of all vehicle and equipment energy in FY 2000. In FY 2000 compared to the previous year, jet fuel consumption decreased 9.4 percent from 444.7 trillion Btu to 403.0 trillion Btu.
Agencies have taken many tangible steps to keep the use of vehicle fuels to a minimum. For example, USPS continues to modernize its fleet, adding diesel delivery vans and long-life vehicles to its inventory, both of which are more fuel efficient than the older vehicles they replaced. DOD continues to increase the use of flight simulators, as well as the use of new propulsion technologies in order to lessen the growth of vehicle and equipment fuel consumption.
Figure 10 depicts the vehicles and equipment fuel mix within DOD and civilian agencies. Jet fuel accounted for 403.0 trillion Btu or 71.2 percent of the total energy usage in the category, with 21.6 percent attributed to diesel and distillate fuel, 5.6 percent to auto gasoline, and 1.6 percent to aviation gasoline, navy special, LPG/propane and other fuels, combined.
75

TABLE 13FEDERAL ENERGY CONSUMPTION IN VEHICLE AND EQUIPMENT OPERATIONS
(In Billions of Btu, with Conversions to Millions of Barrels of Oil Equivalent [MBOE], and Petajoules [Joule x 1015])
CIVILIAN FY FY FY FY FY FY FY FY FY FY FY FY %Change %Change AGENCY 1985 1990 1991 1992 1993 1994 1995 1996 1997 1998 1999 2000 85-00 99-00
USPS 11,524.2 12,136.2 12,196.2 12,225.0 12,565.3 13,348.6 14,571.2 14,217.1 16,779.2 14,777.2 14,583.7 14,987.2 30.1 2.8 DOT 11,957.0 12,150.8 12,350.7 8,702.6 10,769.7 12,917.0 12,193.7 12,222.9 12,347.9 10,145.0 10,870.5 10,327.9 -13.6 -5.0 DOJ 2,064.0 2,097.9 2,124.0 3,675.1 2,835.9 3,451.3 3,181.6 3,693.0 3,149.3 7,171.4 6,456.3 7,481.7 262.5 15.9 USDA 4,319.6 4,952.3 5,123.8 4,982.7 4,931.2 5,129.1 4,821.7 4,654.8 3,153.0 3,389.4 3,337.9 3,025.7 -30.0 -9.4 DOI 3,053.9 3,352.5 3,208.6 3,819.1 3,507.8 3,970.0 2,782.2 1,347.5 2,943.7 2,679.9 3,661.4 1,963.5 -35.7 -46.4 TRSY 2,155.0 1,473.2 1,655.7 2,065.2 2,420.9 2,161.8 1,773.4 1,350.9 1,561.4 2,078.6 2,120.2 1,947.0 -9.7 -8.2 NASA 1,972.7 1,736.7 1,864.0 1,875.4 1,798.0 1,734.3 1,750.9 1,539.3 1,622.1 1,428.3 1,412.8 1,306.7 -33.8 -7.5 DOE 2,882.0 2,520.4 2,559.7 2,078.1 2,241.3 2,085.9 1,841.9 1,561.0 1,971.0 1,955.6 1,444.6 1,222.1 -57.6 -15.4 VA 592.8 518.3 317.4 634.9 663.9 374.4 353.6 660.7 1,199.1 1,380.3 1,337.6 874.4 47.5 -34.6 TVA 578.5 476.6 534.7 408.8 452.4 480.3 541.7 583.8 479.5 429.1 423.3 821.9 42.1 94.2 GSA 144.1 128.1 122.6 102.9 79.6 69.9 91.3 98.8 119.9 122.2 125.2 162.6 12.8 29.9 HHS 373.3 0.0 0.0 0.0 177.3 176.3 105.5 18.6 435.0 447.7 447.7 84.4 -77.4 -81.1 EPA 132.3 0.0 0.0 0.0 100.7 98.0 99.6 76.5 137.2 97.7 120.6 42.2 -68.1 -65.0 ST 14.8 34.9 0.0 0.0 7.5 0.0 0.0 0.0 44.7 40.9 40.9 41.5 181.0 1.5 DOL 232.2 239.0 401.9 388.7 369.1 369.6 356.9 337.7 336.2 350.2 350.2 13.8 -94.0 -96.0 FCC 12.4 9.1 7.2 7.5 7.2 6.6 6.6 4.8 7.1 6.6 6.6 11.6 -6.9 74.8 DOC 1,010.2 3,100.3 1,315.2 952.5 995.7 995.2 760.6 570.1 929.1 708.4 834.5 4.5 -99.6 -99.5 HUD 0.0 0.0 32.7 33.6 31.6 30.7 25.4 25.4 28.3 23.3 23.3 0.2 N/A -99.1 PCC 530.4 653.7 578.6 699.6 684.9 688.4 866.7 829.7 766.8 0.0 0.0 0.0 -100.0 N/A OTHER* 39.2 69.6 27.6 113.6 106.7 105.4 119.6 116.9 140.1 147.6 144.0 36.1 -7.9 -74.9
CIVILIAN AGENCIES TOTAL 43,588.5 45,649.7 44,420.7 42,765.2 44,746.7 48,193.0 46,244.1 43,909.5 48,150.6 47,379.4 47,741.4 44,355.2 1.8 -7.1
DOD 890,679.9 881,345.1 926,033.6 740,357.2 727,887.1 674,597.5 640,893.4 631,202.0 617,235.4 579,959.8 559,785.8 521,725.7 -41.4 -6.8
ALL AGENCIES 934,268.4 926,994.8 970,454.3 783,122.4 772,633.8 722,790.5 687,137.4 675,111.5 665,386.0 627,339.2 607,527.2 566,080.9 -39.4 -6.8 MBOE 160.4 159.1 166.6 134.4 132.6 124.1 118.0 115.9 114.2 107.7 104.3 97.2 Petajoules 985.6 977.9 1,023.8 826.2 815.1 762.5 724.9 712.2 702.0 661.8 640.9 597.2
DATA AS OF 11/30/01
*Other includes for certain years the CFTC, CIA, FEMA, NSF, NRC, OPM, and USIA/IBB.
Note: FY 1999 data was used to estimate the non-tactical vehicle component of agency energy consumption for FY 2000. Sum of components may not equal total due to independent rounding.
Source: Federal Agency Annual Energy Management Data Reports
76

FIGURE 10Defense and Civilian Consumption in
Vehicles and Equipment by Fuel Type, FY 2000
450
400
350
300
250
200
150
100
50
0 Jet Fuel Diesel Auto Gas Other*
DOD Civilian *Other includes navy special, aviation gas,and LPG/propane
As shown in Tables 14-A and 14-B, the Federal Government spent $3,099.7 million on vehicles and equipment energy in FY 2000, 22.3 percent less than the FY 1999 expenditure of $3,987.9 million constant dollars. In FY 2000, the combined price for all types of vehicles and equipment energy was $5.48 per million Btu, down 16.6 percent from FY 1999. The average real cost of gasoline to the Federal Government decreased from $1.13 per gallon in FY 1999 to $1.03 in FY 2000. The unit cost for diesel/distillate fuel declined 22.5 percent while the unit cost for jet fuel fell 14.8 percent.
When compared to FY 1985 using constant 2000 dollars, energy costs for vehicles and equipment decreased 64.8 percent from $8,800.4 million to $3,099.7 million in FY 2000. During that same period, the Government’s combined cost per million Btu for vehicles and equipment energy fell 41.8 percent from $9.42 to $5.48 in constant dollars.
Vehicle and equipment fuel costs in FY 2000 represent 42.1 percent of the Government’s total energy costs of $7.3 billion.
TRIL
LIO
N B
TU
77

TABLE 14-ADEFENSE AND CIVILIAN FEDERAL COSTS FOR VEHICLE AND EQUIPMENT ENERGY
IN FY 2000(In Millions of Dollars)
AUTO GAS DIST. LPG/ AVIATION JET FUEL NAVY OTHER TOTAL DIESEL PROPANE GAS SPECIAL
DEFENSE 57.567 478.078 0.185 0.023 2,190.267 17.607 1.572 2,745.299 CIVILIAN 206.427 72.972 0.299 3.181 63.241 0.003 8.284 354.407
263.994 551.050 0.483 3.204 2,253.508 17.610 9.856 3,099.706
AVERAGE COST PER UNIT, BASED ON REPORTS FROM AGENCIES
VEHICLES AND EQUIPMENT
GASOLINE = 1.03 / GALLON DIST/DIESEL = 0.62 / GALLON LPG/PROPANE = 1.17 / GALLON AVIATION GAS = 2.09 / GALLON JET FUEL = 0.73 / GALLON NAVY SPECIAL = 0.38 / GALLON OTHER = 4.55 / MILLION BTU
DATA AS OF 11/30/01
Note: FY 1999 data was used to estimate the non-tactical vehicle component of agency energy costs for FY 2000. Sum of components may not equal total due to independent rounding.
Source: Federal Agency Annual Energy Management Data Reports
78

TABLE 14-BCONSUMPTION AND COSTS OF VEHICLE AND EQUIPMENTENERGY BY FUEL TYPE IN FY 2000, FY 1999, AND FY 1985
(Constant 2000 Dollars)
ENERGY TYPE BILLIONS OF COST PER COST (IN MILLIONS BTU MMBTU OF DOLLARS)
FY 2000 AUTO GASOLINEDIST/DIESELLPG/PROPANEAVIATION GASOLINEJET FUELNAVY SPECIALOTHER
TOTAL
31,886.4 122,316.3
39.6 192.0
403,051.3 6,426.8 2,168.4
566,080.9
AVERAGE COST PER MMBTU = $5.476
FY 1999 AUTO GASOLINEDIST/DIESELLPG/PROPANEAVIATION GASOLINEJET FUELNAVY SPECIALOTHER
TOTAL
41,091.2 116,571.7
79.2 132.1
444,680.5 4,543.9
428.6
607,527.2
AVERAGE COST PER MMBTU = $6.564
FY 1985 AUTO GASOLINEDIST/DIESELLPG/PROPANEAVIATION GASOLINEJET FUELNAVY SPECIALOTHER
TOTAL
50,420.1 169,215.0
149.2 1,882.3
705,675.5 6,687.7
238.6
934,268.4
AVERAGE COST PER MMBTU = $9.419
8.2792 263.994 4.5051 551.050
12.1997 0.483 16.6907 3.204
5.5911 2,253.508 2.7401 17.610 4.5453 9.856
3,099.706
8.9785 368.936 5.8177 678.183 8.3359 0.660
14.0200 1.852 6.5634 2,918.636 3.5318 16.048 8.4661 3.629
3,987.943
10.9684 553.028 8.7566 1,481.743
10.1752 1.518 16.2086 30.509
9.4625 6,677.444 8.1208 54.309 7.8287 1.868
8,800.421
DATA AS OF 11/30/01
Note: FY 1999 data was used to estimate the non-tactical vehicle component of agency energy costs for FY 2000. Sum of components may not equal total due to independent rounding.
Source: Federal Agency Annual Energy Management Data Reports
79

This page intentionally left blank.
80


VI. FEDERAL AGENCY ENERGY MANAGEMENT ACTIVITIES
A. DEPARTMENT OF AGRICULTURE (USDA)
Management and Administration In the U.S. Department of Agriculture (USDA), the Assistant Secretary for Administration has the authority to implement Federal energy management policy related to the internal operations of the Department and to exercise full Department-wide contracting and procurement authority. As the Senior Energy Official, the Assistant Secretary is principally responsible for planning and implementing energy conservation programs within USDA and for coordinating with the Department of Energy on energy matters.
USDA has put in place an Energy Support Technical Team comprised of USDA energy policy officials and agency energy coordinators, engineers, facilities managers, and procurement personnel. The three agencies represented on the Team – the Agricultural Research Service (ARS), U.S. Forest Service, and Office of Operations – are responsible for 89 percent of USDA’s consumption.
Recognition During FY 2000, five employees of USDA were recognized as energy champions under DOE’s “You Have the Power” energy awareness campaign:
! Facility engineer Jerry Carlson of the Siuslaw National Forest who, by initiating the first energy savings performance contract for the USDA Forest Service, is helping the Pacific Northwest Forestry Sciences Laboratory reduce its energy costs by $85,000 annually;
! Facility engineer Victor Hager of the U.S. Forest Service who, by implementing an ESPC with Johnson Controls to modernize lighting and HVAC systems at the Rocky Mountain Research Station in Fort Collins, CO, is helping USDA save energy costs of $160,000;
! Facilities manager Dennis Jones of the National Animal Disease Center (NADC) who, by using an ESPC, is helping the ARS save more than $500,000 each year in energy costs;
! Civil engineer Cathy O’Brien of the Manti-LaSal National Forest who, by replacing generator power with photovoltaics at several guard stations, is helping the USDA Forest Service save $500 per guard station in fuel costs each year; and
! Engineer Harry Solhjoo of the ARS who, by retrofitting facilities with energy-efficient lighting and incorporating advanced HVAC free-cooling
technology, is saving USDA hundreds of thousands of dollars each year.
ARS continues to use the its existing system of employee incentive and awards programs to recognize and reward employees for energy savings contributions. For example, two employees at the National Agricultural Library (NAL) were given spot awards for identifying and acting on energy savings opportunities resulting in approximately $200,000 in savings.
Performance Evaluations An energy management element continues to be incorporated in appropriate position descriptions and performance evaluation standards of ARS employees considered to be critical for the successful implementation of the energy management and conservation program. Each critical position employee at the Beltsville Agricultural Research Center (BARC) is evaluated based on the energy conservation measures achieved within the employee’s unit.
Training All USDA agencies continue to provide relevant energy management training and materials to their employees. ARS employees are encouraged to attend energy management training offered by DOE’s Federal Energy Management Program, private or public educational institutions, Federal agencies, or professional associations.
BARC continues to employ aggressive training that updates its employees with the changing equipment and technologies. Contracts with new technologies incorporate cost allowance for training of BARC employees.
Showcase Facilities ARS evaluated newly-approved major facility construction or modernization projects as possible candidates for energy Showcase designation.
The Office of Operations substantially completed Phase I of the USDA Headquarters South Building Modernization in FY 2000 and that will result in a Showcase Facility of approximately 2 million square feet when all eight phases are completed.
81

Energy Efficiency Performance
Standard Buildings In FY 2000, USDA reported a 23.1 percent decrease in energy consumption from FY 1985 for its standard buildings when measured in Btu per gross square foot. USDA received credit for purchases of 3.1 billion Btu of renewable electricity. This lowered the energy intensity of its standard buildings from 65,358 Btu/GSF to 65,259 Btu/GSF.
Industrial and Laboratory Facilities The entire ARS building inventory is designated as “Industrial, Laboratory, Research, and Other Energy Intensive Facilities” for energy reporting purposes.
The ARS building inventory includes more than 3,000 separate buildings (average size less than 4,000 square feet) widely dispersed across the nation, the majority of which are used for research and development functions and laboratories. The inventory does include some office buildings and other facilities commonly treated as “Standard” or “Exempt” under the DOE reporting guidelines, but it is not feasible to separate those buildings for reporting purposes.
! The predominant mission of ARS and of its facilities is research and related functions of a highly technical and specialized nature. Energy use in ARS facilities is dominated by laboratory and research and development buildings that are characterized by the greater intensity and variability of energy use, as well as by the more complex challenges of achieving energy cost reductions in such facilities.
! Separating the buildings operated by ARS into three reporting categories is just not possible within reasonable cost. Utility bills for all of ARS are paid by a central financial processing and accounting unit and it is infeasible with available information to segregate utility costs by buildings or building categories.
! A significant number of ARS facilities, most particularly those at the larger sites, are served by central heating and/or cooling plants, which are centrally metered without submetering by building.
! A great many of ARS facilities are co-located (often on central systems) with land-grant university agricultural research facilities. Usage and occupancy of such facilities is variable and mixed among ARS and university functions and personnel, and operating costs are allocated through a variety of lease and cost-sharing practices.
! To meet its mission objectives, ARS has changed
the use and, therefore, the appropriate classification of many of its facilities. Storage spaces, for example, have been converted to research or office facilities, or other more energy intensive uses.
Performance of ARS facilities is measured based on Air-Quality-Adjusted Btu/GSF, which removes the impact of present day requirements for increased laboratory ventilation air for safety and health reasons. Since 1990, ARS has undertaken an extensive conversion program of systematically modifying spaceconditioning systems in its laboratory facilities to use far less re-circulating air, and more fresh air from outside the building, in order to protect ARS and university researchers from the health and safety risks of hazardous chemicals and airborne pathogens. These requirements have become more stringent and require greater energy use than the standards that were in place in 1990, the base year of the goal.
In 1989, ARS initiated a comprehensive nationwide ARS facilities modernization program to upgrade existing facilities to present day building code and life safety standards. As part of this modernization effort, a significant number of energy efficiency design features have been and continue to be incorporated into the facilities. ARS has completed Super ESPC agreements for comprehensive energy retrofits at the NAL and at the NADC. ARS is working with the Lawrence Berkeley National Laboratory to develop additional opportunities for efficiency improvements in its laboratory facilities. The total impact of these energy-efficiency efforts will be reflected in ARS-wide energy-use reporting. These efficiency gains, however, will be obscured if there is no adjustment for the impact of essential health and safety improvements in these buildings.
Based on the ARS best engineering judgement, laboratory and research space accounts for more than 90 percent of ARS building energy consumption and modifications to existing space-conditioning systems to improve indoor air quality will result in an increase in Btu/GSF of modernized space. To eliminate the distorting impact of air-quality improvements and to allow a more accurate comparison of current energy use with the baseline year, ARS annually reported data will be adjusted accordingly to reflect actual progress of the ARS modernization program.
In FY 1990, ARS consumed a total of 2,258 billion Btu in 12.7 million square feet of facilities (or 178,014 Btu/GSF). In FY 2000, ARS consumption is 2,368.4 billion Btu in 12.9 million GSF of facilities (or 183,578
82

Btu/GSF). A total of 1.3 million GSF of laboratory facilities have been modernized since FY 1990, which more than doubled the energy intensity of this space. Removing the effect of the modernization-related increase results in an Air-Quality Adjusted Btu/GSF of 137,012 – a reduction of about 23 percent from the baseline consumption in FY 1990.
Renewable Energy Where possible and cost effective, the U.S. Forest Service endeavors to install photovoltaic-powered equipment at remote sites, incorporate passive solar technology into new facility design/construction, and identify/estimate energy use from renewable energy self-generation and renewable energy thermal projects. Recent examples include:
! In FY 1999, the Missoula Technology and Development Center received a $44,000 grant from the DOE to install photovoltaic lighting systems at Forest Service fire camps. These were used extensively in FY 2000;
! Apache-Sitgreaves National Forest, Region 3, installed photovoltaic powered pumps as part of the Basel ine-Horsesprings Allotments Range/Wildlife Watering Project;
! Red Canyon Camp Ground in the Cibola National Forest, Region 3, installed photovoltaic lighting and fan systems at three toilet buildings and a photovoltaic powered water pump system;
! Douglas Ranger District, Coronado National Forest, Region 3 installed photovoltaic systems in partnership with a rancher to pump water;
! Alto Pit on the Prescott National Forest, Region 3, installed photovoltaic systems to power a water pressure pump and alarm system for a wastewater holding tank at the Alto Pit;
! The design for the new Missoula Technology and Development Center includes a solar preheat wall system for make-up air, passive solar lighting, a photovoltaic system to pump water for irrigation, and a ground-coupled heat pump;
! Cibola National Forest, Region 3, installed a water pump that is powered by 16 modules and 64 watts of active tracking photovoltaic systems; and
! Coronado National Forest, Region 3, installed three photovoltaic systems as part of communication repeater projects.
During FY 2000, the Southern Plains Area of ARS reported a renewable electricity purchase of 165.6 megawatt-hours at a cost of $94,604. Iowa State University (ISU) provides electricity, steam, and chilled water for the National Soil Tilth Laboratory (NSTL) in Ames, Iowa. ISU generates much of its own power
using a combination of renewable resources and coal. The city of Ames is a back-up power source for ISU and Ames also used renewable energy resources in power generation.
In the transportation end-use sector, the BARC purchased biodiesel for its vehicular fleet. To date, BARC has purchased approximately 100,000 gallons of biodiesel for a total cost of $123,000.
Petroleum Since FY 1985, USDA has substantially reduced its use of petroleum-based fuels in its facilities. In FY 2000, USDA reduced consumption of fuel oil in its standard buildings by 87.5 percent from almost 886,500 gallons in FY 1985 to 110,500 gallons in FY 2000. The use of LPG/propane was reduced 63.1 percent during the period, a reduction of 1.9 million gallons.
Similar reductions were seen in USDA’s ARS laboratory facilities. Fuel oil consumption in these facilities decreased 81.8 percent from 3.5 million gallons in FY 1985 to 638,900 gallons in FY 2000.
Water Conservation Overall, the USDA used almost 1.6 billion gallons (1,579.4 million gallons) of water for all facilities during FY 2000 at a cost of more than $2.8 million.
ARS reported the following water conservation activities undertaken during FY 2000:
! The BARC used recycled effluent water for the production of steam;
! The computer control system used at the BARC-East Water Treatment Plant has been programmed to operate wells and pumps more efficiently based on the needs of the facility. Wastewater treatment equipment, which was designed to operate continuously, was evaluated and placed on electrical timers;
! Repackaged steam joints and expansion joints, replaced old steam traps and main valves, and replaced leaking steam lines;
! Replaced parts in flush-o-meters to water-saver kits and replaced back-flow prevention devices.
! Animal water troughs are being upgraded with more efficient models in Dubois, Idaho;
! Non-recirculating de-ionized water system has been replaced with re-circulating reverse osmosis system at the Western Regional Research Center in Albany, California for annual water savings of 5.8 million gallons ($57,000); and
! A trickle irrigation system designed to reduce water usage has been installed in an 1,800 square
83

foot greenhouse in Ames, Iowa.
Implementation Strategies
Life-Cycle Cost Analysis ARS continued to use life-cycle cost analysis (LCC) in evaluating energy-consuming products, services, and construction. Policies and procedures are in place regarding use of life-cycle cost analysis for evaluating energy conservation opportunities and decision making.
During FY 2000, the Office of Operations expended most of its resources for the modernization of Wing 3 of the USDA Headquarters South Building and the design of an energy-efficient and water-conserving Wing 4. Capital budgeting decisions, using life-cycle cost analysis and considering energy efficiency features, were made during the concept/design phases of these projects.
Energy Audits ARS continues to conduct energy audits at locations nationwide. In FY 2000, an energy audit was conducted at facilities in Beaumont, Texas. About 668,000 total square feet were audited in late FY 2000.
The BARC and the U.S. National Arboretum were audited by an energy service company. After all audits are completed, a review of the findings will determine which sites can benefit from an ESPC and/or utility energy service contract (UESC) projects.
The Forest Service is pursuing an approach in which audits are conducted on prototypical buildings so that an audit of one type of facility can be used to identify recommendations of numerous similar facilities.
Financing Mechanisms During FY 2000, USDA identified almost $2.0 million in direct obligations for facility energy efficiency improvements. These funds were from the facilities modernization and repair and maintenance accounts of the ARS, Office of Operations, and Forest Service.
USDA proceeded with programming and budgeting for energy efficiency measures and Executive Order implementation activities as a discrete line item in its FY 2002 budget request.
In FY 2000, as part of the its facilities modernization and repair and maintenance program effort, ARS spent $1.8 million for related building energy conservation/efficiency improvement projects. Examples include replacement of electrical lighting systems, insulation systems, HVAC systems, and
building automation control systems with the most up-to-date efficient equipment available. Other projects include replacement of steam traps and lines throughout the BARC facility, replacement of antiquated chillers and several hundred light fixtures and ballasts with energy saving units.
ARS awarded a Super ESPC delivery order on December 16, 1999, for energy upgrades at the NADC in Ames, Iowa. Work included installation of equipment to preheat combustion air for generators; installation of steam and chilled water meters in buildings; connection of existing metering system; installation of heat recovery units; boiler replacement with combustion turbine to generate base load steam and electricity; and installation of standby generator for less costly interruptible electrical rates. The total private-sector investment for this project is almost $6.4 million. The total awarded value of this delivery order is $12,238,015. The annual energy savings are about 26 billion Btu.
ARS also awarded a second Super ESPC delivery order on February 1, 2000, for chiller, burner, and lighting replacements at the NAL in Beltsville, Maryland. Total value of the ESPC delivery award is $1,807,000.
The BARC entered into an agreement with Washington Gas to install natural gas lines throughout its facilities at no initial cost to the Government. In return, BARC will pay reduced delivery charges. The estimated annual energy savings is $416,500.
Energy-Efficient Product Procurement Through the USDA’s Customer Supplies Centers and through the General Services Administration, there are established procedures for the purchase of energy-efficient products. During FY 2000, ARS acquired microcomputers which met the ENERGY STAR® requirements for energy efficiency.
The procurement staff at the Plant Introduction Station in Ames, Iowa, has been trained in procurement of energy-efficient products, provided product information of energy-efficient products, used energy efficiency as a selection criteria, and strongly encouraged purchase of energy-efficient products when processing purchase requisitions and orders.
ENERGY STAR® BuildingsUsing the EPA benchmarking tool, the BARC identifiedeight buildings at its facility as eligible for ENERGY
STAR® Building labels.
Sustainable Building Design
84

Appropriate considerations of the sustainable design principles continue to be given to the siting, design, and construction of new ARS facilities. These principles have been incorporated in the agency’s facilities design standards.
Energy Efficiency in Lease Provisions Energy and water efficiency considerations continue to be used as evaluation factors in determining the most beneficial offer when soliciting for new USDA leased space.
Highly Efficient Systems The BARC embarked on an ESPC project to install a cogeneration system. The energy service company is tasked with providing information in its proposal on eight locally-available natural resources for consideration as fuel for the cogeneration system.
Off-Grid Generation The U.S. Forest Service has identified more than 500 photovoltaic systems in use. The Forest Service and other USDA agencies plan to continue efforts to use solar and other renewable technology, particularly at remote locations, where it competes favorably with traditional power systems.
The National Soil Tilthe Laboratory uses small solar cell systems for several field instrumentation operations.
Energy Management Contact Ms. Sharon HolcombeOffice of Procurement and Property ManagementU.S. Department of AgricultureMail Stop 9302Washington, D.C. 20250-9304Phone: 202-720-3673Fax: 202-690-1209
85

B. DEPARTMENT OF COMMERCE
Management and Administration The Chief Financial Officer and Assistant Secretary for Administration serves as the Senior Energy Official for the Department of Commerce.
Commerce includes a wide variety of individual bureaus. Those bureaus with responsibilities for energy and water management in Federal facilities are the Headquarters, Herbert C. Hoover Building; National Oceanic and Atmospheric Administration (NOAA); National Institute of Standards and Technology (NIST); and the Bureau of Census.
Commerce’s Administrative Order for Federal Energy Management prescribes policies, assigns responsibility, and provides program guidelines for energy and water management. The plan also includes individual conservation plans for the Bureaus.
Awards and Performance Evaluations Commerce presents awards to employees who help implement the agency’s energy efficiency goals, and includes measures of energy efficiency in employees’ performance evaluations.
Training and Education Commerce trains managers, engineers and Architect/Engineering contractors in sustainable development, through General Services Administration workshops. Commerce also provides information on energy management programs and references such as the Whole Building Design Guide, the Leadership in Energy & Environmental Design rating system, and Building for Environmental and Economic Sustainability.
In FY 2000, Commerce co-sponsored the World Energy and Environmental Congress and Environmental Technology Conference hosted by the Association of Energy Engineers. Commerce also participated in the ENERGY 2000 Conference.
Energy Efficiency Performance
Standard Buildings In FY 2000, Commerce reported a 34.0 percent decrease in energy consumption from FY 1985 for its standard buildings when measured in Btu per gross square foot.
In FY 2000, NOAA reported energy data for sites in the Atlantic Marine Center, Pacific Marine Center, and Aircraft Operation Center along with the NOAA Motor
Pool. The 49 Weather Forecast Offices operate 24 hours, 7 days per week to forecast weather predictions and have extremely high energy usage. Presently, there are 36 National Weather Service Acquisition Sites reporting.
Industrial and Laboratory Facilities NIST plans to take steps in FY2001 toward meeting the Executive Order 13123 goals. Energy and water conservation projects will be managed in the Plant and Technical Services Divisions. NIST in Boulder, Colorado, performed a DOE Facility Energy and Water Survey of several buildings. The results of the survey will help the facility plan future energy conservation measures.
A design for HVAC setback and HVAC enthalpy controls in specific NIST Gaithersburg campus buildings will be completed in FY 2001 fiscal year and is planned as an ESPC activity. Documenting consumption of energy and to provide baseline information for building improvements, NIST has installed electrical meters on most Gaithersburg building feeders during the past year, and will continue to data log individual building electrical power consumption in FY 2001.
NIST also has in place a design for retrofit of a laboratory building with Variable Air Volume (VAV) supply and exhausts that will be ready for FY 2001 contracting. NIST proposes to spend up to $500,000 and $400,000 for energy conservation projects for Boulder and Gaithersburg, respectively, for FY 2001 Safety, Capacity, Maintenance and Major Repairs (SCMMR). Increased funding will be requested in future SCMMR plans through 2010 to help meet the Executive Order 13123 energy efficiency improvement goals. Other future utility reduction measures during maintenance work include lighting retrofit and controls, solar film, direct digital control building controls, high efficiency electric motor replacement, and VAV hood operation.
Purchased Renewable Energy NIST has in place a contract to purchase wind energy for its Boulder, Colorado laboratory when available from the local utility company.
Million Solar Roofs Commerce is encouraging solarization of all sun rich facilities under the Million Solar Roofs initiative. Sites under consideration for solar power cogeneration include the NOAA-owned Weather Forecast Offices
86

and National Marine Fisheries Service Laboratories.
Water Conservation Chilled water consumption has been monitored in NIST campus buildings using two portable external pipe installed flow meters. A separate building chilled water differential temperature study will be completed by NIST to identify and correct chilled water low return water temperature problems with the goal to further improve the central chilled water plant efficiency and reduce CHW pumping power.
NOAA operates a Tsunami Warning Center in Ewa Beach, Hawaii, which currently uses 8 million gallons of potable water per year for landscape irrigation, at a cost of $20,000 per year. To offset the cost and reduce the amount of drinkable water used for irrigation, a groundwater irrigation project was begun. The project aims to capture groundwater from at least two highly productive wells, or from a pond that will be excavated. NOAA is paying the estimated project cost of $41,000, which has a simple payback of less than three years.
Implementation Strategies
Energy Audits Commerce is continuing to benefit from the SAVEnergy audits offered through DOE’s Federal Energy Management program. In FY 2000, Commerce completed six audits and plans to complete approximately six more in FY 2000. These include audits of weather service stations, laboratories, and office buildings.
NOAA’s strategy is to audit all of its facilities, as funding allows, to determine the most effective energy reduction and water conservation programs. In FY 2000 , f ive ins ta l la t ions submitted the SAVEnergy/FEMP SAVEnergy Request applications to DOE.
Financing Mechanisms In FY 2000, NOAA’s Western Regional Center continued implementation of a Super ESPC which started in FY 1998. The project involves replacing outdated and aging HVAC, lighting, and other energy consuming equipment. The Super ESPC will result in annual savings of $81,000 ($68,000 in energy savings, and $13,000 in maintenance savings).
NOAA’s Western Administrative Support Center (WASC) plans to use its existing conventional energy financing program for solar energy incorporation. The existing WASC Super ESPC was first implemented in
the DOE Western Region and the WASC Western Regional Center - Seattle, Washington was the third agency to be contracted for conventional energy efficiency improvements. DOE will provide feasibility study, design, and construction support under the Super ESPC.
NOAA is also working on a Utility Energy Service contract with San Diego Gas and Electric to implement energy conservation measures at the La Jolla Laboratory.
Sustainable Building Design Commerce is participating on the Task Force Working Group developing Federal guidelines for sustainable development and is preparing a far-reaching Sustainable Design policy statement to incorporate into its standard practices. NOAA is already incorporating these criteria into designs for new laboratories in California, Maine, Alaska, and Guam, eliminating the traditional mechanical ventilation systems and, instead, using natural ventilation.
Through its modernization program, the National Weather Service (NWS) is committed to increasing the energy efficiency of its facilities. NWS is replacing its old offices with new, energy efficient facilities.
NWS is integrating Sustainable Design into its newest WFO located in Tlyan, Guam. This was a formidable challenge because of the difficult functional and environmental requirements of the project. As the hub of the NWS in its region, the Guam facility is required to operate on a 24-hours a day 365-days a year schedule. The WFO houses sensitive electronic systems and complex communication equipment necessary to fulfill its mission of providing valuable weather data for the region.
Because of its location and critical mission. the facility is required to withstand 194 mile-per-hour typhoon winds and accompanying flying debris. The facility is self-sufficient, with a 7,000-gallon potable water tank and diesel electrical generators. The design also needed to address high humidity and salt corrosion problems. The team looked at the various opportunities to provide sustainable features such as: low maintenance, energy efficiency, use of alternate energy resources, waste reduction, recycled materials, optimizing indoor environmental quality. Using DOE 2.1 E Software, a benchmark-model of typical energy use in previous NWS facilities was created. This benchmark was used in analyzing various design and material specification options.
87

The overall strategies are expected to save approximately 22 percent in annual energy costs in comparison to a typical American Society of Heating, Refrigerating, and Air-Conditioning Engineers-compliant building. The sustainable design elements at the WFO Guam include building siting, landscape, maintenance, daylighting, building envelope. energy efficiency, alternate energy resources, indoor air quality, and recycled/renewable materials.
NIST plans to implement the Gaithersburg Campus Site-Wide Energy Conservation Master Plan measures that collectively can reduce the Gaithersburg existing laboratory consumption by 20 percent relative to FY 1990. NIST will continue to install energy and water conservation measures using the Gaithersburg Campus Site-Wide Energy Conservation Master Plan that identified over $10 million dollars of energy and water conservation measures. After FY 2005, additional engineering studies will be required to identify measures to obtain the 25 percent and 35 percent reductions.
Energy Management Contact Mr. James WoodsEnergy Conservation OfficerOffice of the Federal Property ProgramsU.S. Department of CommerceHerbert C. Hoover Building, Room 132914th and Constitution Avenue, NWWashington, D.C. 20230Phone: 202-482-0885Fax: 202-482-1969
88
C. DEPARTMENT OF DEFENSE
Management and Administration The Principal Deputy Under Secretary of Defense (Acquisition, Technology and Logistics) is the DOD Senior Agency Official responsible for meeting the goals of Executive Order 13123.
The existing DOD Installations Policy Board (IPB), chaired by the Deputy Under Secretary of Defense (Installations) and chartered to address a broad spectrum of installation issues, has been designated as the DOD Agency Energy Team. The membership of the IPB contains the cross-section of DOD senior leadership necessary to make decisions to remove obstacles hindering compliance with the Executive Order.
Awards In October 2000, the Department of the Navy held its FY 2000 annual Secretary of the Navy awards ceremony in Washington, DC. Seven awards were presented to Navy and Marine Corps winners in the categories of facilities, ships, and air squadrons. The Services also participated in the Federal Energy and Water Management Awards Program. In FY 2000, DOD received 24 awards. In addition to DOE and Service energy award programs, the White House recognized the Army’s Energy Team with a Presidential Award for Federal Energy Management, and the Omaha Public Power District awarded the prestigious J.M. Harding Energy Award to Offutt Air Force Base (AFB), Nebraska. Additionally, the Defense Commissary Agency (DeCA), the National Imagery and Mapping Agency (NIMA), Washington Headquarters Service (WHS), and the National Security Agency (NSA) incorporate on-the-spot awards and incentive awards to recognize exceptional performance and participation in the energy management program.
Performance Evaluations Energy management provisions are included in performance plans of the DOD energy chain of command, including major command, base and site energy managers. To ensure the inclusion of management provisions, action items were established in the FY 2001 Navy shore energy plan, while the Army conducts scheduled assistance visits to installations.
Training and Education Awareness and training programs are a critical part of DOD’s efforts to achieve and sustain energy-efficient operations at the installation level. In FY 2000, 2,361 DOD personnel were trained through either commercially-available or in-house technical courses,
seminars, conferences, software, videos, and certifications. The U.S. Army Logistics Integration Agency, Army Corps of Engineers Huntsville Engineering and Support Center, Civil Engineer Corps Officer School, Air Force Institute of Technology Civil Engineering School, and DeCA sponsored in-house courses and seminars. The Services held installation energy management conferences, and DOD personnel attended the Energy 2000 Workshop in Pittsburgh, Pennsylvania. DOD was a co-sponsor of Energy 2000, with WHS being an active participant in the planning committees for both Energy 2000 and Energy 2001.
Showcase Facilities In FY 2000, the U.S. Army Forces Command worked with DOE to designate Fort Irwin, California, as an energy Showcase installation. Fort Irwin has exceeded a 42 percent reduction in Btu/GSF through a systematic program to identify cost-effective energy projects, followed by an aggressive program of implementation supported by Southern California Edison. This Showcase installation demonstrated a variety of technologies including natural lighting and passive solar features, energy saving controls, thermal storage, solar photovoltaics, and gas-fired chillers.
The following Navy locations have been identified as candidates for new Showcase recognition: ! Bldg 33, Washington Navy Yard, Washington,
D.C., is an historic administration building incorporating sustainable design and development.
! Naval Air Station North Island, San Clemente Island, California, features wind farm electric generation technology.
! Bachelor Officers Quarters, Great Lakes, Illinois, includes high levels of insulation, high-performance windows, high-efficiency electric lighting, use of existing steam system for heating, a direct digital control system with setback, variable speed drive motors, and energy-efficient transformers.
Energy Efficiency Performance
Standard Buildings In FY 2000, DOD reported a 23.5 percent decrease in energy consumption from FY 1985 for its standard buildings when measured in Btu per gross square foot. DOD received credit for purchases of 1,373.4 billion Btu of renewable electricity, natural gas, and thermal energy. This lowered the energy intensity of its standard buildings from 105,228 Btu/GSF to 104,543 Btu/GSF.
89
Industrial and Laboratory Facilities The FY 2000 DOD Scorecard established a FY 1990 baseline of 213,349 Btu/GSF for the newly defined Industrial, Labs, Research and Energy Intensive Facilities category. For this new facilities category, DOD has achieved a 22.7 percent reduction in Btu/GSF consumption relative to the FY 1990 base year.
Because the relationship between energy consumption and production varies widely between processes, DOD has decided to use energy usage per gross square foot as the performance measure for the industrial and laboratory facility category. Additionally, to simplify data collection, and the associated metering and reporting costs, DOD considers an entire base an industrial facility if 60 percent or more of the base-wide energy use is for industrial purposes.
Exempt Facilities The Navy is the only component in DOD to list facilities classified as exempt. The Navy exempts mission-critical, concentrated energy use transmitters, simulators, cold iron support to ships, and some private party facilities. These are non-production-oriented facilities with little or no square footage, making conventional performance measures meaningless. The mission criticality of these end users is such that energy efficiency measures are evaluated on a case-by-case basis.
Tactical Vehicle and Equipment Fuel Use Total tactical vehicle fuel use was 199,151 billion Btu in FY 2000, decreasing 6 percent from FY 1999, primarily through improved fuel efficiency of equipment and energy conserving operating procedures. Improving fuel efficiency in DOD tactical equipment increases vehicle range and sustainability, and reduces logistics support requirements. The reduction in jet fuel consumption (9 percent from FY 1999) was the significant factor in the overall reduction. The Navy has saved $110 million annually in fuel costs for its ship and aircraft fleets through technological advances and operational practices.
DOD’s commitment to use alternative fuels in AFVs and to reduce the use of fossil fuels was underscored by the multi-component participation in implementing a bio-diesel fueling site at the Navy Exchange Service Station near the Pentagon. Bio-diesel may be used in any vehicle that uses diesel as a fuel. The B20 fuel (20 percent bio-diesel and 80 percent diesel fuel) provided at the Navy Exchange Service Station is an approved alternative fuel, and may be used by Federal, State and local government agencies.
Self-Generated Renewable Energy As these technologies have become more cost-effective, DOD has integrated photovoltaic power systems, solar water heating systems, and transpired solar collectors (solar walls) into its facilities. Self-generated power is often coupled with ground-source heat pumps, solar water heating systems and photovoltaic arrays to generate electricity at isolated locations, such as range targets, airfield landing strip lighting and remote water pumping stations. Active solar heating applications have included maintenance facility solar walls, swimming pool heating, and water heating. Projects installed in FY 2000 include solar domestic water heaters at Camp Stover, Hawaii, and Marine Corps Logistics Base, 29 Palms, California. Solar photovoltaics were used at Naval Base San Diego, CA; Naval Air Station, North Island, California; and Naval Air Warfare Center, China Lake, and Santa Cruz Island, California. A solar roof was constructed at Ford Island, Hawaii, while an outdoor warning system was installed using solar backup batteries at Goodfellow Air Force Base, Texas. Geothermal heat pumps have been installed at MCB Camp Lejeune, California; Tyndall Air Force Base, Florida; and Charleston Air Force Base, South Carolina. The Pentagon Heating and Refrigeration Plant Complex has installed a 30-kilowatt photovoltaic array.
Purchase of Renewable Energy In FY 2000, the Army purchased 276 megawatt-hours of electrical power generated from renewable sources, the Air Force Academy purchased 45 megawatt-hours of wind generation from the local utility, and the Navy purchased 163,696 megawatt-hours of renewable electricity and 803.5 billion Btu of renewable thermal energy. The Naval Shipyard, Norfolk, Virginia, purchases electricity and steam from its now privatized waste-to-energy plant, while Naval Air Station, Keflavik, Iceland, purchases hot water from geothermal wells and electricity from hydroelectric plants.
Million Solar Roofs (MSR) Active solar heating applications have been expanded at DOD to include maintenance facility solar walls, swimming pool heating, and water heating in family housing. The Army has approximately 3,000 “solar roofs” in use at its installations and expects to develop and implement other solar and solar-thermal projects in FY 2001.
In addition to the projects listed under “self-generation renewable energy,” installations which implemented solar projects in FY 2000 were Fort Hood, Texas; Fort Bragg, North Carolina; Fort Polk, Louisiana; Fort Irwin, California; Fort McPherson, Georgia; Fort
90

Lewis, Washington; Fort Gillem, Georgia; Hickam AFB, Hawaii; Andersen AFB, Guam; and Kadena Air Base, Japan.
Petroleum DOD’s petroleum-based fuel use in all of its facilities has decreased 65 percent from the FY 1985 baseline. Reductions were accomplished primarily through fuel switching (to natural gas), tune-ups, steam trap replacements and improved controls in boiler plants. A significant factor in the reduction is Defense Energy Support Center’s (DESC) Natural Gas Competitive Procurement Program. The objective of this program is to obtain cost-effective supply of natural gas for DOD installations while maintaining supply reliability. In FY 2000, DESC competitively procured 66 trillion Btu of natural gas (20 trillion Btu more than in FY 1999) for the 163 DOD installations that participated in the program and avoided costs of over $32 million ($3 million more than in FY 1999). Boiler conversion from fuel oil to natural gas reduced petroleum usage by 3.2 million gallons (480 billion Btu), from FY 1999.
Water Conservation In FY 2000, DOD consumed 207.4 billion gallons of potable water and spent $309 million on water related services. Although DOD water use has decreased steadily, the costs associated with its use have not come down proportionately, due to an increase in the unit cost of water in many regions. For instance, while the Army’s water use dropped by almost 45 percent between FY 1992 and FY 1999, the cost of water service only decreased by 13 percent. Similar trends exist for water disposal volumes and costs. In the same time period, water disposal volume dropped by 49 percent, while costs decreased by only 8 percent. This reflects a unit disposal cost increase of 80 percent. Additionally, some installations that purchase their water are increasingly likely to be on rate schedules designed to encourage conservation, such as increasing block rates or summer peak-demand charges. Thus, water conservation efforts, in addition to being environmentally responsible, can help installations stretch dwindling Operation and Maintenance dollars. Also, those water conservation measures that reduce wastewater quantities provide an additional opportunity for savings.
Implementation Strategies
Life-Cycle Cost Analysis DOD facilities use life-cycle cost (LCC) analysis in making decisions about their investment in products, services, construction, and other projects to lower costs and reduce energy and water consumption. DOD
considers the LCC of combining projects, and encourages bundling of energy efficiency projects with renewable energy projects, where appropriate. Projects are generally prioritized for capital funding and execution based upon the greatest life-cycle savings to investment ratio. The use of passive solar design and active solar technologies are recommended where cost-effective over the life of the project. Sustainable development projects use LCC methodology and follow the Whole Building Design Guide.
Facility Energy Audits Comprehensive audits were conducted on 161.6 million square feet (12.4 percent of facility square footage) in FY 2000. Since 1992, comprehensive audits were completed on 758.8 million square feet (55 percent of facility square footage). Auditing 10 percent of facilities annually has been cost prohibitive and many Defense components have been unable to fully fund the audit program. To make up for part of this shortfall, components obtain audits as part of alternative-financed energy savings projects whenever feasible. In addition to energy audits performed in conjunction with alternative-financed projects, the Army uses the “Renewables and Energy Efficiency Planning” (REEP) model, a headquarters-level screening tool for energy and water conservation opportunities that evaluates energy technologies based on their energy savings potential, financial viability, and global warming reduction potential. REEP is a project identification model that forecasts quickly and accurately the effects of installing a new piece of equipment or technology at specific installations and can provide Army-wide analysis for specific constraints. This program can be coupled with an integrated energy methodology to help installations prepare an energy master plan and strategy.
Financing Mechanisms In FY 2000, DOD, through a decentralized approach, awarded 40 UESC and 58 ESPC task orders/contracts producing a total life-cycle savings of $782.6 million with the contractors’ share being $603.5 million (including interest charges). These contracts include many infrastructure upgrades and new equipment to help the installations reduce energy and water consumption. Examples include new thermal storage systems, chillers, boilers, lights, motors, EMCS systems and water reducing devices. Savings generated over time (estimated to be about 77 percent of total savings) are returned to the contractor to pay for the improvement measures. Normally, cost savings are used to first pay the contractor, and then are used to offset other base operating support expenses. In some cases, however, installations decide to seek a shorter contract term and defer all Government cost savings until
91

contract completion. In these cases, the savings generated by UESCs and ESPCs help to reduce the energy consumption, but do not reduce the total costs of operation until the contracts expire. After contract expiration and the retrofits are paid for, DOD will retain full cost savings.
There were no appropriations for DOD’s request for $50 million for the Energy Conservation Investment Program (ECIP) in FY 2000 and $15 million of the requested $33.5 million in was appropriated in FY 2001. However, in FY 2000, DOD received a Congressional add of $4 million to facilitate implementation of ESPCs. A similar $4 million Congressional add for ESPCs is in the FY 2001 Defense Appropriations Bill.
ENERGY STAR® and Other Energy-Efficient Products When life-cycle cost-effective, the Defense components select ENERGY STAR® and other energy-efficient products when acquiring energy-consuming products. Guidance generated by DOE, General Services Administration (GSA) and DLA for energy–efficient products are being incorporated into the sustainable design and development of new and renovated facilities. Information technology hardware and computer and copying equipment are acquired under the ENERGY STAR® program using GSA schedules and either Government-wide or Service contracts. The Defense Commissary Agency (DeCA) requires premium efficiency fan motors for HVAC systems, electronically commuted fan motors on the refrigeration display cases, T-8 fluorescent light fixtures on display cases, and T-8 lighting for sales areas. Another example of the program is the Pentagon Renovation Program’s use of ENERGY STAR®/National Fenestration Rating Council’s guidance for replacement windows.
ENERGY STAR® Buildings DOD currently does not have any ENERGY STAR®
certified buildings, because the buildings generally are not individually metered and temporary metering schemes are cost prohibitive. However, a memorandum of understanding (MOU) signed in June 1997 between DOD, DOE, and EPA allows military installations to self-certify buildings as ENERGY STAR® equivalents if comprehensive audits were conducted and all projects with a 10-year or better payback were implemented. To date no buildings have been certified under this MOU.
Sustainable Building Design The concepts of sustainable development as applied to DOD installations have been incorporated into the master planning process of each of the Services. The Navy co-sponsored the development of the Whole
Building Design Guide, and a commissioning guide, in cooperation with the Passive Solar Industries Council, which incorporates the U.S. Green Building Council’s Leadership in Energy and Environmental Design (LEED) criteria. The Navy is also looking at opportunities to apply sustainable development concepts to ship pier-side loads. Additionally, the U.S. Army Corps of Engineers has developed a 3-day sustainable workshop to train DOD personnel.
Energy Efficiency in Lease Provisions DOD emphasizes energy and water conservation in leased facilities and each Service has issued guidance directing that all leased spaces comply with energy and water efficiency requirements. It is DOD’s intent to have the landlord make appropriate investments in energy efficiency which can be amortized in the lease, provided the new total cost (energy costs plus lease cost) does not exceed total costs without improvements. These leases should amortize the investments over the economic life of the improvements. Build-to-lease solicitations for DOD facilities will contain criteria encouraging sustainable design and development, energy efficiency, and verification of building performance. DOD relies upon GSA to ensure the above provisions are included in buildings that they lease for DOD.
Industrial Facility Efficiency Improvements Several major initiatives for industrial facility efficiency improvements under way include fuel switching at Altus AFB, Oklahoma; waste heat usage to run 1,500 tons of absorption chillers at Wilford Hall Medical Center, Lackland AFB, TX; and installing two thermal storage units serving seven facilities at Laughlin AFB, Texas. The Army used the Process Energy and Pollution Reduction software developed by and available from the Army’s Construction Engineering Research Laboratory (CERL) to evaluate their energy reduction potential in industrial facilities. DeCA, with a large inventory of commissary stores, installs dual-path air conditioning to control humidity as an alternative to natural gas or propane fired desiccant dehumidification systems. DeCA also uses and plans to increase the use of heat-pipe technology for dehumidification and heat reclaim. Domestic hot water heat reclaim systems are standard in most large commissary store systems. Remote diagnostic monitoring of Refrigeration Monitoring and Control Systems is used at approximately 175 individual commissaries to assure that refrigeration and lighting systems are being operated and maintained at their design specification. Discrepancies are forwarded to DeCA’s maintenance contractors on a daily basis for correction. Lighting controls were monitored and
92

adjusted by this same method in FY 2000. This surveillance resulted in improved contractor maintenance and improved equipment operation and less energy consumed. The DeCA Eastern Region Utilities Task Force was formed in FY 2000 to identify potential energy savings with the objective of driving total operating costs down.
Highly Efficient Systems DOD encourages the component agencies to combine cooling, heating, and power systems in new construction and/or retrofit projects when cost effective. The Army is currently in the third year of a 5-year, $300 million central boiler plant modernization program. The goals of this program are to update the aging central boiler plant infrastructure that are currently found on many installations. These projects have resulted in upgraded or new boilers, new distribution systems, improved high efficiency pumps and motors, and updated system controls in all of these plants. The Navy used an ESPC to install a 5-megawatt gas turbine with 70,000 lb/hour heat recovery steam generators at Naval Shipyard, Portsmouth, NH. Several Air Force projects have included the use of geothermal and biomass systems. Tyndall AFB, FL, and Bolling AFB, DC, have installed ground source heat pumps, and Wright-Patterson AFB, Ohio, has awarded an ESPC to construct a 1.2-megawatt biomass unit at the base.
Off-Grid Generation DOD is pursuing off-grid generation where it is life-cycle cost-effective. The Army’s Fort Hood is using two new innovative energy reduction technologies: solar parking lot lighting and an active daylighting system. Each of the 156 units of active daylighting installed produces the equivalent of approximately 600 to 800 watts of flourescent light—virtually eliminating all daytime electric lighting—equating to more than 1.4 billion Btu of renewable energy. The solar parking lot lighting system uses just two panels to produce 800 kilowatt-hours per year. These two projects combined to save the installation $103,000 in FY 2000. The Navy also installed three 225 kilowatt wind generators at San Clemente Island, California, producing 5.2 million kilowatt hours of electricity and three solar photovoltaic systems (160 kilowatt total) at Santa Cruz Island producing 238,000 kilowatt-hours of electricity.
Water Conservation In addition to establishing an overall water baseline to evaluate water usage and monitor the impact of future water efficiency improvements, Defense components concentrated on water conservation methods such as early leak detection and repair, installation of low-flow water-efficient fixtures in housing and administration buildings, and public awareness programs.
Energy Management Contact Captain Kevin E. MikulaDirector, Energy OfficeHousing and Energy DirectorateOffice of the Deputy Under Secretary of Defense forInstallations3000 Defense Pentagon, Room 30-284Washington, D.C. 20301-3000Phone: 703-697-6195Fax: 703-695-1493
93

D. DEPARTMENT OF ENERGY (DOE)
Management and Administration In FY 2000, DOE designated the Deputy Secretary of Energy as the senior official responsible for meeting the goals of Executive Order 13123, and appointed a technical support team. In addition, the Department’s Energy Management Steering Committee, comprised of Federal Energy Management Program and DOE Secretarial Officer representatives, establishes and implements internal policy for energy management and integrates these activities into DOE program operations.
Recognition During FY 2000, seven Departmental Energy Management Awards were presented to organizations and individuals. Eleven DOE organizations have employee incentive programs to reward exceptional performance in energy management.
Performance Evaluations Thirteen DOE sites are relating energy activities to employee performance evaluations and position descriptions.
Training Technical training and energy awareness activities continue to be emphasized in site energy management programs. Sixteen DOE organizations have training programs in place or take advantage of training and education opportunities as they arise. For example, at Sandia National Laboratory (SNL) many staff have attended energy savings performance contract training, as well as a seminar sponsored by the Rebuild America program. Also, an energy programming workshop was held at SNL on how to integrate comprehensive energy efficiency design principles into a major project at the Laboratory.
Showcase Facilities Many DOE facilities do not qualify as Showcase Facilities because visitation is restricted due to national security or safety reasons. While DOE sites have not designated any buildings for FY 2000, Pacific Northwest National Laboratory (PNNL), Rocky Flats (RF), and Los Alamos National Laboratory have facilities which are considered exemplary.
Energy Efficiency Performance
Standard Buildings In FY 2000, DOE reported a 43.7 percent decrease in energy consumption from FY 1985 for its standard buildings when measured in Btu per gross square foot. DOE received credit for purchases of 0.9 billion Btu of
renewable electricity. This lowered the energy intensity of its standard buildings from 249,979 Btu/GSF to 249,969 Btu/GSF.
Reductions in DOE’s consumption in FY 2000 is partially due to reduced mission-related activities and overall downsizing of operations and facilities. As manpower is reduced and facilities are closed, efforts are ongoing to consolidate operations and minimize energy use in vacated buildings. This includes review of HVAC systems, lighting, transformers, and other building equipment usage.
Industrial and Laboratory Facilities DOE’s metered process facilities saw a reduction in Btu/GSF of 14.0 percent since FY 1990. This reduction is mainly attributable to reduced mission-related activities and overall downsizing of operations and facilities. DOE anticipates exempting appropriate facilities from the requirements of Executive Order 13123 during the FY 2001 reporting period and updating its reporting system to accommodate this change. Most of the facilities proposed for exemption are currently reported under the metered process category and have been scaled back operationally to prepare for decontamination and decommissioning. As part of the reporting change for FY 2001, some laboratory buildings currently being reported under the standard buildings category may also be reclassified under the energy intensive facility category.
Savannah River Site (SRS) accomplished the following industrial energy efficiency improvements during FY 2000:
! Completed design and began construction of a new 2,200-ton central chilled water facility supporting the Regulatory Monitoring and Bioassay Laboratory project. The plant will consist of a three chiller arrangement and will use ozone-friendly refrigerant. It replaces 15 existing R-22 chillers and three new chillers projected for the new facility. The facility is expected to save 1.7 billion Btu annually from the current configuration plus the new facility;
! Completed facility plan for four 500-ton HVAC chillers and two 280-ton chillers in the Defense Waste Processing Facility. All six new chillers will use ozone-friendly refrigerant and save 2.9 billion Btu per year; and
! Completed design and began construction of a new pelletization facility for use of alternate fuels (paper) in site stoker-fired boilers. This project is
94

estimated to reduce coal use by approximately 2,200 tons per year.
Numerous energy efficiency projects were completed during FY 2000 at Lawrence Livermore National Laboratory (LLNL). Projects addressed retrofits for energy efficiency in central utility systems and in building systems. Seventeen projects were completed, with a combined investment of $699,000. One of the most successful projects involved compressed air system leak surveys and repairs. Compressed air leakage was reduced to such a great extent that one of the air compressors was moved from standby use to de-energized status.
During FY 2000 a new 100,000-pounds-per-hour, natural gas-fired steam boiler was put into service at Oak Ridge National Laboratory (ORNL). This project is part of a 10-year master plan for the ORNL central steam plant that allows the burning of coal and the handling of coal to be eliminated. This project will save significant energy, maintenance, operation, and environmental-related expenses. Condensate pumps were replaced and the final system checkout was accomplished. This project allows a portion of steam condensate to be returned to the main steam plant rather than being discharged, thus reducing the amount of makeup water required and reclaiming lost heat.
SNL implemented cooling tower optimization at Building 858, a chilled water plant. Estimated annual savings are $18,000.
Brookhaven National Laboratory (BNL), Stanford Linear Accelerator Center (SLAC), Idaho National Engineering and Environmental Laboratory (INEEL), and RF also reported implementing improvements in industrial facilities.
Tactical Vehicle and Equipment Fuel Use INEEL reported that tactical vehicle fuel use is dependent primarily on factors uncontrolled by fleet operations personnel, such as funding, weather, and emergency needs. Over-the-road vehicles at INEEL are switching from gasoline and diesel to compressed natural gas and LNG. ORNL is working on switching from pure diesel to bio-diesel for all diesel-powered tactical vehicles and equipment. Thirty-two ethanol vehicles are also in use, and ORNL is installing a 10,000-gallon ethanol storage tank to support them.
Renewable Energy The LLNL Environmental Rededication Department has deployed eight solar units. The units are photovoltaic-powered, portable groundwater contamination treatment units. Each unit’s array is capable of generating approximately 400 watts of electric power.
National Renewable Energy Laboratory (NREL) generates a small amount, less than 1 percent of its electrical load, with photovoltaics and wind power. These applications were installed as a means of demonstrating the technology.
On April 20, 2000, the Secretary of Energy directed DOE to purchase 3 percent of its total electricity needs from non-hydro renewable energy sources by 2005, and 7.5 percent of its total electricity purchases from renewable by 2010. In certain cases, DOE officials may find that electricity produced from renewable power costs more than electricity produced using other energy sources, such as conventional fossil fuels. In those instances, DOE will use the incremental costs saved from energy projects, savings obtained through lower energy costs as a result of retail electric competition, contract negotiations with utility companies, and utility rate reductions. By combining the lower cost electricity with some portion of moderately more expensive renewable electricity, DOE will not increase its overall utility budget.
This past year, ORNL, in signing up for the Tennessee Valley Authority (TVA) “Green Power Switch” program, became the TVA’s first industrial green power participant. The TVA program presently includes three wind turbines atop Buffalo Mountain in the Southeast’s first commercial-scale use of wind power to generate electricity. Also, the TVA program includes four solar collectors at one site, with eight more sites and a landfill gas-to-energy facility planned in the near future. More specifically, in support of the Green Power Switch program, ORNL signed up for 675 megawatt-hours annually at an incremental cost of $18,000 annually.
NREL subscribed to purchase 28 megawatt-hours of wind-generated electricity during FY 2000, about 2.4 percent of its power. The Golden Field Office (GFO) subscribed to purchase 72 megawatt-hours of wind power or 23 percent of its electricity consumption. The GFO occupies leased space. GFO does not normally pay utility bills separate from its lease payments. Instead, GFO will pay the premium costs for the wind-power.
95

As part of the Million Solar Roof program, INEEL included solar initiatives in two new building designs. A solar wall on the new Records Storage Facility is currently being constructed in Idaho Falls, and solar water heating is included in the design of the Site Operations Center facility.
Petroleum Since FY 1985, DOE has substantially reduced its use of petroleum-based fuels in its facilities. In FY 2000, DOE reduced consumption of fuel oil in its standard buildings by 52.4 percent from 11.1 million gallons in FY 1985 to 5.3 million gallons in FY 2000. The use of LPG/propane was reduced 66.2 percent during the period.
Similar reductions were seen in DOE’s energy-intensive metered process facilities. Fuel oil consumption in these facilities decreased 73.6 percent from 7.9 million gallons in FY 1985 to 2.1 million gallons. LPG/propane use in metered process facilities decreased 33.3 percent during the period, a reduction of more than 69,000 gallons.
Water Conservation Water conservation procedures have been practiced at LLNL in California for many years. In response to drought, irrigation procedures and planting standards have been modified, resulting in significant reductions in water use. Two water conservation projects were begun in FY 2000 that invest $100,000 to purchase sensor-type urinal flush valves and ultra-low flow toilets.
ORNL’s site-wide program to improve water treatment identified a leaky, oversized wood-basin cooling tower and replaced it with an existing, surplus, properly sized cooling tower.
Implementation Strategies
Life-Cycle Cost Analysis Life cycle cost (LCC) analysis is required for all energy and water conservation projects that are proposed for implementation at Argonne National Laboratory (ANL) by Utility Energy Services Contracts (UESC) and Super Energy Savings Performance Contract (ESPC) contractors. LCC analysis allows the Laboratory to determine if the lifetime of the equipment and systems installed by such projects outlive the payback period of the project by at least 25 percent. Additionally, the Laboratory requires that the UESC and ESPC contractors screen each audited facility for the application of renewable energy as part of any facility upgrade project proposal. This allows the Laboratory to
determine if bundling of renewable energy concepts with other energy conservation opportunities is cost effective on a life cycle basis.
At LLNL, procedures are in place to ensure that funds controlled by the LLNL Energy Management Program use LCC analyses in making investment decisions. Several “Ten-Minute Trainers” were conducted during FY 2000 to educate maintenance coordinators, project managers, and administrators to promote investment decision-making using LCC analyses.
At Pantex, LCC analysis is used regularly with Motor Master software to confirm replacements of inefficient motors with premium efficient versions. LCC was used to purchase two air-cooled screw chillers instead of replacing the existing chiller with another water cooled one. It was also used to install a steam-powered condensate return units with a higher first-cost instead of repairing continuously-broken electric pumps. LCC analysis was used in a capital project to upgrade emergency power at the steam plant to include the two large boilers. Pantex had a 15-year low in natural gas usage this year as a result.
Energy Audits PNNL conducted several audits and self-assessments of its energy and energy-related operations and maintenance, including a study on the potential cost savings of performance-based contracts that can bring capital improvements and improved practices to utilities. PNNL also initiated a multi-year continuous-commissioning campaign that coordinates the implementation of traditional and alternative financed projects. NREL completed an energy audit of 100 percent of its DOE-owned facilities in July 2000. The audit was conducted on all facilities to determine how well previously completed projects are operating now and to determine the need for future projects.
Financing Mechanisms DOE received no direct appropriations for in-house energy management during FY 2000. No funds have been appropriated by Congress for DOE in-house energy efficiency projects since FY 1995.
DOE requested $5 million for energy efficiency projects for FY 2001, of which $2 million was appropriated.
Obtaining alternate financing for energy efficiency projects in the form of ESPCs or UESCs is considered vital to continued energy reductions. To date, DOE has awarded and completed six UESC projects with a total private sector investment of almost $23 million. On the
96

ESPC front, DOE has awarded five site-specific ESPCs to date and two Super ESPC delivery orders.
At the Savannah River Site (SRS), all design and construction activities associated with Task Order #1 of the site-wide ESPC were completed on schedule in September 2000. This task order consisted of upgrades in 16 administrative facilities. A total of 540,000 square feet of building space was audited in the development of this task. The capital upgrades, at a cost of approximately $1.7 million, included lighting enhancements, energy management control system installations, and HVAC improvements. The total contractual cost over 14 years is approximately $3.8 million, with guaranteed annual energy and O&M cost savings totaling $268,000.
On June 1, 2000, the DOE’s Pantex Plant, located in Amarillo, Texas, awarded a Super ESPC delivery order to Northeast Energy Services, Inc. (NORESCO). NORESCO will invest $4.45 million in the Pantex Plant, a nuclear weapons assembly and disassembly facility, in order to replace and update old, inefficient, maintenance-intensive equipment. The delivery order will cover Area 12 of the facility, about 450,000 square feet, or about 15 percent of the total site. NORESCO will install several energy conservation measures, including:
! Lighting retrofits; ! Energy management and control systems;! Chilled water and steam distribution system
upgrade; ! Rooftop air handling unit replacements; ! A small solar water heating system; ! Domestic hot water temperature reset; ! Controls for air preheat coils; and ! Ozone laundry system.
The energy conservation measures noted above will produce significant savings for the site. Annual energy savings will total more than 86 billion Btu, annual energy cost savings will total $449,000, and annual operations and maintenance savings will total almost $32,000. This means the site will save more than $480,000 per year during the entire 17-year contract term, with a project total of $8.18 million. By awarding such a large project, the DOE has made it clear that it sees the use of Super ESPCs as an excellent method of addressing problems of old, inefficient equipment.
ANL has been working throughout FY 2000 to secure delivery orders on one UESC and three ESPCs. During FY 2000, the UESC project and one of the ESPC projects were completed through final proposal status;
however, no delivery order had been signed. The two projects have a total estimated cost of approximately $2 million and $2.5 million respectively with annual energy cost savings on each project at the $280,000 level. The ESPC contractor began preliminary proposals on two additional projects in FY 2000.
Energy-Efficient Product Procurement ANL utilizes ENERGY STAR® labeled products and specifications for office and construction purchases as an ongoing procurement policy. The Laboratory’s procurement organization has previously modified the Laboratory standard Commercial Terms and Conditions document to include EPA ENERGY STAR® requirements in the purchase and warranty provisions.
LLNL master construction specifications have been modified over the past two fiscal years to encourage the selection of the equipment recommended in the ENERGY STAR® program and products included in FEMP’s Product Energy Efficiency Recommendations.
SLAC has an ongoing program to procure products that increase energy efficiency and conservation. The most energy-efficient magnets and other equipment, which meet specifications for the accelerator, are purchased on an ongoing basis.
ORNL sites routinely purchase new computers with ENERGY STAR® ratings. A “Green Acquisition Advocate” was established at Thomas Jefferson National Accelerator Facility to address purchases of ENERGY STAR® products.
Hanford, Brookhaven, Oak Ridge Institute for Science and Education (ORISE), Ames, Strategic Petroleum Reserve, INEEL, Federal Energy Regulatory Commission, RF, Waste Isolation Pilot Plant (WIPP), and Pantex also report varying levels of participation in the ENERGY STAR® program and the purchase of energy-efficient equipment and products.
ENERGY STAR® Buildings An assessment of the energy efficiency of buildings at ORNL led to the Buildings Technology Center headquarters building being officially designated as an ENERGY STAR® building in FY 2000. This is one of the first DOE buildings to achieve this rating and only the second building in the State of Tennessee to do so. The building outperforms more than 90 percent of the office buildings across the United States.
Sustainable Building Design The SRS made significant progress in FY 2000 in implementing the principles of sustainable design using
97

guidance provided in the DOE Draft Sustainable Design Integration Procotcol. In FY 1999 and FY 2000, the following projects at SRS implemented sustainable design principles:
! B-Area chiller replacement project (under construction);
! Super compactor project (complete); ! Regulatory Monitoring and Bioassay Laboratory
project (under construction); and ! Tritium Extraction Facility (in design execution).
Sustainable building design principles have been incorporated into the siting, design, and construction of the new Central Supply Facility at ANL. Construction of the new facility began in FY 2000.
At LLNL, SLAC, PNNL, INEEL, ORNL, and Pantex, sustainable design principles are being implemented or are planned for a variety of facility types.
Energy Efficiency in Lease Provisions PNNL included significant energy efficiency features in its new user housing facility to be built in FY 2001 by a private developer who will lease it back to PNNL. PNNL used FEMP’s Federal Energy Decision Support tool to help determine which energy technologies where cost effective under various lease periods (5, 10, and 15 years).
Highly Efficient Systems LLNL Energy Management, Geothermal and Environmental Technologies, and Environmental
Remediation programs have combined to conceive, develop, evaluate, and advocate a method of extracting energy efficiency from an untapped renewable energy resource. This resource is the treated effluent from pollution prevention groundwater remediation pump-and-treat installations. Utilization of this resource as condenser water in a nearby building’s water-source heat-pumps, and, further as irrigation water, represents technological and programmatic synergism. LLNL has successfully demonstrated this technology application at its own site.
Off-Grid Generation During FY 2000, a natural gas-fired micro turbine was installed by the ORNL Energy Division and is currently undergoing operational testing. The turbine is tied into the Tennessee Valley Authority electrical power grid and can generate 30 kilowatts of power. The turbine can be remotely monitored, started, and stopped. Although it is tied into the electrical power grid, the turbine is primarily intended for research use in the area of enhancing energy efficiency components and systems.
Energy Management Contact Mr. Victor P. PetrolatiU.S. Department of EnergyForrestal Building, Room 6B-0521000 Independence Avenue, SWWashington, DC 20585Phone: 202-586-4549Fax: 202-586-3000Email: [email protected]
98

E. DEPARTMENT OF HEALTH AND HUMAN SERVICES (HHS)
Management and Administration The U.S. Department of Health and Human Services (HHS) has established a centralized energy program to coordinate the energy and water conservation efforts throughout the Department, facilitate alternative financing of energy and water projects, promote Federal energy programs, manage an extensive energy awareness campaign, and provide information and assistance to meet the goals of Executive Order 13123. In FY 2000, the HHS Energy Program was strengthened by developing energy scorecards for the Operating Divisions (OPDIVs), holding a poster contest for Energy Awareness Month, assisting in the hiring of a dedicated energy manager at the National Institutes of Health Bethesda Campus, analyzing the classification of HHS facilities, and facilitating the implementation of renewable energy projects.
The six HHS OPDIVs that manage real property are the Centers for Disease Control and Prevention (CDC), the Food and Drug Administration (FDA), the Indian Health Service (IHS), the National Institutes of Health (NIH), the Office of the Secretary (OS), and the Program Support Center (PSC). The HHS Senior Agency Official is the Assistant Secretary for Management and Budget.
In FY 2000, the HHS energy team addressed the implementation of renewable energy projects, the measurement of energy and water efficiency performance, the publication of HHS projects in the Federal Energy Management Program’s FEMP Focus, the classification of HHS facilities, and the expanded use of alternative financing vehicles.
Recognition In FY 2000, the annual HHS Energy and Water Management Awards Program presented six awards to individuals, small groups, and one organization for exceptional performance in energy efficiency/energy management, water conservation, and alternative financing.
Also in FY 2000, Frank Kutlak, an NIH architect/project officer, received a Federal Energy and Water Management Award for managing the design and construction of the energy-efficient Louis Stokes Laboratory.
In FY 2000, three HHS Energy Champions posters were recognized under the “You Have the Power” energy awareness campaign.
In addition, OS used its internal awards programs in FY 2000 to recognize three individuals for their work on energy awareness events and recycling. The IHS Portland Area used on-the-spot awards to commend employees who implemented and demonstrated successful energy management policies and practices.
Performance Evaluations Several key OPDIV energy management personnel positions contain critical performance elements that address energy and water efficiency, particularly within OS, NIH, CDC, and PSC.
Training In FY 2000, 103 HHS energy personnel received training in energy and water efficiency topics. This training included OPDIV-specific workshops, DOE or FEMP classes, utility or manufacturer-sponsored training, and the HHS Energy Seminar.
Outreach and energy awareness programs are widely used throughout the OPDIVs and by the HHS Energy Program to highlight ENERGY STAR® products and programs, as well as the procurement of these and other energy efficient products.
Showcase Facilities HHS last designated a Federal Energy Saver Showcase Facility in 1999—the state-of-the-art, energy efficient NIH Louis Stokes Laboratory, Bethesda, Maryland. The following candidates are being considered for FY 2001:
! The Hubert H. Humphrey Building, Washington, D.C. - This facility is a past Showcase building. Current plans to implement a renewable energy project at the site will deem it a strong candidate for a renewable energy Showcase;
! The NIH Bethesda Campus, Bethesda, Maryland -The 850,000 square foot state-of-the-art Clinical Research Center, currently under construction, will utilize innovative energy conservation initiatives such as steam driven electric generating turbines as a means of conserving steam energy; and
! Parklawn Building, Rockville, Maryland - The Parklawn facility management has worked extensively with the lessor of the building to incorporate energy and water efficiency measures, lowering the energy consumption by 19 percent as compared to FY 1985.
99

Energy Efficiency Performance The HHS energy efficiency performance has changed significantly from FY 1999, due to the reclassification of 89 percent of the Department’s square footage to energy intensive facilities.
Standard Buildings In FY 2000, HHS reported a 17.4 percent decrease in energy consumption from FY 1985 for its standard buildings when measured in Btu per gross square foot.
Industrial and Laboratory Facilities As previously mentioned, 89 percent of the HHS square footage is energy intensive facilities including laboratories, hospitals, animal centers, health clinics, and other related support space. The performance measure used for the HHS energy intensive facilities is Btu/GSF.
In FY 2000, the energy consumption of HHS energy intensive facilities declined 12.3 percent compared to FY 1990.
Comparing equivalent energy intensive facility square footage, FY 2000 energy consumption was 7.9 percent higher than the FY 1999 usage. The change was primarily due to increased fuel oil usage by the NIH Bethesda Campus to cover heating loads when their contracted natural gas supply was interrupted. In FY 2000, the campus experienced an unusually high number of interrupted periods to the natural gas supply. In addition, an influx of new construction on CDC and NIH campuses has caused an increase in overall energy consumption.
Since the majority of HHS square footage is considered energy intensive, most energy projects address energy intensive systems such as steam systems, boiler operation, fuel switching, and co-generation. For example, the NIH Bethesda Campus has implemented many projects over the past eight years to improve energy efficiency in its buildings. These include the replacement of inefficient chillers with ultra efficient large capacity models, the retrofit of oil burning boilers to use natural gas as the primary fuel, the upgrade of boiler burners to state-of-the-art low nitrogen oxide units, and the replacement of the utility distribution system with larger capacity lines to reduce heat loss and overall chilled water operating pressures. In FY 2000, NIH executed a Utility Energy Service Contract (UESC) with the local utility for the construction and operation of a 23-megawatt cogeneration unit.
In FY 2000, FDA replaced HVAC and central plant equipment with high efficiency models at the National
Center for Toxicology Research (NCTR) in Jefferson, Arkansas. A UESC has also been initiated at the FDA Module One (MOD1) facility in Laurel, Maryland, to make similar energy efficiency improvements.
The IHS Anchorage Area requires that energy audits include alternative analyses to identify potential energy savings from improvements to existing facility operations, environmental conditions, HVAC equipment, and the local utility sources of energy. The IHS Bemidji Area facility (serving Illinois, Michigan, Minnesota, and Wisconsin) has converted boilers from fuel oil to natural gas, replaced cast iron boilers with energy efficient staged boiler systems, continued the replacement of lamps and ballasts to high efficiency models, installed direct digital controls on HVAC equipment, and regulated the heating and cooling of supply air.
Exempt Facilities The only exempted facilities at HHS are outdoor multilevel parking garages on the NIH Bethesda Campus that consume lighting energy only. These facilities are not metered separately. Therefore, the energy consumption of these structures has been estimated based on the number of lighting fixtures and the time of use. Total energy use is estimated at 8.3 billion Btu.
Renewable Energy IHS has been active in the use of self-generated renewable energy. For example, the IHS Santa Fe and Acoma-Canoncito-Laguna (ACL) Hospitals in New Mexico both utilize solar energy systems. Maintenance and performance improvements have been made to both systems over the past few years. The IHS ACL Hospital also installed solar powered outdoor lighting. The Santa Fe Indian Hospital was awarded a National Renewable Energy Laboratory grant from DOE to refurbish its 20-year-old solar system. FY 1999 funds of $20,000 were used to evaluate and test the existing Santa Fe system. Based on the recommendations of the evaluation, $65,000 of FY 2000 funding was provided for renovations. The IHS Seattle Energy Services Office coordinated a geothermal heat pump project that involved the installation of 111 residential geothermal heat pumps.
Petroleum In FY 1990, HHS energy intensive facilities used 2,242.7 billion Btu of fuel oil and LPG/propane. In FY 2000, these facilities used only 751.4 billion Btu of petroleum products, resulting in a 66.5 percent reduction in consumption. However, it should be noted that fuel oil consumption in FY 2000 was abnormally
100

high due to the increased usage at the NIH Bethesda Campus to cover the interrupted natural gas supply.
Water Conservation The HHS OPDIVs reported a usage in FY 2000 of 1.3 billion gallons at a cost of almost $6.5 million. This value is a low reading or estimate of the actual water usage for the entire agency. IHS was unable to provide estimated data on water consumption in the 895 facilities they manage. Lack of manpower and data prohibited the completion of this task.
In general, HHS facilities minimize the amount of water used to water lawns and landscapes. Many plumbing fixtures have been retrofitted to newer low-flow models and the purchase of new fixtures is specified as low-flow types.
The PSC Parklawn Building completed a UESC to upgrade 366 toilets from 3.5 gallon models to 1.6 gallons-per-flush models. Washroom faucets sink aerators were also upgraded from 2.5 gallons of water use per minute (gpm) to 1.0 gpm. The total water savings equates to 6.3 million gallons and the cost savings are $58,240 per year.
NIH has implemented the following water saving measures:
! Irrigation of landscape plants using otherwise wasted groundwater from a construction de-watering operation;
! Elimination of lawn watering; ! Progressive utilization of landscape plants
requiring less water; ! Reduced frequency of automatic animal facility
wash downs; ! Eliminated use of wastewater holding vaults in
ungulate facility at NIH Animal Center; ! Use of water conservation devices including
low-flow faucets, toilets, and valve assemblies; and ! Installation of boiler water polishing units to soften
boiler return condensate that was previously dumped.
Implementation Strategies The HHS Energy Program incorporates the following implementation strategies in its management, as do all OPDIVs and facilities nationwide. However, as necessary, some issues are site specific and therefore are addressed as needed in the OPDIV or facility.
Life-Cycle Cost Analysis FDA has initiated the use of life-cycle cost (LCC) analysis while making investment decisions about construction of new laboratory buildings. An LCC analysis was completed for the HVAC equipment to be utilized in FDA’s new laboratory building at Irvine, California. This building is currently in the construction procurement process.
OS uses LCC analysis to prioritize and justify the implementation of energy efficiency projects in the HHH Building. As an example, LCC analysis was used to study the replacement of large HVAC motors with energy efficient models. The project was implemented in FY 2000.
NIH has revised its Design Policy and Guidelines to include the following language: “Throughout the development of the project, LCC analysis shall be used in making decisions about which construction products and services are used to lower the Federal Government’s costs and to reduce energy and water consumption. Inefficient systems and equipment shall be retired on an accelerated basis where replacement results in lower LCC to the greatest extent practicable. All project cost estimates and budget activities for design, construction, and renovation of facilities shall be based on LCC. Facilities shall be designed and constructed to the lowest LCC whenever possible.”
In preparing to enter into an Energy Savings Performing Contract (ESPC), the IHS Aberdeen Area hired a DOE contractor to investigate and analyze energy saving projects at the Area facilities. LCC analyses were performed and have been reported as part of the ESPC project documentation.
At the IHS Bemidji Area, LCC analysis is required for all contract services and Government procurement of products, services, construction, and other projects to lower energy and water consumption. The IHS Portland Area performs LCC analysis on large projects to assure a maximum of a 10-years payback.
Energy Audits In FY 2000, 2.6 million square feet, or 10.5 percent, of HHS facilities were audited. CDC and NIH performed the most comprehensive audits in conjunction with utility energy services contracts. To date, 54 percent of the HHS facility square footage has received energy and water efficiency audits.
101
Financing Mechanisms In FY 2000, the HHS Energy Program focused efforts on promoting and facilitating the use of alternative financing mechanisms to implement energy and water efficiency projects. Many GSA Area Wide Contracts and Super ESPCs have been initiated and are moving toward the delivery order phase.
NIH is using UESCs to identify, evaluate, and implement economically feasible energy and water conservation measures.
NIH entered into three UESCs for a total of $38.9 million in FY 2000. These included the construction and operation of a 23-megawatt cogeneration facility, the installation of an energy management control system, and the upgrade of lighting and motors at the main campus.
FDA signed a GSA Area Wide contract with the local utility company for the implementation of energy projects at the Module One facility in Laurel, Maryland. A delivery order is expected in FY 2001.
In FY 2000, ESPCs were being developed for three major CDC facilities. At the CDC Atlanta campus an energy retrofit was completed under a UESC that had begun in FY1999.
The IHS Aberdeen Area and Seattle Engineering Services is moving forward on a Super ESPC with Johnson Controls to implement energy projects at 28 facilities in North and South Dakota. The Super ESPC is anticipated to be awarded in early FY 2001.
In FY 2000, HHS used $8.4 million of direct agency funding to implement energy and water efficiency projects and audits. The funding requested for FY 2001 is $5 million. It is anticipated that most energy and water efficiency work will be completed under alternative financing contracts.
Energy-Efficient Product Procurement HHS uses the HHS Energy Program communication tools to relate the significance of using ENERGY STAR® and other energy efficient products. Methods for procurement of these products are also highlighted and described. In general, OPDIVs use the GSA Schedule to procure energy efficient products and have revised project specifications and standard procurement contracts to include their purchase.
ENERGY STAR® BuildingsHHS does not have any buildings that have met theENERGY STAR® Building criteria. As of FY 2000, 89
percent of the HHS square footage is energy intensive facilities such as laboratories, hospitals, and medical clinics. The ENERGY STAR® Buildings rating is currently applied only to office buildings. In FY 2001, the HHS Energy Officer and PSC facility management will work together with the Parklawn Building lessor to attempt to achieve an ENERGY STAR® rating for the building.
Sustainable Building Design In FY 2000, the HHS Energy Program began to highlight the concept of sustainable building design and the use of the Whole Building Design Guide through the awareness newsletters, training, and direct facility management correspondence.
The NIH Design Policy and Guidelines require that new building siting, design, and construction conform to Executive Order 13123 sustainable design and development principles that are included in the Whole Building Design Guide web site. To the greatest extent practicable, these principles were applied to those portions of existing facilities undergoing renovation or upgrade in FY 2000.
The Whole Building Design Guide and U.S. Green Building Council’s LEED™ (Leadership in Energy and Environmental Design) ratings are now being included in the design of a major new CDC laboratory. These guides will be standard tools for all future CDC building designs. In addition, several IHS Areas utilize the principles of sustainable design in new construction.
Highly Efficient Systems At the IHS Anchorage Area, a ground water cooling project is currently under design for the Alaska Native Medical Center. A test well has been drilled to assess flow rates, which will determine the final project configuration. The project feasibility study will be completed in early FY 2001, and construction will move forward when the project permitting and final design have been completed.
Renovations are continuing at the IHS Albuquerque Hospital to replace the old boiler and chiller central system with a geothermal ground source heat pump loop system.
A highly efficient system is under construction at the NIH Clinical Research Center (CRC), and involves the use of steam driven electric generating turbines as a means of conserving steam energy that would otherwise be lost in the normal pressure reducing process.
102

Off-Grid Generation In FY 2000, PSC installed solar emergency call boxes throughout 13 acres of outdoor parking at the Parklawn Building. Solar powered outdoor lighting was also installed at the IHS ACL Hospital in New Mexico.
The NIH 23-megawatt cogeneration unit to be constructed and operated by the local utility under the UESC signed in FY 2000 will generate off-grid power to supply the NIH Bethesda Campus with its base electrical load. Also, a steam driven electrical generating turbine has been designed for inclusion in the NIH Bethesda Campus CRC facility to convert steam pressure reduction energy to electricity.
Energy Management Contact Mr. Scott WaldmanHHS Energy OfficerU.S. Department of Health and Human ServicesRoom 709DHubert H. Humphrey Building200 Independence Avenue, SWWashington, DC 20201Phone: 202-619-0719Fax: 202-619-2692
103

F. DEPARTMENT OF THE INTERIOR (DOI)
Management and Administration Implementation of the Energy Management program within the Department of the Interior (DOI) is the responsibility of the Assistant Secretary for Policy, Management and Budget and is delegated to the Office of Acquisition and Property Management. The DOI’s Energy Management Team consists of an Executive Energy Committee, which is comprised of bureau representatives at the Assistant Director for Administration level, and the Departmental Energy Conservation Committee (DECC), and is comprised of bureau representatives ranging from property management specialists to engineers.
Recognition DOI encourages energy and water conservation nominations under the Department’s annual environmental award program. This year, a water conservation project at Folsom, California, was one of a dozen national environmental award winners. Five nominations were submitted in FY 2000 for consideration under the Federal Energy and Water Efficiency Awards program. Three projects were honored with awards.
Performance Evaluations The performance evaluation criteria for the Director of Administration and the Director, Office of Acquisition and Property Management, include energy and water conservation elements.
Training DOI energy managers involved in building energy efficiency and water conservation have attended workshops offered by the Federal Energy Management Program, the General Services Administration (GSA), Environmental Protection Agency (EPA), the Association of Energy Engineers, public utilities, and Bureau energy coordinator’s meetings. DOI’s Property Management Conference in FY 2000 offered a track on sustainability, with keynote speeches and workshops that covered real property, renewable energy, and the Whole Building Design Guide.
Showcase Facilities DOI recognized four new Showcase Facilities in FY 2000:
! Cottonwood Visitor Use Complex, Joshua Tree National Park, California. A 21-kilowatt photovoltaic array, a 250-kilowatt bank of batteries, a 30-kilowatt inverter and battery charger, and a 30-kilowatt propane generator for
backup power replaced the diesel generators at the complex. A separate 2-kilowatt photovoltaic system now supplies electricity to the park’s amphitheaters. The park also switched electric heating loads to propane, installed occupancy sensors to control lighting, retrofitted all lighting with fluorescent fixtures and lamps, equipped residences with highly efficient refrigerators, increased building insulation, and added shading structures to reduce cooling requirements. The cost of the new photovoltaic system was $265,000 with an estimated annual operating cost of only $1,100. The simple payback is 5.4 years. Battery replacement will be necessary in 10 years and will cost $25,000.
! North Manitou Island Visitor Center, Sleeping Bear Dunes National Lakeshore, Michigan. In collaboration with DOE and Sandia National Laboratories, the National Park Service (NPS) invested $190,000 in a hybrid-Photovoltaic system that now provides 85 percent of the island’s energy needs. The system consists of a 10-kilowatt photovoltaic array, installed in three subarrays; a battery bank sufficient for five cloudy days; a 15-kilowatt inverter to convert 12 DC to 120 or 240 AC power; and controllers and switchgear needed to optimize the system’s functioning and backup. The hybrid system will also save $2,500 per year in diesel fuel costs as well as the costs of transporting fuel to the island. In addition, the system educates visitors and encourages them to be more environmentally conscious in their own homes.
! Whitman Mission National Historic Site, Washington. Since 1992, Whitman Mission National Historic Site’s (NHS) Bruce Hancock, Chief of Maintenance, and other staff at the park have retrofitted outdated lighting systems in the maintenance shop and visitor center. The result was a 25 to 40 percent reduction in energy consumption in 1999. The Lighting Design Lab, Steve Butterworth, NPS Regional Energy Conservation Manager, and the park staff worked together to identify locations and ways to update the Park’s lighting. Most of the costs for the lighting retrofits were paid with funds authorized for park maintenance, but some special regional funding for equipment procurement was used in the early stages of the project. FEMP staff assisted Whitman Mission NHS with an agreement between DOE and the Lighting Design Lab.
104

! Zion Canyon Visitor Center, Zion National Park, Utah. Completed in May 2000, the Zion Visitor Center demonstrates the concept of “whole building design.” The result at Zion is a sustainable building that incorporates the area’s natural features and energy-efficient building concepts into an attractive design that saves energy and operating expenses while protecting the environment and natural beauty. The Visitor Center uses 70 percent less energy than a typical building and because the building required no mechanical systems such as air conditioning, construction costs were lower. An energy-management computer that ensures all of the building’s energy-efficient features are working together is key to the design of the building.
Energy Reduction Performance
Standard Buildings In FY 2000, DOI reported an 11.6 percent decrease in energy consumption from FY 1985 for its standard buildings when measured in Btu per gross square foot. DOI received credit for purchases of 1.2 billion Btu of renewable electricity. This lowered the energy intensity of its standard buildings from 77,744 Btu/GSF to 77,720 Btu/GSF.
Renewable Energy DOI requires its engineers to implement the use of low-risk, passive solar strategies, as appropriate, in the design of new buildings. DOI has implemented 34 renewable energy projects including standalone and grid connected photovoltaic systems, solar thermal (hot water) projects, geothermal (ground source) heat pumps, and wind related projects. DOI has also committed to purchasing a portion of its monthly electric power needs from wind-generated electricity through the Wind Source Program offered by the Public Service Company of Colorado.
One of DOI’s Million Solar Roofs projects for FY 2000 included power and water pumping photovoltaic projects at Sand Island Campground/Boat Ramp, Monticello, Utah.
Water Conservation The Fish and Wildlife Service’s Mora National Fish Hatchery and Technology Center, New Mexico, was selected to receive an FY 2000 Federal Energy and Water Management Award for the implementation of a fishery water reuse system that saves approximately 2.2 billion gallons of water, based on a remarkable water reuse rate of 95 percent. This initiative is one of the Department’s most outstanding examples of water conservation.
Implementation Strategies
Life-Cycle Cost Analysis The Departmental Plan encourages the use of life-cycle costing techniques for the purchase of energy efficient products and investments in facility improvements.
For example, the Fish and Wildlife Service (FWS) Manual requires that engineers must design buildings or building systems that result in lowest total LCC. Their basic LCC Costing Model has been distributed to all Regional Engineers.
Energy Audits In FY 2000, the DOI received funding from DOE’s SAVEnergy audit program for assessing the potential for the use of renewable energy at 20 field stations. Eight percent of facility space was audited during the fiscal year and 61 percent of facility space has been audited since 1992.
The National Park Service continued its partnership program with James Madison University. The project links university students and faculty with NPS personnel to identify and develop sustainable energy use practices. The projects included performing energy surveys, developing an innovative database system to track energy consumption and costs, and identifying Shenandoah National Park’s first renewable energy project. The goal to apply the partnership philosophy elsewhere in the National Park System is moving forward.
Financing Mechanisms DOI spent $24 million in FY 2000 for facility energy improvements that are expected to improve performance in the future.
Five Energy Savings Performance Contracts (ESPCs) are operating within the DOI with a total contractor investment of $5.5 million. Two facilities initiated ESPCs in FY 2000: the Bureau of Indian Affair’s Chemawa School in Salem, Oregon, and Yosemite National Park in California. The School utilized the Super ESPC Delivery Order for a variety of energy efficiency measures. Yosemite National Park will implement electrical upgrades, retrofit lighting, and replace boilers.
The Fish and Wildlife Service’s use of DOE’s SAVEnergy audit program identified projects that may also lead to an ESPC.
105

The most common problem encountered by DOI in entering ESPCs is the low return on investment because of the relatively small size of DOI’s facilities, which does not provide sufficient incentive for contractor participation.
Energy-Efficient Products In February 2000, the DOI issued its Strategic Plan for greening the agency under Executive Order 13101, incorporating energy efficiency considerations into all levels of procurement. Under DOI’s Acquisition Intern Program, selected participants are provided training on how to enhance purchases of environmentally preferable and energy-efficient products and services. As a result of this successful training program, DOI now manages the Government-wide Acquisition Management Intern Program.
DOI’s Integrated Charge Card (Government Purchase Card) Program Guidelines Manual dated May 2000 provides guidance to cardholders and addresses preferential purchasing requirements applicable to energy-efficient products and services. In September 2000, DOI’s Procurement Executive issued a memorandum reminding procurement professionals to look at what they can do to make DOI the “greenest” Department in the Federal Government through promoting the purchase of energy efficient, recycled and environmentally preferable products identified in the DOE FEMP and Federal Environmental Executive web sites.
DOI’s procurement and acquisition community continues to work closely with program managers to consider the incorporation of environmentally preferable and energy-efficient attributes and selection criteria in making buying decisions.
DOI established a policy that only re-refined oil would be used in its vehicles and equipment. To ensure compliance with the policy, DOI requested DLA to substitute re-refined oil when virgin lubricating oil was mistakenly ordered.
ENERGY STAR® BuildingsDOI requested its bureaus to look for office buildings(minimum of 5,000 gross square feet) for qualificationas an ENERGY STAR® Building by using thebenchmarking tool developed by EPA. DOI is planningto partner with EPA to include visitor centers in theENERGY STAR® Building Labels program.
Sustainable Building Design The use of partnering plays a major part in DOI’s sustainable design efforts. In April of 1999, DOI and DOE signed a Memorandum of Understanding to launch a new partnership to modernize energy use throughout the NPS. The program, Green Energy Parks, deploys sustainable energy technologies into National Parks and demonstrates the Federal Government’s commitment and leadership in efforts to save energy, conserve water usage, reduce carbon emissions and lower energy costs. The program’s goals are two-fold:
! Promote the use of energy efficient and renewable energy technologies’ and practices, and the increased use of alternative fuels throughout NPS facilities and transportation systems; and
! Educate the visiting public about the impact of conventional energy use on natural and cultural resources, the capacity of current and emerging energy technologies to mitigate such impacts, and the steps visitors can take at home to reduce their own energy use and help protect the environment.
In FY 2000, the NPS and DOE committed $3.8 million for the Green Energy Parks initiative. Over 60 visitor centers are incorporating low-cost projects such as: replacing high volume water fixtures, purchasing solar power generation and installing solar lighting, upgrading lighting with motion detectors and occupancy sensors, installing or replacing insulation, and installing water conserving toilets.
Energy Efficiency in Lease Provisions DOI plans to draft policy directing that all new leases include a minimum set of green building and operation clauses. The policy will differentiate between leases that are for all or most of a building and leases where DOI will be a single tenant in a multi-tenant building, occupying a small percentage of the building space. The policy will identify the role and responsibility of DOI’s space lease managers in negotiating and monitoring the lease.
The Main DOI Building, a leased facility that has been delegated for operations and maintenance, is preparing for a multi-year modernization project. Energy efficiency retrofits planned for the building should allow for the building to be nominated as an energy efficiency Showcase facility when the modernization is complete.
106

Off-Grid Generation Following are examples of off-grid generation that were implemented by the Bureau of Land Management in FY 2000:
! 13-Mile Campground, Red Rock Canyon National Conservation Area, Las Vegas Field Office, Nevada – Lighting for the interior and exterior of the twelve restroom buildings was needed. A small photovoltaic power system was designed which consisted of a solar panel, charge/light controller, and maintenance-free battery. The total cost for the 12 systems was $15,000.
! Sand Island Campground/Boat Ramp, Monticello Field Office, Utah – A photovoltaic array was installed at the River Ranger Station to provide power, and a second photovoltaic pumping array was installed at the water well. The total cost for the photovoltaic water pumping systems was $10,000.
! Case Mountain Research Center, Carrizo Plains Natural Area, Bakersfield Field Office, California – Two field stations provide temporary quarters for employees in remote areas where no utility power is available. The portable photovoltaic power system selected for the sites is a standard design currently used in over 20 other remote applications. Total cost for the two systems was $17,000.
! Ayer Spring, Cedar City Field Office, Utah – Ayer Spring provides water to wildlife and livestock. A photovoltaic pumping system was installed in partnership with the local range users. Water will be pumped from the spring to a storage tank and gravity fed through a pipeline to several troughs. Contribution to the project was $5,000.
Energy Management Contact Mr. John MoreskoProperty Management SpecialistOffice of Acquisition and Property ManagementU.S. Department of the InteriorMain Interior Building, Room 55121849 C Street, NWWashington, DC 20240Phone: 202-208-5704Fax: 202-208-6301
107

G. DEPARTMENT OF JUSTICE (DOJ)
Management and Administration The Assistant Attorney General for Administration has been designated the Senior Agency Official for the Department of Justice (DOJ) in accordance with the provisions of Executive Order 13123.
Recognition The DOJ plans to implement a combined Energy and Environmental Awards program during FY 2001 to recognize excellence in energy management. In addition, employees are nominated for Department of Energy awards annually and are recognized at the local level for outstanding performance.
Performance Evaluations The DOJ Energy Program Manager has the implementation of applicable provisions of the Executive Order included as an element in performance evaluations. The expansion of this element to other energy team members and appropriate employees will be explored during FY 2001. The in-house engineering staff of the Federal Bureau of Investigations (FBI) is responsible for energy management activities, and the position descriptions and performance evaluations for these engineers reflect that proper energy and water conservation methods be used in job performance.
Training The DOJ periodically conducts meetings with its bureaus to disseminate energy-related information and provides guidance and assistance to the bureaus in meeting energy efficiency goals and requirements. Energy conservation remains a very important topic at the Facilities Management training course held biannually and at the National Facilities Managers Conference. The course generally has 25-30 participants from throughout the Bureau of Prisons (BOP) who hold a wide variety of positions. Topics include such items as reviewing the energy program, and required documentation for requesting energy projects, life-cycle costing, and the requirements of Executive Order 13123. A videotape outlining energy reduction goals and highlighting energy conservation projects is being distributed to institutions throughout BOP.
Showcase Facilities Due to the nature of the BOP mission, security requirements pertaining to physical access to the institution, and the need to maintain control over what operating information is released, it is not practicable to designate prisons as Showcase Facilities. Similarly, for security reasons, the FBI has not designated any
Showcase Facilities. The INS will attempt to showcase three facilities in FY 2001:
! The Batavia, New York, Federal Detention Facility project, completed in FY 1999. The project design specified the use of energy efficient materials and equipment, and the facility has entered into a National Fuels contract to purchase natural gas at less than market prices, saving thousands of dollars annually. In addition, electrical power is supplied by an INS-owned transformer rather than from the local utility, saving over $60,000 annually.
! The Krome Service Processing Center in Florida is being designed with energy efficient materials and equipment, including solar power.
! The Border Patrol Station in Remey, Puerto Rico, currently in design and construction phase. The facility will be built using energy efficient materials, equipment and technologies, including solar electrical backup.
The DOJ will strive to designate at least one Showcase Facility annually and will work with the bureaus towards achieving that goal.
Energy Efficiency Performance
Standard Buildings In FY 2000, DOJ reported a 40.7 percent decrease in energy consumption from FY 1985 for its standard buildings when measured in Btu per gross square foot.
The BOP, with 88.6 percent of DOJ’s total space, is continuing with its efforts to meet the reduction goals. Policies have been updated to reflect the new mandates regarding the level of energy reduction. The majority of institutions have had energy conservation surveys, and BOP has established limited funding for a number of energy conservation projects. It is anticipated this source of funding will be available to assist institutions to meet the required reduction goals.
Industrial and Laboratory Facilities The DOJ industrial and laboratory facilities are energy intensive facilities. They are comprised of large data centers, FBI labs, the FBI headquarters facility, and the training facility in Quantico, Virginia. These facilities operate 24 hours per day, 365 days per year and are not typical office buildings. While these facilities were previously designated as being exempt from the energy reduction goals due to the critical nature of their operations, there have nevertheless been significant improvements in energy consumption. Several energy
108

efficiency projects have been undertaken at these locations to improve HVAC systems, lighting and electrical distribution. New data centers have recently been constructed using energy efficient equipment and construction materials. DOJ is planning to consolidate two data centers into a new energy efficient complex to achieve some economies of scale and relocate FBI labs from the headquarters facility into a newly constructed energy efficient facility in Quantico, Virginia.
Renewable Energy The BOP entered into an ESPC during FY 1996 that covers the provision of domestic hot water, heated by solar energy, at the Federal Correctional Institution (FCI) in Phoenix, Arizona. The system became operational in FY 1999. The BOP is seeking to expand the original scope of this contract to include absorption chillers, if proven viable, and is in the process of identifying additional locations where such technology would be operationally viable, and economically beneficial. In addition, BOP is currently negotiating a contract with the local gas utility to use the methane gas resource located at the Federal Prison Camp, Allenwood, Pennsylvania. The contractor will provide all the necessary pipelines and equipment retrofit at no cost to BOP, and BOP expects to retain about 10 percent of the projected savings over the life of the contract.
Petroleum The DOJ has several projects underway to reduce the use of petroleum in its facilities. The BOP has an operational solar hot water system at the FCI in Phoenix, Arizona. The FBI is converting its central heating and cooling plant at Quantico, Virginia, from fuel oil to natural gas and is participating with other Federal agencies in Denver, Colorado, to purchase electricity produced by wind turbines from the local utility company. The INS is implementing a geothermal heat pump project in its U.S. Virgin Islands facility.
The BOP is continuing its efforts to reduce the use of petroleum within its facilities by using alternative fuels where applicable. The BOP also has a policy mandating life cycle costing (LCC) that has served to limit the use of petroleum-based fuels where it is not the most cost-effective option.
Water Conservation DOJ developed an initial water baseline data survey during FY 2000 and will be re-evaluating the accuracy of this data during FY 2001. There will be an increased emphasis during FY 2001 and FY 2002 on implementing DOE established Best Management
Practices to reduce water consumption at DOJ facilities nationwide.
The BOP has completed a total of 75 energy and water conservation surveys of its facilities. Additional surveys have been funded and are ongoing through an existing program. Many of the water conservation opportunities identified in the survey reports can be implemented as an extension of the regular maintenance program, such as the replacement of hand operated valves on inmate showers with timed push button operators. The surveys provide an excellent guideline and management tool at the institutions to reduce water consumption and associated energy use.
Implementation Strategies
Life-Cycle Cost Analysis The BOP has a policy in place mandating the use of LCC analysis. BOP policies clearly outline procedures ensuring that LCC analyses are conducted on all projects involving replacement of energy consuming major equipment, new construction, renovation, and expansion.
Energy Audits The BOP funded and completed six energy audits in FY 2000, bringing its total number of completed audits to 76. These audits were conducted throughout the nation in a wide variety of institution types and climates and have resulted in requests for funding and the establishment of energy conservation projects. The remaining institutions which have not been surveyed are primarily institutions which have been activated in the past five years and already include energy conservation design features. Postponing surveys at such locations will allow resources to be concentrated on the energy conservation needs of older institutions.
Financing Mechanisms The BOP entered into an Energy Savings Performance Contract in FY 1996, construction began in FY 1998, and operation commenced in FY 1999 at the FCI in Phoenix. The ESPC is for the installation of a solar energy system that will provide a large percentage of the domestic hot water for the FCI. The remaining DOJ real property holding bureaus each have the management structure and authority within their respective organizations to implement ESPCs and they are encouraged to take full advantage of such contracts
The BOP currently has one ESPC in place for the provision of solar heated domestic hot water at FCI Phoenix, which became operational in February 1999. Savings for FY 2000 were $75,705 with the retention of
109

$7,570 by BOP. Additional savings of approximately $500 per month accrue due to the decreased maintenance required for the existing water heaters. Total energy delivered by the system used to estimate the energy savings during FY 2000 is 4,030,620 million Btu. The cumulative cost for this ESPC is $108,776, with $10,877 retained by BOP and 5,773,510 million Btu in cumulative energy savings.
FBI uses its own in-house engineering staff to conduct energy conservation surveys rather than using ESPCs. Projects with the best investment-to-payback return are given the highest priority. Projects with specific funding from GSA or that coincide with replacement of equipment that has reached the end of its useful life are given a high priority. Energy intensive facilities are reviewed for improved equipment installation as technologies become available. The J. Edgar Hoover Building (JEH) in Washington, D.C., received an energy audit by GSA three years ago. As a result, a new energy management system for JEH is being designed to include automated controls and sensors.
The BOP has actively taken part in a number of utility incentives and rebate programs to reduce the amount of Government funding required to complete energy conservation projects. Both electric and natural gas utilities have worked with BOP by providing services, guidance, and financial incentives on such systems as lighting and HVAC. The cost savings generated by such efforts allow for additional projects to be funded in a time of limited resources.
ENERGY STAR® and other Energy-Efficient Products The DOJ has employed a variety of management tools during FY 2000 in support of the provisions of this Section:
! Bureaus have incorporated energy and water efficient design and construction practices in specifications for new construction and alteration projects;
! Procurement officials have been notified of the requirement to purchase ENERGY STAR® products whenever available; and
! Bureaus have incorporated sustainable design principles in new design and construction projects.
In addition, the INS will be applying the standards for ENERGY STAR® designation to one of its facilities during FY 2001.
Sustainable Building Design The FBI’s energy management system for JEH is being completely redesigned. A new energy management system and new energy efficient HVAC equipment are being installed during the major renovation project for the Main Justice Building in Washington, DC. Upon completion, the old, inefficient HVAC equipment will be decommissioned and replaced entirely by a modern, energy efficient system.
Off-Grid Generation In July 1998, an interagency agreement was entered into between the GSA National Utilities Management Program (NUMP) and BOP. This agreement provides authority to NUMP for negotiation and transportation of natural gas for BOP use at various institutions. During the first three quarters of FY 1999, with three institutions reporting under this contract, the BOP saved over $460,000. Since July 1999, a total of six institutions reporting under this contract identified additional savings of over $230,000.
The BOP’s solar heated hot water project at the FCI in Phoenix was a success, and the BOP is seeking to expand the scope to include absorption chillers and is identifying additional locations where such technology would be operationally viable and economically beneficial.
In addition, FBI is participating with other Federal agencies in Denver to purchase electricity produced by wind turbines from a local utility company.
Energy Management Contact Mr. William LawrenceEnergy Program ManagerU.S. Department of JusticeNational Place Building, Suite 10501331 Pennsylvania Avenue, NWWashington, DC 20530-0001Phone: 202-616-2417Fax: 202-307-1874
110

H. DEPARTMENT OF LABOR (DOL)
Management and Administration The Senior Energy Official for DOL is the Assistant Secretary for Administration and Management. The members of DOL’s energy team consist of representatives from the budget, procurement, legal, and technical offices.
Recognition DOL participates in the “You Have the Power” campaign, and has recognized several employees as energy champions.
Performance Evaluations Performance evaluations for DOL managers and energy team members include performance measures for energy conservation.
Training DOL employees receive energy conservation training through in-house programs, participation in energy conferences, FEMP workshops, web-based training, and private industry workshops. Training was also provided as part of the ESPCs awarded by DOL. Twenty-three employees were trained in energy conservation methods in FY 2000.
In addition, energy awareness tools are available to all DOL employees through employee distribution. DOL’s participation in energy programs such as Energy Awareness Month, the “You Have the Power” program, National Recycling Day, and Earth Day, also promotes awareness of energy conservation among its employees.
Energy Efficiency Performance Standard Buildings In FY 2000, DOL reported a 12.6 percent decrease in energy consumption from FY 1985 for its standard buildings when measured in Btu per gross square foot. One hundred percent of DOL’s facilities are classified as standard buildings and facilities. DOL does not have any industrial, laboratory, or exempt facilities.
Purchased Renewable Energy Several facilities in the Pacific Northwest region currently purchase a percentage of electricity generated from hydropower. Data for FY 2000 was not available to quantify the purchases.
Million Solar Roofs In FY 2000, the Gary Job Corps Center (JCC), in San Marcos, Texas, repaired and reactivated a solar water heating system in its cafeteria facility. The annual
energy cost savings from the system are estimated at approximately 17,800 therms.
DOL is in the process of installing solar security film in the Frances Perkins Building, located in Washington, D.C.
Petroleum DOL reported a decrease of 47 percent in overall fuel consumption in FY 2000, as compared to the FY 1985 baseline. Decreases were seen as a result of replacement of oil-fired heating systems with natural gas systems during modernization projects.
Water Conservation DOL has implemented water conservation measures at the Gary JCC. Renovations at the facilities resulted in installation of low-flow toilets, urinals, showerheads, and faucet aerators.
Implementation Strategies Life-Cycle Cost Analysis All DOL design and construction projects are required to use LCC analysis in the selection of building systems, as well as for choosing energy conservation measures to implement. Energy conservation projects at the the Gary JCC, Sacramento JCC, and the Inland Empire JCC used LCC analysis in determining which Energy Conservation Measures to undertake.
Facility Energy Audits In FY 2000, DOL audited 12 percent of its facilities. DOL received seven FEMP SAVEnergy audits from FY 1995 through FY 1999. Since FY 1992, 29 percent of DOL facilities have been audited.
Financing Mechanisms To meet the goals of Executive Order 13123, Job Corps developed a strategic plan to reduce energy consumption by using a combination of ESPCs, Area Wide Utility Contracts, and agency funding. In addition, many of the JCCs have developed no cost/low cost energy conservation programs.
DOL currently has two Super-ESPCs, with a total private sector investment of more than $1.6 million. The project at the Gary JCC, awarded in December 1999, includes lighting upgrades, installation on programmable thermostats, replacement of HVAC equipment in several buildings, water conservation measures, and the refurbishment of the solar water heating system.
111

The ESPC for the Inland Empire JCC and Sacramento JCC, awarded in December 1999, is primarily for lighting upgrades.
ENERGY STAR® and Other Energy-Efficient Products DOL policy is to purchase ENERGY STAR® computers.
Sustainable Building Design All provisions and standards of the Sustainable Building Design are incorporated into all Requests for Proposals and work orders issued for construction and renovation projects at JCC facilities.
DOL’s Frances Perkins Building is an Energy Saver Showcase facility. The facility employs energy-saving measures such as T8 lighting in all office areas, motion sensors, revolving doors, and low flush valves in restrooms. Measures have also been taken to reduce the electrical load, including raising the indoor temperature, shutting down elevators during non-peak hours, reducing lighting, and reducing the temperature in water fountains.
Energy Management Contact Ms. Patricia ClarkBuilding ManagerU.S. Department of Labor200 Constitution Avenue, NWRoom S-1521Washington, DC 20210Phone: 202-219-5205, ext. 117Fax: 202-501-6886
112

I. DEPARTMENT OF STATE (DOS)
Management and Administration The Senior Agency Official for the Department of State (DOS) in accordance with the provisions of Executive Order 13123 is the Assistant Secretary for Administration.
Recognition DOS uses employee incentive programs to reward exceptional performance in implementing this order.
Performance Evaluation DOS includes successful implementation in areas such as Energy Savings Performance Contracts, sustainable design, energy efficient procurement, energy efficiency, water conservation, and renewable energy projects in the position descriptions and performance evaluations of members of the agency energy team, principal program managers, heads of field offices, facility managers, energy managers, and other appropriate employees.
Training and Education DOS ensures that all appropriate personnel receive training for implementing Executive Order 13123. DOS has developed outreach programs that include education, training, and promotion of ENERGY STAR® and other energy efficient products for Federal purchase card holders.
Showcase Facilities DOS has designated the Florida Regional Center as a “Federal Solar Energy Showcase” facility, the first specific technology showcase. A contract for a solar audit of the property was awarded and work was progressing by the end of FY 2000.
DOS has also designated the Berlin Model Energy House as a Model Energy House (MEH) to demonstrate increased energy performance, reduced operating costs, and the reduced environmental impact associated with energy consumption. Through the MEH, the Office of Foreign Buildings Operations (FBO) will introduce American Foreign Service Officers (FSOs) to the technologies that may be incorporated into their housing in the future as they rotate to other Posts.
The MEH should incorporate enhanced energy efficiency features, along with provisions for the display and demonstration of those features. FBO anticipates that the following technologies will be included in the MEH:
! A ground source heat pump system or heat recovered from roof photovoltaic panels coupled with interior radiant floor heating;
! Natural ventilation with operable windows, incorporated into the mechanical ventilation system with heat recovery by use of window contact switches;
! Minimum 2 kilowatt photovoltaic system on the roof, qualifying for local utility subsidy;
! Increased wall insulation, with a cutaway view of the wall showing the construction;
! Use of high performance, electro-chromic or polarized glazing window glazing;
! Plan for incorporation of future fuel cell technology by allocating exterior space that is convenient to gas and electric connections. Provide valved/labeled connection points for the future fuel cell;
! Heat recovered from domestic hot water residual is used to pre-heat water heater input. The heat exchange device is arranged for viewing;
! Maximize natural lighting, supplement with energy efficient lighting as required, controlled by occupancy sensors where appropriate. Organization of the electrical circuitry to allow for sub-metering of major power uses such as lighting, heating/ventilation, appliances, and plug load. Energy monitoring and display to permit comparison of the MEH energy use to an adjacent non-MEH; and
! Inclusion of highly energy efficient appliances in the design.
Energy Efficiency Performance
In FY 2000, DOS reported a 1.6 percent decrease in energy consumption from FY 1985 for its standard buildings when measured in Btu per gross square foot.
DOS maintains an array of unique special use facilities that, by the nature of their design and function, would prove detrimental to the agency-wide reporting summaries and are excluded from subsequent energy goal requirements. DOS intends to comply with the spirit and intent of all current, pending, or future energy conservation initiatives, statutes, and government-wide guidelines, as is practicable, designing energy enhancements into foreign and domestic buildings and facilities as a part of new construction or retrofit projects as circumstance will allow.
Energy efficiency projects begun or continued in FY 2000 include various retrofits in the Portsmouth National Center, the Charleston Regional Center, the International Chancery Center.
113

The largest ongoing renovation among domestic facilities is the Main Street Building renovation. DOS has replaced moat and canopy lighting, exit lighting, and the four main R-12 refrigeration machines as part of the Chlorofluorocarbon (CFC) Removal Program. Significant energy savings from the project have already been recorded.
Tactical Vehicle and Equipment Fuel Use DOS is a participant in the DOE Alternative Fuel Vehicle 5-Year Acquisition Plan Program. DOS’s motor pool fleet is 35 percent alternative fueled with hybrid fuel vehicles and one shuttle bus of 11 operating units fueled with natural gas. DOS currently is reporting the energy consumed by vehicles and equipment under its control consistent with its mission requirements regarding the need for protective, surveillance, and other law enforcement vehicles. Vehicles procured or acquired for overseas use are excluded from all current reporting requirements; however, every effort is made to uphold the spirit of energy conservation through the acquisition of alternative fueled and energy efficient vehicles wherever possible. DOS has committed energy and economic resources to promote ride sharing and the use of public transportation through employee subsidy of the Metro fare card supplement program.
Renewable Energy DOS has expanded the use of renewable energy within its facilities; notably solar photovoltaic and solar thermal. DOS has instituted the use of alternative fuels within its facilities, substituting less greenhouse gas-intensive fuel for petroleum base fuel, notably natural gas.
In FY 2000, solar water heating systems were installed in residences and recreation facilities in Chennai, India; Addis Ababa, Ethiopia; Niamey, Niger; and Kuala Lumpur, Malaysia.
DOS has signed an MOU with the Geothermal Heat Pump Consortium for application of geothermal technology in 1998.
DOS foreign posts reported a total of 356 solar collector systems. These systems include a total of approximately 1,285 solar collector panels, and are used for various purposes including domestic water preheating in residences, office buildings, and to supplement the electrical grid and domestic systems.
Petroleum As opportunities arise that lend themselves to dual fuel conversion, the potential will be pursued in terms of life-cycle cost-effective application as well as
determination of availability of local fuels, consistent with local, state, and Federal clean air statutes and policies.
DOS has dual fuel capability for boilers in the National Foreign Affairs Training Center (NFATC) facility. However, in the future, fuel cells may make primary gas and oil fuel backup obsolete for emergency generators and electric generation. DOS is considering installation of a small unit(s).
DOS has acquired nine natural gas vehicles and one natural gas shuttle bus in response to antipollution greenhouse gas initiatives. DOS also included Diplomatic Security pursuit units in the acquisition request for 100 percent natural gas units. The expectation of the alternative fuel program is to convert all motor pool and shuttle bus units to 100 percent natural gas consumption and obtain an all alternative fuel motor pool with a fuel resupply station at the NFATC.
Through life-cycle cost-effective measures, DOS shall reduce the use of petroleum within its facilities. DOS may accomplish this reduction by switching to a non-petroleum energy source, such as natural gas or renewable energy sources; by eliminating unnecessary fuel use; or by other appropriate methods. Where alternative fuels are not practical or life-cycle cost-effective, agencies shall strive to improve the efficiency of their facilities.
Water Conservation DOS has instituted a model pilot program to install sensor water faucets and toilets in Main State, to be installed under the renovation plan. In addition, sensor faucets and toilets were installed in the NFATC.
The U.S. Embassy in Tokyo replaced old, worn, water booster pumps with a newer variable speed system for potable city water. This resulted in savings of approximately 155 million Btu and $5,000 in electricity annually, plus $92,000 and 10,000 gallons of water per year – a 20 percent reduction in the total water bill for the entire Post. The project cost was $116,000, with utility cost savings equal to $97,000 a year, for a payback in 1.2 years.
Through life-cycle cost-effective measures, DOS shall reduce water consumption and associated energy use in their facilities to reach the goals of Executive Order 13123. Where possible, water cost savings and associated energy cost savings shall be included in Energy Savings Performance Contracts and other financing mechanisms.
114

Implementation Strategies
Life-Cycle Cost Analysis DOS’s policy is to use life-cycle cost analysis in making decisions about investments in products, services, construction, and other projects to lower the Federal Government’s costs and to reduce energy and water consumption. DOS also retires inefficient equipment on an accelerated basis where replacement results in lower life-cycle costs.
Energy Audits DOS will continue the energy audit and energyconservation opportunity (ECO) identification programto pursue maximum energy efficiency of its facilities.To date, all major facilities (over 300,000 GSF) havebeen audited through the comprehensive audit method,which requires all energy technologies to be consideredfor implementation. As new technologies aredeveloped, re-audits are done to assess applicability forinstallation. In addition, all ECOs are grouped intovarious categories of package ECOs. Smaller facilitiesare audited by walk-through or partial comprehensivemethod.
DOS shall continue to conduct energy and water auditsfor approximately 10 percent of their facilities eachyear, either independently or through Energy SavingsPerformance Contracts or utility energy-efficiencyservice contracts.
In FY 2000, FBO performed comprehensive energymanagement surveys for properties at the followingPosts:
! U.S. Embassy, Buenos Aires, Argentina;! U.S. Embassy, Conakry, Guinea;! U.S. Embassy, Bangui, Central African Republic;! U.S. Embassy, Lilongwe, Malawi; ! U.S. Embassy, Rabat, Morocco;! U.S. Embassy, Lima, Peru;! U.S. Embassy, Vientiane, Laos; ! U.S. Embassy, Ulaanbaatar, Mongolia.
Total area surveyed in FY 2000 was 1,595,000 GSF.To date, approximately 74 percent of the availablespace in the DOS’s worldwide facility inventory havebeen surveyed.
Financing Mechanisms Three Energy Savings Performance Contracts, and one utility energy efficiency service agreement (ESA) have been completed by DOS.
DOS currently has one ESPC for foreign facilities, awarded in July 1998, to replace lighting fixtures and upgrade HVAC systems at Embassy buildings in Mexico City. The FY 2000 measurement and verification inspection of the installed ESPC was conducted, indicating more than 500,000 kilowatt-hours savings per year. While this project has yielded substantial energy savings, cost savings are not commensurate due to fluctuations in local currency and fuel costs. However, by significantly reducing energy consumption, the ESPC has yielded savings in avoided costs from increased electricity rates equal to approximately $18,000 per year.
Energy-Efficient Product Procurement DOS participates in the “Buying Energy Efficient Products” program of the Department of Energy. For procurement of other energy efficient goods and services, DOS has established and/or clarified procurement policies and procedures including the use of life-cycle cost estimating techniques in acquiring energy efficient supplies and services that are life-cycle cost-effective and environmentally safe alternatives to petroleum consumption.
In addition, DOS has determined that certain technologies are implementable as a normal course of maintenance replacement action where funds are available. Such implementations include the following actions:
! Energy efficient motors and variable speed drives are installed as the opportunity arises either through maintenance work or ESPC opportunity;
! T-8 & T-5 electronic lighting is installed by contract through the maintenance contractor relative to group relamping requirements of the contract or through ESPC opportunity;
! Motion Sensors, either ultra sonic or thermal sensing, are installed with lighting or by contract maintenance personnel; and
! Generally, flourescents are installed in place of incandescent; Sodium is utilized for light, non-color-required illumination.
DOS shall select ENERGY STAR® and other energy efficient products when acquiring energy-using products where life-cycle cost-effective.
115

For product groups where ENERGY STAR® labels are notyet available, DOS shall select products that are in theupper 25 percent of energy efficiency as designated byFEMP.
DOS shall incorporate energy efficient criteriaconsistent with ENERGY STAR® and other FEMPdesignated energy efficiency levels into all guidespecifications and project specifications developed fornew construction and renovation, as well as intoproduct specification language developed for BasicOrdering Agreements, Blanket Purchasing Agreements,Government Wide Acquisition Contracts, and all otherpurchasing procedures.
ENERGY STAR® BuildingsDOS shall strive to meet the ENERGY STAR® Buildingcriteria in eligible facilities to the maximum extentpracticable by the end of 2002. DOS shall integrate thisbuilding-rating tool into their general facility audits.
Sustainable Building Design FBO stimulates the adoption of sustainable building practices through training staff in the use of Leadership in Energy and Environmental Design Rating System (LEED) as a framework for sustainability analysis, developing sustainability standards for FBO projects, and promoting opportunities for sustainable product vendors to present their products to FBO personnel.
FBO utilizes the following resources related to sustainability:
! The U.S. Green Building Council; ! The Whole Building Design Guide: ! Executive Order 13148 Implemenation Activities;
and ! The Federal Facilities Council.
The FBO’s organizational transformation plan seeks to increase awareness and knowledge of sustainability options and benefits within FBO and the design community. With added tools and expertise, design firms will pursue sustainable building design options. This is expected to result in improved compliance with Executive Order 13148 goals and eventual FBO design criteria enhancement. FBO compares and reports on LEED scores of new office buildings in design and construction by FBO. The ranking and reporting draws comparisons to FBO competing projects, and helps project teams assess performance.
This activity also includes the provision of Scope and Design Criteria language for inclusion into project specific documents, and leads to opportunities to interact with project teams to customize that language for specific projects. These interactions provide a valuable forum for discussion and goal setting.
During the design submittal review process there are regular interactions again with the FBO teams and the architects/engineers to review and comment on sustainability submittals. Where projects are not on track to the LEED goals, more intervention is required to share ideas for reaching these goals.
Finally, this activity includes work with the U.S. Green Building Council and other Federal Agencies in the refinement of the LEED Rating system for overseas use. This new effort has the potential to transform building and design organizations doing work overseas.
Energy Efficiency in Lease Provisions At the time new GSA-controlled leases are negotiated and/or existing leases are re-negotiated, GSA is making an effort to include energy conservation goals as part of the new or re-negotiated leases. In addition, all of the Department’s leased facilities are scheduled for energy survey through the FEMP Energy Audit program. At the time of lease negotiation, energy efficient and economically advantageous retrofits that are identified through the FEMP program building audit and Energy Conservation Opportunity (ECO) identification process will be mandated through lease administration. Partial funding may be available to co-pay for some of these retrofits if both lessor and lessee can equally benefit.
Regarding federally-owned and/or leased properties located in foreign countries, the Office of Foreign Buildings Operations (AIFBO) participated in the energy tracking program by entering energy data and project information for the Scorecard submitted to the Office of Management and Budget in FY 2000. The FBO has embarked upon a proactive energy technology installation program in overseas-owned facilities.
Highly Efficient Systems DOS shall implement district energy systems, and other highly efficient systems, in new construction or retrofit projects when life-cycle cost-effective. DOS shall consider combined cooling, heat, and power when upgrading and assessing facility power needs and shall use combined cooling, heat, and power systems when life-cycle cost-effective. DOS shall survey local natural resources to optimize use of available biomass, bioenergy, geothermal, or other naturally occurring energy sources.
116

Off-Grid Generation DOS utilizes off-grid generation systems, including solar hot water, solar electric, solar outdoor lighting, small wind turbines, fuel cells, and other off-grid alternatives, where such systems are life-cycle cost-effective and offer benefits including energy efficiency, pollution prevention, source energy reductions, avoided infrastructure costs, or expedited service.
Energy Management Contact Mr. Richard T. ArthursEnergy ManagerFacilities Management and Support ServicesDepartment of StateA/OPR/FMSS2201 C Street, NWWashington, D.C. 20520Phone: 202-647-8970Fax: 202-647-1873
117

J. DEPARTMENT OF TRANSPORTATION (DOT)
Management and Administration The Assistant Secretary for Administration is the Designated Senior Agency Official responsible for implementation of energy and environmental requirements at the Department of Transportation (DOT).
DOT established a technical support team at the headquarters level within the Office of the Secretary to assist the operating administrations in implementing the requirements of the National Energy Conservation Policy Act and Executive Order 13123.
Recognition Within DOT incentive awards are widely used to reward conscientious and innovative energy management activities. In FY 2000, one individual and an organization from the Federal Aviation Administration (FAA) were nominated for the Department of Energy annual energy awards. Proactive individuals and groups have been recognized as energy champions through the “You Have the Power” campaign. Organizations have used a variety of means to reward individuals such as Letters of Appreciation.
Performance Evaluations The operating administrations have included the requirement that energy and environmental responsibilities be added to management position descriptions as they are updated.
Training DOT participates in training opportunities offered by the annual energy conferences sponsored by the DOE, the General Services Administration (GSA), and the Department of Defense.
Showcase Facilities The Airport Traffic Control Tower (ATCT) at Palm Beach International Airport was recognized as a Federal Energy Savers Showcase by DOE’s Federal Energy Management Program. Energy efficiency at this older facility was vastly improved with the replacement of four inefficient air conditioning units, improved insulation, and upgraded lighting using modern T-8 fixtures with electronic ballasts and reflectors.
Energy Efficiency Performance
Standard Buildings In FY 2000, DOT reported a 29.3 percent decrease in energy consumption from FY 1985 for its standard buildings when measured in Btu per gross square foot.
Tactical Vehicle and Equipment Fuel Use Jet fuel used by the U.S. Coast Guard (USCG) and FAA represents the majority of consumption in this category. Consequently, consumption levels are highly dependent on mission requirements and efficiency of the equipment in the fleet. Over the years, significant energy reductions have been made through improved operations such as combining missions and training flights. Future reductions will be made through equipment replacement and modernization.
Renewable Energy FAA generated an estimated 0.7 billion Btu of renewable energy in FY 2000. USCG estimates that they generated 0.07 BBtu of renewable energy. USCG installed 60 solar hot water systems in Honolulu, Hawaii, and increased the buoys using solar power to 99 percent. The St. Lawrence Seaway Development Corporation (SLSDC) also uses solar power for its fixed and floating aids to navigation. SLSDC is in the process of solarizing its visibility and weather monitoring equipment.
It is DOT policy to use renewable energy sources wherever it is economically practical. The requirements of Executive Order 13123 have been incorporated into the Transportation Acquisition Manual (TAM). FAA is also developing procedures for purchasing power generated from renewable sources. However, opportunities for the purchase of competitive renewable energy remain limited.
Million Solar Roofs In FY 2000, FAA had 29 solar units and USCG had 60 solar units.
Petroleum DOT used 80,789 Btu/GSF in petroleum-based fuels (fuel oil and LPG/propane) in buildings in FY 1985 and 23,031 Btu/GSF in FY 2000 for a 71.5 percentage reduction from FY 1985. Since 1985, many DOT facilities have switched to natural gas for heating due to the better efficiency and lower cost of natural gas.
118

Water Conservation In FY 2000 most DOT water conservation activity centered on developing baseline data. The FAA’s Mike Monroney Aeronautical Center in Oklahoma City, Oklahoma, has installed water meters on buildings. FAA is also planning to replace grass with patios at some Airport Traffic Control Towers in arid locations to reduce water requirements.
Implementation Strategies
Life-Cycle Cost Analysis The requirement for life cycle cost (LCC) analysis is formalized in the TAM. Each of the operating administrations has requirements for LCC analysis in alteration, construction, and the procurement of energy consuming equipment. Staffs have been trained on and use the National Institute of Standards and Technology’s Handbook 134 and the associated LCC software. Use of LCC for the lighting retrofit and air conditioning replacement at the Palm Beach ATCT identified a payback of less than three years.
Energy Audits During FY 2000, five percent of facilities were audited within DOT. Overall, 75 percent of all DOT facilities have been audited. Since large facilities with large energy usage were audited first, smaller facilities are now being audited resulting in a lower percentage of square footage completed in the later years of the audit plan.
Financing Mechanisms USCG awarded one Energy Savings Performance Contract at the Coast Guard Station, Elizabeth City, in FY 2000. This ESPC involves a capital investment of $1.8 million and brings the total number of ESPCs in DOT to seven, with a total capital investment of over $9.3 million. FAA has several ESPC delivery orders in various states of preparation with at least two expected to be awarded in FY 2001.
Energy-Efficient Product Procurement The TAM states the requirement to purchase energy-consuming products in the top 25 percent efficiency. FAA reports that energy efficiency criteria have been incorporated into the In-Service Master Specification for new systems. One such system recently modified to include energy efficiency criteria is the national specification for acquisition of sustainable power systems.
ENERGY STAR® Buildings FAA has two new facilities which are expected to attain ENERGY STAR® Building recognition after a full year of data has been gathered.
Sustainable Building Design FAA is incorporating sustainable design requirements into its national design master specifications. The specifications standards for large terminal radar approach facilities and ATCTs contain sustainable design requirements and will be replicated across the country as new facilities are constructed.
Energy Efficiency in Lease Provisions DOT has been working with GSA to ensure that energy efficiency and sustainable design principles are incorporated into future leases.
Off-Grid Generation In FY 2000 the FAA installed 900-watt photovoltaic panels on seven Remote Communication Link (RCL) facilities. A wind turbine was also installed on an RCL in the Pacific Northwest Region.
Energy Management Contact Mr. George KuehnAdministrative Services Policy DivisionU.S. Department of TransportationRoom 2318, Mail Code M43400 7th Street, SWWashington, DC 20590Phone: 202-366-1614Fax: 202-493-2006
119

K. DEPARTMENT OF THE TREASURY
Management and Administration The Department of the Treasury’s (Treasury) Senior Agency Official is the Acting Assistant Secretary for Management and Chief Financial Officer. Each Treasury bureau has designated a Senior Bureau Energy Official to direct its energy program. The Senior Agency and Bureau Officials provide the policy on meeting the goals of Executive Order 13123.
Recognition Treasury uses its existing performance awards system to recognize individual employees and plans to develop an annual Secretary’s Energy Management Award in FY 2001. The bureaus will also develop annual awards.
Performance Evaluations Treasury energy managers now have an energy management element in their performance criteria and the agency is currently examining how to implement a similar element for upper management.
Training Treasury trained 17 employees in energy management during FY 2000. The agency used the Federal Energy Management Program’s course offerings whenever available. Energy training and efficient product links have been added to the Office of Procurement’s Web site.
Energy Efficiency Performance
Standard Buildings In FY 2000, Treasury reported a 12.0 percent decrease in energy consumption from FY 1985 for its standard buildings when measured in Btu per gross square foot.
During FY 2000, Treasury and its bureaus occupied approximately 55 million square feet of space, the majority of which was in General Services Administration (GSA) assigned facilities. 8.3 million square feet of space for the Internal Revenue Service (IRS), the Bureau of the Public Debt (BPD), and the Financial Management Service (FMS) was managed directly by Treasury under the GSA Buildings Delegations Program.
Treasury-owned buildings and facilities consisted of 3.5 million square feet of space in the Main Treasury and Annex buildings, the Federal Law Enforcement Training Center (FLETC), the U.S. Customs Service (USCS), and the U.S. Secret Service (USSS).
In FY 2000, Treasury’s energy consumption shows a significant reduction compared to FY 1999. The change is due to the removal of energy intensive IRS facilities from the standard building inventory for the fiscal years 1985, 1990, and 2000.
All Treasury bureaus follow GSA’s Energy Management and Conservation Guidelines for building operations. The following projects were undertaken:
! The IRS’s Andover, Massachusetts, Service Center completed a major lighting retrofit. Twenty-five hundred old T-12 light fixtures were replaced with T-8 lamps with electronic ballasts. Savings of 650,000 kilowatt-hours and $55,000 are expected annually. A $45,000 rebate was received from the Massachusetts Electric Company. The Center’s mainframe computers were removed and replaced by servers with a much lower load.
! The Ogden, Utah, Service Center completed a number of energy retrofits and upgrades, including lowering ceilings, window seal improvements, variable frequency drives on the fan systems, installation of a gas-fired absorption chiller, retrofitting parking lot lighting, and insulating chiller piping. Also the mainframe computer was removed.
! The FLETC in Glynco, Georgia, conducted an investment grade audit of the entire facility and expects to enter into a Utility Service Energy Contract (USEC) in FY 2001. The USEC will include lighting, premium efficient motors, building automation, programmable thermostats, and geothermal heat pumps. A 9.7 percent reduction in consumption is predicted for the project. A number of renovation projects include energy retrofits.
! The chillers and cooling towers at the Main Treasury Building were replaced with new energy efficient equipment. The new chillers do not contain chlorofluorocarbons (CFCs). A complete retrofit of the building’s electrical and lighting systems is underway. Single-pane windows are being replaced with Argon-filled double-pane glazing.
! The BPD’s Parkersburg, West Virginia, facility began conversion to direct digital controls for the HVAC systems.
120

Industrial and Laboratory Facilities Treasury reports energy consumption for 3.3 million square feet of industrial space. The Bureau of Engraving and Printing (BEP) and the U.S. Mint (Mint) occupied the majority of the space. As of FY 2000, Treasury’s industrial facilities have achieved a 6.1 percent reduction in consumption over their FY 1990 baseline on a Btu/GSF basis.
The BEP reports a 14.7 percent reduction in energy consumption measured in Btu/unit of production basis compared to the FY 1990 baseline. Using the Btu/GSF basis, there is a 28 percent increase due primarily to the addition of the Fort Worth Currency facility, although production remained static. The Fort Worth facility came on line in 1991.
The Mint has had a 38.3 percent increase in energy consumption compared to the FY 1990 baseline on a Btu/GSF basis. When measured against production, Mint had a 12.6 percent reduction in consumption on a Btu/unit of production basis. Production has increased 58.4 percent since 1990. Mint is in the midst of an extensive re-tooling to meet the demand for the state quarters and new dollar coin. When completed, further reductions in consumption are expected.
The BEP replaced its CFC chillers with new energy-efficient, non-CFC chillers. The bureau expects to reduce chiller energy consumption by one-third. The bureau also replaced its 1918 vintage roof with a new standing seam metal roof with increased insulation.
Renewable Energy The Mint agreed to purchase 100 megawatt-hours of wind power in Denver, Colorado. The IRS’s Andover, Massachusetts, facility is participating in the load aggregation for the area-wide contract which calls for a certain percentage of power to be supplied from green sources.
Petroleum The IRS’s Andover, Massachusetts, Service Center completed conversion of its low-pressure steam boilers from oil to natural gas. The new burners are 15 percent more efficient. The FMS installed a new natural gas-fired back-up generator system at the Birmingham, Alabama, Financial Center.
Water Conservation BEP renovated all the restrooms in their Annex Building in Washington, D.C. The retrofits included water-conserving plumbing fixtures and energy efficient lighting. The USSS installed motion sensored water faucets in all their new buildings and retrofitted several
of the older buildings at their training center. A 25 percent reduction in water consumption is expected.
Implementation Strategies
Life-Cycle Cost Analysis Treasury’s revised energy directive will specifically require the use of LCC analysis for all energy projects and procurement.
Energy Audits In FY 2000, Treasury performed energy audits in 10 percent of its space – bringing the total to 90 percent since 1992.
Financing Mechanisms In FY 2000, Treasury did not enter into any Energy Savings Performance Contracts or Utility Service Energy Contracts. Five have been completed since 1997, with three more USECs planned in FY 2001.
Energy-Efficient Product Procurement Treasury has had a policy of purchasing only ENERGY STAR® compliant computers for a number of years. The Department also purchases ENERGY STAR® copiers and fax machines, and follows the product recommendations in DOE’s Energy Efficient Products Guide.
ENERGY STAR® Buildings Treasury applied for ENERGY STAR® certification of the Firearms Instructors Building at the USSS Training Center in Beltsville, Maryland. The FMS is having the Liberty Loan Building in Washington, D.C. evaluated for ENERGY STAR® compliance.
Sustainable Building Design Treasury plans to mandate use of the Whole Building Design Guide for its new facilities. The new Alcohol, Tobacco, and Firearms Headquarters building is being designed following sustainable design principles. Sustainable design principles are being followed for design work in the USSS.
Energy Efficiency in Lease Provisions Treasury has provided the model green lease provisions to each of its bureaus. They are encouraged to follow them where they have independent leasing authority and ensure that GSA follows the provisions when obtaining space for the bureau.
Highly Efficient Systems Two newly constructed buildings at the USSS Training Center use new, energy-efficient HVAC systems.
121

Energy Management Contact Mr. Bill McGovernEnvironment and Energy Programs OfficerDepartment of the Treasury1310 G-400 West1500 Pennsylvania Avenue, NWWashington, DC 20220Phone: (202) 622-0043Fax: (202) 622-1468E-mail: [email protected]
122
L. DEPARTMENT OF VETERANS AFFAIRS (VA)
Management and Administration The Senior Energy Official for the Department of Veterans Affairs (VA) is the Under Secretary for Health. The members of the agency’s energy team represent the technical, legal, procurement, and budget sections of VA.
The Energy Management Division at VA is responsible for ensuring that all medical centers develop and implement comprehensive energy management programs to reduce overall energy usage in the operation and maintenance of buildings and facilities by FY 2010 to meet their established energy consumption targets.
Recognition VA initiated an Employee Incentive Awards Program in 1975 and since then has recognized individuals and medical centers for their energy savings efforts. These awards also provide motivation for others to identify energy reduction measures and energy reduction achievements. The VA participates in two energy awards program - the Medical Center Director, Veterans Integrated Service Network (VISN) Director and/or Secretary of the VA Energy Conservation Awards, and the Federal Energy and Water Conservation Efficiency Awards.
Performance Evaluations It is VA’s policy to include energy conservation requirements as part of performance evaluations of energy engineers at the Headquarters facility as well as at the medical centers. The performance evaluations for the Chief, Engineering Service, at the medical centers are based upon implementation of Executive Order 13123 and the percentage of the 2010 target achieved.
Training VA developed a handbook of energy conservation methods, concepts, and evaluation procedures for direct use by facility engineers. Continuing with the philosophy of developing in-house expertise, the VA conducted many regional workshops and teleconferences. Many medical center engineers completed classes offered by the Association of Energy Engineers in FY 1999 and FY 2000. Staff also participated in Energy Savings Performance Contract training courses.
Energy Efficiency Performance
Standard Buildings In FY 2000, VA reported a 15.4 percent decrease in energy consumption from FY 1985 for its standard buildings when measured in Btu per gross square foot.
During FY 2000, electrical consumption went up as a result of installation of information technology equipment and state-of-the-art medical equipment to provide modern care to the nation’s veterans.
Industrial and Laboratory Facilities VA does not have separate laboratory facilities. The laboratories are an integral part of the overall facility and their energy consumption is reported as part of the overall facility.
All VA facilities, as medical centers, are energy-intensive facilities. These facilities have steam systems, boiler operation, air compressor systems, cogeneration, fuel switching and other efficient and renewable energy technologies. VA has taken cost-effective steps to reduce energy consumption in these facilities and will continue to do so to meet the goals established by Executive Order 13123.
Renewable Energy The VA medical center at Mountain Home, Tennessee, selected an energy services company to finance, design, build, and maintain a state-of-the-art energy center on the VA campus. This project will be the first privately financed and operated energy plant on VA property and the first ever in the Federal Government using VA’s unique Enhanced-Use authority. The energy center will use the most recent cogeneration technologies and provide utility services to the medical center and other neighboring facilities. This project will replace existing facilities and systems with high-efficiency units enabling the medical center to reduce energy consumption and achieve operational cost savings of over $15 million over the term of the lease with no capital cost to VA. The project will also result in a cost avoidance of over $3 million.
Water Conservation VA has taken steps to promote water efficiency throughout the agency by requesting that medical centers develop water management plans and implement best management practices for efficient use of water.
123

Most of the medical centers which have signed ESPCs with energy service companies have asked them to recommend water conservation projects as part of their proposals.
Implementation Strategies
Life-Cycle Cost Analysis Since 1975, VA’s policy has been to fund only those projects that are cost-effective based upon LCC analysis.
Energy Audits Most of the VA facilities had energy audits completed in the early 1980s and as a result, a handbook was published that consolidated the energy conservation methods, concepts and evaluation procedures for use by the facility engineers. During FY 2000, the medical centers that signed ESPCs with energy savings companies are having energy audits conducted by them as part of their contracts. VA has also used funding from DOE to complete energy audits in recent years.
Financing Mechanisms VA takes advantage of ESPCs and utility rebate programs whenever possible. The following projects have been completed using these alternative financing mechanisms:
! VA Medical Center, Lake City, Florida, completed the retrofit of lighting fixtures throughout the facility. Total Project Cost, $308,000, Rebate from Utility Company, $28,000, Annual Savings, $54,000. Term of contract, 7 years;
! VA Medical Center, Dallas, Texas, completed the installation of a thermal water storage system containing a 3.3 million gallons capacity vessel. Total Project Cost, $1.9 million, Rebate from Utility Company, $475,000, Annual Savings, $250,000. Term of contract, 6 years;
! VA Medical Center, Richmond, Virginia, completed the installation of cooling towers. Total Project Cost, $529,000, Annual Savings, $85,000;
! VA Medical Center, Portland, Oregon, completed the retrofit of about 10,000 lighting fixtures, 500 exit signs and 800 occupancy sensors. Total Project Cost, over $1 million, Rebate from Utility Company, $240,000, Annual Savings, $103,000;
! VA Medical Center, Atlanta, Georgia, completed lighting retrofit project. Total Project Cost,
$460,000, VA’s portion of Savings, $97,000. Term of contract, 4 years; and
! VA Medical Center, West Los Angeles, California, completed an ENVEST Energy Efficiency Retrofit project. Total Project Cost, $4,338,000, VA’s portion of the savings, $560,000. Term of contract, 12 years.
All VISNs are in various planning stages for implementation of ESPCs. One hundred twenty seven of the 162 Medical Centers have signed a Memorandum of Agreement (MOA) either with U.S. Army Engineering and Support Center, Huntsville, Alabama, DOE, GSA Area Wide-based contract, or through station level projects, for the various services they offer under the ESPC program. Several projects under these MOAs have been awarded to ESPC contractors for design and others are in various phases of construction.
VA building retrofit projects include the installation of Energy Management Control Systems, modifications of existing HVAC systems, replacement of inefficient electric motors with energy efficient motors, installation of variable frequency speed controllers, steam trap replacement, improvement of boiler efficiency, improvement by retrofitting and relamping and/or replacing existing lighting fixtures, installation of electronic ballasts, improvement in power systems, installation of additional insulation and storm windows and water conservation projects.
Energy-Efficient Product Procurement VA is issuing a directive requesting that contracting officers, purchasing agents, purchase card holders, and other procurement officials purchase ENERGY STAR®
products when purchasing equipment. If ENERGY STAR® products are unavailable for any particular energy consuming equipment, then equipment that is among the upper 25 percent in energy efficiency. This energy efficient criteria has been incorporated into VA’s standard specifications and product specifications for new as well as renovation construction projects.
Sustainable Building Design VA has integrated the “build green” attitude by incorporating sustainable design concepts into solicitation requirements for architect/engineering firms on all major VA projects.
124

Energy Efficiency in Lease Provisions VA will be incorporating the following clauses in their lease bid package for new as well as renegotiated/extended leases:
! All offerors are encouraged to use ESPCs or utility agreements to achieve, maintain and/or exceed the ENERGY STAR® Benchmark Score of 75, and are encouraged to include shared savings in their offer as a result of energy upgrades where applicable;
! All new construction shall achieve an ENERGY STAR® Building Label within one year after reaching 95 percent occupancy and continue to maintain the level of performance; and
! Offerors may obtain a list of energy service companies qualified under the EPACT to perform ESPCs, as well as additional information on cost effective energy efficiency, renewables, and water conservation from FEMP.
Highly Efficient Systems Most of VA’s new and retrofit projects have combined cooling, heating, ventilating and power systems as integral part of the overall project.
Increased demands to satisfy the needs of modern medical care have resulted in an increase of electrical consumption of 28.6 percent as of the third quarter of FY 2000 as compared to VA’s consumption in the base year FY 1985.
The following methods have also been implemented to reduce this increase:
! The design criteria for all new construction and retrofits now include the use of most energy efficient lighting fixtures that have a potential for savings of up to 45 percent of energy used for fluorescent light fixtures. Also, the new construction is now designed to operate at an electrical power factor of 0.95 or higher; and
! Energy Management and Control Systems with direct digital controls are specified as part of new construction as well as when retrofitting existing HVAC systems.
Off-Grid Generation VA has installed many solar hot water systems in its medical centers.
Energy Management Contact Mr. Rajinder P. GargChief, Energy Management Division (138C1)U.S. Department of Veterans AffairsRoom 417-LAF810 Vermont Avenue, NWWashington, DC 20420Phone: 202-273-5843Fax: 202-273-6298
125

M. ENVIRONMENTAL PROTECTION AGENCY (EPA)
Management and Administration In November 2000, the Environmental Protection Agency (EPA) consolidated energy and water management activities in a newly formed Sustainable Facilities Practices Branch (SFPB). The SFPB will give full-time attention to sustainable practices, policies, and project implementation.
EPA has designated the Assistant Administrator for Administration and Resources Management as the Agency Energy and Environmental Executive. This senior official is supported by a national energy coordinator and team manager. The energy team is supplemented by architects and engineers from EPA’s Architecture, Engineering, and Real Estate Branch and by the U.S. Department of Energy’s National Renewable Energy Laboratory (NREL) on a project-specific basis.
EPA realizes that the commitment of its employees to improve energy efficiency is vital to achieving the energy reduction goal. EPA’s energy management team uses awards, incentives, and performance evaluations, as well as continuing education and training programs, to support individual and team efforts in energy efficiency.
Recognition EPA is an active participant of the the DOE-sponsored “You Have the Power” campaign and has recognized 19 employees as energy champions.
EPA has an agency-wide awards program addressing sustainable design and resource conservation. In addition, EPA established an Award for Excellence in Management for individuals or groups that have exhibited superior energy and water management.
Training EPA uses several education and training programs to ensure that employees are aware of the latest technologies and opportunities to increase energy efficiency.
In 1997, EPA, in cooperation with the Lawrence Berkeley National Laboratory and the Nationa Renewable Energy Laboratory (NREL), instituted an annual conference for Federal laboratory managers interested in energy upgrades for their facilities. The “Laboratories for the 21st Century” (Labs 21) initiative, which grew out of that conference, provides information on energy efficient technology alternatives for laboratory applications and creates a forum for
laboratory designers, owners, and operators to obtain up-to-date information and support for implementing energy-efficiency programs.
The Labs21 conference has become an annual event and includes plenary and panel sessions to discuss ways that successful strategies and technologies are being implemented to improve the energy efficiency and environmental performance of laboratories.
The fourth annual Labs21 conference took place from September 6 to 8, 2000, in San Francisco, California. More than 250 participants attended the conference, which was open to both Federal and non-Federal participants and to representatives from other countries including Canada and Australia.
Also conducted on a yearly basis is a 3-day Buildings and Facilities conference, which all EPA facility managers must attend. An entire day is spent on issues related to energy-efficient design and management, including renewable energy purchases, energy savings performance contracting, and energy efficient retrofits.
Greening EPA is distributed to all EPA facility managers and others interested in renewable energy and energy and water efficiency activities in EPA facilities.
For Earth Day 2000, EPA created a 50-foot by 8-foot model of a “green” home. Every feature in the house, from the construction materials to the furnishings, was selected to highlight specific environmental benefits that were explained with more than 100 interpretive signs. Almost one-quarter of the signs featured energy efficiency strategies, including the use of ENERGY STAR®-labeled windows, light fixtures, bulbs, appliances, and computers. EPA estimates more than 280,000 people visited the exhibit on Earth Day. In May 2000, an additional 80,000 people saw the display on the Mall during Public Service Recognition Week.
Energy Reduction Performance
Standard Facilities Since 1985, the EPA has measured and reported laboratory energy and water consumption using the it’s standard facility 1985 baseline and reduction requirements. Starting in FY 2000 EPA is no longer reporting its laboratory energy and water consumption under the standard facility designation and is now using the more appropriate energy intensive facility designation.
126

Industrial and Laboratory Facilities EPA has implemented an aggressive strategy to reduce energy consumption. EPA reduced energy consumption in Agency-owned laboratories from 399,907 Btu/GSF. in 1985 to 348,401 Btu/GSF in FY 2000—a reduction of 12.9 percent. Energy use fell from 357,348 Btu/GSF in 1990 to 348,401 Btu/GSF in FY 2000—a decrease of only 2.5 percent—because the Agency built seven additional facilities during those years. EPA received credit for purchases of 7.6 billion Btu of renewable electricity. This lowered the energy intensity of its laboratories from 351,251 Btu/GSF to 348,401 Btu/GSF.
EPA is maximizing the energy and water efficiency and environmental performance of its facilities through a variety of innovative projects and commonsense initiatives. Following are synopses of the energy-efficiency activities at selected EPA laboratories.
! Ada, Oklahoma – As part of a recently awarded Energy Savings Performance Contract, an HVAC system renovation/upgrade will install a ground source heat pump, variable air volume fume hoods and air supply, new and upgraded fan motors, and integrated direct digital control system for HVAC, energy, fire, and security management;
! Ann Arbor, Michigan – As part of ESPC renovations, a new energy and HVAC infrastructure was installed. New air handling units, a new cooling tower, a 200 natural gas kilowatt fuel cell, and a new direct digital control system were installed. The newchilled water plant consists of 900 tons of high-efficiency, double-effect ch i l l e r /h e a t e r s , which d o no t u se chlorofluorocarbon (CFC) or HCFC refrigerants. The new chiller/heaters come equipped with units to recover waste heat from the condensers in the cooling cycle. The chiller/heaters will recover up to 25 percent of the input energy from the condenser water stream;
! Cincinnati, Ohio -- The facility installed a closed-loop glycol cooling tower, energy-efficient elevator motors, boiler controls, a revolving door to help maintain temperature and building pressure, a new HVAC system, improved windows and insulation, a new energy efficient boiler, and enthalpy recovery from boiler exhaust;
! Corvallis, Oregon – The facility installed new energy efficient non-CFC chillers and boilers;
! Duluth, Minnesota – The facility installed an energy and environmental management system to minimize energy waste through improved equipment controls. In FY 2000, EPA replaced
two large boilers with ten smaller boilers to improve the heating system’s efficiency;
! Golden, Colorado – The facility installed a direct digital control system to monitor operating conditions of the HVAC unit. The Golden lab’s ventilation system conserves energy after work hours by cutting the system back to 25 percent of its maximum volume. The system is divided into 7 zones to enable air exchange in selected areas when employees work late;
! Montgomery, Alabama – EPA relocated and installed a 150-ton chiller from Ann Arbor to Montgomery. This move and installation saved money for purchase of a new chiller to condition furnace hood wake-up air; and
! Research Triangle Park, North Carolina– EPA installed a Building Automation System that enables operations staff to monitor and control energy-consuming aspects of the building, including temperature, pressures, humidity, electrical systems, refrigeration and boiler equipment, maintenance indicators and alarms, lighting, security, and communications. Fume hoods are serviced by a centralized air flow system and customized sashes that save energy by avoiding the loss of heated or cooled air and by reducing the need for numerous energy-consuming fans.
Tactical Vehicle and Equipment Fuel Use EPA’s Compliance Strategic Plan for the Reduction of Petroleum-based fuels in Tactical Vehicles and Other Equipment has been developed to meet the provisions of Executive Order 13123 and provides a precise approach for achieving the fuel reduction goal. The approach requires:
! Reducing the current number of tactical vehicles and other equipment provided as Government Furnished Equipment to EPA contractors;
! Acquiring better fuel-efficient equipment, which would decrease fuel usage;
! Re-evaluating mission requirements and eliminating equipment where possible; and
! Creating incentives for EPA employees and managers to reduce fuel consumption.
Renewable Energy EPA is committed to buying green power whenever possible and can play an important role in assisting the Federal Government to accelerate the growth of renewable energy sources by requiring the purchase of green power for a percentage of its overall energy requirements.
127

In FY 2000, Richmond, California, purchased 100 percent green power, and Golden, Colorado, purchased 17 percent green power. Combined, these facilities purchased 2.2 megawatt hours of renewable energy. This represented 1.6 percent of EPA’s total electricity purchases.
Based on the success of the Richmond pilot and further exploration of green power purchasing opportunities nationwide, EPA announced its goal of converting all EPA laboratories to 100 percent green power over a 10-year time-frame.
Recent green power procurement efforts at other EPA laboratories include:
! Golden, Colorado – In October 2000, the Golden facility began purchasing 100 percent of its energy from wind power;
! Manchester, Washington—The Manchester lab’s green power purchase is unique because Washington has not deregulated its utility supply industry. This means that the lab is required to purchase electricity from Puget Sound Energy, which currently supplies only a small amount of renewable power generated from hydroelectric dams. Based on current market prices, the lab determined that purchasing green power from Puget Sound Energy would cost approximately 2.2 cents more per kilowatt hour, representing an additional $50,000 annually. EPA decided to provide that amount of money to the Bonneville Environmental Foundation in the form of a 10-year grant to build a wind turbine. The turbine will produce approximately 2.1 million kilowatt hours of electricity annually – enough energy to power the Manchester lab and to produce additional power to the regional electric grid; and
! Chelmsford, Massachusetts—EPA issued a 100 percent green power Request for Proposals to power EPA’s New England Regional Laboratory, currently under construction. EPA accepted a bid to supply the laboratory with energy derived totally from wind. EPA worked with GSA to contract for the green power purchase, and EPA’s Region 1 office will fund the incremental cost.
By the end of FY 2000, EPA’s wet laboratory in Manchester, Washington, one of the facility’s multiple laboratory buildings, should become the first commercial, solar-powered “net metering” project in the Northwest. Under net metering, any excess electricity produced by the lab’s 28 new solar panels will flow directly into the local utility power grid, spinning the electricity meter backwards and offsetting
the lab’s energy costs. The new solar panels are installed and fully operational, generating approximately 2 kilowatts of electricity.
Million Solar Roofs As part of the Million Solar Roofs program, EPA has installed solar panels at its laboratories in Golden, Colorado; Athens (Environmental Service Division), Georgia; Manchester, Washington; and Edison, New Jersey. This represents 26 percent of the facilities the Agency manages. In addition, EPA has funded solar panels in facilities it occupies but does not manage, including its Waterside Mall facility in Washington, DC, and the Region 5 headquarters building in Chicago, Illinois.
Water Conservation In FY 2000, EPA used 187.3 million gallons of water. EPA expects water consumption to decrease in its facilities as ESPC improvements begin to take effect.
During the past 5 years, EPA has required its facilities to monitor and report water consumption and costs and energy consumption data on a quarterly basis. Since 1994, EPA has required the use of water conserving equipment in all newly leased and built facilities. Assessments of water efficiency opportunities are part of EPA’s facility site visit program and have led to operational and management measures that have reduced water consumption. Following are brief highlights of the water conservation efforts at EPA’s facilities.
! Ada, Oklahoma – As part of the recently awarded ESPC, EPA expects water consumption at the Ada facility to decrease by 80 percent when the upgrade is completed;
! Ann Arbor, Michigan – As a result of the improvements made under the ESPC, EPA expects the Ann Arbor facility’s water consumption to decrease by 80 percent;
! Houston, Texas – The facility incorporated a cooling tower condensate return system to reduce water consumption and operating costs and enhance environmental conditions. Without this system, large volumes of water would have to be supplied by the local water utility;
! Manchester, Washington – The lab replaced its 4-inch PVC water lines with 6-inch ductile iron water lines. The bigger, stronger lines reduce the frequency of leaks and the lab’s overall water consumption rate. The lab also replaced a 20-year-old water cooling tower with a new, more efficient tower, which reduced the water volume needed to run the cooling system. These upgrades have
128

dropped the facility’s average water bill from $596 to $203 per month, and reduced water consumption 66 percent, from 204,000 to 70,000 gallons per month; and
! Research Triangle Park, North Carolina – EPA incorporated water-efficient fixtures throughout the facility, including flow-restricting nozzles, automated shutoff, and hot and cold water delivery systems with automatic temperature controls. The lavatories have sensor-operated metered faucets that regulate the amount of water flow, which will save water and the energy needed to heat it.
Implementation Strategies
Life-Cycle Cost Analysis When designing, constructing, and maintaining its facilities, EPA uses natural resources conservatively and seeks to incorporate innovative technologies that are cost-effective and environmentally sound throughout their life cycles.
EPA is expanding the time frame it uses to examine life-cycle cost (LCC) savings - investigating project savings over a 15- or 20-year time frame. Some renewable technologies have payback periods of 15 to 20 years, and in Fort Meade, for example, the payback period for the solid oxide fuel cell is approximately 25 years. EPA considers the reasonable life of these products and the potential for decreased energy consumption, as well as the cost of product, when making investment decisions about which projects to pursue.
Facility Energy Audits EPA’s facilities are regularly audited for energy and water efficiency. Facilities participate either through a contracted audit process, or as part of the ESPC evaluation process. Since 1995, 63 percent of all EPA-owned facilities have been audited.
Financing Mechanisms EPA is pursuing ESPCs to finance the initial cost of comprehensive energy upgrades. In FY 2000, EPA awarded one ESPC at its laboratory in Ada, Oklahoma, worth more than $4 million for facility upgrades.
Energy-Efficient Product Procurement EPA actively promotes the purchase of energy-efficient products that carry the ENERGY STAR® label. The Agency reviews and updates its purchasing specifications regularly.
EPA encourages its employees to become involved and responsible participants in the Agency’s energy
management activities. The Environmentally PreferablePurchasing program helps train Government purchasecard users on buying energy-efficient and sustainableproducts. The Agency also distributes product guidesthat explain in greater detail the environmentalattributes of available products, such as light bulbs,light fixtures, and air conditioning equipment.
Credit card purchasing guidelines on EPA’sEnvironmentally Preferable Purchasing Program’s Website provide easy access for credit card holders toensure their purchases comply with environmental lawsand EPA policies. The guidelines identify specificenvironmental attributes to look for when selectingproducts, including the ENERGY STAR® label or otherenergy-efficiency designations.
Several EPA newsletters promote the use of energy-efficient products and provide resources to EPApurchasers, including the Environmentally PreferablePurchasing (EPP) Program’s EPP Update and theOffice of Administration and Resources Management’sGreening EPA.
ENERGY STAR® BuildingsCurrently, the ENERGY STAR® Buildings program doesnot encompass energy-intensive facilities such aslaboratories, therefore EPA cannot designate its 19laboratory facilities as ENERGY STAR® buildings. TheAgency is working with GSA, however, to achieve theENERGY STAR® Buildings label in its leased officefacilities. Three EPA office buildings, either owned orleased by GSA, have been awarded the ENERGY STAR®
label.
Sustainable Building Design EPA incorporates sustainable design principles into the siting, design, and construction of new facilities, as well as the renovation and maintenance of existing facilities. The Agency developed a Green Buildings Vision and Policy Statement which serves as a guide for a holistic, systems approach to building design.
Several EPA facilities are applying the green building principles outlined in the policy statement. In Fort Meade, Maryland, the new Environmental Science Center features many green building technologies, including energy-saving lighting, use of natural light, an environmentally-sound climate control system, a variable air volume system, direct digital controls, environmentally preferable building materials, natural landscaping, and water conservation. The facility is also pursuing certification of its environmental management system under the international ISO 14001 standard.
129

The new Region 7 Headquarters in Kansas City, Kansas, is a “green” office building incorporating significant environmental features. EPA leases the building and worked with GSA and the building developer to increase the building’s environmental performance. Environmental components at the new office building include energy-efficient and passive solar design (using natural light, motion sensors, T-8 fluorescent bulbs, low-E windows), an advanced water management system, erosion control, landscaping and use of indigenous plants, recycled materials, and indoor air quality.
Energy Efficiency in Lease Provisions EPA does not own most of the buildings it uses. They are leased by the Agency directly from the building owners or are owned by GSA. As part of its mission to protect and improve the environment, however, EPA decided to exert some control over the energy and water management of its office buildings and recently began requiring “green riders” as part of its leases for newly constructed leased buildings. The green rider, which includes environmentally preferable criteria such as energy and water efficiency measures, is an amendment to the Agency’s solicitation for offers for constructing or retrofitting EPA facilities. EPA used green riders for its new Region 3, Region 7, and Region 10 office buildings and the Region 7 and Region 1 laboratories currently under construction. When potential contractors submit bids to build a new facility for EPA’s use, they are required to address the green rider as part of the proposal process.
Off-Grid Generation To promote environmentally-sensitive energy generation, EPA facilities are using renewable energy technologies to supplement or replace a large portion of their energy requirements. In all ESPCs, EPA requires the installation of renewable technologies as part of the overall upgrade. The following facilities incorporate renewable energy technologies:
! Ada, Oklahoma – The Ada, Oklahoma, laboratory, is installing a geothermal heat pump as part of an ESPC upgrade.
! Ann Arbor, Michigan – A 200 kilowatt natural gas fuel cell is being installed as part of an ESPC upgrade. The fuel cell will generate 200 kilowatts of power and will provide heating water for the reheat water loop serving the air handling units. By integrating the heating and cooling plant, EPA will recover significant amounts of energy.
! Athens, Georgia – The facility installed a solar water heater at the onsite day-care center.
! Edison, New Jersey – The facility installed three solar energy water-heating systems that are now the primary source of hot water in their respective facility areas.
! Fort Meade, Maryland – EPA is working with the DOE, Siemens-Westinghouse Power Corporation, and Cinergy Corporation to demonstrate the world’s first megawatt-class solid oxide fuel cell (SOFC) power generation system. Never before has a fuel cell been built of this size, scale, or capacity. The hybrid power system will demonstrate the highest electrical efficiency (60 percent) and lowest emissions of any power plant fueled by natural gas. SOFC technology has the potential to virtually eliminate nitrous oxide and sulfur oxide emissions and drastically reduce greenhouse gases.
! Gulf Breeze – Florida. The laboratory installed a photovoltaic system to generate onsite electricity to light two of the facility’s four piers.
! Manchester, Washington – EPA’s wet laboratory in Manchester, Washington, may become the first commercial solar powered “net metering” project in the Northwest.
Energy Management Contact Mr. Philip Wirdzek Facilities Management and Services Division Mail Stop 3204 U.S. Environmental Protection Agency 401 M Street, SW Washington, DC 20460 Phone: 202-260-2094 Fax: 202-401-8971
130

N. GENERAL SERVICES ADMINISTRATION (GSA)
Management and Administration The Assistant Commissioner for Business Performance is designated as the General Services Administration’s (GSA) Senior Official responsible for meeting the goals and requirements of Executive Order 13123. The Official is supported by a team of appropriate personnel to expedite and encourage the agency’s use of strategies identified in the Executive Order.
Recognition GSA annually participates in the Federal Energy and Water Management Awards program, and received six awards at the October 2000 program. Internally, GSA honors each of the DOE award recipients with a ceremony and monetary award.
Energy reduction and utility cost reduction goals are tracked as part of GSA’s performance evaluation to the President. Senior management and regional senior management executives have energy performance included as part of their performance evaluation. In each region, Regional Energy Coordinators’ performance evaluations and position descriptions include a full range of energy efficiency, water conservation, and renewable project measures in their descriptions.
Training Training workshops held by GSA or in collaboration with other organizations in FY 2000 include the following:
! “United Nations Workshop on Energy Efficiency and Global Competitiveness and deregulation” in New York, New York, with 500 attendees;
! Energy Centers of Expertise Workshop in Kansas City, Missouri, with 35 attendees;
! “Utilities Workshop” in Annapolis, Maryland, with 100 attendees;
! “Energy 2000” in Pittsburgh, Pennsylvania, with 1125 attendees; and
! “Energy Workshop” with 75 attendees
GSA routinely trains its own personnel in all aspects of energy and water management and conservation. GSA also includes project managers responsible for renovation and new construction projects in many energy management training activities.
Showcase Facilities In FY 2000, GSA designated two facilities as Showcase Facilities. The Denver Federal Court House is crowned by a series of glazing-integrated photovoltaic modules
incorporated into the top horizontal roof louver of the tower. Estimated total energy production from the system is approximately 25,000 kilowatt-hours per year, or about 2 percent of the building’s total annual electric consumption.
The building also incorporated sustainable design principles into selections of building materials, making use of local materials, steel frames with recycled content, and flooring materials made from recycled or native sources. The building’s design includes low-impact landscaping to minimize water use, reduce the “urban heat island” effect, and provide an attractive outdoor space. Low-flow lavatory faucets and water closets will also be used throughout to minimize water use. All interior finish materials were carefully selected on the basis of their impact on the environment and occupants.
The building will consume 43 percent less energy than a building designed according to DOE standards for energy efficiency. Because the courthouse has been designated a “demonstration project” by GSA, it will be used to influence future courthouse design projects.
As a result of energy-efficient mechanical systems, water conservation and the application of renewable energy technologies, the 615,000 square foot facility will save $300,000 in energy costs per year, in comparison to other facilities of this type. A projected 50 percent cost savings in utility consumption will be achieved through attainment of the U.S. Green Building Council’s Leadership in Energy and Environmental Design gold rating.
The second Showcase building is the Seattle Federal Courthouse, with construction scheduled for completion in 2002. The facility will serve as an opportunity to educate hundreds of visitors per day about sustainable building practices. The design of the courthouse includes a minimized building footprint, allowing for an open courtyard that contains plants requiring little water.
Energy Efficiency Performance
Standard Buildings In FY 2000, GSA reported a 20.2 percent decrease in energy consumption from FY 1985 for its standard buildings when measured in Btu per gross square foot. GSA received credit for purchases of 3.8 billion Btu of renewable electricity. This lowered the energy intensity
131

of its standard buildings from 66,813 Btu/GSF to 66,791 Btu/GSF.
The 1985 baseline for this category of standard buildings was modified due to the moving of appropriate energy intensive facilities to their own category. These facilities were selected in accordance with DOE’s guidance issued on December 8, 1999.
In FY 2000, GSA invested $16.5 million of Energy Program appropriations in its standard facilities.
Industrial and Laboratory Facilities GSA energy usage in FY 2000 was 287,476 Btu/GSF compared to 432,313 Btu/GSF in FY1990. This represents a decrease of 33.5 percent compared with the 1990 base year. The agency achieved this reduction by directly investing in energy and water conservation opportunities with paybacks of 10 years or less.
In FY 2000, GSA invested $496,000 of Energy Program appropriations in its industrial and laboratory facilities, largely for two projects that are part of GSA’s energy intensive inventory. GSA has reduced it’s consumption in these facilities by 31 percent over the FY 1990 baseline, exceeding the goals mandated for this category of facility for FY 2005.
! Region 6 entered into a Utility financed project with Kansas City Power and Light at the Federal Building in Kansas City, Missouri, for energy efficiency measures that are anticipated to save the Government 18,800 MBtu annually. This facility is classified as an energy intensive facility.
! Region 10 entered into a Super ESPC with Johnson Controls at the FDA Building in Bothell, Washington for $577,000. The energy conservation measures implemented in this project are projected to save 9,700 MBtu annually. This facility is classified as an energy intensive facility.
Exempt Facilities GSA excluded buildings include those entering or leaving the inventory in a given year, buildings undergoing renovations, and outside parking garages.
Renewable Energy GSA considers opportunities for solar and other renewable energy in building design and retrofits. When GSA performs an energy audit of a facility, renewable opportunities are identified and implemented if they are LCC effective.
GSA completed three solar projects at facilities across the country:
! In Boston, Massachusetts, at the J.W. Williams CG building, GSA installed a 28 kilowatt building integrated photovoltaic roof system;
! In Suitland, Maryland, GSA installed a 100 kilowatt photovoltaic array at the Suitland FB; and
! In Auburn, Washington, GSA installed at 2 kilowatt photovoltaic project at the GSA daycare center in the Regional Office.
Purchased Renewable Energy In FY 2000, GSA purchased a total of 1,113 megawatt-hours of electricity from renewables through competitive power contracts.
The New England Region of GSA signed an electric generation contract with ENRON Energy Services in FY 1998. As part of this contract, the GSA will be purchasing 10 percent of its power consumption in the State of Massachusetts from a renewable source (4,800 megawatt-hours). The delivery of the green power began in FY 2000. The GSA intends to follow up this term with a follow-on term for green power purchase. The eight other Federal agencies under the ENRON contract will also be using the green power pricing negotiated by GSA to procure Green power for their facilities.
In February 2000, the mid-Atlantic Region of GSA signed a 12 month agreement with The Energy Cooperative of Philadelphia, Pennsylvania, to purchase green power for six accounts, for approximately 2.7 million kilowatt-hours annually.
GSA contracted on behalf of the EPA for a 100 percent renewable power purchase at their new lab in Chelmsford, Massachusetts. The total estimated annual contract load for this procurement is 1.9 megawatt-hours.
GSA attempts to include the option for renewable purchases in all competitive procurements issued and exercises the option when possible.
Million Solar Roofs GSA is a participating agency in the Million Solar Roofs initiative. GSA developed a plan to install 60 solar roof projects as defined by DOE under this initiative by the year 2010.
In FY 2000, four qualifying roofs were installed. In addition, the GSA Energy Center of Expertise is
132

funding a photovoltaic project in Washington with FY 2001 funding.
Petroleum GSA has encouraged the reduction in the use of petroleum-based fuel. From the 1975 former base year to the 1985 present base year, GSA reduced oil use from approximately 18.5 million gallons in Federally-owned buildings to about 7.6 million gallons in 1985 in both owned and leased buildings. From 1985 to 2000, GSA petroleum-based fuel use in buildings dropped by 93.5 percent, from 7.6 million gallons to 491.4 gallons.
Implementation Strategies
Life-Cycle Cost Analysis GSA used LCC analysis as one of the primary factors in determining which energy projects to fund in FY 2000. GSA conducted two training classes in LCC analysis during FY 2000. GSA staff also attend Federal Energy Management Program LCC analysis-training classes.
GSA strives to make LCC analysis a part of the selection process for the majority of the agency’s construction projects. In addition to being a criteria for disbursement of dedicated energy conservation funds, other construction projects such as chiller replacements utilized this tool in the selection of equipment prior to issuance of the construction bid documents to ensure that the most life-cycle cost effective equipment would be installed.
Energy Audits GSA has a 10-year audit plan in place in which approximately 10 percent of all space is audited in any given year. The plan is updated each year.
GSA performs energy and water surveys in accordance with its 10 year audit plan. The conservation measures that have been identified are developed into energy conservation project proposals using LCC methodology. As funding permits, projects are selected for approval and implementation. GSA had planned to invest $50 million per year from 1994 through 2000 in order to meet the 20 and 30 percent reduction goals. The actual appropriations, after rescissions, have averaged $16.8 million over 6 years. Other programs, such as GSA’s annual Repair and Alterations Program, as well as the chlorofluorocarbon (CFC) Chiller Replacement Program, also invest in energy efficient facilities and equipment. However, the sum of these investments may not be sufficient for GSA to meet the energy reduction goals.
Financing Mechanisms During FY 2000, $878,000 in rebates was deposited into GSA’s Federal Buildings Fund from demand side management programs from energy projects. All of this money was distributed to regional programs to fund energy retrofits or energy audits.
GSA requested $20 million in energy funding and received $17 million for FY 2000. GSA distributed the funds to the Regions for approved energy and water conservation projects. These projects were selected based on Savings to Investment Ratios, a payback analysis, as well as projects which assisted GSA in achieving some of the strategic goals. Many were direct result of energy audits that were performed at the various facilities.
A goal was set of doubling the number of financed projects in FY 2000 compared to FY 1999. GSA is proud to report this goal was accomplished. In 1999, GSA awarded a total of 4 alternatively financed projects, 1 ESPC and 3 UESC projects. In FY 2000, GSA awarded 9 financed projects, 6 ESPCs and 3 utility financed projects.
GSA used alternatively financed contracting to implement a large number of energy retrofits. The ECOE developed a guide, “Procuring Energy Management Services with the Utility Area-wide Contract” to assist Regions in using these vehicles to finance energy conservation projects through utilities. Additionally, every Region sent employees to the Super ESPC Workshops that were offered by DOE to train everyone on the team responsible for the execution of these projects.
The annual savings anticipated from GSA’s ESPCs and utility contracts currently in place are 223,248 MBtu and $4,792,000.
In FY 2000, GSA used area wide utility contracts and basic ordering agreements to obtain utility financing of energy projects as follows:
! Region 2, is currently working on 6 energy management projects. The estimated combined value of these 6 projects is $5.3 million;
! Region 4 has 5 Utility Financed projects that are currently in repayment status. Total project value in the region is $2.7 million;
! Region 6 has one Utility Financed project currently in repayment status. This project value was $2.6 million;
! Region 7 is currently working on a Utility Financed project for the Federal Building in
133

Houston, Texas. The value is estimated at $3 million; and
! Region 11 awarded 3 Utility Financed projects in FY 2000. One contract for the National Courts Building is for $1.8 million, a 2nd project for FAA buildings is for $3.6 million and the 3rd is at the Suitland Federal Building 2 and is valued at $1.4 million. This region is also in the final stages of a large Utility Financed project at the Smithsonian Institution in Washington, D.C., whose value will be close to $50 million.
GSA currently has 13 utility financed projects in place and is pursuing 8 additional projects. Three of the utility financed projects were paid off during FY2000.
ENERGY STAR® and Other Energy Efficient Products GSA supports the procurement of energy efficient products through a number of activities. GSA provides product supply schedules that promote energy efficient and environmentally preferable products and to mandate the purchase of ENERGY STAR® computers and office equipment. GSA is a signatory to and an active participant in the “Procurement Challenge”, an interagency program through FEMP designed to identify the most energy efficient products and to increase the purchase of these projects.
ENERGY STAR® Buildings GSA has conducted a mass evaluation of all Category A, standard facilities using ENERGY STAR® software and forwarded the results to the regions for data correction and certification as identified in the FY 2000 Implementation Plan. As of September 2000, GSA has earned the ENERGY STAR® Building Label for 70 of its own facilities and 1 of GSA’s leased facilities. The total square footage for the facilities is 17.4 million GSF.
Sustainable Building Design In FY 2000, GSA conducted Sustainable Design workshops in all 11 regions. The training was attended by employees directly involved in the energy program, project managers, building management specialists, and engineers.
As identified in the GSA FY 2000 implementation plan, GSA has incorporated sustainable design criteria into all guide specifications, facilities standards, and other construction requirements for new construction and renovation efforts.
Off-Grid Generation GSA has continued to investigate the potential for off-grid generation technologies whenever an energy audit or study is conducted at a facility. In FY 2000, the
ECOE funded a geothermal heat pump project in Missouri. GSA also installed four solar photovoltaic projects in FY 2000, totaling 140 kilowatt-hours of electricity generated.
Energy Efficiency in Lease Provisions The GSA 2000 Implementation Plan included incorporating lease provisions that encourage energy and water efficiency and sustainable design. In FY 1999, GSA issued an acquisition letter to all leasing activities – the first installment of leasing energy and environmental business practices and solicitation for offers language for implementation of Executive Order 13123.
Water Conservation In FY 2000, GSA finalized a Water Management Guide which is posted on the GSA Energy Center of Expertise’s website for use by any Federal agency. This guide provides comprehensive guidance on how to meet the requirements of Executive Order 13123.
GSA conducts audits on approximately 10 percent of its facilities each year. The scope of these audits always includes water conservation measures. GSA also includes water conservation savings when investigating the feasibility of Energy Service Performance Contract and Utility Energy Service Contract (UESC) projects. In FY 2000, GSA funded numerous whole building retrofits for a variety of facilities across the nation. Many of these projects included a detailed energy audit that investigates water conservation as well as energy conservation. If shown to be LCC-effective, conservation projects such as restroom retrofits, cooling tower technologies, condensate reuse, and irrigation measures continue to be implemented in GSA facilities.
GSA’s water consumption for FY 2000 is estimated to be 4 million gallons. This represents consumption for all of GSA’s owned facility inventory. The cost of this consumption was $16 million , which includes sewage costs as well.
Energy Management Contact Mr. Mark EwingDirector, Energy Center of ExpertiseGeneral Services Administration1500 East Bannister RoadKansas City, MO 64131-3088Phone: 816-823-2691Fax: 816-823-2696
134

O. NATIONAL AERONAUTICS AND SPACE ADMINISTRATION (NASA)
Management and Administration The National Aeronautics and Space Administration (NASA) Administrator has designated the Associate Administrator for Management Systems as the senior NASA official responsible for meeting the goals and requirements of Executive Order 13123.
The Energy Efficiency Board (EEB) was established to meet the requirement for an Agency Energy Team. The EEB provides an agency-level forum to guide the planning and implementation of energy efficiency activities, including energy and water conservation, greenhouse gases reduction, and use of renewable energy sources.
NASA employed the following management initiativesand tools to promote effective energy and watermanagement:! A comprehensive NASA directive was drafted with
assistance from the National Renewable Energy Laboratory (NREL). This directive provides agency wide procedures and guidelines for meeting the requirements and goals of Executive Order 13123, using alternative financing, and evaluating renewable energy and water conservation opportunities.
! Program Operating Plan guidance was issued to NASA Centers and Component Facilities for including energy efficiency funds in their FY 2002 budget requests.
! Energy and Water Management Functional Reviews were conducted at Glenn Research Center (GRC), Goddard Space Flight Center (GSFC), Jet Propulsion Laboratory (JPL), Goldstone Deep Space Communications Complex, Michoud Assembly Facility (MAF), and Wallops Flight Facility.
! The NASA Environmental Tracking System (NETS) energy reporting module was enhanced to include Executive Order 13123 requirements and new Federal Energy Management Program /Office of Management and Budget (OMB) annual reporting guidance. A feature was also added to NETS to automatically generate Btu/GSF charts for each reporting site to track building energy reduction progress.
Recognition NASA actively participates in the DOE Federal Energy and Water Management Awards program. In addition, most NASA Centers and Component Facilities recognize employee contributions to energy and water savings by utilizing established employee suggestion
programs, issuing monetary awards based on savings achieved, and recognizing employee contributions in internal news publications. The following specific activities were also pursued:
! NASA submitted four award nominations in FY 2000 and received two awards.
! NASA has named 16 Energy Champions since the FEMP program began in FY 1998;
! The Ames Research Center (ARC) administers a Pollution Prevention Award which takes energy savings measures into account; and
! The KSC Joint Base Operations Support Contractor established the Energy Achievement Goals for Life and Environment (EAGLE) Award program, and in FY 2000 recognized employee contributions to energy and water efficiency and environmental improvement.
Performance Evaluations Most NASA Centers and Component Facilities have included, or are including, the successful implementation of energy management conservation requirements in performance evaluations and positions descriptions for all those involved in energy management activities. This also includes the Center Maintenance and Base Operations Support contractors.
Training NASA completed the following activities to ensure that all appropriate personnel receive training for energy and water management requirements:
! An Energy Efficiency and Water Conservation course was developed to give energy and facilities management professionals the knowledge and skills required to successfully implement energy efficiency and water conservation projects;
! NASA Headquarters hosted the NASA 2000 Environmental Conference at ARC in March 2000. The Conference was attended by 150 energy, environmental, and facilities professionals from across the Agency. The Conference included an energy efficiency track including sessions on ESPCs and Utility Energy Services Contracts (UESC), sustainable design, continuous commissioning, renewable energy, water conservation, and green power;
! KSC carried training broadcasts on the Center’s closed circuit TV system.
! Fifty NASA employees and contractors received energy and water management training through FEMP courses, industry conferences, and
135

commercial or academic classes.
Showcase Facilities NASA did not designate any new Showcase Facilities in FY 2000. NASA currently has one Showcase Facility, the Marshall Space Flight Center (MSFC) Project Engineering Facility, Building 4203. This facility features many state-of-the-art energy efficiency and environmental quality measures such as tinted windows, a variable air volume HVAC system, nonchloroflurocarbon (CFC) chillers, an automated energy management system with direct digital controls, self-illuminating exit signs, and a radon venting system. The building is heated with steam from the Army’s Redstone Arsenal steam distribution system, which is connected to the city’s solid waste-to-steam plant.
Energy Efficiency Performance
Standard Buildings In FY 2000, NASA reported a 20.5 percent decrease in energy consumption from FY 1985 for its standard buildings when measured in Btu per gross square foot.
NASA completed a major effort to realign its facility designations and historical energy consumption baselines to comply with the definitions and goals established by Executive Order 13123 for the three new categories of Federal buildings and facilities.
This agency-wide facility realignment brings NASA into compliance with the facility definitions of Executive Order 13123 and dramatically reduces the number of facility exemptions claimed by the agency.
In FY 1999, 15.5 million gross square feet (GSF), or 39 percent of NASA’s total facility square footage, was designated as exempt. For FY 2000, only 4.9 million GSF, or 12 percent of NASA facility square footage is designated as exempt.
Industrial and Laboratory Facilities NASA has elected to use Btu/GSF as the agency wide aggregate performance measure for these facilities. Other performance measures are utilized for individual industrial facilities, space flight tracking stations, and clean rooms. The average energy intensity for NASA’s standard buildings was 256,613 Btu/GSF by the end of FY 2000, as compared to the FY 1990 baseline value of 323,955 Btu/GSF. This represents a decrease of 20.8 percent.
NASA completed the following activities to improve the energy efficiency of its industrial and laboratory facilities:
! JPL included an energy conservation performance incentive in a facility maintenance and operations services contract The incentive is based on achieving specific energy consumption targets for each of three consecutive years. The targets were set to reduce energy consumption below current consumption levels. The incentive structure includes a penalty provision if the specified targets for energy-intensive mission variable facilities are exceeded;
! NASA continued its shared energy savings contract incentive arrangement with Lockheed Martin Michoud Space Systems (LMMSS), the contractor operator of the NASA MAF. This contract incentive arrangement, known as the Energy Cost Reduction Program (ECRP), was established in 1988. Under this program, LMMSS’s prime contract with NASA was modified to include an energy conservation incentive clause. The program rewards LMMSS for exceptional performance in the management of energy usage at MAF by providing 8 to 14 percent of energy savings achieved as an additional award fee. The program includes provisions for sharing savings achieved through energy conservation projects proposed by LMMSS. The share of savings is determined by whether NASA or LMMSS funds the capital investment. Savings from the ECRP at MAF are used to reduce the overall cost of the Space Shuttle External Tank program.
Exempt Facilities In FY 2000, only 4.9 million GSF, or 12 percent of NASA facility square footage is designated as exempt. These facilities are highly specialized and energy intensive, having been constructed for specific space flight and research programs. Examples are wind tunnels driven by multi-thousand horsepower electric motors, space simulation chambers, and space communication facilities. The facilities range from pre-World War II aeronautical test installations to new facilities that support the Space Shuttle and International Space Station programs. Energy consumption in these facilities varies directly with the level and intensity of program activities.
NASA completed the following activities to improve the energy efficiency of its exempt facilities:
! NASA adopted an internal goal to improve the energy efficiency of exempt facilities, where cost effective and without adversely affecting mission performance, by 10 percent by FY 2005 compared with FY 1985 levels. Wind tunnels are excluded from this goal; and
136

! The Merritt Island Launch Annex installed a bus-tie breaker in the tracking station’s power plant reducing the need to operate two out of four engine/generator sets. This change in operating procedure saves diesel fuel, increases reliability, and reduces air emissions and maintenance costs.
MAF selected billions of Btu per External Tank as its industrial energy metric. In the FY 1990 baseline year, MAF total energy consumption was 925.8 billion Btu at a production rate of 4.6 External Tanks per year, or 201.3 billion Btu per External Tank. In FY 2000, MAF total energy consumption was 957.9 billion Btu at a production rate of 6.0 External Tanks per year, or 160.0 billion Btu per External Tank. This represents a 20.5 percent reduction in energy consumption per External Tank produced.
Tactical Vehicle and Equipment Fuel Use NASA received recognition from the Secretary of Energy as a leader in improving air quality, strengthening the local economy, and enhancing public awareness of alternative fuels through its commitment to and participation in the Clean Cities Coalition. NASA also completed the following activities to reduce the use of gasoline and diesel fuels in vehicles:
! Installed two inductive charging stations to provide on-site access for charging electric vehicles; and
! Continued to operate compressed natural gas fueling stations at Glenn Research Center and KSC.
Renewable Energy NASA completed the following activities to expand its use of on-site renewable energy resources:
! Procured a small windmill to power a remote pumping station as part of an ESPC at Ames Research Center. The windmill will save $2,000 annually; and
! Continued operation of a major geothermal heat pump system for a test area at Stennis Space Center (SSC). This system has a total heating capacity of 7.1 million Btu per hour.
Due to the significant cost premium of electricity generated from renewable energy, NASA has focused its efforts on forms of renewable energy that are cost-competitive with conventional energy sources. NASA completed the following activities to increase energy purchases from renewable sources:
! Awarded a landfill methane supply contract at GSFC. This contract represents NASA’s largest
renewable energy project to date. The project will replace approximately $1.5 million in natural gas purchases with landfill gas, an amount equal to 3.8 percent of all NASA facility energy. The project has the same greenhouse gas reduction benefit as planting 68,000 acres of trees or removing 100,000 cars from Maryland highways. The project will also reduce the Center’s annual energy costs by approximately $330,000 and enhance fuel supply reliability. In awarding this contract, NASA became the first Federal agency to sign a Memorandum of Understanding (MOU) with the Environmental Protection Agency’s (EPA) Landfill Methane Outreach Program and the first to use landfill gas directly in boilers; and
! Continued to purchase steam generated from municipal solid waste at the Langley Research Center (LaRC) and Marshall Space Flight Center.
Million Solar Roofs NASA completed the following Million Solar Roofs project in FY 2000:
! Dryden Flight Research Center (DFRC) in Edwards, California, installed an innovative hybrid solar energy and natural gas heating system used by NASA to house research aircraft. The new heating system uses a 2,500 square foot, transpired solar wall in combination with six modular high-efficiency condensing boilers. The project reduces energy costs, improves indoor air quality and worker safety, and reduces air emissions. In accomplishing this project, NASA partnered with Edwards Air Force Base, who partially funded the project as a technology demonstration under its air permit elimination initiative, and with NREL, who provided project planning and design assistance. NASA will nominate this Million Solar Roofs project as a FY 2001 Federal Energy Saver Showcase Facility.
Petroleum NASA continues to make significant progress in reducing the use of petroleum-based fuels in buildings and facilities.
Petroleum, including fuel oil and liquefied petroleum gas, represents only 8.7 percent of NASA fuel consumption in fixed facilities and 3.0 percent of total fixed facility energy usage.
Water Conservation NASA completed the following actions in FY 2000 to improve water efficiency:
137

! Ames Research Center installed an automatic irrigation system to reduce the amount of water run-off. The $60,000 system is saving 30,000 gallons of water annually;
! Goddard Space Flight Center is installing automatic sensors on restroom faucets. The $412,000 project will save 4.9 million gallons of water annually. The Center also plans to drill two 500 foot water wells through a UESC contract. The wells will supply 7 million gallons of make-up water to the Center’s cooling towers. The $1.2 million project will reduce demand on the local water utility’s potable water supply and has a payback period of less than 4 years;
! JPL continued the final phase of its program to install waterless urinals throughout the Center. In FY 2000, JPL invested $1,000 in this technology. This investment will be recovered in just over two years through reduced water usage and related maintenance savings;
! KSC installed water conservation fixtures in bathrooms and in its exercise facility. The $18,000 project is saving 1.3 million gallons of water annually;
! LaRC initiated a survey of approximately 32 laboratories to review the use of once-through cooling water to equipment; and
! Michoud Assembly Facility initiated a pilot project to determine the feasibility of ozone treatment of cooling tower water. This technology has the potential for significant water and chemical treatment cost savings if implemented site-wide.
Implementation Strategies
Life-Cycle Cost Analysis Life-cycle costing (LCC) is the primary tool for analyzing energy retrofit projects at NASA. Economic analyses are performed for all construction and revitalization projects in excess of $1.5 million.
Energy Audits During FY 2000, NASA completed audits for 9.6 percent of its total building square footage. Among these audits were DOE SAVEnergy Audits for seven buildings at DFRC totaling 420,000 GSF or approximately 47 percent of the Center’s total square footage. From FY 1991 through FY 2000, NASA completed energy audits for 75.7 percent of its total building square footage, including 74.4 percent of non-exempt square footage, and 77.1 percent of exempt and industrial square footage.
Financing Mechanisms In FY 2000, NASA made continued progress in
implementing ESPC and UESC contracts. Over the past 2 years NASA has awarded 5 ESPC delivery orders and 1 UESC at 4 locations (Glenn Research Center, Goddard Space Flight Center, Johnson Space Center, and Kennedy Space Ceneter) resulting in $28 million in energy improvements in NASA facilities that are saving $3.2 million annually. The following additional accomplishments were achieved in FY 2000:
! NASA Headquarters issued a letter to all NASA Center Directors encouraging continued use of ESPC and UESC as important tools for reducing energy use and cost in facilities and operations. The letter included ESPC implementation guidelines based on lessons learned and was widely distributed.
! ARC in Moffett Field, California, issued an ESPC Delivery Order to Johnson Controls under the DOE Western Region Super ESPC on August 21, 2000,. The Delivery Order value was $5.1 million over its 19-year term. The Delivery Order provides for multiple projects involving energy efficient lighting systems, an automated building energy management and control system, and a small wind-powered water pumping system. The initial contractor capital investment is approximately $2.1 million and annual savings of $258,000 are anticipated. The work will be performed in 21 buildings, the majority of which are non-research facilities. One added benefit of the project is the removal of hundreds of polychlorinated (PCB) lighting ballasts still in service in these old buildings.
! GSFC issued its third ESPC delivery order under its own multiple award indefinite delivery, indefinite quantity ESPCs with two energy service companies. This $272,000 delivery order will install T-8 lamps, electronic ballasts, and will also install motion detectors in offices, hallways, and restrooms. Annual savings of $56,000 are anticipated.
! KSC participated in the Air Force 45th Space Wing’s ESPC with Noresco, Inc. The value of NASA’s share of the ESPC is $3,390,000 over its 13 year term. Annual savings of $253,000 are anticipated.
! The JPL in Pasadena, California, issued an ESPC Request for Proposals involving nine of JPL’s most energy-intensive laboratories and research facilities on October 5, 2000. JPL is a Federally-Funded Research and Development Center operated for NASA by Caltech. Because Caltech pays utility costs directly and is subsequently reimbursed by NASA under the prime contract, it would be administratively complex for JPL to use the DOE
138

Western Region Super ESPC vehicle. JPL will develop and award its own ESPC using the DOE contract format.
! Mississippi Power completed walk through audits of all NASA and tenant facilities at SSC and submitted a Preliminary Analysis Report to NASA. SSC established a cross-functional team of financial, legal, procurement, and facilities engineering, operations and maintenance personnel to evaluate Mississippi Power’s Report. The team is developing an Indefinite Quantity-Indefinite Delivery ordering mechanism under the existing GSA Area-wide utility contract that will allow the Center to order energy-efficiency services as specific lighting, metering, HVAC, and renewable energy projects are identified.
ENERGY STAR® and Other Energy Efficient Products In FY 2000, NASA Centers and Component Facilities continued to install high efficiency electrical products such as variable frequency drive systems for fans and pumps, high efficiency fluorescent lamps, electronic ballasts, compact fluorescent bulbs as replacements for incandescent bulbs, light emitting diode and other low power consumption exit lights, and occupancy sensors. NASA took the following actions in FY 2000 to purchase ENERGY STAR® and other energy-efficient products:
! NASA Headquarters initiated a study to develop a NASA-wide consensus standard for Energy Monitoring and Control System (EMCS) device and system communications and a recommend a migration path to the new EMCS open protocol standards.
! DFRC installed a hybrid solar/modular gas-fired boiler heating system in a hangar. The new heating system uses a 2,500 square foot transpired solar wall in combination with six modular high-efficiency condensing boilers. The project reduces energy costs, improves indoor air quality, and reduces air emissions.
! JPL replaced T-12 lamps and ballasts with T-8 lamps and electronic ballasts in several buildings. The $108,000 investment will payback in just over 4 years.
! KSC completed one phase of a lighting retrofit project for the Launch Control Complex. The project will install T-8 lamps, electronic ballasts, and occupancy sensors. The $400,000 project will payback in under 6 years.
! Marshall Space Flight Center installed new stairway lighting fixtures incorporating occupancy sensors. The fixtures cost $95,000 installed and will save $12,000 in energy costs annually.
! White Sands Test Facility installed low loss transformers at the Water Treatment Building.
ENERGY STAR® Buildings NASA analyzed 64 facilities at 9 locations using the EPA’s ENERGY STAR® Building Label benchmarking tool. Two buildings qualified for and will receive the ENERGY STAR® Label; the Child Development Center at KSC and the Chief, Naval Meteorology and Oceanography Administration Facility at Stennis Space Center. Guidance was also provided to Centers for conducting future ENERGY STAR® Label for Buildings analyses using the benchmarking tool. Recommended ESPC and UESC language was also developed to require pre- and post-retrofit ENERGY STAR® analyses of projects involving significant energy improvements in NASA office buildings.
Sustainable Building Design NASA Headquarters is sponsoring a study to develop an integrated strategy for sustainable design, building commissioning, and design for maintainability. In the course of the study, NASA benchmarked with Federal agencies, the U.S. Green Building Council, the Sustainable Buildings Industry Council, state governments, industry, and academia. NASA’s final policy will draw heavily on guidance and criteria from the Whole Building Design Guide, the Leadership in Energy and Environmental Design (LEED) standard, and the Federal Facilities Council’s Guide To Integrating Value Engineering, Life Cycle Costing, And Sustainable Development.
Industrial Energy Efficiency Improvements NASA completed a number of projects in FY 2000 to improve the energy efficiency of standard and energy-intensive industrial facilities. Specific projects include:
! ARC installed new electrical metering as part of the ESPC preliminary investigation at a cost of $7,000;
! Glenn Research Center completed projects to replace HVAC units, install modern energy controls, rehabilitate lighting systems, and replace obsolete laboratory fume hood controls in several buildings;
! GSFC replaced HVAC units and controls in various buildings with more energy efficient units. Variable frequency drives were also installed on large motors. The Center also completed $700,000 in repairs to building roofs and roof insulation. The repairs will save $41,000 in energy costs annually;
! JPL replaced an obsolete fire-tube boiler in the Center Cafeteria with a high-efficiency water-tube boiler. JPL also completed installation and
139
calibration of electric and gas meters and gas leak repairs at its Pasadena campus;
! KSC completed the replacement of the HVAC system in a training facility with a state of the art system using chilled water from a central plant, a CO2 demand ventilation control, “Tri-Coil” heat transfer coils for free pre-cooling and reheating, and direct digital controls. The $303,000 project eliminates use of chlorofluorocarbon (CFC) 12 refrigerant, demonstrates new technologies, and will reduce energy costs by $31,000 annually. The Center also completed HVAC system renovations for an area of the Headquarters Building. The project resulted in reduced exhaust and make-up air flow by installing new air handling units, ambient light sensors and dimmers in rooms with windows, and direct digital controls with occupancy sensors to adjust outside air requirements. The Center consolidated space within existing buildings to relocate personnel from office trailers and modular buildings. This action is saving $22,000 in energy costs;
! LaRC initiated various maintenance augmentation tasks including roofing and HVAC replacement projects at a cost of $1.02 million dollars. These projects will save $205,000 annually. The Center also initiated a project to improve substation metering used to collect data on power parameters and energy supplied to Langley Air Force Base. The project will provide greater accuracy in billing the Air Force for electrical energy; and
! MSFC installed an ultrasonic steam meter in the cross-country line from the Army’s Redstone Arsenal. The meter station will allow the Center to verify actual steam usage and support analysis to potentially switch to lower cost energy sources.
Highly Efficient Systems NASA completed the following actions in FY 2000 to develop new construction and retrofit projects for advanced cooling, heating, and power systems:
! NASA awarded a landfill methane supply contract at GSFC; and
! KSC and Florida Power & Light Company completed a jointly-funded thermal energy storage system evaluation for the Industrial Area.
Off-Grid Generation NASA completed the following actions in FY 2000 to install new energy off-grid alternatives:
! KSC received funding to demonstrate a new technology or a solar desiccant dehumidification system for a photographic film storage facility with strict environmental control parameters. The system will use 640 square feet of solar concentrating collectors to heat water to 185 degrees F. to regenerate a silica desiccant dehumidification wheel. Waste heat rejected to the atmosphere will be recovered to enhance system efficiency. The $85,000 project will be jointly funded by the DOE Million Solar Roofs program, NASA, and the Florida Solar Energy Center; and
! MAF installed two solar powered warning lights at pedestrian crosswalks at a cost of $5,000.
Energy Management Contact Mr. Richard Wickman Environmental Management Division (JE) National Aeronautics and Space Administration 300 E Street, SW Washington, DC 20546-0001 Phone: 202-358-1113 Fax: 202-358-2861
140

P. NATIONAL ARCHIVES AND RECORDS ADMINISTRATION (NARA)
Management and Administration The Assistant Archivist for Administrative Services serves as NARA’s Senior Energy Official.
Recognition In concert with the overall Agency award plan, employees are granted awards for implementing actions associated with Executive Order 13123.
Performance Evaluations All agency personnel directly connected with the implementation of Executive Order 13123 have their position descriptions and performance evaluations annotated accordingly.
Training Members of the agency energy team will seekadditional training in FY 2001 and develop an outreachprogram to Federal purchase card holders to promoteENERGY STAR® and/or energy efficient products.All NARA employees are to be trained in energyconservation procedures in FY 2001.
Energy Efficiency Performance NARA owns and operates 13 separate facilities, all dedicated to the preservation, storage, display, and use of historical documents and artifacts. Documents and artifacts must be maintained in a controlled environment 24 hours per day, 365 days per year. All NARA facilities are excluded from the energy reduction requirements of the National Energy Conservation Policy Act (NECPA), because of stringent requirements for records storage which are very energy intensive and preclude major changes in operational parameters to conserve energy. These facilities are designated as energy intensive (non-industrial) for the purpose of this act.
NARA initiated the development of an agency Energy Plan in 1996 in concert with the agency’s Strategic Planning Process. The plan included conducting energy surveys of existing facilities which continue in conjunction with the building assessments and evaluations. NARA has an agency-wide policy to operate buildings as efficiently as possible with the intent to meet the energy reduction goals established in Executive Order 13123 and still maintain the environmental conditions required for preservation and safe storage of the nation’s archival documents. The Archives II building (approximately 50 percent of NARA’s total square footage of building space) did not become fully occupied and operational until 1996 and precludes the establishment of a meaningful energy
consumption figure for 1990. NARA’s yearly energy usage figures from FY 2000 vs FY 1997 show an 8 percent reduction in electricity usage and a 20 percent reduction in natural gas usage, which reflects implementation of NARA’s Energy Plan.
Implementation Strategies Financing Mechanisms NARA is pursuing the option of using Super Energy Savings Performance Contracts for pending work at the Kennedy, Roosevelt, and Reagan libraries.
Facility Energy Audits At least two Presidential Libraries will be audited in FY 2001, and recommendations will be incorporated into the agency overall renovation strategy.
ENERGY STAR® and Other Energy-Efficient Products All equipment and products specified in the Archives Irenovation are ENERGY STAR® or energy efficientproducts. All new computer hardware purchased by theagency must have an ENERGY STAR® designation. In FY2001, renovation plans for the Archives I buildinginclude energy efficient equipment.
In FY 2000, NARA integrated energy conservationmethods into building renovations. Light-fixture tubesand ballasts were replaced with energy efficient modelsin the Archives I building, and elevators were renovatedand upgraded using high efficiency equipment. TheArchives II building implemented peak demand limitingoperation of the Stack AHU’s. Energy efficientequipment was installed during renovations of thePresidential libraries. This included the installation ofa new ATC system at the Jimmy Carter library,replacement of boilers and AHU’s at the Trumanlibrary, and the installation of an energy efficient air-cooled chiller at the Ford library.
ENERGY STAR® BuildingsThe stringent requirements for records storage preventsNARA from designating any facilities as ENERGY
STAR® buildings. All NARA buildings, however,continue to implement the agency’s Energy Plan toreduce energy consumption.
Energy Management Contact Mr. Gary SimmonsGeneral Engineer, Facilities Management BranchNational Archives and Records Administration8601 Adelphi RoadCollege Park, MD 20740-6001Phone: 301-713-6470 x251
141

Q. NUCLEAR REGULATORY COMMISSION (NRC)
Management and Administration The Deputy Executive Director for Management Services serves as the Senior Energy Official.
An agency energy team was established in FY 2000 consisting of procurement, legal, budget, management, and technical representatives.
Recognition The Agency’s award program is used to reward exceptional performance in implementing Executive Order 13123.
Performance Evaluations Performance plans and evaluations for the Senior Energy Official take into account programmatic responsibility for implementation of Executive Order 13123. Position descriptions and performance evaluations for the Facilities/Energy Managers incorporate appropriate provisions for implementation of the Executive Order.
Training In FY 2000, members of the energy team attended the Department of Energy’s Interagency Energy Management Task Force meetings and training on Super Energy Savings Performance Contracts.
Energy Efficiency Performance
Standard Buildings Two White Flint North’s (TWFN) gross square footage has remained constant at 440,400 since base year FY 1996, the first year of full occupancy.
Water Conservation In FY 2001, NRC will consider installing water saving toilets, as recommended in DOE’s Water Management Plans and Best Management Practices.
Implementation Strategies
Energy Audits In FY 2000, two preliminary energy audits were conducted at One White Flint North (OWFN) and TWFN. This represents 100 percent of the NRC facilities’ inventory requiring energy audits.
The energy audit at TWFN identified the following energy conservation measures to be undertaken:
! Variable frequency drives on cooling towers; ! Power improvement devices on motors;
! Lighting upgrades; ! Occupancy sensors; and ! Water saving toilets.
NRC FY 2001 strategy is to perform a preliminary and comprehensive energy audit of OWFN, perform a comprehensive energy audit of TWFN, and implement self-funding projects.
Financing Mechanisms NRC has pursued alternative financing mechanisms for funding renovation projects. In FY 2000, NRC entered into an Interagency Agreement and Memorandum of Understanding with DOE to facilitate the award of a Super Energy Savings Performance Contract. A preliminary energy audit at OWFN was conducted to identify energy conservation methods. TWFN, a leased building, was excluded from the preliminary audit. Several system upgrades were identified as potential financible projects. Further financial analysis of the projects, however, led to the determination that the projects were not cost-effective Similar self-funded renovation proposals have also proven to be infeasible.
NRC is expecting to have in place a Utility Energy Services Contract (UESC) in FY 2001. PEPCO Energy Services will implement energy conservation measures at the OWFN and TWFN buildings.
Energy-Efficient Product Procurement All specifications for renovation projects performed by NRC are developed to ensure that energy efficient equipment and systems are incorporated into the renovation design. Additionally, the building operation and maintenance contract specifications for OWFN and TWFN have been updated to ensure that all building support replacement products and components are energy efficient. The NRC’s Affirmative Procurement Program for Recovered Materials provides Internet links to on-line training for Federal purchase card users on ENERGY STAR® acquisitions and other energy efficient products.
Energy Efficiency in Lease Provisions GSA serves as the leasing agent for all NRC facilities. However, prior to the execution of new leases, renegotiations, or extension of existing leases, NRC will request the opportunity to review all proposed lease documents to ensure that they are in compliance with the Model Lease Provision of the Executive Order.
142

Off-Grid Generation Energy Management ContactOff-grid generation systems such as solar hot water, Mr. Ken McDowsolar electric, small wind turbines, and fuel cells were Division of Facilities and Securityevaluated during a preliminary energy audit and Office of Administrationconsidered economically infeasible. Nuclear Regulatory Commission
Washington, D.C. 20555-0001 Phone: 301-415-1712
143

R. OFFICE OF PERSONNEL MANAGEMENT (OPM)
Management and Administration The Director, Office of Contracting and Administrative Services, is the Senior Agency Official for the U.S. Office of Personnel Management (OPM).
The energy team at OPM has responsibility for strategic oversight of OPM’s energy conservation plan and the planning and implementation of projects included in OPM’s energy conservation program.
Recognition OPM granted cash awards throughout FY 2000 to acknowledge work on behalf of the agency’s energy conservation program.
Performance Evaluations In FY 2000, OPM management considered energy program participation in determining performance ratings for members of the agency’s energy team.
Training OPM sent two of its energy team members to the Department of Energy-sponsored “Energy 2000 Conference” in FY 2000. Employee awareness is encouraged by OPM’s contracting staff, which issued periodic instructions in FY 2000 encouraging OPM procurement officials to take advantage of ENERGY STAR® products wherever practicable.
Energy Efficiency Performance
OPM has assumed delegated authority over the Theodore Roosevelt Federal Building (TRB) from the General Services Administration. TRB’s consumption data for FY 1985 was unavailable, thus OPM’s base year consumption is based on estimates. The data shows that OPM’s energy use has increased by more than a third from FY 1985 to FY 2000.
OPM’s level of energy consumption has been affected by the following factors: the extended hours of operations since 1985 by permitting more flexible working hours; some agency operations are now conducted on weekends as well as during the regular workweek; operation of a large computer facility that runs 7 days a week, 24 hours a day; increased building population; and widespread distribution of workstation technology including personal computers and printers.
OPM invested almost $121,000 to accomplish energy conservation projects in FY 2000. Among the projects undertaken by OPM to reduce energy use included: retrofitting of all light fixtures with energy efficient
bulbs and ballasts, and replacing the air conditioning chiller plant with energy efficient equipment.
Tactical Vehicle and Equipment Fuel Use In FY 2000, OPM increased the number of alternate fuel vehicles in its fleet, while substantially reducing the overall size of the fleet.
Water Conservation OPM has made progress in this area by installing water-saving flush valves, automatic flush valves, and by installing a new water treatment system. OPM has an employee awareness water conservation program in place for FY 2001.
Implementation Strategies
Life-Cycle Cost Analysis In FY 2000, OPM conducted an LCC analysis to determine the feasibility and payback on the investment in the air conditioning chiller plant replacement, and the expected energy savings from the complete lighting retrofit of the TRB. OPM continues to use LCC analysis when examining potential renovation projects.
Facility Energy Audits Local utility companies performed audits on OPM’s delegated facilities in Macon, Georgia, and Charlottesville, Virginia. These audits accounted for 12 percent of OPM’s total delegated square footage. As a result, 100 percent of OPM’s delegated square footage has now been audited.
Financing Mechanisms OPM included $1.5 million in its FY 2002 budget request to achieve the goals of Executive Order 13123.
In FY 2000, OPM entered into a $2 million Utility Energy Service Contract with its Washington, D.C., utility provider. This contract led to the retrofitting of all of the lights in the TRB with new energy efficient fluorescent tubes and ballasts. The contract was amended and enlarged to include the air conditioning chiller plant replacement, begun in FY 2000 and continued in FY 2001.
Energy-Efficient Product Procurement OPM’s facilities management program staff require that contractors install the highest efficiency motors in all equipment replaced in the TRB.
144

Highly Efficient Systems Energy Management ContactOPM has integrated highly efficient systems into most Mr. Ronald Peacockof its renovation projects, including the water system, Chief Building Operations Branchair conditioning, and lighting upgrades at the TRB and U.S. Office of Personnel ManagementMacon facility. Theodore Roosevelt Building
1900 E Street NW Washington, D.C. 20415-9110 Phone: 202-606-5255
145

S. SOCIAL SECURITY ADMINISTRATION (SSA)
Management and Administration The Social Security Administration’s (SSA) senior energy official is the Deputy Commissioner for Finance, Assessment and Management (DCFAM). The DCFAM’s responsibilities are to ensure agency compliance with the goals and requirements of Executive Order 13123.
The members of the agency’s energy team identify and implement strategies and approaches to achieve the goals of Executive Order 13123 and to facilitate and encourage agency usage of appropriations, Energy Savings Performance Contracts, and other financing mechanisms necessary in the execution of approved energy efficient activities.
Recognition SSA recognizes employees whose job descriptions require energy management skills and whose overall performance or individual acts are exceptional. SSA presents an award at the annual Building Managers Conference. SSA annually submits energy savings projects to the Federal Energy Management Program for recognition. SSA recognizes individual contributions to energy savings through suggestion and cash award programs. In FY 2000, two SSA headquarters energy managers’ efforts were recognized by receiving cash awards for ongoing efforts to encourage and enforce energy management within the agency. SSA also received an “Eagle Award” from the Advanced Transformer Company for “Excellence in using energy efficient technologies in projects in the SSA’s Headquarters buildings”. The energy manager at the Mid-Atlantic Program Service Center (MATPSC) received an Energy Champion award for FY 2000 for initiating and completing a lighting project that has helped SSA reduce energy costs for the Center by 15 percent over the last 10 years.
Performance Evaluations SSA has incorporated energy evaluation and analysis responsibilities into senior facilities/energy managers’ positions. SSA has included energy conservation duties into many of the agency’s energy team position descriptions and in each building/energy manager specialist position nationwide.
Training Building managers and staff have attended a variety of training classes and conferences: Life cycle cost (LCC) analysis, alternative fuels, lighting, and controls and demand side management practices. SSA staff attend General Services Administration (GSA) regional
conferences to become familiar with current strategies in GSA’s program to reduce energy consumption. SSA participated in a DOE interactive training program to ensure the presence of a trained energy manager in each of the delegated facilities. SSA provides additional training designed to help energy managers track energy usage and cost. Energy managers also attend FEMP, DOE, and GSA workshops, meetings, and conferences.
SSA employees are educated on the need and benefits of energy conservation through an awareness program via email, newsletters, and the agency magazine. In FY 2000, an educational program for Headquarters employees and their children was held in conjunction with “Take Our Children to Work Day” and “Earth Day”. SSA participated in the celebration of the 30th
Anniversary of Earth Day on the National Mall in Washington, D.C., with an exhibit focused on promoting energy conservation and recycling awareness accomplishments.
Energy Efficiency Performance
Standard Buildings SSA became an independent agency in FY 1996 -which serves as the base year for the agency. SSA is committed to reducing energy usage and cost in accordance with the Energy Policy Act, Executive Order 12902 and Executive Order 13123. While SSA’s energy initiatives have produced significant energy consumption and cost efficiencies, overall energy consumption has increased 9.4 percent since the FY 1996 base year. Substantive changes in the way SSA does business have affected the use of facilities and related energy costs, including significantly increasing automation at SSA, expanding hours of operation, and consolidating employees into Government-owned space.
SSA is evaluating a number of options to reduce energy consumption and cost, yet still maintain the ability to provide world class service to the public 7 days a week, 24 hours a day.
Industrial and Laboratory Facilities The National Computer Center (NCC) is designated as an energy intensive building because it contains the main database and query server for all of SSA’s increasingly automated offices nationwide. The mainframe computers operate virtually 24 hours a day, 365 days a year.
146

Renewable Energy SSA has analyzed a variety of solar and renewable energy technologies for its headquarters buildings. Natural day lighting appears to be the most viable renewable energy source for implementation. The use of solar technologies (solar hot water and solar lighting) is under evaluation for use in the Richmond, California, and Philadelphia, Pennsylvania, facilities.
Solar lighting was installed at the NCC as a demonstration project, however it did not provide adequate lighting. SSA explored installing day lighting in some of the warehouse space, but it was not economically feasible when compared with energy efficient lighting technologies. SSA is incorporating natural day lighting into renovations when possible.
SSA purchases competitive power in four facilities located in states that have deregulated markets. Approximately three percent, or 1,371.8 megawatt-hours of SSA’s competitive power purchases under contract are from renewable sources.
Petroleum SSA has taken several steps to reduce the need for petroleum products. At the Security West leased facility in Baltimore, Maryland, the existing boiler was converted from oil to natural gas. At the NCC and the Mid Atlantic Program Service Center (MATPSC), new boilers that operate on dual fuel (natural gas and oil) were installed. In FY 2000, SSA used approximately 24,300 gallons of fuel oil. This is 59 percent less than used in the base year. This reduction is a direct result of converting to dual fuel for boilers.
Water Conservation Numerous conversions of existing fixtures to energy efficient low flow aerators and water closets have been completed, and this technology is used in all major building renovations.
Implementation Strategies
Life-Cycle Cost Analysis SSA has included LCC analysis in each of its energy audits, resulting conservation projects, and prospectus projects. SSA has replaced old central chiller plants with energy efficient chillers in its delegated buildings. Installing new central plants has allowed SSA to include energy efficient equipment and reduce dramatically the stock of old refrigerant.
In FY 2000, a central plant in the headquarters complex was converted to ice-generating chlorofluorocarbon (CFC)-compliant chillers. Another
project to convert the chiller plant in the Metro West facility in Baltimore to District Chilled Water was also started. SSA will save approximately 2,250,000 kilowatt-hours of electricity when this project is complete.
SSA has initiated and completed energy audits in all of its Government-owned delegated buildings. In FY 2000, SSA initiated several of these projects in the Headquarters Complex in Baltimore and the Great Lakes Program Service Center (GLPSC) in Chicago. When completed, these projects should provide annual savings of approximately 15 million kilowatt hours. The fossil fuel required to produce this amount of electricity would have discharged 14,452 lbs. of carbon dioxide, 54,947 lbs. of sulfur dioxide, and 43,602 lbs. of nitrogen oxides into the atmosphere.
Energy Audits SSA conducted comprehensive energy audits of its entire inventory of Federally-owned delegated space. These audits identified projects that will meet the criteria for implementation as energy projects. The potential projects include retrofits to existing equipment, replacement of CFC chillers, and water conservation projects.
Financing Mechanisms SSA has made extensive use of Utility Energy Service Contracts (UESC). SSA has not initiated any Energy Savings Performance Contracts because many of the ideal candidate projects either have been accomplished or will be through prospectus work, UESCs and utility Area-Wide Contracts. In FY 2000, 2 projects – in Baltimore and Chicago – were completed via Area-Wide contracts.
In FY 2000, SSA budgeted $1 million for energy projects, which included selected lighting retrofits, lighting controls, dimmable ballasts, and VSD air handlers in the headquarters complex and the GLPSC. SSA also replaced the cooling towers at the MATPSC.
ENERGY STAR® and Other Energy Efficient Products SSA purchases energy efficient and ENERGY STAR®
products for its buildings.
Energy efficient specifications are incorporated into construction criteria for prospectus level projects as well.
Language has been incorporated in SSA contracts to purchase energy efficient computers, motors, equipment, building systems, etc. SSA is enhancing
147

training for employees and micro-purchasers to assure they are purchasing energy efficient products.
Sustainable Building Design In conjunction with GSA, SSA is renovating the Headquarters complex. Sustainable building design principles are used to the fullest extent possible. The renovations, while not exclusively energy projects, will significantly affect SSA’s energy baseline by installing:
! Energy efficient central heating and air conditioning plants;
! Energy efficient windows and doors; ! New central computer-based energy management
systems; ! Natural daylighting; and ! Efficient lighting and lighting controls.
The Child Care Facility at SSA’s headquarters will also incorporate sustainable design features.
The Annex building at SSA headquarters is undergoing renovations and energy conserving and demand management features have been included in the design. One of the project’s primary sustainable design features is an ice storage air conditioning system.
Energy Efficiency in Lease Provisions SSA works with GSA to identify the most energy efficient buildings for leased field offices.
Off-Grid Generation SSA is working in conjunction with GSA to install solar water heating systems in the delegated facility in Philadelphia and to implement renewable technologies in the Richmond, California facility.
SSA is also producing off-grid power at NCC. During peak electrical demand periods, the facility receives monthly utility bill credits, which provide a continuing savings in demand charges for the agency. Installation of the service was accomplished through the local utility and a UESC.
Energy Management Contact Ms. Bette HoffmanOffice of Realty ManagementSocial Security Administration1-B-25 Operations Building6401 Security BoulevardBaltimore, MD 21235Phone: 410-966-5016Fax: 410-966-0668Email: [email protected]
148

T. RAILROAD RETIREMENT BOARD (RRB)
Management and Administration The Director of Supply and Service is the designated senior energy official and is responsible for administering the RRB’s energy program to insure all aspects of RRB’s energy conservation plan are effectively implemented.
Bureau Heads, Managers, and Supervisors are responsible for ensuring that established energy conservation procedures are consistently followed by the personnel they supervise. This includes ensuring that appropriate efforts are made to conserve energy in their work areas. This includes, but is not limited to, the reduction of unnecessary lighting, abiding by established air temperatures, and the judicious use of motor vehicles for official business.
Training Personnel responsible for energy management receive the additional training that is provided by the General Services Administration (GSA) for energy management.
Performance Evaluations Presently the senior energy official and the facility energy manager have performance standards that require the successful implementation of provisions of Executive Order 13123. The compliance with these requirements directly affects their performance evaluations.
Energy Efficiency Performance
The headquarters building in Chicago, Illinois is the only building over which the RRB has operational control. The RRB operates and maintains the building under a delegation of authority agreement established with the GSA. Regional and field locations for the RRB are in GSA-leased facilities and are reported under the GSA inventory of properties.
Standard Buildings The reduction of almost 14.5 percent from FY 1999 to FY 2000 is mostly attributable to accurate energy data compiled after the completion of a multiyear construction renovation project implemented by the GSA. Due to construction modifications to the facility, accurate energy savings calculations in FY 1999 were difficult to quantify.
Water Conservation The RRB consumed 87,000 gallons of water in FY 2000 at an annual cost of $18,400.
The RRB has taken great steps toward improving water conservation in its headquarters facility. In all the restrooms and lavatories 90 percent of all the sinks and 100 percent of the urinals have automatic faucets and flush valves with reduced consumption type diagrams.
Implementation Strategies
Life-Cycle Cost Analysis The agency utilizes LCC analysis techniques in the development of its energy strategy to determine which projects should be considered to meet its energy goals. Much of this analysis is done in conjunction with GSA However, even projects under $50,000 are only considered after careful cost analysis and determination of 10-year simple paybacks. RRB also utilizes a Building Life Cycle Cost Analysis Software Program (BLCC), provided by the Federal Energy Management Program.
Energy-Efficient Product Procurement The RRB supports procurement of energy efficient products, and mandates the purchase of ENERGY STAR®
computers and office equipment. RRB is a signatory to and an active participant in Planet GSA. With support from the Department of Energy and the Environmental Protection Agency, RRB, through GSA, wi11 encourage the purchase and use of ENERGY STAR®
products and other products that rank in the upper 25 percent in terms of energy efficiency. These same energy efficient criteria have been incorporated into all RRB/GSA Guide specifications and product specifications for new construction and renovation projects, as well as all new product specification language.
Energy Management Contact Mr. Henry J. ValiulisDirector of Supply and ServiceU.S. Railroad Retirement BoardRoom 1230844 North Rush StreetChicago, IL 60611Phone: 312-751-4565Fax: 312-751-4923
149

U. TENNESSEE VALLEY AUTHORITY (TVA)
Management and Administration The designated senior energy official for the Tennessee Valley Authority (TVA) is the Executive Vice President of Administration.
TVA formed an Agency Energy Management Committee (AEMC) to facilitate compliance with Federal statutes, Executive Orders, Federal regulations, TVA energy and related environmental management objectives, and obligations under the Environmental Protection Agency (EPA) Green Lights Program (GL) and EPA’s ENERGY STAR® Buildings Program. This committee is comprised of representatives from each TVA organization responsible for energy management and associated environmental considerations in facility and general operations inside the agency.
Recognition The AEMC had its annual employee awareness display on tour in October 2000. In conjunction with the tour, an energy-related article was published in TVA’s newspaper.
Performance Evaluations To the extent employees are responsible for activities that are related to the objectives of Executive Order 13123, their job descriptions contain reflective line items and their performance is evaluated in terms of the extent to which they accomplish such goals.
Training TVA provides updates on current Federal requirements and regulations to employees, managers, and TVA customers when requested. Energy management and associated environmental training is provided to managers and employees as needed. Employee awareness activities are used to educate employees on how they affect energy and the environment through their daily activities at work and home. TVA also educates staff in both energy and environmental related topics through the TVA University.
Showcase Facilities The TVA Chattanooga Office Complex (COC) is TVA’s designated Showcase Facility. The COC was completed in 1986 and covers approximately 1.2 million square feet of floor area. It integrates the use of passive energy strategies, energy management practices, and environmental programs and activities. Occupants’ daily activities have been recognized as a major component in facility performance. Energy and environmental awareness programs have been established to inform the occupants of the impacts their
actions have on this performance. The combination of original design elements, energy and environmental activities, and aggressive energy reduction operation and maintenance efforts have resulted in the COC becoming a model facility.
Energy Efficiency Performance
Standard Buildings In FY 2000, TVA reported a 27.2 percent decrease in energy consumption from FY 1985 for its standard buildings when measured in Btu per gross square foot. TVA received credit for purchases of 0.5 billion Btu of renewable electricity. This lowered the energy intensity of its standard buildings from 60,046 Btu/GSF to 59,995 Btu/GSF.
Energy consumption in the COC is approximately 50,000 Btu/GSF. This exceeds TVA’s target for facility design and the FY 2010 building energy reduction goal established in Executive Order 13123. Since initial construction, additional energy and environmental improvements have been implemented in the facility. One of these improvements was the design and installation of a chilled and hot water storage system for the COC and Monteagle Place (MP) buildings. This system uses three existing 19,000-gallon hot water storage tanks. These tanks can be tied into the MP chilled water system, the MP chiller heat recovery condensing water system, or the COC chilled water system. Savings attributed to chilled water storage is $40,000 per year, while cost avoidance due to hot water storage is $160,000 per year. The system allows the two buildings, through a symbiotic relationship, to better use site energy and reduce the need for source energy. By shifting the peak demand by using the storage tanks for chilled water storage, operating costs during the cooling season are reduced. By storing hot water during the day and using it at night for heating, the use of electric boilers to heat the buildings during the heating season is virtually eliminated. By using the tanks to store chilled water and circulating it through the heat recovery bundle of the MP chillers, the MP cooling towers can be shut down for maintenance without having a building outage.
Industrial and Laboratory Facilities TVA ended FY 2000 with a Btu/GSF of 65,960 which is a 21 percent reduction from FY 1990 and an 11 percent reduction from FY 1999.
TVA’s Hydro Power division considers energy efficiency and environmental impacts for each project
150

and activity. TVA has cooperated with Voith Hydro, Inc., in establishing and operating Hydro Resource Solutions, LLC, a Tennessee limited liability company, which develops and markets energy efficiency enhancing hardware and software for the hydro power industry. During FY 2000 many energy management and related environmental projects were completed at TVA Hydro plants. Benefits from these projects include maintaining plant availability, reducing energy consumption, lowering maintenance costs, increasing overall efficiency, and environmental stewardship.
Nuclear energy reduction projects in FY 2000 include:
! Bellefonte – Demobilizing of support facilities to minimize energy usage. This was completed during FY 2000. Annual savings were 104 kilowatts thermal energy.
! Browns Ferry Nuclear Plant – Control Bay Chiller Upgrade - Reduction of 0.23 megawatts thermal energy; and removed 12,000 square feet of space. This is a reduction of 0.35 megawatts thermal energy.
! Sequoyah Nuclear Plant – Replaced 75 lighting ballasts with high efficient electronic ballasts in the Solar Building office and Power Stores Building; and removed additional temporary office trailers -Reduction of 94 kilowatts thermal energy.
! Watts Bar Nuclear Plant – Removed additional temporary office trailers. Reduction of 74 kilowatts thermal energy.
Many energy management and related environmental projects were completed at TVA fossil plants during FY 2000. Benefits from these projects include heat rate improvements, maintaining plant availability, reducing energy consumption, lowering maintenance costs, environmental stewardship, and increasing overall efficiency.
Tactical Vehicle and Equipment Fuel Use TVA encourages employees to use mass transit systems, vans for group travel, and car pools when available and feasible. The use of coordinated TVA and vendor delivery and pickup routing schedules, and just-in-time delivery was expanded throughout TVA. This coordinated effort avoids double handling, multiple trips to the same sites, and reduces deadheading.
As a major supplier of electricity, TVA is particularly interested in supporting the use of electric vehicles (EVs). TVA has incorporated EVs into its fleet operations and supports power distributors and local communities with EV technology demonstrations.
Renewable Energy TVA and twelve public power companies launched Green Power Switch on Earth Day, April 22, 2000. Green Power Switch, the first green power program of its kind offered in the Southeast, provides consumers with the opportunity to participate economically in TVA’s development of green power, particularly the power generated by three newly-installed wind turbines and a number of solar generating facilities. It is planned to expand this opportunity to include electricity generated by landfill gas.
Under the program, residential, commercial, and industrial consumers sign up for green power blocks of 150 kilowatt-hours each, which represent approximately 12 percent of a typical home’s monthly energy use. The associated reduction of atmospheric carbon dioxide is equivalent to the reduction produced by planting an acre of trees.
Four solar generating facilities are presently operating in Tennessee. Seven other solar installations and a landfill gas generation site are scheduled to be completed in the Valley by the end of calendar year 2000. One commercial scale wind power generation site, has also been completed as part of the initial pilot. The pilot project was turned over to the Customer Services and Marketing group in FY 2000 to become part of their program offering package.
TVA is currently researching, testing, and demonstrating the use of green power technologies.
Petroleum In FY 2000, TVA consumed 13,650 gallons of petroleum in building operations. This is a decrease of 38 percent from the FY 1985 baseline of 21,920 gallons.
Water Conservation In FY 2000, TVA consumed 378 million gallons of water with an estimated cost of $803,000. The AEMC is in the process of evaluating the best management practices for application to TVA facilities. Facilities were evaluated for water use during the summer and high use areas were noted. TVA has already implemented certain BMPs in some of its corporate facilities and in some of its public use areas.
Implementation Strategies
TVA has implemented many energy management measures through its operation and maintenance activities and building retrofits. Through TVA’s SWAP program, controls are placed on lighting and other
151

energy consuming equipment, and inefficient lighting is replaced when these actions are determined to be life-cycle cost effective. This program is implemented through the operation and maintenance staff as part of its daily activities. TVA has also installed energy management control systems (EMCSs) in the majority of its corporate facility space and considers the use of EMCSs for all facilities when their use is life-cycle cost effective.
As part of its operation and maintenance function, TVA has an emergency curtailment procedure which reduces energy use in its buildings during energy emergencies. This procedure was invoked during periods of peak energy use.
Life-Cycle Cost Analysis TVA’s Energy Plan provides that life-cycle analyses will be used in making investment decisions regarding energy conservation measures.
Energy Audits TVA has evaluated its building inventory for potential energy conservation measures. These facilities will be re-evaluated in accordance with Executive Order 13123 and TVA’s Memorandum Of Understanding with the EPA.
Financing Mechanisms Funding procedures for energy management and related environmental projects are reviewed through the IEMP and the AEMC. Recommendations and comments are submitted to the proper organizations. Projects for facilities are primarily funded through renovation, operation, maintenance, and modernization efforts. Projects covered under general operations are ranked for economic benefit compared to other TVA projects to determine funding availability and implementation status and are funded mainly through the capital budgeting process.
Energy-Efficient Product Procurement TVA’s Energy Plan provides that TVA will purchase ENERGY STAR® and other energy efficient products whenever feasible.
TVA established the Public Power Institute (PPI) in FY 1999 to help fulfill its commitment to sustain and enhance the environment while continuing to provide low-cost, reliable electricity. The PPI’s primary purpose is to:
! Enhance the role of Public Power; ! Research new energy-related technologies and
environmental sustainability; ! Develop and implement strategic partnerships,
including public and private entities; and ! Examine emerging energy issues and public power
policies facing a deregulated marketplace.
The institute serves both as a research laboratory seeking new ways to achieve sustainable power production and as a public policy clearinghouse for energy and environmental issues. PPI represents the vision and ultimate mission of public power: to put the public good first and to emphasize long-term benefits over short-term gains.
Headquartered on the TVA campus in Muscle Shoals, Alabama, the PPI employs a core staff to coordinate projects that further research, showcase innovations, and develop policy concerned with new energy-related technologies that benefit the public and have economic value. The staff draws on the capabilities and expertise available throughout TVA’s workforce.
The PPI forms partnerships with other organizations to develop, demonstrate, and deploy technologies that can produce and deliver electric power in a more environmentally sensitive way. The partnerships leverage external expertise and promote cooperation between the public and private sectors.
TVA continues its efforts to buy materials that have positive environmental qualities. Examples of environmental products purchased include soy ink, rechargeable batteries, low mercury lamps, and non-toxic supplies. TVA also purchases materials which meet sustainable architecture criteria. These are building materials which are non-toxic, have recycled content, and whose creation, use, and disposal do not damage the environment.
ENERGY STAR® Buildings TVA’s COC was recognized for its energy and related environmental performance by receiving an ENERGY STAR® Building Label from the EPA and DOE.
Energy consumption in the COC was less than 50,000 Btu/GSF. This exceeds both TVA’s target for facility design and the FY 2010 building energy reduction goal established in Executive Order 13123. This low energy consumption rate supports reducing the production of carbon dioxide, nitogen oxide, and other air pollutants at the source.
152

Energy Efficiency in Lease Provisions TVA has developed model lease provisions, based on those recommended by the General Services Administration, which require energy and water efficiency and will be incorporated into new and renewed leases as cost-effective.
Energy Management Contact Mr. Stephen L. BrothersInternal Energy Management ProgramTechnical Services SectionTennessee Valley AuthorityFacilities and Realty ManagementEE 2E-C, 1101 Market Street (EB3-C)Chattanooga, TN 37402-2801Phone: 423-751-7369Fax: 423-751-6309
153
V. UNITED STATES POSTAL SERVICE (USPS)
Management and Administration The Vice President of Engineering serves as the United States Postal Service’s (USPS) senior energy official. The official has overall responsibility for implementation of energy efficiency policies and practices within the agency.
Each of the USPS eleven Area offices have designated energy coordinators to provide program direction and coordination, consistent with national program objectives, within their geographical areas of responsibility. The Areas are comprised of District offices. In each of the districts, there is an employee responsible for identifying and coordinating energy activities and projects. In all instances, these are “ad hoc” responsibilities.
Recognition In FY 2000, the USPS submitted a total of 13 nominations for the Federal Energy and Water Management Awards, and received three awards. One of the awards recognized the Office of the Controller, the first such award given by DOE.
The USPS actively participates in the “You Have the Power” energy awareness campaign. During FY 2000, three “Energy Champions” were recognized. When appropriate, postal employees receive monetary awards for their energy accomplishments. These awards are given at the discretion of the supervisor on a case by case basis. In some instances, Vice President spot awards are awarded. The energy program uses the existing USPS award system and procedures in recognizing noteworthy employee contributions.
Performance Evaluations Through the annual goal-setting and review process, appropriate managers are evaluated on specific actions related to the USPS energy program. Position descriptions include responsibilities and accountability for management of assigned functions, programs, and activities. Because of its impact on total operating expenses, energy program performance has a tie to the financial performance of the USPS. Financial performance, in turn, is one of the factors considered in evaluating the performance of senior management and managers throughout the organization.
Training Postal Service employees receive ongoing training as part of the Corporate Voice of the Employee goal. Individual training, education planning, and implementation are decentralized to the facility and
supervisor-subordinate level. Postal employees participate in the various educational and training opportunities presented by Federal Energy Management Program.
Energy training is integrated with the training provided to employees charged with facility responsibilities. These in-house energy training programs are provided to postal employees at the USPS National Training Center. These courses emphasize the energy efficiency aspects of proper operation and maintenance of energy systems.
During FY 2000, the USPS completed its final seminar on Shared Energy Savings (Alternative Financing). As a result, all eleven Areas and associated Purchasing Centers have now been trained.
The Northeast Area conducted a seminar on energy efficiency lighting for their energy coordinators, maintenance and facility personnel.
Energy Awareness The energy Showcase initiative has been integrated with the environmental “green building” program. Eighth Avenue Station, Ft Worth,Texas, was the first USPS “green building”. Since then, additional projects have been completed in places such as Corrales, New Mexico, and South Raleigh, North Carolina. The “green building” program is managed by the USPS facilities department and involves the use of sustainable design principles. It further incorporates the use of a “green addendum” that is periodically updated to reflect applicable, cost-effective emerging technologies.
Energy Reduction Performance
Standard Buildings In FY 2000, USPS reported a 13.5 percent decrease in energy consumption from FY 1985 for its standard buildings when measured in Btu per gross square foot. USPS received credit for purchases of 34.1 billion Btu of renewable electricity. This lowered the energy intensity of its standard buildings from 74,294 Btu/GSF to 74,194 Btu/GSF.
Renewable Energy Facilities in Rancho Mirage, California, and Block Island, Rhode Island, have installed and are operating photovoltaic units. Geothermal heat pumps have been installed at postal facilities in the Southwest, New York Metro, and Mid-Atlantic areas. USPS has signed a contract in California under which
154

it will secure 7.5 percent of its power from renewable sources. This electricity purchase is estimated at 10,000 megawatt-hours in FY2000.
In FY 2000, in partnership with the National Renewable Energy Laboratory, the Postal Service completed the design study of standard solar units for use on Postal Facilities in Hawaii.
Water Conservation Total USPS water usage for FY 2000 is estimated at 10,000 million gallons. The cost of water and sewage for FY 2000 was slightly less than $20 million.
In FY 2000, the USPS published the Water Guide for Facility Managers and issued drafts of the Water Conservation Guide and Water Resources handbooks. They were placed on the USPS internal website for use by appropriate USPS personnel. The use of the handbooks will lead to improved water management. In FY 2000, the USPS also commenced a comprehensive pilot project at a Baltimore, Maryland, processing and distribution center facility to test various water conservation techniques.
Implementation Strategies During FY 2000, a focused effort was initiated to develop a comprehensive ten-year energy program plan for the USPS. The major strategies of the plan currently include: Energy Surveys and Retrofits, Operations and Maintenance, New Construction (green building), Purchasing Utilities and Materials, Emerging Technologies, Management and Employee Awareness, Standardization and Benchmarking, Goals and Policy, Energy Crisis Management, and Financing Methods. These strategies integrate the requirements of EPACT, Executive Order 13123, and other external requirements with the business needs of the USPS.
Life-Cycle Cost Analysis Within the USPS, capital energy conservation projects are subjected to economic analysis. In FY 2000, Headquarters EMP approved funding for about $6 million with an average return on investment exceeding 35 percent. Projects were also funded at the Area and District levels.
Financing Mechanisms Within USPS, one Energy Savings Performance Contract was begun in FY 2000 with a total contract value of $1.6 million. In addition, $6 million in internal funds were approved to finance retrofit projects. Facilities also use District and Area funds to implement energy projects.
Energy-Efficient Products Whenever possible, efforts are made to assure that purchased equipment is ENERGY STAR® rated. The USPS environmental department has issued an “Environmental Products Directory” and it is envisioned that ENERGY STAR® will be integrated with this USPS document.
ENERGY STAR® Buildings USPS is working with the EPA’s ENERGY STAR®
Building to develop specific ENERGY STAR® criteria for postal facilities. During FY 2000, a beta test was conducted on the criteria using data collected from “Do It Yourself” energy surveys and financial performance data. When completed, this effort will provide an ENERGY STAR® building program addressing USPS buildings.
Sustainable Building Design USPS has developed sustainable building designs and has also created a “green addendum” for the Medium Standard Building Design. These design principles are applied to all new construction projects.
Energy Efficiency in Lease Provisions For leased facilities where USPS pays for the utilities, USPS energy policy and standards are applied. These facilities are included in the national energy program initiatives. In some instances, the USPS may retrofit the facility to bring it up to energy standards. In leased space where the owner pays the utility costs, the lease provisions are negotiated on a case-by-case basis.
Highly Efficient Systems As referenced under the sustainable design narrative, USPS facilities are continually improving their energy systems with newer and more energy efficient technologies.
! The Corrales, New Mexico, “green” facility used straw bales, a sustainable renewable resource, as insulation. The R factor for the straw bale design is R-40 to 50, 2 to 3 times greater than conventional wall systems;
! The South Raleigh Annex, North Carolina, facility includes the following energy efficiency improvements: light colored roofing to reflect heat, aluminum storefront incorporates a thermal break, exit lights are light-emitting diode type, natural lighting supplemented by dimmable energy efficient High Intensity Discharge pendent lighting, passive solar controls (overhangs and natural vegetation) to shade south and west exposure in summer, low-e glazing, occupancy sensors in areas
155

with intermittent use, increased R-value, high efficiency HVAC system;
! The South Raleigh Annex facility also incorporates the following water efficiency improvements: xeriscaping carbon sinking, elimination of the irrigation system, and installed sensor operated faucets and flush valves.
Off-Grid Generation The Anchorage Alaska Processing and Distribution Center is powered by fuel cells. Any power not consumed by the facility is fed back to the grid. Two solar projects are in operation at Rancho Mirage, California, and at Block Island, Rhode Island.
Energy Management Contact Mr. Paul Fennewald Environmental Programs Analyst Environmental Management Policy United States Postal Service Room 6830 475 L’Enfant Plaza, SW Washington, DC 20260-2810 Phone: 202-268-6014 Fax: 202-268-6016
156

APPENDIX A LIST OF AUTHORITIES
ENERGY POLICY AND CONSERVATION ACT (Public Law 94-163), December 1975 SECTION 381 - FEDERAL ENERGY CONSERVATION PROGRAMS
DEPARTMENT OF ENERGY ORGANIZATION ACT (Public Law 95-91), August 1977 TITLE III - TRANSFERS OF FUNCTIONS
NATIONAL ENERGY CONSERVATION POLICY ACT (Public Law 95-619), November 1978
FEDERAL ENERGY MANAGEMENT IMPROVEMENT ACT OF 1988 (Public Law 100-615), November 1988
ENERGY POLICY ACT (Public Law 102-486), October 1992
EXECUTIVE ORDER 12902, March 6, 1994 ENERGY EFFICIENCY AND WATER CONSERVATION AT FEDERAL FACILITIES
EXECUTIVE ORDER 13123, June 3, 1999 GREENING THE GOVERNMENT THROUGH EFFICIENT ENERGY MANAGEMENT
OFPP POLICY LETTER NO. 76-1, August 6, 1976 FEDERAL PROCUREMENT POLICY CONCERNING ENERGY POLICY AND CONSERVATION
SUPPLEMENT NO. 1 TO OFPP POLICY LETTER 76-1, July 2, 1980
OTHER FEDERAL REGULATIONS
FEDERAL ACQUISITION REGULATION 48 C.F.R. §§ 23.201-203 (1995)
FEDERAL ENERGY MANAGEMENT AND PLANNING PROGRAMS 10 C.F.R., Part 436 (1996)
FEDERAL PROPERTY MANAGEMENT REGULATION 41 C.F.R., Part 101-25 (1996)
A-1

This page intentionally left blank.
A-2

APPENDIX BDATA COLLECTION
Standard Buildings and Facilities, Energy Intensive Facilities, and Exempt Facilities
The Federal agencies that own or control buildings are required to report the energy consumption in these buildings to FEMP 45 days after the end of each fiscal year. The General Services Administration (GSA) reports the energy of buildings it owns and operates, including usage by other Federal agency occupants. For buildings which have been delegated by GSA to other agencies, the individual agencies are responsible for reporting the energy consumption and square footage figures.
The data shown in this report do not include leased space in buildings where the energy costs are a part of the rent and the Federal agency involved has no control over the building’s energy management.
The Federal agencies submit their annual reports expressed in the following units: megawatt hours of electricity; thousands of gallons of fuel oil; thousands of cubic feet of natural gas; thousands of gallons of liquefied petroleum gas (LPG) and propane; short tons of coal; billions of Btu of purchased steam; and billions of Btu of “other.” DOE reviews this data for accuracy and confers with the submitting agency to clarify any apparent anomalies. The data are then entered into a computer database management program.
The tables shown in this Annual Report are expressed in billions of Btu derived from the following conversion factors:
Electricity - 3,412 Btu/kilowatt hourFuel Oil - 138,700 Btu/gallonNatural Gas - 1,031 Btu/cubic footLPG/Propane - 95,500 Btu/gallonCoal - 24,580,000 Btu/short tonPurchased Steam - 1,000 Btu/pound
The above conversion factors for electricity and purchased steam refer to site-delivered energy (or heat content) and does not account for energy consumed in the production and delivery of energy products. Tables 1-A, 4-A, and 7-B of this report account for primary energy use, which is the sum of the energy directly consumed by end users (site energy) and the energy consumed in the production and delivery of energy products. According to the Energy Information Administration, in 1999, steam electric utility plants (the largest source of electricity generation) were estimated to have used 10,346 Btu of fossil fuel energy to generate 1 kilowatt-hour of electricity. DOE uses this conversion factor to calculate primary energy use for electricity and 1,390 Btu per pound for purchased steam.
In addition, the Federal agencies annually report to FEMP the gross square footage of their buildings and the cost of their buildings’ energy.
B-1

Vehicles and Equipment
Federal agencies are required to report the energy consumption of their vehicles and equipment to FEMP within 45 days after the end of each fiscal year.
The fuels used in vehicles and equipment are automotive gasoline, diesel and petroleum distillate fuels, aviation gasoline, jet fuel, navy special, liquefied petroleum gas/propane, and "other." All the fuels in this category with the exception of "other" are reported in thousands of gallons. "Other" is reported in billions of Btu.
The conversion factors for these fuels are:
Gasoline - 125,000 Btu/gallon Diesel-Distillate - 138,700 Btu/gallon Aviation Gasoline - 125,000 Btu/gallon Jet Fuel - 130,000 Btu/gallon Navy Special - 138,700 Btu/gallon LPG/Propane - 95,500 Btu/gallon
This report excludes those agencies that have been unable to provide complete fiscal year consumption data prior to the publication date. All agency omissions, as well as any anomalies in the data, are indicated by footnotes on the tables or in the text of the report.
B-2

Calculation of Estimated Carbon Emissions
In the past, DOE tracked and reported aggregate energy use for all Federal agencies and estimated carbon emissions using national fuel-specific emission factors. This approach, however, resulted in less accurate emission estimates for electricity use because carbon emission factors for electricity vary significantly by utility and State depending on the resource used to generate the electricity (e.g., coal, gas, nuclear, hydro).
To obtain a greater level of accuracy in estimating emissions from electricity use, DOE developed a new approach that places little or no additional reporting burden on the agencies. Agencies continue to report their aggregated national-level electricity consumption data as they have in the past. DOE then takes that total consumption figure and apportions it across the States in which the agency has facility locations. DOE will then multiply the apportioned electricity usage by the appropriate regional-level carbon emission factor assigned to each State. Once emissions from electricity use are calculated, these will be added to the emissions estimated from the other fuels used by the agency to determine total carbon emissions. (National factors may be appropriately used for fuel oil, natural gas, LPG/propane, coal, and purchased steam.)
DOE estimated State electricity usage by determining the percentage of facility floor area for the agency and apportioning the reported total electricity use according to that percentage. For the purposes of estimating changes in greenhouse gas emissions over time, DOE is assuming that floor area can be used as a reasonable proxy to represent the State-level usage pattern for electricity consumption for an agency. DOE uses historical square footage data for Government-owned buildings from the General Services Administration’s Office of Governmentwide Policy, Office of Real Property to determine each agency’s percentage floor area for each State.
DOE uses factors derived from data from the Energy Information Administration (EIA) for estimating carbon emissions from non-electric fuels on a nation-wide basis. The regional emissions factors for electricity were calculated by summing the annual EIA data on electricity sales and carbon emissions for each State in a given region. These sums were then used to calculate the regional emissions/kWh (which were then converted to MMTCE/Quad). This value will be used for each State in a particular region.
Non-Electric Fuel National CoefficientsMillion Metric Tons of Carbon Equivalent (MMTCE) per Site-Delivered Quad(or Metric Tons of Carbon Equivalent [MTCE] per Site-Delivered Billion Btu)
1990 1991 1992 1993 1994 1995 1996 1997 1998 1999 2000
Fu el O il 19.95 19.95 19.95 19.95 19.95 19.95 19.95 19.95 19.95 19.95 19.95
Natural Gas 14.47 14.47 14.47 14.47 14.47 14.47 14.47 14.47 14.47 14.47 14.47
LPG/Propane 16.99 16.98 16.99 16.97 17.01 17.00 16.99 16.99 16.99 16.99 16.99
Coal 25.58 25.60 25.62 25.61 25.63 25.63 25.61 25.63 25.63 25.63 25.63
Purchased Steam 35.63 35.63 35.63 35.63 35.63 35.63 35.63 35.63 35.63 35.63 35.63
Source: EIA’s Emissions of Greenhouse Gases in the United States, 1998, Tables 11 and B1, DOE/EIA-0573(98),
October 1999. The factor for purchased steam is derived from the coefficient for coal adding associated
losses for generation and transportation (using a factor of 1.39 to convert site-delivered to primary energy).
B-3

Electricity Regional CoefficientsMillion Metric Tons of Carbon Equivalent (MMTCE) per Site-Delivered Quad(or Metric Tons of Carbon Equivalent [MTCE] per Site-Delivered Billion Btu)
1990
AK 49.51
AL, GA, MS, NC,
SC, TN, VA
43.28
AR, KS, LA, MO, OK 57.92
1991 1992 1993 1994 1995 1996 1997 1998 1999 2000
49.51 49.51 49.51 44.66 44.66 44.66 44.66 51.92 84.07 84.07
43.28 43.28 43.28 45.27 45.27 45.27 45.27 45.36 45.47 45.47
57.92 57.92 57.92 57.74 57.74 57.74 57.74 62.22 63.39 63.39
AZ, CO, NM 82.50 82.50 82.50 82.50 68.44 68.44 68.44 68.44 69.26 69.13 69.13
CA 15.12 15.12 15.12 15.12 13.42 13.42 13.42 13.42 12.81 17.02 17.02
CT, MA, ME, NH, RI, 33.08 33.08 33.08 33.08 32.27 32.27 32.27 32.27 27.84 32.02 32.02
VT
DC, DE, MD, NJ, PA 47.39 47.39 47.39 47.39 43.36 43.36 43.36 43.36 46.14 46.24 46.24
46.61 46.61 46.61 46.61 44.34 44.34 44.34 44.34 47.05 45.38 45.38FL
HI 61.59 61.59 61.59 61.59 49.47 49.47 49.47 49.47 44.70 49.96 49.96
IA, MN, NE, ND, SD 73.55 73.55 73.55 73.55 66.89 66.89 66.89 66.89 48.69 47.59 47.59
ID, MT, NV, OR, UT, 41.83 41.83 41.83 41.83 40.12 40.12 40.12 40.12 44.26 39.80 39.80
WA, WY
44.50 44.50 44.50 44.50 51.37 51.37 51.37 51.37 49.90 49.76 49.76
82.23 82.23 82.23 82.23 77.30 77.30 77.30 77.30 78.84 78.20 78.20
40.59 40.59 40.59 40.59 25.95 25.95 25.95 25.95 28.63 26.69 26.69
55.75 55.75 55.75 55.75 52.42 52.42 52.42 52.42 58.21 55.82 55.82
IL, W I
IN, KY, MI, OH, WV
NY
TX
Note:Regions match those defined in the Energy Information Administration’s (EIA’s) Electricity Market Module of the National Energy Modeling System. 1991 through 1993 use the coefficients developed for 1990, 1994 through 1997 use the coefficients developed for 1997. Coefficients were developed for 1998 and 1999 with the year 2000 using the coefficients developed for 1999.
Sources: For 1990 generation: EIA, Electric Power Annual 1991 Volume II, Tables 26 and 73, DOE/EIA-
0348(98)/2, December 1991. (used 1990 data).
For 1997 generation: EIA, Electric Power Annual 1998 Volume II, Tables 4 and 61, DOE/EIA-
0348(98)/2, December 1998. (used 1997 data)
For carbon emissions: EIA, Electric Power Industry Estimated Carbon Emissions 1990 and 1997
For 1998 and 1999 coefficients:
EIA - Electric Power Annual - 1999 (Vol. 2), Form-861, “Annual Electric Utility Report”.
EIA - Electric Power Annual - 1999 (Vol. 2), Form-860B, “Annual Electric Generator Report, Non-
Utility”.
EIA - Electric Power Annual - 1999 (Vol. 2), Form-767, “Steam-Electric Plant Operation and Design
Report,” Form-759. “Monthly Power Plant Report”.
EIA - Electric Power Annual - 1999 (Vol. 2), Form-860B, “Annual Electric Generator Report, Non-
Utility”.
B-4

Vehicle & Equipment Fuel National Coefficients, 1990 - 2000Million Metric Tons of Carbon Equivalent (MMTCE) per Site-Delivered Quad(or Metric Tons of Carbon Equivalent [MTCE] per Site-Delivered Billion Btu)
Gasoline 19.35 Diesel 19.95 Aviation Gas 18.87 Jet Fuel 19.33 Navy Special 21.49
Source: EIA’s Emissions of Greenhouse Gases in the United States, 1998, Tables 11 and B1, DOE/EIA-0573(98),
October 1999.
B-5
APPENDIX CFEDERAL ENERGY EXPENDITURES,
FY 1985 THROUGH FY 2000
C-1

TABLE C FEDERAL ENERGY EXPENDITURES, FY 1985–FY 2000
(CONSTANT 2000 DOLLARS)
Year Annual Annual Annual Change in Energy Energy Use Energy Cost Energy Cost Costs from 1985
1
(BBTU) ($ MILLION) ($/MMBTU) ($ MILLION)
Standard Buildings & Facilities
1985
1986
1987
1988
1989
1990
1991
1992
1993
1994
1995
1996
1997
1998
1999
2000
Energy Intensive Facilities
1985
1986
1987
1988
1989
1990
1991
1992
1993
1994
1995
1996
1997
1998
1999
2000
422,291.4 $5,240.650 $12.410 $0.000
447,127.9 $5,283.496 $11.817 $42.846
468,908.8 $5,271.942 $11.243 $31.292
443,952.8 $4,805.611 $10.825 -$435.040
440,927.6 $4,406.080 $9.993 -$834.571
430,911.9 $4,820.824 $11.187 -$419.826
400,193.6 $4,450.933 $11.122 -$789.717
405,671.4 $4,188.438 $10.325 -$1,052.212
395,735.1 $4,374.642 $11.054 -$866.008
377,815.4 $4,190.107 $11.090 -$1,050.543
360,875.9 $3,907.130 $10.827 -$1,333.521
352,023.7 $3,824.452 $10.864 -$1,416.198
344,548.1 $3,694.247 $10.722 -$1,546.403
337,572.8 $3,590.809 $10.637 -$1,649.841
333,715.9 $3,451.459 $10.343 -$1,789.191
326,841.1 $3,390.166 $10.373 -$1,850.484
90,013.1 $1,149.721 $12.773 $0.000
33,019.9 $476.149 $14.420 -$673.572
32,780.1 $431.744 $13.171 -$717.978
63,799.2 $788.719 $12.363 -$361.003
57,653.7 $620.288 $10.759 -$529.434
75,212.6 $887.669 $11.802 -$262.053
85,342.6 $922.714 $10.812 -$227.007
99,094.0 $1,022.520 $10.319 -$127.201
71,410.7 $661.653 $9.265 -$488.068
72,099.1 $677.842 $9.402 -$471.879
76,798.0 $613.509 $7.989 -$536.213
75,431.9 $648.513 $8.597 -$501.208
66,084.5 $634.398 $9.600 -$515.323
64,442.3 $567.835 $8.812 -$581.886
62,022.8 $550.587 $8.877 -$599.135
67,005.2 $611.190 $9.122 -$538.531
1Changes in energy costs from 1985 should not be construed as savings resu lting from Federal energy management activities.
Many variables contribute to fluctuations in annua l energy costs, including changes in square footage, building stock, weather,
energy efficiency inves tments, serv ice level, fuel mix , fue l prices, and vehicle , naval, and aircra ft flee t composition . Th is table
incorporates revisions to previously published energy consumption and cost data submitted to DOE by Federal agencies.
Source: Federal Agency Annua l Energy M anagem ent Data Reports
C-2

TABLE C (Continued)FEDERAL ENERGY EXPENDITURES, FY 1985–FY 2000 (CONSTANT 2000 DOLLARS)
Year
Exempt Facilities
1985
1986
1987
1988
1989
1990
1991
1992
1993
1994
1995
1996
1997
1998
1999
2000
Vehicles & Equipment
1985
1986
1987
1988
1989
1990
1991
1992
1993
1994
1995
1996
1997
1998
1999
2000
Annual Annual Annual Change in Energy Energy Use Energy Cost Energy Cost Costs from 1985
1
(BBTU) ($ MILLION) ($/MMBTU) ($ MILLION)
4,67 6.0 $86.145 $18.423 $0.000
5,18 0.7 $92.906 $17.933 $6.761
5,76 4.5 $102.503 $17.782 $16.358
5,69 4.6 $95.009 $16.684 $8.864
6,13 7.1 $97.900 $15.952 $11.755
5,20 2.3 $96.046 $18.462 $9.901
5,74 6.6 $100.777 $17.537 $14.632
6,85 0.8 $103.272 $15.075 $17.127
7,22 0.2 $99.566 $13.790 $13.421
5,56 3.1 $100.107 $17.995 $13.962
4,90 8.3 $90.674 $18.474 $4.529
5,32 8.4 $91.747 $17.218 $5.601
7,06 9.9 $138.831 $19.637 $52.686
8,70 0.1 $138.676 $15.940 $52.531
9,88 8.6 $131.333 $13.281 $45.188
20,5 61.4 $263.956 $12.837 $177.811
934,268.4 $8,800.421 $9.420 $0.000
924,833.7 $5,336.737 $5.770 -$3,463.684
958,904.3 $5,645.552 $5.888 -$3,154.869
846,896.2 $5,357.867 $6.326 -$3,442.554
959,994.6 $6,018.594 $6.269 -$2,781.827
926,994.8 $6,512.768 $7.026 -$2,287.653
970,454.3 $8,039.827 $8.285 -$760.594
783,122.4 $4,785.206 $6.110 -$4,015.215
772,633.8 $5,034.830 $6.516 -$3,765.591
722,790.5 $3,621.836 $5.011 -$5,178.585
687,137.4 $3,734.202 $5.434 -$5,066.219
675,111.5 $3,667.846 $5.433 -$5,132.575
665,386.0 $4,227.043 $6.353 -$4,573.378
627,339.2 $4,500.479 $7.174 -$4,299.942
607,527.2 $3,987.943 $6.564 -$4,812.478
566,080.9 $3,099.706 $5.476 -$5,700.715
1Changes in energy costs from 1985 should not be construed as savings resu lting from Federal energy management activities.
Many variables contribute to fluctuations in annua l energy costs, including changes in square footage, building stock, weather,
energy efficiency inves tments, serv ice level, fuel mix , fue l prices, and vehicle , naval, and aircra ft flee t composition . Th is table
incorporates revisions to previously published energy consumption and cost data submitted to DOE by Federal agencies.
Source: Federal Agency Annua l Energy M anagem ent Data Reports
C-3

TABLE C (Continued)FEDERAL ENERGY EXPENDITURES, FY 1985–FY 2000 (CONSTANT 2000 DOLLARS)
Year Annual Annual Annual Change in Energy Energy Use Energy Cost Energy Cost Costs from 1985
1
(BBTU) ($ MILLION) ($/MMBTU) ($ MILLION)
Total Energy - All End-Use Sectors
1985 1,451,248.9 $15,276.938 $10.527 $0.000
1986 1,410,162.2 $11,189.288 $7.935 -$4,087.649
1987 1,466,357.7 $11,451.741 $7.810 -$3,825.197
1988 1,360,342.8 $11,047.205 $8.121 -$4,229.732
1989 1,464,713.0 $11,142.861 $7.608 -$4,134.076
1990 1,438,321.6 $12,317.307 $8.564 -$2,959.631
1991 1,461,737.1 $13,514.251 $9.245 -$1,762.686
1992 1,294,738.6 $10,099.437 $7.800 -$5,177.501
1993 1,246,999.8 $10,170.691 $8.156 -$5,106.247
1994 1,178,268.1 $8,589.892 $7.290 -$6,687.046
1995 1,129,719.6 $8,345.514 $7.387 -$6,931.423
1996 1,107,895.5 $8,232.558 $7.431 -$7,044.379
1997 1,083,088.5 $8,694.520 $8.028 -$6,582.418
1998 1,038,054.4 $8,797.799 $8.475 -$6,479.139
1999 1,013,154.5 $8,121.321 $8.016 -$7,155.616
2000 980,488.6 $7,365.018 $7.512 -$7,911.920
1Changes in energy costs from 1985 should not be construed as savings resu lting from Federal energy management activities.
Many variables contribute to fluctuations in annua l energy costs, including changes in square footage, building stock, weather,
energy efficiency inves tments, serv ice level, fuel mix , fue l prices, and vehicle , naval, and aircra ft flee t composition . Th is table
incorporates revisions to previously published energy consumption and cost data submitted to DOE by Federal agencies.
Source: Federal Agency Annua l Energy M anagem ent Data Reports
C-4

APPENDIX DINDUSTRIAL, LABORATORY, RESEARCH, AND OTHER
ENERGY INTENSIVE FACILITIES
Department of Agriculture (Agricultural Research Service)
514 Laboratory Buildings 76
494 Other Building Types 54
479 Greenhouses 8
426 Storage Buildings 6
242 Barns 5
215 Sheds 4
158 Shops 2
137 Housing Buildings 2
98 Headhouses 2
87 Chemical Storage Buildings 1
85 Office/Laboratory Buildings 1
78 Office Buildings
Garages
Trailers
Engineering Facilities
Restroom Buildings
Fire Stations
Filling Stations
Waste Treatment Buildings
Incinerator Buildings
Bus Stations
Chapel
Weather Station
Department of Commerce
National Institute of Standards and Technology
Gaithersburg, Maryland Sites
101 Administration
102 Gate House
202 Eng. Mech.
205 Fire Research
206 Concr. Mtrls.
220 M etrology
221 Physics Lab
222 Chemistry
223 Mtrls. Test.
224 Polymers
225 Technology
226 Building Research
230 Fluid Mech.
231 Industrial
233 Sound
235 Reactor CNRF
236 Hazards
237 Non-magnetic
238 Non-magnetic
245 Radiation
301 Supply and Pln.
302 SCWPG Cooling TWR
303 Service
304 Instr. Shops
305 Switchgear
306 Elec. Sub.
307 Chemical Waste
308 Bowman House
309 Grounds
310 Hazards Strg.
311 Grounds Strg.
411 TRF
412 Temp. O fc
413 Temp. O fc
415-418 Temp. O fc
419 Temp. Childcare
Boulder, Colorado Sites
1 Radio
1A Radio Building
1B Radio Building
1C Radio Building
1D Radio Building
2 Cryogenics
2A Cryogenics - Annex A
3 Liquifier
3A Liquifier - Annex A
4 Camco
5 Camco Annex
8 Mesa Test Site
9 Gas Meter
11 Ionospheric Observatory
14 Field Strength
21 Maintenance Garage
22 W arehouse
24 Plasma Physics
24A Plasma Physics - Annex A
25 Maintenance Shops
26 D ay Care Facility
27 High Frequency
National Oceanic and Atmospheric Administration
D-1

AKW O11 E.T. Shop
AKW 129 Elec. Storg. Bldg. & Fac.
AKW130 Marine Warehouse
ARM004 W FO
CAW072 SW Fisheries Cntr
CAW107 WSO
CA4486 WSFO
COC004 W SFO
COM 017 Optics Bldg & Fac.
COM018 Lab. Bldg
COM019 Lab. Bldg
COM053 Lab. Bldg
CTE005 Chem. Storg. Bldg. & Fac.
FLE078 Port of Miami
FLM024 W SO
HIW015 W SO
LAM048 Office Bldg
MAE032 Morris Island Observ
MEE00S NW S Forecast Ofc
MOC036 WSFO
MOC037 NEXRAD Bldg
Army
MSM 011 WFO
MTW006 Radar Bldg
MTW0119 B alloon Infltn. Bldg
NCC001 Dive Locker & Fac.
NEC008 Balloon Infltn. Bldg. & Fac.
NMM021 W FO
NVW 016 Balloon Infltn. Bldg
NY5451 30 Rockefeller Plaza
ORW 012 Fire Station/WSO
ORW 065 WSO
PAE013 Storage Bldg. & Fac.
TNM 006 WFO
TXM 029 WSO
UTW 004 Balloon Infltn. Bldg
VAE014 Antenna Deck & Fac.
WAW052 Behavior Lab. & Fac.
WV E002 NW S Bldg
Bureau of Census
Charlotte Computer Center
Department of Defense
Holston Army Ammunition Plant, Kingsport, TN
Radford Army Ammunition Plant, Radford, VA
AAFES Food Processing Plant, Grünstadt, Germany
Laundry Facility, Ft. Leonard Wood, MO
Navy
AMFORRDRESINS, Bethesda, MD
COMOPTEVFOR, Norfolk, VA
EODT DI, Indian Head, MD
FISC, Pearl Harbor, HI
FISC, San Diego, CA
FISC, Yokosuka, Japan
INTCOMBATSYSTESTFAC, San Diego, CA
MCLB, Albany, GA
MCLB, Barstown, CA
NAVAIRPROPCEN, Trenton, NJ
NAV AVIONICCE, Indianapolis, IN
NAVAVNDEPOT, Cherry Point, NC
NAVAVNDEPOT, Jacksonville, FL
NAVAVNDEP OT, North Island, CA
NAVORDMISTESTSTA White Sands, NM
NAVPBRO, Magna, UT
NAVSHIPREPFAC, Guam
NAVSHIPREPFAC, Yokosuka, Japan
NAVSPASURFLDSTA, Chula Vista, CA
NAVSPASURFLDSTA, Hawkinsville, GA
NAVSPASURFLDSTA, Hollandale , MS
NAVSPASURFLDSTA, Maricopa, AZ
NAVSPASURFLDSTA, Savannah, GA
NAVSPASURFLDSTA, Wetumpka, AL
NAVSPASURFLDSTAELPHAB TRORC, NM
NAVSPASURFLDSTAKIKLK ACH CT, TX
NAVSPASURFLDSTAREDRVR LW SV, AR
NAVWPNINDRESPLNT, Toledo, OH
NAVXDIVINGU, Panama City, FL
NOC PAC DET FALLBROOK, CA
NOCPACDIV DET PORT HADLOCK, WA
NSC, Jacksonville, FL
NSC, Norfolk, VA
NSC, Oakland, CA
NSC, Pensacola, FL
NSC, Puget Sound Bremerton, WA
NSD, Guam
NSW C DET, Bayview, ID
NSWC DET FCDSA, Dam Neck, VA
NSWC DET, Ft. Lauderdale, FL
NSWC DET SSES, Philadelphia, PA
NSWC DIV CARDEROCK, Bethesda, MD
NSW C DIV, Crane, IN
NSWC DIV, Indian Head, MD
NSWC DIV, Pt Hueneme, CA
NSWC DIV, Pt Hueneme, CA
NSWC LCC DET, Memphis, TN
NSWC NWAS CORONA
NSY, Norfolk, VA
NSY, Pearl Harbor, HI
NSY, Portsmouth, NH
NSY, Puget Sound Bremerton, WA
NUWC DET, Andros Isl, BF
D-2

NUWC DIV, Keyport, WA
NW S Yorktown SJC Annex
SIMA, Pascagoula , MS
SIMA, San Diego, CA
SUBASE, Pearl Harbor, HI
SWFLANT, Kings Bay, GA
SW FPAC, Bangor, WA
TRIREFFAC, Kings Bay, GA
UNISERUOFHEASCN, Bethesda, MD
WPNSTA, Charleston, SC
WPNSTA, Concord, CA
WPNSTA EARLE, Colts Neck, NJ
WPNSTA, Seal Beach, CA
WPNSTA, Yorktown, VA
WV AB L, Mineral, CO
Air Force
Hill AFB, UT
Tinker AFB, OK
Robins AFB, GA
Kelly AFB, TX
McClellan, CA
Arnold AFB, TN
DeCA
ABERDEEN, Baltimore, MD
MCLB ALBAN, Albany, GA
ALTUS, Altus, OK
ANCHORAGE, Anchorage, AK
ANDERSEN AFB, Yigo, Guam
ANDREWS AFB, Camp Springs, MD
ANNAPOLIS, Annapolis, MD
ARDEC, Patterson, NJ
ARNOLD AFB, Tullahoma, TN
ATHENS NSCS, Athens, GA
ATSUGI, Yokohama, Japan
BANGOR, Silverdale, W A
BANGOR ANGB, Bangor, ME
BARBERS POINT, Pearl City, HI
BARKSDALE AFB, Bossier City, LA
BARSTOW MCLB, Barstow, CA
BEALE AFB, Marysville, CA
BOLLING AFB, Washington, D.C.
BREM ERTO N, Bremerton, W A
BROOKS, San Antonio, TX
BRUNSWICK NAS, Portland, ME
C. E. KELLY, Pittsburgh, PA
C.M. PRICE, Granite City , IL
CAMP CARROLL, Taegu, South Korea
CAMP CASEY, Tongduchon, South Korea
CAMP COU RTNEY, Gushikawa, Japan
CAMP FOST ER, Naha, Japan
CAMP HOWZE, Munson, South Korea
CAMP HUMPHREY S, Pyongtaek, South Korea
CAMP KINSER, Naha, Japan
CAMP KURE, Hiroshima, Japan
CAMP LEJUENE, Jacksonville, NC
CAMP MERRILL, Dahlonega, GA
CAMP PAGE, Taegu , South Korea
CAMP PENDLETON, Oceanside, CA
CAMP STANLEY, Uijongbu , South Korea
CAMP ZAM A, Tokyo, Japan
CANNON AFB, Clovis, NM
CARLISLE, Carlisle, PA
CHARLESTON AFB, Charleston, SC
CHARLESTON NW S, Charleston, SC
CHERRY POINT, Havelock, NC
CHINA LAKE, Ridgecrest, CA
CHINH AE NAS, Chinhae, South Korea
COLUM BUS AFB, Columbus, MS
CORPUS CHRISTI, Corpus Christi, TX
CRANE NWSC, Crane, IN
CUTLER, Machias, ME
DAHLGREN, Fredericksburg, VA
DAVIS-MONTHAN, Tucson, AZ
DDC (New Cumberland), Harrisburg, PA
DOVER, Dover, DE
DSCR, Richmond, VA
DUGWAY, Dugway, UT
DYESS AFB, Abilene, TX
EDWARDS, Rosamond, CA
EGLIN AFB, Niceville, FL
EIELSON AFB, Fairbanks, AK
EL CENTRO, El Centro, CA
EL TORO MCAS, Santa Ana, CA
ELLSWORTH AFB, Rapid City, SD
F. E. WARREN, Cheyenne, WY
FAIRCHILD, Spokane, WA
FALLON, Fallon, NV
FITZSIMONS, Aurora, CO
FT. BELVOIR, Alexandria, VA
FT. BENNING, Columbus, GA
FT. BLISS, El Paso, TX
FT. BRAGG - MAIN, Fayetteville, NC
FT. BUCHAN AN, San Juan, Puerto Rico
FT. CAMPBELL, Clarksville, TN
FT. CARSON, Colorado Springs, CO
FT. DETRICK, Frederick, MD
FT. DRUM, Watertown, NJ
FT. EUSTIS, Newport News, VA
FT. GILLEM, Atlanta, GA
FT. GORDON, Augusta, GA
FT. GREELY, Delta Junction, AK
FT. HAMILTON, New York, NY
FT. HOOD I , Killeen, TX
FT. HOOD II, Killeen, TX
FT. HUACHU CA, Sierra Vista, AZ
FT. HUNTER-LIGGETT, King City, CA
FT. IRWIN, Fort Irwin, CA
FT. JACKSON, Columbia, SC
D-3

FT. KNOX, Louisville, KY
FT. LEAVENW ORTH, Leavenworth, KS
FT. LEE, Petersburg, VA
FT. LEONARD WOOD, Waynesville, MO
FT. LEWIS, Tacoma, WA
FT. MCCLELLAN, Anniston, AL
FT. MCCOY, La Crosse, WI
FT. MCPHERSON, Atlanta, GA
FT. MEADE, Laurel, MD
FT. MO NMOUT H, Eatontown, NJ
FT. MONROE, Hampton, VA
FT. MYER, Arlington, VA
FT. ORD (MONTEREY), Monterey, CA
FT. POLK, Leesville, LA
FT. RILEY, Junction City, KS
FT. RUCKER, Daleville, AL
FT. SAM HOUSTON, San Antonio, TX
FT. SHAFTER, Honolulu, HI
FT. SILL, Lawton, OK
FT. STEWART, Hinesville, GA
FT. WAINWRIGHT, Fairbanks, AK
GOODFELLOW, San Angelo, TX
GRAND FORKS AFB, Grand Forks, ND
GREAT LAKES NTC, Waukegan, IL
GUAM (OROT E), Agat, Guam
GULFPORT NCB C, Gulfport, MS
GUNT ER AFB, Montgomery, AL
HANNAM VILLAGE, Seoul, Korea
HANSCOM, Bedford, MA
HARIO HO USING, Hario, Japan
HARRISON VILLAGE, Indianapolis, IN
HICKAM AFB, Honolulu, HI
HILL AFB, Ogden, UT
HOLLOMAN AFB, Alamogordo, NM
HUNTER AAF, Savannah, GA
HURLBURT FIELD, Fort Walton Beach, FL
IMPERIAL BEACH, Imperial Beach, CA
IWAKU NI MCAS, Iwakuni, Japan
JACKSONV ILLE, Jacksonville, FL
KADENA AFB, Naha, Japan
KAN EOH E BAY, Kaneohe Bay, HI
KEESLER AFB, Biloxi, MS
KEFLAVIK, Keflavik, Iceland
KELLY, San Antonio, TX
KEY W EST NAS, Key West, FL
KINGS BAY NSB, St. Marys, GA
KINGSVILLE, Kingsville, TX
KIRTLAND AFB, Albuquerque, NM
KUN SAN AFB , Kunsan City, South Korea
LACKLAND AFB, San Antonio, TX
LAKEHURST, Toms River, NJ
LANGLEY AFB, Hampton, VA
LAUGHLIN AFB, San Antonio, TX
LEMOORE, Fresno, CA
LITTLE CREEK NAB, Virginia Beach, VA
LITTLE ROCK AFB, Jacksonville, AR
LOS ANGELES AFB, Los Angeles, CA
LUKE AFB, Phoenix, AZ
MACD ILL AFB, Tampa, FL
MALLONEE VILLAGE, Fayetteville, NC
MALMSTROM AFB, Great Falls, MT
MARCH AFB, Riverside, CA
MAXWELL AFB, Montgomery, AL
MAYPORT NS, Atlantic Beach, FL
MCCHORD AFB, Tacoma, WA
MCCLELLAN AFB, North Highlands, CA
MCCO NNELL AFB, W ichita, KS
MCGUIRE AFB, Wrighttown, NJ
MEMPHIS NAS, Memphis, TN
MERIDIAN N AS, Meridian, MS
MINOT AFB, Minot, ND
MIRAMAR NAS, San Diego, CA
MISAWA AFB, Misawa, Japan
MITCHEL FIELD, Garden City, NY
MOFFETT FIELD, Mountain View, CA
MOOD Y AFB, Valdosta, GA
MTN HOME AFB, Mountain Home, ID
NELLIS AFB, Las Vegas, NV
NEW LONDON, Groton, CT
NEW ORLEANS NSA, New Orleans, LA
NEW RIVER MCAS, Jacksonville, NC
NEW PORT, Newport, RI
NORFOLK NB, Norfolk, VA
NORTH ISLAND, San Diego, CA
OCEANA NAS, Virginia Beach, VA
OFFUTT AFB, Bellevue, NE
OSAN AFB, Osan, South Korea
PARRIS ISLAND, Beaufort, SC
PATRICK AFB , Cocoa Beach, FL
PATUXENT, Lexington Park, MD
PEARL HARBOR, Honolulu, HI
PENSACOLA, Pensacola, FL
PETERSON, Colorado Springs, CO
POINT MUG U, Point Mugu, CA
POPE AFB, Fayetteville, NC
PORT HUEN EME, Port Hueneme, CA
PORTSMOUTH, Portsmouth, NH
PORTSMO UTH NNSY, Portsmouth, VA
PRESIDIO OF SF, San Francisco, CA
PUSAN, Pusan, South Korea
QUANTICO, Woodbridge, VA
RANDOLPH AFB, San Antonio, TX
REDSTO NE ARSENAL, Huntsville, AL
ROBINS AFB, Macon, GA
ROCK ISLAND AR, Rock Island, IL
ROOSEV ELT ROAD S, Ceiba, Puerto Rico
SAGAMI DEPOT, Tokyo, Japan
SAGAMIHARA, Tokyo, Japan
SAN DIEGO NS, San Diego, CA
SAN ONOFRE, San Clemente, CA
D-4

SASEBO, Sasebo, Japan
SCHOFIELD BKS, W ahiawa, HI
SCOTIA, Schenectady, NY
SCOTT AFB, Belleville, IL
SELFRIDGE ANG, Mt Clemens, MI
SEYMOUR JOHNSON, Goldsboro, NC
SHAW AFB, Sumter, SC
SHEPPARD AFB, Wichita Falls, TX
SIERRA, Herlong, CA
SMOKEY POINT NS, Marysville, WA
TAEGU, Taegu, South Korea
TINKER AFB, Oklahoma City, OK
TOBYH ANNA, Scranton, PA
TRAVIS AFB, Fairfield, CA
USAF ACADEMY, Colorado Springs, CO
VANCE AFB, Enid, OK
VANDENB ERG AFB, Lompoc, CA
WALT ER REED, Washington, D.C.
WEST POINT, Highland Falls, NY
WHIDBEY ISL NAS, Oak Harbor, WA
WHITE SANDS MR, Las Cruces, NM
WHITEMAN AFB, Knob Noster, MO
WH ITING FIELD, Pensacola, FL
WINTER HARBOR, Bangor, ME
WRIGHT-PATTERSON, Dayton, OH
YOKOSUKA NESC, Yokosuka, Japan
YOKOTA AB, Tokyo, Japan
YON GSAN, Seoul, South Korea
TWENTYNINE PALMS, Twentynine Palms, CA YUM A MCAS, Yuma, AZ
TYNDALL AFB, Panama City, FL YUMA PG , Yuma, AZ
Department of Energy
Los Alamos National Laboratory
Equipment Test Lab
Lab Meson Facility
Operations Bldg
Service Corridor
Accelerator Tec Bldg
LANSCE/WN R Bldg
Proton Storage Ring
High Res B eam Facility
General Purpose Lab
WNR Lab Support Facility
Warehouse
Proton Storage Staging Ring
FMIT Bldg
Accelerator Tec Bldg
Development & Testing
Computer Maintenance
Data Analysis Center
Accelerator Maintenance Bldg
Sub-Stockroom/Wjse
JCl Craft Shop
Proton Storage Ring Eqp
Experimental Area
Neutron Scattering Exper
NPB Technical Support
Shop & Storage Bldg
Office Bldg
Warehouse
Office Bldg
Med Resolution Spect
Neutron Exper Service
GT A Facility
ML Neutron Scattering
322 Trailers, Transportables & Small Service Sheds
Kansas City Plant
Industrial Wastewater Pretreatment Facility
Pantex Plant
16-4/Paint and Sand Blast
16-10/Vehicle W ash
Security Lighting
Sandia National Laboratories, Albuquerque
(Site No. 0112)
Building 880
Building 827
858/Microelectronics Development Lab
878/Process Development Lab
Naval Petroleum and O il Shale Reserves in
Colorado, Utah, and Wyoming
Maintenance Shop
LTS G as Plant Main Compressor Building
Steam Generator #1 Facility
Warehouse Quonset
Water Treatment Facility
Field Core Facility
Steam Generator #2 Facility
Steam Generator #3 Facility
Steam Generator #4 Facility
Steam Generator #5 Facility
Field Operations Office
Environmental, Safety, and Health Office
Water Treatment Facility Expansion
UPS Building
LTS Gas Plant Office
Water Disposal Facility
LTS Gas Plant Shop
Polymer Plant
LTS G as Plant PAMCO B uilding
D-5

LTS Gas Plant Lab
LTS Gas Plant Pump House
Fireflood Pump Building
South Terminal Main Building
South Gate Guard Shack
Idaho Operations
Utility Building
Laboratory
Transportation Complex
Service Building Powerhouse
New Waste Calcining Facility
Coal-Fired Boiler House
Coal Plant Unloading Building
Liquid Effluent Treatment and Disposal Facility
Hot Shop/Manufacturing and Assembly
SMC M anufacturing and Assembly
ATR Building
ATR Cooling Tower Pumphouse
Deep Well Pump-House #4
Diesel Generator Building
Waste Heat Recovery Building
ICF Kaiser, Hanford Site
Riggers Loft
Tritium Vault
Tritium Laboratory
6 Reactor Facilities
Decon Station Foundation
4 Effluent Water Outfall Structures
3 Retention Basins
Filter Plant Power Operation Facility
Mechanical Development Lab (D&D in prog-=94)
Main Pump House
Fresh Metal Storage
Development Laboratory (D & D in Prog-=94)
Main Pump HSE-Includes North and South Annex
Biology Laboratory
ERDS Towers On Hanford Site
Warehouse
Mobile Office @105H
Change Room Trailer @ 105H
Mobile Office (FKA:1131N)
Mobile Office @ 105H
Gas Recirculation Building
2 Exhaust Air Sample Building
Power Control Building Columbia River Monitorin
Effluent Water Treatment Pilot Plant
Water Studies Semiworks Facility
Offices and Telephone Exchange
Filter Plant Head House, Chlorine
11 Office Buildings
Badge H ouse Temporary
3 Carpenter Shops
Change Room Building
Crib Effluent Iodine Monitoring Facility
9 Storage Buildings
Demineralization Plant Building
Fuel Oil Storage Tank and Unloading Platform
Vehicle Gate Inspection Bldg
Patrol Boat House
Rivr Guard Tower
Mobile Office W. of 1167A
Process Facility
Tank Farm W aste Support Facility
Gas Preparation Building
Underground Waste Storage Tank Farm
Waste Disposal Tank Farms (4)
Tank
Tank and Vault
Radioactive Particle Research Laboratory
Cask Loading Building
Guard Station for 209E
Office Administration and Gate House
Office Administration Building
Paint Storage Building
Critical Mass Storage
Office Machine Storage
Field Mobile @ Slab Yard
Canine Facility
Fabrication, Mockup Shop Building
Warehouse Essential Materials, NO. Of Purex
Solvent Handling Building
Filter Building
Fanhouse
Mobile Office @ 4th & Baltimore (57B)
Graphics Facility @ 284E (ATT TO MO931)
Survey Mobile Office @ 4th & Baltimore (2910E)
Change Room Trailer @ 284E
Mobile Office @ 202A (ATT=D TO MO948)
Mobile Office @ 202A (ATT=D TO MO542)
Mobile Office @ 202A (ATT=D/ID=D MO355)
Mobile Ofc @ Baltimore N/O 4th
2 Mobile OFC @ Baltimore N/O 4th
1 Janitorial Storage @284E
2 Mobile Office @200 Area ETF
Mobile Office @ Baltimore N/O 4th
Mobile Office @ 4th & Baltimore
Lunchroom T railer @ Slab Yard
Mobile Office @ 4th &Baltimore (AKA: 2910E)
Graphics Trlr @ 284E (ATT M O203)
4 Mobile Office @ 4th and Baltimore (AKA:2911E)
Mobile Office @ Purex
Mobile Office @ 202A (ATT=D/D=D AS MO347)
Mobile Office @ 224B
Office Administration Building
Office and Laboratory Building
Concentration Facility, U03 Plant
Calcination Facility
Electrican Shop
D-6

Pipefitter Storage
Pipefitter Small Shop
Gas Bottle Dock
Pipefitter Small Shop
Sheetmetal Shop
Material Storage
Insulator Shop
Paint Storage(W-25)
Laborer Storage
Non-Tracable Bench Stock Storage
Ice House
Heavy Equipment Operator Shack
Paint Mixing Shop
Paint Shop
2 Paint Storage
Mask Laundry and Office Building
Materials Engineering Laboratory
Waste Incinerator Facility
Plutonium Concentration Facility
Exhaust Filter Building
Change House
Coal Handlers Shelter
First Aid Station and Offices
Office and Service Building
PU Storage
Welding Laboratory Building
D&D Female Change Trailor @ 271T
Chemical Storage W arehouse
Power House Stream Plant
Packaged Boiler
Water Tower
Exhaust Fan Control House and Stack
Jet Pit House
Acid Recovery and Gas Treatment Building
2 Mobile Office @2704w
Mobile Office @222T
SWP Changeroom Trailer @211U
Decon Trailer @242S
Material Evaluation Laboratory
Material Storage Building
Waste & Material Storage
Uranium O xide Facility
Uranium Concretion Facility
Uranium Concretion Change Room
Electrician and Pipefitter Shop
Storage
Materials Development Laboratory
2 Fuel Development Laboaratory
SP-100 Ges Tesr Facility
Emergency Storage, Part if 309 Building
N Fuel Manufacturing Support FAX.
Engineering Development Laboratory
Stress Rupture Test Facility
Hydromechanical/Seismic Facility
Model Heat Loop, Part of 321 Building
Mechanical Properties Laboratory
Chemical Engineering Building
Stack Sampling Facility
Post Irradiation Test Laboratory
Virology Laboratory
Dog Kennel
Animal Resources Storage Building
Packaging Test Facility
N Fuel Building
Waste Acid Storage Building
Waste Neutraliza tion Facility
Waste Retention Building
Maintenance Shop
Communication and Documentation Services
Change House
Radioanalytical Laboratory
Organic Chemistry Laboratory
Spare Parts W arehouse
Materials Archive Building
Laboratory Equipment Central Pool Building
Sodium Storage Facility
Chemistry and Metal Sciences Laboratory
Classified Incinerator Facility
Fabrication Shop
Solvent and Acid Storage Building
Emergency Air Bottle Bldg(ATT to 3701d)
Classified Vault
Geotechnicl High-Bay
Gamma Irrdiation Facility Laboratory Equipment
Central Pool
Graphite Machine Shop
Paint Storage Building
Radiological Calibrations and Standards
Electron Acclerator Facility
Irradiation Physics Building
Conference Training Building
Technical Security
Offices
Laboratory
Mobile Office 329 T.2
Mobile Office 329 T.1
Mobile Office (377 Trl 1)
Mobile Office 3760 T.1
Mobile Office (3745 Trl 1)
Mobile Office 326 T.2
Mobile Office 306W T.2
Mobile Office 328 T.5
Mobile Office (3705 Trl 1)
Mobile Office (318 Trl 3)
Mobile Office 331 T.5
Mobile Office (323 Trl 2)
Mobile Office (333 Trl 1)
Mobile Office 306W T.6
Mobile Office (366 Trl 4)
Mobile Office (3770 Trl 2)
D-7

Mobile Office (3770 Trl 1)
4 Mobile Office
Mobile Office 318 T.2
Mobile Office @ FMIT
Mobile Office 325 T.1
Mobile Office 320 T.2
Mobile Office (FMIT TRL 3)
Mobile Office (FMIT TRL 5)
Escort Trailor
Mobile Office to be Excessed 7/94
Mobile Office Also K nown As 377 T rl 2
HPT O ffice @ 340
Mobile Office 306W T.5
Mobile Office Shop (306 Trl 7)
Mobile Office (FMIT Trl 9)
Mobile Office N/O 4 th & Buffalo (A Farm)
Mobile Office (FMIT Trl 4)
Mobile Office 3760 T.3
Mobile Office (FMIT Trl 10)
Mobile Office (3763 Trl 1)
Mobile Office to be Excessed 10/94
Mobile Office @ ESML Constr. Site
Radio Maintenance Shop(655W-AVE)
X Ray Facility
Sand Blast Facility
Telephone Exchange (959FIRSTST)
Hevy Equipment Repair Shop and Office
Oil Storage
Bottled Gas Storage
Fabrication Shop
Compressor Shop
Warehouse and Safety Hall
Combustible Material Storage
Administration Building
Administration and Engineering Office Bldg
Office Building (2770U-Ave)
Consolidated Personnel Building
Telecommunication Shop @1154(2671W -Ave)
Telecommunications Office @ 1154 (2675W-Ave)
Mobile Office Near 1262 Building (2730U-Ave)
Restroom Trlr @ 1209 Bldg Gate
Telecommunications Office @ 1154 (2665W-Ave)
Men’s Restroom Trailers S. Of 1226
Previously Called Trl. 4 Near 1301
Mobile Office Att to 1154-Formerly TrlF 7
Mobile Office Near MO-850(2726U-AVE)
Field Changeroom Trailer S of 1226
2 Telecommunications Parts Storage @1154
Mobile Office @1154 (2667W-AVE)
Mobile Office (2735U-AVE)
Mobile Office Near 1226(2648W-AVE)
Mobile Office @ EM SL Site EM SL T r.1
Visitor’s Center
Training Facility
Maintenance and Storage Facility (MASF)
Former Guard Station, Kentucky Blvd
Guard Station, Grant Ave.
Guard Station, Hayes St.
Security Maintenance Shop
400 Area Fire Station
400 Area Site Support Office
Medical Aid Station
Site Service Maintenance Shop
Warehouse (Special Tools)
Warehouse
Mobile Office Of W. Of 4706
Mobile Office (Trl 100) W. Of 4706
Mobile Office (Trl 102) W Of 4706
Field Trailer W. Of 4706
Mobile Office W. Of 4706
Patrol Utiltity Building
Radioecology Field Laboratory, Rattlesnake SPRI
Space Science Laboratory
Pump House
Lysimeter Preparation Building
Ale Field Storage Building
ALE Laboratory 11
Pump House
Fallout Laboratory
Fire Protection Pump House
Mobile Office @ Grout
Escort Trailor @ Gate 814
Mobile Office s/o 622G
Portable GEN/W ater Tank @ CTRL Landfill
Mobile Office @243G
Boar House/Storage Building
Savannah River Operations Office
Downstream River Water Pumphouse
K-Reactor
L-Reactor
Brookhaven National Lab
Valvehouse
Equipment House
NAT Synchrotron Light Source
High Flux Beam Reactor
Cold Neutron Facility
Fanhouse
Cyclotron
Tandem Van De Graaff
Cryogenic Wing
Pett VI
Heavy Ion Power Supply A
Heavy Ion Power Supply B
Heavy Ion Beam Tunnel
AGS Experimental Halls
Mechanical Equipment
AGS Tunnel
Fan House A
D-8

Fan House B
Fan House C/A-10 House
Fan House D
Fan House E
Proton House D18
Proton House E18
Proton House F18
Proton House G18
Proton House H18
Proton House I18
Proton House J18
Proton House K18
Proton House L18
Booster Equipment House L18A
Proton House A18
Proton House B18
Proton House C18
H-10 Equipment House
Booster
Warehouse
7 Works Buildings
PTR Rect. House #1
PTR Rect. House #2
PTR Rect. House #3
E-10 Power Supply
Exp. Power Supply Building G-2
Scientific Assembly
Electronic Equipment Repair
N. Experimental Tunnel
MG Power Supply
RF Power Supply
200 MEV Linac
Isotope Producer (BLIP)
F-10 House Equipment
Equipment Storage
On-Line Data Facility
Power Supply and Support
Booster Tunnel
Blip Pump House
G-2 Tunnel
Pump Room
4 Storages
Rectifier House A
R & D Facility
Experimental Computer/Electrical Building
Machine Shops/SPS
RHIC Tunnel
W-Line Power Supply
Brahmns Experimental Hall
Instrumentation Brahmns Ser
2:00 Cryo Service Building
Brahmns Counting House
RF Service Building
4:00 Cryo/Main Power Supply SE
Yellow Ring Injection Service
Compressor Building
5:00 Cooling Tower
Collider Center
Star Experimental Hall
Star Service Building
6:00 Cryo Service Building
Star Counting House
Blue Ring Injection Service
Phenix Experimental Lab
Phenix Service Hall Building
8:00 Cryo Phenix Magnet Ser
Phenix Cooling and Pump House
Phobos Experimental Hall
Cryo Phobos Service Building
Future Facility / Experimental
Cryo Polarimeter Service
Assembly Building
Strategic Petroleum Reserve
41 Field Instruments Buildings
5 Foam Storage Buildings
6 Control Center Buildings
Maintenance Building
Foam Storage A Building
Potable W ater Building
5 Sky Switchgear Building
Maintenance Strg equipment Building
3 Soc Building
Main Guard House Building
3 Property Warehouse Buildings
4 Flammable Storage Buildings
3 Foam D eludge Building
RW IS Pump H puse Building
2 Gun Cleaning Building
Weld Shop Building
Grass Maintenance Equipment Building
2 Foam G enerator Buildings
Maintenance Facility Building
Radio Repairer Building
Skva Supr Bloc F & G
1 Firewater Pumps
6 Administration Buildings
Fire Pumps on Trucks Building
Paper Recycling Building
Guard House Building
Electrical Moa Building
Substation Electrical Building
Deludge Valve Building
Moc Be-2 Building
Guard House Corner Building
3 Gun Cleaning Building
Water Storage Building
2 Motor Control Center Building
Maintenance & W arehouse Building
Erner Properness Building
D-9

RW IS Ups Building
2 Communications Buildings
Warehouse E Building
Main Fire W ater Building
Fire At Black Lake Building
ACUS Small Shed
Control Room Taxoma Building
Sky Foam Deluge Building
Fab Shed B uilding
Deluge Valve
Flammable Storage Shed
Guard Conet Gate Building
Ravis Microwave Building
Ravis Computer Conrno Building
Sky West Building
Sky East Building
Switchgear Building
Construction and Maintenance Building
Sample Lab Building
Pump H ouse Foam Building
Inert gas Gen Building
P/S Head Frame
MO CS s/s Area Building
Equipment Storage Building
Fire Truck Building
Well Water Pump House Building
Fire Transformer Dei Building
Fill Site Storage Building
Maintenance Receiving Building
Lab Building
Radio Tower Building
Guard House On Site
Foam Prop. #3 Building
Foam Prop.#2 Building
Foam Prop. #1 Building
Foam Prop. #4 Building
Operator Control Dk1 Building
Operator Control Dk2 Building
Foam Prop Dock 1 Building
Firewater Pump Dk 1 Building
Foam Prop. Dock 2 Building
Property Whse/Maint Building
Vehicle Maintenance Building
Wash Rack Building
Wheeled Equip Building
Sample Storage Building
Gatehouse Front Hard Building
Gatehouse #3 Building
Firewater Pump Building
Foam Proportioning Building
Covered Laydown Building
RW IS Guardhouse Har Building
Substation Building
RW IS Control Building
Prefab. Paint Storage Building
RW IS Comm Building
Microwave B uilding
HPP/Permit/Fire Pump
S/S Hoist
S/S Head Frame
2 Property Warehouse
Warehouse D
RW IS
Warehouse Guard House
Stanford Linear Accelerator Center
Accelerator Tunnel
Klystron Gallery
Beam Switch Yard (BSY)
Damping Ring Vault, South
Damping Ring Vault, North
Damping Ring RF - South
Damping Ring RF - North
Collider Housing North Arc
Collider Housing South Arc
Power Conversion
Casting Pad Shelter
Test Laboratory
Hydrogen Furnace Housing
Deionization Plant
Main Control Center (MCC)
Cryogenics Building
Test Cell Facility
Electronics Building Annex
End Station A
Final Focus Test Beam Bldg
Final Focus Test Beam Bldg
Bubble Chamber / 40"
Bubble Chamber Bldg / 82"
Spear Interaction Area/East
Spear Control Building
Spear Interaction Area/West
SSRL, North Annex
Test Beam Facility (TBF)
SSRL South Arc Building
SSRL Lab/Office/Shop Bldg
SSRL Spear Injector (in Const.)
Van Group D
Experimental Control C-Beam
East Pit Control Room
82" BC Support
82" BC Support
Control Room B/L 19
Cryo Eng. & Operations
West Pit Detector Support Bldg
Beamline 6 Test Building
Final Focus Test Beam
Laser Storage Building
E 137 Experimental Building
IR 2 Hall
D-10

IR 2 Hall Annex
IR 2 Counting House
IR 2 Support Building
IR 4 Hall
IR 4 Counting House
IR 4 Support Building
IR 6 Hall
IR 6 Counting House
IR 6 Support Building
IR 8 Hall
IR 8 Support Building
IR 10 Support Building
IR 12 Hall
IR 12 Counting House
IR 12 Support Building
SSRL PBF 18
CEH SLC Experimental Hall
MkII Leach
MCC Portable Building
Light Fabrication Building
Heavy Fabrication Building
Plating Shop Annex
Vacuum Assembly Building
Light Assembly Building
EFD Shops and Storage
EFD Shop Building
Rigging Loft
PMU Shops Building
Transport Tire Shop
Electronics Shop Trailer
Research Yard Machine Shop
Department of Health and Human Services
Centers for Disease Control and Prevention
Clifton Road Facility, Atlanta, GA
Chamblee, Atlanta, GA
Lawrenceville, Lawrenceville, GA
Cincinnati Taft North, Cincinnati, OH
Cincinnati Hamilton, Hamilton, OH
Morgantown, Morgantown, WV
San Juan, San Juan, PR
Ft. Collins, Ft. Collins, CO
Spokane, Spokane, WA
Pittsburgh, Pittsburgh, PA
Food and Drug Administration
Module I and II (MOD 1 & 2) and Beltsville
Research Facility, Beltsville , MD
Gulf Technical Services, Dauphin Island, AL
Winchester Engineering and Analytical Center
(WEAC), Winchester, MA
San Juan District and Laboratory, San Juan, PR
Atlanta Offices and Laboratory, Atlanta, GA
Los Angeles Offices and Laboratory, Los Angeles,
CA
National Center for Toxicology Research (NCTR),
Jefferson, AR
Indian Health Service
Aberdeen/49, SD, ND, NE
Albuquerque/26, NM
Anchorage/23, AK
Bemidji/9 , MN
Billings/16, M T, W Y
Nashville/4, MS, NC
Navajo/54, NM, AZ
Oklahoma City/20, OK, KS
Phoenix/40, AZ, CA, NV, UT
Portland/23, WA, OR, ID
Tucson/6, AZ
National Institutes of Health
Bethesda Campus & NIHAC, Bethesda &
Poolesville , MD
Research Triangle Park, Research Triangle,
NCFrederick Cancer Research and Development
Center (FCRDC), Frederick, MD
Rocky Mountain Laboratory, Hamilton, MT
Gerontology Research Center, Baltimore, MD
5 Research Court, Rockville , MD
Federal Building, Bethesda, MD
12441 Parklawn, Rockville , MD
12300 Twinbrook, Rockville , MD
Twinbrook I & II, Rockville , MD
Department of Justice
FBI Headquarters, J. Edgar Hoover B ldg, Western Regional, Data Center
Washington, DC FBI Complex, Clarksburg, WV
FBI Training Facility, Quantico, VA Justice Data Center, Rockville , MD
D-11

Department of the Treasury
Bureau of Alcohol, Tobacco, and Firearms U.S. Mint
Canine Training Center, Front Royal, VA Philadelphia Mint, Philadelphia, PA
Denver Mint, Denver, CO
Bureau of Engraving and Printing San Francisco Mint, San Francisco, CA
Washington Currency Facility, Washington, DC West Point Bullion Depository, West Point, NY
Western Currency Facility, Fort Worth, TX Fork Knox Bullion Depository, Fort Knox, KY
Internal Revenue Service U.S. Secret Service
Martinsburg Computer Center, M artinsburg, W V Rowley Training Center, Beltsville , MD
Environmental Protection Agency
Robert S. Kerr Environmental Research Lab, Ada,
OK
National Vehicle and Fuel Emissions Laboratory,
Ann Arbor, MI
National Exposure Research Laboratory, Athens, GA
Science and Ecosystem Support Division, Athens,
GA
Andrew W. Breidenbach Environmental Research
Center, Cincinnati, OH
National Health and Environmental Effects Research
Laboratory - Western Ecology Division, Corvallis,
OR
National Health and Environmental Effects Research
Laboratory - Mid-Continent Ecology Division,
Duluth, MN
Region 2 Laboratory, Edison, NJ
Environmental Science Center, Fort Meade, MD
Region 8 Laboratory, Golden, CO
National Health and Environmental Effects Research
Laboratory - Gulf Ecology Division, Gulf Breeze, FL
Environmental Laboratory, Houston, TX
University of Nevada, Las Vegas - On Campus EPA
Facilities, Las Vegas, NV
Region 10 Laboratory, M anchester, W A
National Air and Radiation Environmental
Laboratory, Montgomery, AL
National Health and Environmental Effects Research
Laboratory - Atlantic Ecology Division, Narragansett,
RI
National Health and Environmental Effects Research
Laboratory - Western Ecology Division, Newport,
OR
Central Regional Laboratory, Richmond, CA
Research Triangle Park, Research Triangle Park, NC
General Services Administration
Federal Center-Admin, Waltham, MA
Boston New Ch, Boston, MA
EPA Laboratory, Lexington, MA
US Border Station, Calais, ME
US Border Station, Coburn Gore, ME
US Border Station, Fort Fairfie ld , ME
US Border Station, Houlton, ME
US Border Station, Jackman, ME
US Border Station, Limestone, ME
US Border Station, Orient, ME
US Border Station, Vanceboro, ME
US Border Station, Van Buren, ME
US Border Station, Calais, ME
St. Pamphille , Saint Francis, ME
US Border Station, Madawaska, ME
USBP Sec Hd Houlton, Hodgdon, ME
US Border Station, Fort Kent, ME
USBS/TWP20, Saint Francis, ME
USBS, Township 11, Saint Francis, ME
US Border Station, Derby Line, VT
US Border Station, Norton, VT
US Border Station, Beebe Plain, VT
US Border Station, Alburg Springs, VT
US Border Station, North Troy, VT
US Border Station, West Berkshire, VT
US Border Station USPO, Derby Line, VT
US Border Station, Beecher Falls, VT
US Border Station, Canaan, VT
USBS East Richford, Richford, VT
US Border Station, Richford, VT
USBP Sector Hdqtrs, Swanton, VT
USBS, Highgate Springs, VT
Swanton Border Patrol Bldg, Highgate Springs, VT
Administration Bldg., Champlain, NY
Inspection Bld Borde, Chateaugay, NY
Temp Frme Gar Bdr St, Massena, NY
Inspection Building, Mooers, NY
Border Station, Fort Covington, NY
Border Station, Rouses Point, NY
Border Station, Rouses Point, NY
D-12

Border Station, Trout River, NY
US Mission to the UN, New York-Manhattan, NY
Administration Bldg, Alexandria Bay, NY
Rainbow Br Pt Entry, Niagara Falls, NY
Chas. E. Bennett FB, Jacksonville, FL
Airside Commerce, Orlando, FL
Columbus, Miami, FL
2385 Chamblee Tucker, Atlanta, GA
Gnann House, Plains, GA
GSA/FBI Motor Pool, Memphis, TN
Southplace Office Park, Nashville, TN
Federal Building, Chicago, IL
Minton-Capehart F/B, Indianapolis, IN
US Border Station, Sault Ste Marie , MI
Cust Cargo Inspection Facility, Detroit, MI
Food & Drug, Detroit, MI
Ambassador Bridge, Detroit, MI
Detroit Computing Ct, Detroit, MI
Border Station, Grand Portage, MN
Custom & Immigration Station, Noyes, MN
US Border Station, International Falls, MN
Prop. Border Station, Baudette, MN
FDA Fornsc Chem Center, Cincinnati, OH
25 Funston Road, Kansas City, KS
11510 West 80th, Lenexa, KS
Federal Bldg, Kansas City, MO
Executive Hills, Kansas City, MO
Buckeye Industr. Park, Kansas City, MO
USBP SH Bldg 13, New Orleans, LA
USBS Import Dock, Santa Teresa, NM
Border Station, Columbus, NM
Austin Finance Ctr, Austin, TX
USBS B&M-Admin Bldg, Brownsville, TX
Gateway USBS Bldg A, Brownsville, TX
USBS-Columbia Admin, Laredo, TX
US Border Station, Laredo, TX
USBS Admin Building, Del Rio, TX
BPSH Bldg 1, Hqtrs, Del Rio, TX
USBS Br Of The Amers, El Paso, TX
USBS Amdin Building, Eagle Pass, TX
USBS Admin Building, Hidalgo, TX
Juarez-Lincoln USBS, Laredo, TX
USBS Admin Building, Los Indios, TX
BPSH Bldg A, Laredo, TX
Los Tomates USBS Ad, Brownsville, TX
BPSH Administratn Bd, Mcallen, TX
Headquarters Bldg, Marfa, TX
USBS Pharr Admin Bld, Pharr, TX
USBS Paso Del Norte, El Paso, TX
USBS Admin Building, Progreso, TX
US Border Station, Rio Grande City, TX
USBS Admin Building, Roma, TX
USBS Main Building, El Paso, TX
Federal Building, Dallas, TX
US Border Station, Fabens, TX
USBS Intl RR, Laredo, TX
US Border Station, Presidio, TX
Chief Mtn BS & Qtrs, Babb, MT
Piegan BS & Qtrs, Babb, MT
Roosville BS, Eureka, MT
Sweetgrass BS, Sweetgrass, MT
Border Patrol Sector Hq, Havre, MT
Turner B, Turner, MT
Ambrose BS, Ambrose, ND
Dunseith BS, Dunseith, ND
Portal BS, Portal, ND
St John BS, St John, ND
Bldg A Main Building, Pembina, ND
Border Patrol Sector Hq, Grand Forks, ND
Lukeville Dock, Lukeville Arizona, AZ
BS Old Cus Bldg, Nogales, AZ
BS Garage, Sasabe, AZ
BS Main Bldg, Douglas, AZ
Border Patrol Sector Hqrs, Tucson, AZ
BS Main Bldg, San Luis, AZ
BS Main Bldg, Naco, AZ
BS Office Bldg, Nogales, AZ
BS Old Customs Bldg, Calexico, CA
BS Exist Main Bldg, San Diego, CA
BS Main Bldg, Andrade, CA
New Commercial Fac, San Diego, CA
BS Main Bldg, Tecate, CA
BS Bulk Lot Bldg, Calexico, CA
US Border Patrol Station, Calexico, CA
Parkway Centre, Alameda, CA
Dalton Cache Bor Sta, Haines, AK
Station Building, Tok, AK
Post Office Ct Jail, Nome, AK
Housing Unit No 2, Nome, AK
Int Ag Motor Pool, Anchorage, AK
Skagway Border Station, Skagway, AK
US Border Station, Eastport, ID
US Border Station New, Porthill, ID
E.Green - W.Wyatt FB, Portland, OR
Station Bldg, Blaine, W A
Danville Border Station, Danville, W A
Station & Quarters, Curlew, WA
Station, Laurier, WA
Station, Metaline Falls, WA
US Border Station, Oroville, WA
US Border Station, Sumas, WA
Kenneth G . Ward B S, Lynden, W A
Fed Bldg USDJ INS, Seattle, W A
Fed Bldg USPO & CH, Richland , WA
Border Patro l Sect Hq, Blaine, W A
Border Patro l Sec Hq Annex, B laine, W A
Border Patro l Sect Hq, Spokane, W A
Jackson FB, Seattle, W A
FDA Bldg, Bothell, W A
New Border Station, Point Roberts, W A
D-13

Pacific Hiway Border, Blaine, WA
Border Patro l Annex, Spokane, W A
Central Heating Plant Stm, Washington, D.C.
West Heating Plnt Stm, Washington, D.C.
Wilbur J. Cohen Bldg, Washington, D.C.
Reagan Bldg FOB, Washington, D.C.
Flam Lab- Bldg "A", Gaithersburg, MD
1401 Research Blvd, Rockville , MD
Rickman Building, Rockville , MD
New Carrollton Fed, Lanham, MD
The Gaither Dist Ctr, Gaithersburg, MD
Census Computer Facility, Bowie, MD
U.S. Secret Service Headquarters, Washington, D.C.
National Aeronautics and Space Administration
Ames Research Center, Moffett Field, CA
Model Development Facility
Technical Services Shop
Central Computation Facility
Thermal Protection Facility
Arc Jet Facility
Model Construction Facility
Program Support Communication Network Facility
Flight Data Complex
Numerical Aeronautics Simulator
Unitary Plan Wind Tunnel Auxiliary Building
Advanced Computation Facility
Flight Data Facility
High Pressure Air Housing
Glenn Research Center, Cleveland, OH
Chemistry Laboratory
Instrument Research Laboratory
Operations/Integration Building
Goddard Space Flight Center, Greenbelt, MD
Central Flight Control Range
Instrument Construction/Development Laboratory
Payload Testing Facility
Environmental Testing Laboratory
Network Control Center
Spacecraft Operations Facility
Data Interpretation Laboratory
EOS/DIS Building
Goddard Geophysical and Astronomical Observatory
Area
Jet Propulsion Laboratory, Pasadena, CA
Environmental Laboratory
25 Foot Space Simulator
Spacecraft Assembly Facility
Space Flight Operations Facility
10 Foot Space Simulator
Space Flight Support
Frequency Standards Laboratory
Earth & Space Sciences Laboratory
Micro Devices Laboratory
Johnson Space Center, Houston, TX
Crew Systems Laboratory
Photographic Technology Laboratory
Central Heating & Cooling Plant
Auxiliary Chiller Facility
Space Environment Simulation Laboratory
Life Sciences Laboratory
Central Computing Facility
Emergency Power Building
Vibration and Acoustic Test Facility
Atmospheric Re-Entry Materials & Structures
Evaluation Facility
Radiant Heat Facility
Thermo Chemical Test Area
Sonny Carter Training Facility
Avionics Systems Laboratory
Planetary & Earth Science Laboratory
Kennedy Space Center, Kennedy Space Center, FL
Hangar L, Life Sciences Support Facility
Hangar AE, Missile Assembly Building
First Wash Building
East High Pressure Wash/Surf Prep
Robot Wash Building
Media Blast
Program Support Communication
Electromagnetic Lab
Central Instrumentation Facility
Film Storage
PGOC Warehouse
Warehouse #1
Operations and Checkout Building
Space Station Processing Facility
Payload Support Building
Canister Rotation Facility
Multi-Payload Processing Facility
Spacecraft Assembly & Encapsulation Facility
Payload Hazardous Servicing Facility
Vertical Processing Facility
Ordnance Storage
Langley Research Center, Hampton, VA
East Area Compressor Station (Closed)
Hydrodynamics Research Facility
Space Environmental Effects Laboratory
Structures and Materials Research Laboratory
Steam to H ot Water Exch/Pump House
D-14

Central Heating and Steam Generation Plant
Conference Center
Central Scientific Computing Facility
Refuse-Fired Steam Generating Facility
Flight Dynamics Drop Model Facility (Closed)
Anechoic Noise Facility
Compressor Station
Vacuum Pumping Station – Gas Dynamics Complex
Flight Simulation Laboratory
Central Scientific Computing Facility
Earth Orbiting System-DIS-DAAC Facility
Cockpit Motion Facility
Michoud Assembly Facility, New Orleans, LA
Entire Facility is Industrial
Marshall Space Flight Center, Huntsville, AL
Microwave Anechoic Chamber
Communications Facility
Photographic Laboratory
SSM E - Block II Facility
LIDAR Facility
Power Systems Laboratory
MAST /FSL Simulation Facility
Space Science Labortory
Laboratory & Office Building
Test Stand Support Building
Test Facility 300
Test Facility 116
Structural Test Facility
Test Facility Terminal Building
Hot Gas Test Facility
Test Control and Service Building
TPTA Refurbishment Facility
Pump and B oiler House
Propulsion and Structural Test Facility
Test & Data Recording Facility
Space Environmental Effects Laboratory
Air Compressor Building
Materials & Processes Laboratory
Atmospheric Research Facility
Heat Treatment Facility
Structural Dynamics & Thermal Vacuum Laboratory
Hydrogen Test Facility
Air Compressor Building
High Pressure Test Facility
Multi-Purpose H igh Bay Facility
Hydraulic Equipment Development Facility
LH2 Vaporization Facility
High Pressure GN2 Facility
Boiler Plant
Computer Facility
Pump House
Advanced Engine T est Facility
Test Support Building
Block House
Boiler House
Helium Compressor Building
Non-Destructive Evaluation Laboratory
Shops & Neutral Buoyancy Simulator
Productivity Enhancement Facility
Engineering & Developmental Laboratory
Developmental Processes Laboratory
X-Ray Calibration Facility
Office and Wind Tunnel
Compressed Air Facility
Air Compressor Facility
High Bay Shop Building
Space Station Development Laboratory
Surface Treatment Facility
High Reynolds N umber Facility
Low Density Flow Facility
Engine Dynamic Fluid Flow Facility
NASA Industrial Plant, Downey and Palmdale, CA
NASA Industrial Plant (Downey) and USAF Plant
42, Production Site 1 (Palmdale)
Santa Susana Field Laboratory, Canoga Park, CA
Entire facility is laboratory space.
Wallops Flight Facility, Wallops Island, VA
Mainland/Island Areas
Radar Facility
Machine Shop – Fabrication
Aircraft Projects/Hangar Area
Electronics Support/Storage
National Archives and Records Administration
National Archives I, Washington, D.C. Ford Presidentia l Library, Ann Arbor, MI
National Archives II, College Park, MD Ford Museum, Grand Rapids, MI
Hoover Presidential Library, West Branch, IA Carter Presidential Library, Atlanta, GA
Roosevelt Presidential Library, Hyde Park, NY Reagan Presidential Library, Simi Valley, CA
Truman Presidentia l Library, Independence, MO Kennedy Presidentia l Library, Boston, MA
Eisenhower Presidential Library, Abilene, KS Bush Presidential Library, College Station, TX
Johnson Presidential Library, Austin, TX
D-15

Social Security Administration
National Computer Center, Baltimore, MD
Coal Handling Facilities
Truck Coal Sample Station
BRF Breaker Bldg
GAF Coal Sample Collection Bldg
CUF Coal Sample Bldg
CUF Live Storage Silos
KIF Fuel Handling
SHF Fuel Handling
CUF Reclaim Hopper
CUF Breaker Structure
CUF Surge Hopper Bldg
WCF Fuel Handling System
SHF Coal Yard Lighting
SHF Railroad Hopper Bldg
COF Barge Unloader Building 1
Computer Facilities
Monteagle Place
Control Room Facilities
PAF Security Portal
BOH Control Building
COF Switchyard Control Bldg
KIF Precipitator Control Bldg 3
KIF Demineralization Bldg
KIF Precipitator Control Bldg 2
WBN Control Building Cb
RPS Switchyard Control Building
SHF W ater Treatment Plant
JSF Conveyor Control Tower
KIF Precipitator Control Bldg 1
SHF AFBC Control Bldg
JOF Control Bldg
GFH Control Building
COF Precipitator Control Building 5
SHF Control Bldg
GAF Electrical Control Bldg
BRF Control & Sampling Bldg
SHF Crusher Bldg
Generator Facilities
Tennessee Valley Authority
TLH Emergency Generator Building
NJH Diesel Generator Building
Laboratory Facilities
PAF Coal Wash Laboratory
Engineering Labs Building P
Engineering Labs Building D
Engineering Labs Building A
BFN Low Lvl Rdwst Bldg. (E-32)
Aquatic Biology Lab-Wet Lab
Aquatic Biology Lab-Tractor Shed
Aquatic Biology Lab.-Shed
Catalyzer # 4 - Radio/High Pressure Lab
Catalyzer # 1 - Mineral Lab
Catalyzer # 2 - Nitro Fertilization Lab
Catalyzer # 5 - Plant
Catalyzer # 6 - Nitro Fertilization Office
Aquatic Biology Lab-Hatchery
Aquatic Biology Lab (Main)
Chemical Engineering Building Lab
Western Area Radiological Lab
Engineering Lab Annex
N Engineering Lab Bldg B
BFN B iothermal Research
N M aintenance Building
Experimental Greenhouse
Chl/Dc/Msc Coal Laboratory
N Engineering Lab Bldg N
Chl/Dc/Msc Laboratory Bldg/Power Stores
WCF Sample Prep Bldg
N Engineering Lab Bldg H
BFN T oxicity Testing Lab
Load Management Facilities
FTL Modular Unit
Glasgow Modular Unit
Holston Mountain Load
Hiwassee Microwave
Microwave Stations
Hopkinsville Microwave
TFH Spillway Emergency Generator Building Terrapin Mtn Radio
Powerhouse (Generator Facility) Eaves Bluff Microwave/Radio
WBN Diesel Generator Building Dg-2 Lamar Microwave
WBN Diesel Generator Building Dg-1 Grandview Radio/Microwave
CHH Diesel Generator Building Graham M icrowave
BRH Small Turbine Generator Martin Radio
MHH Diesel Generator Bldg Bruce Radio Station
TFH Diesel Generator Building Elkton Hill Radio/Microwave
D-16

Russell Hill Microwave
Ellis Mountain Microwave
Meredith Microwave
Oswald Dome Microwave
Hinze Radio/M icrowave
Norton Hill Microwave
Beech Grove Microwave
Montlake Microwave
Roosevelt Mt M icrowave
Van Vleet Radio/Microwave
Pickwick Microwave
Raccoon Mtn Pump House
Wininger Microwave
Norris Modular Unit
Lena Radio/Microwave
Woodall Mountain Microwave
Nickajack Modular Unit
Tuscumbia Microwave
Stephensville Microwave
Waynesboro Radio Repeater
Johnsonville Microwave
State Line Microwave
Germantown M icrowave
McEwen Microwave
Fain Mountain Microwave
Sharps Ridge Microwave
Lambert Chapel M icrowave
Monsanto Microwave
Monte Sano Microwave
Rogersville Microwave
Sebastopole Radio Repeater
Hornbeak Radio/Microwave
Holston Mountain Microwave
Pulaski Microwave
Church Hill Microwave
Raccoon M tn Microwave
Bunker Hill Microwave
Thorton Town Microwave
Fort Mountain Radio Station
Trace Park Microwave
Rock Springs Microwave
New Castle Microwave
Signal Mountain Microwave
Finger Microwave Station
Great Falls Microwave
Vanleer Microwave
Cottonport Radio
DGH Modular
Morristown Microwave
Sequoyah Training Radio
New Johnsonville Microwave
Pulaski Radio Tower
Brawley Mtn Microwave/Radio
Sequatchie Valley Radio Station
Roane M ountain Microwave
Shawnee Repeater Station
Anderson M icrowave
Oak Ridge M icrowave
Smithville Radio
Fabius Microwave
Lynn Grove M icrowave
Hickman M icrowave
Spring Hill Microwave
Grand River Radio/Microwave
Donelson M icrowave
Sewanee Microwave
Centerville Microwave
Broadview Microwave
Model Microwave
WBH Modular Unit
Beech Grove Microwave
Wauchecha Bald Radio
Burney Mountain Microwave
Green Top Mountain Microwave
White Oak Mountain Radio
Bowling Green M icrowave
Combs Knob M icrowave
Monte Sano VHF
Hollis Chapel Microwave
Powerhouse Facilities
GAF Powerhouse
BFN Reactor Building
DGH Powerhouse/Dam
WCF Powerhouse Plant A
GFH Powerhouse
RPS Powerplant Chamber and Tunnels
CTH Powerhouse/Dam
GUH Powerhouse/Dam
O1H Powerhouse/Dam
HIH Powerhouse/Control Building
NOH Powerhouse/Dam
BFN Unit 3 Diesel Generator Bldg
BRH Powerhouse
KIF Powerhouse
PAF Powerhouse
BFN Unit 1 & 2 Dsl.Gen. Bldg
O3H Powerhouse/Control Bay
NJH Powerhouse/Dam
MHH Powerhouse/Dam
CRH Powerhouse/Dam
COF Powerhouse
KYH Powerhouse/Dam
SHH Powerhouse
BFN Turbine Building
RPS V entilation Fan Building
RPS Discharge Structure Pumping Station
WIH Powerhouse/Dam
NTH Powerhouse
WTH Powerhouse
D-17

BFN Radwaste Evaporator Bldg
WBH Powerhouse/Dam
BRF Powerhouse
SHF AFBC Boiler Bldg
FLH Powerhouse/Dam
SHF Powerhouse
FNH Powerhouse/Dam
PKH Powerhouse/Dam
CHH Powerhouse/Dam
JOF Powerhouse
CUF Powerhouse
WCF Powerhouse Plant B
RPS Surge Chamber and Tunnel
WB H Control Bldg
WEH Powerhouse/Dam
WBN Turbine Building Tb
BOH Powerhouse/Dam
O2H Powerhouse/Dam
RPS Service Equipment Building
BFN Control Building
RPS Power Storage Building
JSF Powerhouse
TFH Powerhouse/Dam
FPH Powerhouse/Dam
APH Powerhouse
Process Facilities
WTH Control Building
Dandridge Pump Sta. (Doug Dam)
KIF Sample & Hopper Bldg No. 1
Fleet Harbor Pumping Station
HIH Dam
ALF Powerhouse
KIF Switchyard Control Bldg
SQN Diesel Gen. Bldg.
KIF Crusher Bldg
GAF Utility Bldg
BRF Sewage Treatment Plant
NTH Compressor and Blower Building
WCF Forced Oxidation Blower Bldg.
SQN Intake Pump.Stat.
KIF Hopper Bldg No. 2
PDW Pumping Station
SQN Reactor Bldg.
WTH Oil Purification Building
Pump Station (W atts Bar Res)
Prototype Opers Bldg (P ilot Plant)
SQN Turbine Bldg.
KIF Truck Sample Prep B ldg.
TFH Intake Structure
WTH Electrical Equipment Building
KIF W ater Treatment Plant
Lexington W ater Pump (Temporary)
Volunteer 500 kV Pump House
WEH O il Purification Building
GFH Rock House
O3H Dam/Gallery
BFN Unit 3 Restart
Singleton Compressor/Phone Bldg
O3H Valve House
PAF Limestone Preparation Bldg
O2H W ater Level Gauge House
O2H Penstock Valve House
O2H Trash Rack House
O2H Water Treatment Plant
Duck River Ltg/Heat
COF New W ater Treatment Bldg.
Martin Pump House
PAF Barge Unloader
FNH Diesel Generator Building
O2H W ell Pump House
O2H Oil Purification Building
ALF Combustion Turbine Maint Facility
O1H Diesel Generator Building
BFN Telephone Node Bldg. (W-19)
BRF Hydrogen Trailer Port
PAF Coal Wash Plant
GFH Intake House
PAF Conditioner Bldg
PAF Scrubber Maintenance Bldg
TLH Dam
Rockhouse, Buckeye, Bagwell Pump House
Camden 161 kV Pump House
Chemical Feed House
Fultondale Battery Building
Catalyzer # 3 - Plant
TFH Aeration and Compressor Building
South Jackson 161 kV Generator Bldg
PAF B reaker Building N
Columbia 161 Well House
SQN Control Bldg.
Boiler Building
ALF W ater Intake Structure
PAF Scrubber Control Bldg
CUF Utility Bldg
Marshall Pump House
PAF T ransfer Station A
Big Sandy Pumphouse - Motor
SHH Intake and Access Tunnel
Roane 500 kV Pump House
SHF Ash Handling System
BRH Spillway Equipment Building
JSF Control Bldg
APH D am
APH Valve House
GAF Hydrogen Trailer Port A
APH Diesel Generator Building
JSF Sample Bldg.
Phipps Bend 500 Pump House
Boiler House
D-18

CUF PPTR Control Bldg 1A
JOF Hopper Bldg
GAF Fuel Handling
Nickajack FTC New Pump House
Backwater Protection
Prototype Operations Building, Plant
JOF Crusher Bldg
WBF Boiler Bay
CUF W ater Supply Pumping Station
SQN Node Bldg
Big Sandy Pumphouse - Heat/Ltg
WBF Powerhouse
WCF Switchyard Control Bldg
CUF Absorber Building
JOF Draft Sys. Electrical Building
WCF Crusher Bldg
GAF Hopper Bldg
Pump House
COF Old W ater Treatment Plant
SHF Hopper Bldg
WCF Hopper Bldg
SHF Fly Ash Blower Bldg
Scottsboro Pump House
WBF Fuel Handling
Old Pump House
WB F Hopper Bldg
WBN M akeup Water Treatment Plant Mwp
GAF Water Treatment Plant
GAF Oil Pumping Station
CUF Accessory Bldg.
JSF Demineralizer Bldg
L&N Building East, Plant
BRF Aux Hopper
KIF Water Supply Pumping Station
WCF Water Supply
WBN Reactor Building Reac
Nickajack FTC Ventilator Building
GAF Combustion Turbine Maintenance Bldg
WBN Auxillary Building Aux
SHF D emineralization Bldg 2
GAF Conveyor Control Bldg
Weakley 500 kV Pump House
SHF D emineralizer Bldg 1
JSF Fly Ash Silo
BLN Turbine Bldg
MSW Plant
JOF Water Supply Bldg
West Sandy Pump House (Lts/Ht)
SHF Surge Hopper Bldg 1
JSF W ater Treatment Plant
JSF Chlorination Bldg
BRF Pumping Station
Whiteside Pump House
WCF Scrubber Unit 7
BLN Reactor Bldg
BRF Pptr Control Bldg
Wellhouse (Watauga Dam)
SHF Limestone Conditioner Bldg
Wellhouse
WCF Scrubber Unit 8
SQN Aux.Bldg
Well Houses
National Center For Emmissions Research
West Sandy Pump House
BLN Auxiliary Bldg
SHF Bag H ouse
COF Conveyor Control Bldg
JSF Conveyor Switchgear Bldg
COF Dry Fly Ash Eqpt Bldg
Cable Tunnels
WBN Intake Pumping Station-Intake
BLN Control Bldg
Substation Facilities
Huntsville 161 kV Switch House
Counce 161 kV Switch House
Hartsville HT SE W arehouse
Columbus Air Force Base 46 kV Switch House
Cornersville 46 kV Switch House
Columbia Primary 161 kV Switch House
Section 46 kV Switch House
Lebanon 161 kV Pump House
Madison 500 kV Switch House
Williamsport 46 kV Switch House
Pin Hook 161 kV Switch House
Trinity 500 kV Switch House
West Cookeville 161 kV Switch House
Bowling Green 161 kV Switch House
Albertville District 46 kV Switch House
Cordova 500 kV Pump House
Nance 161 kV Switch House
Arab 161 kV Switch House
Wilson 500 kV Pump House
Moulton 161 kV Switch House
Calhoun City 161 kV Switch House
Livingston 161 kV Switch House
Salem Carpet Mills 46 kV Switch House
Oglethorpe 161 kV Switch House
Concord 161 kV Switch House
Jackson 500 kV Switch House
Lynchburg 46 kV Switch House
North Huntsville 161 kV Switch House
Unionville 46 kV Switch House
Scottsboro 161 kV Switch House
Reynolds 161 kV Switch House
Red Bay 161 kV Switch House
West Nashville 161 Kv Switch House
Haletown 69 kV Switch House
Bryant 161 kV Switch House
Dupont 69 kV Switch House
D-19

Shelby 500 kV Pump House
Dayton 161 kV Switch House
Ardmore 161 kV Switch House
Shelbyville 46 kV Switch House
Albertville 161 kV Switch House
Spring City 161 kV Switch House
Centerville Fallout Shelter
Smithville 161 kV Switch House
Rockwood 161 kV Switch House
Mount Pleasant 161 kV Switch House
Jersey Miniere Zinc Co 161 kV Switch House
Hillsboro 46 kV Switch House
Fultondale 115 kV Switch House
Sherwood 46 kV Switch House
JSF 161kV Switch House Structure
Moccasin 161 kV Switch House
Springfield 161 kV Switch House
Lewisburg 161 kV Switch House
North Pigeon Forge 161 kV Switch House
Lawrenceburg 161 kV Switch House
Belfast 161 kV Pump House
Columbia 161 kV Pump House
Murphy 161 kV Switch House
Union 500 kV Switch House
Mt. Pleasant 161 kV Switch House
Columbia 161 kV Shelter
Waynesboro 161 kV Switch House
Sewanee 69 kV Switch House
Shelby 500 kV Switch House
Milan 161 kV Switch House
Culleoka 46 kV Switch House
South Jackson 161 kV Switch House
Tupelo 161 kV Switch House
Goose Pond 161 kV Switch House
Jersey Miniere Zinc-Elmwood
Raccoon Mtn Ps Plant 500 kV (161 kV)
Alpha 69 kV Switch House
Grove Oak 46 kV Switch House
Lewisburg 46 kV Switch House
Ridgedale 161 kV Switch House
Guntersville 161 Kv Switch House
GAF 161 kV Switch House
Henegar 161 kV Switch House
Bluff City 161 kV Pump House
Montgomery 500-kV-Pump House
Roane 500 kV Switch House
Charleston 161 kV Switch House
Collinsville 161 kV Switch House
Smyrna 161 kV Switch House
Monsanto 161 kV Switch House
Cullman 161 kV Switch House
Freeport 500 kV Switch House
Maury 500 kV Switch House
Decatur 161 kV Switch House
Huntsville 161 kV Switch House
FTL Plant 161 kV Switch House
Murfreesboro M aintenance Building
Dry Creek Primary 161 kV Switch House
Murffessboro Ind Park 161 kV Switch House
Farley 161 kV Switch House
Athens 161 kV Switch House
Marshall 500 kV Switch House
Clarksville Water Tower/COMM
Clarksville 161 kV Switch House
Double Bridges 161 kV Switch House
North Sardis 161 kV Switch House
NASA 161 kV Switch House
Hartsville N.P . 161kV Switch House
New Albany 161 kV Switch House
Moscow 161 kV Switch House
Okolona 161 kV Switch House
Oxford 161 kV Switch House
Carthage 161 kV Switch House
Sardis 161 kV Switch House
Holly Springs 161 kV Switch House
Kirkmansville 69 kV Switch House
Booneville District 46 kV Switch House
Water Valley 161 kV Switch House
Franklin 161 kV Switch House
Lafayette 161 kV Switch House
Aberdeen
Bolivar
Bonicord
Loudon 161 kV Switch House
Dunmor 69 kV Switch House
Rienzi 46 Switch House
Phipps Bend 500 kV Switch House
Shoals 161 kV Switch House
Logan Aluminum
Centerville 161 kV Switch House
Edgoten 161 kV Switch House
Limestone 500 kV Switch House
Radnor 161 kV Switch House
West Point 500 kV Pump House
Etowah Switch House 69 kV Switch House
Madison 500 kV Pump House
Hardwick Clothes Inc
Batesville 161 kV Switch House
Elkton 69 kV Switch House
Weyerhaeuser Co. 161 kV Switch House
Booneville 161 kV Switch House
Oakland 161 kV Switch House
Hopson 69 kV Switch House
Glasgow 161 kV Switch House
Dyersburg 161 kV Switch House
Burnsville 161 kV Switch House
Coffeeville 161 kV Switch House
Bandy, R. H. 115 kV Switch House
Hopkinsville 161 kV Switch House
South Nashville 161 kV Switch House/Nash ADCC
D-20

White Pine 161 kV Switch House
Hopkinsville 161 Well House
Olive Branch 161 kV Switch House
Cadiz 161 kV Switch House
WPM Philadelphia
Russellville 161 kV Switch House
Union City 161 kV Switch House
Russellville District 69 kV Switch House
Alamo 161 kV Switch House
Guntown 161 kV Switch House
Ludlow 46 kV Switch House
South M acon 161 kV Switch House
Tusculum 161 kV Switch House
Sturgis 161 kV Switch House
Nickajack FTC Elec Sim Control
Weakley 500 kV Switch House
Bristow
Kirkville 46 kV Switch House
Melton Hill Modular Unit
West Point 500 kV Switch House
Bolivar 161 kV Switch House
Bolivar District 46 kV Switch House
Weyerhauser 161 kV Switch House
Scott 115 kV Switch House
Covington 161 kV Switch House
Chesterfield 161 kV Switch House
Clarksburg 161 kV Switch House
Columbus 161 kV Switch House
Marble 69 kV Switch House
Paducah 161 kV Switch House
Columbus District 46 kV Switch House
Corinth 161 kV Switch House
Charlotte 69 kV Switch House
Brownsville 161 kV Switch House
Midway 161 kV Switch House
Trinity 500 kV Pump House
East Bowling Green 161 kV Switch House
Dekalb 161 kV Switch House
Sullivan Static Condensor
Hickory Valley 161kV Switch House
Peedee 69 kV Switch House
Casky 161 kV Switch House
Alcoa 161 kV Switch House
Pembroke 69 kV Switch House
Leake 161 kV Switch House
Brownsville District 161 kV Switch House
Louisville 161 kV Switch House
Sullivan 500 kV Switch House
Lonsdale 161 kV Switch House
Northeast Substation
Crossville 161 kV Switch House
Lowndes 500 kV Switch House
McGregor Chapel 161 kV Switch House
Miller 161 kV Switch House
Sullivan 500 kV Pump House
Tri State 161KV Switch House
West Ringgold 230kV Switch House
Clinton 161 kV Switch House
Calvert 161 kV Switch House
Knoxville 161 kV Switch House
COF 161 kV Switch House
Nixon Road 161 kV Switch House
Finley 161 kV Switch House
Erin 161 kV Switch House
East Shelbyville 161 kV Switch House
North Knoxville 161 kV Switch House
North Nashville 161 kV Switch House
Pigeon Forge 161 kV Switch House
Penchem 69 kV Switch House
Fort Payne 161 kV Switch House
Huntsville 161 kV Storage
Kerr-M cgee Inc. 161 kV Switch House
Stevenson 161 kV Switch House
Columbia District 46 kV Switch House
Athens 161 kV Switch House
Valley Creek 115 kV Switch House
Cranberry 161 kV Switch House
Jackson 500 kV Switch House
Lightfoot 69 kV Switch House
Humboldt 161 kV Switch House
Elizabethton 161 kV Switch House
Courtland 46 kV Switch House
Selmer 161kV Switch House
Louisville 161 kV Switch House
South Jackson
Fayetteville 161 kV Switch House
Bluff City 161 kV Switch House
Franklin 161 kV Switch House
Estill Springs 46 kV Switch House
Brindley 46 kV Switch House
Hickory Valley 161 kV Pump House
Niles Ferry 69 kV Switch House
Greeneville Ind Park 161 kV Switch House
Roane Mountain 161 kV Switch House
Savannah 161 kV Switch House
Wartrace 161 kV Switch House
Winchester 161 kV Switch House
Manchester 161 kV Switch House
Philadelphia 161 kV Switch House
East Cleveland 161 kV Switch House
Vonore 69 kV Switch House
Portland 161 kV Switch House
Starkville (New) 161 kV Switch House
Murfreesboro 161 kV Switch House
WBF Plant 161 kV Switch House
Jetport 161 kV Switch House
Morristown 161 kV Switch House
Monsanto Chemical 161 kV Switch House
Baxter 161 kV Switch House Land
Braytown 161 kV Switch House
D-21

Falling Water 161 kV Switch House
North Bristol 161 kV Switch House
Davidson 500 kV Switch House
Wilson 500 kV Switch House
Cerulean 69 kV Switch House
Northeast Johnson City 161 kV Switch House
Casky 69 kV Switch House
National Carbide 161 kV Switch House
Hendersonville 161 kV Switch House
East McMinnville 161 kV Switch House
Belfast 161 kV Switch House
Substation # 1 Plant
Lowland 69 kV Switch House
Copper Basin 161 kV Switch House
Martin 161 kV Switch House
Mayfield 161 kV Switch House
Starkville (Old) 161 kV Switch House
Fultondale AL 115kv Switch House
McMinnville 161 kV Switch House
Summer Shade 161 kV Switch House
Great Lakes SW Station
South Calvert 161 kV Switch House
Wilson 500 kV Maintenance Bldg - M1
Cowan 46 kV Switch House
Franklin 500 kV Switch House
Davidson 500 kV Pump House
Newport 161 kV Switch House
Lebanon 161 kV Switch House
Dickson 161 kV Switch House
Switchgear Facilities
Nashville ADCC/Switch
COF Gas Turbine Switchgear 1
BRF Electrical Switchgear Bldg
Freeport Abandoned Switch House
Hartsville Admin # 1
Bonicord 69 kV Switch House
GAF Breaker Switchgear Bldg
ALF Switchgear Bldg.
Solutia Switch House
D-22

APPENDIX E
EXEM PT FACILITIES
Department of Defense
Cold Iron Facilities
SUBASE, New London, CT
NSY, Norfolk, VA
PWC, Norfolk, VA
WPNSTA, Charleston, SC
NAS, Pensacola, FL
NAS, Key West, FL
NAVSTA ROOSEVELT ROADS, PR
SUBASE, Kings Bay, GA
NAVSTA, Mayport, FL
WPNSTA EARLE COLTS NECK, NJ
NAVSTA, Gauntanamo, Cuba
NSWC COASTSY STA, Panama City, FL
NAVPHIBASE, Little Creek, VA
NETC, Newport, RI
NAVSTA ROTA SP
NAVSTA, Pascagoula , MS
NAVSTA, Ingleside, TX
NUSC, New London Laboratory
NSC, Oakland, CA
NAVSTA, San Diego, CA
NAS NORTH IS San Diego, CA
NSY Puget Sound Bremerton, WA
NSY, Pearl Harbor, HI
SUBASE, Pearl Harbor, HI
FLEASWTRACENPAC, San Diego, CA
FLEET ACTIVITIES, Chinhae, South Korea
WPNSTA, Concord, CA
COM FLEACT , Yokosuka, Japan
NAVSTA, Guam
CBC Port Hueneme, CA
NAVSHIPREPFAC, Guam
COM FLEACT , Sasebo, Japan
PWC, Pearl Harbor, HI
NAVSTA, Pearl Harbor, HI
SUBASE, San Diego, CA
NAVRESREDCOM REG 22, Seattle, WA
SUBASE, Bangor, WA
NAVSTA, Everett, WA
Simulators
WPNSTA, Charleston, SC
NAS, Pensacola, FL
NAS, Jacksonville, FL
NAS, Dallas, TX
NAS, Kingsville, TX
NAVAIRDEVCEN, Warinster, PA
NAS, Lemoore, CA
NSWC DIV, Pt. Hueneme, CA
MCAS, Miramar, CA
Transm itters
NAS, Jacksonville, FL
NAVSECGRUACT, Winter Harbor, ME
NRTF DIXON
RADTRANF, Annapolis, MD
NAVRADTRANFAC SADDLEBUNCH KEYS
NAVSECGRUACT, Sabana Seca, Puerto Rico
NAVCO MM STA, Jacksonville, FL
NAVRADSTA /T/ Jim Creek, W A
NAVSECGRUACT GALETA IS PN
Other
NAS, Dallas, TX
NAVCOM MU, Washington, D.C.
NAF, El Centro, CA
NSWC COASTSY STA, Panama City, FL
COM FLEACT , Yokosuka, Japan
NAVOBSY, Washington, D.C.
NAF, Atsugi, Japan
CBC, Port Hueneme, CA
CBC, Gulfport, MS
MCAS, Iwakuni, Japan
PWC, Pearl Harbor, HI
NAVSTA ROTA SP
NAS, Keflavik, Iceland
NAV COM MSTA, Keflavik, Iceland
DoD SCHOOLS, Keflavik, Iceland
HDQT RS 4TH M ARDIV, New Orleans, LA
NAVSTA, Pascagoula , MS
“Other” category includes energy consumed by non-
Defense activities, private parties, contractors, and
State and local governments.
Department of Health and Human Services
Bethesda Campus Multilevel Parking Garages,
Bethesda, MD
E-1

Federal Aviation Administration
Oklahoma City, OK
ARSR-1D
ARSR-3 main building
ARSR-3 equip. building
ARSR-3 tower building
ASR-8 training lab
Building 213 (ASR-8 STOR.)
Antenna range shop
Antenna test shop
Ant. test tower (ATCBI)
Base maintenance
Building "K"
Line maintenance building
Line maintenance shed
Radar antenna building
VOR-700 antenna test
ARSR-3 radar test (RMM)
ARSR-4
ASD E-3
ASR-7 training facility
ASR-9
Building 210 (ASR-9 STOR.)
FPS-66 training facility
Ind. waste treatment plant
Prog. Supt. fac. (TDWR2)
TDWR #2 equip. building
Radio RFI
Special purpose building
TDWR #1 building
Thomas P. Stafford
TSI lab building
Waste Coll. Sys. stg. building
TSI compressor building
ARSR-3 storage
TSI storage
Guard house (North)
Guard house (South)
VOR/DME/TACAN
GNAS
Systems support facility
Hazardous waste building
MARK 1 F (Conn. to ILS Com'plx)
MARK1-E
MARK1-F
MARK 20
MARK 20 annex
LSTC
MARK1-B
Digital Remote Switch
Grounds M aint. II
Atlantic City, NJ
Department of Transportation
OAT S storage
Various office space
Storage/Space management
Integration & Interoperability facility
Human Factors Laboratory
Water treatment plant
Hazardous Material Storage
NEXCOM Facility
2 Pump house & well facilities
JP-4 Trans. building
OLD Control Tower
Radio Communications Link
ASR-8 Radar facility
Peripheral Communications
ILS Localizer building R/W 22
Doppler VOR #2
Generator building
DART S trailer
12 Storage facilities
Experimental VORTAC
ARSR-2 RADAR Site
Federal Air Marshal Headquarters
Federal Air Marshal Logistics Office
Materials Fire Test Facility
Wind tunnel
Nacelle Test Facility/Model Shop
Salvage yard
Crashworthiness Build Up
Water treatment plant
Fuel test lab
Aircraft Safety Branch Office
Fire test cell
2 Fuel pump house facilities
Crashworthiness Lab
Sewage lift
Drop test facility
Sprinkler test building
Drum storage building
EAIR radar
Communications building
Experimental RW lighting building
Sewage Lift St. #2
Aircraft blower
Pump house
Fuel storage
Compressor building
Fire Test building
Air Test building
Chemical lab
Log cabin
Radar building
Pump house well # 5
Guard house
E-2

New helipad building
New radar building
Components Fire Test Facility
Friction test equipment storage
ASDE-3 metal building
New ASDE-3 tower w/trailer
Shoothouse
Fuels research lab
Vapor extraction building
Biotreatment building
Extraction control building
Pavement test facility
Fire & crash station
Power conditioning system
Refueler repair
Wash rack near 302
Mobile equipment storage building
Sand storage building (R&G)
Aviation security laboratory
Advanced automation system
Aircraft battery shop building
Bulk storage building
Trace storage building
Security operations center
2 junk trailers
Office Building addition to 150
RCL trailers (was # 291)
Garage
2 Mode S trailers
Office Modules 6 UNITS
Jet engine shelter behind 202
Fuel tank & generator
Catapult storage metal building
TASR Storage
Range cover & weapon cleaning
Reactive range cover
2Pump houses
Instrumentation trailer
Engine enclosure
Other locations
FSS, Betttles, AK
FSS (10), Various
ATBM, Tanana, AK
ATB M (7), Various
UB, Cold Bay, AK
ATCT, Fairbanks, AK
VOR, Kotzebue, AK
VOR (25), Various
H, Ambler, AK
H (11), Various
ASR, Fairbanks, AK
ATCT, Bethel, AK
QS, Dillingham, AK
TOW B, Anchorage, AK
UB, Middleton, AK
TOW B, Kodiak, AK
ATCT, Kansas City, MO
ATCT, Des M oines, IA
AFSS, Columbia, MO
ARTCC, Olathe, KS
ATCT, Sioux City, IA
AFSS, Chesterfie ld , MO
RCLT, Columbia, MO
ARSR, Kirksville , MO
ARSR (6), Various
ASR, Wichita, KS
ASR (5), Various
ATCT, St. Louis, MO
ATCT (17), Various
FSS, Wichita, KS
ATBM, Springfield, MO
VOR, Goodland, KS
VOR/TACR (49), Various
RCAG, Salina, KS
HDQ, Kansas, MO
AFSS, Columbus, NE
HDQ (5), Various
ATBM, Chanute, KS
ATBM, Scottsbluff, NE
ATBM, Lincoln, NE
RCAG, Manhattan, KS
ARTCC, Islip, NY
ATCT, Rochester, NY
AFSS, Islip, NY
AFSS, Millville, NJ
ATCT, Pittsburgh, PA
AFSS, Leesburg, VA
FSS, Islip, NY
ARTCC, Leesburg, VA
ATCT, Washington, D.C.
ARSR, Benton, PA
ATCT, Caldwell, NJ
IFST, Sayville, NY
AFSS, Williamsport, PA
ATCT, Long Island, NY
VOR, , Calverton, NY
VOR (78), Various
HDQS, Charleston, WV
FSS, Salisbury, MD
FSS (4), Various
HDQS, Norfolk, VA
UB, Roanoke, VA
HDQF, Poughkeepsie, NY
ATBM, Long Island, NY
ASR, Syracuse, NY
ASR (13), Various
ARSR, Riverhead, NY
ARSR (7), Various
ATCT, Islip, NY
E-3

ATCT (25), Various
AFSS, Altoona, PA
ASR, Chicago, IL
ASR (16), Various
ARSR, Cooperville , MI
ARSR (13), Various
ATCT, W. Chicago
ATCT (38), Various
ATBM, Columbus, OH
VOR, Stronghold, IL
VOR (80), Various
HDQS, Willmar, MN
HDQS (6), Various
TOWB, Flint, MI
TOWB (8), Various
MULTI, Dayton, OH
MU LTI (7), Various
AFSS, Grand Forks, ND
AFSS, Huron, SD
HDQF, Traverse City
HDQF (5), Various
ARTCC, Oberlin, OH
AFSS, Lansing, MI
FSS, Dayton, OH
AFSS, Kankakee, IL
ATCT, Grand Rapids, MI
AFSS, Green B ay, WI
ARTCC, Aurora, IL
AFSS, Princeton, MN
AFSS, Terre Haute, IN
ARTCC, Farmington, MN
ARTCC, Indianapolis, IN
ATCT, Detroit, MI
MULT, Minneapolis, MN
ATCT, Rapid City, SD
MU LT, Indianapolis, IN
ATCT, Minneapolis, MN
ASR, Nantucket, MA
ASR, Boston, MA
ARSR, Cummington, MA
ATCT, New Haven, CT
ATCT (19), Various
ASR, Manchester, NH
ASR, Portland, ME
VOR, Augusta, ME
VOR (14), Various
AFSS, Bangor, ME
AFSS , Burlington, VT
HDQS, Boston, MA
ATCT, Providence, RI
AFSS, Bridgeport, CT
ARSR, North Truro, MA
ATCT, Boston, MA
ATCT, Otis AFB, MA
ARTCC, Boston, MA
ARSR, St. Albans, ME
ARSR, Bucks Harbor, ME
AFSS, Cedar City, UT
AFSS, Great Falls, WY
AFSS, Casper, WY
RCAG, Alamosa, CO
RCAG (8), Various
RTR, Ogden, UT
TOW B, Tobe, CO
RTR, Renton, WA
RTR, Spokane, W A
DM E, W enatchee, W A
RTR, Seattle, WA
ARSR, Klamath Falss, OR
ASR, Salt Lake City, UT
ASR (12), Various
ARSR (15), Various
ATCT, Denver, CO
ATCT (21), Various
VOR, Myton, UT
VOR (63), Various
FSS, Redmond, OR
FSS (13), Various
TO WB, Spokane, W A
SB, Mica Peak, W A
ARTCC, Auburn, WA
ARTCC, Salt Lake City, UT
ARTCC, Longmont, CO
AFSS, Boise, ID
AFSS, Seattle, WA
AFSS, Denver, CO
ARSR, Malstrom AFB, MT
ATCT, Colorado Springs, CO
ARSR, Salt Lake City, UT
AFSS, Bosie, ID
AFSS, Casper, W Y
ATCT, Eugene, OR
AFSS, McMinnville, OR
ATCT, Grand Junction, CO
ARSR, Lake Side, MT
ATCT, Twin Falls, ID
FSS (8), Various
ATBM , Tallahassee, FL
ATBM (7), Various
RTR, Briltol, TN
AFSS, Miami, FL
AFSS, Anderson, SC
AFSS, Greenwood, MS
MULTI, Orlando, FL
RCAG, London, KY
ARSR, Newport, MS
ARSR (16), Various
ASR, Atlanta, GA
ASR (36), Various
RTR, Savannah, GA
E-4

ATCT, Mobile, AL
ATCT (53), Various
VOR, San Juan, PR
VOR (82), Various
FSS, Mccombs, MS
ARTCC, Memphis, TN
AFSS, Raliegh Durham, NC
AFSS, Nashville, TN
AFSS, Louisville, KY
ATCT, Pensacola, FL
ATCT, Greer, SC
AFSS, Jackson, MS
ATBM, Tri City, TN
ATCT, Wilmington, NC
ATCT, Atlanta, GA
ARTCC, Miami, FL
CERAP, San Juan, PR,
ATBM , Jacksonville, FL
ATCT, Orlando, FL
AFSS, Gainsville, FL
ATCT, Opa Locka, FL
AFSS, Macon, GA
ATCT, Memphis, TN
ATCT, Charleston, SC
ATCT, Charlotte, NC
ARTCC, Atlanta, GA
ARTCC, Jacksonville, FL
VOR, New Orleans, LA
VOR/TACR (65), Various
ATCT, Corpus Christi, TX
ATCT (37), Various
ASR, El Paso, TX
ASR (17), Various
ARSR, Rogers, TX
ARSR (17), Various
RCAG, El Paso, TX
RCAG (5), Various
TDWR, Houston, TX
FSS, Gallup, NM
FSS (10), Various
ARTCC, Houston, TX
ARTCC, Albuquerque, NM
ATCT, Houston, TX
ATCT, Albuquerque, NM
AFSS, Albuquerque, NM
ATCT, Lafayette, LA
AFSS, De Ridder, LA
AFSS, Conroe, TX
ARTS, El Paso, TX
AFSS, Ft. Worth, TX
ATCT, Oklahoma City, OK
ARTCC, Fort Worth, TX
AFSS, San Angelo, TX
ATCT, Lubbock, TX
AFSS, McAleaster, OK
ATCT, San Antonio, TX
FSS, Austin, TX
ATCT, Dallas-Fort Worth, TX
FSS, Fort Worth, TX
FSS, Jonesboro, AR
ATCT, Tyler, TX
ELD, Lafayette, LA
ATCT, El Paso, TX
ADQF1, Jonesboro, AR
MOBIL, Dallas-Fort Worth, TX
ARTS, Oakland, CA
ASR, Oakland, CA
ASR (13), Various
ARSR, Fallon, NV
ARSR (6), Various
ATCT, Las Vegas, NV
ATCT (40), Various
ATCB, Las Vegas, NV
HDQ, Reno, NV
HDQ (5), Various
FSS, Red Bluff, CA
FSS (11), Various
VOR, Kaunakakai, HI
VOR/TACR (62), Various
TOW B, Long Beach, CA
TOWB (6), Various
AFSS, San Diego, CA
TRACO, Phoenix, AZ
ARTCC, Fremont, CA
CERAP, Honolulu, HI
FSS, Prescott, AZ
ARSR, Mount Luguna, CA
ARSR, Mill Valley, CA
AFSS, Ranco Muirieta, CA
ARSR, Unknown
AFSS, Riverside, CA
AFSS, Oakland, CA
AFSS, Hawthorne, CA
ARTCC, Palmdale, CA
ARSR, Crescent City, CA
AFSS, Honolulu, HI
ATCT, Sacramento, CA
ATBM, Ontario, CA
ATCT, Fresno, CA
VOR, San Catalina, CA
Federal Highway Administration
Turner-Fairbanks Facility, McLean, VA
Maritime Administration
James River Reserve Fleet, Newport News, VA
Beaumont Reserve Fleet, Beaumont, TX
Suisun Bay Reserve Fleet, San Francisco, CA
E-5

St. Lawrence Seaway Development Corporation Snell Lock, Massena, NY
Eisenhower Lock, Massena, NY
Department of State
Blair House Complex, Washington, D.C. Federal Building (SA-33) International Chancery
Beltsville Information Management Center, Center, Washington, D.C.
Beltsville , MD
General Services Administration
Region 1
470 Murdock Avenue, Meriden, CT
Dummy for FBI, New Haven, CT
600 State Street, New Haven, CT
GSA CD Depot 234, Watertown, MA
100 Concord Street, Framingham, MA
Liberty Tree Mall, Danvers, MA
Parking Facility, Portland, ME
J .B. Brown Block, Portland, ME
J B Brown Block, Portland, ME
Region 2
758 Route 18, East Brunswick, NJ
425 Raritan Center P, Edison, NJ
F. B. No. 1, New York-Kings, NY
Silvio V Mollo FB, New York-Manhattan, NY
Long Island Crthse F, Central Islip, NY
Mech Equip Garage, Champlain, NY
W/S Jamiesons Line, Burke, NY
Resnick Buildings, New York-Bronx, NY
3 Cottage Place, New Rochelle, NY
599 Hartsdale Ave, White Plains, NY
Greenway Plaza, Melville, NY
200 Montague Street, New York-Kings, NY
76 Eleventh Avenue, New York-Manhattan, NY
First Source Credit Union, Utica, NY
FDA, New York - Queens, NY
Brookhaven Corporate, Holtsville, NY
153-155 Bay Ridge Av, New York - Kings, NY
955 Coney Island Ave, New York - Kings, NY
Census Bureau Office, New York- Bronx, NY
660 W 183rd St, New York - Manhattan, NY
3117 Webster Ave, New York - Bronx, NY
315 East 62 Street, New York - Manhattan, NY
750 Grand St, New York - Queens, NY
Bridge Plaza Office, New York - Queens, NY
Brooklyn East LCO, New York - Kings, NY
93 22 Jamaica Ave, New York - Queens, NY
13216 32nd Ave, New York - Queens, NY
Miglori Building, Yauco, Mayaguez, PR
Villa Captain II, Mayaguez, Mayaguez, PR
Region 3
715 Bldg, Wilmington, DE
Caton Research Ctr., Catonsville , MD
Equitable Bank Ctr I, Baltimore, MD
Windsor Corporate Park, Woodlawn, MD
First National Bank, Camden, NJ
Stegmaier Building, Wilkes Barre, PA
Newton Square Corp, Newton Square, PA
Customhouse, Norfolk, VA
Wise County Plaza, Wise, VA
Fairgrounds Dist Ctr, Richmond, VA
Crossways Com Center, Chesapeake, VA
Cloverleaf Bldg, Harrisonburg, VA
O.L. 720 Sixth Ave, Huntington, WV
Region 4
Fb-CT, Ft Myers, FL
Federal Building, La Fayette, GA
Phil Landrum Fb-Po, Jasper, GA
The Hay Building, Atlanta, GA
J&P Office Park II, Winder, GA
739 Red Banks Rd, Greenville, SC
Region 5
GSA Interag Mtr Pool, Chicago, IL
Banker Building, Chicago, IL
O'Hare Lake Office Plaza, Des Plaines, IL
Clyde Savings Bldg, North Riverside, IL
2100 N California, Chicago, IL
Wash Bicentennial Bg, Springfield, IL
Smoke Tree Bus Park, North Aurora, IL
Glen Hill North Bg A, Glen Ellyn, IL
10 W est Jackson Blvd, Chicago, IL
O'Hare Lake Office Plaza, Des Plaines, IL
One Congress Center, Chicago, IL
E Empire & Eastport, Bloomington, IL
Burrell Building, Chicago, IL
1279 N orth Milwaukee, Chicago, IL
Bank of America, Chicago, IL
901 W arrenville Road, Lisle, IL
1700 South Wolf Road, Des Plaines, IL
Elm Plaza So. Tower, Hinsdale, IL
Soc. Sec. Office, Chicago, IL
204 N. Main Street, Harrisburg, IL
E-6
IL. Business Center, Springfield, IL
2360 E . Devon Ave., Des Plaines, IL
River Center, Chicago, IL
Schaumburg Atrium, Schaumburg, IL
10850 Lincoln Trail, Fairview Heights, IL
600 Joliet Rd, Willowbrook, IL
2350 E . Devon, Des Plaines, IL
Gateway IV, Chicago, IL
Citicorp Center, Chicago, IL
29 North Wacker Drive, Chicago, IL
Governors' Office Park, Olympia Fields, IL
One Oakbrook Terrace, Oakbrook Terrace, IL
Xerox Centre, Chicago, IL
Stewart Square, Rockford, IL
Midway Business Center, Chicago, IL
635 Butterfield Rd, Oakbrook Terrace, IL
5353 S . Laramie, Chicago, IL
Illinois Fin. Center, Springfield, IL
Northwestern Bldg, Evanston, IL
The Rookery, Chicago, IL
Heritage Place, Moline, IL
1600 Corporate Center, Rolling Meadows, IL
4849 N . Milwaukee Ave, Chicago, IL
AT& T Corporate Center, Chicago, IL
801 W arrenville Road, Lisle, IL
1000 T ower Lane Bldg, Bensenville, IL
Olympian Office Center, Lisle, IL
The Pk At NW Point, Elk Grove Village, IL
945 Lakeview Parkway, Vernon Hills, IL
2860 River Road, Des Plaines, IL
One S. W acker Bldg, Chicago, IL
Governors Office Pk, Olympia Fields, IL
1830 2nd Ave., Rock Island, IL
The Esplanade, Downers Grove, IL
Network Centre, Effingham, IL
Burr Ridge Executive, Burr Ridge, IL
Firstar Bank Build, Vernon Hills, IL
Two ILL Center, Chicago, IL
Emco P laza Bldg, Joliet, IL
Federal Bldg, Vincennes, IN
401 M edical Plaza, Michigan City, IN
5969-6035 Lakeside B, Indianapolis, IN
429 Penn Center, Indianapolis, IN
425 South Main Stree, South Bend, IN
Building 400, Lawrence, IN
Fed Bldg & PO, Benton Harbor, MI
Fed Parking Facility, Detroit, MI
Pontiac Place Bldg, Pontiac, MI
29 Pearl Street, Grand Rapids, MI
Domino's Farm House, Ann Arbor, MI
Brewery Park Phase I, Detroit, MI
Woodcrest Office Park, Troy, MI
Bureau of the Census, Dearborn, MI
US Census Bureau, Ann Arbor, MI
Benstein Business Park, Walled Lake, MI
Food & Drug Adm Bldg, Minneapolis, MN
Frank T. Bow Federal, Canton, OH
Federal Bldg, Zanesville, OH
Federal Bldg, Toledo, OH
Fed Parking Facility, Dayton, OH
Plaza Nine Bldg, Cleveland, OH
Commerce Place, Middleburg Heights, OH
Plaza South II, Middleburg Heights, OH
Sanning Apartments, Cincinnati, OH
926 Taylor Station, Gahanna, OH
One Cleveland Ctr, Cleveland, OH
Lakewood Center West, Lakewood, OH
2026 West Main Street, Springfield, OH
4411 Montgomery Road, Norwood, OH
Cbld Building, Cincinnati, OH
Moraine Bus. Ctr. 2, Moraine, OH
Bank One Center, Cleveland, OH
Eaton Center, Cleveland, OH
Renaissance, Cleveland, OH
228th & Lake Shore B, Euclid, OH
Society Tower, Cleveland, OH
6161 Oaktree, Independence, OH
Rockside Center III, Independence, OH
BP America Bldg., Cleveland, OH
5 Point Shopping Ct, Cleveland, OH
Building One Moraine, Moraine, OH
Census Bureau, Lorain, OH
Federal Bldg, W ausau, WI
Social Security Off, W isconsin Rapids, W I
Ace Industrial Dr., Cudahy, W I
Goerke's Park II, W aukesha, W I
700 Regent St, M adison, WI
Region 6
Herbert Hoover Library, West Branch, IA
I 80 Building, West Branch, IA
Service Bg-Eisenhowe, Abilene, KS
Courthouse, St Louis, MO
Federal Bg, Kansas City, MO
SO MO Savings & Loan, Van Buren, MO
New Construction, Kansas City, MO
Hruska US Courthouse, Omaha, NE
2610 Ave "Q" Kearney, Kearney, NE
Region 7
Open Land - FDA Site, New Orleans, LA
Food & Drug Lab, New Orleans, LA
Unnamed Building, Opelousas, LA
Bldg 27, Houma, LA
Monta Vista S C, Las Cruces, NM
Solana S C, Santa Fe, NM
SSA District Office, Ardmore, OK
Natl Park Service Facility, Corpus Christi, TX
Unnamed Building, Laredo, TX
Imperial Square, Irving, TX
E-7

Greenbriar Business, Stafford, TX
CS Village Shopping, College Station, TX
Valley View Tech Cen, Farmers Branch, TX
Eagle Pass Border Pt, Eagle Pass, TX
Redbird Village S C, Duncanville, TX
World Trade Bridge U, Laredo, TX
T & P Building, Fort Worth, TX
Region 8
GSA Parking Lot, Denver, CO
Parking Lot, Denver, CO
USGS Water Lab, Arvada, CO
Earth Lab, Arvada, CO
Wildlife Reasearch, Fort Collins, CO
Dangler Bldg, Grand Junction, CO
GSA Storage Bldg, Bismarck, ND
New Parking Lot, Bismarck, ND
Sunbeam Appl Svc, Salt Lake City, UT
Garage, Cheyenne, W Y
Region 9
Tuscon 405 W Congres, Tuscon, AZ
Building 1, Flagstaff, AZ
US Old Mint Bldg, San Francisco, CA
Federal Building, Sacramento, CA
General Services, San Francisco, CA
15600 Devonshire St., Los Angeles, CA
P. Burton Fed Bldg, Las Vegas, NV
Region 10
Walla W alla Airport, W alla W alla, W A
Region 11
POT Annex 1, Washington, D.C.
White House, Washington, D.C.
US International Tr, Washington, D.C.
Judiciary Center, Washington, D.C.
1990 K Street N W, Washington, D.C.
425 7th Street, NW, Washington, D.C.
625 D Street, NW, Washington, D.C.
628 E Street, Nw, Washington, D.C.
Columbia Plaza, Washington, D.C.
Executive Plaza, Rockville , MD
Washington Comm Ctr, Landover, MD
The Hamptons, Capitol Heights, MD
Woodmont Complex, Bethesda, MD
6700 Springfield Ctr Dr, Springfield, VA
National Aeronautics and Space Administration
Ames Research Center, Moffett Field, CA
Pilot Model of 3.5 foot Hypersonic Wind Tunnel
12 Foot Pressure Wind Tunnel
Pressurized Ballistic Range
Flight Support Facility
7 X 10 Foot Wind Tunnel #1
7 X 10 Foot Wind Tunnel #2
Magnetic Calibration Laboratory
14 foot Transonic W ind Tunnel Laboratory
40 X 80 Foot Wind Tunnel
2 X 2 Foot Transonic Wind Tunnel
Electrical Substation
6 X 6 Foot Supersonic Wind Tunnel
Unitary Plan Wind Tunnel Building
3.5 Foot Hypersonic Wind Tunnel
Fluid Dynamics Laboratory
Hypervelocity Free Flight Facility
Life Sciences Research Laboratory
Airborne Missions/Life Science Facility
Vestibular Research Facility
Vertical Motion Simulator
Space Projects Facility
Space Sciences Research Laboratory
Aircraft Service Facility
Outdoor Aerodynamic Research Facility
Man-Vehicle System Research Facility
High Altitude Aircraft Support Facility
Fluid Mechanics Laboratory
Biomedical Research Laboratory
Human Performance Research Laboratory
Automated Sciences Research Facility
Computational Fluid Dynamics Building
Vertical Gun
12 Foot Wind Tunnel Auxiliaries
Propulsion Simulations Calibration Laboratory
Model Preparation Facility
Model Assembly
Magnetic Test Laboratory
14 Foot Electrical Equipment Building
Fan Blade Shop
20-G Centrifuge
80 X 120 Foot Wind Tunnel
Electrical Substation North
11 Foot Transonic Wind Tunnel
9 X 7 Foot Subsonic Wind Tunnel
8 X 7 Foot Subsonic Wind Tunnel
3.5 Foot Hypersonic Wind Tunnel Auxiliary Building
3.5 Foot Hypersonic Wind Tunnel Storage Building
Thermal Protection Boiler
Life Sciences Equipment Facility
Life Sciences Flight Experiments
Vertical Motion Simulator Equipment Facility
Aircraft Service Facility
Aircraft Service Facility
E-8

RSRA Calibration Facility
Aircraft Service Facility
Bioscience Laboratories
Goldstone Deep Space Communications Complex,
Goldstone, CA
Entire facility is exempt.
Glenn Research Center, Cleveland, OH
Engine Research Building
Icing Research Tunnel – Refrigeration Building
Icing Research Tunnel – Cooling Tower No. 1
Icing Research Tunnel
Engine Research Building – West Wing
Special Projects Laboratory
Materials Research Laboratory
Engine Research Building – Northwest Wing
Engine Research Building – High Pressure Facility
8 X 6 Ft. Supersonic Wind Tunnel
8 X 6 Ft. Supersonic Wind Tunnel - Cooling Tower
No. 2
Materials & Structures Laboratory
8 X 6 Ft. Supersonic Wind Tunnel - Drive Equipment
Building
8 X 6 Ft. Supersonic Wind Tunnel - Air Dryer
Building
Central Air Equipment Building
Central Air Equipment Building - PSLCooling Tower
No. 3
Central Air Equipment Building - Cooling Tower
Water Pump Building
Engine Research Building – Spray Cooler Building
Engine Research Building – Cooling Tower No. 4
10 X 10 Ft. Supersonic Wind Tunnel
10 X 10 Ft. Supersonic Wind Tunnel - Office &
Control Building
10 X 10 Ft. Supersonic Wind Tunnel - 2nd
Compressor & Drive Building
10 X 10 Ft. Supersonic Wind Tunnel - Air Dryer
Building
10 X 10 Ft. Supersonic Wind Tunnel - Substation
"K"
10 X 10 Ft. Supersonic Wind Tunnel - Main
Compressor & Drive Building
10 X 10 Ft. Supersonic Wind Tunnel - Low Pressure
Fuel Pump Building
10 X 10 Ft. Supersonic Wind Tunnel - High Pressure
Fuel Pump Building
10 X 10 Ft. Supersonic Wind Tunnel - Cooling
Tower No. 5
10 X 10 Ft. Supersonic Wind Tunnel - Cooling
Tower Water Pump Building
Central Air Equipment Building - PSL Desiccant Air
Dryer
Engine Research Building Combustion Air Heater
Engine Components Research Laboratory
Materials Processing Laboratory
Basic Materials Laboratory
10 X 10 Ft. Supersonic Wind Tunnel - Shop Building
(#86)
10 X 10 Ft. Supersonic Wind Tunnel - Exhauster
Building
PSL Heater Building
PSL Engine Test Building
Central Air Equipment Building - PSL Cooling
Tower No. 6
Aero-Acoustic Propulsion Laboratory & Control
Room
Electric Power Laboratory
Energy Conversion Laboratory
Space Power Research Laboratory
Goddard Space Flight Center, Greenbelt, MD
Spacecraft Systems Development/Integration Facility
Johnson Space Center, Houston, TX
Mission Simulation Development Facility
Jake Garn Simulator and Training
Mission/Space Station Control Center
Langley Research Center, Hampton, VA
8-Foot Transonic Pressure Tunnel (Closed)
University of Virginia & ART Management Office
Building
30 X 60 Foot Tunnel
Transonic Dynamic Tunnel
16 Foot Transonic Tunnel
Subsonic Tunnel Offices
Hypersonic Propulsion Facility
Frequency Converter Building
National Transonic Facility (NTF)
Drive Control Facility
0.3-Meter Transonic Cryogenic Tunnel
Atmospheric Sciences/Systems Development
Laboratory
Unitary Wind Tunnel
8 Foot High Temperature Tunnel
TDT Complex--Cooling Tower
16 Foot TW T Cpx.—Equipment Fac.
16 Foot TW T Cpx.--Valve House
16 Foot TW T Cpx.--Cool.Twr/Pump Hse
16 Foot TW T Complex—Annex
16 Foot TW T Complex—Annex
16 Foot TW T Complex—Annex
16 Foot TW T Cpx.--Gas Stor. Shed
16 Foot TWT Cpx.--Motor House #1
16 Foot TWT Cpx.--Motor House #2
16 Foot TW T Complex—Annex
16 Foot TWT Cpx.--Air Exchange Twr.
16 Foot TW T Complex—Annex
E-9

16 Foot TW T Complex—Access Area
High Speed 7 X 10 Foot Tunnel
14 X 22 Foot Subsonic Tunnel
High Intensity Noise Research Laboratory
Hypersonic Propulsion Facility
Hypersonic Propulsion Facility
Hypersonic Propulsion Facility
Hypersonic Propulsion Facility
NTF Annex—ME
NTF Annex--Vent Structure
NTF Tunnel Model Storage
NTF Annex
Foundry & Glass Blowing Shop
0.3 Meter Tunnel Annex
Gas Dynamics/Fluid M echanics Research Facility
Hypersonic Facilities Complex - West Wing
Hypersonic Facilities Cooling Tower
Hypersonic Facilities Complex - East Wing
60-Inch M18 H elium T unnel Facility
Atmospheric Sciences Laboratory Annex
Unitary Complex--31 Inch M10 Annex
Unitary Complex Cooling Tower
Unitary Complex Annex— Chem. Treat.
Unitary Complex Annex— Sprink. House
Unitary Complex Annex— Flamm. Stor.
8 Foot HTT Complex—Bottle Storage
8 Foot HTT Complex—Combuster Fac.
8 Foot HTT Complex—Cooling tower
8 Foot HTT Complex--Fuels Equip. Fac
8 Foot HTT Complex—Storage Annex
8 Foot HTT Cpx--6000PSI Bottle Fld
8 Foot HTT Complex—Annex
Plum Brook Station, Sandusky, OH
Plum Brook Station (PBS)
Spaceflight and Data Network, Ponce de Leon, FL
Entire facility is exempt.
White Sands Complex, White Sands, NM
Entire facility is exempt.
White Sands Test Facility, Las Cruces, NM
Boiler Building
Water Treatment Building
300 Area Cooling Pond
Boiler Building
Switchgear Building
Altitude Simulation System Building
Steam Generator Support Building
Treated Water Storage Facility
Altitude Simulation System (Steam Generator)
E-10

APPENDIX F
FEDERAL INTERAGENCY ENERGY POLICY COM MITTEE
(656 COMM ITTEE)
FY 2000
Committee Chair
Mr. Dan W. Reicher
Assistant Secretary
Energy Efficiency and Renewable Energy
U.S. Department of Energy, EE-1
Forrestal Building, Room 6C-016
1000 Independence Avenue, SW
Washington, DC 20585
Phone: 202-586-9220
Fax: 202-586-9260
Agriculture
Mr. Paul W. Fiddick
Assistant Secretary for Administration
U.S. Department of Agriculture
Administration Building, Room 240W
14th and Independence Avenue, SW
Washington, DC 20250-0103
Phone: 202-720-3590
Fax: 202-720-2191
Commerce
Linda J. Bilmes
Assistant Secretary for Administration
U.S. Department of Commerce
Main Commerce, Room 5830
14th and Constitution Avenue, NW
Washington, DC 20230
Phone: 202-482-1200
Fax: 202-482-1962
Defense
Mr. Randall A. Yim
Acting Deputy Under Secretary of Defense
(Installations)
3330 Defense Pentagon, Room 3E-1074
Washington, DC 20301-3330
Phone: 703-697-1771
Fax: 703-695-6929
Education
Mr. W illie H. Gilmore
Director of Office for Management
U.S. Department of Education
400 Maryland Avenue, SW, Room 3E-1069
Washington, DC 20202
Phone: 202-401-0470
Fax: 202-401-0485
Environmental Protection Agency
Mr. John C. Chamberlin
Director Office of Administration
and Resources Management
Environmental Protection Agency
Room 1109 West Tower, MS3201
401 M Street, SW
Washington, DC 20460
Phone: 202-260-8400
Fax: 202-260-8408
General Services Administration
Mr. Robert A. Peck
Commissioner of Public Buildings Service
General Services Administration
Room 6344
18th and F Streets, NW
Washington, DC 20405
Phone: 202-501-1100
Fax: 202-219-2310
Health and Human Services
Mr. John Callahan
Assistant Secretary
for Management and Budget
U.S. Department of Health
and Human Services
Hubert H . Humphrey Building,
Room 514-G
200 Independence Avenue, SW
Washington, DC 20201
Phone: 202-690-6396
Fax: 202-690-5405
Housing and Urban Development
Ms. Karen Jackson
Deputy Assistant Secretary for Administration
U.S. Department of Housing and
Urban Development
Room 10110
451 7th Street, SW
Washington, DC 20410
Phone: 202-708-0940
Fax: 202-619-8129
F-1

Interior
Mr. John Berry
Assistant Secre tary for Policy,
Management and Budget
U.S. Department of the Interior
Room 6130
1849 C Street, NW
Washington, DC 20240
Phone: 202-208-4203
Fax: 202-208-4561
Justice
Mr. Stephen R. Colgate
Assistant Attorney General
for Administration
U.S. Department of Justice
Room 1111
10th and Constitution Avenue, NW
Washington, DC 20530
Phone: 202-514-3101
Fax: 202-514-1778
Labor
Ms. Patricia W. Lattimore
Assistant Secretary for Administration
and Management
U.S. Department of Labor
Room S-2514
200 Constitution Avenue, NW
Washington, DC 20210
Phone: 202-693-4040
Fax: 202-693-4055
National Aeronautics and
Space Administration
Mr. Jeffrey E. Sutton
Associate Administrator for Management
Systems
National Aeronautics and Space Administration
Code J, Room 6W17
300 E Street, SW
Washington, DC 20546-0001
Phone: 202-358-2800
Fax: 202-358-3068
Postal Service
Mr. W illiam Dowling
Vice President, Engineering
U.S. Postal Service
8403 Lee Highway
4th Floor
Merrifield, VA 22082-8101
Phone: 703-280-7001
Fax: 703-280-8401
State
Mr. Patrick S. Kennedy
Assistant Secretary
for Administration
U.S. Department of State
Room 6330
22nd & C Streets, NW
Washington, DC 20520
Phone: 202-647-1492
Fax: 202-647-1558
Transportation
Ms. Melissa Allen
Assistant Secretary for Administration
U.S. Department of Transportation
Room 10314
400 7th Street, SW
Washington, DC 20590
Phone: 202-366-2332
Fax: 202-366-9634
Treasury
Ms. Lisa G. Ross
Assistant Secretary
for Management/Chief Financial Officer
U.S. Department of the Treasury
Room 2426, M ain Treasury Building
1500 Pennsylvania Avenue, NW
Washington, DC 20220
Phone: 202-622-0410
Fax: 202-622-2337
Veterans Affairs
Dr. T homas L. Garthwaite
Deputy Under Secretary for Health (10A)
U.S. Department of Veterans Affairs
Room 806
810 Vermont Avenue, NW
Washington, DC 20420
Phone: 202-273-5803
Fax: 202-273-7090
Office of Management and Budget
Dr. Kathleen Peroff
Deputy Associate Director
Energy and Science Division
Office of Management and Budget
New Executive Office Building
Room 8001
725 17th Street, NW
Washington, DC 20503
Phone: 202-395-3404
Fax: 202-395-4817
F-2

APPENDIX G PERSONNEL OF THE DEPARTMENT OF ENERGY'S
FEDERAL ENERGY MANAGEMENT PROGRAM
FY 2000 Personnel
Dan W. ReicherAssistant Secretary, Energy Efficiency and Renewable Energy
and Chair, Federal InteragencyEnergy Policy Committee
Federal Energy Management Program Staff:
Beth Shearer, Director Executive Secretary, Federal Interagency Energy Policy Committee,
Executive Director, Interagency Energy Management Task Force
Joan Glickman, Deputy Director
Veronica BellamyTed CollinsAnne CrawleyDoug CulbrethJerry DionCurtis FramelMike FultonSharon GillBrad GustafsonAnnie HaskinsArun JhaveriApril JohnsonRandy JonesPaul KingBill Klebous
Rick KlimkosHelen KrupovichWill LintnerKatie McGerveyClaudia MarchioneLaDeane MorelandTatiana StrajnicPat O’BrienBeth PetermanVic PetrolatiWill PrueTanya SadlerCheri SayerNellie GreerEileen Yoshinaka
G-1